Fidelity's Targeted International Equity Funds®
Fidelity® Canada Fund
Fidelity® China Region Fund
Fidelity® Emerging Asia Fund
Fidelity® Emerging Markets Fund
Fidelity® Europe Fund
Fidelity® Japan Fund
Fidelity® Japan Smaller Companies Fund
Fidelity® Latin America Fund
Fidelity® Nordic Fund
Fidelity® Pacific Basin Fund
Annual Report
October 31, 2019
Includes Fidelity and Fidelity Advisor share classes

See the inside front cover for important information about access to your fund’s shareholder reports.

Beginning on January 1, 2021, as permitted by regulations adopted by the Securities and Exchange Commission, paper copies of a fund’s shareholder reports will no longer be sent by mail, unless you specifically request paper copies of the reports from the fund or from your financial intermediary, such as a financial advisor, broker-dealer or bank. Instead, the reports will be made available on a website, and you will be notified by mail each time a report is posted and provided with a website link to access the report.
If you already elected to receive shareholder reports electronically, you will not be affected by this change and you need not take any action. You may elect to receive shareholder reports and other communications from a fund electronically, by contacting your financial intermediary. For Fidelity customers, visit Fidelity's web site or call Fidelity using the contact information listed below.
You may elect to receive all future reports in paper free of charge. If you wish to continue receiving paper copies of your shareholder reports, you may contact your financial intermediary or, if you are a Fidelity customer, visit Fidelity’s website, or call Fidelity at the applicable toll-free number listed below. Your election to receive reports in paper will apply to all funds held with the fund complex/your financial intermediary.
| Account Type | Website | Phone Number |
| Brokerage, Mutual Fund, or Annuity Contracts: | fidelity.com/mailpreferences | 1-800-343-3548 |
| Employer Provided Retirement Accounts: | netbenefits.fidelity.com/preferences (choose 'no' under Required Disclosures to continue to print) | 1-800-343-0860 |
| Advisor Sold Accounts Serviced Through Your Financial Intermediary: | Contact Your Financial Intermediary | Your Financial Intermediary's phone number |
| Advisor Sold Accounts Serviced by Fidelity: | institutional.fidelity.com | 1-877-208-0098 |
Contents
To view a fund's proxy voting guidelines and proxy voting record for the 12-month period ended June 30, visit http://www.fidelity.com/proxyvotingresults or visit the Securities and Exchange Commission's (SEC) web site at http://www.sec.gov.
You may also call 1-800-544-8544 if you’re an individual investing directly with Fidelity, call 1-800-835-5092 if you’re a plan sponsor or participant with Fidelity as your recordkeeper or call 1-877-208-0098 on institutional accounts or if you’re an advisor or invest through one to request a free copy of the proxy voting guidelines.
Standard & Poor's, S&P and S&P 500 are registered service marks of The McGraw-Hill Companies, Inc. and have been licensed for use by Fidelity Distributors Corporation.
Other third-party marks appearing herein are the property of their respective owners.
All other marks appearing herein are registered or unregistered trademarks or service marks of FMR LLC or an affiliated company. © 2019 FMR LLC. All rights reserved.
This report and the financial statements contained herein are submitted for the general information of the shareholders of the Funds. This report is not authorized for distribution to prospective investors in the Funds unless preceded or accompanied by an effective prospectus.
A fund files its complete schedule of portfolio holdings with the SEC for the first and third quarters of each fiscal year on Form N-PORT. Forms N-PORT are available on the SEC’s web site at http://www.sec.gov. A fund's Forms N-PORT may be reviewed and copied at the SEC’s Public Reference Room in Washington, DC. Information regarding the operation of the SEC's Public Reference Room may be obtained by calling 1-800-SEC-0330.
For a complete list of a fund's portfolio holdings, view the most recent holdings listing, semiannual report, or annual report on Fidelity's web site at http://www.fidelity.com, http://www.institutional.fidelity.com, or http://www.401k.com, as applicable.
NOT FDIC INSURED •MAY LOSE VALUE •NO BANK GUARANTEE
Neither the Funds nor Fidelity Distributors Corporation is a bank.
Fidelity® Canada Fund
Performance: The Bottom Line
Average annual total return reflects the change in the value of an investment, assuming reinvestment of distributions from dividend income and capital gains (the profits earned upon the sale of securities that have grown in value, if any) and assuming a constant rate of performance each year. The hypothetical investment and the average annual total returns do not reflect the deduction of taxes that a shareholder would pay on fund distributions or the redemption of fund shares. During periods of reimbursement by Fidelity, a fund’s total return will be greater than it would be had the reimbursement not occurred. How a fund did yesterday is no guarantee of how it will do tomorrow.
Average Annual Total Returns
| For the periods ended October 31, 2019 | Past 1 year | Past 5 years | Past 10 years |
| Class A (incl. 5.75% sales charge) | 4.93% | 0.65% | 4.05% |
| Class M (incl. 3.50% sales charge) | 7.13% | 0.83% | 4.00% |
| Class C (incl. contingent deferred sales charge) | 9.53% | 1.11% | 3.91% |
| Fidelity® Canada Fund | 11.70% | 2.17% | 5.00% |
| Class I | 11.74% | 2.20% | 5.01% |
| Class Z | 11.87% | 2.23% | 5.02% |
Class C shares' contingent deferred sales charges included in the past one year, past five years and past ten years total return figures are 1%, 0% and 0%, respectively.
The initial offering of Class Z shares took place on October 2, 2018. Returns prior to October 2, 2018, are those of Class I.
$10,000 Over 10 Years
Let's say hypothetically that $10,000 was invested in Fidelity® Canada Fund, a class of the fund, on October 31, 2009.
The chart shows how the value of your investment would have changed, and also shows how the S&P/TSX Composite Index performed over the same period.
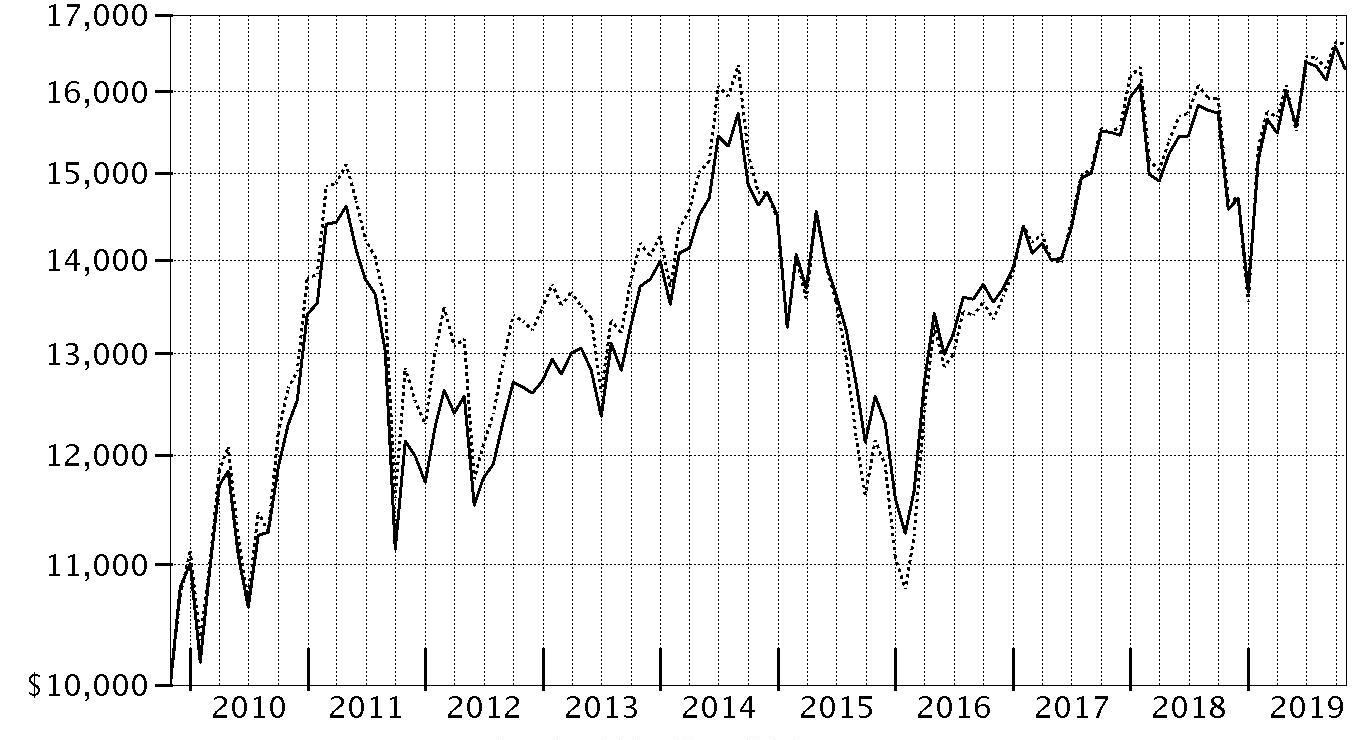
| Period Ending Values |
| $16,282 | Fidelity® Canada Fund |
| $16,615 | S&P/TSX Composite Index |
Fidelity® Canada Fund
Management's Discussion of Fund Performance
Market Recap: The MSCI ACWI (All Country World Index) ex USA Index gained 11.47% for the 12 months ending October 31, 2019, as international stocks reflected a confluence of factors, including escalating trade tension, and moderating but still positive global economic growth. Currency fluctuations were largely modest and varied by region, muting the overall impact on international equity returns. In late December, the U.S. Federal Reserve shifted from raising interest rates to a more dovish policy in 2019, joining many foreign central banks. In June, international stocks rose 6.03%, as policy stimulus in China stabilized that country’s economic growth. The Fed cut its policy rate in July for the first time since 2008. However, the index returned -1.21% for the month, followed by -3.08% in August. In September, the Fed cut its policy rate another quarter point, citing concerns about slowing economic growth and muted inflation, and did the same in October, leading to monthly gains of 2.59% and 3.49%, respectively. For the full 12 months, the growth-oriented information technology sector (+22%) led the way, followed by utilities (+20%) and real estate (+18%), two high-dividend-yielding categories. Conversely, energy was roughly flat, while materials (+6%) and communication services (7%) also lagged. By region, Asia Pacific ex Japan (+16%), Europe ex U.K (+13%), Canada (+12%) and emerging markets (+12%) fared best. Meanwhile, the U.K. (+7%) and Japan (+10%) trailed the broader market.
Comments from Portfolio Manager Ryan Oldham: For the fiscal year, the fund's share classes (excluding sales charges, if applicable) gained roughly 11% to 12%, falling short of the 13.15% result of the benchmark, the S&P/TSX Composite Index. The benchmark's positive result for the 12 months belied meaningful performance differences by sector. Information technology (+44%) posted the strongest result, followed by utilities (+35%). Conversely, energy struggled (-1%), and health care delivered the worst result (-29%). Versus the benchmark, stock selection hurt the fund's relative return; however, positive market positioning helped offset most of this negative impact. Choices in energy detracted the most, mainly due to the fund's stakes in PrairieSky Royalty (-33%) and Suncor Energy (-8%), each of which lagged due to tepid oil prices. Avoiding e-commerce company Shopify (+127%) also hurt the fund's relative result. Conversely, stock picking in industrials added relative value. Among individual stocks, holding several materials names contributed, including Franco-Nevada (+57%) and Wheaton Precious Metals (+73%), each of which benefited from higher gold prices.
The views expressed above reflect those of the portfolio manager(s) only through the end of the period as stated on the cover of this report and do not necessarily represent the views of Fidelity or any other person in the Fidelity organization. Any such views are subject to change at any time based upon market or other conditions and Fidelity disclaims any responsibility to update such views. These views may not be relied on as investment advice and, because investment decisions for a Fidelity fund are based on numerous factors, may not be relied on as an indication of trading intent on behalf of any Fidelity fund.
Fidelity® Canada Fund
Investment Summary (Unaudited)
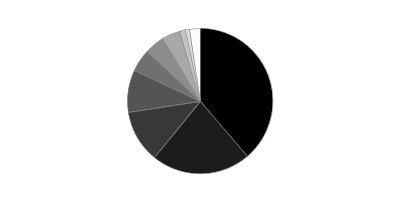
Geographic Diversification (% of fund's net assets)
| As of October 31, 2019 |
| | Canada | 99.2% |
| | United States of America* | 0.8% |

* Includes Short-Term investments and Net Other Assets (Liabilities).
Percentages are based on country or territory of incorporation and are adjusted for the effect of futures contracts, if applicable.
Asset Allocation as of October 31, 2019
| | % of fund's net assets |
| Stocks | 99.2 |
| Short-Term Investments and Net Other Assets (Liabilities) | 0.8 |
Top Ten Stocks as of October 31, 2019
| | % of fund's net assets |
| Royal Bank of Canada (Banks) | 11.2 |
| The Toronto-Dominion Bank (Banks) | 10.8 |
| Suncor Energy, Inc. (Oil, Gas & Consumable Fuels) | 5.3 |
| Canadian Pacific Railway Ltd. (Road & Rail) | 4.9 |
| Sun Life Financial, Inc. (Insurance) | 4.6 |
| TELUS Corp. (Diversified Telecommunication Services) | 4.5 |
| Alimentation Couche-Tard, Inc. Class B (sub. vtg.) (Food & Staples Retailing) | 4.5 |
| Franco-Nevada Corp. (Metals & Mining) | 4.1 |
| Enbridge, Inc. (Oil, Gas & Consumable Fuels) | 3.5 |
| Nutrien Ltd. (Chemicals) | 3.5 |
| | 56.9 |
Top Market Sectors as of October 31, 2019
| | % of fund's net assets |
| Financials | 33.1 |
| Energy | 16.2 |
| Materials | 12.0 |
| Industrials | 10.7 |
| Consumer Staples | 9.0 |
| Communication Services | 7.3 |
| Information Technology | 5.9 |
| Consumer Discretionary | 3.9 |
| Real Estate | 1.1 |
Market Sectors may include more than one industry category.
The Fund may invest up to 35% of its total assets in any industry that represents more than 20% of the Canadian market. As of October 31, 2019, the Fund did not have more than 25% of its total assets invested in any one industry.
Fidelity® Canada Fund
Schedule of Investments October 31, 2019
Showing Percentage of Net Assets
| Common Stocks - 99.2% | | | |
| | | Shares | Value |
| COMMUNICATION SERVICES - 7.3% | | | |
| Diversified Telecommunication Services - 4.5% | | | |
| TELUS Corp. | | 1,115,200 | $39,668,302 |
| Media - 0.4% | | | |
| Cogeco Communications, Inc. | | 38,500 | 3,327,936 |
| Wireless Telecommunication Services - 2.4% | | | |
| Rogers Communications, Inc. Class B (non-vtg.) (a) | | 452,200 | 21,289,896 |
|
| TOTAL COMMUNICATION SERVICES | | | 64,286,134 |
|
| CONSUMER DISCRETIONARY - 3.9% | | | |
| Hotels, Restaurants & Leisure - 0.4% | | | |
| Recipe Unlimited Corp. | | 206,100 | 3,702,320 |
| Leisure Products - 0.8% | | | |
| Spin Master Corp. (b)(c) | | 242,000 | 6,846,041 |
| Multiline Retail - 2.3% | | | |
| Dollarama, Inc. | | 600,400 | 20,198,712 |
| Textiles, Apparel & Luxury Goods - 0.4% | | | |
| Canada Goose Holdings, Inc. (b) | | 83,900 | 3,509,901 |
|
| TOTAL CONSUMER DISCRETIONARY | | | 34,256,974 |
|
| CONSUMER STAPLES - 9.0% | | | |
| Food & Staples Retailing - 8.8% | | | |
| Alimentation Couche-Tard, Inc. Class B (sub. vtg.) | | 1,320,300 | 39,595,968 |
| George Weston Ltd. | | 211,000 | 16,893,136 |
| Metro, Inc. Class A (sub. vtg.) | | 348,395 | 14,733,582 |
| North West Co., Inc. | | 321,600 | 6,880,790 |
| | | | 78,103,476 |
| Personal Products - 0.2% | | | |
| Jamieson Wellness, Inc. | | 81,800 | 1,475,642 |
|
| TOTAL CONSUMER STAPLES | | | 79,579,118 |
|
| ENERGY - 16.2% | | | |
| Energy Equipment & Services - 0.3% | | | |
| Computer Modelling Group Ltd. | | 419,100 | 2,230,576 |
| Oil, Gas & Consumable Fuels - 15.9% | | | |
| Canadian Natural Resources Ltd. | | 1,129,698 | 28,484,755 |
| Cenovus Energy, Inc. (Canada) | | 1,205,400 | 10,268,459 |
| Enbridge, Inc. | | 840,900 | 30,626,356 |
| Pinnacle Renewable Energy, Inc. | | 438,100 | 2,404,877 |
| PrairieSky Royalty Ltd. (a) | | 2,206,618 | 21,545,143 |
| Suncor Energy, Inc. | | 1,592,400 | 47,345,216 |
| | | | 140,674,806 |
|
| TOTAL ENERGY | | | 142,905,382 |
|
| FINANCIALS - 33.1% | | | |
| Banks - 22.0% | | | |
| Royal Bank of Canada | | 1,224,500 | 98,770,694 |
| The Toronto-Dominion Bank | | 1,676,400 | 95,727,009 |
| | | | 194,497,703 |
| Capital Markets - 1.1% | | | |
| IGM Financial, Inc. | | 344,700 | 9,727,810 |
| Insurance - 10.0% | | | |
| Fairfax Financial Holdings Ltd. (sub. vtg.) | | 23,300 | 9,871,232 |
| Intact Financial Corp. (d) | | 163,025 | 16,821,120 |
| Intact Financial Corp. rights 7/31/20 | | 29,500 | 3,021,449 |
| Power Corp. of Canada (sub. vtg.) | | 775,800 | 17,953,370 |
| Sun Life Financial, Inc. | | 912,500 | 40,938,141 |
| | | | 88,605,312 |
|
| TOTAL FINANCIALS | | | 292,830,825 |
|
| INDUSTRIALS - 10.7% | | | |
| Aerospace & Defense - 0.7% | | | |
| CAE, Inc. | | 242,200 | 6,073,849 |
| Professional Services - 2.1% | | | |
| Thomson Reuters Corp. | | 277,500 | 18,648,185 |
| Road & Rail - 7.9% | | | |
| Canadian National Railway Co. | | 299,800 | 26,813,788 |
| Canadian Pacific Railway Ltd. | | 191,800 | 43,615,533 |
| | | | 70,429,321 |
|
| TOTAL INDUSTRIALS | | | 95,151,355 |
|
| INFORMATION TECHNOLOGY - 5.9% | | | |
| IT Services - 2.0% | | | |
| CGI Group, Inc. Class A (sub. vtg.) (b) | | 235,000 | 18,266,874 |
| Software - 3.9% | | | |
| Constellation Software, Inc. | | 17,000 | 16,790,001 |
| Open Text Corp. | | 433,328 | 17,509,465 |
| | | | 34,299,466 |
|
| TOTAL INFORMATION TECHNOLOGY | | | 52,566,340 |
|
| MATERIALS - 12.0% | | | |
| Chemicals - 3.5% | | | |
| Nutrien Ltd. | | 636,881 | 30,468,356 |
| Containers & Packaging - 1.1% | | | |
| CCL Industries, Inc. Class B | | 235,000 | 9,672,272 |
| Metals & Mining - 7.1% | | | |
| Franco-Nevada Corp. | | 376,500 | 36,532,306 |
| Lundin Mining Corp. | | 866,300 | 4,373,924 |
| OceanaGold Corp. | | 991,000 | 2,377,617 |
| Wheaton Precious Metals Corp. | | 697,400 | 19,549,015 |
| | | | 62,832,862 |
| Paper & Forest Products - 0.3% | | | |
| Western Forest Products, Inc. | | 3,027,583 | 2,988,276 |
|
| TOTAL MATERIALS | | | 105,961,766 |
|
| REAL ESTATE - 1.1% | | | |
| Equity Real Estate Investment Trusts (REITs) - 1.1% | | | |
| Allied Properties (REIT) | | 231,500 | 9,417,485 |
| TOTAL COMMON STOCKS | | | |
| (Cost $617,884,344) | | | 876,955,379 |
|
| Money Market Funds - 2.8% | | | |
| Fidelity Cash Central Fund 1.83% (e) | | 3,502,972 | 3,503,672 |
| Fidelity Securities Lending Cash Central Fund 1.84% (e)(f) | | 21,379,551 | 21,381,689 |
| TOTAL MONEY MARKET FUNDS | | | |
| (Cost $24,885,361) | | | 24,885,361 |
| TOTAL INVESTMENT IN SECURITIES - 102.0% | | | |
| (Cost $642,769,705) | | | 901,840,740 |
| NET OTHER ASSETS (LIABILITIES) - (2.0)% | | | (17,795,253) |
| NET ASSETS - 100% | | | $884,045,487 |
Legend
(a) Security or a portion of the security is on loan at period end.
(b) Non-income producing
(c) Security exempt from registration under Rule 144A of the Securities Act of 1933. These securities may be resold in transactions exempt from registration, normally to qualified institutional buyers. At the end of the period, the value of these securities amounted to $6,846,041 or 0.8% of net assets.
(d) A portion of the security sold on a delayed delivery basis.
(e) Affiliated fund that is generally available only to investment companies and other accounts managed by Fidelity Investments. The rate quoted is the annualized seven-day yield of the fund at period end. A complete unaudited listing of the fund's holdings as of its most recent quarter end is available upon request. In addition, each Fidelity Central Fund's financial statements, which are not covered by the Fund's Report of Independent Registered Public Accounting Firm, are available on the SEC's website or upon request.
(f) Investment made with cash collateral received from securities on loan.
Affiliated Central Funds
Information regarding fiscal year to date income earned by the Fund from investments in Fidelity Central Funds is as follows:
| Fund | Income earned |
| Fidelity Cash Central Fund | $178,397 |
| Fidelity Securities Lending Cash Central Fund | 208,528 |
| Total | $386,925 |
Amounts in the income column in the above table include any capital gain distributions from underlying funds, which are presented in the corresponding line-item in the Statement of Operations, if applicable. Amount for Fidelity Securities Lending Cash Central Fund represents the income earned on investing cash collateral, less rebates paid to borrowers and any lending agent fees associated with the loan, plus any premium payments received for lending certain types of securities.
Investment Valuation
All investments are categorized as Level 1 under the Fair Value Hierarchy. The inputs or methodology used for valuing securities may not be an indication of the risk associated with investing in those securities. For more information on valuation inputs please refer to the Investment Valuation section in the accompanying Notes to Financial Statements.
See accompanying notes which are an integral part of the financial statements.
Fidelity® Canada Fund
Financial Statements
Statement of Assets and Liabilities
| | | October 31, 2019 |
| Assets | | |
Investment in securities, at value (including securities loaned of $20,543,952) — See accompanying schedule:
Unaffiliated issuers (cost $617,884,344) | $876,955,379 | |
| Fidelity Central Funds (cost $24,885,361) | 24,885,361 | |
| Total Investment in Securities (cost $642,769,705) | | $901,840,740 |
| Foreign currency held at value (cost $1,033,734) | | 1,033,734 |
| Receivable for investments sold | | |
| Regular delivery | | 13,022,910 |
| Delayed delivery | | 900,188 |
| Receivable for fund shares sold | | 86,388 |
| Dividends receivable | | 1,029,517 |
| Distributions receivable from Fidelity Central Funds | | 13,385 |
| Prepaid expenses | | 1,858 |
| Other receivables | | 3,358 |
| Total assets | | 917,932,078 |
| Liabilities | | |
| Payable for investments purchased | $2,325,926 | |
| Payable for fund shares redeemed | 9,451,294 | |
| Accrued management fee | 453,730 | |
| Distribution and service plan fees payable | 15,039 | |
| Other affiliated payables | 201,380 | |
| Other payables and accrued expenses | 58,785 | |
| Collateral on securities loaned | 21,380,437 | |
| Total liabilities | | 33,886,591 |
| Net Assets | | $884,045,487 |
| Net Assets consist of: | | |
| Paid in capital | | $591,746,354 |
| Total accumulated earnings (loss) | | 292,299,133 |
| Net Assets | | $884,045,487 |
| Net Asset Value and Maximum Offering Price | | |
| Class A: | | |
| Net Asset Value and redemption price per share ($30,597,966 ÷ 588,977 shares)(a) | | $51.95 |
| Maximum offering price per share (100/94.25 of $51.95) | | $55.12 |
| Class M: | | |
| Net Asset Value and redemption price per share ($8,589,285 ÷ 166,247 shares)(a) | | $51.67 |
| Maximum offering price per share (100/96.50 of $51.67) | | $53.54 |
| Class C: | | |
| Net Asset Value and offering price per share ($6,226,346 ÷ 123,025 shares)(a) | | $50.61 |
| Canada: | | |
| Net Asset Value, offering price and redemption price per share ($803,629,318 ÷ 15,392,611 shares) | | $52.21 |
| Class I: | | |
| Net Asset Value, offering price and redemption price per share ($14,506,898 ÷ 278,408 shares) | | $52.11 |
| Class Z: | | |
| Net Asset Value, offering price and redemption price per share ($20,495,674 ÷ 393,616 shares) | | $52.07 |
(a) Redemption price per share is equal to net asset value less any applicable contingent deferred sales charge.
See accompanying notes which are an integral part of the financial statements.
Statement of Operations
| | | Year ended October 31, 2019 |
| Investment Income | | |
| Dividends | | $28,863,330 |
| Income from Fidelity Central Funds (including $208,528 from security lending) | | 386,925 |
| Income before foreign taxes withheld | | 29,250,255 |
| Less foreign taxes withheld | | (4,448,823) |
| Total income | | 24,801,432 |
| Expenses | | |
| Management fee | | |
| Basic fee | $6,787,616 | |
| Performance adjustment | (812,345) | |
| Transfer agent fees | 2,045,774 | |
| Distribution and service plan fees | 200,535 | |
| Accounting and security lending fees | 465,042 | |
| Custodian fees and expenses | 8,284 | |
| Independent trustees' fees and expenses | 5,621 | |
| Registration fees | 100,151 | |
| Audit | 76,250 | |
| Legal | 3,118 | |
| Interest | 3,436 | |
| Miscellaneous | 6,911 | |
| Total expenses before reductions | 8,890,393 | |
| Expense reductions | (44,415) | |
| Total expenses after reductions | | 8,845,978 |
| Net investment income (loss) | | 15,955,454 |
| Realized and Unrealized Gain (Loss) | | |
| Net realized gain (loss) on: | | |
| Investment securities: | | |
| Unaffiliated issuers | 28,559,317 | |
| Redemptions in-kind with affiliated entities | 25,479,297 | |
| Fidelity Central Funds | 2,841 | |
| Foreign currency transactions | 27,421 | |
| Total net realized gain (loss) | | 54,068,876 |
| Change in net unrealized appreciation (depreciation) on: | | |
| Investment securities: | | |
| Unaffiliated issuers | 39,657,328 | |
| Assets and liabilities in foreign currencies | 3,379 | |
| Total change in net unrealized appreciation (depreciation) | | 39,660,707 |
| Net gain (loss) | | 93,729,583 |
| Net increase (decrease) in net assets resulting from operations | | $109,685,037 |
See accompanying notes which are an integral part of the financial statements.
Statement of Changes in Net Assets
| | Year ended October 31, 2019 | Year ended October 31, 2018 |
| Increase (Decrease) in Net Assets | | |
| Operations | | |
| Net investment income (loss) | $15,955,454 | $15,980,423 |
| Net realized gain (loss) | 54,068,876 | 57,232,871 |
| Change in net unrealized appreciation (depreciation) | 39,660,707 | (134,481,756) |
| Net increase (decrease) in net assets resulting from operations | 109,685,037 | (61,268,462) |
| Distributions to shareholders | (61,875,999) | (27,476,751) |
| Share transactions - net increase (decrease) | (142,935,933) | (157,321,221) |
| Redemption fees | – | 5,144 |
| Total increase (decrease) in net assets | (95,126,895) | (246,061,290) |
| Net Assets | | |
| Beginning of period | 979,172,382 | 1,225,233,672 |
| End of period | $884,045,487 | $979,172,382 |
See accompanying notes which are an integral part of the financial statements.
Financial Highlights
Fidelity Canada Fund Class A
| Years ended October 31, | 2019 | 2018 | 2017 | 2016 | 2015 |
| Selected Per–Share Data | | | | | |
| Net asset value, beginning of period | $49.75 | $54.11 | $48.09 | $45.25 | $60.56 |
| Income from Investment Operations | | | | | |
| Net investment income (loss)A | .66 | .60 | .50 | .48 | .45 |
| Net realized and unrealized gain (loss) | 4.56 | (3.88) | 6.16 | 2.84 | (8.04) |
| Total from investment operations | 5.22 | (3.28) | 6.66 | 3.32 | (7.59) |
| Distributions from net investment income | (.39) | (.59) | (.45) | (.42) | (.50) |
| Distributions from net realized gain | (2.63) | (.49) | (.19) | (.06) | (7.22) |
| Total distributions | (3.02) | (1.08) | (.64) | (.48) | (7.72) |
| Redemption fees added to paid in capitalA | – | –B | –B | –B | –B |
| Net asset value, end of period | $51.95 | $49.75 | $54.11 | $48.09 | $45.25 |
| Total ReturnC,D | 11.34% | (6.19)% | 13.98% | 7.45% | (14.32)% |
| Ratios to Average Net AssetsE,F | | | | | |
| Expenses before reductions | 1.20% | 1.21% | 1.34% | 1.48% | 1.43% |
| Expenses net of fee waivers, if any | 1.20% | 1.21% | 1.34% | 1.48% | 1.43% |
| Expenses net of all reductions | 1.19% | 1.20% | 1.34% | 1.48% | 1.43% |
| Net investment income (loss) | 1.32% | 1.13% | .98% | 1.06% | .90% |
| Supplemental Data | | | | | |
| Net assets, end of period (000 omitted) | $30,598 | $29,420 | $37,557 | $44,144 | $58,286 |
| Portfolio turnover rateG | 8%H | 29% | 26% | 44% | 24% |
A Calculated based on average shares outstanding during the period.
B Amount represents less than $.005 per share.
C Total returns would have been lower if certain expenses had not been reduced during the applicable periods shown.
D Total returns do not include the effect of the sales charges.
E Fees and expenses of any underlying Fidelity Central Funds are not included in the Fund's expense ratio. The Fund indirectly bears its proportionate share of the expenses of any underlying Fidelity Central Funds.
F Expense ratios reflect operating expenses of the class. Expenses before reductions do not reflect amounts reimbursed by the investment adviser or reductions from brokerage service arrangements or reductions from other expense offset arrangements and do not represent the amount paid by the class during periods when reimbursements or reductions occur. Expenses net of fee waivers reflect expenses after reimbursement by the investment adviser but prior to reductions from brokerage service arrangements or other expense offset arrangements. Expenses net of all reductions represent the net expenses paid by the class.
G Amount does not include the portfolio activity of any underlying Fidelity Central Funds.
H Portfolio turnover rate excludes securities received or delivered in-kind.
See accompanying notes which are an integral part of the financial statements.
Fidelity Canada Fund Class M
| Years ended October 31, | 2019 | 2018 | 2017 | 2016 | 2015 |
| Selected Per–Share Data | | | | | |
| Net asset value, beginning of period | $49.46 | $53.77 | $47.82 | $44.99 | $60.22 |
| Income from Investment Operations | | | | | |
| Net investment income (loss)A | .51 | .44 | .35 | .35 | .29 |
| Net realized and unrealized gain (loss) | 4.55 | (3.86) | 6.13 | 2.83 | (8.00) |
| Total from investment operations | 5.06 | (3.42) | 6.48 | 3.18 | (7.71) |
| Distributions from net investment income | (.22) | (.40) | (.34) | (.29) | (.30) |
| Distributions from net realized gain | (2.63) | (.49) | (.19) | (.06) | (7.22) |
| Total distributions | (2.85) | (.89) | (.53) | (.35) | (7.52) |
| Redemption fees added to paid in capitalA | – | –B | –B | –B | –B |
| Net asset value, end of period | $51.67 | $49.46 | $53.77 | $47.82 | $44.99 |
| Total ReturnC,D | 11.02% | (6.47)% | 13.64% | 7.14% | (14.58)% |
| Ratios to Average Net AssetsE,F | | | | | |
| Expenses before reductions | 1.49% | 1.51% | 1.63% | 1.77% | 1.75% |
| Expenses net of fee waivers, if any | 1.48% | 1.51% | 1.63% | 1.77% | 1.75% |
| Expenses net of all reductions | 1.48% | 1.51% | 1.63% | 1.77% | 1.75% |
| Net investment income (loss) | 1.03% | .83% | .69% | .78% | .58% |
| Supplemental Data | | | | | |
| Net assets, end of period (000 omitted) | $8,589 | $7,844 | $10,356 | $11,140 | $12,820 |
| Portfolio turnover rateG | 8%H | 29% | 26% | 44% | 24% |
A Calculated based on average shares outstanding during the period.
B Amount represents less than $.005 per share.
C Total returns would have been lower if certain expenses had not been reduced during the applicable periods shown.
D Total returns do not include the effect of the sales charges.
E Fees and expenses of any underlying Fidelity Central Funds are not included in the Fund's expense ratio. The Fund indirectly bears its proportionate share of the expenses of any underlying Fidelity Central Funds.
F Expense ratios reflect operating expenses of the class. Expenses before reductions do not reflect amounts reimbursed by the investment adviser or reductions from brokerage service arrangements or reductions from other expense offset arrangements and do not represent the amount paid by the class during periods when reimbursements or reductions occur. Expenses net of fee waivers reflect expenses after reimbursement by the investment adviser but prior to reductions from brokerage service arrangements or other expense offset arrangements. Expenses net of all reductions represent the net expenses paid by the class.
G Amount does not include the portfolio activity of any underlying Fidelity Central Funds.
H Portfolio turnover rate excludes securities received or delivered in-kind.
See accompanying notes which are an integral part of the financial statements.
Fidelity Canada Fund Class C
| Years ended October 31, | 2019 | 2018 | 2017 | 2016 | 2015 |
| Selected Per–Share Data | | | | | |
| Net asset value, beginning of period | $48.48 | $52.72 | $46.87 | $44.02 | $59.04 |
| Income from Investment Operations | | | | | |
| Net investment income (loss)A | .29 | .21 | .13 | .15 | .07 |
| Net realized and unrealized gain (loss) | 4.47 | (3.78) | 6.01 | 2.78 | (7.85) |
| Total from investment operations | 4.76 | (3.57) | 6.14 | 2.93 | (7.78) |
| Distributions from net investment income | – | (.18) | (.11) | (.02) | (.02) |
| Distributions from net realized gain | (2.63) | (.49) | (.19) | (.06) | (7.22) |
| Total distributions | (2.63) | (.67) | (.29)B | (.08) | (7.24) |
| Redemption fees added to paid in capitalA | – | –C | –C | –C | –C |
| Net asset value, end of period | $50.61 | $48.48 | $52.72 | $46.87 | $44.02 |
| Total ReturnD,E | 10.53% | (6.85)% | 13.16% | 6.67% | (14.96)% |
| Ratios to Average Net AssetsF,G | | | | | |
| Expenses before reductions | 1.92% | 1.94% | 2.06% | 2.21% | 2.19% |
| Expenses net of fee waivers, if any | 1.92% | 1.93% | 2.06% | 2.21% | 2.19% |
| Expenses net of all reductions | 1.91% | 1.93% | 2.06% | 2.21% | 2.18% |
| Net investment income (loss) | .60% | .40% | .26% | .33% | .14% |
| Supplemental Data | | | | | |
| Net assets, end of period (000 omitted) | $6,226 | $11,196 | $15,938 | $18,489 | $21,610 |
| Portfolio turnover rateH | 8%I | 29% | 26% | 44% | 24% |
A Calculated based on average shares outstanding during the period.
B Total distributions of $.29 per share is comprised of distributions from net investment income of $.105 and distributions from net realized gain of $.188 per share.
C Amount represents less than $.005 per share.
D Total returns would have been lower if certain expenses had not been reduced during the applicable periods shown.
E Total returns do not include the effect of the contingent deferred sales charge.
F Fees and expenses of any underlying Fidelity Central Funds are not included in the Fund's expense ratio. The Fund indirectly bears its proportionate share of the expenses of any underlying Fidelity Central Funds.
G Expense ratios reflect operating expenses of the class. Expenses before reductions do not reflect amounts reimbursed by the investment adviser or reductions from brokerage service arrangements or reductions from other expense offset arrangements and do not represent the amount paid by the class during periods when reimbursements or reductions occur. Expenses net of fee waivers reflect expenses after reimbursement by the investment adviser but prior to reductions from brokerage service arrangements or other expense offset arrangements. Expenses net of all reductions represent the net expenses paid by the class.
H Amount does not include the portfolio activity of any underlying Fidelity Central Funds.
I Portfolio turnover rate excludes securities received or delivered in-kind.
See accompanying notes which are an integral part of the financial statements.
Fidelity Canada Fund
| Years ended October 31, | 2019 | 2018 | 2017 | 2016 | 2015 |
| Selected Per–Share Data | | | | | |
| Net asset value, beginning of period | $50.02 | $54.41 | $48.35 | $45.55 | $60.95 |
| Income from Investment Operations | | | | | |
| Net investment income (loss)A | .82 | .77 | .66 | .62 | .60 |
| Net realized and unrealized gain (loss) | 4.58 | (3.90) | 6.20 | 2.85 | (8.09) |
| Total from investment operations | 5.40 | (3.13) | 6.86 | 3.47 | (7.49) |
| Distributions from net investment income | (.58) | (.77) | (.61) | (.61) | (.69) |
| Distributions from net realized gain | (2.63) | (.49) | (.19) | (.06) | (7.22) |
| Total distributions | (3.21) | (1.26) | (.80) | (.67) | (7.91) |
| Redemption fees added to paid in capitalA | – | –B | –B | –B | –B |
| Net asset value, end of period | $52.21 | $50.02 | $54.41 | $48.35 | $45.55 |
| Total ReturnC | 11.70% | (5.89)% | 14.35% | 7.79% | (14.08)% |
| Ratios to Average Net AssetsD,E | | | | | |
| Expenses before reductions | .88% | .89% | 1.02% | 1.17% | 1.15% |
| Expenses net of fee waivers, if any | .88% | .89% | 1.02% | 1.17% | 1.15% |
| Expenses net of all reductions | .87% | .88% | 1.02% | 1.17% | 1.14% |
| Net investment income (loss) | 1.64% | 1.45% | 1.30% | 1.37% | 1.18% |
| Supplemental Data | | | | | |
| Net assets, end of period (000 omitted) | $803,629 | $903,662 | $1,130,803 | $1,233,050 | $1,279,488 |
| Portfolio turnover rateF | 8%G | 29% | 26% | 44% | 24% |
A Calculated based on average shares outstanding during the period.
B Amount represents less than $.005 per share.
C Total returns would have been lower if certain expenses had not been reduced during the applicable periods shown.
D Fees and expenses of any underlying Fidelity Central Funds are not included in the Fund's expense ratio. The Fund indirectly bears its proportionate share of the expenses of any underlying Fidelity Central Funds.
E Expense ratios reflect operating expenses of the class. Expenses before reductions do not reflect amounts reimbursed by the investment adviser or reductions from brokerage service arrangements or reductions from other expense offset arrangements and do not represent the amount paid by the class during periods when reimbursements or reductions occur. Expenses net of fee waivers reflect expenses after reimbursement by the investment adviser but prior to reductions from brokerage service arrangements or other expense offset arrangements. Expenses net of all reductions represent the net expenses paid by the class.
F Amount does not include the portfolio activity of any underlying Fidelity Central Funds.
G Portfolio turnover rate excludes securities received or delivered in-kind.
See accompanying notes which are an integral part of the financial statements.
Fidelity Canada Fund Class I
| Years ended October 31, | 2019 | 2018 | 2017 | 2016 | 2015 |
| Selected Per–Share Data | | | | | |
| Net asset value, beginning of period | $49.93 | $54.29 | $48.28 | $45.44 | $60.80 |
| Income from Investment Operations | | | | | |
| Net investment income (loss)A | .85 | .79 | .67 | .66 | .61 |
| Net realized and unrealized gain (loss) | 4.55 | (3.90) | 6.19 | 2.83 | (8.07) |
| Total from investment operations | 5.40 | (3.11) | 6.86 | 3.49 | (7.46) |
| Distributions from net investment income | (.59) | (.77) | (.66) | (.59) | (.68) |
| Distributions from net realized gain | (2.63) | (.49) | (.19) | (.06) | (7.22) |
| Total distributions | (3.22) | (1.25)B | (.85) | (.65) | (7.90) |
| Redemption fees added to paid in capitalA | – | –C | –C | –C | –C |
| Net asset value, end of period | $52.11 | $49.93 | $54.29 | $48.28 | $45.44 |
| Total ReturnD | 11.74% | (5.86)% | 14.38% | 7.83% | (14.05)% |
| Ratios to Average Net AssetsE,F | | | | | |
| Expenses before reductions | .84% | .86% | 1.00% | 1.14% | 1.13% |
| Expenses net of fee waivers, if any | .84% | .85% | .99% | 1.13% | 1.12% |
| Expenses net of all reductions | .83% | .85% | .99% | 1.13% | 1.12% |
| Net investment income (loss) | 1.68% | 1.49% | 1.33% | 1.41% | 1.21% |
| Supplemental Data | | | | | |
| Net assets, end of period (000 omitted) | $14,507 | $26,923 | $30,581 | $41,217 | $14,846 |
| Portfolio turnover rateG | 8%H | 29% | 26% | 44% | 24% |
A Calculated based on average shares outstanding during the period.
B Total distributions of $1.25 per share is comprised of distributions from net investment income of $.765 and distributions from net realized gain of $.487 per share.
C Amount represents less than $.005 per share.
D Total returns would have been lower if certain expenses had not been reduced during the applicable periods shown.
E Fees and expenses of any underlying Fidelity Central Funds are not included in the Fund's expense ratio. The Fund indirectly bears its proportionate share of the expenses of any underlying Fidelity Central Funds.
F Expense ratios reflect operating expenses of the class. Expenses before reductions do not reflect amounts reimbursed by the investment adviser or reductions from brokerage service arrangements or reductions from other expense offset arrangements and do not represent the amount paid by the class during periods when reimbursements or reductions occur. Expenses net of fee waivers reflect expenses after reimbursement by the investment adviser but prior to reductions from brokerage service arrangements or other expense offset arrangements. Expenses net of all reductions represent the net expenses paid by the class.
G Amount does not include the portfolio activity of any underlying Fidelity Central Funds.
H Portfolio turnover rate excludes securities received or delivered in-kind.
See accompanying notes which are an integral part of the financial statements.
Fidelity Canada Fund Class Z
| Years ended October 31, | 2019 | 2018 A |
| Selected Per–Share Data | | |
| Net asset value, beginning of period | $49.94 | $53.92 |
| Income from Investment Operations | | |
| Net investment income (loss)B | .92 | .06 |
| Net realized and unrealized gain (loss) | 4.53 | (4.04) |
| Total from investment operations | 5.45 | (3.98) |
| Distributions from net investment income | (.69) | – |
| Distributions from net realized gain | (2.63) | – |
| Total distributions | (3.32) | – |
| Net asset value, end of period | $52.07 | $49.94 |
| Total ReturnC,D | 11.87% | (7.38)% |
| Ratios to Average Net AssetsE,F | | |
| Expenses before reductions | .72% | .80%G |
| Expenses net of fee waivers, if any | .72% | .80%G |
| Expenses net of all reductions | .71% | .79%G |
| Net investment income (loss) | 1.80% | 1.48%G |
| Supplemental Data | | |
| Net assets, end of period (000 omitted) | $20,496 | $128 |
| Portfolio turnover rateH | 8%I | 29% |
A For the period October 2, 2018 (commencement of sale of shares) to October 31, 2018.
B Calculated based on average shares outstanding during the period.
C Total returns for periods of less than one year are not annualized.
D Total returns would have been lower if certain expenses had not been reduced during the applicable periods shown.
E Fees and expenses of any underlying Fidelity Central Funds are not included in the Fund's expense ratio. The Fund indirectly bears its proportionate share of the expenses of any underlying Fidelity Central Funds.
F Expense ratios reflect operating expenses of the class. Expenses before reductions do not reflect amounts reimbursed by the investment adviser or reductions from brokerage service arrangements or reductions from other expense offset arrangements and do not represent the amount paid by the class during periods when reimbursements or reductions occur. Expense ratios before reductions for start-up periods may not be representative of longer-term operating periods. Expenses net of fee waivers reflect expenses after reimbursement by the investment adviser but prior to reductions from brokerage service arrangements or other expense offset arrangements. Expenses net of all reductions represent the net expenses paid by the class.
G Annualized
H Amount does not include the portfolio activity of any underlying Fidelity Central Funds.
I Portfolio turnover rate excludes securities received or delivered in-kind.
See accompanying notes which are an integral part of the financial statements.
Notes to Financial Statements
For the period ended October 31, 2019
1. Organization.
Fidelity Canada Fund (the Fund) is a fund of Fidelity Investment Trust (the Trust) and is authorized to issue an unlimited number of shares. The Trust is registered under the Investment Company Act of 1940, as amended (the 1940 Act), as an open-end management investment company organized as a Massachusetts business trust. The Fund offers Class A, Class M, Class C, Canada, Class I and Class Z shares, each of which has equal rights as to assets and voting privileges. Each class has exclusive voting rights with respect to matters that affect that class. Effective March 1, 2019, Class C shares will automatically convert to Class A shares after a holding period of ten years from the initial date of purchase, with certain exceptions.
2. Investments in Fidelity Central Funds.
The Fund invests in Fidelity Central Funds, which are open-end investment companies generally available only to other investment companies and accounts managed by the investment adviser and its affiliates. The Fund's Schedule of Investments lists each of the Fidelity Central Funds held as of period end, if any, as an investment of the Fund, but does not include the underlying holdings of each Fidelity Central Fund. As an Investing Fund, the Fund indirectly bears its proportionate share of the expenses of the underlying Fidelity Central Funds.
The Money Market Central Funds seek preservation of capital and current income and are managed by Fidelity Investments Money Management, Inc. (FIMM), an affiliate of the investment adviser. Annualized expenses of the Money Market Central Funds as of their most recent shareholder report date ranged from less than .005% to .01%.
A complete unaudited list of holdings for each Fidelity Central Fund is available upon request or at the Securities and Exchange Commission (the SEC) website at www.sec.gov. In addition, the financial statements of the Fidelity Central Funds, which are not covered by the Fund's Report of Independent Registered Public Accounting Firm, are available on the SEC website or upon request.
3. Significant Accounting Policies.
The Fund is an investment company and applies the accounting and reporting guidance of the Financial Accounting Standards Board (FASB) Accounting Standards Codification Topic 946 Financial Services – Investments Companies. The financial statements have been prepared in conformity with accounting principles generally accepted in the United States of America (GAAP), which require management to make certain estimates and assumptions at the date of the financial statements. Actual results could differ from those estimates. Subsequent events, if any, through the date that the financial statements were issued have been evaluated in the preparation of the financial statements. The following summarizes the significant accounting policies of the Fund:
Investment Valuation. Investments are valued as of 4:00 p.m. Eastern time on the last calendar day of the period. The Board of Trustees (the Board) has delegated the day to day responsibility for the valuation of the Fund's investments to the Fair Value Committee (the Committee) established by the Fund's investment adviser. In accordance with valuation policies and procedures approved by the Board, the Fund attempts to obtain prices from one or more third party pricing vendors or brokers to value its investments. When current market prices, quotations or currency exchange rates are not readily available or reliable, investments will be fair valued in good faith by the Committee, in accordance with procedures adopted by the Board. Factors used in determining fair value vary by investment type and may include market or investment specific events. The frequency with which these procedures are used cannot be predicted and they may be utilized to a significant extent. The Committee oversees the Fund's valuation policies and procedures and reports to the Board on the Committee's activities and fair value determinations. The Board monitors the appropriateness of the procedures used in valuing the Fund's investments and ratifies the fair value determinations of the Committee.
The Fund categorizes the inputs to valuation techniques used to value its investments into a disclosure hierarchy consisting of three levels as shown below:
- Level 1 – quoted prices in active markets for identical investments
- Level 2 – other significant observable inputs (including quoted prices for similar investments, interest rates, prepayment speeds, etc.)
- Level 3 – unobservable inputs (including the Fund's own assumptions based on the best information available)
Valuation techniques used to value the Fund's investments by major category are as follows:
Equity securities, including restricted securities, for which market quotations are readily available, are valued at the last reported sale price or official closing price as reported by a third party pricing vendor on the primary market or exchange on which they are traded and are categorized as Level 1 in the hierarchy. In the event there were no sales during the day or closing prices are not available, securities are valued at the last quoted bid price or may be valued using the last available price and are generally categorized as Level 2 in the hierarchy. For foreign equity securities, when market or security specific events arise, comparisons to the valuation of American Depositary Receipts (ADRs), futures contracts, Exchange-Traded Funds (ETFs) and certain indexes as well as quoted prices for similar securities may be used and would be categorized as Level 2 in the hierarchy. For equity securities, including restricted securities, where observable inputs are limited, assumptions about market activity and risk are used and these securities may be categorized as Level 3 in the hierarchy.
Investments in open-end mutual funds, including the Fidelity Central Funds, are valued at their closing net asset value (NAV) each business day and are categorized as Level 1 in the hierarchy.
Changes in valuation techniques may result in transfers in or out of an assigned level within the disclosure hierarchy.
Foreign Currency. The Fund may use foreign currency contracts to facilitate transactions in foreign-denominated securities. Gains and losses from these transactions may arise from changes in the value of the foreign currency or if the counterparties do not perform under the contracts' terms.
Foreign-denominated assets, including investment securities, and liabilities are translated into U.S. dollars at the exchange rates at period end. Purchases and sales of investment securities, income and dividends received and expenses denominated in foreign currencies are translated into U.S. dollars at the exchange rate in effect on the transaction date.
The effects of exchange rate fluctuations on investments are included with the net realized and unrealized gain (loss) on investment securities. Other foreign currency transactions resulting in realized and unrealized gain (loss) are disclosed separately.
Investment Transactions and Income. For financial reporting purposes, the Fund's investment holdings and NAV include trades executed through the end of the last business day of the period. The NAV per share for processing shareholder transactions is calculated as of the close of business of the New York Stock Exchange (NYSE), normally 4:00 p.m. Eastern time and includes trades executed through the end of the prior business day. Gains and losses on securities sold are determined on the basis of identified cost and include proceeds received from litigation. Dividend income is recorded on the ex-dividend date, except for certain dividends from foreign securities where the ex-dividend date may have passed, which are recorded as soon as the Fund is informed of the ex-dividend date. Non-cash dividends included in dividend income, if any, are recorded at the fair market value of the securities received. Income and capital gain distributions from Fidelity Central Funds, if any, are recorded on the ex-dividend date. Certain distributions received by the Fund represent a return of capital or capital gain. The Fund determines the components of these distributions subsequent to the ex-dividend date, based upon receipt of tax filings or other correspondence relating to the underlying investment. These distributions are recorded as a reduction of cost of investments and/or as a realized gain. Investment income is recorded net of foreign taxes withheld where recovery of such taxes is uncertain.
Class Allocations and Expenses. Investment income, realized and unrealized capital gains and losses, common expenses of the Fund, and certain fund-level expense reductions, if any, are allocated daily on a pro-rata basis to each class based on the relative net assets of each class to the total net assets of the Fund. Each class differs with respect to transfer agent and distribution and service plan fees incurred. Certain expense reductions may also differ by class. For the reporting period, the allocated portion of income and expenses to each class as a percent of its average net assets may vary due to the timing of recording these transactions in relation to fluctuating net assets of the classes. Expenses directly attributable to a fund are charged to that fund. Expenses attributable to more than one fund are allocated among the respective funds on the basis of relative net assets or other appropriate methods. Expense estimates are accrued in the period to which they relate and adjustments are made when actual amounts are known.
Income Tax Information and Distributions to Shareholders. Each year, the Fund intends to qualify as a regulated investment company under Subchapter M of the Internal Revenue Code, including distributing substantially all of its taxable income and realized gains. As a result, no provision for U.S. Federal income taxes is required. As of October 31, 2019, the Fund did not have any unrecognized tax benefits in the financial statements; nor is the Fund aware of any tax positions for which it is reasonably possible that the total amounts of unrecognized tax benefits will significantly change in the next twelve months. The Fund files a U.S. federal tax return, in addition to state and local tax returns as required. The Fund's federal income tax returns are subject to examination by the Internal Revenue Service (IRS) for a period of three fiscal years after they are filed. State and local tax returns may be subject to examination for an additional fiscal year depending on the jurisdiction. Foreign taxes are provided for based on the Fund's understanding of the tax rules and rates that exist in the foreign markets in which it invests.
Distributions are declared and recorded on the ex-dividend date. Income and capital gain distributions are declared separately for each class. Income and capital gain distributions are determined in accordance with income tax regulations, which may differ from GAAP. In addition, the Fund claimed a portion of the payment made to redeeming shareholders as a distribution for income tax purposes.
Capital accounts within the financial statements are adjusted for permanent book-tax differences. These adjustments have no impact on net assets or the results of operations. Capital accounts are not adjusted for temporary book-tax differences which will reverse in a subsequent period.
Book-tax differences are primarily due to foreign currency transactions, passive foreign investment companies (PFIC), redemptions in kind, non-taxable dividends and losses deferred due to wash sales.
As of period end, the cost and unrealized appreciation (depreciation) in securities, and derivatives if applicable, for federal income tax purposes were as follows:
| Gross unrealized appreciation | $296,255,787 |
| Gross unrealized depreciation | (39,769,964) |
| Net unrealized appreciation (depreciation) | $256,485,823 |
| Tax Cost | $645,354,917 |
The tax-based components of distributable earnings as of period end were as follows:
| Undistributed ordinary income | $12,903,319 |
| Undistributed long-term capital gain | $22,920,743 |
| Net unrealized appreciation (depreciation) on securities and other investments | $256,475,070 |
The tax character of distributions paid was as follows:
| | October 31, 2019 | October 31, 2018 |
| Ordinary Income | $10,899,530 | $ 22,403,877 |
| Long-term Capital Gains | 50,976,469 | 5,072,874 |
| Total | $61,875,999 | $ 27,476,751 |
Delayed Delivery Transactions and When-Issued Securities. During the period, the Fund transacted in securities on a delayed delivery or when-issued basis. Payment and delivery may take place after the customary settlement period for that security. The price of the underlying securities and the date when the securities will be delivered and paid for are fixed at the time the transaction is negotiated. Losses may arise due to changes in the value of the underlying securities or if the counterparty does not perform under the contract's terms, or if the issuer does not issue the securities due to political, economic, or other factors.
Restricted Securities. The Fund may invest in securities that are subject to legal or contractual restrictions on resale. These securities generally may be resold in transactions exempt from registration or to the public if the securities are registered. Disposal of these securities may involve time-consuming negotiations and expense, and prompt sale at an acceptable price may be difficult. Information regarding restricted securities is included at the end of the Fund's Schedule of Investments.
4. Purchases and Sales of Investments.
Purchases and sales of securities, other than short-term securities and in-kind transactions, aggregated $82,140,157 and $208,715,800, respectively.
5. Fees and Other Transactions with Affiliates.
Management Fee. Fidelity Management & Research Company (the investment adviser) and its affiliates provide the Fund with investment management related services for which the Fund pays a monthly management fee. The management fee is the sum of an individual fund fee rate that is based on an annual rate of .45% of the Fund's average net assets and an annualized group fee rate that averaged .24% during the period. The group fee rate is based upon the average net assets of all the mutual funds advised by the investment adviser, including any mutual funds previously advised by the investment adviser that are currently advised by Fidelity SelectCo, LLC, an affiliate of the investment adviser. The group fee rate decreases as assets under management increase and increases as assets under management decrease. In addition, the management fee is subject to a performance adjustment (up to a maximum of +/- .20% of the Fund's average net assets over a 36 month performance period). The upward or downward adjustment to the management fee is based on the relative investment performance of Canada as compared to its benchmark index, the S&P/TSX Composite Index, over the same 36 month performance period. For the reporting period, the total annual management fee rate, including the performance adjustment, was .61% of the Fund's average net assets. The performance adjustment included in the management fee rate may be higher or lower than the maximum performance adjustment rate due to the difference between the average net assets for the reporting and performance periods.
Distribution and Service Plan Fees. In accordance with Rule 12b-1 of the 1940 Act, the Fund has adopted separate Distribution and Service Plans for each class of shares. Certain classes pay Fidelity Distributors Corporation (FDC), an affiliate of the investment adviser, separate Distribution and Service Fees, each of which is based on an annual percentage of each class' average net assets. In addition, FDC may pay financial intermediaries for selling shares of the Fund and providing shareholder support services. For the period, the Distribution and Service Fee rates, total fees and amounts retained by FDC were as follows:
| | Distribution Fee | Service Fee | Total Fees | Retained by FDC |
| Class A | -% | .25% | $74,470 | $487 |
| Class M | .25% | .25% | 39,406 | 192 |
| Class C | .75% | .25% | 86,659 | 2,472 |
| | | | $200,535 | $3,151 |
Sales Load. FDC may receive a front-end sales charge of up to 5.75% for selling Class A shares and 3.50% for selling Class M shares, some of which is paid to financial intermediaries for selling shares of the Fund. Depending on the holding period, FDC may receive contingent deferred sales charges levied on Class A, Class M and Class C redemptions. The deferred sales charges are 1.00% for Class C shares, 1.00% for certain purchases of Class A shares and .25% for certain purchases of Class M shares.
For the period, sales charge amounts retained by FDC were as follows:
| | Retained by FDC |
| Class A | $3,443 |
| Class M | 1,081 |
| Class C(a) | 303 |
| | $4,827 |
(a) When Class C shares are initially sold, FDC pays commissions from its own resources to financial intermediaries through which the sales are made.
Transfer Agent Fees. Fidelity Investments Institutional Operations Company, Inc., (FIIOC), an affiliate of the investment adviser, is the transfer, dividend disbursing and shareholder servicing agent for each class of the Fund. FIIOC receives account fees and asset-based fees that vary according to the account size and type of account of the shareholders of the respective classes of the Fund, except for Class Z. FIIOC receives an asset-based fee of Class Z's average net assets. FIIOC pays for typesetting, printing and mailing of shareholder reports, except proxy statements.
For the period, transfer agent fees for each class were as follows:
| | Amount | % of Class-Level Average Net Assets |
| Class A | $82,441 | .28 |
| Class M | 24,810 | .31 |
| Class C | 20,676 | .24 |
| Canada | 1,847,720 | .21 |
| Class I | 68,107 | .17 |
| Class Z | 2,020 | .04 |
| | $2,045,774 | |
Accounting and Security Lending Fees. Fidelity Service Company, Inc. (FSC), an affiliate of the investment adviser, maintains the Fund's accounting records. The accounting fee is based on the level of average net assets for each month. Prior to April 1, 2019, FSC had a separate agreement with the Fund for administration of the security lending program, based on the number and duration of lending transactions. For the period, the total fees paid for accounting and administration of securities lending were equivalent to an annual rate of .05%.
Interfund Lending Program. Pursuant to an Exemptive Order issued by the SEC, the Fund, along with other registered investment companies having management contracts with Fidelity Management & Research Company (FMR) or other affiliated entities of FMR, may participate in an interfund lending program. This program provides an alternative credit facility allowing the funds to borrow from, or lend money to, other participating affiliated funds. At period end, there were no interfund loans outstanding. The Fund's activity in this program during the period for which loans were outstanding was as follows:
| Borrower or Lender | Average Loan Balance | Weighted Average Interest Rate | Interest Expense |
| Borrower | $10,526,000 | 2.35% | $3,436 |
Interfund Trades. The Fund may purchase from or sell securities to other Fidelity Funds under procedures adopted by the Board. The procedures have been designed to ensure these interfund trades are executed in accordance with Rule 17a-7 of the 1940 Act. Interfund trades are included within the respective purchases and sales amounts shown in the Purchases and Sales of Investments note.
Affiliated Redemptions In-Kind. During the period, 1,326,664 shares of the Fund were redeemed in-kind for investments and cash with a value of $69,285,297. The net realized gain of $25,479,297 on investments delivered through in-kind redemptions is included in the accompanying Statement of Operations. The amount of the in-kind redemptions is included in share transactions in the accompanying Statement of Changes in Net Assets as well as the Notes to Financial Statements. The Fund recognized no gain or loss for federal income tax purposes.
6. Committed Line of Credit.
The Fund participates with other funds managed by the investment adviser or an affiliate in a $4.25 billion credit facility (the "line of credit") to be utilized for temporary or emergency purposes to fund shareholder redemptions or for other short-term liquidity purposes. The Fund has agreed to pay commitment fees on its pro-rata portion of the line of credit, which amounted to $2,639 and is reflected in Miscellaneous expenses on the Statement of Operations. During the period, the Fund did not borrow on this line of credit.
7. Security Lending.
The Fund lends portfolio securities from time to time in order to earn additional income. For equity securities, lending agents are used, including National Financial Services (NFS), an affiliate of the Fund. Pursuant to a securities lending agreement, NFS will receive a fee, which is capped at 9.9% of daily lending revenue, for its services as lending agent. The Fund may lend securities to certain qualified borrowers, including NFS. On the settlement date of the loan, the Fund receives collateral (in the form of U.S. Treasury obligations, letters of credit and/or cash) against the loaned securities and maintains collateral in an amount not less than 100% of the market value of the loaned securities during the period of the loan. The market value of the loaned securities is determined at the close of business of the Fund and any additional required collateral is delivered to the Fund on the next business day. The Fund or borrower may terminate the loan at any time, and if the borrower defaults on its obligation to return the securities loaned because of insolvency or other reasons, the Fund may apply collateral received from the borrower against the obligation. The Fund may experience delays and costs in recovering the securities loaned. Any cash collateral received is invested in the Fidelity Securities Lending Cash Central Fund. The value of loaned securities and cash collateral at period end are disclosed on the Fund's Statement of Assets and Liabilities. Security lending income represents the income earned on investing cash collateral, less rebates paid to borrowers and any lending agent fees associated with the loan, plus any premium payments received for lending certain types of securities. Security lending income is presented in the Statement of Operations as a component of income from Fidelity Central Funds. During the period, there were no securities loaned to NFS.
8. Expense Reductions.
Commissions paid to certain brokers with whom the investment adviser, or its affiliates, places trades on behalf of the Fund include an amount in addition to trade execution, which may be rebated back to the Fund to offset certain expenses. This amount totaled $20,848 for the period. In addition, through arrangements with the Fund's custodian, credits realized as a result of certain uninvested cash balances were used to reduce the Fund's expenses. During the period, custodian credits reduced the Fund's expenses by $70. During the period, transfer agent credits reduced each class' expenses as noted in the table below.
| | Expense reduction |
| Canada | $188 |
In addition, during the period the investment adviser reimbursed and/or waived a portion of fund-level operating expenses in the amount of $7,308 and a portion of class-level operating expenses as follows:
| | Amount |
| Class A | $458 |
| Class M | 128 |
| Class C | 168 |
| Canada | 14,543 |
| Class I | 700 |
| Class Z | 4 |
| | $16,001 |
9. Distributions to Shareholders.
Distributions to shareholders of each class were as follows:
| | Year ended
October 31, 2019 | Year ended
October 31, 2018(a) |
| Distributions to shareholders | | |
| Class A | $1,725,249 | $734,732 |
| Class M | 438,995 | 166,749 |
| Class C | 599,233 | 198,725 |
| Canada | 57,337,031 | 25,679,409 |
| Class I | 1,761,950 | 697,136 |
| Class Z | 13,541 | – |
| Total | $61,875,999 | $27,476,751 |
(a) Distributions for Class Z are for the period October 2, 2018 (commencement of sale of shares) to October 31, 2018.
10. Share Transactions.
Share transactions for each class were as follows and may contain automatic conversions between classes or exchanges between affiliated funds:
| | Shares | Shares | Dollars | Dollars |
| | Year ended October 31, 2019 | Year ended October 31, 2018(a) | Year ended October 31, 2019 | Year ended October 31, 2018(a) |
| Class A | | | | |
| Shares sold | 95,319 | 46,971 | $4,762,032 | $2,500,808 |
| Reinvestment of distributions | 34,965 | 12,714 | 1,594,742 | 672,936 |
| Shares redeemed | (132,619) | (162,467) | (6,599,280) | (8,569,248) |
| Net increase (decrease) | (2,335) | (102,782) | $(242,506) | $(5,395,504) |
| Class M | | | | |
| Shares sold | 24,151 | 8,442 | $1,232,542 | $442,723 |
| Reinvestment of distributions | 9,616 | 3,154 | 437,340 | 166,353 |
| Shares redeemed | (26,108) | (45,613) | (1,303,095) | (2,414,584) |
| Net increase (decrease) | 7,659 | (34,017) | $366,787 | $(1,805,508) |
| Class C | | | | |
| Shares sold | 5,030 | 9,399 | $242,358 | $481,011 |
| Reinvestment of distributions | 12,492 | 3,474 | 558,623 | 180,309 |
| Shares redeemed | (125,453) | (84,247) | (6,065,682) | (4,355,073) |
| Net increase (decrease) | (107,931) | (71,374) | $(5,264,701) | $(3,693,753) |
| Canada | | | | |
| Shares sold | 720,245 | 711,176 | $35,658,625 | $37,797,009 |
| Reinvestment of distributions | 1,185,764 | 457,772 | 54,201,287 | 24,289,363 |
| Shares redeemed | (4,577,840)(b) | (3,887,975) | (231,547,759)(b) | (207,409,511) |
| Net increase (decrease) | (2,671,831) | (2,719,027) | $(141,687,847) | $(145,323,139) |
| Class I | | | | |
| Shares sold | 739,392 | 160,132 | $35,133,991 | $8,478,569 |
| Reinvestment of distributions | 37,998 | 12,538 | 1,732,719 | 663,882 |
| Shares redeemed | (1,038,167)(b) | (196,779) | (52,836,490)(b) | (10,381,577) |
| Net increase (decrease) | (260,777) | (24,109) | $(15,969,780) | $(1,239,126) |
| Class Z | | | | |
| Shares sold | 412,219 | 2,572 | $20,955,321 | $135,809 |
| Reinvestment of distributions | 266 | – | 12,119 | – |
| Shares redeemed | (21,441) | – | (1,105,326) | – |
| Net increase (decrease) | 391,044 | 2,572 | $19,862,114 | $135,809 |
(a) Share transactions for Class Z are for the period October 2, 2018 (commencement of sale of shares) to October 31, 2018.
(b) Amount includes in-kind redemptions (see the Affiliated Redemptions In-Kind note for additional details).
11. Other.
The Fund's organizational documents provide former and current trustees and officers with a limited indemnification against liabilities arising in connection with the performance of their duties to the Fund. In the normal course of business, the Fund may also enter into contracts that provide general indemnifications. The Fund's maximum exposure under these arrangements is unknown as this would be dependent on future claims that may be made against the Fund. The risk of material loss from such claims is considered remote.
Fidelity® China Region Fund
Performance: The Bottom Line
Average annual total return reflects the change in the value of an investment, assuming reinvestment of distributions from dividend income and capital gains (the profits earned upon the sale of securities that have grown in value, if any) and assuming a constant rate of performance each year. The hypothetical investment and the average annual total returns do not reflect the deduction of taxes that a shareholder would pay on fund distributions or the redemption of fund shares. During periods of reimbursement by Fidelity, a fund’s total return will be greater than it would be had the reimbursement not occurred. How a fund did yesterday is no guarantee of how it will do tomorrow.
Average Annual Total Returns
| For the periods ended October 31, 2019 | Past 1 year | Past 5 years | Past 10 years |
| Class A (incl. 5.75% sales charge) | 18.10% | 5.82% | 7.16% |
| Class M (incl. 3.50% sales charge) | 20.53% | 5.96% | 7.09% |
| Class C (incl. contingent deferred sales charge) | 23.41% | 6.29% | 7.00% |
| Fidelity® China Region Fund | 25.72% | 7.41% | 8.15% |
| Class I | 25.71% | 7.41% | 8.15% |
| Class Z | 25.86% | 7.44% | 8.16% |
The initial offering of Class Z shares took place on October 2, 2018. Returns prior to October 2, 2018, are those of Class I.
$10,000 Over 10 Years
Let's say hypothetically that $10,000 was invested in Fidelity® China Region Fund - Fidelity® China Region Fund on October 31, 2009, and the current % sales charge was paid.
The chart shows how the value of your investment would have changed, and also shows how the MSCI Golden Dragon Index performed over the same period.
See above for additional information regarding the performance of Fidelity® China Region Fund.

| Period Ending Values |
| $21,882 | Fidelity® China Region Fund |
| $18,573 | MSCI Golden Dragon Index |
Fidelity® China Region Fund
Management's Discussion of Fund Performance
Market Recap: The MSCI ACWI (All Country World Index) ex USA Index gained 11.47% for the 12 months ending October 31, 2019, as international stocks reflected a confluence of factors, including escalating trade tension, and moderating but still positive global economic growth. Currency fluctuations were largely modest and varied by region, muting the overall impact on international equity returns. In late December, the U.S. Federal Reserve shifted from raising interest rates to a more dovish policy in 2019, joining many foreign central banks. In June, international stocks rose 6.03%, as policy stimulus in China stabilized that country’s economic growth. The Fed cut its policy rate in July for the first time since 2008. However, the index returned -1.21% for the month, followed by -3.08% in August. In September, the Fed cut its policy rate another quarter point, citing concerns about slowing economic growth and muted inflation, and did the same in October, leading to monthly gains of 2.59% and 3.49%, respectively. For the full 12 months, the growth-oriented information technology sector (+22%) led the way, followed by utilities (+20%) and real estate (+18%), two high-dividend-yielding categories. Conversely, energy was roughly flat, while materials (+6%) and communication services (7%) also lagged. By region, Asia Pacific ex Japan (+16%), Europe ex U.K (+13%), Canada (+12%) and emerging markets (+12%) fared best. Meanwhile, the U.K. (+7%) and Japan (+10%) trailed the broader market.
Comments from Co-Portfolio Managers Stephen Lieu and Ivan Xie: For the year, the fund’s share classes (excluding sales charges, if applicable) returned roughly 24% to 26%, well ahead of the 15.36% advance of the benchmark, the MSCI Golden Dragon Index. Stock selection primarily drove the fund’s outperformance of the benchmark, especially in the consumer discretionary, information technology and consumer staples sectors. By country, China accounted for most of the fund’s outperformance, overcoming poor positioning in Hong Kong and a non-benchmark allocation to the United States. Among individual positions, overweighting China-based e-commerce platform operator Pinduoduo and food-delivery service Meituan Dianping each added considerable value. It also helped to not own China-based internet search provider Baidu. Conversely, positioning in materials detracted from the fund’s relative result, as did a small cash position. Among individual holdings, a non-benchmark stake in content, marketing and transactions services company Bitauto Holdings hurt notably, as did a non-benchmark stake in Uxin, an online used-car dealer. We sold both Bitauto Holdings and Uxin from the fund. A sizable overweighting in Sinopec Engineering Group also worked against us.
The views expressed above reflect those of the portfolio manager(s) only through the end of the period as stated on the cover of this report and do not necessarily represent the views of Fidelity or any other person in the Fidelity organization. Any such views are subject to change at any time based upon market or other conditions and Fidelity disclaims any responsibility to update such views. These views may not be relied on as investment advice and, because investment decisions for a Fidelity fund are based on numerous factors, may not be relied on as an indication of trading intent on behalf of any Fidelity fund.
Fidelity® China Region Fund
Investment Summary (Unaudited)
Geographic Diversification (% of fund's net assets)
| As of October 31, 2019 |
| | Cayman Islands | 38.7% |
| | China | 22.1% |
| | Hong Kong | 11.7% |
| | Taiwan | 9.4% |
| | Korea (South) | 5.1% |
| | Bermuda | 4.4% |
| | United States of America* | 4.1% |
| | Netherlands | 1.3% |
| | Luxembourg | 1.0% |
| | Other | 2.2% |
* Includes Short-Term investments and Net Other Assets (Liabilities).
Percentages are based on country or territory of incorporation and are adjusted for the effect of futures contracts, if applicable.
Asset Allocation as of October 31, 2019
| | % of fund's net assets |
| Stocks | 98.7 |
| Short-Term Investments and Net Other Assets (Liabilities) | 1.3 |
Top Ten Stocks as of October 31, 2019
| | % of fund's net assets |
| Alibaba Group Holding Ltd. sponsored ADR (Internet & Direct Marketing Retail) | 11.0 |
| Tencent Holdings Ltd. (Interactive Media & Services) | 10.3 |
| Taiwan Semiconductor Manufacturing Co. Ltd. (Semiconductors & Semiconductor Equipment) | 5.8 |
| AIA Group Ltd. (Insurance) | 4.5 |
| China Construction Bank Corp. (H Shares) (Banks) | 3.7 |
| Industrial & Commercial Bank of China Ltd. (H Shares) (Banks) | 2.1 |
| Meituan Dianping Class B (Internet & Direct Marketing Retail) | 2.1 |
| New Oriental Education & Technology Group, Inc. sponsored ADR (Diversified Consumer Services) | 1.9 |
| Pinduoduo, Inc. ADR (Internet & Direct Marketing Retail) | 1.8 |
| China Unicom Ltd. (Diversified Telecommunication Services) | 1.7 |
| | 44.9 |
Top Market Sectors as of October 31, 2019
| | % of fund's net assets |
| Consumer Discretionary | 24.4 |
| Financials | 17.9 |
| Information Technology | 16.8 |
| Communication Services | 15.4 |
| Real Estate | 5.7 |
| Industrials | 4.8 |
| Health Care | 4.7 |
| Materials | 3.0 |
| Consumer Staples | 2.7 |
| Energy | 2.0 |
Market Sectors may include more than one industry category.
The Fund may invest up to 35% of its total assets in any industry that represents more than 20% of the Hong Kong, Taiwanese and Chinese markets. As of October 31, 2019, the Fund did not have more than 25% of its total assets invested in any one industry.
Fidelity® China Region Fund
Schedule of Investments October 31, 2019
Showing Percentage of Net Assets
| Common Stocks - 97.2% | | | |
| | | Shares | Value |
| COMMUNICATION SERVICES - 15.4% | | | |
| Diversified Telecommunication Services - 1.7% | | | |
| China Unicom Ltd. | | 20,936,000 | $20,611,473 |
| Entertainment - 1.9% | | | |
| DouYu International Holdings Ltd. ADR (a) | | 2,148,600 | 16,694,622 |
| iQIYI, Inc. ADR (a)(b) | | 352,700 | 6,147,561 |
| | | | 22,842,183 |
| Interactive Media & Services - 11.8% | | | |
| Momo, Inc. ADR | | 396,700 | 13,297,384 |
| Tencent Holdings Ltd. | | 3,101,100 | 125,789,663 |
| Wise Talent Information Technology Co. Ltd. (b) | | 1,784,600 | 4,446,128 |
| | | | 143,533,175 |
|
| TOTAL COMMUNICATION SERVICES | | | 186,986,831 |
|
| CONSUMER DISCRETIONARY - 24.4% | | | |
| Automobiles - 1.7% | | | |
| Brilliance China Automotive Holdings Ltd. | | 7,490,000 | 8,259,775 |
| Great Wall Motor Co. Ltd. (H Shares) (a) | | 10,223,000 | 8,283,200 |
| Guangzhou Automobile Group Co. Ltd. (H Shares) | | 4,246,000 | 4,240,631 |
| | | | 20,783,606 |
| Diversified Consumer Services - 3.4% | | | |
| Koolearn Technology Holding Ltd. (a)(b)(c) | | 4,660,500 | 10,940,778 |
| New Oriental Education & Technology Group, Inc. sponsored ADR (b) | | 193,500 | 23,618,610 |
| TAL Education Group ADR (b) | | 163,300 | 6,990,873 |
| | | | 41,550,261 |
| Hotels, Restaurants & Leisure - 0.9% | | | |
| Galaxy Entertainment Group Ltd. | | 935,000 | 6,438,073 |
| Summit Ascent Holdings Ltd. (b) | | 25,142,000 | 3,905,831 |
| | | | 10,343,904 |
| Household Durables - 1.8% | | | |
| Gree Electric Appliances, Inc. of Zhuhai (A Shares) | | 1,605,610 | 13,386,672 |
| Haier Electronics Group Co. Ltd. | | 2,947,000 | 8,413,947 |
| | | | 21,800,619 |
| Internet & Direct Marketing Retail - 15.6% | | | |
| Alibaba Group Holding Ltd. sponsored ADR (b) | | 754,800 | 133,350,514 |
| Farfetch Ltd. Class A (a)(b) | | 441,000 | 3,938,130 |
| Meituan Dianping Class B (b) | | 2,094,388 | 24,982,159 |
| Pinduoduo, Inc. ADR (b) | | 536,705 | 21,940,500 |
| Secoo Holding Ltd. ADR (b) | | 907,467 | 5,453,877 |
| | | | 189,665,180 |
| Textiles, Apparel & Luxury Goods - 1.0% | | | |
| Samsonite International SA | | 6,212,100 | 12,648,847 |
|
| TOTAL CONSUMER DISCRETIONARY | | | 296,792,417 |
|
| CONSUMER STAPLES - 2.7% | | | |
| Beverages - 1.5% | | | |
| Kweichow Moutai Co. Ltd. (A Shares) | | 105,145 | 17,598,077 |
| Shanghai Bairun Investment Holding Group Co. Ltd. (A Shares) | | 164,408 | 622,223 |
| | | | 18,220,300 |
| Food Products - 0.5% | | | |
| Chongqing Fuling Zhacai Group Co. Ltd. Group (A Shares) | | 1,826,163 | 6,023,096 |
| Household Products - 0.7% | | | |
| C&S Paper Co. Ltd. (A Shares) | | 5,094,152 | 9,007,927 |
|
| TOTAL CONSUMER STAPLES | | | 33,251,323 |
|
| ENERGY - 2.0% | | | |
| Energy Equipment & Services - 1.2% | | | |
| China Oilfield Services Ltd. (H Shares) | | 10,182,000 | 14,176,158 |
| Oil, Gas & Consumable Fuels - 0.8% | | | |
| PetroChina Co. Ltd. (H Shares) | | 20,186,000 | 9,843,937 |
|
| TOTAL ENERGY | | | 24,020,095 |
|
| FINANCIALS - 17.9% | | | |
| Banks - 7.2% | | | |
| China Construction Bank Corp. (H Shares) | | 55,877,000 | 44,772,592 |
| Dah Sing Banking Group Ltd. | | 3,656,800 | 4,727,496 |
| Dah Sing Financial Holdings Ltd. | | 1,404,800 | 5,227,361 |
| E.SUN Financial Holdings Co. Ltd. | | 8,474,671 | 7,655,492 |
| Industrial & Commercial Bank of China Ltd. (H Shares) | | 34,995,000 | 25,070,184 |
| | | | 87,453,125 |
| Capital Markets - 1.5% | | | |
| Hong Kong Exchanges and Clearing Ltd. | | 294,500 | 9,174,864 |
| Huatai Securities Co. Ltd. (H Shares) (c) | | 1,885,600 | 2,802,788 |
| Yantai China Pet Foods Co. Ltd. ELS (UBS AG London Bank Warrant Program) Class A warrants 4/27/20 (b)(c) | | 1,870,613 | 6,084,724 |
| | | | 18,062,376 |
| Consumer Finance - 0.7% | | | |
| 360 Finance, Inc. ADR | | 201,500 | 1,783,275 |
| LexinFintech Holdings Ltd. ADR (b) | | 486,300 | 5,514,642 |
| PPDAI Group, Inc. ADR | | 412,694 | 1,155,543 |
| | | | 8,453,460 |
| Insurance - 8.5% | | | |
| AIA Group Ltd. | | 5,562,400 | 55,391,630 |
| China Life Insurance Co. Ltd. (b) | | 14,766,000 | 12,152,489 |
| China Life Insurance Co. Ltd. (H Shares) | | 6,493,000 | 16,697,993 |
| China Pacific Insurance (Group) Co. Ltd. (H Shares) | | 1,333,000 | 4,836,509 |
| Ping An Insurance Group Co. of China Ltd. (H Shares) | | 1,302,000 | 15,027,412 |
| | | | 104,106,033 |
|
| TOTAL FINANCIALS | | | 218,074,994 |
|
| HEALTH CARE - 4.7% | | | |
| Biotechnology - 1.5% | | | |
| CStone Pharmaceuticals Co. Ltd. (b)(c) | | 1,172,000 | 1,562,431 |
| Jinyu Bio-Technology Co. Ltd. (A Shares) | | 5,271,338 | 15,393,237 |
| Zai Lab Ltd. ADR (b) | | 30,200 | 1,020,458 |
| | | | 17,976,126 |
| Health Care Equipment & Supplies - 0.4% | | | |
| Shenzhen Mindray Bio-Medical Electronics Co. Ltd. (A Shares) | | 167,315 | 4,224,614 |
| Pharmaceuticals - 2.8% | | | |
| Hansoh Pharmaceutical Group Co. Ltd. (c) | | 3,878,000 | 11,781,592 |
| Hutchison China Meditech Ltd. sponsored ADR (b) | | 168,600 | 3,186,540 |
| Tonghua Dongbao Pharmaceutical Co. Ltd. (A Shares) | | 775,948 | 1,759,927 |
| Yunnan Baiyao Group Co. Ltd. (A Shares) | | 1,439,061 | 17,684,252 |
| | | | 34,412,311 |
|
| TOTAL HEALTH CARE | | | 56,613,051 |
|
| INDUSTRIALS - 4.8% | | | |
| Construction & Engineering - 0.5% | | | |
| Sinopec Engineering Group Co. Ltd. (H Shares) | | 11,310,500 | 6,461,201 |
| Machinery - 2.9% | | | |
| Airtac International Group | | 559,000 | 7,652,387 |
| Cimc Enric Holdings Ltd. | | 1,418,000 | 767,518 |
| HIWIN Technologies Corp. | | 1,282,350 | 10,995,296 |
| Impro Precision Industries Ltd. (c) | | 7,974,000 | 3,194,835 |
| Shenzhen Inovance Technology Co. Ltd. (A Shares) | | 1,626,309 | 5,753,815 |
| Zhejiang Sanhua Intelligent Controls Co. Ltd. (A Shares) | | 3,238,742 | 6,434,454 |
| | | | 34,798,305 |
| Marine - 0.5% | | | |
| Pacific Basin Shipping Ltd. | | 28,971,000 | 6,707,872 |
| Professional Services - 0.9% | | | |
| 51job, Inc. sponsored ADR (b) | | 95,200 | 7,498,904 |
| Centre Testing International Group Co. Ltd. (A Shares) | | 1,601,300 | 3,182,587 |
| | | | 10,681,491 |
|
| TOTAL INDUSTRIALS | | | 58,648,869 |
|
| INFORMATION TECHNOLOGY - 15.3% | | | |
| Communications Equipment - 0.9% | | | |
| Ericsson (B Shares) sponsored ADR (a) | | 1,287,500 | 11,227,000 |
| Electronic Equipment & Components - 2.0% | | | |
| AVIC Jonhon OptronicTechnology Co. Ltd. | | 1,061,289 | 6,076,118 |
| Largan Precision Co. Ltd. | | 93,000 | 13,630,730 |
| Sunny Optical Technology Group Co. Ltd. | | 287,200 | 4,616,420 |
| | | | 24,323,268 |
| Semiconductors & Semiconductor Equipment - 10.7% | | | |
| ASM Pacific Technology Ltd. | | 628,200 | 8,771,452 |
| Micron Technology, Inc. (b) | | 269,200 | 12,800,460 |
| NXP Semiconductors NV | | 140,070 | 15,923,158 |
| Semiconductor Manufacturing International Corp. (a)(b) | | 6,567,000 | 8,341,722 |
| SK Hynix, Inc. | | 186,820 | 13,090,123 |
| Taiwan Semiconductor Manufacturing Co. Ltd. | | 7,267,000 | 71,080,908 |
| | | | 130,007,823 |
| Software - 0.6% | | | |
| Kingsoft Corp. Ltd. (b) | | 3,276,000 | 7,539,520 |
| Technology Hardware, Storage & Peripherals - 1.1% | | | |
| Samsung Electronics Co. Ltd. | | 310,370 | 13,366,472 |
|
| TOTAL INFORMATION TECHNOLOGY | | | 186,464,083 |
|
| MATERIALS - 3.0% | | | |
| Chemicals - 1.4% | | | |
| LG Chemical Ltd. | | 64,988 | 17,075,947 |
| Construction Materials - 0.8% | | | |
| West China Cement Ltd. | | 57,872,000 | 9,273,080 |
| Metals & Mining - 0.8% | | | |
| Zijin Mining Group Co. Ltd. (H Shares) | | 29,330,000 | 10,159,616 |
|
| TOTAL MATERIALS | | | 36,508,643 |
|
| REAL ESTATE - 5.7% | | | |
| Real Estate Management & Development - 5.7% | | | |
| Cheung Kong Property Holdings Ltd. | | 537,500 | 3,739,769 |
| China Jinmao Holdings Group Ltd. | | 12,476,000 | 8,294,304 |
| China Overseas Land and Investment Ltd. | | 2,706,000 | 8,538,764 |
| Hongkong Land Holdings Ltd. | | 1,955,000 | 10,739,586 |
| Longfor Properties Co. Ltd. (c) | | 3,386,000 | 14,052,416 |
| Sino Land Ltd. | | 7,383,630 | 11,037,546 |
| Sun Hung Kai Properties Ltd. | | 827,000 | 12,531,795 |
| | | | 68,934,180 |
| UTILITIES - 1.3% | | | |
| Gas Utilities - 1.3% | | | |
| China Gas Holdings Ltd. | | 3,845,400 | 16,381,174 |
| TOTAL COMMON STOCKS | | | |
| (Cost $926,066,449) | | | 1,182,675,660 |
|
| Nonconvertible Preferred Stocks - 1.5% | | | |
| INFORMATION TECHNOLOGY - 1.5% | | | |
| Technology Hardware, Storage & Peripherals - 1.5% | | | |
| Samsung Electronics Co. Ltd. | | | |
| (Cost $17,737,605) | | 539,640 | 18,928,831 |
|
| Money Market Funds - 3.8% | | | |
| Fidelity Cash Central Fund 1.83% (d) | | 16,815,536 | 16,818,900 |
| Fidelity Securities Lending Cash Central Fund 1.84% (d)(e) | | 28,965,915 | 28,968,812 |
| TOTAL MONEY MARKET FUNDS | | | |
| (Cost $45,787,737) | | | 45,787,712 |
| TOTAL INVESTMENT IN SECURITIES - 102.5% | | | |
| (Cost $989,591,791) | | | 1,247,392,203 |
| NET OTHER ASSETS (LIABILITIES) - (2.5)% | | | (30,643,738) |
| NET ASSETS - 100% | | | $1,216,748,465 |
Security Type Abbreviations
ELS – Equity-Linked Security
Legend
(a) Security or a portion of the security is on loan at period end.
(b) Non-income producing
(c) Security exempt from registration under Rule 144A of the Securities Act of 1933. These securities may be resold in transactions exempt from registration, normally to qualified institutional buyers. At the end of the period, the value of these securities amounted to $50,419,564 or 4.1% of net assets.
(d) Affiliated fund that is generally available only to investment companies and other accounts managed by Fidelity Investments. The rate quoted is the annualized seven-day yield of the fund at period end. A complete unaudited listing of the fund's holdings as of its most recent quarter end is available upon request. In addition, each Fidelity Central Fund's financial statements, which are not covered by the Fund's Report of Independent Registered Public Accounting Firm, are available on the SEC's website or upon request.
(e) Investment made with cash collateral received from securities on loan.
Affiliated Central Funds
Information regarding fiscal year to date income earned by the Fund from investments in Fidelity Central Funds is as follows:
| Fund | Income earned |
| Fidelity Cash Central Fund | $507,884 |
| Fidelity Securities Lending Cash Central Fund | 703,071 |
| Total | $1,210,955 |
Amounts in the income column in the above table include any capital gain distributions from underlying funds, which are presented in the corresponding line-item in the Statement of Operations, if applicable. Amount for Fidelity Securities Lending Cash Central Fund represents the income earned on investing cash collateral, less rebates paid to borrowers and any lending agent fees associated with the loan, plus any premium payments received for lending certain types of securities.
Investment Valuation
The following is a summary of the inputs used, as of October 31, 2019, involving the Fund's assets and liabilities carried at fair value. The inputs or methodology used for valuing securities may not be an indication of the risk associated with investing in those securities. For more information on valuation inputs, and their aggregation into the levels used below, please refer to the Investment Valuation section in the accompanying Notes to Financial Statements.
| | Valuation Inputs at Reporting Date: |
| Description | Total | Level 1 | Level 2 | Level 3 |
| Investments in Securities: | | | | |
| Equities: | | | | |
| Communication Services | $186,986,831 | $36,139,567 | $150,847,264 | $-- |
| Consumer Discretionary | 296,792,417 | 195,292,504 | 101,499,913 | -- |
| Consumer Staples | 33,251,323 | -- | 33,251,323 | -- |
| Energy | 24,020,095 | -- | 24,020,095 | -- |
| Financials | 218,074,994 | 28,261,441 | 189,813,553 | -- |
| Health Care | 56,613,051 | 4,206,998 | 52,406,053 | -- |
| Industrials | 58,648,869 | 26,146,587 | 32,502,282 | -- |
| Information Technology | 205,392,914 | 98,966,774 | 106,426,140 | -- |
| Materials | 36,508,643 | 17,075,947 | 19,432,696 | -- |
| Real Estate | 68,934,180 | -- | 68,934,180 | -- |
| Utilities | 16,381,174 | -- | 16,381,174 | -- |
| Money Market Funds | 45,787,712 | 45,787,712 | -- | -- |
| Total Investments in Securities: | $1,247,392,203 | $451,877,530 | $795,514,673 | $-- |
See accompanying notes which are an integral part of the financial statements.
Fidelity® China Region Fund
Financial Statements
Statement of Assets and Liabilities
| | | October 31, 2019 |
| Assets | | |
Investment in securities, at value (including securities loaned of $27,525,228) — See accompanying schedule:
Unaffiliated issuers (cost $943,804,054) | $1,201,604,491 | |
| Fidelity Central Funds (cost $45,787,737) | 45,787,712 | |
| Total Investment in Securities (cost $989,591,791) | | $1,247,392,203 |
| Receivable for fund shares sold | | 431,617 |
| Dividends receivable | | 559,080 |
| Distributions receivable from Fidelity Central Funds | | 38,881 |
| Prepaid expenses | | 2,123 |
| Other receivables | | 89,769 |
| Total assets | | 1,248,513,673 |
| Liabilities | | |
| Payable for fund shares redeemed | $1,678,483 | |
| Accrued management fee | 681,067 | |
| Distribution and service plan fees payable | 17,619 | |
| Other affiliated payables | 219,325 | |
| Other payables and accrued expenses | 199,409 | |
| Collateral on securities loaned | 28,969,305 | |
| Total liabilities | | 31,765,208 |
| Net Assets | | $1,216,748,465 |
| Net Assets consist of: | | |
| Paid in capital | | $952,652,617 |
| Total accumulated earnings (loss) | | 264,095,848 |
| Net Assets | | $1,216,748,465 |
| Net Asset Value and Maximum Offering Price | | |
| Class A: | | |
| Net Asset Value and redemption price per share ($29,962,550 ÷ 835,530 shares)(a) | | $35.86 |
| Maximum offering price per share (100/94.25 of $35.86) | | $38.05 |
| Class M: | | |
| Net Asset Value and redemption price per share ($9,250,910 ÷ 259,429 shares)(a) | | $35.66 |
| Maximum offering price per share (100/96.50 of $35.66) | | $36.95 |
| Class C: | | |
| Net Asset Value and offering price per share ($9,437,156 ÷ 271,898 shares)(a) | | $34.71 |
| China Region: | | |
| Net Asset Value, offering price and redemption price per share ($1,093,827,058 ÷ 30,133,331 shares) | | $36.30 |
| Class I: | | |
| Net Asset Value, offering price and redemption price per share ($27,410,259 ÷ 760,398 shares) | | $36.05 |
| Class Z: | | |
| Net Asset Value, offering price and redemption price per share ($46,860,532 ÷ 1,301,566 shares) | | $36.00 |
(a) Redemption price per share is equal to net asset value less any applicable contingent deferred sales charge.
See accompanying notes which are an integral part of the financial statements.
Statement of Operations
| | | Year ended October 31, 2019 |
| Investment Income | | |
| Dividends | | $20,427,706 |
| Income from Fidelity Central Funds (including $703,071 from security lending) | | 1,210,955 |
| Income before foreign taxes withheld | | 21,638,661 |
| Less foreign taxes withheld | | (1,706,130) |
| Total income | | 19,932,531 |
| Expenses | | |
| Management fee | $8,031,688 | |
| Transfer agent fees | 2,129,667 | |
| Distribution and service plan fees | 210,732 | |
| Accounting and security lending fees | 538,459 | |
| Custodian fees and expenses | 230,793 | |
| Independent trustees' fees and expenses | 6,531 | |
| Registration fees | 125,123 | |
| Audit | 95,288 | |
| Legal | 3,856 | |
| Miscellaneous | 8,862 | |
| Total expenses before reductions | 11,380,999 | |
| Expense reductions | (69,665) | |
| Total expenses after reductions | | 11,311,334 |
| Net investment income (loss) | | 8,621,197 |
| Realized and Unrealized Gain (Loss) | | |
| Net realized gain (loss) on: | | |
| Investment securities: | | |
| Unaffiliated issuers | 44,266,932 | |
| Fidelity Central Funds | (682) | |
| Foreign currency transactions | (7,160) | |
| Total net realized gain (loss) | | 44,259,090 |
| Change in net unrealized appreciation (depreciation) on: | | |
| Investment securities: | | |
| Unaffiliated issuers | 200,233,073 | |
| Fidelity Central Funds | (25) | |
| Assets and liabilities in foreign currencies | 9,366 | |
| Total change in net unrealized appreciation (depreciation) | | 200,242,414 |
| Net gain (loss) | | 244,501,504 |
| Net increase (decrease) in net assets resulting from operations | | $253,122,701 |
See accompanying notes which are an integral part of the financial statements.
Statement of Changes in Net Assets
| | Year ended October 31, 2019 | Year ended October 31, 2018 |
| Increase (Decrease) in Net Assets | | |
| Operations | | |
| Net investment income (loss) | $8,621,197 | $10,227,987 |
| Net realized gain (loss) | 44,259,090 | 94,015,398 |
| Change in net unrealized appreciation (depreciation) | 200,242,414 | (301,946,605) |
| Net increase (decrease) in net assets resulting from operations | 253,122,701 | (197,703,220) |
| Distributions to shareholders | (8,434,846) | (5,632,793) |
| Share transactions - net increase (decrease) | (60,489,131) | (145,112,080) |
| Redemption fees | – | 88,494 |
| Total increase (decrease) in net assets | 184,198,724 | (348,359,599) |
| Net Assets | | |
| Beginning of period | 1,032,549,741 | 1,380,909,340 |
| End of period | $1,216,748,465 | $1,032,549,741 |
See accompanying notes which are an integral part of the financial statements.
Financial Highlights
Fidelity China Region Fund Class A
| Years ended October 31, | 2019 | 2018 | 2017 | 2016 | 2015 |
| Selected Per–Share Data | | | | | |
| Net asset value, beginning of period | $28.73 | $34.22 | $25.46 | $29.34 | $34.18 |
| Income from Investment Operations | | | | | |
| Net investment income (loss)A | .15 | .15 | .08 | .18 | .40B |
| Net realized and unrealized gain (loss) | 7.10 | (5.56) | 8.90 | (.20) | (.83) |
| Total from investment operations | 7.25 | (5.41) | 8.98 | (.02) | (.43) |
| Distributions from net investment income | (.12) | (.08) | (.18) | (.27) | (.22) |
| Distributions from net realized gain | – | – | (.05) | (3.59) | (4.24) |
| Total distributions | (.12) | (.08) | (.23) | (3.86) | (4.46) |
| Redemption fees added to paid in capitalA | – | –C | .01 | –C | .05 |
| Net asset value, end of period | $35.86 | $28.73 | $34.22 | $25.46 | $29.34 |
| Total ReturnD,E | 25.30% | (15.86)% | 35.67% | (.13)% | (1.45)% |
| Ratios to Average Net AssetsF,G | | | | | |
| Expenses before reductions | 1.27% | 1.27% | 1.30% | 1.33% | 1.28% |
| Expenses net of fee waivers, if any | 1.26% | 1.27% | 1.30% | 1.33% | 1.28% |
| Expenses net of all reductions | 1.26% | 1.24% | 1.29% | 1.32% | 1.26% |
| Net investment income (loss) | .44% | .43% | .28% | .75% | 1.26%B |
| Supplemental Data | | | | | |
| Net assets, end of period (000 omitted) | $29,963 | $23,424 | $35,539 | $22,937 | $32,761 |
| Portfolio turnover rateH | 80% | 60% | 68% | 70% | 151% |
A Calculated based on average shares outstanding during the period.
B Net investment income per share reflects a large, non-recurring dividend which amounted to $.13 per share. Excluding this non-recurring dividend, the ratio of net investment income (loss) to average net assets would have been .85%.
C Amount represents less than $.005 per share.
D Total returns would have been lower if certain expenses had not been reduced during the applicable periods shown.
E Total returns do not include the effect of the sales charges.
F Fees and expenses of any underlying Fidelity Central Funds are not included in the Fund's expense ratio. The Fund indirectly bears its proportionate share of the expenses of any underlying Fidelity Central Funds.
G Expense ratios reflect operating expenses of the class. Expenses before reductions do not reflect amounts reimbursed by the investment adviser or reductions from brokerage service arrangements or reductions from other expense offset arrangements and do not represent the amount paid by the class during periods when reimbursements or reductions occur. Expenses net of fee waivers reflect expenses after reimbursement by the investment adviser but prior to reductions from brokerage service arrangements or other expense offset arrangements. Expenses net of all reductions represent the net expenses paid by the class.
H Amount does not include the portfolio activity of any underlying Fidelity Central Funds.
See accompanying notes which are an integral part of the financial statements.
Fidelity China Region Fund Class M
| Years ended October 31, | 2019 | 2018 | 2017 | 2016 | 2015 |
| Selected Per–Share Data | | | | | |
| Net asset value, beginning of period | $28.55 | $34.05 | $25.34 | $29.18 | $34.02 |
| Income from Investment Operations | | | | | |
| Net investment income (loss)A | .04 | .03 | (.02) | .10 | .30B |
| Net realized and unrealized gain (loss) | 7.07 | (5.53) | 8.88 | (.22) | (.83) |
| Total from investment operations | 7.11 | (5.50) | 8.86 | (.12) | (.53) |
| Distributions from net investment income | – | – | (.11) | (.13) | (.12) |
| Distributions from net realized gain | – | – | (.05) | (3.59) | (4.24) |
| Total distributions | – | – | (.16) | (3.72) | (4.36) |
| Redemption fees added to paid in capitalA | – | –C | .01 | –C | .05 |
| Net asset value, end of period | $35.66 | $28.55 | $34.05 | $25.34 | $29.18 |
| Total ReturnD,E | 24.90% | (16.15)% | 35.25% | (.50)% | (1.79)% |
| Ratios to Average Net AssetsF,G | | | | | |
| Expenses before reductions | 1.59% | 1.62% | 1.65% | 1.67% | 1.62% |
| Expenses net of fee waivers, if any | 1.59% | 1.62% | 1.65% | 1.67% | 1.62% |
| Expenses net of all reductions | 1.58% | 1.58% | 1.64% | 1.67% | 1.60% |
| Net investment income (loss) | .12% | .08% | (.07)% | .40% | .92%B |
| Supplemental Data | | | | | |
| Net assets, end of period (000 omitted) | $9,251 | $8,132 | $9,763 | $5,644 | $6,409 |
| Portfolio turnover rateH | 80% | 60% | 68% | 70% | 151% |
A Calculated based on average shares outstanding during the period.
B Net investment income per share reflects a large, non-recurring dividend which amounted to $.13 per share. Excluding this non-recurring dividend, the ratio of net investment income (loss) to average net assets would have been .51%.
C Amount represents less than $.005 per share.
D Total returns would have been lower if certain expenses had not been reduced during the applicable periods shown.
E Total returns do not include the effect of the sales charges.
F Fees and expenses of any underlying Fidelity Central Funds are not included in the Fund's expense ratio. The Fund indirectly bears its proportionate share of the expenses of any underlying Fidelity Central Funds.
G Expense ratios reflect operating expenses of the class. Expenses before reductions do not reflect amounts reimbursed by the investment adviser or reductions from brokerage service arrangements or reductions from other expense offset arrangements and do not represent the amount paid by the class during periods when reimbursements or reductions occur. Expenses net of fee waivers reflect expenses after reimbursement by the investment adviser but prior to reductions from brokerage service arrangements or other expense offset arrangements. Expenses net of all reductions represent the net expenses paid by the class.
H Amount does not include the portfolio activity of any underlying Fidelity Central Funds.
See accompanying notes which are an integral part of the financial statements.
Fidelity China Region Fund Class C
| Years ended October 31, | 2019 | 2018 | 2017 | 2016 | 2015 |
| Selected Per–Share Data | | | | | |
| Net asset value, beginning of period | $27.90 | $33.41 | $24.82 | $28.68 | $33.56 |
| Income from Investment Operations | | | | | |
| Net investment income (loss)A | (.09) | (.11) | (.13) | –B | .15C |
| Net realized and unrealized gain (loss) | 6.90 | (5.40) | 8.73 | (.21) | (.80) |
| Total from investment operations | 6.81 | (5.51) | 8.60 | (.21) | (.65) |
| Distributions from net investment income | – | – | – | (.06) | (.04) |
| Distributions from net realized gain | – | – | (.02) | (3.59) | (4.24) |
| Total distributions | – | – | (.02) | (3.65) | (4.28) |
| Redemption fees added to paid in capitalA | – | –B | .01 | –B | .05 |
| Net asset value, end of period | $34.71 | $27.90 | $33.41 | $24.82 | $28.68 |
| Total ReturnD,E | 24.41% | (16.49)% | 34.71% | (.88)% | (2.21)% |
| Ratios to Average Net AssetsF,G | | | | | |
| Expenses before reductions | 2.00% | 2.01% | 2.05% | 2.07% | 2.05% |
| Expenses net of fee waivers, if any | 2.00% | 2.01% | 2.05% | 2.07% | 2.05% |
| Expenses net of all reductions | 1.99% | 1.98% | 2.03% | 2.06% | 2.02% |
| Net investment income (loss) | (.29)% | (.31)% | (.46)% | .01% | .49%C |
| Supplemental Data | | | | | |
| Net assets, end of period (000 omitted) | $9,437 | $10,138 | $12,952 | $11,218 | $14,355 |
| Portfolio turnover rateH | 80% | 60% | 68% | 70% | 151% |
A Calculated based on average shares outstanding during the period.
B Amount represents less than $.005 per share.
C Net investment income per share reflects a large, non-recurring dividend which amounted to $.13 per share. Excluding this non-recurring dividend, the ratio of net investment income (loss) to average net assets would have been .09%.
D Total returns would have been lower if certain expenses had not been reduced during the applicable periods shown.
E Total returns do not include the effect of the contingent deferred sales charge.
F Fees and expenses of any underlying Fidelity Central Funds are not included in the Fund's expense ratio. The Fund indirectly bears its proportionate share of the expenses of any underlying Fidelity Central Funds.
G Expense ratios reflect operating expenses of the class. Expenses before reductions do not reflect amounts reimbursed by the investment adviser or reductions from brokerage service arrangements or reductions from other expense offset arrangements and do not represent the amount paid by the class during periods when reimbursements or reductions occur. Expenses net of fee waivers reflect expenses after reimbursement by the investment adviser but prior to reductions from brokerage service arrangements or other expense offset arrangements. Expenses net of all reductions represent the net expenses paid by the class.
H Amount does not include the portfolio activity of any underlying Fidelity Central Funds.
See accompanying notes which are an integral part of the financial statements.
Fidelity China Region Fund
| Years ended October 31, | 2019 | 2018 | 2017 | 2016 | 2015 |
| Selected Per–Share Data | | | | | |
| Net asset value, beginning of period | $29.11 | $34.64 | $25.78 | $29.66 | $34.51 |
| Income from Investment Operations | | | | | |
| Net investment income (loss)A | .25 | .26 | .17 | .26 | .51B |
| Net realized and unrealized gain (loss) | 7.19 | (5.65) | 9.00 | (.21) | (.84) |
| Total from investment operations | 7.44 | (5.39) | 9.17 | .05 | (.33) |
| Distributions from net investment income | (.25) | (.14) | (.27) | (.35) | (.33) |
| Distributions from net realized gain | – | – | (.05) | (3.59) | (4.24) |
| Total distributions | (.25) | (.14) | (.32) | (3.93)C | (4.57) |
| Redemption fees added to paid in capitalA | – | –D | .01 | –D | .05 |
| Net asset value, end of period | $36.30 | $29.11 | $34.64 | $25.78 | $29.66 |
| Total ReturnE | 25.72% | (15.62)% | 36.10% | .15% | (1.14)% |
| Ratios to Average Net AssetsF,G | | | | | |
| Expenses before reductions | .95% | .96% | 1.00% | 1.02% | .99% |
| Expenses net of fee waivers, if any | .95% | .96% | 1.00% | 1.02% | .98% |
| Expenses net of all reductions | .95% | .93% | .99% | 1.01% | .96% |
| Net investment income (loss) | .76% | .74% | .58% | 1.06% | 1.55%B |
| Supplemental Data | | | | | |
| Net assets, end of period (000 omitted) | $1,093,827 | $969,679 | $1,294,775 | $1,004,985 | $1,262,274 |
| Portfolio turnover rateH | 80% | 60% | 68% | 70% | 151% |
A Calculated based on average shares outstanding during the period.
B Net investment income per share reflects a large, non-recurring dividend which amounted to $.13 per share. Excluding this non-recurring dividend, the ratio of net investment income (loss) to average net assets would have been 1.15%.
C Total distributions of $3.93 per share is comprised of distributions from net investment income of $.345 and distributions from net realized gain of $3.588 per share.
D Amount represents less than $.005 per share.
E Total returns would have been lower if certain expenses had not been reduced during the applicable periods shown.
F Fees and expenses of any underlying Fidelity Central Funds are not included in the Fund's expense ratio. The Fund indirectly bears its proportionate share of the expenses of any underlying Fidelity Central Funds.
G Expense ratios reflect operating expenses of the class. Expenses before reductions do not reflect amounts reimbursed by the investment adviser or reductions from brokerage service arrangements or reductions from other expense offset arrangements and do not represent the amount paid by the class during periods when reimbursements or reductions occur. Expenses net of fee waivers reflect expenses after reimbursement by the investment adviser but prior to reductions from brokerage service arrangements or other expense offset arrangements. Expenses net of all reductions represent the net expenses paid by the class.
H Amount does not include the portfolio activity of any underlying Fidelity Central Funds.
See accompanying notes which are an integral part of the financial statements.
Fidelity China Region Fund Class I
| Years ended October 31, | 2019 | 2018 | 2017 | 2016 | 2015 |
| Selected Per–Share Data | | | | | |
| Net asset value, beginning of period | $28.90 | $34.41 | $25.62 | $29.51 | $34.39 |
| Income from Investment Operations | | | | | |
| Net investment income (loss)A | .25 | .26 | .16 | .26 | .51B |
| Net realized and unrealized gain (loss) | 7.13 | (5.61) | 8.95 | (.20) | (.84) |
| Total from investment operations | 7.38 | (5.35) | 9.11 | .06 | (.33) |
| Distributions from net investment income | (.23) | (.16) | (.28) | (.36) | (.36) |
| Distributions from net realized gain | – | – | (.05) | (3.59) | (4.24) |
| Total distributions | (.23) | (.16) | (.33) | (3.95) | (4.60) |
| Redemption fees added to paid in capitalA | – | –C | .01 | –C | .05 |
| Net asset value, end of period | $36.05 | $28.90 | $34.41 | $25.62 | $29.51 |
| Total ReturnD | 25.71% | (15.63)% | 36.11% | .16% | (1.14)% |
| Ratios to Average Net AssetsE,F | | | | | |
| Expenses before reductions | .97% | .98% | 1.01% | 1.00% | .97% |
| Expenses net of fee waivers, if any | .96% | .98% | 1.01% | 1.00% | .97% |
| Expenses net of all reductions | .96% | .95% | .99% | .99% | .95% |
| Net investment income (loss) | .74% | .72% | .57% | 1.07% | 1.57%B |
| Supplemental Data | | | | | |
| Net assets, end of period (000 omitted) | $27,410 | $20,854 | $27,880 | $19,334 | $26,961 |
| Portfolio turnover rateG | 80% | 60% | 68% | 70% | 151% |
A Calculated based on average shares outstanding during the period.
B Net investment income per share reflects a large, non-recurring dividend which amounted to $.13 per share. Excluding this non-recurring dividend, the ratio of net investment income (loss) to average net assets would have been 1.16%.
C Amount represents less than $.005 per share.
D Total returns would have been lower if certain expenses had not been reduced during the applicable periods shown.
E Fees and expenses of any underlying Fidelity Central Funds are not included in the Fund's expense ratio. The Fund indirectly bears its proportionate share of the expenses of any underlying Fidelity Central Funds.
F Expense ratios reflect operating expenses of the class. Expenses before reductions do not reflect amounts reimbursed by the investment adviser or reductions from brokerage service arrangements or reductions from other expense offset arrangements and do not represent the amount paid by the class during periods when reimbursements or reductions occur. Expenses net of fee waivers reflect expenses after reimbursement by the investment adviser but prior to reductions from brokerage service arrangements or other expense offset arrangements. Expenses net of all reductions represent the net expenses paid by the class.
G Amount does not include the portfolio activity of any underlying Fidelity Central Funds.
See accompanying notes which are an integral part of the financial statements.
Fidelity China Region Fund Class Z
| Years ended October 31, | 2019 | 2018 A |
| Selected Per–Share Data | | |
| Net asset value, beginning of period | $28.91 | $32.63 |
| Income from Investment Operations | | |
| Net investment income (loss)B | .30 | .01 |
| Net realized and unrealized gain (loss) | 7.11 | (3.73) |
| Total from investment operations | 7.41 | (3.72) |
| Distributions from net investment income | (.32) | – |
| Distributions from net realized gain | – | – |
| Total distributions | (.32) | – |
| Net asset value, end of period | $36.00 | $28.91 |
| Total ReturnC,D | 25.86% | (11.40)% |
| Ratios to Average Net AssetsE,F | | |
| Expenses before reductions | .82% | .91%G |
| Expenses net of fee waivers, if any | .82% | .90%G |
| Expenses net of all reductions | .81% | .87%G |
| Net investment income (loss) | .89% | .57%G |
| Supplemental Data | | |
| Net assets, end of period (000 omitted) | $46,861 | $323 |
| Portfolio turnover rateH | 80% | 60% |
A For the period October 2, 2018 (commencement of sale of shares) to October 31, 2018.
B Calculated based on average shares outstanding during the period.
C Total returns for periods of less than one year are not annualized.
D Total returns would have been lower if certain expenses had not been reduced during the applicable periods shown.
E Fees and expenses of any underlying Fidelity Central Funds are not included in the Fund's expense ratio. The Fund indirectly bears its proportionate share of the expenses of any underlying Fidelity Central Funds.
F Expense ratios reflect operating expenses of the class. Expenses before reductions do not reflect amounts reimbursed by the investment adviser or reductions from brokerage service arrangements or reductions from other expense offset arrangements and do not represent the amount paid by the class during periods when reimbursements or reductions occur. Expense ratios before reductions for start-up periods may not be representative of longer-term operating periods. Expenses net of fee waivers reflect expenses after reimbursement by the investment adviser but prior to reductions from brokerage service arrangements or other expense offset arrangements. Expenses net of all reductions represent the net expenses paid by the class.
G Annualized
H Amount does not include the portfolio activity of any underlying Fidelity Central Funds.
See accompanying notes which are an integral part of the financial statements.
Notes to Financial Statements
For the period ended October 31, 2019
1. Organization.
Fidelity China Region Fund (the Fund) is a fund of Fidelity Investment Trust (the Trust) and is authorized to issue an unlimited number of shares. The Trust is registered under the Investment Company Act of 1940, as amended (the 1940 Act), as an open-end management investment company organized as a Massachusetts business trust. The Fund offers Class A, Class M, Class C, China Region, Class I and Class Z shares, each of which has equal rights as to assets and voting privileges. Each class has exclusive voting rights with respect to matters that affect that class. Effective March 1, 2019, Class C shares will automatically convert to Class A shares after a holding period of ten years from the initial date of purchase, with certain exceptions. The Fund's investments in emerging markets can be subject to social, economic, regulatory, and political uncertainties and can be extremely volatile.
2. Investments in Fidelity Central Funds.
The Fund invests in Fidelity Central Funds, which are open-end investment companies generally available only to other investment companies and accounts managed by the investment adviser and its affiliates. The Fund's Schedule of Investments lists each of the Fidelity Central Funds held as of period end, if any, as an investment of the Fund, but does not include the underlying holdings of each Fidelity Central Fund. As an Investing Fund, the Fund indirectly bears its proportionate share of the expenses of the underlying Fidelity Central Funds.
The Money Market Central Funds seek preservation of capital and current income and are managed by Fidelity Investments Money Management, Inc. (FIMM), an affiliate of the investment adviser. Annualized expenses of the Money Market Central Funds as of their most recent shareholder report date ranged from less than .005% to .01%.
A complete unaudited list of holdings for each Fidelity Central Fund is available upon request or at the Securities and Exchange Commission (the SEC) website at www.sec.gov. In addition, the financial statements of the Fidelity Central Funds, which are not covered by the Fund's Report of Independent Registered Public Accounting Firm, are available on the SEC website or upon request.
3. Significant Accounting Policies.
The Fund is an investment company and applies the accounting and reporting guidance of the Financial Accounting Standards Board (FASB) Accounting Standards Codification Topic 946 Financial Services – Investments Companies. The financial statements have been prepared in conformity with accounting principles generally accepted in the United States of America (GAAP), which require management to make certain estimates and assumptions at the date of the financial statements. Actual results could differ from those estimates. Subsequent events, if any, through the date that the financial statements were issued have been evaluated in the preparation of the financial statements. The following summarizes the significant accounting policies of the Fund:
Investment Valuation. Investments are valued as of 4:00 p.m. Eastern time on the last calendar day of the period. The Board of Trustees (the Board) has delegated the day to day responsibility for the valuation of the Fund's investments to the Fair Value Committee (the Committee) established by the Fund's investment adviser. In accordance with valuation policies and procedures approved by the Board, the Fund attempts to obtain prices from one or more third party pricing vendors or brokers to value its investments. When current market prices, quotations or currency exchange rates are not readily available or reliable, investments will be fair valued in good faith by the Committee, in accordance with procedures adopted by the Board. Factors used in determining fair value vary by investment type and may include market or investment specific events. The frequency with which these procedures are used cannot be predicted and they may be utilized to a significant extent. The Committee oversees the Fund's valuation policies and procedures and reports to the Board on the Committee's activities and fair value determinations. The Board monitors the appropriateness of the procedures used in valuing the Fund's investments and ratifies the fair value determinations of the Committee.
The Fund categorizes the inputs to valuation techniques used to value its investments into a disclosure hierarchy consisting of three levels as shown below:
- Level 1 – quoted prices in active markets for identical investments
- Level 2 – other significant observable inputs (including quoted prices for similar investments, interest rates, prepayment speeds, etc.)
- Level 3 – unobservable inputs (including the Fund's own assumptions based on the best information available)
Valuation techniques used to value the Fund's investments by major category are as follows:
Equity securities, including restricted securities, for which market quotations are readily available, are valued at the last reported sale price or official closing price as reported by a third party pricing vendor on the primary market or exchange on which they are traded and are categorized as Level 1 in the hierarchy. In the event there were no sales during the day or closing prices are not available, securities are valued at the last quoted bid price or may be valued using the last available price and are generally categorized as Level 2 in the hierarchy. For foreign equity securities, when market or security specific events arise, comparisons to the valuation of American Depositary Receipts (ADRs), futures contracts, Exchange-Traded Funds (ETFs) and certain indexes as well as quoted prices for similar securities may be used and would be categorized as Level 2 in the hierarchy. For equity securities, including restricted securities, where observable inputs are limited, assumptions about market activity and risk are used and these securities may be categorized as Level 3 in the hierarchy.
Investments in open-end mutual funds, including the Fidelity Central Funds, are valued at their closing net asset value (NAV) each business day and are categorized as Level 1 in the hierarchy.
Changes in valuation techniques may result in transfers in or out of an assigned level within the disclosure hierarchy. The aggregate value of investments by input level as of October 31, 2019 is included at the end of the Fund's Schedule of Investments.
Foreign Currency. The Fund may use foreign currency contracts to facilitate transactions in foreign-denominated securities. Gains and losses from these transactions may arise from changes in the value of the foreign currency or if the counterparties do not perform under the contracts' terms.
Foreign-denominated assets, including investment securities, and liabilities are translated into U.S. dollars at the exchange rates at period end. Purchases and sales of investment securities, income and dividends received and expenses denominated in foreign currencies are translated into U.S. dollars at the exchange rate in effect on the transaction date.
The effects of exchange rate fluctuations on investments are included with the net realized and unrealized gain (loss) on investment securities. Other foreign currency transactions resulting in realized and unrealized gain (loss) are disclosed separately.
Investment Transactions and Income. For financial reporting purposes, the Fund's investment holdings and NAV include trades executed through the end of the last business day of the period. The NAV per share for processing shareholder transactions is calculated as of the close of business of the New York Stock Exchange (NYSE), normally 4:00 p.m. Eastern time and includes trades executed through the end of the prior business day. Gains and losses on securities sold are determined on the basis of identified cost. Dividend income is recorded on the ex-dividend date, except for certain dividends from foreign securities where the ex-dividend date may have passed, which are recorded as soon as the Fund is informed of the ex-dividend date. Non-cash dividends included in dividend income, if any, are recorded at the fair market value of the securities received. Income and capital gain distributions from Fidelity Central Funds, if any, are recorded on the ex-dividend date. Investment income is recorded net of foreign taxes withheld where recovery of such taxes is uncertain.
Class Allocations and Expenses. Investment income, realized and unrealized capital gains and losses, common expenses of the Fund, and certain fund-level expense reductions, if any, are allocated daily on a pro-rata basis to each class based on the relative net assets of each class to the total net assets of the Fund. Each class differs with respect to transfer agent and distribution and service plan fees incurred. Certain expense reductions may also differ by class. For the reporting period, the allocated portion of income and expenses to each class as a percent of its average net assets may vary due to the timing of recording these transactions in relation to fluctuating net assets of the classes. Expenses directly attributable to a fund are charged to that fund. Expenses attributable to more than one fund are allocated among the respective funds on the basis of relative net assets or other appropriate methods. Expense estimates are accrued in the period to which they relate and adjustments are made when actual amounts are known.
Income Tax Information and Distributions to Shareholders. Each year, the Fund intends to qualify as a regulated investment company under Subchapter M of the Internal Revenue Code, including distributing substantially all of its taxable income and realized gains. As a result, no provision for U.S. Federal income taxes is required. As of October 31, 2019, the Fund did not have any unrecognized tax benefits in the financial statements; nor is the Fund aware of any tax positions for which it is reasonably possible that the total amounts of unrecognized tax benefits will significantly change in the next twelve months. The Fund files a U.S. federal tax return, in addition to state and local tax returns as required. The Fund's federal income tax returns are subject to examination by the Internal Revenue Service (IRS) for a period of three fiscal years after they are filed. State and local tax returns may be subject to examination for an additional fiscal year depending on the jurisdiction. Foreign taxes are provided for based on the Fund's understanding of the tax rules and rates that exist in the foreign markets in which it invests.
Distributions are declared and recorded on the ex-dividend date. Income and capital gain distributions are declared separately for each class. Income and capital gain distributions are determined in accordance with income tax regulations, which may differ from GAAP. In addition, the Fund claimed a portion of the payment made to redeeming shareholders as a distribution for income tax purposes.
Capital accounts within the financial statements are adjusted for permanent book-tax differences. These adjustments have no impact on net assets or the results of operations. Capital accounts are not adjusted for temporary book-tax differences which will reverse in a subsequent period.
Book-tax differences are primarily due to foreign currency transactions, capital loss carryforwards and losses deferred due to wash sales.
As of period end, the cost and unrealized appreciation (depreciation) in securities, and derivatives if applicable, for federal income tax purposes were as follows:
| Gross unrealized appreciation | $312,402,023 |
| Gross unrealized depreciation | (56,801,432) |
| Net unrealized appreciation (depreciation) | $255,600,591 |
| Tax Cost | $991,791,612 |
The tax-based components of distributable earnings as of period end were as follows:
| Undistributed ordinary income | $8,491,814 |
| Net unrealized appreciation (depreciation) on securities and other investments | $255,604,037 |
The tax character of distributions paid was as follows:
| | October 31, 2019 | October 31, 2018 |
| Ordinary Income | $8,434,846 | $ 5,632,793 |
Restricted Securities. The Fund may invest in securities that are subject to legal or contractual restrictions on resale. These securities generally may be resold in transactions exempt from registration or to the public if the securities are registered. Disposal of these securities may involve time-consuming negotiations and expense, and prompt sale at an acceptable price may be difficult. Information regarding restricted securities is included at the end of the Fund's Schedule of Investments.
4. Purchases and Sales of Investments.
Purchases and sales of securities, other than short-term securities, aggregated $908,152,738 and $942,676,287, respectively.
5. Fees and Other Transactions with Affiliates.
Management Fee. Fidelity Management & Research Company (the investment adviser) and its affiliates provide the Fund with investment management related services for which the Fund pays a monthly management fee. The management fee is the sum of an individual fund fee rate that is based on an annual rate of .45% of the Fund's average net assets and an annualized group fee rate that averaged .24% during the period. The group fee rate is based upon the average net assets of all the mutual funds advised by the investment adviser, including any mutual funds previously advised by the investment adviser that are currently advised by Fidelity SelectCo, LLC, an affiliate of the investment adviser. The group fee rate decreases as assets under management increase and increases as assets under management decrease. For the reporting period, the total annual management fee rate was .69% of the Fund's average net assets.
Distribution and Service Plan Fees. In accordance with Rule 12b-1 of the 1940 Act, the Fund has adopted separate Distribution and Service Plans for each class of shares. Certain classes pay Fidelity Distributors Corporation (FDC), an affiliate of the investment adviser, separate Distribution and Service Fees, each of which is based on an annual percentage of each class' average net assets. In addition, FDC may pay financial intermediaries for selling shares of the Fund and providing shareholder support services. For the period, the Distribution and Service Fee rates, total fees and amounts retained by FDC were as follows:
| | Distribution Fee | Service Fee | Total Fees | Retained by FDC |
| Class A | -% | .25% | $66,931 | $2,232 |
| Class M | .25% | .25% | 43,476 | 517 |
| Class C | .75% | .25% | 100,325 | 13,216 |
| | | | $210,732 | $15,965 |
Sales Load. FDC may receive a front-end sales charge of up to 5.75% for selling Class A shares and 3.50% for selling Class M shares, some of which is paid to financial intermediaries for selling shares of the Fund. Depending on the holding period, FDC may receive contingent deferred sales charges levied on Class A, Class M and Class C redemptions. The deferred sales charges are 1.00% for Class C shares, 1.00% for certain purchases of Class A shares and .25% for certain purchases of Class M shares.
For the period, sales charge amounts retained by FDC were as follows:
| | Retained by FDC |
| Class A | $11,946 |
| Class M | 2,197 |
| Class C(a) | 2,143 |
| | $16,286 |
(a) When Class C shares are initially sold, FDC pays commissions from its own resources to financial intermediaries through which the sales are made.
Transfer Agent Fees. Fidelity Investments Institutional Operations Company, Inc., (FIIOC), an affiliate of the investment adviser, is the transfer, dividend disbursing and shareholder servicing agent for each class of the Fund. FIIOC receives account fees and asset-based fees that vary according to the account size and type of account of the shareholders of the respective classes of the Fund, except for Class Z. FIIOC receives an asset-based fee of Class Z's average net assets. FIIOC pays for typesetting, printing and mailing of shareholder reports, except proxy statements.
For the period, transfer agent fees for each class were as follows:
| | Amount | % of Class-Level Average Net Assets |
| Class A | $65,446 | .24 |
| Class M | 27,657 | .32 |
| Class C | 22,742 | .23 |
| China Region | 1,958,811 | .18 |
| Class I | 50,424 | .19 |
| Class Z | 4,587 | .04 |
| | $2,129,667 | |
Accounting and Security Lending Fees. Fidelity Service Company, Inc. (FSC), an affiliate of the investment adviser, maintains the Fund's accounting records. The accounting fee is based on the level of average net assets for each month. Prior to April 1, 2019, FSC had a separate agreement with the Fund for administration of the security lending program, based on the number and duration of lending transactions. For the period, the total fees paid for accounting and administration of securities lending were equivalent to an annual rate of .05%.
Brokerage Commissions. The Fund placed a portion of its portfolio transactions with brokerage firms which are affiliates of the investment adviser. Brokerage commissions are included in net realized gain (loss) and change in net unrealized appreciation (depreciation) in the Statement of Operations. The commissions paid to these affiliated firms were $20,385 for the period.
Interfund Trades. The Fund may purchase from or sell securities to other Fidelity Funds under procedures adopted by the Board. The procedures have been designed to ensure these interfund trades are executed in accordance with Rule 17a-7 of the 1940 Act. Interfund trades are included within the respective purchases and sales amounts shown in the Purchases and Sales of Investments note.
6. Committed Line of Credit.
The Fund participates with other funds managed by the investment adviser or an affiliate in a $4.25 billion credit facility (the "line of credit") to be utilized for temporary or emergency purposes to fund shareholder redemptions or for other short-term liquidity purposes. The Fund has agreed to pay commitment fees on its pro-rata portion of the line of credit, which amounted to $3,068 and is reflected in Miscellaneous expenses on the Statement of Operations. During the period, the Fund did not borrow on this line of credit.
7. Security Lending.
The Fund lends portfolio securities from time to time in order to earn additional income. For equity securities, lending agents are used, including National Financial Services (NFS), an affiliate of the Fund. Pursuant to a securities lending agreement, NFS will receive a fee, which is capped at 9.9% of daily lending revenue, for its services as lending agent. The Fund may lend securities to certain qualified borrowers, including NFS. On the settlement date of the loan, the Fund receives collateral (in the form of U.S. Treasury obligations, letters of credit and/or cash) against the loaned securities and maintains collateral in an amount not less than 100% of the market value of the loaned securities during the period of the loan. The market value of the loaned securities is determined at the close of business of the Fund and any additional required collateral is delivered to the Fund on the next business day. The Fund or borrower may terminate the loan at any time, and if the borrower defaults on its obligation to return the securities loaned because of insolvency or other reasons, the Fund may apply collateral received from the borrower against the obligation. The Fund may experience delays and costs in recovering the securities loaned. Any cash collateral received is invested in the Fidelity Securities Lending Cash Central Fund. The value of loaned securities and cash collateral at period end are disclosed on the Fund's Statement of Assets and Liabilities. At period end, there were no security loans outstanding with NFS, as affiliated borrower. Total fees paid by the Fund to NFS, as lending agent, amounted to $14,364. Security lending income represents the income earned on investing cash collateral, less rebates paid to borrowers and any lending agent fees associated with the loan, plus any premium payments received for lending certain types of securities. Security lending income is presented in the Statement of Operations as a component of income from Fidelity Central Funds, and includes $3,383 from securities loaned to NFS, as affiliated borrower.
8. Expense Reductions.
Commissions paid to certain brokers with whom the investment adviser, or its affiliates, places trades on behalf of the Fund include an amount in addition to trade execution, which may be rebated back to the Fund to offset certain expenses. This amount totaled $44,090 for the period. In addition, through arrangements with the Fund's custodian and each class' transfer agent, credits realized as a result of certain uninvested cash balances were used to reduce the Fund's expenses. During the period, custodian credits reduced the Fund's expenses by $970. During the period, transfer agent credits reduced each class' expenses as noted in the table below.
| | Expense reduction |
| China Region | $147 |
In addition, during the period the investment adviser reimbursed and/or waived a portion of fund-level operating expenses in the amount of $8,458 and portion of class-level operating expenses as follows:
| | Amount |
| Class A | $350 |
| Class M | 118 |
| Class C | 145 |
| China Region | 15,020 |
| Class I | 355 |
| Class Z | 12 |
| | $16,000 |
9. Distributions to Shareholders.
Distributions to shareholders of each class were as follows:
| | Year ended
October 31, 2019 | Year ended
October 31, 2018(a) |
| Distributions to shareholders | | |
| Class A | $92,117 | $79,937 |
| China Region | 8,164,383 | 5,380,060 |
| Class I | 170,585 | 172,796 |
| Class Z | 7,761 | – |
| Total | $8,434,846 | $5,632,793 |
(a) Distributions for Class Z are for the period October 2, 2018 (commencement of sale of shares) to October 31, 20198.
10. Share Transactions.
Share transactions for each class were as follows and may contain automatic conversions between classes or exchanges between affiliated funds:
| | Shares | Shares | Dollars | Dollars |
| | Year ended October 31, 2019 | Year ended October 31, 2018(a) | Year ended October 31, 2019 | Year ended October 31, 2018(a) |
| Class A | | | | |
| Shares sold | 199,202 | 281,109 | $6,700,557 | $9,945,540 |
| Reinvestment of distributions | 3,062 | 2,311 | 90,830 | 78,690 |
| Shares redeemed | (182,149) | (506,416) | (5,889,031) | (18,191,086) |
| Net increase (decrease) | 20,115 | (222,996) | $902,356 | $(8,166,856) |
| Class M | | | | |
| Shares sold | 40,302 | 116,652 | $1,338,213 | $4,199,988 |
| Shares redeemed | (65,723) | (118,515) | (2,122,809) | (4,110,606) |
| Net increase (decrease) | (25,421) | (1,863) | $(784,596) | $89,382 |
| Class C | | | | |
| Shares sold | 43,065 | 141,748 | $1,400,507 | $4,961,864 |
| Shares redeemed | (134,542) | (166,005) | (4,290,419) | (5,613,368) |
| Net increase (decrease) | (91,477) | (24,257) | $(2,889,912) | $(651,504) |
| China Region | | | | |
| Shares sold | 6,473,996 | 9,405,338 | $219,994,317 | $342,970,076 |
| Reinvestment of distributions | 260,477 | 150,399 | 7,798,692 | 5,175,224 |
| Shares redeemed | (9,909,366) | (13,622,290) | (329,544,092) | (481,771,408) |
| Net increase (decrease) | (3,174,893) | (4,066,553) | $(101,751,083) | $(133,626,108) |
| Class I | | | | |
| Shares sold | 427,700 | 748,387 | $14,190,055 | $26,698,679 |
| Reinvestment of distributions | 4,738 | 4,532 | 140,863 | 154,844 |
| Shares redeemed | (393,573) | (841,495) | (12,947,213) | (29,947,068) |
| Net increase (decrease) | 38,865 | (88,576) | $1,383,705 | $(3,093,545) |
| Class Z | | | | |
| Shares sold | 1,429,776 | 11,185 | $47,427,389 | $336,639 |
| Reinvestment of distributions | 262 | – | 7,761 | – |
| Shares redeemed | (139,654) | (3) | (4,784,751) | (88) |
| Net increase (decrease) | 1,290,384 | 11,182 | $42,650,399 | $336,551 |
(a) Share transactions for Class Z are for the period October 2, 2018 (commencement of sale of shares) to October 31, 2018.
11. Other.
The Fund's organizational documents provide former and current trustees and officers with a limited indemnification against liabilities arising in connection with the performance of their duties to the Fund. In the normal course of business, the Fund may also enter into contracts that provide general indemnifications. The Fund's maximum exposure under these arrangements is unknown as this would be dependent on future claims that may be made against the Fund. The risk of material loss from such claims is considered remote.
Fidelity® Emerging Asia Fund
Performance: The Bottom Line
Average annual total return reflects the change in the value of an investment, assuming reinvestment of distributions from dividend income and capital gains (the profits earned upon the sale of securities that have grown in value, if any) and assuming a constant rate of performance each year. The hypothetical investment and the average annual total returns do not reflect the deduction of taxes that a shareholder would pay on fund distributions or the redemption of fund shares. During periods of reimbursement by Fidelity, a fund’s total return will be greater than it would be had the reimbursement not occurred. How a fund did yesterday is no guarantee of how it will do tomorrow.
Average Annual Total Returns
| For the periods ended October 31, 2019 | Past 1 year | Past 5 years | Past 10 years |
| Fidelity® Emerging Asia Fund | 26.95% | 7.85% | 8.33% |
Prior to December 1, 2010, the fund operated under certain different investment policies and compared its performance to a different index. The fund's historical performance may not represent its current investment policies.
$10,000 Over 10 Years
Let's say hypothetically that $10,000 was invested in Fidelity® Emerging Asia Fund on October 31, 2009.
The chart shows how the value of your investment would have changed, and also shows how the MSCI AC (All Country) Asia ex Japan Index performed over the same period.

| Period Ending Values |
| $22,259 | Fidelity® Emerging Asia Fund |
| $18,064 | MSCI AC (All Country) Asia ex Japan Index |
Fidelity® Emerging Asia Fund
Management's Discussion of Fund Performance
Market Recap: The MSCI ACWI (All Country World Index) ex USA Index gained 11.47% for the 12 months ending October 31, 2019, as international stocks reflected a confluence of factors, including escalating trade tension, and moderating but still positive global economic growth. Currency fluctuations were largely modest and varied by region, muting the overall impact on international equity returns. In late December, the U.S. Federal Reserve shifted from raising interest rates to a more dovish policy in 2019, joining many foreign central banks. In June, international stocks rose 6.03%, as policy stimulus in China stabilized that country’s economic growth. The Fed cut its policy rate in July for the first time since 2008. However, the index returned -1.21% for the month, followed by -3.08% in August. In September, the Fed cut its policy rate another quarter point, citing concerns about slowing economic growth and muted inflation, and did the same in October, leading to monthly gains of 2.59% and 3.49%, respectively. For the full 12 months, the growth-oriented information technology sector (+22%) led the way, followed by utilities (+20%) and real estate (+18%), two high-dividend-yielding categories. Conversely, energy was roughly flat, while materials (+6%) and communication services (7%) also lagged. By region, Asia Pacific ex Japan (+16%), Europe ex U.K (+13%), Canada (+12%) and emerging markets (+12%) fared best. Meanwhile, the U.K. (+7%) and Japan (+10%) trailed the broader market.
Comments from Co-Portfolio Manager John Dance: For the year, the fund gained 26.95%, more than double the 13.24% return of the benchmark, the MSCI AC (All Country) Asia ex Japan Index. Stock selection mainly drove the fund’s advantage over the benchmark, especially in the consumer staples, financials and industrials sectors. By country, picks in China added considerable value, while positioning in India, Indonesia and Taiwan also helped. Among individual holdings, overweighting in China-based liquor manufacturers Kweichow Moutai and Wuliangye Yibin notably lifted the fund’s relative performance. We exited the latter position by period end. Avoiding China-based internet search provider Baidu also helped, as did the fund's non-benchmark position in clinical research services firm Hangzhou Tigermed Consulting. Conversely, picks in Australia detracted, as did the fund's cash position of about 3%, on average. Looking at individual holdings, overweighting South Korea-based Hyundai Marine & Fire Insurance, as well as non-benchmark stakes in Dah Sing Banking Group and consumer electronics and contract manufacturing firm Vtech Holdings hurt the fund's relative return. By period end, we sold Hyundai Marine & Fire Insurance and Vtech Holdings, and significantly reduced the fund’s stake in Dah Sing Banking Group.
The views expressed above reflect those of the portfolio manager(s) only through the end of the period as stated on the cover of this report and do not necessarily represent the views of Fidelity or any other person in the Fidelity organization. Any such views are subject to change at any time based upon market or other conditions and Fidelity disclaims any responsibility to update such views. These views may not be relied on as investment advice and, because investment decisions for a Fidelity fund are based on numerous factors, may not be relied on as an indication of trading intent on behalf of any Fidelity fund.
Note to shareholders: On June 1, 2019, Xiaoting Zhao assumed co-management responsibilities, joining John Dance until year-end, when John comes off of the fund.
Fidelity® Emerging Asia Fund
Investment Summary (Unaudited)
Geographic Diversification (% of fund's net assets)
| As of October 31, 2019 |
| | Cayman Islands | 24.8% |
| | India | 16.0% |
| | China | 14.2% |
| | Korea (South) | 11.8% |
| | Taiwan | 9.0% |
| | Hong Kong | 8.2% |
| | United States of America* | 4.4% |
| | Indonesia | 3.0% |
| | Philippines | 2.2% |
| | Other | 6.4% |

* Includes Short-Term investments and Net Other Assets (Liabilities).
Percentages are based on country or territory of incorporation and are adjusted for the effect of futures contracts, if applicable.
Asset Allocation as of October 31, 2019
| | % of fund's net assets |
| Stocks | 99.6 |
| Short-Term Investments and Net Other Assets (Liabilities) | 0.4 |
Top Ten Stocks as of October 31, 2019
| | % of fund's net assets |
| Tencent Holdings Ltd. (Cayman Islands, Interactive Media & Services) | 7.9 |
| Taiwan Semiconductor Manufacturing Co. Ltd. (Taiwan, Semiconductors & Semiconductor Equipment) | 7.7 |
| Samsung Electronics Co. Ltd. (Korea (South), Technology Hardware, Storage & Peripherals) | 5.1 |
| AIA Group Ltd. (Hong Kong, Insurance) | 4.6 |
| Alibaba Group Holding Ltd. sponsored ADR (Cayman Islands, Internet & Direct Marketing Retail) | 3.9 |
| SK Hynix, Inc. (Korea (South), Semiconductors & Semiconductor Equipment) | 2.9 |
| Housing Development Finance Corp. Ltd. (India, Thrifts & Mortgage Finance) | 2.6 |
| Ping An Insurance Group Co. of China Ltd. (H Shares) (China, Insurance) | 2.5 |
| Reliance Industries Ltd. (India, Oil, Gas & Consumable Fuels) | 2.4 |
| Pinduoduo, Inc. ADR (Cayman Islands, Internet & Direct Marketing Retail) | 2.2 |
| | 41.8 |
Top Market Sectors as of October 31, 2019
| | % of fund's net assets |
| Information Technology | 24.0 |
| Financials | 20.9 |
| Consumer Discretionary | 17.2 |
| Communication Services | 11.8 |
| Real Estate | 5.3 |
| Consumer Staples | 5.0 |
| Health Care | 4.3 |
| Energy | 3.9 |
| Industrials | 3.8 |
| Materials | 1.7 |
Fidelity® Emerging Asia Fund
Schedule of Investments October 31, 2019
Showing Percentage of Net Assets
| Common Stocks - 98.3% | | | |
| | | Shares | Value |
| Australia - 0.4% | | | |
| Blue Sky Alternative Investments Ltd. (a)(b) | | 1,118,552 | $8 |
| HUB24 Ltd. (c) | | 508,321 | 4,315,065 |
|
| TOTAL AUSTRALIA | | | 4,315,073 |
|
| Bermuda - 0.4% | | | |
| Tai Cheung Holdings Ltd. | | 4,625,854 | 3,715,305 |
| Cayman Islands - 24.8% | | | |
| Alibaba Group Holding Ltd. sponsored ADR (a) | | 217,868 | 38,490,740 |
| Bilibili, Inc. ADR (a) | | 77,558 | 1,224,641 |
| CStone Pharmaceuticals Co. Ltd. (a)(d) | | 3,291,000 | 4,387,339 |
| Geely Automobile Holdings Ltd. | | 3,454,000 | 6,535,700 |
| Hansoh Pharmaceutical Group Co. Ltd. (d) | | 1,288,870 | 3,915,663 |
| International Housewares Retail Co. Ltd. | | 20,950,905 | 4,886,979 |
| Kingsoft Corp. Ltd. (a) | | 2,332,700 | 5,368,571 |
| Longfor Properties Co. Ltd. (d) | | 1,588,500 | 6,592,517 |
| Meituan Dianping Class B (a) | | 1,010,044 | 12,047,949 |
| New Oriental Education & Technology Group, Inc. sponsored ADR (a) | | 131,000 | 15,989,860 |
| Pinduoduo, Inc. ADR (a) | | 544,700 | 22,267,336 |
| Shenzhou International Group Holdings Ltd. | | 889,192 | 12,287,436 |
| SITC International Holdings Co. Ltd. | | 5,077,375 | 5,590,691 |
| Sunny Optical Technology Group Co. Ltd. | | 336,800 | 5,413,684 |
| TAL Education Group ADR (a) | | 381,100 | 16,314,891 |
| Tencent Holdings Ltd. | | 1,927,640 | 78,190,699 |
| Wuxi Biologics (Cayman), Inc. (a)(d) | | 614,000 | 7,215,400 |
|
| TOTAL CAYMAN ISLANDS | | | 246,720,096 |
|
| China - 14.2% | | | |
| AVIC Jonhon OptronicTechnology Co. Ltd. | | 863,355 | 4,942,902 |
| Chongqing Fuling Zhacai Group Co. Ltd. Group (A Shares) | | 1,499,400 | 4,945,358 |
| Contemporary Amperex Technology Co. Ltd. | | 402,275 | 3,923,893 |
| Foshan Haitian Flavouring & Food Co. Ltd. (A Shares) | | 328,500 | 5,209,882 |
| Great Wall Motor Co. Ltd. (H Shares) | | 9,928,000 | 8,044,176 |
| Hangzhou Tigermed Consulting Co. Ltd. (A Shares) | | 878,997 | 8,523,080 |
| Industrial & Commercial Bank of China Ltd. (H Shares) | | 23,703,000 | 16,980,671 |
| Inner Mongoli Yili Industries Co. Ltd. (A Shares) | | 1,229,922 | 5,062,119 |
| Kweichow Moutai Co. Ltd. (A Shares) | | 46,781 | 7,829,717 |
| Ping An Insurance Group Co. of China Ltd. (H Shares) | | 2,126,591 | 24,544,669 |
| Qingdao Port International Co. Ltd. (H Shares) (d) | | 6,270,203 | 3,595,848 |
| Shanghai Bairun Investment Holding Group Co. Ltd. (A Shares) | | 2,824,100 | 10,688,162 |
| Shanghai M&G Stationery, Inc. (A Shares) | | 792,954 | 5,630,891 |
| Shenzhen Inovance Technology Co. Ltd. (A Shares) | | 1,840,985 | 6,513,331 |
| Shenzhen Mindray Bio-Medical Electronics Co. Ltd. (A Shares) | | 266,808 | 6,736,759 |
| WuXi AppTec Co. Ltd. (H Shares) (c)(d) | | 476,300 | 5,742,619 |
| Yunnan Baiyao Group Co. Ltd. (A Shares) | | 538,955 | 6,623,080 |
| Zhejiang Sanhua Intelligent Controls Co. Ltd. (A Shares) | | 2,658,840 | 5,282,354 |
|
| TOTAL CHINA | | | 140,819,511 |
|
| Hong Kong - 8.2% | | | |
| AIA Group Ltd. | | 4,605,650 | 45,864,098 |
| China Overseas Land and Investment Ltd. | | 2,286,000 | 7,213,457 |
| CNOOC Ltd. | | 3,906,000 | 5,813,107 |
| Dah Sing Banking Group Ltd. | | 688,375 | 889,928 |
| Hong Kong Exchanges and Clearing Ltd. | | 450,146 | 14,023,865 |
| Sino Land Ltd. | | 5,141,328 | 7,685,603 |
|
| TOTAL HONG KONG | | | 81,490,058 |
|
| India - 16.0% | | | |
| Asian Paints Ltd. | | 202,100 | 5,147,929 |
| Aster DM Healthcare Ltd. (a)(d) | | 45,900 | 87,265 |
| Bajaj Finance Ltd. | | 131,000 | 7,423,372 |
| CCL Products (India) Ltd. | | 943,730 | 2,741,205 |
| HDFC Asset Management Co. Ltd. (d) | | 251,335 | 10,586,677 |
| HDFC Bank Ltd. | | 991,038 | 17,158,616 |
| Housing Development Finance Corp. Ltd. | | 854,464 | 25,625,717 |
| Indraprastha Gas Ltd. | | 1,421,127 | 7,830,995 |
| Kotak Mahindra Bank Ltd. | | 358,300 | 7,941,246 |
| Maruti Suzuki India Ltd. | | 83,800 | 8,922,343 |
| Oberoi Realty Ltd. | | 1,234,517 | 8,805,593 |
| Page Industries Ltd. | | 12,000 | 4,347,500 |
| Petronet LNG Ltd. | | 2,231,560 | 8,998,267 |
| Power Grid Corp. of India Ltd. | | 3,059,338 | 8,548,981 |
| Reliance Industries Ltd. | | 1,143,254 | 23,546,943 |
| Shree Cement Ltd. | | 21,200 | 5,938,737 |
| TCNS Clothing Co. Ltd. (a)(d) | | 522,430 | 5,545,385 |
|
| TOTAL INDIA | | | 159,196,771 |
|
| Indonesia - 3.0% | | | |
| PT Bank Central Asia Tbk | | 8,301,677 | 18,581,873 |
| PT Bank Rakyat Indonesia Tbk | | 38,470,255 | 11,527,045 |
|
| TOTAL INDONESIA | | | 30,108,918 |
|
| Korea (South) - 10.5% | | | |
| Kakao Corp. | | 52,400 | 6,335,695 |
| LG Chemical Ltd. | | 23,163 | 6,086,203 |
| Samsung Electronics Co. Ltd. | | 1,182,890 | 50,942,635 |
| Samsung SDI Co. Ltd. | | 61,700 | 11,994,249 |
| SK Hynix, Inc. | | 416,156 | 29,159,261 |
|
| TOTAL KOREA (SOUTH) | | | 104,518,043 |
|
| Malaysia - 0.3% | | | |
| Bursa Malaysia Bhd | | 2,048,700 | 2,964,068 |
| Multi-National - 1.7% | | | |
| HKT Trust/HKT Ltd. unit | | 10,913,468 | 16,977,646 |
| Netherlands - 1.0% | | | |
| ASML Holding NV (Netherlands) | | 35,955 | 9,424,331 |
| Philippines - 2.2% | | | |
| Ayala Land, Inc. | | 13,655,436 | 13,040,524 |
| Jollibee Food Corp. | | 1,807,000 | 8,251,109 |
|
| TOTAL PHILIPPINES | | | 21,291,633 |
|
| Singapore - 0.5% | | | |
| Wing Tai Holdings Ltd. | | 3,414,422 | 5,092,172 |
| Taiwan - 9.0% | | | |
| Micro-Star International Co. Ltd. | | 1,996,000 | 5,890,222 |
| Taiwan Semiconductor Manufacturing Co. Ltd. | | 7,780,892 | 76,107,454 |
| Voltronic Power Technology Corp. | | 333,250 | 7,375,689 |
|
| TOTAL TAIWAN | | | 89,373,365 |
|
| Thailand - 1.6% | | | |
| Home Product Center PCL (For. Reg.) | | 13,777,633 | 7,847,699 |
| Thai Beverage PCL | | 11,567,907 | 7,766,566 |
|
| TOTAL THAILAND | | | 15,614,265 |
|
| United States of America - 4.0% | | | |
| DouYu International Holdings Ltd. ADR | | 1,736,294 | 13,491,004 |
| Lam Research Corp. | | 33,917 | 9,192,864 |
| Micron Technology, Inc. (a) | | 181,500 | 8,630,325 |
| NVIDIA Corp. | | 42,300 | 8,503,146 |
|
| TOTAL UNITED STATES OF AMERICA | | | 39,817,339 |
|
| Vietnam - 0.5% | | | |
| Vietnam Dairy Products Corp. | | 869,500 | 4,864,260 |
| TOTAL COMMON STOCKS | | | |
| (Cost $724,235,419) | | | 976,302,854 |
|
| Nonconvertible Preferred Stocks - 1.3% | | | |
| Korea (South) - 1.3% | | | |
| Samsung Electronics Co. Ltd. | | | |
| (Cost $13,262,085) | | 379,880 | 13,324,966 |
|
| Money Market Funds - 3.9% | | | |
| Fidelity Cash Central Fund 1.83% (e) | | 32,041,236 | 32,047,644 |
| Fidelity Securities Lending Cash Central Fund 1.84% (e)(f) | | 7,016,191 | 7,016,892 |
| TOTAL MONEY MARKET FUNDS | | | |
| (Cost $39,064,536) | | | 39,064,536 |
| TOTAL INVESTMENT IN SECURITIES - 103.5% | | | |
| (Cost $776,562,040) | | | 1,028,692,356 |
| NET OTHER ASSETS (LIABILITIES) - (3.5)% | | | (35,072,104) |
| NET ASSETS - 100% | | | $993,620,252 |
Categorizations in the Schedule of Investments are based on country or territory of incorporation.
Legend
(a) Non-income producing
(b) Level 3 security
(c) Security or a portion of the security is on loan at period end.
(d) Security exempt from registration under Rule 144A of the Securities Act of 1933. These securities may be resold in transactions exempt from registration, normally to qualified institutional buyers. At the end of the period, the value of these securities amounted to $47,668,713 or 4.8% of net assets.
(e) Affiliated fund that is generally available only to investment companies and other accounts managed by Fidelity Investments. The rate quoted is the annualized seven-day yield of the fund at period end. A complete unaudited listing of the fund's holdings as of its most recent quarter end is available upon request. In addition, each Fidelity Central Fund's financial statements, which are not covered by the Fund's Report of Independent Registered Public Accounting Firm, are available on the SEC's website or upon request.
(f) Investment made with cash collateral received from securities on loan.
Affiliated Central Funds
Information regarding fiscal year to date income earned by the Fund from investments in Fidelity Central Funds is as follows:
| Fund | Income earned |
| Fidelity Cash Central Fund | $773,539 |
| Fidelity Securities Lending Cash Central Fund | 68,030 |
| Total | $841,569 |
Amounts in the income column in the above table include any capital gain distributions from underlying funds, which are presented in the corresponding line-item in the Statement of Operations, if applicable. Amount for Fidelity Securities Lending Cash Central Fund represents the income earned on investing cash collateral, less rebates paid to borrowers and any lending agent fees associated with the loan, plus any premium payments received for lending certain types of securities.
Investment Valuation
The following is a summary of the inputs used, as of October 31, 2019, involving the Fund's assets and liabilities carried at fair value. The inputs or methodology used for valuing securities may not be an indication of the risk associated with investing in those securities. For more information on valuation inputs, and their aggregation into the levels used below, please refer to the Investment Valuation section in the accompanying Notes to Financial Statements.
| | Valuation Inputs at Reporting Date: |
| Description | Total | Level 1 | Level 2 | Level 3 |
| Investments in Securities: | | | | |
| Equities: | | | | |
| Communication Services | $116,219,685 | $21,051,340 | $95,168,345 | $-- |
| Consumer Discretionary | 171,779,103 | 93,062,827 | 78,716,276 | -- |
| Consumer Staples | 49,107,269 | -- | 49,107,269 | -- |
| Energy | 38,358,317 | -- | 38,358,317 | -- |
| Financials | 208,426,918 | -- | 208,426,910 | 8 |
| Health Care | 43,231,205 | -- | 43,231,205 | -- |
| Industrials | 37,912,697 | 7,375,689 | 30,537,008 | -- |
| Information Technology | 238,894,610 | 137,637,668 | 101,256,942 | -- |
| Materials | 17,172,869 | 6,086,203 | 11,086,666 | -- |
| Real Estate | 52,145,171 | -- | 52,145,171 | -- |
| Utilities | 16,379,976 | -- | 16,379,976 | -- |
| Money Market Funds | 39,064,536 | 39,064,536 | -- | -- |
| Total Investments in Securities: | $1,028,692,356 | $304,278,263 | $724,414,085 | $8 |
The following is a reconciliation of Investments in Securities for which Level 3 inputs were used in determining value:
| Investments in Securities: | |
| Beginning Balance | $10,258,212 |
| Net Realized Gain (Loss) on Investment Securities | (520,681) |
| Net Unrealized Gain (Loss) on Investment Securities | (485,469) |
| Cost of Purchases | -- |
| Proceeds of Sales | (8,183) |
| Amortization/Accretion | -- |
| Transfers into Level 3 | 1,014,341 |
| Transfers out of Level 3 | (10,258,212) |
| Ending Balance | $8 |
| The change in unrealized gain (loss) for the period attributable to Level 3 securities held at October 31, 2019 | $(485,469) |
The information used in the above reconciliation represents fiscal year to date activity for any Investments in Securities identified as using Level 3 inputs at either the beginning or the end of the current fiscal period. Transfers in or out of Level 3 represent the beginning value of any Security or Instrument where a change in the pricing level occurred from the beginning to the end of the period. The cost of purchases and the proceeds of sales may include securities received or delivered through corporate actions or exchanges. Realized and unrealized gains (losses) disclosed in the reconciliation are included in Net Gain (Loss) on the Fund's Statement of Operations.
See accompanying notes which are an integral part of the financial statements.
Fidelity® Emerging Asia Fund
Financial Statements
Statement of Assets and Liabilities
| | | October 31, 2019 |
| Assets | | |
Investment in securities, at value (including securities loaned of $6,397,152) — See accompanying schedule:
Unaffiliated issuers (cost $737,497,504) | $989,627,820 | |
| Fidelity Central Funds (cost $39,064,536) | 39,064,536 | |
| Total Investment in Securities (cost $776,562,040) | | $1,028,692,356 |
| Foreign currency held at value (cost $1,310,314) | | 1,309,985 |
| Receivable for investments sold | | 42,418,445 |
| Receivable for fund shares sold | | 234,546 |
| Dividends receivable | | 630,991 |
| Distributions receivable from Fidelity Central Funds | | 32,953 |
| Prepaid expenses | | 1,898 |
| Other receivables | | 386,704 |
| Total assets | | 1,073,707,878 |
| Liabilities | | |
| Payable to custodian bank | $731,336 | |
| Payable for investments purchased | 11,821,436 | |
| Payable for fund shares redeemed | 57,797,535 | |
| Accrued management fee | 767,543 | |
| Other affiliated payables | 182,958 | |
| Other payables and accrued expenses | 1,770,137 | |
| Collateral on securities loaned | 7,016,681 | |
| Total liabilities | | 80,087,626 |
| Net Assets | | $993,620,252 |
| Net Assets consist of: | | |
| Paid in capital | | $686,573,904 |
| Total accumulated earnings (loss) | | 307,046,348 |
| Net Assets, for 22,064,949 shares outstanding | | $993,620,252 |
| Net Asset Value, offering price and redemption price per share ($993,620,252 ÷ 22,064,949 shares) | | $45.03 |
See accompanying notes which are an integral part of the financial statements.
Statement of Operations
| | | Year ended October 31, 2019 |
| Investment Income | | |
| Dividends | | $20,600,475 |
| Income from Fidelity Central Funds (including $68,030 from security lending) | | 841,569 |
| Income before foreign taxes withheld | | 21,442,044 |
| Less foreign taxes withheld | | (1,936,504) |
| Total income | | 19,505,540 |
| Expenses | | |
| Management fee | | |
| Basic fee | $6,949,328 | |
| Performance adjustment | 1,542,256 | |
| Transfer agent fees | 1,741,978 | |
| Accounting and security lending fees | 471,324 | |
| Custodian fees and expenses | 355,971 | |
| Independent trustees' fees and expenses | 5,683 | |
| Registration fees | 35,069 | |
| Audit | 104,462 | |
| Legal | 3,277 | |
| Interest | 549 | |
| Miscellaneous | 7,745 | |
| Total expenses before reductions | 11,217,642 | |
| Expense reductions | (17,796) | |
| Total expenses after reductions | | 11,199,846 |
| Net investment income (loss) | | 8,305,694 |
| Realized and Unrealized Gain (Loss) | | |
| Net realized gain (loss) on: | | |
| Investment securities: | | |
| Unaffiliated issuers | 54,866,329 | |
| Redemptions in-kind with affiliated entities | 9,780,162 | |
| Fidelity Central Funds | 44 | |
| Foreign currency transactions | (514,295) | |
| Total net realized gain (loss) | | 64,132,240 |
| Change in net unrealized appreciation (depreciation) on: | | |
| Investment securities: | | |
| Unaffiliated issuers (net of increase in deferred foreign taxes of $1,486,085) | 160,798,059 | |
| Assets and liabilities in foreign currencies | (25,460) | |
| Total change in net unrealized appreciation (depreciation) | | 160,772,599 |
| Net gain (loss) | | 224,904,839 |
| Net increase (decrease) in net assets resulting from operations | | $233,210,533 |
See accompanying notes which are an integral part of the financial statements.
Statement of Changes in Net Assets
| | Year ended October 31, 2019 | Year ended October 31, 2018 |
| Increase (Decrease) in Net Assets | | |
| Operations | | |
| Net investment income (loss) | $8,305,694 | $11,853,453 |
| Net realized gain (loss) | 64,132,240 | 65,607,429 |
| Change in net unrealized appreciation (depreciation) | 160,772,599 | (262,687,708) |
| Net increase (decrease) in net assets resulting from operations | 233,210,533 | (185,226,826) |
| Distributions to shareholders | (30,935,746) | (11,209,950) |
| Share transactions | | |
| Proceeds from sales of shares | 122,462,574 | 413,143,734 |
| Reinvestment of distributions | 27,229,181 | 9,352,064 |
| Cost of shares redeemed | (272,286,267) | (598,473,348) |
| Net increase (decrease) in net assets resulting from share transactions | (122,594,512) | (175,977,550) |
| Redemption fees | – | 23,229 |
| Total increase (decrease) in net assets | 79,680,275 | (372,391,097) |
| Net Assets | | |
| Beginning of period | 913,939,977 | 1,286,331,074 |
| End of period | $993,620,252 | $913,939,977 |
| Other Information | | |
| Shares | | |
| Sold | 2,933,364 | 9,234,180 |
| Issued in reinvestment of distributions | 736,521 | 215,039 |
| Redeemed | (6,512,148) | (13,816,562) |
| Net increase (decrease) | (2,842,263) | (4,367,343) |
See accompanying notes which are an integral part of the financial statements.
Financial Highlights
Fidelity Emerging Asia Fund
| | | | | | |
| Years ended October 31, | 2019 | 2018 | 2017 | 2016 | 2015 |
| Selected Per–Share Data | | | | | |
| Net asset value, beginning of period | $36.69 | $43.94 | $33.37 | $31.20 | $33.03 |
| Income from Investment Operations | | | | | |
| Net investment income (loss)A | .34 | .41 | .40 | .39 | .42 |
| Net realized and unrealized gain (loss) | 9.27 | (7.27) | 10.56 | 1.91 | (1.96) |
| Total from investment operations | 9.61 | (6.86) | 10.96 | 2.30 | (1.54) |
| Distributions from net investment income | (.39) | (.37) | (.34) | (.13) | (.29) |
| Distributions from net realized gain | (.88) | (.02) | (.05) | – | – |
| Total distributions | (1.27) | (.39) | (.39) | (.13) | (.29) |
| Redemption fees added to paid in capitalA | – | –B | –B | –B | –B |
| Net asset value, end of period | $45.03 | $36.69 | $43.94 | $33.37 | $31.20 |
| Total ReturnC | 26.95% | (15.75)% | 33.28% | 7.42% | (4.69)% |
| Ratios to Average Net AssetsD,E | | | | | |
| Expenses before reductions | 1.11% | 1.02% | 1.10% | 1.16% | 1.09% |
| Expenses net of fee waivers, if any | 1.11% | 1.02% | 1.10% | 1.16% | 1.09% |
| Expenses net of all reductions | 1.11% | 1.00% | 1.08% | 1.16% | 1.09% |
| Net investment income (loss) | .82% | .93% | 1.07% | 1.25% | 1.26% |
| Supplemental Data | | | | | |
| Net assets, end of period (000 omitted) | $993,620 | $913,940 | $1,286,331 | $922,265 | $1,008,178 |
| Portfolio turnover rateF | 61%G | 36% | 40% | 77% | 68% |
A Calculated based on average shares outstanding during the period.
B Amount represents less than $.005 per share.
C Total returns would have been lower if certain expenses had not been reduced during the applicable periods shown.
D Fees and expenses of any underlying Fidelity Central Funds are not included in the Fund's expense ratio. The Fund indirectly bears its proportionate share of the expenses of any underlying Fidelity Central Funds.
E Expense ratios reflect operating expenses of the Fund. Expenses before reductions do not reflect amounts reimbursed by the investment adviser or reductions from brokerage service arrangements or reductions from other expense offset arrangements and do not represent the amount paid by the Fund during periods when reimbursements or reductions occur. Expenses net of fee waivers reflect expenses after reimbursement by the investment adviser but prior to reductions from brokerage service arrangements or other expense offset arrangements. Expenses net of all reductions represent the net expenses paid by the Fund.
F Amount does not include the portfolio activity of any underlying Fidelity Central Funds.
G Portfolio turnover rate excludes securities received or delivered in-kind.
See accompanying notes which are an integral part of the financial statements.
Notes to Financial Statements
For the period ended October 31, 2019
1. Organization.
Fidelity Emerging Asia Fund (the Fund) is a fund of Fidelity Investment Trust (the Trust) and is authorized to issue an unlimited number of shares. Share transactions on the Statement of Changes in Net Assets may contain exchanges between affiliated funds. The Trust is registered under the Investment Company Act of 1940, as amended (the 1940 Act), as an open-end management investment company organized as a Massachusetts business trust. The Fund's investments in emerging markets can be subject to social, economic, regulatory, and political uncertainties and can be extremely volatile.
2. Investments in Fidelity Central Funds.
The Fund invests in Fidelity Central Funds, which are open-end investment companies generally available only to other investment companies and accounts managed by the investment adviser and its affiliates. The Fund's Schedule of Investments lists each of the Fidelity Central Funds held as of period end, if any, as an investment of the Fund, but does not include the underlying holdings of each Fidelity Central Fund. As an Investing Fund, the Fund indirectly bears its proportionate share of the expenses of the underlying Fidelity Central Funds.
The Money Market Central Funds seek preservation of capital and current income and are managed by Fidelity Investments Money Management, Inc. (FIMM), an affiliate of the investment adviser. Annualized expenses of the Money Market Central Funds as of their most recent shareholder report date ranged from less than .005% to .01%.
A complete unaudited list of holdings for each Fidelity Central Fund is available upon request or at the Securities and Exchange Commission (the SEC) website at www.sec.gov. In addition, the financial statements of the Fidelity Central Funds, which are not covered by the Fund's Report of Independent Registered Public Accounting Firm, are available on the SEC website or upon request.
3. Significant Accounting Policies.
The Fund is an investment company and applies the accounting and reporting guidance of the Financial Accounting Standards Board (FASB) Accounting Standards Codification Topic 946 Financial Services – Investments Companies. The financial statements have been prepared in conformity with accounting principles generally accepted in the United States of America (GAAP), which require management to make certain estimates and assumptions at the date of the financial statements. Actual results could differ from those estimates. Subsequent events, if any, through the date that the financial statements were issued have been evaluated in the preparation of the financial statements. The following summarizes the significant accounting policies of the Fund:
Investment Valuation. Investments are valued as of 4:00 p.m. Eastern time on the last calendar day of the period. The Board of Trustees (the Board) has delegated the day to day responsibility for the valuation of the Fund's investments to the Fair Value Committee (the Committee) established by the Fund's investment adviser. In accordance with valuation policies and procedures approved by the Board, the Fund attempts to obtain prices from one or more third party pricing vendors or brokers to value its investments. When current market prices, quotations or currency exchange rates are not readily available or reliable, investments will be fair valued in good faith by the Committee, in accordance with procedures adopted by the Board. Factors used in determining fair value vary by investment type and may include market or investment specific events. The frequency with which these procedures are used cannot be predicted and they may be utilized to a significant extent. The Committee oversees the Fund's valuation policies and procedures and reports to the Board on the Committee's activities and fair value determinations. The Board monitors the appropriateness of the procedures used in valuing the Fund's investments and ratifies the fair value determinations of the Committee.
The Fund categorizes the inputs to valuation techniques used to value its investments into a disclosure hierarchy consisting of three levels as shown below:
- Level 1 – quoted prices in active markets for identical investments
- Level 2 – other significant observable inputs (including quoted prices for similar investments, interest rates, prepayment speeds, etc.)
- Level 3 – unobservable inputs (including the Fund's own assumptions based on the best information available)
Valuation techniques used to value the Fund's investments by major category are as follows:
Equity securities, including restricted securities, for which market quotations are readily available, are valued at the last reported sale price or official closing price as reported by a third party pricing vendor on the primary market or exchange on which they are traded and are categorized as Level 1 in the hierarchy. In the event there were no sales during the day or closing prices are not available, securities are valued at the last quoted bid price or may be valued using the last available price and are generally categorized as Level 2 in the hierarchy. For foreign equity securities, when market or security specific events arise, comparisons to the valuation of American Depositary Receipts (ADRs), futures contracts, Exchange-Traded Funds (ETFs) and certain indexes as well as quoted prices for similar securities may be used and would be categorized as Level 2 in the hierarchy. For equity securities, including restricted securities, where observable inputs are limited, assumptions about market activity and risk are used and these securities may be categorized as Level 3 in the hierarchy.
Investments in open-end mutual funds, including the Fidelity Central Funds, are valued at their closing net asset value (NAV) each business day and are categorized as Level 1 in the hierarchy.
Changes in valuation techniques may result in transfers in or out of an assigned level within the disclosure hierarchy. The aggregate value of investments by input level as of October 31, 2019, as well as a roll forward of Level 3 investments, is included at the end of the Fund's Schedule of Investments.
Foreign Currency. The Fund may use foreign currency contracts to facilitate transactions in foreign-denominated securities. Gains and losses from these transactions may arise from changes in the value of the foreign currency or if the counterparties do not perform under the contracts' terms.
Foreign-denominated assets, including investment securities, and liabilities are translated into U.S. dollars at the exchange rates at period end. Purchases and sales of investment securities, income and dividends received and expenses denominated in foreign currencies are translated into U.S. dollars at the exchange rate in effect on the transaction date.
The effects of exchange rate fluctuations on investments are included with the net realized and unrealized gain (loss) on investment securities. Other foreign currency transactions resulting in realized and unrealized gain (loss) are disclosed separately.
Investment Transactions and Income. For financial reporting purposes, the Fund's investment holdings and NAV include trades executed through the end of the last business day of the period. The NAV per share for processing shareholder transactions is calculated as of the close of business of the New York Stock Exchange (NYSE), normally 4:00 p.m. Eastern time and includes trades executed through the end of the prior business day. Gains and losses on securities sold are determined on the basis of identified cost and include proceeds received from litigation. Dividend income is recorded on the ex-dividend date, except for certain dividends from foreign securities where the ex-dividend date may have passed, which are recorded as soon as the Fund is informed of the ex-dividend date. Non-cash dividends included in dividend income, if any, are recorded at the fair market value of the securities received. Income and capital gain distributions from Fidelity Central Funds, if any, are recorded on the ex-dividend date. Certain distributions received by the Fund represent a return of capital or capital gain. The Fund determines the components of these distributions subsequent to the ex-dividend date, based upon receipt of tax filings or other correspondence relating to the underlying investment. These distributions are recorded as a reduction of cost of investments and/or as a realized gain. Investment income is recorded net of foreign taxes withheld where recovery of such taxes is uncertain.
Expenses. Expenses directly attributable to a fund are charged to that fund. Expenses attributable to more than one fund are allocated among the respective funds on the basis of relative net assets or other appropriate methods. Expense estimates are accrued in the period to which they relate and adjustments are made when actual amounts are known.
Income Tax Information and Distributions to Shareholders. Each year, the Fund intends to qualify as a regulated investment company under Subchapter M of the Internal Revenue Code, including distributing substantially all of its taxable income and realized gains. As a result, no provision for U.S. Federal income taxes is required. As of October 31, 2019, the Fund did not have any unrecognized tax benefits in the financial statements; nor is the Fund aware of any tax positions for which it is reasonably possible that the total amounts of unrecognized tax benefits will significantly change in the next twelve months. The Fund files a U.S. federal tax return, in addition to state and local tax returns as required. The Fund's federal income tax returns are subject to examination by the Internal Revenue Service (IRS) for a period of three fiscal years after they are filed. State and local tax returns may be subject to examination for an additional fiscal year depending on the jurisdiction. Foreign taxes are provided for based on the Fund's understanding of the tax rules and rates that exist in the foreign markets in which it invests. The Fund is subject to a tax imposed on capital gains by certain countries in which it invests. An estimated deferred tax liability for net unrealized appreciation on the applicable securities is included in Other payables and accrued expenses on the Statement of Assets & Liabilities.
Distributions are declared and recorded on the ex-dividend date. Income and capital gain distributions are determined in accordance with income tax regulations, which may differ from GAAP. In addition, the Fund claimed a portion of the payment made to redeeming shareholders as a distribution for income tax purposes.
Capital accounts within the financial statements are adjusted for permanent book-tax differences. These adjustments have no impact on net assets or the results of operations. Capital accounts are not adjusted for temporary book-tax differences which will reverse in a subsequent period.
Book-tax differences are primarily due to in-kind transactions, foreign currency transactions, passive foreign investment companies (PFIC) and losses deferred due to wash sales.
As of period end, the cost and unrealized appreciation (depreciation) in securities, and derivatives if applicable, for federal income tax purposes were as follows:
| Gross unrealized appreciation | $272,604,635 |
| Gross unrealized depreciation | (24,719,615) |
| Net unrealized appreciation (depreciation) | $247,885,020 |
| Tax Cost | $780,807,336 |
The tax-based components of distributable earnings as of period end were as follows:
| Undistributed ordinary income | $6,932,663 |
| Undistributed long-term capital gain | $53,973,429 |
| Net unrealized appreciation (depreciation) on securities and other investments | $247,626,342 |
The tax character of distributions paid was as follows:
| | October 31, 2019 | October 31, 2018 |
| Ordinary Income | $9,516,819 | $ 11,209,950 |
| Long-term Capital Gains | 21,418,927 | – |
| Total | $30,935,746 | $ 11,209,950 |
Restricted Securities. The Fund may invest in securities that are subject to legal or contractual restrictions on resale. These securities generally may be resold in transactions exempt from registration or to the public if the securities are registered. Disposal of these securities may involve time-consuming negotiations and expense, and prompt sale at an acceptable price may be difficult. Information regarding restricted securities is included at the end of the Fund's Schedule of Investments.
4. Purchases and Sales of Investments.
Purchases and sales of securities, other than short-term securities and in-kind transactions, aggregated $596,453,656 and $658,021,096, respectively.
5. Fees and Other Transactions with Affiliates.
Management Fee. Fidelity Management & Research Company (the investment adviser) and its affiliates provide the Fund with investment management related services for which the Fund pays a monthly management fee. The management fee is the sum of an individual fund fee rate that is based on an annual rate of .45% of the Fund's average net assets and an annualized group fee rate that averaged .24% during the period. The group fee rate is based upon the average net assets of all the mutual funds advised by the investment adviser, including any mutual funds previously advised by the investment adviser that are currently advised by Fidelity SelectCo, LLC, an affiliate of the investment adviser. The group fee rate decreases as assets under management increase and increases as assets under management decrease. In addition, the management fee is subject to a performance adjustment (up to a maximum of +/- .20% of the Fund's average net assets over a 36 month performance period). The upward or downward adjustment to the management fee is based on the Fund's relative investment performance as compared to its benchmark index, the MSCI All Country Asia ex Japan Index, over the same 36 month performance period. For the reporting period, the total annual management fee rate, including the performance adjustment, was .84% of the Fund's average net assets. The performance adjustment included in the management fee rate may be higher or lower than the maximum performance adjustment rate due to the difference between the average net assets for the reporting and performance periods.
Transfer Agent Fees. Fidelity Investments Institutional Operations Company, Inc. (FIIOC), an affiliate of the investment adviser, is the Fund's transfer, dividend disbursing and shareholder servicing agent. FIIOC receives account fees and asset-based fees that vary according to account size and type of account. FIIOC pays for typesetting, printing and mailing of shareholder reports, except proxy statements. For the period, the transfer agent fees were equivalent to an annual rate of .17% of average net assets.
Accounting and Security Lending Fees. Fidelity Service Company, Inc. (FSC), an affiliate of the investment adviser, maintains the Fund's accounting records. The accounting fee is based on the level of average net assets for each month. Prior to April 1, 2019, FSC had a separate agreement with the Fund for administration of the security lending program, based on the number and duration of lending transactions. For the period, the total fees paid for accounting and administration of securities lending were equivalent to an annual rate of .05%.
Brokerage Commissions. The Fund placed a portion of its portfolio transactions with brokerage firms which are affiliates of the investment adviser. Brokerage commissions are included in net realized gain (loss) and change in net unrealized appreciation (depreciation) in the Statement of Operations. The commissions paid to these affiliated firms were $4,406 for the period.
Interfund Lending Program. Pursuant to an Exemptive Order issued by the SEC, the Fund, along with other registered investment companies having management contracts with Fidelity Management & Research Company (FMR) or other affiliated entities of FMR, may participate in an interfund lending program. This program provides an alternative credit facility allowing the funds to borrow from, or lend money to, other participating affiliated funds. At period end, there were no interfund loans outstanding. The Fund's activity in this program during the period for which loans were outstanding was as follows:
| Borrower or Lender | Average Loan Balance | Weighted Average Interest Rate | Interest Expense |
| Borrower | $8,946,000 | 2.21% | $549 |
Interfund Trades. The Fund may purchase from or sell securities to other Fidelity Funds under procedures adopted by the Board. The procedures have been designed to ensure these interfund trades are executed in accordance with Rule 17a-7 of the 1940 Act. Interfund trades are included within the respective purchases and sales amounts shown in the Purchases and Sales of Investments note.
Affiliated Redemptions In-Kind. During the period, 667,060 shares of the Fund were redeemed in-kind for investments and cash with a value of $27,823,070. The net realized gain of $9,780,162 on investments delivered through in-kind redemptions is included in the accompanying Statement of Operations. The amount of the in-kind redemptions is included in share transactions in the accompanying Statement of Changes in Net Assets. The Fund recognized no gain or loss for federal income tax purposes.
6. Committed Line of Credit.
The Fund participates with other funds managed by the investment adviser or an affiliate in a $4.25 billion credit facility (the "line of credit") to be utilized for temporary or emergency purposes to fund shareholder redemptions or for other short-term liquidity purposes. The Fund has agreed to pay commitment fees on its pro-rata portion of the line of credit, which amounted to $2,662 and is reflected in Miscellaneous expenses on the Statement of Operations. During the period, the Fund did not borrow on this line of credit.
7. Security Lending.
The Fund lends portfolio securities from time to time in order to earn additional income. For equity securities, lending agents are used, including National Financial Services (NFS), an affiliate of the Fund. Pursuant to a securities lending agreement, NFS will receive a fee, which is capped at 9.9% of daily lending revenue, for its services as lending agent. The Fund may lend securities to certain qualified borrowers, including NFS. On the settlement date of the loan, the Fund receives collateral (in the form of U.S. Treasury obligations, letters of credit and/or cash) against the loaned securities and maintains collateral in an amount not less than 100% of the market value of the loaned securities during the period of the loan. The market value of the loaned securities is determined at the close of business of the Fund and any additional required collateral is delivered to the Fund on the next business day. The Fund or borrower may terminate the loan at any time, and if the borrower defaults on its obligation to return the securities loaned because of insolvency or other reasons, the Fund may apply collateral received from the borrower against the obligation. The Fund may experience delays and costs in recovering the securities loaned. Any cash collateral received is invested in Fidelity Securities Lending Cash Central Fund. The value of loaned securities and cash collateral at period end are disclosed on the Fund's Statement of Assets and Liabilities. Security lending income represents the income earned on investing cash collateral, less rebates paid to borrowers and any lending agent fees associated with the loan, plus any premium payments received for lending certain types of securities. Security lending income is presented in the Statement of Operations as a component of income from Fidelity Central Funds. During the period, there were no securities loaned to NFS.
8. Expense Reductions.
Commissions paid to certain brokers with whom the investment adviser, or its affiliates, places trades on behalf of the Fund include an amount in addition to trade execution, which may be rebated back to the Fund to offset certain expenses. This amount totaled $10,406 for the period.
In addition, during the period the investment adviser reimbursed and/or waived a portion of operating expenses in the amount of $7,390.
9. Other.
The Fund's organizational documents provide former and current trustees and officers with a limited indemnification against liabilities arising in connection with the performance of their duties to the Fund. In the normal course of business, the Fund may also enter into contracts that provide general indemnifications. The Fund's maximum exposure under these arrangements is unknown as this would be dependent on future claims that may be made against the Fund. The risk of material loss from such claims is considered remote.
Fidelity® Emerging Markets Fund
Performance: The Bottom Line
Average annual total return reflects the change in the value of an investment, assuming reinvestment of distributions from dividend income and capital gains (the profits earned upon the sale of securities that have grown in value, if any) and assuming a constant rate of performance each year. The hypothetical investment and the average annual total returns do not reflect the deduction of taxes that a shareholder would pay on fund distributions or the redemption of fund shares. During periods of reimbursement by Fidelity, a fund’s total return will be greater than it would be had the reimbursement not occurred. How a fund did yesterday is no guarantee of how it will do tomorrow.
Average Annual Total Returns
| For the periods ended October 31, 2019 | Past 1 year | Past 5 years | Past 10 years |
| Fidelity® Emerging Markets Fund | 24.91% | 6.05% | 5.70% |
| Class K | 25.08% | 6.22% | 5.90% |
The initial offering of Class K shares took place on May 9, 2008. Returns prior to May 9, 2008 are those of Fidelity® Emerging Markets Fund, the original class of the fund.
$10,000 Over 10 Years
Let's say hypothetically that $10,000 was invested in Fidelity® Emerging Markets Fund, a class of the fund, on October 31, 2009.
The chart shows how the value of your investment would have changed, and also shows how the MSCI Emerging Markets Index performed over the same period.
See (above) (previous page) for additional information regarding the performance of Fidelity® Emerging Markets Fund.
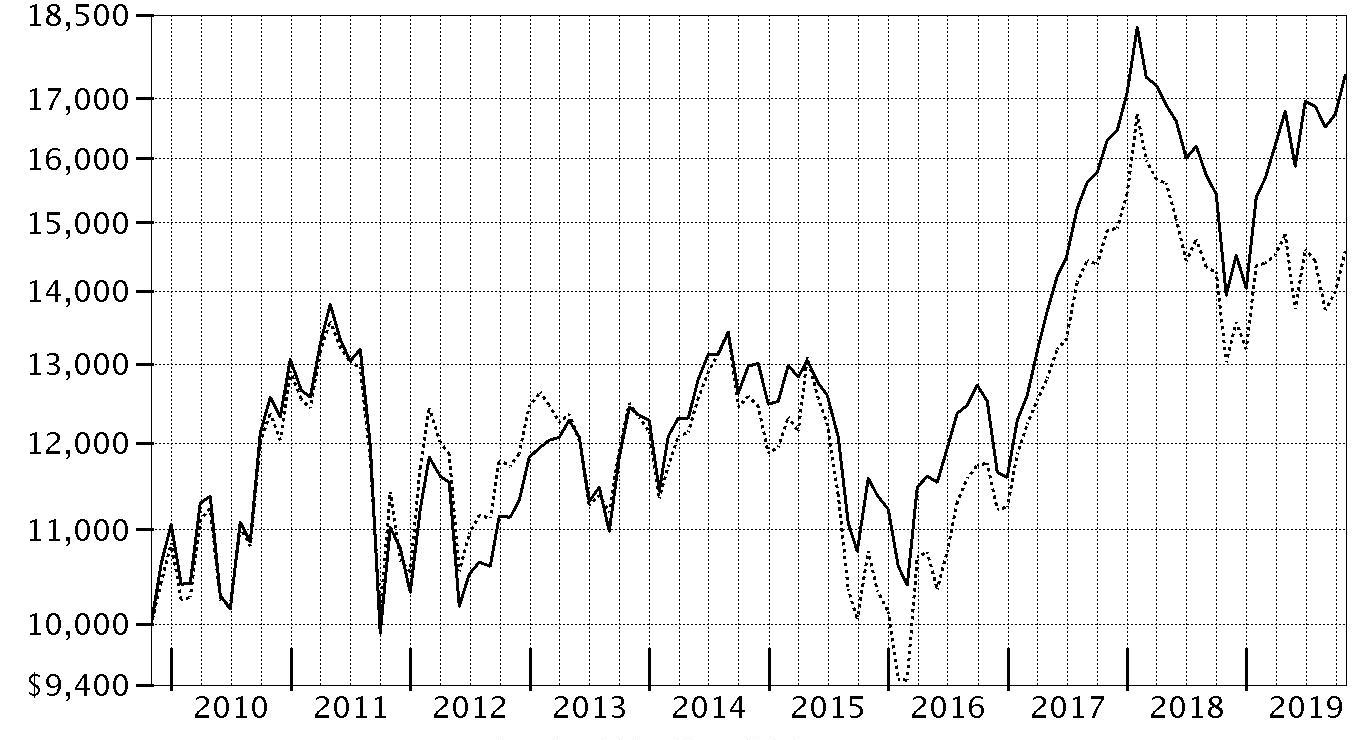
| Period Ending Values |
| $17,403 | Fidelity® Emerging Markets Fund |
| $14,574 | MSCI Emerging Markets Index |
Fidelity® Emerging Markets Fund
Management's Discussion of Fund Performance
Market Recap: The MSCI ACWI (All Country World Index) ex USA Index gained 11.47% for the 12 months ending October 31, 2019, as international stocks reflected a confluence of factors, including escalating trade tension, and moderating but still positive global economic growth. Currency fluctuations were largely modest and varied by region, muting the overall impact on international equity returns. In late December, the U.S. Federal Reserve shifted from raising interest rates to a more dovish policy in 2019, joining many foreign central banks. In June, international stocks rose 6.03%, as policy stimulus in China stabilized that country’s economic growth. The Fed cut its policy rate in July for the first time since 2008. However, the index returned -1.21% for the month, followed by -3.08% in August. In September, the Fed cut its policy rate another quarter point, citing concerns about slowing economic growth and muted inflation, and did the same in October, leading to monthly gains of 2.59% and 3.49%, respectively. For the full 12 months, the growth-oriented information technology sector (+22%) led the way, followed by utilities (+20%) and real estate (+18%), two high-dividend-yielding categories. Conversely, energy was roughly flat, while materials (+6%) and communication services (7%) also lagged. By region, Asia Pacific ex Japan (+16%), Europe ex U.K (+13%), Canada (+12%) and emerging markets (+12%) fared best. Meanwhile, the U.K. (+7%) and Japan (+10%) trailed the broader market.
Comments from Portfolio Manager John Dance: For the year, the fund’s share classes returned roughly 25%, more than double the 11.89% return of the benchmark MSCI Emerging Markets Index. Stock selection mainly drove the fund’s advantage over the benchmark, especially in the financials, consumer staples, consumer discretionary and health care sectors. By country, stock picking in China provided a notable boost to the fund’s relative result. Positioning in Brazil, India and South Korea also stood out to the upside, as did non-benchmark exposure to the U.S. and France. However, non-benchmark allocations to the U.K., Germany and Belgium hurt the fund's relative performance. Among individual securities, two China-based beverage makers, Wuliangye Yibin and Kweichow Moutai, added notable value, as did Notre Dame Intermedica, a Brazil-based integrated medical provider. Conversely, a non-benchmark stake in London-based health care services firm NMC Health detracted. Also worth mentioning, the fund owned two suppliers of materials for electric vehicle batteries that disappointed: Chile-based lithium producer Sociedad Quimica Y Minera (-32%) and Belgium-based Umicore (-25%), which was a non-benchmark position. We sold all three detractors I mentioned from the fund by period end.
The views expressed above reflect those of the portfolio manager(s) only through the end of the period as stated on the cover of this report and do not necessarily represent the views of Fidelity or any other person in the Fidelity organization. Any such views are subject to change at any time based upon market or other conditions and Fidelity disclaims any responsibility to update such views. These views may not be relied on as investment advice and, because investment decisions for a Fidelity fund are based on numerous factors, may not be relied on as an indication of trading intent on behalf of any Fidelity fund.
Note to shareholders: On February 22, 2019, John Dance assumed co-management responsibilities for the fund, joining Co-Manager Sammy Simnegar. As of October 1, 2019, Sammy no longer manages the fund, leaving John as sole Portfolio Manager.
Fidelity® Emerging Markets Fund
Investment Summary (Unaudited)
Geographic Diversification (% of fund's net assets)
| As of October 31, 2019 |
| | Cayman Islands | 15.2% |
| | India | 14.4% |
| | China | 11.6% |
| | Brazil | 11.0% |
| | United States of America* | 9.1% |
| | Taiwan | 7.2% |
| | Russia | 5.2% |
| | Korea (South) | 4.8% |
| | South Africa | 3.5% |
| | Other | 18.0% |
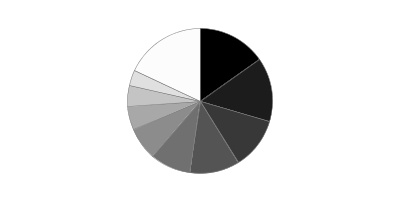
* Includes Short-Term investments and Net Other Assets (Liabilities).
Percentages are based on country or territory of incorporation and are adjusted for the effect of futures contracts, if applicable.
Asset Allocation as of October 31, 2019
| | % of fund's net assets |
| Stocks | 98.5 |
| Short-Term Investments and Net Other Assets (Liabilities) | 1.5 |
Top Ten Stocks as of October 31, 2019
| | % of fund's net assets |
| Taiwan Semiconductor Manufacturing Co. Ltd. (Taiwan, Semiconductors & Semiconductor Equipment) | 6.0 |
| Tencent Holdings Ltd. (Cayman Islands, Interactive Media & Services) | 5.7 |
| Alibaba Group Holding Ltd. sponsored ADR (Cayman Islands, Internet & Direct Marketing Retail) | 5.6 |
| Samsung Electronics Co. Ltd. (Korea (South), Technology Hardware, Storage & Peripherals) | 4.8 |
| Reliance Industries Ltd. (India, Oil, Gas & Consumable Fuels) | 2.9 |
| Ping An Insurance Group Co. of China Ltd. (H Shares) (China, Insurance) | 2.1 |
| Housing Development Finance Corp. Ltd. (India, Thrifts & Mortgage Finance) | 1.9 |
| PT Bank Central Asia Tbk (Indonesia, Banks) | 1.8 |
| Naspers Ltd. Class N (South Africa, Internet & Direct Marketing Retail) | 1.8 |
| Kweichow Moutai Co. Ltd. (A Shares) (China, Beverages) | 1.7 |
| | 34.3 |
Top Market Sectors as of October 31, 2019
| | % of fund's net assets |
| Financials | 20.9 |
| Information Technology | 20.0 |
| Consumer Discretionary | 16.8 |
| Energy | 9.0 |
| Consumer Staples | 7.4 |
| Communication Services | 7.2 |
| Industrials | 6.4 |
| Health Care | 5.2 |
| Materials | 2.7 |
| Utilities | 1.7 |
Fidelity® Emerging Markets Fund
Schedule of Investments October 31, 2019
Showing Percentage of Net Assets
| Common Stocks - 95.4% | | | |
| | | Shares | Value |
| Bermuda - 1.0% | | | |
| Credicorp Ltd. (United States) | | 195,031 | $41,744,435 |
| Brazil - 8.2% | | | |
| Atacadao Distribuicao Comercio e Industria Ltda | | 3,707,400 | 17,665,731 |
| BM&F BOVESPA SA | | 4,441,200 | 53,575,678 |
| Equatorial Energia SA | | 1,467,000 | 37,266,665 |
| Hapvida Participacoes e Investimentos SA (a) | | 1,069,800 | 15,018,013 |
| Localiza Rent A Car SA | | 3,754,700 | 40,425,869 |
| Lojas Renner SA | | 3,495,650 | 44,234,943 |
| Notre Dame Intermedica Participacoes SA | | 3,941,600 | 58,969,206 |
| Rumo SA (b) | | 7,665,800 | 43,580,661 |
| Suzano Papel e Celulose SA | | 3,196,700 | 26,016,778 |
|
| TOTAL BRAZIL | | | 336,753,544 |
|
| Cayman Islands - 15.2% | | | |
| 51job, Inc. sponsored ADR (b) | | 347,774 | 27,394,158 |
| Alibaba Group Holding Ltd. sponsored ADR (b) | | 1,302,954 | 230,192,883 |
| Hansoh Pharmaceutical Group Co. Ltd. (a) | | 12,302,000 | 37,374,201 |
| New Oriental Education & Technology Group, Inc. sponsored ADR (b) | | 385,087 | 47,003,719 |
| Pinduoduo, Inc. ADR (b) | | 332,400 | 13,588,512 |
| Shenzhou International Group Holdings Ltd. | | 2,768,500 | 38,256,943 |
| Tencent Holdings Ltd. | | 5,754,800 | 233,431,477 |
|
| TOTAL CAYMAN ISLANDS | | | 627,241,893 |
|
| Chile - 0.1% | | | |
| Banco Santander Chile sponsored ADR | | 236,750 | 5,736,453 |
| China - 11.6% | | | |
| AVIC Jonhon OptronicTechnology Co. Ltd. | | 6,509,409 | 37,267,831 |
| Chongqing Fuling Zhacai Group Co. Ltd. Group (A Shares) | | 8,343,449 | 27,518,569 |
| Foshan Haitian Flavouring & Food Co. Ltd. (A Shares) | | 2,239,890 | 35,523,786 |
| Inner Mongoli Yili Industries Co. Ltd. (A Shares) | | 4,909,400 | 20,206,133 |
| Kweichow Moutai Co. Ltd. (A Shares) | | 421,438 | 70,535,911 |
| Midea Group Co. Ltd. (A Shares) | | 4,831,348 | 38,050,858 |
| Ping An Insurance Group Co. of China Ltd. (H Shares) | | 7,512,500 | 86,707,704 |
| Shanghai International Airport Co. Ltd. (A Shares) | | 2,737,400 | 29,629,621 |
| Shanghai M&G Stationery, Inc. (A Shares) | | 5,486,825 | 38,962,806 |
| Shenzhen Expressway Co. Ltd.: | | | |
| (A Shares) | | 3,535,819 | 5,240,522 |
| (H Shares) | | 16,416,000 | 21,972,797 |
| Shenzhen Mindray Bio-Medical Electronics Co. Ltd. (A Shares) | | 1,267,125 | 31,994,225 |
| Wuliangye Yibin Co. Ltd. (A Shares) | | 1,776,030 | 33,224,048 |
|
| TOTAL CHINA | | | 476,834,811 |
|
| France - 3.1% | | | |
| Dassault Systemes SA | | 125,676 | 19,069,645 |
| Hermes International SCA | | 51,362 | 36,948,205 |
| LVMH Moet Hennessy Louis Vuitton SE | | 92,599 | 39,544,961 |
| Pernod Ricard SA | | 169,048 | 31,203,243 |
|
| TOTAL FRANCE | | | 126,766,054 |
|
| Hong Kong - 1.5% | | | |
| AIA Group Ltd. | | 3,549,600 | 35,347,715 |
| Hong Kong Exchanges and Clearing Ltd. | | 794,000 | 24,736,306 |
|
| TOTAL HONG KONG | | | 60,084,021 |
|
| India - 14.4% | | | |
| Asian Paints Ltd. | | 1,359,645 | 34,633,133 |
| Axis Bank Ltd. | | 3,572,600 | 36,989,533 |
| Bajaj Finance Ltd. | | 442,500 | 25,075,129 |
| HDFC Bank Ltd. | | 2,775,194 | 48,049,105 |
| Housing Development Finance Corp. Ltd. | | 2,667,746 | 80,006,769 |
| Infosys Ltd. sponsored ADR | | 247,858 | 2,376,958 |
| Kotak Mahindra Bank Ltd. | | 2,339,048 | 51,841,908 |
| Page Industries Ltd. | | 125,600 | 45,503,832 |
| Petronet LNG Ltd. | | 12,889,200 | 51,972,816 |
| Power Grid Corp. of India Ltd. | | 11,273,100 | 31,501,427 |
| Reliance Industries Ltd. | | 5,751,918 | 118,468,937 |
| Tata Consultancy Services Ltd. | | 2,082,700 | 66,329,840 |
|
| TOTAL INDIA | | | 592,749,387 |
|
| Indonesia - 2.8% | | | |
| PT Bank Central Asia Tbk | | 32,450,300 | 72,634,404 |
| PT Bank Rakyat Indonesia Tbk | | 136,839,300 | 41,001,881 |
|
| TOTAL INDONESIA | | | 113,636,285 |
|
| Japan - 1.0% | | | |
| Hoya Corp. | | 446,200 | 39,433,920 |
| Kenya - 0.9% | | | |
| Safaricom Ltd. | | 126,938,700 | 36,557,854 |
| Korea (South) - 4.8% | | | |
| Samsung Electronics Co. Ltd. | | 4,625,307 | 199,194,621 |
| Mexico - 0.4% | | | |
| Grupo Aeroportuario Norte S.A.B. de CV | | 2,616,063 | 18,137,620 |
| Netherlands - 3.5% | | | |
| ASML Holding NV (Netherlands) | | 200,900 | 52,658,825 |
| Prosus NV (b) | | 512,212 | 35,321,627 |
| Unilever NV | | 531,600 | 31,393,710 |
| Yandex NV Series A (b) | | 732,287 | 24,451,063 |
|
| TOTAL NETHERLANDS | | | 143,825,225 |
|
| Philippines - 1.9% | | | |
| Ayala Land, Inc. | | 53,880,200 | 51,453,943 |
| Jollibee Food Corp. | | 5,920,100 | 27,032,314 |
|
| TOTAL PHILIPPINES | | | 78,486,257 |
|
| Russia - 4.9% | | | |
| Alrosa Co. Ltd. | | 18,234,300 | 21,188,158 |
| Lukoil PJSC sponsored ADR | | 666,100 | 61,254,556 |
| NOVATEK OAO GDR (Reg. S) | | 275,122 | 58,876,108 |
| Sberbank of Russia | | 16,766,410 | 61,447,403 |
|
| TOTAL RUSSIA | | | 202,766,225 |
|
| South Africa - 3.5% | | | |
| Clicks Group Ltd. | | 2,379,800 | 38,708,662 |
| FirstRand Ltd. | | 8,138,100 | 35,168,785 |
| Naspers Ltd. Class N | | 512,212 | 72,482,413 |
|
| TOTAL SOUTH AFRICA | | | 146,359,860 |
|
| Switzerland - 0.8% | | | |
| Sika AG | | 195,613 | 33,610,140 |
| Taiwan - 7.2% | | | |
| E.SUN Financial Holdings Co. Ltd. | | 46,627,678 | 42,120,550 |
| Taiwan Semiconductor Manufacturing Co. Ltd. | | 25,287,000 | 247,340,434 |
| Voltronic Power Technology Corp. | | 372,000 | 8,233,327 |
|
| TOTAL TAIWAN | | | 297,694,311 |
|
| United Arab Emirates - 1.0% | | | |
| National Bank of Abu Dhabi PJSC | | 10,427,800 | 43,213,155 |
| United States of America - 7.6% | | | |
| Adobe, Inc. (b) | | 118,078 | 32,817,419 |
| Lam Research Corp. | | 143,008 | 38,760,888 |
| MasterCard, Inc. Class A | | 118,249 | 32,732,506 |
| MercadoLibre, Inc. (b) | | 48,068 | 25,068,423 |
| Microsoft Corp. | | 158,632 | 22,743,070 |
| Moody's Corp. | | 150,009 | 33,105,486 |
| NVIDIA Corp. | | 179,977 | 36,178,977 |
| Thermo Fisher Scientific, Inc. | | 99,738 | 30,118,881 |
| TransDigm Group, Inc. | | 52,848 | 27,812,845 |
| Visa, Inc. Class A | | 184,673 | 33,030,613 |
|
| TOTAL UNITED STATES OF AMERICA | | | 312,369,108 |
|
| TOTAL COMMON STOCKS | | | |
| (Cost $2,698,166,780) | | | 3,933,195,179 |
|
| Nonconvertible Preferred Stocks - 3.1% | | | |
| Brazil - 2.8% | | | |
| Itau Unibanco Holding SA | | 5,432,865 | 49,079,341 |
| Petroleo Brasileiro SA - Petrobras sponsored ADR | | 3,999,105 | 64,945,465 |
|
| TOTAL BRAZIL | | | 114,024,806 |
|
| Russia - 0.3% | | | |
| Tatneft PAO | | 1,219,100 | 12,528,939 |
| TOTAL NONCONVERTIBLE PREFERRED STOCKS | | | |
| (Cost $96,366,305) | | | 126,553,745 |
|
| Money Market Funds - 1.0% | | | |
| Fidelity Cash Central Fund 1.83% (c) | | | |
| (Cost $43,389,560) | | 43,380,884 | 43,389,560 |
| TOTAL INVESTMENT IN SECURITIES - 99.5% | | | |
| (Cost $2,837,922,645) | | | 4,103,138,484 |
| NET OTHER ASSETS (LIABILITIES) - 0.5% | | | 20,513,490 |
| NET ASSETS - 100% | | | $4,123,651,974 |
Categorizations in the Schedule of Investments are based on country or territory of incorporation.
Legend
(a) Security exempt from registration under Rule 144A of the Securities Act of 1933. These securities may be resold in transactions exempt from registration, normally to qualified institutional buyers. At the end of the period, the value of these securities amounted to $52,392,214 or 1.3% of net assets.
(b) Non-income producing
(c) Affiliated fund that is generally available only to investment companies and other accounts managed by Fidelity Investments. The rate quoted is the annualized seven-day yield of the fund at period end. A complete unaudited listing of the fund's holdings as of its most recent quarter end is available upon request. In addition, each Fidelity Central Fund's financial statements, which are not covered by the Fund's Report of Independent Registered Public Accounting Firm, are available on the SEC's website or upon request.
Affiliated Central Funds
Information regarding fiscal year to date income earned by the Fund from investments in Fidelity Central Funds is as follows:
| Fund | Income earned |
| Fidelity Cash Central Fund | $1,723,273 |
| Fidelity Securities Lending Cash Central Fund | 2,514,136 |
| Total | $4,237,409 |
Amounts in the income column in the above table include any capital gain distributions from underlying funds, which are presented in the corresponding line-item in the Statement of Operations, if applicable. Amount for Fidelity Securities Lending Cash Central Fund represents the income earned on investing cash collateral, less rebates paid to borrowers and any lending agent fees associated with the loan, plus any premium payments received for lending certain types of securities.
Investment Valuation
The following is a summary of the inputs used, as of October 31, 2019, involving the Fund's assets and liabilities carried at fair value. The inputs or methodology used for valuing securities may not be an indication of the risk associated with investing in those securities. For more information on valuation inputs, and their aggregation into the levels used below, please refer to the Investment Valuation section in the accompanying Notes to Financial Statements.
| | Valuation Inputs at Reporting Date: |
| Description | Total | Level 1 | Level 2 | Level 3 |
| Investments in Securities: | | | | |
| Equities: | | | | |
| Communication Services | $294,440,394 | $61,008,917 | $233,431,477 | $-- |
| Consumer Discretionary | 693,229,633 | 432,358,312 | 260,871,321 | -- |
| Consumer Staples | 305,979,793 | 118,971,346 | 187,008,447 | -- |
| Energy | 368,046,821 | 197,605,068 | 170,441,753 | -- |
| Financials | 867,581,740 | 303,743,883 | 563,837,857 | -- |
| Health Care | 212,908,446 | 104,106,100 | 108,802,346 | -- |
| Industrials | 261,390,226 | 165,584,480 | 95,805,746 | -- |
| Information Technology | 820,501,627 | 416,904,697 | 403,596,930 | -- |
| Materials | 115,448,209 | 80,815,076 | 34,633,133 | -- |
| Real Estate | 51,453,943 | -- | 51,453,943 | -- |
| Utilities | 68,768,092 | 37,266,665 | 31,501,427 | -- |
| Money Market Funds | 43,389,560 | 43,389,560 | -- | -- |
| Total Investments in Securities: | $4,103,138,484 | $1,961,754,104 | $2,141,384,380 | $-- |
See accompanying notes which are an integral part of the financial statements.
Fidelity® Emerging Markets Fund
Financial Statements
Statement of Assets and Liabilities
| | | October 31, 2019 |
| Assets | | |
Investment in securities, at value — See accompanying schedule:
Unaffiliated issuers (cost $2,794,533,085) | $4,059,748,924 | |
| Fidelity Central Funds (cost $43,389,560) | 43,389,560 | |
| Total Investment in Securities (cost $2,837,922,645) | | $4,103,138,484 |
| Foreign currency held at value (cost $917,833) | | 919,073 |
| Receivable for investments sold | | 24,966,247 |
| Receivable for fund shares sold | | 5,554,858 |
| Dividends receivable | | 4,999,486 |
| Distributions receivable from Fidelity Central Funds | | 120,429 |
| Prepaid expenses | | 8,325 |
| Other receivables | | 1,909,430 |
| Total assets | | 4,141,616,332 |
| Liabilities | | |
| Payable for investments purchased | $5,849,088 | |
| Payable for fund shares redeemed | 3,743,681 | |
| Accrued management fee | 2,561,844 | |
| Other affiliated payables | 693,374 | |
| Other payables and accrued expenses | 5,116,371 | |
| Total liabilities | | 17,964,358 |
| Net Assets | | $4,123,651,974 |
| Net Assets consist of: | | |
| Paid in capital | | $2,878,808,017 |
| Total accumulated earnings (loss) | | 1,244,843,957 |
| Net Assets | | $4,123,651,974 |
| Net Asset Value and Maximum Offering Price | | |
| Emerging Markets: | | |
| Net Asset Value, offering price and redemption price per share ($3,104,887,425 ÷ 93,994,537 shares) | | $33.03 |
| Class K: | | |
| Net Asset Value, offering price and redemption price per share ($1,018,764,549 ÷ 30,807,509 shares) | | $33.07 |
See accompanying notes which are an integral part of the financial statements.
Statement of Operations
| | | Year ended October 31, 2019 |
| Investment Income | | |
| Dividends | | $85,077,613 |
| Non-Cash dividends | | 50,198,237 |
| Income from Fidelity Central Funds (including $2,514,136 from security lending) | | 4,237,409 |
| Income before foreign taxes withheld | | 139,513,259 |
| Less foreign taxes withheld | | (9,831,569) |
| Total income | | 129,681,690 |
| Expenses | | |
| Management fee | $30,275,148 | |
| Transfer agent fees | 6,633,867 | |
| Accounting and security lending fees | 1,546,409 | |
| Custodian fees and expenses | 1,213,851 | |
| Independent trustees' fees and expenses | 24,789 | |
| Registration fees | 117,535 | |
| Audit | 140,454 | |
| Legal | 10,413 | |
| Interest | 99,915 | |
| Miscellaneous | 30,860 | |
| Total expenses before reductions | 40,093,241 | |
| Expense reductions | (803,811) | |
| Total expenses after reductions | | 39,289,430 |
| Net investment income (loss) | | 90,392,260 |
| Realized and Unrealized Gain (Loss) | | |
| Net realized gain (loss) on: | | |
| Investment securities: | | |
| Unaffiliated issuers | 217,389,638 | |
| Redemptions in-kind with affiliated entities | 158,099,354 | |
| Fidelity Central Funds | 921 | |
| Foreign currency transactions | (1,309,401) | |
| Futures contracts | (879,880) | |
| Total net realized gain (loss) | | 373,300,632 |
| Change in net unrealized appreciation (depreciation) on: | | |
| Investment securities: | | |
| Unaffiliated issuers (net of increase in deferred foreign taxes of $4,443,887) | 477,362,165 | |
| Assets and liabilities in foreign currencies | 174,839 | |
| Total change in net unrealized appreciation (depreciation) | | 477,537,004 |
| Net gain (loss) | | 850,837,636 |
| Net increase (decrease) in net assets resulting from operations | | $941,229,896 |
See accompanying notes which are an integral part of the financial statements.
Statement of Changes in Net Assets
| | Year ended October 31, 2019 | Year ended October 31, 2018 |
| Increase (Decrease) in Net Assets | | |
| Operations | | |
| Net investment income (loss) | $90,392,260 | $39,764,335 |
| Net realized gain (loss) | 373,300,632 | (46,242,124) |
| Change in net unrealized appreciation (depreciation) | 477,537,004 | (732,988,757) |
| Net increase (decrease) in net assets resulting from operations | 941,229,896 | (739,466,546) |
| Distributions to shareholders | (35,645,109) | (31,488,954) |
| Share transactions - net increase (decrease) | (1,146,375,276) | 277,115,896 |
| Redemption fees | – | 97,832 |
| Total increase (decrease) in net assets | (240,790,489) | (493,741,772) |
| Net Assets | | |
| Beginning of period | 4,364,442,463 | 4,858,184,235 |
| End of period | $4,123,651,974 | $4,364,442,463 |
See accompanying notes which are an integral part of the financial statements.
Financial Highlights
Fidelity Emerging Markets Fund
| Years ended October 31, | 2019 | 2018 | 2017 | 2016 | 2015 |
| Selected Per–Share Data | | | | | |
| Net asset value, beginning of period | $26.66 | $31.37 | $24.25 | $22.55 | $25.44 |
| Income from Investment Operations | | | | | |
| Net investment income (loss)A | .61B | .24 | .22 | .14 | .19 |
| Net realized and unrealized gain (loss) | 5.98 | (4.76) | 7.05 | 1.66 | (2.91) |
| Total from investment operations | 6.59 | (4.52) | 7.27 | 1.80 | (2.72) |
| Distributions from net investment income | (.22) | (.16) | (.15) | (.11) | (.14) |
| Distributions from net realized gain | –C | (.03) | – | – | (.03) |
| Total distributions | (.22) | (.19) | (.15) | (.11) | (.17) |
| Redemption fees added to paid in capitalA | – | –C | –C | .01 | –C |
| Net asset value, end of period | $33.03 | $26.66 | $31.37 | $24.25 | $22.55 |
| Total ReturnD | 24.91% | (14.51)% | 30.21% | 8.07% | (10.76)% |
| Ratios to Average Net AssetsE,F | | | | | |
| Expenses before reductions | .94% | .96% | .97% | 1.01% | 1.05% |
| Expenses net of fee waivers, if any | .94% | .96% | .97% | 1.01% | 1.05% |
| Expenses net of all reductions | .92% | .92% | .96% | 1.00% | 1.03% |
| Net investment income (loss) | 2.02%B | .75% | .83% | .61% | .78% |
| Supplemental Data | | | | | |
| Net assets, end of period (000 omitted) | $3,104,887 | $3,493,583 | $3,933,401 | $3,014,957 | $2,738,934 |
| Portfolio turnover rateG | 85%H | 86% | 81% | 79% | 107% |
A Calculated based on average shares outstanding during the period.
B Net investment income per share reflects a large, non-recurring dividend which amounted to $.34 per share. Excluding this non-recurring dividend, the ratio of net investment income (loss) to average net assets would have been .88%.
C Amount represents less than $.005 per share.
D Total returns would have been lower if certain expenses had not been reduced during the applicable periods shown.
E Fees and expenses of any underlying Fidelity Central Funds are not included in the Fund's expense ratio. The Fund indirectly bears its proportionate share of the expenses of any underlying Fidelity Central Funds.
F Expense ratios reflect operating expenses of the class. Expenses before reductions do not reflect amounts reimbursed by the investment adviser or reductions from brokerage service arrangements or reductions from other expense offset arrangements and do not represent the amount paid by the class during periods when reimbursements or reductions occur. Expenses net of fee waivers reflect expenses after reimbursement by the investment adviser but prior to reductions from brokerage service arrangements or other expense offset arrangements. Expenses net of all reductions represent the net expenses paid by the class.
G Amount does not include the portfolio activity of any underlying Fidelity Central Funds.
H Portfolio turnover rate excludes securities received or delivered in-kind.
See accompanying notes which are an integral part of the financial statements.
Fidelity Emerging Markets Fund Class K
| Years ended October 31, | 2019 | 2018 | 2017 | 2016 | 2015 |
| Selected Per–Share Data | | | | | |
| Net asset value, beginning of period | $26.70 | $31.41 | $24.28 | $22.58 | $25.48 |
| Income from Investment Operations | | | | | |
| Net investment income (loss)A | .65B | .28 | .26 | .18 | .24 |
| Net realized and unrealized gain (loss) | 5.99 | (4.76) | 7.06 | 1.66 | (2.92) |
| Total from investment operations | 6.64 | (4.48) | 7.32 | 1.84 | (2.68) |
| Distributions from net investment income | (.26) | (.20) | (.19) | (.15) | (.20) |
| Distributions from net realized gain | –C | (.03) | – | – | (.03) |
| Total distributions | (.27)D | (.23) | (.19) | (.15) | (.22)E |
| Redemption fees added to paid in capitalA | – | –C | –C | .01 | –C |
| Net asset value, end of period | $33.07 | $26.70 | $31.41 | $24.28 | $22.58 |
| Total ReturnF | 25.08% | (14.39)% | 30.44% | 8.27% | (10.60)% |
| Ratios to Average Net AssetsG,H | | | | | |
| Expenses before reductions | .80% | .82% | .83% | .84% | .85% |
| Expenses net of fee waivers, if any | .80% | .82% | .82% | .84% | .85% |
| Expenses net of all reductions | .79% | .78% | .81% | .83% | .83% |
| Net investment income (loss) | 2.15%B | .89% | .98% | .78% | .98% |
| Supplemental Data | | | | | |
| Net assets, end of period (000 omitted) | $1,018,765 | $870,859 | $924,783 | $658,276 | $554,041 |
| Portfolio turnover rateI | 85%J | 86% | 81% | 79% | 107% |
A Calculated based on average shares outstanding during the period.
B Net investment income per share reflects a large, non-recurring dividend which amounted to $.34 per share. Excluding this non-recurring dividend, the ratio of net investment income (loss) to average net assets would have been 1.02%.
C Amount represents less than $.005 per share.
D Total distributions of $.27 per share is comprised of distributions from net investment income of $.263 and distributions from net realized gain of $.003 per share.
E Total distributions of $.22 per share is comprised of distributions from net investment income of $.195 and distributions from net realized gain of $.025 per share.
F Total returns would have been lower if certain expenses had not been reduced during the applicable periods shown.
G Fees and expenses of any underlying Fidelity Central Funds are not included in the Fund's expense ratio. The Fund indirectly bears its proportionate share of the expenses of any underlying Fidelity Central Funds.
H Expense ratios reflect operating expenses of the class. Expenses before reductions do not reflect amounts reimbursed by the investment adviser or reductions from brokerage service arrangements or reductions from other expense offset arrangements and do not represent the amount paid by the class during periods when reimbursements or reductions occur. Expenses net of fee waivers reflect expenses after reimbursement by the investment adviser but prior to reductions from brokerage service arrangements or other expense offset arrangements. Expenses net of all reductions represent the net expenses paid by the class.
I Amount does not include the portfolio activity of any underlying Fidelity Central Funds.
J Portfolio turnover rate excludes securities received or delivered in-kind.
See accompanying notes which are an integral part of the financial statements.
Notes to Financial Statements
For the period ended October 31, 2019
1. Organization.
Fidelity Emerging Markets Fund (the Fund) is a fund of Fidelity Investment Trust (the Trust) and is authorized to issue an unlimited number of shares. The Trust is registered under the Investment Company Act of 1940, as amended (the 1940 Act), as an open-end management investment company organized as a Massachusetts business trust. The Fund offers Emerging Markets and Class K shares, each of which has equal rights as to assets and voting privileges. Each class has exclusive voting rights with respect to matters that affect that class. The Fund's investments in emerging markets can be subject to social, economic, regulatory, and political uncertainties and can be extremely volatile.
2. Investments in Fidelity Central Funds.
The Fund invests in Fidelity Central Funds, which are open-end investment companies generally available only to other investment companies and accounts managed by the investment adviser and its affiliates. The Fund's Schedule of Investments lists each of the Fidelity Central Funds held as of period end, if any, as an investment of the Fund, but does not include the underlying holdings of each Fidelity Central Fund. As an Investing Fund, the Fund indirectly bears its proportionate share of the expenses of the underlying Fidelity Central Funds.
The Money Market Central Funds seek preservation of capital and current income and are managed by Fidelity Investments Money Management, Inc. (FIMM), an affiliate of the investment adviser. Annualized expenses of the Money Market Central Funds as of their most recent shareholder report date ranged from less than .005% to .01%.
A complete unaudited list of holdings for each Fidelity Central Fund is available upon request or at the Securities and Exchange Commission (the SEC) website at www.sec.gov. In addition, the financial statements of the Fidelity Central Funds, which are not covered by the Fund's Report of Independent Registered Public Accounting Firm, are available on the SEC website or upon request.
3. Significant Accounting Policies.
The Fund is an investment company and applies the accounting and reporting guidance of the Financial Accounting Standards Board (FASB) Accounting Standards Codification Topic 946 Financial Services – Investments Companies. The financial statements have been prepared in conformity with accounting principles generally accepted in the United States of America (GAAP), which require management to make certain estimates and assumptions at the date of the financial statements. Actual results could differ from those estimates. Subsequent events, if any, through the date that the financial statements were issued have been evaluated in the preparation of the financial statements. The following summarizes the significant accounting policies of the Fund:
Investment Valuation. Investments are valued as of 4:00 p.m. Eastern time on the last calendar day of the period. The Board of Trustees (the Board) has delegated the day to day responsibility for the valuation of the Fund's investments to the Fair Value Committee (the Committee) established by the Fund's investment adviser. In accordance with valuation policies and procedures approved by the Board, the Fund attempts to obtain prices from one or more third party pricing vendors or brokers to value its investments. When current market prices, quotations or currency exchange rates are not readily available or reliable, investments will be fair valued in good faith by the Committee, in accordance with procedures adopted by the Board. Factors used in determining fair value vary by investment type and may include market or investment specific events. The frequency with which these procedures are used cannot be predicted and they may be utilized to a significant extent. The Committee oversees the Fund's valuation policies and procedures and reports to the Board on the Committee's activities and fair value determinations. The Board monitors the appropriateness of the procedures used in valuing the Fund's investments and ratifies the fair value determinations of the Committee.
The Fund categorizes the inputs to valuation techniques used to value its investments into a disclosure hierarchy consisting of three levels as shown below:
- Level 1 – quoted prices in active markets for identical investments
- Level 2 – other significant observable inputs (including quoted prices for similar investments, interest rates, prepayment speeds, etc.)
- Level 3 – unobservable inputs (including the Fund's own assumptions based on the best information available)
Valuation techniques used to value the Fund's investments by major category are as follows:
Equity securities, including restricted securities, for which market quotations are readily available, are valued at the last reported sale price or official closing price as reported by a third party pricing vendor on the primary market or exchange on which they are traded and are categorized as Level 1 in the hierarchy. In the event there were no sales during the day or closing prices are not available, securities are valued at the last quoted bid price or may be valued using the last available price and are generally categorized as Level 2 in the hierarchy. For foreign equity securities, when market or security specific events arise, comparisons to the valuation of American Depositary Receipts (ADRs), futures contracts, Exchange-Traded Funds (ETFs) and certain indexes as well as quoted prices for similar securities may be used and would be categorized as Level 2 in the hierarchy. For equity securities, including restricted securities, where observable inputs are limited, assumptions about market activity and risk are used and these securities may be categorized as Level 3 in the hierarchy.
Investments in open-end mutual funds, including the Fidelity Central Funds, are valued at their closing net asset value (NAV) each business day and are categorized as Level 1 in the hierarchy.
Changes in valuation techniques may result in transfers in or out of an assigned level within the disclosure hierarchy. The aggregate value of investments by input level as of October 31, 2019 is included at the end of the Fund's Schedule of Investments.
Foreign Currency. The Fund may use foreign currency contracts to facilitate transactions in foreign-denominated securities. Gains and losses from these transactions may arise from changes in the value of the foreign currency or if the counterparties do not perform under the contracts' terms.
Foreign-denominated assets, including investment securities, and liabilities are translated into U.S. dollars at the exchange rates at period end. Purchases and sales of investment securities, income and dividends received and expenses denominated in foreign currencies are translated into U.S. dollars at the exchange rate in effect on the transaction date.
The effects of exchange rate fluctuations on investments are included with the net realized and unrealized gain (loss) on investment securities. Other foreign currency transactions resulting in realized and unrealized gain (loss) are disclosed separately.
Investment Transactions and Income. For financial reporting purposes, the Fund's investment holdings and NAV include trades executed through the end of the last business day of the period. The NAV per share for processing shareholder transactions is calculated as of the close of business of the New York Stock Exchange (NYSE), normally 4:00 p.m. Eastern time and includes trades executed through the end of the prior business day. Gains and losses on securities sold are determined on the basis of identified cost and include proceeds received from litigation. Dividend income is recorded on the ex-dividend date, except for certain dividends from foreign securities where the ex-dividend date may have passed, which are recorded as soon as the Fund is informed of the ex-dividend date. Non-cash dividends included in dividend income, if any, are recorded at the fair market value of the securities received. Income and capital gain distributions from Fidelity Central Funds, if any, are recorded on the ex-dividend date. Certain distributions received by the Fund represent a return of capital or capital gain. The Fund determines the components of these distributions subsequent to the ex-dividend date, based upon receipt of tax filings or other correspondence relating to the underlying investment. These distributions are recorded as a reduction of cost of investments and/or as a realized gain. Large, non-recurring dividends recognized by the Fund are presented separately on the Statement of Operations as "Non-cash dividends" and the impact of these dividends is presented in the Financial Highlights. Investment income is recorded net of foreign taxes withheld where recovery of such taxes is uncertain.
Class Allocations and Expenses. Investment income, realized and unrealized capital gains and losses, common expenses of the Fund, and certain fund-level expense reductions, if any, are allocated daily on a pro-rata basis to each class based on the relative net assets of each class to the total net assets of the Fund. Each class differs with respect to transfer agent fees incurred. Certain expense reductions may also differ by class. For the reporting period, the allocated portion of income and expenses to each class as a percent of its average net assets may vary due to the timing of recording these transactions in relation to fluctuating net assets of the classes. Expenses directly attributable to a fund are charged to that fund. Expenses attributable to more than one fund are allocated among the respective funds on the basis of relative net assets or other appropriate methods. Expense estimates are accrued in the period to which they relate and adjustments are made when actual amounts are known.
Income Tax Information and Distributions to Shareholders. Each year, the Fund intends to qualify as a regulated investment company under Subchapter M of the Internal Revenue Code, including distributing substantially all of its taxable income and realized gains. As a result, no provision for U.S. Federal income taxes is required. As of October 31, 2019, the Fund did not have any unrecognized tax benefits in the financial statements; nor is the Fund aware of any tax positions for which it is reasonably possible that the total amounts of unrecognized tax benefits will significantly change in the next twelve months. The Fund files a U.S. federal tax return, in addition to state and local tax returns as required. The Fund's federal income tax returns are subject to examination by the Internal Revenue Service (IRS) for a period of three fiscal years after they are filed. State and local tax returns may be subject to examination for an additional fiscal year depending on the jurisdiction. Foreign taxes are provided for based on the Fund's understanding of the tax rules and rates that exist in the foreign markets in which it invests. The Fund is subject to a tax imposed on capital gains by certain countries in which it invests. An estimated deferred tax liability for net unrealized appreciation on the applicable securities is included in Other payables and accrued expenses on the Statement of Assets & Liabilities.
Distributions are declared and recorded on the ex-dividend date. Income and capital gain distributions are declared separately for each class. Income and capital gain distributions are determined in accordance with income tax regulations, which may differ from GAAP. In addition, the Fund claimed a portion of the payment made to redeeming shareholders as a distribution for income tax purposes.
Capital accounts within the financial statements are adjusted for permanent book-tax differences. These adjustments have no impact on net assets or the results of operations. Capital accounts are not adjusted for temporary book-tax differences which will reverse in a subsequent period.
Book-tax differences are primarily due to futures contracts, foreign currency transactions, passive foreign investment companies (PFIC), redemptions in kind, capital loss carryforwards and losses deferred due to wash sales.
As of period end, the cost and unrealized appreciation (depreciation) in securities, and derivatives if applicable, for federal income tax purposes were as follows:
| Gross unrealized appreciation | $1,307,165,789 |
| Gross unrealized depreciation | (53,467,350) |
| Net unrealized appreciation (depreciation) | $1,253,698,439 |
| Tax Cost | $2,849,440,045 |
The tax-based components of distributable earnings as of period end were as follows:
| Undistributed ordinary income | $70,706,404 |
| Capital loss carryforward | $(74,380,837) |
| Net unrealized appreciation (depreciation) on securities and other investments | $1,252,962,277 |
Capital loss carryforwards are only available to offset future capital gains of the Fund to the extent provided by regulations and may be limited. Under the Regulated Investment Company Modernization Act of 2010 (the Act), the Fund is permitted to carry forward capital losses incurred in taxable years beginning after December 22, 2010 for an unlimited period and such capital losses are required to be used prior to any losses that expire. The capital loss carryforward information presented below, including any applicable limitation, is estimated as of fiscal period end and is subject to adjustment.
| No expiration | |
| Short-term | $(74,380,837) |
The tax character of distributions paid was as follows:
| | October 31, 2019 | October 31, 2018 |
| Ordinary Income | $35,645,109 | $ 31,488,954 |
Restricted Securities. The Fund may invest in securities that are subject to legal or contractual restrictions on resale. These securities generally may be resold in transactions exempt from registration or to the public if the securities are registered. Disposal of these securities may involve time-consuming negotiations and expense, and prompt sale at an acceptable price may be difficult. Information regarding restricted securities is included at the end of the Fund's Schedule of Investments.
4. Derivative Instruments.
Risk Exposures and the Use of Derivative Instruments. The Fund's investment objective allows the Fund to enter into various types of derivative contracts, including futures contracts. Derivatives are investments whose value is primarily derived from underlying assets, indices or reference rates and may be transacted on an exchange or over-the-counter (OTC). Derivatives may involve a future commitment to buy or sell a specified asset based on specified terms, to exchange future cash flows at periodic intervals based on a notional principal amount, or for one party to make one or more payments upon the occurrence of specified events in exchange for periodic payments from the other party.
The Fund used derivatives to increase returns and to manage exposure to certain risks as defined below. The success of any strategy involving derivatives depends on analysis of numerous economic factors, and if the strategies for investment do not work as intended, the Fund may not achieve its objectives.
The Fund's use of derivatives increased or decreased its exposure to the following risk:
| Equity Risk | Equity risk relates to the fluctuations in the value of financial instruments as a result of changes in market prices (other than those arising from interest rate risk or foreign exchange risk), whether caused by factors specific to an individual investment, its issuer, or all factors affecting all instruments traded in a market or market segment.
|
The Fund is also exposed to additional risks from investing in derivatives, such as liquidity risk and counterparty credit risk. Liquidity risk is the risk that the Fund will be unable to close out the derivative in the open market in a timely manner. Counterparty credit risk is the risk that the counterparty will not be able to fulfill its obligation to the Fund. Counterparty credit risk related to exchange-traded futures contracts may be mitigated by the protection provided by the exchange on which they trade.
Investing in derivatives may involve greater risks than investing in the underlying assets directly and, to varying degrees, may involve risk of loss in excess of any initial investment and collateral received and amounts recognized in the Statement of Assets and Liabilities. In addition, there may be the risk that the change in value of the derivative contract does not correspond to the change in value of the underlying instrument.
Futures Contracts. A futures contract is an agreement between two parties to buy or sell a specified underlying instrument for a fixed price at a specified future date. The Fund used futures contracts to manage its exposure to the stock market.
Upon entering into a futures contract, a fund is required to deposit either cash or securities (initial margin) with a clearing broker in an amount equal to a certain percentage of the face value of the contract. Futures contracts are marked-to-market daily and subsequent daily payments (variation margin) are made or received by a fund depending on the daily fluctuations in the value of the futures contracts and are recorded as unrealized appreciation or (depreciation). This receivable and/or payable, if any, is included in daily variation margin on futures contracts in the Statement of Assets and Liabilities. Realized gain or (loss) is recorded upon the expiration or closing of a futures contract. The net realized gain (loss) and change in net unrealized appreciation (depreciation) on futures contracts during the period is presented in the Statement of Operations.
Any open futures contracts at period end are presented in the Schedule of Investments under the caption "Futures Contracts". The notional amount at value reflects each contract's exposure to the underlying instrument or index at period end.
5. Purchases and Sales of Investments.
Purchases and sales of securities, other than short-term securities and in-kind transactions, aggregated $3,688,005,773 and $4,410,481,889, respectively.
6. Fees and Other Transactions with Affiliates.
Management Fee. Fidelity Management & Research Company (the investment adviser) and its affiliates provide the Fund with investment management related services for which the Fund pays a monthly management fee. The management fee is the sum of an individual fund fee rate that is based on an annual rate of .45% of the Fund's average net assets and an annualized group fee rate that averaged .24% during the period. The group fee rate is based upon the average net assets of all the mutual funds advised by the investment adviser, including any mutual funds previously advised by the investment adviser that are currently advised by Fidelity SelectCo, LLC, an affiliate of the investment adviser. The group fee rate decreases as assets under management increase and increases as assets under management decrease. For the reporting period, the total annual management fee rate was .69% of the Fund's average net assets.
Transfer Agent Fees. Fidelity Investments Institutional Operations Company, Inc., (FIIOC), an affiliate of the investment adviser, is the transfer, dividend disbursing and shareholder servicing agent for each class of the Fund. FIIOC receives account fees and asset-based fees that vary according to the account size and type of account of the shareholders of Emerging Markets, except for Class K. FIIOC receives an asset-based fee of Class K's average net assets. FIIOC pays for typesetting, printing and mailing of shareholder reports, except proxy statements.
For the period, transfer agent fees for each class were as follows:
| | Amount | % of Class-Level Average Net Assets |
| Emerging Markets | $6,200,141 | .18 |
| Class K | 433,726 | .05 |
| | $6,633,867 | |
Accounting and Security Lending Fees. Fidelity Service Company, Inc. (FSC), an affiliate of the investment adviser, maintains the Fund's accounting records. The accounting fee is based on the level of average net assets for each month. Prior to April 1, 2019, FSC had a separate agreement with the Fund for administration of the security lending program, based on the number and duration of lending transactions. For the period, the total fees paid for accounting and administration of securities lending were equivalent to an annual rate of .04%.
Brokerage Commissions. The Fund placed a portion of its portfolio transactions with brokerage firms which are affiliates of the investment adviser. Brokerage commissions are included in net realized gain (loss) and change in net unrealized appreciation (depreciation) in the Statement of Operations. The commissions paid to these affiliated firms were $24,488 for the period.
Interfund Lending Program. Pursuant to an Exemptive Order issued by the SEC, the Fund, along with other registered investment companies having management contracts with Fidelity Management & Research Company (FMR) or other affiliated entities of FMR, may participate in an interfund lending program. This program provides an alternative credit facility allowing the funds to borrow from, or lend money to, other participating affiliated funds. At period end, there were no interfund loans outstanding. The Fund's activity in this program during the period for which loans were outstanding was as follows:
| Borrower or Lender | Average Loan Balance | Weighted Average Interest Rate | Interest Expense |
| Borrower | $37,677,114 | 2.49% | $91,075 |
Interfund Trades. The Fund may purchase from or sell securities to other Fidelity Funds under procedures adopted by the Board. The procedures have been designed to ensure these interfund trades are executed in accordance with Rule 17a-7 of the 1940 Act. Interfund trades are included within the respective purchases and sales amounts shown in the Purchases and Sales of Investments note.
Affiliated Redemptions In-Kind. During the period, 21,444,879 shares of the Fund were redeemed in-kind for investments and cash with a value of $696,283,067. The net realized gain of $158,099,354 on investments delivered through in-kind redemptions is included in the accompanying Statement of Operations. The amount of the in-kind redemptions is included in share transactions in the accompanying Statement of Changes in Net Assets as well as the Notes to Financial Statements. The Fund recognized no gain or loss for federal income tax purposes.
7. Committed Line of Credit.
The Fund participates with other funds managed by the investment adviser or an affiliate in a $4.25 billion credit facility (the "line of credit") to be utilized for temporary or emergency purposes to fund shareholder redemptions or for other short-term liquidity purposes. The Fund has agreed to pay commitment fees on its pro-rata portion of the line of credit, which amounted to $11,613 and is reflected in Miscellaneous expenses on the Statement of Operations. During the period, the Fund did not borrow on this line of credit.
8. Security Lending.
The Fund lends portfolio securities from time to time in order to earn additional income. For equity securities, lending agents are used, including National Financial Services (NFS), an affiliate of the Fund. Pursuant to a securities lending agreement, NFS will receive a fee, which is capped at 9.9% of daily lending revenue, for its services as lending agent. The Fund may lend securities to certain qualified borrowers, including NFS. On the settlement date of the loan, the Fund receives collateral (in the form of U.S. Treasury obligations, letters of credit and/or cash) against the loaned securities and maintains collateral in an amount not less than 100% of the market value of the loaned securities during the period of the loan. The market value of the loaned securities is determined at the close of business of the Fund and any additional required collateral is delivered to the Fund on the next business day. The Fund or borrower may terminate the loan at any time, and if the borrower defaults on its obligation to return the securities loaned because of insolvency or other reasons, the Fund may apply collateral received from the borrower against the obligation. The Fund may experience delays and costs in recovering the securities loaned. Any cash collateral received is invested in the Fidelity Securities Lending Cash Central Fund. At period end, there were no security loans outstanding. Security lending income represents the income earned on investing cash collateral, less rebates paid to borrowers and any lending agent fees associated with the loan, plus any premium payments received for lending certain types of securities. Security lending income is presented in the Statement of Operations as a component of income from Fidelity Central Funds, and includes $151,245 from securities loaned to NFS, as affiliated borrower.
9. Bank Borrowings.
The Fund is permitted to have bank borrowings for temporary or emergency purposes to fund shareholder redemptions or for other short-term liquidity requirements. The Fund has established borrowing arrangements with certain banks. The interest rate on the borrowings is the bank's base rate, as revised from time to time. The average loan balance during the period for which loans were outstanding amounted to $27,433,250. The weighted average interest rate was 2.90%. The interest expense amounted to $8,840 under the bank borrowing program. At period end, there were no bank borrowings outstanding.
10. Expense Reductions.
Commissions paid to certain brokers with whom the investment adviser, or its affiliates, places trades on behalf of the Fund include an amount in addition to trade execution, which may be rebated back to the Fund to offset certain expenses. This amount totaled $761,726 for the period. In addition, through arrangements with the Fund's custodian, credits realized as a result of certain uninvested cash balances were used to reduce the Fund's expenses. During the period, custodian credits reduced the Fund's expenses by $10,466.
In addition, during the period the investment adviser reimbursed and/or waived a portion of fund-level operating expenses in the amount of $31,619.
11. Distributions to Shareholders.
Distributions to shareholders of each class were as follows:
| | Year ended
October 31, 2019 | Year ended
October 31, 2018 |
| Distributions to shareholders | | |
| Emerging Markets | $27,210,630 | $24,827,626 |
| Class K | 8,434,479 | 6,661,328 |
| Total | $35,645,109 | $31,488,954 |
12. Share Transactions.
Share transactions for each class were as follows and may contain automatic conversions between classes or exchanges between affiliated funds:
| | Shares | Shares | Dollars | Dollars |
| | Year ended October 31, 2019 | Year ended October 31, 2018 | Year ended October 31, 2019 | Year ended October 31, 2018 |
| Emerging Markets | | | | |
| Shares sold | 64,449,799 | 49,869,535 | $1,867,496,661 | $1,579,168,818 |
| Reinvestment of distributions | 956,493 | 746,970 | 25,710,532 | 23,634,137 |
| Shares redeemed | (102,449,927)(a) | (44,964,469) | (2,985,928,831)(a) | (1,422,584,142) |
| Net increase (decrease) | (37,043,635) | 5,652,036 | $(1,092,721,638) | $180,218,813 |
| Class K | | | | |
| Shares sold | 7,052,169 | 12,153,123 | $210,813,709 | $380,393,513 |
| Reinvestment of distributions | 313,899 | 210,535 | 8,434,479 | 6,661,328 |
| Shares redeemed | (9,176,353) | (9,189,434) | (272,901,826) | (290,157,758) |
| Net increase (decrease) | (1,810,285) | 3,174,224 | $(53,653,638) | $96,897,083 |
(a) Amount includes in-kind redemptions (see the Affiliated Redemptions In-Kind note for additional details).
13. Other.
The Fund's organizational documents provide former and current trustees and officers with a limited indemnification against liabilities arising in connection with the performance of their duties to the Fund. In the normal course of business, the Fund may also enter into contracts that provide general indemnifications. The Fund's maximum exposure under these arrangements is unknown as this would be dependent on future claims that may be made against the Fund. The risk of material loss from such claims is considered remote.
Fidelity® Europe Fund
Performance: The Bottom Line
Average annual total return reflects the change in the value of an investment, assuming reinvestment of distributions from dividend income and capital gains (the profits earned upon the sale of securities that have grown in value, if any) and assuming a constant rate of performance each year. The hypothetical investment and the average annual total returns do not reflect the deduction of taxes that a shareholder would pay on fund distributions or the redemption of fund shares. During periods of reimbursement by Fidelity, a fund’s total return will be greater than it would be had the reimbursement not occurred. How a fund did yesterday is no guarantee of how it will do tomorrow.
Average Annual Total Returns
| For the periods ended October 31, 2019 | Past 1 year | Past 5 years | Past 10 years |
| Class A (incl. 5.75% sales charge) | 1.04% | 2.36% | 4.66% |
| Class M (incl. 3.50% sales charge) | 3.14% | 2.53% | 4.73% |
| Class C (incl. contingent deferred sales charge) | 5.39% | 2.76% | 4.82% |
| Fidelity® Europe Fund | 7.56% | 3.91% | 5.48% |
| Class I | 7.58% | 3.95% | 5.49% |
| Class Z | 7.68% | 3.96% | 5.50% |
Class A shares bear a 0.25% 12b-1 fee. The initial offering of Class A shares took place on March 18, 2014. Returns prior to March 18, 2014, are those of Fidelity® Europe Fund, the original class of the fund, which has no 12b-1 fee. Had Class A's 12b-1 fee been reflected, returns prior to March 18, 2014, would have been lower.
Class M shares bear a 0.50% 12b-1 fee. The initial offering of Class M shares took place on March 18,2014. Returns prior to March 18, 2014, are those of Fidelity® Europe Fund, the original class of the fund, which has no 12b-1 fee. Had Class M's 12b-1 fee been reflected, returns prior to March 18, 2014, would have been lower.
Class C shares bear a 1.00% 12b-1 fee. The initial offering of Class C shares took place on March 18, 2014. Returns prior to March 18, 2014, are those of Fidelity® Europe Fund, the original class of the fund, which has no 12b-1 fee. Had Class C's 12b-1 fee been reflected, returns prior to March 18, 2014, would have been lower.
Class C shares' contingent deferred sales charges included in the past one year, past five years and past ten years total return figures are 1%, 0% and 0%, respectively.
The initial offering of Class I shares took place on March 18, 2014. Returns prior to March 18, 2014 are those of Fidelity® Europe Fund, the original class of the fund.
The initial offering of Class Z shares took place on October 2, 2018. Returns prior to October 2, 2018, are those of Class I. Returns between March 18, 2014 and October 2, 2018, are those of Class I. Returns prior to March 18, 2014 are those of Fidelity® Europe Fund, the original class of the fund.
$10,000 Over 10 Years
Let's say hypothetically that $10,000 was invested in Fidelity® Europe Fund, a class of the fund, on October 31, 2009.
The chart shows how the value of your investment would have changed, and also shows how the MSCI Europe Index performed over the same period.
See above for additional information regarding the performance of Fidelity® Europe Fund.

| Period Ending Values |
| $17,042 | Fidelity® Europe Fund |
| $16,817 | MSCI Europe Index |
Fidelity® Europe Fund
Management's Discussion of Fund Performance
Market Recap: The MSCI ACWI (All Country World Index) ex USA Index gained 11.47% for the 12 months ending October 31, 2019, as international stocks reflected a confluence of factors, including escalating trade tension, and moderating but still positive global economic growth. Currency fluctuations were largely modest and varied by region, muting the overall impact on international equity returns. In late December, the U.S. Federal Reserve shifted from raising interest rates to a more dovish policy in 2019, joining many foreign central banks. In June, international stocks rose 6.03%, as policy stimulus in China stabilized that country’s economic growth. The Fed cut its policy rate in July for the first time since 2008. However, the index returned -1.21% for the month, followed by -3.08% in August. In September, the Fed cut its policy rate another quarter point, citing concerns about slowing economic growth and muted inflation, and did the same in October, leading to monthly gains of 2.59% and 3.49%, respectively. For the full 12 months, the growth-oriented information technology sector (+22%) led the way, followed by utilities (+20%) and real estate (+18%), two high-dividend-yielding categories. Conversely, energy was roughly flat, while materials (+6%) and communication services (7%) also lagged. By region, Asia Pacific ex Japan (+16%), Europe ex U.K (+13%), Canada (+12%) and emerging markets (+12%) fared best. Meanwhile, the U.K. (+7%) and Japan (+10%) trailed the broader market.
Comments from Portfolio Manager Andrew Sergeant: For the fiscal year, the fund's share classes (excluding sales charges, if applicable) gained roughly 6% to 8%, underperforming the 11.22% advance of the benchmark, the MSCI Europe Index. Despite signals of weakening economies, the European markets remained resilient. Increased volatility drove up prices for higher-quality, more-defensive stocks, especially in the utilities sector (+29%). Versus the MSCI index, stock selection detracted notably, especially in the industrials and consumer discretionary sectors. Among individual securities, the fund's sizable non-benchmark position in Kambi Group, a sports-betting infrastructure firm listed on Sweden's First North stock exchange, hurt more than any other fund holding. Headlines about Kambi potentially losing one of its most important clients triggered a sell-off of this stock. A non-benchmark position in Bertrandt, a research and development consultant to companies in the automobile industry, also detracted. On the upside, stock picking in financials and communication services contributed to the fund's relative return. A stake in Micro Focus International, a U.K.-based software firm, added more value than any other individual position. I sold the fund's stake in Micro Focus by period end to take profit.
The views expressed above reflect those of the portfolio manager(s) only through the end of the period as stated on the cover of this report and do not necessarily represent the views of Fidelity or any other person in the Fidelity organization. Any such views are subject to change at any time based upon market or other conditions and Fidelity disclaims any responsibility to update such views. These views may not be relied on as investment advice and, because investment decisions for a Fidelity fund are based on numerous factors, may not be relied on as an indication of trading intent on behalf of any Fidelity fund.
Fidelity® Europe Fund
Investment Summary (Unaudited)
Geographic Diversification (% of fund's net assets)
| As of October 31, 2019 |
| | United Kingdom | 31.2% |
| | Sweden | 12.2% |
| | Germany | 9.4% |
| | France | 7.8% |
| | Netherlands | 6.6% |
| | Denmark | 6.2% |
| | Switzerland | 5.6% |
| | Italy | 3.6% |
| | United States of America* | 3.4% |
| | Other | 14.0% |

* Includes Short-Term investments and Net Other Assets (Liabilities).
Percentages are based on country or territory of incorporation and are adjusted for the effect of futures contracts, if applicable.
Asset Allocation as of October 31, 2019
| | % of fund's net assets |
| Stocks | 97.7 |
| Short-Term Investments and Net Other Assets (Liabilities) | 2.3 |
Top Ten Stocks as of October 31, 2019
| | % of fund's net assets |
| Roche Holding AG (participation certificate) (Switzerland, Pharmaceuticals) | 4.1 |
| BP PLC (United Kingdom, Oil, Gas & Consumable Fuels) | 3.7 |
| Total SA (France, Oil, Gas & Consumable Fuels) | 3.1 |
| Unilever PLC (United Kingdom, Personal Products) | 3.0 |
| AstraZeneca PLC (United Kingdom) (United Kingdom, Pharmaceuticals) | 2.8 |
| SAP SE (Germany, Software) | 2.5 |
| Sanofi SA (France, Pharmaceuticals) | 2.3 |
| Lloyds Banking Group PLC (United Kingdom, Banks) | 2.3 |
| Swedbank AB (A Shares) (Sweden, Banks) | 2.2 |
| ASML Holding NV (Netherlands) (Netherlands, Semiconductors & Semiconductor Equipment) | 2.1 |
| | 28.1 |
Top Market Sectors as of October 31, 2019
| | % of fund's net assets |
| Financials | 20.6 |
| Industrials | 17.6 |
| Health Care | 11.7 |
| Consumer Staples | 11.7 |
| Information Technology | 8.0 |
| Energy | 7.2 |
| Consumer Discretionary | 6.9 |
| Materials | 5.6 |
| Communication Services | 4.2 |
| Real Estate | 2.9 |
Fidelity® Europe Fund
Schedule of Investments October 31, 2019
Showing Percentage of Net Assets
| Common Stocks - 96.5% | | | |
| | | Shares | Value |
| Austria - 1.2% | | | |
| Mayr-Melnhof Karton AG | | 85,100 | $10,459,306 |
| Bailiwick of Jersey - 1.3% | | | |
| Glencore Xstrata PLC | | 3,848,700 | 11,616,842 |
| Belgium - 1.6% | | | |
| KBC Groep NV | | 200,700 | 14,075,104 |
| Bermuda - 1.2% | | | |
| Vostok New Ventures Ltd. (depositary receipt) | | 1,745,431 | 10,936,398 |
| Denmark - 6.2% | | | |
| A.P. Moller - Maersk A/S Series B | | 12,912 | 16,470,578 |
| DSV A/S | | 115,100 | 11,168,418 |
| ORSTED A/S (a) | | 137,300 | 12,043,572 |
| Scandinavian Tobacco Group A/S (a) | | 721,700 | 8,527,282 |
| Vestas Wind Systems A/S | | 92,100 | 7,503,186 |
|
| TOTAL DENMARK | | | 55,713,036 |
|
| Finland - 2.8% | | | |
| Nokian Tyres PLC | | 474,200 | 13,539,207 |
| UPM-Kymmene Corp. | | 350,000 | 11,374,945 |
|
| TOTAL FINLAND | | | 24,914,152 |
|
| France - 7.8% | | | |
| Altarea SCA | | 19,896 | 4,371,431 |
| Capgemini SA | | 69,800 | 7,858,750 |
| Natixis SA | | 2,007,800 | 9,205,760 |
| Sanofi SA | | 229,000 | 21,110,859 |
| Total SA | | 522,707 | 27,634,602 |
|
| TOTAL FRANCE | | | 70,181,402 |
|
| Germany - 9.4% | | | |
| Bertrandt AG | | 182,700 | 9,118,498 |
| Deutsche Post AG | | 481,500 | 17,050,288 |
| Instone Real Estate Group BV (a)(b) | | 420,264 | 9,843,129 |
| JOST Werke AG (a) | | 234,900 | 6,601,996 |
| LEG Immobilien AG | | 83,947 | 9,634,125 |
| SAP SE | | 168,937 | 22,384,403 |
| Scout24 AG (a) | | 133,200 | 8,237,539 |
| WashTec AG | | 29,300 | 1,473,791 |
|
| TOTAL GERMANY | | | 84,343,769 |
|
| Ireland - 0.2% | | | |
| Irish Residential Properties REIT PLC | | 1,097,763 | 2,149,932 |
| Italy - 2.4% | | | |
| Prada SpA | | 2,537,100 | 8,722,219 |
| Recordati SpA | | 312,300 | 13,120,770 |
|
| TOTAL ITALY | | | 21,842,989 |
|
| Malta - 1.6% | | | |
| Kambi Group PLC (b) | | 873,759 | 14,433,398 |
| Netherlands - 6.6% | | | |
| ASML Holding NV (Netherlands) | | 72,900 | 19,108,155 |
| ASR Nederland NV | | 288,100 | 10,542,441 |
| Heineken NV (Bearer) | | 137,000 | 13,974,731 |
| Intertrust NV (a) | | 682,241 | 12,965,794 |
| Prosus NV (b) | | 45,700 | 3,151,426 |
|
| TOTAL NETHERLANDS | | | 59,742,547 |
|
| Norway - 2.1% | | | |
| Adevinta ASA: | | | |
| rights 11/12/19 (b) | | 111,150 | 16,994 |
| Class B | | 1,209,250 | 13,807,001 |
| Schibsted ASA (A Shares) | | 168,533 | 4,948,148 |
|
| TOTAL NORWAY | | | 18,772,143 |
|
| South Africa - 0.7% | | | |
| Naspers Ltd. Class N | | 45,700 | 6,466,944 |
| Spain - 1.3% | | | |
| Prosegur Cash SA (a) | | 7,417,400 | 11,581,677 |
| Sweden - 12.2% | | | |
| Arjo AB | | 2,411,884 | 9,931,596 |
| Dustin Group AB (a) | | 777,693 | 6,193,709 |
| Ericsson (B Shares) | | 1,887,100 | 16,490,972 |
| Essity AB Class B | | 331,000 | 10,328,645 |
| HEXPOL AB (B Shares) | | 655,400 | 5,837,422 |
| Indutrade AB | | 208,400 | 6,414,499 |
| Investor AB (B Shares) (c) | | 219,471 | 11,239,828 |
| Securitas AB (B Shares) | | 699,200 | 11,180,596 |
| Swedbank AB (A Shares) | | 1,393,200 | 19,486,071 |
| Swedish Match Co. AB | | 267,800 | 12,569,463 |
|
| TOTAL SWEDEN | | | 109,672,801 |
|
| Switzerland - 5.6% | | | |
| Julius Baer Group Ltd. | | 303,610 | 13,444,953 |
| Roche Holding AG (participation certificate) | | 121,140 | 36,457,805 |
|
| TOTAL SWITZERLAND | | | 49,902,758 |
|
| United Kingdom - 31.2% | | | |
| Aggreko PLC | | 1,107,578 | 11,345,617 |
| AstraZeneca PLC (United Kingdom) | | 259,100 | 25,266,724 |
| Avon Rubber PLC | | 80,799 | 1,858,815 |
| BP PLC | | 5,278,429 | 33,472,444 |
| Close Brothers Group PLC | | 581,900 | 10,424,558 |
| Cranswick PLC | | 386,882 | 15,555,621 |
| Diageo PLC | | 399,700 | 16,360,112 |
| John Wood Group PLC | | 858,300 | 3,761,216 |
| Keywords Studios PLC | | 426,736 | 6,135,774 |
| Lloyds Banking Group PLC | | 27,754,235 | 20,416,230 |
| London Stock Exchange Group PLC | | 73,000 | 6,578,675 |
| M&G PLC (b) | | 1,031,484 | 2,856,652 |
| Prudential PLC | | 803,684 | 14,037,818 |
| Rightmove PLC | | 1,325,800 | 10,280,207 |
| Rolls-Royce Holdings PLC (b) | | 64,892,200 | 84,058 |
| Rolls-Royce Holdings PLC | | 1,410,700 | 12,980,906 |
| Rotork PLC | | 2,224,100 | 8,683,298 |
| Sabre Insurance Group PLC (a) | | 3,300,000 | 12,610,232 |
| St. James's Place Capital PLC | | 944,900 | 12,741,592 |
| Standard Life PLC | | 3,961,875 | 15,575,665 |
| The Weir Group PLC | | 373,622 | 6,516,673 |
| Unilever PLC | | 450,400 | 26,968,850 |
| Volution Group PLC | | 1,994,243 | 5,153,569 |
|
| TOTAL UNITED KINGDOM | | | 279,665,306 |
|
| United States of America - 1.1% | | | |
| Autoliv, Inc. (depositary receipt) | | 126,400 | 9,870,398 |
| TOTAL COMMON STOCKS | | | |
| (Cost $869,362,742) | | | 866,340,902 |
|
| Nonconvertible Preferred Stocks - 1.2% | | | |
| Italy - 1.2% | | | |
| Buzzi Unicem SpA (Risparmio Shares) | | | |
| (Cost $7,694,002) | | 702,780 | 10,753,881 |
|
| Money Market Funds - 2.3% | | | |
| Fidelity Cash Central Fund 1.83% (d) | | 18,605,358 | 18,609,079 |
| Fidelity Securities Lending Cash Central Fund 1.84% (d)(e) | | 1,632,147 | 1,632,310 |
| TOTAL MONEY MARKET FUNDS | | | |
| (Cost $20,241,389) | | | 20,241,389 |
| TOTAL INVESTMENT IN SECURITIES - 100.0% | | | |
| (Cost $897,298,133) | | | 897,336,172 |
| NET OTHER ASSETS (LIABILITIES) - 0.0% | | | 306,752 |
| NET ASSETS - 100% | | | $897,642,924 |
Categorizations in the Schedule of Investments are based on country or territory of incorporation.
Legend
(a) Security exempt from registration under Rule 144A of the Securities Act of 1933. These securities may be resold in transactions exempt from registration, normally to qualified institutional buyers. At the end of the period, the value of these securities amounted to $88,604,930 or 9.9% of net assets.
(b) Non-income producing
(c) Security or a portion of the security is on loan at period end.
(d) Affiliated fund that is generally available only to investment companies and other accounts managed by Fidelity Investments. The rate quoted is the annualized seven-day yield of the fund at period end. A complete unaudited listing of the fund's holdings as of its most recent quarter end is available upon request. In addition, each Fidelity Central Fund's financial statements, which are not covered by the Fund's Report of Independent Registered Public Accounting Firm, are available on the SEC's website or upon request.
(e) Investment made with cash collateral received from securities on loan.
Affiliated Central Funds
Information regarding fiscal year to date income earned by the Fund from investments in Fidelity Central Funds is as follows:
| Fund | Income earned |
| Fidelity Cash Central Fund | $187,484 |
| Fidelity Securities Lending Cash Central Fund | 441,526 |
| Total | $629,010 |
Amounts in the income column in the above table include any capital gain distributions from underlying funds, which are presented in the corresponding line-item in the Statement of Operations, if applicable. Amount for Fidelity Securities Lending Cash Central Fund represents the income earned on investing cash collateral, less rebates paid to borrowers and any lending agent fees associated with the loan, plus any premium payments received for lending certain types of securities.
Investment Valuation
The following is a summary of the inputs used, as of October 31, 2019, involving the Fund's assets and liabilities carried at fair value. The inputs or methodology used for valuing securities may not be an indication of the risk associated with investing in those securities. For more information on valuation inputs, and their aggregation into the levels used below, please refer to the Investment Valuation section in the accompanying Notes to Financial Statements.
| | Valuation Inputs at Reporting Date: |
| Description | Total | Level 1 | Level 2 | Level 3 |
| Investments in Securities: | | | | |
| Equities: | | | | |
| Communication Services | $37,289,889 | $37,289,889 | $-- | $-- |
| Consumer Discretionary | 62,377,301 | 47,188,138 | 15,189,163 | -- |
| Consumer Staples | 104,284,704 | 87,924,592 | 16,360,112 | -- |
| Energy | 64,868,262 | 3,761,216 | 61,107,046 | -- |
| Financials | 184,171,977 | 129,694,301 | 54,477,676 | -- |
| Health Care | 105,887,754 | 23,052,366 | 82,835,388 | -- |
| Industrials | 158,152,257 | 121,197,587 | 36,954,670 | -- |
| Information Technology | 71,978,054 | 13,994,524 | 57,983,530 | -- |
| Materials | 50,042,396 | 38,425,554 | 11,616,842 | -- |
| Real Estate | 25,998,617 | 25,998,617 | -- | -- |
| Utilities | 12,043,572 | 12,043,572 | -- | -- |
| Money Market Funds | 20,241,389 | 20,241,389 | -- | -- |
| Total Investments in Securities: | $897,336,172 | $560,811,745 | $336,524,427 | $-- |
See accompanying notes which are an integral part of the financial statements.
Fidelity® Europe Fund
Financial Statements
Statement of Assets and Liabilities
| | | October 31, 2019 |
| Assets | | |
Investment in securities, at value (including securities loaned of $1,550,076) — See accompanying schedule:
Unaffiliated issuers (cost $877,056,744) | $877,094,783 | |
| Fidelity Central Funds (cost $20,241,389) | 20,241,389 | |
| Total Investment in Securities (cost $897,298,133) | | $897,336,172 |
| Receivable for investments sold | | 188,906 |
| Receivable for fund shares sold | | 135,761 |
| Dividends receivable | | 3,007,054 |
| Distributions receivable from Fidelity Central Funds | | 10,280 |
| Prepaid expenses | | 1,719 |
| Other receivables | | 1,724 |
| Total assets | | 900,681,616 |
| Liabilities | | |
| Payable for investments purchased | $346,786 | |
| Payable for fund shares redeemed | 415,762 | |
| Accrued management fee | 373,485 | |
| Distribution and service plan fees payable | 11,717 | |
| Other affiliated payables | 161,078 | |
| Other payables and accrued expenses | 97,554 | |
| Collateral on securities loaned | 1,632,310 | |
| Total liabilities | | 3,038,692 |
| Net Assets | | $897,642,924 |
| Net Assets consist of: | | |
| Paid in capital | | $836,536,820 |
| Total accumulated earnings (loss) | | 61,106,104 |
| Net Assets | | $897,642,924 |
| Net Asset Value and Maximum Offering Price | | |
| Class A: | | |
| Net Asset Value and redemption price per share ($20,818,743 ÷ 573,564 shares)(a) | | $36.30 |
| Maximum offering price per share (100/94.25 of $36.30) | | $38.51 |
| Class M: | | |
| Net Asset Value and redemption price per share ($5,781,564 ÷ 159,186 shares)(a) | | $36.32 |
| Maximum offering price per share (100/96.50 of $36.32) | | $37.64 |
| Class C: | | |
| Net Asset Value and offering price per share ($6,144,882 ÷ 171,293 shares)(a) | | $35.87 |
| Europe: | | |
| Net Asset Value, offering price and redemption price per share ($836,373,184 ÷ 23,054,921 shares) | | $36.28 |
| Class I: | | |
| Net Asset Value, offering price and redemption price per share ($6,686,353 ÷ 184,370 shares) | | $36.27 |
| Class Z: | | |
| Net Asset Value, offering price and redemption price per share ($21,838,198 ÷ 603,048 shares) | | $36.21 |
(a) Redemption price per share is equal to net asset value less any applicable contingent deferred sales charge.
See accompanying notes which are an integral part of the financial statements.
Statement of Operations
| | | Year ended October 31, 2019 |
| Investment Income | | |
| Dividends | | $35,169,851 |
| Non-Cash dividends | | 14,080,867 |
| Income from Fidelity Central Funds (including $441,526 from security lending) | | 629,010 |
| Income before foreign taxes withheld | | 49,879,728 |
| Less foreign taxes withheld | | (2,759,146) |
| Total income | | 47,120,582 |
| Expenses | | |
| Management fee | | |
| Basic fee | $6,375,611 | |
| Performance adjustment | (1,515,239) | |
| Transfer agent fees | 1,634,022 | |
| Distribution and service plan fees | 159,993 | |
| Accounting and security lending fees | 436,998 | |
| Custodian fees and expenses | 68,581 | |
| Independent trustees' fees and expenses | 5,334 | |
| Registration fees | 101,761 | |
| Audit | 89,048 | |
| Legal | 4,070 | |
| Interest | 2,236 | |
| Miscellaneous | 6,861 | |
| Total expenses before reductions | 7,369,276 | |
| Expense reductions | (219,422) | |
| Total expenses after reductions | | 7,149,854 |
| Net investment income (loss) | | 39,970,728 |
| Realized and Unrealized Gain (Loss) | | |
| Net realized gain (loss) on: | | |
| Investment securities: | | |
| Unaffiliated issuers | 30,389,480 | |
| Fidelity Central Funds | (1,140) | |
| Foreign currency transactions | (310,408) | |
| Total net realized gain (loss) | | 30,077,932 |
| Change in net unrealized appreciation (depreciation) on: | | |
| Investment securities: | | |
| Unaffiliated issuers | (5,100,958) | |
| Assets and liabilities in foreign currencies | 62,860 | |
| Total change in net unrealized appreciation (depreciation) | | (5,038,098) |
| Net gain (loss) | | 25,039,834 |
| Net increase (decrease) in net assets resulting from operations | | $65,010,562 |
See accompanying notes which are an integral part of the financial statements.
Statement of Changes in Net Assets
| | Year ended October 31, 2019 | Year ended October 31, 2018 |
| Increase (Decrease) in Net Assets | | |
| Operations | | |
| Net investment income (loss) | $39,970,728 | $13,390,463 |
| Net realized gain (loss) | 30,077,932 | 96,763,866 |
| Change in net unrealized appreciation (depreciation) | (5,038,098) | (208,563,140) |
| Net increase (decrease) in net assets resulting from operations | 65,010,562 | (98,408,811) |
| Distributions to shareholders | (96,043,890) | (31,260,216) |
| Share transactions - net increase (decrease) | (57,264,097) | (276,592,457) |
| Total increase (decrease) in net assets | (88,297,425) | (406,261,484) |
| Net Assets | | |
| Beginning of period | 985,940,349 | 1,392,201,833 |
| End of period | $897,642,924 | $985,940,349 |
See accompanying notes which are an integral part of the financial statements.
Financial Highlights
Fidelity Europe Fund Class A
| Years ended October 31, | 2019 | 2018 | 2017 | 2016 | 2015 |
| Selected Per–Share Data | | | | | |
| Net asset value, beginning of period | $37.61 | $42.47 | $34.17 | $37.06 | $36.24 |
| Income from Investment Operations | | | | | |
| Net investment income (loss)A | 1.41B | .34 | .26 | .22 | .37 |
| Net realized and unrealized gain (loss) | .82 | (4.21)C | 8.39 | (2.67) | 1.29 |
| Total from investment operations | 2.23 | (3.87) | 8.65 | (2.45) | 1.66 |
| Distributions from net investment income | (.11) | (.33) | (.22) | (.29) | (.84) |
| Distributions from net realized gain | (3.43) | (.66) | (.13) | (.15) | – |
| Total distributions | (3.54) | (.99) | (.35) | (.44) | (.84) |
| Redemption fees added to paid in capitalA | – | – | –D | –D | –D |
| Net asset value, end of period | $36.30 | $37.61 | $42.47 | $34.17 | $37.06 |
| Total ReturnE,F,G | 7.21% | (9.31)%C | 25.61% | (6.69)% | 4.63% |
| Ratios to Average Net AssetsH,I | | | | | |
| Expenses before reductions | 1.09% | 1.28% | 1.32% | 1.39% | 1.33% |
| Expenses net of fee waivers, if any | 1.09% | 1.28% | 1.32% | 1.39% | 1.33% |
| Expenses net of all reductions | 1.07% | 1.28% | 1.28% | 1.38% | 1.31% |
| Net investment income (loss) | 4.02%B | .82% | .70% | .62% | .98% |
| Supplemental Data | | | | | |
| Net assets, end of period (000 omitted) | $20,819 | $19,531 | $20,925 | $17,267 | $23,381 |
| Portfolio turnover rateJ | 45% | 57% | 73% | 62% | 87% |
A Calculated based on average shares outstanding during the period.
B Net investment income per share reflects a large, non-recurring dividend which amounted to $.20 per share. Excluding this non-recurring dividend, the ratio of net investment income (loss) to average net assets would have been 3.44%.
C Net realized and unrealized gain (loss) per share reflects proceeds received from litigation which amounted to $.18 per share. Excluding these litigation proceeds, the total return would have been (9.74) %.
D Amount represents less than $.005 per share.
E Total returns for periods of less than one year are not annualized.
F Total returns would have been lower if certain expenses had not been reduced during the applicable periods shown.
G Total returns do not include the effect of the sales charges.
H Fees and expenses of any underlying Fidelity Central Funds are not included in the Fund's expense ratio. The Fund indirectly bears its proportionate share of the expenses of any underlying Fidelity Central Funds.
I Expense ratios reflect operating expenses of the class. Expenses before reductions do not reflect amounts reimbursed by the investment adviser or reductions from brokerage service arrangements or reductions from other expense offset arrangements and do not represent the amount paid by the class during periods when reimbursements or reductions occur. Expense ratios before reductions for start-up periods may not be representative of longer-term operating periods. Expenses net of fee waivers reflect expenses after reimbursement by the investment adviser but prior to reductions from brokerage service arrangements or other expense offset arrangements. Expenses net of all reductions represent the net expenses paid by the class.
J Amount does not include the portfolio activity of any underlying Fidelity Central Funds.
See accompanying notes which are an integral part of the financial statements.
Fidelity Europe Fund Class M
| Years ended October 31, | 2019 | 2018 | 2017 | 2016 | 2015 |
| Selected Per–Share Data | | | | | |
| Net asset value, beginning of period | $37.57 | $42.47 | $34.13 | $36.94 | $36.18 |
| Income from Investment Operations | | | | | |
| Net investment income (loss)A | 1.30B | .21 | .15 | .11 | .26 |
| Net realized and unrealized gain (loss) | .83 | (4.23)C | 8.41 | (2.67) | 1.29 |
| Total from investment operations | 2.13 | (4.02) | 8.56 | (2.56) | 1.55 |
| Distributions from net investment income | – | (.23) | (.09) | (.09) | (.79) |
| Distributions from net realized gain | (3.38) | (.66) | (.13) | (.15) | – |
| Total distributions | (3.38) | (.88)D | (.22) | (.25)E | (.79) |
| Redemption fees added to paid in capitalA | – | – | –F | –F | –F |
| Net asset value, end of period | $36.32 | $37.57 | $42.47 | $34.13 | $36.94 |
| Total ReturnG,H,I | 6.88% | (9.63)%C | 25.25% | (6.99)% | 4.33% |
| Ratios to Average Net AssetsJ,K | | | | | |
| Expenses before reductions | 1.41% | 1.61% | 1.63% | 1.70% | 1.61% |
| Expenses net of fee waivers, if any | 1.40% | 1.61% | 1.63% | 1.70% | 1.61% |
| Expenses net of all reductions | 1.38% | 1.61% | 1.59% | 1.68% | 1.59% |
| Net investment income (loss) | 3.70%B | .50% | .39% | .31% | .70% |
| Supplemental Data | | | | | |
| Net assets, end of period (000 omitted) | $5,782 | $7,257 | $8,874 | $6,980 | $9,632 |
| Portfolio turnover rateL | 45% | 57% | 73% | 62% | 87% |
A Calculated based on average shares outstanding during the period.
B Net investment income per share reflects a large, non-recurring dividend which amounted to $.20 per share. Excluding this non-recurring dividend, the ratio of net investment income (loss) to average net assets would have been 3.12%.
C Net realized and unrealized gain (loss) per share reflects proceeds received from litigation which amounted to $.18 per share. Excluding these litigation proceeds, the total return would have been (10.06)%.
D Total distributions of $.88 per share is comprised of distributions from net investment income of $.227 and distributions from net realized gain of $.657 per share.
E Total distributions of $.25 per share is comprised of distributions from net investment income of $.092 and distributions from net realized gain of $.154 per share.
F Amount represents less than $.005 per share.
G Total returns for periods of less than one year are not annualized.
H Total returns would have been lower if certain expenses had not been reduced during the applicable periods shown.
I Total returns do not include the effect of the sales charges.
J Fees and expenses of any underlying Fidelity Central Funds are not included in the Fund's expense ratio. The Fund indirectly bears its proportionate share of the expenses of any underlying Fidelity Central Funds.
K Expense ratios reflect operating expenses of the class. Expenses before reductions do not reflect amounts reimbursed by the investment adviser or reductions from brokerage service arrangements or reductions from other expense offset arrangements and do not represent the amount paid by the class during periods when reimbursements or reductions occur. Expense ratios before reductions for start-up periods may not be representative of longer-term operating periods. Expenses net of fee waivers reflect expenses after reimbursement by the investment adviser but prior to reductions from brokerage service arrangements or other expense offset arrangements. Expenses net of all reductions represent the net expenses paid by the class.
L Amount does not include the portfolio activity of any underlying Fidelity Central Funds.
See accompanying notes which are an integral part of the financial statements.
Fidelity Europe Fund Class C
| Years ended October 31, | 2019 | 2018 | 2017 | 2016 | 2015 |
| Selected Per–Share Data | | | | | |
| Net asset value, beginning of period | $37.23 | $42.15 | $33.82 | $36.81 | $36.07 |
| Income from Investment Operations | | | | | |
| Net investment income (loss)A | 1.12B | .02 | (.03) | (.06) | .07 |
| Net realized and unrealized gain (loss) | .82 | (4.18)C | 8.36 | (2.65) | 1.29 |
| Total from investment operations | 1.94 | (4.16) | 8.33 | (2.71) | 1.36 |
| Distributions from net investment income | – | (.10) | – | (.12) | (.62) |
| Distributions from net realized gain | (3.30) | (.66) | – | (.15) | – |
| Total distributions | (3.30) | (.76) | – | (.28)D | (.62) |
| Redemption fees added to paid in capitalA | – | – | –E | –E | –E |
| Net asset value, end of period | $35.87 | $37.23 | $42.15 | $33.82 | $36.81 |
| Total ReturnF,G,H | 6.35% | (10.04)%C | 24.63% | (7.43)% | 3.79% |
| Ratios to Average Net AssetsI,J | | | | | |
| Expenses before reductions | 1.90% | 2.06% | 2.11% | 2.18% | 2.13% |
| Expenses net of fee waivers, if any | 1.90% | 2.06% | 2.11% | 2.18% | 2.13% |
| Expenses net of all reductions | 1.87% | 2.06% | 2.07% | 2.17% | 2.11% |
| Net investment income (loss) | 3.21%B | .04% | (.09)% | (.17)% | .18% |
| Supplemental Data | | | | | |
| Net assets, end of period (000 omitted) | $6,145 | $10,060 | $10,721 | $9,007 | $11,151 |
| Portfolio turnover rateK | 45% | 57% | 73% | 62% | 87% |
A Calculated based on average shares outstanding during the period.
B Net investment income per share reflects a large, non-recurring dividend which amounted to $.20 per share. Excluding this non-recurring dividend, the ratio of net investment income (loss) to average net assets would have been 2.63%.
C Net realized and unrealized gain (loss) per share reflects proceeds received from litigation which amounted to $.18 per share. Excluding these litigation proceeds, the total return would have been (10.47)%
D Total distributions of $.28 per share is comprised of distributions from net investment income of $.123 and distributions from net realized gain of $.154 per share.
E Amount represents less than $.005 per share.
F Total returns for periods of less than one year are not annualized.
G Total returns would have been lower if certain expenses had not been reduced during the applicable periods shown.
H Total returns do not include the effect of the contingent deferred sales charge.
I Fees and expenses of any underlying Fidelity Central Funds are not included in the Fund's expense ratio. The Fund indirectly bears its proportionate share of the expenses of any underlying Fidelity Central Funds.
J Expense ratios reflect operating expenses of the class. Expenses before reductions do not reflect amounts reimbursed by the investment adviser or reductions from brokerage service arrangements or reductions from other expense offset arrangements and do not represent the amount paid by the class during periods when reimbursements or reductions occur. Expense ratios before reductions for start-up periods may not be representative of longer-term operating periods. Expenses net of fee waivers reflect expenses after reimbursement by the investment adviser but prior to reductions from brokerage service arrangements or other expense offset arrangements. Expenses net of all reductions represent the net expenses paid by the class.
K Amount does not include the portfolio activity of any underlying Fidelity Central Funds.
See accompanying notes which are an integral part of the financial statements.
Fidelity Europe Fund
| Years ended October 31, | 2019 | 2018 | 2017 | 2016 | 2015 |
| Selected Per–Share Data | | | | | |
| Net asset value, beginning of period | $37.70 | $42.53 | $34.26 | $37.19 | $36.32 |
| Income from Investment Operations | | | | | |
| Net investment income (loss)A | 1.52B | .48 | .38 | .33 | .48 |
| Net realized and unrealized gain (loss) | .81 | (4.24)C | 8.40 | (2.68) | 1.30 |
| Total from investment operations | 2.33 | (3.76) | 8.78 | (2.35) | 1.78 |
| Distributions from net investment income | (.32) | (.41) | (.38) | (.43) | (.91) |
| Distributions from net realized gain | (3.43) | (.66) | (.13) | (.15) | – |
| Total distributions | (3.75) | (1.07) | (.51) | (.58) | (.91) |
| Redemption fees added to paid in capitalA | – | – | –D | –D | –D |
| Net asset value, end of period | $36.28 | $37.70 | $42.53 | $34.26 | $37.19 |
| Total ReturnE | 7.56% | (9.05)%C | 26.05% | (6.42)% | 4.97% |
| Ratios to Average Net AssetsF,G | | | | | |
| Expenses before reductions | .78% | .96% | 1.00% | 1.07% | 1.03% |
| Expenses net of fee waivers, if any | .77% | .96% | 1.00% | 1.07% | 1.03% |
| Expenses net of all reductions | .75% | .96% | .96% | 1.06% | 1.01% |
| Net investment income (loss) | 4.33%B | 1.14% | 1.02% | .94% | 1.28% |
| Supplemental Data | | | | | |
| Net assets, end of period (000 omitted) | $836,373 | $941,670 | $1,343,213 | $1,066,488 | $1,384,134 |
| Portfolio turnover rateH | 45% | 57% | 73% | 62% | 87% |
A Calculated based on average shares outstanding during the period.
B Net investment income per share reflects a large, non-recurring dividend which amounted to $.20 per share. Excluding this non-recurring dividend, the ratio of net investment income (loss) to average net assets would have been 3.75%.
C Net realized and unrealized gain (loss) per share reflects proceeds received from litigation which amounted to $.18 per share. Excluding these litigation proceeds, the total return would have been (9.48)%.
D Amount represents less than $.005 per share.
E Total returns would have been lower if certain expenses had not been reduced during the applicable periods shown.
F Fees and expenses of any underlying Fidelity Central Funds are not included in the Fund's expense ratio. The Fund indirectly bears its proportionate share of the expenses of any underlying Fidelity Central Funds.
G Expense ratios reflect operating expenses of the class. Expenses before reductions do not reflect amounts reimbursed by the investment adviser or reductions from brokerage service arrangements or reductions from other expense offset arrangements and do not represent the amount paid by the class during periods when reimbursements or reductions occur. Expenses net of fee waivers reflect expenses after reimbursement by the investment adviser but prior to reductions from brokerage service arrangements or other expense offset arrangements. Expenses net of all reductions represent the net expenses paid by the class.
H Amount does not include the portfolio activity of any underlying Fidelity Central Funds.
See accompanying notes which are an integral part of the financial statements.
Fidelity Europe Fund Class I
| Years ended October 31, | 2019 | 2018 | 2017 | 2016 | 2015 |
| Selected Per–Share Data | | | | | |
| Net asset value, beginning of period | $37.69 | $42.53 | $34.29 | $37.21 | $36.32 |
| Income from Investment Operations | | | | | |
| Net investment income (loss)A | 1.53B | .48 | .39 | .35 | .50 |
| Net realized and unrealized gain (loss) | .80 | (4.23)C | 8.38 | (2.67) | 1.30 |
| Total from investment operations | 2.33 | (3.75) | 8.77 | (2.32) | 1.80 |
| Distributions from net investment income | (.32) | (.43) | (.41) | (.45) | (.91) |
| Distributions from net realized gain | (3.43) | (.66) | (.13) | (.15) | – |
| Total distributions | (3.75) | (1.09) | (.53)D | (.60) | (.91) |
| Redemption fees added to paid in capitalA | – | – | –E | –E | –E |
| Net asset value, end of period | $36.27 | $37.69 | $42.53 | $34.29 | $37.21 |
| Total ReturnF,G | 7.58% | (9.02)%C | 26.04% | (6.33)% | 5.02% |
| Ratios to Average Net AssetsH,I | | | | | |
| Expenses before reductions | .75% | .95% | .98% | 1.01% | .98% |
| Expenses net of fee waivers, if any | .74% | .95% | .98% | 1.01% | .98% |
| Expenses net of all reductions | .72% | .95% | .94% | 1.00% | .96% |
| Net investment income (loss) | 4.36%B | 1.16% | 1.04% | 1.00% | 1.33% |
| Supplemental Data | | | | | |
| Net assets, end of period (000 omitted) | $6,686 | $7,318 | $8,469 | $5,340 | $6,552 |
| Portfolio turnover rateJ | 45% | 57% | 73% | 62% | 87% |
A Calculated based on average shares outstanding during the period.
B Net investment income per share reflects a large, non-recurring dividend which amounted to $.20 per share. Excluding this non-recurring dividend, the ratio of net investment income (loss) to average net assets would have been 3.78%.
C Net realized and unrealized gain (loss) per share reflects proceeds received from litigation which amounted to $.18 per share. Excluding these litigation proceeds, the total return would have been (9.45)%.
D Total distributions of $.53 per share is comprised of distributions from net investment income of $.408 and distributions from net realized gain of $.126 per share.
E Amount represents less than $.005 per share.
F Total returns for periods of less than one year are not annualized.
G Total returns would have been lower if certain expenses had not been reduced during the applicable periods shown.
H Fees and expenses of any underlying Fidelity Central Funds are not included in the Fund's expense ratio. The Fund indirectly bears its proportionate share of the expenses of any underlying Fidelity Central Funds.
I Expense ratios reflect operating expenses of the class. Expenses before reductions do not reflect amounts reimbursed by the investment adviser or reductions from brokerage service arrangements or reductions from other expense offset arrangements and do not represent the amount paid by the class during periods when reimbursements or reductions occur. Expense ratios before reductions for start-up periods may not be representative of longer-term operating periods. Expenses net of fee waivers reflect expenses after reimbursement by the investment adviser but prior to reductions from brokerage service arrangements or other expense offset arrangements. Expenses net of all reductions represent the net expenses paid by the class.
J Amount does not include the portfolio activity of any underlying Fidelity Central Funds.
See accompanying notes which are an integral part of the financial statements.
Fidelity Europe Fund Class Z
| Years ended October 31, | 2019 | 2018 A |
| Selected Per–Share Data | | |
| Net asset value, beginning of period | $37.69 | $41.00 |
| Income from Investment Operations | | |
| Net investment income (loss)B | 1.53C | .06 |
| Net realized and unrealized gain (loss) | .82 | (3.37)D |
| Total from investment operations | 2.35 | (3.31) |
| Distributions from net investment income | (.41) | – |
| Distributions from net realized gain | (3.43) | – |
| Total distributions | (3.83)E | – |
| Net asset value, end of period | $36.21 | $37.69 |
| Total ReturnF,G | 7.71% | (8.07)%D |
| Ratios to Average Net AssetsH,I | | |
| Expenses before reductions | .65% | .91%J |
| Expenses net of fee waivers, if any | .64% | .90%J |
| Expenses net of all reductions | .62% | .90%J |
| Net investment income (loss) | 4.46%C | 2.04%J |
| Supplemental Data | | |
| Net assets, end of period (000 omitted) | $21,838 | $104 |
| Portfolio turnover rateK | 45% | 57% |
A For the period October 2, 2018 (commencement of sale of shares) to October 31, 2018.
B Calculated based on average shares outstanding during the period.
C Net investment income per share reflects a large, non-recurring dividend which amounted to $.20 per share. Excluding this non-recurring dividend, the ratio of net investment income (loss) to average net assets would have been 3.88%.
D Net realized and unrealized gain (loss) per share reflects proceeds received from litigation which amounted to $.16 per share. Excluding these litigation proceeds, the total return would have been (8.50)%.
E Total distributions of $3.83 per share is comprised of distributions from net investment income of $.405 and distributions from net realized gain of $3.427 per share.
F Total returns for periods of less than one year are not annualized.
G Total returns would have been lower if certain expenses had not been reduced during the applicable periods shown.
H Fees and expenses of any underlying Fidelity Central Funds are not included in the Fund's expense ratio. The Fund indirectly bears its proportionate share of the expenses of any underlying Fidelity Central Funds.
I Expense ratios reflect operating expenses of the class. Expenses before reductions do not reflect amounts reimbursed by the investment adviser or reductions from brokerage service arrangements or reductions from other expense offset arrangements and do not represent the amount paid by the class during periods when reimbursements or reductions occur. Expense ratios before reductions for start-up periods may not be representative of longer-term operating periods. Expenses net of fee waivers reflect expenses after reimbursement by the investment adviser but prior to reductions from brokerage service arrangements or other expense offset arrangements. Expenses net of all reductions represent the net expenses paid by the class.
J Annualized
K Amount does not include the portfolio activity of any underlying Fidelity Central Funds.
See accompanying notes which are an integral part of the financial statements.
Notes to Financial Statements
For the period ended October 31, 2019
1. Organization.
Fidelity Europe Fund (the Fund) is a fund of Fidelity Investment Trust (the Trust) and is authorized to issue an unlimited number of shares. The Trust is registered under the Investment Company Act of 1940, as amended (the 1940 Act), as an open-end management investment company organized as a Massachusetts business trust. The Fund offers Class A, Class M, Class C, Europe, Class I and Class Z shares, each of which has equal rights as to assets and voting privileges. Each class has exclusive voting rights with respect to matters that affect that class. Effective March 1, 2019, Class C shares will automatically convert to Class A shares after a holding period of ten years from the initial date of purchase, with certain exceptions.
2. Investments in Fidelity Central Funds.
The Fund invests in Fidelity Central Funds, which are open-end investment companies generally available only to other investment companies and accounts managed by the investment adviser and its affiliates. The Fund's Schedule of Investments lists each of the Fidelity Central Funds held as of period end, if any, as an investment of the Fund, but does not include the underlying holdings of each Fidelity Central Fund. As an Investing Fund, the Fund indirectly bears its proportionate share of the expenses of the underlying Fidelity Central Funds.
The Money Market Central Funds seek preservation of capital and current income and are managed by Fidelity Investments Money Management, Inc. (FIMM), an affiliate of the investment adviser. Annualized expenses of the Money Market Central Funds as of their most recent shareholder report date ranged from less than .005% to .01%.
A complete unaudited list of holdings for each Fidelity Central Fund is available upon request or at the Securities and Exchange Commission (the SEC) website at www.sec.gov. In addition, the financial statements of the Fidelity Central Funds, which are not covered by the Fund's Report of Independent Registered Public Accounting Firm, are available on the SEC website or upon request.
3. Significant Accounting Policies.
The Fund is an investment company and applies the accounting and reporting guidance of the Financial Accounting Standards Board (FASB) Accounting Standards Codification Topic 946 Financial Services – Investments Companies. The financial statements have been prepared in conformity with accounting principles generally accepted in the United States of America (GAAP), which require management to make certain estimates and assumptions at the date of the financial statements. Actual results could differ from those estimates. Subsequent events, if any, through the date that the financial statements were issued have been evaluated in the preparation of the financial statements. The following summarizes the significant accounting policies of the Fund:
Investment Valuation. Investments are valued as of 4:00 p.m. Eastern time on the last calendar day of the period. The Board of Trustees (the Board) has delegated the day to day responsibility for the valuation of the Fund's investments to the Fair Value Committee (the Committee) established by the Fund's investment adviser. In accordance with valuation policies and procedures approved by the Board, the Fund attempts to obtain prices from one or more third party pricing vendors or brokers to value its investments. When current market prices, quotations or currency exchange rates are not readily available or reliable, investments will be fair valued in good faith by the Committee, in accordance with procedures adopted by the Board. Factors used in determining fair value vary by investment type and may include market or investment specific events. The frequency with which these procedures are used cannot be predicted and they may be utilized to a significant extent. The Committee oversees the Fund's valuation policies and procedures and reports to the Board on the Committee's activities and fair value determinations. The Board monitors the appropriateness of the procedures used in valuing the Fund's investments and ratifies the fair value determinations of the Committee.
The Fund categorizes the inputs to valuation techniques used to value its investments into a disclosure hierarchy consisting of three levels as shown below:
- Level 1 – quoted prices in active markets for identical investments
- Level 2 – other significant observable inputs (including quoted prices for similar investments, interest rates, prepayment speeds, etc.)
- Level 3 – unobservable inputs (including the Fund's own assumptions based on the best information available)
Valuation techniques used to value the Fund's investments by major category are as follows:
Equity securities, including restricted securities, for which market quotations are readily available, are valued at the last reported sale price or official closing price as reported by a third party pricing vendor on the primary market or exchange on which they are traded and are categorized as Level 1 in the hierarchy. In the event there were no sales during the day or closing prices are not available, securities are valued at the last quoted bid price or may be valued using the last available price and are generally categorized as Level 2 in the hierarchy. For foreign equity securities, when market or security specific events arise, comparisons to the valuation of American Depositary Receipts (ADRs), futures contracts, Exchange-Traded Funds (ETFs) and certain indexes as well as quoted prices for similar securities may be used and would be categorized as Level 2 in the hierarchy. For equity securities, including restricted securities, where observable inputs are limited, assumptions about market activity and risk are used and these securities may be categorized as Level 3 in the hierarchy.
Investments in open-end mutual funds, including the Fidelity Central Funds, are valued at their closing net asset value (NAV) each business day and are categorized as Level 1 in the hierarchy.
Changes in valuation techniques may result in transfers in or out of an assigned level within the disclosure hierarchy. The aggregate value of investments by input level as of October 31, 2019 is included at the end of the Fund's Schedule of Investments.
Foreign Currency. The Fund may use foreign currency contracts to facilitate transactions in foreign-denominated securities. Gains and losses from these transactions may arise from changes in the value of the foreign currency or if the counterparties do not perform under the contracts' terms.
Foreign-denominated assets, including investment securities, and liabilities are translated into U.S. dollars at the exchange rates at period end. Purchases and sales of investment securities, income and dividends received and expenses denominated in foreign currencies are translated into U.S. dollars at the exchange rate in effect on the transaction date.
The effects of exchange rate fluctuations on investments are included with the net realized and unrealized gain (loss) on investment securities. Other foreign currency transactions resulting in realized and unrealized gain (loss) are disclosed separately.
Investment Transactions and Income. For financial reporting purposes, the Fund's investment holdings and NAV include trades executed through the end of the last business day of the period. The NAV per share for processing shareholder transactions is calculated as of the close of business of the New York Stock Exchange (NYSE), normally 4:00 p.m. Eastern time and includes trades executed through the end of the prior business day. Gains and losses on securities sold are determined on the basis of identified cost and include proceeds received from litigation. Dividend income is recorded on the ex-dividend date, except for certain dividends from foreign securities where the ex-dividend date may have passed, which are recorded as soon as the Fund is informed of the ex-dividend date. Non-cash dividends included in dividend income, if any, are recorded at the fair market value of the securities received. Income and capital gain distributions from Fidelity Central Funds, if any, are recorded on the ex-dividend date. Large, non-recurring dividends recognized by the Fund are presented separately on the Statement of Operations in "Non-cash dividends" and the impact of these dividends is presented in the Financial Highlights. Investment income is recorded net of foreign taxes withheld where recovery of such taxes is uncertain.
Class Allocations and Expenses. Investment income, realized and unrealized capital gains and losses, common expenses of the Fund, and certain fund-level expense reductions, if any, are allocated daily on a pro-rata basis to each class based on the relative net assets of each class to the total net assets of the Fund. Each class differs with respect to transfer agent and distribution and service plan fees incurred. Certain expense reductions may also differ by class. For the reporting period, the allocated portion of income and expenses to each class as a percent of its average net assets may vary due to the timing of recording these transactions in relation to fluctuating net assets of the classes. Expenses directly attributable to a fund are charged to that fund. Expenses attributable to more than one fund are allocated among the respective funds on the basis of relative net assets or other appropriate methods. Expense estimates are accrued in the period to which they relate and adjustments are made when actual amounts are known.
Income Tax Information and Distributions to Shareholders. Each year, the Fund intends to qualify as a regulated investment company under Subchapter M of the Internal Revenue Code, including distributing substantially all of its taxable income and realized gains. As a result, no provision for U.S. Federal income taxes is required. As of October 31, 2019, the Fund did not have any unrecognized tax benefits in the financial statements; nor is the Fund aware of any tax positions for which it is reasonably possible that the total amounts of unrecognized tax benefits will significantly change in the next twelve months. The Fund files a U.S. federal tax return, in addition to state and local tax returns as required. The Fund's federal income tax returns are subject to examination by the Internal Revenue Service (IRS) for a period of three fiscal years after they are filed. State and local tax returns may be subject to examination for an additional fiscal year depending on the jurisdiction. Foreign taxes are provided for based on the Fund's understanding of the tax rules and rates that exist in the foreign markets in which it invests.
Distributions are declared and recorded on the ex-dividend date. Income and capital gain distributions are declared separately for each class. Income and capital gain distributions are determined in accordance with income tax regulations, which may differ from GAAP.
Capital accounts within the financial statements are adjusted for permanent book-tax differences. These adjustments have no impact on net assets or the results of operations. Capital accounts are not adjusted for temporary book-tax differences which will reverse in a subsequent period.
Book-tax differences are primarily due to foreign currency transactions, passive foreign investment companies (PFIC) and losses deferred due to wash sales.
As of period end, the cost and unrealized appreciation (depreciation) in securities, and derivatives if applicable, for federal income tax purposes were as follows:
| Gross unrealized appreciation | $83,124,274 |
| Gross unrealized depreciation | (87,762,520) |
| Net unrealized appreciation (depreciation) | $(4,638,246) |
| Tax Cost | $901,974,418 |
The tax-based components of distributable earnings as of period end were as follows:
| Undistributed ordinary income | $43,207,198 |
| Undistributed long-term capital gain | $22,530,922 |
| Net unrealized appreciation (depreciation) on securities and other investments | $(4,632,016) |
The tax character of distributions paid was as follows:
| | October 31, 2019 | October 31, 2018 |
| Ordinary Income | $33,149,624 | $ 31,260,216 |
| Long-term Capital Gains | 62,894,266 | – |
| Total | $96,043,890 | $ 31,260,216 |
Restricted Securities. The Fund may invest in securities that are subject to legal or contractual restrictions on resale. These securities generally may be resold in transactions exempt from registration or to the public if the securities are registered. Disposal of these securities may involve time-consuming negotiations and expense, and prompt sale at an acceptable price may be difficult. Information regarding restricted securities is included at the end of the Fund's Schedule of Investments.
4. Purchases and Sales of Investments.
Purchases and sales of securities, other than short-term securities, aggregated $411,970,397 and $526,594,921, respectively.
5. Fees and Other Transactions with Affiliates.
Management Fee. Fidelity Management & Research Company (the investment adviser) and its affiliates provide the Fund with investment management related services for which the Fund pays a monthly management fee. The management fee is the sum of an individual fund fee rate that is based on an annual rate of .45% of the Fund's average net assets and an annualized group fee rate that averaged .24% during the period. The group fee rate is based upon the average net assets of all the mutual funds advised by the investment adviser, including any mutual funds previously advised by the investment adviser that are currently advised by Fidelity SelectCo, LLC, an affiliate of the investment adviser. The group fee rate decreases as assets under management increase and increases as assets under management decrease. In addition, the management fee is subject to a performance adjustment (up to a maximum of +/- .20% of the Fund's average net assets over a 36 month performance period). The upward or downward adjustment to the management fee is based on the relative investment performance of Europe as compared to its benchmark index, the MSCI Europe Index, over the same 36 month performance period. For the reporting period, the total annual management fee rate, including the performance adjustment, was .52% of the Fund's average net assets. The performance adjustment included in the management fee rate may be higher or lower than the maximum performance adjustment rate due to the difference between the average net assets for the reporting and performance periods.
Distribution and Service Plan Fees. In accordance with Rule 12b-1 of the 1940 Act, the Fund has adopted separate Distribution and Service Plans for each class of shares. Certain classes pay Fidelity Distributors Corporation (FDC), an affiliate of the investment adviser, separate Distribution and Service Fees, each of which is based on an annual percentage of each class' average net assets. In addition, FDC may pay financial intermediaries for selling shares of the Fund and providing shareholder support services. For the period, the Distribution and Service Fee rates, total fees and amounts retained by FDC were as follows:
| | Distribution Fee | Service Fee | Total Fees | Retained by FDC |
| Class A | -% | .25% | $50,147 | $2,398 |
| Class M | .25% | .25% | 31,902 | 221 |
| Class C | .75% | .25% | 77,944 | 10,142 |
| | | | $159,993 | $12,761 |
Sales Load. FDC may receive a front-end sales charge of up to 5.75% for selling Class A shares and 3.50% for selling Class M shares, some of which is paid to financial intermediaries for selling shares of the Fund. Depending on the holding period, FDC may receive contingent deferred sales charges levied on Class A, Class M and Class C redemptions. The deferred sales charges are 1.00% for Class C shares, 1.00% for certain purchases of Class A shares and .25% for certain purchases of Class M shares.
For the period, sales charge amounts retained by FDC were as follows:
| | Retained by FDC |
| Class A | $18,859 |
| Class M | 258 |
| Class C(a) | 375 |
| | $19,492 |
(a) When Class C shares are initially sold, FDC pays commissions from its own resources to financial intermediaries through which the sales are made.
Transfer Agent Fees. Fidelity Investments Institutional Operations Company, Inc., (FIIOC), an affiliate of the investment adviser, is the transfer, dividend disbursing and shareholder servicing agent for each class of the Fund. FIIOC receives account fees and asset-based fees that vary according to the account size and type of account of the shareholders of the respective classes of the Fund, except for Class Z. FIIOC receives an asset-based fee of Class Z's average net assets. FIIOC pays for typesetting, printing and mailing of shareholder reports, except proxy statements.
For the period, transfer agent fees for each class were as follows:
| | Amount | % of Class-Level Average Net Assets |
| Class A | $47,717 | .24 |
| Class M | 19,349 | .30 |
| Class C | 22,697 | .29 |
| Europe | 1,532,222 | .17 |
| Class I | 9,967 | .14 |
| Class Z | 2,070 | .04 |
| | $1,634,022 | |
Accounting and Security Lending Fees. Fidelity Service Company, Inc. (FSC), an affiliate of the investment adviser, maintains the Fund's accounting records. The accounting fee is based on the level of average net assets for each month. Prior to April 1, 2019, FSC had a separate agreement with the Fund for administration of the security lending program, based on the number and duration of lending transactions. For the period, the total fees paid for accounting and administration of securities lending were equivalent to an annual rate of .05%.
Interfund Lending Program. Pursuant to an Exemptive Order issued by the SEC, the Fund, along with other registered investment companies having management contracts with Fidelity Management & Research Company (FMR) or other affiliated entities of FMR, may participate in an interfund lending program. This program provides an alternative credit facility allowing the funds to borrow from, or lend money to, other participating affiliated funds. At period end, there were no interfund loans outstanding. The Fund's activity in this program during the period for which loans were outstanding was as follows:
| Borrower or Lender | Average Loan Balance | Weighted Average Interest Rate | Interest Expense |
| Borrower | $2,618,750 | 2.56% | $2,236 |
Interfund Trades. The Fund may purchase from or sell securities to other Fidelity Funds under procedures adopted by the Board. The procedures have been designed to ensure these interfund trades are executed in accordance with Rule 17a-7 of the 1940 Act. Interfund trades are included within the respective purchases and sales amounts shown in the Purchases and Sales of Investments note.
6. Committed Line of Credit.
The Fund participates with other funds managed by the investment adviser or an affiliate in a $4.25 billion credit facility (the "line of credit") to be utilized for temporary or emergency purposes to fund shareholder redemptions or for other short-term liquidity purposes. The Fund has agreed to pay commitment fees on its pro-rata portion of the line of credit, which amounted to $2,495 and is reflected in Miscellaneous expenses on the Statement of Operations. During the period, the Fund did not borrow on this line of credit.
7. Security Lending.
The Fund lends portfolio securities from time to time in order to earn additional income. For equity securities, lending agents are used, including National Financial Services (NFS), an affiliate of the Fund. Pursuant to a securities lending agreement, NFS will receive a fee, which is capped at 9.9% of daily lending revenue, for its services as lending agent. The Fund may lend securities to certain qualified borrowers, including NFS. On the settlement date of the loan, the Fund receives collateral (in the form of U.S. Treasury obligations, letters of credit and/or cash) against the loaned securities and maintains collateral in an amount not less than 100% of the market value of the loaned securities during the period of the loan. The market value of the loaned securities is determined at the close of business of the Fund and any additional required collateral is delivered to the Fund on the next business day. The Fund or borrower may terminate the loan at any time, and if the borrower defaults on its obligation to return the securities loaned because of insolvency or other reasons, the Fund may apply collateral received from the borrower against the obligation. The Fund may experience delays and costs in recovering the securities loaned. Any cash collateral received is invested in the Fidelity Securities Lending Cash Central Fund. The value of loaned securities and cash collateral at period end are disclosed on the Fund's Statement of Assets and Liabilities. Security lending income represents the income earned on investing cash collateral, less rebates paid to borrowers and any lending agent fees associated with the loan, plus any premium payments received for lending certain types of securities. Security lending income is presented in the Statement of Operations as a component of income from Fidelity Central Funds. During the period, there were no securities loaned to NFS.
8. Expense Reductions.
Commissions paid to certain brokers with whom the investment adviser, or its affiliates, places trades on behalf of the Fund include an amount in addition to trade execution, which may be rebated back to the Fund to offset certain expenses. This amount totaled $195,541 for the period. In addition, through arrangements with each class' transfer agent, credits realized as a result of certain uninvested cash balances were used to reduce the Fund's expenses. During the period, transfer agent credits reduced each class' expenses as noted in the table below.
| | Expense reduction |
| Europe | $672 |
In addition, during the period the investment adviser reimbursed and/or waived a portion of fund-level operating expenses in the amount of $7,208 and a portion of class-level operating expenses as follows:
| | Amount |
| Class A | $329 |
| Class M | 111 |
| Class C | 151 |
| Europe | 15,290 |
| Class I | 116 |
| Class Z | 4 |
| | $16,001 |
9. Distributions to Shareholders.
Distributions to shareholders of each class were as follows:
| | Year ended
October 31, 2019 | Year ended
October 31, 2018(a) |
| Distributions to shareholders | | |
| Class A | $1,831,498 | $501,208 |
| Class M | 614,305 | 186,202 |
| Class C | 867,653 | 200,227 |
| Europe | 92,001,047 | 30,143,621 |
| Class I | 707,340 | 228,958 |
| Class Z | 22,047 | – |
| Total | $96,043,890 | $31,260,216 |
(a) Distributions for Class Z are for the period October 2, 2018 (commencement of sale of shares) to October 31, 2018.
10. Share Transactions.
Share transactions for each class were as follows and may contain automatic conversions between classes or exchanges between affiliated funds:
| | Shares | Shares | Dollars | Dollars |
| | Year ended October 31, 2019 | Year ended October 31, 2018(a) | Year ended October 31, 2019 | Year ended October 31, 2018(a) |
| Class A | | | | |
| Shares sold | 187,597 | 219,725 | $6,415,473 | $9,120,083 |
| Reinvestment of distributions | 55,527 | 11,776 | 1,772,425 | 482,917 |
| Shares redeemed | (188,928) | (204,787) | (6,512,432) | (8,469,723) |
| Net increase (decrease) | 54,196 | 26,714 | $1,675,466 | $1,133,277 |
| Class M | | | | |
| Shares sold | 5,598 | 32,492 | $196,494 | $1,375,839 |
| Reinvestment of distributions | 19,078 | 4,513 | 611,073 | 185,442 |
| Shares redeemed | (58,673) | (52,789) | (2,065,750) | (2,166,691) |
| Net increase (decrease) | (33,997) | (15,784) | $(1,258,183) | $(605,410) |
| Class C | | | | |
| Shares sold | 7,894 | 79,985 | $273,437 | $3,363,120 |
| Reinvestment of distributions | 27,024 | 4,833 | 858,558 | 197,576 |
| Shares redeemed | (133,837) | (68,943) | (4,597,859) | (2,831,033) |
| Net increase (decrease) | (98,919) | 15,875 | $(3,465,864) | $729,663 |
| Europe | | | | |
| Shares sold | 1,130,150 | 2,475,476 | $39,213,489 | $104,461,482 |
| Reinvestment of distributions | 2,737,998 | 696,409 | 87,123,097 | 28,552,790 |
| Shares redeemed | (5,789,436) | (9,777,479) | (200,269,069) | (410,827,963) |
| Net increase (decrease) | (1,921,288) | (6,605,594) | $(73,932,483) | $(277,813,691) |
| Class I | | | | |
| Shares sold | 84,926 | 129,107 | $2,952,630 | $5,438,702 |
| Reinvestment of distributions | 20,748 | 5,434 | 659,789 | 222,682 |
| Shares redeemed | (115,475) | (139,490) | (3,974,243) | (5,809,512) |
| Net increase (decrease) | (9,801) | (4,949) | $(361,824) | $(148,128) |
| Class Z | | | | |
| Shares sold | 644,857 | 2,761 | $21,625,731 | $111,832 |
| Reinvestment of distributions | 695 | – | 22,047 | – |
| Shares redeemed | (45,265) | – | (1,568,987) | – |
| Net increase (decrease) | 600,287 | 2,761 | $20,078,791 | $111,832 |
(a) Share transactions for Class Z are for the period October 2, 2018 (commencement of sale of shares) to October 31, 2018.
11. Other.
The Fund's organizational documents provide former and current trustees and officers with a limited indemnification against liabilities arising in connection with the performance of their duties to the Fund. In the normal course of business, the Fund may also enter into contracts that provide general indemnifications. The Fund's maximum exposure under these arrangements is unknown as this would be dependent on future claims that may be made against the Fund. The risk of material loss from such claims is considered remote.
Fidelity® Japan Fund
Performance: The Bottom Line
Average annual total return reflects the change in the value of an investment, assuming reinvestment of distributions from dividend income and capital gains (the profits earned upon the sale of securities that have grown in value, if any) and assuming a constant rate of performance each year. The hypothetical investment and the average annual total returns do not reflect the deduction of taxes that a shareholder would pay on fund distributions or the redemption of fund shares. During periods of reimbursement by Fidelity, a fund’s total return will be greater than it would be had the reimbursement not occurred. How a fund did yesterday is no guarantee of how it will do tomorrow.
Average Annual Total Returns
| For the periods ended October 31, 2019 | Past 1 year | Past 5 years | Past 10 years |
| Class A (incl. 5.75% sales charge) | 5.24% | 5.53% | 5.33% |
| Class M (incl. 3.50% sales charge) | 7.44% | 5.67% | 5.28% |
| Class C (incl. contingent deferred sales charge) | 9.88% | 6.04% | 5.29% |
| Fidelity® Japan Fund | 12.10% | 7.12% | 6.25% |
| Class I | 12.12% | 7.17% | 6.29% |
| Class Z | 12.14% | 7.19% | 6.30% |
Class A shares bear a 0.25% 12b-1 fee. The initial offering of Class A shares took place on December 14, 2010. Returns prior to December 14, 2010, are those of Fidelity® Japan Fund, the original class of the fund, which has no 12b-1 fee. Had Class A's 12b-1 fee been reflected, returns prior to December 14, 2010, would have been lower.
Class M shares bear a 0.50% 12b-1 fee. The initial offering of Class M shares took place on December 14, 2010. Returns prior to December 14, 2010, are those of Fidelity® Japan Fund, the original class of the fund, which has no 12b-1 fee. Had Class M's 12b-1 fee been reflected, returns prior to December 14, 2010, would have been lower.
Class C shares bear a 1.00% 12b-1 fee. The initial offering of Class C shares took place on December 14, 2010. Returns prior to December 14, 2010, are those of Fidelity® Japan Fund, the original class of the fund, which has no 12b-1 fee. Had Class C's 12b-1 fee been reflected, returns prior to December 14, 2010, would have been lower.
Class C shares' contingent deferred sales charges included in the past one year, past five years and past ten years total return figures are 1%, 0% and 0%, respectively.
The initial offering of Class I shares took place on December 14, 2010. Returns prior to December 14, 2010 are those of Fidelity® Japan Fund, the original class of the fund.
The initial offering of Class Z shares took place on October 2, 2018. Returns prior to October 2, 2018, are those of Class I. Returns between December 14, 2010 and October 2, 2018, are those of Class I. Returns prior to December 14, 2010 are those of Fidelity Japan Fund, the original class of the fund.
$10,000 Over 10 Years
Let's say hypothetically that $10,000 was invested in Fidelity® Japan Fund - Fidelity® Japan Fund on October 31, 2009, and the current % sales charge was paid.
The chart shows how the value of your investment would have changed, and also shows how the Tokyo Stock Price Index (TOPIX) performed over the same period.
See above for additional information regarding the performance of Fidelity® Japan Fund.

| Period Ending Values |
| $18,342 | Fidelity® Japan Fund |
| $19,309 | Tokyo Stock Price Index (TOPIX) |
Fidelity® Japan Fund
Management's Discussion of Fund Performance
Market Recap: The MSCI ACWI (All Country World Index) ex USA Index gained 11.47% for the 12 months ending October 31, 2019, as international stocks reflected a confluence of factors, including escalating trade tension, and moderating but still positive global economic growth. Currency fluctuations were largely modest and varied by region, muting the overall impact on international equity returns. In late December, the U.S. Federal Reserve shifted from raising interest rates to a more dovish policy in 2019, joining many foreign central banks. In June, international stocks rose 6.03%, as policy stimulus in China stabilized that country’s economic growth. The Fed cut its policy rate in July for the first time since 2008. However, the index returned -1.21% for the month, followed by -3.08% in August. In September, the Fed cut its policy rate another quarter point, citing concerns about slowing economic growth and muted inflation, and did the same in October, leading to monthly gains of 2.59% and 3.49%, respectively. For the full 12 months, the growth-oriented information technology sector (+22%) led the way, followed by utilities (+20%) and real estate (+18%), two high-dividend-yielding categories. Conversely, energy was roughly flat, while materials (+6%) and communication services (7%) also lagged. By region, Asia Pacific ex Japan (+16%), Europe ex U.K (+13%), Canada (+12%) and emerging markets (+12%) fared best. Meanwhile, the U.K. (+7%) and Japan (+10%) trailed the broader market.
Comments from Portfolio Manager Kirk Neureiter: For the year, the fund’s share classes (excluding sales charges, if applicable) gained roughly 11% to 12%, handily topping the 8.45% advance of the benchmark Tokyo Stock Price Index (TOPIX). Security selection accounted for most of the portfolio’s outperformance of the benchmark, especially among industrials, materials and health care stocks. Overall, the fund's positioning in nine of 11 market sectors added value the past 12 months. The leading individual relative contributor and largest holding at period end was Hoya Group (+58%). Classified in health care equipment & services, the company also has a strong presence in photomasks for semiconductor substrates and glass disks for hard-disk drives. These two businesses provided the firm with healthy growth this period. An overweight stake in endoscope manufacturer Olympus (+65%) also paid off, as did an overweighting in Kansai Paint (+66%), Japan’s second-largest paint manufacturer. Conversely, stock picks within the communication services sector detracted most. More specifically, choices in telecommunication services were the primary reason for the fund’s weak relative result, especially our sizable overweighting in SoftBank Group (-3%). Overweighting the poor-performing food & staples retailing segment of the consumer staples sector also hurt. SoftBank suffered in part due to the blow-up of its investment in WeWork, the office-leasing company. With that said, our largest individual detractor was an overweighting in bank stock Mitsubishi UFJ Financial Group (-10%). Not owning the shares of auto manufacturer Toyota Motor (+23%) hurt as well.
The views expressed above reflect those of the portfolio manager(s) only through the end of the period as stated on the cover of this report and do not necessarily represent the views of Fidelity or any other person in the Fidelity organization. Any such views are subject to change at any time based upon market or other conditions and Fidelity disclaims any responsibility to update such views. These views may not be relied on as investment advice and, because investment decisions for a Fidelity fund are based on numerous factors, may not be relied on as an indication of trading intent on behalf of any Fidelity fund.
Fidelity® Japan Fund
Investment Summary (Unaudited)
Geographic Diversification (% of fund's net assets)
| As of October 31, 2019 |
| | Japan | 95.4% |
| | United States of America* | 4.6% |

* Includes Short-Term investments and Net Other Assets (Liabilities).
Percentages are based on country or territory of incorporation and are adjusted for the effect of futures contracts, if applicable.
Asset Allocation as of October 31, 2019
| | % of fund's net assets |
| Stocks | 95.8 |
| Short-Term Investments and Net Other Assets (Liabilities) | 4.2 |
Top Ten Stocks as of October 31, 2019
| | % of fund's net assets |
| Hoya Corp. (Health Care Equipment & Supplies) | 4.3 |
| SoftBank Corp. (Wireless Telecommunication Services) | 4.0 |
| Sony Corp. (Household Durables) | 3.9 |
| Mitsubishi UFJ Financial Group, Inc. (Banks) | 3.0 |
| Nidec Corp. (Electrical Equipment) | 2.3 |
| Suzuki Motor Corp. (Automobiles) | 2.3 |
| ORIX Corp. (Diversified Financial Services) | 2.3 |
| Kao Corp. (Personal Products) | 2.1 |
| Tokio Marine Holdings, Inc. (Insurance) | 2.0 |
| Takeda Pharmaceutical Co. Ltd. (Pharmaceuticals) | 2.0 |
| | 28.2 |
Top Market Sectors as of October 31, 2019
| | % of fund's net assets |
| Industrials | 21.3 |
| Consumer Discretionary | 14.1 |
| Information Technology | 12.2 |
| Health Care | 11.1 |
| Financials | 10.6 |
| Consumer Staples | 9.8 |
| Communication Services | 7.4 |
| Materials | 6.9 |
| Real Estate | 2.4 |
Fidelity® Japan Fund
Schedule of Investments October 31, 2019
Showing Percentage of Net Assets
| Common Stocks - 95.8% | | | |
| | | Shares | Value |
| COMMUNICATION SERVICES - 7.4% | | | |
| Entertainment - 1.4% | | | |
| Nintendo Co. Ltd. | | 29,900 | $10,966,946 |
| Interactive Media & Services - 1.2% | | | |
| LIFULL Co. Ltd. | | 778,300 | 4,730,260 |
| Yahoo! Japan Corp. | | 1,455,400 | 4,480,767 |
| | | | 9,211,027 |
| Media - 0.8% | | | |
| Dentsu, Inc. | | 163,500 | 5,845,087 |
| Wireless Telecommunication Services - 4.0% | | | |
| SoftBank Corp. | | 786,700 | 30,261,529 |
|
| TOTAL COMMUNICATION SERVICES | | | 56,284,589 |
|
| CONSUMER DISCRETIONARY - 14.1% | | | |
| Auto Components - 1.0% | | | |
| Aisin Seiki Co. Ltd. | | 118,300 | 4,721,332 |
| DaikyoNishikawa Corp. | | 367,000 | 2,819,507 |
| | | | 7,540,839 |
| Automobiles - 4.1% | | | |
| Subaru Corp. | | 484,200 | 13,875,968 |
| Suzuki Motor Corp. | | 370,100 | 17,473,944 |
| | | | 31,349,912 |
| Distributors - 0.6% | | | |
| Arata Corp. | | 112,800 | 4,228,798 |
| Hotels, Restaurants & Leisure - 1.1% | | | |
| Koshidaka Holdings Co. Ltd. | | 580,500 | 8,429,444 |
| Household Durables - 3.9% | | | |
| Sony Corp. | | 481,100 | 29,284,148 |
| Internet & Direct Marketing Retail - 1.0% | | | |
| Zozo, Inc. (a) | | 308,500 | 7,185,875 |
| Leisure Products - 0.7% | | | |
| Bandai Namco Holdings, Inc. | | 88,000 | 5,411,048 |
| Multiline Retail - 0.5% | | | |
| Ryohin Keikaku Co. Ltd. | | 177,500 | 3,951,554 |
| Specialty Retail - 1.2% | | | |
| Nitori Holdings Co. Ltd. | | 43,200 | 6,575,521 |
| USS Co. Ltd. | | 148,400 | 2,874,240 |
| | | | 9,449,761 |
|
| TOTAL CONSUMER DISCRETIONARY | | | 106,831,379 |
|
| CONSUMER STAPLES - 9.8% | | | |
| Food & Staples Retailing - 4.9% | | | |
| Ain Holdings, Inc. | | 77,200 | 4,417,319 |
| Nishimoto Co. Ltd. | | 137,900 | 4,446,182 |
| Seven & i Holdings Co. Ltd. | | 301,100 | 11,375,650 |
| Sundrug Co. Ltd. | | 81,100 | 2,683,658 |
| Tsuruha Holdings, Inc. | | 64,600 | 7,266,761 |
| Welcia Holdings Co. Ltd. | | 123,400 | 7,090,599 |
| | | | 37,280,169 |
| Food Products - 0.8% | | | |
| Morinaga & Co. Ltd. | | 124,000 | 6,125,538 |
| Personal Products - 4.1% | | | |
| Kao Corp. | | 193,200 | 15,533,026 |
| Kose Corp. | | 33,500 | 5,939,351 |
| Shiseido Co. Ltd. | | 110,500 | 9,110,499 |
| | | | 30,582,876 |
|
| TOTAL CONSUMER STAPLES | | | 73,988,583 |
|
| FINANCIALS - 10.6% | | | |
| Banks - 3.5% | | | |
| Mitsubishi UFJ Financial Group, Inc. | | 4,319,400 | 22,393,015 |
| Shinsei Bank Ltd. | | 252,100 | 3,930,176 |
| | | | 26,323,191 |
| Capital Markets - 1.0% | | | |
| JAFCO Co. Ltd. | | 102,400 | 3,846,339 |
| SBI Holdings, Inc. Japan | | 188,400 | 4,097,388 |
| | | | 7,943,727 |
| Consumer Finance - 0.5% | | | |
| AEON Financial Service Co. Ltd. | | 239,700 | 3,653,124 |
| Diversified Financial Services - 2.3% | | | |
| ORIX Corp. | | 1,108,300 | 17,416,818 |
| Insurance - 3.3% | | | |
| AFLAC, Inc. | | 55,500 | 2,950,380 |
| Sony Financial Holdings, Inc. | | 307,400 | 6,613,234 |
| Tokio Marine Holdings, Inc. | | 284,900 | 15,403,295 |
| | | | 24,966,909 |
|
| TOTAL FINANCIALS | | | 80,303,769 |
|
| HEALTH CARE - 11.1% | | | |
| Biotechnology - 0.1% | | | |
| StemRim, Inc. | | 77,700 | 691,551 |
| Health Care Equipment & Supplies - 7.7% | | | |
| Hoya Corp. | | 369,600 | 32,664,221 |
| Nakanishi, Inc. | | 137,600 | 2,294,097 |
| Olympus Corp. | | 768,800 | 10,460,594 |
| Paramount Bed Holdings Co. Ltd. | | 120,400 | 4,603,737 |
| Sysmex Corp. | | 45,200 | 2,949,213 |
| Terumo Corp. | | 177,600 | 5,796,282 |
| | | | 58,768,144 |
| Health Care Providers & Services - 0.7% | | | |
| N Field Co. Ltd. (a) | | 188,800 | 1,107,319 |
| Ship Healthcare Holdings, Inc. | | 91,100 | 3,882,842 |
| | | | 4,990,161 |
| Pharmaceuticals - 2.6% | | | |
| Shionogi & Co. Ltd. | | 79,300 | 4,759,816 |
| Takeda Pharmaceutical Co. Ltd. | | 416,341 | 15,043,682 |
| | | | 19,803,498 |
|
| TOTAL HEALTH CARE | | | 84,253,354 |
|
| INDUSTRIALS - 21.3% | | | |
| Building Products - 2.7% | | | |
| Daikin Industries Ltd. | | 100,300 | 14,037,952 |
| Toto Ltd. | | 152,600 | 6,230,023 |
| | | | 20,267,975 |
| Commercial Services & Supplies - 0.8% | | | |
| Sohgo Security Services Co., Ltd. | | 107,200 | 5,822,871 |
| Construction & Engineering - 1.5% | | | |
| Mirait Holdings Corp. | | 362,700 | 5,823,878 |
| Toshiba Plant Systems & Services Corp. | | 293,900 | 5,742,450 |
| | | | 11,566,328 |
| Electrical Equipment - 2.3% | | | |
| Nidec Corp. | | 120,800 | 17,784,875 |
| Machinery - 7.7% | | | |
| CKD Corp. (a) | | 330,100 | 4,634,281 |
| Fanuc Corp. | | 59,400 | 11,716,609 |
| Hoshizaki Corp. | | 131,100 | 11,143,806 |
| Kitz Corp. | | 492,800 | 3,358,403 |
| Minebea Mitsumi, Inc. | | 461,500 | 8,764,600 |
| Misumi Group, Inc. | | 450,460 | 11,324,007 |
| Nabtesco Corp. | | 184,400 | 5,870,338 |
| Shima Seiki Manufacturing Ltd. | | 55,400 | 1,324,597 |
| | | | 58,136,641 |
| Professional Services - 3.5% | | | |
| Outsourcing, Inc. | | 357,700 | 3,850,277 |
| Persol Holdings Co., Ltd. | | 413,100 | 7,934,834 |
| Recruit Holdings Co. Ltd. | | 242,400 | 8,055,932 |
| SMS Co., Ltd. | | 269,900 | 6,617,070 |
| | | | 26,458,113 |
| Road & Rail - 0.6% | | | |
| Hitachi Transport System Ltd. | | 150,800 | 4,292,186 |
| Trading Companies & Distributors - 2.2% | | | |
| Itochu Corp. | | 371,400 | 7,765,188 |
| MonotaRO Co. Ltd. (a) | | 130,000 | 3,927,380 |
| Trusco Nakayama Corp. | | 213,000 | 5,150,112 |
| | | | 16,842,680 |
|
| TOTAL INDUSTRIALS | | | 161,171,669 |
|
| INFORMATION TECHNOLOGY - 12.2% | | | |
| Electronic Equipment & Components - 4.8% | | | |
| Azbil Corp. | | 238,000 | 6,622,873 |
| Dexerials Corp. | | 587,800 | 5,188,745 |
| Iriso Electronics Co. Ltd. | | 118,600 | 5,863,872 |
| Murata Manufacturing Co. Ltd. | | 145,900 | 7,943,990 |
| Shimadzu Corp. | | 147,200 | 3,931,139 |
| TDK Corp. | | 71,200 | 7,025,574 |
| | | | 36,576,193 |
| IT Services - 5.1% | | | |
| GMO Internet, Inc. | | 457,800 | 7,693,254 |
| IT Holdings Corp. | | 77,900 | 4,723,352 |
| ITOCHU Techno-Solutions Corp. | | 260,800 | 7,023,557 |
| NSD Co. Ltd. | | 221,100 | 6,815,323 |
| NTT Data Corp. | | 339,600 | 4,459,237 |
| Otsuka Corp. | | 92,200 | 3,717,316 |
| SCSK Corp. | | 79,700 | 4,057,079 |
| | | | 38,489,118 |
| Semiconductors & Semiconductor Equipment - 0.9% | | | |
| Renesas Electronics Corp. (b) | | 952,200 | 6,446,087 |
| Software - 1.4% | | | |
| Money Forward, Inc. (a)(b) | | 142,800 | 5,098,879 |
| Oracle Corp. Japan | | 66,542 | 5,848,787 |
| | | | 10,947,666 |
|
| TOTAL INFORMATION TECHNOLOGY | | | 92,459,064 |
|
| MATERIALS - 6.9% | | | |
| Chemicals - 6.9% | | | |
| JSR Corp. | | 338,900 | 6,362,420 |
| Kansai Paint Co. Ltd. | | 429,100 | 10,334,805 |
| KH Neochem Co. Ltd. | | 197,699 | 4,814,356 |
| Nissan Chemical Corp. | | 133,500 | 5,481,227 |
| NOF Corp. | | 128,400 | 4,337,231 |
| Okamoto Industries, Inc. | | 42,800 | 1,652,921 |
| Shin-Etsu Chemical Co. Ltd. | | 131,300 | 14,640,112 |
| Tokyo Ohka Kogyo Co. Ltd. | | 118,500 | 4,693,005 |
| | | | 52,316,077 |
| REAL ESTATE - 2.4% | | | |
| Real Estate Management & Development - 2.4% | | | |
| Kenedix, Inc. | | 1,368,400 | 7,448,411 |
| Open House Co. Ltd. | | 158,300 | 4,045,286 |
| Relo Group, Inc. | | 266,800 | 6,529,512 |
| | | | 18,023,209 |
| TOTAL COMMON STOCKS | | | |
| (Cost $615,397,248) | | | 725,631,693 |
|
| Money Market Funds - 5.4% | | | |
| Fidelity Cash Central Fund 1.83% (c) | | 30,150,179 | 30,156,209 |
| Fidelity Securities Lending Cash Central Fund 1.84% (c)(d) | | 11,055,781 | 11,056,886 |
| TOTAL MONEY MARKET FUNDS | | | |
| (Cost $41,213,313) | | | 41,213,095 |
| TOTAL INVESTMENT IN SECURITIES - 101.2% | | | |
| (Cost $656,610,561) | | | 766,844,788 |
| NET OTHER ASSETS (LIABILITIES) - (1.2)% | | | (9,357,647) |
| NET ASSETS - 100% | | | $757,487,141 |
Legend
(a) Security or a portion of the security is on loan at period end.
(b) Non-income producing
(c) Affiliated fund that is generally available only to investment companies and other accounts managed by Fidelity Investments. The rate quoted is the annualized seven-day yield of the fund at period end. A complete unaudited listing of the fund's holdings as of its most recent quarter end is available upon request. In addition, each Fidelity Central Fund's financial statements, which are not covered by the Fund's Report of Independent Registered Public Accounting Firm, are available on the SEC's website or upon request.
(d) Investment made with cash collateral received from securities on loan.
Affiliated Central Funds
Information regarding fiscal year to date income earned by the Fund from investments in Fidelity Central Funds is as follows:
| Fund | Income earned |
| Fidelity Cash Central Fund | $316,823 |
| Fidelity Securities Lending Cash Central Fund | 181,952 |
| Total | $498,775 |
Amounts in the income column in the above table include any capital gain distributions from underlying funds, which are presented in the corresponding line-item in the Statement of Operations, if applicable. Amount for Fidelity Securities Lending Cash Central Fund represents the income earned on investing cash collateral, less rebates paid to borrowers and any lending agent fees associated with the loan, plus any premium payments received for lending certain types of securities.
Investment Valuation
The following is a summary of the inputs used, as of October 31, 2019, involving the Fund's assets and liabilities carried at fair value. The inputs or methodology used for valuing securities may not be an indication of the risk associated with investing in those securities. For more information on valuation inputs, and their aggregation into the levels used below, please refer to the Investment Valuation section in the accompanying Notes to Financial Statements.
| | Valuation Inputs at Reporting Date: |
| Description | Total | Level 1 | Level 2 | Level 3 |
| Investments in Securities: | | | | |
| Equities: | | | | |
| Consumer Discretionary | $106,831,379 | $-- | $106,831,379 | $-- |
| Consumer Staples | 73,988,583 | -- | 73,988,583 | -- |
| Financials | 80,303,769 | 2,950,380 | 77,353,389 | -- |
| Health Care | 84,253,354 | -- | 84,253,354 | -- |
| Industrials | 161,171,669 | -- | 161,171,669 | -- |
| Information Technology | 92,459,064 | -- | 92,459,064 | -- |
| Materials | 52,316,077 | -- | 52,316,077 | -- |
| Real Estate | 18,023,209 | -- | 18,023,209 | -- |
| Telecommunication Services | 56,284,589 | -- | 56,284,589 | -- |
| Money Market Funds | 41,213,095 | 41,213,095 | -- | -- |
| Total Investments in Securities: | $766,844,788 | $44,163,475 | $722,681,313 | $-- |
See accompanying notes which are an integral part of the financial statements.
Fidelity® Japan Fund
Financial Statements
Statement of Assets and Liabilities
| | | October 31, 2019 |
| Assets | | |
Investment in securities, at value (including securities loaned of $10,508,767) — See accompanying schedule:
Unaffiliated issuers (cost $615,397,248) | $725,631,693 | |
| Fidelity Central Funds (cost $41,213,313) | 41,213,095 | |
| Total Investment in Securities (cost $656,610,561) | | $766,844,788 |
| Foreign currency held at value (cost $1,148) | | 1,148 |
| Receivable for investments sold | | 1,505,480 |
| Receivable for fund shares sold | | 620,863 |
| Dividends receivable | | 4,552,929 |
| Distributions receivable from Fidelity Central Funds | | 82,658 |
| Prepaid expenses | | 1,231 |
| Other receivables | | 13,683 |
| Total assets | | 773,622,780 |
| Liabilities | | |
| Payable for investments purchased | $4,133,212 | |
| Payable for fund shares redeemed | 261,371 | |
| Accrued management fee | 455,262 | |
| Distribution and service plan fees payable | 12,038 | |
| Other affiliated payables | 128,540 | |
| Other payables and accrued expenses | 89,897 | |
| Collateral on securities loaned | 11,055,319 | |
| Total liabilities | | 16,135,639 |
| Net Assets | | $757,487,141 |
| Net Assets consist of: | | |
| Paid in capital | | $645,152,592 |
| Total accumulated earnings (loss) | | 112,334,549 |
| Net Assets | | $757,487,141 |
| Net Asset Value and Maximum Offering Price | | |
| Class A: | | |
| Net Asset Value and redemption price per share ($16,068,712 ÷ 1,016,830 shares)(a) | | $15.80 |
| Maximum offering price per share (100/94.25 of $15.80) | | $16.76 |
| Class M: | | |
| Net Asset Value and redemption price per share ($3,945,443 ÷ 251,100 shares)(a) | | $15.71 |
| Maximum offering price per share (100/96.50 of $15.71) | | $16.28 |
| Class C: | | |
| Net Asset Value and offering price per share ($8,828,598 ÷ 569,869 shares)(a) | | $15.49 |
| Japan: | | |
| Net Asset Value, offering price and redemption price per share ($401,344,330 ÷ 25,309,248 shares) | | $15.86 |
| Class I: | | |
| Net Asset Value, offering price and redemption price per share ($319,164,494 ÷ 20,141,298 shares) | | $15.85 |
| Class Z: | | |
| Net Asset Value, offering price and redemption price per share ($8,135,564 ÷ 513,581 shares) | | $15.84 |
(a) Redemption price per share is equal to net asset value less any applicable contingent deferred sales charge.
See accompanying notes which are an integral part of the financial statements.
Statement of Operations
| | | Year ended October 31, 2019 |
| Investment Income | | |
| Dividends | | $13,115,714 |
| Interest | | 1,436 |
| Income from Fidelity Central Funds (including $181,952 from security lending) | | 498,775 |
| Income before foreign taxes withheld | | 13,615,925 |
| Less foreign taxes withheld | | (1,309,387) |
| Total income | | 12,306,538 |
| Expenses | | |
| Management fee | | |
| Basic fee | $4,632,987 | |
| Performance adjustment | 329,798 | |
| Transfer agent fees | 1,161,489 | |
| Distribution and service plan fees | 161,740 | |
| Accounting and security lending fees | 332,087 | |
| Custodian fees and expenses | 61,145 | |
| Independent trustees' fees and expenses | 3,563 | |
| Registration fees | 100,286 | |
| Audit | 83,644 | |
| Legal | 1,678 | |
| Interest | 3,879 | |
| Miscellaneous | 3,265 | |
| Total expenses before reductions | 6,875,561 | |
| Expense reductions | (67,572) | |
| Total expenses after reductions | | 6,807,989 |
| Net investment income (loss) | | 5,498,549 |
| Realized and Unrealized Gain (Loss) | | |
| Net realized gain (loss) on: | | |
| Investment securities: | | |
| Unaffiliated issuers | 12,147,636 | |
| Fidelity Central Funds | (34) | |
| Foreign currency transactions | 210,132 | |
| Futures contracts | 124,181 | |
| Total net realized gain (loss) | | 12,481,915 |
| Change in net unrealized appreciation (depreciation) on: | | |
| Investment securities: | | |
| Unaffiliated issuers | 61,651,668 | |
| Fidelity Central Funds | (56) | |
| Assets and liabilities in foreign currencies | (412,587) | |
| Total change in net unrealized appreciation (depreciation) | | 61,239,025 |
| Net gain (loss) | | 73,720,940 |
| Net increase (decrease) in net assets resulting from operations | | $79,219,489 |
See accompanying notes which are an integral part of the financial statements.
Statement of Changes in Net Assets
| | Year ended October 31, 2019 | Year ended October 31, 2018 |
| Increase (Decrease) in Net Assets | | |
| Operations | | |
| Net investment income (loss) | $5,498,549 | $1,758,486 |
| Net realized gain (loss) | 12,481,915 | 41,576,809 |
| Change in net unrealized appreciation (depreciation) | 61,239,025 | (63,407,131) |
| Net increase (decrease) in net assets resulting from operations | 79,219,489 | (20,071,836) |
| Distributions to shareholders | (2,139,920) | (3,858,691) |
| Share transactions - net increase (decrease) | 158,952,766 | 88,029,029 |
| Redemption fees | – | 7,512 |
| Total increase (decrease) in net assets | 236,032,335 | 64,106,014 |
| Net Assets | | |
| Beginning of period | 521,454,806 | 457,348,792 |
| End of period | $757,487,141 | $521,454,806 |
See accompanying notes which are an integral part of the financial statements.
Financial Highlights
Fidelity Japan Fund Class A
| Years ended October 31, | 2019 | 2018 | 2017 | 2016 | 2015 |
| Selected Per–Share Data | | | | | |
| Net asset value, beginning of period | $14.15 | $15.08 | $12.59 | $11.87 | $11.65 |
| Income from Investment Operations | | | | | |
| Net investment income (loss)A | .07 | .03 | .06 | .06 | .04 |
| Net realized and unrealized gain (loss) | 1.58 | (.85) | 2.52 | .72 | .23 |
| Total from investment operations | 1.65 | (.82) | 2.58 | .78 | .27 |
| Distributions from net investment income | – | (.08) | (.06) | (.05) | (.05) |
| Distributions from net realized gain | – | (.04) | (.03) | (.01) | – |
| Total distributions | – | (.11)B | (.09) | (.06) | (.05) |
| Redemption fees added to paid in capitalA | – | –C | –C | –C | –C |
| Net asset value, end of period | $15.80 | $14.15 | $15.08 | $12.59 | $11.87 |
| Total ReturnD,E | 11.66% | (5.48)% | 20.70% | 6.56% | 2.31% |
| Ratios to Average Net AssetsF,G | | | | | |
| Expenses before reductions | 1.33% | 1.33% | 1.11% | 1.08% | 1.10% |
| Expenses net of fee waivers, if any | 1.32% | 1.33% | 1.11% | 1.08% | 1.10% |
| Expenses net of all reductions | 1.32% | 1.32% | 1.11% | 1.08% | 1.09% |
| Net investment income (loss) | .51% | .17% | .45% | .51% | .37% |
| Supplemental Data | | | | | |
| Net assets, end of period (000 omitted) | $16,069 | $14,587 | $16,155 | $23,910 | $23,918 |
| Portfolio turnover rateH | 27% | 40% | 23% | 15% | 35% |
A Calculated based on average shares outstanding during the period.
B Total distributions of $.11 per share is comprised of distributions from net investment income of $.078 and distributions from net realized gain of $.035 per share.
C Amount represents less than $.005 per share.
D Total returns would have been lower if certain expenses had not been reduced during the applicable periods shown.
E Total returns do not include the effect of the sales charges.
F Fees and expenses of any underlying Fidelity Central Funds are not included in the Fund's expense ratio. The Fund indirectly bears its proportionate share of the expenses of any underlying Fidelity Central Funds.
G Expense ratios reflect operating expenses of the class. Expenses before reductions do not reflect amounts reimbursed by the investment adviser or reductions from brokerage service arrangements or reductions from other expense offset arrangements and do not represent the amount paid by the class during periods when reimbursements or reductions occur. Expenses net of fee waivers reflect expenses after reimbursement by the investment adviser but prior to reductions from brokerage service arrangements or other expense offset arrangements. Expenses net of all reductions represent the net expenses paid by the class.
H Amount does not include the portfolio activity of any underlying Fidelity Central Funds.
See accompanying notes which are an integral part of the financial statements.
Fidelity Japan Fund Class M
| Years ended October 31, | 2019 | 2018 | 2017 | 2016 | 2015 |
| Selected Per–Share Data | | | | | |
| Net asset value, beginning of period | $14.11 | $15.06 | $12.57 | $11.85 | $11.62 |
| Income from Investment Operations | | | | | |
| Net investment income (loss)A | .03 | (.03) | .01 | .02 | –B |
| Net realized and unrealized gain (loss) | 1.57 | (.84) | 2.52 | .71 | .23 |
| Total from investment operations | 1.60 | (.87) | 2.53 | .73 | .23 |
| Distributions from net investment income | – | (.05) | (.01) | –B | – |
| Distributions from net realized gain | – | (.04) | (.03) | (.01) | – |
| Total distributions | – | (.08)C | (.04) | (.01) | – |
| Redemption fees added to paid in capitalA | – | –B | –B | –B | –B |
| Net asset value, end of period | $15.71 | $14.11 | $15.06 | $12.57 | $11.85 |
| Total ReturnD,E | 11.34% | (5.81)% | 20.24% | 6.15% | 1.98% |
| Ratios to Average Net AssetsF,G | | | | | |
| Expenses before reductions | 1.64% | 1.67% | 1.46% | 1.44% | 1.43% |
| Expenses net of fee waivers, if any | 1.64% | 1.67% | 1.46% | 1.44% | 1.43% |
| Expenses net of all reductions | 1.63% | 1.66% | 1.46% | 1.44% | 1.42% |
| Net investment income (loss) | .19% | (.17)% | .10% | .16% | .04% |
| Supplemental Data | | | | | |
| Net assets, end of period (000 omitted) | $3,945 | $3,993 | $4,464 | $4,193 | $4,809 |
| Portfolio turnover rateH | 27% | 40% | 23% | 15% | 35% |
A Calculated based on average shares outstanding during the period.
B Amount represents less than $.005 per share.
C Total distributions of $.08 per share is comprised of distributions from net investment income of $.047 and distributions from net realized gain of $.035 per share.
D Total returns would have been lower if certain expenses had not been reduced during the applicable periods shown.
E Total returns do not include the effect of the sales charges.
F Fees and expenses of any underlying Fidelity Central Funds are not included in the Fund's expense ratio. The Fund indirectly bears its proportionate share of the expenses of any underlying Fidelity Central Funds.
G Expense ratios reflect operating expenses of the class. Expenses before reductions do not reflect amounts reimbursed by the investment adviser or reductions from brokerage service arrangements or reductions from other expense offset arrangements and do not represent the amount paid by the class during periods when reimbursements or reductions occur. Expenses net of fee waivers reflect expenses after reimbursement by the investment adviser but prior to reductions from brokerage service arrangements or other expense offset arrangements. Expenses net of all reductions represent the net expenses paid by the class.
H Amount does not include the portfolio activity of any underlying Fidelity Central Funds.
See accompanying notes which are an integral part of the financial statements.
Fidelity Japan Fund Class C
| Years ended October 31, | 2019 | 2018 | 2017 | 2016 | 2015 |
| Selected Per–Share Data | | | | | |
| Net asset value, beginning of period | $13.97 | $14.92 | $12.44 | $11.77 | $11.58 |
| Income from Investment Operations | | | | | |
| Net investment income (loss)A | (.02) | (.08) | (.03) | (.02) | (.04) |
| Net realized and unrealized gain (loss) | 1.54 | (.83) | 2.51 | .69 | .23 |
| Total from investment operations | 1.52 | (.91) | 2.48 | .67 | .19 |
| Distributions from net investment income | – | –B | – | – | – |
| Distributions from net realized gain | – | (.04) | – | – | – |
| Total distributions | – | (.04) | – | – | – |
| Redemption fees added to paid in capitalA | – | –B | –B | –B | –B |
| Net asset value, end of period | $15.49 | $13.97 | $14.92 | $12.44 | $11.77 |
| Total ReturnC,D | 10.88% | (6.13)% | 19.94% | 5.69% | 1.64% |
| Ratios to Average Net AssetsE,F | | | | | |
| Expenses before reductions | 2.01% | 2.04% | 1.81% | 1.81% | 1.81% |
| Expenses net of fee waivers, if any | 2.00% | 2.03% | 1.81% | 1.81% | 1.81% |
| Expenses net of all reductions | 2.00% | 2.03% | 1.81% | 1.81% | 1.80% |
| Net investment income (loss) | (.17)% | (.53)% | (.25)% | (.21)% | (.34)% |
| Supplemental Data | | | | | |
| Net assets, end of period (000 omitted) | $8,829 | $12,586 | $13,542 | $15,077 | $18,491 |
| Portfolio turnover rateG | 27% | 40% | 23% | 15% | 35% |
A Calculated based on average shares outstanding during the period.
B Amount represents less than $.005 per share.
C Total returns would have been lower if certain expenses had not been reduced during the applicable periods shown.
D Total returns do not include the effect of the contingent deferred sales charge.
E Fees and expenses of any underlying Fidelity Central Funds are not included in the Fund's expense ratio. The Fund indirectly bears its proportionate share of the expenses of any underlying Fidelity Central Funds.
F Expense ratios reflect operating expenses of the class. Expenses before reductions do not reflect amounts reimbursed by the investment adviser or reductions from brokerage service arrangements or reductions from other expense offset arrangements and do not represent the amount paid by the class during periods when reimbursements or reductions occur. Expenses net of fee waivers reflect expenses after reimbursement by the investment adviser but prior to reductions from brokerage service arrangements or other expense offset arrangements. Expenses net of all reductions represent the net expenses paid by the class.
G Amount does not include the portfolio activity of any underlying Fidelity Central Funds.
See accompanying notes which are an integral part of the financial statements.
Fidelity Japan Fund
| Years ended October 31, | 2019 | 2018 | 2017 | 2016 | 2015 |
| Selected Per–Share Data | | | | | |
| Net asset value, beginning of period | $14.20 | $15.13 | $12.64 | $11.91 | $11.69 |
| Income from Investment Operations | | | | | |
| Net investment income (loss)A | .12 | .07 | .10 | .09 | .08 |
| Net realized and unrealized gain (loss) | 1.59 | (.86) | 2.54 | .72 | .23 |
| Total from investment operations | 1.71 | (.79) | 2.64 | .81 | .31 |
| Distributions from net investment income | (.05) | (.11) | (.11) | (.07) | (.09) |
| Distributions from net realized gain | – | (.04) | (.03) | (.01) | – |
| Total distributions | (.05) | (.14)B | (.15)C | (.08) | (.09) |
| Redemption fees added to paid in capitalA | – | –D | –D | –D | –D |
| Net asset value, end of period | $15.86 | $14.20 | $15.13 | $12.64 | $11.91 |
| Total ReturnE | 12.10% | (5.28)% | 21.13% | 6.80% | 2.66% |
| Ratios to Average Net AssetsF,G | | | | | |
| Expenses before reductions | 1.01% | 1.05% | .82% | .78% | .80% |
| Expenses net of fee waivers, if any | 1.01% | 1.05% | .82% | .78% | .80% |
| Expenses net of all reductions | 1.00% | 1.04% | .82% | .78% | .79% |
| Net investment income (loss) | .82% | .45% | .74% | .81% | .67% |
| Supplemental Data | | | | | |
| Net assets, end of period (000 omitted) | $401,344 | $297,644 | $247,372 | $352,936 | $485,803 |
| Portfolio turnover rateH | 27% | 40% | 23% | 15% | 35% |
A Calculated based on average shares outstanding during the period.
B Total distributions of $.14 per share is comprised of distributions from net investment income of $.107 and distributions from net realized gain of $.035 per share.
C Total distributions of $.15 per share is comprised of distributions from net investment income of $.112 and distributions from net realized gain of $.034 per share.
D Amount represents less than $.005 per share.
E Total returns would have been lower if certain expenses had not been reduced during the applicable periods shown.
F Fees and expenses of any underlying Fidelity Central Funds are not included in the Fund's expense ratio. The Fund indirectly bears its proportionate share of the expenses of any underlying Fidelity Central Funds.
G Expense ratios reflect operating expenses of the class. Expenses before reductions do not reflect amounts reimbursed by the investment adviser or reductions from brokerage service arrangements or reductions from other expense offset arrangements and do not represent the amount paid by the class during periods when reimbursements or reductions occur. Expenses net of fee waivers reflect expenses after reimbursement by the investment adviser but prior to reductions from brokerage service arrangements or other expense offset arrangements. Expenses net of all reductions represent the net expenses paid by the class.
H Amount does not include the portfolio activity of any underlying Fidelity Central Funds.
See accompanying notes which are an integral part of the financial statements.
Fidelity Japan Fund Class I
| Years ended October 31, | 2019 | 2018 | 2017 | 2016 | 2015 |
| Selected Per–Share Data | | | | | |
| Net asset value, beginning of period | $14.18 | $15.12 | $12.62 | $11.89 | $11.67 |
| Income from Investment Operations | | | | | |
| Net investment income (loss)A | .13 | .08 | .11 | .10 | .08 |
| Net realized and unrealized gain (loss) | 1.58 | (.85) | 2.53 | .70 | .23 |
| Total from investment operations | 1.71 | (.77) | 2.64 | .80 | .31 |
| Distributions from net investment income | (.04) | (.14) | (.11) | (.07) | (.09) |
| Distributions from net realized gain | – | (.04) | (.03) | (.01) | – |
| Total distributions | (.04) | (.17)B | (.14) | (.07)C | (.09) |
| Redemption fees added to paid in capitalA | – | –D | –D | –D | –D |
| Net asset value, end of period | $15.85 | $14.18 | $15.12 | $12.62 | $11.89 |
| Total ReturnE | 12.12% | (5.18)% | 21.22% | 6.77% | 2.72% |
| Ratios to Average Net AssetsF,G | | | | | |
| Expenses before reductions | .96% | .98% | .76% | .77% | .80% |
| Expenses net of fee waivers, if any | .96% | .98% | .76% | .77% | .80% |
| Expenses net of all reductions | .95% | .97% | .76% | .76% | .79% |
| Net investment income (loss) | .87% | .52% | .80% | .83% | .67% |
| Supplemental Data | | | | | |
| Net assets, end of period (000 omitted) | $319,164 | $192,555 | $175,816 | $7,032 | $13,957 |
| Portfolio turnover rateH | 27% | 40% | 23% | 15% | 35% |
A Calculated based on average shares outstanding during the period.
B Total distributions of $.17 per share is comprised of distributions from net investment income of $.135 and distributions from net realized gain of $.035 per share.
C Total distributions of $.07 per share is comprised of distributions from net investment income of $.065 and distributions from net realized gain of $.006 per share.
D Amount represents less than $.005 per share.
E Total returns would have been lower if certain expenses had not been reduced during the applicable periods shown.
F Fees and expenses of any underlying Fidelity Central Funds are not included in the Fund's expense ratio. The Fund indirectly bears its proportionate share of the expenses of any underlying Fidelity Central Funds.
G Expense ratios reflect operating expenses of the class. Expenses before reductions do not reflect amounts reimbursed by the investment adviser or reductions from brokerage service arrangements or reductions from other expense offset arrangements and do not represent the amount paid by the class during periods when reimbursements or reductions occur. Expenses net of fee waivers reflect expenses after reimbursement by the investment adviser but prior to reductions from brokerage service arrangements or other expense offset arrangements. Expenses net of all reductions represent the net expenses paid by the class.
H Amount does not include the portfolio activity of any underlying Fidelity Central Funds.
See accompanying notes which are an integral part of the financial statements.
Fidelity Japan Fund Class Z
| Years ended October 31, | 2019 | 2018 A |
| Selected Per–Share Data | | |
| Net asset value, beginning of period | $14.19 | $15.77 |
| Income from Investment Operations | | |
| Net investment income (loss)B | .14 | (.01) |
| Net realized and unrealized gain (loss) | 1.57 | (1.57) |
| Total from investment operations | 1.71 | (1.58) |
| Distributions from net investment income | (.06) | – |
| Distributions from net realized gain | – | – |
| Total distributions | (.06) | – |
| Net asset value, end of period | $15.84 | $14.19 |
| Total ReturnC,D | 12.14% | (10.02)% |
| Ratios to Average Net AssetsE,F | | |
| Expenses before reductions | .87% | .96%G |
| Expenses net of fee waivers, if any | .87% | .96%G |
| Expenses net of all reductions | .86% | .95%G |
| Net investment income (loss) | .96% | (.73)%G |
| Supplemental Data | | |
| Net assets, end of period (000 omitted) | $8,136 | $90 |
| Portfolio turnover rateH | 27% | 40% |
A For the period October 2, 2018 (commencement of sale of shares) to October 31, 2018.
B Calculated based on average shares outstanding during the period.
C Total returns for periods of less than one year are not annualized.
D Total returns would have been lower if certain expenses had not been reduced during the applicable periods shown.
E Fees and expenses of any underlying Fidelity Central Funds are not included in the Fund's expense ratio. The Fund indirectly bears its proportionate share of the expenses of any underlying Fidelity Central Funds.
F Expense ratios reflect operating expenses of the class. Expenses before reductions do not reflect amounts reimbursed by the investment adviser or reductions from brokerage service arrangements or reductions from other expense offset arrangements and do not represent the amount paid by the class during periods when reimbursements or reductions occur. Expense ratios before reductions for start-up periods may not be representative of longer-term operating periods. Expenses net of fee waivers reflect expenses after reimbursement by the investment adviser but prior to reductions from brokerage service arrangements or other expense offset arrangements. Expenses net of all reductions represent the net expenses paid by the class.
G Annualized
H Amount does not include the portfolio activity of any underlying Fidelity Central Funds.
See accompanying notes which are an integral part of the financial statements.
Notes to Financial Statements
For the period ended October 31, 2019
1. Organization.
Fidelity Japan Fund (the Fund) is a fund of Fidelity Investment Trust (the Trust) and is authorized to issue an unlimited number of shares. The Trust is registered under the Investment Company Act of 1940, as amended (the 1940 Act), as an open-end management investment company organized as a Massachusetts business trust. The Fund offers Class A, Class M, Class C, Japan, Class I and Class Z shares, each of which has equal rights as to assets and voting privileges. Each class has exclusive voting rights with respect to matters that affect that class. Effective March 1, 2019, Class C shares will automatically convert to Class A shares after a holding period of ten years from the initial date of purchase, with certain exceptions.
2. Investments in Fidelity Central Funds.
The Fund invests in Fidelity Central Funds, which are open-end investment companies generally available only to other investment companies and accounts managed by the investment adviser and its affiliates. The Fund's Schedule of Investments lists each of the Fidelity Central Funds held as of period end, if any, as an investment of the Fund, but does not include the underlying holdings of each Fidelity Central Fund. As an Investing Fund, the Fund indirectly bears its proportionate share of the expenses of the underlying Fidelity Central Funds.
The Money Market Central Funds seek preservation of capital and current income and are managed by Fidelity Investments Money Management, Inc. (FIMM), an affiliate of the investment adviser. Annualized expenses of the Money Market Central Funds as of their most recent shareholder report date ranged from less than .005% to .01%.
A complete unaudited list of holdings for each Fidelity Central Fund is available upon request or at the Securities and Exchange Commission (the SEC) website at www.sec.gov. In addition, the financial statements of the Fidelity Central Funds, which are not covered by the Fund's Report of Independent Registered Public Accounting Firm, are available on the SEC website or upon request.
3. Significant Accounting Policies.
The Fund is an investment company and applies the accounting and reporting guidance of the Financial Accounting Standards Board (FASB) Accounting Standards Codification Topic 946 Financial Services – Investments Companies. The financial statements have been prepared in conformity with accounting principles generally accepted in the United States of America (GAAP), which require management to make certain estimates and assumptions at the date of the financial statements. Actual results could differ from those estimates. Subsequent events, if any, through the date that the financial statements were issued have been evaluated in the preparation of the financial statements. The following summarizes the significant accounting policies of the Fund:
Investment Valuation. Investments are valued as of 4:00 p.m. Eastern time on the last calendar day of the period. The Board of Trustees (the Board) has delegated the day to day responsibility for the valuation of the Fund's investments to the Fair Value Committee (the Committee) established by the Fund's investment adviser. In accordance with valuation policies and procedures approved by the Board, the Fund attempts to obtain prices from one or more third party pricing vendors or brokers to value its investments. When current market prices, quotations or currency exchange rates are not readily available or reliable, investments will be fair valued in good faith by the Committee, in accordance with procedures adopted by the Board. Factors used in determining fair value vary by investment type and may include market or investment specific events. The frequency with which these procedures are used cannot be predicted and they may be utilized to a significant extent. The Committee oversees the Fund's valuation policies and procedures and reports to the Board on the Committee's activities and fair value determinations. The Board monitors the appropriateness of the procedures used in valuing the Fund's investments and ratifies the fair value determinations of the Committee.
The Fund categorizes the inputs to valuation techniques used to value its investments into a disclosure hierarchy consisting of three levels as shown below:
- Level 1 – quoted prices in active markets for identical investments
- Level 2 – other significant observable inputs (including quoted prices for similar investments, interest rates, prepayment speeds, etc.)
- Level 3 – unobservable inputs (including the Fund's own assumptions based on the best information available)
Valuation techniques used to value the Fund's investments by major category are as follows:
Equity securities, including restricted securities, for which market quotations are readily available, are valued at the last reported sale price or official closing price as reported by a third party pricing vendor on the primary market or exchange on which they are traded and are categorized as Level 1 in the hierarchy. In the event there were no sales during the day or closing prices are not available, securities are valued at the last quoted bid price or may be valued using the last available price and are generally categorized as Level 2 in the hierarchy. For foreign equity securities, when market or security specific events arise, comparisons to the valuation of American Depositary Receipts (ADRs), futures contracts, Exchange-Traded Funds (ETFs) and certain indexes as well as quoted prices for similar securities may be used and would be categorized as Level 2 in the hierarchy. For equity securities, including restricted securities, where observable inputs are limited, assumptions about market activity and risk are used and these securities may be categorized as Level 3 in the hierarchy.
Investments in open-end mutual funds, including the Fidelity Central Funds, are valued at their closing net asset value (NAV) each business day and are categorized as Level 1 in the hierarchy
Changes in valuation techniques may result in transfers in or out of an assigned level within the disclosure hierarchy. The aggregate value of investments by input level as of October 31, 2019 is included at the end of the Fund's Schedule of Investments.
Foreign Currency. The Fund may use foreign currency contracts to facilitate transactions in foreign-denominated securities. Gains and losses from these transactions may arise from changes in the value of the foreign currency or if the counterparties do not perform under the contracts' terms.
Foreign-denominated assets, including investment securities, and liabilities are translated into U.S. dollars at the exchange rates at period end. Purchases and sales of investment securities, income and dividends received and expenses denominated in foreign currencies are translated into U.S. dollars at the exchange rate in effect on the transaction date.
The effects of exchange rate fluctuations on investments are included with the net realized and unrealized gain (loss) on investment securities. Other foreign currency transactions resulting in realized and unrealized gain (loss) are disclosed separately.
Investment Transactions and Income. For financial reporting purposes, the Fund's investment holdings and NAV include trades executed through the end of the last business day of the period. The NAV per share for processing shareholder transactions is calculated as of the close of business of the New York Stock Exchange (NYSE), normally 4:00 p.m. Eastern time and includes trades executed through the end of the prior business day. Gains and losses on securities sold are determined on the basis of identified cost. Dividend income is recorded on the ex-dividend date, except for certain dividends from foreign securities where the ex-dividend date may have passed, which are recorded as soon as the Fund is informed of the ex-dividend date. Non-cash dividends included in dividend income, if any, are recorded at the fair market value of the securities received. Income and capital gain distributions from Fidelity Central Funds, if any, are recorded on the ex-dividend date. Interest income is accrued as earned and includes coupon interest and amortization of premium and accretion of discount on debt securities as applicable. Investment income is recorded net of foreign taxes withheld where recovery of such taxes is uncertain.
Class Allocations and Expenses. Investment income, realized and unrealized capital gains and losses, common expenses of the Fund, and certain fund-level expense reductions, if any, are allocated daily on a pro-rata basis to each class based on the relative net assets of each class to the total net assets of the Fund. Each class differs with respect to transfer agent and distribution and service plan fees incurred. Certain expense reductions may also differ by class. For the reporting period, the allocated portion of income and expenses to each class as a percent of its average net assets may vary due to the timing of recording these transactions in relation to fluctuating net assets of the classes. Expenses directly attributable to a fund are charged to that fund. Expenses attributable to more than one fund are allocated among the respective funds on the basis of relative net assets or other appropriate methods. Expense estimates are accrued in the period to which they relate and adjustments are made when actual amounts are known.
Income Tax Information and Distributions to Shareholders. Each year, the Fund intends to qualify as a regulated investment company under Subchapter M of the Internal Revenue Code, including distributing substantially all of its taxable income and realized gains. As a result, no provision for U.S. Federal income taxes is required. As of October 31, 2019, the Fund did not have any unrecognized tax benefits in the financial statements; nor is the Fund aware of any tax positions for which it is reasonably possible that the total amounts of unrecognized tax benefits will significantly change in the next twelve months. The Fund files a U.S. federal tax return, in addition to state and local tax returns as required. The Fund's federal income tax returns are subject to examination by the Internal Revenue Service (IRS) for a period of three fiscal years after they are filed. State and local tax returns may be subject to examination for an additional fiscal year depending on the jurisdiction. Foreign taxes are provided for based on the Fund's understanding of the tax rules and rates that exist in the foreign markets in which it invests.
Distributions are declared and recorded on the ex-dividend date. Income and capital gain distributions are declared separately for each class. Income and capital gain distributions are determined in accordance with income tax regulations, which may differ from GAAP.
Capital accounts within the financial statements are adjusted for permanent book-tax differences. These adjustments have no impact on net assets or the results of operations. Capital accounts are not adjusted for temporary book-tax differences which will reverse in a subsequent period.
Book-tax differences are primarily due to, foreign currency transactions, passive foreign investment companies (PFIC), market discount, capital loss carryforwards, expiring capital loss carryforwards and losses deferred due to wash sales.
As of period end, the cost and unrealized appreciation (depreciation) in securities, and derivatives if applicable, for federal income tax purposes were as follows:
| Gross unrealized appreciation | $135,156,130 |
| Gross unrealized depreciation | (32,155,111) |
| Net unrealized appreciation (depreciation) | $103,001,019 |
| Tax Cost | $663,843,769 |
The tax-based components of distributable earnings as of period end were as follows:
| Undistributed ordinary income | $9,337,406 |
| Net unrealized appreciation (depreciation) on securities and other investments | $102,997,144 |
The tax character of distributions paid was as follows:
| | October 31, 2019 | October 31, 2018 |
| Ordinary Income | $2,139,920 | $ 3,858,691 |
4. Derivative Instruments.
Risk Exposures and the Use of Derivative Instruments. The Fund's investment objective allows the Fund to enter into various types of derivative contracts, including futures contracts. Derivatives are investments whose value is primarily derived from underlying assets, indices or reference rates and may be transacted on an exchange or over-the-counter (OTC). Derivatives may involve a future commitment to buy or sell a specified asset based on specified terms, to exchange future cash flows at periodic intervals based on a notional principal amount, or for one party to make one or more payments upon the occurrence of specified events in exchange for periodic payments from the other party.
The Fund used derivatives to increase returns and to manage exposure to certain risks as defined below. The success of any strategy involving derivatives depends on analysis of numerous economic factors, and if the strategies for investment do not work as intended, the Fund may not achieve its objectives.
The Fund's use of derivatives increased or decreased its exposure to the following risk:
| Equity Risk | Equity risk relates to the fluctuations in the value of financial instruments as a result of changes in market prices (other than those arising from interest rate risk or foreign exchange risk), whether caused by factors specific to an individual investment, its issuer, or all factors affecting all instruments traded in a market or market segment.
|
The Fund is also exposed to additional risks from investing in derivatives, such as liquidity risk and counterparty credit risk. Liquidity risk is the risk that the Fund will be unable to close out the derivative in the open market in a timely manner. Counterparty credit risk is the risk that the counterparty will not be able to fulfill its obligation to the Fund. Counterparty credit risk related to exchange-traded futures contracts exchange on which they trade.
Investing in derivatives may involve greater risks than investing in the underlying assets directly and, to varying degrees, may involve risk of loss in excess of any initial investment and collateral received and amounts recognized in the Statement of Assets and Liabilities. In addition, there may be the risk that the change in value of the derivative contract does not correspond to the change in value of the underlying instrument.
Futures Contracts. A futures contract is an agreement between two parties to buy or sell a specified underlying instrument for a fixed price at a specified future date. The Fund used futures contracts to manage its exposure to the stock market.
Upon entering into a futures contract, a fund is required to deposit either cash or securities (initial margin) with a clearing broker in an amount equal to a certain percentage of the face value of the contract. Futures contracts are marked-to-market daily and subsequent daily payments (variation margin) are made or received by a fund depending on the daily fluctuations in the value of the futures contracts and are recorded as unrealized appreciation or (depreciation). This receivable and/or payable, if any, is included in daily variation margin on futures contracts in the Statement of Assets and Liabilities. Realized gain or (loss) is recorded upon the expiration or closing of a futures contract. The net realized gain (loss) and change in net unrealized appreciation (depreciation) on futures contracts during the period is presented in the Statement of Operations.
Any open futures contracts at period end are presented in the Schedule of Investments under the caption "Futures Contracts". The notional amount at value reflects each contract's exposure to the underlying instrument or index at period end.
5. Purchases and Sales of Investments.
Purchases and sales of securities, other than short-term securities, aggregated $321,965,582 and $174,654,529, respectively.
6. Fees and Other Transactions with Affiliates.
Management Fee. Fidelity Management & Research Company (the investment adviser) and its affiliates provide the Fund with investment management related services for which the Fund pays a monthly management fee. The management fee is the sum of an individual fund fee rate that is based on an annual rate of .45% of the Fund's average net assets and an annualized group fee rate that averaged .24% during the period. The group fee rate is based upon the average net assets of all the mutual funds advised by the investment adviser, including any mutual funds previously advised by the investment adviser that are currently advised by Fidelity SelectCo, LLC, an affiliate of the investment adviser. The group fee rate decreases as assets under management increase and increases as assets under management decrease. In addition, the management fee is subject to a performance adjustment (up to a maximum of +/- .20% of the Fund's average net assets over a 36 month performance period). The upward or downward adjustment to the management fee is based on the relative investment performance of Japan as compared to its benchmark index, the TOPIX, over the same 36 month performance period. For the reporting period, the total annual management fee rate, including the performance adjustment, was .74% of the Fund's average net assets. The performance adjustment included in the management fee rate may be higher or lower than the maximum performance adjustment rate due to the difference between the average net assets for the reporting and performance periods.
Distribution and Service Plan Fees. In accordance with Rule 12b-1 of the 1940 Act, the Fund has adopted separate Distribution and Service Plans for each class of shares. Certain classes pay Fidelity Distributors Corporation (FDC), an affiliate of the investment adviser, separate Distribution and Service Fees, each of which is based on an annual percentage of each class' average net assets. In addition, FDC may pay financial intermediaries for selling shares of the Fund and providing shareholder support services. For the period, the Distribution and Service Fee rates, total fees and amounts retained by FDC were as follows:
| | Distribution Fee | Service Fee | Total Fees | Retained by FDC |
| Class A | -% | .25% | $36,302 | $693 |
| Class M | .25% | .25% | 19,010 | 203 |
| Class C | .75% | .25% | 106,428 | 9,498 |
| | | | $161,740 | $10,394 |
Sales Load. FDC may receive a front-end sales charge of up to 5.75% for selling Class A shares and 3.50% for selling Class M shares, some of which is paid to financial intermediaries for selling shares of the Fund. Depending on the holding period, FDC may receive contingent deferred sales charges levied on Class A, Class M and Class C redemptions. The deferred sales charges are 1.00% for Class C shares, 1.00% for certain purchases of Class A shares and .25% for certain purchases of Class M shares.
For the period, sales charge amounts retained by FDC were as follows:
| | Retained by FDC |
| Class A | $3,158 |
| Class M | 317 |
| Class C(a) | 875 |
| | $4,350 |
(a) When Class C shares are initially sold, FDC pays commissions from its own resources to financial intermediaries through which the sales are made.
Transfer Agent Fees. Fidelity Investments Institutional Operations Company, Inc., (FIIOC), an affiliate of the investment adviser, is the transfer, dividend disbursing and shareholder servicing agent for each class of the Fund. FIIOC receives account fees and asset-based fees that vary according to the account size and type of account of the shareholders of the respective classes of the Fund, Class Z. FIIOC receives an asset-based fee of Class K's average net assets. FIIOC pays for typesetting, printing and mailing of shareholder reports, except proxy statements.
For the period, transfer agent fees for each class were as follows:
| | Amount | % of Class-Level Average Net Assets |
| Class A | $37,140 | .26 |
| Class M | 12,210 | .32 |
| Class C | 19,285 | .18 |
| Japan | 749,174 | .19 |
| Class I | 342,842 | .14 |
| Class Z | 838 | .04 |
| | $1,161,489 | |
Accounting and Security Lending Fees. Fidelity Service Company, Inc. (FSC), an affiliate of the investment adviser, maintains the Fund's accounting records. The accounting fee is based on the level of average net assets for each month. Prior to April 1, 2019, FSC had a separate agreement with the Fund for administration of the security lending program, based on the number and duration of lending transactions. For the period, the total fees paid for accounting and administration of securities lending were equivalent to an annual rate of .05%.
Brokerage Commissions. The Fund placed a portion of its portfolio transactions with brokerage firms which are affiliates of the investment adviser. Brokerage commissions are included in net realized gain (loss) and change in net unrealized appreciation (depreciation) in the Statement of Operations. The commissions paid to these affiliated firms were $58 for the period.
Interfund Lending Program. Pursuant to an Exemptive Order issued by the SEC, the Fund, along with other registered investment companies having management contracts with Fidelity Management & Research Company (FMR) or other affiliated entities of FMR, may participate in an interfund lending program. This program provides an alternative credit facility allowing the funds to borrow from, or lend money to, other participating affiliated funds. At period end, there were no interfund loans outstanding. The Fund's activity in this program during the period for which loans were outstanding was as follows:
| Borrower or Lender | Average Loan Balance | Weighted Average Interest Rate | Interest Expense |
| Borrower | $17,680,333 | 2.63% | $3,879 |
Interfund Trades. The Fund may purchase from or sell securities to other Fidelity Funds under procedures adopted by the Board. The procedures have been designed to ensure these interfund trades are executed in accordance with Rule 17a-7 of the 1940 Act. Interfund trades are included within the respective purchases and sales amounts shown in the Purchases and Sales of Investments note.
7. Committed Line of Credit.
The Fund participates with other funds managed by the investment adviser or an affiliate in a $4.25 billion credit facility (the "line of credit") to be utilized for temporary or emergency purposes to fund shareholder redemptions or for other short-term liquidity purposes. The Fund has agreed to pay commitment fees on its pro-rata portion of the line of credit, which amounted to $1,703 and is reflected in Miscellaneous expenses on the Statement of Operations. During the period, the Fund did not borrow on this line of credit.
8. Security Lending.
The Fund lends portfolio securities from time to time in order to earn additional income. For equity securities, lending agents are used, including National Financial Services (NFS), an affiliate of the Fund. Pursuant to a securities lending agreement, NFS will receive a fee, which is capped at 9.9% of daily lending revenue, for its services as lending agent. The Fund may lend securities to certain qualified borrowers, including NFS. On the settlement date of the loan, the Fund receives collateral (in the form of U.S. Treasury obligations, letters of credit and/or cash) against the loaned securities and maintains collateral in an amount not less than 100% of the market value of the loaned securities during the period of the loan. The market value of the loaned securities is determined at the close of business of the Fund and any additional required collateral is delivered to the Fund on the next business day. The Fund or borrower may terminate the loan at any time, and if the borrower defaults on its obligation to return the securities loaned because of insolvency or other reasons, the Fund may apply collateral received from the borrower against the obligation. The Fund may experience delays and costs in recovering the securities loaned. Any cash collateral received is invested in the Fidelity Securities Lending Cash Central Fund. The value of loaned securities and cash collateral at period end are disclosed on the Fund's Statement of Assets and Liabilities. Security lending income represents the income earned on investing cash collateral, less rebates paid to borrowers and any lending agent fees associated with the loan, plus any premium payments received for lending certain types of securities. Security lending income is presented in the Statement of Operations as a component of income from Fidelity Central Funds. During the period, there were no securities loaned to NFS.
9. Expense Reductions.
Commissions paid to certain brokers with whom the investment adviser, or its affiliates, places trades on behalf of the Fund include an amount in addition to trade execution, which may be rebated back to the Fund to offset certain expenses. This amount totaled $46,502 for the period.
In addition, during the period the investment adviser reimbursed and/or waived a portion of fund-level operating expenses in the amount of $5,070 and a portion of class-level operating expenses as follows:
| | Amount |
| Class A | $325 |
| Class M | 91 |
| Class C | 286 |
| Japan | 10,002 |
| Class I | 5,288 |
| Class Z | 8 |
| | $16,000 |
10. Distributions to Shareholders.
Distributions to shareholders of each class were as follows:
| | Year ended
October 31, 2019 | Year ended
October 31, 2018(a) |
| Distributions to shareholders | | |
| Class A | $– | $121,236 |
| Class M | – | 24,538 |
| Class C | – | 35,656 |
| Japan | 1,540,617 | 1,679,410 |
| Class I | 598,003 | 1,997,851 |
| Class Z | 1,300 | – |
| Total | $2,139,920 | $3,858,691 |
(a) Distributions for Class Z are for the period October 2, 2018 (commencement of sale of shares) to October 31, 2018.
11. Share Transactions.
Share transactions for each class were as follows and may contain automatic conversions between classes or exchanges between affiliated funds:
| | Shares | Shares | Dollars | Dollars |
| | Year ended October 31, 2019 | Year ended October 31, 2018(a) | Year ended October 31, 2019 | Year ended October 31, 2018(a) |
| Class A | | | | |
| Shares sold | 257,296 | 227,462 | $3,675,072 | $3,578,036 |
| Reinvestment of distributions | – | 7,603 | – | 116,628 |
| Shares redeemed | (271,258) | (275,394) | (3,843,441) | (4,276,195) |
| Net increase (decrease) | (13,962) | (40,329) | $(168,369) | $(581,531) |
| Class M | | | | |
| Shares sold | 9,337 | 26,530 | $133,363 | $416,546 |
| Reinvestment of distributions | – | 1,589 | – | 24,389 |
| Shares redeemed | (41,158) | (41,543) | (593,314) | (648,170) |
| Net increase (decrease) | (31,821) | (13,424) | $(459,951) | $(207,235) |
| Class C | | | | |
| Shares sold | 37,703 | 247,078 | $525,026 | $3,881,516 |
| Reinvestment of distributions | – | 2,227 | – | 33,918 |
| Shares redeemed | (368,937) | (255,967) | (5,208,165) | (3,954,581) |
| Net increase (decrease) | (331,234) | (6,662) | $(4,683,139) | $(39,147) |
| Japan | | | | |
| Shares sold | 11,302,166 | 13,428,936 | $161,493,452 | $195,751,878 |
| Reinvestment of distributions | 110,302 | 102,752 | 1,507,832 | 1,578,266 |
| Shares redeemed | (7,058,309) | (8,929,520) | (100,437,866) | (137,886,513) |
| Net increase (decrease) | 4,354,159 | 4,602,168 | $62,563,418 | $59,443,631 |
| Class I | | | | |
| Shares sold | 6,909,379 | 2,319,602 | $99,292,734 | $34,952,986 |
| Reinvestment of distributions | 43,742 | 129,754 | 597,082 | 1,987,832 |
| Shares redeemed | (389,348) | (501,872) | (5,566,323) | (7,627,507) |
| Net increase (decrease) | 6,563,773 | 1,947,484 | $94,323,493 | $29,313,311 |
| Class Z | | | | |
| Shares sold | 534,414 | 6,341 | $7,783,555 | $100,000 |
| Reinvestment of distributions | 64 | – | 875 | – |
| Shares redeemed | (27,238) | – | (407,116) | – |
| Net increase (decrease) | 507,240 | 6,341 | $7,377,314 | $100,000 |
(a) Share transactions for Class Z are for the period October 2, 2018 (commencement of sale of shares) to October 31, 2018.
12. Other.
The Fund's organizational documents provide former and current trustees and officers with a limited indemnification against liabilities arising in connection with the performance of their duties to the Fund. In the normal course of business, the Fund may also enter into contracts that provide general indemnifications. The Fund's maximum exposure under these arrangements is unknown as this would be dependent on future claims that may be made against the Fund. The risk of material loss from such claims is considered remote.
At the end of the period, VIP FundsManager 50% Portfolio, VIP FundsManager 60% Portfolio and Strategic Advisers Fidelity International Fund were the owners of record of approximately 12%, 15% and 34%, respectively, of the total outstanding shares of the Fund. Mutual funds managed by the investment adviser or its affiliates were the owners of record, in the aggregate, of approximately 75% of the total outstanding shares of the Fund.
Fidelity® Japan Smaller Companies Fund
Performance: The Bottom Line
Average annual total return reflects the change in the value of an investment, assuming reinvestment of distributions from dividend income and capital gains (the profits earned upon the sale of securities that have grown in value, if any) and assuming a constant rate of performance each year. The hypothetical investment and the average annual total returns do not reflect the deduction of taxes that a shareholder would pay on fund distributions or the redemption of fund shares. During periods of reimbursement by Fidelity, a fund’s total return will be greater than it would be had the reimbursement not occurred. How a fund did yesterday is no guarantee of how it will do tomorrow.
Average Annual Total Returns
| For the periods ended October 31, 2019 | Past 1 year | Past 5 years | Past 10 years |
| Fidelity® Japan Smaller Companies Fund | 8.22% | 9.50% | 10.20% |
$10,000 Over 10 Years
Let's say hypothetically that $10,000 was invested in Fidelity® Japan Smaller Companies Fund on October 31, 2009.
The chart shows how the value of your investment would have changed, and also shows how the Russell/Nomura Mid-Small Cap™ Index performed over the same period.
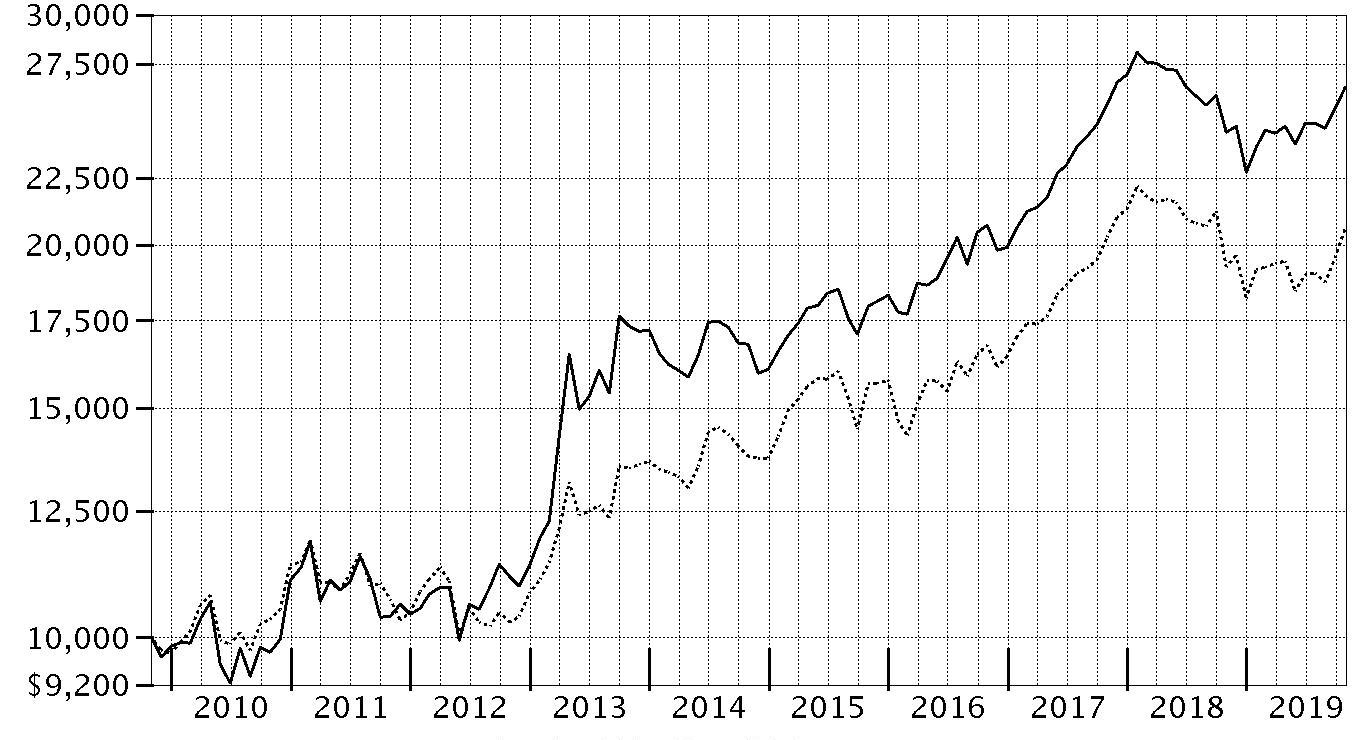
| Period Ending Values |
| $26,408 | Fidelity® Japan Smaller Companies Fund |
| $20,592 | Russell/Nomura Mid-Small Cap™ Index |
Fidelity® Japan Smaller Companies Fund
Management's Discussion of Fund Performance
Market Recap: The MSCI ACWI (All Country World Index) ex USA Index gained 11.47% for the 12 months ending October 31, 2019, as international stocks reflected a confluence of factors, including escalating trade tension, and moderating but still positive global economic growth. Currency fluctuations were largely modest and varied by region, muting the overall impact on international equity returns. In late December, the U.S. Federal Reserve shifted from raising interest rates to a more dovish policy in 2019, joining many foreign central banks. In June, international stocks rose 6.03%, as policy stimulus in China stabilized that country’s economic growth. The Fed cut its policy rate in July for the first time since 2008. However, the index returned -1.21% for the month, followed by -3.08% in August. In September, the Fed cut its policy rate another quarter point, citing concerns about slowing economic growth and muted inflation, and did the same in October, leading to monthly gains of 2.59% and 3.49%, respectively. For the full 12 months, the growth-oriented information technology sector (+22%) led the way, followed by utilities (+20%) and real estate (+18%), two high-dividend-yielding categories. Conversely, energy was roughly flat, while materials (+6%) and communication services (7%) also lagged. By region, Asia Pacific ex Japan (+16%), Europe ex U.K (+13%), Canada (+12%) and emerging markets (+12%) fared best. Meanwhile, the U.K. (+7%) and Japan (+10%) trailed the broader market.
Comments from Portfolio Manager David Jenkins: For the year, the fund gained 8.22%, outpacing the 7.20% advance of the benchmark Russell/Nomura Mid-Small Cap℠ Index. Investors in Japanese stocks were risk averse for much of the past 12 months but shifted toward higher risk, more economically sensitive stocks late in the period. Security selection, most notably in the consumer discretionary, information technology and consumer staples sectors, aided the fund’s relative performance. Versus the benchmark, the top individual contributor was an overweight stake in confectionery company Kotobuki Spirits, which posted an 80% gain this period thanks to positive consumer spending trends, as well as the company’s pricing power and the introduction of new products. Among consumer discretionary stocks, shares of Central Automotive Products (+48%) benefited from strong demand for the firm’s highly profitable aftermarket autobody coatings. Central Automotive was an overweighting and the fund’s top holding on October 31. Conversely, stocks picks in materials hurt relative performance. The biggest individual detractor was an overweighting in meat processor S Foods (-32%), whose stock declined due to disappointing profit margins domestically and weakness in its U.S. subsidiary.
The views expressed above reflect those of the portfolio manager(s) only through the end of the period as stated on the cover of this report and do not necessarily represent the views of Fidelity or any other person in the Fidelity organization. Any such views are subject to change at any time based upon market or other conditions and Fidelity disclaims any responsibility to update such views. These views may not be relied on as investment advice and, because investment decisions for a Fidelity fund are based on numerous factors, may not be relied on as an indication of trading intent on behalf of any Fidelity fund.
Fidelity® Japan Smaller Companies Fund
Investment Summary (Unaudited)
Geographic Diversification (% of fund's net assets)
| As of October 31, 2019 |
| | Japan | 94.2% |
| | United States of America* | 5.8% |

* Includes Short-Term investments and Net Other Assets (Liabilities).
Percentages are based on country or territory of incorporation and are adjusted for the effect of futures contracts, if applicable.
Asset Allocation as of October 31, 2019
| | % of fund's net assets |
| Stocks | 94.2 |
| Short-Term Investments and Net Other Assets (Liabilities) | 5.8 |
Top Ten Stocks as of October 31, 2019
| | % of fund's net assets |
| Central Automotive Products Ltd. (Distributors) | 2.5 |
| Yamada Consulting Group Co. Ltd. (Professional Services) | 2.0 |
| Amano Corp. (Electronic Equipment & Components) | 1.9 |
| Inaba Denki Sangyo Co. Ltd. (Trading Companies & Distributors) | 1.8 |
| Sumitomo Electric Industries Ltd. (Auto Components) | 1.7 |
| Koshidaka Holdings Co. Ltd. (Hotels, Restaurants & Leisure) | 1.7 |
| Otsuka Corp. (IT Services) | 1.7 |
| Sekisui Jushi Corp. (Building Products) | 1.6 |
| SK Kaken Co. Ltd. (Chemicals) | 1.6 |
| Mitsubishi Chemical Holdings Corp. (Chemicals) | 1.6 |
| | 18.1 |
Top Market Sectors as of October 31, 2019
| | % of fund's net assets |
| Industrials | 25.6 |
| Consumer Discretionary | 18.8 |
| Information Technology | 11.7 |
| Materials | 8.6 |
| Consumer Staples | 7.0 |
| Financials | 6.4 |
| Health Care | 5.6 |
| Communication Services | 4.4 |
| Utilities | 2.5 |
| Energy | 2.3 |
Fidelity® Japan Smaller Companies Fund
Schedule of Investments October 31, 2019
Showing Percentage of Net Assets
| Common Stocks - 94.2% | | | |
| | | Shares | Value |
| COMMUNICATION SERVICES - 4.4% | | | |
| Entertainment - 1.9% | | | |
| Daiichikosho Co. Ltd. | | 167,900 | $7,981,517 |
| DeNA Co. Ltd. | | 287,300 | 4,897,260 |
| | | | 12,878,777 |
| Interactive Media & Services - 1.1% | | | |
| Yahoo! Japan Corp. | | 2,545,000 | 7,835,338 |
| Media - 1.4% | | | |
| Hakuhodo DY Holdings, Inc. | | 650,000 | 9,699,763 |
|
| TOTAL COMMUNICATION SERVICES | | | 30,413,878 |
|
| CONSUMER DISCRETIONARY - 18.8% | | | |
| Auto Components - 5.1% | | | |
| Aisin Seiki Co. Ltd. | | 199,000 | 7,942,055 |
| Bridgestone Corp. | | 244,900 | 10,175,575 |
| DaikyoNishikawa Corp. | | 628,900 | 4,831,575 |
| Sumitomo Electric Industries Ltd. | | 869,500 | 11,924,113 |
| | | | 34,873,318 |
| Automobiles - 2.0% | | | |
| Isuzu Motors Ltd. | | 826,000 | 9,598,045 |
| Subaru Corp. | | 146,000 | 4,183,997 |
| | | | 13,782,042 |
| Distributors - 3.5% | | | |
| Central Automotive Products Ltd. | | 885,000 | 17,320,184 |
| PALTAC Corp. | | 136,000 | 6,558,669 |
| | | | 23,878,853 |
| Hotels, Restaurants & Leisure - 1.7% | | | |
| Koshidaka Holdings Co. Ltd. | | 817,000 | 11,863,663 |
| Internet & Direct Marketing Retail - 1.2% | | | |
| Aucnet, Inc. | | 575,000 | 7,897,279 |
| Specialty Retail - 4.4% | | | |
| Arc Land Sakamoto Co. Ltd. | | 493,700 | 5,823,791 |
| Fuji Corp. | | 340,600 | 6,948,688 |
| Nitori Holdings Co. Ltd. | | 68,600 | 10,441,684 |
| Workman Co. Ltd. (a) | | 100,000 | 7,077,935 |
| | | | 30,292,098 |
| Textiles, Apparel & Luxury Goods - 0.9% | | | |
| Hagihara Industries, Inc. | | 421,400 | 6,331,648 |
|
| TOTAL CONSUMER DISCRETIONARY | | | 128,918,901 |
|
| CONSUMER STAPLES - 7.0% | | | |
| Food & Staples Retailing - 3.3% | | | |
| Japan Meat Co. Ltd. (a) | | 372,400 | 7,617,355 |
| Kirindo Holdings Co. Ltd. | | 301,100 | 6,027,366 |
| San-A Co. Ltd. | | 184,000 | 8,712,791 |
| | | | 22,357,512 |
| Food Products - 3.7% | | | |
| Kotobuki Spirits Co. Ltd. | | 105,000 | 7,225,397 |
| Morinaga & Co. Ltd. | | 209,700 | 10,359,075 |
| S Foods, Inc. | | 302,700 | 8,155,484 |
| | | | 25,739,956 |
|
| TOTAL CONSUMER STAPLES | | | 48,097,468 |
|
| ENERGY - 2.3% | | | |
| Oil, Gas & Consumable Fuels - 2.3% | | | |
| Idemitsu Kosan Co. Ltd. | | 237,000 | 6,966,680 |
| San-Ai Oil Co. Ltd. | | 865,800 | 9,064,276 |
| | | | 16,030,956 |
| FINANCIALS - 6.4% | | | |
| Banks - 2.3% | | | |
| Mitsubishi UFJ Financial Group, Inc. | | 1,024,600 | 5,311,822 |
| Shinsei Bank Ltd. | | 658,300 | 10,262,733 |
| | | | 15,574,555 |
| Diversified Financial Services - 1.7% | | | |
| ORIX Corp. | | 456,800 | 7,178,564 |
| Ricoh Leasing Co. Ltd. | | 125,000 | 4,212,313 |
| | | | 11,390,877 |
| Insurance - 2.4% | | | |
| T&D Holdings, Inc. | | 878,000 | 9,778,936 |
| Tokio Marine Holdings, Inc. | | 124,500 | 6,731,170 |
| | | | 16,510,106 |
|
| TOTAL FINANCIALS | | | 43,475,538 |
|
| HEALTH CARE - 5.6% | | | |
| Health Care Equipment & Supplies - 2.1% | | | |
| Medikit Co. Ltd. | | 139,100 | 8,814,591 |
| Paramount Bed Holdings Co. Ltd. | | 138,900 | 5,311,121 |
| | | | 14,125,712 |
| Health Care Providers & Services - 1.5% | | | |
| A/S One Corp. | | 123,000 | 10,285,049 |
| Pharmaceuticals - 2.0% | | | |
| Santen Pharmaceutical Co. Ltd. | | 450,000 | 7,971,002 |
| Shionogi & Co. Ltd. | | 102,000 | 6,122,336 |
| | | | 14,093,338 |
|
| TOTAL HEALTH CARE | | | 38,504,099 |
|
| INDUSTRIALS - 25.6% | | | |
| Air Freight & Logistics - 0.7% | | | |
| AIT Corp. | | 573,220 | 4,892,098 |
| Airlines - 1.3% | | | |
| Japan Airlines Co. Ltd. | | 284,600 | 8,868,731 |
| Building Products - 1.6% | | | |
| Sekisui Jushi Corp. | | 546,300 | 11,186,634 |
| Commercial Services & Supplies - 2.7% | | | |
| Aeon Delight Co. Ltd. | | 178,800 | 6,226,776 |
| ProNexus, Inc. | | 328,323 | 3,852,506 |
| Secom Joshinetsu Co. Ltd. | | 258,000 | 8,352,233 |
| | | | 18,431,515 |
| Construction & Engineering - 1.7% | | | |
| Hokuriku Electrical Construction Co. Ltd. | | 854,300 | 7,774,084 |
| Toshiba Plant Systems & Services Corp. | | 184,500 | 3,604,906 |
| | | | 11,378,990 |
| Electrical Equipment - 1.3% | | | |
| Aichi Electric Co. Ltd. | | 193,100 | 4,914,182 |
| Denyo Co. Ltd. | | 212,600 | 3,729,870 |
| | | | 8,644,052 |
| Machinery - 2.7% | | | |
| CKD Corp. (a) | | 385,000 | 5,405,024 |
| Kawasaki Heavy Industries Ltd. | | 230,000 | 5,519,616 |
| Mitsubishi Heavy Industries Ltd. | | 191,700 | 7,757,978 |
| | | | 18,682,618 |
| Marine - 1.3% | | | |
| Nippon Concept Corp. | | 645,000 | 8,693,691 |
| Professional Services - 3.6% | | | |
| Funai Soken Holdings, Inc. | | 211,480 | 5,095,373 |
| Persol Holdings Co., Ltd. | | 325,000 | 6,242,607 |
| Yamada Consulting Group Co. Ltd. | | 752,700 | 13,569,801 |
| | | | 24,907,781 |
| Trading Companies & Distributors - 7.6% | | | |
| Chori Co. Ltd. | | 196,100 | 3,434,895 |
| Inaba Denki Sangyo Co. Ltd. | | 268,800 | 12,348,330 |
| Itochu Corp. | | 505,000 | 10,558,481 |
| Mitani Shoji Co. Ltd. | | 143,100 | 7,189,370 |
| Trusco Nakayama Corp. | | 242,550 | 5,864,599 |
| Tsubakimoto Kogyo Co. Ltd. | | 87,400 | 3,587,516 |
| Yuasa Trading Co. Ltd. | | 305,800 | 9,486,780 |
| | | | 52,469,971 |
| Transportation Infrastructure - 1.1% | | | |
| Kamigumi Co. Ltd. | | 322,000 | 7,280,791 |
|
| TOTAL INDUSTRIALS | | | 175,436,872 |
|
| INFORMATION TECHNOLOGY - 11.7% | | | |
| Electronic Equipment & Components - 4.3% | | | |
| Amano Corp. | | 450,200 | 13,310,927 |
| Dexerials Corp. | | 856,500 | 7,560,667 |
| Hitachi High-Technologies Corp. | | 137,000 | 8,523,561 |
| | | | 29,395,155 |
| IT Services - 3.6% | | | |
| GMO Internet, Inc. | | 285,000 | 4,789,378 |
| Otsuka Corp. | | 287,000 | 11,571,255 |
| TKC Corp. | | 202,200 | 8,517,874 |
| | | | 24,878,507 |
| Semiconductors & Semiconductor Equipment - 1.3% | | | |
| Renesas Electronics Corp. (b) | | 1,260,000 | 8,529,794 |
| Software - 1.4% | | | |
| Broadleaf Co. Ltd. | | 592,200 | 3,327,163 |
| Oracle Corp. Japan | | 71,200 | 6,258,208 |
| | | | 9,585,371 |
| Technology Hardware, Storage & Peripherals - 1.1% | | | |
| Elecom Co. Ltd. | | 193,500 | 7,513,835 |
|
| TOTAL INFORMATION TECHNOLOGY | | | 79,902,662 |
|
| MATERIALS - 8.6% | | | |
| Chemicals - 6.2% | | | |
| C. Uyemura & Co. Ltd. | | 131,400 | 8,133,470 |
| Lintec Corp. | | 408,000 | 8,569,146 |
| Mitsubishi Chemical Holdings Corp. | | 1,404,800 | 10,706,295 |
| Nihon Parkerizing Co. Ltd. | | 375,000 | 4,396,867 |
| SK Kaken Co. Ltd. | | 25,100 | 10,718,414 |
| | | | 42,524,192 |
| Construction Materials - 1.4% | | | |
| Taiheiyo Cement Corp. | | 343,500 | 9,717,269 |
| Metals & Mining - 1.0% | | | |
| JFE Holdings, Inc. | | 547,000 | 6,841,682 |
|
| TOTAL MATERIALS | | | 59,083,143 |
|
| REAL ESTATE - 1.3% | | | |
| Real Estate Management & Development - 1.3% | | | |
| Century21 Real Estate Japan Ltd. | | 415,400 | 4,648,028 |
| Kenedix, Inc. | | 795,000 | 4,327,307 |
| | | | 8,975,335 |
| UTILITIES - 2.5% | | | |
| Electric Utilities - 1.1% | | | |
| The Okinawa Electric Power Co., Inc. | | 445,740 | 7,385,790 |
| Gas Utilities - 1.4% | | | |
| Tokyo Gas Co. Ltd. | | 387,200 | 9,451,952 |
|
| TOTAL UTILITIES | | | 16,837,742 |
|
| TOTAL COMMON STOCKS | | | |
| (Cost $491,442,981) | | | 645,676,594 |
|
| Money Market Funds - 6.4% | | | |
| Fidelity Cash Central Fund 1.83% (c) | | 34,342,015 | 34,348,883 |
| Fidelity Securities Lending Cash Central Fund 1.84% (c)(d) | | 9,597,249 | 9,598,208 |
| TOTAL MONEY MARKET FUNDS | | | |
| (Cost $43,947,023) | | | 43,947,091 |
| TOTAL INVESTMENT IN SECURITIES - 100.6% | | | |
| (Cost $535,390,004) | | | 689,623,685 |
| NET OTHER ASSETS (LIABILITIES) - (0.6)% | | | (3,972,938) |
| NET ASSETS - 100% | | | $685,650,747 |
Legend
(a) Security or a portion of the security is on loan at period end.
(b) Non-income producing
(c) Affiliated fund that is generally available only to investment companies and other accounts managed by Fidelity Investments. The rate quoted is the annualized seven-day yield of the fund at period end. A complete unaudited listing of the fund's holdings as of its most recent quarter end is available upon request. In addition, each Fidelity Central Fund's financial statements, which are not covered by the Fund's Report of Independent Registered Public Accounting Firm, are available on the SEC's website or upon request.
(d) Investment made with cash collateral received from securities on loan.
Affiliated Central Funds
Information regarding fiscal year to date income earned by the Fund from investments in Fidelity Central Funds is as follows:
| Fund | Income earned |
| Fidelity Cash Central Fund | $589,414 |
| Fidelity Securities Lending Cash Central Fund | 38,239 |
| Total | $627,653 |
Amounts in the income column in the above table include any capital gain distributions from underlying funds, which are presented in the corresponding line-item in the Statement of Operations, if applicable. Amount for Fidelity Securities Lending Cash Central Fund represents the income earned on investing cash collateral, less rebates paid to borrowers and any lending agent fees associated with the loan, plus any premium payments received for lending certain types of securities.
Investment Valuation
The following is a summary of the inputs used, as of October 31, 2019, involving the Fund's assets and liabilities carried at fair value. The inputs or methodology used for valuing securities may not be an indication of the risk associated with investing in those securities. For more information on valuation inputs, and their aggregation into the levels used below, please refer to the Investment Valuation section in the accompanying Notes to Financial Statements.
| | Valuation Inputs at Reporting Date: |
| Description | Total | Level 1 | Level 2 | Level 3 |
| Investments in Securities: | | | | |
| Equities: | | | | |
| Consumer Discretionary | $128,918,901 | $-- | $128,918,901 | $-- |
| Consumer Staples | 48,097,468 | -- | 48,097,468 | -- |
| Energy | 16,030,956 | -- | 16,030,956 | -- |
| Financials | 43,475,538 | -- | 43,475,538 | -- |
| Health Care | 38,504,099 | -- | 38,504,099 | -- |
| Industrials | 175,436,872 | -- | 175,436,872 | -- |
| Information Technology | 79,902,662 | -- | 79,902,662 | -- |
| Materials | 59,083,143 | -- | 59,083,143 | -- |
| Real Estate | 8,975,335 | -- | 8,975,335 | -- |
| Telecommunication Services | 30,413,878 | -- | 30,413,878 | -- |
| Utilities | 16,837,742 | -- | 16,837,742 | -- |
| Money Market Funds | 43,947,091 | 43,947,091 | -- | -- |
| Total Investments in Securities: | $689,623,685 | $43,947,091 | $645,676,594 | $-- |
See accompanying notes which are an integral part of the financial statements.
Fidelity® Japan Smaller Companies Fund
Financial Statements
Statement of Assets and Liabilities
| | | October 31, 2019 |
| Assets | | |
Investment in securities, at value (including securities loaned of $9,136,751) — See accompanying schedule:
Unaffiliated issuers (cost $491,442,981) | $645,676,594 | |
| Fidelity Central Funds (cost $43,947,023) | 43,947,091 | |
| Total Investment in Securities (cost $535,390,004) | | $689,623,685 |
| Receivable for investments sold | | 886,323 |
| Receivable for fund shares sold | | 37,292 |
| Dividends receivable | | 5,404,766 |
| Distributions receivable from Fidelity Central Funds | | 61,758 |
| Prepaid expenses | | 1,192 |
| Other receivables | | 8,910 |
| Total assets | | 696,023,926 |
| Liabilities | | |
| Payable to custodian bank | $12,342 | |
| Payable for fund shares redeemed | 178,664 | |
| Accrued management fee | 382,551 | |
| Other affiliated payables | 120,179 | |
| Other payables and accrued expenses | 81,289 | |
| Collateral on securities loaned | 9,598,154 | |
| Total liabilities | | 10,373,179 |
| Net Assets | | $685,650,747 |
| Net Assets consist of: | | |
| Paid in capital | | $515,400,169 |
| Total accumulated earnings (loss) | | 170,250,578 |
| Net Assets, for 38,959,405 shares outstanding | | $685,650,747 |
| Net Asset Value, offering price and redemption price per share ($685,650,747 ÷ 38,959,405 shares) | | $17.60 |
See accompanying notes which are an integral part of the financial statements.
Statement of Operations
| | | Year ended October 31, 2019 |
| Investment Income | | |
| Dividends | | $15,806,889 |
| Income from Fidelity Central Funds (including $38,239 from security lending) | | 627,653 |
| Income before foreign taxes withheld | | 16,434,542 |
| Less foreign taxes withheld | | (1,580,689) |
| Total income | | 14,853,853 |
| Expenses | | |
| Management fee | $4,547,049 | |
| Transfer agent fees | 1,152,509 | |
| Accounting and security lending fees | 326,247 | |
| Custodian fees and expenses | 57,002 | |
| Independent trustees' fees and expenses | 3,792 | |
| Registration fees | 25,370 | |
| Audit | 62,911 | |
| Legal | 1,453 | |
| Miscellaneous | 4,906 | |
| Total expenses before reductions | 6,181,239 | |
| Expense reductions | (19,173) | |
| Total expenses after reductions | | 6,162,066 |
| Net investment income (loss) | | 8,691,787 |
| Realized and Unrealized Gain (Loss) | | |
| Net realized gain (loss) on: | | |
| Investment securities: | | |
| Unaffiliated issuers | 32,180,296 | |
| Fidelity Central Funds | (37) | |
| Foreign currency transactions | 221,491 | |
| Futures contracts | (1,808,185) | |
| Total net realized gain (loss) | | 30,593,565 |
| Change in net unrealized appreciation (depreciation) on: | | |
| Investment securities: | | |
| Unaffiliated issuers | 11,990,517 | |
| Fidelity Central Funds | 56 | |
| Assets and liabilities in foreign currencies | 3,216 | |
| Futures contracts | (93,523) | |
| Total change in net unrealized appreciation (depreciation) | | 11,900,266 |
| Net gain (loss) | | 42,493,831 |
| Net increase (decrease) in net assets resulting from operations | | $51,185,618 |
See accompanying notes which are an integral part of the financial statements.
Statement of Changes in Net Assets
| | Year ended October 31, 2019 | Year ended October 31, 2018 |
| Increase (Decrease) in Net Assets | | |
| Operations | | |
| Net investment income (loss) | $8,691,787 | $7,601,888 |
| Net realized gain (loss) | 30,593,565 | 32,636,042 |
| Change in net unrealized appreciation (depreciation) | 11,900,266 | (80,999,571) |
| Net increase (decrease) in net assets resulting from operations | 51,185,618 | (40,761,641) |
| Distributions to shareholders | (34,049,418) | (35,635,448) |
| Share transactions | | |
| Proceeds from sales of shares | 28,621,928 | 220,739,615 |
| Reinvestment of distributions | 31,582,463 | 32,808,433 |
| Cost of shares redeemed | (107,091,949) | (225,809,121) |
| Net increase (decrease) in net assets resulting from share transactions | (46,887,558) | 27,738,927 |
| Redemption fees | – | 8,581 |
| Total increase (decrease) in net assets | (29,751,358) | (48,649,581) |
| Net Assets | | |
| Beginning of period | 715,402,105 | 764,051,686 |
| End of period | $685,650,747 | $715,402,105 |
| Other Information | | |
| Shares | | |
| Sold | 1,769,793 | 11,538,209 |
| Issued in reinvestment of distributions | 1,977,612 | 1,763,894 |
| Redeemed | (6,565,669) | (12,068,741) |
| Net increase (decrease) | (2,818,264) | 1,233,362 |
See accompanying notes which are an integral part of the financial statements.
Financial Highlights
Fidelity Japan Smaller Companies Fund
| | | | | | |
| Years ended October 31, | 2019 | 2018 | 2017 | 2016 | 2015 |
| Selected Per–Share Data | | | | | |
| Net asset value, beginning of period | $17.12 | $18.84 | $15.66 | $13.76 | $13.10 |
| Income from Investment Operations | | | | | |
| Net investment income (loss)A | .22 | .18 | .17 | .17 | .10 |
| Net realized and unrealized gain (loss) | 1.10 | (1.00) | 3.42 | 1.93 | .78 |
| Total from investment operations | 1.32 | (.82) | 3.59 | 2.10 | .88 |
| Distributions from net investment income | (.11) | (.16) | (.17) | (.09) | (.03) |
| Distributions from net realized gain | (.73) | (.74) | (.25) | (.11) | (.19) |
| Total distributions | (.84) | (.90) | (.41)B | (.20) | (.22) |
| Redemption fees added to paid in capitalA | – | –C | –C | –C | –C |
| Net asset value, end of period | $17.60 | $17.12 | $18.84 | $15.66 | $13.76 |
| Total ReturnD | 8.22% | (4.71)% | 23.68% | 15.44% | 6.93% |
| Ratios to Average Net AssetsE,F | | | | | |
| Expenses before reductions | .93% | .94% | .95% | .96% | .98% |
| Expenses net of fee waivers, if any | .93% | .93% | .95% | .96% | .98% |
| Expenses net of all reductions | .93% | .93% | .94% | .96% | .97% |
| Net investment income (loss) | 1.31% | .95% | 1.04% | 1.18% | .77% |
| Supplemental Data | | | | | |
| Net assets, end of period (000 omitted) | $685,651 | $715,402 | $764,052 | $587,034 | $502,842 |
| Portfolio turnover rateG | 16% | 17% | 20% | 30% | 41% |
A Calculated based on average shares outstanding during the period.
B Total distributions of $.41 per share is comprised of distributions from net investment income of $.169 and distributions from net realized gain of $.245 per share.
C Amount represents less than $.005 per share.
D Total returns would have been lower if certain expenses had not been reduced during the applicable periods shown.
E Fees and expenses of any underlying Fidelity Central Funds are not included in the Fund's expense ratio. The Fund indirectly bears its proportionate share of the expenses of any underlying Fidelity Central Funds.
F Expense ratios reflect operating expenses of the Fund. Expenses before reductions do not reflect amounts reimbursed by the investment adviser or reductions from brokerage service arrangements or reductions from other expense offset arrangements and do not represent the amount paid by the Fund during periods when reimbursements or reductions occur. Expenses net of fee waivers reflect expenses after reimbursement by the investment adviser but prior to reductions from brokerage service arrangements or other expense offset arrangements. Expenses net of all reductions represent the net expenses paid by the Fund.
G Amount does not include the portfolio activity of any underlying Fidelity Central Funds.
See accompanying notes which are an integral part of the financial statements.
Notes to Financial Statements
For the period ended October 31, 2019
1. Organization.
Fidelity Japan Smaller Companies Fund (the Fund) is a fund of Fidelity Investment Trust (the Trust) and is authorized to issue an unlimited number of shares. Share transactions on the Statement of Changes in Net Assets may contain exchanges between affiliated funds. The Trust is registered under the Investment Company Act of 1940, as amended (the 1940 Act), as an open-end management investment company organized as a Massachusetts business trust.
2. Investments in Fidelity Central Funds.
The Fund invests in Fidelity Central Funds, which are open-end investment companies generally available only to other investment companies and accounts managed by the investment adviser and its affiliates. The Fund's Schedule of Investments lists each of the Fidelity Central Funds held as of period end, if any, as an investment of the Fund, but does not include the underlying holdings of each Fidelity Central Fund. As an Investing Fund, the Fund indirectly bears its proportionate share of the expenses of the underlying Fidelity Central Funds.
The Money Market Central Funds seek preservation of capital and current income and are managed by Fidelity Investments Money Management, Inc. (FIMM), an affiliate of the investment adviser. Annualized expenses of the Money Market Central Funds as of their most recent shareholder report date ranged from less than .005% to .01%.
A complete unaudited list of holdings for each Fidelity Central Fund is available upon request or at the Securities and Exchange Commission (the SEC) website at www.sec.gov. In addition, the financial statements of the Fidelity Central Funds, which are not covered by the Fund's Report of Independent Registered Public Accounting Firm, are available on the SEC website or upon request.
3. Significant Accounting Policies.
The Fund is an investment company and applies the accounting and reporting guidance of the Financial Accounting Standards Board (FASB) Accounting Standards Codification Topic 946 Financial Services – Investments Companies. The financial statements have been prepared in conformity with accounting principles generally accepted in the United States of America (GAAP), which require management to make certain estimates and assumptions at the date of the financial statements. Actual results could differ from those estimates. Subsequent events, if any, through the date that the financial statements were issued have been evaluated in the preparation of the financial statements. The following summarizes the significant accounting policies of the Fund:
Investment Valuation. Investments are valued as of 4:00 p.m. Eastern time on the last calendar day of the period. The Board of Trustees (the Board) has delegated the day to day responsibility for the valuation of the Fund's investments to the Fair Value Committee (the Committee) established by the Fund's investment adviser. In accordance with valuation policies and procedures approved by the Board, the Fund attempts to obtain prices from one or more third party pricing vendors or brokers to value its investments. When current market prices, quotations or currency exchange rates are not readily available or reliable, investments will be fair valued in good faith by the Committee, in accordance with procedures adopted by the Board. Factors used in determining fair value vary by investment type and may include market or investment specific events. The frequency with which these procedures are used cannot be predicted and they may be utilized to a significant extent. The Committee oversees the Fund's valuation policies and procedures and reports to the Board on the Committee's activities and fair value determinations. The Board monitors the appropriateness of the procedures used in valuing the Fund's investments and ratifies the fair value determinations of the Committee.
The Fund categorizes the inputs to valuation techniques used to value its investments into a disclosure hierarchy consisting of three levels as shown below:
- Level 1 – quoted prices in active markets for identical investments
- Level 2 – other significant observable inputs (including quoted prices for similar investments, interest rates, prepayment speeds, etc.)
- Level 3 – unobservable inputs (including the Fund's own assumptions based on the best information available)
Valuation techniques used to value the Fund's investments by major category are as follows:
Equity securities, including restricted securities, for which market quotations are readily available, are valued at the last reported sale price or official closing price as reported by a third party pricing vendor on the primary market or exchange on which they are traded and are categorized as Level 1 in the hierarchy. In the event there were no sales during the day or closing prices are not available, securities are valued at the last quoted bid price or may be valued using the last available price and are generally categorized as Level 2 in the hierarchy. For foreign equity securities, when market or security specific events arise, comparisons to the valuation of American Depositary Receipts (ADRs), futures contracts, Exchange-Traded Funds (ETFs) and certain indexes as well as quoted prices for similar securities may be used and would be categorized as Level 2 in the hierarchy. For equity securities, including restricted securities, where observable inputs are limited, assumptions about market activity and risk are used and these securities may be categorized as Level 3 in the hierarchy.
Investments in open-end mutual funds, including the Fidelity Central Funds, are valued at their closing net asset value (NAV) each business day and are categorized as Level 1 in the hierarchy.
Changes in valuation techniques may result in transfers in or out of an assigned level within the disclosure hierarchy. The aggregate value of investments by input level as of October 31, 2019 is included at the end of the Fund's Schedule of Investments.
Foreign Currency. The Fund may use foreign currency contracts to facilitate transactions in foreign-denominated securities. Gains and losses from these transactions may arise from changes in the value of the foreign currency or if the counterparties do not perform under the contracts' terms.
Foreign-denominated assets, including investment securities, and liabilities are translated into U.S. dollars at the exchange rates at period end. Purchases and sales of investment securities, income and dividends received and expenses denominated in foreign currencies are translated into U.S. dollars at the exchange rate in effect on the transaction date.
The effects of exchange rate fluctuations on investments are included with the net realized and unrealized gain (loss) on investment securities. Other foreign currency transactions resulting in realized and unrealized gain (loss) are disclosed separately.
Investment Transactions and Income. For financial reporting purposes, the Fund's investment holdings and NAV include trades executed through the end of the last business day of the period. The NAV per share for processing shareholder transactions is calculated as of the close of business of the New York Stock Exchange (NYSE), normally 4:00 p.m. Eastern time and includes trades executed through the end of the prior business day. Gains and losses on securities sold are determined on the basis of identified cost. Dividend income is recorded on the ex-dividend date, except for certain dividends from foreign securities where the ex-dividend date may have passed, which are recorded as soon as the Fund is informed of the ex-dividend date. Non-cash dividends included in dividend income, if any, are recorded at the fair market value of the securities received. Income and capital gain distributions from Fidelity Central Funds, if any, are recorded on the ex-dividend date. Investment income is recorded net of foreign taxes withheld where recovery of such taxes is uncertain.
Expenses. Expenses directly attributable to a fund are charged to that fund. Expenses attributable to more than one fund are allocated among the respective funds on the basis of relative net assets or other appropriate methods. Expense estimates are accrued in the period to which they relate and adjustments are made when actual amounts are known.
Income Tax Information and Distributions to Shareholders. Each year, the Fund intends to qualify as a regulated investment company under Subchapter M of the Internal Revenue Code, including distributing substantially all of its taxable income and realized gains. As a result, no provision for U.S. Federal income taxes is required. As of October 31, 2019, the Fund did not have any unrecognized tax benefits in the financial statements; nor is the Fund aware of any tax positions for which it is reasonably possible that the total amounts of unrecognized tax benefits will significantly change in the next twelve months. The Fund files a U.S. federal tax return, in addition to state and local tax returns as required. The Fund's federal income tax returns are subject to examination by the Internal Revenue Service (IRS) for a period of three fiscal years after they are filed. State and local tax returns may be subject to examination for an additional fiscal year depending on the jurisdiction. Foreign taxes are provided for based on the Fund's understanding of the tax rules and rates that exist in the foreign markets in which it invests.
Distributions are declared and recorded on the ex-dividend date. Income and capital gain distributions are determined in accordance with income tax regulations, which may differ from GAAP. In addition, the Fund claimed a portion of the payment made to redeeming shareholders as a distribution for income tax purposes.
Capital accounts within the financial statements are adjusted for permanent book-tax differences. These adjustments have no impact on net assets or the results of operations. Capital accounts are not adjusted for temporary book-tax differences which will reverse in a subsequent period.
Book-tax differences are primarily due to foreign currency transactions, passive foreign investment companies (PFIC) and losses deferred due to wash sales.
As of period end, the cost and unrealized appreciation (depreciation) in securities, and derivatives if applicable, for federal income tax purposes were as follows:
| Gross unrealized appreciation | $149,588,432 |
| Gross unrealized depreciation | (26,756,229) |
| Net unrealized appreciation (depreciation) | $122,832,203 |
| Tax Cost | $566,791,482 |
The tax-based components of distributable earnings as of period end were as follows:
| Undistributed ordinary income | $18,823,944 |
| Undistributed long-term capital gain | $28,598,427 |
| Net unrealized appreciation (depreciation) on securities and other investments | $122,828,207 |
The tax character of distributions paid was as follows:
| | October 31, 2019 | October 31, 2018 |
| Ordinary Income | $4,534,525 | $ 19,317,251 |
| Long-term Capital Gains | 29,514,893 | 16,318,197 |
| Total | $34,049,418 | $ 35,635,448 |
4. Derivative Instruments.
Risk Exposures and the Use of Derivative Instruments. The Fund's investment objective allows the Fund to enter into various types of derivative contracts, including futures contracts. Derivatives are investments whose value is primarily derived from underlying assets, indices or reference rates and may be transacted on an exchange or over-the-counter (OTC). Derivatives may involve a future commitment to buy or sell a specified asset based on specified terms, to exchange future cash flows at periodic intervals based on a notional principal amount, or for one party to make one or more payments upon the occurrence of specified events in exchange for periodic payments from the other party.
The Fund used derivatives to increase returns and to manage exposure to certain risks as defined below. The success of any strategy involving derivatives depends on analysis of numerous economic factors, and if the strategies for investment do not work as intended, the Fund may not achieve its objectives.
The Fund's use of derivatives increased or decreased its exposure to the following risk:
| Equity Risk | Equity risk relates to the fluctuations in the value of financial instruments as a result of changes in market prices (other than those arising from interest rate risk or foreign exchange risk), whether caused by factors specific to an individual investment, its issuer, or all factors affecting all instruments traded in a market or market segment.
|
The Fund is also exposed to additional risks from investing in derivatives, such as liquidity risk and counterparty credit risk. Liquidity risk is the risk that the Fund will be unable to close out the derivative in the open market in a timely manner. Counterparty credit risk is the risk that the counterparty will not be able to fulfill its obligation to the Fund. Counterparty credit risk related to exchange-traded futures contracts may be mitigated by the protection provided by the exchange on which they trade.
Investing in derivatives may involve greater risks than investing in the underlying assets directly and, to varying degrees, may involve risk of loss in excess of any initial investment and collateral received and amounts recognized in the Statement of Assets and Liabilities. In addition, there may be the risk that the change in value of the derivative contract does not correspond to the change in value of the underlying instrument.
Futures Contracts. A futures contract is an agreement between two parties to buy or sell a specified underlying instrument for a fixed price at a specified future date. The Fund used futures contracts to manage its exposure to the stock market.
Upon entering into a futures contract, a fund is required to deposit either cash or securities (initial margin) with a clearing broker in an amount equal to a certain percentage of the face value of the contract. Futures contracts are marked-to-market daily and subsequent daily payments (variation margin) are made or received by a fund depending on the daily fluctuations in the value of the futures contracts and are recorded as unrealized appreciation or (depreciation). This receivable and/or payable, if any, is included in daily variation margin on futures contracts in the Statement of Assets and Liabilities. Realized gain or (loss) is recorded upon the expiration or closing of a futures contract. The net realized gain (loss) and change in net unrealized appreciation (depreciation) on futures contracts during the period is presented in the Statement of Operations.
Any open futures contracts at period end are presented in the Schedule of Investments under the caption "Futures Contracts". The notional amount at value reflects each contract's exposure to the underlying instrument or index at period end.
5. Purchases and Sales of Investments.
Purchases and sales of securities, other than short-term securities, aggregated $99,019,415 and $163,764,941, respectively.
6. Fees and Other Transactions with Affiliates.
Management Fee. Fidelity Management & Research Company (the investment adviser) and its affiliates provide the Fund with investment management related services for which the Fund pays a monthly management fee. The management fee is the sum of an individual fund fee rate that is based on an annual rate of .45% of the Fund's average net assets and an annualized group fee rate that averaged .24% during the period. The group fee rate is based upon the average net assets of all the mutual funds advised by the investment adviser, including any mutual funds previously advised by the investment adviser that are currently advised by Fidelity SelectCo, LLC, an affiliate of the investment adviser. The group fee rate decreases as assets under management increase and increases as assets under management decrease. For the reporting period, the total annual management fee rate was .69% of the Fund's average net assets.
Transfer Agent Fees. Fidelity Investments Institutional Operations Company, Inc. (FIIOC), an affiliate of the investment adviser, is the Fund's transfer, dividend disbursing and shareholder servicing agent. FIIOC receives account fees and asset-based fees that vary according to account size and type of account. FIIOC pays for typesetting, printing and mailing of shareholder reports, except proxy statements. For the period, the transfer agent fees were equivalent to an annual rate of .17% of average net assets.
Accounting and Security Lending Fees. Fidelity Service Company, Inc. (FSC), an affiliate of the investment adviser, maintains the Fund's accounting records. The accounting fee is based on the level of average net assets for each month. Prior to April 1, 2019, FSC had a separate agreement with the Fund for administration of the security lending program, based on the number and duration of lending transactions. For the period, the total fees paid for accounting and administration of securities lending were equivalent to an annual rate of .05%.
Interfund Trades. The Fund may purchase from or sell securities to other Fidelity Funds under procedures adopted by the Board. The procedures have been designed to ensure these interfund trades are executed in accordance with Rule 17a-7 of the 1940 Act. Interfund trades are included within the respective purchases and sales amounts shown in the Purchases and Sales of Investments note.
7. Committed Line of Credit.
The Fund participates with other funds managed by the investment adviser or an affiliate in a $4.25 billion credit facility (the "line of credit") to be utilized for temporary or emergency purposes to fund shareholder redemptions or for other short-term liquidity purposes. The Fund has agreed to pay commitment fees on its pro-rata portion of the line of credit, which amounted to $1,773 and is reflected in Miscellaneous expenses on the Statement of Operations. During the period, the Fund did not borrow on this line of credit.
8. Security Lending.
The Fund lends portfolio securities from time to time in order to earn additional income. For equity securities, lending agents are used, including National Financial Services (NFS), an affiliate of the Fund. Pursuant to a securities lending agreement, NFS will receive a fee, which is capped at 9.9% of daily lending revenue, for its services as lending agent. The Fund may lend securities to certain qualified borrowers, including NFS. On the settlement date of the loan, the Fund receives collateral (in the form of U.S. Treasury obligations, letters of credit and/or cash) against the loaned securities and maintains collateral in an amount not less than 100% of the market value of the loaned securities during the period of the loan. The market value of the loaned securities is determined at the close of business of the Fund and any additional required collateral is delivered to the Fund on the next business day. The Fund or borrower may terminate the loan at any time, and if the borrower defaults on its obligation to return the securities loaned because of insolvency or other reasons, the Fund may apply collateral received from the borrower against the obligation. The Fund may experience delays and costs in recovering the securities loaned. Any cash collateral received is invested in the Fidelity Securities Lending Cash Central Fund. The value of loaned securities and cash collateral at period end are disclosed on the Fund's Statement of Assets and Liabilities. Security lending income represents the income earned on investing cash collateral, less rebates paid to borrowers and any lending agent fees associated with the loan, plus any premium payments received for lending certain types of securities. Security lending income is presented in the Statement of Operations as a component of income from Fidelity Central Funds. During the period, there were no securities loaned to NFS.
9. Expense Reductions.
Commissions paid to certain brokers with whom the investment adviser, or its affiliates, places trades on behalf of the Fund include an amount in addition to trade execution, which may be rebated back to the Fund to offset certain expenses. This amount totaled $13,891 for the period. In addition, through arrangements with the Fund's custodian, credits realized as a result of certain uninvested cash balances were used to reduce the Fund's expenses by $58.
In addition, during the period the investment adviser reimbursed and/or waived a portion of operating expenses in the amount of $5,224.
10. Other.
The Fund's organizational documents provide former and current trustees and officers with a limited indemnification against liabilities arising in connection with the performance of their duties to the Fund. In the normal course of business, the Fund may also enter into contracts that provide general indemnifications. The Fund's maximum exposure under these arrangements is unknown as this would be dependent on future claims that may be made against the Fund. The risk of material loss from such claims is considered remote.
At the end of the period, Strategic Advisers International Fund, VIP FundsManager 50% Portfolio and VIP FundsManager 60% Portfolio were the owners of record of approximately 16%, 11% and 13%, respectively, of the total outstanding shares of the Fund. Mutual funds managed by the investment adviser or its affiliates were the owners of record, in the aggregate, of approximately 53% of the total outstanding shares of the Fund.
Fidelity® Latin America Fund
Performance: The Bottom Line
Average annual total return reflects the change in the value of an investment, assuming reinvestment of distributions from dividend income and capital gains (the profits earned upon the sale of securities that have grown in value, if any) and assuming a constant rate of performance each year. The hypothetical investment and the average annual total returns do not reflect the deduction of taxes that a shareholder would pay on fund distributions or the redemption of fund shares. During periods of reimbursement by Fidelity, a fund’s total return will be greater than it would be had the reimbursement not occurred. How a fund did yesterday is no guarantee of how it will do tomorrow.
Average Annual Total Returns
| For the periods ended October 31, 2019 | Past 1 year | Past 5 years | Past 10 years |
| Class A (incl. 5.75% sales charge) | 24.03% | 0.74% | (0.61)% |
| Class M (incl. 3.50% sales charge) | 26.67% | 0.94% | (0.62)% |
| Class C (incl. contingent deferred sales charge) | 29.62% | 1.19% | (0.70)% |
| Fidelity® Latin America Fund | 32.06% | 2.24% | 0.26% |
| Class I | 32.09% | 2.30% | 0.29% |
| Class Z | 32.28% | 2.33% | 0.31% |
Class A shares bear a 0.25% 12b-1 fee. The initial offering of Class A shares took place on September 28, 2010. Returns prior to September 28, 2010, are those of Fidelity® Latin America Fund, the original class of the fund, which has no 12b-1 fee. Had Class A's 12b-1 fee been reflected, returns prior to September 28, 2010, would have been lower.
Class M shares bear a 0.50% 12b-1 fee. The initial offering of Class M shares took place on September 28, 2010. Returns prior to September 28, 2010, are those of Fidelity® Latin America Fund, the original class of the fund, which has no 12b-1 fee. Had Class M's 12b-1 fee been reflected, returns prior to September 28, 2010, would have been lower.
Class C shares bear a 1.00% 12b-1 fee. The initial offering of Class C shares took place on September 28, 2010. Returns prior to September 28, 2010, are those of Fidelity® Latin America Fund, the original class of the fund, which has no 12b-1 fee. Had Class C's 12b-1 fee been reflected, returns prior to September 28, 2010, would have been lower.
Class C shares' contingent deferred sales charges included in the past one year, past five years and past ten years total return figures are 1%, 0% and 0%, respectively.
The initial offering of Class I shares took place on September 28, 2010. Returns prior to September 28, 2010 are those of Fidelity® Latin America Fund, the original class of the fund.
The initial offering of Class Z shares took place on October 2, 2018. Returns prior to October 2, 2018, are those of Class I. Returns between September 28, 2010 and October 2, 2018, are those of Class I. Returns prior to September 28, 2010 are those of Fidelity Latin America Fund, the original class of the fund.
$10,000 Over 10 Years
Let's say hypothetically that $10,000 was invested in Fidelity® Latin America Fund - Fidelity® Latin America Fund on October 31, 2009, and the current % sales charge was paid.
The chart shows how the value of your investment would have changed, and also shows how the MSCI EM (Emerging Markets) Latin America Index performed over the same period.
See above for additional information regarding the performance of Fidelity® Latin America Fund.
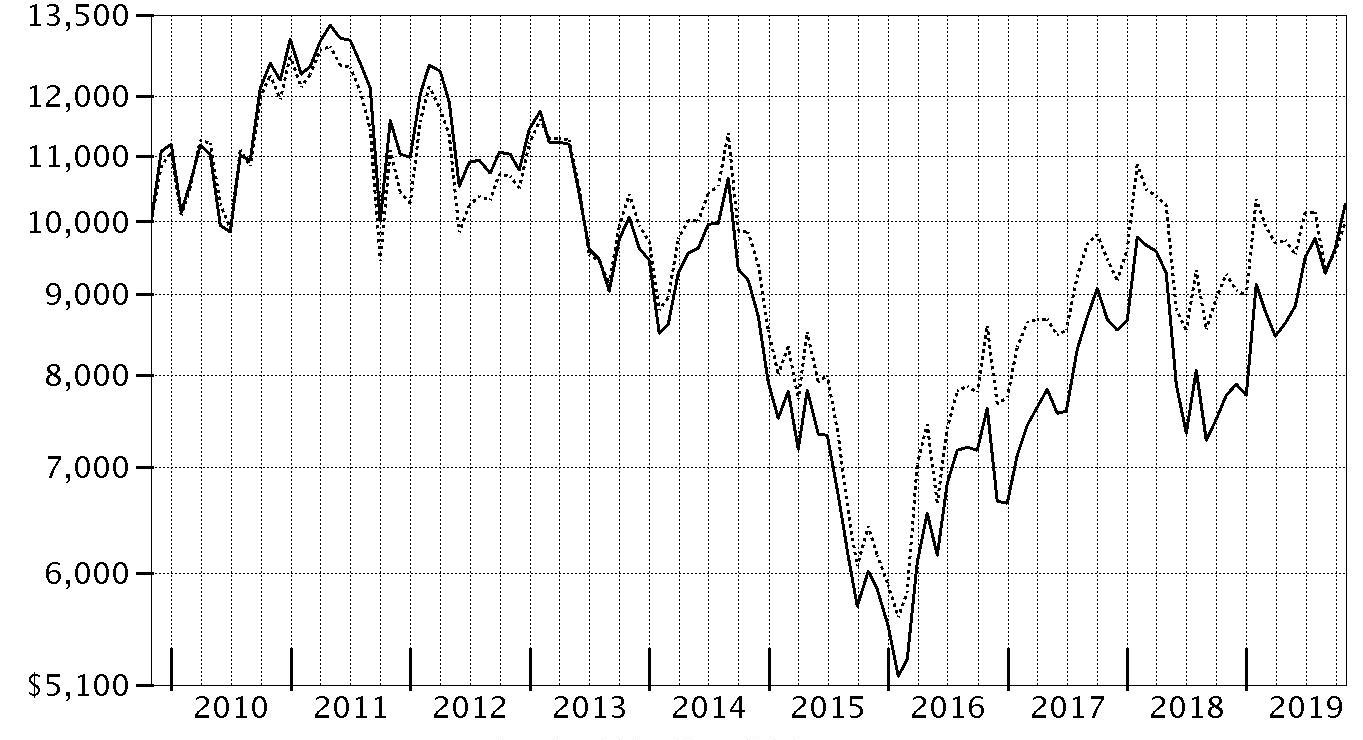
| Period Ending Values |
| $10,262 | Fidelity® Latin America Fund |
| $9,989 | MSCI EM (Emerging Markets) Latin America Index |
Fidelity® Latin America Fund
Management's Discussion of Fund Performance
Market Recap: The MSCI ACWI (All Country World Index) ex USA Index gained 11.47% for the 12 months ending October 31, 2019, as international stocks reflected a confluence of factors, including escalating trade tension, and moderating but still positive global economic growth. Currency fluctuations were largely modest and varied by region, muting the overall impact on international equity returns. In late December, the U.S. Federal Reserve shifted from raising interest rates to a more dovish policy in 2019, joining many foreign central banks. In June, international stocks rose 6.03%, as policy stimulus in China stabilized that country’s economic growth. The Fed cut its policy rate in July for the first time since 2008. However, the index returned -1.21% for the month, followed by -3.08% in August. In September, the Fed cut its policy rate another quarter point, citing concerns about slowing economic growth and muted inflation, and did the same in October, leading to monthly gains of 2.59% and 3.49%, respectively. For the full 12 months, the growth-oriented information technology sector (+22%) led the way, followed by utilities (+20%) and real estate (+18%), two high-dividend-yielding categories. Conversely, energy was roughly flat, while materials (+6%) and communication services (7%) also lagged. By region, Asia Pacific ex Japan (+16%), Europe ex U.K (+13%), Canada (+12%) and emerging markets (+12%) fared best. Meanwhile, the U.K. (+7%) and Japan (+10%) trailed the broader market.
Comments from Portfolio Manager Will Pruett: For the year, the fund’s share classes (excluding sales charges, if applicable) posted gains in the range of roughly 31% to 32%, substantially ahead of the 7.91% advance of the benchmark, the MSCI Emerging Markets Latin America Index. Versus the benchmark, stock selections and an overweighting in Brazil helped the most by far. Within Brazil, a focus on domestic companies that stood to benefit from regulatory reform added to the fund's relative return. An underweighting in Mexico also contributed, as did a small non-benchmark stake in Panama and avoiding Chile. Conversely, avoiding Colombia detracted to a degree. Underweighting the consumer staples and utilities sectors, each of which benefited from a reduction in market interest rates, also detracted somewhat. By period end, I added to the fund's weightings in financials and consumer discretionary and reduced exposure to health care. Among individual stocks, overweighting Brazil-based bank Banco BTG Pactual and maintaining non-benchmark exposure to health care equipment companies Qualicorp and Hapvida each added value. A non-benchmark stake in Brazil-based airline Azul also helped. Conversely, lack of exposure to index component Brazil-based exchange operator B3 Brasil Bolsa Balcão detracted, as did owning Bolsas y Mercados Argentinos, a leading stock exchange in Argentina.
The views expressed above reflect those of the portfolio manager(s) only through the end of the period as stated on the cover of this report and do not necessarily represent the views of Fidelity or any other person in the Fidelity organization. Any such views are subject to change at any time based upon market or other conditions and Fidelity disclaims any responsibility to update such views. These views may not be relied on as investment advice and, because investment decisions for a Fidelity fund are based on numerous factors, may not be relied on as an indication of trading intent on behalf of any Fidelity fund.
Fidelity® Latin America Fund
Investment Summary (Unaudited)
Geographic Diversification (% of fund's net assets)
| As of October 31, 2019 |
| | Brazil | 68.9% |
| | Mexico | 16.7% |
| | United States of America* | 8.2% |
| | Panama | 4.2% |
| | Cayman Islands | 2.0% |

* Includes Short-Term Investments and Net Other Assets (Liabilities).
Percentages are based on country or territory of incorporation and are adjusted for the effect of futures contracts, if applicable.
Asset Allocation as of October 31, 2019
| | % of fund's net assets |
| Stocks | 98.9 |
| Short-Term Investments and Net Other Assets (Liabilities) | 1.1 |
Top Ten Stocks as of October 31, 2019
| | % of fund's net assets |
| Itausa-Investimentos Itau SA (PN) (Brazil, Banks) | 11.4 |
| Petroleo Brasileiro SA - Petrobras (PN) (non-vtg.) (Brazil, Oil, Gas & Consumable Fuels) | 10.7 |
| Azul SA sponsored ADR (Brazil, Airlines) | 5.2 |
| Afya Ltd. (United States of America, Diversified Consumer Services) | 5.1 |
| BTG Pactual Participations Ltd. unit (Brazil, Capital Markets) | 4.8 |
| Companhia de Locacao das Americas (Brazil, Road & Rail) | 4.1 |
| Hapvida Participacoes e Investimentos SA (Brazil, Health Care Providers & Services) | 4.0 |
| Estacio Participacoes SA (Brazil, Diversified Consumer Services) | 3.6 |
| Qualitas Controladora S.A.B. de CV (Mexico, Insurance) | 3.6 |
| Lojas Renner SA (Brazil, Multiline Retail) | 3.6 |
| | 56.1 |
Top Market Sectors as of October 31, 2019
| | % of fund's net assets |
| Financials | 39.9 |
| Consumer Discretionary | 16.6 |
| Industrials | 15.9 |
| Health Care | 10.7 |
| Energy | 10.7 |
| Materials | 3.1 |
| Information Technology | 2.0 |
Market Sectors may include more than one industry category.
The Fund may invest up to 35% of its total assets in any industry that represents more than 20% of the Latin American market. As of October 31, 2019, the Fund did not have more than 25% of its total assets invested in any one industry.
Fidelity® Latin America Fund
Schedule of Investments October 31, 2019
Showing Percentage of Net Assets
| Common Stocks - 76.8% | | | |
| | | Shares | Value |
| Brazil - 46.8% | | | |
| Azul SA sponsored ADR (a) | | 776,257 | $30,258,498 |
| Banco BMG SA unit (a)(b) | | 1,184,622 | 12,967,188 |
| BTG Pactual Participations Ltd. unit | | 1,715,471 | 27,786,310 |
| Companhia de Locacao das Americas | | 5,560,092 | 23,928,983 |
| CVC Brasil Operadora e Agencia de Viagens SA | | 809,937 | 10,346,110 |
| Estacio Participacoes SA | | 2,147,494 | 21,017,115 |
| Hapvida Participacoes e Investimentos SA (b) | | 1,647,108 | 23,122,349 |
| IRB Brasil Resseguros SA | | 2,060,094 | 19,411,782 |
| Lojas Renner SA | | 1,623,411 | 20,543,101 |
| Qualicorp Consultoria E Corret | | 2,349,102 | 18,685,040 |
| Rumo SA (a) | | 2,956,221 | 16,806,343 |
| Ser Educacional SA (b) | | 2,462,566 | 14,632,327 |
| Sul America SA unit | | 1,140,694 | 13,734,974 |
| Suzano Papel e Celulose SA | | 2,206,820 | 17,960,505 |
|
| TOTAL BRAZIL | | | 271,200,625 |
|
| Cayman Islands - 2.0% | | | |
| PagSeguro Digital Ltd. (a)(c) | | 311,401 | 11,546,749 |
| Mexico - 16.7% | | | |
| Banco del Bajio SA (b) | | 6,915,271 | 11,140,501 |
| Credito Real S.A.B. de CV | | 14,635,664 | 17,955,536 |
| Genomma Lab Internacional SA de CV (a)(c) | | 19,301,994 | 20,379,149 |
| Grupo Aeroportuario Norte S.A.B. de CV | | 1,339,622 | 9,287,832 |
| Grupo Financiero Banorte S.A.B. de CV Series O | | 1,676,257 | 9,149,637 |
| Qualitas Controladora S.A.B. de CV | | 4,768,593 | 20,565,200 |
| Unifin Financiera SAPI de CV | | 4,768,717 | 8,022,025 |
|
| TOTAL MEXICO | | | 96,499,880 |
|
| Panama - 4.2% | | | |
| Copa Holdings SA Class A | | 118,038 | 12,009,186 |
| Intercorp Financial Services, Inc. (c) | | 297,996 | 12,435,373 |
|
| TOTAL PANAMA | | | 24,444,559 |
|
| United States of America - 7.1% | | | |
| Afya Ltd. (c) | | 1,089,951 | 29,428,677 |
| First Cash Financial Services, Inc. | | 135,306 | 11,418,473 |
|
| TOTAL UNITED STATES OF AMERICA | | | 40,847,150 |
|
| TOTAL COMMON STOCKS | | | |
| (Cost $344,972,078) | | | 444,538,963 |
|
| Nonconvertible Preferred Stocks - 22.1% | | | |
| Brazil - 22.1% | | | |
| Itausa-Investimentos Itau SA (PN) | | 19,422,987 | 66,397,993 |
| Petroleo Brasileiro SA - Petrobras (PN) (non-vtg.) | | 8,175,400 | 61,949,983 |
| TOTAL PREFERRED STOCKS | | | |
| (Cost $83,890,263) | | | 128,347,976 |
|
| Money Market Funds - 3.7% | | | |
| Fidelity Cash Central Fund 1.83% (d) | | 12,826,697 | 12,829,263 |
| Fidelity Securities Lending Cash Central Fund 1.84% (d)(e) | | 8,484,753 | 8,485,602 |
| TOTAL MONEY MARKET FUNDS | | | |
| (Cost $21,314,865) | | | 21,314,865 |
| TOTAL INVESTMENT IN SECURITIES - 102.6% | | | |
| (Cost $450,177,206) | | | 594,201,804 |
| NET OTHER ASSETS (LIABILITIES) - (2.6)% | | | (15,148,784) |
| NET ASSETS - 100% | | | $579,053,020 |
Categorizations in the Schedule of Investments are based on country or territory of incorporation.
Legend
(a) Non-income producing
(b) Security exempt from registration under Rule 144A of the Securities Act of 1933. These securities may be resold in transactions exempt from registration, normally to qualified institutional buyers. At the end of the period, the value of these securities amounted to $61,862,365 or 10.7% of net assets.
(c) Security or a portion of the security is on loan at period end.
(d) Affiliated fund that is generally available only to investment companies and other accounts managed by Fidelity Investments. The rate quoted is the annualized seven-day yield of the fund at period end. A complete unaudited listing of the fund's holdings as of its most recent quarter end is available upon request. In addition, each Fidelity Central Fund's financial statements, which are not covered by the Fund's Report of Independent Registered Public Accounting Firm, are available on the SEC's website or upon request.
(e) Investment made with cash collateral received from securities on loan.
Affiliated Central Funds
Information regarding fiscal year to date income earned by the Fund from investments in Fidelity Central Funds is as follows:
| Fund | Income earned |
| Fidelity Cash Central Fund | $77,469 |
| Fidelity Securities Lending Cash Central Fund | 5,939 |
| Total | $83,408 |
Amounts in the income column in the above table include any capital gain distributions from underlying funds, which are presented in the corresponding line-item in the Statement of Operations, if applicable. Amount for Fidelity Securities Lending Cash Central Fund represents the income earned on investing cash collateral, less rebates paid to borrowers and any lending agent fees associated with the loan, plus any premium payments received for lending certain types of securities.
Investment Valuation
All investments are categorized as Level 1 under the Fair Value Hierarchy. The inputs or methodology used for valuing securities may not be an indication of the risk associated with investing in those securities. For more information on valuation inputs please refer to the Investment Valuation section in the accompanying Notes to Financial Statements.
See accompanying notes which are an integral part of the financial statements.
Fidelity® Latin America Fund
Financial Statements
Statement of Assets and Liabilities
| | | October 31, 2019 |
| Assets | | |
Investment in securities, at value (including securities loaned of $8,134,216) — See accompanying schedule:
Unaffiliated issuers (cost $428,862,341) | $572,886,939 | |
| Fidelity Central Funds (cost $21,314,865) | 21,314,865 | |
| Total Investment in Securities (cost $450,177,206) | | $594,201,804 |
| Receivable for fund shares sold | | 1,238,192 |
| Dividends receivable | | 2,910,104 |
| Distributions receivable from Fidelity Central Funds | | 8,698 |
| Prepaid expenses | | 985 |
| Other receivables | | 1,111,346 |
| Total assets | | 599,471,129 |
| Liabilities | | |
| Payable to custodian bank | $9,255,704 | |
| Payable for investments purchased | 1,872,995 | |
| Payable for fund shares redeemed | 189,197 | |
| Accrued management fee | 313,981 | |
| Distribution and service plan fees payable | 8,718 | |
| Other affiliated payables | 120,027 | |
| Other payables and accrued expenses | 171,937 | |
| Collateral on securities loaned | 8,485,550 | |
| Total liabilities | | 20,418,109 |
| Net Assets | | $579,053,020 |
| Net Assets consist of: | | |
| Paid in capital | | $467,167,654 |
| Total accumulated earnings (loss) | | 111,885,366 |
| Net Assets | | $579,053,020 |
| Net Asset Value and Maximum Offering Price | | |
| Class A: | | |
| Net Asset Value and redemption price per share ($17,952,713 ÷ 632,962 shares)(a) | | $28.36 |
| Maximum offering price per share (100/94.25 of $28.36) | | $30.09 |
| Class M: | | |
| Net Asset Value and redemption price per share ($6,031,949 ÷ 212,323 shares)(a) | | $28.41 |
| Maximum offering price per share (100/96.50 of $28.41) | | $29.44 |
| Class C: | | |
| Net Asset Value and offering price per share ($3,437,821 ÷ 119,921 shares)(a) | | $28.67 |
| Latin America: | | |
| Net Asset Value, offering price and redemption price per share ($517,901,430 ÷ 18,302,222 shares) | | $28.30 |
| Class I: | | |
| Net Asset Value, offering price and redemption price per share ($7,124,312 ÷ 251,948 shares) | | $28.28 |
| Class Z: | | |
| Net Asset Value, offering price and redemption price per share ($26,604,795 ÷ 942,252 shares) | | $28.24 |
(a) Redemption price per share is equal to net asset value less any applicable contingent deferred sales charge.
See accompanying notes which are an integral part of the financial statements.
Statement of Operations
| | | Year ended October 31, 2019 |
| Investment Income | | |
| Dividends | | $23,053,634 |
| Income from Fidelity Central Funds (including $5,939 from security lending) | | 83,408 |
| Income before foreign taxes withheld | | 23,137,042 |
| Less foreign taxes withheld | | (1,133,487) |
| Total income | | 22,003,555 |
| Expenses | | |
| Management fee | $3,618,879 | |
| Transfer agent fees | 1,222,287 | |
| Distribution and service plan fees | 102,818 | |
| Accounting and security lending fees | 269,563 | |
| Custodian fees and expenses | 215,521 | |
| Independent trustees' fees and expenses | 2,916 | |
| Registration fees | 103,592 | |
| Audit | 82,282 | |
| Legal | 1,445 | |
| Interest | 443 | |
| Miscellaneous | 14,894 | |
| Total expenses before reductions | 5,634,640 | |
| Expense reductions | (20,256) | |
| Total expenses after reductions | | 5,614,384 |
| Net investment income (loss) | | 16,389,171 |
| Realized and Unrealized Gain (Loss) | | |
| Net realized gain (loss) on: | | |
| Investment securities: | | |
| Unaffiliated issuers | 57,702,935 | |
| Fidelity Central Funds | 1,088 | |
| Foreign currency transactions | (448,621) | |
| Total net realized gain (loss) | | 57,255,402 |
| Change in net unrealized appreciation (depreciation) on: | | |
| Investment securities: | | |
| Unaffiliated issuers | 72,607,961 | |
| Assets and liabilities in foreign currencies | 114,092 | |
| Total change in net unrealized appreciation (depreciation) | | 72,722,053 |
| Net gain (loss) | | 129,977,455 |
| Net increase (decrease) in net assets resulting from operations | | $146,366,626 |
See accompanying notes which are an integral part of the financial statements.
Statement of Changes in Net Assets
| | Year ended October 31, 2019 | Year ended October 31, 2018 |
| Increase (Decrease) in Net Assets | | |
| Operations | | |
| Net investment income (loss) | $16,389,171 | $13,382,179 |
| Net realized gain (loss) | 57,255,402 | 40,059,458 |
| Change in net unrealized appreciation (depreciation) | 72,722,053 | (118,083,853) |
| Net increase (decrease) in net assets resulting from operations | 146,366,626 | (64,642,216) |
| Distributions to shareholders | (10,500,914) | (9,005,746) |
| Share transactions - net increase (decrease) | (30,101,947) | (88,546,151) |
| Redemption fees | – | 87,345 |
| Total increase (decrease) in net assets | 105,763,765 | (162,106,768) |
| Net Assets | | |
| Beginning of period | 473,289,255 | 635,396,023 |
| End of period | $579,053,020 | $473,289,255 |
See accompanying notes which are an integral part of the financial statements.
Financial Highlights
Fidelity Latin America Fund Class A
| Years ended October 31, | 2019 | 2018 | 2017 | 2016 | 2015 |
| Selected Per–Share Data | | | | | |
| Net asset value, beginning of period | $21.98 | $24.93 | $22.45 | $18.09 | $30.31 |
| Income from Investment Operations | | | | | |
| Net investment income (loss)A | .69 | .50 | .42 | .40 | .28 |
| Net realized and unrealized gain (loss) | 6.11 | (3.16) | 2.48 | 4.27 | (10.11) |
| Total from investment operations | 6.80 | (2.66) | 2.90 | 4.67 | (9.83) |
| Distributions from net investment income | (.42) | (.29) | (.43) | (.31) | (.31) |
| Distributions from net realized gain | – | – | – | – | (2.08) |
| Total distributions | (.42) | (.29) | (.43) | (.31) | (2.39) |
| Redemption fees added to paid in capitalA | – | –B | .01 | –B | –B |
| Net asset value, end of period | $28.36 | $21.98 | $24.93 | $22.45 | $18.09 |
| Total ReturnC,D | 31.60% | (10.78)% | 13.55% | 26.29% | (34.60)% |
| Ratios to Average Net AssetsE,F | | | | | |
| Expenses before reductions | 1.36% | 1.38% | 1.39% | 1.40% | 1.40% |
| Expenses net of fee waivers, if any | 1.36% | 1.38% | 1.39% | 1.40% | 1.40% |
| Expenses net of all reductions | 1.36% | 1.36% | 1.38% | 1.39% | 1.39% |
| Net investment income (loss) | 2.81% | 2.08% | 1.90% | 2.14% | 1.26% |
| Supplemental Data | | | | | |
| Net assets, end of period (000 omitted) | $17,953 | $14,157 | $17,801 | $19,115 | $16,424 |
| Portfolio turnover rateG | 48% | 53% | 51% | 108% | 30% |
A Calculated based on average shares outstanding during the period.
B Amount represents less than $.005 per share.
C Total returns would have been lower if certain expenses had not been reduced during the applicable periods shown.
D Total returns do not include the effect of the sales charges.
E Fees and expenses of any underlying Fidelity Central Funds are not included in the Fund's expense ratio. The Fund indirectly bears its proportionate share of the expenses of any underlying Fidelity Central Funds.
F Expense ratios reflect operating expenses of the class. Expenses before reductions do not reflect amounts reimbursed by the investment adviser or reductions from brokerage service arrangements or reductions from other expense offset arrangements and do not represent the amount paid by the class during periods when reimbursements or reductions occur. Expenses net of fee waivers reflect expenses after reimbursement by the investment adviser but prior to reductions from brokerage service arrangements or other expense offset arrangements. Expenses net of all reductions represent the net expenses paid by the class.
G Amount does not include the portfolio activity of any underlying Fidelity Central Funds.
See accompanying notes which are an integral part of the financial statements.
Fidelity Latin America Fund Class M
| Years ended October 31, | 2019 | 2018 | 2017 | 2016 | 2015 |
| Selected Per–Share Data | | | | | |
| Net asset value, beginning of period | $22.00 | $24.96 | $22.47 | $18.11 | $30.33 |
| Income from Investment Operations | | | | | |
| Net investment income (loss)A | .63 | .43 | .36 | .35 | .22 |
| Net realized and unrealized gain (loss) | 6.13 | (3.16) | 2.49 | 4.27 | (10.13) |
| Total from investment operations | 6.76 | (2.73) | 2.85 | 4.62 | (9.91) |
| Distributions from net investment income | (.35) | (.23) | (.37) | (.26) | (.23) |
| Distributions from net realized gain | – | – | – | – | (2.08) |
| Total distributions | (.35) | (.23) | (.37) | (.26) | (2.31) |
| Redemption fees added to paid in capitalA | – | –B | .01 | –B | –B |
| Net asset value, end of period | $28.41 | $22.00 | $24.96 | $22.47 | $18.11 |
| Total ReturnC,D | 31.26% | (11.04)% | 13.24% | 25.93% | (34.78)% |
| Ratios to Average Net AssetsE,F | | | | | |
| Expenses before reductions | 1.64% | 1.66% | 1.66% | 1.68% | 1.67% |
| Expenses net of fee waivers, if any | 1.63% | 1.66% | 1.66% | 1.68% | 1.67% |
| Expenses net of all reductions | 1.63% | 1.63% | 1.66% | 1.68% | 1.66% |
| Net investment income (loss) | 2.54% | 1.80% | 1.62% | 1.86% | .99% |
| Supplemental Data | | | | | |
| Net assets, end of period (000 omitted) | $6,032 | $5,098 | $6,740 | $7,378 | $5,284 |
| Portfolio turnover rateG | 48% | 53% | 51% | 108% | 30% |
A Calculated based on average shares outstanding during the period.
B Amount represents less than $.005 per share.
C Total returns would have been lower if certain expenses had not been reduced during the applicable periods shown.
D Total returns do not include the effect of the sales charges.
E Fees and expenses of any underlying Fidelity Central Funds are not included in the Fund's expense ratio. The Fund indirectly bears its proportionate share of the expenses of any underlying Fidelity Central Funds.
F Expense ratios reflect operating expenses of the class. Expenses before reductions do not reflect amounts reimbursed by the investment adviser or reductions from brokerage service arrangements or reductions from other expense offset arrangements and do not represent the amount paid by the class during periods when reimbursements or reductions occur. Expenses net of fee waivers reflect expenses after reimbursement by the investment adviser but prior to reductions from brokerage service arrangements or other expense offset arrangements. Expenses net of all reductions represent the net expenses paid by the class.
G Amount does not include the portfolio activity of any underlying Fidelity Central Funds.
See accompanying notes which are an integral part of the financial statements.
Fidelity Latin America Fund Class C
| Years ended October 31, | 2019 | 2018 | 2017 | 2016 | 2015 |
| Selected Per–Share Data | | | | | |
| Net asset value, beginning of period | $22.16 | $25.12 | $22.61 | $18.18 | $30.37 |
| Income from Investment Operations | | | | | |
| Net investment income (loss)A | .51 | .32 | .26 | .26 | .11 |
| Net realized and unrealized gain (loss) | 6.21 | (3.18) | 2.52 | 4.30 | (10.17) |
| Total from investment operations | 6.72 | (2.86) | 2.78 | 4.56 | (10.06) |
| Distributions from net investment income | (.21) | (.10) | (.28) | (.13) | (.05) |
| Distributions from net realized gain | – | – | – | – | (2.08) |
| Total distributions | (.21) | (.10) | (.28) | (.13) | (2.13) |
| Redemption fees added to paid in capitalA | – | –B | .01 | –B | –B |
| Net asset value, end of period | $28.67 | $22.16 | $25.12 | $22.61 | $18.18 |
| Total ReturnC,D | 30.62% | (11.43)% | 12.71% | 25.31% | (35.08)% |
| Ratios to Average Net AssetsE,F | | | | | |
| Expenses before reductions | 2.12% | 2.13% | 2.14% | 2.15% | 2.15% |
| Expenses net of fee waivers, if any | 2.12% | 2.13% | 2.14% | 2.14% | 2.15% |
| Expenses net of all reductions | 2.12% | 2.11% | 2.14% | 2.14% | 2.15% |
| Net investment income (loss) | 2.06% | 1.33% | 1.15% | 1.39% | .51% |
| Supplemental Data | | | | | |
| Net assets, end of period (000 omitted) | $3,438 | $3,498 | $5,094 | $6,590 | $5,394 |
| Portfolio turnover rateG | 48% | 53% | 51% | 108% | 30% |
A Calculated based on average shares outstanding during the period.
B Amount represents less than $.005 per share.
C Total returns would have been lower if certain expenses had not been reduced during the applicable periods shown.
D Total returns do not include the effect of the contingent deferred sales charge.
E Fees and expenses of any underlying Fidelity Central Funds are not included in the Fund's expense ratio. The Fund indirectly bears its proportionate share of the expenses of any underlying Fidelity Central Funds.
F Expense ratios reflect operating expenses of the class. Expenses before reductions do not reflect amounts reimbursed by the investment adviser or reductions from brokerage service arrangements or reductions from other expense offset arrangements and do not represent the amount paid by the class during periods when reimbursements or reductions occur. Expenses net of fee waivers reflect expenses after reimbursement by the investment adviser but prior to reductions from brokerage service arrangements or other expense offset arrangements. Expenses net of all reductions represent the net expenses paid by the class.
G Amount does not include the portfolio activity of any underlying Fidelity Central Funds.
See accompanying notes which are an integral part of the financial statements.
Fidelity Latin America Fund
| Years ended October 31, | 2019 | 2018 | 2017 | 2016 | 2015 |
| Selected Per–Share Data | | | | | |
| Net asset value, beginning of period | $21.94 | $24.89 | $22.41 | $18.08 | $30.34 |
| Income from Investment Operations | | | | | |
| Net investment income (loss)A | .77 | .57 | .49 | .45 | .34 |
| Net realized and unrealized gain (loss) | 6.09 | (3.15) | 2.46 | 4.26 | (10.11) |
| Total from investment operations | 6.86 | (2.58) | 2.95 | 4.71 | (9.77) |
| Distributions from net investment income | (.50) | (.37) | (.48) | (.38) | (.41) |
| Distributions from net realized gain | – | – | – | – | (2.08) |
| Total distributions | (.50) | (.37) | (.48) | (.38) | (2.49) |
| Redemption fees added to paid in capitalA | – | –B | .01 | –B | –B |
| Net asset value, end of period | $28.30 | $21.94 | $24.89 | $22.41 | $18.08 |
| Total ReturnC | 32.06% | (10.50)% | 13.87% | 26.65% | (34.45)% |
| Ratios to Average Net AssetsD,E | | | | | |
| Expenses before reductions | 1.05% | 1.07% | 1.09% | 1.14% | 1.13% |
| Expenses net of fee waivers, if any | 1.04% | 1.07% | 1.09% | 1.14% | 1.12% |
| Expenses net of all reductions | 1.04% | 1.05% | 1.09% | 1.13% | 1.12% |
| Net investment income (loss) | 3.13% | 2.39% | 2.19% | 2.40% | 1.53% |
| Supplemental Data | | | | | |
| Net assets, end of period (000 omitted) | $517,901 | $445,845 | $597,161 | $596,514 | $481,005 |
| Portfolio turnover rateF | 48% | 53% | 51% | 108% | 30% |
A Calculated based on average shares outstanding during the period.
B Amount represents less than $.005 per share.
C Total returns would have been lower if certain expenses had not been reduced during the applicable periods shown.
D Fees and expenses of any underlying Fidelity Central Funds are not included in the Fund's expense ratio. The Fund indirectly bears its proportionate share of the expenses of any underlying Fidelity Central Funds.
E Expense ratios reflect operating expenses of the class. Expenses before reductions do not reflect amounts reimbursed by the investment adviser or reductions from brokerage service arrangements or reductions from other expense offset arrangements and do not represent the amount paid by the class during periods when reimbursements or reductions occur. Expenses net of fee waivers reflect expenses after reimbursement by the investment adviser but prior to reductions from brokerage service arrangements or other expense offset arrangements. Expenses net of all reductions represent the net expenses paid by the class.
F Amount does not include the portfolio activity of any underlying Fidelity Central Funds.
See accompanying notes which are an integral part of the financial statements.
Fidelity Latin America Fund Class I
| Years ended October 31, | 2019 | 2018 | 2017 | 2016 | 2015 |
| Selected Per–Share Data | | | | | |
| Net asset value, beginning of period | $21.92 | $24.88 | $22.40 | $18.08 | $30.35 |
| Income from Investment Operations | | | | | |
| Net investment income (loss)A | .78 | .59 | .51 | .46 | .36 |
| Net realized and unrealized gain (loss) | 6.08 | (3.15) | 2.45 | 4.26 | (10.13) |
| Total from investment operations | 6.86 | (2.56) | 2.96 | 4.72 | (9.77) |
| Distributions from net investment income | (.50) | (.40) | (.49) | (.40) | (.42) |
| Distributions from net realized gain | – | – | – | – | (2.08) |
| Total distributions | (.50) | (.40) | (.49) | (.40) | (2.50) |
| Redemption fees added to paid in capitalA | – | –B | .01 | –B | –B |
| Net asset value, end of period | $28.28 | $21.92 | $24.88 | $22.40 | $18.08 |
| Total ReturnC | 32.09% | (10.44)% | 13.94% | 26.77% | (34.42)% |
| Ratios to Average Net AssetsD,E | | | | | |
| Expenses before reductions | 1.01% | 1.01% | 1.01% | 1.07% | 1.06% |
| Expenses net of fee waivers, if any | 1.00% | 1.01% | 1.01% | 1.07% | 1.06% |
| Expenses net of all reductions | 1.00% | .98% | 1.01% | 1.06% | 1.05% |
| Net investment income (loss) | 3.17% | 2.45% | 2.27% | 2.47% | 1.60% |
| Supplemental Data | | | | | |
| Net assets, end of period (000 omitted) | $7,124 | $4,546 | $8,600 | $3,825 | $1,828 |
| Portfolio turnover rateF | 48% | 53% | 51% | 108% | 30% |
A Calculated based on average shares outstanding during the period.
B Amount represents less than $.005 per share.
C Total returns would have been lower if certain expenses had not been reduced during the applicable periods shown.
D Fees and expenses of any underlying Fidelity Central Funds are not included in the Fund's expense ratio. The Fund indirectly bears its proportionate share of the expenses of any underlying Fidelity Central Funds.
E Expense ratios reflect operating expenses of the class. Expenses before reductions do not reflect amounts reimbursed by the investment adviser or reductions from brokerage service arrangements or reductions from other expense offset arrangements and do not represent the amount paid by the class during periods when reimbursements or reductions occur. Expenses net of fee waivers reflect expenses after reimbursement by the investment adviser but prior to reductions from brokerage service arrangements or other expense offset arrangements. Expenses net of all reductions represent the net expenses paid by the class.
F Amount does not include the portfolio activity of any underlying Fidelity Central Funds.
See accompanying notes which are an integral part of the financial statements.
Fidelity Latin America Fund Class Z
| Years ended October 31, | 2019 | 2018 A |
| Selected Per–Share Data | | |
| Net asset value, beginning of period | $21.92 | $21.51 |
| Income from Investment Operations | | |
| Net investment income (loss)B | .85 | (.01) |
| Net realized and unrealized gain (loss) | 6.03 | .42 |
| Total from investment operations | 6.88 | .41 |
| Distributions from net investment income | (.56) | – |
| Distributions from net realized gain | – | – |
| Total distributions | (.56) | – |
| Net asset value, end of period | $28.24 | $21.92 |
| Total ReturnC,D | 32.28% | 1.91% |
| Ratios to Average Net AssetsE,F | | |
| Expenses before reductions | .86% | .95%G |
| Expenses net of fee waivers, if any | .86% | .95%G |
| Expenses net of all reductions | .86% | .93%G |
| Net investment income (loss) | 3.31% | (.37)%G |
| Supplemental Data | | |
| Net assets, end of period (000 omitted) | $26,605 | $145 |
| Portfolio turnover rateH | 48% | 53% |
A For the period October 2, 2018 (commencement of sale of shares) to October 31, 2018.
B Calculated based on average shares outstanding during the period.
C Total returns for periods of less than one year are not annualized.
D Total returns would have been lower if certain expenses had not been reduced during the applicable periods shown.
E Fees and expenses of any underlying Fidelity Central Funds are not included in the Fund's expense ratio. The Fund indirectly bears its proportionate share of the expenses of any underlying Fidelity Central Funds.
F Expense ratios reflect operating expenses of the class. Expenses before reductions do not reflect amounts reimbursed by the investment adviser or reductions from brokerage service arrangements or reductions from other expense offset arrangements and do not represent the amount paid by the class during periods when reimbursements or reductions occur. Expense ratios before reductions for start-up periods may not be representative of longer-term operating periods. Expenses net of fee waivers reflect expenses after reimbursement by the investment adviser but prior to reductions from brokerage service arrangements or other expense offset arrangements. Expenses net of all reductions represent the net expenses paid by the class.
G Annualized
H Amount does not include the portfolio activity of any underlying Fidelity Central Funds.
See accompanying notes which are an integral part of the financial statements.
Notes to Financial Statements
For the period ended October 31, 2019
1. Organization.
Fidelity Latin America Fund (the Fund) is a non-diversified fund of Fidelity Investment Trust (the Trust) and is authorized to issue an unlimited number of shares. The Trust is registered under the Investment Company Act of 1940, as amended (the 1940 Act), as an open-end management investment company organized as a Massachusetts business trust. The Fund offers Class A, Class M, Class C, Latin America, Class I and Class Z shares, each of which has equal rights as to assets and voting privileges. Each class has exclusive voting rights with respect to matters that affect that class. Effective March 1, 2019, Class C shares will automatically convert to Class A shares after a holding period of ten years from the initial date of purchase, with certain exceptions. The Fund's investments in emerging markets can be subject to social, economic, regulatory, and political uncertainties and can be extremely volatile.
2. Investments in Fidelity Central Funds.
The Fund invests in Fidelity Central Funds, which are open-end investment companies generally available only to other investment companies and accounts managed by the investment adviser and its affiliates. The Fund's Schedule of Investments lists each of the Fidelity Central Funds held as of period end, if any, as an investment of the Fund, but does not include the underlying holdings of each Fidelity Central Fund. As an Investing Fund, the Fund indirectly bears its proportionate share of the expenses of the underlying Fidelity Central Funds.
The Money Market Central Funds seek preservation of capital and current income and are managed by Fidelity Investments Money Management, Inc. (FIMM), an affiliate of the investment adviser. Annualized expenses of the Money Market Central Funds as of their most recent shareholder report date ranged from less than .005% to .01%.
A complete unaudited list of holdings for each Fidelity Central Fund is available upon request or at the Securities and Exchange Commission (the SEC) website at www.sec.gov. In addition, the financial statements of the Fidelity Central Funds, which are not covered by the Fund's Report of Independent Registered Public Accounting Firm, are available on the SEC website or upon request.
3. Significant Accounting Policies.
The Fund is an investment company and applies the accounting and reporting guidance of the Financial Accounting Standards Board (FASB) Accounting Standards Codification Topic 946 Financial Services – Investments Companies. The financial statements have been prepared in conformity with accounting principles generally accepted in the United States of America (GAAP), which require management to make certain estimates and assumptions at the date of the financial statements. Actual results could differ from those estimates. Subsequent events, if any, through the date that the financial statements were issued have been evaluated in the preparation of the financial statements. The following summarizes the significant accounting policies of the Fund:
Investment Valuation. Investments are valued as of 4:00 p.m. Eastern time on the last calendar day of the period. The Board of Trustees (the Board) has delegated the day to day responsibility for the valuation of the Fund's investments to the Fair Value Committee (the Committee) established by the Fund's investment adviser. In accordance with valuation policies and procedures approved by the Board, the Fund attempts to obtain prices from one or more third party pricing vendors or brokers to value its investments. When current market prices, quotations or currency exchange rates are not readily available or reliable, investments will be fair valued in good faith by the Committee, in accordance with procedures adopted by the Board. Factors used in determining fair value vary by investment type and may include market or investment specific events. The frequency with which these procedures are used cannot be predicted and they may be utilized to a significant extent. The Committee oversees the Fund's valuation policies and procedures and reports to the Board on the Committee's activities and fair value determinations. The Board monitors the appropriateness of the procedures used in valuing the Fund's investments and ratifies the fair value determinations of the Committee.
The Fund categorizes the inputs to valuation techniques used to value its investments into a disclosure hierarchy consisting of three levels as shown below:
- Level 1 – quoted prices in active markets for identical investments
- Level 2 – other significant observable inputs (including quoted prices for similar investments, interest rates, prepayment speeds, etc.)
- Level 3 – unobservable inputs (including the Fund's own assumptions based on the best information available)
Valuation techniques used to value the Fund's investments by major category are as follows:
Equity securities, including restricted securities, for which market quotations are readily available, are valued at the last reported sale price or official closing price as reported by a third party pricing vendor on the primary market or exchange on which they are traded and are categorized as Level 1 in the hierarchy. In the event there were no sales during the day or closing prices are not available, securities are valued at the last quoted bid price or may be valued using the last available price and are generally categorized as Level 2 in the hierarchy. For foreign equity securities, when market or security specific events arise, comparisons to the valuation of American Depositary Receipts (ADRs), futures contracts, Exchange-Traded Funds (ETFs) and certain indexes as well as quoted prices for similar securities may be used and would be categorized as Level 2 in the hierarchy. For equity securities, including restricted securities, where observable inputs are limited, assumptions about market activity and risk are used and these securities may be categorized as Level 3 in the hierarchy.
Investments in open-end mutual funds, including the Fidelity Central Funds, are valued at their closing net asset value (NAV) each business day and are categorized as Level 1 in the hierarchy.
Changes in valuation techniques may result in transfers in or out of an assigned level within the disclosure hierarchy.
Foreign Currency. The Fund may use foreign currency contracts to facilitate transactions in foreign-denominated securities. Gains and losses from these transactions may arise from changes in the value of the foreign currency or if the counterparties do not perform under the contracts' terms.
Foreign-denominated assets, including investment securities, and liabilities are translated into U.S. dollars at the exchange rates at period end. Purchases and sales of investment securities, income and dividends received and expenses denominated in foreign currencies are translated into U.S. dollars at the exchange rate in effect on the transaction date.
The effects of exchange rate fluctuations on investments are included with the net realized and unrealized gain (loss) on investment securities. Other foreign currency transactions resulting in realized and unrealized gain (loss) are disclosed separately.
Investment Transactions and Income. For financial reporting purposes, the Fund's investment holdings and NAV include trades executed through the end of the last business day of the period. The NAV per share for processing shareholder transactions is calculated as of the close of business of the New York Stock Exchange (NYSE), normally 4:00 p.m. Eastern time and includes trades executed through the end of the prior business day. Gains and losses on securities sold are determined on the basis of identified cost and include proceeds received from litigation. Dividend income is recorded on the ex-dividend date, except for certain dividends from foreign securities where the ex-dividend date may have passed, which are recorded as soon as the Fund is informed of the ex-dividend date. Non-cash dividends included in dividend income, if any, are recorded at the fair market value of the securities received. Income and capital gain distributions from Fidelity Central Funds, if any, are recorded on the ex-dividend date. Certain distributions received by the Fund represent a return of capital or capital gain. The Fund determines the components of these distributions subsequent to the ex-dividend date, based upon receipt of tax filings or other correspondence relating to the underlying investment. These distributions are recorded as a reduction of cost of investments and/or as a realized gain. Interest income is accrued as earned and includes coupon interest and amortization of premium and accretion of discount on debt securities as applicable. Investment income is recorded net of foreign taxes withheld where recovery of such taxes is uncertain.
Class Allocations and Expenses. Investment income, realized and unrealized capital gains and losses, common expenses of the Fund, and certain fund-level expense reductions, if any, are allocated daily on a pro-rata basis to each class based on the relative net assets of each class to the total net assets of the Fund. Each class differs with respect to transfer agent and distribution and service plan fees incurred. Certain expense reductions may also differ by class. For the reporting period, the allocated portion of income and expenses to each class as a percent of its average net assets may vary due to the timing of recording these transactions in relation to fluctuating net assets of the classes. Expenses directly attributable to a fund are charged to that fund. Expenses attributable to more than one fund are allocated among the respective funds on the basis of relative net assets or other appropriate methods. Expense estimates are accrued in the period to which they relate and adjustments are made when actual amounts are known.
Income Tax Information and Distributions to Shareholders. Each year, the Fund intends to qualify as a regulated investment company under Subchapter M of the Internal Revenue Code, including distributing substantially all of its taxable income and realized gains. As a result, no provision for U.S. Federal income taxes is required. As of October 31, 2019, the Fund did not have any unrecognized tax benefits in the financial statements; nor is the Fund aware of any tax positions for which it is reasonably possible that the total amounts of unrecognized tax benefits will significantly change in the next twelve months. The Fund files a U.S. federal tax return, in addition to state and local tax returns as required. The Fund's federal income tax returns are subject to examination by the Internal Revenue Service (IRS) for a period of three fiscal years after they are filed. State and local tax returns may be subject to examination for an additional fiscal year depending on the jurisdiction. Foreign taxes are provided for based on the Fund's understanding of the tax rules and rates that exist in the foreign markets in which it invests.
Distributions are declared and recorded on the ex-dividend date. Income and capital gain distributions are declared separately for each class. Income and capital gain distributions are determined in accordance with income tax regulations, which may differ from GAAP. In addition, the Fund claimed a portion of the payment made to redeeming shareholders as a distribution for income tax purposes.
Capital accounts within the financial statements are adjusted for permanent book-tax differences. These adjustments have no impact on net assets or the results of operations. Capital accounts are not adjusted for temporary book-tax differences which will reverse in a subsequent period.
Book-tax differences are primarily due to foreign currency transactions, passive foreign investment companies (PFIC), capital loss carryforwards and losses deferred due to wash sales.
As of period end, the cost and unrealized appreciation (depreciation) in securities, and derivatives if applicable, for federal income tax purposes were as follows:
| Gross unrealized appreciation | $162,263,490 |
| Gross unrealized depreciation | (18,987,281) |
| Net unrealized appreciation (depreciation) | $143,276,209 |
| Tax Cost | $450,925,595 |
The tax-based components of distributable earnings as of period end were as follows:
| Undistributed ordinary income | $12,432,320 |
| Capital loss carryforward | $(43,933,589) |
| Net unrealized appreciation (depreciation) on securities and other investments | $143,386,635 |
Capital loss carryforwards are only available to offset future capital gains of the Fund to the extent provided by regulations and may be limited. Under the Regulated Investment Company Modernization Act of 2010 (the Act), the Fund is permitted to carry forward capital losses incurred in taxable years beginning after December 22, 2010 for an unlimited period and such capital losses are required to be used prior to any losses that expire. The capital loss carryforward information presented below, including any applicable limitation, is estimated as of fiscal period end and is subject to adjustment.
| No expiration | |
| Short-term | $(43,933,589) |
| Total capital loss carryforward | $(43,933,589) |
The tax character of distributions paid was as follows:
| | October 31, 2019 | October 31, 2018 |
| Ordinary Income | $10,500,914 | $ 9,005,746 |
Restricted Securities. The Fund may invest in securities that are subject to legal or contractual restrictions on resale. These securities generally may be resold in transactions exempt from registration or to the public if the securities are registered. Disposal of these securities may involve time-consuming negotiations and expense, and prompt sale at an acceptable price may be difficult. Information regarding restricted securities is included at the end of the Fund's Schedule of Investments.
4. Purchases and Sales of Investments.
Purchases and sales of securities, other than short-term securities, aggregated $250,548,632 and $279,579,955, respectively.
5. Fees and Other Transactions with Affiliates.
Management Fee. Fidelity Management & Research Company (the investment adviser) and its affiliates provide the Fund with investment management related services for which the Fund pays a monthly management fee. The management fee is the sum of an individual fund fee rate that is based on an annual rate of .45% of the Fund's average net assets and an annualized group fee rate that averaged .24% during the period. The group fee rate is based upon the average net assets of all the mutual funds advised by the investment adviser, including any mutual funds previously advised by the investment adviser that are currently advised by Fidelity SelectCo, LLC, an affiliate of the investment adviser. The group fee rate decreases as assets under management increase and increases as assets under management decrease. For the reporting period, the total annual management fee rate was .69% of the Fund's average net assets.
Distribution and Service Plan Fees. In accordance with Rule 12b-1 of the 1940 Act, the Fund has adopted separate Distribution and Service Plans for each class of shares. Certain classes pay Fidelity Distributors Corporation (FDC), an affiliate of the investment adviser, separate Distribution and Service Fees, each of which is based on an annual percentage of each class' average net assets. In addition, FDC may pay financial intermediaries for selling shares of the Fund and providing shareholder support services. For the period, the Distribution and Service Fee rates, total fees and amounts retained by FDC were as follows:
| | Distribution Fee | Service Fee | Total Fees | Retained by FDC |
| Class A | -% | .25% | $40,621 | $756 |
| Class M | .25% | .25% | 27,553 | 473 |
| Class C | .75% | .25% | 34,644 | 2,581 |
| | | | $102,818 | $3,810 |
Sales Load. FDC may receive a front-end sales charge of up to 5.75% for selling Class A shares and 3.50% for selling Class M shares, some of which is paid to financial intermediaries for selling shares of the Fund. Depending on the holding period, FDC may receive contingent deferred sales charges levied on Class A, Class M and Class C redemptions. The deferred sales charges are 1.00% for Class C shares, 1.00% for certain purchases of Class A shares and .25% for certain purchases of Class M shares.
For the period, sales charge amounts retained by FDC were as follows:
| | Retained by FDC |
| Class A | $2,009 |
| Class M | 657 |
| Class C(a) | 191 |
| | $2,857 |
(a) When Class C shares are initially sold, FDC pays commissions from its own resources to financial intermediaries through which the sales are made.
Transfer Agent Fees. Fidelity Investments Institutional Operations Company, Inc., (FIIOC), an affiliate of the investment adviser, is the transfer, dividend disbursing and shareholder servicing agent for each class of the Fund. FIIOC receives account fees and asset-based fees that vary according to the account size and type of account of the shareholders of the respective classes of the Fund, except for Class Z. FIIOC receives an asset-based fee of Class Z's average net assets. FIIOC pays for typesetting, printing and mailing of shareholder reports, except proxy statements.
For the period, transfer agent fees for each class were as follows:
| | Amount | % of Class-Level Average Net Assets |
| Class A | $48,391 | .30 |
| Class M | 17,604 | .32 |
| Class C | 10,307 | .30 |
| Latin America | 1,135,662 | .23 |
| Class I | 8,043 | .19 |
| Class Z | 2,280 | .04 |
| | $1,222,287 | |
Accounting and Security Lending Fees. Fidelity Service Company, Inc. (FSC), an affiliate of the investment adviser, maintains the Fund's accounting records. The accounting fee is based on the level of average net assets for each month. Prior to April 1, 2019, FSC had a separate agreement with the Fund for administration of the security lending program, based on the number and duration of lending transactions. For the period, the total fees paid for accounting and administration of securities lending were equivalent to an annual rate of .05%.
Brokerage Commissions. The Fund placed a portion of its portfolio transactions with brokerage firms which are affiliates of the investment adviser. Brokerage commissions are included in net realized gain (loss) and change in net unrealized appreciation (depreciation) in the Statement of Operations. The commissions paid to these affiliated firms were $788 for the period.
Interfund Lending Program. Pursuant to an Exemptive Order issued by the SEC, the Fund, along with other registered investment companies having management contracts with Fidelity Management & Research Company (FMR) or other affiliated entities of FMR, may participate in an interfund lending program. This program provides an alternative credit facility allowing the funds to borrow from, or lend money to, other participating affiliated funds. At period end, there were no interfund loans outstanding. The Fund's activity in this program during the period for which loans were outstanding was as follows:
| Borrower or Lender | Average Loan Balance | Weighted Average Interest Rate | Interest Expense |
| Borrower | $3,006,500 | 2.65% | $443 |
Interfund Trades. The Fund may purchase from or sell securities to other Fidelity Funds under procedures adopted by the Board. The procedures have been designed to ensure these interfund trades are executed in accordance with Rule 17a-7 of the 1940 Act. Interfund trades are included within the respective purchases and sales amounts shown in the Purchases and Sales of Investments note.
6. Committed Line of Credit.
The Fund participates with other funds managed by the investment adviser or an affiliate in a $4.25 billion credit facility (the "line of credit") to be utilized for temporary or emergency purposes to fund shareholder redemptions or for other short-term liquidity purposes. The Fund has agreed to pay commitment fees on its pro-rata portion of the line of credit, which amounted to $1,379 and is reflected in Miscellaneous expenses on the Statement of Operations. During the period, the Fund did not borrow on this line of credit.
7. Security Lending.
The Fund lends portfolio securities from time to time in order to earn additional income. For equity securities, lending agents are used, including National Financial Services (NFS), an affiliate of the Fund. Pursuant to a securities lending agreement, NFS will receive a fee, which is capped at 9.9% of daily lending revenue, for its services as lending agent. The Fund may lend securities to certain qualified borrowers, including NFS. On the settlement date of the loan, the Fund receives collateral (in the form of U.S. Treasury obligations, letters of credit and/or cash) against the loaned securities and maintains collateral in an amount not less than 100% of the market value of the loaned securities during the period of the loan. The market value of the loaned securities is determined at the close of business of the Fund and any additional required collateral is delivered to the Fund on the next business day. The Fund or borrower may terminate the loan at any time, and if the borrower defaults on its obligation to return the securities loaned because of insolvency or other reasons, the Fund may apply collateral received from the borrower against the obligation. The Fund may experience delays and costs in recovering the securities loaned. Any cash collateral received is invested in the Fidelity Securities Lending Cash Central Fund. The value of loaned securities and cash collateral at period end are disclosed on the Fund's Statement of Assets and Liabilities. Total fees paid by the Fund to NFS, as lending agent, amounted to $332. Security lending income represents the income earned on investing cash collateral, less rebates paid to borrowers and any lending agent fees associated with the loan, plus any premium payments received for lending certain types of securities. Security lending income is presented in the Statement of Operations as a component of income from Fidelity Central Funds. During the period, there were no securities loaned to NFS.
8. Expense Reductions.
Through arrangements with each class' transfer agent, credits realized as a result of certain uninvested cash balances were used to reduce the Fund's expenses. During the period, transfer agent credits reduced each class' expenses as noted in the table below.
| | Transfer Agent expense reduction |
| Latin America | $606 |
In addition, during the period the investment adviser reimbursed and/or waived a portion of fund-level operating expenses in the amount of $3,651 and a portion of class-level operating expenses as follows:
| | Amount |
| Class A | $495 |
| Class M | 166 |
| Class C | 133 |
| Latin America | 15,080 |
| Class I | 119 |
| Class Z | 6 |
| | $15,999 |
9. Distributions to Shareholders.
Distributions to shareholders of each class were as follows:
| | Year ended
October 31, 2019 | Year ended
October 31, 2018(a) |
| Distributions to shareholders | | |
| Class A | $268,347 | $203,267 |
| Class M | 80,020 | 60,223 |
| Class C | 31,875 | 19,813 |
| Latin America | 10,028,288 | 8,592,965 |
| Class I | 87,883 | 129,478 |
| Class Z | 4,501 | – |
| Total | $10,500,914 | $9,005,746 |
(a) Distributions for Class Z are for the period October 2, 2018 (commencement of sale of shares) to October 31, 2018.
10. Share Transactions.
Share transactions for each class were as follows and may contain automatic conversions between classes or exchanges between affiliated funds:
| | Shares | Shares | Dollars | Dollars |
| | Year ended October 31, 2019 | Year ended October 31, 2018(a) | Year ended October 31, 2019 | Year ended October 31, 2018(a) |
| Class A | | | | |
| Shares sold | 190,162 | 132,121 | $4,542,667 | $3,342,334 |
| Reinvestment of distributions | 12,291 | 8,149 | 261,098 | 198,340 |
| Shares redeemed | (213,594) | (210,293) | (5,187,663) | (4,928,726) |
| Net increase (decrease) | (11,141) | (70,023) | $(383,898) | $(1,388,052) |
| Class M | | | | |
| Shares sold | 28,150 | 33,058 | $685,184 | $849,708 |
| Reinvestment of distributions | 3,725 | 2,445 | 79,471 | 59,769 |
| Shares redeemed | (51,275) | (73,856) | (1,242,844) | (1,749,327) |
| Net increase (decrease) | (19,400) | (38,353) | $(478,189) | $(839,850) |
| Class C | | | | |
| Shares sold | 66,110 | 28,227 | $1,652,333 | $744,605 |
| Reinvestment of distributions | 1,372 | 727 | 29,690 | 18,055 |
| Shares redeemed | (105,422) | (73,884) | (2,560,121) | (1,820,603) |
| Net increase (decrease) | (37,940) | (44,930) | $(878,098) | $(1,057,943) |
| Latin America | | | | |
| Shares sold | 4,153,117 | 4,131,542 | $98,919,671 | $102,336,398 |
| Reinvestment of distributions | 450,184 | 339,440 | 9,512,373 | 8,218,379 |
| Shares redeemed | (6,619,628) | (8,141,607) | (162,591,256) | (192,899,345) |
| Net increase (decrease) | (2,016,327) | (3,670,625) | $(54,159,212) | $(82,344,568) |
| Class I | | | | |
| Shares sold | 150,061 | 238,869 | $3,880,633 | $5,842,130 |
| Reinvestment of distributions | 4,028 | 4,501 | 85,022 | 108,773 |
| Shares redeemed | (109,553) | (381,644) | (2,603,516) | (9,010,302) |
| Net increase (decrease) | 44,536 | (138,274) | $1,362,139 | $(3,059,399) |
| Class Z | | | | |
| Shares sold | 1,000,685 | 6,615 | $26,118,988 | $143,661 |
| Reinvestment of distributions | 198 | – | 4,168 | – |
| Shares redeemed | (65,246) | – | (1,687,845) | – |
| Net increase (decrease) | 935,637 | 6,615 | $24,435,311 | $143,661 |
(a) Share transactions for Class Z are for the period October 2, 2018 (commencement of sale of shares) to October 31, 2018.
11. Other.
The Fund's organizational documents provide former and current trustees and officers with a limited indemnification against liabilities arising in connection with the performance of their duties to the Fund. In the normal course of business, the Fund may also enter into contracts that provide general indemnifications. The Fund's maximum exposure under these arrangements is unknown as this would be dependent on future claims that may be made against the Fund. The risk of material loss from such claims is considered remote.
Fidelity® Nordic Fund
Performance: The Bottom Line
Average annual total return reflects the change in the value of an investment, assuming reinvestment of distributions from dividend income and capital gains (the profits earned upon the sale of securities that have grown in value, if any) and assuming a constant rate of performance each year. The hypothetical investment and the average annual total returns do not reflect the deduction of taxes that a shareholder would pay on fund distributions or the redemption of fund shares. During periods of reimbursement by Fidelity, a fund’s total return will be greater than it would be had the reimbursement not occurred. How a fund did yesterday is no guarantee of how it will do tomorrow.
Average Annual Total Returns
| For the periods ended October 31, 2019 | Past 1 year | Past 5 years | Past 10 years |
| Fidelity® Nordic Fund | 3.96% | 5.04% | 9.07% |
$10,000 Over 10 Years
Let's say hypothetically that $10,000 was invested in Fidelity® Nordic Fund on October 31, 2009.
The chart shows how the value of your investment would have changed, and also shows how the FTSE® Capped Nordic Index performed over the same period.
Returns for the FTSE® Capped Nordic Index for periods prior to October 1, 2009 (it's inception date) are returns of the uncapped FTSE Nordic Index.
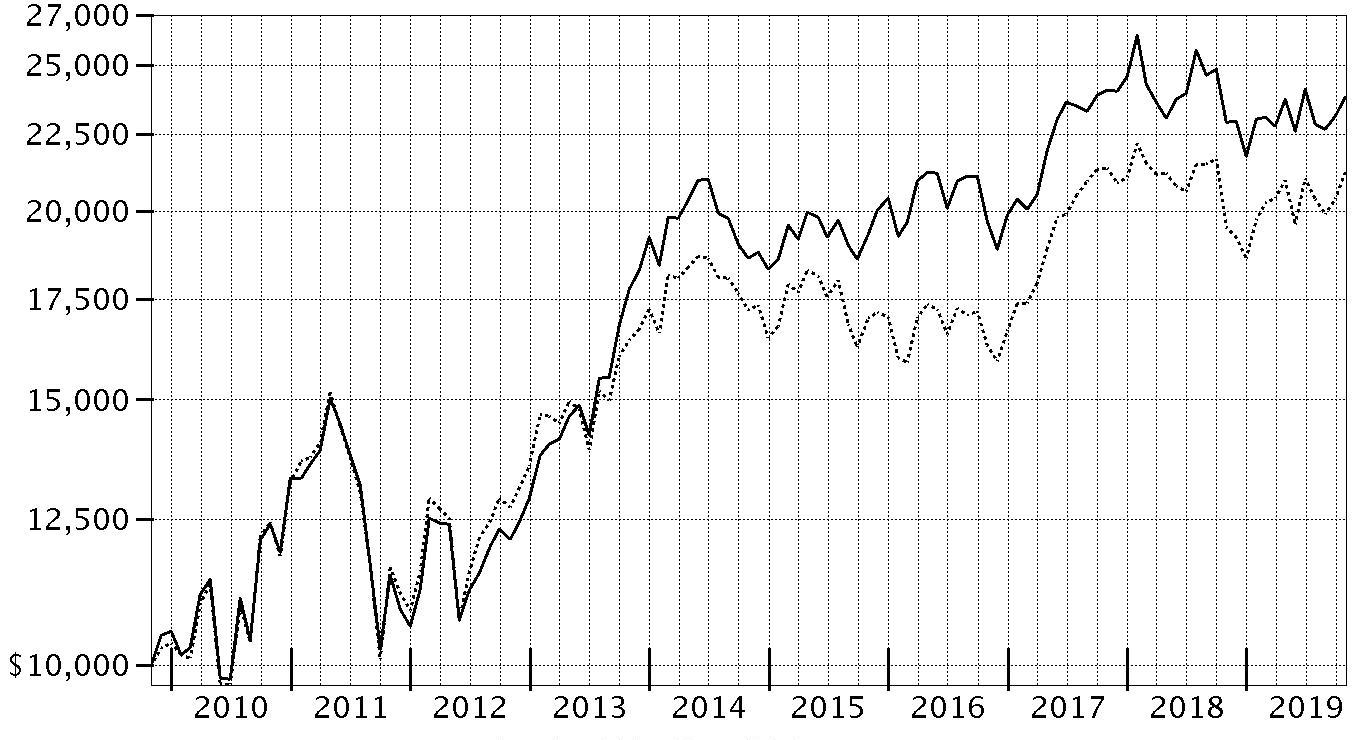
| Period Ending Values |
| $23,818 | Fidelity® Nordic Fund |
| $21,236 | FTSE® Capped Nordic Index |
Fidelity® Nordic Fund
Management's Discussion of Fund Performance
Market Recap: The MSCI ACWI (All Country World Index) ex USA Index gained 11.47% for the 12 months ending October 31, 2019, as international stocks reflected a confluence of factors, including escalating trade tension, and moderating but still positive global economic growth. Currency fluctuations were largely modest and varied by region, muting the overall impact on international equity returns. In late December, the U.S. Federal Reserve shifted from raising interest rates to a more dovish policy in 2019, joining many foreign central banks. In June, international stocks rose 6.03%, as policy stimulus in China stabilized that country’s economic growth. The Fed cut its policy rate in July for the first time since 2008. However, the index returned -1.21% for the month, followed by -3.08% in August. In September, the Fed cut its policy rate another quarter point, citing concerns about slowing economic growth and muted inflation, and did the same in October, leading to monthly gains of 2.59% and 3.49%, respectively. For the full 12 months, the growth-oriented information technology sector (+22%) led the way, followed by utilities (+20%) and real estate (+18%), two high-dividend-yielding categories. Conversely, energy was roughly flat, while materials (+6%) and communication services (7%) also lagged. By region, Asia Pacific ex Japan (+16%), Europe ex U.K (+13%), Canada (+12%) and emerging markets (+12%) fared best. Meanwhile, the U.K. (+7%) and Japan (+10%) trailed the broader market.
Comments from Portfolio Manager Andrew Sergeant: For the fiscal year, the fund gained 3.96%, underperforming the 8.79% advance of the benchmark, the FTSE Nordic Capped Index. Despite continued volatility sparked by slowing global growth and trade tension, the Nordic countries delivered positive results, mainly due to the high-quality business fundamentals of the region's companies. Versus the FTSE index, stock selection detracted the most, especially in the consumer discretionary, industrials and financials sectors. On an individual basis, the fund's outsized position in Swedbank, which struggled after being implicated in a money-laundering scandal, detracted more than any other single security. The fund's sizable non-benchmark stake in Kambi Group, a sports-betting infrastructure firm listed on Sweden's First North stock exchange, also detracted. Conversely, the fund's positioning in materials added relative value, as did stock selection in information technology. Also, the fund's non-benchmark position in AddTech, a Swedish distribution firm for industrial equipment contributed notably.
The views expressed above reflect those of the portfolio manager(s) only through the end of the period as stated on the cover of this report and do not necessarily represent the views of Fidelity or any other person in the Fidelity organization. Any such views are subject to change at any time based upon market or other conditions and Fidelity disclaims any responsibility to update such views. These views may not be relied on as investment advice and, because investment decisions for a Fidelity fund are based on numerous factors, may not be relied on as an indication of trading intent on behalf of any Fidelity fund.
Fidelity® Nordic Fund
Investment Summary (Unaudited)
Geographic Diversification (% of fund's net assets)
| As of October 31, 2019 |
| | Sweden | 43.4% |
| | Denmark | 22.9% |
| | Finland | 14.1% |
| | Norway | 10.3% |
| | United States of America* | 4.9% |
| | Malta | 2.5% |
| | Bermuda | 1.9% |
* Includes Short-Term investments and Net Other Assets (Liabilities).
Percentages are based on country or territory of incorporation and are adjusted for the effect of futures contracts, if applicable.
Asset Allocation as of October 31, 2019
| | % of fund's net assets |
| Stocks | 96.8 |
| Short-Term Investments and Net Other Assets (Liabilities) | 3.2 |
Top Ten Stocks as of October 31, 2019
| | % of fund's net assets |
| Novo Nordisk A/S Series B (Denmark, Pharmaceuticals) | 9.0 |
| Telefonaktiebolaget LM Ericsson (B Shares) (Sweden, Communications Equipment) | 6.9 |
| Swedbank AB (A Shares) (Sweden, Banks) | 5.3 |
| Investor AB (B Shares) (Sweden, Diversified Financial Services) | 4.5 |
| Olvi PLC (A Shares) (Finland, Beverages) | 4.1 |
| UPM-Kymmene Corp. (Finland, Paper & Forest Products) | 4.1 |
| Skandinaviska Enskilda Banken AB (A Shares) (Sweden, Banks) | 3.7 |
| A.P. Moller - Maersk A/S Series B (Denmark, Marine) | 3.4 |
| DSV A/S (Denmark, Air Freight & Logistics) | 3.3 |
| Equinor ASA (Norway, Oil, Gas & Consumable Fuels) | 3.1 |
| | 47.4 |
Top Market Sectors as of October 31, 2019
| | % of fund's net assets |
| Industrials | 21.5 |
| Financials | 18.9 |
| Health Care | 11.3 |
| Information Technology | 9.7 |
| Consumer Discretionary | 9.3 |
| Consumer Staples | 7.8 |
| Materials | 7.4 |
| Communication Services | 3.6 |
| Energy | 3.1 |
| Utilities | 3.0 |
Market Sectors may include more than one industry category.
The Fund may invest up to 35% of its total assets in any industry that represents more than 20% of the Nordic market. As of October 31, 2019, the Fund did not have more than 25% of its total assets invested in any one industry.
Fidelity® Nordic Fund
Schedule of Investments October 31, 2019
Showing Percentage of Net Assets
| Common Stocks - 96.8% | | | |
| | | Shares | Value |
| Bermuda - 1.9% | | | |
| Vostok New Ventures Ltd. (depositary receipt) | | 814,271 | $5,102,001 |
| Denmark - 22.9% | | | |
| A.P. Moller - Maersk A/S Series B | | 6,974 | 8,896,051 |
| DSV A/S | | 89,100 | 8,645,578 |
| Novo Nordisk A/S Series B | | 429,300 | 23,606,655 |
| ORSTED A/S (a) | | 87,800 | 7,701,570 |
| Scandinavian Tobacco Group A/S (a) | | 294,000 | 3,473,771 |
| Vestas Wind Systems A/S | | 93,300 | 7,600,947 |
|
| TOTAL DENMARK | | | 59,924,572 |
|
| Finland - 14.1% | | | |
| Ahlstrom-Munksjo OYJ | | 150,177 | 2,251,098 |
| Caverion Corp. (b) | | 152,766 | 1,141,545 |
| Nokia Corp. | | 1,305,900 | 4,793,977 |
| Nokian Tyres PLC | | 247,900 | 7,077,962 |
| Olvi PLC (A Shares) | | 255,046 | 10,823,429 |
| UPM-Kymmene Corp. | | 331,400 | 10,770,448 |
|
| TOTAL FINLAND | | | 36,858,459 |
|
| Malta - 2.5% | | | |
| Kambi Group PLC (b)(c) | | 391,488 | 6,466,889 |
| Norway - 10.3% | | | |
| Adevinta ASA Class B | | 555,972 | 6,347,989 |
| Entra ASA (a) | | 97,900 | 1,464,856 |
| Equinor ASA | | 439,200 | 8,123,826 |
| Kongsberg Gruppen ASA | | 322,936 | 4,768,812 |
| Schibsted ASA (B Shares) | | 116,850 | 3,263,005 |
| Skandiabanken ASA (a) | | 435,631 | 3,093,328 |
|
| TOTAL NORWAY | | | 27,061,816 |
|
| Sweden - 43.4% | | | |
| AcadeMedia AB (a) | | 403,294 | 2,040,340 |
| Addlife AB | | 90,771 | 2,030,566 |
| AddTech AB (B Shares) | | 58,767 | 1,634,158 |
| Alfa Laval AB | | 123,400 | 2,851,222 |
| Arjo AB | | 947,800 | 3,902,827 |
| Dustin Group AB (a)(b) | | 509,600 | 4,058,560 |
| Eltel AB (a)(b)(c) | | 2,467,623 | 5,315,675 |
| EQT AB (c) | | 16,400 | 157,347 |
| Investor AB (B Shares) (b) | | 230,250 | 11,791,856 |
| John Mattson Fastighetsforetag (c) | | 120,731 | 1,580,455 |
| Lagercrantz Group AB (B Shares) | | 197,351 | 2,534,412 |
| Momentum Group AB Class B | | 323,369 | 3,469,560 |
| Saab AB (B Shares) | | 187,125 | 5,769,350 |
| Securitas AB (B Shares) | | 395,600 | 6,325,863 |
| Skandinaviska Enskilda Banken AB (A Shares) | | 1,011,800 | 9,694,971 |
| Svenska Cellulosa AB (SCA) (B Shares) | | 609,600 | 6,209,830 |
| Svenska Handelsbanken AB (A Shares) | | 572,100 | 5,741,488 |
| Swedbank AB (A Shares) | | 999,699 | 13,982,347 |
| Swedish Match Co. AB | | 136,600 | 6,411,459 |
| Telefonaktiebolaget LM Ericsson (B Shares) | | 2,067,500 | 18,067,450 |
|
| TOTAL SWEDEN | | | 113,569,736 |
|
| United States of America - 1.7% | | | |
| Autoliv, Inc. (depositary receipt) | | 57,200 | 4,466,667 |
| TOTAL COMMON STOCKS | | | |
| (Cost $253,077,599) | | | 253,450,140 |
|
| Money Market Funds - 6.2% | | | |
| Fidelity Cash Central Fund 1.83% (d) | | 2,848,901 | 2,849,470 |
| Fidelity Securities Lending Cash Central Fund 1.84% (d)(e) | | 13,563,616 | 13,564,973 |
| TOTAL MONEY MARKET FUNDS | | | |
| (Cost $16,414,554) | | | 16,414,443 |
| TOTAL INVESTMENT IN SECURITIES - 103.0% | | | |
| (Cost $269,492,153) | | | 269,864,583 |
| NET OTHER ASSETS (LIABILITIES) - (3.0)% | | | (7,968,901) |
| NET ASSETS - 100% | | | $261,895,682 |
Categorizations in the Schedule of Investments are based on country or territory of incorporation.
Legend
(a) Security exempt from registration under Rule 144A of the Securities Act of 1933. These securities may be resold in transactions exempt from registration, normally to qualified institutional buyers. At the end of the period, the value of these securities amounted to $27,148,100 or 10.4% of net assets.
(b) Security or a portion of the security is on loan at period end.
(c) Non-income producing
(d) Affiliated fund that is generally available only to investment companies and other accounts managed by Fidelity Investments. The rate quoted is the annualized seven-day yield of the fund at period end. A complete unaudited listing of the fund's holdings as of its most recent quarter end is available upon request. In addition, each Fidelity Central Fund's financial statements, which are not covered by the Fund's Report of Independent Registered Public Accounting Firm, are available on the SEC's website or upon request.
(e) Investment made with cash collateral received from securities on loan.
Affiliated Central Funds
Information regarding fiscal year to date income earned by the Fund from investments in Fidelity Central Funds is as follows:
| Fund | Income earned |
| Fidelity Cash Central Fund | $64,090 |
| Fidelity Securities Lending Cash Central Fund | 268,273 |
| Total | $332,363 |
Amounts in the income column in the above table include any capital gain distributions from underlying funds, which are presented in the corresponding line-item in the Statement of Operations, if applicable. Amount for Fidelity Securities Lending Cash Central Fund represents the income earned on investing cash collateral, less rebates paid to borrowers and any lending agent fees associated with the loan, plus any premium payments received for lending certain types of securities.
Investment Valuation
The following is a summary of the inputs used, as of October 31, 2019, involving the Fund's assets and liabilities carried at fair value. The inputs or methodology used for valuing securities may not be an indication of the risk associated with investing in those securities. For more information on valuation inputs, and their aggregation into the levels used below, please refer to the Investment Valuation section in the accompanying Notes to Financial Statements.
| | Valuation Inputs at Reporting Date: |
| Description | Total | Level 1 | Level 2 | Level 3 |
| Investments in Securities: | | | | |
| Equities: | | | | |
| Consumer Discretionary | $24,110,418 | $24,110,418 | $-- | $-- |
| Consumer Staples | 20,708,659 | 20,708,659 | -- | -- |
| Energy | 8,123,826 | 8,123,826 | -- | -- |
| Financials | 49,563,338 | 43,821,850 | 5,741,488 | -- |
| Health Care | 29,540,048 | 5,933,393 | 23,606,655 | -- |
| Industrials | 56,418,761 | 39,921,763 | 16,496,998 | -- |
| Information Technology | 25,395,839 | 2,534,412 | 22,861,427 | -- |
| Materials | 19,231,376 | 19,231,376 | -- | -- |
| Real Estate | 3,045,311 | 3,045,311 | -- | -- |
| Telecommunication Services | 9,610,994 | 9,610,994 | -- | -- |
| Utilities | 7,701,570 | 7,701,570 | -- | -- |
| Money Market Funds | 16,414,443 | 16,414,443 | -- | -- |
| Total Investments in Securities: | $269,864,583 | $201,158,015 | $68,706,568 | $-- |
See accompanying notes which are an integral part of the financial statements.
Fidelity® Nordic Fund
Financial Statements
Statement of Assets and Liabilities
| | | October 31, 2019 |
| Assets | | |
Investment in securities, at value (including securities loaned of $12,874,328) — See accompanying schedule:
Unaffiliated issuers (cost $253,077,599) | $253,450,140 | |
| Fidelity Central Funds (cost $16,414,554) | 16,414,443 | |
| Total Investment in Securities (cost $269,492,153) | | $269,864,583 |
| Foreign currency held at value (cost $433,206) | | 433,206 |
| Receivable for investments sold | | 5,994,050 |
| Receivable for fund shares sold | | 24,826 |
| Dividends receivable | | 322,348 |
| Distributions receivable from Fidelity Central Funds | | 6,944 |
| Prepaid expenses | | 496 |
| Other receivables | | 203 |
| Total assets | | 276,646,656 |
| Liabilities | | |
| Payable for investments purchased | $734,839 | |
| Payable for fund shares redeemed | 192,833 | |
| Accrued management fee | 147,065 | |
| Other affiliated payables | 51,533 | |
| Other payables and accrued expenses | 62,041 | |
| Collateral on securities loaned | 13,562,663 | |
| Total liabilities | | 14,750,974 |
| Net Assets | | $261,895,682 |
| Net Assets consist of: | | |
| Paid in capital | | $254,822,223 |
| Total accumulated earnings (loss) | | 7,073,459 |
| Net Assets, for 5,609,232 shares outstanding | | $261,895,682 |
| Net Asset Value, offering price and redemption price per share ($261,895,682 ÷ 5,609,232 shares) | | $46.69 |
See accompanying notes which are an integral part of the financial statements.
Statement of Operations
| | | Year ended October 31, 2019 |
| Investment Income | | |
| Dividends | | $7,438,129 |
| Non-Cash dividends | | 4,818,016 |
| Income from Fidelity Central Funds (including $268,273 from security lending) | | 332,363 |
| Income before foreign taxes withheld | | 12,588,508 |
| Less foreign taxes withheld | | (1,137,970) |
| Total income | | 11,450,538 |
| Expenses | | |
| Management fee | $1,855,374 | |
| Transfer agent fees | 511,115 | |
| Accounting and security lending fees | 140,970 | |
| Custodian fees and expenses | 32,973 | |
| Independent trustees' fees and expenses | 1,551 | |
| Registration fees | 22,720 | |
| Audit | 78,118 | |
| Legal | 608 | |
| Miscellaneous | 1,720 | |
| Total expenses before reductions | 2,645,149 | |
| Expense reductions | (44,922) | |
| Total expenses after reductions | | 2,600,227 |
| Net investment income (loss) | | 8,850,311 |
| Realized and Unrealized Gain (Loss) | | |
| Net realized gain (loss) on: | | |
| Investment securities: | | |
| Unaffiliated issuers | 3,935,198 | |
| Fidelity Central Funds | 794 | |
| Foreign currency transactions | (21,509) | |
| Total net realized gain (loss) | | 3,914,483 |
| Change in net unrealized appreciation (depreciation) on: | | |
| Investment securities: | | |
| Unaffiliated issuers | (2,241,479) | |
| Fidelity Central Funds | (111) | |
| Assets and liabilities in foreign currencies | (19,334) | |
| Total change in net unrealized appreciation (depreciation) | | (2,260,924) |
| Net gain (loss) | | 1,653,559 |
| Net increase (decrease) in net assets resulting from operations | | $10,503,870 |
See accompanying notes which are an integral part of the financial statements.
Statement of Changes in Net Assets
| | Year ended October 31, 2019 | Year ended October 31, 2018 |
| Increase (Decrease) in Net Assets | | |
| Operations | | |
| Net investment income (loss) | $8,850,311 | $2,921,247 |
| Net realized gain (loss) | 3,914,483 | 29,401,950 |
| Change in net unrealized appreciation (depreciation) | (2,260,924) | (46,626,675) |
| Net increase (decrease) in net assets resulting from operations | 10,503,870 | (14,303,478) |
| Distributions to shareholders | (26,423,359) | (13,759,103) |
| Share transactions | | |
| Proceeds from sales of shares | 21,795,602 | 18,566,517 |
| Reinvestment of distributions | 24,699,755 | 12,909,432 |
| Cost of shares redeemed | (58,864,048) | (90,024,441) |
| Net increase (decrease) in net assets resulting from share transactions | (12,368,691) | (58,548,492) |
| Redemption fees | – | 47,618 |
| Total increase (decrease) in net assets | (28,288,180) | (86,563,455) |
| Net Assets | | |
| Beginning of period | 290,183,862 | 376,747,317 |
| End of period | $261,895,682 | $290,183,862 |
| Other Information | | |
| Shares | | |
| Sold | 481,565 | 350,130 |
| Issued in reinvestment of distributions | 565,212 | 250,523 |
| Redeemed | (1,283,144) | (1,688,296) |
| Net increase (decrease) | (236,367) | (1,087,643) |
See accompanying notes which are an integral part of the financial statements.
Financial Highlights
Fidelity Nordic Fund
| | | | | | |
| Years ended October 31, | 2019 | 2018 | 2017 | 2016 | 2015 |
| Selected Per–Share Data | | | | | |
| Net asset value, beginning of period | $49.64 | $54.34 | $45.28 | $44.99 | $43.36 |
| Income from Investment Operations | | | | | |
| Net investment income (loss)A | 1.50B | .47 | .51 | .64 | .56 |
| Net realized and unrealized gain (loss) | .15 | (3.01) | 9.32 | .27 | 1.06 |
| Total from investment operations | 1.65 | (2.54) | 9.83 | .91 | 1.62 |
| Distributions from net investment income | (.05) | (.50) | (.65) | (.57) | – |
| Distributions from net realized gain | (4.55) | (1.67) | (.12) | (.05) | – |
| Total distributions | (4.60) | (2.17) | (.77) | (.62) | – |
| Redemption fees added to paid in capitalA | – | .01 | –C | –C | .01 |
| Net asset value, end of period | $46.69 | $49.64 | $54.34 | $45.28 | $44.99 |
| Total ReturnD | 3.96% | (4.80)% | 22.14% | 1.97% | 3.76% |
| Ratios to Average Net AssetsE,F | | | | | |
| Expenses before reductions | .98% | .98% | .99% | .99% | 1.00% |
| Expenses net of fee waivers, if any | .98% | .97% | .99% | .98% | 1.00% |
| Expenses net of all reductions | .96% | .97% | .96% | .98% | .99% |
| Net investment income (loss) | 3.28%B | .89% | 1.04% | 1.37% | 1.26% |
| Supplemental Data | | | | | |
| Net assets, end of period (000 omitted) | $261,896 | $290,184 | $376,747 | $430,020 | $405,726 |
| Portfolio turnover rateG | 34% | 56% | 69% | 63% | 80% |
A Calculated based on average shares outstanding during the period.
B Net investment income per share reflects large, non-recurring dividends which amounted to $.82 per share. Excluding these non-recurring dividends, the ratio of net investment income (loss) to average net assets would have been 1.50%.
C Amount represents less than $.005 per share.
D Total returns would have been lower if certain expenses had not been reduced during the applicable periods shown.
E Fees and expenses of any underlying Fidelity Central Funds are not included in the Fund's expense ratio. The Fund indirectly bears its proportionate share of the expenses of any underlying Fidelity Central Funds.
F Expense ratios reflect operating expenses of the Fund. Expenses before reductions do not reflect amounts reimbursed by the investment adviser or reductions from brokerage service arrangements or reductions from other expense offset arrangements and do not represent the amount paid by the Fund during periods when reimbursements or reductions occur. Expenses net of fee waivers reflect expenses after reimbursement by the investment adviser but prior to reductions from brokerage service arrangements or other expense offset arrangements. Expenses net of all reductions represent the net expenses paid by the Fund.
G Amount does not include the portfolio activity of any underlying Fidelity Central Funds.
See accompanying notes which are an integral part of the financial statements.
Notes to Financial Statements
For the period ended October 31, 2019
1. Organization.
Fidelity Nordic Fund (the Fund) is a fund of Fidelity Investment Trust (the Trust) and is authorized to issue an unlimited number of shares. Share transactions on the Statement of Changes in Net Assets may contain exchanges between affiliated funds. The Trust is registered under the Investment Company Act of 1940, as amended (the 1940 Act), as an open-end management investment company organized as a Massachusetts business trust.
2. Investments in Fidelity Central Funds.
The Fund invests in Fidelity Central Funds, which are open-end investment companies generally available only to other investment companies and accounts managed by the investment adviser and its affiliates. The Fund's Schedule of Investments lists each of the Fidelity Central Funds held as of period end, if any, as an investment of the Fund, but does not include the underlying holdings of each Fidelity Central Fund. As an Investing Fund, the Fund indirectly bears its proportionate share of the expenses of the underlying Fidelity Central Funds.
The Money Market Central Funds seek preservation of capital and current income and are managed by Fidelity Investments Money Management, Inc. (FIMM), an affiliate of the investment adviser. Annualized expenses of the Money Market Central Funds as of their most recent shareholder report date ranged from less than .005% to .01%.
A complete unaudited list of holdings for each Fidelity Central Fund is available upon request or at the Securities and Exchange Commission (the SEC) website at www.sec.gov. In addition, the financial statements of the Fidelity Central Funds, which are not covered by the Fund's Report of Independent Registered Public Accounting Firm, are available on the SEC website or upon request.
3. Significant Accounting Policies.
The Fund is an investment company and applies the accounting and reporting guidance of the Financial Accounting Standards Board (FASB) Accounting Standards Codification Topic 946 Financial Services – Investments Companies. The financial statements have been prepared in conformity with accounting principles generally accepted in the United States of America (GAAP), which require management to make certain estimates and assumptions at the date of the financial statements. Actual results could differ from those estimates. Subsequent events, if any, through the date that the financial statements were issued have been evaluated in the preparation of the financial statements. The following summarizes the significant accounting policies of the Fund:
Investment Valuation. Investments are valued as of 4:00 p.m. Eastern time on the last calendar day of the period. The Board of Trustees (the Board) has delegated the day to day responsibility for the valuation of the Fund's investments to the Fair Value Committee (the Committee) established by the Fund's investment adviser. In accordance with valuation policies and procedures approved by the Board, the Fund attempts to obtain prices from one or more third party pricing vendors or brokers to value its investments. When current market prices, quotations or currency exchange rates are not readily available or reliable, investments will be fair valued in good faith by the Committee, in accordance with procedures adopted by the Board. Factors used in determining fair value vary by investment type and may include market or investment specific events. The frequency with which these procedures are used cannot be predicted and they may be utilized to a significant extent. The Committee oversees the Fund's valuation policies and procedures and reports to the Board on the Committee's activities and fair value determinations. The Board monitors the appropriateness of the procedures used in valuing the Fund's investments and ratifies the fair value determinations of the Committee.
The Fund categorizes the inputs to valuation techniques used to value its investments into a disclosure hierarchy consisting of three levels as shown below:
- Level 1 – quoted prices in active markets for identical investments
- Level 2 – other significant observable inputs (including quoted prices for similar investments, interest rates, prepayment speeds, etc.)
- Level 3 – unobservable inputs (including the Fund's own assumptions based on the best information available)
Valuation techniques used to value the Fund's investments by major category are as follows:
Equity securities, including restricted securities, for which market quotations are readily available, are valued at the last reported sale price or official closing price as reported by a third party pricing vendor on the primary market or exchange on which they are traded and are categorized as Level 1 in the hierarchy. In the event there were no sales during the day or closing prices are not available, securities are valued at the last quoted bid price or may be valued using the last available price and are generally categorized as Level 2 in the hierarchy. For foreign equity securities, when market or security specific events arise, comparisons to the valuation of American Depositary Receipts (ADRs), futures contracts, Exchange-Traded Funds (ETFs) and certain indexes as well as quoted prices for similar securities may be used and would be categorized as Level 2 in the hierarchy. For equity securities, including restricted securities, where observable inputs are limited, assumptions about market activity and risk are used and these securities may be categorized as Level 3 in the hierarchy.
Investments in open-end mutual funds, including the Fidelity Central Funds, are valued at their closing net asset value (NAV) each business day and are categorized as Level 1 in the hierarchy.
Changes in valuation techniques may result in transfers in or out of an assigned level within the disclosure hierarchy. The aggregate value of investments by input level as of October 31, 2019 is included at the end of the Fund's Schedule of Investments.
Foreign Currency. The Fund may use foreign currency contracts to facilitate transactions in foreign-denominated securities. Gains and losses from these transactions may arise from changes in the value of the foreign currency or if the counterparties do not perform under the contracts' terms.
Foreign-denominated assets, including investment securities, and liabilities are translated into U.S. dollars at the exchange rates at period end. Purchases and sales of investment securities, income and dividends received and expenses denominated in foreign currencies are translated into U.S. dollars at the exchange rate in effect on the transaction date.
The effects of exchange rate fluctuations on investments are included with the net realized and unrealized gain (loss) on investment securities. Other foreign currency transactions resulting in realized and unrealized gain (loss) are disclosed separately.
Investment Transactions and Income. For financial reporting purposes, the Fund's investment holdings and NAV include trades executed through the end of the last business day of the period. The NAV per share for processing shareholder transactions is calculated as of the close of business of the New York Stock Exchange (NYSE), normally 4:00 p.m. Eastern time and includes trades executed through the end of the prior business day. Gains and losses on securities sold are determined on the basis of identified cost. Dividend income is recorded on the ex-dividend date, except for certain dividends from foreign securities where the ex-dividend date may have passed, which are recorded as soon as the Fund is informed of the ex-dividend date. Non-cash dividends included in dividend income, if any, are recorded at the fair market value of the securities received. Income and capital gain distributions from Fidelity Central Funds, if any, are recorded on the ex-dividend date. Large, non-recurring dividends recognized by the Fund are presented separately on the Statement of Operations as "Non-cash dividends" and the impact of these dividends is presented in the Financial Highlights. Investment income is recorded net of foreign taxes withheld where recovery of such taxes is uncertain.
Expenses. Expenses directly attributable to a fund are charged to that fund. Expenses attributable to more than one fund are allocated among the respective funds on the basis of relative net assets or other appropriate methods. Expense estimates are accrued in the period to which they relate and adjustments are made when actual amounts are known.
Income Tax Information and Distributions to Shareholders. Each year, the Fund intends to qualify as a regulated investment company under Subchapter M of the Internal Revenue Code, including distributing substantially all of its taxable income and realized gains. As a result, no provision for U.S. Federal income taxes is required. As of October 31, 2019, the Fund did not have any unrecognized tax benefits in the financial statements; nor is the Fund aware of any tax positions for which it is reasonably possible that the total amounts of unrecognized tax benefits will significantly change in the next twelve months. The Fund files a U.S. federal tax return, in addition to state and local tax returns as required. The Fund's federal income tax returns are subject to examination by the Internal Revenue Service (IRS) for a period of three fiscal years after they are filed. State and local tax returns may be subject to examination for an additional fiscal year depending on the jurisdiction. Foreign taxes are provided for based on the Fund's understanding of the tax rules and rates that exist in the foreign markets in which it invests.
Distributions are declared and recorded on the ex-dividend date. Income and capital gain distributions are determined in accordance with income tax regulations, which may differ from GAAP. In addition, the Fund claimed a portion of the payment made to redeeming shareholders as a distribution for income tax purposes.
Capital accounts within the financial statements are adjusted for permanent book-tax differences. These adjustments have no impact on net assets or the results of operations. Capital accounts are not adjusted for temporary book-tax differences which will reverse in a subsequent period.
Book-tax differences are primarily due to foreign currency transactions, passive foreign investment companies (PFIC) and losses deferred due to wash sales.
As of period end, the cost and unrealized appreciation (depreciation) in securities, and derivatives if applicable, for federal income tax purposes were as follows:
| Gross unrealized appreciation | $25,021,935 |
| Gross unrealized depreciation | (30,013,217) |
| Net unrealized appreciation (depreciation) | $(4,991,282) |
| Tax Cost | $274,855,865 |
The tax-based components of distributable earnings as of period end were as follows:
| Undistributed ordinary income | $8,814,360 |
| Undistributed long-term capital gain | $3,268,887 |
| Net unrealized appreciation (depreciation) on securities and other investments | $(5,009,786) |
The tax character of distributions paid was as follows:
| | October 31, 2019 | October 31, 2018 |
| Ordinary Income | $5,998,258 | $ 10,195,686 |
| Long-term Capital Gains | 20,425,101 | 3,563,417 |
| Total | $26,423,359 | $ 13,759,103 |
Restricted Securities. The Fund may invest in securities that are subject to legal or contractual restrictions on resale. These securities generally may be resold in transactions exempt from registration or to the public if the securities are registered. Disposal of these securities may involve time-consuming negotiations and expense, and prompt sale at an acceptable price may be difficult. Information regarding restricted securities is included at the end of the Fund's Schedule of Investments.
4. Purchases and Sales of Investments.
Purchases and sales of securities, other than short-term securities, aggregated $90,955,107 and $120,650,871, respectively.
5. Fees and Other Transactions with Affiliates.
Management Fee. Fidelity Management & Research Company (the investment adviser) and its affiliates provide the Fund with investment management related services for which the Fund pays a monthly management fee. The management fee is the sum of an individual fund fee rate that is based on an annual rate of .45% of the Fund's average net assets and an annualized group fee rate that averaged .24% during the period. The group fee rate is based upon the average net assets of all the mutual funds advised by the investment adviser, including any mutual funds previously advised by the investment adviser that are currently advised by Fidelity SelectCo, LLC, an affiliate of the investment adviser. The group fee rate decreases as assets under management increase and increases as assets under management decrease. For the reporting period, the total annual management fee rate was .69% of the Fund's average net assets.
Transfer Agent Fees. Fidelity Investments Institutional Operations Company, Inc. (FIIOC), an affiliate of the investment adviser, is the Fund's transfer, dividend disbursing and shareholder servicing agent. FIIOC receives account fees and asset-based fees that vary according to account size and type of account. FIIOC pays for typesetting, printing and mailing of shareholder reports, except proxy statements. For the period, the transfer agent fees were equivalent to an annual rate of .19% of average net assets.
Accounting and Security Lending Fees. Fidelity Service Company, Inc. (FSC), an affiliate of the investment adviser, maintains the Fund's accounting records. The accounting fee is based on the level of average net assets for each month. Prior to April 1, 2019, FSC had a separate agreement with the Fund for administration of the security lending program, based on the number and duration of lending transactions. For the period, the total fees paid for accounting and administration of securities lending were equivalent to an annual rate of .05%.
Interfund Trades. The Fund may purchase from or sell securities to other Fidelity Funds under procedures adopted by the Board. The procedures have been designed to ensure these interfund trades are executed in accordance with Rule 17a-7 of the 1940 Act. Interfund trades are included within the respective purchases and sales amounts shown in the Purchases and Sales of Investments note.
6. Committed Line of Credit.
The Fund participates with other funds managed by the investment adviser or an affiliate in a $4.25 billion credit facility (the "line of credit") to be utilized for temporary or emergency purposes to fund shareholder redemptions or for other short-term liquidity purposes. The Fund has agreed to pay commitment fees on its pro-rata portion of the line of credit, which amounted to $726 and is reflected in Miscellaneous expenses on the Statement of Operations. During the period, the Fund did not borrow on this line of credit.
7. Security Lending.
The Fund lends portfolio securities from time to time in order to earn additional income. For equity securities, lending agents are used, including National Financial Services (NFS), an affiliate of the Fund. Pursuant to a securities lending agreement, NFS will receive a fee, which is capped at 9.9% of daily lending revenue, for its services as lending agent. The Fund may lend securities to certain qualified borrowers, including NFS. On the settlement date of the loan, the Fund receives collateral (in the form of U.S. Treasury obligations, letters of credit and/or cash) against the loaned securities and maintains collateral in an amount not less than 100% of the market value of the loaned securities during the period of the loan. The market value of the loaned securities is determined at the close of business of the Fund and any additional required collateral is delivered to the Fund on the next business day. The Fund or borrower may terminate the loan at any time, and if the borrower defaults on its obligation to return the securities loaned because of insolvency or other reasons, the Fund may apply collateral received from the borrower against the obligation. The Fund may experience delays and costs in recovering the securities loaned. Any cash collateral received is invested in the Fidelity Securities Lending Cash Central Fund. The value of loaned securities and cash collateral at period end are disclosed on the Fund's Statement of Assets and Liabilities. Security lending income represents the income earned on investing cash collateral, less rebates paid to borrowers and any lending agent fees associated with the loan, plus any premium payments received for lending certain types of securities. Security lending income is presented in the Statement of Operations as a component of income from Fidelity Central Funds. During the period, there were no securities loaned to NFS.
8. Expense Reductions.
Commissions paid to certain brokers with whom the investment adviser, or its affiliates, places trades on behalf of the Fund include an amount in addition to trade execution, which may be rebated back to the Fund to offset certain expenses. This amount totaled $42,654 for the period. In addition, through arrangements with the Fund's custodian, credits realized as a result of certain uninvested cash balances were used to reduce the Fund's expenses by $113.
In addition, during the period the investment adviser reimbursed and/or waived a portion of operating expenses in the amount of $2,155.
9. Other.
The Fund's organizational documents provide former and current trustees and officers with a limited indemnification against liabilities arising in connection with the performance of their duties to the Fund. In the normal course of business, the Fund may also enter into contracts that provide general indemnifications. The Fund's maximum exposure under these arrangements is unknown as this would be dependent on future claims that may be made against the Fund. The risk of material loss from such claims is considered remote.
Fidelity® Pacific Basin Fund
Performance: The Bottom Line
Average annual total return reflects the change in the value of an investment, assuming reinvestment of distributions from dividend income and capital gains (the profits earned upon the sale of securities that have grown in value, if any) and assuming a constant rate of performance each year. The hypothetical investment and the average annual total returns do not reflect the deduction of taxes that a shareholder would pay on fund distributions or the redemption of fund shares. During periods of reimbursement by Fidelity, a fund’s total return will be greater than it would be had the reimbursement not occurred. How a fund did yesterday is no guarantee of how it will do tomorrow.
Average Annual Total Returns
| For the periods ended October 31, 2019 | Past 1 year | Past 5 years | Past 10 years |
| Fidelity® Pacific Basin Fund | 22.37% | 8.41% | 10.88% |
$10,000 Over 10 Years
Let's say hypothetically that $10,000 was invested in Fidelity® Pacific Basin Fund on October 31, 2009.
The chart shows how the value of your investment would have changed, and also shows how the MSCI AC (All Country) Pacific Index performed over the same period.
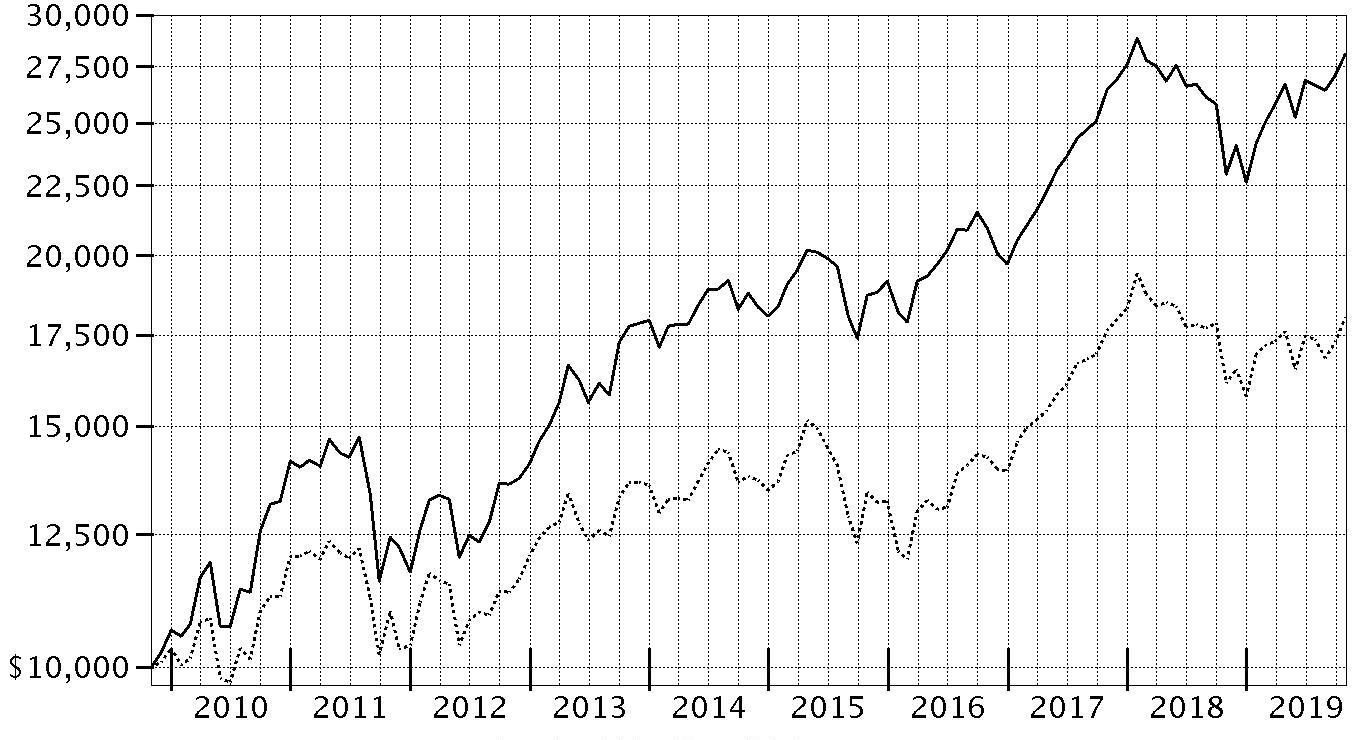
| Period Ending Values |
| $28,088 | Fidelity® Pacific Basin Fund |
| $18,025 | MSCI AC (All Country) Pacific Index |
Fidelity® Pacific Basin Fund
Management's Discussion of Fund Performance
Market Recap: The MSCI ACWI (All Country World Index) ex USA Index gained 11.47% for the 12 months ending October 31, 2019, as international stocks reflected a confluence of factors, including escalating trade tension, and moderating but still positive global economic growth. Currency fluctuations were largely modest and varied by region, muting the overall impact on international equity returns. In late December, the U.S. Federal Reserve shifted from raising interest rates to a more dovish policy in 2019, joining many foreign central banks. In June, international stocks rose 6.03%, as policy stimulus in China stabilized that country’s economic growth. The Fed cut its policy rate in July for the first time since 2008. However, the index returned -1.21% for the month, followed by -3.08% in August. In September, the Fed cut its policy rate another quarter point, citing concerns about slowing economic growth and muted inflation, and did the same in October, leading to monthly gains of 2.59% and 3.49%, respectively. For the full 12 months, the growth-oriented information technology sector (+22%) led the way, followed by utilities (+20%) and real estate (+18%), two high-dividend-yielding categories. Conversely, energy was roughly flat, while materials (+6%) and communication services (7%) also lagged. By region, Asia Pacific ex Japan (+16%), Europe ex U.K (+13%), Canada (+12%) and emerging markets (+12%) fared best. Meanwhile, the U.K. (+7%) and Japan (+10%) trailed the broader market.
Comments from Co-Portfolio Manager John Dance: For the year, the fund advanced 22.37%, considerably outpacing the 11.82% gain of the benchmark, the MSCI AC (All Country) Pacific Free Index. Stock selection drove the vast majority of the fund’s advantage over the benchmark, especially in financials, consumer staples and industrials. Choices in China stood out to the upside. A large overweighting in China-based Kweichow Moutai added more relative value than any other holding. Overweighting Magellan Financial Group, an Australia-based asset manager, also contributed on a relative basis, as did Hoya, a provider of EUV (extreme ultraviolet) lithography photomasks. Conversely, picks in consumer discretionary and an underweighting in real estate detracted, along with a modest cash position. Several non-benchmark positions in Japan hurt: Nakanishi, a manufacturer of dental equipment; Pilot (-25%), a maker of writing instruments, stationery and jewelry; and Fukushima Industries, which makes refrigeration equipment used in convenience stores. We sold this last stock from the fund by period end.
The views expressed above reflect those of the portfolio manager(s) only through the end of the period as stated on the cover of this report and do not necessarily represent the views of Fidelity or any other person in the Fidelity organization. Any such views are subject to change at any time based upon market or other conditions and Fidelity disclaims any responsibility to update such views. These views may not be relied on as investment advice and, because investment decisions for a Fidelity fund are based on numerous factors, may not be relied on as an indication of trading intent on behalf of any Fidelity fund.
Note to shareholders: On June 1, 2019, Kirk Neureiter and Bruce MacDonald joined John Dance as co-managers of the fund. They’re co-managing the fund until year-end, when John will come off of the fund.
Fidelity® Pacific Basin Fund
Investment Summary (Unaudited)
Geographic Diversification (% of fund's net assets)
| As of October 31, 2019 |
| | Japan | 32.7% |
| | Australia | 11.8% |
| | Cayman Islands | 11.6% |
| | China | 10.2% |
| | India | 8.1% |
| | Taiwan | 5.6% |
| | Hong Kong | 5.3% |
| | Korea (South) | 4.1% |
| | Indonesia | 2.2% |
| | Other | 8.4% |
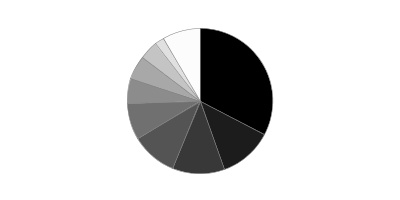
Percentages are based on country or territory of incorporation and are adjusted for the effect of futures contracts, if applicable.
Asset Allocation as of October 31, 2019
| | % of fund's net assets |
| Stocks | 99.2 |
| Short-Term Investments and Net Other Assets (Liabilities) | 0.8 |
Top Ten Stocks as of October 31, 2019
| | % of fund's net assets |
| Taiwan Semiconductor Manufacturing Co. Ltd. (Taiwan, Semiconductors & Semiconductor Equipment) | 4.2 |
| Tencent Holdings Ltd. (Cayman Islands, Interactive Media & Services) | 4.2 |
| Alibaba Group Holding Ltd. sponsored ADR (Cayman Islands, Internet & Direct Marketing Retail) | 3.6 |
| Kweichow Moutai Co. Ltd. (A Shares) (China, Beverages) | 2.3 |
| AIA Group Ltd. (Hong Kong, Insurance) | 2.3 |
| Keyence Corp. (Japan, Electronic Equipment & Components) | 2.2 |
| Commonwealth Bank of Australia (Australia, Banks) | 2.1 |
| Hoya Corp. (Japan, Health Care Equipment & Supplies) | 2.0 |
| Reliance Industries Ltd. (India, Oil, Gas & Consumable Fuels) | 1.8 |
| CSL Ltd. (Australia, Biotechnology) | 1.8 |
| | 26.5 |
Top Market Sectors as of October 31, 2019
| | % of fund's net assets |
| Financials | 16.6 |
| Information Technology | 16.2 |
| Industrials | 14.3 |
| Health Care | 13.7 |
| Consumer Discretionary | 12.7 |
| Communication Services | 9.5 |
| Consumer Staples | 8.1 |
| Energy | 3.1 |
| Real Estate | 3.1 |
| Utilities | 1.1 |
Fidelity® Pacific Basin Fund
Schedule of Investments October 31, 2019
Showing Percentage of Net Assets
| Common Stocks - 98.2% | | | |
| | | Shares | Value |
| Australia - 11.8% | | | |
| Aristocrat Leisure Ltd. | | 384,311 | $8,379,917 |
| Blue Sky Alternative Investments Ltd. (a)(b) | | 1,733,447 | 12 |
| BWX Ltd. (c) | | 1,998,080 | 5,397,455 |
| Commonwealth Bank of Australia | | 345,808 | 18,749,748 |
| CSL Ltd. | | 91,907 | 16,208,380 |
| Hansen Technologies Ltd. | | 2,942,633 | 6,885,837 |
| HUB24 Ltd. (c) | | 1,034,212 | 8,779,279 |
| Macquarie Group Ltd. | | 134,320 | 12,402,764 |
| Magellan Financial Group Ltd. | | 140,866 | 4,672,236 |
| National Storage (REIT) unit | | 1,754,473 | 2,251,301 |
| Netwealth Group Ltd. (c) | | 857,077 | 5,198,709 |
| NIB Holdings Ltd. | | 1,133,545 | 5,479,611 |
| Pro Medicus Ltd. (c) | | 70,223 | 1,288,658 |
| realestate.com.au Ltd. | | 122,365 | 9,183,419 |
|
| TOTAL AUSTRALIA | | | 104,877,326 |
|
| Bailiwick of Jersey - 0.8% | | | |
| Amcor PLC unit | | 716,758 | 6,863,234 |
| Cayman Islands - 11.6% | | | |
| 51job, Inc. sponsored ADR (a) | | 88,100 | 6,939,637 |
| Alibaba Group Holding Ltd. sponsored ADR (a) | | 183,900 | 32,489,613 |
| China High Precision Automation Group Ltd. (a)(b) | | 1,875,000 | 2 |
| China Metal Recycling (Holdings) Ltd. (a)(b) | | 2,572,200 | 3 |
| Hansoh Pharmaceutical Group Co. Ltd. (d) | | 2,358,000 | 7,163,743 |
| Hypebeast Ltd. | | 20,020,000 | 3,432,613 |
| International Housewares Retail Co. Ltd. | | 19,363,700 | 4,516,750 |
| Shenzhou International Group Holdings Ltd. | | 547,500 | 7,565,713 |
| SITC International Holdings Co. Ltd. | | 3,415,000 | 3,760,252 |
| Tencent Holdings Ltd. | | 914,800 | 37,106,957 |
|
| TOTAL CAYMAN ISLANDS | | | 102,975,283 |
|
| China - 10.2% | | | |
| AVIC Jonhon OptronicTechnology Co. Ltd. | | 1,413,610 | 8,093,235 |
| Centre Testing International Group Co. Ltd. (A Shares) | | 2,386,109 | 4,742,397 |
| Chongqing Fuling Zhacai Group Co. Ltd. Group (A Shares) | | 1,336,800 | 4,409,067 |
| Foshan Haitian Flavouring & Food Co. Ltd. (A Shares) | | 568,010 | 9,008,418 |
| Gree Electric Appliances, Inc. of Zhuhai (A Shares) | | 703,694 | 5,867,004 |
| Hangzhou Tigermed Consulting Co. Ltd. (A Shares) | | 711,900 | 6,902,845 |
| Kweichow Moutai Co. Ltd. (A Shares) | | 124,650 | 20,862,621 |
| Midea Group Co. Ltd. (A Shares) | | 773,400 | 6,091,164 |
| Qingdao Port International Co. Ltd. (H Shares) (d) | | 7,112,000 | 4,078,604 |
| Shanghai International Airport Co. Ltd. (A Shares) | | 361,613 | 3,914,100 |
| Shenzhen Expressway Co. Ltd. (H Shares) | | 6,894,000 | 9,227,611 |
| Yunnan Baiyao Group Co. Ltd. (A Shares) | | 622,433 | 7,648,920 |
|
| TOTAL CHINA | | | 90,845,986 |
|
| Hong Kong - 5.3% | | | |
| AIA Group Ltd. | | 2,028,800 | 20,203,247 |
| CNOOC Ltd. | | 4,214,000 | 6,271,488 |
| CSPC Pharmaceutical Group Ltd. | | 2,566,000 | 6,571,836 |
| Dah Sing Banking Group Ltd. | | 681,600 | 881,170 |
| Hong Kong Exchanges and Clearing Ltd. | | 262,427 | 8,175,661 |
| Sino Land Ltd. | | 3,392,000 | 5,070,590 |
|
| TOTAL HONG KONG | | | 47,173,992 |
|
| India - 8.1% | | | |
| Axis Bank Ltd. | | 464,198 | 4,806,154 |
| CCL Products (India) Ltd. | | 1,250,367 | 3,631,878 |
| HDFC Asset Management Co. Ltd. (d) | | 155,363 | 6,544,166 |
| HDFC Bank Ltd. | | 515,532 | 8,925,809 |
| Housing Development Finance Corp. Ltd. | | 306,384 | 9,188,579 |
| Indraprastha Gas Ltd. | | 927,400 | 5,110,356 |
| Oberoi Realty Ltd. | | 352,703 | 2,515,769 |
| Petronet LNG Ltd. | | 1,275,200 | 5,141,959 |
| Power Grid Corp. of India Ltd. | | 1,496,460 | 4,181,691 |
| Reliance Industries Ltd. | | 788,675 | 16,243,884 |
| TCNS Clothing Co. Ltd. (a)(d) | | 595,290 | 6,318,764 |
|
| TOTAL INDIA | | | 72,609,009 |
|
| Indonesia - 2.2% | | | |
| PT Bank Central Asia Tbk | | 5,372,500 | 12,025,415 |
| PT Bank Rakyat Indonesia Tbk | | 25,248,900 | 7,565,461 |
|
| TOTAL INDONESIA | | | 19,590,876 |
|
| Japan - 32.7% | | | |
| Azbil Corp. | | 248,800 | 6,923,406 |
| Bank of Kyoto Ltd. | | 88,500 | 3,502,878 |
| Create SD Holdings Co. Ltd. | | 211,800 | 5,247,619 |
| Daikin Industries Ltd. | | 73,200 | 10,245,046 |
| Hoshizaki Corp. | | 91,400 | 7,769,213 |
| Hoya Corp. | | 204,100 | 18,037,793 |
| Iriso Electronics Co. Ltd. | | 135,100 | 6,679,672 |
| Kao Corp. | | 142,100 | 11,424,653 |
| Keyence Corp. | | 30,400 | 19,221,811 |
| Kyowa Hakko Kirin Co., Ltd. | | 298,500 | 5,492,406 |
| Lasertec Corp. | | 116,100 | 8,345,969 |
| Minebea Mitsumi, Inc. | | 428,500 | 8,137,879 |
| Misumi Group, Inc. | | 271,800 | 6,832,716 |
| MonotaRO Co. Ltd. (c) | | 250,800 | 7,576,823 |
| Nakanishi, Inc. | | 242,800 | 4,048,015 |
| Nidec Corp. | | 50,000 | 7,361,289 |
| Nihon M&A Center, Inc. | | 238,600 | 7,254,657 |
| Nintendo Co. Ltd. | | 30,500 | 11,187,019 |
| Nitori Holdings Co. Ltd. | | 54,700 | 8,325,949 |
| NSD Co. Ltd. | | 277,700 | 8,559,997 |
| Open House Co. Ltd. | | 315,800 | 8,070,128 |
| ORIX Corp. | | 337,400 | 5,302,205 |
| PALTAC Corp. | | 86,600 | 4,176,329 |
| Pilot Corp. | | 145,500 | 5,901,139 |
| Recruit Holdings Co. Ltd. | | 276,700 | 9,195,860 |
| Shionogi & Co. Ltd. | | 172,600 | 10,359,952 |
| SMC Corp. | | 23,000 | 9,936,948 |
| SMS Co., Ltd. | | 323,200 | 7,923,812 |
| SoftBank Corp. | | 367,700 | 14,144,101 |
| Subaru Corp. | | 306,000 | 8,769,199 |
| Terumo Corp. | | 384,600 | 12,552,085 |
| Tsuruha Holdings, Inc. | | 75,400 | 8,481,637 |
| Zozo, Inc. (c) | | 611,200 | 14,236,650 |
|
| TOTAL JAPAN | | | 291,224,855 |
|
| Korea (South) - 3.1% | | | |
| KB Financial Group, Inc. | | 160,640 | 5,749,148 |
| Samsung Electronics Co. Ltd. | | 221,980 | 9,559,846 |
| SK Hynix, Inc. | | 170,628 | 11,955,580 |
|
| TOTAL KOREA (SOUTH) | | | 27,264,574 |
|
| Multi-National - 1.0% | | | |
| HKT Trust/HKT Ltd. unit | | 5,722,000 | 8,901,487 |
| Netherlands - 0.8% | | | |
| ASML Holding NV (Netherlands) | | 28,700 | 7,522,689 |
| New Zealand - 1.6% | | | |
| EBOS Group Ltd. | | 428,279 | 6,764,419 |
| Ryman Healthcare Group Ltd. | | 955,340 | 7,895,839 |
|
| TOTAL NEW ZEALAND | | | 14,660,258 |
|
| Philippines - 1.0% | | | |
| Ayala Land, Inc. | | 9,453,000 | 9,027,326 |
| Taiwan - 5.6% | | | |
| Micro-Star International Co. Ltd. | | 1,674,000 | 4,939,996 |
| Taiwan Semiconductor Manufacturing Co. Ltd. | | 3,831,000 | 37,472,264 |
| Voltronic Power Technology Corp. | | 350,388 | 7,754,997 |
|
| TOTAL TAIWAN | | | 50,167,257 |
|
| Thailand - 1.2% | | | |
| Home Product Center PCL (For. Reg.) | | 10,933,100 | 6,227,462 |
| Thai Beverage PCL | | 7,190,200 | 4,827,422 |
|
| TOTAL THAILAND | | | 11,054,884 |
|
| United States of America - 1.2% | | | |
| GI Dynamics, Inc. CDI (a) | | 5,561,290 | 149,513 |
| ResMed, Inc. CDI | | 699,662 | 10,280,324 |
|
| TOTAL UNITED STATES OF AMERICA | | | 10,429,837 |
|
| TOTAL COMMON STOCKS | | | |
| (Cost $652,271,738) | | | 875,188,873 |
|
| Nonconvertible Preferred Stocks - 1.0% | | | |
| Korea (South) - 1.0% | | | |
| Samsung Electronics Co. Ltd. | | | |
| (Cost $8,424,134) | | 244,100 | 8,562,241 |
|
| Money Market Funds - 3.3% | | | |
| Fidelity Cash Central Fund 1.83% (e) | | 5,874,802 | 5,875,977 |
| Fidelity Securities Lending Cash Central Fund 1.84% (e)(f) | | 23,794,301 | 23,796,681 |
| TOTAL MONEY MARKET FUNDS | | | |
| (Cost $29,672,658) | | | 29,672,658 |
| TOTAL INVESTMENT IN SECURITIES - 102.5% | | | |
| (Cost $690,368,530) | | | 913,423,772 |
| NET OTHER ASSETS (LIABILITIES) - (2.5)% | | | (22,269,678) |
| NET ASSETS - 100% | | | $891,154,094 |
Categorizations in the Schedule of Investments are based on country or territory of incorporation.
Legend
(a) Non-income producing
(b) Level 3 security
(c) Security or a portion of the security is on loan at period end.
(d) Security exempt from registration under Rule 144A of the Securities Act of 1933. These securities may be resold in transactions exempt from registration, normally to qualified institutional buyers. At the end of the period, the value of these securities amounted to $24,105,277 or 2.7% of net assets.
(e) Affiliated fund that is generally available only to investment companies and other accounts managed by Fidelity Investments. The rate quoted is the annualized seven-day yield of the fund at period end. A complete unaudited listing of the fund's holdings as of its most recent quarter end is available upon request. In addition, each Fidelity Central Fund's financial statements, which are not covered by the Fund's Report of Independent Registered Public Accounting Firm, are available on the SEC's website or upon request.
(f) Investment made with cash collateral received from securities on loan.
Affiliated Central Funds
Information regarding fiscal year to date income earned by the Fund from investments in Fidelity Central Funds is as follows:
| Fund | Income earned |
| Fidelity Cash Central Fund | $405,499 |
| Fidelity Securities Lending Cash Central Fund | 415,220 |
| Total | $820,719 |
Amounts in the income column in the above table include any capital gain distributions from underlying funds, which are presented in the corresponding line-item in the Statement of Operations, if applicable. Amount for Fidelity Securities Lending Cash Central Fund represents the income earned on investing cash collateral, less rebates paid to borrowers and any lending agent fees associated with the loan, plus any premium payments received for lending certain types of securities.
Investment Valuation
The following is a summary of the inputs used, as of October 31, 2019, involving the Fund's assets and liabilities carried at fair value. The inputs or methodology used for valuing securities may not be an indication of the risk associated with investing in those securities. For more information on valuation inputs, and their aggregation into the levels used below, please refer to the Investment Valuation section in the accompanying Notes to Financial Statements.
| | Valuation Inputs at Reporting Date: |
| Description | Total | Level 1 | Level 2 | Level 3 |
| Investments in Securities: | | | | |
| Equities: | | | | |
| Communication Services | $83,955,596 | $-- | $83,955,596 | $-- |
| Consumer Discretionary | 112,964,514 | 32,489,613 | 80,474,901 | -- |
| Consumer Staples | 73,290,770 | -- | 73,290,770 | -- |
| Energy | 27,657,331 | -- | 27,657,331 | -- |
| Financials | 148,152,252 | -- | 148,152,240 | 12 |
| Health Care | 121,364,728 | -- | 121,364,728 | -- |
| Industrials | 128,552,980 | 14,694,634 | 113,858,346 | -- |
| Information Technology | 144,722,545 | 35,017,663 | 109,704,880 | 2 |
| Materials | 6,863,237 | -- | 6,863,234 | 3 |
| Real Estate | 26,935,114 | -- | 26,935,114 | -- |
| Utilities | 9,292,047 | -- | 9,292,047 | -- |
| Money Market Funds | 29,672,658 | 29,672,658 | -- | -- |
| Total Investments in Securities: | $913,423,772 | $111,874,568 | $801,549,187 | $17 |
See accompanying notes which are an integral part of the financial statements.
Fidelity® Pacific Basin Fund
Financial Statements
Statement of Assets and Liabilities
| | | October 31, 2019 |
| Assets | | |
Investment in securities, at value (including securities loaned of $22,608,454) — See accompanying schedule:
Unaffiliated issuers (cost $660,695,872) | $883,751,114 | |
| Fidelity Central Funds (cost $29,672,658) | 29,672,658 | |
| Total Investment in Securities (cost $690,368,530) | | $913,423,772 |
| Receivable for investments sold | | 3,228,714 |
| Receivable for fund shares sold | | 310,122 |
| Dividends receivable | | 1,604,315 |
| Distributions receivable from Fidelity Central Funds | | 82,432 |
| Prepaid expenses | | 1,550 |
| Other receivables | | 45,243 |
| Total assets | | 918,696,148 |
| Liabilities | | |
| Payable for investments purchased | $1,594,343 | |
| Payable for fund shares redeemed | 373,379 | |
| Accrued management fee | 610,087 | |
| Other affiliated payables | 151,398 | |
| Other payables and accrued expenses | 1,017,603 | |
| Collateral on securities loaned | 23,795,244 | |
| Total liabilities | | 27,542,054 |
| Net Assets | | $891,154,094 |
| Net Assets consist of: | | |
| Paid in capital | | $670,070,690 |
| Total accumulated earnings (loss) | | 221,083,404 |
| Net Assets, for 27,293,538 shares outstanding | | $891,154,094 |
| Net Asset Value, offering price and redemption price per share ($891,154,094 ÷ 27,293,538 shares) | | $32.65 |
See accompanying notes which are an integral part of the financial statements.
Statement of Operations
| | | Year ended October 31, 2019 |
| Investment Income | | |
| Dividends | | $16,029,246 |
| Income from Fidelity Central Funds (including $415,220 from security lending) | | 820,719 |
| Income before foreign taxes withheld | | 16,849,965 |
| Less foreign taxes withheld | | (1,274,482) |
| Total income | | 15,575,483 |
| Expenses | | |
| Management fee | | |
| Basic fee | $5,779,120 | |
| Performance adjustment | 326,109 | |
| Transfer agent fees | 1,391,824 | |
| Accounting and security lending fees | 401,558 | |
| Custodian fees and expenses | 163,009 | |
| Independent trustees' fees and expenses | 4,734 | |
| Registration fees | 30,379 | |
| Audit | 94,946 | |
| Legal | 3,007 | |
| Miscellaneous | 5,997 | |
| Total expenses before reductions | 8,200,683 | |
| Expense reductions | (61,211) | |
| Total expenses after reductions | | 8,139,472 |
| Net investment income (loss) | | 7,436,011 |
| Realized and Unrealized Gain (Loss) | | |
| Net realized gain (loss) on: | | |
| Investment securities: | | |
| Unaffiliated issuers | (1,298,985) | |
| Fidelity Central Funds | (39) | |
| Foreign currency transactions | (73,749) | |
| Total net realized gain (loss) | | (1,372,773) |
| Change in net unrealized appreciation (depreciation) on: | | |
| Investment securities: | | |
| Unaffiliated issuers (net of increase in deferred foreign taxes of $879,462) | 161,477,396 | |
| Assets and liabilities in foreign currencies | 13,995 | |
| Total change in net unrealized appreciation (depreciation) | | 161,491,391 |
| Net gain (loss) | | 160,118,618 |
| Net increase (decrease) in net assets resulting from operations | | $167,554,629 |
See accompanying notes which are an integral part of the financial statements.
Statement of Changes in Net Assets
| | Year ended October 31, 2019 | Year ended October 31, 2018 |
| Increase (Decrease) in Net Assets | | |
| Operations | | |
| Net investment income (loss) | $7,436,011 | $6,163,967 |
| Net realized gain (loss) | (1,372,773) | 80,755,805 |
| Change in net unrealized appreciation (depreciation) | 161,491,391 | (211,680,575) |
| Net increase (decrease) in net assets resulting from operations | 167,554,629 | (124,760,803) |
| Distributions to shareholders | (77,993,885) | (42,947,398) |
| Share transactions | | |
| Proceeds from sales of shares | 84,737,459 | 182,924,589 |
| Reinvestment of distributions | 60,437,260 | 41,121,006 |
| Cost of shares redeemed | (151,213,172) | (223,982,513) |
| Net increase (decrease) in net assets resulting from share transactions | (6,038,453) | 63,082 |
| Redemption fees | – | 17,913 |
| Total increase (decrease) in net assets | 83,522,291 | (167,627,206) |
| Net Assets | | |
| Beginning of period | 807,631,803 | 975,259,009 |
| End of period | $891,154,094 | $807,631,803 |
| Other Information | | |
| Shares | | |
| Sold | 2,829,464 | 5,193,865 |
| Issued in reinvestment of distributions | 2,238,417 | 1,184,702 |
| Redeemed | (5,146,136) | (6,457,678) |
| Net increase (decrease) | (78,255) | (79,111) |
See accompanying notes which are an integral part of the financial statements.
Financial Highlights
Fidelity Pacific Basin Fund
| | | | | | |
| Years ended October 31, | 2019 | 2018 | 2017 | 2016 | 2015 |
| Selected Per–Share Data | | | | | |
| Net asset value, beginning of period | $29.51 | $35.53 | $28.82 | $27.01 | $28.92 |
| Income from Investment Operations | | | | | |
| Net investment income (loss)A | .26 | .22 | .25 | .24 | .37B |
| Net realized and unrealized gain (loss) | 5.74 | (4.69) | 7.09 | 2.88 | (.49) |
| Total from investment operations | 6.00 | (4.47) | 7.34 | 3.12 | (.12) |
| Distributions from net investment income | (.20) | (.23) | (.17) | (.36) | (.18) |
| Distributions from net realized gain | (2.67) | (1.32) | (.46) | (.95) | (1.61) |
| Total distributions | (2.86)C | (1.55) | (.63) | (1.31) | (1.79) |
| Redemption fees added to paid in capitalA | – | –D | –D | –D | –D |
| Net asset value, end of period | $32.65 | $29.51 | $35.53 | $28.82 | $27.01 |
| Total ReturnE | 22.37% | (13.24)% | 26.22% | 12.05% | (.29)% |
| Ratios to Average Net AssetsF,G | | | | | |
| Expenses before reductions | .97% | 1.07% | 1.11% | 1.19% | 1.17% |
| Expenses net of fee waivers, if any | .97% | 1.07% | 1.11% | 1.19% | 1.17% |
| Expenses net of all reductions | .97% | 1.06% | 1.10% | 1.19% | 1.17% |
| Net investment income (loss) | .88% | .62% | .84% | .87% | 1.34%B |
| Supplemental Data | | | | | |
| Net assets, end of period (000 omitted) | $891,154 | $807,632 | $975,259 | $688,318 | $654,032 |
| Portfolio turnover rateH | 32% | 37% | 36% | 30% | 36% |
A Calculated based on average shares outstanding during the period.
B Net investment income per share reflects a large, non-recurring dividend which amounted to $.10 per share. Excluding this non-recurring dividend, the ratio of net investment income (loss) to average net assets would have been .99%.
C Total distributions of $2.86 per share is comprised of distributions from net investment income of $.195 and distributions from net realized gain of $2.668 per share.
D Amount represents less than $.005 per share.
E Total returns would have been lower if certain expenses had not been reduced during the applicable periods shown.
F Fees and expenses of any underlying Fidelity Central Funds are not included in the Fund's expense ratio. The Fund indirectly bears its proportionate share of the expenses of any underlying Fidelity Central Funds.
G Expense ratios reflect operating expenses of the Fund. Expenses before reductions do not reflect amounts reimbursed by the investment adviser or reductions from brokerage service arrangements or reductions from other expense offset arrangements and do not represent the amount paid by the Fund during periods when reimbursements or reductions occur. Expenses net of fee waivers reflect expenses after reimbursement by the investment adviser but prior to reductions from brokerage service arrangements or other expense offset arrangements. Expenses net of all reductions represent the net expenses paid by the Fund.
H Amount does not include the portfolio activity of any underlying Fidelity Central Funds.
See accompanying notes which are an integral part of the financial statements.
Notes to Financial Statements
For the period ended October 31, 2019
1. Organization.
Fidelity Pacific Basin Fund (the Fund) is a fund of Fidelity Investment Trust (the Trust) and is authorized to issue an unlimited number of shares. Share transactions on the Statement of Changes in Net Assets may contain exchanges between affiliated funds. The Trust is registered under the Investment Company Act of 1940, as amended (the 1940 Act), as an open-end management investment company organized as a Massachusetts business trust. The Fund's investments in emerging markets can be subject to social, economic, regulatory, and political uncertainties and can be extremely volatile.
2. Investments in Fidelity Central Funds.
The Fund invests in Fidelity Central Funds, which are open-end investment companies generally available only to other investment companies and accounts managed by the investment adviser and its affiliates. The Fund's Schedule of Investments lists each of the Fidelity Central Funds held as of period end, if any, as an investment of the Fund, but does not include the underlying holdings of each Fidelity Central Fund. As an Investing Fund, the Fund indirectly bears its proportionate share of the expenses of the underlying Fidelity Central Funds.
The Money Market Central Funds seek preservation of capital and current income and are managed by Fidelity Investments Money Management, Inc. (FIMM), an affiliate of the investment adviser. Annualized expenses of the Money Market Central Funds as of their most recent shareholder report date ranged from less than .005% to .01%.
A complete unaudited list of holdings for each Fidelity Central Fund is available upon request or at the Securities and Exchange Commission (the SEC) website at www.sec.gov. In addition, the financial statements of the Fidelity Central Funds, which are not covered by the Fund's Report of Independent Registered Public Accounting Firm, are available on the SEC website or upon request.
3. Significant Accounting Policies.
The Fund is an investment company and applies the accounting and reporting guidance of the Financial Accounting Standards Board (FASB) Accounting Standards Codification Topic 946 Financial Services – Investments Companies. The financial statements have been prepared in conformity with accounting principles generally accepted in the United States of America (GAAP), which require management to make certain estimates and assumptions at the date of the financial statements. Actual results could differ from those estimates. Subsequent events, if any, through the date that the financial statements were issued have been evaluated in the preparation of the financial statements. The following summarizes the significant accounting policies of the Fund:
Investment Valuation. Investments are valued as of 4:00 p.m. Eastern time on the last calendar day of the period. The Board of Trustees (the Board) has delegated the day to day responsibility for the valuation of the Fund's investments to the Fair Value Committee (the Committee) established by the Fund's investment adviser. In accordance with valuation policies and procedures approved by the Board, the Fund attempts to obtain prices from one or more third party pricing vendors or brokers to value its investments. When current market prices, quotations or currency exchange rates are not readily available or reliable, investments will be fair valued in good faith by the Committee, in accordance with procedures adopted by the Board. Factors used in determining fair value vary by investment type and may include market or investment specific events. The frequency with which these procedures are used cannot be predicted and they may be utilized to a significant extent. The Committee oversees the Fund's valuation policies and procedures and reports to the Board on the Committee's activities and fair value determinations. The Board monitors the appropriateness of the procedures used in valuing the Fund's investments and ratifies the fair value determinations of the Committee.
The Fund categorizes the inputs to valuation techniques used to value its investments into a disclosure hierarchy consisting of three levels as shown below:
- Level 1 – quoted prices in active markets for identical investments
- Level 2 – other significant observable inputs (including quoted prices for similar investments, interest rates, prepayment speeds, etc.)
- Level 3 – unobservable inputs (including the Fund's own assumptions based on the best information available)
Valuation techniques used to value the Fund's investments by major category are as follows:
Equity securities, including restricted securities, for which market quotations are readily available, are valued at the last reported sale price or official closing price as reported by a third party pricing vendor on the primary market or exchange on which they are traded and are categorized as Level 1 in the hierarchy. In the event there were no sales during the day or closing prices are not available, securities are valued at the last quoted bid price or may be valued using the last available price and are generally categorized as Level 2 in the hierarchy. For foreign equity securities, when market or security specific events arise, comparisons to the valuation of American Depositary Receipts (ADRs), futures contracts, Exchange-Traded Funds (ETFs) and certain indexes as well as quoted prices for similar securities may be used and would be categorized as Level 2 in the hierarchy. For equity securities, including restricted securities, where observable inputs are limited, assumptions about market activity and risk are used and these securities may be categorized as Level 3 in the hierarchy.
Investments in open-end mutual funds, including the Fidelity Central Funds, are valued at their closing net asset value (NAV) each business day and are categorized as Level 1 in the hierarchy.
Changes in valuation techniques may result in transfers in or out of an assigned level within the disclosure hierarchy. The aggregate value of investments by input level as of October 31, 2019 is included at the end of the Fund's Schedule of Investments.
Foreign Currency. The Fund may use foreign currency contracts to facilitate transactions in foreign-denominated securities. Gains and losses from these transactions may arise from changes in the value of the foreign currency or if the counterparties do not perform under the contracts' terms.
Foreign-denominated assets, including investment securities, and liabilities are translated into U.S. dollars at the exchange rates at period end. Purchases and sales of investment securities, income and dividends received and expenses denominated in foreign currencies are translated into U.S. dollars at the exchange rate in effect on the transaction date.
The effects of exchange rate fluctuations on investments are included with the net realized and unrealized gain (loss) on investment securities. Other foreign currency transactions resulting in realized and unrealized gain (loss) are disclosed separately.
Investment Transactions and Income. For financial reporting purposes, the Fund's investment holdings and NAV include trades executed through the end of the last business day of the period. The NAV per share for processing shareholder transactions is calculated as of the close of business of the New York Stock Exchange (NYSE), normally 4:00 p.m. Eastern time and includes trades executed through the end of the prior business day. Gains and losses on securities sold are determined on the basis of identified cost. Dividend income is recorded on the ex-dividend date, except for certain dividends from foreign securities where the ex-dividend date may have passed, which are recorded as soon as the Fund is informed of the ex-dividend date. Non-cash dividends included in dividend income, if any, are recorded at the fair market value of the securities received. Income and capital gain distributions from Fidelity Central Funds, if any, are recorded on the ex-dividend date. Investment income is recorded net of foreign taxes withheld where recovery of such taxes is uncertain.
Expenses. Expenses directly attributable to a fund are charged to that fund. Expenses attributable to more than one fund are allocated among the respective funds on the basis of relative net assets or other appropriate methods. Expense estimates are accrued in the period to which they relate and adjustments are made when actual amounts are known.
Income Tax Information and Distributions to Shareholders. Each year, the Fund intends to qualify as a regulated investment company under Subchapter M of the Internal Revenue Code, including distributing substantially all of its taxable income and realized gains. As a result, no provision for U.S. Federal income taxes is required. As of October 31, 2019, the Fund did not have any unrecognized tax benefits in the financial statements; nor is the Fund aware of any tax positions for which it is reasonably possible that the total amounts of unrecognized tax benefits will significantly change in the next twelve months. The Fund files a U.S. federal tax return, in addition to state and local tax returns as required. The Fund's federal income tax returns are subject to examination by the Internal Revenue Service (IRS) for a period of three fiscal years after they are filed. State and local tax returns may be subject to examination for an additional fiscal year depending on the jurisdiction. Foreign taxes are provided for based on the Fund's understanding of the tax rules and rates that exist in the foreign markets in which it invests. The Fund is subject to a tax imposed on capital gains by certain countries in which it invests. An estimated deferred tax liability for net unrealized appreciation on the applicable securities is included in Other payables and accrued expenses on the Statement of Assets & Liabilities.
Distributions are declared and recorded on the ex-dividend date. Income and capital gain distributions are determined in accordance with income tax regulations, which may differ from GAAP. In addition, the Fund claimed a portion of the payment made to redeeming shareholders as a distribution for income tax purposes.
Capital accounts within the financial statements are adjusted for permanent book-tax differences. These adjustments have no impact on net assets or the results of operations. Capital accounts are not adjusted for temporary book-tax differences which will reverse in a subsequent period.
Book-tax differences are primarily due to foreign currency transactions, passive foreign investment companies (PFIC), capital loss carryforwards and losses deferred due to wash sales.
As of period end, the cost and unrealized appreciation (depreciation) in securities, and derivatives if applicable, for federal income tax purposes were as follows:
| Gross unrealized appreciation | $266,063,125 |
| Gross unrealized depreciation | (48,580,025) |
| Net unrealized appreciation (depreciation) | $217,483,100 |
| Tax Cost | $695,940,672 |
The tax-based components of distributable earnings as of period end were as follows:
| Undistributed ordinary income | $6,499,690 |
| Capital loss carryforward | $(2,002,422) |
| Net unrealized appreciation (depreciation) on securities and other investments | $217,465,597 |
Capital loss carryforwards are only available to offset future capital gains of the Fund to the extent provided by regulations and may be limited. Under the Regulated Investment Company Modernization Act of 2010 (the Act), the Fund is permitted to carry forward capital losses incurred in taxable years beginning after December 22, 2010 for an unlimited period and such capital losses are required to be used prior to any losses that expire. The capital loss carryforward information presented below, including any applicable limitation, is estimated as of fiscal period end and is subject to adjustment.
| No expiration | |
| Short-term | $(2,002,422) |
The tax character of distributions paid was as follows:
| | October 31, 2019 | October 31, 2018 |
| Ordinary Income | $5,312,193 | $ 10,743,790 |
| Long-term Capital Gains | 72,681,692 | 32,203,608 |
| Total | $77,993,885 | $ 42,947,398 |
Restricted Securities. The Fund may invest in securities that are subject to legal or contractual restrictions on resale. These securities generally may be resold in transactions exempt from registration or to the public if the securities are registered. Disposal of these securities may involve time-consuming negotiations and expense, and prompt sale at an acceptable price may be difficult. Information regarding restricted securities is included at the end of the Fund's Schedule of Investments.
4. Purchases and Sales of Investments.
Purchases and sales of securities, other than short-term securities, aggregated $266,386,992 and $292,566,340, respectively.
5. Fees and Other Transactions with Affiliates.
Management Fee. Fidelity Management & Research Company (the investment adviser) and its affiliates provide the Fund with investment management related services for which the Fund pays a monthly management fee. The management fee is the sum of an individual fund fee rate that is based on an annual rate of .45% of the Fund's average net assets and an annualized group fee rate that averaged .24% during the period. The group fee rate is based upon the average net assets of all the mutual funds advised by the investment adviser, including any mutual funds previously advised by the investment adviser that are currently advised by Fidelity SelectCo, LLC, an affiliate of the investment adviser. The group fee rate decreases as assets under management increase and increases as assets under management decrease. In addition, the management fee is subject to a performance adjustment (up to a maximum of +/- .20% of the Fund's average net assets over a 36 month performance period). The upward or downward adjustment to the management fee is based on the Fund's relative investment performance as compared to its benchmark index, the MSCI All Country Pacific Index, over the same 36 month performance period. For the reporting period, the total annual management fee rate, including the performance adjustment, was .73% of the Fund's average net assets. The performance adjustment included in the management fee rate may be higher or lower than the maximum performance adjustment rate due to the difference between the average net assets for the reporting and performance periods.
Transfer Agent Fees. Fidelity Investments Institutional Operations Company, Inc. (FIIOC), an affiliate of the investment adviser, is the Fund's transfer, dividend disbursing and shareholder servicing agent. FIIOC receives account fees and asset-based fees that vary according to account size and type of account. FIIOC pays for typesetting, printing and mailing of shareholder reports, except proxy statements. For the period, the transfer agent fees were equivalent to an annual rate of .17% of average net assets.
Accounting and Security Lending Fees. Fidelity Service Company, Inc. (FSC), an affiliate of the investment adviser, maintains the Fund's accounting records. The accounting fee is based on the level of average net assets for each month. Prior to April 1, 2019, FSC had a separate agreement with the Fund for administration of the security lending program, based on the number and duration of lending transactions. For the period, the total fees paid for accounting and administration of securities lending were equivalent to an annual rate of .05%.
Brokerage Commissions. The Fund placed a portion of its portfolio transactions with brokerage firms which are affiliates of the investment adviser. Brokerage commissions are included in net realized gain (loss) and change in net unrealized appreciation (depreciation) in the Statement of Operations. The commissions paid to these affiliated firms were $454 for the period.
Interfund Trades. The Fund may purchase from or sell securities to other Fidelity Funds under procedures adopted by the Board. The procedures have been designed to ensure these interfund trades are executed in accordance with Rule 17a-7 of the 1940 Act. Interfund trades are included within the respective purchases and sales amounts shown in the Purchases and Sales of Investments note.
6. Committed Line of Credit.
The Fund participates with other funds managed by the investment adviser or an affiliate in a $4.25 billion credit facility (the "line of credit") to be utilized for temporary or emergency purposes to fund shareholder redemptions or for other short-term liquidity purposes. The Fund has agreed to pay commitment fees on its pro-rata portion of the line of credit, which amounted to $2,219 and is reflected in Miscellaneous expenses on the Statement of Operations. During the period, the Fund did not borrow on this line of credit.
7. Security Lending.
The Fund lends portfolio securities from time to time in order to earn additional income. For equity securities, lending agents are used, including National Financial Services (NFS), an affiliate of the Fund. Pursuant to a securities lending agreement, NFS will receive a fee, which is capped at 9.9% of daily lending revenue, for its services as lending agent. The Fund may lend securities to certain qualified borrowers, including NFS. On the settlement date of the loan, the Fund receives collateral (in the form of U.S. Treasury obligations, letters of credit and/or cash) against the loaned securities and maintains collateral in an amount not less than 100% of the market value of the loaned securities during the period of the loan. The market value of the loaned securities is determined at the close of business of the Fund and any additional required collateral is delivered to the Fund on the next business day. The Fund or borrower may terminate the loan at any time, and if the borrower defaults on its obligation to return the securities loaned because of insolvency or other reasons, the Fund may apply collateral received from the borrower against the obligation. The Fund may experience delays and costs in recovering the securities loaned. Any cash collateral received is invested in the Fidelity Securities Lending Cash Central Fund. The value of loaned securities and cash collateral at period end are disclosed on the Fund's Statement of Assets and Liabilities. Security lending income represents the income earned on investing cash collateral, less rebates paid to borrowers and any lending agent fees associated with the loan, plus any premium payments received for lending certain types of securities. Security lending income is presented in the Statement of Operations as a component of income from Fidelity Central Funds. During the period, there were no securities loaned to NFS.
8. Expense Reductions.
Commissions paid to certain brokers with whom the investment adviser, or its affiliates, places trades on behalf of the Fund include an amount in addition to trade execution, which may be rebated back to the Fund to offset certain expenses. This amount totaled $54,127 for the period. In addition, through arrangements with the Fund's custodian, credits realized as a result of certain uninvested cash balances were used to reduce the Fund's expenses by $761.
In addition, during the period the investment adviser reimbursed and/or waived a portion of operating expenses in the amount of $6,323.
9. Other.
The Fund's organizational documents provide former and current trustees and officers with a limited indemnification against liabilities arising in connection with the performance of their duties to the Fund. In the normal course of business, the Fund may also enter into contracts that provide general indemnifications. The Fund's maximum exposure under these arrangements is unknown as this would be dependent on future claims that may be made against the Fund. The risk of material loss from such claims is considered remote.
At the end of the period, Strategic Advisers Fidelity International Fund was the owner of record of approximately 18% of the total outstanding shares of the Fund. Mutual funds managed by the investment adviser or its affiliates were the owners of record, in the aggregate, of approximately 24% of the total outstanding shares of the Fund.
Report of Independent Registered Public Accounting Firm
To the Board of Trustees of Fidelity Investment Trust and Shareholders of Fidelity Canada Fund, Fidelity China Region Fund, Fidelity Emerging Asia Fund, Fidelity Emerging Markets Fund, Fidelity Europe Fund, Fidelity Japan Fund, Fidelity Japan Smaller Companies Fund, Fidelity Latin America Fund, Fidelity Nordic Fund and Fidelity Pacific Basin Fund:
Opinions on the Financial Statements
We have audited the accompanying statements of assets and liabilities, including the schedules of investments, of Fidelity Canada Fund, Fidelity China Region Fund, Fidelity Emerging Asia Fund, Fidelity Emerging Markets Fund, Fidelity Europe Fund, Fidelity Japan Fund, Fidelity Japan Smaller Companies Fund, Fidelity Latin America Fund, Fidelity Nordic Fund and Fidelity Pacific Basin Fund (ten of the funds constituting Fidelity Investment Trust, hereafter collectively referred to as the “Funds”) as of October 31, 2019, the related statements of operations for the year ended October 31, 2019, the statements of changes in net assets for each of the two years in the period ended October 31, 2019, including the related notes, and the financial highlights for each of the periods indicated therein (collectively referred to as the “financial statements”). In our opinion, the financial statements present fairly, in all material respects, the financial position of each of the Funds as of October 31, 2019, the results of each of their operations for the year then ended, the changes in each of their net assets for each of the two years in the period ended October 31, 2019 and each of the financial highlights for each of the periods indicated therein in conformity with accounting principles generally accepted in the United States of America.
Basis for Opinions
These financial statements are the responsibility of the Funds' management. Our responsibility is to express an opinion on the Funds' financial statements based on our audits. We are a public accounting firm registered with the Public Company Accounting Oversight Board (United States) (PCAOB) and are required to be independent with respect to the Funds in accordance with the U.S. federal securities laws and the applicable rules and regulations of the Securities and Exchange Commission and the PCAOB.
We conducted our audits of these financial statements in accordance with the standards of the PCAOB. Those standards require that we plan and perform the audit to obtain reasonable assurance about whether the financial statements are free of material misstatement, whether due to error or fraud.
Our audits included performing procedures to assess the risks of material misstatement of the financial statements, whether due to error or fraud, and performing procedures that respond to those risks. Such procedures included examining, on a test basis, evidence regarding the amounts and disclosures in the financial statements. Our audits also included evaluating the accounting principles used and significant estimates made by management, as well as evaluating the overall presentation of the financial statements. Our procedures included confirmation of securities owned as of October 31, 2019 by correspondence with the custodian and brokers; when replies were not received from brokers, we performed other auditing procedures. We believe that our audits provide a reasonable basis for our opinions.
PricewaterhouseCoopers LLP
Boston, Massachusetts
December 12, 2019
We have served as the auditor of one or more investment companies in the Fidelity group of funds since 1932.
Trustees and Officers
The Trustees, Members of the Advisory Board (if any), and officers of the trust and funds, as applicable, are listed below. The Board of Trustees governs each fund and is responsible for protecting the interests of shareholders. The Trustees are experienced executives who meet periodically throughout the year to oversee each fund's activities, review contractual arrangements with companies that provide services to each fund, oversee management of the risks associated with such activities and contractual arrangements, and review each fund's performance. Except for Jonathan Chiel, each of the Trustees oversees 298 funds. Mr. Chiel oversees 171 funds.
The Trustees hold office without limit in time except that (a) any Trustee may resign; (b) any Trustee may be removed by written instrument, signed by at least two-thirds of the number of Trustees prior to such removal; (c) any Trustee who requests to be retired or who has become incapacitated by illness or injury may be retired by written instrument signed by a majority of the other Trustees; and (d) any Trustee may be removed at any special meeting of shareholders by a two-thirds vote of the outstanding voting securities of the trust. Each Trustee who is not an interested person (as defined in the 1940 Act) of the trust and the funds is referred to herein as an Independent Trustee. Each Independent Trustee shall retire not later than the last day of the calendar year in which his or her 75th birthday occurs. The Independent Trustees may waive this mandatory retirement age policy with respect to individual Trustees. Officers and Advisory Board Members hold office without limit in time, except that any officer or Advisory Board Member may resign or may be removed by a vote of a majority of the Trustees at any regular meeting or any special meeting of the Trustees. Except as indicated, each individual has held the office shown or other offices in the same company for the past five years.
Each fund's Statement of Additional Information (SAI) includes more information about the Trustees. To request a free copy, call Fidelity at 1-800-544-8544 if you’re an individual investing directly with Fidelity, call 1-800-835-5092 if you’re a plan sponsor or participant with Fidelity as your recordkeeper or call 1-877-208-0098 on institutional accounts or if you’re an advisor or invest through one.
Experience, Skills, Attributes, and Qualifications of the Trustees. The Governance and Nominating Committee has adopted a statement of policy that describes the experience, qualifications, attributes, and skills that are necessary and desirable for potential Independent Trustee candidates (Statement of Policy). The Board believes that each Trustee satisfied at the time he or she was initially elected or appointed a Trustee, and continues to satisfy, the standards contemplated by the Statement of Policy. The Governance and Nominating Committee also engages professional search firms to help identify potential Independent Trustee candidates who have the experience, qualifications, attributes, and skills consistent with the Statement of Policy. From time to time, additional criteria based on the composition and skills of the current Independent Trustees, as well as experience or skills that may be appropriate in light of future changes to board composition, business conditions, and regulatory or other developments, have also been considered by the professional search firms and the Governance and Nominating Committee. In addition, the Board takes into account the Trustees' commitment and participation in Board and committee meetings, as well as their leadership of standing and ad hoc committees throughout their tenure.
In determining that a particular Trustee was and continues to be qualified to serve as a Trustee, the Board has considered a variety of criteria, none of which, in isolation, was controlling. The Board believes that, collectively, the Trustees have balanced and diverse experience, qualifications, attributes, and skills, which allow the Board to operate effectively in governing each fund and protecting the interests of shareholders. Information about the specific experience, skills, attributes, and qualifications of each Trustee, which in each case led to the Board's conclusion that the Trustee should serve (or continue to serve) as a trustee of the funds, is provided below.
Board Structure and Oversight Function. James C. Curvey is an interested person and currently serves as Chairman. The Trustees have determined that an interested Chairman is appropriate and benefits shareholders because an interested Chairman has a personal and professional stake in the quality and continuity of services provided to the funds. Independent Trustees exercise their informed business judgment to appoint an individual of their choosing to serve as Chairman, regardless of whether the Trustee happens to be independent or a member of management. The Independent Trustees have determined that they can act independently and effectively without having an Independent Trustee serve as Chairman and that a key structural component for assuring that they are in a position to do so is for the Independent Trustees to constitute a substantial majority for the Board. The Independent Trustees also regularly meet in executive session. Ned C. Lautenbach serves as Chairman of the Independent Trustees and as such (i) acts as a liaison between the Independent Trustees and management with respect to matters important to the Independent Trustees and (ii) with management prepares agendas for Board meetings.
Fidelity® funds are overseen by different Boards of Trustees. The funds' Board oversees Fidelity's high income and certain equity funds, and other Boards oversee Fidelity's investment-grade bond, money market, asset allocation, and other equity funds. The asset allocation funds may invest in Fidelity® funds overseen by the funds' Board. The use of separate Boards, each with its own committee structure, allows the Trustees of each group of Fidelity® funds to focus on the unique issues of the funds they oversee, including common research, investment, and operational issues. On occasion, the separate Boards establish joint committees to address issues of overlapping consequences for the Fidelity® funds overseen by each Board.
The Trustees operate using a system of committees to facilitate the timely and efficient consideration of all matters of importance to the Trustees, each fund, and fund shareholders and to facilitate compliance with legal and regulatory requirements and oversight of the funds' activities and associated risks. The Board, acting through its committees, has charged FMR and its affiliates with (i) identifying events or circumstances the occurrence of which could have demonstrably adverse effects on the funds' business and/or reputation; (ii) implementing processes and controls to lessen the possibility that such events or circumstances occur or to mitigate the effects of such events or circumstances if they do occur; and (iii) creating and maintaining a system designed to evaluate continuously business and market conditions in order to facilitate the identification and implementation processes described in (i) and (ii) above. Because the day-to-day operations and activities of the funds are carried out by or through FMR, its affiliates, and other service providers, the funds' exposure to risks is mitigated but not eliminated by the processes overseen by the Trustees. While each of the Board's committees has responsibility for overseeing different aspects of the funds' activities, oversight is exercised primarily through the Operations, Audit, and Compliance Committees. Appropriate personnel, including but not limited to the funds' Chief Compliance Officer (CCO), FMR's internal auditor, the independent accountants, the funds' Treasurer and portfolio management personnel, make periodic reports to the Board's committees, as appropriate, including an annual review of Fidelity's risk management program for the Fidelity® funds. The responsibilities of each standing committee, including their oversight responsibilities, are described further under "Standing Committees of the Trustees."
Interested Trustees*:
Correspondence intended for a Trustee who is an interested person may be sent to Fidelity Investments, 245 Summer Street, Boston, Massachusetts 02210.
Name, Year of Birth; Principal Occupations and Other Relevant Experience+
Jonathan Chiel (1957)
Year of Election or Appointment: 2016
Trustee
Mr. Chiel also serves as Trustee of other Fidelity® funds. Mr. Chiel is Executive Vice President and General Counsel for FMR LLC (diversified financial services company, 2012-present). Previously, Mr. Chiel served as general counsel (2004-2012) and senior vice president and deputy general counsel (2000-2004) for John Hancock Financial Services; a partner with Choate, Hall & Stewart (1996-2000) (law firm); and an Assistant United States Attorney for the United States Attorney’s Office of the District of Massachusetts (1986-95), including Chief of the Criminal Division (1993-1995). Mr. Chiel is a director on the boards of the Boston Bar Foundation and the Maimonides School.
James C. Curvey (1935)
Year of Election or Appointment: 2007
Trustee
Chairman of the Board of Trustees
Mr. Curvey also serves as Trustee of other Fidelity® funds. Mr. Curvey is Vice Chairman (2007-present) and Director of FMR LLC (diversified financial services company). In addition, Mr. Curvey is an Overseer Emeritus for the Boston Symphony Orchestra, a Director of Artis-Naples, and a Trustee of Brewster Academy in Wolfeboro, New Hampshire. Previously, Mr. Curvey served as a Director of Fidelity Research & Analysis Co. (investment adviser firm, 2009-2018), Director of Fidelity Investments Money Management, Inc. (investment adviser firm, 2009-2014) and a Director of FMR and FMR Co., Inc. (investment adviser firms, 2007-2014).
* Determined to be an “Interested Trustee” by virtue of, among other things, his or her affiliation with the trust or various entities under common control with FMR.
+ The information includes the Trustee's principal occupation during the last five years and other information relating to the experience, attributes, and skills relevant to the Trustee's qualifications to serve as a Trustee, which led to the conclusion that the Trustee should serve as a Trustee for each fund.
Independent Trustees:
Correspondence intended for an Independent Trustee may be sent to Fidelity Investments, P.O. Box 55235, Boston, Massachusetts 02205-5235.
Name, Year of Birth; Principal Occupations and Other Relevant Experience+
Dennis J. Dirks (1948)
Year of Election or Appointment: 2005
Trustee
Mr. Dirks also serves as Trustee of other Fidelity® funds. Prior to his retirement in May 2003, Mr. Dirks was Chief Operating Officer and a member of the Board of The Depository Trust & Clearing Corporation (DTCC). He also served as President, Chief Operating Officer, and Board member of The Depository Trust Company (DTC) and President and Board member of the National Securities Clearing Corporation (NSCC). In addition, Mr. Dirks served as Chief Executive Officer and Board member of the Government Securities Clearing Corporation, Chief Executive Officer and Board member of the Mortgage-Backed Securities Clearing Corporation, as a Trustee and a member of the Finance Committee of Manhattan College (2005-2008), as a Trustee and a member of the Finance Committee of AHRC of Nassau County (2006-2008), as a member of the Independent Directors Council (IDC) Governing Council (2010-2015), and as a member of the Board of Directors for The Brookville Center for Children’s Services, Inc. (2009-2017). Mr. Dirks is a member of the Finance Committee (2016-present) and Board of Directors (2017-present) and is Treasurer (2018-present) of the Asolo Repertory Theatre.
Donald F. Donahue (1950)
Year of Election or Appointment: 2018
Trustee
Mr. Donahue also serves as a Trustee of other Fidelity® funds. Mr. Donahue is President and Chief Executive Officer of Miranda Partners, LLC (risk consulting for the financial services industry, 2012-present). Previously, Mr. Donahue served as a Member of the Advisory Board of certain Fidelity® funds (2015-2018) and Chief Executive Officer (2006-2012), Chief Operating Officer (2003-2006), and Managing Director, Customer Marketing and Development (1999-2003) of The Depository Trust & Clearing Corporation (financial markets infrastructure). Mr. Donahue serves as a Member (2007-present) and Co-Chairman (2016-present) of the Board of Directors of United Way of New York, Member of the Board of Directors of NYC Leadership Academy (2012-present) and Member of the Board of Advisors of Ripple Labs, Inc. (financial services, 2015-present). He also served as Chairman (2010-2012) and Member of the Board of Directors (2012-2013) of Omgeo, LLC (financial services), Treasurer of United Way of New York (2012-2016), and Member of the Board of Directors of XBRL US (financial services non-profit, 2009-2012) and the International Securities Services Association (2009-2012).
Alan J. Lacy (1953)
Year of Election or Appointment: 2008
Trustee
Mr. Lacy also serves as Trustee of other Fidelity® funds. Mr. Lacy serves as a Director of Bristol-Myers Squibb Company (global pharmaceuticals, 2008-present). He is a Trustee of the California Chapter of The Nature Conservancy (2015-present) and a Director of the Center for Advanced Study in the Behavioral Sciences at Stanford University (2015-present). In addition, Mr. Lacy served as Senior Adviser (2007-2014) of Oak Hill Capital Partners, L.P. (private equity) and also served as Chief Executive Officer (2005) and Vice Chairman (2005-2006) of Sears Holdings Corporation (retail) and Chief Executive Officer and Chairman of the Board of Sears, Roebuck and Co. (retail, 2000-2005). Previously, Mr. Lacy served as Chairman (2014-2017) and a member (2010-2017) of the Board of Directors of Dave & Buster’s Entertainment, Inc. (restaurant and entertainment complexes), as Chairman (2008-2011) and a member (2006-2015) of the Board of Trustees of the National Parks Conservation Association, and as a member of the Board of Directors for The Hillman Companies, Inc. (hardware wholesalers, 2010-2014), Earth Fare, Inc. (retail grocery, 2010-2014), and The Western Union Company (global money transfer, 2006-2011).
Ned C. Lautenbach (1944)
Year of Election or Appointment: 2000
Trustee
Chairman of the Independent Trustees
Mr. Lautenbach also serves as Trustee of other Fidelity® funds. Mr. Lautenbach currently serves as Chair (2018-present) and Member (2013-present) of the Board of Governors, State University System of Florida and is a member of the Council on Foreign Relations (1994-present). He is also a member and has most recently served as Chairman of the Board of Directors of Artis-Naples (2012-present). Previously, Mr. Lautenbach served as a member and then Lead Director of the Board of Directors of Eaton Corporation (diversified industrial, 1997-2016). He was also a Partner and Advisory Partner at Clayton, Dubilier & Rice, LLC (private equity investment, 1998-2010), as well as a Director of Sony Corporation (2006-2007). In addition, Mr. Lautenbach also had a 30-year career with IBM (technology company) during which time he served as Senior Vice President and a member of the Corporate Executive Committee (1968-1998).
Joseph Mauriello (1944)
Year of Election or Appointment: 2008
Trustee
Mr. Mauriello also serves as Trustee of other Fidelity® funds. Prior to his retirement in January 2006, Mr. Mauriello served in numerous senior management positions including Deputy Chairman and Chief Operating Officer (2004-2005), and Vice Chairman of Financial Services (2002-2004) of KPMG LLP US (professional services, 1965-2005). Mr. Mauriello currently serves as a member of the Independent Directors Council (IDC) Governing Council (2015-present). Previously, Mr. Mauriello served as a member of the Board of Directors of XL Group plc. (global insurance and re-insurance, 2006-2018).
Cornelia M. Small (1944)
Year of Election or Appointment: 2005
Trustee
Ms. Small also serves as Trustee of other Fidelity® funds. Ms. Small is a member of the Board of Directors (2009-present) and Chair of the Investment Committee (2010-present) of the Teagle Foundation. Ms. Small also serves on the Investment Committee of the Berkshire Taconic Community Foundation (2008-present). Previously, Ms. Small served as Chairperson (2002-2008) and a member of the Investment Committee and Chairperson (2008-2012) and a member of the Board of Trustees of Smith College. In addition, Ms. Small served as Chief Investment Officer, Director of Global Equity Investments, and a member of the Board of Directors of Scudder, Stevens & Clark and Scudder Kemper Investments.
Garnett A. Smith (1947)
Year of Election or Appointment: 2018
Trustee
Mr. Smith also serves as Trustee of other Fidelity® funds. Prior to Mr. Smith's retirement, he served as Chairman and Chief Executive Officer of Inbrand Corp. (manufacturer of personal absorbent products, 1990-1997). He also served as President (1986-1990) of Inbrand Corp. Prior to his employment with Inbrand Corp., he was employed by a retail fabric chain and North Carolina National Bank. In addition, Mr. Smith served as a Member of the Advisory Board of certain Fidelity® funds (2012-2013) and as a board member of the Jackson Hole Land Trust (2009-2012).
David M. Thomas (1949)
Year of Election or Appointment: 2008
Trustee
Mr. Thomas also serves as Trustee of other Fidelity® funds. Mr. Thomas serves as Non-Executive Chairman of the Board of Directors of Fortune Brands Home and Security (home and security products, 2011-present) and as a member of the Board of Directors (2004-present) and Presiding Director (2013-present) of Interpublic Group of Companies, Inc. (marketing communication). Previously, Mr. Thomas served as Executive Chairman (2005-2006) and Chairman and Chief Executive Officer (2000-2005) of IMS Health, Inc. (pharmaceutical and healthcare information solutions), a Director of Fortune Brands, Inc. (consumer products, 2000-2011), and a member of the Board of Trustees of the University of Florida (2013-2018).
+ The information includes the Trustee's principal occupation during the last five years and other information relating to the experience, attributes, and skills relevant to the Trustee's qualifications to serve as a Trustee, which led to the conclusion that the Trustee should serve as a Trustee for each fund.
Advisory Board Members and Officers:
Correspondence intended for a Member of the Advisory Board (if any) may be sent to Fidelity Investments, P.O. Box 55235, Boston, Massachusetts 02205-5235. Correspondence intended for an officer or Peter S. Lynch may be sent to Fidelity Investments, 245 Summer Street, Boston, Massachusetts 02210. Officers appear below in alphabetical order.
Name, Year of Birth; Principal Occupation
Vicki L. Fuller (1957)
Year of Election or Appointment: 2018
Member of the Advisory Board
Ms. Fuller also serves as Member of the Advisory Board of other Fidelity® funds. Ms. Fuller serves as a member of the Board of Directors, Audit Committee, and Nominating and Governance Committee of The Williams Companies, Inc. (natural gas infrastructure, 2018-present). Previously, Ms. Fuller served as the Chief Investment Officer of the New York State Common Retirement Fund (2012-2018) and held a variety of positions at AllianceBernstein L.P. (global asset management, 1985-2012), including Managing Director (2006-2012) and Senior Vice President and Senior Portfolio Manager (2001-2006).
Peter S. Lynch (1944)
Year of Election or Appointment: 2003
Member of the Advisory Board
Mr. Lynch also serves as Member of the Advisory Board of other Fidelity® funds. Mr. Lynch is Vice Chairman and a Director of FMR (investment adviser firm) and FMR Co., Inc. (investment adviser firm). In addition, Mr. Lynch serves as a Trustee of Boston College and as the Chairman of the Inner-City Scholarship Fund. Previously, Mr. Lynch served on the Special Olympics International Board of Directors (1997-2006).
Michael E. Wiley (1950)
Year of Election or Appointment: 2018
Member of the Advisory Board
Mr. Wiley also serves as Trustee or Member of the Advisory Board of other Fidelity® funds. Mr. Wiley serves as a Director of High Point Resources (exploration and production, 2005-present). Previously, Mr. Wiley served as a Director of Andeavor Corporation (independent oil refiner and marketer, 2005-2018), a Director of Andeavor Logistics LP (natural resources logistics, 2015-2018), a Director of Post Oak Bank (privately-held bank, 2004-2018), a Director of Asia Pacific Exploration Consolidated (international oil and gas exploration and production, 2008-2013), a member of the Board of Trustees of the University of Tulsa (2000-2006; 2007-2010), a Senior Energy Advisor of Katzenbach Partners, LLC (consulting, 2006-2007), an Advisory Director of Riverstone Holdings (private investment), a Director of Spinnaker Exploration Company (exploration and production, 2001-2005) and Chairman, President, and CEO of Baker Hughes, Inc. (oilfield services, 2000-2004).
Elizabeth Paige Baumann (1968)
Year of Election or Appointment: 2017
Anti-Money Laundering (AML) Officer
Ms. Baumann also serves as AML Officer of other funds. She is Chief AML Officer (2012-present) and Senior Vice President (2014-present) of FMR LLC (diversified financial services company) and is an employee of Fidelity Investments. Previously, Ms. Baumann served as AML Officer of the funds (2012-2016), and Vice President (2007-2014) and Deputy Anti-Money Laundering Officer (2007-2012) of FMR LLC.
Craig S. Brown (1977)
Year of Election or Appointment: 2019
Assistant Treasurer
Mr. Brown also serves as Assistant Treasurer of other funds. Mr. Brown is an employee of Fidelity Investments (2013-present).
John J. Burke III (1964)
Year of Election or Appointment: 2018
Chief Financial Officer
Mr. Burke also serves as Chief Financial Officer of other funds. Mr. Burke serves as Head of Investment Operations for Fidelity Fund and Investment Operations (2018-present) and is an employee of Fidelity Investments (1998-present). Previously Mr. Burke served as head of Asset Management Investment Operations (2012-2018).
William C. Coffey (1969)
Year of Election or Appointment: 2019
Assistant Secretary
Mr. Coffey also serves as Assistant Secretary of other funds. He is Senior Vice President and Deputy General Counsel of FMR LLC (diversified financial services company, 2010-present), and is an employee of Fidelity Investments. Previously, Mr. Coffey served as Secretary and CLO of certain funds (2018-2019); CLO, Secretary, and Senior Vice President of Fidelity Management & Research Company and FMR Co., Inc. (investment adviser firms, 2018-2019); Secretary of Fidelity SelectCo, LLC and Fidelity Investments Money Management, Inc. (investment adviser firms, 2018-2019); CLO of Fidelity Management & Research (Hong Kong) Limited, FMR Investment Management (UK) Limited, and Fidelity Management & Research (Japan) Limited (investment adviser firms, 2018-2019); and Assistant Secretary of certain funds (2009-2018).
Timothy M. Cohen (1969)
Year of Election or Appointment: 2018
Vice President
Mr. Cohen also serves as Vice President of other funds. Mr. Cohen serves as Executive Vice President of Fidelity SelectCo, LLC (2019-present), Co-Head of Equity (2018-present), a Director of Fidelity Management & Research (Japan) Limited (investment adviser firm, 2016-present), and is an employee of Fidelity Investments. Previously, Mr. Cohen served as Head of Global Equity Research (2016-2018), Chief Investment Officer - Equity and a Director of Fidelity Management & Research (U.K.) Inc. (investment adviser firm, 2013-2015) and as a Director of Fidelity Management & Research (Hong Kong) Limited (investment adviser firm, 2017).
Jonathan Davis (1968)
Year of Election or Appointment: 2010
Assistant Treasurer
Mr. Davis also serves as Assistant Treasurer of other funds. Mr. Davis serves as Assistant Treasurer of FMR Capital, Inc. (2017-present) and is an employee of Fidelity Investments. Previously, Mr. Davis served as Vice President and Associate General Counsel of FMR LLC (diversified financial services company, 2003-2010).
Adrien E. Deberghes (1967)
Year of Election or Appointment: 2016
Assistant Treasurer
Mr. Deberghes also serves as an officer of other funds. He serves as Assistant Treasurer of FMR Capital, Inc. (2017-present), Executive Vice President of Fidelity Investments Money Management, Inc. (FIMM) (investment adviser firm, 2016-present), and is an employee of Fidelity Investments (2008-present). Previously, Mr. Deberghes served as President and Treasurer of certain Fidelity® funds (2013-2018). Prior to joining Fidelity Investments, Mr. Deberghes was Senior Vice President of Mutual Fund Administration at State Street Corporation (2007-2008), Senior Director of Mutual Fund Administration at Investors Bank & Trust (2005-2007), and Director of Finance for Dunkin' Brands (2000-2005). Previously, Mr. Deberghes served in other fund officer roles.
Laura M. Del Prato (1964)
Year of Election or Appointment: 2018
Assistant Treasurer
Ms. Del Prato also serves as an officer of other funds. Ms. Del Prato is an employee of Fidelity Investments (2017-present). Prior to joining Fidelity Investments, Ms. Del Prato served as a Managing Director and Treasurer of the JPMorgan Mutual Funds (2014-2017). Prior to JPMorgan, Ms. Del Prato served as a partner at Cohen Fund Audit Services (accounting firm, 2012-2013) and KPMG LLP (accounting firm, 2004-2012).
Colm A. Hogan (1973)
Year of Election or Appointment: 2016
Deputy Treasurer
Mr. Hogan also serves as an officer of other funds. Mr. Hogan serves as Assistant Treasurer of FMR Capital, Inc. (2017-present) and is an employee of Fidelity Investments (2005-present). Previously, Mr. Hogan served as Assistant Treasurer of certain Fidelity® funds (2016-2018).
Pamela R. Holding (1964)
Year of Election or Appointment: 2018
Vice President
Ms. Holding also serves as Vice President of other funds. Ms. Holding serves as Executive Vice President of Fidelity SelectCo, LLC (2019-present), Co-Head of Equity (2018-present) and is an employee of Fidelity Investments (2013-present). Previously, Ms. Holding served as Chief Investment Officer of Fidelity Institutional Asset Management (2013-2018).
Cynthia Lo Bessette (1969)
Year of Election or Appointment: 2019
Secretary and Chief Legal Officer (CLO)
Ms. Lo Bessette also serves as Secretary and CLO of other funds. Ms. Lo Bessette serves as CLO, Secretary, and Senior Vice President of Fidelity Management & Research Company and FMR Co., Inc. (investment adviser firms, 2019-present); Secretary of Fidelity SelectCo, LLC and Fidelity Investments Money Management, Inc. (investment adviser firms, 2019-present); and CLO of Fidelity Management & Research (Hong Kong) Limited, FMR Investment Management (UK) Limited, and Fidelity Management & Research (Japan) Limited (investment adviser firms, 2019-present). She is a Senior Vice President and Deputy General Counsel of FMR LLC (diversified financial services company, 2019-present), and is an employee of Fidelity Investments. Previously, Ms. Lo Bessette served as Executive Vice President, General Counsel (2016-2019) and Senior Vice President, Deputy General Counsel (2015-2016) of OppenheimerFunds (investment management company) and Deputy Chief Legal Officer (2013-2015) of Jennison Associates LLC (investment adviser firm).
Chris Maher (1972)
Year of Election or Appointment: 2013
Assistant Treasurer
Mr. Maher serves as Assistant Treasurer of other funds. Mr. Maher is Vice President of Valuation Oversight, serves as Assistant Treasurer of FMR Capital, Inc. (2017-present), and is an employee of Fidelity Investments. Previously, Mr. Maher served as Vice President of Asset Management Compliance (2013), Vice President of the Program Management Group of FMR (investment adviser firm, 2010-2013), and Vice President of Valuation Oversight (2008-2010).
Kenneth B. Robins (1969)
Year of Election or Appointment: 2016
Chief Compliance Officer
Mr. Robins also serves as an officer of other funds. Mr. Robins serves as Compliance Officer of Fidelity Management & Research Company and FMR Co., Inc. (investment adviser firms, 2016-present) and is an employee of Fidelity Investments (2004-present). Previously, Mr. Robins served as Executive Vice President of Fidelity Investments Money Management, Inc. (investment adviser firm, 2013-2016) and served in other fund officer roles.
Stacie M. Smith (1974)
Year of Election or Appointment: 2016
President and Treasurer
Ms. Smith also serves as an officer of other funds. Ms. Smith serves as Assistant Treasurer of FMR Capital, Inc. (2017-present), is an employee of Fidelity Investments (2009-present), and has served in other fund officer roles. Prior to joining Fidelity Investments, Ms. Smith served as Senior Audit Manager of Ernst & Young LLP (accounting firm, 1996-2009). Previously, Ms. Smith served as Assistant Treasurer (2013-2018) and Deputy Treasurer (2013-2016) of certain Fidelity® funds.
Marc L. Spector (1972)
Year of Election or Appointment: 2016
Assistant Treasurer
Mr. Spector also serves as an officer of other funds. Mr. Spector serves as Assistant Treasurer of FMR Capital, Inc. (2017-present) and is an employee of Fidelity Investments (2016-present). Prior to joining Fidelity Investments, Mr. Spector served as Director at the Siegfried Group (accounting firm, 2013-2016), and prior to Siegfried Group as audit senior manager at Deloitte & Touche (accounting firm, 2005-2013).
Jim Wegmann (1979)
Year of Election or Appointment: 2019
Assistant Treasurer
Mr. Wegmann also serves as Assistant Treasurer of other funds. Mr. Wegmann is an employee of Fidelity Investments (2011-present).
Shareholder Expense Example
As a shareholder of a Fund, you incur two types of costs: (1) transaction costs, including sales charges (loads) on purchase payments or redemption proceeds, and (2) ongoing costs, including management fees, distribution and/or service (12b-1) fees and other Fund expenses. This Example is intended to help you understand your ongoing costs (in dollars) of investing in the Funds and to compare these costs with the ongoing costs of investing in other mutual funds.
The Example is based on an investment of $1,000 invested at the beginning of the period and held for the entire period (May 1, 2019 to October 31, 2019).
Actual Expenses
The first line of the accompanying table for each Class of each fund provides information about actual account values and actual expenses. You may use the information in this line, together with the amount you invested, to estimate the expenses that you paid over the period. Simply divide your account value by $1,000.00 (for example, an $8,600 account value divided by $1,000.00 = 8.6), then multiply the result by the number in the first line for a Class of the fund under the heading entitled "Expenses Paid During Period" to estimate the expenses you paid on your account during this period. In addition, each Fund, as a shareholder in the underlying Fidelity Central Funds, will indirectly bear its pro-rata share of the fees and expenses incurred by the underlying Fidelity Central Funds. These fees and expenses are not included in the Fund's annualized expense ratio used to calculate the expense estimate in the table below.
Hypothetical Example for Comparison Purposes
The second line of the accompanying table for each Class of each fund provides information about hypothetical account values and hypothetical expenses based on a Class' actual expense ratio and an assumed rate of return of 5% per year before expenses, which is not the Class' actual return. The hypothetical account values and expenses may not be used to estimate the actual ending account balance or expenses you paid for the period. You may use this information to compare the ongoing costs of investing in the Fund and other funds. To do so, compare this 5% hypothetical example with the 5% hypothetical examples that appear in the shareholder reports of the other funds. In addition, each Fund, as a shareholder in the underlying Fidelity Central Funds, will indirectly bear its pro-rata share of the fees and expenses incurred by the underlying Fidelity Central Funds. These fees and expenses are not included in the Fund's annualized expense ratio used to calculate the expense estimate in the table below.
Please note that the expenses shown in the table are meant to highlight your ongoing costs only and do not reflect any transaction costs. Therefore, the second line of the table is useful in comparing ongoing costs only, and will not help you determine the relative total costs of owning different funds. In addition, if these transactional costs were included, your costs would have been higher.
| | Annualized Expense Ratio-A | Beginning
Account Value
May 1, 2019 | Ending
Account Value
October 31, 2019 | Expenses Paid
During Period-B
May 1, 2019
to October 31, 2019 |
| Fidelity Canada Fund | | | | |
| Class A | 1.22% | | | |
| Actual | | $1,000.00 | $1,015.60 | $6.20 |
| Hypothetical-C | | $1,000.00 | $1,019.06 | $6.21 |
| Class M | 1.51% | | | |
| Actual | | $1,000.00 | $1,014.30 | $7.67 |
| Hypothetical-C | | $1,000.00 | $1,017.59 | $7.68 |
| Class C | 1.94% | | | |
| Actual | | $1,000.00 | $1,012.00 | $9.84 |
| Hypothetical-C | | $1,000.00 | $1,015.43 | $9.86 |
| Canada | .90% | | | |
| Actual | | $1,000.00 | $1,017.30 | $4.58 |
| Hypothetical-C | | $1,000.00 | $1,020.67 | $4.58 |
| Class I | .87% | | | |
| Actual | | $1,000.00 | $1,017.40 | $4.42 |
| Hypothetical-C | | $1,000.00 | $1,020.82 | $4.43 |
| Class Z | .74% | | | |
| Actual | | $1,000.00 | $1,018.20 | $3.76 |
| Hypothetical-C | | $1,000.00 | $1,021.48 | $3.77 |
| Fidelity China Region Fund | | | | |
| Class A | 1.25% | | | |
| Actual | | $1,000.00 | $1,009.90 | $6.33 |
| Hypothetical-C | | $1,000.00 | $1,018.90 | $6.36 |
| Class M | 1.57% | | | |
| Actual | | $1,000.00 | $1,008.20 | $7.95 |
| Hypothetical-C | | $1,000.00 | $1,017.29 | $7.98 |
| Class C | 1.98% | | | |
| Actual | | $1,000.00 | $1,006.10 | $10.01 |
| Hypothetical-C | | $1,000.00 | $1,015.22 | $10.06 |
| China Region | .93% | | | |
| Actual | | $1,000.00 | $1,011.40 | $4.71 |
| Hypothetical-C | | $1,000.00 | $1,020.52 | $4.74 |
| Class I | .95% | | | |
| Actual | | $1,000.00 | $1,011.50 | $4.82 |
| Hypothetical-C | | $1,000.00 | $1,020.42 | $4.84 |
| Class Z | .84% | | | |
| Actual | | $1,000.00 | $1,012.10 | $4.26 |
| Hypothetical-C | | $1,000.00 | $1,020.97 | $4.28 |
| Fidelity Emerging Asia Fund | 1.16% | | | |
| Actual | | $1,000.00 | $1,021.80 | $5.91 |
| Hypothetical-C | | $1,000.00 | $1,019.36 | $5.90 |
| Fidelity Emerging Markets Fund | | | | |
| Emerging Markets | .92% | | | |
| Actual | | $1,000.00 | $1,036.70 | $4.72 |
| Hypothetical-C | | $1,000.00 | $1,020.57 | $4.69 |
| Class K | .79% | | | |
| Actual | | $1,000.00 | $1,037.30 | $4.06 |
| Hypothetical-C | | $1,000.00 | $1,021.22 | $4.02 |
| Fidelity Europe Fund | | | | |
| Class A | 1.05% | | | |
| Actual | | $1,000.00 | $992.30 | $5.27 |
| Hypothetical-C | | $1,000.00 | $1,019.91 | $5.35 |
| Class M | 1.36% | | | |
| Actual | | $1,000.00 | $990.70 | $6.82 |
| Hypothetical-C | | $1,000.00 | $1,018.35 | $6.92 |
| Class C | 1.83% | | | |
| Actual | | $1,000.00 | $988.20 | $9.17 |
| Hypothetical-C | | $1,000.00 | $1,015.98 | $9.30 |
| Europe | .73% | | | |
| Actual | | $1,000.00 | $994.00 | $3.67 |
| Hypothetical-C | | $1,000.00 | $1,021.53 | $3.72 |
| Class I | .70% | | | |
| Actual | | $1,000.00 | $994.00 | $3.52 |
| Hypothetical-C | | $1,000.00 | $1,021.68 | $3.57 |
| Class Z | .66% | | | |
| Actual | | $1,000.00 | $994.20 | $3.32 |
| Hypothetical-C | | $1,000.00 | $1,021.88 | $3.36 |
| Fidelity Japan Fund | | | | |
| Class A | 1.33% | | | |
| Actual | | $1,000.00 | $1,067.60 | $6.93 |
| Hypothetical-C | | $1,000.00 | $1,018.50 | $6.77 |
| Class M | 1.64% | | | |
| Actual | | $1,000.00 | $1,065.80 | $8.54 |
| Hypothetical-C | | $1,000.00 | $1,016.94 | $8.34 |
| Class C | 2.00% | | | |
| Actual | | $1,000.00 | $1,063.90 | $10.40 |
| Hypothetical-C | | $1,000.00 | $1,015.12 | $10.16 |
| Japan | 1.01% | | | |
| Actual | | $1,000.00 | $1,069.50 | $5.27 |
| Hypothetical-C | | $1,000.00 | $1,020.11 | $5.14 |
| Class I | .97% | | | |
| Actual | | $1,000.00 | $1,070.20 | $5.06 |
| Hypothetical-C | | $1,000.00 | $1,020.32 | $4.94 |
| Class Z | .89% | | | |
| Actual | | $1,000.00 | $1,070.30 | $4.64 |
| Hypothetical-C | | $1,000.00 | $1,020.72 | $4.53 |
| Fidelity Japan Smaller Companies Fund | .93% | | | |
| Actual | | $1,000.00 | $1,070.60 | $4.85 |
| Hypothetical-C | | $1,000.00 | $1,020.52 | $4.74 |
| Fidelity Latin America Fund | | | | |
| Class A | 1.35% | | | |
| Actual | | $1,000.00 | $1,187.10 | $7.44 |
| Hypothetical-C | | $1,000.00 | $1,018.40 | $6.87 |
| Class M | 1.62% | | | |
| Actual | | $1,000.00 | $1,185.70 | $8.92 |
| Hypothetical-C | | $1,000.00 | $1,017.04 | $8.24 |
| Class C | 2.08% | | | |
| Actual | | $1,000.00 | $1,182.80 | $11.44 |
| Hypothetical-C | | $1,000.00 | $1,014.72 | $10.56 |
| Latin America | 1.03% | | | |
| Actual | | $1,000.00 | $1,189.10 | $5.68 |
| Hypothetical-C | | $1,000.00 | $1,020.01 | $5.24 |
| Class I | .99% | | | |
| Actual | | $1,000.00 | $1,189.20 | $5.46 |
| Hypothetical-C | | $1,000.00 | $1,020.21 | $5.04 |
| Class Z | .88% | | | |
| Actual | | $1,000.00 | $1,190.10 | $4.86 |
| Hypothetical-C | | $1,000.00 | $1,020.77 | $4.48 |
| Fidelity Nordic Fund | .97% | | | |
| Actual | | $1,000.00 | $1,002.60 | $4.90 |
| Hypothetical-C | | $1,000.00 | $1,020.32 | $4.94 |
| Fidelity Pacific Basin Fund | 1.01% | | | |
| Actual | | $1,000.00 | $1,052.20 | $5.22 |
| Hypothetical-C | | $1,000.00 | $1,020.11 | $5.14 |
A Annualized expense ratio reflects expenses net of applicable fee waivers.
B Expenses are equal to each Class' annualized expense ratio, multiplied by the average account value over the period, multiplied by 184/ 365 (to reflect the one-half year period).
C 5% return per year before expenses
Distributions (Unaudited)
The Board of Trustees of each fund voted to pay to shareholders of record at the opening of business on record date, the following distributions per share derived from capital gains realized from sales of portfolio securities and dividends derived from net investment income:
| | Pay Date | Record Date | Dividends | Capital Gains |
| Fidelity Canada Fund | | | | |
| Class A | 12/09/19 | 12/06/19 | $0.765 | $1.404 |
| Class M | 12/09/19 | 12/06/19 | $0.635 | $1.404 |
| Class C | 12/09/19 | 12/06/19 | $0.175 | $1.404 |
| Canada | 12/09/19 | 12/06/19 | $0.921 | $1.404 |
| Class I | 12/09/19 | 12/06/19 | $0.867 | $1.404 |
| Class Z | 12/09/19 | 12/06/19 | $1.029 | $1.404 |
| Fidelity China Region Fund | | | | |
| Class A | 12/09/19 | 12/06/19 | $0.149 | $0.000 |
| Class M | 12/09/19 | 12/06/19 | $0.009 | $0.000 |
| Class C | 12/09/19 | 12/06/19 | $0.000 | $0.000 |
| China Region | 12/09/19 | 12/06/19 | $0.259 | $0.000 |
| Class I | 12/09/19 | 12/06/19 | $0.257 | $0.000 |
| Class Z | 12/09/19 | 12/06/19 | $0.328 | $0.000 |
| Fidelity Emerging Asia Fund | | | | |
| Emerging Asia | 12/09/19 | 12/06/19 | $0.329 | $2.466 |
| Fidelity Emerging Markets Fund | | | | |
| Emerging Markets | 12/09/19 | 12/06/19 | $0.599 | $0.000 |
| Class K | 12/09/19 | 12/06/19 | $0.646 | $0.000 |
| Fidelity Europe Fund | | | | |
| Class A | 12/09/19 | 12/06/19 | $1.499 | $1.081 |
| Class M | 12/09/19 | 12/06/19 | $1.360 | $1.081 |
| Class C | 12/09/19 | 12/06/19 | $1.136 | $1.081 |
| Europe | 12/09/19 | 12/06/19 | $1.609 | $1.081 |
| Class I | 12/09/19 | 12/06/19 | $1.621 | $1.081 |
| Class Z | 12/09/19 | 12/06/19 | $1.668 | $1.081 |
| Fidelity Japan Fund | | | | |
| Class A | 12/09/19 | 12/06/19 | $0.072 | $0.088 |
| Class M | 12/09/19 | 12/06/19 | $0.027 | $0.088 |
| Class C | 12/09/19 | 12/06/19 | $0.000 | $0.035 |
| Japan | 12/09/19 | 12/06/19 | $0.105 | $0.088 |
| Class I | 12/09/19 | 12/06/19 | $0.118 | $0.088 |
| Class Z | 12/09/19 | 12/06/19 | $0.131 | $0.088 |
| Fidelity Japan Smaller Companies Fund | | | | |
| Japan Smaller Companies | 12/09/19 | 12/06/19 | $0.225 | $1.003 |
| Fidelity Latin America Fund | | | | |
| Class A | 12/09/19 | 12/06/19 | $0.549 | $0.000 |
| Class M | 12/09/19 | 12/06/19 | $0.475 | $0.000 |
| Class C | 12/09/19 | 12/06/19 | $0.316 | $0.000 |
| Latin America | 12/09/19 | 12/06/19 | $0.633 | $0.000 |
| Class I | 12/09/19 | 12/06/19 | $0.671 | $0.000 |
| Class Z | 12/09/19 | 12/06/19 | $0.691 | $0.000 |
| Fidelity Nordic Fund | | | | |
| Nordic | 12/09/19 | 12/06/19 | $1.599 | $0.592 |
| Fidelity Pacific Basin Fund | | | | |
| Pacific Basin | 12/09/19 | 12/06/19 | $0.258 | $0.000 |
The funds hereby designate as capital gain dividend the amounts noted below for the taxable year ended October 31, 2019, or, if subsequently determined to be different, the net capital gain of such year.
| Fidelity Canada Fund | $22,923,907 |
| Fidelity China Region Fund | $149,631 |
| Fidelity Emerging Asia Fund | $54,004,246 |
| Fidelity Europe Fund | $22,536,801 |
| Fidelity Japan Smaller Companies Fund | $28,639,394 |
| Fidelity Nordic Fund | $3,386,067 |
A percentage of the dividends distributed during the fiscal year for the following funds qualify for the dividends–received deduction for corporate shareholders:
| | Class A | Class M | Class C | Retail Class | Class I | Class K | Class Z |
| Fidelity Canada Fund | | | | | | | |
| December, 2018 | 2% | 3% | – | 1% | 1% | – | 1% |
| Fidelity Emerging Markets Fund | | | | | | | |
| December, 2018 | – | – | – | 6% | – | 5% | – |
| Fidelity Europe Fund | | | | | | | |
| December, 2018 | 2% | 2% | 3% | 2% | 2% | – | 2% |
| Fidelity Latin America Fund | | | | | | | |
| December 07, 2018 | 1% | 1% | 1% | – | – | – | – |
| December 28, 2018 | 1% | 1% | 1% | 1% | 1% | – | 1% |
| Fidelity Nordic Fund | | | | | | | |
| December, 2018 | – | – | – | 3% | – | | – |
| Fidelity Pacific Basin Fund | | | | | | | |
| December, 2018 | – | – | – | 2% | – | – | – |
|
A percentage of the dividends distributed during the fiscal year for the following funds may be taken into account as a dividend for purposes of the maximum rate under section 1(h)(11) of the Internal Revenue Code.
| | Class A | Class M | Class C | Retail Class | Class I | Class K | Class Z |
| Fidelity Canada Fund | | | | | | | |
| December, 2018 | 100% | 100% | – | 94% | 92% | – | 82% |
| Fidelity China Region Fund | | | | | | | |
| December, 2018 | 100% | – | – | 100% | 100% | – | 100% |
| Fidelity Emerging Asia Fund | | | | | | | |
| December, 2018 | – | – | – | 100% | – | – | – |
| Fidelity Emerging Markets Fund | | | | | | | |
| December, 2018 | – | – | – | 100% | – | 100% | – |
| Fidelity Europe Fund | | | | | | | |
| December, 2018 | 82% | 95% | 100% | 70% | 70% | – | 66% |
| Fidelity Japan Fund | | | | | | | |
| December, 2018 | – | – | – | 100% | 100% | – | 100% |
| Fidelity Japan Smaller Companies Fund | | | | | | | |
| December, 2018 | – | – | – | 100% | – | – | |
| Fidelity Latin America Fund | | | | | | | |
| December 07, 2018 | 43% | 51% | 80% | 37% | 37% | – | 33% |
| December 28, 2018 | 27% | 27% | 27% | 27% | 27% | – | 27% |
| Fidelity Nordic Fund | | | | | | | |
| December, 2018 | – | – | – | 69% | – | – | – |
| Fidelity Pacific Basin | | | | | | | |
| December, 2018 | – | – | – | 100% | – | – | – |
|
The amounts per share which represent income derived from sources within, and taxes paid to, foreign countries or possessions of the United States are as follows:
| | Pay Date | Income | Taxes |
| Fidelity Canada Fund | | | |
| Class A | 12/10/18 | $0.5687 | $0.1787 |
| Class M | 12/10/18 | $0.4007 | $0.1787 |
| Class C | 12/11/18 | $0.0000 | $0.0000 |
| Canada | 12/10/18 | $0.7557 | $0.1787 |
| Class I | 12/10/18 | $0.7707 | $0.1787 |
| Class Z | 12/10/18 | $0.8667 | $0.1787 |
| Fidelity China Region Fund | | | |
| Class A | 12/10/18 | $0.1875 | $0.0725 |
| Class M | 12/10/18 | $0.0000 | $0.0000 |
| Class C | 12/10/18 | $0.0000 | $0.0000 |
| China Region | 12/10/18 | $0.3185 | $0.0725 |
| Class I | 12/10/18 | $0.3045 | $0.0725 |
| Class Z | 12/10/18 | $0.3895 | $0.0725 |
| Fidelity Emerging Asia Fund | | | |
| Emerging Asia | 12/10/18 | $0.4826 | $0.0916 |
| Fidelity Emerging Markets Fund | | | |
| Emerging Markets | 12/10/18 | $0.2782 | $0.0582 |
| Class K | 12/10/18 | $0.3242 | $0.0582 |
| Fidelity Europe Fund | | | |
| Class A | 12/17/18 | $0.8268 | $0.0710 |
| Class M | 12/17/18 | $0.7171 | $0.0710 |
| Class C | 12/17/18 | $0.6580 | $0.0710 |
| Europe | 12/17/18 | $0.9764 | $0.0710 |
| Class I | 12/17/18 | $0.9799 | $0.0710 |
| Class Z | 12/17/18 | $1.0383 | $0.0710 |
| Fidelity Japan Fund | | | |
| Class A | 12/10/18 | $0.0000 | $0.0000 |
| Class M | 12/10/18 | $0.0000 | $0.0000 |
| Class C | 12/10/18 | $0.0000 | $0.0000 |
| Japan | 12/10/18 | $0.0644 | $0.0144 |
| Class I | 12/10/18 | $0.0564 | $0.0144 |
| Class Z | 12/10/18 | $0.0774 | $0.0144 |
| Fidelity Japan Smaller Companies Fund | | | |
| Japan Smaller Companies | 12/10/18 | $0.1515 | $0.0395 |
| Fidelity Latin America Fund | | | |
| Class A | 12/10/18 | $0.4609 | $0.0579 |
| Class M | 12/10/18 | $0.3889 | $0.0579 |
| Class C | 12/10/18 | $0.2459 | $0.0579 |
| Latin America | 12/10/18 | $0.5409 | $0.0579 |
| Class I | 12/10/18 | $0.5409 | $0.0579 |
| Class Z | 12/10/18 | $0.6009 | $0.0579 |
| Class A | 12/31/18 | $0.0200 | $0.0000 |
| Class M | 12/31/18 | $0.0200 | $0.0000 |
| Class C | 12/31/18 | $0.0200 | $0.0000 |
| Latin America | 12/31/18 | $0.0200 | $0.0000 |
| Class I | 12/31/18 | $0.0200 | $0.0000 |
| Class Z | 12/31/18 | $0.0200 | $0.0000 |
| Fidelity Nordic Fund | | | |
| Nordic | 12/10/18 | $1.0287 | $0.0527 |
| Fidelity Pacific Basin Fund | | | |
| Pacific Basin | 12/17/18 | $0.2445 | $0.0495 |
|
The funds will notify shareholders in January 2020 of amounts for use in preparing 2019 income tax returns.

TIF-ANN-1219
1.754542.119