UNITED STATES
SECURITIES AND EXCHANGE COMMISSION
Washington, D.C. 20549
FORM N-CSR
CERTIFIED SHAREHOLDER REPORT OF REGISTERED
MANAGEMENT INVESTMENT COMPANIES
Investment Company Act file number 811-04008
Fidelity Investment Trust
(Exact name of registrant as specified in charter)
245 Summer St., Boston, Massachusetts 02210
(Address of principal executive offices) (Zip code)
Cynthia Lo Bessette, Secretary
245 Summer St.
Boston, Massachusetts 02210
(Name and address of agent for service)
Registrant's telephone number, including area code:
617-563-7000
| |
Date of fiscal year end: | October 31 |
|
|
Date of reporting period: | October 31, 2020 |
Item 1.
Reports to Stockholders
Fidelity® International Small Cap Fund
Annual Report
October 31, 2020
Includes Fidelity and Fidelity Advisor share classes

See the inside front cover for important information about access to your fund’s shareholder reports.

Beginning on January 1, 2021, as permitted by regulations adopted by the Securities and Exchange Commission, paper copies of a fund’s shareholder reports will no longer be sent by mail, unless you specifically request paper copies of the reports from the fund or from your financial intermediary, such as a financial advisor, broker-dealer or bank. Instead, the reports will be made available on a website, and you will be notified by mail each time a report is posted and provided with a website link to access the report.
If you already elected to receive shareholder reports electronically, you will not be affected by this change and you need not take any action. You may elect to receive shareholder reports and other communications from a fund electronically, by contacting your financial intermediary. For Fidelity customers, visit Fidelity's web site or call Fidelity using the contact information listed below.
You may elect to receive all future reports in paper free of charge. If you wish to continue receiving paper copies of your shareholder reports, you may contact your financial intermediary or, if you are a Fidelity customer, visit Fidelity’s website, or call Fidelity at the applicable toll-free number listed below. Your election to receive reports in paper will apply to all funds held with the fund complex/your financial intermediary.
| Account Type | Website | Phone Number |
| Brokerage, Mutual Fund, or Annuity Contracts: | fidelity.com/mailpreferences | 1-800-343-3548 |
| Employer Provided Retirement Accounts: | netbenefits.fidelity.com/preferences (choose 'no' under Required Disclosures to continue to print) | 1-800-343-0860 |
| Advisor Sold Accounts Serviced Through Your Financial Intermediary: | Contact Your Financial Intermediary | Your Financial Intermediary's phone number |
| Advisor Sold Accounts Serviced by Fidelity: | institutional.fidelity.com | 1-877-208-0098 |
Contents
To view a fund's proxy voting guidelines and proxy voting record for the 12-month period ended June 30, visit http://www.fidelity.com/proxyvotingresults or visit the Securities and Exchange Commission's (SEC) web site at http://www.sec.gov.
You may also call 1-800-544-8544 if you’re an individual investing directly with Fidelity, call 1-800-835-5092 if you’re a plan sponsor or participant with Fidelity as your recordkeeper or call 1-877-208-0098 on institutional accounts or if you’re an advisor or invest through one to request a free copy of the proxy voting guidelines.
Standard & Poor's, S&P and S&P 500 are registered service marks of The McGraw-Hill Companies, Inc. and have been licensed for use by Fidelity Distributors Corporation.
Other third-party marks appearing herein are the property of their respective owners.
All other marks appearing herein are registered or unregistered trademarks or service marks of FMR LLC or an affiliated company. © 2020 FMR LLC. All rights reserved.
This report and the financial statements contained herein are submitted for the general information of the shareholders of the Fund. This report is not authorized for distribution to prospective investors in the Fund unless preceded or accompanied by an effective prospectus.
A fund files its complete schedule of portfolio holdings with the SEC for the first and third quarters of each fiscal year on Form N-PORT. Forms N-PORT are available on the SEC’s web site at http://www.sec.gov. A fund's Forms N-PORT may be reviewed and copied at the SEC’s Public Reference Room in Washington, DC. Information regarding the operation of the SEC's Public Reference Room may be obtained by calling 1-800-SEC-0330.
For a complete list of a fund's portfolio holdings, view the most recent holdings listing, semiannual report, or annual report on Fidelity's web site at http://www.fidelity.com, http://www.institutional.fidelity.com, or http://www.401k.com, as applicable.
NOT FDIC INSURED •MAY LOSE VALUE •NO BANK GUARANTEE
Neither the Fund nor Fidelity Distributors Corporation is a bank.
Note to Shareholders:
Early in 2020, the outbreak and spread of a new coronavirus emerged as a public health emergency that had a major influence on financial markets, primarily based on its impact on the global economy and the outlook for corporate earnings. The virus causes a respiratory disease known as COVID-19. On March 11, the World Health Organization declared the COVID-19 outbreak a pandemic, citing sustained risk of further global spread.
In the weeks following, as the crisis worsened, we witnessed an escalating human tragedy with wide-scale social and economic consequences from coronavirus-containment measures. The outbreak of COVID-19 prompted a number of measures to limit the spread, including travel and border restrictions, quarantines, and restrictions on large gatherings. In turn, these resulted in lower consumer activity, diminished demand for a wide range of products and services, disruption in manufacturing and supply chains, and – given the wide variability in outcomes regarding the outbreak – significant market uncertainty and volatility. Amid the turmoil, global governments and central banks took unprecedented action to help support consumers, businesses, and the broader economies, and to limit disruption to financial systems.
The situation continues to unfold, and the extent and duration of its impact on financial markets and the economy remain highly uncertain. Extreme events such as the coronavirus crisis are “exogenous shocks” that can have significant adverse effects on mutual funds and their investments. Although multiple asset classes may be affected by market disruption, the duration and impact may not be the same for all types of assets.
Fidelity is committed to helping you stay informed amid news about COVID-19 and during increased market volatility, and we’re taking extra steps to be responsive to customer needs. We encourage you to visit our websites, where we offer ongoing updates, commentary, and analysis on the markets and our funds.
Performance: The Bottom Line
Average annual total return reflects the change in the value of an investment, assuming reinvestment of distributions from dividend income and capital gains (the profits earned upon the sale of securities that have grown in value, if any) and assuming a constant rate of performance each year. The hypothetical investment and the average annual total returns do not reflect the deduction of taxes that a shareholder would pay on fund distributions or the redemption of fund shares. During periods of reimbursement by Fidelity, a fund’s total return will be greater than it would be had the reimbursement not occurred. How a fund did yesterday is no guarantee of how it will do tomorrow.
Average Annual Total Returns
| For the periods ended October 31, 2020 | Past 1 year | Past 5 years | Past 10 years |
| Class A (incl. 5.75% sales charge) | (9.43)% | 4.13% | 5.79% |
| Class M (incl. 3.50% sales charge) | (7.55)% | 4.31% | 5.75% |
| Class C (incl. contingent deferred sales charge) | (5.59)% | 4.56% | 5.63% |
| Fidelity® International Small Cap Fund | (3.61)% | 5.67% | 6.73% |
| Class I | (3.62)% | 5.67% | 6.78% |
| Class Z | (3.51)% | 5.73% | 6.81% |
Prior to April 1, 2014, the fund compared its performance to a different benchmark. The fund's historical performance may not represent its current investment policies.
Class C shares' contingent deferred sales charges included in the past one year, past five years and past ten years total return figures are 1%, 0% and 0%, respectively.
The initial offering of Class Z shares took place on October 2, 2018. Returns prior to October 2, 2018, are those of Class I.
$10,000 Over 10 Years
Let's say hypothetically that $10,000 was invested in Fidelity® International Small Cap Fund, a class of the fund, on October 31, 2010.
The chart shows how the value of your investment would have changed, and also shows how the MSCI ACWI (All Country World Index) ex USA Small Cap Index performed over the same period.
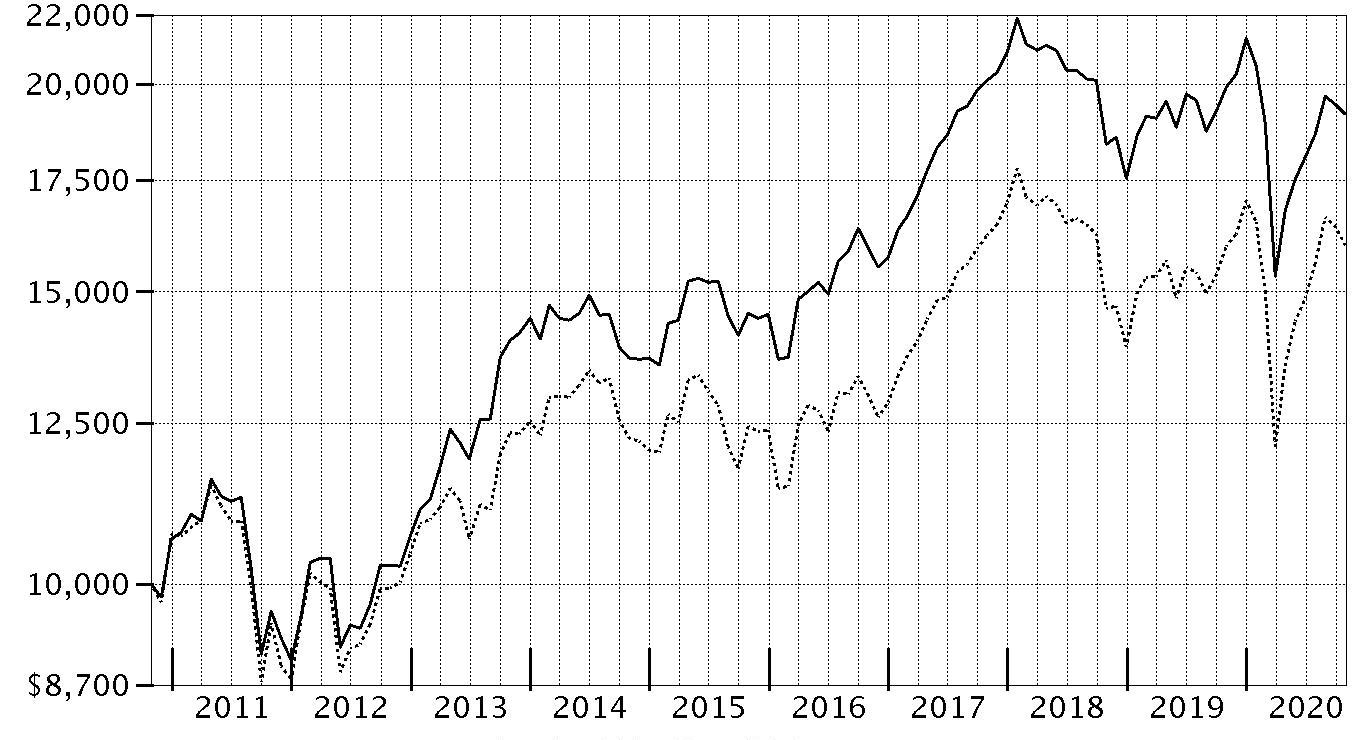
| Period Ending Values |
| $19,184 | Fidelity® International Small Cap Fund |
| $15,992 | MSCI ACWI (All Country World Index) ex USA Small Cap Index |
Management's Discussion of Fund Performance
Market Recap: The MSCI ACWI (All Country World Index) ex USA Index returned -2.46% for the 12 months ending October 31, 2020, in what was a bumpy ride for non-U.S. equities, marked by a steep but brief decline due to the early-2020 outbreak and spread of the coronavirus, followed by a sharp upturn. Declared a pandemic on March 11, the crisis and containment efforts caused broad contraction in economic activity, elevated volatility and dislocation in financial markets. A historically rapid and expansive monetary- and fiscal-policy response around the world provided a partial offset to the economic disruption. Other supporting factors included resilient corporate earnings and near-term potential for a COVID-19 vaccine breakthrough. This was evident in the index’s 12.28% gain in the final six months of the year. Currency fluctuation generally boosted foreign developed-markets equities for the year, while the reverse was true for emerging-markets stocks. Late in the period, the index was pressured by a second wave of COVID-19 cases in some regions, and stretched valuations and crowded positioning in big tech. For the full year, the U.K. (-22%), Asia Pacific ex Japan (-8%), Canada (-5%) and Europe ex U.K. (-4%) notably lagged. Emerging markets (+9%) and Japan (+1%) outperformed. By sector, energy (-38%), financials and real estate (-20% each) lagged, whereas information technology (+ 25%) and communication services (+15%) topped the index.
Comments from Portfolio Manager Sam Chamovitz: For the fiscal year ending October 31, 2020, the fund's share classes (excluding sales charges, if applicable) returned roughly -5% to -4%, underperforming the 0.19% result of the benchmark Fidelity International Small Cap Fund Linked Index. From a regional standpoint, stock picks in the U.K. and an underweighting in Europe ex U.K. hurt the fund's relative result. Among sectors, security selection was the primary detractor versus the benchmark, especially within the media & entertainment area of the communication services sector, followed by materials. The biggest individual relative detractor was an overweight position in Hyve (-87%), a stake that was not held at the end of the period. A second notable relative detractor was our overweighting in Cineworld (-73%), a position that was sold the past 12 months. Further hampering the portfolio’s relative return was an overweighting in John Wood (-34%), which was among the fund's largest holdings this period. Conversely, stock picks in Japan and Europe ex U.K., specifically Finland, contributed most to the fund's relative result. By sector, the primary contributor to performance versus the benchmark was our stock selection in industrials, especially within the transportation industry. The biggest individual relative contributor was an overweight position in Arcland Sakamoto (+64%), which also was among the fund’s largest holdings at period end. Adding additional value was our outsized stake in SITC International Holdings, which gained roughly 54%. SITC was among the fund's largest holdings this period. Another notable relative contributor was an overweighting in GMO Internet (+58%). Notable changes in positioning include decreased exposure to Australia and a higher allocation to China. By sector, meaningful changes in positioning include increased exposure to information technology and a lower allocation to consumer staples.
The views expressed above reflect those of the portfolio manager(s) only through the end of the period as stated on the cover of this report and do not necessarily represent the views of Fidelity or any other person in the Fidelity organization. Any such views are subject to change at any time based upon market or other conditions and Fidelity disclaims any responsibility to update such views. These views may not be relied on as investment advice and, because investment decisions for a Fidelity fund are based on numerous factors, may not be relied on as an indication of trading intent on behalf of any Fidelity fund.
Investment Summary (Unaudited)
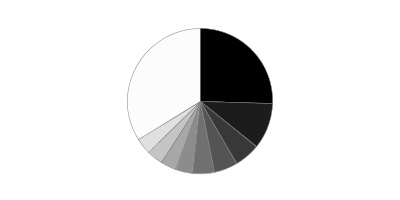
Geographic Diversification (% of fund's net assets)
| As of October 31, 2020 |
| | Japan | 25.6% |
| | United Kingdom | 10.3% |
| | United States of America* | 5.6% |
| | Canada | 5.3% |
| | Cayman Islands | 4.9% |
| | Netherlands | 3.7% |
| | Australia | 3.6% |
| | Taiwan | 3.5% |
| | Germany | 3.5% |
| | Other | 34.0% |
* Includes Short-Term investments and Net Other Assets (Liabilities).
Percentages are based on country or territory of incorporation and are adjusted for the effect of futures contracts, if applicable.
Asset Allocation as of October 31, 2020
| | % of fund's net assets |
| Stocks | 94.4 |
| Short-Term Investments and Net Other Assets (Liabilities) | 5.6 |
Top Ten Stocks as of October 31, 2020
| | % of fund's net assets |
| Arata Corp. (Japan, Distributors) | 1.5 |
| Renesas Electronics Corp. (Japan, Semiconductors & Semiconductor Equipment) | 1.4 |
| RHI Magnesita NV (Netherlands, Construction Materials) | 1.3 |
| Arc Land Sakamoto Co. Ltd. (Japan, Specialty Retail) | 1.3 |
| Persol Holdings Co., Ltd. (Japan, Professional Services) | 1.2 |
| S Foods, Inc. (Japan, Food Products) | 1.1 |
| Mytilineos SA (Greece, Industrial Conglomerates) | 1.0 |
| Irish Residential Properties REIT PLC (Ireland, Equity Real Estate Investment Trusts (REITs)) | 0.9 |
| Open Text Corp. (Canada, Software) | 0.9 |
| Wienerberger AG (Austria, Construction Materials) | 0.9 |
| | 11.5 |
Top Market Sectors as of October 31, 2020
| | % of fund's net assets |
| Industrials | 21.8 |
| Consumer Discretionary | 16.3 |
| Information Technology | 11.7 |
| Financials | 9.4 |
| Materials | 8.6 |
| Real Estate | 8.4 |
| Consumer Staples | 7.1 |
| Health Care | 6.4 |
| Energy | 2.4 |
| Communication Services | 2.3 |
Schedule of Investments October 31, 2020
Showing Percentage of Net Assets
| Common Stocks - 94.4% | | | |
| | | Shares | Value |
| Australia - 3.6% | | | |
| GUD Holdings Ltd. | | 1,121,398 | $10,003,276 |
| Hansen Technologies Ltd. | | 1,585,165 | 4,404,370 |
| Imdex Ltd. | | 14,094,051 | 11,939,205 |
| Inghams Group Ltd. | | 8,220,396 | 16,540,940 |
| Nanosonics Ltd. (a) | | 1,887,880 | 6,839,749 |
| National Storage (REIT) unit | | 9,904,479 | 12,570,105 |
| Servcorp Ltd. (b) | | 5,760,566 | 10,031,922 |
| SomnoMed Ltd. (a) | | 3,898,596 | 4,958,437 |
|
| TOTAL AUSTRALIA | | | 77,288,004 |
|
| Austria - 1.8% | | | |
| IMMOFINANZ Immobilien Anlagen AG (a) | | 240,507 | 3,221,224 |
| Mayr-Melnhof Karton AG | | 99,200 | 16,197,766 |
| Wienerberger AG | | 779,400 | 19,661,393 |
|
| TOTAL AUSTRIA | | | 39,080,383 |
|
| Belgium - 1.3% | | | |
| Econocom Group SA (a) | | 6,736,149 | 14,811,843 |
| Fagron NV | | 567,100 | 12,582,011 |
|
| TOTAL BELGIUM | | | 27,393,854 |
|
| Bermuda - 0.7% | | | |
| Hiscox Ltd. (a) | | 1,383,720 | 14,778,271 |
| Brazil - 0.6% | | | |
| Estacio Participacoes SA | | 2,966,000 | 11,847,562 |
| Canada - 5.3% | | | |
| CCL Industries, Inc. Class B | | 345,900 | 13,189,011 |
| Computer Modelling Group Ltd. | | 1,710,717 | 6,073,476 |
| ECN Capital Corp. | | 2,694,400 | 10,678,100 |
| Genesis Land Development Corp. (a)(b) | | 2,969,722 | 3,120,627 |
| Lassonde Industries, Inc. Class A (sub. vtg.) | | 162,199 | 18,505,027 |
| McCoy Global, Inc. (a)(c) | | 1,328,570 | 508,572 |
| North West Co., Inc. | | 565,400 | 13,940,847 |
| Open Text Corp. | | 536,496 | 19,711,386 |
| Richelieu Hardware Ltd. | | 293,600 | 7,893,682 |
| TFI International, Inc. (Canada) | | 198,000 | 8,815,852 |
| Total Energy Services, Inc. | | 610,400 | 907,147 |
| Western Forest Products, Inc. (c) | | 13,914,875 | 8,982,055 |
|
| TOTAL CANADA | | | 112,325,782 |
|
| Cayman Islands - 4.9% | | | |
| ASM Pacific Technology Ltd. | | 1,433,800 | 14,425,850 |
| Best Pacific International Holdings Ltd. | | 17,896,000 | 3,070,194 |
| China Metal Recycling (Holdings) Ltd. (a)(d) | | 436,800 | 1 |
| Haitian International Holdings Ltd. | | 5,242,000 | 12,982,444 |
| Impro Precision Industries Ltd. (e) | | 15,697,300 | 4,555,811 |
| Kangji Medical Holdings Ltd. | | 955,500 | 2,470,558 |
| Pico Far East Holdings Ltd. | | 56,047,231 | 8,097,117 |
| Precision Tsugami China Corp. Ltd. | | 12,908,453 | 11,572,235 |
| SITC International Holdings Co. Ltd. | | 11,547,000 | 17,813,882 |
| Value Partners Group Ltd. | | 19,272,000 | 8,402,368 |
| Wise Talent Information Technology Co. Ltd. (a) | | 1,610,400 | 3,955,113 |
| Xingda International Holdings Ltd. | | 66,561,755 | 17,171,688 |
|
| TOTAL CAYMAN ISLANDS | | | 104,517,261 |
|
| China - 1.9% | | | |
| Qingdao Port International Co. Ltd. (H Shares) (e) | | 26,533,000 | 15,059,039 |
| TravelSky Technology Ltd. (H Shares) | | 4,968,000 | 10,432,640 |
| Weifu High-Technology Group Co. Ltd. (B Shares) | | 7,725,486 | 14,230,257 |
|
| TOTAL CHINA | | | 39,721,936 |
|
| Denmark - 1.1% | | | |
| Jyske Bank A/S (Reg.) (a) | | 259,103 | 7,711,881 |
| Spar Nord Bank A/S | | 1,685,026 | 14,498,816 |
|
| TOTAL DENMARK | | | 22,210,697 |
|
| Finland - 0.3% | | | |
| Nanoform Finland PLC | | 521,700 | 2,489,936 |
| Olvi PLC (A Shares) | | 66,738 | 3,489,916 |
|
| TOTAL FINLAND | | | 5,979,852 |
|
| France - 3.1% | | | |
| Altarea SCA | | 87,864 | 11,256,389 |
| Lectra | | 427,112 | 9,819,386 |
| Maisons du Monde SA (a)(e) | | 857,201 | 11,470,917 |
| The Vicat Group | | 394,732 | 12,136,730 |
| Thermador Groupe SA | | 212,266 | 14,338,505 |
| Virbac SA (a) | | 32,600 | 7,585,924 |
|
| TOTAL FRANCE | | | 66,607,851 |
|
| Germany - 3.5% | | | |
| DIC Asset AG | | 1,137,600 | 13,090,070 |
| DWS Group GmbH & Co. KGaA (e) | | 272,000 | 9,235,861 |
| JOST Werke AG (a)(e) | | 515,572 | 19,334,842 |
| Takkt AG | | 1,324,330 | 14,035,666 |
| Talanx AG | | 615,167 | 18,111,963 |
|
| TOTAL GERMANY | | | 73,808,402 |
|
| Greece - 1.0% | | | |
| Mytilineos SA | | 2,000,916 | 21,858,841 |
| Hong Kong - 1.6% | | | |
| Dah Sing Banking Group Ltd. | | 9,607,600 | 8,253,675 |
| Far East Horizon Ltd. | | 11,169,000 | 10,963,701 |
| Magnificent Hotel Investment Ltd. | | 316,412,000 | 3,673,277 |
| Sino Land Ltd. | | 9,172,837 | 10,838,205 |
|
| TOTAL HONG KONG | | | 33,728,858 |
|
| India - 2.5% | | | |
| Cyient Ltd. | | 1,428,166 | 7,564,476 |
| Embassy Office Parks (REIT) | | 2,124,800 | 9,807,946 |
| L&T Technology Services Ltd. (e) | | 615,733 | 13,760,899 |
| Oberoi Realty Ltd. (a) | | 2,196,600 | 13,045,739 |
| Shriram Transport Finance Co. Ltd. | | 1,027,352 | 9,548,405 |
|
| TOTAL INDIA | | | 53,727,465 |
|
| Indonesia - 0.8% | | | |
| PT ACE Hardware Indonesia Tbk | | 61,050,100 | 6,510,115 |
| PT Selamat Sempurna Tbk | | 108,667,100 | 10,300,909 |
|
| TOTAL INDONESIA | | | 16,811,024 |
|
| Ireland - 2.4% | | | |
| Dalata Hotel Group PLC | | 2,992,503 | 8,434,229 |
| Irish Residential Properties REIT PLC | | 12,360,000 | 19,721,251 |
| Mincon Group PLC (b) | | 11,895,744 | 12,191,853 |
| United Drug PLC (United Kingdom) | | 1,094,300 | 10,285,164 |
|
| TOTAL IRELAND | | | 50,632,497 |
|
| Italy - 1.6% | | | |
| Banca Generali SpA | | 426,000 | 12,105,838 |
| MARR SpA | | 887,207 | 12,027,445 |
| Recordati SpA | | 166,611 | 8,632,995 |
|
| TOTAL ITALY | | | 32,766,278 |
|
| Japan - 25.6% | | | |
| Aeon Delight Co. Ltd. | | 627,500 | 16,519,501 |
| Amano Corp. | | 475,700 | 11,196,272 |
| Arata Corp. | | 643,800 | 31,286,898 |
| Arc Land Sakamoto Co. Ltd. | | 1,432,000 | 27,588,330 |
| Aucnet, Inc. | | 409,430 | 5,443,115 |
| Central Automotive Products Ltd. | | 374,100 | 7,287,044 |
| Daiichikosho Co. Ltd. | | 301,500 | 10,316,419 |
| DaikyoNishikawa Corp. | | 2,420,000 | 13,413,941 |
| Daiwa Industries Ltd. | | 1,532,100 | 13,757,161 |
| Dexerials Corp. | | 1,715,400 | 19,624,255 |
| Dip Corp. | | 544,400 | 10,459,750 |
| DTS Corp. | | 180,500 | 3,510,545 |
| GMO Internet, Inc. | | 503,600 | 13,432,147 |
| Inaba Denki Sangyo Co. Ltd. | | 500,100 | 12,039,136 |
| Isuzu Motors Ltd. | | 2,175,700 | 17,652,531 |
| IT Holdings Corp. | | 625,800 | 11,968,515 |
| Jm Holdings Co. Ltd. | | 236,500 | 5,379,492 |
| Kenedix, Inc. | | 3,250,800 | 16,845,908 |
| Maruwa Ceramic Co. Ltd. | | 90,900 | 9,456,186 |
| Meitec Corp. | | 206,100 | 10,217,448 |
| Mirait Holdings Corp. | | 510,200 | 7,263,281 |
| Mitani Shoji Co. Ltd. | | 254,500 | 16,047,529 |
| Nihon Parkerizing Co. Ltd. | | 1,951,000 | 19,227,255 |
| Nishimoto Co. Ltd. | | 510,000 | 9,123,722 |
| NOF Corp. | | 347,600 | 13,063,617 |
| NSD Co. Ltd. | | 826,200 | 14,511,918 |
| PALTAC Corp. | | 231,900 | 12,964,970 |
| Paramount Bed Holdings Co. Ltd. | | 306,700 | 11,816,491 |
| Persol Holdings Co., Ltd. | | 1,705,400 | 25,830,332 |
| Poletowin Pitcrew Holdings, Inc. | | 67,100 | 584,555 |
| Renesas Electronics Corp. (a) | | 3,568,500 | 29,456,730 |
| S Foods, Inc. | | 718,969 | 23,945,773 |
| San-Ai Oil Co. Ltd. | | 1,646,300 | 16,598,965 |
| Santen Pharmaceutical Co. Ltd. | | 441,700 | 7,869,326 |
| SG Holdings Co. Ltd. | | 357,600 | 8,625,469 |
| Shinsei Bank Ltd. | | 890,300 | 10,711,686 |
| Ship Healthcare Holdings, Inc. | | 268,500 | 12,740,956 |
| THK Co. Ltd. | | 566,400 | 15,035,039 |
| TKC Corp. | | 135,400 | 8,390,812 |
| Tsuruha Holdings, Inc. | | 61,600 | 8,625,542 |
| Yamada Consulting Group Co. Ltd. | | 420,580 | 4,048,345 |
|
| TOTAL JAPAN | | | 543,876,907 |
|
| Korea (South) - 0.8% | | | |
| Hyundai Fire & Marine Insurance Co. Ltd. | | 819,676 | 16,845,541 |
| Luxembourg - 1.3% | | | |
| B&M European Value Retail SA | | 2,077,700 | 13,049,169 |
| Stabilus SA | | 252,900 | 14,320,534 |
|
| TOTAL LUXEMBOURG | | | 27,369,703 |
|
| Mexico - 1.4% | | | |
| Credito Real S.A.B. de CV (a) | | 6,947,800 | 3,645,617 |
| Genomma Lab Internacional SA de CV (a) | | 13,960,448 | 12,379,890 |
| Gruma S.A.B. de CV Series B | | 711,100 | 7,563,410 |
| Qualitas Controladora S.A.B. de CV | | 1,391,602 | 5,557,486 |
|
| TOTAL MEXICO | | | 29,146,403 |
|
| Netherlands - 3.7% | | | |
| AerCap Holdings NV (a) | | 272,800 | 6,773,624 |
| Amsterdam Commodities NV | | 769,655 | 16,045,179 |
| Arcadis NV | | 555,458 | 12,938,283 |
| Intertrust NV (e) | | 753,700 | 11,674,696 |
| RHI Magnesita NV | | 863,774 | 28,646,892 |
| Van Lanschot NV (Bearer) | | 170,941 | 3,424,287 |
|
| TOTAL NETHERLANDS | | | 79,502,961 |
|
| New Zealand - 0.7% | | | |
| EBOS Group Ltd. | | 917,010 | 15,608,827 |
| Panama - 0.4% | | | |
| Intercorp Financial Services, Inc. | | 445,100 | 9,244,727 |
| Philippines - 1.4% | | | |
| Century Pacific Food, Inc. | | 35,943,000 | 11,484,371 |
| Jollibee Food Corp. | | 2,209,000 | 7,723,357 |
| Robinsons Land Corp. | | 36,623,700 | 11,306,767 |
|
| TOTAL PHILIPPINES | | | 30,514,495 |
|
| Romania - 0.5% | | | |
| Banca Transilvania SA | | 23,956,569 | 10,846,828 |
| Singapore - 2.1% | | | |
| Boustead Singapore Ltd. | | 12,196,612 | 6,256,373 |
| Hour Glass Ltd. | | 13,304,580 | 6,820,856 |
| HRnetgroup Ltd. | | 23,528,700 | 8,098,863 |
| Mapletree Industrial (REIT) | | 4,984,516 | 11,108,750 |
| Wing Tai Holdings Ltd. | | 9,005,500 | 11,802,561 |
|
| TOTAL SINGAPORE | | | 44,087,403 |
|
| Spain - 1.6% | | | |
| Cie Automotive SA | | 580,300 | 11,354,219 |
| Indra Sistemas SA (a)(c) | | 1,622,300 | 9,730,470 |
| Prosegur Compania de Seguridad SA (Reg.) | | 5,731,350 | 13,109,733 |
|
| TOTAL SPAIN | | | 34,194,422 |
|
| Sweden - 2.5% | | | |
| Dustin Group AB (e) | | 2,570,379 | 16,349,394 |
| Granges AB (c) | | 1,055,521 | 9,531,052 |
| HEXPOL AB (B Shares) | | 1,702,700 | 15,001,762 |
| John Mattson Fastighetsforetag (a) | | 690,600 | 11,625,897 |
|
| TOTAL SWEDEN | | | 52,508,105 |
|
| Taiwan - 3.5% | | | |
| King's Town Bank | | 5,227,000 | 7,079,809 |
| Lumax International Corp. Ltd. | | 4,827,600 | 10,630,878 |
| Makalot Industrial Co. Ltd. | | 1,149,000 | 7,610,734 |
| Sporton International, Inc. | | 1,141,740 | 9,099,120 |
| Test Research, Inc. | | 7,452,000 | 14,456,500 |
| Tripod Technology Corp. | | 3,257,000 | 12,921,441 |
| Yageo Corp. | | 562,000 | 6,983,502 |
| Yung Chi Paint & Varnish Manufacturing Co. Ltd. | | 2,538,000 | 6,156,706 |
|
| TOTAL TAIWAN | | | 74,938,690 |
|
| Thailand - 0.6% | | | |
| Star Petroleum Refining PCL | | 78,418,300 | 13,332,306 |
| United Kingdom - 10.3% | | | |
| Alliance Pharma PLC | | 17,191,210 | 16,369,341 |
| Anhui Heli Co. Ltd. ELS (UBS AG London Branch Bank Warrant Program) Class A warrants 1/21/22 (a)(e) | | 7,318,056 | 15,483,590 |
| Bodycote PLC | | 1,084,717 | 9,141,157 |
| Bond International Software PLC (a)(d) | | 899,666 | 12 |
| Dart Group PLC | | 798,000 | 8,792,546 |
| Dechra Pharmaceuticals PLC | | 70,195 | 3,175,542 |
| Informa PLC | | 1,836,386 | 9,944,379 |
| ITE Group PLC | | 7,909,617 | 5,225,924 |
| J.D. Weatherspoon PLC | | 1,431,200 | 15,982,511 |
| John Wood Group PLC | | 5,548,300 | 15,245,372 |
| Luxfer Holdings PLC sponsored | | 1,078,459 | 13,394,461 |
| McColl's Retail Group PLC (a)(b) | | 9,602,129 | 2,550,109 |
| Mears Group PLC (b) | | 7,279,440 | 9,949,193 |
| Moneysupermarket.com Group PLC | | 2,690,073 | 8,475,495 |
| On The Beach Group PLC (e) | | 2,741,500 | 7,635,968 |
| Savills PLC | | 1,082,400 | 11,659,702 |
| Ten Entertainment Group PLC (b) | | 5,588,511 | 9,701,487 |
| Tullett Prebon PLC | | 2,282,469 | 5,641,839 |
| Ultra Electronics Holdings PLC | | 457,781 | 11,149,439 |
| Victrex PLC | | 477,800 | 11,420,364 |
| Vistry Group PLC | | 1,497,297 | 10,571,628 |
| Volution Group PLC | | 6,747,742 | 16,958,898 |
|
| TOTAL UNITED KINGDOM | | | 218,468,957 |
|
| TOTAL COMMON STOCKS | | | |
| (Cost $2,043,152,006) | | | 2,005,571,093 |
|
| Money Market Funds - 5.1% | | | |
| Fidelity Cash Central Fund 0.10% (f) | | 99,945,509 | 99,965,498 |
| Fidelity Securities Lending Cash Central Fund 0.11% (f)(g) | | 9,808,960 | 9,809,941 |
| TOTAL MONEY MARKET FUNDS | | | |
| (Cost $109,770,680) | | | 109,775,439 |
| TOTAL INVESTMENT IN SECURITIES - 99.5% | | | |
| (Cost $2,152,922,686) | | | 2,115,346,532 |
| NET OTHER ASSETS (LIABILITIES) - 0.5% | | | 9,822,573 |
| NET ASSETS - 100% | | | $2,125,169,105 |
Categorizations in the Schedule of Investments are based on country or territory of incorporation.
Legend
(a) Non-income producing
(b) Affiliated company
(c) Security or a portion of the security is on loan at period end.
(d) Level 3 security
(e) Security exempt from registration under Rule 144A of the Securities Act of 1933. These securities may be resold in transactions exempt from registration, normally to qualified institutional buyers. At the end of the period, the value of these securities amounted to $124,561,017 or 5.9% of net assets.
(f) Affiliated fund that is generally available only to investment companies and other accounts managed by Fidelity Investments. The rate quoted is the annualized seven-day yield of the fund at period end. A complete unaudited listing of the fund's holdings as of its most recent quarter end is available upon request. In addition, each Fidelity Central Fund's financial statements, which are not covered by the Fund's Report of Independent Registered Public Accounting Firm, are available on the SEC's website or upon request.
(g) Investment made with cash collateral received from securities on loan.
Affiliated Central Funds
Information regarding fiscal year to date income earned by the Fund from investments in Fidelity Central Funds is as follows:
| Fund | Income earned |
| Fidelity Cash Central Fund | $686,300 |
| Fidelity Securities Lending Cash Central Fund | 133,463 |
| Total | $819,763 |
Amounts in the income column in the above table include any capital gain distributions from underlying funds, which are presented in the corresponding line-item in the Statement of Operations, if applicable. Amount for Fidelity Securities Lending Cash Central Fund represents the income earned on investing cash collateral, less rebates paid to borrowers and any lending agent fees associated with the loan, plus any premium payments received for lending certain types of securities.
Other Affiliated Issuers
An affiliated company is a company in which the Fund has ownership of at least 5% of the voting securities. Fiscal year to date transactions with companies which are or were affiliates are as follows:
| Affiliate | Value, beginning of period | Purchases | Sales Proceeds | Dividend Income | Realized Gain (loss) | Change in Unrealized appreciation (depreciation) | Value, end of period |
| Genesis Land Development Corp. | $4,820,743 | $524,036 | $-- | $-- | $-- | $(2,224,152) | $3,120,627 |
| Kirindo Holdings Co. Ltd. | 12,969,727 | -- | 6,753,793 | 233,565 | 14,652,975 | (6,266,990) | -- |
| McColl's Retail Group PLC | 5,671,782 | -- | -- | -- | -- | (3,121,673) | 2,550,109 |
| Mears Group PLC | 15,190,954 | 5,187,708 | 95,324 | -- | (292,019) | (10,042,126) | 9,949,193 |
| Mincon Group PLC | 10,176,939 | 2,795,655 | -- | 145,050 | -- | (780,741) | 12,191,853 |
| Servcorp Ltd. | 15,135,173 | 1,209,426 | -- | 680,934 | -- | (6,312,677) | 10,031,922 |
| SomnoMed Ltd. | 7,022,858 | 589,627 | 1,539,835 | -- | 150,313 | (1,264,526) | -- |
| Ten Entertainment Group PLC | 14,596,790 | 3,086,100 | 1,333,854 | 209,786 | 239,919 | (6,887,468) | 9,701,487 |
| Topps Tiles PLC | 6,354,270 | 3,738,943 | 6,144,682 | 194,979 | (4,310,841) | 362,310 | -- |
| | $91,939,236 | $17,131,495 | $15,867,488 | $1,464,314 | $10,440,347 | $(36,538,043) | $47,545,191 |
Investment Valuation
The following is a summary of the inputs used, as of October 31, 2020, involving the Fund's assets and liabilities carried at fair value. The inputs or methodology used for valuing securities may not be an indication of the risk associated with investing in those securities. For more information on valuation inputs, and their aggregation into the levels used below, please refer to the Investment Valuation section in the accompanying Notes to Financial Statements.
| | Valuation Inputs at Reporting Date: |
| Description | Total | Level 1 | Level 2 | Level 3 |
| Investments in Securities: | | | | |
| Equities: | | | | |
| Communication Services | $47,998,702 | $27,222,533 | $20,776,169 | $-- |
| Consumer Discretionary | 341,659,737 | 170,434,138 | 171,225,599 | -- |
| Consumer Staples | 149,221,773 | 74,121,933 | 75,099,840 | -- |
| Energy | 52,665,838 | 22,734,567 | 29,931,271 | -- |
| Financials | 197,286,699 | 160,181,067 | 37,105,632 | -- |
| Health Care | 135,805,147 | 73,500,803 | 62,304,344 | -- |
| Industrials | 467,332,514 | 294,349,548 | 172,982,966 | -- |
| Information Technology | 247,393,811 | 113,293,018 | 134,100,781 | 12 |
| Materials | 185,153,809 | 140,923,731 | 44,230,077 | 1 |
| Real Estate | 181,053,063 | 84,533,365 | 96,519,698 | -- |
| Money Market Funds | 109,775,439 | 109,775,439 | -- | -- |
| Total Investments in Securities: | $2,115,346,532 | $1,271,070,142 | $844,276,377 | $13 |
See accompanying notes which are an integral part of the financial statements.
Financial Statements
Statement of Assets and Liabilities
| | | October 31, 2020 |
| Assets | | |
Investment in securities, at value (including securities loaned of $9,280,645) — See accompanying schedule:
Unaffiliated issuers (cost $1,944,668,592) | $1,958,025,902 | |
| Fidelity Central Funds (cost $109,770,680) | 109,775,439 | |
| Other affiliated issuers (cost $98,483,414) | 47,545,191 | |
| Total Investment in Securities (cost $2,152,922,686) | | $2,115,346,532 |
| Cash | | 68,085 |
| Foreign currency held at value (cost $4,462,963) | | 4,461,946 |
| Receivable for investments sold | | 22,819,416 |
| Receivable for fund shares sold | | 7,985,840 |
| Dividends receivable | | 6,400,004 |
| Distributions receivable from Fidelity Central Funds | | 11,073 |
| Prepaid expenses | | 3,691 |
| Other receivables | | 94,680 |
| Total assets | | 2,157,191,267 |
| Liabilities | | |
| Payable for investments purchased | $16,865,086 | |
| Payable for fund shares redeemed | 2,572,047 | |
| Accrued management fee | 1,386,077 | |
| Distribution and service plan fees payable | 45,023 | |
| Other affiliated payables | 372,109 | |
| Other payables and accrued expenses | 975,973 | |
| Collateral on securities loaned | 9,805,847 | |
| Total liabilities | | 32,022,162 |
| Net Assets | | $2,125,169,105 |
| Net Assets consist of: | | |
| Paid in capital | | $2,195,752,679 |
| Total accumulated earnings (loss) | | (70,583,574) |
| Net Assets | | $2,125,169,105 |
| Net Asset Value and Maximum Offering Price | | |
| Class A: | | |
| Net Asset Value and redemption price per share ($92,044,353 ÷ 3,719,369 shares)(a) | | $24.75 |
| Maximum offering price per share (100/94.25 of $24.75) | | $26.26 |
| Class M: | | |
| Net Asset Value and redemption price per share ($12,492,173 ÷ 507,392 shares)(a) | | $24.62 |
| Maximum offering price per share (100/96.50 of $24.62) | | $25.51 |
| Class C: | | |
| Net Asset Value and offering price per share ($17,659,308 ÷ 741,999 shares)(a) | | $23.80 |
| International Small Cap: | | |
| Net Asset Value, offering price and redemption price per share ($1,122,746,396 ÷ 44,417,532 shares) | | $25.28 |
| Class I: | | |
| Net Asset Value, offering price and redemption price per share ($605,099,527 ÷ 23,788,043 shares) | | $25.44 |
| Class Z: | | |
| Net Asset Value, offering price and redemption price per share ($275,127,348 ÷ 10,819,016 shares) | | $25.43 |
(a) Redemption price per share is equal to net asset value less any applicable contingent deferred sales charge.
See accompanying notes which are an integral part of the financial statements.
Statement of Operations
| | | Year ended October 31, 2020 |
| Investment Income | | |
| Dividends (including $1,464,314 earned from other affiliated issuers) | | $58,026,127 |
| Income from Fidelity Central Funds (including $133,463 from security lending) | | 819,763 |
| Income before foreign taxes withheld | | 58,845,890 |
| Less foreign taxes withheld | | (4,490,651) |
| Total income | | 54,355,239 |
| Expenses | | |
| Management fee | | |
| Basic fee | $18,604,679 | |
| Performance adjustment | (293,584) | |
| Transfer agent fees | 3,683,712 | |
| Distribution and service plan fees | 533,335 | |
| Accounting fees | 979,800 | |
| Custodian fees and expenses | 365,924 | |
| Independent trustees' fees and expenses | 12,925 | |
| Registration fees | 200,977 | |
| Audit | 101,397 | |
| Legal | 3,658 | |
| Miscellaneous | 104,631 | |
| Total expenses before reductions | 24,297,454 | |
| Expense reductions | (340,410) | |
| Total expenses after reductions | | 23,957,044 |
| Net investment income (loss) | | 30,398,195 |
| Realized and Unrealized Gain (Loss) | | |
| Net realized gain (loss) on: | | |
| Investment securities: | | |
| Unaffiliated issuers (net of foreign taxes of $198,052) | (34,721,092) | |
| Fidelity Central Funds | 11,194 | |
| Other affiliated issuers | 10,440,347 | |
| Foreign currency transactions | (266,226) | |
| Total net realized gain (loss) | | (24,535,777) |
| Change in net unrealized appreciation (depreciation) on: | | |
| Investment securities: | | |
| Unaffiliated issuers (net of increase in deferred foreign taxes of $699,882) | (104,510,346) | |
| Fidelity Central Funds | (4,139) | |
| Other affiliated issuers | (36,538,043) | |
| Assets and liabilities in foreign currencies | 60,423 | |
| Total change in net unrealized appreciation (depreciation) | | (140,992,105) |
| Net gain (loss) | | (165,527,882) |
| Net increase (decrease) in net assets resulting from operations | | $(135,129,687) |
See accompanying notes which are an integral part of the financial statements.
Statement of Changes in Net Assets
| | Year ended October 31, 2020 | Year ended October 31, 2019 |
| Increase (Decrease) in Net Assets | | |
| Operations | | |
| Net investment income (loss) | $30,398,195 | $46,988,829 |
| Net realized gain (loss) | (24,535,777) | 12,739,673 |
| Change in net unrealized appreciation (depreciation) | (140,992,105) | 117,471,715 |
| Net increase (decrease) in net assets resulting from operations | (135,129,687) | 177,200,217 |
| Distributions to shareholders | (60,415,664) | (106,530,925) |
| Share transactions - net increase (decrease) | (130,456,723) | 413,223,659 |
| Total increase (decrease) in net assets | (326,002,074) | 483,892,951 |
| Net Assets | | |
| Beginning of period | 2,451,171,179 | 1,967,278,228 |
| End of period | $2,125,169,105 | $2,451,171,179 |
See accompanying notes which are an integral part of the financial statements.
Financial Highlights
Fidelity International Small Cap Fund Class A
| Years ended October 31, | 2020 | 2019 | 2018 | 2017 | 2016 |
| Selected Per–Share Data | | | | | |
| Net asset value, beginning of period | $26.32 | $25.78 | $29.24 | $23.81 | $22.69 |
| Income from Investment Operations | | | | | |
| Net investment income (loss)A | .27 | .49 | .38 | .29 | .34 |
| Net realized and unrealized gain (loss) | (1.26) | 1.43 | (2.87) | 5.70 | 1.64 |
| Total from investment operations | (.99) | 1.92 | (2.49) | 5.99 | 1.98 |
| Distributions from net investment income | (.44) | (.38) | (.23) | (.28) | (.25) |
| Distributions from net realized gain | (.14) | (1.00) | (.74) | (.29) | (.62) |
| Total distributions | (.58) | (1.38) | (.97) | (.57) | (.87) |
| Redemption fees added to paid in capitalA | – | – | –B | .01 | .01 |
| Net asset value, end of period | $24.75 | $26.32 | $25.78 | $29.24 | $23.81 |
| Total ReturnC,D | (3.91)% | 8.00% | (8.83)% | 25.83% | 9.11% |
| Ratios to Average Net AssetsE,F | | | | | |
| Expenses before reductions | 1.36% | 1.47% | 1.49% | 1.55% | 1.61% |
| Expenses net of fee waivers, if any | 1.36% | 1.47% | 1.49% | 1.55% | 1.61% |
| Expenses net of all reductions | 1.35% | 1.46% | 1.48% | 1.55% | 1.61% |
| Net investment income (loss) | 1.09% | 1.94% | 1.33% | 1.11% | 1.50% |
| Supplemental Data | | | | | |
| Net assets, end of period (000 omitted) | $92,044 | $105,786 | $80,395 | $63,459 | $36,480 |
| Portfolio turnover rateG | 43% | 28% | 25% | 22% | 29% |
A Calculated based on average shares outstanding during the period.
B Amount represents less than $.005 per share.
C Total returns would have been lower if certain expenses had not been reduced during the applicable periods shown.
D Total returns do not include the effect of the sales charges.
E Fees and expenses of any underlying mutual funds or exchange-traded funds (ETFs) are not included in the Fund's expense ratio. The Fund indirectly bears its proportionate share of these expenses. For additional expense information related to investments in Fidelity Central Funds, please refer to the "Investments in Fidelity Central Funds" note found in the Notes to Financial Statements section of the most recent Annual or Semi-Annual report.
F Expense ratios reflect operating expenses of the class. Expenses before reductions do not reflect amounts reimbursed, waived, or reduced through arrangements with the investment adviser, brokerage services, or other offset arrangements, if applicable, and do not represent the amount paid by the class during periods when reimbursements, waivers or reductions occur.
G Amount does not include the portfolio activity of any underlying mutual funds or exchange-traded funds (ETFs).
See accompanying notes which are an integral part of the financial statements.
Fidelity International Small Cap Fund Class M
| Years ended October 31, | 2020 | 2019 | 2018 | 2017 | 2016 |
| Selected Per–Share Data | | | | | |
| Net asset value, beginning of period | $26.18 | $25.62 | $29.07 | $23.65 | $22.55 |
| Income from Investment Operations | | | | | |
| Net investment income (loss)A | .19 | .41 | .30 | .21 | .27 |
| Net realized and unrealized gain (loss) | (1.25) | 1.43 | (2.86) | 5.69 | 1.63 |
| Total from investment operations | (1.06) | 1.84 | (2.56) | 5.90 | 1.90 |
| Distributions from net investment income | (.36) | (.27) | (.15) | (.19) | (.19) |
| Distributions from net realized gain | (.14) | (1.00) | (.74) | (.29) | (.62) |
| Total distributions | (.50) | (1.28)B | (.89) | (.48) | (.81) |
| Redemption fees added to paid in capitalA | – | – | –C | –C | .01 |
| Net asset value, end of period | $24.62 | $26.18 | $25.62 | $29.07 | $23.65 |
| Total ReturnD,E | (4.19)% | 7.65% | (9.10)% | 25.47% | 8.79% |
| Ratios to Average Net AssetsF,G | | | | | |
| Expenses before reductions | 1.67% | 1.78% | 1.77% | 1.84% | 1.90% |
| Expenses net of fee waivers, if any | 1.67% | 1.78% | 1.77% | 1.84% | 1.90% |
| Expenses net of all reductions | 1.65% | 1.77% | 1.76% | 1.84% | 1.90% |
| Net investment income (loss) | .78% | 1.62% | 1.05% | .82% | 1.21% |
| Supplemental Data | | | | | |
| Net assets, end of period (000 omitted) | $12,492 | $16,013 | $16,362 | $18,148 | $13,331 |
| Portfolio turnover rateH | 43% | 28% | 25% | 22% | 29% |
A Calculated based on average shares outstanding during the period.
B Total distributions per share do not sum due to rounding.
C Amount represents less than $.005 per share.
D Total returns would have been lower if certain expenses had not been reduced during the applicable periods shown.
E Total returns do not include the effect of the sales charges.
F Fees and expenses of any underlying mutual funds or exchange-traded funds (ETFs) are not included in the Fund's expense ratio. The Fund indirectly bears its proportionate share of these expenses. For additional expense information related to investments in Fidelity Central Funds, please refer to the "Investments in Fidelity Central Funds" note found in the Notes to Financial Statements section of the most recent Annual or Semi-Annual report.
G Expense ratios reflect operating expenses of the class. Expenses before reductions do not reflect amounts reimbursed, waived, or reduced through arrangements with the investment adviser, brokerage services, or other offset arrangements, if applicable, and do not represent the amount paid by the class during periods when reimbursements, waivers or reductions occur.
H Amount does not include the portfolio activity of any underlying mutual funds or exchange-traded funds (ETFs).
See accompanying notes which are an integral part of the financial statements.
Fidelity International Small Cap Fund Class C
| Years ended October 31, | 2020 | 2019 | 2018 | 2017 | 2016 |
| Selected Per–Share Data | | | | | |
| Net asset value, beginning of period | $25.27 | $24.77 | $28.21 | $22.97 | $21.96 |
| Income from Investment Operations | | | | | |
| Net investment income (loss)A | .08 | .28 | .16 | .08 | .16 |
| Net realized and unrealized gain (loss) | (1.23) | 1.39 | (2.76) | 5.53 | 1.59 |
| Total from investment operations | (1.15) | 1.67 | (2.60) | 5.61 | 1.75 |
| Distributions from net investment income | (.18) | (.17) | (.10) | (.08) | (.13) |
| Distributions from net realized gain | (.14) | (1.00) | (.74) | (.29) | (.62) |
| Total distributions | (.32) | (1.17) | (.84) | (.37) | (.75) |
| Redemption fees added to paid in capitalA | – | – | –B | –B | .01 |
| Net asset value, end of period | $23.80 | $25.27 | $24.77 | $28.21 | $22.97 |
| Total ReturnC,D | (4.65)% | 7.17% | (9.51)% | 24.85% | 8.26% |
| Ratios to Average Net AssetsE,F | | | | | |
| Expenses before reductions | 2.13% | 2.24% | 2.24% | 2.33% | 2.40% |
| Expenses net of fee waivers, if any | 2.13% | 2.24% | 2.24% | 2.33% | 2.40% |
| Expenses net of all reductions | 2.11% | 2.23% | 2.23% | 2.32% | 2.39% |
| Net investment income (loss) | .32% | 1.16% | .58% | .33% | .71% |
| Supplemental Data | | | | | |
| Net assets, end of period (000 omitted) | $17,659 | $23,937 | $41,918 | $26,005 | $12,187 |
| Portfolio turnover rateG | 43% | 28% | 25% | 22% | 29% |
A Calculated based on average shares outstanding during the period.
B Amount represents less than $.005 per share.
C Total returns would have been lower if certain expenses had not been reduced during the applicable periods shown.
D Total returns do not include the effect of the contingent deferred sales charge.
E Fees and expenses of any underlying mutual funds or exchange-traded funds (ETFs) are not included in the Fund's expense ratio. The Fund indirectly bears its proportionate share of these expenses. For additional expense information related to investments in Fidelity Central Funds, please refer to the "Investments in Fidelity Central Funds" note found in the Notes to Financial Statements section of the most recent Annual or Semi-Annual report.
F Expense ratios reflect operating expenses of the class. Expenses before reductions do not reflect amounts reimbursed, waived, or reduced through arrangements with the investment adviser, brokerage services, or other offset arrangements, if applicable, and do not represent the amount paid by the class during periods when reimbursements, waivers or reductions occur.
G Amount does not include the portfolio activity of any underlying mutual funds or exchange-traded funds (ETFs).
See accompanying notes which are an integral part of the financial statements.
Fidelity International Small Cap Fund
| Years ended October 31, | 2020 | 2019 | 2018 | 2017 | 2016 |
| Selected Per–Share Data | | | | | |
| Net asset value, beginning of period | $26.86 | $26.29 | $29.77 | $24.23 | $23.06 |
| Income from Investment Operations | | | | | |
| Net investment income (loss)A | .34 | .57 | .48 | .37 | .40 |
| Net realized and unrealized gain (loss) | (1.27) | 1.45 | (2.93) | 5.79 | 1.67 |
| Total from investment operations | (.93) | 2.02 | (2.45) | 6.16 | 2.07 |
| Distributions from net investment income | (.51) | (.45) | (.29) | (.34) | (.29) |
| Distributions from net realized gain | (.14) | (1.00) | (.74) | (.29) | (.62) |
| Total distributions | (.65) | (1.45) | (1.03) | (.63) | (.91) |
| Redemption fees added to paid in capitalA | – | – | –B | .01 | .01 |
| Net asset value, end of period | $25.28 | $26.86 | $26.29 | $29.77 | $24.23 |
| Total ReturnC | (3.61)% | 8.27% | (8.54)% | 26.18% | 9.39% |
| Ratios to Average Net AssetsD,E | | | | | |
| Expenses before reductions | 1.08% | 1.19% | 1.20% | 1.25% | 1.34% |
| Expenses net of fee waivers, if any | 1.08% | 1.19% | 1.20% | 1.25% | 1.34% |
| Expenses net of all reductions | 1.07% | 1.18% | 1.19% | 1.24% | 1.33% |
| Net investment income (loss) | 1.37% | 2.22% | 1.62% | 1.41% | 1.77% |
| Supplemental Data | | | | | |
| Net assets, end of period (000 omitted) | $1,122,746 | $1,282,412 | $1,256,193 | $1,418,452 | $906,420 |
| Portfolio turnover rateF | 43% | 28% | 25% | 22% | 29% |
A Calculated based on average shares outstanding during the period.
B Amount represents less than $.005 per share.
C Total returns would have been lower if certain expenses had not been reduced during the applicable periods shown.
D Fees and expenses of any underlying mutual funds or exchange-traded funds (ETFs) are not included in the Fund's expense ratio. The Fund indirectly bears its proportionate share of these expenses. For additional expense information related to investments in Fidelity Central Funds, please refer to the "Investments in Fidelity Central Funds" note found in the Notes to Financial Statements section of the most recent Annual or Semi-Annual report.
E Expense ratios reflect operating expenses of the class. Expenses before reductions do not reflect amounts reimbursed, waived, or reduced through arrangements with the investment adviser, brokerage services, or other offset arrangements, if applicable, and do not represent the amount paid by the class during periods when reimbursements, waivers or reductions occur.
F Amount does not include the portfolio activity of any underlying mutual funds or exchange-traded funds (ETFs).
See accompanying notes which are an integral part of the financial statements.
Fidelity International Small Cap Fund Class I
| Years ended October 31, | 2020 | 2019 | 2018 | 2017 | 2016 |
| Selected Per–Share Data | | | | | |
| Net asset value, beginning of period | $27.03 | $26.45 | $29.97 | $24.42 | $23.24 |
| Income from Investment Operations | | | | | |
| Net investment income (loss)A | .35 | .58 | .47 | .38 | .41 |
| Net realized and unrealized gain (loss) | (1.28) | 1.46 | (2.95) | 5.82 | 1.69 |
| Total from investment operations | (.93) | 2.04 | (2.48) | 6.20 | 2.10 |
| Distributions from net investment income | (.52) | (.46) | (.30) | (.37) | (.31) |
| Distributions from net realized gain | (.14) | (1.00) | (.74) | (.29) | (.62) |
| Total distributions | (.66) | (1.46) | (1.04) | (.66) | (.93) |
| Redemption fees added to paid in capitalA | – | – | –B | .01 | .01 |
| Net asset value, end of period | $25.44 | $27.03 | $26.45 | $29.97 | $24.42 |
| Total ReturnC | (3.62)% | 8.28% | (8.58)% | 26.17% | 9.43% |
| Ratios to Average Net AssetsD,E | | | | | |
| Expenses before reductions | 1.08% | 1.19% | 1.21% | 1.28% | 1.31% |
| Expenses net of fee waivers, if any | 1.08% | 1.18% | 1.21% | 1.28% | 1.31% |
| Expenses net of all reductions | 1.06% | 1.18% | 1.20% | 1.27% | 1.31% |
| Net investment income (loss) | 1.38% | 2.22% | 1.61% | 1.39% | 1.80% |
| Supplemental Data | | | | | |
| Net assets, end of period (000 omitted) | $605,100 | $777,771 | $564,988 | $237,469 | $22,727 |
| Portfolio turnover rateF | 43% | 28% | 25% | 22% | 29% |
A Calculated based on average shares outstanding during the period.
B Amount represents less than $.005 per share.
C Total returns would have been lower if certain expenses had not been reduced during the applicable periods shown.
D Fees and expenses of any underlying mutual funds or exchange-traded funds (ETFs) are not included in the Fund's expense ratio. The Fund indirectly bears its proportionate share of these expenses. For additional expense information related to investments in Fidelity Central Funds, please refer to the "Investments in Fidelity Central Funds" note found in the Notes to Financial Statements section of the most recent Annual or Semi-Annual report.
E Expense ratios reflect operating expenses of the class. Expenses before reductions do not reflect amounts reimbursed, waived, or reduced through arrangements with the investment adviser, brokerage services, or other offset arrangements, if applicable, and do not represent the amount paid by the class during periods when reimbursements, waivers or reductions occur.
F Amount does not include the portfolio activity of any underlying mutual funds or exchange-traded funds (ETFs).
See accompanying notes which are an integral part of the financial statements.
Fidelity International Small Cap Fund Class Z
| Years ended October 31, | 2020 | 2019 | 2018 A |
| Selected Per–Share Data | | | |
| Net asset value, beginning of period | $27.03 | $26.46 | $28.78 |
| Income from Investment Operations | | | |
| Net investment income (loss)B | .38 | .61 | .03 |
| Net realized and unrealized gain (loss) | (1.28) | 1.47 | (2.35) |
| Total from investment operations | (.90) | 2.08 | (2.32) |
| Distributions from net investment income | (.56) | (.50) | – |
| Distributions from net realized gain | (.14) | (1.00) | – |
| Total distributions | (.70) | (1.51)C | – |
| Net asset value, end of period | $25.43 | $27.03 | $26.46 |
| Total ReturnD,E | (3.51)% | 8.44% | (8.06)% |
| Ratios to Average Net AssetsF,G | | | |
| Expenses before reductions | .94% | 1.05% | 1.15%H |
| Expenses net of fee waivers, if any | .94% | 1.05% | 1.15%H |
| Expenses net of all reductions | .93% | 1.04% | 1.14%H |
| Net investment income (loss) | 1.51% | 2.35% | 2.01%H |
| Supplemental Data | | | |
| Net assets, end of period (000 omitted) | $275,127 | $245,252 | $7,421 |
| Portfolio turnover rateI | 43% | 28% | 25% |
A For the period October 2, 2018 (commencement of sale of shares) to October 31, 2018.
B Calculated based on average shares outstanding during the period.
C Total distributions per share do not sum due to rounding.
D Total returns for periods of less than one year are not annualized.
E Total returns would have been lower if certain expenses had not been reduced during the applicable periods shown.
F Fees and expenses of any underlying mutual funds or exchange-traded funds (ETFs) are not included in the Fund's expense ratio. The Fund indirectly bears its proportionate share of these expenses. For additional expense information related to investments in Fidelity Central Funds, please refer to the "Investments in Fidelity Central Funds" note found in the Notes to Financial Statements section of the most recent Annual or Semi-Annual report.
G Expense ratios reflect operating expenses of the class. Expenses before reductions do not reflect amounts reimbursed, waived, or reduced through arrangements with the investment adviser, brokerage services, or other offset arrangements, if applicable, and do not represent the amount paid by the class during periods when reimbursements, waivers or reductions occur.
H Annualized
I Amount does not include the portfolio activity of any underlying mutual funds or exchange-traded funds (ETFs).
See accompanying notes which are an integral part of the financial statements.
Notes to Financial Statements
For the period ended October 31, 2020
1. Organization.
Fidelity International Small Cap Fund (the Fund) is a fund of Fidelity Investment Trust (the Trust) and is authorized to issue an unlimited number of shares. The Trust is registered under the Investment Company Act of 1940, as amended (the 1940 Act), as an open-end management investment company organized as a Massachusetts business trust. The Fund offers Class A, Class M, Class C, International Small Cap, Class I and Class Z shares, each of which has equal rights as to assets and voting privileges. Each class has exclusive voting rights with respect to matters that affect that class. Class C shares will automatically convert to Class A shares after a holding period of ten years from the initial date of purchase, with certain exceptions. The Fund's investments in emerging markets can be subject to social, economic, regulatory, and political uncertainties and can be extremely volatile.
Effective January 1, 2020:
Investment advisers Fidelity Investments Money Management, Inc., FMR Co., Inc., and Fidelity SelectCo, LLC, merged with and into Fidelity Management & Research Company. In connection with the merger transactions, the resulting, merged investment adviser was then redomiciled from Massachusetts to Delaware, changed its corporate structure from a corporation to a limited liability company, and changed its name to "Fidelity Management & Research Company LLC".
Broker-dealer Fidelity Distributors Corporation merged with and into Fidelity Investments Institutional Services Company, Inc. ("FIISC"). FIISC was then redomiciled from Massachusetts to Delaware, changed its corporate structure from a corporation to a limited liability company, and changed its name to "Fidelity Distributors Company LLC".
Fidelity Investments Institutional Operations Company, Inc. converted from a Massachusetts corporation to a Massachusetts LLC, and changed its name to "Fidelity Investments Institutional Operations Company LLC".
2. Investments in Fidelity Central Funds.
The Fund invests in Fidelity Central Funds, which are open-end investment companies generally available only to other investment companies and accounts managed by the investment adviser and its affiliates. The Fund's Schedule of Investments lists each of the Fidelity Central Funds held as of period end, if any, as an investment of the Fund, but does not include the underlying holdings of each Fidelity Central Fund. As an Investing Fund, the Fund indirectly bears its proportionate share of the expenses of the underlying Fidelity Central Funds.
The Money Market Central Funds seek preservation of capital and current income and are managed by the investment adviser. Annualized expenses of the Money Market Central Funds as of their most recent shareholder report date ranged from less than .005% to .01%.
A complete unaudited list of holdings for each Fidelity Central Fund is available upon request or at the Securities and Exchange Commission (the SEC) website at www.sec.gov. In addition, the financial statements of the Fidelity Central Funds, which are not covered by the Fund's Report of Independent Registered Public Accounting Firm, are available on the SEC website or upon request.
3. Significant Accounting Policies.
The Fund is an investment company and applies the accounting and reporting guidance of the Financial Accounting Standards Board (FASB) Accounting Standards Codification Topic 946 Financial Services – Investment Companies. The financial statements have been prepared in conformity with accounting principles generally accepted in the United States of America (GAAP), which require management to make certain estimates and assumptions at the date of the financial statements. Actual results could differ from those estimates. Subsequent events, if any, through the date that the financial statements were issued have been evaluated in the preparation of the financial statements. The following summarizes the significant accounting policies of the Fund:
Investment Valuation. Investments are valued as of 4:00 p.m. Eastern time on the last calendar day of the period. The Board of Trustees (the Board) has delegated the day to day responsibility for the valuation of the Fund's investments to the Fair Value Committee (the Committee) established by the Fund's investment adviser. In accordance with valuation policies and procedures approved by the Board, the Fund attempts to obtain prices from one or more third party pricing vendors or brokers to value its investments. When current market prices, quotations or currency exchange rates are not readily available or reliable, investments will be fair valued in good faith by the Committee, in accordance with procedures adopted by the Board. Factors used in determining fair value vary by investment type and may include market or investment specific events. The frequency with which these procedures are used cannot be predicted and they may be utilized to a significant extent. The Committee oversees the Fund's valuation policies and procedures and reports to the Board on the Committee's activities and fair value determinations. The Board monitors the appropriateness of the procedures used in valuing the Fund's investments and ratifies the fair value determinations of the Committee.
The Fund categorizes the inputs to valuation techniques used to value its investments into a disclosure hierarchy consisting of three levels as shown below:
- Level 1 – quoted prices in active markets for identical investments
- Level 2 – other significant observable inputs (including quoted prices for similar investments, interest rates, prepayment speeds, etc.)
- Level 3 – unobservable inputs (including the Fund's own assumptions based on the best information available)
Valuation techniques used to value the Fund's investments by major category are as follows:
Equity securities, including restricted securities, for which market quotations are readily available, are valued at the last reported sale price or official closing price as reported by a third party pricing vendor on the primary market or exchange on which they are traded and are categorized as Level 1 in the hierarchy. In the event there were no sales during the day or closing prices are not available, securities are valued at the last quoted bid price or may be valued using the last available price and are generally categorized as Level 2 in the hierarchy. For foreign equity securities, when market or security specific events arise, comparisons to the valuation of American Depositary Receipts (ADRs), futures contracts, Exchange-Traded Funds (ETFs) and certain indexes as well as quoted prices for similar securities may be used and would be categorized as Level 2 in the hierarchy. For equity securities, including restricted securities, where observable inputs are limited, assumptions about market activity and risk are used and these securities may be categorized as Level 3 in the hierarchy.
Investments in open-end mutual funds, including the Fidelity Central Funds, are valued at their closing net asset value (NAV) each business day and are categorized as Level 1 in the hierarchy.
Changes in valuation techniques may result in transfers in or out of an assigned level within the disclosure hierarchy. The aggregate value of investments by input level as of October 31, 2020 is included at the end of the Fund's Schedule of Investments.
Foreign Currency. Certain Funds may use foreign currency contracts to facilitate transactions in foreign-denominated securities. Gains and losses from these transactions may arise from changes in the value of the foreign currency or if the counterparties do not perform under the contracts' terms.
Foreign-denominated assets, including investment securities, and liabilities are translated into U.S. dollars at the exchange rates at period end. Purchases and sales of investment securities, income and dividends received, and expenses denominated in foreign currencies are translated into U.S. dollars at the exchange rate in effect on the transaction date.
The effects of exchange rate fluctuations on investments are included with the net realized and unrealized gain (loss) on investment securities. Other foreign currency transactions resulting in realized and unrealized gain (loss) are disclosed separately.
Investment Transactions and Income. For financial reporting purposes, the Fund's investment holdings and NAV include trades executed through the end of the last business day of the period. The NAV per share for processing shareholder transactions is calculated as of the close of business of the New York Stock Exchange (NYSE), normally 4:00 p.m. Eastern time and includes trades executed through the end of the prior business day. Gains and losses on securities sold are determined on the basis of identified cost. Dividend income is recorded on the ex-dividend date, except for certain dividends from foreign securities where the ex-dividend date may have passed, which are recorded as soon as the Fund is informed of the ex-dividend date. Non-cash dividends included in dividend income, if any, are recorded at the fair market value of the securities received. Income and capital gain distributions from Fidelity Central Funds, if any, are recorded on the ex-dividend date. Certain distributions received by the Fund represent a return of capital or capital gain. The Fund determines the components of these distributions subsequent to the ex-dividend date, based upon receipt of tax filings or other correspondence relating to the underlying investment. These distributions are recorded as a reduction of cost of investments and/or as a realized gain. Investment income is recorded net of foreign taxes withheld where recovery of such taxes is uncertain.
Class Allocations and Expenses. Investment income, realized and unrealized capital gains and losses, common expenses of the Fund, and certain fund-level expense reductions, if any, are allocated daily on a pro-rata basis to each class based on the relative net assets of each class to the total net assets of the Fund. Each class differs with respect to transfer agent and distribution and service plan fees incurred. Certain expense reductions may also differ by class. For the reporting period, the allocated portion of income and expenses to each class as a percent of its average net assets may vary due to the timing of recording these transactions in relation to fluctuating net assets of the classes. Expenses directly attributable to a fund are charged to that fund. Expenses attributable to more than one fund are allocated among the respective funds on the basis of relative net assets or other appropriate methods. Expense estimates are accrued in the period to which they relate and adjustments are made when actual amounts are known.
Income Tax Information and Distributions to Shareholders. Each year, the Fund intends to qualify as a regulated investment company under Subchapter M of the Internal Revenue Code, including distributing substantially all of its taxable income and realized gains. As a result, no provision for U.S. Federal income taxes is required. As of October 31, 2020, the Fund did not have any unrecognized tax benefits in the financial statements; nor is the Fund aware of any tax positions for which it is reasonably possible that the total amounts of unrecognized tax benefits will significantly change in the next twelve months. The Fund files a U.S. federal tax return, in addition to state and local tax returns as required. The Fund's federal income tax returns are subject to examination by the Internal Revenue Service (IRS) for a period of three fiscal years after they are filed. State and local tax returns may be subject to examination for an additional fiscal year depending on the jurisdiction. Foreign taxes are provided for based on the Fund's understanding of the tax rules and rates that exist in the foreign markets in which it invests. The Fund is subject to a tax imposed on capital gains by certain countries in which it invests. An estimated deferred tax liability for net unrealized appreciation on the applicable securities is included in Other payables and accrued expenses on the Statement of Assets & Liabilities.
Distributions are declared and recorded on the ex-dividend date. Income and capital gain distributions are declared separately for each class. Income and capital gain distributions are determined in accordance with income tax regulations, which may differ from GAAP. In addition, the Fund claimed a portion of the payment made to redeeming shareholders as a distribution for income tax purposes.
Capital accounts within the financial statements are adjusted for permanent book-tax differences. These adjustments have no impact on net assets or the results of operations. Capital accounts are not adjusted for temporary book-tax differences which will reverse in a subsequent period.
Book-tax differences are primarily due to foreign currency transactions, certain foreign taxes, passive foreign investment companies (PFIC) and losses deferred due to wash sales.
As of period end, the cost and unrealized appreciation (depreciation) in securities, and derivatives if applicable, for federal income tax purposes were as follows:
| Gross unrealized appreciation | $307,757,837 |
| Gross unrealized depreciation | (366,876,886) |
| Net unrealized appreciation (depreciation) | $(59,119,049) |
| Tax Cost | $2,174,465,581 |
The tax-based components of distributable earnings as of period end were as follows:
| Undistributed ordinary income | $17,300,543 |
| Capital loss carryforward | $(27,943,647) |
| Net unrealized appreciation (depreciation) on securities and other investments | $(59,067,058) |
Capital loss carryforwards are only available to offset future capital gains of the Fund to the extent provided by regulations and may be limited. The capital loss carryforward information presented below, including any applicable limitation, is estimated as of fiscal period end and is subject to adjustment.
| No expiration | |
| Short-term | $(13,887,532) |
| Long-term | (14,056,115) |
| Total capital loss carryforward | $(27,943,647) |
The tax character of distributions paid was as follows:
| | October 31, 2020 | October 31, 2019 |
| Ordinary Income | $56,242,686 | $ 32,698,873 |
| Long-term Capital Gains | 4,172,978 | 73,832,052 |
| Total | $60,415,664 | $ 106,530,925 |
Restricted Securities (including Private Placements). The Fund may invest in securities that are subject to legal or contractual restrictions on resale. These securities generally may be resold in transactions exempt from registration or to the public if the securities are registered. Disposal of these securities may involve time-consuming negotiations and expense, and prompt sale at an acceptable price may be difficult. Information regarding restricted securities is included at the end of the Fund's Schedule of Investments.
4. Purchases and Sales of Investments.
Purchases and sales of securities, other than short-term securities, are noted in the table below.
| | Purchases ($) | Sales ($) |
| Fidelity International Small Cap Fund | 918,214,123 | 1,087,311,601 |
5. Fees and Other Transactions with Affiliates.
Management Fee. Fidelity Management & Research Company LLC (the investment adviser) and its affiliates provide the Fund with investment management related services for which the Fund pays a monthly management fee. The management fee is the sum of an individual fund fee rate that is based on an annual rate of .60% of the Fund's average net assets and an annualized group fee rate that averaged .23% during the period. The group fee rate is based upon the monthly average net assets of a group of registered investment companies with which the investment adviser has management contracts. The group fee rate decreases as assets under management increase and increases as assets under management decrease. In addition, the management fee is subject to a performance adjustment (up to a maximum of +/- .20 % of the Fund's average net assets over a 36 month performance period). The upward or downward adjustment to the management fee is based on relative investment performance of International Small Cap as compared to its benchmark index, the MSCI ACWI (All Country World Index) ex USA Small Cap Index, over the same 36 month performance period. For the reporting period, the total annual management fee rate, including the performance adjustment, was .82% of the Fund's average net assets. The performance adjustment included in the management fee rate may be higher or lower than the maximum performance adjustment rate due to the difference between the average net assets for the reporting and performance periods.
Distribution and Service Plan Fees. In accordance with Rule 12b-1 of the 1940 Act, the Fund has adopted separate Distribution and Service Plans for each class of shares. Certain classes pay Fidelity Distributors Company LLC (FDC), an affiliate of the investment adviser, separate Distribution and Service Fees, each of which is based on an annual percentage of each class' average net assets. In addition, FDC may pay financial intermediaries for selling shares of the Fund and providing shareholder support services. For the period, the Distribution and Service Fee rates, total fees and amounts retained by FDC were as follows:
| | Distribution Fee | Service Fee | Total Fees | Retained by FDC |
| Class A | -% | .25% | $259,392 | $5,202 |
| Class M | .25% | .25% | 69,876 | 178 |
| Class C | .75% | .25% | 204,067 | 32,520 |
| | | | $533,335 | $37,900 |
Sales Load. FDC may receive a front-end sales charge of up to 5.75% for selling Class A shares and 3.50% for selling Class M shares, some of which is paid to financial intermediaries for selling shares of the Fund. Depending on the holding period, FDC may receive contingent deferred sales charges levied on Class A, Class M and Class C redemptions. The deferred sales charges are 1.00% for Class C shares, 1.00% for certain purchases of Class A shares and .25% for certain purchases of Class M shares.
For the period, sales charge amounts retained by FDC were as follows:
| | Retained by FDC |
| Class A | $23,590 |
| Class M | 2,023 |
| Class C(a) | 3,493 |
| | $29,106 |
(a) When Class C shares are initially sold, FDC pays commissions from its own resources to financial intermediaries through which the sales are made.
Transfer Agent Fees. Fidelity Investments Institutional Operations Company LLC (FIIOC), an affiliate of the investment adviser, is the transfer, dividend disbursing and shareholder servicing agent for each class of the Fund. FIIOC receives account fees and asset-based fees that vary according to the account size and type of account of the shareholders of the respective classes of the Fund, except for Class Z. FIIOC receives an asset-based fee of Class Z's average net assets. FIIOC pays for typesetting, printing and mailing of shareholder reports, except proxy statements. Effective February 1, 2020, the Board approved to change the fee for Class Z from .046% to .044%.
For the period, transfer agent fees for each class were as follows:
| | Amount | % of Class-Level Average Net Assets |
| Class A | $217,465 | .21 |
| Class M | 36,933 | .27 |
| Class C | 45,505 | .22 |
| International Small Cap | 2,090,350 | .18 |
| Class I | 1,174,786 | .18 |
| Class Z | 118,673 | .04 |
| | $3,683,712 | |
Accounting Fees. Fidelity Service Company, Inc. (FSC), an affiliate of the investment adviser, maintains the Fund's accounting records. The accounting fee is based on the level of average net assets for each month. For the period, the fees were equivalent to the following annual rates:
| | % of Average Net Assets |
| Fidelity International Small Cap Fund | .04 |
Brokerage Commissions. A portion of portfolio transactions were placed with brokerage firms which are affiliates of the investment adviser. Brokerage commissions are included in net realized gain (loss) and change in net unrealized appreciation (depreciation) in the Statement of Operations. The commissions paid to these affiliated firms were as follows:
| | Amount |
| Fidelity International Small Cap Fund | $358 |
Interfund Trades. Funds may purchase from or sell securities to other Fidelity Funds under procedures adopted by the Board. The procedures have been designed to ensure these interfund trades are executed in accordance with Rule 17a-7 of the 1940 Act. Interfund trades are included within the respective purchases and sales amounts shown in the Purchases and Sales of Investments note.
6. Committed Line of Credit.
Certain Funds participate with other funds managed by the investment adviser or an affiliate in a $4.25 billion credit facility (the "line of credit") to be utilized for temporary or emergency purposes to fund shareholder redemptions or for other short-term liquidity purposes. The participating funds have agreed to pay commitment fees on their pro-rata portion of the line of credit, which are reflected in Miscellaneous expenses on the Statement of Operations, and are as follows:
| | Amount |
| Fidelity International Small Cap Fund | $5,331 |
During the period, there were no borrowings on this line of credit.
7. Security Lending.
Funds lend portfolio securities from time to time in order to earn additional income. Lending agents are used, including National Financial Services (NFS), an affiliate of the investment adviser. Pursuant to a securities lending agreement, NFS will receive a fee, which is capped at 9.9% of a fund's daily lending revenue, for its services as lending agent. A fund may lend securities to certain qualified borrowers, including NFS. On the settlement date of the loan, a fund receives collateral (in the form of U.S. Treasury obligations, letters of credit and/or cash) against the loaned securities and maintains collateral in an amount not less than 100% of the market value of the loaned securities during the period of the loan. The market value of the loaned securities is determined at the close of business of a fund and any additional required collateral is delivered to a fund on the next business day. A fund or borrower may terminate the loan at any time, and if the borrower defaults on its obligation to return the securities loaned because of insolvency or other reasons, a fund may apply collateral received from the borrower against the obligation. A fund may experience delays and costs in recovering the securities loaned. Any cash collateral received is invested in the Fidelity Securities Lending Cash Central Fund. Any loaned securities are identified as such in the Schedule of Investments, and the value of loaned securities and cash collateral at period end, as applicable, are presented in the Statement of Assets and Liabilities. Security lending income represents the income earned on investing cash collateral, less rebates paid to borrowers and any lending agent fees associated with the loan, plus any premium payments received for lending certain types of securities. Security lending income is presented in the Statement of Operations as a component of income from Fidelity Central Funds. Affiliated security lending activity, if any, was as follows:
| | Total Security Lending Income Fees Paid to NFS | Security Lending Income From Securities Loaned to NFS | Value of Securities Loaned to NFS at Period End |
| Fidelity International Small Cap Fund | $5 | $– | $– |
8. Expense Reductions.
Commissions paid to certain brokers with whom the investment adviser, or its affiliates, places trades on behalf of the Fund include an amount in addition to trade execution, which may be rebated back to the Fund to offset certain expenses. This amount totaled $317,213 for the period. In addition, through arrangements with the Fund's custodian, credits realized as a result of certain uninvested cash balances were used to reduce the Fund's expenses. During the period, custodian credits reduced the Fund's expenses by $557.
In addition, during the period the investment adviser or an affiliate reimbursed and/or waived a portion of fund-level operating expenses in the amount of $10,420.
In addition, during the period the investment adviser or an affiliate reimbursed the Fund $12,220 for an operational error which is included in the accompanying Statement of Operations.
9. Distributions to Shareholders.
Distributions to shareholders of each class were as follows:
| | Year ended
October 31, 2020 | Year ended
October 31, 2019 |
| Distributions to shareholders | | |
| Class A | $2,384,232 | $4,227,273 |
| Class M | 304,208 | 800,268 |
| Class C | 295,806 | 1,885,280 |
| International Small Cap | 31,519,090 | 68,518,204 |
| Class I | 18,753,159 | 29,933,675 |
| Class Z | 7,159,169 | 1,166,225 |
| Total | $60,415,664 | $106,530,925 |
10. Share Transactions.
Share transactions for each class were as follows and may contain automatic conversions between classes or exchanges between affiliated funds:
| | Shares | Shares | Dollars | Dollars |
| | Year ended October 31, 2020 | Year ended October 31, 2019 | Year ended October 31, 2020 | Year ended October 31, 2019 |
| Class A | | | | |
| Shares sold | 2,524,897 | 2,237,245 | $59,510,790 | $54,946,164 |
| Reinvestment of distributions | 87,479 | 171,183 | 2,326,940 | 4,094,693 |
| Shares redeemed | (2,912,683) | (1,507,211) | (69,359,325) | (37,924,113) |
| Net increase (decrease) | (300,307) | 901,217 | $(7,521,595) | $21,116,744 |
| Class M | | | | |
| Shares sold | 65,170 | 98,480 | $1,616,133 | $2,472,682 |
| Reinvestment of distributions | 11,416 | 33,142 | 302,969 | 790,760 |
| Shares redeemed | (180,814) | (158,670) | (4,251,620) | (3,947,659) |
| Net increase (decrease) | (104,228) | (27,048) | $(2,332,518) | $(684,217) |
| Class C | | | | |
| Shares sold | 138,385 | 177,459 | $3,407,389 | $4,292,617 |
| Reinvestment of distributions | 11,407 | 81,103 | 293,855 | 1,875,111 |
| Shares redeemed | (355,222) | (1,003,566) | (8,126,021) | (24,351,495) |
| Net increase (decrease) | (205,430) | (745,004) | $(4,424,777) | $(18,183,767) |
| International Small Cap | | | | |
| Shares sold | 12,818,627 | 14,687,346 | $314,903,517 | $373,563,417 |
| Reinvestment of distributions | 1,085,455 | 2,618,248 | 29,415,824 | 63,754,337 |
| Shares redeemed | (17,225,026) | (17,355,424) | (409,514,236) | (442,220,464) |
| Net increase (decrease) | (3,320,944) | (49,830) | $(65,194,895) | $(4,902,710) |
| Class I | | | | |
| Shares sold | 13,046,234 | 22,250,461 | $317,826,804 | $571,039,816 |
| Reinvestment of distributions | 668,307 | 1,167,331 | 18,231,405 | 28,611,283 |
| Shares redeemed | (18,698,646) | (16,004,841) | (440,114,911) | (410,930,116) |
| Net increase (decrease) | (4,984,105) | 7,412,951 | $(104,056,702) | $188,720,983 |
| Class Z | | | | |
| Shares sold | 6,570,577 | 9,825,331 | $164,218,517 | $254,217,793 |
| Reinvestment of distributions | 213,836 | 39,558 | 5,822,753 | 967,979 |
| Shares redeemed | (5,039,772) | (1,071,017) | (116,967,506) | (28,029,146) |
| Net increase (decrease) | 1,744,641 | 8,793,872 | $53,073,764 | $227,156,626 |
11. Other.
The Fund's organizational documents provide former and current trustees and officers with a limited indemnification against liabilities arising in connection with the performance of their duties to the Fund. In the normal course of business, the Fund may also enter into contracts that provide general indemnifications. The Fund's maximum exposure under these arrangements is unknown as this would be dependent on future claims that may be made against the Fund. The risk of material loss from such claims is considered remote.
12. Coronavirus (COVID-19) Pandemic.
An outbreak of COVID-19 first detected in China during December 2019 has since spread globally and was declared a pandemic by the World Health Organization during March 2020. Developments that disrupt global economies and financial markets, such as the COVID-19 pandemic, may magnify factors that affect the Fund's performance.
Report of Independent Registered Public Accounting Firm
To the Board of Trustees of Fidelity Investment Trust and Shareholders of Fidelity International Small Cap Fund:
Opinion on the Financial Statements and Financial Highlights
We have audited the accompanying statement of assets and liabilities of Fidelity International Small Cap Fund (the "Fund"), a fund of Fidelity Investment Trust, including the schedule of investments, as of October 31, 2020, the related statement of operations for the year then ended, the statement of changes in net assets for each of the two years in the period then ended, the financial highlights for each of the five years in the period then ended, and the related notes. In our opinion, the financial statements and financial highlights present fairly, in all material respects, the financial position of the Fund as of October 31, 2020, and the results of its operations for the year then ended, the changes in its net assets for each of the two years in the period then ended, and the financial highlights for each of the five years in the period then ended in conformity with accounting principles generally accepted in the United States of America.
Basis for Opinion
These financial statements and financial highlights are the responsibility of the Fund's management. Our responsibility is to express an opinion on the Fund's financial statements and financial highlights based on our audits. We are a public accounting firm registered with the Public Company Accounting Oversight Board (United States) (PCAOB) and are required to be independent with respect to the Fund in accordance with the U.S. federal securities laws and the applicable rules and regulations of the Securities and Exchange Commission and the PCAOB.
We conducted our audits in accordance with the standards of the PCAOB. Those standards require that we plan and perform the audit to obtain reasonable assurance about whether the financial statements and financial highlights are free of material misstatement, whether due to error or fraud. The Fund is not required to have, nor were we engaged to perform, an audit of its internal control over financial reporting. As part of our audits we are required to obtain an understanding of internal control over financial reporting but not for the purpose of expressing an opinion on the effectiveness of the Fund’s internal control over financial reporting. Accordingly, we express no such opinion.
Our audits included performing procedures to assess the risks of material misstatement of the financial statements and financial highlights, whether due to error or fraud, and performing procedures that respond to those risks. Such procedures included examining, on a test basis, evidence regarding the amounts and disclosures in the financial statements and financial highlights. Our audits also included evaluating the accounting principles used and significant estimates made by management, as well as evaluating the overall presentation of the financial statements and financial highlights. Our procedures included confirmation of securities owned as of October 31, 2020, by correspondence with the custodian and brokers; when replies were not received from brokers, we performed other auditing procedures. We believe that our audits provide a reasonable basis for our opinion.
/s/ Deloitte & Touche LLP
Boston, Massachusetts
December 11, 2020
We have served as the auditor of one or more of the Fidelity investment companies since 1999.
Trustees and Officers
The Trustees, Members of the Advisory Board (if any), and officers of the trust and fund, as applicable, are listed below. The Board of Trustees governs the fund and is responsible for protecting the interests of shareholders. The Trustees are experienced executives who meet periodically throughout the year to oversee the fund's activities, review contractual arrangements with companies that provide services to the fund, oversee management of the risks associated with such activities and contractual arrangements, and review the fund's performance. Except for Jonathan Chiel, each of the Trustees oversees 305 funds. Mr. Chiel oversees 176 funds.
The Trustees hold office without limit in time except that (a) any Trustee may resign; (b) any Trustee may be removed by written instrument, signed by at least two-thirds of the number of Trustees prior to such removal; (c) any Trustee who requests to be retired or who has become incapacitated by illness or injury may be retired by written instrument signed by a majority of the other Trustees; and (d) any Trustee may be removed at any special meeting of shareholders by a two-thirds vote of the outstanding voting securities of the trust. Each Trustee who is not an interested person (as defined in the 1940 Act) of the trust and the fund is referred to herein as an Independent Trustee. Each Independent Trustee shall retire not later than the last day of the calendar year in which his or her 75th birthday occurs. The Independent Trustees may waive this mandatory retirement age policy with respect to individual Trustees. Officers and Advisory Board Members hold office without limit in time, except that any officer or Advisory Board Member may resign or may be removed by a vote of a majority of the Trustees at any regular meeting or any special meeting of the Trustees. Except as indicated, each individual has held the office shown or other offices in the same company for the past five years.
The fund's Statement of Additional Information (SAI) includes more information about the Trustees. To request a free copy, call Fidelity at 1-800-544-8544 if you’re an individual investing directly with Fidelity, call 1-800-835-5092 if you’re a plan sponsor or participant with Fidelity as your recordkeeper or call 1-877-208-0098 on institutional accounts or if you’re an advisor or invest through one.
Experience, Skills, Attributes, and Qualifications of the Trustees. The Governance and Nominating Committee has adopted a statement of policy that describes the experience, qualifications, attributes, and skills that are necessary and desirable for potential Independent Trustee candidates (Statement of Policy). The Board believes that each Trustee satisfied at the time he or she was initially elected or appointed a Trustee, and continues to satisfy, the standards contemplated by the Statement of Policy. The Governance and Nominating Committee also engages professional search firms to help identify potential Independent Trustee candidates who have the experience, qualifications, attributes, and skills consistent with the Statement of Policy. From time to time, additional criteria based on the composition and skills of the current Independent Trustees, as well as experience or skills that may be appropriate in light of future changes to board composition, business conditions, and regulatory or other developments, have also been considered by the professional search firms and the Governance and Nominating Committee. In addition, the Board takes into account the Trustees' commitment and participation in Board and committee meetings, as well as their leadership of standing and ad hoc committees throughout their tenure.
In determining that a particular Trustee was and continues to be qualified to serve as a Trustee, the Board has considered a variety of criteria, none of which, in isolation, was controlling. The Board believes that, collectively, the Trustees have balanced and diverse experience, qualifications, attributes, and skills, which allow the Board to operate effectively in governing the fund and protecting the interests of shareholders. Information about the specific experience, skills, attributes, and qualifications of each Trustee, which in each case led to the Board's conclusion that the Trustee should serve (or continue to serve) as a trustee of the fund, is provided below.
Board Structure and Oversight Function. Robert A. Lawrence is an interested person and currently serves as Acting Chairman. The Trustees have determined that an interested Chairman is appropriate and benefits shareholders because an interested Chairman has a personal and professional stake in the quality and continuity of services provided to the fund. Independent Trustees exercise their informed business judgment to appoint an individual of their choosing to serve as Chairman, regardless of whether the Trustee happens to be independent or a member of management. The Independent Trustees have determined that they can act independently and effectively without having an Independent Trustee serve as Chairman and that a key structural component for assuring that they are in a position to do so is for the Independent Trustees to constitute a substantial majority for the Board. The Independent Trustees also regularly meet in executive session. Ned C. Lautenbach and David M. Thomas serve as Co-Lead Independent Trustees and as such each (i) acts as a liaison between the Independent Trustees and management with respect to matters important to the Independent Trustees and (ii) with management prepares agendas for Board meetings.
Fidelity® funds are overseen by different Boards of Trustees. The fund's Board oversees Fidelity's high income and certain equity funds, and other Boards oversee Fidelity's investment-grade bond, money market, asset allocation, and other equity funds. The asset allocation funds may invest in Fidelity® funds overseen by the fund's Board. The use of separate Boards, each with its own committee structure, allows the Trustees of each group of Fidelity® funds to focus on the unique issues of the funds they oversee, including common research, investment, and operational issues. On occasion, the separate Boards establish joint committees to address issues of overlapping consequences for the Fidelity® funds overseen by each Board.
The Trustees operate using a system of committees to facilitate the timely and efficient consideration of all matters of importance to the Trustees, the fund, and fund shareholders and to facilitate compliance with legal and regulatory requirements and oversight of the fund's activities and associated risks. The Board, acting through its committees, has charged FMR and its affiliates with (i) identifying events or circumstances the occurrence of which could have demonstrably adverse effects on the fund's business and/or reputation; (ii) implementing processes and controls to lessen the possibility that such events or circumstances occur or to mitigate the effects of such events or circumstances if they do occur; and (iii) creating and maintaining a system designed to evaluate continuously business and market conditions in order to facilitate the identification and implementation processes described in (i) and (ii) above. Because the day-to-day operations and activities of the fund are carried out by or through FMR, its affiliates, and other service providers, the fund's exposure to risks is mitigated but not eliminated by the processes overseen by the Trustees. While each of the Board's committees has responsibility for overseeing different aspects of the fund's activities, oversight is exercised primarily through the Operations, Audit, and Compliance Committees. Appropriate personnel, including but not limited to the fund's Chief Compliance Officer (CCO), FMR's internal auditor, the independent accountants, the fund's Treasurer and portfolio management personnel, make periodic reports to the Board's committees, as appropriate, including an annual review of Fidelity's risk management program for the Fidelity® funds. The responsibilities of each standing committee, including their oversight responsibilities, are described further under "Standing Committees of the Trustees."
Interested Trustees*:
Correspondence intended for a Trustee who is an interested person may be sent to Fidelity Investments, 245 Summer Street, Boston, Massachusetts 02210.
Name, Year of Birth; Principal Occupations and Other Relevant Experience+
Jonathan Chiel (1957)
Year of Election or Appointment: 2016
Trustee
Mr. Chiel also serves as Trustee of other Fidelity® funds. Mr. Chiel is Executive Vice President and General Counsel for FMR LLC (diversified financial services company, 2012-present). Previously, Mr. Chiel served as general counsel (2004-2012) and senior vice president and deputy general counsel (2000-2004) for John Hancock Financial Services; a partner with Choate, Hall & Stewart (1996-2000) (law firm); and an Assistant United States Attorney for the United States Attorney’s Office of the District of Massachusetts (1986-95), including Chief of the Criminal Division (1993-1995). Mr. Chiel is a director on the boards of the Boston Bar Foundation and the Maimonides School.
Robert A. Lawrence (1952)
Year of Election or Appointment: 2020
Trustee
Acting Chairman of the Board of Trustees
Mr. Lawrence also serves as Trustee of other funds. Previously, Mr. Lawrence served as a Member of the Advisory Board of certain funds. Prior to his retirement in 2008, Mr. Lawrence served as Vice President of certain Fidelity® funds (2006-2008), Senior Vice President, Head of High Income Division of Fidelity Management & Research Company (investment adviser firm, 2006-2008), and President of Fidelity Strategic Investments (investment adviser firm, 2002-2005).
* Determined to be an “Interested Trustee” by virtue of, among other things, his or her affiliation with the trust or various entities under common control with FMR.
+ The information includes the Trustee's principal occupation during the last five years and other information relating to the experience, attributes, and skills relevant to the Trustee's qualifications to serve as a Trustee, which led to the conclusion that the Trustee should serve as a Trustee for the fund.
Independent Trustees:
Correspondence intended for an Independent Trustee may be sent to Fidelity Investments, P.O. Box 55235, Boston, Massachusetts 02205-5235.
Name, Year of Birth; Principal Occupations and Other Relevant Experience+
Dennis J. Dirks (1948)
Year of Election or Appointment: 2005
Trustee
Mr. Dirks also serves as Trustee of other Fidelity® funds. Prior to his retirement in May 2003, Mr. Dirks served as Chief Operating Officer and as a member of the Board of The Depository Trust & Clearing Corporation (financial markets infrastructure), President, Chief Operating Officer and a member of the Board of The Depository Trust Company (DTC), President and a member of the Board of the National Securities Clearing Corporation (NSCC), Chief Executive Officer and a member of the Board of the Government Securities Clearing Corporation and Chief Executive Officer and a member of the Board of the Mortgage-Backed Securities Clearing Corporation. Mr. Dirks currently serves as a member of the Finance Committee (2016-present) and Board (2017-present) and is Treasurer (2018-present) of the Asolo Repertory Theatre.
Donald F. Donahue (1950)
Year of Election or Appointment: 2018
Trustee
Mr. Donahue also serves as Trustee of other Fidelity® funds. Mr. Donahue serves as President and Chief Executive Officer of Miranda Partners, LLC (risk consulting for the financial services industry, 2012-present). Previously, Mr. Donahue served as Chief Executive Officer (2006-2012), Chief Operating Officer (2003-2006) and Managing Director, Customer Marketing and Development (1999-2003) of The Depository Trust & Clearing Corporation (financial markets infrastructure). Mr. Donahue currently serves as a member (2007-present) and Co-Chairman (2016-present) of the Board of United Way of New York, a member of the Board of NYC Leadership Academy (2012-present) and a member of the Board of Advisors of Ripple Labs, Inc. (financial services, 2015-present). Mr. Donahue previously served as a member of the Advisory Board of certain Fidelity® funds (2015-2018).
Vicki L. Fuller (1957)
Year of Election or Appointment: 2020
Trustee
Ms. Fuller also serves as Trustee of other Fidelity® funds. Previously, Ms. Fuller served as a member of the Advisory Board of certain Fidelity® funds (2018-2020), Chief Investment Officer of the New York State Common Retirement Fund (2012-2018) and held a variety of positions at AllianceBernstein L.P. (global asset management, 1985-2012), including Managing Director (2006-2012) and Senior Vice President and Senior Portfolio Manager (2001-2006). Ms. Fuller currently serves as a member of the Board, Audit Committee and Nominating and Governance Committee of The Williams Companies, Inc. (natural gas infrastructure, 2018-present), as a member of the Board, Audit Committee and Nominating and Governance Committee of two Blackstone business development companies (2020-present) and as a member of the Board of Treliant, LLC (consulting, 2019-present).
Patricia L. Kampling (1959)
Year of Election or Appointment: 2020
Trustee
Ms. Kampling also serves as Trustee of other Fidelity® funds. Prior to her retirement, Ms. Kampling served as Chairman of the Board and Chief Executive Officer (2012-2019), President and Chief Operating Officer (2011-2012) and Executive Vice President and Chief Financial Officer (2010-2011) of Alliant Energy Corporation. Ms. Kampling currently serves as a member of the Board, Compensation Committee and Executive Committee and as Chair of the Audit Committee of Briggs & Stratton Corporation (manufacturing, 2011-present) and as a member of the Board, Audit, Finance and Risk Committee and Safety, Environmental, Technology and Operations Committee of American Water Works Company, Inc. (utilities company, 2019-present). In addition, Ms. Kampling currently serves as a member of the Board of the Nature Conservancy, Wisconsin Chapter (2019-present). Previously, Ms. Kampling served as a Member of the Advisory Board of certain Fidelity® funds (2020), a member of the Board of Interstate Power and Light Company (2012-2019) and Wisconsin Power and Light Company (2012-2019) (each a subsidiary of Alliant Energy Corporation) and as a member of the Board and Workforce Development Committee of the Business Roundtable (2018-2019).
Alan J. Lacy (1953)
Year of Election or Appointment: 2008
Trustee
Mr. Lacy also serves as Trustee of other Fidelity® funds. Previously, Mr. Lacy served as Senior Adviser (2007-2014) of Oak Hill Capital Partners, L.P. (private equity), Chief Executive Officer (2005) and Vice Chairman (2005-2006) of Sears Holdings Corporation (retail), Chief Executive Officer and Chairman of the Board of Sears, Roebuck and Co. (retail, 2000-2005), Chairman (2014-2017) and a member of the Board (2010-2017) of Dave & Buster’s Entertainment, Inc. (restaurant and entertainment complexes) and a member of the Board of Bristol-Myers Squibb Company (global pharmaceuticals, 2008-2020). Mr. Lacy currently serves as a Trustee of the California Chapter of The Nature Conservancy (2015-present) and a member of the Board of the Center for Advanced Study in the Behavioral Sciences at Stanford University (2015-present).
Ned C. Lautenbach (1944)
Year of Election or Appointment: 2000
Trustee
Co-Lead Independent Trustee
Mr. Lautenbach also serves as Trustee of other Fidelity® funds. Mr. Lautenbach currently serves as Chair of the Board of Governors, State University System of Florida (2013-present) and is a member of the Council on Foreign Relations (1994-present). He is also a member and has in the past served as Chairman of the Board of Directors of Artis-Naples (2012-present). Previously, Mr. Lautenbach served as a member and then Lead Director of the Board of Directors of Eaton Corporation (diversified industrial, 1997-2016). He was also a Partner at Clayton, Dubilier & Rice, LLC (private equity investment, 1998-2010); as well as Director of Sony Corporation (2006-2007). In addition, Mr. Lautenbach had a 30-year career with IBM (technology company), during which time he served as Senior Vice President and as a member of the Corporate Executive Committee (1968-1998).
Joseph Mauriello (1944)
Year of Election or Appointment: 2008
Trustee
Mr. Mauriello also serves as Trustee of other Fidelity® funds. Prior to his retirement in January 2006, Mr. Mauriello served in numerous senior management positions including Deputy Chairman and Chief Operating Officer (2004-2005), and Vice Chairman of Financial Services (2002-2004) of KPMG LLP US (professional services, 1965-2005). Mr. Mauriello currently serves as a member of the Independent Directors Council Governing Council (2015-present). Previously, Mr. Mauriello served as a member of the Board of XL Group plc. (global insurance and re-insurance, 2006-2018).
Cornelia M. Small (1944)
Year of Election or Appointment: 2005
Trustee
Ms. Small also serves as Trustee of other Fidelity® funds. Previously, Ms. Small served as Chief Investment Officer, Director of Global Equity Investments and a member of Scudder, Stevens & Clark and Scudder Kemper Investments. Ms. Small previously served as a member of the Board (2009-2019) and Chair of the Investment Committee (2010-2019) of the Teagle Foundation and a member of the Investment Committee of the Berkshire Taconic Community Foundation (2008-2019).
Garnett A. Smith (1947)
Year of Election or Appointment: 2018
Trustee
Mr. Smith also serves as Trustee of other Fidelity® funds. Prior to his retirement, Mr. Smith served as Chairman and Chief Executive Officer (1990-1997) and President (1986-1990) of Inbrand Corp. (manufacturer of personal absorbent products). Prior to his employment with Inbrand Corp., he was employed by a retail fabric chain and North Carolina National Bank (now Bank of America). Mr. Smith previously served as a member of the Advisory Board of certain Fidelity® funds (2012-2013).
David M. Thomas (1949)
Year of Election or Appointment: 2008
Trustee
Co-Lead Independent Trustee
Mr. Thomas also serves as Trustee of other Fidelity® funds. Previously, Mr. Thomas served as Executive Chairman (2005-2006) and Chairman and Chief Executive Officer (2000-2005) of IMS Health, Inc. (pharmaceutical and healthcare information solutions). Mr. Thomas currently serves as Non-Executive Chairman of the Board of Fortune Brands Home and Security (home and security products, 2011-present), and a member of the Board (2004-present) and Presiding Director (2013-present) of Interpublic Group of Companies, Inc. (marketing communication).
Susan Tomasky (1953)
Year of Election or Appointment: 2020
Trustee
Ms. Tomasky also serves as Trustee of other Fidelity® funds. Prior to her retirement, Ms. Tomasky served in various executive officer positions at American Electric Power Company, Inc. (1998-2011), including most recently as President of AEP Transmission (2007-2011). Ms. Tomasky currently serves as a member of the Board and Sustainability Committee and as Chair of the Audit Committee of Marathon Petroleum Corporation (2018-present) and as a member of the Board, Corporate Governance Committee and Organization and Compensation Committee and as Chair of the Audit Committee of Public Service Enterprise Group, Inc. (utilities company, 2012-present). In addition, Ms. Tomasky currently serves as a member of the Board of the Columbus Regional Airport Authority (2007-present), as a member of the Board of the Royal Shakespeare Company – America (2009-present), as a member of the Board of the Columbus Association for the Performing Arts (2011-present) and as a member of the Board of Kenyon College (2016-present). Previously, Ms. Tomasky served as a Member of the Advisory Board of certain Fidelity® funds (2020), a member of the Board (2011-2019) and as Lead Independent Director (2015-2018) of Andeavor Corporation (previously Tesoro Corporation) (independent oil refiner and marketer) and as a member of the Board of Summit Midstream Partners LP (energy, 2012-2018).
Michael E. Wiley (1950)
Year of Election or Appointment: 2020
Trustee
Mr. Wiley also serves as Trustee of other Fidelity® funds. Previously, Mr. Wiley served as a member of the Advisory Board of certain Fidelity® funds (2018-2020), Chairman, President and CEO of Baker Hughes, Inc. (oilfield services, 2000-2004). Mr. Wiley also previously served as a member of the Board of Andeavor Corporation (independent oil refiner and marketer, 2005-2018), a member of the Board of Andeavor Logistics LP (natural resources logistics, 2015-2018) and a member of the Board of High Point Resources (exploration and production, 2005-2020).
+ The information includes the Trustee's principal occupation during the last five years and other information relating to the experience, attributes, and skills relevant to the Trustee's qualifications to serve as a Trustee, which led to the conclusion that the Trustee should serve as a Trustee for the fund.
Advisory Board Members and Officers:
Correspondence intended for a Member of the Advisory Board (if any) may be sent to Fidelity Investments, P.O. Box 55235, Boston, Massachusetts 02205-5235. Correspondence intended for an officer or Peter S. Lynch may be sent to Fidelity Investments, 245 Summer Street, Boston, Massachusetts 02210. Officers appear below in alphabetical order.
Name, Year of Birth; Principal Occupation
Lloyd James Austin, III (1953)
Year of Election or Appointment: 2020
Member of the Advisory Board
General Austin also serves as a Member of the Advisory Board of other Fidelity® funds. Prior to his retirement, General Austin (United States Army, Retired) held a variety of positions within the U.S. Government, including Commander, U.S. Central Command (2013-2016), Vice Chief of Staff, U.S. Army (2012-2013) and Commanding General, U.S. Forces – Iraq, Operation New Dawn (2010-2012). General Austin currently serves as a Partner of Pine Island Capital Partners (private equity, 2020-present) and as President of the Austin Strategy Group LLC (consulting, 2016-present). General Austin serves as a member of the Board of Directors of Nucor Corporation (steel products, 2017-present), as a member of the Board of Directors of Tenet Healthcare Corporation (2018-present) and as a member of the Board of Directors of Raytheon Technologies Corporation (aerospace and defense, 2020-present). In addition, General Austin currently serves as a member of the Board of Trustees of the Carnegie Corporation of New York (2017-present) and as a member of the Board of Trustees of Auburn University (2017-present). Previously, General Austin served as a member of the Board of Directors of United Technologies Corporation (aerospace, defense and building, 2016-2020).
Thomas A. Kennedy (1955)
Year of Election or Appointment: 2020
Member of the Advisory Board
Mr. Kennedy also serves as a Member of the Advisory Board of other Fidelity® funds. Previously, Mr. Kennedy held a variety of positions at Raytheon Company (aerospace and defense, 1983-2020), including Chairman and Chief Executive Officer (2014-2020) and Executive Vice President and Chief Operating Officer (2013-2014). Mr. Kennedy currently serves as Executive Chairman of the Board of Directors of Raytheon Technologies Corporation (aerospace and defense, 2020-present). He is also a member of the Rutgers School of Engineering Industry Advisory Board (2011-present) and a member of the UCLA Engineering Dean’s Executive Board (2016-present).
Peter S. Lynch (1944)
Year of Election or Appointment: 2003
Member of the Advisory Board
Mr. Lynch also serves as a Member of the Advisory Board of other Fidelity® funds. Mr. Lynch is Vice Chairman and a Director of Fidelity Management & Research Company LLC (investment adviser firm). In addition, Mr. Lynch serves as a Trustee of Boston College and as the Chairman of the Inner-City Scholarship Fund. Previously, Mr. Lynch served as Vice Chairman and a Director of FMR Co., Inc. (investment adviser firm) and on the Special Olympics International Board of Directors (1997-2006).
Elizabeth Paige Baumann (1968)
Year of Election or Appointment: 2017
Anti-Money Laundering (AML) Officer
Ms. Baumann also serves as AML Officer of other funds. She is Chief AML Officer (2012-present) and Senior Vice President (2014-present) of FMR LLC (diversified financial services company) and is an employee of Fidelity Investments. Previously, Ms. Baumann served as AML Officer of certain funds (2017-2019), as AML Officer of the funds (2012-2016), and Vice President (2007-2014) and Deputy Anti-Money Laundering Officer (2007-2012) of FMR LLC.
Craig S. Brown (1977)
Year of Election or Appointment: 2019
Assistant Treasurer
Mr. Brown also serves as Assistant Treasurer of other funds. Mr. Brown is an employee of Fidelity Investments (2013-present).
John J. Burke III (1964)
Year of Election or Appointment: 2018
Chief Financial Officer
Mr. Burke also serves as Chief Financial Officer of other funds. Mr. Burke serves as Head of Investment Operations for Fidelity Fund and Investment Operations (2018-present) and is an employee of Fidelity Investments (1998-present). Previously Mr. Burke served as head of Asset Management Investment Operations (2012-2018).
William C. Coffey (1969)
Year of Election or Appointment: 2019
Assistant Secretary
Mr. Coffey also serves as Assistant Secretary of other funds. He is Senior Vice President and Deputy General Counsel of FMR LLC (diversified financial services company, 2010-present), and is an employee of Fidelity Investments. Previously, Mr. Coffey served as Secretary and CLO of certain funds (2018-2019); CLO, Secretary, and Senior Vice President of Fidelity Management & Research Company and FMR Co., Inc. (investment adviser firms, 2018-2019); Secretary of Fidelity SelectCo, LLC and Fidelity Investments Money Management, Inc. (investment adviser firms, 2018-2019); CLO of Fidelity Management & Research (Hong Kong) Limited, FMR Investment Management (UK) Limited, and Fidelity Management & Research (Japan) Limited (investment adviser firms, 2018-2019); and Assistant Secretary of certain funds (2009-2018).
Timothy M. Cohen (1969)
Year of Election or Appointment: 2018
Vice President
Mr. Cohen also serves as Vice President of other funds. Mr. Cohen serves as Co-Head of Equity (2018-present), a Director of Fidelity Management & Research (Japan) Limited (investment adviser firm, 2016-present), and is an employee of Fidelity Investments. Previously, Mr. Cohen served as Executive Vice President of Fidelity SelectCo, LLC (2019), Head of Global Equity Research (2016-2018), Chief Investment Officer - Equity and a Director of Fidelity Management & Research (U.K.) Inc. (investment adviser firm, 2013-2015) and as a Director of Fidelity Management & Research (Hong Kong) Limited (investment adviser firm, 2017).
Jonathan Davis (1968)
Year of Election or Appointment: 2010
Assistant Treasurer
Mr. Davis also serves as Assistant Treasurer of other funds. Mr. Davis serves as Assistant Treasurer of FMR Capital, Inc. (2017-present) and is an employee of Fidelity Investments. Previously, Mr. Davis served as Vice President and Associate General Counsel of FMR LLC (diversified financial services company, 2003-2010).
Laura M. Del Prato (1964)
Year of Election or Appointment: 2018
Assistant Treasurer
Ms. Del Prato also serves as an officer of other funds. Ms. Del Prato is an employee of Fidelity Investments (2017-present). Previously, Ms. Del Prato served as President and Treasurer of The North Carolina Capital Management Trust: Cash Portfolio and Term Portfolio (2018-2020). Prior to joining Fidelity Investments, Ms. Del Prato served as a Managing Director and Treasurer of the JPMorgan Mutual Funds (2014-2017). Prior to JPMorgan, Ms. Del Prato served as a partner at Cohen Fund Audit Services (accounting firm, 2012-2013) and KPMG LLP (accounting firm, 2004-2012).
Colm A. Hogan (1973)
Year of Election or Appointment: 2020
Assistant Treasurer
Mr. Hogan also serves as an officer of other funds. Mr. Hogan serves as Assistant Treasurer of FMR Capital, Inc. (2017-present) and is an employee of Fidelity Investments (2005-present). Previously, Mr. Hogan served as Deputy Treasurer of certain Fidelity® funds (2016-2020) and Assistant Treasurer of certain Fidelity® funds (2016-2018).
Pamela R. Holding (1964)
Year of Election or Appointment: 2018
Vice President
Ms. Holding also serves as Vice President of other funds. Ms. Holding serves as Co-Head of Equity (2018-present) and is an employee of Fidelity Investments (2013-present). Previously, Ms. Holding served as Executive Vice President of Fidelity SelectCo, LLC (2019) and as Chief Investment Officer of Fidelity Institutional Asset Management (2013-2018).
Cynthia Lo Bessette (1969)
Year of Election or Appointment: 2019
Secretary and Chief Legal Officer (CLO)
Ms. Lo Bessette also serves as an officer of other funds. Ms. Lo Bessette serves as CLO, Secretary, and Senior Vice President of Fidelity Management & Research Company LLC (investment adviser firm, 2019-present); and CLO of Fidelity Management & Research (Hong Kong) Limited, FMR Investment Management (UK) Limited, and Fidelity Management & Research (Japan) Limited (investment adviser firms, 2019-present). She is a Senior Vice President and Deputy General Counsel of FMR LLC (diversified financial services company, 2019-present), and is an employee of Fidelity Investments. Previously, Ms. Lo Bessette served as CLO, Secretary, and Senior Vice President of FMR Co., Inc. (investment adviser firm, 2019); Secretary of Fidelity SelectCo, LLC and Fidelity Investments Money Management, Inc. (investment adviser firms, 2019). Prior to joining Fidelity Investments, Ms. Lo Bessette was Executive Vice President, General Counsel (2016-2019) and Senior Vice President, Deputy General Counsel (2015-2016) of OppenheimerFunds (investment management company) and Deputy Chief Legal Officer (2013-2015) of Jennison Associates LLC (investment adviser firm).
Chris Maher (1972)
Year of Election or Appointment: 2020
Deputy Treasurer
Mr. Maher also serves as an officer of other funds. Mr. Maher serves as Assistant Treasurer of FMR Capital, Inc. (2017-present), and is an employee of Fidelity Investments (2008-present). Previously, Mr. Maher served as Assistant Treasurer of certain funds (2013-2020); Vice President of Asset Management Compliance (2013), Vice President of the Program Management Group of FMR (investment adviser firm, 2010-2013), and Vice President of Valuation Oversight (2008-2010).
Jason P. Pogorelec (1975)
Year of Election or Appointment: 2020
Chief Compliance Officer
Mr. Pogorelec also serves as Chief Compliance Officer of other funds. Mr. Pogorelec is a senior Vice President of Asset Management Compliance for Fidelity Investments and is an employee of Fidelity Investments (2006-present). Previously, Mr. Pogorelec served as Vice President, Associate General Counsel for Fidelity Investments (2010-2020) and Assistant Secretary of certain Fidelity funds (2015-2020).
Stacie M. Smith (1974)
Year of Election or Appointment: 2016
President and Treasurer
Ms. Smith also serves as an officer of other funds. Ms. Smith serves as Assistant Treasurer of FMR Capital, Inc. (2017-present), is an employee of Fidelity Investments (2009-present), and has served in other fund officer roles. Prior to joining Fidelity Investments, Ms. Smith served as Senior Audit Manager of Ernst & Young LLP (accounting firm, 1996-2009). Previously, Ms. Smith served as Assistant Treasurer (2013-2019) and Deputy Treasurer (2013-2016) of certain Fidelity® funds.
Marc L. Spector (1972)
Year of Election or Appointment: 2016
Assistant Treasurer
Mr. Spector also serves as an officer of other funds. Mr. Spector serves as Assistant Treasurer of FMR Capital, Inc. (2017-present) and is an employee of Fidelity Investments (2016-present). Prior to joining Fidelity Investments, Mr. Spector served as Director at the Siegfried Group (accounting firm, 2013-2016), and prior to Siegfried Group as audit senior manager at Deloitte & Touche LLP (accounting firm, 2005-2013).
Jim Wegmann (1979)
Year of Election or Appointment: 2019
Assistant Treasurer
Mr. Wegmann also serves as Assistant Treasurer of other funds. Mr. Wegmann is an employee of Fidelity Investments (2011-present).
Shareholder Expense Example
As a shareholder, you incur two types of costs: (1) transaction costs, which may include sales charges (loads) on purchase payments or redemption proceeds, as applicable and (2) ongoing costs, which generally include management fees, distribution and/or service (12b-1) fees and other Fund expenses. This Example is intended to help you understand your ongoing costs (in dollars) of investing in a fund and to compare these costs with the ongoing costs of investing in other mutual funds.
The Example is based on an investment of $1,000 invested at the beginning of the period and held for the entire period (May 1, 2020 to October 31, 2020).
Actual Expenses
The first line of the accompanying table provides information about actual account values and actual expenses. You may use the information in this line, together with the amount you invested, to estimate the expenses that you paid over the period. Simply divide your account value by $1,000.00 (for example, an $8,600 account value divided by $1,000.00 = 8.6), then multiply the result by the number in the first line for a class/Fund under the heading entitled "Expenses Paid During Period" to estimate the expenses you paid on your account during this period. If any fund is a shareholder of any underlying mutual funds or exchange-traded funds (ETFs) (the Underlying Funds), such fund indirectly bears its proportional share of the expenses of the Underlying Funds in addition to the direct expenses incurred presented in the table. These fees and expenses are not included in the annualized expense ratio used to calculate the expense estimate in the table below.
Hypothetical Example for Comparison Purposes
The second line of the accompanying table provides information about hypothetical account values and hypothetical expenses based on the actual expense ratio and an assumed rate of return of 5% per year before expenses, which is not the actual return. The hypothetical account values and expenses may not be used to estimate the actual ending account balance or expenses you paid for the period. You may use this information to compare the ongoing costs of investing in the Fund and other funds. To do so, compare this 5% hypothetical example with the 5% hypothetical examples that appear in the shareholder reports of the other funds. If any fund is a shareholder of any Underlying Funds, such fund indirectly bears its proportional share of the expenses of the Underlying Funds in addition to the direct expenses as presented in the table. These fees and expenses are not included in the annualized expense ratio used to calculate the expense estimate in the table below.
Please note that the expenses shown in the table are meant to highlight your ongoing costs only and do not reflect any transaction costs. Therefore, the second line of the table is useful in comparing ongoing costs only, and will not help you determine the relative total costs of owning different funds. In addition, if these transactional costs were included, your costs would have been higher.
| | Annualized Expense Ratio-A | Beginning
Account Value
May 1, 2020 | Ending
Account Value
October 31, 2020 | Expenses Paid
During Period-B
May 1, 2020
to October 31, 2020 |
| Fidelity International Small Cap Fund | | | | |
| Class A | 1.30% | | | |
| Actual | | $1,000.00 | $1,141.10 | $7.00 |
| Hypothetical-C | | $1,000.00 | $1,018.60 | $6.60 |
| Class M | 1.59% | | | |
| Actual | | $1,000.00 | $1,139.30 | $8.55 |
| Hypothetical-C | | $1,000.00 | $1,017.14 | $8.06 |
| Class C | 2.04% | | | |
| Actual | | $1,000.00 | $1,136.60 | $10.96 |
| Hypothetical-C | | $1,000.00 | $1,014.88 | $10.33 |
| International Small Cap | 1.01% | | | |
| Actual | | $1,000.00 | $1,142.90 | $5.44 |
| Hypothetical-C | | $1,000.00 | $1,020.06 | $5.13 |
| Class I | .99% | | | |
| Actual | | $1,000.00 | $1,142.90 | $5.33 |
| Hypothetical-C | | $1,000.00 | $1,020.16 | $5.03 |
| Class Z | .88% | | | |
| Actual | | $1,000.00 | $1,143.40 | $4.74 |
| Hypothetical-C | | $1,000.00 | $1,020.71 | $4.47 |
A Annualized expense ratio reflects expenses net of applicable fee waivers.
B Expenses are equal to the annualized expense ratio, multiplied by the average account value over the period, multiplied by 184/ 366 (to reflect the one-half year period). The fees and expenses of any Underlying Funds are not included in each annualized expense ratio.
C 5% return per year before expenses
Distributions (Unaudited)
Class A designates 100%; Class M designates 100%; Class C designates 100%; International Small Cap designates 93%; Class I designates 92%; and Class Z designates 87%; of the dividend distributed in December 2019 during the fiscal year as amounts which may be taken into account as a dividend for purposes of the maximum rate under section 1(h)(11) of the Internal Revenue Code.
The amounts per share which represent income derived from sources within, and taxes paid to, foreign countries or possessions of the United States are as follows:
| | Pay Date | Income | Taxes |
| Fidelity International Small Cap Fund | | | |
| Class A | 12/09/19 | $0.5996 | $0.0626 |
| Class M | 12/09/19 | $0.5156 | $0.0626 |
| Class C | 12/09/19 | $0.3366 | $0.0626 |
| International Small Cap | 12/09/19 | $0.6706 | $0.0626 |
| Class I | 12/09/19 | $0.6746 | $0.0626 |
| Class Z | 12/09/19 | $0.7136 | $0.0626 |
The fund will notify shareholders in January 2021 of amounts for use in preparing 2020 income tax returns.
Proxy Voting Results
A special meeting of shareholders was held on June 9, 2020. The results of votes taken among shareholders on the proposals before them are reported below. Each vote reported represents one dollar of net asset value held on the record date for the meeting.
PROPOSAL 1
To elect a Board of Trustees.
| | # of
Votes | % of
Votes |
| Dennis J. Dirks |
| Affirmative | 91,643,443,973.030 | 98.167 |
| Withheld | 1,711,119,384.419 | 1.833 |
| TOTAL | 93,354,563,357.449 | 100.000 |
| Donald F. Donahue |
| Affirmative | 91,659,003,496.045 | 98.184 |
| Withheld | 1,695,559,852.789 | 1.816 |
| TOTAL | 93,354,563,357.449 | 100.000 |
| Bettina Doulton |
| Affirmative | 91,774,146,516.145 | 98.307 |
| Withheld | 1,580,416,862.377 | 1.693 |
| TOTAL | 93,354,563,357.449 | 100.000 |
| Vicki L. Fuller |
| Affirmative | 91,845,419,368.993 | 98.383 |
| Withheld | 1,509,143,998.591 | 1.617 |
| TOTAL | 93,354,563,357.449 | 100.00 |
| Patricia L. Kampling |
| Affirmative | 91,723,732,274.457 | 98.253 |
| Withheld | 1,630,831,098.411 | 1.747 |
| TOTAL | 93,354,563,357.449 | 100.000 |
| Alan J. Lacy |
| Affirmative | 91,490,319,407.772 | 98.003 |
| Withheld | 1,864,243,948.299 | 1.997 |
| TOTAL | 93,354,563,357.449 | 100.000 |
| Ned C. Lautenbach |
| Affirmative | 91,285,367,239.075 | 97.784 |
| Withheld | 2,069,196,119.052 | 2.216 |
| TOTAL | 93,354,563,357.449 | 100.000 |
| Robert A. Lawrence |
| Affirmative | 91,556,271,429.466 | 98.074 |
| Withheld | 1,798,291,912.707 | 1.926 |
| TOTAL | 93,354,563,357.449 | 100.000 |
| Joseph Mauriello |
| Affirmative | 91,497,480,147.082 | 98.011 |
| Withheld | 1,857,083,211.045 | 1.989 |
| TOTAL | 93,354,563,357.449 | 100.000 |
| Cornelia M. Small |
| Affirmative | 91,606,808,161.438 | 98.128 |
| Withheld | 1,747,755,220.497 | 1.872 |
| TOTAL | 93,354,563,357.449 | 100.000 |
| Garnett A. Smith |
| Affirmative | 91,505,784,053.038 | 98.020 |
| Withheld | 1,848,779,305.090 | 1.980 |
| TOTAL | 93,354,563,357.449 | 100.000 |
| David M. Thomas |
| Affirmative | 91,536,969,704.881 | 98.053 |
| Withheld | 1,817,593,630.919 | 1.947 |
| TOTAL | 93,354,563,357.449 | 100.000 |
| Susan Tomasky |
| Affirmative | 91,697,125,678.165 | 98.225 |
| Withheld | 1,657,437,703.277 | 1.775 |
| TOTAL | 93,354,563,357.449 | 100.000 |
| Michael E. Wiley |
| Affirmative | 91,506,805,575.815 | 98.021 |
| Withheld | 1,847,757,759.985 | 1.979 |
| TOTAL | 93,354,563,357.449 | 100.000 |
PROPOSAL 2
To convert a fundamental investment policy to a non-fundamental investment policy.
| | # of
Votes | % of
Votes |
| Affirmative | 522,260,850.607 | 42.841 |
| Against | 240,219,253.333 | 19.705 |
| Abstain | 115,819,810.035 | 9.501 |
| Broker Non-Vote | 340,760,561.350 | 27.953 |
| TOTAL | 1,219,060,475.325 | 100.000 |
| Proposal 1 reflects trust wide proposal and voting results. |
| Proposal 2 was not approved by shareholders. |

ISC-ANN-1220
1.793585.117
Fidelity® International Small Cap Opportunities Fund
Annual Report
October 31, 2020
Includes Fidelity and Fidelity Advisor share classes
See the inside front cover for important information about access to your fund’s shareholder reports.
Beginning on January 1, 2021, as permitted by regulations adopted by the Securities and Exchange Commission, paper copies of a fund’s shareholder reports will no longer be sent by mail, unless you specifically request paper copies of the reports from the fund or from your financial intermediary, such as a financial advisor, broker-dealer or bank. Instead, the reports will be made available on a website, and you will be notified by mail each time a report is posted and provided with a website link to access the report.
If you already elected to receive shareholder reports electronically, you will not be affected by this change and you need not take any action. You may elect to receive shareholder reports and other communications from a fund electronically, by contacting your financial intermediary. For Fidelity customers, visit Fidelity's web site or call Fidelity using the contact information listed below.
You may elect to receive all future reports in paper free of charge. If you wish to continue receiving paper copies of your shareholder reports, you may contact your financial intermediary or, if you are a Fidelity customer, visit Fidelity’s website, or call Fidelity at the applicable toll-free number listed below. Your election to receive reports in paper will apply to all funds held with the fund complex/your financial intermediary.
| Account Type | Website | Phone Number |
| Brokerage, Mutual Fund, or Annuity Contracts: | fidelity.com/mailpreferences | 1-800-343-3548 |
| Employer Provided Retirement Accounts: | netbenefits.fidelity.com/preferences (choose 'no' under Required Disclosures to continue to print) | 1-800-343-0860 |
| Advisor Sold Accounts Serviced Through Your Financial Intermediary: | Contact Your Financial Intermediary | Your Financial Intermediary's phone number |
| Advisor Sold Accounts Serviced by Fidelity: | institutional.fidelity.com | 1-877-208-0098 |
Contents
To view a fund's proxy voting guidelines and proxy voting record for the 12-month period ended June 30, visit http://www.fidelity.com/proxyvotingresults or visit the Securities and Exchange Commission's (SEC) web site at http://www.sec.gov.
You may also call 1-800-544-8544 if you’re an individual investing directly with Fidelity, call 1-800-835-5092 if you’re a plan sponsor or participant with Fidelity as your recordkeeper or call 1-877-208-0098 on institutional accounts or if you’re an advisor or invest through one to request a free copy of the proxy voting guidelines.
Standard & Poor's, S&P and S&P 500 are registered service marks of The McGraw-Hill Companies, Inc. and have been licensed for use by Fidelity Distributors Corporation.
Other third-party marks appearing herein are the property of their respective owners.
All other marks appearing herein are registered or unregistered trademarks or service marks of FMR LLC or an affiliated company. © 2020 FMR LLC. All rights reserved.
This report and the financial statements contained herein are submitted for the general information of the shareholders of the Fund. This report is not authorized for distribution to prospective investors in the Fund unless preceded or accompanied by an effective prospectus.
A fund files its complete schedule of portfolio holdings with the SEC for the first and third quarters of each fiscal year on Form N-PORT. Forms N-PORT are available on the SEC’s web site at http://www.sec.gov. A fund's Forms N-PORT may be reviewed and copied at the SEC’s Public Reference Room in Washington, DC. Information regarding the operation of the SEC's Public Reference Room may be obtained by calling 1-800-SEC-0330.
For a complete list of a fund's portfolio holdings, view the most recent holdings listing, semiannual report, or annual report on Fidelity's web site at http://www.fidelity.com, http://www.institutional.fidelity.com, or http://www.401k.com, as applicable.
NOT FDIC INSURED •MAY LOSE VALUE •NO BANK GUARANTEE
Neither the Fund nor Fidelity Distributors Corporation is a bank.
Note to Shareholders:
Early in 2020, the outbreak and spread of a new coronavirus emerged as a public health emergency that had a major influence on financial markets, primarily based on its impact on the global economy and the outlook for corporate earnings. The virus causes a respiratory disease known as COVID-19. On March 11, the World Health Organization declared the COVID-19 outbreak a pandemic, citing sustained risk of further global spread.
In the weeks following, as the crisis worsened, we witnessed an escalating human tragedy with wide-scale social and economic consequences from coronavirus-containment measures. The outbreak of COVID-19 prompted a number of measures to limit the spread, including travel and border restrictions, quarantines, and restrictions on large gatherings. In turn, these resulted in lower consumer activity, diminished demand for a wide range of products and services, disruption in manufacturing and supply chains, and – given the wide variability in outcomes regarding the outbreak – significant market uncertainty and volatility. Amid the turmoil, global governments and central banks took unprecedented action to help support consumers, businesses, and the broader economies, and to limit disruption to financial systems.
The situation continues to unfold, and the extent and duration of its impact on financial markets and the economy remain highly uncertain. Extreme events such as the coronavirus crisis are “exogenous shocks” that can have significant adverse effects on mutual funds and their investments. Although multiple asset classes may be affected by market disruption, the duration and impact may not be the same for all types of assets.
Fidelity is committed to helping you stay informed amid news about COVID-19 and during increased market volatility, and we’re taking extra steps to be responsive to customer needs. We encourage you to visit our websites, where we offer ongoing updates, commentary, and analysis on the markets and our funds.
Performance: The Bottom Line
Average annual total return reflects the change in the value of an investment, assuming reinvestment of distributions from dividend income and capital gains (the profits earned upon the sale of securities that have grown in value, if any) and assuming a constant rate of performance each year. The hypothetical investment and the average annual total returns do not reflect the deduction of taxes that a shareholder would pay on fund distributions or the redemption of fund shares. During periods of reimbursement by Fidelity, a fund’s total return will be greater than it would be had the reimbursement not occurred. How a fund did yesterday is no guarantee of how it will do tomorrow.
Average Annual Total Returns
| For the periods ended October 31, 2020 | Past 1 year | Past 5 years | Past 10 years |
| Class A (incl. 5.75% sales charge) | 4.22% | 7.43% | 8.50% |
| Class M (incl. 3.50% sales charge) | 6.43% | 7.62% | 8.46% |
| Class C (incl. contingent deferred sales charge) | 8.72% | 7.86% | 8.31% |
| Fidelity® International Small Cap Opportunities Fund | 10.90% | 9.02% | 9.45% |
| Class I | 10.90% | 9.01% | 9.46% |
| Class Z | 11.03% | 9.07% | 9.48% |
Class C shares' contingent deferred sales charges included in the past one year, past five years and past ten years total return figures are 1%, 0% and 0%, respectively.
The initial offering of Class Z shares took place on October 2, 2018. Returns prior to October 2, 2018, are those of Class I.
$10,000 Over 10 Years
Let's say hypothetically that $10,000 was invested in Fidelity® International Small Cap Opportunities Fund, a class of the fund, on October 31, 2010.
The chart shows how the value of your investment would have changed, and also shows how the MSCI EAFE Small Cap Index performed over the same period.
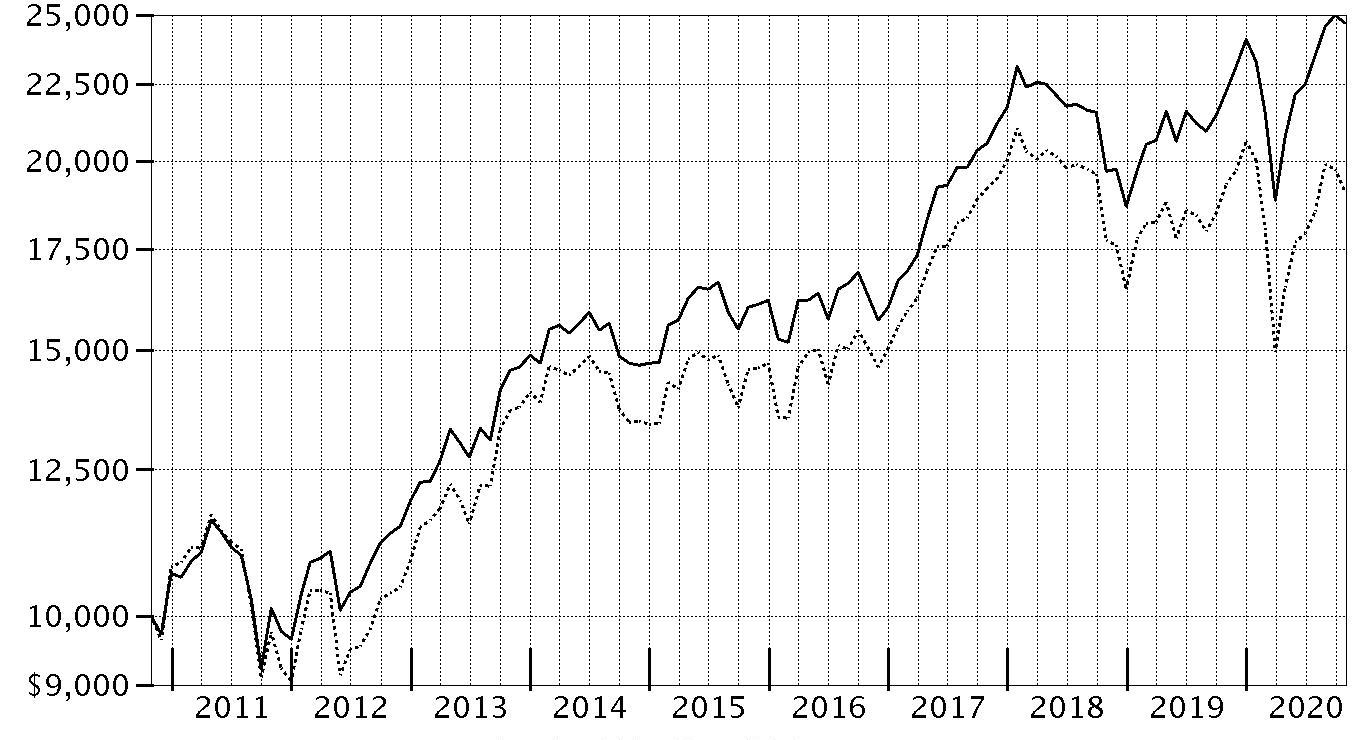
| Period Ending Values |
| $24,671 | Fidelity® International Small Cap Opportunities Fund |
| $19,081 | MSCI EAFE Small Cap Index |
Management's Discussion of Fund Performance
Market Recap: The MSCI ACWI (All Country World Index) ex USA Index returned -2.46% for the 12 months ending October 31, 2020, in what was a bumpy ride for non-U.S. equities, marked by a steep but brief decline due to the early-2020 outbreak and spread of the coronavirus, followed by a sharp upturn. Declared a pandemic on March 11, the crisis and containment efforts caused broad contraction in economic activity, elevated volatility and dislocation in financial markets. A historically rapid and expansive monetary- and fiscal-policy response around the world provided a partial offset to the economic disruption. Other supporting factors included resilient corporate earnings and near-term potential for a COVID-19 vaccine breakthrough. This was evident in the index’s 12.28% gain in the final six months of the year. Currency fluctuation generally boosted foreign developed-markets equities for the year, while the reverse was true for emerging-markets stocks. Late in the period, the index was pressured by a second wave of COVID-19 cases in some regions, and stretched valuations and crowded positioning in big tech. For the full year, the U.K. (-22%), Asia Pacific ex Japan (-8%), Canada (-5%) and Europe ex U.K. (-4%) notably lagged. Emerging markets (+9%) and Japan (+1%) outperformed. By sector, energy (-38%), financials and real estate (-20% each) lagged, whereas information technology (+ 25%) and communication services (+15%) topped the index.
Comments from Portfolio Manager Jed Weiss: For the fiscal year ending October 31, 2020, the fund's share classes (excluding sales charges, if applicable) gained roughly 10% to 11%, handily outperforming the -1.22% result of the benchmark MSCI EAFE Small Cap Index (Net MA). From a regional standpoint, stock picks in Japan and Europe contributed most to the fund's relative result. By sector, the primary contributor to performance versus the benchmark was our security selection in industrials, especially within the capital goods industry. Also helping were investment choices in both health care and information technology. The biggest individual relative contributor was an overweight position in Lasertec (+138%), one of the fund’s largest holdings. Also lifting performance was the portfolio’s overweighting in Azbil, which gained 46% and was among the fund's biggest positions as well. Another top relative contributor was an out-of-benchmark stake in Avon Rubber (+123%), also among the largest holdings at period end. Conversely, an underweighting and stock picks in Asia Pacific ex Japan, specifically Australia, detracted from the fund's relative return. By sector, the primary detractor from performance versus the benchmark were picks among communication services stocks, especially within the media & entertainment industry. The biggest individual relative detractor was an overweight position in Hyve Group (-86%), a stock that was not held at the end of this period. Another notable relative detractor was an outsized stake in Barco (-48%). Further weighing on relative performance was an overweighting in OSG (-30%). The fund’s cash position of about 5% of assets, on average, also hurt.
The views expressed above reflect those of the portfolio manager(s) only through the end of the period as stated on the cover of this report and do not necessarily represent the views of Fidelity or any other person in the Fidelity organization. Any such views are subject to change at any time based upon market or other conditions and Fidelity disclaims any responsibility to update such views. These views may not be relied on as investment advice and, because investment decisions for a Fidelity fund are based on numerous factors, may not be relied on as an indication of trading intent on behalf of any Fidelity fund.
Investment Summary (Unaudited)
Geographic Diversification (% of fund's net assets)
| As of October 31, 2020 |
| | Japan | 37.1% |
| | United Kingdom | 14.5% |
| | United States of America* | 13.1% |
| | Sweden | 6.7% |
| | Germany | 5.1% |
| | Denmark | 2.7% |
| | Israel | 2.5% |
| | Switzerland | 2.2% |
| | Italy | 1.9% |
| | Other | 14.2% |
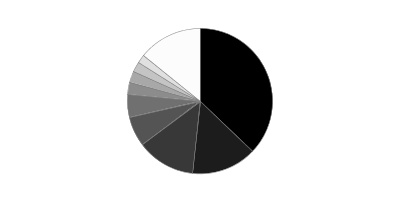
* Includes Short-Term investments and Net Other Assets (Liabilities).
Percentages are based on country or territory of incorporation and are adjusted for the effect of futures contracts, if applicable.
Asset Allocation as of October 31, 2020
| | % of fund's net assets |
| Stocks and Investment Companies | 94.3 |
| Short-Term Investments and Net Other Assets (Liabilities) | 5.7 |
Top Ten Stocks as of October 31, 2020
| | % of fund's net assets |
| Azbil Corp. (Japan, Electronic Equipment & Components) | 4.3 |
| OBIC Co. Ltd. (Japan, IT Services) | 3.4 |
| Lasertec Corp. (Japan, Semiconductors & Semiconductor Equipment) | 3.1 |
| Spirax-Sarco Engineering PLC (United Kingdom, Machinery) | 3.1 |
| Avon Rubber PLC (United Kingdom, Aerospace & Defense) | 2.5 |
| Dechra Pharmaceuticals PLC (United Kingdom, Pharmaceuticals) | 2.4 |
| AddTech AB (B Shares) (Sweden, Trading Companies & Distributors) | 2.4 |
| Tecan Group AG (Switzerland, Life Sciences Tools & Services) | 2.2 |
| SHO-BOND Holdings Co. Ltd. (Japan, Construction & Engineering) | 2.2 |
| Spectris PLC (United Kingdom, Electronic Equipment & Components) | 2.1 |
| | 27.7 |
Top Market Sectors as of October 31, 2020
| | % of fund's net assets |
| Industrials | 25.1 |
| Information Technology | 21.4 |
| Health Care | 17.1 |
| Consumer Staples | 7.4 |
| Consumer Discretionary | 7.3 |
| Communication Services | 3.4 |
| Materials | 2.5 |
| Financials | 2.5 |
| Real Estate | 2.1 |
| Energy | 0.6 |
Schedule of Investments October 31, 2020
Showing Percentage of Net Assets
| Common Stocks - 87.9% | | | |
| | | Shares | Value |
| Australia - 0.7% | | | |
| Beacon Lighting Group Ltd. | | 566,043 | $587,268 |
| Imdex Ltd. | | 2,841,452 | 2,407,021 |
| Kogan.Com Ltd. | | 453,043 | 6,558,264 |
|
| TOTAL AUSTRALIA | | | 9,552,553 |
|
| Bailiwick of Jersey - 0.4% | | | |
| Integrated Diagnostics Holdings PLC (a) | | 1,711,679 | 6,016,552 |
| Belgium - 1.2% | | | |
| Barco NV | | 577,461 | 9,049,025 |
| KBC Ancora (b) | | 268,489 | 7,598,506 |
|
| TOTAL BELGIUM | | | 16,647,531 |
|
| Canada - 1.7% | | | |
| McCoy Global, Inc. (b)(c) | | 630,715 | 241,436 |
| New Look Vision Group, Inc. | | 248,900 | 5,679,321 |
| Richelieu Hardware Ltd. | | 449,500 | 12,085,184 |
| Summit Industrial Income REIT (c) | | 655,000 | 6,622,270 |
|
| TOTAL CANADA | | | 24,628,211 |
|
| China - 0.5% | | | |
| Zhejiang Sanhua Intelligent Controls Co. Ltd. (A Shares) | | 1,864,491 | 6,840,558 |
| Denmark - 2.7% | | | |
| Netcompany Group A/S (a)(b) | | 235,226 | 19,540,833 |
| SimCorp A/S | | 109,800 | 13,089,424 |
| Spar Nord Bank A/S | | 640,287 | 5,509,353 |
|
| TOTAL DENMARK | | | 38,139,610 |
|
| Finland - 0.9% | | | |
| Admicom OYJ | | 51,100 | 5,951,361 |
| Musti Group OYJ | | 40,404 | 925,602 |
| Tikkurila Oyj | | 374,985 | 6,000,619 |
|
| TOTAL FINLAND | | | 12,877,582 |
|
| France - 1.4% | | | |
| Laurent-Perrier Group SA | | 53,188 | 4,373,346 |
| Lectra | | 204,400 | 4,699,195 |
| Vetoquinol SA | | 116,884 | 11,026,445 |
|
| TOTAL FRANCE | | | 20,098,986 |
|
| Germany - 3.6% | | | |
| CompuGroup Medical AG | | 228,810 | 19,599,866 |
| CTS Eventim AG | | 328,993 | 14,575,471 |
| Nexus AG | | 291,358 | 16,219,978 |
|
| TOTAL GERMANY | | | 50,395,315 |
|
| India - 0.8% | | | |
| Embassy Office Parks (REIT) | | 1,679,400 | 7,752,007 |
| Indian Energy Exchange Ltd. (a) | | 1,204,228 | 3,088,362 |
|
| TOTAL INDIA | | | 10,840,369 |
|
| Ireland - 0.1% | | | |
| FBD Holdings PLC (b) | | 243,128 | 1,755,586 |
| Israel - 2.5% | | | |
| Ituran Location & Control Ltd. | | 557,077 | 7,882,640 |
| Maytronics Ltd. | | 291,015 | 4,470,068 |
| Strauss Group Ltd. | | 671,484 | 19,416,073 |
| Tel Aviv Stock Exchange Ltd. | | 707,643 | 3,069,450 |
|
| TOTAL ISRAEL | | | 34,838,231 |
|
| Italy - 1.9% | | | |
| Interpump Group SpA | | 716,943 | 27,053,600 |
| Japan - 37.1% | | | |
| Ai Holdings Corp. | | 225,800 | 3,970,088 |
| Aoki Super Co. Ltd. | | 175,000 | 4,583,778 |
| Artnature, Inc. | | 483,700 | 2,802,903 |
| Aucnet, Inc. | | 288,600 | 3,836,756 |
| Azbil Corp. | | 1,484,992 | 60,265,878 |
| Broadleaf Co. Ltd. (c) | | 2,399,998 | 12,553,788 |
| Central Automotive Products Ltd. | | 130,900 | 2,549,784 |
| Century21 Real Estate Japan Ltd. | | 66,500 | 669,054 |
| Curves Holdings Co. Ltd. | | 1,592,126 | 9,782,012 |
| Daiichikosho Co. Ltd. | | 362,500 | 12,403,654 |
| Daikokutenbussan Co. Ltd. | | 160,800 | 8,748,101 |
| Funai Soken Holdings, Inc. | | 334,750 | 7,241,105 |
| Goldcrest Co. Ltd. | | 701,630 | 8,965,006 |
| Iwatsuka Confectionary Co. Ltd. | | 18,900 | 661,500 |
| Kobayashi Pharmaceutical Co. Ltd. | | 123,800 | 12,063,778 |
| Koshidaka Holdings Co. Ltd. | | 1,546,400 | 5,784,825 |
| Kusuri No Aoki Holdings Co. Ltd. | | 123,300 | 9,842,543 |
| Lasertec Corp. | | 511,844 | 44,336,340 |
| Medikit Co. Ltd. | | 224,400 | 6,593,580 |
| Miroku Jyoho Service Co., Ltd. | | 349,800 | 7,084,990 |
| Misumi Group, Inc. | | 519,650 | 15,433,383 |
| Mitsuboshi Belting Ltd. | | 229,680 | 3,595,567 |
| Nabtesco Corp. | | 475,600 | 17,767,582 |
| Nagaileben Co. Ltd. | | 660,527 | 16,528,228 |
| Nihon Parkerizing Co. Ltd. | | 1,745,600 | 17,203,023 |
| NS Tool Co. Ltd. | | 283,100 | 6,076,576 |
| OBIC Co. Ltd. | | 270,700 | 47,925,548 |
| OSG Corp. | | 1,019,700 | 15,276,180 |
| Paramount Bed Holdings Co. Ltd. | | 308,360 | 11,880,447 |
| Poletowin Pitcrew Holdings, Inc. | | 59,300 | 516,603 |
| ProNexus, Inc. | | 462,800 | 4,814,338 |
| San-Ai Oil Co. Ltd. | | 825,900 | 8,327,210 |
| SHO-BOND Holdings Co. Ltd. | | 635,600 | 30,679,314 |
| Shoei Co. Ltd. | | 820,652 | 24,991,149 |
| SK Kaken Co. Ltd. | | 27,900 | 10,600,687 |
| Software Service, Inc. | | 106,600 | 11,485,766 |
| Techno Medica Co. Ltd. | | 80,791 | 1,249,885 |
| The Monogatari Corp. | | 54,700 | 5,589,846 |
| TKC Corp. | | 106,500 | 6,599,864 |
| Tocalo Co. Ltd. | | 643,336 | 6,412,987 |
| USS Co. Ltd. | | 924,700 | 16,913,297 |
| Welcia Holdings Co. Ltd. | | 244,400 | 9,578,361 |
| Workman Co. Ltd. (c) | | 64,600 | 5,728,063 |
| Yamada Consulting Group Co. Ltd. | | 235,400 | 2,265,872 |
|
| TOTAL JAPAN | | | 522,179,239 |
|
| Korea (South) - 0.8% | | | |
| BGF Retail Co. Ltd. | | 54,526 | 5,657,648 |
| Leeno Industrial, Inc. | | 57,528 | 6,174,329 |
|
| TOTAL KOREA (SOUTH) | | | 11,831,977 |
|
| Netherlands - 1.9% | | | |
| Aalberts Industries NV | | 785,422 | 26,381,151 |
| Norway - 1.2% | | | |
| Kongsberg Gruppen ASA | | 471,559 | 7,636,503 |
| Medistim ASA | | 170,842 | 3,704,367 |
| Skandiabanken ASA (a) | | 794,633 | 5,035,829 |
|
| TOTAL NORWAY | | | 16,376,699 |
|
| Philippines - 0.2% | | | |
| Jollibee Food Corp. | | 941,940 | 3,293,318 |
| South Africa - 1.0% | | | |
| Clicks Group Ltd. | | 1,002,129 | 14,494,203 |
| Spain - 1.0% | | | |
| Fluidra SA | | 689,408 | 12,461,303 |
| Prosegur Compania de Seguridad SA (Reg.) | | 495,549 | 1,133,505 |
|
| TOTAL SPAIN | | | 13,594,808 |
|
| Sweden - 6.7% | | | |
| Addlife AB | | 1,869,656 | 28,117,118 |
| AddTech AB (B Shares) | | 3,038,017 | 33,629,043 |
| Bygghemma Group First AB (b) | | 45,700 | 713,870 |
| INVISIO AB | | 316,300 | 5,701,533 |
| John Mattson Fastighetsforetag (b) | | 233,652 | 3,933,412 |
| Lagercrantz Group AB (B Shares) | | 3,584,831 | 22,092,975 |
|
| TOTAL SWEDEN | | | 94,187,951 |
|
| Switzerland - 2.2% | | | |
| Tecan Group AG | | 65,620 | 31,130,051 |
| Taiwan - 0.4% | | | |
| Addcn Technology Co. Ltd. | | 691,435 | 4,990,784 |
| United Kingdom - 14.5% | | | |
| Alliance Pharma PLC | | 8,507,237 | 8,100,527 |
| Avon Rubber PLC | | 700,000 | 35,593,863 |
| Bodycote PLC | | 798,967 | 6,733,077 |
| Clarkson PLC | | 193,000 | 5,025,633 |
| Dechra Pharmaceuticals PLC | | 755,095 | 34,159,637 |
| DP Poland PLC (b)(d) | | 9,954,100 | 934,926 |
| Great Portland Estates PLC | | 187,843 | 1,404,133 |
| Hilton Food Group PLC | | 318,426 | 4,785,242 |
| Howden Joinery Group PLC | | 1,129,900 | 9,321,386 |
| Rightmove PLC | | 2,014,170 | 16,125,828 |
| Spectris PLC | | 939,278 | 30,128,826 |
| Spirax-Sarco Engineering PLC | | 297,391 | 43,458,461 |
| Ultra Electronics Holdings PLC | | 333,258 | 8,116,632 |
|
| TOTAL UNITED KINGDOM | | | 203,888,171 |
|
| United States of America - 2.5% | | | |
| Autoliv, Inc. | | 52,300 | 3,964,340 |
| Morningstar, Inc. | | 53,100 | 10,109,178 |
| PriceSmart, Inc. | | 120,660 | 8,325,540 |
| ResMed, Inc. | | 63,495 | 12,187,230 |
|
| TOTAL UNITED STATES OF AMERICA | | | 34,586,288 |
|
| TOTAL COMMON STOCKS | | | |
| (Cost $775,950,655) | | | 1,236,619,324 |
|
| Nonconvertible Preferred Stocks - 1.5% | | | |
| Germany - 1.5% | | | |
| Sartorius AG (non-vtg.) | | | |
| (Cost $1,367,417) | | 49,680 | 21,026,256 |
|
| Investment Companies - 4.9% | | | |
| United States of America - 4.9% | | | |
| iShares MSCI EAFE Small-Cap ETF | | | |
| (Cost $69,619,288) | | 1,200,000 | 68,339,996 |
|
| Money Market Funds - 5.9% | | | |
| Fidelity Cash Central Fund 0.10% (e) | | 76,188,423 | 76,203,661 |
| Fidelity Securities Lending Cash Central Fund 0.11% (e)(f) | | 7,075,847 | 7,076,555 |
| TOTAL MONEY MARKET FUNDS | | | |
| (Cost $83,280,187) | | | 83,280,216 |
| TOTAL INVESTMENT IN SECURITIES - 100.2% | | | |
| (Cost $930,217,547) | | | 1,409,265,792 |
| NET OTHER ASSETS (LIABILITIES) - (0.2)% | | | (3,110,899) |
| NET ASSETS - 100% | | | $1,406,154,893 |
Security Type Abbreviations
ETF – Exchange-Traded Fund
Categorizations in the Schedule of Investments are based on country or territory of incorporation.
Legend
(a) Security exempt from registration under Rule 144A of the Securities Act of 1933. These securities may be resold in transactions exempt from registration, normally to qualified institutional buyers. At the end of the period, the value of these securities amounted to $33,681,576 or 2.4% of net assets.
(b) Non-income producing
(c) Security or a portion of the security is on loan at period end.
(d) Level 3 security
(e) Affiliated fund that is generally available only to investment companies and other accounts managed by Fidelity Investments. The rate quoted is the annualized seven-day yield of the fund at period end. A complete unaudited listing of the fund's holdings as of its most recent quarter end is available upon request. In addition, each Fidelity Central Fund's financial statements, which are not covered by the Fund's Report of Independent Registered Public Accounting Firm, are available on the SEC's website or upon request.
(f) Investment made with cash collateral received from securities on loan.
Affiliated Central Funds
Information regarding fiscal year to date income earned by the Fund from investments in Fidelity Central Funds is as follows:
| Fund | Income earned |
| Fidelity Cash Central Fund | $297,196 |
| Fidelity Securities Lending Cash Central Fund | 218,743 |
| Total | $515,939 |
Amounts in the income column in the above table include any capital gain distributions from underlying funds, which are presented in the corresponding line-item in the Statement of Operations, if applicable. Amount for Fidelity Securities Lending Cash Central Fund represents the income earned on investing cash collateral, less rebates paid to borrowers and any lending agent fees associated with the loan, plus any premium payments received for lending certain types of securities.
The value, beginning of period, for the Fidelity Cash Central Fund was $76,862,974. Net realized gain (loss) and change in net unrealized appreciation (depreciation) on Fidelity Cash Central Fund is presented in the Statement of Operations, if applicable. Purchases and sales of the Fidelity Cash Central Fund were $285,949,900 and $286,606,014, respectively, during the period.
Investment Valuation
The following is a summary of the inputs used, as of October 31, 2020, involving the Fund's assets and liabilities carried at fair value. The inputs or methodology used for valuing securities may not be an indication of the risk associated with investing in those securities. For more information on valuation inputs, and their aggregation into the levels used below, please refer to the Investment Valuation section in the accompanying Notes to Financial Statements.
| | Valuation Inputs at Reporting Date: |
| Description | Total | Level 1 | Level 2 | Level 3 |
| Investments in Securities: | | | | |
| Equities: | | | | |
| Communication Services | $48,095,737 | $35,692,083 | $12,403,654 | $-- |
| Consumer Discretionary | 102,302,709 | 15,753,201 | 85,614,582 | 934,926 |
| Consumer Staples | 105,333,016 | 36,900,201 | 68,432,815 | -- |
| Energy | 8,568,646 | 241,436 | 8,327,210 | -- |
| Financials | 36,166,264 | 33,077,902 | 3,088,362 | -- |
| Health Care | 239,025,933 | 191,288,027 | 47,737,906 | -- |
| Industrials | 350,734,336 | 234,330,874 | 116,403,462 | -- |
| Information Technology | 301,861,707 | 112,434,279 | 189,427,428 | -- |
| Materials | 36,211,350 | 6,000,619 | 30,210,731 | -- |
| Real Estate | 29,345,882 | 11,959,815 | 17,386,067 | -- |
| Investment Companies | 68,339,996 | 68,339,996 | -- | -- |
| Money Market Funds | 83,280,216 | 83,280,216 | -- | -- |
| Total Investments in Securities: | $1,409,265,792 | $829,298,649 | $579,032,217 | $934,926 |
See accompanying notes which are an integral part of the financial statements.
Financial Statements
Statement of Assets and Liabilities
| | | October 31, 2020 |
| Assets | | |
Investment in securities, at value (including securities loaned of $6,748,311) — See accompanying schedule:
Unaffiliated issuers (cost $846,937,360) | $1,325,985,576 | |
| Fidelity Central Funds (cost $83,280,187) | 83,280,216 | |
| Total Investment in Securities (cost $930,217,547) | | $1,409,265,792 |
| Foreign currency held at value (cost $62,282) | | 62,359 |
| Receivable for investments sold | | 3,755,519 |
| Receivable for fund shares sold | | 652,966 |
| Dividends receivable | | 4,916,239 |
| Distributions receivable from Fidelity Central Funds | | 12,230 |
| Prepaid expenses | | 2,321 |
| Other receivables | | 32,544 |
| Total assets | | 1,418,699,970 |
| Liabilities | | |
| Payable for investments purchased | $2,531,529 | |
| Payable for fund shares redeemed | 1,248,171 | |
| Accrued management fee | 1,224,990 | |
| Distribution and service plan fees payable | 20,113 | |
| Other affiliated payables | 246,274 | |
| Other payables and accrued expenses | 193,835 | |
| Collateral on securities loaned | 7,080,165 | |
| Total liabilities | | 12,545,077 |
| Net Assets | | $1,406,154,893 |
| Net Assets consist of: | | |
| Paid in capital | | $972,002,469 |
| Total accumulated earnings (loss) | | 434,152,424 |
| Net Assets | | $1,406,154,893 |
| Net Asset Value and Maximum Offering Price | | |
| Class A: | | |
| Net Asset Value and redemption price per share ($37,771,480 ÷ 1,811,043 shares)(a) | | $20.86 |
| Maximum offering price per share (100/94.25 of $20.86) | | $22.13 |
| Class M: | | |
| Net Asset Value and redemption price per share ($13,141,427 ÷ 635,872 shares)(a) | | $20.67 |
| Maximum offering price per share (100/96.50 of $20.67) | | $21.42 |
| Class C: | | |
| Net Asset Value and offering price per share ($7,252,618 ÷ 360,953 shares)(a) | | $20.09 |
| International Small Cap Opportunities: | | |
| Net Asset Value, offering price and redemption price per share ($1,152,472,180 ÷ 54,608,528 shares) | | $21.10 |
| Class I: | | |
| Net Asset Value, offering price and redemption price per share ($113,040,752 ÷ 5,360,164 shares) | | $21.09 |
| Class Z: | | |
| Net Asset Value, offering price and redemption price per share ($82,476,436 ÷ 3,917,437 shares) | | $21.05 |
(a) Redemption price per share is equal to net asset value less any applicable contingent deferred sales charge.
See accompanying notes which are an integral part of the financial statements.
Statement of Operations
| | | Year ended October 31, 2020 |
| Investment Income | | |
| Dividends | | $19,365,911 |
| Income from Fidelity Central Funds (including $218,743 from security lending) | | 515,939 |
| Income before foreign taxes withheld | | 19,881,850 |
| Less foreign taxes withheld | | (1,678,140) |
| Total income | | 18,203,710 |
| Expenses | | |
| Management fee | | |
| Basic fee | $11,127,047 | |
| Performance adjustment | 2,470,976 | |
| Transfer agent fees | 2,193,353 | |
| Distribution and service plan fees | 244,099 | |
| Accounting fees | 606,770 | |
| Custodian fees and expenses | 161,629 | |
| Independent trustees' fees and expenses | 7,517 | |
| Registration fees | 107,716 | |
| Audit | 84,037 | |
| Legal | 3,202 | |
| Miscellaneous | 37,333 | |
| Total expenses before reductions | 17,043,679 | |
| Expense reductions | (106,012) | |
| Total expenses after reductions | | 16,937,667 |
| Net investment income (loss) | | 1,266,043 |
| Realized and Unrealized Gain (Loss) | | |
| Net realized gain (loss) on: | | |
| Investment securities: | | |
| Unaffiliated issuers (net of foreign taxes of $31,373) | (29,207,682) | |
| Fidelity Central Funds | (2,935) | |
| Foreign currency transactions | 126,360 | |
| Total net realized gain (loss) | | (29,084,257) |
| Change in net unrealized appreciation (depreciation) on: | | |
| Investment securities: | | |
| Unaffiliated issuers (net of decrease in deferred foreign taxes of $193,758) | 168,864,511 | |
| Assets and liabilities in foreign currencies | 74,941 | |
| Total change in net unrealized appreciation (depreciation) | | 168,939,452 |
| Net gain (loss) | | 139,855,195 |
| Net increase (decrease) in net assets resulting from operations | | $141,121,238 |
See accompanying notes which are an integral part of the financial statements.
Statement of Changes in Net Assets
| | Year ended October 31, 2020 | Year ended October 31, 2019 |
| Increase (Decrease) in Net Assets | | |
| Operations | | |
| Net investment income (loss) | $1,266,043 | $11,461,565 |
| Net realized gain (loss) | (29,084,257) | 421,543 |
| Change in net unrealized appreciation (depreciation) | 168,939,452 | 142,365,422 |
| Net increase (decrease) in net assets resulting from operations | 141,121,238 | 154,248,530 |
| Distributions to shareholders | (15,254,562) | (32,407,290) |
| Share transactions - net increase (decrease) | (45,058,769) | 4,567,294 |
| Total increase (decrease) in net assets | 80,807,907 | 126,408,534 |
| Net Assets | | |
| Beginning of period | 1,325,346,986 | 1,198,938,452 |
| End of period | $1,406,154,893 | $1,325,346,986 |
See accompanying notes which are an integral part of the financial statements.
Financial Highlights
Fidelity International Small Cap Opportunities Fund Class A
| Years ended October 31, | 2020 | 2019 | 2018 | 2017 | 2016 |
| Selected Per–Share Data | | | | | |
| Net asset value, beginning of period | $19.02 | $17.33 | $18.47 | $14.82 | $14.75 |
| Income from Investment Operations | | | | | |
| Net investment income (loss)A | (.04) | .11 | .12 | .10 | .09 |
| Net realized and unrealized gain (loss) | 2.05 | 2.01 | (.92) | 3.71 | .10 |
| Total from investment operations | 2.01 | 2.12 | (.80) | 3.81 | .19 |
| Distributions from net investment income | (.11) | (.11) | (.09) | (.12) | (.05) |
| Distributions from net realized gain | (.05) | (.31) | (.24) | (.04) | (.07) |
| Total distributions | (.17)B | (.43)B | (.34)B | (.16) | (.12) |
| Redemption fees added to paid in capitalA | – | – | –C | –C | –C |
| Net asset value, end of period | $20.86 | $19.02 | $17.33 | $18.47 | $14.82 |
| Total ReturnD,E | 10.58% | 12.61% | (4.48)% | 26.00% | 1.30% |
| Ratios to Average Net AssetsF,G | | | | | |
| Expenses before reductions | 1.57% | 1.49% | 1.38% | 1.43% | 1.45% |
| Expenses net of fee waivers, if any | 1.57% | 1.49% | 1.38% | 1.43% | 1.45% |
| Expenses net of all reductions | 1.56% | 1.48% | 1.37% | 1.43% | 1.45% |
| Net investment income (loss) | (.20)% | .64% | .65% | .61% | .62% |
| Supplemental Data | | | | | |
| Net assets, end of period (000 omitted) | $37,771 | $41,679 | $41,164 | $41,324 | $45,151 |
| Portfolio turnover rateH | 20% | 17% | 19% | 11% | 24% |
A Calculated based on average shares outstanding during the period.
B Total distributions per share do not sum due to rounding.
C Amount represents less than $.005 per share.
D Total returns would have been lower if certain expenses had not been reduced during the applicable periods shown.
E Total returns do not include the effect of the sales charges.
F Fees and expenses of any underlying mutual funds or exchange-traded funds (ETFs) are not included in the Fund's expense ratio. The Fund indirectly bears its proportionate share of these expenses. For additional expense information related to investments in Fidelity Central Funds, please refer to the "Investments in Fidelity Central Funds" note found in the Notes to Financial Statements section of the most recent Annual or Semi-Annual report.
G Expense ratios reflect operating expenses of the class. Expenses before reductions do not reflect amounts reimbursed, waived, or reduced through arrangements with the investment adviser, brokerage services, or other offset arrangements, if applicable, and do not represent the amount paid by the class during periods when reimbursements, waivers or reductions occur.
H Amount does not include the portfolio activity of any underlying mutual funds or exchange-traded funds (ETFs).
See accompanying notes which are an integral part of the financial statements.
Fidelity International Small Cap Opportunities Fund Class M
| Years ended October 31, | 2020 | 2019 | 2018 | 2017 | 2016 |
| Selected Per–Share Data | | | | | |
| Net asset value, beginning of period | $18.85 | $17.17 | $18.32 | $14.68 | $14.62 |
| Income from Investment Operations | | | | | |
| Net investment income (loss)A | (.09) | .06 | .07 | .05 | .04 |
| Net realized and unrealized gain (loss) | 2.03 | 1.99 | (.92) | 3.69 | .10 |
| Total from investment operations | 1.94 | 2.05 | (.85) | 3.74 | .14 |
| Distributions from net investment income | (.06) | (.06) | (.06) | (.06) | (.01) |
| Distributions from net realized gain | (.05) | (.31) | (.24) | (.04) | (.07) |
| Total distributions | (.12)B | (.37) | (.30) | (.10) | (.08) |
| Redemption fees added to paid in capitalA | – | – | –C | –C | –C |
| Net asset value, end of period | $20.67 | $18.85 | $17.17 | $18.32 | $14.68 |
| Total ReturnD,E | 10.29% | 12.29% | (4.74)% | 25.63% | .95% |
| Ratios to Average Net AssetsF,G | | | | | |
| Expenses before reductions | 1.84% | 1.77% | 1.67% | 1.73% | 1.77% |
| Expenses net of fee waivers, if any | 1.84% | 1.77% | 1.67% | 1.73% | 1.77% |
| Expenses net of all reductions | 1.83% | 1.77% | 1.66% | 1.73% | 1.77% |
| Net investment income (loss) | (.47)% | .36% | .36% | .31% | .30% |
| Supplemental Data | | | | | |
| Net assets, end of period (000 omitted) | $13,141 | $13,875 | $13,245 | $14,422 | $12,308 |
| Portfolio turnover rateH | 20% | 17% | 19% | 11% | 24% |
A Calculated based on average shares outstanding during the period.
B Total distributions per share do not sum due to rounding.
C Amount represents less than $.005 per share.
D Total returns would have been lower if certain expenses had not been reduced during the applicable periods shown.
E Total returns do not include the effect of the sales charges.
F Fees and expenses of any underlying mutual funds or exchange-traded funds (ETFs) are not included in the Fund's expense ratio. The Fund indirectly bears its proportionate share of these expenses. For additional expense information related to investments in Fidelity Central Funds, please refer to the "Investments in Fidelity Central Funds" note found in the Notes to Financial Statements section of the most recent Annual or Semi-Annual report.
G Expense ratios reflect operating expenses of the class. Expenses before reductions do not reflect amounts reimbursed, waived, or reduced through arrangements with the investment adviser, brokerage services, or other offset arrangements, if applicable, and do not represent the amount paid by the class during periods when reimbursements, waivers or reductions occur.
H Amount does not include the portfolio activity of any underlying mutual funds or exchange-traded funds (ETFs).
See accompanying notes which are an integral part of the financial statements.
Fidelity International Small Cap Opportunities Fund Class C
| Years ended October 31, | 2020 | 2019 | 2018 | 2017 | 2016 |
| Selected Per–Share Data | | | | | |
| Net asset value, beginning of period | $18.31 | $16.69 | $17.84 | $14.27 | $14.26 |
| Income from Investment Operations | | | | | |
| Net investment income (loss)A | (.18) | (.02) | (.02) | (.03) | (.03) |
| Net realized and unrealized gain (loss) | 1.96 | 1.93 | (.89) | 3.60 | .09 |
| Total from investment operations | 1.78 | 1.91 | (.91) | 3.57 | .06 |
| Distributions from net investment income | – | – | – | – | – |
| Distributions from net realized gain | – | (.29) | (.24) | – | (.05) |
| Total distributions | – | (.29) | (.24) | – | (.05) |
| Redemption fees added to paid in capitalA | – | – | –B | –B | –B |
| Net asset value, end of period | $20.09 | $18.31 | $16.69 | $17.84 | $14.27 |
| Total ReturnC,D | 9.72% | 11.74% | (5.19)% | 25.02% | .44% |
| Ratios to Average Net AssetsE,F | | | | | |
| Expenses before reductions | 2.33% | 2.27% | 2.15% | 2.22% | 2.26% |
| Expenses net of fee waivers, if any | 2.33% | 2.26% | 2.15% | 2.22% | 2.26% |
| Expenses net of all reductions | 2.33% | 2.26% | 2.14% | 2.21% | 2.25% |
| Net investment income (loss) | (.96)% | (.13)% | (.12)% | (.17)% | (.19)% |
| Supplemental Data | | | | | |
| Net assets, end of period (000 omitted) | $7,253 | $9,424 | $14,461 | $14,547 | $12,625 |
| Portfolio turnover rateG | 20% | 17% | 19% | 11% | 24% |
A Calculated based on average shares outstanding during the period.
B Amount represents less than $.005 per share.
C Total returns would have been lower if certain expenses had not been reduced during the applicable periods shown.
D Total returns do not include the effect of the contingent deferred sales charge.
E Fees and expenses of any underlying mutual funds or exchange-traded funds (ETFs) are not included in the Fund's expense ratio. The Fund indirectly bears its proportionate share of these expenses. For additional expense information related to investments in Fidelity Central Funds, please refer to the "Investments in Fidelity Central Funds" note found in the Notes to Financial Statements section of the most recent Annual or Semi-Annual report.
F Expense ratios reflect operating expenses of the class. Expenses before reductions do not reflect amounts reimbursed, waived, or reduced through arrangements with the investment adviser, brokerage services, or other offset arrangements, if applicable, and do not represent the amount paid by the class during periods when reimbursements, waivers or reductions occur.
G Amount does not include the portfolio activity of any underlying mutual funds or exchange-traded funds (ETFs).
See accompanying notes which are an integral part of the financial statements.
Fidelity International Small Cap Opportunities Fund
| Years ended October 31, | 2020 | 2019 | 2018 | 2017 | 2016 |
| Selected Per–Share Data | | | | | |
| Net asset value, beginning of period | $19.24 | $17.53 | $18.69 | $15.00 | $14.91 |
| Income from Investment Operations | | | | | |
| Net investment income (loss)A | .02 | .17 | .18 | .15 | .13 |
| Net realized and unrealized gain (loss) | 2.07 | 2.02 | (.95) | 3.75 | .11 |
| Total from investment operations | 2.09 | 2.19 | (.77) | 3.90 | .24 |
| Distributions from net investment income | (.17) | (.17) | (.15) | (.17) | (.08) |
| Distributions from net realized gain | (.05) | (.31) | (.24) | (.04) | (.07) |
| Total distributions | (.23)B | (.48) | (.39) | (.21) | (.15) |
| Redemption fees added to paid in capitalA | – | – | –C | –C | –C |
| Net asset value, end of period | $21.10 | $19.24 | $17.53 | $18.69 | $15.00 |
| Total ReturnD | 10.90% | 12.97% | (4.25)% | 26.39% | 1.58% |
| Ratios to Average Net AssetsE,F | | | | | |
| Expenses before reductions | 1.26% | 1.19% | 1.10% | 1.13% | 1.17% |
| Expenses net of fee waivers, if any | 1.26% | 1.19% | 1.10% | 1.13% | 1.17% |
| Expenses net of all reductions | 1.25% | 1.19% | 1.09% | 1.13% | 1.16% |
| Net investment income (loss) | .11% | .94% | .93% | .91% | .90% |
| Supplemental Data | | | | | |
| Net assets, end of period (000 omitted) | $1,152,472 | $1,040,989 | $965,482 | $916,882 | $809,952 |
| Portfolio turnover rateG | 20% | 17% | 19% | 11% | 24% |
A Calculated based on average shares outstanding during the period.
B Total distributions per share do not sum due to rounding.
C Amount represents less than $.005 per share.
D Total returns would have been lower if certain expenses had not been reduced during the applicable periods shown.
E Fees and expenses of any underlying mutual funds or exchange-traded funds (ETFs) are not included in the Fund's expense ratio. The Fund indirectly bears its proportionate share of these expenses. For additional expense information related to investments in Fidelity Central Funds, please refer to the "Investments in Fidelity Central Funds" note found in the Notes to Financial Statements section of the most recent Annual or Semi-Annual report.
F Expense ratios reflect operating expenses of the class. Expenses before reductions do not reflect amounts reimbursed, waived, or reduced through arrangements with the investment adviser, brokerage services, or other offset arrangements, if applicable, and do not represent the amount paid by the class during periods when reimbursements, waivers or reductions occur.
G Amount does not include the portfolio activity of any underlying mutual funds or exchange-traded funds (ETFs).
See accompanying notes which are an integral part of the financial statements.
Fidelity International Small Cap Opportunities Fund Class I
| Years ended October 31, | 2020 | 2019 | 2018 | 2017 | 2016 |
| Selected Per–Share Data | | | | | |
| Net asset value, beginning of period | $19.22 | $17.51 | $18.66 | $14.99 | $14.91 |
| Income from Investment Operations | | | | | |
| Net investment income (loss)A | .02 | .17 | .18 | .15 | .13 |
| Net realized and unrealized gain (loss) | 2.07 | 2.02 | (.94) | 3.74 | .10 |
| Total from investment operations | 2.09 | 2.19 | (.76) | 3.89 | .23 |
| Distributions from net investment income | (.16) | (.16) | (.15) | (.18) | (.08) |
| Distributions from net realized gain | (.05) | (.31) | (.24) | (.04) | (.07) |
| Total distributions | (.22)B | (.48)B | (.39) | (.22) | (.15) |
| Redemption fees added to paid in capitalA | – | – | –C | –C | –C |
| Net asset value, end of period | $21.09 | $19.22 | $17.51 | $18.66 | $14.99 |
| Total ReturnD | 10.90% | 12.93% | (4.21)% | 26.34% | 1.56% |
| Ratios to Average Net AssetsE,F | | | | | |
| Expenses before reductions | 1.28% | 1.20% | 1.12% | 1.14% | 1.16% |
| Expenses net of fee waivers, if any | 1.27% | 1.19% | 1.12% | 1.14% | 1.16% |
| Expenses net of all reductions | 1.27% | 1.19% | 1.11% | 1.14% | 1.16% |
| Net investment income (loss) | .09% | .93% | .91% | .90% | .91% |
| Supplemental Data | | | | | |
| Net assets, end of period (000 omitted) | $113,041 | $142,854 | $159,968 | $164,878 | $155,551 |
| Portfolio turnover rateG | 20% | 17% | 19% | 11% | 24% |
A Calculated based on average shares outstanding during the period.
B Total distributions per share do not sum due to rounding.
C Amount represents less than $.005 per share.
D Total returns would have been lower if certain expenses had not been reduced during the applicable periods shown.
E Fees and expenses of any underlying mutual funds or exchange-traded funds (ETFs) are not included in the Fund's expense ratio. The Fund indirectly bears its proportionate share of these expenses. For additional expense information related to investments in Fidelity Central Funds, please refer to the "Investments in Fidelity Central Funds" note found in the Notes to Financial Statements section of the most recent Annual or Semi-Annual report.
F Expense ratios reflect operating expenses of the class. Expenses before reductions do not reflect amounts reimbursed, waived, or reduced through arrangements with the investment adviser, brokerage services, or other offset arrangements, if applicable, and do not represent the amount paid by the class during periods when reimbursements, waivers or reductions occur.
G Amount does not include the portfolio activity of any underlying mutual funds or exchange-traded funds (ETFs).
See accompanying notes which are an integral part of the financial statements.
Fidelity International Small Cap Opportunities Fund Class Z
| Years ended October 31, | 2020 | 2019 | 2018 A |
| Selected Per–Share Data | | | |
| Net asset value, beginning of period | $19.20 | $17.51 | $19.11 |
| Income from Investment Operations | | | |
| Net investment income (loss)B | .05 | .19 | –C |
| Net realized and unrealized gain (loss) | 2.05 | 2.02 | (1.60) |
| Total from investment operations | 2.10 | 2.21 | (1.60) |
| Distributions from net investment income | (.20) | (.20) | – |
| Distributions from net realized gain | (.05) | (.31) | – |
| Total distributions | (.25) | (.52)D | – |
| Redemption fees added to paid in capitalB | – | – | – |
| Net asset value, end of period | $21.05 | $19.20 | $17.51 |
| Total ReturnE,F | 11.03% | 13.10% | (8.37)% |
| Ratios to Average Net AssetsG,H | | | |
| Expenses before reductions | 1.14% | 1.05% | 1.03%I |
| Expenses net of fee waivers, if any | 1.13% | 1.05% | 1.03%I |
| Expenses net of all reductions | 1.13% | 1.05% | 1.02%I |
| Net investment income (loss) | .23% | 1.08% | .16%I |
| Supplemental Data | | | |
| Net assets, end of period (000 omitted) | $82,476 | $76,527 | $4,617 |
| Portfolio turnover rateJ | 20% | 17% | 19% |
A For the period October 2, 2018 (commencement of sale of shares) to October 31, 2018.
B Calculated based on average shares outstanding during the period.
C Amount represents less than $.005 per share.
D Total distributions per share do not sum due to rounding.
E Total returns for periods of less than one year are not annualized.
F Total returns would have been lower if certain expenses had not been reduced during the applicable periods shown.
G Fees and expenses of any underlying mutual funds or exchange-traded funds (ETFs) are not included in the Fund's expense ratio. The Fund indirectly bears its proportionate share of these expenses. For additional expense information related to investments in Fidelity Central Funds, please refer to the "Investments in Fidelity Central Funds" note found in the Notes to Financial Statements section of the most recent Annual or Semi-Annual report.
H Expense ratios reflect operating expenses of the class. Expenses before reductions do not reflect amounts reimbursed, waived, or reduced through arrangements with the investment adviser, brokerage services, or other offset arrangements, if applicable, and do not represent the amount paid by the class during periods when reimbursements, waivers or reductions occur.
I Annualized
J Amount does not include the portfolio activity of any underlying mutual funds or exchange-traded funds (ETFs).
See accompanying notes which are an integral part of the financial statements.
Notes to Financial Statements
For the period ended October 31, 2020
1. Organization.
Fidelity International Small Cap Opportunities Fund (the Fund) is a fund of Fidelity Investment Trust (the Trust) and is authorized to issue an unlimited number of shares. The Trust is registered under the Investment Company Act of 1940, as amended (the 1940 Act), as an open-end management investment company organized as a Massachusetts business trust. The Fund offers Class A, Class M, Class C, International Small Cap Opportunities, Class I and Class Z shares, each of which has equal rights as to assets and voting privileges. Effective after the close of business on May 31, 2019, the Fund was closed to new accounts with certain exceptions. Each class has exclusive voting rights with respect to matters that affect that class. Class C shares will automatically convert to Class A shares after a holding period of ten years from the initial date of purchase, with certain exceptions.
Effective January 1, 2020:
Investment advisers Fidelity Investments Money Management, Inc., FMR Co., Inc., and Fidelity SelectCo, LLC, merged with and into Fidelity Management & Research Company. In connection with the merger transactions, the resulting, merged investment adviser was then redomiciled from Massachusetts to Delaware, changed its corporate structure from a corporation to a limited liability company, and changed its name to "Fidelity Management & Research Company LLC".
Broker-dealer Fidelity Distributors Corporation merged with and into Fidelity Investments Institutional Services Company, Inc. ("FIISC"). FIISC was then redomiciled from Massachusetts to Delaware, changed its corporate structure from a corporation to a limited liability company, and changed its name to "Fidelity Distributors Company LLC".
Fidelity Investments Institutional Operations Company, Inc. converted from a Massachusetts corporation to a Massachusetts LLC, and changed its name to "Fidelity Investments Institutional Operations Company LLC".
2. Investments in Fidelity Central Funds.
The Fund invests in Fidelity Central Funds, which are open-end investment companies generally available only to other investment companies and accounts managed by the investment adviser and its affiliates. The Fund's Schedule of Investments lists each of the Fidelity Central Funds held as of period end, if any, as an investment of the Fund, but does not include the underlying holdings of each Fidelity Central Fund. As an Investing Fund, the Fund indirectly bears its proportionate share of the expenses of the underlying Fidelity Central Funds.
The Money Market Central Funds seek preservation of capital and current income and are managed by the investment adviser. Annualized expenses of the Money Market Central Funds as of their most recent shareholder report date ranged from less than .005% to .01%.
A complete unaudited list of holdings for each Fidelity Central Fund is available upon request or at the Securities and Exchange Commission (the SEC) website at www.sec.gov. In addition, the financial statements of the Fidelity Central Funds, which are not covered by the Fund's Report of Independent Registered Public Accounting Firm, are available on the SEC website or upon request.
3. Significant Accounting Policies.
The Fund is an investment company and applies the accounting and reporting guidance of the Financial Accounting Standards Board (FASB) Accounting Standards Codification Topic 946 Financial Services – Investment Companies. The financial statements have been prepared in conformity with accounting principles generally accepted in the United States of America (GAAP), which require management to make certain estimates and assumptions at the date of the financial statements. Actual results could differ from those estimates. Subsequent events, if any, through the date that the financial statements were issued have been evaluated in the preparation of the financial statements. The following summarizes the significant accounting policies of the Fund:
Investment Valuation. Investments are valued as of 4:00 p.m. Eastern time on the last calendar day of the period. The Board of Trustees (the Board) has delegated the day to day responsibility for the valuation of the Fund's investments to the Fair Value Committee (the Committee) established by the Fund's investment adviser. In accordance with valuation policies and procedures approved by the Board, the Fund attempts to obtain prices from one or more third party pricing vendors or brokers to value its investments. When current market prices, quotations or currency exchange rates are not readily available or reliable, investments will be fair valued in good faith by the Committee, in accordance with procedures adopted by the Board. Factors used in determining fair value vary by investment type and may include market or investment specific events. The frequency with which these procedures are used cannot be predicted and they may be utilized to a significant extent. The Committee oversees the Fund's valuation policies and procedures and reports to the Board on the Committee's activities and fair value determinations. The Board monitors the appropriateness of the procedures used in valuing the Fund's investments and ratifies the fair value determinations of the Committee.
The Fund categorizes the inputs to valuation techniques used to value its investments into a disclosure hierarchy consisting of three levels as shown below:
- Level 1 – quoted prices in active markets for identical investments
- Level 2 – other significant observable inputs (including quoted prices for similar investments, interest rates, prepayment speeds, etc.)
- Level 3 – unobservable inputs (including the Fund's own assumptions based on the best information available)
Valuation techniques used to value the Fund's investments by major category are as follows:
Equity securities, including restricted securities, for which market quotations are readily available, are valued at the last reported sale price or official closing price as reported by a third party pricing vendor on the primary market or exchange on which they are traded and are categorized as Level 1 in the hierarchy. In the event there were no sales during the day or closing prices are not available, securities are valued at the last quoted bid price or may be valued using the last available price and are generally categorized as Level 2 in the hierarchy. For foreign equity securities, when market or security specific events arise, comparisons to the valuation of American Depositary Receipts (ADRs), futures contracts, Exchange-Traded Funds (ETFs) and certain indexes as well as quoted prices for similar securities may be used and would be categorized as Level 2 in the hierarchy. For equity securities, including restricted securities, where observable inputs are limited, assumptions about market activity and risk are used and these securities may be categorized as Level 3 in the hierarchy.
ETFs are valued at their last sale price or official closing price as reported by a third party pricing vendor on the primary market or exchange on which they are traded and are categorized as Level 1 in the hierarchy. In the event there were no sales during the day but the exchange reports a closing bid level, ETFs are valued at the closing bid and would be categorized as Level 1 in the hierarchy. In the event there was no closing bid, ETFs may be valued by another method that the Board believes reflects fair value in accordance with the Board's fair value pricing policies and may be categorized as Level 2 in the hierarchy.
Investments in open-end mutual funds, including the Fidelity Central Funds, are valued at their closing net asset value (NAV) each business day and are categorized as Level 1 in the hierarchy.
Changes in valuation techniques may result in transfers in or out of an assigned level within the disclosure hierarchy. The aggregate value of investments by input level as of October 31, 2020 is included at the end of the Fund's Schedule of Investments.
Foreign Currency. Certain Funds may use foreign currency contracts to facilitate transactions in foreign-denominated securities. Gains and losses from these transactions may arise from changes in the value of the foreign currency or if the counterparties do not perform under the contracts' terms.
Foreign-denominated assets, including investment securities, and liabilities are translated into U.S. dollars at the exchange rates at period end. Purchases and sales of investment securities, income and dividends received, and expenses denominated in foreign currencies are translated into U.S. dollars at the exchange rate in effect on the transaction date.
The effects of exchange rate fluctuations on investments are included with the net realized and unrealized gain (loss) on investment securities. Other foreign currency transactions resulting in realized and unrealized gain (loss) are disclosed separately.
Investment Transactions and Income. For financial reporting purposes, the Fund's investment holdings and NAV include trades executed through the end of the last business day of the period. The NAV per share for processing shareholder transactions is calculated as of the close of business of the New York Stock Exchange (NYSE), normally 4:00 p.m. Eastern time and includes trades executed through the end of the prior business day. Gains and losses on securities sold are determined on the basis of identified cost. Dividend income is recorded on the ex-dividend date, except for certain dividends from foreign securities where the ex-dividend date may have passed, which are recorded as soon as the Fund is informed of the ex-dividend date. Non-cash dividends included in dividend income, if any, are recorded at the fair market value of the securities received. Income and capital gain distributions from Fidelity Central Funds, if any, are recorded on the ex-dividend date. Certain distributions received by the Fund represent a return of capital or capital gain. The Fund determines the components of these distributions subsequent to the ex-dividend date, based upon receipt of tax filings or other correspondence relating to the underlying investment. These distributions are recorded as a reduction of cost of investments and/or as a realized gain. Investment income is recorded net of foreign taxes withheld where recovery of such taxes is uncertain.
Class Allocations and Expenses. Investment income, realized and unrealized capital gains and losses, common expenses of the Fund, and certain fund-level expense reductions, if any, are allocated daily on a pro-rata basis to each class based on the relative net assets of each class to the total net assets of the Fund. Each class differs with respect to transfer agent and distribution and service plan fees incurred. Certain expense reductions may also differ by class. For the reporting period, the allocated portion of income and expenses to each class as a percent of its average net assets may vary due to the timing of recording these transactions in relation to fluctuating net assets of the classes. Expenses directly attributable to a fund are charged to that fund. Expenses attributable to more than one fund are allocated among the respective funds on the basis of relative net assets or other appropriate methods. Expense estimates are accrued in the period to which they relate and adjustments are made when actual amounts are known.
Income Tax Information and Distributions to Shareholders. Each year, the Fund intends to qualify as a regulated investment company under Subchapter M of the Internal Revenue Code, including distributing substantially all of its taxable income and realized gains. As a result, no provision for U.S. Federal income taxes is required. As of October 31, 2020, the Fund did not have any unrecognized tax benefits in the financial statements; nor is the Fund aware of any tax positions for which it is reasonably possible that the total amounts of unrecognized tax benefits will significantly change in the next twelve months. The Fund files a U.S. federal tax return, in addition to state and local tax returns as required. The Fund's federal income tax returns are subject to examination by the Internal Revenue Service (IRS) for a period of three fiscal years after they are filed. State and local tax returns may be subject to examination for an additional fiscal year depending on the jurisdiction. Foreign taxes are provided for based on the Fund's understanding of the tax rules and rates that exist in the foreign markets in which it invests. The Fund is subject to a tax imposed on capital gains by certain countries in which it invests. An estimated deferred tax liability for net unrealized appreciation on the applicable securities is included in Other payables and accrued expenses on the Statement of Assets & Liabilities.
Distributions are declared and recorded on the ex-dividend date. Income and capital gain distributions are declared separately for each class. Income and capital gain distributions are determined in accordance with income tax regulations, which may differ from GAAP.
Capital accounts within the financial statements are adjusted for permanent book-tax differences. These adjustments have no impact on net assets or the results of operations. Capital accounts are not adjusted for temporary book-tax differences which will reverse in a subsequent period.
Book-tax differences are primarily due to foreign currency transactions, certain foreign taxes, passive foreign investment companies (PFIC), capital loss carryforwards and losses deferred due to wash sales and excise tax regulations.
As of period end, the cost and unrealized appreciation (depreciation) in securities, and derivatives if applicable, for federal income tax purposes were as follows:
| Gross unrealized appreciation | $532,558,971 |
| Gross unrealized depreciation | (60,689,489) |
| Net unrealized appreciation (depreciation) | $471,869,482 |
| Tax Cost | $937,396,310 |
The tax-based components of distributable earnings as of period end were as follows:
| Capital loss carryforward | $(34,028,193) |
| Net unrealized appreciation (depreciation) on securities and other investments | $(471,920,403) |
Capital loss carryforwards are only available to offset future capital gains of the Fund to the extent provided by regulations and may be limited. The capital loss carryforward information presented below, including any applicable limitation, is estimated as of fiscal period end and is subject to adjustment.
| No expiration | |
| Short-term | $(13,871,542) |
| Long-term | (20,156,651) |
| Total capital loss carryforward | $(34,028,193) |
The Fund intends to elect to defer to its next fiscal year $3,592,305 of ordinary losses recognized during the period January 1, 2020 to October 31, 2020.
The tax character of distributions paid was as follows:
| | October 31, 2020 | October 31, 2019 |
| Ordinary Income | $15,254,562 | $ 12,482,676 |
| Long-term Capital Gains | – | 19,924,614 |
| Total | $15,254,562 | $ 32,407,290 |
Restricted Securities (including Private Placements). The Fund may invest in securities that are subject to legal or contractual restrictions on resale. These securities generally may be resold in transactions exempt from registration or to the public if the securities are registered. Disposal of these securities may involve time-consuming negotiations and expense, and prompt sale at an acceptable price may be difficult. Information regarding restricted securities is included at the end of the Fund's Schedule of Investments.
4. Purchases and Sales of Investments.
Purchases and sales of securities, other than short-term securities are noted in the table below.
| | Purchases ($) | Sales ($) |
| Fidelity International Small Cap Opportunities Fund | 253,641,842 | 307,633,185 |
5. Fees and Other Transactions with Affiliates.
Management Fee. Fidelity Management & Research Company LLC (the investment adviser) and its affiliates provide the Fund with investment management related services for which the Fund pays a monthly management fee. The management fee is the sum of an individual fund fee rate that is based on an annual rate of .60% of the Fund's average net assets and an annualized group fee rate that averaged .23% during the period. The group fee rate is based upon the monthly average net assets of a group of registered investment companies with which the investment adviser has management contracts. The group fee rate decreases as assets under management increase and increases as assets under management decrease. In addition, the management fee is subject to a performance adjustment (up to a maximum of +/-.20 % of the Fund's average net assets over a 36 month performance period). The upward or downward adjustment to the management fee is based on the relative investment performance of International Small Cap Opportunities as compared to its benchmark index, the MSCI EAFE Small Cap Index, over the same 36 month performance period. For the reporting period, the total annual management fee rate, including the performance adjustment, was 1.02% of the Fund's average net assets. The performance adjustment included in the management fee rate may be higher or lower than the maximum performance adjustment rate due to the difference between the average net assets for the reporting and performance periods.
Distribution and Service Plan Fees. In accordance with Rule 12b-1 of the 1940 Act, the Fund has adopted separate Distribution and Service Plans for each class of shares. Certain classes pay Fidelity Distributors Company LLC (FDC), an affiliate of the investment adviser, separate Distribution and Service Fees, each of which is based on an annual percentage of each class' average net assets. In addition, FDC may pay financial intermediaries for selling shares of the Fund and providing shareholder support services. For the period, the Distribution and Service Fee rates, total fees and amounts retained by FDC were as follows:
| | Distribution Fee | Service Fee | Total Fees | Retained by FDC |
| Class A | -% | .25% | $96,948 | $693 |
| Class M | .25% | .25% | 65,204 | 461 |
| Class C | .75% | .25% | 81,947 | 3,163 |
| | | | $244,099 | $4,317 |
Sales Load. FDC may receive a front-end sales charge of up to 5.75% for selling Class A shares and 3.50% for selling Class M shares, some of which is paid to financial intermediaries for selling shares of the Fund. Depending on the holding period, FDC may receive contingent deferred sales charges levied on Class A, Class M and Class C redemptions. The deferred sales charges are 1.00% for Class C shares, 1.00% for certain purchases of Class A shares and .25% for certain purchases of Class M shares.
For the period, sales charge amounts retained by FDC were as follows:
| | Retained by FDC |
| Class A | $4,747 |
| Class M | 746 |
| Class C(a) | 231 |
| | $5,724 |
(a) When Class C shares are initially sold, FDC pays commissions from its own resources to financial intermediaries through which the sales are made.
Transfer Agent Fees. Fidelity Investments Institutional Operations Company LLC (FIIOC), an affiliate of the investment adviser, is the transfer, dividend disbursing and shareholder servicing agent for each class of the Fund. FIIOC receives account fees and asset-based fees that vary according to the account size and type of account of the shareholders of the respective classes of the Fund, except for Class Z. FIIOC receives an asset-based fee of Class Z's average net assets. FIIOC pays for typesetting, printing and mailing of shareholder reports, except proxy statements. Effective February 1, 2020, the Board approved to change the fee for Class Z from .046% to .044%.
For the period, transfer agent fees for each class were as follows:
| | Amount | % of Class-Level Average Net Assets |
| Class A | $87,528 | .23 |
| Class M | 31,729 | .24 |
| Class C | 19,444 | .24 |
| International Small Cap Opportunities | 1,791,809 | .17 |
| Class I | 226,397 | .18 |
| Class Z | 36,446 | .04 |
| | $2,193,353 | |
Accounting Fees. Fidelity Service Company, Inc. (FSC), an affiliate of the investment adviser, maintains the Fund's accounting records. The accounting fee is based on the level of average net assets for each month. For the period, the fees were equivalent to the following annual rates:
| | % of Average Net Assets |
| Fidelity International Small Cap Opportunities Fund | .05 |
Brokerage Commissions. A portion of portfolio transactions were placed with brokerage firms which are affiliates of the investment adviser. Brokerage commissions are included in net realized gain (loss) and change in net unrealized appreciation (depreciation) in the Statement of Operations. The commissions paid to these affiliated firms were as follows:
| | Amount |
| Fidelity International Small Cap Opportunities Fund | $239 |
Interfund Trades. Funds may purchase from or sell securities to other Fidelity Funds under procedures adopted by the Board. The procedures have been designed to ensure these interfund trades are executed in accordance with Rule 17a-7 of the 1940 Act. Interfund trades are included within the respective purchases and sales amounts shown in the Purchases and Sales of Investments note.
Other. During the period, the investment adviser reimbursed the Fund for certain losses in the amount of $2,739.
6. Committed Line of Credit.
Certain Funds participate with other funds managed by the investment adviser or an affiliate in a $4.25 billion credit facility (the "line of credit") to be utilized for temporary or emergency purposes to fund shareholder redemptions or for other short-term liquidity purposes. The participating funds have agreed to pay commitment fees on their pro-rata portion of the line of credit, which are reflected in Miscellaneous expenses on the Statement of Operations, and are as follows:
| | Amount |
| Fidelity International Small Cap Opportunities Fund | $3,109 |
During the period, there were no borrowings on this line of credit.
7. Security Lending.
Funds lend portfolio securities from time to time in order to earn additional income. Lending agents are used, including National Financial Services (NFS), an affiliate of the investment adviser. Pursuant to a securities lending agreement, NFS will receive a fee, which is capped at 9.9% of a fund's daily lending revenue, for its services as lending agent. A fund may lend securities to certain qualified borrowers, including NFS. On the settlement date of the loan, a fund receives collateral (in the form of U.S. Treasury obligations, letters of credit and/or cash) against the loaned securities and maintains collateral in an amount not less than 100% of the market value of the loaned securities during the period of the loan. The market value of the loaned securities is determined at the close of business of a fund and any additional required collateral is delivered to a fund on the next business day. A fund or borrower may terminate the loan at any time, and if the borrower defaults on its obligation to return the securities loaned because of insolvency or other reasons, a fund may apply collateral received from the borrower against the obligation. A fund may experience delays and costs in recovering the securities loaned. Any cash collateral received is invested in the Fidelity Securities Lending Cash Central Fund. Any loaned securities are identified as such in the Schedule of Investments, and the value of loaned securities and cash collateral at period end, as applicable, are presented in the Statement of Assets and Liabilities. Security lending income represents the income earned on investing cash collateral, less rebates paid to borrowers and any lending agent fees associated with the loan, plus any premium payments received for lending certain types of securities. Security lending income is presented in the Statement of Operations as a component of income from Fidelity Central Funds. Affiliated security lending activity, if any, was as follows:
| | Total Security Lending Income Fees Paid to NFS | Security Lending Income From Securities Loaned to NFS | Value of Securities Loaned to NFS at Period End |
| Fidelity International Small Cap Opportunities Fund | $2,447 | $– | $– |
8. Expense Reductions.
Commissions paid to certain brokers with whom the investment adviser, or its affiliates, places trades on behalf of the Fund include an amount in addition to trade execution, which may be rebated back to the Fund to offset certain expenses. This amount totaled $87,834 for the period. In addition, through arrangements with the Fund's custodian, credits realized as a result of certain uninvested cash balances were used to reduce the Fund's expenses. During the period, custodian credits reduced the Fund's expenses by $189.
In addition, during the period the investment adviser or an affiliate reimbursed and/or waived a portion of fund-level operating expenses in the amount of $5,619.
In addition, during the period the investment adviser or an affiliate reimbursed the Fund $12,370 for an operational error which is included in the accompanying Statement of Operations.
9. Distributions to Shareholders.
Distributions to shareholders of each class were as follows:
| | Year ended
October 31, 2020 | Year ended
October 31, 2019 |
| Distributions to shareholders | | |
| Class A | $359,710 | $994,541 |
| Class M | 83,402 | 282,415 |
| Class C | – | 249,469 |
| International Small Cap Opportunities | 12,239,552 | 26,356,595 |
| Class I | 1,565,823 | 4,287,454 |
| Class Z | 1,006,075 | 236,816 |
| Total | $15,254,562 | $32,407,290 |
10. Share Transactions.
Share transactions for each class were as follows and may contain automatic conversions between classes or exchanges between affiliated funds:
| | Shares | Shares | Dollars | Dollars |
| | Year ended October 31, 2020 | Year ended October 31, 2019 | Year ended October 31, 2020 | Year ended October 31, 2019 |
| Class A | | | | |
| Shares sold | 115,472 | 423,049 | $2,239,031 | $7,405,618 |
| Reinvestment of distributions | 17,715 | 59,448 | 352,696 | 971,383 |
| Shares redeemed | (513,295) | (667,182) | (9,586,714) | (11,683,968) |
| Net increase (decrease) | (380,108) | (184,685) | $(6,994,987) | $(3,306,967) |
| Class M | | | | |
| Shares sold | 28,870 | 79,729 | $539,626 | $1,409,014 |
| Reinvestment of distributions | 4,174 | 17,248 | 82,571 | 280,108 |
| Shares redeemed | (133,118) | (132,596) | (2,431,470) | (2,312,809) |
| Net increase (decrease) | (100,074) | (35,619) | $(1,809,273) | $(623,687) |
| Class C | | | | |
| Shares sold | 10,065 | 52,441 | $184,762 | $867,877 |
| Reinvestment of distributions | – | 15,575 | – | 246,701 |
| Shares redeemed | (163,713) | (420,073) | (2,889,355) | (7,170,818) |
| Net increase (decrease) | (153,648) | (352,057) | $(2,704,593) | $(6,056,240) |
| International Small Cap Opportunities | | | | |
| Shares sold | 11,210,670 | 9,303,310 | $208,124,787 | $164,068,281 |
| Reinvestment of distributions | 478,896 | 1,247,133 | 9,619,511 | 20,565,227 |
| Shares redeemed | (11,175,902) | (11,525,534) | (207,443,272) | (203,368,630) |
| Net increase (decrease) | 513,664 | (975,091) | $10,301,026 | $(18,735,122) |
| Class I | | | | |
| Shares sold | 664,029 | 4,794,543 | $12,154,759 | $83,925,837 |
| Reinvestment of distributions | 63,166 | 211,847 | 1,268,187 | 3,489,125 |
| Shares redeemed | (2,798,174) | (6,712,845) | (52,655,386) | (120,051,412) |
| Net increase (decrease) | (2,070,979) | (1,706,455) | $(39,232,440) | $(32,636,450) |
| Class Z | | | | |
| Shares sold | 2,354,520 | 4,282,903 | $45,294,900 | $75,981,672 |
| Reinvestment of distributions | 33,724 | 12,712 | 675,012 | 208,865 |
| Shares redeemed | (2,456,243) | (573,920) | (50,588,414) | (10,264,777) |
| Net increase (decrease) | (67,999) | 3,721,695 | $(4,618,502) | $65,925,760 |
11. Other.
The Fund's organizational documents provide former and current trustees and officers with a limited indemnification against liabilities arising in connection with the performance of their duties to the Fund. In the normal course of business, the Fund may also enter into contracts that provide general indemnifications. The Fund's maximum exposure under these arrangements is unknown as this would be dependent on future claims that may be made against the Fund. The risk of material loss from such claims is considered remote.
12. Coronavirus (COVID-19) Pandemic.
An outbreak of COVID-19 first detected in China during December 2019 has since spread globally and was declared a pandemic by the World Health Organization during March 2020. Developments that disrupt global economies and financial markets, such as the COVID-19 pandemic, may magnify factors that affect the Fund's performance.
Report of Independent Registered Public Accounting Firm
To the Board of Trustees of Fidelity Investment Trust and Shareholders of Fidelity International Small Cap Opportunities Fund:
Opinion on the Financial Statements and Financial Highlights
We have audited the accompanying statement of assets and liabilities of Fidelity International Small Cap Opportunities Fund (the "Fund"), a fund of Fidelity Investment Trust, including the schedule of investments, as of October 31, 2020, the related statement of operations for the year then ended, the statement of changes in net assets for each of the two years in the period then ended, the financial highlights for each of the five years in the period then ended, and the related notes. In our opinion, the financial statements and financial highlights present fairly, in all material respects, the financial position of the Fund as of October 31, 2020, and the results of its operations for the year then ended, the changes in its net assets for each of the two years in the period then ended, and the financial highlights for each of the five years in the period then ended in conformity with accounting principles generally accepted in the United States of America.
Basis for Opinion
These financial statements and financial highlights are the responsibility of the Fund's management. Our responsibility is to express an opinion on the Fund's financial statements and financial highlights based on our audits. We are a public accounting firm registered with the Public Company Accounting Oversight Board (United States) (PCAOB) and are required to be independent with respect to the Fund in accordance with the U.S. federal securities laws and the applicable rules and regulations of the Securities and Exchange Commission and the PCAOB.
We conducted our audits in accordance with the standards of the PCAOB. Those standards require that we plan and perform the audit to obtain reasonable assurance about whether the financial statements and financial highlights are free of material misstatement, whether due to error or fraud. The Fund is not required to have, nor were we engaged to perform, an audit of its internal control over financial reporting. As part of our audits we are required to obtain an understanding of internal control over financial reporting but not for the purpose of expressing an opinion on the effectiveness of the Fund’s internal control over financial reporting. Accordingly, we express no such opinion.
Our audits included performing procedures to assess the risks of material misstatement of the financial statements and financial highlights, whether due to error or fraud, and performing procedures that respond to those risks. Such procedures included examining, on a test basis, evidence regarding the amounts and disclosures in the financial statements and financial highlights. Our audits also included evaluating the accounting principles used and significant estimates made by management, as well as evaluating the overall presentation of the financial statements and financial highlights. Our procedures included confirmation of securities owned as of October 31, 2020, by correspondence with the custodian and brokers; when replies were not received from brokers, we performed other auditing procedures. We believe that our audits provide a reasonable basis for our opinion.
/s/ Deloitte & Touche LLP
Boston, Massachusetts
December 14, 2020
We have served as the auditor of one or more of the Fidelity investment companies since 1999.
Trustees and Officers
The Trustees, Members of the Advisory Board (if any), and officers of the trust and fund, as applicable, are listed below. The Board of Trustees governs the fund and is responsible for protecting the interests of shareholders. The Trustees are experienced executives who meet periodically throughout the year to oversee the fund's activities, review contractual arrangements with companies that provide services to the fund, oversee management of the risks associated with such activities and contractual arrangements, and review the fund's performance. Except for Jonathan Chiel, each of the Trustees oversees 305 funds. Mr. Chiel oversees 176 funds.
The Trustees hold office without limit in time except that (a) any Trustee may resign; (b) any Trustee may be removed by written instrument, signed by at least two-thirds of the number of Trustees prior to such removal; (c) any Trustee who requests to be retired or who has become incapacitated by illness or injury may be retired by written instrument signed by a majority of the other Trustees; and (d) any Trustee may be removed at any special meeting of shareholders by a two-thirds vote of the outstanding voting securities of the trust. Each Trustee who is not an interested person (as defined in the 1940 Act) of the trust and the fund is referred to herein as an Independent Trustee. Each Independent Trustee shall retire not later than the last day of the calendar year in which his or her 75th birthday occurs. The Independent Trustees may waive this mandatory retirement age policy with respect to individual Trustees. Officers and Advisory Board Members hold office without limit in time, except that any officer or Advisory Board Member may resign or may be removed by a vote of a majority of the Trustees at any regular meeting or any special meeting of the Trustees. Except as indicated, each individual has held the office shown or other offices in the same company for the past five years.
The fund's Statement of Additional Information (SAI) includes more information about the Trustees. To request a free copy, call Fidelity at 1-800-544-8544 if you’re an individual investing directly with Fidelity, call 1-800-835-5092 if you’re a plan sponsor or participant with Fidelity as your recordkeeper or call 1-877-208-0098 on institutional accounts or if you’re an advisor or invest through one.
Experience, Skills, Attributes, and Qualifications of the Trustees. The Governance and Nominating Committee has adopted a statement of policy that describes the experience, qualifications, attributes, and skills that are necessary and desirable for potential Independent Trustee candidates (Statement of Policy). The Board believes that each Trustee satisfied at the time he or she was initially elected or appointed a Trustee, and continues to satisfy, the standards contemplated by the Statement of Policy. The Governance and Nominating Committee also engages professional search firms to help identify potential Independent Trustee candidates who have the experience, qualifications, attributes, and skills consistent with the Statement of Policy. From time to time, additional criteria based on the composition and skills of the current Independent Trustees, as well as experience or skills that may be appropriate in light of future changes to board composition, business conditions, and regulatory or other developments, have also been considered by the professional search firms and the Governance and Nominating Committee. In addition, the Board takes into account the Trustees' commitment and participation in Board and committee meetings, as well as their leadership of standing and ad hoc committees throughout their tenure.
In determining that a particular Trustee was and continues to be qualified to serve as a Trustee, the Board has considered a variety of criteria, none of which, in isolation, was controlling. The Board believes that, collectively, the Trustees have balanced and diverse experience, qualifications, attributes, and skills, which allow the Board to operate effectively in governing the fund and protecting the interests of shareholders. Information about the specific experience, skills, attributes, and qualifications of each Trustee, which in each case led to the Board's conclusion that the Trustee should serve (or continue to serve) as a trustee of the fund, is provided below.
Board Structure and Oversight Function. Robert A. Lawrence is an interested person and currently serves as Acting Chairman. The Trustees have determined that an interested Chairman is appropriate and benefits shareholders because an interested Chairman has a personal and professional stake in the quality and continuity of services provided to the fund. Independent Trustees exercise their informed business judgment to appoint an individual of their choosing to serve as Chairman, regardless of whether the Trustee happens to be independent or a member of management. The Independent Trustees have determined that they can act independently and effectively without having an Independent Trustee serve as Chairman and that a key structural component for assuring that they are in a position to do so is for the Independent Trustees to constitute a substantial majority for the Board. The Independent Trustees also regularly meet in executive session. Ned C. Lautenbach and David M. Thomas serve as Co-Lead Independent Trustees and as such each (i) acts as a liaison between the Independent Trustees and management with respect to matters important to the Independent Trustees and (ii) with management prepares agendas for Board meetings.
Fidelity® funds are overseen by different Boards of Trustees. The fund's Board oversees Fidelity's high income and certain equity funds, and other Boards oversee Fidelity's investment-grade bond, money market, asset allocation, and other equity funds. The asset allocation funds may invest in Fidelity® funds overseen by the fund's Board. The use of separate Boards, each with its own committee structure, allows the Trustees of each group of Fidelity® funds to focus on the unique issues of the funds they oversee, including common research, investment, and operational issues. On occasion, the separate Boards establish joint committees to address issues of overlapping consequences for the Fidelity® funds overseen by each Board.
The Trustees operate using a system of committees to facilitate the timely and efficient consideration of all matters of importance to the Trustees, the fund, and fund shareholders and to facilitate compliance with legal and regulatory requirements and oversight of the fund's activities and associated risks. The Board, acting through its committees, has charged FMR and its affiliates with (i) identifying events or circumstances the occurrence of which could have demonstrably adverse effects on the fund's business and/or reputation; (ii) implementing processes and controls to lessen the possibility that such events or circumstances occur or to mitigate the effects of such events or circumstances if they do occur; and (iii) creating and maintaining a system designed to evaluate continuously business and market conditions in order to facilitate the identification and implementation processes described in (i) and (ii) above. Because the day-to-day operations and activities of the fund are carried out by or through FMR, its affiliates, and other service providers, the fund's exposure to risks is mitigated but not eliminated by the processes overseen by the Trustees. While each of the Board's committees has responsibility for overseeing different aspects of the fund's activities, oversight is exercised primarily through the Operations, Audit, and Compliance Committees. Appropriate personnel, including but not limited to the fund's Chief Compliance Officer (CCO), FMR's internal auditor, the independent accountants, the fund's Treasurer and portfolio management personnel, make periodic reports to the Board's committees, as appropriate, including an annual review of Fidelity's risk management program for the Fidelity® funds. The responsibilities of each standing committee, including their oversight responsibilities, are described further under "Standing Committees of the Trustees."
Interested Trustees*:
Correspondence intended for a Trustee who is an interested person may be sent to Fidelity Investments, 245 Summer Street, Boston, Massachusetts 02210.
Name, Year of Birth; Principal Occupations and Other Relevant Experience+
Jonathan Chiel (1957)
Year of Election or Appointment: 2016
Trustee
Mr. Chiel also serves as Trustee of other Fidelity® funds. Mr. Chiel is Executive Vice President and General Counsel for FMR LLC (diversified financial services company, 2012-present). Previously, Mr. Chiel served as general counsel (2004-2012) and senior vice president and deputy general counsel (2000-2004) for John Hancock Financial Services; a partner with Choate, Hall & Stewart (1996-2000) (law firm); and an Assistant United States Attorney for the United States Attorney’s Office of the District of Massachusetts (1986-95), including Chief of the Criminal Division (1993-1995). Mr. Chiel is a director on the boards of the Boston Bar Foundation and the Maimonides School.
Robert A. Lawrence (1952)
Year of Election or Appointment: 2020
Trustee
Acting Chairman of the Board of Trustees
Mr. Lawrence also serves as Trustee of other funds. Previously, Mr. Lawrence served as a Member of the Advisory Board of certain funds. Prior to his retirement in 2008, Mr. Lawrence served as Vice President of certain Fidelity® funds (2006-2008), Senior Vice President, Head of High Income Division of Fidelity Management & Research Company (investment adviser firm, 2006-2008), and President of Fidelity Strategic Investments (investment adviser firm, 2002-2005).
* Determined to be an “Interested Trustee” by virtue of, among other things, his or her affiliation with the trust or various entities under common control with FMR.
+ The information includes the Trustee's principal occupation during the last five years and other information relating to the experience, attributes, and skills relevant to the Trustee's qualifications to serve as a Trustee, which led to the conclusion that the Trustee should serve as a Trustee for the fund.
Independent Trustees:
Correspondence intended for an Independent Trustee may be sent to Fidelity Investments, P.O. Box 55235, Boston, Massachusetts 02205-5235.
Name, Year of Birth; Principal Occupations and Other Relevant Experience+
Dennis J. Dirks (1948)
Year of Election or Appointment: 2005
Trustee
Mr. Dirks also serves as Trustee of other Fidelity® funds. Prior to his retirement in May 2003, Mr. Dirks served as Chief Operating Officer and as a member of the Board of The Depository Trust & Clearing Corporation (financial markets infrastructure), President, Chief Operating Officer and a member of the Board of The Depository Trust Company (DTC), President and a member of the Board of the National Securities Clearing Corporation (NSCC), Chief Executive Officer and a member of the Board of the Government Securities Clearing Corporation and Chief Executive Officer and a member of the Board of the Mortgage-Backed Securities Clearing Corporation. Mr. Dirks currently serves as a member of the Finance Committee (2016-present) and Board (2017-present) and is Treasurer (2018-present) of the Asolo Repertory Theatre.
Donald F. Donahue (1950)
Year of Election or Appointment: 2018
Trustee
Mr. Donahue also serves as Trustee of other Fidelity® funds. Mr. Donahue serves as President and Chief Executive Officer of Miranda Partners, LLC (risk consulting for the financial services industry, 2012-present). Previously, Mr. Donahue served as Chief Executive Officer (2006-2012), Chief Operating Officer (2003-2006) and Managing Director, Customer Marketing and Development (1999-2003) of The Depository Trust & Clearing Corporation (financial markets infrastructure). Mr. Donahue currently serves as a member (2007-present) and Co-Chairman (2016-present) of the Board of United Way of New York, a member of the Board of NYC Leadership Academy (2012-present) and a member of the Board of Advisors of Ripple Labs, Inc. (financial services, 2015-present). Mr. Donahue previously served as a member of the Advisory Board of certain Fidelity® funds (2015-2018).
Vicki L. Fuller (1957)
Year of Election or Appointment: 2020
Trustee
Ms. Fuller also serves as Trustee of other Fidelity® funds. Previously, Ms. Fuller served as a member of the Advisory Board of certain Fidelity® funds (2018-2020), Chief Investment Officer of the New York State Common Retirement Fund (2012-2018) and held a variety of positions at AllianceBernstein L.P. (global asset management, 1985-2012), including Managing Director (2006-2012) and Senior Vice President and Senior Portfolio Manager (2001-2006). Ms. Fuller currently serves as a member of the Board, Audit Committee and Nominating and Governance Committee of The Williams Companies, Inc. (natural gas infrastructure, 2018-present), as a member of the Board, Audit Committee and Nominating and Governance Committee of two Blackstone business development companies (2020-present) and as a member of the Board of Treliant, LLC (consulting, 2019-present).
Patricia L. Kampling (1959)
Year of Election or Appointment: 2020
Trustee
Ms. Kampling also serves as Trustee of other Fidelity® funds. Prior to her retirement, Ms. Kampling served as Chairman of the Board and Chief Executive Officer (2012-2019), President and Chief Operating Officer (2011-2012) and Executive Vice President and Chief Financial Officer (2010-2011) of Alliant Energy Corporation. Ms. Kampling currently serves as a member of the Board, Compensation Committee and Executive Committee and as Chair of the Audit Committee of Briggs & Stratton Corporation (manufacturing, 2011-present) and as a member of the Board, Audit, Finance and Risk Committee and Safety, Environmental, Technology and Operations Committee of American Water Works Company, Inc. (utilities company, 2019-present). In addition, Ms. Kampling currently serves as a member of the Board of the Nature Conservancy, Wisconsin Chapter (2019-present). Previously, Ms. Kampling served as a Member of the Advisory Board of certain Fidelity® funds (2020), a member of the Board of Interstate Power and Light Company (2012-2019) and Wisconsin Power and Light Company (2012-2019) (each a subsidiary of Alliant Energy Corporation) and as a member of the Board and Workforce Development Committee of the Business Roundtable (2018-2019).
Alan J. Lacy (1953)
Year of Election or Appointment: 2008
Trustee
Mr. Lacy also serves as Trustee of other Fidelity® funds. Previously, Mr. Lacy served as Senior Adviser (2007-2014) of Oak Hill Capital Partners, L.P. (private equity), Chief Executive Officer (2005) and Vice Chairman (2005-2006) of Sears Holdings Corporation (retail), Chief Executive Officer and Chairman of the Board of Sears, Roebuck and Co. (retail, 2000-2005), Chairman (2014-2017) and a member of the Board (2010-2017) of Dave & Buster’s Entertainment, Inc. (restaurant and entertainment complexes) and a member of the Board of Bristol-Myers Squibb Company (global pharmaceuticals, 2008-2020). Mr. Lacy currently serves as a Trustee of the California Chapter of The Nature Conservancy (2015-present) and a member of the Board of the Center for Advanced Study in the Behavioral Sciences at Stanford University (2015-present).
Ned C. Lautenbach (1944)
Year of Election or Appointment: 2000
Trustee
Co-Lead Independent Trustee
Mr. Lautenbach also serves as Trustee of other Fidelity® funds. Mr. Lautenbach currently serves as Chair of the Board of Governors, State University System of Florida (2013-present) and is a member of the Council on Foreign Relations (1994-present). He is also a member and has in the past served as Chairman of the Board of Directors of Artis-Naples (2012-present). Previously, Mr. Lautenbach served as a member and then Lead Director of the Board of Directors of Eaton Corporation (diversified industrial, 1997-2016). He was also a Partner at Clayton, Dubilier & Rice, LLC (private equity investment, 1998-2010); as well as Director of Sony Corporation (2006-2007). In addition, Mr. Lautenbach had a 30-year career with IBM (technology company), during which time he served as Senior Vice President and as a member of the Corporate Executive Committee (1968-1998).
Joseph Mauriello (1944)
Year of Election or Appointment: 2008
Trustee
Mr. Mauriello also serves as Trustee of other Fidelity® funds. Prior to his retirement in January 2006, Mr. Mauriello served in numerous senior management positions including Deputy Chairman and Chief Operating Officer (2004-2005), and Vice Chairman of Financial Services (2002-2004) of KPMG LLP US (professional services, 1965-2005). Mr. Mauriello currently serves as a member of the Independent Directors Council Governing Council (2015-present). Previously, Mr. Mauriello served as a member of the Board of XL Group plc. (global insurance and re-insurance, 2006-2018).
Cornelia M. Small (1944)
Year of Election or Appointment: 2005
Trustee
Ms. Small also serves as Trustee of other Fidelity® funds. Previously, Ms. Small served as Chief Investment Officer, Director of Global Equity Investments and a member of Scudder, Stevens & Clark and Scudder Kemper Investments. Ms. Small previously served as a member of the Board (2009-2019) and Chair of the Investment Committee (2010-2019) of the Teagle Foundation and a member of the Investment Committee of the Berkshire Taconic Community Foundation (2008-2019).
Garnett A. Smith (1947)
Year of Election or Appointment: 2018
Trustee
Mr. Smith also serves as Trustee of other Fidelity® funds. Prior to his retirement, Mr. Smith served as Chairman and Chief Executive Officer (1990-1997) and President (1986-1990) of Inbrand Corp. (manufacturer of personal absorbent products). Prior to his employment with Inbrand Corp., he was employed by a retail fabric chain and North Carolina National Bank (now Bank of America). Mr. Smith previously served as a member of the Advisory Board of certain Fidelity® funds (2012-2013).
David M. Thomas (1949)
Year of Election or Appointment: 2008
Trustee
Co-Lead Independent Trustee
Mr. Thomas also serves as Trustee of other Fidelity® funds. Previously, Mr. Thomas served as Executive Chairman (2005-2006) and Chairman and Chief Executive Officer (2000-2005) of IMS Health, Inc. (pharmaceutical and healthcare information solutions). Mr. Thomas currently serves as Non-Executive Chairman of the Board of Fortune Brands Home and Security (home and security products, 2011-present), and a member of the Board (2004-present) and Presiding Director (2013-present) of Interpublic Group of Companies, Inc. (marketing communication).
Susan Tomasky (1953)
Year of Election or Appointment: 2020
Trustee
Ms. Tomasky also serves as Trustee of other Fidelity® funds. Prior to her retirement, Ms. Tomasky served in various executive officer positions at American Electric Power Company, Inc. (1998-2011), including most recently as President of AEP Transmission (2007-2011). Ms. Tomasky currently serves as a member of the Board and Sustainability Committee and as Chair of the Audit Committee of Marathon Petroleum Corporation (2018-present) and as a member of the Board, Corporate Governance Committee and Organization and Compensation Committee and as Chair of the Audit Committee of Public Service Enterprise Group, Inc. (utilities company, 2012-present). In addition, Ms. Tomasky currently serves as a member of the Board of the Columbus Regional Airport Authority (2007-present), as a member of the Board of the Royal Shakespeare Company – America (2009-present), as a member of the Board of the Columbus Association for the Performing Arts (2011-present) and as a member of the Board of Kenyon College (2016-present). Previously, Ms. Tomasky served as a Member of the Advisory Board of certain Fidelity® funds (2020), a member of the Board (2011-2019) and as Lead Independent Director (2015-2018) of Andeavor Corporation (previously Tesoro Corporation) (independent oil refiner and marketer) and as a member of the Board of Summit Midstream Partners LP (energy, 2012-2018).
Michael E. Wiley (1950)
Year of Election or Appointment: 2020
Trustee
Mr. Wiley also serves as Trustee of other Fidelity® funds. Previously, Mr. Wiley served as a member of the Advisory Board of certain Fidelity® funds (2018-2020), Chairman, President and CEO of Baker Hughes, Inc. (oilfield services, 2000-2004). Mr. Wiley also previously served as a member of the Board of Andeavor Corporation (independent oil refiner and marketer, 2005-2018), a member of the Board of Andeavor Logistics LP (natural resources logistics, 2015-2018) and a member of the Board of High Point Resources (exploration and production, 2005-2020).
+ The information includes the Trustee's principal occupation during the last five years and other information relating to the experience, attributes, and skills relevant to the Trustee's qualifications to serve as a Trustee, which led to the conclusion that the Trustee should serve as a Trustee for the fund.
Advisory Board Members and Officers:
Correspondence intended for a Member of the Advisory Board (if any) may be sent to Fidelity Investments, P.O. Box 55235, Boston, Massachusetts 02205-5235. Correspondence intended for an officer or Peter S. Lynch may be sent to Fidelity Investments, 245 Summer Street, Boston, Massachusetts 02210. Officers appear below in alphabetical order.
Name, Year of Birth; Principal Occupation
Lloyd James Austin, III (1953)
Year of Election or Appointment: 2020
Member of the Advisory Board
General Austin also serves as a Member of the Advisory Board of other Fidelity® funds. Prior to his retirement, General Austin (United States Army, Retired) held a variety of positions within the U.S. Government, including Commander, U.S. Central Command (2013-2016), Vice Chief of Staff, U.S. Army (2012-2013) and Commanding General, U.S. Forces – Iraq, Operation New Dawn (2010-2012). General Austin currently serves as a Partner of Pine Island Capital Partners (private equity, 2020-present) and as President of the Austin Strategy Group LLC (consulting, 2016-present). General Austin serves as a member of the Board of Directors of Nucor Corporation (steel products, 2017-present), as a member of the Board of Directors of Tenet Healthcare Corporation (2018-present) and as a member of the Board of Directors of Raytheon Technologies Corporation (aerospace and defense, 2020-present). In addition, General Austin currently serves as a member of the Board of Trustees of the Carnegie Corporation of New York (2017-present) and as a member of the Board of Trustees of Auburn University (2017-present). Previously, General Austin served as a member of the Board of Directors of United Technologies Corporation (aerospace, defense and building, 2016-2020).
Thomas A. Kennedy (1955)
Year of Election or Appointment: 2020
Member of the Advisory Board
Mr. Kennedy also serves as a Member of the Advisory Board of other Fidelity® funds. Previously, Mr. Kennedy held a variety of positions at Raytheon Company (aerospace and defense, 1983-2020), including Chairman and Chief Executive Officer (2014-2020) and Executive Vice President and Chief Operating Officer (2013-2014). Mr. Kennedy currently serves as Executive Chairman of the Board of Directors of Raytheon Technologies Corporation (aerospace and defense, 2020-present). He is also a member of the Rutgers School of Engineering Industry Advisory Board (2011-present) and a member of the UCLA Engineering Dean’s Executive Board (2016-present).
Peter S. Lynch (1944)
Year of Election or Appointment: 2003
Member of the Advisory Board
Mr. Lynch also serves as a Member of the Advisory Board of other Fidelity® funds. Mr. Lynch is Vice Chairman and a Director of Fidelity Management & Research Company LLC (investment adviser firm). In addition, Mr. Lynch serves as a Trustee of Boston College and as the Chairman of the Inner-City Scholarship Fund. Previously, Mr. Lynch served as Vice Chairman and a Director of FMR Co., Inc. (investment adviser firm) and on the Special Olympics International Board of Directors (1997-2006).
Elizabeth Paige Baumann (1968)
Year of Election or Appointment: 2017
Anti-Money Laundering (AML) Officer
Ms. Baumann also serves as AML Officer of other funds. She is Chief AML Officer (2012-present) and Senior Vice President (2014-present) of FMR LLC (diversified financial services company) and is an employee of Fidelity Investments. Previously, Ms. Baumann served as AML Officer of certain funds (2017-2019), as AML Officer of the funds (2012-2016), and Vice President (2007-2014) and Deputy Anti-Money Laundering Officer (2007-2012) of FMR LLC.
Craig S. Brown (1977)
Year of Election or Appointment: 2019
Assistant Treasurer
Mr. Brown also serves as Assistant Treasurer of other funds. Mr. Brown is an employee of Fidelity Investments (2013-present).
John J. Burke III (1964)
Year of Election or Appointment: 2018
Chief Financial Officer
Mr. Burke also serves as Chief Financial Officer of other funds. Mr. Burke serves as Head of Investment Operations for Fidelity Fund and Investment Operations (2018-present) and is an employee of Fidelity Investments (1998-present). Previously Mr. Burke served as head of Asset Management Investment Operations (2012-2018).
William C. Coffey (1969)
Year of Election or Appointment: 2019
Assistant Secretary
Mr. Coffey also serves as Assistant Secretary of other funds. He is Senior Vice President and Deputy General Counsel of FMR LLC (diversified financial services company, 2010-present), and is an employee of Fidelity Investments. Previously, Mr. Coffey served as Secretary and CLO of certain funds (2018-2019); CLO, Secretary, and Senior Vice President of Fidelity Management & Research Company and FMR Co., Inc. (investment adviser firms, 2018-2019); Secretary of Fidelity SelectCo, LLC and Fidelity Investments Money Management, Inc. (investment adviser firms, 2018-2019); CLO of Fidelity Management & Research (Hong Kong) Limited, FMR Investment Management (UK) Limited, and Fidelity Management & Research (Japan) Limited (investment adviser firms, 2018-2019); and Assistant Secretary of certain funds (2009-2018).
Timothy M. Cohen (1969)
Year of Election or Appointment: 2018
Vice President
Mr. Cohen also serves as Vice President of other funds. Mr. Cohen serves as Co-Head of Equity (2018-present), a Director of Fidelity Management & Research (Japan) Limited (investment adviser firm, 2016-present), and is an employee of Fidelity Investments. Previously, Mr. Cohen served as Executive Vice President of Fidelity SelectCo, LLC (2019), Head of Global Equity Research (2016-2018), Chief Investment Officer - Equity and a Director of Fidelity Management & Research (U.K.) Inc. (investment adviser firm, 2013-2015) and as a Director of Fidelity Management & Research (Hong Kong) Limited (investment adviser firm, 2017).
Jonathan Davis (1968)
Year of Election or Appointment: 2010
Assistant Treasurer
Mr. Davis also serves as Assistant Treasurer of other funds. Mr. Davis serves as Assistant Treasurer of FMR Capital, Inc. (2017-present) and is an employee of Fidelity Investments. Previously, Mr. Davis served as Vice President and Associate General Counsel of FMR LLC (diversified financial services company, 2003-2010).
Laura M. Del Prato (1964)
Year of Election or Appointment: 2018
Assistant Treasurer
Ms. Del Prato also serves as an officer of other funds. Ms. Del Prato is an employee of Fidelity Investments (2017-present). Previously, Ms. Del Prato served as President and Treasurer of The North Carolina Capital Management Trust: Cash Portfolio and Term Portfolio (2018-2020). Prior to joining Fidelity Investments, Ms. Del Prato served as a Managing Director and Treasurer of the JPMorgan Mutual Funds (2014-2017). Prior to JPMorgan, Ms. Del Prato served as a partner at Cohen Fund Audit Services (accounting firm, 2012-2013) and KPMG LLP (accounting firm, 2004-2012).
Colm A. Hogan (1973)
Year of Election or Appointment: 2020
Assistant Treasurer
Mr. Hogan also serves as an officer of other funds. Mr. Hogan serves as Assistant Treasurer of FMR Capital, Inc. (2017-present) and is an employee of Fidelity Investments (2005-present). Previously, Mr. Hogan served as Deputy Treasurer of certain Fidelity® funds (2016-2020) and Assistant Treasurer of certain Fidelity® funds (2016-2018).
Pamela R. Holding (1964)
Year of Election or Appointment: 2018
Vice President
Ms. Holding also serves as Vice President of other funds. Ms. Holding serves as Co-Head of Equity (2018-present) and is an employee of Fidelity Investments (2013-present). Previously, Ms. Holding served as Executive Vice President of Fidelity SelectCo, LLC (2019) and as Chief Investment Officer of Fidelity Institutional Asset Management (2013-2018).
Cynthia Lo Bessette (1969)
Year of Election or Appointment: 2019
Secretary and Chief Legal Officer (CLO)
Ms. Lo Bessette also serves as an officer of other funds. Ms. Lo Bessette serves as CLO, Secretary, and Senior Vice President of Fidelity Management & Research Company LLC (investment adviser firm, 2019-present); and CLO of Fidelity Management & Research (Hong Kong) Limited, FMR Investment Management (UK) Limited, and Fidelity Management & Research (Japan) Limited (investment adviser firms, 2019-present). She is a Senior Vice President and Deputy General Counsel of FMR LLC (diversified financial services company, 2019-present), and is an employee of Fidelity Investments. Previously, Ms. Lo Bessette served as CLO, Secretary, and Senior Vice President of FMR Co., Inc. (investment adviser firm, 2019); Secretary of Fidelity SelectCo, LLC and Fidelity Investments Money Management, Inc. (investment adviser firms, 2019). Prior to joining Fidelity Investments, Ms. Lo Bessette was Executive Vice President, General Counsel (2016-2019) and Senior Vice President, Deputy General Counsel (2015-2016) of OppenheimerFunds (investment management company) and Deputy Chief Legal Officer (2013-2015) of Jennison Associates LLC (investment adviser firm).
Chris Maher (1972)
Year of Election or Appointment: 2020
Deputy Treasurer
Mr. Maher also serves as an officer of other funds. Mr. Maher serves as Assistant Treasurer of FMR Capital, Inc. (2017-present), and is an employee of Fidelity Investments (2008-present). Previously, Mr. Maher served as Assistant Treasurer of certain funds (2013-2020); Vice President of Asset Management Compliance (2013), Vice President of the Program Management Group of FMR (investment adviser firm, 2010-2013), and Vice President of Valuation Oversight (2008-2010).
Jason P. Pogorelec (1975)
Year of Election or Appointment: 2020
Chief Compliance Officer
Mr. Pogorelec also serves as Chief Compliance Officer of other funds. Mr. Pogorelec is a senior Vice President of Asset Management Compliance for Fidelity Investments and is an employee of Fidelity Investments (2006-present). Previously, Mr. Pogorelec served as Vice President, Associate General Counsel for Fidelity Investments (2010-2020) and Assistant Secretary of certain Fidelity funds (2015-2020).
Stacie M. Smith (1974)
Year of Election or Appointment: 2016
President and Treasurer
Ms. Smith also serves as an officer of other funds. Ms. Smith serves as Assistant Treasurer of FMR Capital, Inc. (2017-present), is an employee of Fidelity Investments (2009-present), and has served in other fund officer roles. Prior to joining Fidelity Investments, Ms. Smith served as Senior Audit Manager of Ernst & Young LLP (accounting firm, 1996-2009). Previously, Ms. Smith served as Assistant Treasurer (2013-2019) and Deputy Treasurer (2013-2016) of certain Fidelity® funds.
Marc L. Spector (1972)
Year of Election or Appointment: 2016
Assistant Treasurer
Mr. Spector also serves as an officer of other funds. Mr. Spector serves as Assistant Treasurer of FMR Capital, Inc. (2017-present) and is an employee of Fidelity Investments (2016-present). Prior to joining Fidelity Investments, Mr. Spector served as Director at the Siegfried Group (accounting firm, 2013-2016), and prior to Siegfried Group as audit senior manager at Deloitte & Touche LLP (accounting firm, 2005-2013).
Jim Wegmann (1979)
Year of Election or Appointment: 2019
Assistant Treasurer
Mr. Wegmann also serves as Assistant Treasurer of other funds. Mr. Wegmann is an employee of Fidelity Investments (2011-present).
Shareholder Expense Example
As a shareholder, you incur two types of costs: (1) transaction costs, which may include sales charges (loads) on purchase payments or redemption proceeds, as applicable and (2) ongoing costs, which generally include management fees, distribution and/or service (12b-1) fees and other Fund expenses. This Example is intended to help you understand your ongoing costs (in dollars) of investing in a fund and to compare these costs with the ongoing costs of investing in other mutual funds.
The Example is based on an investment of $1,000 invested at the beginning of the period and held for the entire period (May 1, 2020 to October 31, 2020).
Actual Expenses
The first line of the accompanying table provides information about actual account values and actual expenses. You may use the information in this line, together with the amount you invested, to estimate the expenses that you paid over the period. Simply divide your account value by $1,000.00 (for example, an $8,600 account value divided by $1,000.00 = 8.6), then multiply the result by the number in the first line for a class/Fund under the heading entitled "Expenses Paid During Period" to estimate the expenses you paid on your account during this period. If any fund is a shareholder of any underlying mutual funds or exchange-traded funds (ETFs) (the Underlying Funds), such fund indirectly bears its proportional share of the expenses of the Underlying Funds in addition to the direct expenses incurred presented in the table. These fees and expenses are not included in the annualized expense ratio used to calculate the expense estimate in the table below.
Hypothetical Example for Comparison Purposes
The second line of the accompanying table provides information about hypothetical account values and hypothetical expenses based on the actual expense ratio and an assumed rate of return of 5% per year before expenses, which is not the actual return. The hypothetical account values and expenses may not be used to estimate the actual ending account balance or expenses you paid for the period. You may use this information to compare the ongoing costs of investing in the Fund and other funds. To do so, compare this 5% hypothetical example with the 5% hypothetical examples that appear in the shareholder reports of the other funds. If any fund is a shareholder of any Underlying Funds, such fund indirectly bears its proportional share of the expenses of the Underlying Funds in addition to the direct expenses as presented in the table. These fees and expenses are not included in the annualized expense ratio used to calculate the expense estimate in the table below.
Please note that the expenses shown in the table are meant to highlight your ongoing costs only and do not reflect any transaction costs. Therefore, the second line of the table is useful in comparing ongoing costs only, and will not help you determine the relative total costs of owning different funds. In addition, if these transactional costs were included, your costs would have been higher.
| | Annualized Expense Ratio-A | Beginning
Account Value
May 1, 2020 | Ending
Account Value
October 31, 2020 | Expenses Paid
During Period-B
May 1, 2020
to October 31, 2020 |
| Fidelity International Small Cap Opportunities Fund | | | | |
| Class A | 1.56% | | | |
| Actual | | $1,000.00 | $1,186.60 | $8.57 |
| Hypothetical-C | | $1,000.00 | $1,017.29 | $7.91 |
| Class M | 1.83% | | | |
| Actual | | $1,000.00 | $1,184.50 | $10.05 |
| Hypothetical-C | | $1,000.00 | $1,015.94 | $9.27 |
| Class C | 2.32% | | | |
| Actual | | $1,000.00 | $1,181.80 | $12.72 |
| Hypothetical-C | | $1,000.00 | $1,013.47 | $11.74 |
| International Small Cap Opportunities | 1.25% | | | |
| Actual | | $1,000.00 | $1,188.10 | $6.88 |
| Hypothetical-C | | $1,000.00 | $1,018.85 | $6.34 |
| Class I | 1.27% | | | |
| Actual | | $1,000.00 | $1,188.20 | $6.99 |
| Hypothetical-C | | $1,000.00 | $1,018.75 | $6.44 |
| Class Z | 1.13% | | | |
| Actual | | $1,000.00 | $1,188.60 | $6.22 |
| Hypothetical-C | | $1,000.00 | $1,019.46 | $5.74 |
A Annualized expense ratio reflects expenses net of applicable fee waivers.
B Expenses are equal to the annualized expense ratio, multiplied by the average account value over the period, multiplied by 184/ 366 (to reflect the one-half year period). The fees and expenses of any Underlying Funds are not included in each annualized expense ratio.
C 5% return per year before expenses
Distributions (Unaudited)
Class A, Class M, International Small Cap Opportunities, Class I, and Class Z designate 9% of the dividend distributed during the fiscal year as qualifying for the dividends–received deduction for corporate shareholders.
Class A, Class M, International Small Cap Opportunities, Class I, and Class Z designate 100% of the dividends distributed during the fiscal year as amounts which may be taken into account as a dividend for purposes of the maximum rate under section 1(h)(11) of the Internal Revenue Code.
The amounts per share which represent income derived from sources within, and taxes paid to, foreign countries or possessions of the United States are as follows:
| | Pay Date | Income | Taxes |
| Fidelity International Small Cap Opportunities Fund | | | |
| Class A | 12/09/2019 | $0.1945 | $0.0335 |
| Class M | 12/09/2019 | $0.1445 | $0.0335 |
| Class C | 12/09/2019 | $0.0000 | $0.0000 |
| International Small Cap Opportunities | 12/09/2019 | $0.2545 | $0.0335 |
| Class I | 12/09/2019 | $0.2445 | $0.0335 |
| Class Z | 12/09/2019 | $0.2835 | $0.0335 |
The fund will notify shareholders in January 2021 of amounts for use in preparing 2020 income tax returns.
Proxy Voting Results
A special meeting of shareholders was held on June 9, 2020. The results of votes taken among shareholders on the proposals before them are reported below. Each vote reported represents one dollar of net asset value held on the record date for the meeting.
PROPOSAL 1
To elect a Board of Trustees.
| | # of
Votes | % of
Votes |
| Dennis J. Dirks |
| Affirmative | 91,643,443,973.030 | 98.167 |
| Withheld | 1,711,119,384.419 | 1.833 |
| TOTAL | 93,354,563,357.449 | 100.000 |
| Donald F. Donahue |
| Affirmative | 91,659,003,496.045 | 98.184 |
| Withheld | 1,695,559,852.789 | 1.816 |
| TOTAL | 93,354,563,357.449 | 100.000 |
| Bettina Doulton |
| Affirmative | 91,774,146,516.145 | 98.307 |
| Withheld | 1,580,416,862.377 | 1.693 |
| TOTAL | 93,354,563,357.449 | 100.000 |
| Vicki L. Fuller |
| Affirmative | 91,845,419,368.993 | 98.383 |
| Withheld | 1,509,143,998.591 | 1.617 |
| TOTAL | 93,354,563,357.449 | 100.00 |
| Patricia L. Kampling |
| Affirmative | 91,723,732,274.457 | 98.253 |
| Withheld | 1,630,831,098.411 | 1.747 |
| TOTAL | 93,354,563,357.449 | 100.000 |
| Alan J. Lacy |
| Affirmative | 91,490,319,407.772 | 98.003 |
| Withheld | 1,864,243,948.299 | 1.997 |
| TOTAL | 93,354,563,357.449 | 100.000 |
| Ned C. Lautenbach |
| Affirmative | 91,285,367,239.075 | 97.784 |
| Withheld | 2,069,196,119.052 | 2.216 |
| TOTAL | 93,354,563,357.449 | 100.000 |
| Robert A. Lawrence |
| Affirmative | 91,556,271,429.466 | 98.074 |
| Withheld | 1,798,291,912.707 | 1.926 |
| TOTAL | 93,354,563,357.449 | 100.000 |
| Joseph Mauriello |
| Affirmative | 91,497,480,147.082 | 98.011 |
| Withheld | 1,857,083,211.045 | 1.989 |
| TOTAL | 93,354,563,357.449 | 100.000 |
| Cornelia M. Small |
| Affirmative | 91,606,808,161.438 | 98.128 |
| Withheld | 1,747,755,220.497 | 1.872 |
| TOTAL | 93,354,563,357.449 | 100.000 |
| Garnett A. Smith |
| Affirmative | 91,505,784,053.038 | 98.020 |
| Withheld | 1,848,779,305.090 | 1.980 |
| TOTAL | 93,354,563,357.449 | 100.000 |
| David M. Thomas |
| Affirmative | 91,536,969,704.881 | 98.053 |
| Withheld | 1,817,593,630.919 | 1.947 |
| TOTAL | 93,354,563,357.449 | 100.000 |
| Susan Tomasky |
| Affirmative | 91,697,125,678.165 | 98.225 |
| Withheld | 1,657,437,703.277 | 1.775 |
| TOTAL | 93,354,563,357.449 | 100.000 |
| Michael E. Wiley |
| Affirmative | 91,506,805,575.815 | 98.021 |
| Withheld | 1,847,757,759.985 | 1.979 |
| TOTAL | 93,354,563,357.449 | 100.000 |
PROPOSAL 2
To convert a fundamental investment policy to a non-fundamental investment policy.
| | # of
Votes | % of
Votes |
| Affirmative | 457,855,595.389 | 61.548 |
| Against | 172,350,999.835 | 23.169 |
| Abstain | 53,462,061.343 | 7.187 |
| Broker Non-Vote | 60,228,928.130 | 8.096 |
| TOTAL | 743,897,584.697 | 100.000 |
| Proposal 1 reflects trust wide proposal and voting results. |
| Proposal 2 was not approved by shareholders. |
ILS-ANN-1220
1.815075.116
Fidelity® International Value Fund
Annual Report
October 31, 2020
Includes Fidelity and Fidelity Advisor share classes
See the inside front cover for important information about access to your fund’s shareholder reports.
Beginning on January 1, 2021, as permitted by regulations adopted by the Securities and Exchange Commission, paper copies of a fund’s shareholder reports will no longer be sent by mail, unless you specifically request paper copies of the reports from the fund or from your financial intermediary, such as a financial advisor, broker-dealer or bank. Instead, the reports will be made available on a website, and you will be notified by mail each time a report is posted and provided with a website link to access the report.
If you already elected to receive shareholder reports electronically, you will not be affected by this change and you need not take any action. You may elect to receive shareholder reports and other communications from a fund electronically, by contacting your financial intermediary. For Fidelity customers, visit Fidelity's web site or call Fidelity using the contact information listed below.
You may elect to receive all future reports in paper free of charge. If you wish to continue receiving paper copies of your shareholder reports, you may contact your financial intermediary or, if you are a Fidelity customer, visit Fidelity’s website, or call Fidelity at the applicable toll-free number listed below. Your election to receive reports in paper will apply to all funds held with the fund complex/your financial intermediary.
| Account Type | Website | Phone Number |
| Brokerage, Mutual Fund, or Annuity Contracts: | fidelity.com/mailpreferences | 1-800-343-3548 |
| Employer Provided Retirement Accounts: | netbenefits.fidelity.com/preferences (choose 'no' under Required Disclosures to continue to print) | 1-800-343-0860 |
| Advisor Sold Accounts Serviced Through Your Financial Intermediary: | Contact Your Financial Intermediary | Your Financial Intermediary's phone number |
| Advisor Sold Accounts Serviced by Fidelity: | institutional.fidelity.com | 1-877-208-0098 |
Contents
To view a fund's proxy voting guidelines and proxy voting record for the 12-month period ended June 30, visit http://www.fidelity.com/proxyvotingresults or visit the Securities and Exchange Commission's (SEC) web site at http://www.sec.gov.
You may also call 1-800-544-8544 if you’re an individual investing directly with Fidelity, call 1-800-835-5092 if you’re a plan sponsor or participant with Fidelity as your recordkeeper or call 1-877-208-0098 on institutional accounts or if you’re an advisor or invest through one to request a free copy of the proxy voting guidelines.
Standard & Poor's, S&P and S&P 500 are registered service marks of The McGraw-Hill Companies, Inc. and have been licensed for use by Fidelity Distributors Corporation.
Other third-party marks appearing herein are the property of their respective owners.
All other marks appearing herein are registered or unregistered trademarks or service marks of FMR LLC or an affiliated company. © 2020 FMR LLC. All rights reserved.
This report and the financial statements contained herein are submitted for the general information of the shareholders of the Fund. This report is not authorized for distribution to prospective investors in the Fund unless preceded or accompanied by an effective prospectus.
A fund files its complete schedule of portfolio holdings with the SEC for the first and third quarters of each fiscal year on Form N-PORT. Forms N-PORT are available on the SEC’s web site at http://www.sec.gov. A fund's Forms N-PORT may be reviewed and copied at the SEC’s Public Reference Room in Washington, DC. Information regarding the operation of the SEC's Public Reference Room may be obtained by calling 1-800-SEC-0330.
For a complete list of a fund's portfolio holdings, view the most recent holdings listing, semiannual report, or annual report on Fidelity's web site at http://www.fidelity.com, http://www.institutional.fidelity.com, or http://www.401k.com, as applicable.
NOT FDIC INSURED •MAY LOSE VALUE •NO BANK GUARANTEE
Neither the Fund nor Fidelity Distributors Corporation is a bank.
Note to Shareholders:
Early in 2020, the outbreak and spread of a new coronavirus emerged as a public health emergency that had a major influence on financial markets, primarily based on its impact on the global economy and the outlook for corporate earnings. The virus causes a respiratory disease known as COVID-19. On March 11, the World Health Organization declared the COVID-19 outbreak a pandemic, citing sustained risk of further global spread.
In the weeks following, as the crisis worsened, we witnessed an escalating human tragedy with wide-scale social and economic consequences from coronavirus-containment measures. The outbreak of COVID-19 prompted a number of measures to limit the spread, including travel and border restrictions, quarantines, and restrictions on large gatherings. In turn, these resulted in lower consumer activity, diminished demand for a wide range of products and services, disruption in manufacturing and supply chains, and – given the wide variability in outcomes regarding the outbreak – significant market uncertainty and volatility. Amid the turmoil, global governments and central banks took unprecedented action to help support consumers, businesses, and the broader economies, and to limit disruption to financial systems.
The situation continues to unfold, and the extent and duration of its impact on financial markets and the economy remain highly uncertain. Extreme events such as the coronavirus crisis are “exogenous shocks” that can have significant adverse effects on mutual funds and their investments. Although multiple asset classes may be affected by market disruption, the duration and impact may not be the same for all types of assets.
Fidelity is committed to helping you stay informed amid news about COVID-19 and during increased market volatility, and we’re taking extra steps to be responsive to customer needs. We encourage you to visit our websites, where we offer ongoing updates, commentary, and analysis on the markets and our funds.
Performance: The Bottom Line
Average annual total return reflects the change in the value of an investment, assuming reinvestment of distributions from dividend income and capital gains (the profits earned upon the sale of securities that have grown in value, if any) and assuming a constant rate of performance each year. The hypothetical investment and the average annual total returns do not reflect the deduction of taxes that a shareholder would pay on fund distributions or the redemption of fund shares. During periods of reimbursement by Fidelity, a fund’s total return will be greater than it would be had the reimbursement not occurred. How a fund did yesterday is no guarantee of how it will do tomorrow.
Average Annual Total Returns
| For the periods ended October 31, 2020 | Past 1 year | Past 5 years | Past 10 years |
| Class A (incl. 5.75% sales charge) | (18.95)% | (2.73)% | 0.15% |
| Class M (incl. 3.50% sales charge) | (17.29)% | (2.56)% | 0.11% |
| Class C (incl. contingent deferred sales charge) | (15.50)% | (2.35)% | (0.02)% |
| Fidelity® International Value Fund | (13.70)% | (1.25)% | 1.09% |
| Class I | (13.75)% | (1.34)% | 1.04% |
| Class Z | (13.58)% | (1.27)% | 1.07% |
Class C shares' contingent deferred sales charges included in the past one year, past five years and past ten years total return figures are 1%, 0% and 0%, respectively.
The initial offering of Class Z shares took place on October 2, 2018. Returns prior to October 2, 2018, are those of Class I.
$10,000 Over 10 Years
Let's say hypothetically that $10,000 was invested in Fidelity® International Value Fund, a class of the fund, on October 31, 2010.
The chart shows how the value of your investment would have changed, and also shows how the MSCI EAFE Value Index performed over the same period.
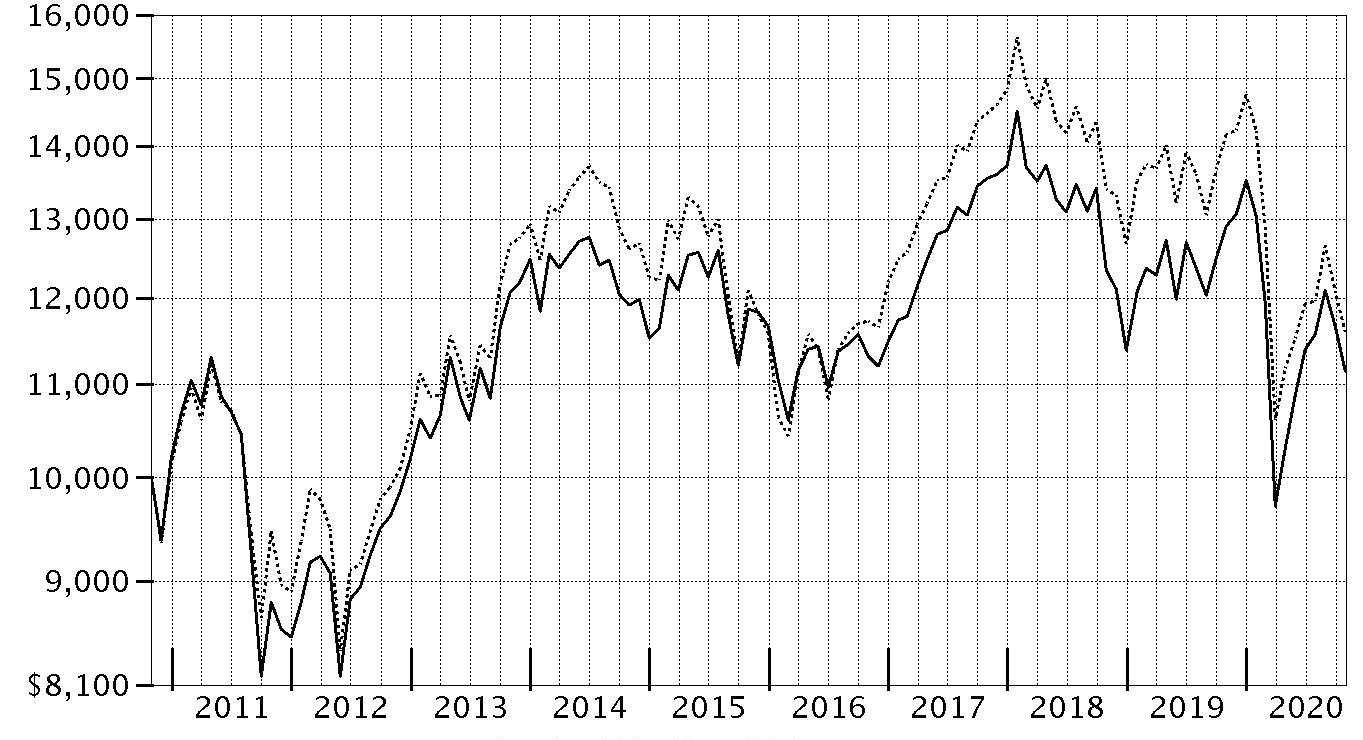
| Period Ending Values |
| $11,145 | Fidelity® International Value Fund |
| $11,593 | MSCI EAFE Value Index |
Management's Discussion of Fund Performance
Market Recap: The MSCI ACWI (All Country World Index) ex USA Index returned -2.46% for the 12 months ending October 31, 2020, in what was a bumpy ride for non-U.S. equities, marked by a steep but brief decline due to the early-2020 outbreak and spread of the coronavirus, followed by a sharp upturn. Declared a pandemic on March 11, the crisis and containment efforts caused broad contraction in economic activity, elevated volatility and dislocation in financial markets. A historically rapid and expansive monetary- and fiscal-policy response around the world provided a partial offset to the economic disruption. Other supporting factors included resilient corporate earnings and near-term potential for a COVID-19 vaccine breakthrough. This was evident in the index’s 12.28% gain in the final six months of the year. Currency fluctuation generally boosted foreign developed-markets equities for the year, while the reverse was true for emerging-markets stocks. Late in the period, the index was pressured by a second wave of COVID-19 cases in some regions, and stretched valuations and crowded positioning in big tech. For the full year, the U.K. (-22%), Asia Pacific ex Japan (-8%), Canada (-5%) and Europe ex U.K. (-4%) notably lagged. Emerging markets (+9%) and Japan (+1%) outperformed. By sector, energy (-38%), financials and real estate (-20% each) lagged, whereas information technology (+ 25%) and communication services (+15%) topped the index.
Comments from Portfolio Manager Alex Zavratsky: For the fiscal year ending October 31, 2020, the fund's share classes (excluding sales charges, if applicable) returned about -15% to -14%, outperforming the -18.23% result of the benchmark MSCI EAFE Value Index (Net MA). From a regional standpoint, stock picks in Japan, Italy and an underweighting in the U.K. contributed most to the fund's relative result. By sector, the top contributor to performance versus the benchmark were investment choices and an overweighting in information technology. Strong picks among industrials stocks, primarily driven by the commercial & professional services industry, also lifted performance. Further bolstering the portfolio's relative result was security selection in health care, especially within the health care equipment & services industry. The fund's largest individual relative contributor was an underweighting in Royal Dutch Shell, which returned -55% the past 12 months but was no longer held at period end. Also adding value this period was the decision to avoid HHSBC Holdings, a benchmark component that returned -45%. The fund's non-benchmark stake in Hoya gained 27% and aided performance as well. In contrast, an underweighting in Australia and stock picks in the U.K. hurt the fund's relative result. By sector, the largest detractor from performance versus the benchmark was an underweighting in utilities. An overweighting in the financials sector, primarily within the banks industry, also hindered performance this period. The portfolio’s underweighting in consumer discretionary hurt too. The fund's largest individual relative detractor was an overweighting in BP, which returned -57% the past year and was among the fund's biggest holdings this period. Also weighing on performance was our outsized stake in Banco Santander, which returned about -50%. Avoiding Schneider Electric, a benchmark component that gained 35%, further pressured the fund’s return. Notable changes in positioning include increased exposure to Switzerland and a lower allocation to United Kingdom. By sector, meaningful changes in positioning include increased exposure to industrials and a lower allocation to energy.
The views expressed above reflect those of the portfolio manager(s) only through the end of the period as stated on the cover of this report and do not necessarily represent the views of Fidelity or any other person in the Fidelity organization. Any such views are subject to change at any time based upon market or other conditions and Fidelity disclaims any responsibility to update such views. These views may not be relied on as investment advice and, because investment decisions for a Fidelity fund are based on numerous factors, may not be relied on as an indication of trading intent on behalf of any Fidelity fund.
Investment Summary (Unaudited)
Geographic Diversification (% of fund's net assets)
| As of October 31, 2020 |
| | Japan | 26.1% |
| | Germany | 15.0% |
| | France | 13.1% |
| | United Kingdom | 10.4% |
| | Switzerland | 7.7% |
| | Italy | 3.5% |
| | Sweden | 3.4% |
| | Australia | 2.4% |
| | Spain | 2.2% |
| | Other* | 16.2% |
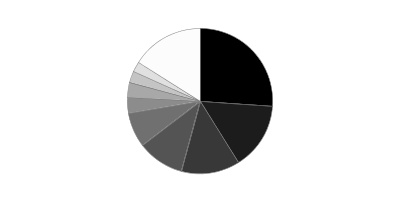
* Includes Short-Term investments and Net Other Assets (Liabilities).
Percentages are based on country or territory of incorporation and are adjusted for the effect of futures contracts, if applicable.
Asset Allocation as of October 31, 2020
| | % of fund's net assets |
| Stocks | 98.1 |
| Short-Term Investments and Net Other Assets (Liabilities) | 1.9 |
Top Ten Stocks as of October 31, 2020
| | % of fund's net assets |
| BHP Billiton PLC (United Kingdom, Metals & Mining) | 3.3 |
| Toyota Motor Corp. (Japan, Automobiles) | 3.2 |
| Siemens AG (Germany, Industrial Conglomerates) | 2.9 |
| Novartis AG (Switzerland, Pharmaceuticals) | 2.7 |
| Sanofi SA (France, Pharmaceuticals) | 2.2 |
| Enel SpA (Italy, Electric Utilities) | 2.2 |
| Zurich Insurance Group Ltd. (Switzerland, Insurance) | 2.1 |
| Total SA (France, Oil, Gas & Consumable Fuels) | 2.0 |
| BNP Paribas SA (France, Banks) | 1.8 |
| Vonovia SE (Germany, Real Estate Management & Development) | 1.7 |
| | 24.1 |
Top Market Sectors as of October 31, 2020
| | % of fund's net assets |
| Financials | 29.0 |
| Industrials | 14.5 |
| Materials | 11.7 |
| Health Care | 10.2 |
| Information Technology | 8.6 |
| Consumer Discretionary | 7.9 |
| Energy | 5.1 |
| Utilities | 4.1 |
| Communication Services | 3.2 |
| Real Estate | 2.6 |
Schedule of Investments October 31, 2020
Showing Percentage of Net Assets
| Common Stocks - 96.6% | | | |
| | | Shares | Value |
| Australia - 2.4% | | | |
| Commonwealth Bank of Australia | | 87,813 | $4,263,457 |
| Evolution Mining Ltd. | | 416,371 | 1,632,354 |
| Macquarie Group Ltd. | | 48,132 | 4,291,447 |
|
| TOTAL AUSTRALIA | | | 10,187,258 |
|
| Austria - 0.7% | | | |
| Erste Group Bank AG | | 143,907 | 2,946,431 |
| Bailiwick of Jersey - 1.7% | | | |
| Ferguson PLC | | 40,300 | 4,002,635 |
| Glencore Xstrata PLC | | 1,683,200 | 3,395,413 |
|
| TOTAL BAILIWICK OF JERSEY | | | 7,398,048 |
|
| Belgium - 1.4% | | | |
| KBC Groep NV | | 118,425 | 5,838,309 |
| Denmark - 1.6% | | | |
| A.P. Moller - Maersk A/S Series B | | 1,976 | 3,166,806 |
| ORSTED A/S (a) | | 22,900 | 3,634,551 |
|
| TOTAL DENMARK | | | 6,801,357 |
|
| Finland - 0.8% | | | |
| Sampo Oyj (A Shares) | | 91,534 | 3,454,004 |
| France - 13.1% | | | |
| ALTEN (b) | | 9,100 | 727,574 |
| Atos Origin SA (b) | | 37,082 | 2,530,790 |
| AXA SA | | 409,721 | 6,579,832 |
| BNP Paribas SA (b) | | 218,100 | 7,606,190 |
| Capgemini SA | | 28,893 | 3,336,084 |
| Natixis SA (b) | | 381,600 | 887,083 |
| Sanofi SA | | 107,879 | 9,740,761 |
| SR Teleperformance SA | | 16,400 | 4,922,137 |
| Total SA | | 291,005 | 8,816,498 |
| VINCI SA | | 58,700 | 4,636,427 |
| Vivendi SA | | 166,092 | 4,795,354 |
| Worldline SA (a)(b) | | 28,788 | 2,133,718 |
|
| TOTAL FRANCE | | | 56,712,448 |
|
| Germany - 13.5% | | | |
| Bayer AG | | 97,000 | 4,558,083 |
| Deutsche Post AG | | 123,600 | 5,475,886 |
| Hannover Reuck SE | | 30,500 | 4,429,572 |
| HeidelbergCement AG | | 62,600 | 3,581,196 |
| Infineon Technologies AG | | 142,100 | 3,956,232 |
| Linde PLC | | 25,814 | 5,658,097 |
| Muenchener Rueckversicherungs-Gesellschaft AG in Muenchen | | 19,500 | 4,560,304 |
| Rheinmetall AG | | 28,700 | 2,095,776 |
| RWE AG | | 118,500 | 4,387,370 |
| Siemens AG | | 105,500 | 12,373,067 |
| Vonovia SE | | 114,180 | 7,289,949 |
|
| TOTAL GERMANY | | | 58,365,532 |
|
| Hong Kong - 0.9% | | | |
| AIA Group Ltd. | | 394,800 | 3,757,381 |
| India - 0.4% | | | |
| Reliance Industries Ltd. sponsored GDR (a) | | 31,600 | 1,734,840 |
| Indonesia - 0.3% | | | |
| PT Bank Rakyat Indonesia Tbk | | 6,043,800 | 1,368,147 |
| Ireland - 2.1% | | | |
| CRH PLC | | 188,302 | 6,589,021 |
| Ryanair Holdings PLC (b) | | 6,800 | 93,699 |
| Ryanair Holdings PLC sponsored ADR (b) | | 29,300 | 2,361,580 |
|
| TOTAL IRELAND | | | 9,044,300 |
|
| Italy - 3.5% | | | |
| Assicurazioni Generali SpA | | 191,900 | 2,572,443 |
| Enel SpA | | 1,218,100 | 9,684,510 |
| Mediobanca SpA | | 417,925 | 2,963,251 |
|
| TOTAL ITALY | | | 15,220,204 |
|
| Japan - 26.1% | | | |
| DENSO Corp. | | 97,300 | 4,533,848 |
| FANUC Corp. | | 27,000 | 5,703,071 |
| Fujitsu Ltd. | | 31,800 | 3,762,405 |
| Hoya Corp. | | 53,900 | 6,082,989 |
| Ibiden Co. Ltd. | | 56,100 | 2,287,393 |
| Idemitsu Kosan Co. Ltd. | | 99,600 | 2,014,308 |
| Itochu Corp. | | 258,800 | 6,215,993 |
| Kao Corp. | | 42,400 | 3,018,825 |
| Minebea Mitsumi, Inc. | | 237,700 | 4,293,185 |
| Mitsubishi Estate Co. Ltd. | | 134,600 | 2,007,677 |
| Mitsubishi UFJ Financial Group, Inc. | | 1,228,100 | 4,841,053 |
| Mitsui Fudosan Co. Ltd. | | 98,400 | 1,675,513 |
| OBIC Co. Ltd. | | 15,293 | 2,707,519 |
| Oracle Corp. Japan | | 27,100 | 2,708,377 |
| ORIX Corp. | | 329,300 | 3,851,242 |
| Recruit Holdings Co. Ltd. | | 72,900 | 2,773,894 |
| Shin-Etsu Chemical Co. Ltd. | | 51,400 | 6,865,336 |
| Shinsei Bank Ltd. | | 239,600 | 2,882,759 |
| SoftBank Group Corp. | | 90,300 | 5,881,583 |
| Sony Corp. | | 67,300 | 5,610,564 |
| Sumitomo Mitsui Financial Group, Inc. | | 186,400 | 5,159,907 |
| Suzuki Motor Corp. | | 90,900 | 3,903,946 |
| Takeda Pharmaceutical Co. Ltd. | | 68,051 | 2,102,954 |
| Tokio Marine Holdings, Inc. | | 116,900 | 5,224,813 |
| Tokyo Electron Ltd. | | 10,900 | 2,925,679 |
| Toyota Motor Corp. | | 208,700 | 13,700,509 |
|
| TOTAL JAPAN | | | 112,735,342 |
|
| Korea (South) - 0.9% | | | |
| Samsung Electronics Co. Ltd. | | 78,520 | 3,938,198 |
| Luxembourg - 0.5% | | | |
| ArcelorMittal SA (Netherlands) (b) | | 165,700 | 2,248,632 |
| Netherlands - 1.9% | | | |
| AerCap Holdings NV (b) | | 45,000 | 1,117,350 |
| Koninklijke Philips Electronics NV | | 78,935 | 3,656,015 |
| NN Group NV | | 101,893 | 3,552,970 |
|
| TOTAL NETHERLANDS | | | 8,326,335 |
|
| Portugal - 0.3% | | | |
| Galp Energia SGPS SA Class B | | 165,685 | 1,345,559 |
| Singapore - 0.8% | | | |
| United Overseas Bank Ltd. | | 242,523 | 3,369,724 |
| Spain - 2.2% | | | |
| Banco Santander SA (Spain) | | 2,721,650 | 5,450,259 |
| Cellnex Telecom SA (a) | | 50,400 | 3,235,454 |
| Unicaja Banco SA (a) | | 1,088,800 | 693,001 |
|
| TOTAL SPAIN | | | 9,378,714 |
|
| Sweden - 3.4% | | | |
| Ericsson (B Shares) | | 521,600 | 5,823,411 |
| Investor AB (B Shares) | | 108,460 | 6,513,646 |
| Volvo AB (B Shares) | | 114,200 | 2,222,167 |
|
| TOTAL SWEDEN | | | 14,559,224 |
|
| Switzerland - 7.7% | | | |
| Novartis AG | | 151,880 | 11,834,883 |
| Roche Holding AG (participation certificate) | | 9,030 | 2,901,624 |
| Siemens Energy AG (b) | | 68,550 | 1,500,931 |
| Swiss Life Holding AG | | 6,172 | 2,074,497 |
| UBS Group AG | | 521,458 | 6,095,844 |
| Zurich Insurance Group Ltd. | | 26,881 | 8,928,408 |
|
| TOTAL SWITZERLAND | | | 33,336,187 |
|
| United Kingdom - 10.4% | | | |
| Anglo American PLC (United Kingdom) | | 284,876 | 6,684,358 |
| AstraZeneca PLC (United Kingdom) | | 36,712 | 3,686,087 |
| Beazley PLC | | 289,700 | 1,103,401 |
| BHP Billiton PLC | | 724,004 | 14,025,665 |
| BP PLC | | 2,376,344 | 6,061,305 |
| Imperial Brands PLC | | 134,766 | 2,136,974 |
| Lloyds Banking Group PLC | | 8,464,006 | 3,081,805 |
| Royal Dutch Shell PLC Class B sponsored ADR | | 95,800 | 2,313,570 |
| RSA Insurance Group PLC | | 503,610 | 2,763,680 |
| Standard Chartered PLC (United Kingdom) | | 631,911 | 2,879,978 |
| Standard Life PLC | | 22,852 | 66,463 |
|
| TOTAL UNITED KINGDOM | | | 44,803,286 |
|
| TOTAL COMMON STOCKS | | | |
| (Cost $468,167,342) | | | 416,869,460 |
|
| Nonconvertible Preferred Stocks - 1.5% | | | |
| Germany - 1.5% | | | |
| Porsche Automobil Holding SE (Germany) | | | |
| (Cost $8,604,969) | | 120,200 | 6,439,583 |
|
| Money Market Funds - 1.4% | | | |
| Fidelity Cash Central Fund 0.10% (c) | | | |
| (Cost $5,809,466) | | 5,808,305 | 5,809,466 |
| TOTAL INVESTMENT IN SECURITIES - 99.5% | | | |
| (Cost $482,581,777) | | | 429,118,509 |
| NET OTHER ASSETS (LIABILITIES) - 0.5% | | | 2,275,492 |
| NET ASSETS - 100% | | | $431,394,001 |
Categorizations in the Schedule of Investments are based on country or territory of incorporation.
Legend
(a) Security exempt from registration under Rule 144A of the Securities Act of 1933. These securities may be resold in transactions exempt from registration, normally to qualified institutional buyers. At the end of the period, the value of these securities amounted to $11,431,564 or 2.6% of net assets.
(b) Non-income producing
(c) Affiliated fund that is generally available only to investment companies and other accounts managed by Fidelity Investments. The rate quoted is the annualized seven-day yield of the fund at period end. A complete unaudited listing of the fund's holdings as of its most recent quarter end is available upon request. In addition, each Fidelity Central Fund's financial statements, which are not covered by the Fund's Report of Independent Registered Public Accounting Firm, are available on the SEC's website or upon request.
Affiliated Central Funds
Information regarding fiscal year to date income earned by the Fund from investments in Fidelity Central Funds is as follows:
| Fund | Income earned |
| Fidelity Cash Central Fund | $17,827 |
| Fidelity Securities Lending Cash Central Fund | 23,230 |
| Total | $41,057 |
Amounts in the income column in the above table include any capital gain distributions from underlying funds, which are presented in the corresponding line-item in the Statement of Operations, if applicable. Amount for Fidelity Securities Lending Cash Central Fund represents the income earned on investing cash collateral, less rebates paid to borrowers and any lending agent fees associated with the loan, plus any premium payments received for lending certain types of securities.
Investment Valuation
The following is a summary of the inputs used, as of October 31, 2020, involving the Fund's assets and liabilities carried at fair value. The inputs or methodology used for valuing securities may not be an indication of the risk associated with investing in those securities. For more information on valuation inputs, and their aggregation into the levels used below, please refer to the Investment Valuation section in the accompanying Notes to Financial Statements.
| | Valuation Inputs at Reporting Date: |
| Description | Total | Level 1 | Level 2 | Level 3 |
| Investments in Securities: | | | | |
| Equities: | | | | |
| Communication Services | $13,912,391 | $8,030,808 | $5,881,583 | $-- |
| Consumer Discretionary | 34,188,450 | 6,439,583 | 27,748,867 | -- |
| Consumer Staples | 5,155,799 | 2,136,974 | 3,018,825 | -- |
| Energy | 22,286,080 | 4,048,410 | 18,237,670 | -- |
| Financials | 124,051,301 | 53,394,877 | 70,656,424 | -- |
| Health Care | 44,563,396 | -- | 44,563,396 | -- |
| Industrials | 62,954,604 | 32,068,894 | 30,885,710 | -- |
| Information Technology | 36,837,380 | 8,728,166 | 28,109,214 | -- |
| Materials | 50,680,072 | 18,172,283 | 32,507,789 | -- |
| Real Estate | 10,973,139 | 7,289,949 | 3,683,190 | -- |
| Utilities | 17,706,431 | 8,021,921 | 9,684,510 | -- |
| Money Market Funds | 5,809,466 | 5,809,466 | -- | -- |
| Total Investments in Securities: | $429,118,509 | $154,141,331 | $274,977,178 | $-- |
See accompanying notes which are an integral part of the financial statements.
Financial Statements
Statement of Assets and Liabilities
| | | October 31, 2020 |
| Assets | | |
Investment in securities, at value — See accompanying schedule:
Unaffiliated issuers (cost $476,772,311) | $423,309,043 | |
| Fidelity Central Funds (cost $5,809,466) | 5,809,466 | |
| Total Investment in Securities (cost $482,581,777) | | $429,118,509 |
| Receivable for fund shares sold | | 468,808 |
| Dividends receivable | | 2,388,833 |
| Distributions receivable from Fidelity Central Funds | | 318 |
| Prepaid expenses | | 746 |
| Other receivables | | 23,328 |
| Total assets | | 432,000,542 |
| Liabilities | | |
| Payable for fund shares redeemed | $219,187 | |
| Accrued management fee | 275,090 | |
| Transfer agent fee payable | 61,576 | |
| Distribution and service plan fees payable | 5,161 | |
| Other affiliated payables | 19,558 | |
| Other payables and accrued expenses | 25,969 | |
| Total liabilities | | 606,541 |
| Net Assets | | $431,394,001 |
| Net Assets consist of: | | |
| Paid in capital | | $535,693,076 |
| Total accumulated earnings (loss) | | (104,299,075) |
| Net Assets | | $431,394,001 |
| Net Asset Value and Maximum Offering Price | | |
| Class A: | | |
| Net Asset Value and redemption price per share ($5,947,271 ÷ 866,188 shares)(a) | | $6.87 |
| Maximum offering price per share (100/94.25 of $6.87) | | $7.29 |
| Class M: | | |
| Net Asset Value and redemption price per share ($2,883,803 ÷ 420,517 shares)(a) | | $6.86 |
| Maximum offering price per share (100/96.50 of $6.86) | | $7.11 |
| Class C: | | |
| Net Asset Value and offering price per share ($2,947,254 ÷ 430,391 shares)(a) | | $6.85 |
| International Value: | | |
| Net Asset Value, offering price and redemption price per share ($406,661,057 ÷ 59,206,784 shares) | | $6.87 |
| Class I: | | |
| Net Asset Value, offering price and redemption price per share ($10,406,059 ÷ 1,512,934 shares) | | $6.88 |
| Class Z: | | |
| Net Asset Value, offering price and redemption price per share ($2,548,557 ÷ 370,979 shares) | | $6.87 |
(a) Redemption price per share is equal to net asset value less any applicable contingent deferred sales charge.
See accompanying notes which are an integral part of the financial statements.
Statement of Operations
| | | Year ended October 31, 2020 |
| Investment Income | | |
| Dividends | | $12,863,990 |
| Non-Cash dividends | | 1,331,802 |
| Income from Fidelity Central Funds (including $23,230 from security lending) | | 41,057 |
| Income before foreign taxes withheld | | 14,236,849 |
| Less foreign taxes withheld | | (1,100,901) |
| Total income | | 13,135,948 |
| Expenses | | |
| Management fee | | |
| Basic fee | $2,994,068 | |
| Performance adjustment | (49,223) | |
| Transfer agent fees | 717,236 | |
| Distribution and service plan fees | 64,953 | |
| Accounting fees | 227,524 | |
| Custodian fees and expenses | 69,247 | |
| Independent trustees' fees and expenses | 2,507 | |
| Registration fees | 94,117 | |
| Audit | 66,693 | |
| Legal | 913 | |
| Interest | 637 | |
| Miscellaneous | 6,582 | |
| Total expenses before reductions | 4,195,254 | |
| Expense reductions | (68,396) | |
| Total expenses after reductions | | 4,126,858 |
| Net investment income (loss) | | 9,009,090 |
| Realized and Unrealized Gain (Loss) | | |
| Net realized gain (loss) on: | | |
| Investment securities: | | |
| Unaffiliated issuers | (36,200,428) | |
| Fidelity Central Funds | (786) | |
| Foreign currency transactions | (47,505) | |
| Total net realized gain (loss) | | (36,248,719) |
| Change in net unrealized appreciation (depreciation) on: | | |
| Investment securities: | | |
| Unaffiliated issuers | (37,393,236) | |
| Assets and liabilities in foreign currencies | 74,054 | |
| Total change in net unrealized appreciation (depreciation) | | (37,319,182) |
| Net gain (loss) | | (73,567,901) |
| Net increase (decrease) in net assets resulting from operations | | $(64,558,811) |
See accompanying notes which are an integral part of the financial statements.
Statement of Changes in Net Assets
| | Year ended October 31, 2020 | Year ended October 31, 2019 |
| Increase (Decrease) in Net Assets | | |
| Operations | | |
| Net investment income (loss) | $9,009,090 | $15,991,829 |
| Net realized gain (loss) | (36,248,719) | (19,627,326) |
| Change in net unrealized appreciation (depreciation) | (37,319,182) | 24,543,996 |
| Net increase (decrease) in net assets resulting from operations | (64,558,811) | 20,908,499 |
| Distributions to shareholders | (17,025,846) | (13,674,095) |
| Share transactions - net increase (decrease) | 44,017,671 | 4,693,076 |
| Total increase (decrease) in net assets | (37,566,986) | 11,927,480 |
| Net Assets | | |
| Beginning of period | 468,960,987 | 457,033,507 |
| End of period | $431,394,001 | $468,960,987 |
See accompanying notes which are an integral part of the financial statements.
Financial Highlights
Fidelity International Value Fund Class A
| Years ended October 31, | 2020 | 2019 | 2018 | 2017 | 2016 |
| Selected Per–Share Data | | | | | |
| Net asset value, beginning of period | $8.25 | $8.13 | $9.08 | $7.78 | $8.27 |
| Income from Investment Operations | | | | | |
| Net investment income (loss)A | .13 | .25 | .21 | .17 | .17 |
| Net realized and unrealized gain (loss) | (1.24) | .08 | (1.04) | 1.31 | (.57) |
| Total from investment operations | (1.11) | .33 | (.83) | 1.48 | (.40) |
| Distributions from net investment income | (.24) | (.21) | (.10) | (.17) | (.09) |
| Distributions from net realized gain | (.03) | – | (.01) | (.01) | – |
| Total distributions | (.27) | (.21) | (.12)B | (.18) | (.09) |
| Redemption fees added to paid in capitalA | – | – | –C | –C | –C |
| Net asset value, end of period | $6.87 | $8.25 | $8.13 | $9.08 | $7.78 |
| Total ReturnD,E | (14.01)% | 4.38% | (9.30)% | 19.36% | (4.91)% |
| Ratios to Average Net AssetsF,G | | | | | |
| Expenses before reductions | 1.30% | 1.14% | 1.23% | 1.33% | 1.40% |
| Expenses net of fee waivers, if any | 1.30% | 1.13% | 1.23% | 1.33% | 1.40% |
| Expenses net of all reductions | 1.28% | 1.12% | 1.21% | 1.32% | 1.39% |
| Net investment income (loss) | 1.71% | 3.19% | 2.36% | 2.01% | 2.19% |
| Supplemental Data | | | | | |
| Net assets, end of period (000 omitted) | $5,947 | $7,806 | $7,887 | $8,151 | $7,717 |
| Portfolio turnover rateH | 36% | 47% | 55% | 50% | 47% |
A Calculated based on average shares outstanding during the period.
B Total distributions per share do not sum due to rounding.
C Amount represents less than $.005 per share.
D Total returns would have been lower if certain expenses had not been reduced during the applicable periods shown.
E Total returns do not include the effect of the sales charges.
F Fees and expenses of any underlying mutual funds or exchange-traded funds (ETFs) are not included in the Fund's expense ratio. The Fund indirectly bears its proportionate share of these expenses. For additional expense information related to investments in Fidelity Central Funds, please refer to the "Investments in Fidelity Central Funds" note found in the Notes to Financial Statements section of the most recent Annual or Semi-Annual report.
G Expense ratios reflect operating expenses of the class. Expenses before reductions do not reflect amounts reimbursed, waived, or reduced through arrangements with the investment adviser, brokerage services, or other offset arrangements, if applicable, and do not represent the amount paid by the class during periods when reimbursements, waivers or reductions occur.
H Amount does not include the portfolio activity of any underlying mutual funds or exchange-traded funds (ETFs).
See accompanying notes which are an integral part of the financial statements.
Fidelity International Value Fund Class M
| Years ended October 31, | 2020 | 2019 | 2018 | 2017 | 2016 |
| Selected Per–Share Data | | | | | |
| Net asset value, beginning of period | $8.24 | $8.11 | $9.06 | $7.76 | $8.25 |
| Income from Investment Operations | | | | | |
| Net investment income (loss)A | .11 | .23 | .18 | .14 | .15 |
| Net realized and unrealized gain (loss) | (1.25) | .08 | (1.04) | 1.31 | (.58) |
| Total from investment operations | (1.14) | .31 | (.86) | 1.45 | (.43) |
| Distributions from net investment income | (.21) | (.18) | (.08) | (.14) | (.06) |
| Distributions from net realized gain | (.03) | – | (.01) | (.01) | – |
| Total distributions | (.24) | (.18) | (.09) | (.15) | (.06) |
| Redemption fees added to paid in capitalA | – | – | –B | –B | –B |
| Net asset value, end of period | $6.86 | $8.24 | $8.11 | $9.06 | $7.76 |
| Total ReturnC,D | (14.29)% | 4.11% | (9.59)% | 19.04% | (5.24)% |
| Ratios to Average Net AssetsE,F | | | | | |
| Expenses before reductions | 1.57% | 1.44% | 1.56% | 1.64% | 1.70% |
| Expenses net of fee waivers, if any | 1.57% | 1.43% | 1.55% | 1.64% | 1.70% |
| Expenses net of all reductions | 1.55% | 1.42% | 1.54% | 1.63% | 1.69% |
| Net investment income (loss) | 1.44% | 2.89% | 2.04% | 1.70% | 1.89% |
| Supplemental Data | | | | | |
| Net assets, end of period (000 omitted) | $2,884 | $3,756 | $3,920 | $4,181 | $3,703 |
| Portfolio turnover rateG | 36% | 47% | 55% | 50% | 47% |
A Calculated based on average shares outstanding during the period.
B Amount represents less than $.005 per share.
C Total returns would have been lower if certain expenses had not been reduced during the applicable periods shown.
D Total returns do not include the effect of the sales charges.
E Fees and expenses of any underlying mutual funds or exchange-traded funds (ETFs) are not included in the Fund's expense ratio. The Fund indirectly bears its proportionate share of these expenses. For additional expense information related to investments in Fidelity Central Funds, please refer to the "Investments in Fidelity Central Funds" note found in the Notes to Financial Statements section of the most recent Annual or Semi-Annual report.
F Expense ratios reflect operating expenses of the class. Expenses before reductions do not reflect amounts reimbursed, waived, or reduced through arrangements with the investment adviser, brokerage services, or other offset arrangements, if applicable, and do not represent the amount paid by the class during periods when reimbursements, waivers or reductions occur.
G Amount does not include the portfolio activity of any underlying mutual funds or exchange-traded funds (ETFs).
See accompanying notes which are an integral part of the financial statements.
Fidelity International Value Fund Class C
| Years ended October 31, | 2020 | 2019 | 2018 | 2017 | 2016 |
| Selected Per–Share Data | | | | | |
| Net asset value, beginning of period | $8.22 | $8.08 | $9.04 | $7.75 | $8.23 |
| Income from Investment Operations | | | | | |
| Net investment income (loss)A | .07 | .19 | .14 | .10 | .11 |
| Net realized and unrealized gain (loss) | (1.24) | .08 | (1.04) | 1.31 | (.57) |
| Total from investment operations | (1.17) | .27 | (.90) | 1.41 | (.46) |
| Distributions from net investment income | (.17) | (.13) | (.04) | (.11) | (.02) |
| Distributions from net realized gain | (.03) | – | (.01) | (.01) | – |
| Total distributions | (.20) | (.13) | (.06)B | (.12) | (.02) |
| Redemption fees added to paid in capitalA | – | – | –C | –C | –C |
| Net asset value, end of period | $6.85 | $8.22 | $8.08 | $9.04 | $7.75 |
| Total ReturnD,E | (14.67)% | 3.53% | (10.06)% | 18.41% | (5.61)% |
| Ratios to Average Net AssetsF,G | | | | | |
| Expenses before reductions | 2.07% | 1.93% | 2.04% | 2.12% | 2.17% |
| Expenses net of fee waivers, if any | 2.07% | 1.92% | 2.04% | 2.12% | 2.17% |
| Expenses net of all reductions | 2.05% | 1.91% | 2.02% | 2.11% | 2.17% |
| Net investment income (loss) | .94% | 2.40% | 1.55% | 1.22% | 1.42% |
| Supplemental Data | | | | | |
| Net assets, end of period (000 omitted) | $2,947 | $3,839 | $5,339 | $5,171 | $4,168 |
| Portfolio turnover rateH | 36% | 47% | 55% | 50% | 47% |
A Calculated based on average shares outstanding during the period.
B Total distributions per share do not sum due to rounding.
C Amount represents less than $.005 per share.
D Total returns would have been lower if certain expenses had not been reduced during the applicable periods shown.
E Total returns do not include the effect of the contingent deferred sales charge.
F Fees and expenses of any underlying mutual funds or exchange-traded funds (ETFs) are not included in the Fund's expense ratio. The Fund indirectly bears its proportionate share of these expenses. For additional expense information related to investments in Fidelity Central Funds, please refer to the "Investments in Fidelity Central Funds" note found in the Notes to Financial Statements section of the most recent Annual or Semi-Annual report.
G Expense ratios reflect operating expenses of the class. Expenses before reductions do not reflect amounts reimbursed, waived, or reduced through arrangements with the investment adviser, brokerage services, or other offset arrangements, if applicable, and do not represent the amount paid by the class during periods when reimbursements, waivers or reductions occur.
H Amount does not include the portfolio activity of any underlying mutual funds or exchange-traded funds (ETFs).
See accompanying notes which are an integral part of the financial statements.
Fidelity International Value Fund
| Years ended October 31, | 2020 | 2019 | 2018 | 2017 | 2016 |
| Selected Per–Share Data | | | | | |
| Net asset value, beginning of period | $8.25 | $8.14 | $9.09 | $7.79 | $8.29 |
| Income from Investment Operations | | | | | |
| Net investment income (loss)A | .15 | .28 | .24 | .20 | .20 |
| Net realized and unrealized gain (loss) | (1.23) | .07 | (1.04) | 1.31 | (.58) |
| Total from investment operations | (1.08) | .35 | (.80) | 1.51 | (.38) |
| Distributions from net investment income | (.27) | (.24) | (.14) | (.20) | (.12) |
| Distributions from net realized gain | (.03) | – | (.01) | (.01) | – |
| Total distributions | (.30) | (.24) | (.15) | (.21) | (.12) |
| Redemption fees added to paid in capitalA | – | – | –B | –B | –B |
| Net asset value, end of period | $6.87 | $8.25 | $8.14 | $9.09 | $7.79 |
| Total ReturnC | (13.70)% | 4.65% | (8.95)% | 19.83% | (4.69)% |
| Ratios to Average Net AssetsD,E | | | | | |
| Expenses before reductions | .94% | .79% | .89% | .97% | 1.03% |
| Expenses net of fee waivers, if any | .94% | .78% | .89% | .97% | 1.03% |
| Expenses net of all reductions | .92% | .78% | .87% | .96% | 1.03% |
| Net investment income (loss) | 2.07% | 3.54% | 2.70% | 2.36% | 2.56% |
| Supplemental Data | | | | | |
| Net assets, end of period (000 omitted) | $406,661 | $442,816 | $433,015 | $359,770 | $309,199 |
| Portfolio turnover rateF | 36% | 47% | 55% | 50% | 47% |
A Calculated based on average shares outstanding during the period.
B Amount represents less than $.005 per share.
C Total returns would have been lower if certain expenses had not been reduced during the applicable periods shown.
D Fees and expenses of any underlying mutual funds or exchange-traded funds (ETFs) are not included in the Fund's expense ratio. The Fund indirectly bears its proportionate share of these expenses. For additional expense information related to investments in Fidelity Central Funds, please refer to the "Investments in Fidelity Central Funds" note found in the Notes to Financial Statements section of the most recent Annual or Semi-Annual report.
E Expense ratios reflect operating expenses of the class. Expenses before reductions do not reflect amounts reimbursed, waived, or reduced through arrangements with the investment adviser, brokerage services, or other offset arrangements, if applicable, and do not represent the amount paid by the class during periods when reimbursements, waivers or reductions occur.
F Amount does not include the portfolio activity of any underlying mutual funds or exchange-traded funds (ETFs).
See accompanying notes which are an integral part of the financial statements.
Fidelity International Value Fund Class I
| Years ended October 31, | 2020 | 2019 | 2018 | 2017 | 2016 |
| Selected Per–Share Data | | | | | |
| Net asset value, beginning of period | $8.26 | $8.15 | $9.10 | $7.80 | $8.29 |
| Income from Investment Operations | | | | | |
| Net investment income (loss)A | .15 | .27 | .23 | .19 | .19 |
| Net realized and unrealized gain (loss) | (1.24) | .08 | (1.04) | 1.31 | (.58) |
| Total from investment operations | (1.09) | .35 | (.81) | 1.50 | (.39) |
| Distributions from net investment income | (.26) | (.24) | (.13) | (.19) | (.10) |
| Distributions from net realized gain | (.03) | – | (.01) | (.01) | – |
| Total distributions | (.29) | (.24) | (.14) | (.20) | (.10) |
| Redemption fees added to paid in capitalA | – | – | –B | –B | –B |
| Net asset value, end of period | $6.88 | $8.26 | $8.15 | $9.10 | $7.80 |
| Total ReturnC | (13.75)% | 4.57% | (9.04)% | 19.68% | (4.81)% |
| Ratios to Average Net AssetsD,E | | | | | |
| Expenses before reductions | .98% | .86% | .97% | 1.10% | 1.17% |
| Expenses net of fee waivers, if any | .98% | .85% | .97% | 1.10% | 1.17% |
| Expenses net of all reductions | .97% | .85% | .95% | 1.09% | 1.16% |
| Net investment income (loss) | 2.03% | 3.47% | 2.62% | 2.23% | 2.42% |
| Supplemental Data | | | | | |
| Net assets, end of period (000 omitted) | $10,406 | $8,495 | $6,779 | $5,523 | $1,955 |
| Portfolio turnover rateF | 36% | 47% | 55% | 50% | 47% |
A Calculated based on average shares outstanding during the period.
B Amount represents less than $.005 per share.
C Total returns would have been lower if certain expenses had not been reduced during the applicable periods shown.
D Fees and expenses of any underlying mutual funds or exchange-traded funds (ETFs) are not included in the Fund's expense ratio. The Fund indirectly bears its proportionate share of these expenses. For additional expense information related to investments in Fidelity Central Funds, please refer to the "Investments in Fidelity Central Funds" note found in the Notes to Financial Statements section of the most recent Annual or Semi-Annual report.
E Expense ratios reflect operating expenses of the class. Expenses before reductions do not reflect amounts reimbursed, waived, or reduced through arrangements with the investment adviser, brokerage services, or other offset arrangements, if applicable, and do not represent the amount paid by the class during periods when reimbursements, waivers or reductions occur.
F Amount does not include the portfolio activity of any underlying mutual funds or exchange-traded funds (ETFs).
See accompanying notes which are an integral part of the financial statements.
Fidelity International Value Fund Class Z
| Years ended October 31, | 2020 | 2019 | 2018 A |
| Selected Per–Share Data | | | |
| Net asset value, beginning of period | $8.25 | $8.14 | $8.81 |
| Income from Investment Operations | | | |
| Net investment income (loss)B | .16 | .29 | .01 |
| Net realized and unrealized gain (loss) | (1.23) | .08 | (.68) |
| Total from investment operations | (1.07) | .37 | (.67) |
| Distributions from net investment income | (.28) | (.26) | – |
| Distributions from net realized gain | (.03) | – | – |
| Total distributions | (.31) | (.26) | – |
| Redemption fees added to paid in capitalB | – | – | –C |
| Net asset value, end of period | $6.87 | $8.25 | $8.14 |
| Total ReturnD,E | (13.58)% | 4.84% | (7.60)% |
| Ratios to Average Net AssetsF,G | | | |
| Expenses before reductions | .82% | .67% | .84%H |
| Expenses net of fee waivers, if any | .82% | .67% | .84%H |
| Expenses net of all reductions | .81% | .66% | .82%H |
| Net investment income (loss) | 2.19% | 3.66% | 1.58%H |
| Supplemental Data | | | |
| Net assets, end of period (000 omitted) | $2,549 | $2,249 | $92 |
| Portfolio turnover rateI | 36% | 47% | 55% |
A For the period October 2, 2018 (commencement of sale of shares) to October 31, 2018.
B Calculated based on average shares outstanding during the period.
C Amount represents less than $.005 per share.
D Total returns for periods of less than one year are not annualized.
E Total returns would have been lower if certain expenses had not been reduced during the applicable periods shown.
F Fees and expenses of any underlying mutual funds or exchange-traded funds (ETFs) are not included in the Fund's expense ratio. The Fund indirectly bears its proportionate share of these expenses. For additional expense information related to investments in Fidelity Central Funds, please refer to the "Investments in Fidelity Central Funds" note found in the Notes to Financial Statements section of the most recent Annual or Semi-Annual report.
G Expense ratios reflect operating expenses of the class. Expenses before reductions do not reflect amounts reimbursed, waived, or reduced through arrangements with the investment adviser, brokerage services, or other offset arrangements, if applicable, and do not represent the amount paid by the class during periods when reimbursements, waivers or reductions occur.
H Annualized
I Amount does not include the portfolio activity of any underlying mutual funds or exchange-traded funds (ETFs).
See accompanying notes which are an integral part of the financial statements.
Notes to Financial Statements
For the period ended October 31, 2020
1. Organization.
Fidelity International Value Fund (the Fund) is a fund of Fidelity Investment Trust (the Trust) and is authorized to issue an unlimited number of shares. The Trust is registered under the Investment Company Act of 1940, as amended (the 1940 Act), as an open-end management investment company organized as a Massachusetts business trust. The Fund offers Class A, Class M, Class C, International Value, Class I and Class Z shares, each of which has equal rights as to assets and voting privileges. Each class has exclusive voting rights with respect to matters that affect that class. Class C shares will automatically convert to Class A shares after a holding period of ten years from the initial date of purchase, with certain exceptions.
Effective January 1, 2020:
Investment advisers Fidelity Investments Money Management, Inc., FMR Co., Inc., and Fidelity SelectCo, LLC, merged with and into Fidelity Management & Research Company. In connection with the merger transactions, the resulting, merged investment adviser was then redomiciled from Massachusetts to Delaware, changed its corporate structure from a corporation to a limited liability company, and changed its name to "Fidelity Management & Research Company LLC".
Broker-dealer Fidelity Distributors Corporation merged with and into Fidelity Investments Institutional Services Company, Inc. ("FIISC"). FIISC was then redomiciled from Massachusetts to Delaware, changed its corporate structure from a corporation to a limited liability company, and changed its name to "Fidelity Distributors Company LLC".
Fidelity Investments Institutional Operations Company, Inc. converted from a Massachusetts corporation to a Massachusetts LLC, and changed its name to "Fidelity Investments Institutional Operations Company LLC".
2. Investments in Fidelity Central Funds.
The Fund invests in Fidelity Central Funds, which are open-end investment companies generally available only to other investment companies and accounts managed by the investment adviser and its affiliates. The Fund's Schedule of Investments lists each of the Fidelity Central Funds held as of period end, if any, as an investment of the Fund, but does not include the underlying holdings of each Fidelity Central Fund. As an Investing Fund, the Fund indirectly bears its proportionate share of the expenses of the underlying Fidelity Central Funds.
The Money Market Central Funds seek preservation of capital and current income and are managed by the investment adviser. Annualized expenses of the Money Market Central Funds as of their most recent shareholder report date ranged from less than .005% to .01%.
A complete unaudited list of holdings for each Fidelity Central Fund is available upon request or at the Securities and Exchange Commission (the SEC) website at www.sec.gov. In addition, the financial statements of the Fidelity Central Funds, which are not covered by the Fund's Report of Independent Registered Public Accounting Firm, are available on the SEC website or upon request.
3. Significant Accounting Policies.
The Fund is an investment company and applies the accounting and reporting guidance of the Financial Accounting Standards Board (FASB) Accounting Standards Codification Topic 946 Financial Services – Investment Companies. The financial statements have been prepared in conformity with accounting principles generally accepted in the United States of America (GAAP), which require management to make certain estimates and assumptions at the date of the financial statements. Actual results could differ from those estimates. Subsequent events, if any, through the date that the financial statements were issued have been evaluated in the preparation of the financial statements. The following summarizes the significant accounting policies of the Fund:
Investment Valuation. Investments are valued as of 4:00 p.m. Eastern time on the last calendar day of the period. The Board of Trustees (the Board) has delegated the day to day responsibility for the valuation of the Fund's investments to the Fair Value Committee (the Committee) established by the Fund's investment adviser. In accordance with valuation policies and procedures approved by the Board, the Fund attempts to obtain prices from one or more third party pricing vendors or brokers to value its investments. When current market prices, quotations or currency exchange rates are not readily available or reliable, investments will be fair valued in good faith by the Committee, in accordance with procedures adopted by the Board. Factors used in determining fair value vary by investment type and may include market or investment specific events. The frequency with which these procedures are used cannot be predicted and they may be utilized to a significant extent. The Committee oversees the Fund's valuation policies and procedures and reports to the Board on the Committee's activities and fair value determinations. The Board monitors the appropriateness of the procedures used in valuing the Fund's investments and ratifies the fair value determinations of the Committee.
The Fund categorizes the inputs to valuation techniques used to value its investments into a disclosure hierarchy consisting of three levels as shown below:
- Level 1 – quoted prices in active markets for identical investments
- Level 2 – other significant observable inputs (including quoted prices for similar investments, interest rates, prepayment speeds, etc.)
- Level 3 – unobservable inputs (including the Fund's own assumptions based on the best information available)
Valuation techniques used to value the Fund's investments by major category are as follows:
Equity securities, including restricted securities, for which market quotations are readily available, are valued at the last reported sale price or official closing price as reported by a third party pricing vendor on the primary market or exchange on which they are traded and are categorized as Level 1 in the hierarchy. In the event there were no sales during the day or closing prices are not available, securities are valued at the last quoted bid price or may be valued using the last available price and are generally categorized as Level 2 in the hierarchy. For foreign equity securities, when market or security specific events arise, comparisons to the valuation of American Depositary Receipts (ADRs), futures contracts, Exchange-Traded Funds (ETFs) and certain indexes as well as quoted prices for similar securities may be used and would be categorized as Level 2 in the hierarchy. For equity securities, including restricted securities, where observable inputs are limited, assumptions about market activity and risk are used and these securities may be categorized as Level 3 in the hierarchy.
Investments in open-end mutual funds, including the Fidelity Central Funds, are valued at their closing net asset value (NAV) each business day and are categorized as Level 1 in the hierarchy.
Changes in valuation techniques may result in transfers in or out of an assigned level within the disclosure hierarchy. The aggregate value of investments by input level as of October 31, 2020 is included at the end of the Fund's Schedule of Investments.
Foreign Currency. Certain Funds may use foreign currency contracts to facilitate transactions in foreign-denominated securities. Gains and losses from these transactions may arise from changes in the value of the foreign currency or if the counterparties do not perform under the contracts' terms.
Foreign-denominated assets, including investment securities, and liabilities are translated into U.S. dollars at the exchange rates at period end. Purchases and sales of investment securities, income and dividends received, and expenses denominated in foreign currencies are translated into U.S. dollars at the exchange rate in effect on the transaction date.
The effects of exchange rate fluctuations on investments are included with the net realized and unrealized gain (loss) on investment securities. Other foreign currency transactions resulting in realized and unrealized gain (loss) are disclosed separately.
Investment Transactions and Income. For financial reporting purposes, the Fund's investment holdings and NAV include trades executed through the end of the last business day of the period. The NAV per share for processing shareholder transactions is calculated as of the close of business of the New York Stock Exchange (NYSE), normally 4:00 p.m. Eastern time and includes trades executed through the end of the prior business day. Gains and losses on securities sold are determined on the basis of identified cost and include proceeds received from litigation. Dividend income is recorded on the ex-dividend date, except for certain dividends from foreign securities where the ex-dividend date may have passed, which are recorded as soon as the Fund is informed of the ex-dividend date. Non-cash dividends included in dividend income, if any, are recorded at the fair market value of the securities received. Income and capital gain distributions from Fidelity Central Funds, if any, are recorded on the ex-dividend date. Certain distributions received by the Fund represent a return of capital or capital gain. The Fund determines the components of these distributions subsequent to the ex-dividend date, based upon receipt of tax filings or other correspondence relating to the underlying investment. These distributions are recorded as a reduction of cost of investments and/or as a realized gain. Investment income is recorded net of foreign taxes withheld where recovery of such taxes is uncertain.
Class Allocations and Expenses. Investment income, realized and unrealized capital gains and losses, common expenses of the Fund, and certain fund-level expense reductions, if any, are allocated daily on a pro-rata basis to each class based on the relative net assets of each class to the total net assets of the Fund. Each class differs with respect to transfer agent and distribution and service plan fees incurred. Certain expense reductions may also differ by class. For the reporting period, the allocated portion of income and expenses to each class as a percent of its average net assets may vary due to the timing of recording these transactions in relation to fluctuating net assets of the classes. Expenses directly attributable to a fund are charged to that fund. Expenses attributable to more than one fund are allocated among the respective funds on the basis of relative net assets or other appropriate methods. Expense estimates are accrued in the period to which they relate and adjustments are made when actual amounts are known.
Income Tax Information and Distributions to Shareholders. Each year, the Fund intends to qualify as a regulated investment company under Subchapter M of the Internal Revenue Code, including distributing substantially all of its taxable income and realized gains. As a result, no provision for U.S. Federal income taxes is required. As of October 31, 2020, the Fund did not have any unrecognized tax benefits in the financial statements; nor is the Fund aware of any tax positions for which it is reasonably possible that the total amounts of unrecognized tax benefits will significantly change in the next twelve months. The Fund files a U.S. federal tax return, in addition to state and local tax returns as required. The Fund's federal income tax returns are subject to examination by the Internal Revenue Service (IRS) for a period of three fiscal years after they are filed. State and local tax returns may be subject to examination for an additional fiscal year depending on the jurisdiction. Foreign taxes are provided for based on the Fund's understanding of the tax rules and rates that exist in the foreign markets in which it invests.
Distributions are declared and recorded on the ex-dividend date. Income and capital gain distributions are declared separately for each class. Income and capital gain distributions are determined in accordance with income tax regulations, which may differ from GAAP. In addition, the Fund claimed a portion of the payment made to redeeming shareholders as a distribution for income tax purposes.
Capital accounts within the financial statements are adjusted for permanent book-tax differences. These adjustments have no impact on net assets or the results of operations. Capital accounts are not adjusted for temporary book-tax differences which will reverse in a subsequent period.
Book-tax differences are primarily due to foreign currency transactions, passive foreign investment companies (PFIC), capital loss carryforwards and losses deferred due to wash sales.
As of period end, the cost and unrealized appreciation (depreciation) in securities, and derivatives if applicable, for federal income tax purposes were as follows:
| Gross unrealized appreciation | $44,213,795 |
| Gross unrealized depreciation | (104,465,473) |
| Net unrealized appreciation (depreciation) | $(60,251,678) |
The tax-based components of distributable earnings as of period end were as follows:
| Undistributed ordinary income | $8,829,372 |
| Capital loss carryforward | $(52,943,819) |
| Net unrealized appreciation (depreciation) on securities and other investments | $(60,184,628) |
Capital loss carryforwards are only available to offset future capital gains of the Fund to the extent provided by regulations and may be limited. The capital loss carryforward information presented below, including any applicable limitation, is estimated as of fiscal period end and is subject to adjustment.
| No expiration | |
| Short-term | $(13,358,997) |
| Long-term | (39,584,822) |
| Total capital loss carryforward | $(52,943,819) |
The tax character of distributions paid was as follows:
| | October 31, 2020 | October 31, 2019 |
| Ordinary Income | $17,025,846 | $ 13,674,095 |
Restricted Securities (including Private Placements). The Fund may invest in securities that are subject to legal or contractual restrictions on resale. These securities generally may be resold in transactions exempt from registration or to the public if the securities are registered. Disposal of these securities may involve time-consuming negotiations and expense, and prompt sale at an acceptable price may be difficult. Information regarding restricted securities is included at the end of the Fund's Schedule of Investments.
4. Purchases and Sales of Investments.
Purchases and sales of securities, other than short-term securities, are noted in the table below.
| | Purchases ($) | Sales ($) |
| Fidelity International Value Fund | 187,387,829 | 154,606,729 |
5. Fees and Other Transactions with Affiliates.
Management Fee. Fidelity Management & Research Company LLC (the investment adviser) and its affiliates provide the Fund with investment management related services for which the Fund pays a monthly management fee. The management fee is the sum of an individual fund fee rate that is based on an annual rate of .45% of the Fund's average net assets and an annualized group fee rate that averaged .23% during the period. The group fee rate is based upon the monthly average net assets of a group of registered investment companies with which the investment adviser has management contracts. The group fee rate decreases as assets under management increase and increases as assets under management decrease. In addition, the management fee is subject to a performance adjustment (up to a maximum of +/- .20% of the Fund's average net assets over a 36 month performance period). The upward or downward adjustment to the management fee is based on the relative investment performance of International Value as compared to its benchmark index, the MSCI EAFE Value Index, over the same 36 month performance period. For the reporting period, the total annual management fee rate, including the performance adjustment, was .67% of the Fund's average net assets. The performance adjustment included in the management fee rate may be higher or lower than the maximum performance adjustment rate due to the difference between the average net assets for the reporting and performance periods.
Distribution and Service Plan Fees. In accordance with Rule 12b-1 of the 1940 Act, the Fund has adopted separate Distribution and Service Plans for each class of shares. Certain classes pay Fidelity Distributors Company LLC (FDC), an affiliate of the investment adviser, separate Distribution and Service Fees, each of which is based on an annual percentage of each class' average net assets. In addition, FDC may pay financial intermediaries for selling shares of the Fund and providing shareholder support services. For the period, the Distribution and Service Fee rates, total fees and amounts retained by FDC were as follows:
| | Distribution Fee | Service Fee | Total Fees | Retained by FDC |
| Class A | -% | .25% | $16,220 | $268 |
| Class M | .25% | .25% | 16,223 | 247 |
| Class C | .75% | .25% | 32,510 | 3,463 |
| | | | $64,953 | $3,978 |
Sales Load. FDC may receive a front-end sales charge of up to 5.75% for selling Class A shares and 3.50% for selling Class M shares, some of which is paid to financial intermediaries for selling shares of the Fund. Depending on the holding period, FDC may receive contingent deferred sales charges levied on Class A, Class M and Class C redemptions. The deferred sales charges are 1.00% for Class C shares, 1.00% for certain purchases of Class A shares and .25% for certain purchases of Class M shares.
For the period, sales charge amounts retained by FDC were as follows:
| | Retained by FDC |
| Class A | $1,716 |
| Class M | 432 |
| Class C(a) | 226 |
| | $2,374 |
(a) When Class C shares are initially sold, FDC pays commissions from its own resources to financial intermediaries through which the sales are made.
Transfer Agent Fees. Fidelity Investments Institutional Operations Company LLC (FIIOC), an affiliate of the investment adviser, is the transfer, dividend disbursing and shareholder servicing agent for each class of the Fund. FIIOC receives account fees and asset-based fees that vary according to the account size and type of account of the shareholders of the respective classes of the Fund, except for Class Z. FIIOC receives an asset-based fee of Class Z's average net assets. FIIOC pays for typesetting, printing and mailing of shareholder reports, except proxy statements. Effective February 1, 2020, the Board approved to change the fee for Class Z from .046% to .044%.
For the period, transfer agent fees for each class were as follows:
| | Amount | % of Class-Level Average Net Assets |
| Class A | $17,528 | .27 |
| Class M | 9,404 | .29 |
| Class C | 9,327 | .29 |
| International Value | 665,199 | .16 |
| Class I | 14,789 | .20 |
| Class Z | 989 | .04 |
| | $717,236 | |
Accounting Fees. Fidelity Service Company, Inc. (FSC), an affiliate of the investment adviser, maintains the Fund's accounting records. The accounting fee is based on the level of average net assets for each month. For the period, the fees were equivalent to the following annual rates:
| | % of Average Net Assets |
| Fidelity International Value Fund | .05 |
Brokerage Commissions. A portion of portfolio transactions were placed with brokerage firms which are affiliates of the investment adviser. Brokerage commissions are included in net realized gain (loss) and change in net unrealized appreciation (depreciation) in the Statement of Operations. The commissions paid to these affiliated firms were as follows:
| | Amount |
| Fidelity International Value Fund | $83 |
Interfund Lending Program. Pursuant to an Exemptive Order issued by the SEC, the Fund, along with other registered investment companies having management contracts with Fidelity Management & Research Company LLC (FMR), or other affiliated entities of FMR, may participate in an interfund lending program. This program provides an alternative credit facility allowing the Fund to borrow from, or lend money to, other participating affiliated funds. At period end, there were no interfund loans outstanding. Activity in this program during the period for which loans were outstanding was as follows:
| | Borrower or Lender | Average Loan Balance | Weighted Average Interest Rate | Interest Expense |
| Fidelity International Value Fund | Borrower | $6,430,500 | 1.78% | $637 |
Interfund Trades. Funds may purchase from or sell securities to other Fidelity Funds under procedures adopted by the Board. The procedures have been designed to ensure these interfund trades are executed in accordance with Rule 17a-7 of the 1940 Act. Interfund trades are included within the respective purchases and sales amounts shown in the Purchases and Sales of Investments note.
6. Committed Line of Credit.
Certain Funds participate with other funds managed by the investment adviser or an affiliate in a $4.25 billion credit facility (the "line of credit") to be utilized for temporary or emergency purposes to fund shareholder redemptions or for other short-term liquidity purposes. The participating funds have agreed to pay commitment fees on their pro-rata portion of the line of credit, which are reflected in Miscellaneous expenses on the Statement of Operations, and are as follows:
| | Amount |
| Fidelity International Value Fund | $1,035 |
During the period, there were no borrowings on this line of credit.
7. Security Lending.
Funds lend portfolio securities from time to time in order to earn additional income. Lending agents are used, including National Financial Services (NFS), an affiliate of the investment adviser. Pursuant to a securities lending agreement, NFS will receive a fee, which is capped at 9.9% of a fund's daily lending revenue, for its services as lending agent. A fund may lend securities to certain qualified borrowers, including NFS. On the settlement date of the loan, a fund receives collateral (in the form of U.S. Treasury obligations, letters of credit and/or cash) against the loaned securities and maintains collateral in an amount not less than 100% of the market value of the loaned securities during the period of the loan. The market value of the loaned securities is determined at the close of business of a fund and any additional required collateral is delivered to a fund on the next business day. A fund or borrower may terminate the loan at any time, and if the borrower defaults on its obligation to return the securities loaned because of insolvency or other reasons, a fund may apply collateral received from the borrower against the obligation. A fund may experience delays and costs in recovering the securities loaned. Any cash collateral received is invested in the Fidelity Securities Lending Cash Central Fund. Any loaned securities are identified as such in the Schedule of Investments, and the value of loaned securities and cash collateral at period end, as applicable, are presented in the Statement of Assets and Liabilities. Security lending income represents the income earned on investing cash collateral, less rebates paid to borrowers and any lending agent fees associated with the loan, plus any premium payments received for lending certain types of securities. Security lending income is presented in the Statement of Operations as a component of income from Fidelity Central Funds. Affiliated security lending activity, if any, was as follows:
| | Total Security Lending Income Fees Paid to NFS | Security Lending Income From Securities Loaned to NFS | Value of Securities Loaned to NFS at Period End |
| Fidelity International Value Fund | $23 | $– | $– |
8. Expense Reductions.
Commissions paid to certain brokers with whom the investment adviser, or its affiliates, places trades on behalf of the Fund include an amount in addition to trade execution, which may be rebated back to the Fund to offset certain expenses. This amount totaled $58,692 for the period.
In addition, during the period the investment adviser or an affiliate reimbursed and/or waived a portion of fund-level operating expenses in the amount of $1,954.
In addition, during the period the investment adviser or an affiliate reimbursed the Fund $7,750 for an operational error which is included in the accompanying Statement of Operations.
9. Distributions to Shareholders.
Distributions to shareholders of each class were as follows:
| | Year ended
October 31, 2020 | Year ended
October 31, 2019 |
| Distributions to shareholders | | |
| Class A | $250,358 | $203,466 |
| Class M | 108,862 | 86,532 |
| Class C | 90,015 | 78,779 |
| International Value | 16,196,338 | 13,098,896 |
| Class I | 295,710 | 198,775 |
| Class Z | 84,563 | 7,647 |
| Total | $17,025,846 | $13,674,095 |
10. Share Transactions.
Share transactions for each class were as follows and may contain automatic conversions between classes or exchanges between affiliated funds:
| | Shares | Shares | Dollars | Dollars |
| | Year ended October 31, 2020 | Year ended October 31, 2019 | Year ended October 31, 2020 | Year ended October 31, 2019 |
| Class A | | | | |
| Shares sold | 149,593 | 218,117 | $1,096,696 | $1,710,090 |
| Reinvestment of distributions | 30,176 | 26,837 | 245,629 | 199,932 |
| Shares redeemed | (259,934) | (268,764) | (1,928,162) | (2,109,659) |
| Net increase (decrease) | (80,165) | (23,810) | $(585,837) | $(199,637) |
| Class M | | | | |
| Shares sold | 43,159 | 80,208 | $312,065 | $628,608 |
| Reinvestment of distributions | 12,987 | 11,597 | 105,846 | 86,515 |
| Shares redeemed | (91,699) | (119,055) | (664,466) | (939,737) |
| Net increase (decrease) | (35,553) | (27,250) | $(246,555) | $(224,614) |
| Class C | | | | |
| Shares sold | 68,089 | 71,027 | $493,863 | $560,721 |
| Reinvestment of distributions | 11,018 | 10,495 | 90,015 | 78,501 |
| Shares redeemed | (115,728) | (275,427) | (851,545) | (2,176,151) |
| Net increase (decrease) | (36,621) | (193,905) | $(267,667) | $(1,536,929) |
| International Value | | | | |
| Shares sold | 13,140,575 | 7,795,183 | $91,311,864 | $61,080,526 |
| Reinvestment of distributions | 1,031,528 | 901,853 | 8,365,693 | 6,700,770 |
| Shares redeemed | (8,634,726) | (8,255,695) | (58,976,320) | (64,565,958) |
| Net increase (decrease) | 5,537,377 | 441,341 | $40,701,237 | $3,215,338 |
| Class I | | | | |
| Shares sold | 1,243,265 | 632,568 | $9,161,904 | $4,879,197 |
| Reinvestment of distributions | 34,548 | 24,905 | 280,876 | 185,542 |
| Shares redeemed | (793,273) | (461,351) | (5,758,278) | (3,618,354) |
| Net increase (decrease) | 484,540 | 196,122 | $3,684,502 | $1,446,385 |
| Class Z | | | | |
| Shares sold | 223,353 | 292,569 | $1,616,204 | $2,235,643 |
| Reinvestment of distributions | 10,427 | 1,029 | 84,563 | 7,647 |
| Shares redeemed | (135,243) | (32,507) | (968,776) | (250,757) |
| Net increase (decrease) | 98,537 | 261,091 | $731,991 | $1,992,533 |
11. Other.
The Fund's organizational documents provide former and current trustees and officers with a limited indemnification against liabilities arising in connection with the performance of their duties to the Fund. In the normal course of business, the Fund may also enter into contracts that provide general indemnifications. The Fund's maximum exposure under these arrangements is unknown as this would be dependent on future claims that may be made against the Fund. The risk of material loss from such claims is considered remote.
At the end of the period, VIP FundsManager 60% Portfolio and Strategic Advisers Fidelity International Fund, were the owners of record of approximately 13% and 40%, respectively, of the total outstanding shares of the Fund. Mutual funds managed by the investment adviser or its affiliates were the owners of record, in the aggregate, of approximately 71% of the total outstanding shares of the Fund.
12. Coronavirus (COVID-19) Pandemic.
An outbreak of COVID-19 first detected in China during December 2019 has since spread globally and was declared a pandemic by the World Health Organization during March 2020. Developments that disrupt global economies and financial markets, such as the COVID-19 pandemic, may magnify factors that affect the Fund's performance.
Report of Independent Registered Public Accounting Firm
To the Board of Trustees of Fidelity Investment Trust and Shareholders of Fidelity International Value Fund:
Opinion on the Financial Statements and Financial Highlights
We have audited the accompanying statement of assets and liabilities of Fidelity International Value Fund (the "Fund"), a fund of Fidelity Investment Trust, including the schedule of investments, as of October 31, 2020, the related statement of operations for the year then ended, the statement of changes in net assets for each of the two years in the period then ended, the financial highlights for each of the five years in the period then ended, and the related notes. In our opinion, the financial statements and financial highlights present fairly, in all material respects, the financial position of the Fund as of October 31, 2020, and the results of its operations for the year then ended, the changes in its net assets for each of the two years in the period then ended, and the financial highlights for each of the five years in the period then ended in conformity with accounting principles generally accepted in the United States of America.
Basis for Opinion
These financial statements and financial highlights are the responsibility of the Fund's management. Our responsibility is to express an opinion on the Fund's financial statements and financial highlights based on our audits. We are a public accounting firm registered with the Public Company Accounting Oversight Board (United States) (PCAOB) and are required to be independent with respect to the Fund in accordance with the U.S. federal securities laws and the applicable rules and regulations of the Securities and Exchange Commission and the PCAOB.
We conducted our audits in accordance with the standards of the PCAOB. Those standards require that we plan and perform the audit to obtain reasonable assurance about whether the financial statements and financial highlights are free of material misstatement, whether due to error or fraud. The Fund is not required to have, nor were we engaged to perform, an audit of its internal control over financial reporting. As part of our audits we are required to obtain an understanding of internal control over financial reporting but not for the purpose of expressing an opinion on the effectiveness of the Fund’s internal control over financial reporting. Accordingly, we express no such opinion.
Our audits included performing procedures to assess the risks of material misstatement of the financial statements and financial highlights, whether due to error or fraud, and performing procedures that respond to those risks. Such procedures included examining, on a test basis, evidence regarding the amounts and disclosures in the financial statements and financial highlights. Our audits also included evaluating the accounting principles used and significant estimates made by management, as well as evaluating the overall presentation of the financial statements and financial highlights. Our procedures included confirmation of securities owned as of October 31, 2020, by correspondence with the custodian and brokers; when replies were not received from brokers, we performed other auditing procedures. We believe that our audits provide a reasonable basis for our opinion.
/s/ Deloitte & Touche LLP
Boston, Massachusetts
December 14, 2020
We have served as the auditor of one or more of the Fidelity investment companies since 1999.
Trustees and Officers
The Trustees, Members of the Advisory Board (if any), and officers of the trust and fund, as applicable, are listed below. The Board of Trustees governs the fund and is responsible for protecting the interests of shareholders. The Trustees are experienced executives who meet periodically throughout the year to oversee the fund's activities, review contractual arrangements with companies that provide services to the fund, oversee management of the risks associated with such activities and contractual arrangements, and review the fund's performance. Except for Jonathan Chiel, each of the Trustees oversees 305 funds. Mr. Chiel oversees 176 funds.
The Trustees hold office without limit in time except that (a) any Trustee may resign; (b) any Trustee may be removed by written instrument, signed by at least two-thirds of the number of Trustees prior to such removal; (c) any Trustee who requests to be retired or who has become incapacitated by illness or injury may be retired by written instrument signed by a majority of the other Trustees; and (d) any Trustee may be removed at any special meeting of shareholders by a two-thirds vote of the outstanding voting securities of the trust. Each Trustee who is not an interested person (as defined in the 1940 Act) of the trust and the fund is referred to herein as an Independent Trustee. Each Independent Trustee shall retire not later than the last day of the calendar year in which his or her 75th birthday occurs. The Independent Trustees may waive this mandatory retirement age policy with respect to individual Trustees. Officers and Advisory Board Members hold office without limit in time, except that any officer or Advisory Board Member may resign or may be removed by a vote of a majority of the Trustees at any regular meeting or any special meeting of the Trustees. Except as indicated, each individual has held the office shown or other offices in the same company for the past five years.
The fund's Statement of Additional Information (SAI) includes more information about the Trustees. To request a free copy, call Fidelity at 1-800-544-8544 if you’re an individual investing directly with Fidelity, call 1-800-835-5092 if you’re a plan sponsor or participant with Fidelity as your recordkeeper or call 1-877-208-0098 on institutional accounts or if you’re an advisor or invest through one.
Experience, Skills, Attributes, and Qualifications of the Trustees. The Governance and Nominating Committee has adopted a statement of policy that describes the experience, qualifications, attributes, and skills that are necessary and desirable for potential Independent Trustee candidates (Statement of Policy). The Board believes that each Trustee satisfied at the time he or she was initially elected or appointed a Trustee, and continues to satisfy, the standards contemplated by the Statement of Policy. The Governance and Nominating Committee also engages professional search firms to help identify potential Independent Trustee candidates who have the experience, qualifications, attributes, and skills consistent with the Statement of Policy. From time to time, additional criteria based on the composition and skills of the current Independent Trustees, as well as experience or skills that may be appropriate in light of future changes to board composition, business conditions, and regulatory or other developments, have also been considered by the professional search firms and the Governance and Nominating Committee. In addition, the Board takes into account the Trustees' commitment and participation in Board and committee meetings, as well as their leadership of standing and ad hoc committees throughout their tenure.
In determining that a particular Trustee was and continues to be qualified to serve as a Trustee, the Board has considered a variety of criteria, none of which, in isolation, was controlling. The Board believes that, collectively, the Trustees have balanced and diverse experience, qualifications, attributes, and skills, which allow the Board to operate effectively in governing the fund and protecting the interests of shareholders. Information about the specific experience, skills, attributes, and qualifications of each Trustee, which in each case led to the Board's conclusion that the Trustee should serve (or continue to serve) as a trustee of the fund, is provided below.
Board Structure and Oversight Function. Robert A. Lawrence is an interested person and currently serves as Acting Chairman. The Trustees have determined that an interested Chairman is appropriate and benefits shareholders because an interested Chairman has a personal and professional stake in the quality and continuity of services provided to the fund. Independent Trustees exercise their informed business judgment to appoint an individual of their choosing to serve as Chairman, regardless of whether the Trustee happens to be independent or a member of management. The Independent Trustees have determined that they can act independently and effectively without having an Independent Trustee serve as Chairman and that a key structural component for assuring that they are in a position to do so is for the Independent Trustees to constitute a substantial majority for the Board. The Independent Trustees also regularly meet in executive session. Ned C. Lautenbach and David M. Thomas serve as Co-Lead Independent Trustees and as such each (i) acts as a liaison between the Independent Trustees and management with respect to matters important to the Independent Trustees and (ii) with management prepares agendas for Board meetings.
Fidelity® funds are overseen by different Boards of Trustees. The fund's Board oversees Fidelity's high income and certain equity funds, and other Boards oversee Fidelity's investment-grade bond, money market, asset allocation, and other equity funds. The asset allocation funds may invest in Fidelity® funds overseen by the fund's Board. The use of separate Boards, each with its own committee structure, allows the Trustees of each group of Fidelity® funds to focus on the unique issues of the funds they oversee, including common research, investment, and operational issues. On occasion, the separate Boards establish joint committees to address issues of overlapping consequences for the Fidelity® funds overseen by each Board.
The Trustees operate using a system of committees to facilitate the timely and efficient consideration of all matters of importance to the Trustees, the fund, and fund shareholders and to facilitate compliance with legal and regulatory requirements and oversight of the fund's activities and associated risks. The Board, acting through its committees, has charged FMR and its affiliates with (i) identifying events or circumstances the occurrence of which could have demonstrably adverse effects on the fund's business and/or reputation; (ii) implementing processes and controls to lessen the possibility that such events or circumstances occur or to mitigate the effects of such events or circumstances if they do occur; and (iii) creating and maintaining a system designed to evaluate continuously business and market conditions in order to facilitate the identification and implementation processes described in (i) and (ii) above. Because the day-to-day operations and activities of the fund are carried out by or through FMR, its affiliates, and other service providers, the fund's exposure to risks is mitigated but not eliminated by the processes overseen by the Trustees. While each of the Board's committees has responsibility for overseeing different aspects of the fund's activities, oversight is exercised primarily through the Operations, Audit, and Compliance Committees. Appropriate personnel, including but not limited to the fund's Chief Compliance Officer (CCO), FMR's internal auditor, the independent accountants, the fund's Treasurer and portfolio management personnel, make periodic reports to the Board's committees, as appropriate, including an annual review of Fidelity's risk management program for the Fidelity® funds. The responsibilities of each standing committee, including their oversight responsibilities, are described further under "Standing Committees of the Trustees."
Interested Trustees*:
Correspondence intended for a Trustee who is an interested person may be sent to Fidelity Investments, 245 Summer Street, Boston, Massachusetts 02210.
Name, Year of Birth; Principal Occupations and Other Relevant Experience+
Jonathan Chiel (1957)
Year of Election or Appointment: 2016
Trustee
Mr. Chiel also serves as Trustee of other Fidelity® funds. Mr. Chiel is Executive Vice President and General Counsel for FMR LLC (diversified financial services company, 2012-present). Previously, Mr. Chiel served as general counsel (2004-2012) and senior vice president and deputy general counsel (2000-2004) for John Hancock Financial Services; a partner with Choate, Hall & Stewart (1996-2000) (law firm); and an Assistant United States Attorney for the United States Attorney’s Office of the District of Massachusetts (1986-95), including Chief of the Criminal Division (1993-1995). Mr. Chiel is a director on the boards of the Boston Bar Foundation and the Maimonides School.
Robert A. Lawrence (1952)
Year of Election or Appointment: 2020
Trustee
Acting Chairman of the Board of Trustees
Mr. Lawrence also serves as Trustee of other funds. Previously, Mr. Lawrence served as a Member of the Advisory Board of certain funds. Prior to his retirement in 2008, Mr. Lawrence served as Vice President of certain Fidelity® funds (2006-2008), Senior Vice President, Head of High Income Division of Fidelity Management & Research Company (investment adviser firm, 2006-2008), and President of Fidelity Strategic Investments (investment adviser firm, 2002-2005).
* Determined to be an “Interested Trustee” by virtue of, among other things, his or her affiliation with the trust or various entities under common control with FMR.
+ The information includes the Trustee's principal occupation during the last five years and other information relating to the experience, attributes, and skills relevant to the Trustee's qualifications to serve as a Trustee, which led to the conclusion that the Trustee should serve as a Trustee for the fund.
Independent Trustees:
Correspondence intended for an Independent Trustee may be sent to Fidelity Investments, P.O. Box 55235, Boston, Massachusetts 02205-5235.
Name, Year of Birth; Principal Occupations and Other Relevant Experience+
Dennis J. Dirks (1948)
Year of Election or Appointment: 2005
Trustee
Mr. Dirks also serves as Trustee of other Fidelity® funds. Prior to his retirement in May 2003, Mr. Dirks served as Chief Operating Officer and as a member of the Board of The Depository Trust & Clearing Corporation (financial markets infrastructure), President, Chief Operating Officer and a member of the Board of The Depository Trust Company (DTC), President and a member of the Board of the National Securities Clearing Corporation (NSCC), Chief Executive Officer and a member of the Board of the Government Securities Clearing Corporation and Chief Executive Officer and a member of the Board of the Mortgage-Backed Securities Clearing Corporation. Mr. Dirks currently serves as a member of the Finance Committee (2016-present) and Board (2017-present) and is Treasurer (2018-present) of the Asolo Repertory Theatre.
Donald F. Donahue (1950)
Year of Election or Appointment: 2018
Trustee
Mr. Donahue also serves as Trustee of other Fidelity® funds. Mr. Donahue serves as President and Chief Executive Officer of Miranda Partners, LLC (risk consulting for the financial services industry, 2012-present). Previously, Mr. Donahue served as Chief Executive Officer (2006-2012), Chief Operating Officer (2003-2006) and Managing Director, Customer Marketing and Development (1999-2003) of The Depository Trust & Clearing Corporation (financial markets infrastructure). Mr. Donahue currently serves as a member (2007-present) and Co-Chairman (2016-present) of the Board of United Way of New York, a member of the Board of NYC Leadership Academy (2012-present) and a member of the Board of Advisors of Ripple Labs, Inc. (financial services, 2015-present). Mr. Donahue previously served as a member of the Advisory Board of certain Fidelity® funds (2015-2018).
Vicki L. Fuller (1957)
Year of Election or Appointment: 2020
Trustee
Ms. Fuller also serves as Trustee of other Fidelity® funds. Previously, Ms. Fuller served as a member of the Advisory Board of certain Fidelity® funds (2018-2020), Chief Investment Officer of the New York State Common Retirement Fund (2012-2018) and held a variety of positions at AllianceBernstein L.P. (global asset management, 1985-2012), including Managing Director (2006-2012) and Senior Vice President and Senior Portfolio Manager (2001-2006). Ms. Fuller currently serves as a member of the Board, Audit Committee and Nominating and Governance Committee of The Williams Companies, Inc. (natural gas infrastructure, 2018-present), as a member of the Board, Audit Committee and Nominating and Governance Committee of two Blackstone business development companies (2020-present) and as a member of the Board of Treliant, LLC (consulting, 2019-present).
Patricia L. Kampling (1959)
Year of Election or Appointment: 2020
Trustee
Ms. Kampling also serves as Trustee of other Fidelity® funds. Prior to her retirement, Ms. Kampling served as Chairman of the Board and Chief Executive Officer (2012-2019), President and Chief Operating Officer (2011-2012) and Executive Vice President and Chief Financial Officer (2010-2011) of Alliant Energy Corporation. Ms. Kampling currently serves as a member of the Board, Compensation Committee and Executive Committee and as Chair of the Audit Committee of Briggs & Stratton Corporation (manufacturing, 2011-present) and as a member of the Board, Audit, Finance and Risk Committee and Safety, Environmental, Technology and Operations Committee of American Water Works Company, Inc. (utilities company, 2019-present). In addition, Ms. Kampling currently serves as a member of the Board of the Nature Conservancy, Wisconsin Chapter (2019-present). Previously, Ms. Kampling served as a Member of the Advisory Board of certain Fidelity® funds (2020), a member of the Board of Interstate Power and Light Company (2012-2019) and Wisconsin Power and Light Company (2012-2019) (each a subsidiary of Alliant Energy Corporation) and as a member of the Board and Workforce Development Committee of the Business Roundtable (2018-2019).
Alan J. Lacy (1953)
Year of Election or Appointment: 2008
Trustee
Mr. Lacy also serves as Trustee of other Fidelity® funds. Previously, Mr. Lacy served as Senior Adviser (2007-2014) of Oak Hill Capital Partners, L.P. (private equity), Chief Executive Officer (2005) and Vice Chairman (2005-2006) of Sears Holdings Corporation (retail), Chief Executive Officer and Chairman of the Board of Sears, Roebuck and Co. (retail, 2000-2005), Chairman (2014-2017) and a member of the Board (2010-2017) of Dave & Buster’s Entertainment, Inc. (restaurant and entertainment complexes) and a member of the Board of Bristol-Myers Squibb Company (global pharmaceuticals, 2008-2020). Mr. Lacy currently serves as a Trustee of the California Chapter of The Nature Conservancy (2015-present) and a member of the Board of the Center for Advanced Study in the Behavioral Sciences at Stanford University (2015-present).
Ned C. Lautenbach (1944)
Year of Election or Appointment: 2000
Trustee
Co-Lead Independent Trustee
Mr. Lautenbach also serves as Trustee of other Fidelity® funds. Mr. Lautenbach currently serves as Chair of the Board of Governors, State University System of Florida (2013-present) and is a member of the Council on Foreign Relations (1994-present). He is also a member and has in the past served as Chairman of the Board of Directors of Artis-Naples (2012-present). Previously, Mr. Lautenbach served as a member and then Lead Director of the Board of Directors of Eaton Corporation (diversified industrial, 1997-2016). He was also a Partner at Clayton, Dubilier & Rice, LLC (private equity investment, 1998-2010); as well as Director of Sony Corporation (2006-2007). In addition, Mr. Lautenbach had a 30-year career with IBM (technology company), during which time he served as Senior Vice President and as a member of the Corporate Executive Committee (1968-1998).
Joseph Mauriello (1944)
Year of Election or Appointment: 2008
Trustee
Mr. Mauriello also serves as Trustee of other Fidelity® funds. Prior to his retirement in January 2006, Mr. Mauriello served in numerous senior management positions including Deputy Chairman and Chief Operating Officer (2004-2005), and Vice Chairman of Financial Services (2002-2004) of KPMG LLP US (professional services, 1965-2005). Mr. Mauriello currently serves as a member of the Independent Directors Council Governing Council (2015-present). Previously, Mr. Mauriello served as a member of the Board of XL Group plc. (global insurance and re-insurance, 2006-2018).
Cornelia M. Small (1944)
Year of Election or Appointment: 2005
Trustee
Ms. Small also serves as Trustee of other Fidelity® funds. Previously, Ms. Small served as Chief Investment Officer, Director of Global Equity Investments and a member of Scudder, Stevens & Clark and Scudder Kemper Investments. Ms. Small previously served as a member of the Board (2009-2019) and Chair of the Investment Committee (2010-2019) of the Teagle Foundation and a member of the Investment Committee of the Berkshire Taconic Community Foundation (2008-2019).
Garnett A. Smith (1947)
Year of Election or Appointment: 2018
Trustee
Mr. Smith also serves as Trustee of other Fidelity® funds. Prior to his retirement, Mr. Smith served as Chairman and Chief Executive Officer (1990-1997) and President (1986-1990) of Inbrand Corp. (manufacturer of personal absorbent products). Prior to his employment with Inbrand Corp., he was employed by a retail fabric chain and North Carolina National Bank (now Bank of America). Mr. Smith previously served as a member of the Advisory Board of certain Fidelity® funds (2012-2013).
David M. Thomas (1949)
Year of Election or Appointment: 2008
Trustee
Co-Lead Independent Trustee
Mr. Thomas also serves as Trustee of other Fidelity® funds. Previously, Mr. Thomas served as Executive Chairman (2005-2006) and Chairman and Chief Executive Officer (2000-2005) of IMS Health, Inc. (pharmaceutical and healthcare information solutions). Mr. Thomas currently serves as Non-Executive Chairman of the Board of Fortune Brands Home and Security (home and security products, 2011-present), and a member of the Board (2004-present) and Presiding Director (2013-present) of Interpublic Group of Companies, Inc. (marketing communication).
Susan Tomasky (1953)
Year of Election or Appointment: 2020
Trustee
Ms. Tomasky also serves as Trustee of other Fidelity® funds. Prior to her retirement, Ms. Tomasky served in various executive officer positions at American Electric Power Company, Inc. (1998-2011), including most recently as President of AEP Transmission (2007-2011). Ms. Tomasky currently serves as a member of the Board and Sustainability Committee and as Chair of the Audit Committee of Marathon Petroleum Corporation (2018-present) and as a member of the Board, Corporate Governance Committee and Organization and Compensation Committee and as Chair of the Audit Committee of Public Service Enterprise Group, Inc. (utilities company, 2012-present). In addition, Ms. Tomasky currently serves as a member of the Board of the Columbus Regional Airport Authority (2007-present), as a member of the Board of the Royal Shakespeare Company – America (2009-present), as a member of the Board of the Columbus Association for the Performing Arts (2011-present) and as a member of the Board of Kenyon College (2016-present). Previously, Ms. Tomasky served as a Member of the Advisory Board of certain Fidelity® funds (2020), a member of the Board (2011-2019) and as Lead Independent Director (2015-2018) of Andeavor Corporation (previously Tesoro Corporation) (independent oil refiner and marketer) and as a member of the Board of Summit Midstream Partners LP (energy, 2012-2018).
Michael E. Wiley (1950)
Year of Election or Appointment: 2020
Trustee
Mr. Wiley also serves as Trustee of other Fidelity® funds. Previously, Mr. Wiley served as a member of the Advisory Board of certain Fidelity® funds (2018-2020), Chairman, President and CEO of Baker Hughes, Inc. (oilfield services, 2000-2004). Mr. Wiley also previously served as a member of the Board of Andeavor Corporation (independent oil refiner and marketer, 2005-2018), a member of the Board of Andeavor Logistics LP (natural resources logistics, 2015-2018) and a member of the Board of High Point Resources (exploration and production, 2005-2020).
+ The information includes the Trustee's principal occupation during the last five years and other information relating to the experience, attributes, and skills relevant to the Trustee's qualifications to serve as a Trustee, which led to the conclusion that the Trustee should serve as a Trustee for the fund.
Advisory Board Members and Officers:
Correspondence intended for a Member of the Advisory Board (if any) may be sent to Fidelity Investments, P.O. Box 55235, Boston, Massachusetts 02205-5235. Correspondence intended for an officer or Peter S. Lynch may be sent to Fidelity Investments, 245 Summer Street, Boston, Massachusetts 02210. Officers appear below in alphabetical order.
Name, Year of Birth; Principal Occupation
Lloyd James Austin, III (1953)
Year of Election or Appointment: 2020
Member of the Advisory Board
General Austin also serves as a Member of the Advisory Board of other Fidelity® funds. Prior to his retirement, General Austin (United States Army, Retired) held a variety of positions within the U.S. Government, including Commander, U.S. Central Command (2013-2016), Vice Chief of Staff, U.S. Army (2012-2013) and Commanding General, U.S. Forces – Iraq, Operation New Dawn (2010-2012). General Austin currently serves as a Partner of Pine Island Capital Partners (private equity, 2020-present) and as President of the Austin Strategy Group LLC (consulting, 2016-present). General Austin serves as a member of the Board of Directors of Nucor Corporation (steel products, 2017-present), as a member of the Board of Directors of Tenet Healthcare Corporation (2018-present) and as a member of the Board of Directors of Raytheon Technologies Corporation (aerospace and defense, 2020-present). In addition, General Austin currently serves as a member of the Board of Trustees of the Carnegie Corporation of New York (2017-present) and as a member of the Board of Trustees of Auburn University (2017-present). Previously, General Austin served as a member of the Board of Directors of United Technologies Corporation (aerospace, defense and building, 2016-2020).
Thomas A. Kennedy (1955)
Year of Election or Appointment: 2020
Member of the Advisory Board
Mr. Kennedy also serves as a Member of the Advisory Board of other Fidelity® funds. Previously, Mr. Kennedy held a variety of positions at Raytheon Company (aerospace and defense, 1983-2020), including Chairman and Chief Executive Officer (2014-2020) and Executive Vice President and Chief Operating Officer (2013-2014). Mr. Kennedy currently serves as Executive Chairman of the Board of Directors of Raytheon Technologies Corporation (aerospace and defense, 2020-present). He is also a member of the Rutgers School of Engineering Industry Advisory Board (2011-present) and a member of the UCLA Engineering Dean’s Executive Board (2016-present).
Peter S. Lynch (1944)
Year of Election or Appointment: 2003
Member of the Advisory Board
Mr. Lynch also serves as a Member of the Advisory Board of other Fidelity® funds. Mr. Lynch is Vice Chairman and a Director of Fidelity Management & Research Company LLC (investment adviser firm). In addition, Mr. Lynch serves as a Trustee of Boston College and as the Chairman of the Inner-City Scholarship Fund. Previously, Mr. Lynch served as Vice Chairman and a Director of FMR Co., Inc. (investment adviser firm) and on the Special Olympics International Board of Directors (1997-2006).
Elizabeth Paige Baumann (1968)
Year of Election or Appointment: 2017
Anti-Money Laundering (AML) Officer
Ms. Baumann also serves as AML Officer of other funds. She is Chief AML Officer (2012-present) and Senior Vice President (2014-present) of FMR LLC (diversified financial services company) and is an employee of Fidelity Investments. Previously, Ms. Baumann served as AML Officer of certain funds (2017-2019), as AML Officer of the funds (2012-2016), and Vice President (2007-2014) and Deputy Anti-Money Laundering Officer (2007-2012) of FMR LLC.
Craig S. Brown (1977)
Year of Election or Appointment: 2019
Assistant Treasurer
Mr. Brown also serves as Assistant Treasurer of other funds. Mr. Brown is an employee of Fidelity Investments (2013-present).
John J. Burke III (1964)
Year of Election or Appointment: 2018
Chief Financial Officer
Mr. Burke also serves as Chief Financial Officer of other funds. Mr. Burke serves as Head of Investment Operations for Fidelity Fund and Investment Operations (2018-present) and is an employee of Fidelity Investments (1998-present). Previously Mr. Burke served as head of Asset Management Investment Operations (2012-2018).
William C. Coffey (1969)
Year of Election or Appointment: 2019
Assistant Secretary
Mr. Coffey also serves as Assistant Secretary of other funds. He is Senior Vice President and Deputy General Counsel of FMR LLC (diversified financial services company, 2010-present), and is an employee of Fidelity Investments. Previously, Mr. Coffey served as Secretary and CLO of certain funds (2018-2019); CLO, Secretary, and Senior Vice President of Fidelity Management & Research Company and FMR Co., Inc. (investment adviser firms, 2018-2019); Secretary of Fidelity SelectCo, LLC and Fidelity Investments Money Management, Inc. (investment adviser firms, 2018-2019); CLO of Fidelity Management & Research (Hong Kong) Limited, FMR Investment Management (UK) Limited, and Fidelity Management & Research (Japan) Limited (investment adviser firms, 2018-2019); and Assistant Secretary of certain funds (2009-2018).
Timothy M. Cohen (1969)
Year of Election or Appointment: 2018
Vice President
Mr. Cohen also serves as Vice President of other funds. Mr. Cohen serves as Co-Head of Equity (2018-present), a Director of Fidelity Management & Research (Japan) Limited (investment adviser firm, 2016-present), and is an employee of Fidelity Investments. Previously, Mr. Cohen served as Executive Vice President of Fidelity SelectCo, LLC (2019), Head of Global Equity Research (2016-2018), Chief Investment Officer - Equity and a Director of Fidelity Management & Research (U.K.) Inc. (investment adviser firm, 2013-2015) and as a Director of Fidelity Management & Research (Hong Kong) Limited (investment adviser firm, 2017).
Jonathan Davis (1968)
Year of Election or Appointment: 2010
Assistant Treasurer
Mr. Davis also serves as Assistant Treasurer of other funds. Mr. Davis serves as Assistant Treasurer of FMR Capital, Inc. (2017-present) and is an employee of Fidelity Investments. Previously, Mr. Davis served as Vice President and Associate General Counsel of FMR LLC (diversified financial services company, 2003-2010).
Laura M. Del Prato (1964)
Year of Election or Appointment: 2018
Assistant Treasurer
Ms. Del Prato also serves as an officer of other funds. Ms. Del Prato is an employee of Fidelity Investments (2017-present). Previously, Ms. Del Prato served as President and Treasurer of The North Carolina Capital Management Trust: Cash Portfolio and Term Portfolio (2018-2020). Prior to joining Fidelity Investments, Ms. Del Prato served as a Managing Director and Treasurer of the JPMorgan Mutual Funds (2014-2017). Prior to JPMorgan, Ms. Del Prato served as a partner at Cohen Fund Audit Services (accounting firm, 2012-2013) and KPMG LLP (accounting firm, 2004-2012).
Colm A. Hogan (1973)
Year of Election or Appointment: 2020
Assistant Treasurer
Mr. Hogan also serves as an officer of other funds. Mr. Hogan serves as Assistant Treasurer of FMR Capital, Inc. (2017-present) and is an employee of Fidelity Investments (2005-present). Previously, Mr. Hogan served as Deputy Treasurer of certain Fidelity® funds (2016-2020) and Assistant Treasurer of certain Fidelity® funds (2016-2018).
Pamela R. Holding (1964)
Year of Election or Appointment: 2018
Vice President
Ms. Holding also serves as Vice President of other funds. Ms. Holding serves as Co-Head of Equity (2018-present) and is an employee of Fidelity Investments (2013-present). Previously, Ms. Holding served as Executive Vice President of Fidelity SelectCo, LLC (2019) and as Chief Investment Officer of Fidelity Institutional Asset Management (2013-2018).
Cynthia Lo Bessette (1969)
Year of Election or Appointment: 2019
Secretary and Chief Legal Officer (CLO)
Ms. Lo Bessette also serves as an officer of other funds. Ms. Lo Bessette serves as CLO, Secretary, and Senior Vice President of Fidelity Management & Research Company LLC (investment adviser firm, 2019-present); and CLO of Fidelity Management & Research (Hong Kong) Limited, FMR Investment Management (UK) Limited, and Fidelity Management & Research (Japan) Limited (investment adviser firms, 2019-present). She is a Senior Vice President and Deputy General Counsel of FMR LLC (diversified financial services company, 2019-present), and is an employee of Fidelity Investments. Previously, Ms. Lo Bessette served as CLO, Secretary, and Senior Vice President of FMR Co., Inc. (investment adviser firm, 2019); Secretary of Fidelity SelectCo, LLC and Fidelity Investments Money Management, Inc. (investment adviser firms, 2019). Prior to joining Fidelity Investments, Ms. Lo Bessette was Executive Vice President, General Counsel (2016-2019) and Senior Vice President, Deputy General Counsel (2015-2016) of OppenheimerFunds (investment management company) and Deputy Chief Legal Officer (2013-2015) of Jennison Associates LLC (investment adviser firm).
Chris Maher (1972)
Year of Election or Appointment: 2020
Deputy Treasurer
Mr. Maher also serves as an officer of other funds. Mr. Maher serves as Assistant Treasurer of FMR Capital, Inc. (2017-present), and is an employee of Fidelity Investments (2008-present). Previously, Mr. Maher served as Assistant Treasurer of certain funds (2013-2020); Vice President of Asset Management Compliance (2013), Vice President of the Program Management Group of FMR (investment adviser firm, 2010-2013), and Vice President of Valuation Oversight (2008-2010).
Jason P. Pogorelec (1975)
Year of Election or Appointment: 2020
Chief Compliance Officer
Mr. Pogorelec also serves as Chief Compliance Officer of other funds. Mr. Pogorelec is a senior Vice President of Asset Management Compliance for Fidelity Investments and is an employee of Fidelity Investments (2006-present). Previously, Mr. Pogorelec served as Vice President, Associate General Counsel for Fidelity Investments (2010-2020) and Assistant Secretary of certain Fidelity funds (2015-2020).
Stacie M. Smith (1974)
Year of Election or Appointment: 2016
President and Treasurer
Ms. Smith also serves as an officer of other funds. Ms. Smith serves as Assistant Treasurer of FMR Capital, Inc. (2017-present), is an employee of Fidelity Investments (2009-present), and has served in other fund officer roles. Prior to joining Fidelity Investments, Ms. Smith served as Senior Audit Manager of Ernst & Young LLP (accounting firm, 1996-2009). Previously, Ms. Smith served as Assistant Treasurer (2013-2019) and Deputy Treasurer (2013-2016) of certain Fidelity® funds.
Marc L. Spector (1972)
Year of Election or Appointment: 2016
Assistant Treasurer
Mr. Spector also serves as an officer of other funds. Mr. Spector serves as Assistant Treasurer of FMR Capital, Inc. (2017-present) and is an employee of Fidelity Investments (2016-present). Prior to joining Fidelity Investments, Mr. Spector served as Director at the Siegfried Group (accounting firm, 2013-2016), and prior to Siegfried Group as audit senior manager at Deloitte & Touche LLP (accounting firm, 2005-2013).
Jim Wegmann (1979)
Year of Election or Appointment: 2019
Assistant Treasurer
Mr. Wegmann also serves as Assistant Treasurer of other funds. Mr. Wegmann is an employee of Fidelity Investments (2011-present).
Shareholder Expense Example
As a shareholder, you incur two types of costs: (1) transaction costs, which may include sales charges (loads) on purchase payments or redemption proceeds, as applicable and (2) ongoing costs, which generally include management fees, distribution and/or service (12b-1) fees and other Fund expenses. This Example is intended to help you understand your ongoing costs (in dollars) of investing in a fund and to compare these costs with the ongoing costs of investing in other mutual funds.
The Example is based on an investment of $1,000 invested at the beginning of the period and held for the entire period (May 1, 2020 to October 31, 2020).
Actual Expenses
The first line of the accompanying table provides information about actual account values and actual expenses. You may use the information in this line, together with the amount you invested, to estimate the expenses that you paid over the period. Simply divide your account value by $1,000.00 (for example, an $8,600 account value divided by $1,000.00 = 8.6), then multiply the result by the number in the first line for a class/Fund under the heading entitled "Expenses Paid During Period" to estimate the expenses you paid on your account during this period. If any fund is a shareholder of any underlying mutual funds or exchange-traded funds (ETFs) (the Underlying Funds), such fund indirectly bears its proportional share of the expenses of the Underlying Funds in addition to the direct expenses incurred presented in the table. These fees and expenses are not included in the annualized expense ratio used to calculate the expense estimate in the table below.
Hypothetical Example for Comparison Purposes
The second line of the accompanying table provides information about hypothetical account values and hypothetical expenses based on the actual expense ratio and an assumed rate of return of 5% per year before expenses, which is not the actual return. The hypothetical account values and expenses may not be used to estimate the actual ending account balance or expenses you paid for the period. You may use this information to compare the ongoing costs of investing in the Fund and other funds. To do so, compare this 5% hypothetical example with the 5% hypothetical examples that appear in the shareholder reports of the other funds. If any fund is a shareholder of any Underlying Funds, such fund indirectly bears its proportional share of the expenses of the Underlying Funds in addition to the direct expenses as presented in the table. These fees and expenses are not included in the annualized expense ratio used to calculate the expense estimate in the table below.
Please note that the expenses shown in the table are meant to highlight your ongoing costs only and do not reflect any transaction costs. Therefore, the second line of the table is useful in comparing ongoing costs only, and will not help you determine the relative total costs of owning different funds. In addition, if these transactional costs were included, your costs would have been higher.
| | Annualized Expense Ratio-A | Beginning
Account Value
May 1, 2020 | Ending
Account Value
October 31, 2020 | Expenses Paid
During Period-B
May 1, 2020
to October 31, 2020 |
| Fidelity International Value Fund | | | | |
| Class A | 1.33% | | | |
| Actual | | $1,000.00 | $1,081.90 | $6.96 |
| Hypothetical-C | | $1,000.00 | $1,018.45 | $6.75 |
| Class M | 1.59% | | | |
| Actual | | $1,000.00 | $1,078.60 | $8.31 |
| Hypothetical-C | | $1,000.00 | $1,017.14 | $8.06 |
| Class C | 2.08% | | | |
| Actual | | $1,000.00 | $1,077.00 | $10.86 |
| Hypothetical-C | | $1,000.00 | $1,014.68 | $10.53 |
| International Value | .96% | | | |
| Actual | | $1,000.00 | $1,081.90 | $5.02 |
| Hypothetical-C | | $1,000.00 | $1,020.31 | $4.88 |
| Class I | .98% | | | |
| Actual | | $1,000.00 | $1,081.80 | $5.13 |
| Hypothetical-C | | $1,000.00 | $1,020.21 | $4.98 |
| Class Z | .84% | | | |
| Actual | | $1,000.00 | $1,083.60 | $4.40 |
| Hypothetical-C | | $1,000.00 | $1,020.91 | $4.27 |
A Annualized expense ratio reflects expenses net of applicable fee waivers.
B Expenses are equal to the annualized expense ratio, multiplied by the average account value over the period, multiplied by 184/ 366 (to reflect the one-half year period). The fees and expenses of any Underlying Funds are not included in each annualized expense ratio.
C 5% return per year before expenses
Distributions (Unaudited)
Class A designates 100%, Class M designates 100%, Class C designates 100%, International Value designates 98%, Class I designates 100%, and Class Z designates 94% of the dividends distributed during the fiscal year as amounts which may be taken into account as a dividend for purposes of the maximum rate under section 1(h)(11) of the Internal Revenue Code.
The amounts per share which represent income derived from sources within, and taxes paid to, foreign countries or possessions of the United States are as follows:
| | Pay Date | Income | Taxes |
| Class A | 12/09/2019 | $0.2831 | $0.0171 |
| Class M | 12/09/2019 | $0.2581 | $0.0171 |
| Class C | 12/09/2019 | $0.2131 | $0.0171 |
| International Value | 12/09/2019 | $0.3121 | $0.0171 |
| Class I | 12/09/2019 | $0.3061 | $0.0171 |
| Class Z | 12/09/2019 | $0.3241 | $0.0171 |
|
The fund will notify shareholders in January 2021 of amounts for use in preparing 2020 income tax returns.
Proxy Voting Results
A special meeting of shareholders was held on June 9, 2020. The results of votes taken among shareholders on the proposals before them are reported below. Each vote reported represents one dollar of net asset value held on the record date for the meeting.
PROPOSAL 1
To elect a Board of Trustees.
| | # of
Votes | % of
Votes |
| Dennis J. Dirks |
| Affirmative | 91,643,443,973.030 | 98.167 |
| Withheld | 1,711,119,384.419 | 1.833 |
| TOTAL | 93,354,563,357.449 | 100.000 |
| Donald F. Donahue |
| Affirmative | 91,659,003,496.045 | 98.184 |
| Withheld | 1,695,559,852.789 | 1.816 |
| TOTAL | 93,354,563,357.449 | 100.000 |
| Bettina Doulton |
| Affirmative | 91,774,146,516.145 | 98.307 |
| Withheld | 1,580,416,862.377 | 1.693 |
| TOTAL | 93,354,563,357.449 | 100.000 |
| Vicki L. Fuller |
| Affirmative | 91,845,419,368.993 | 98.383 |
| Withheld | 1,509,143,998.591 | 1.617 |
| TOTAL | 93,354,563,357.449 | 100.00 |
| Patricia L. Kampling |
| Affirmative | 91,723,732,274.457 | 98.253 |
| Withheld | 1,630,831,098.411 | 1.747 |
| TOTAL | 93,354,563,357.449 | 100.000 |
| Alan J. Lacy |
| Affirmative | 91,490,319,407.772 | 98.003 |
| Withheld | 1,864,243,948.299 | 1.997 |
| TOTAL | 93,354,563,357.449 | 100.000 |
| Ned C. Lautenbach |
| Affirmative | 91,285,367,239.075 | 97.784 |
| Withheld | 2,069,196,119.052 | 2.216 |
| TOTAL | 93,354,563,357.449 | 100.000 |
| Robert A. Lawrence |
| Affirmative | 91,556,271,429.466 | 98.074 |
| Withheld | 1,798,291,912.707 | 1.926 |
| TOTAL | 93,354,563,357.449 | 100.000 |
| Joseph Mauriello |
| Affirmative | 91,497,480,147.082 | 98.011 |
| Withheld | 1,857,083,211.045 | 1.989 |
| TOTAL | 93,354,563,357.449 | 100.000 |
| Cornelia M. Small |
| Affirmative | 91,606,808,161.438 | 98.128 |
| Withheld | 1,747,755,220.497 | 1.872 |
| TOTAL | 93,354,563,357.449 | 100.000 |
| Garnett A. Smith |
| Affirmative | 91,505,784,053.038 | 98.020 |
| Withheld | 1,848,779,305.090 | 1.980 |
| TOTAL | 93,354,563,357.449 | 100.000 |
| David M. Thomas |
| Affirmative | 91,536,969,704.881 | 98.053 |
| Withheld | 1,817,593,630.919 | 1.947 |
| TOTAL | 93,354,563,357.449 | 100.000 |
| Susan Tomasky |
| Affirmative | 91,697,125,678.165 | 98.225 |
| Withheld | 1,657,437,703.277 | 1.775 |
| TOTAL | 93,354,563,357.449 | 100.000 |
| Michael E. Wiley |
| Affirmative | 91,506,805,575.815 | 98.021 |
| Withheld | 1,847,757,759.985 | 1.979 |
| TOTAL | 93,354,563,357.449 | 100.000 |
PROPOSAL 2
To convert a fundamental investment policy to a non-fundamental investment policy.
| | # of
Votes | % of
Votes |
| Affirmative | 231,961,836.383 | 72.806 |
| Against | 57,045,175.247 | 17.905 |
| Abstain | 25,283,001.278 | 7.936 |
| Broker Non-Vote | 4,314,654.220 | 1.354 |
| TOTAL | 318,604,667.128 | 100.000 |
|
| Proposal 1 reflects trust wide proposal and voting results. |
FIV-ANN-1220
1.827482.114
Fidelity® International Discovery Fund
Annual Report
October 31, 2020
Includes Fidelity and Fidelity Advisor share classes
See the inside front cover for important information about access to your fund’s shareholder reports.
Beginning on January 1, 2021, as permitted by regulations adopted by the Securities and Exchange Commission, paper copies of a fund’s shareholder reports will no longer be sent by mail, unless you specifically request paper copies of the reports from the fund or from your financial intermediary, such as a financial advisor, broker-dealer or bank. Instead, the reports will be made available on a website, and you will be notified by mail each time a report is posted and provided with a website link to access the report.
If you already elected to receive shareholder reports electronically, you will not be affected by this change and you need not take any action. You may elect to receive shareholder reports and other communications from a fund electronically, by contacting your financial intermediary. For Fidelity customers, visit Fidelity's web site or call Fidelity using the contact information listed below.
You may elect to receive all future reports in paper free of charge. If you wish to continue receiving paper copies of your shareholder reports, you may contact your financial intermediary or, if you are a Fidelity customer, visit Fidelity’s website, or call Fidelity at the applicable toll-free number listed below. Your election to receive reports in paper will apply to all funds held with the fund complex/your financial intermediary.
| Account Type | Website | Phone Number |
| Brokerage, Mutual Fund, or Annuity Contracts: | fidelity.com/mailpreferences | 1-800-343-3548 |
| Employer Provided Retirement Accounts: | netbenefits.fidelity.com/preferences (choose 'no' under Required Disclosures to continue to print) | 1-800-343-0860 |
| Advisor Sold Accounts Serviced Through Your Financial Intermediary: | Contact Your Financial Intermediary | Your Financial Intermediary's phone number |
| Advisor Sold Accounts Serviced by Fidelity: | institutional.fidelity.com | 1-877-208-0098 |
Contents
To view a fund's proxy voting guidelines and proxy voting record for the 12-month period ended June 30, visit http://www.fidelity.com/proxyvotingresults or visit the Securities and Exchange Commission's (SEC) web site at http://www.sec.gov.
You may also call 1-800-544-8544 if you’re an individual investing directly with Fidelity, call 1-800-835-5092 if you’re a plan sponsor or participant with Fidelity as your recordkeeper or call 1-877-208-0098 on institutional accounts or if you’re an advisor or invest through one to request a free copy of the proxy voting guidelines.
Standard & Poor's, S&P and S&P 500 are registered service marks of The McGraw-Hill Companies, Inc. and have been licensed for use by Fidelity Distributors Corporation.
Other third-party marks appearing herein are the property of their respective owners.
All other marks appearing herein are registered or unregistered trademarks or service marks of FMR LLC or an affiliated company. © 2020 FMR LLC. All rights reserved.
This report and the financial statements contained herein are submitted for the general information of the shareholders of the Fund. This report is not authorized for distribution to prospective investors in the Fund unless preceded or accompanied by an effective prospectus.
A fund files its complete schedule of portfolio holdings with the SEC for the first and third quarters of each fiscal year on Form N-PORT. Forms N-PORT are available on the SEC’s web site at http://www.sec.gov. A fund's Forms N-PORT may be reviewed and copied at the SEC’s Public Reference Room in Washington, DC. Information regarding the operation of the SEC's Public Reference Room may be obtained by calling 1-800-SEC-0330.
For a complete list of a fund's portfolio holdings, view the most recent holdings listing, semiannual report, or annual report on Fidelity's web site at http://www.fidelity.com, http://www.institutional.fidelity.com, or http://www.401k.com, as applicable.
NOT FDIC INSURED •MAY LOSE VALUE •NO BANK GUARANTEE
Neither the Fund nor Fidelity Distributors Corporation is a bank.
Note to Shareholders:
Early in 2020, the outbreak and spread of a new coronavirus emerged as a public health emergency that had a major influence on financial markets, primarily based on its impact on the global economy and the outlook for corporate earnings. The virus causes a respiratory disease known as COVID-19. On March 11, the World Health Organization declared the COVID-19 outbreak a pandemic, citing sustained risk of further global spread.
In the weeks following, as the crisis worsened, we witnessed an escalating human tragedy with wide-scale social and economic consequences from coronavirus-containment measures. The outbreak of COVID-19 prompted a number of measures to limit the spread, including travel and border restrictions, quarantines, and restrictions on large gatherings. In turn, these resulted in lower consumer activity, diminished demand for a wide range of products and services, disruption in manufacturing and supply chains, and – given the wide variability in outcomes regarding the outbreak – significant market uncertainty and volatility. Amid the turmoil, global governments and central banks took unprecedented action to help support consumers, businesses, and the broader economies, and to limit disruption to financial systems.
The situation continues to unfold, and the extent and duration of its impact on financial markets and the economy remain highly uncertain. Extreme events such as the coronavirus crisis are “exogenous shocks” that can have significant adverse effects on mutual funds and their investments. Although multiple asset classes may be affected by market disruption, the duration and impact may not be the same for all types of assets.
Fidelity is committed to helping you stay informed amid news about COVID-19 and during increased market volatility, and we’re taking extra steps to be responsive to customer needs. We encourage you to visit our websites, where we offer ongoing updates, commentary, and analysis on the markets and our funds.
Performance: The Bottom Line
Average annual total return reflects the change in the value of an investment, assuming reinvestment of distributions from dividend income and capital gains (the profits earned upon the sale of securities that have grown in value, if any) and assuming a constant rate of performance each year. The hypothetical investment and the average annual total returns do not reflect the deduction of taxes that a shareholder would pay on fund distributions or the redemption of fund shares. During periods of reimbursement by Fidelity, a fund’s total return will be greater than it would be had the reimbursement not occurred. How a fund did yesterday is no guarantee of how it will do tomorrow.
Average Annual Total Returns
| For the periods ended October 31, 2020 | Past 1 year | Past 5 years | Past 10 years |
| Class A (incl. 5.75% sales charge) | 1.81% | 4.17% | 4.93% |
| Class M (incl. 3.50% sales charge) | 4.00% | 4.41% | 4.92% |
| Class C (incl. contingent deferred sales charge) | 6.19% | 4.60% | 4.75% |
| Fidelity® International Discovery Fund | 8.39% | 5.78% | 5.91% |
| Class K | 8.52% | 5.90% | 6.06% |
| Class I | 8.37% | 5.76% | 5.91% |
| Class Z | 8.53% | 5.91% | 6.01% |
Class C shares' contingent deferred sales charges included in the past one year, past five years and past ten years total return figures are 1%, 0% and 0%, respectively.
The initial offering of Class Z shares took place on August 13, 2013. Returns prior to August 13, 2013, are those of Class I.
$10,000 Over 10 Years
Let's say hypothetically that $10,000 was invested in Fidelity® International Discovery Fund, a class of the fund, on October 31, 2010.
The chart shows how the value of your investment would have changed, and also shows how the MSCI EAFE Index performed over the same period.
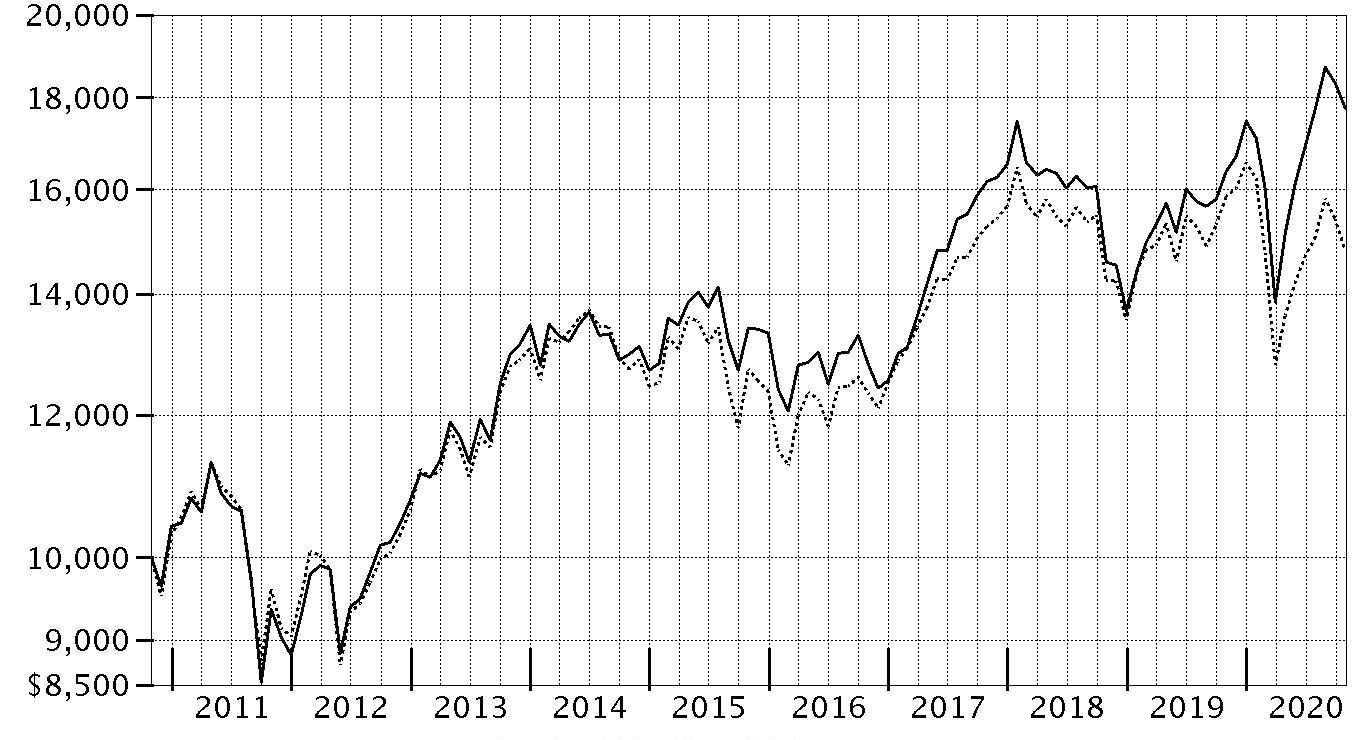
| Period Ending Values |
| $17,763 | Fidelity® International Discovery Fund |
| $14,800 | MSCI EAFE Index |
Management's Discussion of Fund Performance
Market Recap: The MSCI ACWI (All Country World Index) ex USA Index returned -2.46% for the 12 months ending October 31, 2020, in what was a bumpy ride for non-U.S. equities, marked by a steep but brief decline due to the early-2020 outbreak and spread of the coronavirus, followed by a sharp upturn. Declared a pandemic on March 11, the crisis and containment efforts caused broad contraction in economic activity, elevated volatility and dislocation in financial markets. A historically rapid and expansive monetary- and fiscal-policy response around the world provided a partial offset to the economic disruption. Other supporting factors included resilient corporate earnings and near-term potential for a COVID-19 vaccine breakthrough. This was evident in the index’s 12.28% gain in the final six months of the year. Currency fluctuation generally boosted foreign developed-markets equities for the year, while the reverse was true for emerging-markets stocks. Late in the period, the index was pressured by a second wave of COVID-19 cases in some regions, and stretched valuations and crowded positioning in big tech. For the full year, the U.K. (-22%), Asia Pacific ex Japan (-8%), Canada (-5%) and Europe ex U.K. (-4%) notably lagged. Emerging markets (+9%) and Japan (+1%) outperformed. By sector, energy (-38%), financials and real estate (-20% each) lagged, whereas information technology (+ 25%) and communication services (+15%) topped the index.
Comments from Portfolio Manager William Kennedy: For the fiscal year ending October 31, 2020, the fund's share classes (excluding sales charges, if applicable) gained roughly 7% to 9%, outperforming the -6.69% result of the benchmark MSCI EAFE Index. From a geographic standpoint, stock picks in Europe ex U.K., China and Japan contributed most to the fund's relative result. By sector, the primary contributors versus the benchmark were positioning in information technology as well as stock selection in communication services, health care, industrials and consumer discretionary. Our top individual relative contributor was an out-of-benchmark stake in China-based media company Tencent Holdings (+87%), a top-10 holding on October 31. Another key relative contributor was U.K.-listed integrated oil and gas company Royal Dutch Shell (-55%), a benchmark component that we avoided. Also adding value was our outsized stake in Japan-based semiconductor equipment company Lasertec (+110%), which was not held at period end. Conversely, an underweighting in materials and stock picks in Canada nicked relative performance. The fund's largest individual relative detractors were U.K.-based integrated oil and gas company BP (-53%), which we eliminated from the portfolio before period end, and a non-benchmark stake in Canada-based oil sands company Suncor Energy (-61%).
The views expressed above reflect those of the portfolio manager(s) only through the end of the period as stated on the cover of this report and do not necessarily represent the views of Fidelity or any other person in the Fidelity organization. Any such views are subject to change at any time based upon market or other conditions and Fidelity disclaims any responsibility to update such views. These views may not be relied on as investment advice and, because investment decisions for a Fidelity fund are based on numerous factors, may not be relied on as an indication of trading intent on behalf of any Fidelity fund.
Investment Summary (Unaudited)
Geographic Diversification (% of fund's net assets)
| As of October 31, 2020 |
| | Japan | 15.6% |
| | Switzerland | 11.3% |
| | United Kingdom | 11.2% |
| | Germany | 9.9% |
| | France | 6.3% |
| | Cayman Islands | 5.3% |
| | Sweden | 4.7% |
| | India | 4.2% |
| | Netherlands | 3.5% |
| | Other* | 28.0% |

* Includes Short-Term investments and Net Other Assets (Liabilities).
Percentages are based on country or territory of incorporation and are adjusted for the effect of futures contracts, if applicable.
Asset Allocation as of October 31, 2020
| | % of fund's net assets |
| Stocks | 98.1 |
| Short-Term Investments and Net Other Assets (Liabilities) | 1.9 |
Top Ten Stocks as of October 31, 2020
| | % of fund's net assets |
| Nestle SA (Reg. S) (Switzerland, Food Products) | 3.7 |
| Roche Holding AG (participation certificate) (Switzerland, Pharmaceuticals) | 2.8 |
| AstraZeneca PLC (United Kingdom) (United Kingdom, Pharmaceuticals) | 1.9 |
| Tencent Holdings Ltd. (Cayman Islands, Interactive Media & Services) | 1.8 |
| ASML Holding NV (Netherlands) (Netherlands, Semiconductors & Semiconductor Equipment) | 1.7 |
| AIA Group Ltd. (Hong Kong, Insurance) | 1.5 |
| Hoya Corp. (Japan, Health Care Equipment & Supplies) | 1.4 |
| Housing Development Finance Corp. Ltd. (India, Thrifts & Mortgage Finance) | 1.3 |
| Keyence Corp. (Japan, Electronic Equipment & Components) | 1.3 |
| Siemens AG (Germany, Industrial Conglomerates) | 1.3 |
| | 18.7 |
Top Market Sectors as of October 31, 2020
| | % of fund's net assets |
| Financials | 16.2 |
| Industrials | 15.6 |
| Health Care | 15.4 |
| Information Technology | 13.0 |
| Consumer Discretionary | 12.1 |
| Consumer Staples | 8.2 |
| Communication Services | 8.3 |
| Materials | 3.5 |
| Real Estate | 3.2 |
| Energy | 1.3 |
Schedule of Investments October 31, 2020
Showing Percentage of Net Assets
| Common Stocks - 97.2% | | | |
| | | Shares | Value (000s) |
| Australia - 1.2% | | | |
| Bapcor Ltd. | | 8,510,879 | $45,872 |
| Inghams Group Ltd. | | 9,556,432 | 19,229 |
| National Storage (REIT) unit | | 35,189,900 | 44,661 |
| Rio Tinto Ltd. | | 4,347 | 283 |
|
| TOTAL AUSTRALIA | | | 110,045 |
|
| Austria - 0.8% | | | |
| Erste Group Bank AG | | 1,630,534 | 33,384 |
| Wienerberger AG | | 1,489,364 | 37,571 |
|
| TOTAL AUSTRIA | | | 70,955 |
|
| Bailiwick of Jersey - 0.7% | | | |
| Experian PLC | | 1,609,811 | 58,974 |
| Belgium - 1.4% | | | |
| KBC Groep NV | | 1,569,880 | 77,395 |
| UCB SA | | 500,940 | 49,416 |
|
| TOTAL BELGIUM | | | 126,811 |
|
| Canada - 1.4% | | | |
| Alimentation Couche-Tard, Inc. Class B (sub. vtg.) | | 1,153,047 | 35,510 |
| Constellation Software, Inc. | | 67,347 | 70,698 |
| Suncor Energy, Inc. | | 1,569,323 | 17,704 |
|
| TOTAL CANADA | | | 123,912 |
|
| Cayman Islands - 5.3% | | | |
| Akeso, Inc. (a) | | 6,263,000 | 19,631 |
| Alibaba Group Holding Ltd.(b) | | 2,561,950 | 97,082 |
| Bilibili, Inc. ADR (b) | | 463,695 | 20,713 |
| Hansoh Pharmaceutical Group Co. Ltd. (a)(b) | | 7,635,513 | 34,029 |
| JD.com, Inc. Class A | | 1,143,879 | 46,657 |
| Kangji Medical Holdings Ltd. | | 4,036,000 | 10,436 |
| New Oriental Education & Technology Group, Inc. sponsored ADR (b) | | 225,614 | 36,184 |
| Sino Biopharmaceutical Ltd. | | 16,639,982 | 16,785 |
| Tencent Holdings Ltd. | | 2,109,441 | 161,173 |
| Zai Lab Ltd. (b) | | 347,903 | 28,945 |
|
| TOTAL CAYMAN ISLANDS | | | 471,635 |
|
| China - 1.1% | | | |
| AVIC Jonhon OptronicTechnology Co. Ltd. | | 4,283,720 | 35,541 |
| Kweichow Moutai Co. Ltd. (A Shares) | | 101,000 | 25,263 |
| Venus MedTech Hangzhou, Inc. (H Shares) (a)(b) | | 612,227 | 5,887 |
| WuXi AppTec Co. Ltd. (H Shares) (a) | | 1,848,765 | 29,451 |
|
| TOTAL CHINA | | | 96,142 |
|
| Denmark - 2.8% | | | |
| DSV Panalpina A/S | | 388,664 | 62,933 |
| Netcompany Group A/S (a)(b) | | 260,555 | 21,645 |
| ORSTED A/S (a) | | 540,217 | 85,740 |
| Vestas Wind Systems A/S | | 462,618 | 79,369 |
|
| TOTAL DENMARK | | | 249,687 |
|
| Finland - 0.2% | | | |
| Musti Group OYJ | | 579,468 | 13,275 |
| France - 6.3% | | | |
| AXA SA | | 3,601,210 | 57,833 |
| BNP Paribas SA (b) | | 1,383,637 | 48,254 |
| Capgemini SA | | 637,049 | 73,556 |
| LVMH Moet Hennessy Louis Vuitton SE | | 240,269 | 112,626 |
| Sanofi SA | | 1,203,498 | 108,668 |
| SR Teleperformance SA | | 231,301 | 69,420 |
| VINCI SA | | 786,437 | 62,117 |
| Worldline SA (a)(b) | | 375,985 | 27,867 |
|
| TOTAL FRANCE | | | 560,341 |
|
| Germany - 9.2% | | | |
| adidas AG | | 248,585 | 73,826 |
| Akasol AG (a)(b)(c) | | 261,278 | 14,164 |
| Allianz SE | | 581,804 | 102,358 |
| Deutsche Borse AG | | 145,987 | 21,483 |
| Deutsche Post AG | | 2,504,972 | 110,978 |
| Exasol AG | | 813,522 | 15,538 |
| Instone Real Estate Group BV (a)(b) | | 1,244,735 | 25,746 |
| Linde PLC | | 231,853 | 50,819 |
| Nexus AG | | 585,627 | 32,602 |
| Rheinmetall AG | | 282,351 | 20,618 |
| RWE AG | | 674,248 | 24,964 |
| SAP SE | | 885,739 | 94,495 |
| Shop Apotheke Europe NV (a)(b)(c) | | 221,626 | 36,756 |
| Siemens AG | | 982,105 | 115,182 |
| Vonovia SE | | 1,205,102 | 76,941 |
|
| TOTAL GERMANY | | | 816,470 |
|
| Hong Kong - 2.2% | | | |
| AIA Group Ltd. | | 13,901,592 | 132,304 |
| Techtronic Industries Co. Ltd. | | 4,658,880 | 62,138 |
|
| TOTAL HONG KONG | | | 194,442 |
|
| Hungary - 0.7% | | | |
| OTP Bank PLC (b) | | 1,259,340 | 39,222 |
| Richter Gedeon PLC | | 916,901 | 18,703 |
|
| TOTAL HUNGARY | | | 57,925 |
|
| India - 4.2% | | | |
| Avenue Supermarts Ltd. (a)(b) | | 505,358 | 15,188 |
| HDFC Bank Ltd. | | 3,117,382 | 49,489 |
| HDFC Bank Ltd. sponsored ADR (b) | | 1,654,219 | 95,018 |
| Housing Development Finance Corp. Ltd. | | 4,521,515 | 116,607 |
| Reliance Industries Ltd. | | 118,680 | 1,880 |
| Reliance Industries Ltd. | | 1,780,200 | 49,063 |
| Reliance Industries Ltd. sponsored GDR (a) | | 426,802 | 23,431 |
| Sunteck Realty Ltd. | | 2,762,804 | 9,921 |
| TCNS Clothing Co. Ltd. (a)(b) | | 2,099,691 | 10,494 |
|
| TOTAL INDIA | | | 371,091 |
|
| Indonesia - 0.4% | | | |
| PT Bank Central Asia Tbk | | 8,823,469 | 17,362 |
| PT Bank Rakyat Indonesia Tbk | | 61,391,395 | 13,897 |
|
| TOTAL INDONESIA | | | 31,259 |
|
| Ireland - 1.7% | | | |
| Cairn Homes PLC | | 25,836,907 | 23,621 |
| CRH PLC | | 1,843,684 | 64,514 |
| Dalata Hotel Group PLC | | 6,623,824 | 18,669 |
| DCC PLC (United Kingdom) | | 88,137 | 5,736 |
| Kerry Group PLC Class A | | 292,422 | 34,976 |
|
| TOTAL IRELAND | | | 147,516 |
|
| Israel - 0.1% | | | |
| Maytronics Ltd. | | 355,919 | 5,467 |
| Italy - 0.8% | | | |
| GVS SpA (a) | | 644,646 | 9,085 |
| Recordati SpA | | 791,407 | 41,007 |
| Reply SpA | | 223,544 | 24,030 |
|
| TOTAL ITALY | | | 74,122 |
|
| Japan - 15.6% | | | |
| Astellas Pharma, Inc. | | 3,254,517 | 44,629 |
| Daiichi Sankyo Kabushiki Kaisha | | 2,519,688 | 66,504 |
| FANUC Corp. | | 480,260 | 101,443 |
| GMO Payment Gateway, Inc. | | 225,611 | 27,644 |
| Hoya Corp. | | 1,133,282 | 127,899 |
| IT Holdings Corp. | | 1,103,506 | 21,105 |
| Kao Corp. | | 483,959 | 34,457 |
| Kenedix, Inc. | | 4,638,185 | 24,035 |
| Keyence Corp. | | 254,951 | 115,702 |
| Lifenet Insurance Co. (b) | | 1,186,859 | 17,478 |
| Minebea Mitsumi, Inc. | | 3,271,380 | 59,086 |
| Misumi Group, Inc. | | 1,010,927 | 30,024 |
| Mitsubishi UFJ Financial Group, Inc. | | 6,157,849 | 24,274 |
| Nintendo Co. Ltd. | | 125,514 | 67,864 |
| Oracle Corp. Japan | | 397,073 | 39,684 |
| ORIX Corp. | | 6,674,598 | 78,061 |
| Persol Holdings Co., Ltd. | | 1,536,697 | 23,275 |
| Recruit Holdings Co. Ltd. | | 1,241,230 | 47,230 |
| Relo Group, Inc. | | 2,587,748 | 62,103 |
| Shiseido Co. Ltd. | | 347,252 | 21,497 |
| SMC Corp. | | 76,535 | 40,709 |
| SoftBank Group Corp. | | 994,174 | 64,754 |
| Sony Corp. | | 1,307,374 | 108,991 |
| THK Co. Ltd. | | 995,562 | 26,427 |
| Z Holdings Corp. | | 9,436,083 | 65,798 |
| Zozo, Inc. | | 1,460,861 | 37,059 |
|
| TOTAL JAPAN | | | 1,377,732 |
|
| Korea (South) - 1.0% | | | |
| Samsung Electronics Co. Ltd. | | 1,766,530 | 88,601 |
| Luxembourg - 1.0% | | | |
| B&M European Value Retail SA | | 3,429,500 | 21,539 |
| Eurofins Scientific SA (b) | | 84,503 | 67,297 |
|
| TOTAL LUXEMBOURG | | | 88,836 |
|
| Malta - 0.2% | | | |
| Kambi Group PLC (b) | | 612,925 | 19,906 |
| Netherlands - 3.5% | | | |
| Airbus Group NV | | 497,986 | 36,436 |
| ASML Holding NV (Netherlands) | | 402,739 | 145,712 |
| IMCD NV | | 149,320 | 17,297 |
| JDE Peet's BV | | 599,919 | 21,380 |
| NXP Semiconductors NV | | 512,713 | 69,278 |
| RHI Magnesita NV | | 448,001 | 14,858 |
|
| TOTAL NETHERLANDS | | | 304,961 |
|
| New Zealand - 1.1% | | | |
| EBOS Group Ltd. | | 2,652,691 | 45,153 |
| Ryman Healthcare Group Ltd. | | 5,990,235 | 55,434 |
|
| TOTAL NEW ZEALAND | | | 100,587 |
|
| Norway - 1.4% | | | |
| Adevinta ASA Class B (b) | | 1,962,980 | 30,329 |
| Equinor ASA | | 2,368,839 | 30,086 |
| Schibsted ASA (A Shares) | | 1,482,575 | 60,442 |
|
| TOTAL NORWAY | | | 120,857 |
|
| Poland - 0.6% | | | |
| Allegro.eu SA (a)(b) | | 1,089,400 | 22,140 |
| CD Projekt RED SA (b) | | 366,800 | 31,078 |
|
| TOTAL POLAND | | | 53,218 |
|
| South Africa - 0.5% | | | |
| Naspers Ltd. Class N | | 215,448 | 42,061 |
| Spain - 1.9% | | | |
| Amadeus IT Holding SA Class A | | 742,885 | 35,465 |
| Cellnex Telecom SA (a) | | 1,653,199 | 106,128 |
| Euskaltel, S.A. (a) | | 2,762,981 | 26,290 |
|
| TOTAL SPAIN | | | 167,883 |
|
| Sweden - 4.7% | | | |
| ASSA ABLOY AB (B Shares) | | 1,891,307 | 40,535 |
| EQT AB | | 1,149,121 | 21,895 |
| Ericsson (B Shares) | | 8,487,261 | 94,756 |
| Indutrade AB (b) | | 1,680,095 | 85,228 |
| Nibe Industrier AB (B Shares) | | 903,956 | 21,800 |
| Readly International AB (c) | | 1,555,735 | 9,791 |
| Securitas AB (B Shares) | | 3,336,742 | 47,229 |
| Stillfront Group AB (b) | | 469,595 | 55,095 |
| Svenska Handelsbanken AB (A Shares) (b) | | 4,555,350 | 36,911 |
|
| TOTAL SWEDEN | | | 413,240 |
|
| Switzerland - 11.3% | | | |
| Dufry AG (b) | | 175,300 | 6,634 |
| Lonza Group AG | | 150,382 | 91,118 |
| Nestle SA (Reg. S) | | 2,873,852 | 323,245 |
| Partners Group Holding AG | | 80,616 | 72,673 |
| Roche Holding AG (participation certificate) | | 758,027 | 243,578 |
| Schindler Holding AG (participation certificate) | | 146,797 | 37,542 |
| Siemens Energy AG (b) | | 491,672 | 10,765 |
| Sika AG | | 367,807 | 90,533 |
| Swiss Re Ltd. | | 1,156,131 | 82,888 |
| Zur Rose Group AG (b) | | 147,065 | 40,978 |
|
| TOTAL SWITZERLAND | | | 999,954 |
|
| Taiwan - 1.0% | | | |
| MediaTek, Inc. | | 1,546,000 | 36,638 |
| Taiwan Semiconductor Manufacturing Co. Ltd. | | 3,695,000 | 55,893 |
|
| TOTAL TAIWAN | | | 92,531 |
|
| Thailand - 0.2% | | | |
| Thai Beverage PCL | | 49,829,304 | 21,191 |
| United Kingdom - 11.2% | | | |
| Anglo American PLC (United Kingdom) | | 2,135,031 | 50,097 |
| AstraZeneca PLC (United Kingdom) | | 1,622,816 | 162,940 |
| Beazley PLC | | 6,789,996 | 25,862 |
| Big Yellow Group PLC | | 2,442,306 | 34,804 |
| Compass Group PLC | | 2,415,456 | 33,062 |
| Cranswick PLC | | 504,619 | 21,037 |
| Dechra Pharmaceuticals PLC | | 998,193 | 45,157 |
| Diageo PLC | | 1,722,389 | 55,664 |
| HomeServe PLC | | 2,726,541 | 39,031 |
| John David Group PLC | | 5,541,736 | 53,213 |
| JTC PLC (a) | | 4,466,595 | 31,131 |
| Lloyds Banking Group PLC | | 68,884,040 | 25,081 |
| London Stock Exchange Group PLC | | 873,302 | 94,140 |
| M&G PLC | | 33,338,237 | 63,338 |
| Ocado Group PLC (b) | | 1,617,052 | 47,680 |
| Prudential PLC | | 5,724,257 | 70,011 |
| Reckitt Benckiser Group PLC | | 649,356 | 57,201 |
| Rotork PLC | | 5,420,290 | 19,732 |
| THG Holdings Ltd. | | 1,914,482 | 16,359 |
| Vistry Group PLC | | 1,740,033 | 12,285 |
| Zegona Communications PLC (d) | | 18,826,397 | 27,072 |
|
| TOTAL UNITED KINGDOM | | | 984,897 |
|
| United States of America - 1.5% | | | |
| MasterCard, Inc. Class A | | 94,774 | 27,356 |
| MercadoLibre, Inc. (b) | | 62,564 | 75,956 |
| Visa, Inc. Class A | | 148,644 | 27,010 |
|
| TOTAL UNITED STATES OF AMERICA | | | 130,322 |
|
| TOTAL COMMON STOCKS | | | |
| (Cost $6,682,643) | | | 8,586,846 |
|
| Preferred Stocks - 0.9% | | | |
| Convertible Preferred Stocks - 0.2% | | | |
| Hong Kong - 0.2% | | | |
| Antengene Corp. Series C1 (e)(f) | | 5,188,762 | 14,663 |
| Nonconvertible Preferred Stocks - 0.7% | | | |
| Germany - 0.7% | | | |
| Volkswagen AG | | 455,142 | 66,313 |
| TOTAL PREFERRED STOCKS | | | |
| (Cost $95,548) | | | 80,976 |
|
| Money Market Funds - 1.8% | | | |
| Fidelity Cash Central Fund 0.10% (g) | | 141,830,373 | 141,859 |
| Fidelity Securities Lending Cash Central Fund 0.11% (g)(h) | | 11,909,801 | 11,911 |
| TOTAL MONEY MARKET FUNDS | | | |
| (Cost $153,770) | | | 153,770 |
| TOTAL INVESTMENT IN SECURITIES - 99.9% | | | |
| (Cost $6,931,961) | | | 8,821,592 |
| NET OTHER ASSETS (LIABILITIES) - 0.1% | | | 10,397 |
| NET ASSETS - 100% | | | $8,831,989 |
Categorizations in the Schedule of Investments are based on country or territory of incorporation.
Legend
(a) Security exempt from registration under Rule 144A of the Securities Act of 1933. These securities may be resold in transactions exempt from registration, normally to qualified institutional buyers. At the end of the period, the value of these securities amounted to $544,803,000 or 6.2% of net assets.
(b) Non-income producing
(c) Security or a portion of the security is on loan at period end.
(d) Affiliated company
(e) Restricted securities (including private placements) - Investment in securities not registered under the Securities Act of 1933 (excluding 144A issues). At the end of the period, the value of restricted securities (excluding 144A issues) amounted to $14,663,000 or 0.2% of net assets.
(f) Level 3 security
(g) Affiliated fund that is generally available only to investment companies and other accounts managed by Fidelity Investments. The rate quoted is the annualized seven-day yield of the fund at period end. A complete unaudited listing of the fund's holdings as of its most recent quarter end is available upon request. In addition, each Fidelity Central Fund's financial statements, which are not covered by the Fund's Report of Independent Registered Public Accounting Firm, are available on the SEC's website or upon request.
(h) Investment made with cash collateral received from securities on loan.
Additional information on each restricted holding is as follows:
| Security | Acquisition Date | Acquisition Cost (000s) |
| Antengene Corp. Series C1 | 7/11/20 | $14,663 |
Affiliated Central Funds
Information regarding fiscal year to date income earned by the Fund from investments in Fidelity Central Funds is as follows:
| Fund | Income earned |
| | (Amounts in thousands) |
| Fidelity Cash Central Fund | $1,343 |
| Fidelity Securities Lending Cash Central Fund | 1,061 |
| Total | $2,404 |
Amounts in the income column in the above table include any capital gain distributions from underlying funds, which are presented in the corresponding line-item in the Statement of Operations, if applicable. Amount for Fidelity Securities Lending Cash Central Fund represents the income earned on investing cash collateral, less rebates paid to borrowers and any lending agent fees associated with the loan, plus any premium payments received for lending certain types of securities.
Other Affiliated Issuers
An affiliated company is a company in which the Fund has ownership of at least 5% of the voting securities. Fiscal year to date transactions with companies which are or were affiliates are as follows:
| Affiliate (Amounts in thousands) | Value, beginning of period | Purchases | Sales Proceeds(a) | Dividend Income | Realized Gain (loss) | Change in Unrealized appreciation (depreciation) | Value, end of period |
| Zegona Communications PLC | $-- | $25,193 | $101 | $1,105 | $6 | $1,974 | $27,072 |
| Total | $-- | $25,193 | $101 | $1,105 | $6 | $1,974 | $27,072 |
(a) Includes the value of securities delivered through in-kind transactions, if applicable.
Investment Valuation
The following is a summary of the inputs used, as of October 31, 2020, involving the Fund's assets and liabilities carried at fair value. The inputs or methodology used for valuing securities may not be an indication of the risk associated with investing in those securities. For more information on valuation inputs, and their aggregation into the levels used below, please refer to the Investment Valuation section in the accompanying Notes to Financial Statements.
| | Valuation Inputs at Reporting Date: |
| Description | Total | Level 1 | Level 2 | Level 3 |
| (Amounts in thousands) | | | | |
| Investments in Securities: | | | | |
| Equities: | | | | |
| Communication Services | $726,527 | $366,938 | $359,589 | $-- |
| Consumer Discretionary | 1,083,727 | 549,823 | 533,904 | -- |
| Consumer Staples | 726,816 | 153,881 | 572,935 | -- |
| Energy | 122,164 | 71,221 | 50,943 | -- |
| Financials | 1,417,218 | 635,516 | 781,702 | -- |
| Health Care | 1,369,017 | 397,995 | 956,359 | 14,663 |
| Industrials | 1,376,549 | 770,924 | 605,625 | -- |
| Information Technology | 1,148,214 | 429,081 | 719,133 | -- |
| Materials | 308,675 | 243,878 | 64,797 | -- |
| Real Estate | 278,211 | 137,491 | 140,720 | -- |
| Utilities | 110,704 | 110,704 | -- | -- |
| Money Market Funds | 153,770 | 153,770 | -- | -- |
| Total Investments in Securities: | $8,821,592 | $4,021,222 | $4,785,707 | $14,663 |
See accompanying notes which are an integral part of the financial statements.
Financial Statements
Statement of Assets and Liabilities
| Amounts in thousands (except per-share amounts) | | October 31, 2020 |
| Assets | | |
Investment in securities, at value (including securities loaned of $10,832) — See accompanying schedule:
Unaffiliated issuers (cost $6,753,093) | $8,640,750 | |
| Fidelity Central Funds (cost $153,770) | 153,770 | |
| Other affiliated issuers (cost $25,098) | 27,072 | |
| Total Investment in Securities (cost $6,931,961) | | $8,821,592 |
| Foreign currency held at value (cost $755) | | 755 |
| Receivable for investments sold | | 3,467 |
| Receivable for fund shares sold | | 3,736 |
| Dividends receivable | | 25,450 |
| Distributions receivable from Fidelity Central Funds | | 69 |
| Prepaid expenses | | 16 |
| Other receivables | | 3,909 |
| Total assets | | 8,858,994 |
| Liabilities | | |
| Payable for investments purchased | $2,890 | |
| Payable for fund shares redeemed | 3,433 | |
| Accrued management fee | 6,641 | |
| Distribution and service plan fees payable | 57 | |
| Other affiliated payables | 1,156 | |
| Other payables and accrued expenses | 925 | |
| Collateral on securities loaned | 11,903 | |
| Total liabilities | | 27,005 |
| Net Assets | | $8,831,989 |
| Net Assets consist of: | | |
| Paid in capital | | $6,577,604 |
| Total accumulated earnings (loss) | | 2,254,385 |
| Net Assets | | $8,831,989 |
| Net Asset Value and Maximum Offering Price | | |
| Class A: | | |
| Net Asset Value and redemption price per share ($172,784 ÷ 3,768.92 shares)(a) | | $45.84 |
| Maximum offering price per share (100/94.25 of $45.84) | | $48.64 |
| Class M: | | |
| Net Asset Value and redemption price per share ($21,333 ÷ 468.52 shares)(a) | | $45.53 |
| Maximum offering price per share (100/96.50 of $45.53) | | $47.18 |
| Class C: | | |
| Net Asset Value and offering price per share ($10,714 ÷ 237.12 shares)(a) | | $45.18 |
| International Discovery: | | |
| Net Asset Value, offering price and redemption price per share ($6,784,273 ÷ 146,848.37 shares) | | $46.20 |
| Class K: | | |
| Net Asset Value, offering price and redemption price per share ($1,400,517 ÷ 30,379.69 shares) | | $46.10 |
| Class I: | | |
| Net Asset Value, offering price and redemption price per share ($388,405 ÷ 8,428.48 shares) | | $46.08 |
| Class Z: | | |
| Net Asset Value, offering price and redemption price per share ($53,963 ÷ 1,171.44 shares) | | $46.07 |
(a) Redemption price per share is equal to net asset value less any applicable contingent deferred sales charge.
See accompanying notes which are an integral part of the financial statements.
Statement of Operations
| Amounts in thousands | | Year ended October 31, 2020 |
| Investment Income | | |
| Dividends (including $1,105 earned from other affiliated issuers) | | $153,275 |
| Non-Cash dividends | | 12,629 |
| Income from Fidelity Central Funds (including $1,061 from security lending) | | 2,404 |
| Income before foreign taxes withheld | | 168,308 |
| Less foreign taxes withheld | | (14,570) |
| Total income | | 153,738 |
| Expenses | | |
| Management fee | | |
| Basic fee | $58,227 | |
| Performance adjustment | 15,672 | |
| Transfer agent fees | 11,811 | |
| Distribution and service plan fees | 661 | |
| Accounting fees | 1,725 | |
| Custodian fees and expenses | 1,118 | |
| Independent trustees' fees and expenses | 51 | |
| Registration fees | 160 | |
| Audit | 143 | |
| Legal | 16 | |
| Interest | 1 | |
| Miscellaneous | 133 | |
| Total expenses before reductions | 89,718 | |
| Expense reductions | (721) | |
| Total expenses after reductions | | 88,997 |
| Net investment income (loss) | | 64,741 |
| Realized and Unrealized Gain (Loss) | | |
| Net realized gain (loss) on: | | |
| Investment securities: | | |
| Unaffiliated issuers (net of foreign taxes of $99) | 370,287 | |
| Fidelity Central Funds | 41 | |
| Other affiliated issuers | 6 | |
| Foreign currency transactions | (1,976) | |
| Total net realized gain (loss) | | 368,358 |
| Change in net unrealized appreciation (depreciation) on: | | |
| Investment securities: | | |
| Unaffiliated issuers | 257,568 | |
| Affiliated issuers | 1,974 | |
| Assets and liabilities in foreign currencies | 867 | |
| Total change in net unrealized appreciation (depreciation) | | 260,409 |
| Net gain (loss) | | 628,767 |
| Net increase (decrease) in net assets resulting from operations | | $693,508 |
See accompanying notes which are an integral part of the financial statements.
Statement of Changes in Net Assets
| Amounts in thousands | Year ended October 31, 2020 | Year ended October 31, 2019 |
| Increase (Decrease) in Net Assets | | |
| Operations | | |
| Net investment income (loss) | $64,741 | $174,805 |
| Net realized gain (loss) | 368,358 | 104,178 |
| Change in net unrealized appreciation (depreciation) | 260,409 | 769,838 |
| Net increase (decrease) in net assets resulting from operations | 693,508 | 1,048,821 |
| Distributions to shareholders | (219,470) | (328,610) |
| Share transactions - net increase (decrease) | (699,272) | (1,178,397) |
| Total increase (decrease) in net assets | (225,234) | (458,186) |
| Net Assets | | |
| Beginning of period | 9,057,223 | 9,515,409 |
| End of period | $8,831,989 | $9,057,223 |
See accompanying notes which are an integral part of the financial statements.
Financial Highlights
Fidelity International Discovery Fund Class A
| Years ended October 31, | 2020 | 2019 | 2018 | 2017 | 2016 |
| Selected Per–Share Data | | | | | |
| Net asset value, beginning of period | $43.31 | $39.99 | $46.66 | $37.60 | $39.78 |
| Income from Investment Operations | | | | | |
| Net investment income (loss)A | .16 | .63B | .37 | .36 | .47C |
| Net realized and unrealized gain (loss) | 3.27 | 3.93 | (4.87) | 9.22 | (2.38) |
| Total from investment operations | 3.43 | 4.56 | (4.50) | 9.58 | (1.91) |
| Distributions from net investment income | (.62) | (.33) | (.34) | (.47) | (.27) |
| Distributions from net realized gain | (.28) | (.91) | (1.83) | (.05) | (.01) |
| Total distributions | (.90) | (1.24) | (2.17) | (.52) | (.27)D |
| Redemption fees added to paid in capitalA | – | – | – | –E | –E |
| Net asset value, end of period | $45.84 | $43.31 | $39.99 | $46.66 | $37.60 |
| Total ReturnF,G | 8.02% | 11.90% | (10.11)% | 25.87% | (4.83)% |
| Ratios to Average Net AssetsH,I | | | | | |
| Expenses before reductions | 1.36% | 1.12% | 1.22% | 1.29% | 1.35% |
| Expenses net of fee waivers, if any | 1.36% | 1.12% | 1.22% | 1.29% | 1.35% |
| Expenses net of all reductions | 1.36% | 1.11% | 1.21% | 1.27% | 1.34% |
| Net investment income (loss) | .38% | 1.57%B | .83% | .88% | 1.26%C |
| Supplemental Data | | | | | |
| Net assets, end of period (in millions) | $173 | $185 | $191 | $248 | $236 |
| Portfolio turnover rateJ | 34%K | 70%K | 45%K | 42% | 50%K |
A Calculated based on average shares outstanding during the period.
B Net investment income per share reflects one or more large, non-recurring dividend(s) which amounted to $.21 per share. Excluding such non-recurring dividend(s), the ratio of net investment income (loss) to average net assets would have been 1.05%.
C Net investment income per share reflects one or more large, non-recurring dividend(s) which amounted to $.14 per share. Excluding such non-recurring dividend(s), the ratio of net investment income (loss) to average net assets would have been .88%.
D Total distributions per share do not sum due to rounding.
E Amount represents less than $.005 per share.
F Total returns would have been lower if certain expenses had not been reduced during the applicable periods shown.
G Total returns do not include the effect of the sales charges.
H Fees and expenses of any underlying mutual funds or exchange-traded funds (ETFs) are not included in the Fund's expense ratio. The Fund indirectly bears its proportionate share of these expenses. For additional expense information related to investments in Fidelity Central Funds, please refer to the "Investments in Fidelity Central Funds" note found in the Notes to Financial Statements section of the most recent Annual or Semi-Annual report.
I Expense ratios reflect operating expenses of the class. Expenses before reductions do not reflect amounts reimbursed, waived, or reduced through arrangements with the investment adviser, brokerage services, or other offset arrangements, if applicable, and do not represent the amount paid by the class during periods when reimbursements, waivers or reductions occur.
J Amount does not include the portfolio activity of any underlying mutual funds or exchange-traded funds (ETFs).
K Portfolio turnover rate excludes securities received or delivered in-kind.
See accompanying notes which are an integral part of the financial statements.
Fidelity International Discovery Fund Class M
| Years ended October 31, | 2020 | 2019 | 2018 | 2017 | 2016 |
| Selected Per–Share Data | | | | | |
| Net asset value, beginning of period | $43.01 | $39.71 | $46.35 | $37.34 | $39.51 |
| Income from Investment Operations | | | | | |
| Net investment income (loss)A | .06 | .53B | .27 | .26 | .38C |
| Net realized and unrealized gain (loss) | 3.24 | 3.91 | (4.84) | 9.17 | (2.37) |
| Total from investment operations | 3.30 | 4.44 | (4.57) | 9.43 | (1.99) |
| Distributions from net investment income | (.51) | (.22) | (.24) | (.37) | (.17) |
| Distributions from net realized gain | (.28) | (.91) | (1.83) | (.05) | (.01) |
| Total distributions | (.78)D | (1.14)D | (2.07) | (.42) | (.18) |
| Redemption fees added to paid in capitalA | – | – | – | –E | –E |
| Net asset value, end of period | $45.53 | $43.01 | $39.71 | $46.35 | $37.34 |
| Total ReturnF,G | 7.77% | 11.62% | (10.31)% | 25.57% | (5.07)% |
| Ratios to Average Net AssetsH,I | | | | | |
| Expenses before reductions | 1.61% | 1.37% | 1.46% | 1.53% | 1.58% |
| Expenses net of fee waivers, if any | 1.61% | 1.37% | 1.46% | 1.52% | 1.58% |
| Expenses net of all reductions | 1.60% | 1.35% | 1.45% | 1.51% | 1.57% |
| Net investment income (loss) | .13% | 1.32%B | .59% | .64% | 1.02%C |
| Supplemental Data | | | | | |
| Net assets, end of period (in millions) | $21 | $24 | $28 | $35 | $35 |
| Portfolio turnover rateJ | 34%K | 70%K | 45%K | 42% | 50%K |
A Calculated based on average shares outstanding during the period.
B Net investment income per share reflects one or more large, non-recurring dividend(s) which amounted to $.21 per share. Excluding such non-recurring dividend(s), the ratio of net investment income (loss) to average net assets would have been .80%.
C Net investment income per share reflects one or more large, non-recurring dividend(s) which amounted to $.14 per share. Excluding such non-recurring dividend(s), the ratio of net investment income (loss) to average net assets would have been .64%.
D Total distributions per share do not sum due to rounding.
E Amount represents less than $.005 per share.
F Total returns would have been lower if certain expenses had not been reduced during the applicable periods shown.
G Total returns do not include the effect of the sales charges.
H Fees and expenses of any underlying mutual funds or exchange-traded funds (ETFs) are not included in the Fund's expense ratio. The Fund indirectly bears its proportionate share of these expenses. For additional expense information related to investments in Fidelity Central Funds, please refer to the "Investments in Fidelity Central Funds" note found in the Notes to Financial Statements section of the most recent Annual or Semi-Annual report.
I Expense ratios reflect operating expenses of the class. Expenses before reductions do not reflect amounts reimbursed, waived, or reduced through arrangements with the investment adviser, brokerage services, or other offset arrangements, if applicable, and do not represent the amount paid by the class during periods when reimbursements, waivers or reductions occur.
J Amount does not include the portfolio activity of any underlying mutual funds or exchange-traded funds (ETFs).
K Portfolio turnover rate excludes securities received or delivered in-kind.
See accompanying notes which are an integral part of the financial statements.
Fidelity International Discovery Fund Class C
| Years ended October 31, | 2020 | 2019 | 2018 | 2017 | 2016 |
| Selected Per–Share Data | | | | | |
| Net asset value, beginning of period | $42.60 | $39.32 | $45.94 | $36.96 | $39.14 |
| Income from Investment Operations | | | | | |
| Net investment income (loss)A | (.18) | .31B | .02 | .04 | .19C |
| Net realized and unrealized gain (loss) | 3.22 | 3.88 | (4.79) | 9.12 | (2.37) |
| Total from investment operations | 3.04 | 4.19 | (4.77) | 9.16 | (2.18) |
| Distributions from net investment income | (.19) | – | (.02) | (.13) | – |
| Distributions from net realized gain | (.28) | (.91) | (1.83) | (.05) | – |
| Total distributions | (.46)D | (.91) | (1.85) | (.18) | – |
| Redemption fees added to paid in capitalA | – | – | – | –E | –E |
| Net asset value, end of period | $45.18 | $42.60 | $39.32 | $45.94 | $36.96 |
| Total ReturnF,G | 7.19% | 11.02% | (10.80)% | 24.93% | (5.57)% |
| Ratios to Average Net AssetsH,I | | | | | |
| Expenses before reductions | 2.16% | 1.91% | 2.00% | 2.05% | 2.10% |
| Expenses net of fee waivers, if any | 2.15% | 1.91% | 2.00% | 2.05% | 2.10% |
| Expenses net of all reductions | 2.15% | 1.90% | 1.99% | 2.04% | 2.09% |
| Net investment income (loss) | (.41)% | .78%B | .05% | .11% | .50%C |
| Supplemental Data | | | | | |
| Net assets, end of period (in millions) | $11 | $12 | $22 | $28 | $26 |
| Portfolio turnover rateJ | 34%K | 70%K | 45%K | 42% | 50%K |
A Calculated based on average shares outstanding during the period.
B Net investment income per share reflects one or more large, non-recurring dividend(s) which amounted to $.21 per share. Excluding such non-recurring dividend(s), the ratio of net investment income (loss) to average net assets would have been .26%.
C Net investment income per share reflects one or more large, non-recurring dividend(s) which amounted to $.14 per share. Excluding such non-recurring dividend(s), the ratio of net investment income (loss) to average net assets would have been .13%.
D Total distributions per share do not sum due to rounding.
E Amount represents less than $.005 per share.
F Total returns would have been lower if certain expenses had not been reduced during the applicable periods shown.
G Total returns do not include the effect of the contingent deferred sales charge.
H Fees and expenses of any underlying mutual funds or exchange-traded funds (ETFs) are not included in the Fund's expense ratio. The Fund indirectly bears its proportionate share of these expenses. For additional expense information related to investments in Fidelity Central Funds, please refer to the "Investments in Fidelity Central Funds" note found in the Notes to Financial Statements section of the most recent Annual or Semi-Annual report.
I Expense ratios reflect operating expenses of the class. Expenses before reductions do not reflect amounts reimbursed, waived, or reduced through arrangements with the investment adviser, brokerage services, or other offset arrangements, if applicable, and do not represent the amount paid by the class during periods when reimbursements, waivers or reductions occur.
J Amount does not include the portfolio activity of any underlying mutual funds or exchange-traded funds (ETFs).
K Portfolio turnover rate excludes securities received or delivered in-kind.
See accompanying notes which are an integral part of the financial statements.
Fidelity International Discovery Fund
| Years ended October 31, | 2020 | 2019 | 2018 | 2017 | 2016 |
| Selected Per–Share Data | | | | | |
| Net asset value, beginning of period | $43.65 | $40.32 | $47.04 | $37.91 | $40.12 |
| Income from Investment Operations | | | | | |
| Net investment income (loss)A | .32 | .78B | .53 | .50 | .61C |
| Net realized and unrealized gain (loss) | 3.29 | 3.95 | (4.92) | 9.29 | (2.41) |
| Total from investment operations | 3.61 | 4.73 | (4.39) | 9.79 | (1.80) |
| Distributions from net investment income | (.78) | (.49) | (.50) | (.61) | (.41) |
| Distributions from net realized gain | (.28) | (.91) | (1.83) | (.05) | (.01) |
| Total distributions | (1.06) | (1.40) | (2.33) | (.66) | (.41)D |
| Redemption fees added to paid in capitalA | – | – | – | –E | –E |
| Net asset value, end of period | $46.20 | $43.65 | $40.32 | $47.04 | $37.91 |
| Total ReturnF | 8.39% | 12.31% | (9.81)% | 26.33% | (4.53)% |
| Ratios to Average Net AssetsG,H | | | | | |
| Expenses before reductions | 1.02% | .78% | .88% | .94% | 1.00% |
| Expenses net of fee waivers, if any | 1.02% | .78% | .88% | .94% | 1.00% |
| Expenses net of all reductions | 1.01% | .76% | .87% | .92% | .99% |
| Net investment income (loss) | .72% | 1.92%B | 1.17% | 1.22% | 1.61%C |
| Supplemental Data | | | | | |
| Net assets, end of period (in millions) | $6,784 | $6,726 | $6,515 | $7,351 | $6,421 |
| Portfolio turnover rateI | 34%J | 70%J | 45%J | 42% | 50%J |
A Calculated based on average shares outstanding during the period.
B Net investment income per share reflects one or more large, non-recurring dividend(s) which amounted to $.21 per share. Excluding such non-recurring dividend(s), the ratio of net investment income (loss) to average net assets would have been 1.40%.
C Net investment income per share reflects one or more large, non-recurring dividend(s) which amounted to $.14 per share. Excluding such non-recurring dividend(s), the ratio of net investment income (loss) to average net assets would have been 1.23%.
D Total distributions per share do not sum due to rounding.
E Amount represents less than $.005 per share.
F Total returns would have been lower if certain expenses had not been reduced during the applicable periods shown.
G Fees and expenses of any underlying mutual funds or exchange-traded funds (ETFs) are not included in the Fund's expense ratio. The Fund indirectly bears its proportionate share of these expenses. For additional expense information related to investments in Fidelity Central Funds, please refer to the "Investments in Fidelity Central Funds" note found in the Notes to Financial Statements section of the most recent Annual or Semi-Annual report.
H Expense ratios reflect operating expenses of the class. Expenses before reductions do not reflect amounts reimbursed, waived, or reduced through arrangements with the investment adviser, brokerage services, or other offset arrangements, if applicable, and do not represent the amount paid by the class during periods when reimbursements, waivers or reductions occur.
I Amount does not include the portfolio activity of any underlying mutual funds or exchange-traded funds (ETFs).
J Portfolio turnover rate excludes securities received or delivered in-kind.
See accompanying notes which are an integral part of the financial statements.
Fidelity International Discovery Fund Class K
| Years ended October 31, | 2020 | 2019 | 2018 | 2017 | 2016 |
| Selected Per–Share Data | | | | | |
| Net asset value, beginning of period | $43.55 | $40.25 | $46.96 | $37.86 | $40.06 |
| Income from Investment Operations | | | | | |
| Net investment income (loss)A | .36 | .82B | .58 | .55 | .66C |
| Net realized and unrealized gain (loss) | 3.29 | 3.93 | (4.90) | 9.26 | (2.39) |
| Total from investment operations | 3.65 | 4.75 | (4.32) | 9.81 | (1.73) |
| Distributions from net investment income | (.82) | (.54) | (.55) | (.66) | (.46) |
| Distributions from net realized gain | (.28) | (.91) | (1.83) | (.05) | (.01) |
| Total distributions | (1.10) | (1.45) | (2.39)D | (.71) | (.47) |
| Redemption fees added to paid in capitalA | – | – | – | –E | –E |
| Net asset value, end of period | $46.10 | $43.55 | $40.25 | $46.96 | $37.86 |
| Total ReturnF | 8.52% | 12.41% | (9.70)% | 26.47% | (4.38)% |
| Ratios to Average Net AssetsG,H | | | | | |
| Expenses before reductions | .91% | .66% | .77% | .82% | .86% |
| Expenses net of fee waivers, if any | .91% | .66% | .77% | .82% | .86% |
| Expenses net of all reductions | .91% | .65% | .76% | .80% | .85% |
| Net investment income (loss) | .83% | 2.03%B | 1.29% | 1.35% | 1.74%C |
| Supplemental Data | | | | | |
| Net assets, end of period (in millions) | $1,401 | $1,566 | $2,064 | $2,228 | $1,880 |
| Portfolio turnover rateI | 34%J | 70%J | 45%J | 42% | 50%J |
A Calculated based on average shares outstanding during the period.
B Net investment income per share reflects one or more large, non-recurring dividend(s) which amounted to $.21 per share. Excluding such non-recurring dividend(s), the ratio of net investment income (loss) to average net assets would have been 1.51%.
C Net investment income per share reflects one or more large, non-recurring dividend(s) which amounted to $.14 per share. Excluding such non-recurring dividend(s), the ratio of net investment income (loss) to average net assets would have been 1.36%.
D Total distributions per share do not sum due to rounding.
E Amount represents less than $.005 per share.
F Total returns would have been lower if certain expenses had not been reduced during the applicable periods shown.
G Fees and expenses of any underlying mutual funds or exchange-traded funds (ETFs) are not included in the Fund's expense ratio. The Fund indirectly bears its proportionate share of these expenses. For additional expense information related to investments in Fidelity Central Funds, please refer to the "Investments in Fidelity Central Funds" note found in the Notes to Financial Statements section of the most recent Annual or Semi-Annual report.
H Expense ratios reflect operating expenses of the class. Expenses before reductions do not reflect amounts reimbursed, waived, or reduced through arrangements with the investment adviser, brokerage services, or other offset arrangements, if applicable, and do not represent the amount paid by the class during periods when reimbursements, waivers or reductions occur.
I Amount does not include the portfolio activity of any underlying mutual funds or exchange-traded funds (ETFs).
J Portfolio turnover rate excludes securities received or delivered in-kind.
See accompanying notes which are an integral part of the financial statements.
Fidelity International Discovery Fund Class I
| Years ended October 31, | 2020 | 2019 | 2018 | 2017 | 2016 |
| Selected Per–Share Data | | | | | |
| Net asset value, beginning of period | $43.53 | $40.22 | $46.92 | $37.82 | $40.03 |
| Income from Investment Operations | | | | | |
| Net investment income (loss)A | .31 | .77B | .52 | .49 | .61C |
| Net realized and unrealized gain (loss) | 3.28 | 3.93 | (4.90) | 9.27 | (2.40) |
| Total from investment operations | 3.59 | 4.70 | (4.38) | 9.76 | (1.79) |
| Distributions from net investment income | (.76) | (.48) | (.49) | (.61) | (.42) |
| Distributions from net realized gain | (.28) | (.91) | (1.83) | (.05) | (.01) |
| Total distributions | (1.04) | (1.39) | (2.32) | (.66) | (.42)D |
| Redemption fees added to paid in capitalA | – | – | – | –E | –E |
| Net asset value, end of period | $46.08 | $43.53 | $40.22 | $46.92 | $37.82 |
| Total ReturnF | 8.37% | 12.26% | (9.81)% | 26.29% | (4.52)% |
| Ratios to Average Net AssetsG,H | | | | | |
| Expenses before reductions | 1.04% | .80% | .91% | .96% | 1.00% |
| Expenses net of fee waivers, if any | 1.04% | .80% | .91% | .96% | 1.00% |
| Expenses net of all reductions | 1.03% | .79% | .90% | .94% | .99% |
| Net investment income (loss) | .70% | 1.89%B | 1.15% | 1.21% | 1.60%C |
| Supplemental Data | | | | | |
| Net assets, end of period (in millions) | $388 | $463 | $579 | $658 | $745 |
| Portfolio turnover rateI | 34%J | 70%J | 45%J | 42% | 50%J |
A Calculated based on average shares outstanding during the period.
B Net investment income per share reflects one or more large, non-recurring dividend(s) which amounted to $.21 per share. Excluding such non-recurring dividend(s), the ratio of net investment income (loss) to average net assets would have been 1.37%.
C Net investment income per share reflects one or more large, non-recurring dividend(s) which amounted to $.14 per share. Excluding such non-recurring dividend(s), the ratio of net investment income (loss) to average net assets would have been 1.22%.
D Total distributions per share do not sum due to rounding.
E Amount represents less than $.005 per share.
F Total returns would have been lower if certain expenses had not been reduced during the applicable periods shown.
G Fees and expenses of any underlying mutual funds or exchange-traded funds (ETFs) are not included in the Fund's expense ratio. The Fund indirectly bears its proportionate share of these expenses. For additional expense information related to investments in Fidelity Central Funds, please refer to the "Investments in Fidelity Central Funds" note found in the Notes to Financial Statements section of the most recent Annual or Semi-Annual report.
H Expense ratios reflect operating expenses of the class. Expenses before reductions do not reflect amounts reimbursed, waived, or reduced through arrangements with the investment adviser, brokerage services, or other offset arrangements, if applicable, and do not represent the amount paid by the class during periods when reimbursements, waivers or reductions occur.
I Amount does not include the portfolio activity of any underlying mutual funds or exchange-traded funds (ETFs).
J Portfolio turnover rate excludes securities received or delivered in-kind.
See accompanying notes which are an integral part of the financial statements.
Fidelity International Discovery Fund Class Z
| Years ended October 31, | 2020 | 2019 | 2018 | 2017 | 2016 |
| Selected Per–Share Data | | | | | |
| Net asset value, beginning of period | $43.52 | $40.22 | $46.92 | $37.84 | $40.03 |
| Income from Investment Operations | | | | | |
| Net investment income (loss)A | .36 | .82B | .58 | .56 | .66C |
| Net realized and unrealized gain (loss) | 3.29 | 3.94 | (4.89) | 9.24 | (2.38) |
| Total from investment operations | 3.65 | 4.76 | (4.31) | 9.80 | (1.72) |
| Distributions from net investment income | (.82) | (.54) | (.56) | (.67) | (.46) |
| Distributions from net realized gain | (.28) | (.91) | (1.83) | (.05) | (.01) |
| Total distributions | (1.10) | (1.46)D | (2.39) | (.72) | (.47) |
| Redemption fees added to paid in capitalA | – | – | – | –E | –E |
| Net asset value, end of period | $46.07 | $43.52 | $40.22 | $46.92 | $37.84 |
| Total ReturnF | 8.53% | 12.42% | (9.68)% | 26.44% | (4.36)% |
| Ratios to Average Net AssetsG,H | | | | | |
| Expenses before reductions | .91% | .66% | .77% | .82% | .86% |
| Expenses net of fee waivers, if any | .91% | .66% | .77% | .82% | .86% |
| Expenses net of all reductions | .91% | .65% | .76% | .80% | .85% |
| Net investment income (loss) | .83% | 2.03%B | 1.29% | 1.35% | 1.74%C |
| Supplemental Data | | | | | |
| Net assets, end of period (in millions) | $54 | $82 | $118 | $101 | $38 |
| Portfolio turnover rateI | 34%J | 70%J | 45%J | 42% | 50%J |
A Calculated based on average shares outstanding during the period.
B Net investment income per share reflects one or more large, non-recurring dividend(s) which amounted to $.21 per share. Excluding such non-recurring dividend(s), the ratio of net investment income (loss) to average net assets would have been 1.51%.
C Net investment income per share reflects one or more large, non-recurring dividend(s) which amounted to $.14 per share. Excluding such non-recurring dividend(s), the ratio of net investment income (loss) to average net assets would have been 1.36%.
D Total distributions per share do not sum due to rounding.
E Amount represents less than $.005 per share.
F Total returns would have been lower if certain expenses had not been reduced during the applicable periods shown.
G Fees and expenses of any underlying mutual funds or exchange-traded funds (ETFs) are not included in the Fund's expense ratio. The Fund indirectly bears its proportionate share of these expenses. For additional expense information related to investments in Fidelity Central Funds, please refer to the "Investments in Fidelity Central Funds" note found in the Notes to Financial Statements section of the most recent Annual or Semi-Annual report.
H Expense ratios reflect operating expenses of the class. Expenses before reductions do not reflect amounts reimbursed, waived, or reduced through arrangements with the investment adviser, brokerage services, or other offset arrangements, if applicable, and do not represent the amount paid by the class during periods when reimbursements, waivers or reductions occur.
I Amount does not include the portfolio activity of any underlying mutual funds or exchange-traded funds (ETFs).
J Portfolio turnover rate excludes securities received or delivered in-kind.
See accompanying notes which are an integral part of the financial statements.
Notes to Financial Statements
For the period ended October 31, 2020
(Amounts in thousands except percentages)
1. Organization.
Fidelity International Discovery Fund (the Fund) is a fund of Fidelity Investment Trust (the Trust) and is authorized to issue an unlimited number of shares. The Trust is registered under the Investment Company Act of 1940, as amended (the 1940 Act), as an open-end management investment company organized as a Massachusetts business trust. The Fund offers Class A, Class M, Class C, International Discovery, Class K, Class I and Class Z shares, each of which has equal rights as to assets and voting privileges. Each class has exclusive voting rights with respect to matters that affect that class. Class C shares will automatically convert to Class A shares after a holding period of ten years from the initial date of purchase, with certain exceptions.
Effective January 1, 2020:
Investment advisers Fidelity Investments Money Management, Inc., FMR Co., Inc., and Fidelity SelectCo, LLC, merged with and into Fidelity Management & Research Company. In connection with the merger transactions, the resulting, merged investment adviser was then redomiciled from Massachusetts to Delaware, changed its corporate structure from a corporation to a limited liability company, and changed its name to "Fidelity Management & Research Company LLC".
Broker-dealer Fidelity Distributors Corporation merged with and into Fidelity Investments Institutional Services Company, Inc. ("FIISC"). FIISC was then redomiciled from Massachusetts to Delaware, changed its corporate structure from a corporation to a limited liability company, and changed its name to "Fidelity Distributors Company LLC".
Fidelity Investments Institutional Operations Company, Inc. converted from a Massachusetts corporation to a Massachusetts LLC, and changed its name to "Fidelity Investments Institutional Operations Company LLC".
2. Investments in Fidelity Central Funds.
The Fund invests in Fidelity Central Funds, which are open-end investment companies generally available only to other investment companies and accounts managed by the investment adviser and its affiliates. The Fund's Schedule of Investments lists each of the Fidelity Central Funds held as of period end, if any, as an investment of the Fund, but does not include the underlying holdings of each Fidelity Central Fund. As an Investing Fund, the Fund indirectly bears its proportionate share of the expenses of the underlying Fidelity Central Funds.
The Money Market Central Funds seek preservation of capital and current income and are managed by the investment adviser. Annualized expenses of the Money Market Central Funds as of their most recent shareholder report date ranged from less than .005% to .01%.
A complete unaudited list of holdings for each Fidelity Central Fund is available upon request or at the Securities and Exchange Commission (the SEC) website at www.sec.gov. In addition, the financial statements of the Fidelity Central Funds, which are not covered by the Fund's Report of Independent Registered Public Accounting Firm, are available on the SEC website or upon request.
3. Significant Accounting Policies.
The Fund is an investment company and applies the accounting and reporting guidance of the Financial Accounting Standards Board (FASB) Accounting Standards Codification Topic 946 Financial Services – Investment Companies. The financial statements have been prepared in conformity with accounting principles generally accepted in the United States of America (GAAP), which require management to make certain estimates and assumptions at the date of the financial statements. Actual results could differ from those estimates. Subsequent events, if any, through the date that the financial statements were issued have been evaluated in the preparation of the financial statements. The following summarizes the significant accounting policies of the Fund:
Investment Valuation. Investments are valued as of 4:00 p.m. Eastern time on the last calendar day of the period. The Board of Trustees (the Board) has delegated the day to day responsibility for the valuation of the Fund's investments to the Fair Value Committee (the Committee) established by the Fund's investment adviser. In accordance with valuation policies and procedures approved by the Board, the Fund attempts to obtain prices from one or more third party pricing vendors or brokers to value its investments. When current market prices, quotations or currency exchange rates are not readily available or reliable, investments will be fair valued in good faith by the Committee, in accordance with procedures adopted by the Board. Factors used in determining fair value vary by investment type and may include market or investment specific events. The frequency with which these procedures are used cannot be predicted and they may be utilized to a significant extent. The Committee oversees the Fund's valuation policies and procedures and reports to the Board on the Committee's activities and fair value determinations. The Board monitors the appropriateness of the procedures used in valuing the Fund's investments and ratifies the fair value determinations of the Committee.
The Fund categorizes the inputs to valuation techniques used to value its investments into a disclosure hierarchy consisting of three levels as shown below:
- Level 1 – quoted prices in active markets for identical investments
- Level 2 – other significant observable inputs (including quoted prices for similar investments, interest rates, prepayment speeds, etc.)
- Level 3 – unobservable inputs (including the Fund's own assumptions based on the best information available)
Valuation techniques used to value the Fund's investments by major category are as follows:
Equity securities, including restricted securities, for which market quotations are readily available, are valued at the last reported sale price or official closing price as reported by a third party pricing vendor on the primary market or exchange on which they are traded and are categorized as Level 1 in the hierarchy. In the event there were no sales during the day or closing prices are not available, securities are valued at the last quoted bid price or may be valued using the last available price and are generally categorized as Level 2 in the hierarchy. For foreign equity securities, when market or security specific events arise, comparisons to the valuation of American Depositary Receipts (ADRs), futures contracts, Exchange-Traded Funds (ETFs) and certain indexes as well as quoted prices for similar securities may be used and would be categorized as Level 2 in the hierarchy. For equity securities, including restricted securities, where observable inputs are limited, assumptions about market activity and risk are used and these securities may be categorized as Level 3 in the hierarchy.
Investments in open-end mutual funds, including the Fidelity Central Funds, are valued at their closing net asset value (NAV) each business day and are categorized as Level 1 in the hierarchy.
Changes in valuation techniques may result in transfers in or out of an assigned level within the disclosure hierarchy. The aggregate value of investments by input level as of October 31, 2020 is included at the end of the Fund's Schedule of Investments.
Foreign Currency. Certain Funds may use foreign currency contracts to facilitate transactions in foreign-denominated securities. Gains and losses from these transactions may arise from changes in the value of the foreign currency or if the counterparties do not perform under the contracts' terms.
Foreign-denominated assets, including investment securities, and liabilities are translated into U.S. dollars at the exchange rates at period end. Purchases and sales of investment securities, income and dividends received, and expenses denominated in foreign currencies are translated into U.S. dollars at the exchange rate in effect on the transaction date.
The effects of exchange rate fluctuations on investments are included with the net realized and unrealized gain (loss) on investment securities. Other foreign currency transactions resulting in realized and unrealized gain (loss) are disclosed separately.
Investment Transactions and Income. For financial reporting purposes, the Fund's investment holdings and NAV include trades executed through the end of the last business day of the period. The NAV per share for processing shareholder transactions is calculated as of the close of business of the New York Stock Exchange (NYSE), normally 4:00 p.m. Eastern time and includes trades executed through the end of the prior business day. Gains and losses on securities sold are determined on the basis of identified cost and include proceeds received from litigation. Dividend income is recorded on the ex-dividend date, except for certain dividends from foreign securities where the ex-dividend date may have passed, which are recorded as soon as the Fund is informed of the ex-dividend date. Non-cash dividends included in dividend income, if any, are recorded at the fair market value of the securities received. Income and capital gain distributions from Fidelity Central Funds, if any, are recorded on the ex-dividend date. Certain distributions received by the Fund represent a return of capital or capital gain. The Fund determines the components of these distributions subsequent to the ex-dividend date, based upon receipt of tax filings or other correspondence relating to the underlying investment. These distributions are recorded as a reduction of cost of investments and/or as a realized gain. Investment income is recorded net of foreign taxes withheld where recovery of such taxes is uncertain.
Class Allocations and Expenses. Investment income, realized and unrealized capital gains and losses, common expenses of the Fund, and certain fund-level expense reductions, if any, are allocated daily on a pro-rata basis to each class based on the relative net assets of each class to the total net assets of the Fund. Each class differs with respect to transfer agent and distribution and service plan fees incurred. Certain expense reductions may also differ by class. For the reporting period, the allocated portion of income and expenses to each class as a percent of its average net assets may vary due to the timing of recording these transactions in relation to fluctuating net assets of the classes. Expenses directly attributable to a fund are charged to that fund. Expenses attributable to more than one fund are allocated among the respective funds on the basis of relative net assets or other appropriate methods. Expense estimates are accrued in the period to which they relate and adjustments are made when actual amounts are known.
Deferred Trustee Compensation. Under a Deferred Compensation Plan (the Plan) for the Fund, certain independent Trustees have elected to defer receipt of a portion of their annual compensation. Deferred amounts are invested in a cross-section of Fidelity funds, are marked-to-market and remain in the Fund until distributed in accordance with the Plan. The investment of deferred amounts and the offsetting payable to the Trustees of $584 are included in the accompanying Statement of Assets and Liabilities in other receivables and other payables and accrued expenses, respectively.
Income Tax Information and Distributions to Shareholders. Each year, the Fund intends to qualify as a regulated investment company under Subchapter M of the Internal Revenue Code, including distributing substantially all of its taxable income and realized gains. As a result, no provision for U.S. Federal income taxes is required. As of October 31, 2020, the Fund did not have any unrecognized tax benefits in the financial statements; nor is the Fund aware of any tax positions for which it is reasonably possible that the total amounts of unrecognized tax benefits will significantly change in the next twelve months. The Fund files a U.S. federal tax return, in addition to state and local tax returns as required. The Fund's federal income tax returns are subject to examination by the Internal Revenue Service (IRS) for a period of three fiscal years after they are filed. State and local tax returns may be subject to examination for an additional fiscal year depending on the jurisdiction. Foreign taxes are provided for based on the Fund's understanding of the tax rules and rates that exist in the foreign markets in which it invests. The Fund is subject to a tax imposed on capital gains by certain countries in which it invests.
Distributions are declared and recorded on the ex-dividend date. Income and capital gain distributions are declared separately for each class. Income and capital gain distributions are determined in accordance with income tax regulations, which may differ from GAAP. In addition, the Fund claimed a portion of the payment made to redeeming shareholders as a distribution for income tax purposes.
Capital accounts within the financial statements are adjusted for permanent book-tax differences. These adjustments have no impact on net assets or the results of operations. Capital accounts are not adjusted for temporary book-tax differences which will reverse in a subsequent period.
Book-tax differences are primarily due to foreign currency transactions, passive foreign investment companies (PFIC), certain foreign taxes, market discount, redemptions in-kind, deferred trustees compensation and losses deferred due to wash sales.
As of period end, the cost and unrealized appreciation (depreciation) in securities, and derivatives if applicable, for federal income tax purposes were as follows:
| Gross unrealized appreciation | $2,349,007 |
| Gross unrealized depreciation | (466,899) |
| Net unrealized appreciation (depreciation) | $1,882,108 |
| Tax Cost | $6,939,484 |
The tax-based components of distributable earnings as of period end were as follows:
| Undistributed ordinary income | $49,562 |
| Undistributed long-term capital gain | $324,204 |
| Net unrealized appreciation (depreciation) on securities and other investments | $1,881,203 |
The tax character of distributions paid was as follows:
| | October 31, 2020 | October 31, 2019 |
| Ordinary Income | $161,887 | $ 115,761 |
| Long-term Capital Gains | 57,583 | 212,849 |
| Total | $219,470 | $ 328,610 |
Restricted Securities (including Private Placements). The Fund may invest in securities that are subject to legal or contractual restrictions on resale. These securities generally may be resold in transactions exempt from registration or to the public if the securities are registered. Disposal of these securities may involve time-consuming negotiations and expense, and prompt sale at an acceptable price may be difficult. Information regarding restricted securities is included at the end of the Fund's Schedule of Investments.
4. Purchases and Sales of Investments.
Purchases and sales of securities, other than short-term securities and in-kind transactions, are noted in the table below.
| | Purchases ($) | Sales ($) |
| Fidelity International Discovery Fund | 2,916,052 | 3,633,497 |
Unaffiliated Redemptions In-Kind. During the period, 391 shares of the Fund were redeemed in-kind for investments and cash with a value of $17,621. The net realized gain of $5,107 on investments delivered through in-kind redemptions is included in the accompanying Statement of Operations. The amount of the in-kind redemptions is included in share transactions in the accompanying Statement of Changes in Net Assets as well as the Notes to Financial Statements. The Fund recognized no gain or loss for federal income tax purposes.
Prior Fiscal Year Unaffiliated Redemptions In-Kind. During the prior period, 2,812 shares of the Fund were redeemed in-kind for investments and cash with a value of $119,262. The Fund had a net realized gain of $30,907 on investments delivered through in-kind redemptions. The amount of the in-kind redemptions is included in share transactions in the accompanying Statement of Changes in Net Assets as well as the Notes to Financial Statements. The Fund recognized no gain or loss for federal income tax purposes.
5. Fees and Other Transactions with Affiliates.
Management Fee. Fidelity Management & Research Company LLC (the investment adviser) and its affiliates provide the Fund with investment management related services for which the Fund pays a monthly management fee. The management fee is the sum of an individual fund fee rate that is based on an annual rate of .424% of the Fund's average net assets and an annualized group fee rate that averaged .23% during the period. The group fee rate is based upon the monthly average net assets of a group of registered investment companies with which the investment adviser has management contracts. The group fee rate decreases as assets under management increase and increases as assets under management decrease. In addition, the management fee is subject to a performance adjustment (up to a maximum of +/- .20% of the Fund's average net assets over a 36 month performance period). The upward or downward adjustment to the management fee is based on the relative investment performance of International Discovery as compared to its benchmark index, the MSCI EAFE Index, over the same 36 month performance period. For the reporting period, the total annual management fee rate, including the performance adjustment, was .83% of the Fund's average net assets. The performance adjustment included in the management fee rate may be higher or lower than the maximum performance adjustment rate due to the difference between the average net assets for the reporting and performance periods.
Distribution and Service Plan Fees. In accordance with Rule 12b-1 of the 1940 Act, the Fund has adopted separate Distribution and Service Plans for each class of shares. Certain classes pay Fidelity Distributors Company LLC (FDC), an affiliate of the investment adviser, separate Distribution and Service Fees, each of which is based on an annual percentage of each class' average net assets. In addition, FDC may pay financial intermediaries for selling shares of the Fund and providing shareholder support services. For the period, the Distribution and Service Fee rates, total fees and amounts retained by FDC were as follows:
| | Distribution Fee | Service Fee | Total Fees | Retained by FDC |
| Class A | -% | .25% | $438 | $3 |
| Class M | .25% | .25% | 111 | 1 |
| Class C | .75% | .25% | 112 | 10 |
| | | | $661 | $14 |
Sales Load. FDC may receive a front-end sales charge of up to 5.75% for selling Class A shares and 3.50% for selling Class M shares, some of which is paid to financial intermediaries for selling shares of the Fund. Depending on the holding period, FDC may receive contingent deferred sales charges levied on Class A, Class M and Class C redemptions. The deferred sales charges are 1.00% for Class C shares, 1.00% for certain purchases of Class A shares and .25% for certain purchases of Class M shares.
For the period, sales charge amounts retained by FDC were as follows:
| | Retained by FDC |
| Class A | $14 |
| Class M | 1 |
| Class C(a) | 1 |
| | $16 |
(a) When Class C shares are initially sold, FDC pays commissions from its own resources to financial intermediaries through which the sales are made.
Transfer Agent Fees. Fidelity Investments Institutional Operations Company LLC (FIIOC), an affiliate of the investment adviser, is the transfer, dividend disbursing and shareholder servicing agent for each class of the Fund. FIIOC receives account fees and asset-based fees that vary according to the account size and type of account of the shareholders of the respective classes of the Fund, except for Class K and Class Z. FIIOC receives an asset-based fee of Class K's and Class Z's average net assets. FIIOC pays for typesetting, printing and mailing of shareholder reports, except proxy statements. Effective February 1, 2020, the Board approved to change the fee for Class K and Class Z from .046% to .044%.
For the period, transfer agent fees for each applicable class were as follows:
| | Amount | % of Class-Level Average Net Assets |
| Class A | $426 | .24 |
| Class M | 53 | .24 |
| Class C | 32 | .28 |
| International Discovery | 9,946 | .15 |
| Class K | 643 | .04 |
| Class I | 683 | .17 |
| Class Z | 28 | .04 |
| | $11,811 | |
Accounting Fees. Fidelity Service Company, Inc. (FSC), an affiliate of the investment adviser, maintains the Fund's accounting records. The accounting fee is based on the level of average net assets for each month. For the period, the fees were equivalent to the following annual rates:
| | % of Average Net Assets |
| Fidelity International Discovery Fund | .02 |
Brokerage Commissions. A portion of portfolio transactions were placed with brokerage firms which are affiliates of the investment adviser. Brokerage commissions are included in net realized gain (loss) and change in net unrealized appreciation (depreciation) in the Statement of Operations. The commissions paid to these affiliated firms were as follows:
| | Amount |
| Fidelity International Discovery Fund | $9 |
Interfund Lending Program. Pursuant to an Exemptive Order issued by the SEC, the Fund, along with other registered investment companies having management contracts with Fidelity Management & Research Company LLC (FMR), or other affiliated entities of FMR, may participate in an interfund lending program. This program provides an alternative credit facility allowing the Fund to borrow from, or lend money to, other participating affiliated funds. At period end, there were no interfund loans outstanding. Activity in this program during the period for which loans were outstanding was as follows:
| | Borrower or Lender | Average Loan Balance | Weighted Average Interest Rate | Interest Expense |
| Fidelity International Discovery Fund | Borrower | $15,895 | 1.78% | $1 |
Interfund Trades. Funds may purchase from or sell securities to other Fidelity Funds under procedures adopted by the Board. The procedures have been designed to ensure these interfund trades are executed in accordance with Rule 17a-7 of the 1940 Act. Interfund trades are included within the respective purchases and sales amounts shown in the Purchases and Sales of Investments note.
Prior Fiscal Year Affiliated Redemptions In-Kind. During the prior period, 1,243 shares of the Fund were redeemed in-kind for investments and cash with a value of $50,887. The Fund had a net realized gain of $12,062 on investments delivered through in-kind redemptions. The amount of the in-kind redemptions is included in share transactions in the accompanying Statement of Changes in Net Assets as well as the Notes to Financial Statements. The Fund recognized no gain or loss for federal income tax purposes.
Other. During the period, the investment adviser reimbursed the Fund for certain losses in the amount of $23.
6. Committed Line of Credit.
Certain Funds participate with other funds managed by the investment adviser or an affiliate in a $4.25 billion credit facility (the "line of credit") to be utilized for temporary or emergency purposes to fund shareholder redemptions or for other short-term liquidity purposes. The participating funds have agreed to pay commitment fees on their pro-rata portion of the line of credit, which are reflected in Miscellaneous expenses on the Statement of Operations, and are as follows:
| | Amount |
| Fidelity International Discovery Fund | $21 |
During the period, there were no borrowings on this line of credit.
7. Security Lending.
Funds lend portfolio securities from time to time in order to earn additional income. Lending agents are used, including National Financial Services (NFS), an affiliate of the investment adviser. Pursuant to a securities lending agreement, NFS will receive a fee, which is capped at 9.9% of a fund's daily lending revenue, for its services as lending agent. A fund may lend securities to certain qualified borrowers, including NFS. On the settlement date of the loan, a fund receives collateral (in the form of U.S. Treasury obligations, letters of credit and/or cash) against the loaned securities and maintains collateral in an amount not less than 100% of the market value of the loaned securities during the period of the loan. The market value of the loaned securities is determined at the close of business of a fund and any additional required collateral is delivered to a fund on the next business day. A fund or borrower may terminate the loan at any time, and if the borrower defaults on its obligation to return the securities loaned because of insolvency or other reasons, a fund may apply collateral received from the borrower against the obligation. A fund may experience delays and costs in recovering the securities loaned. Any cash collateral received is invested in the Fidelity Securities Lending Cash Central Fund. Any loaned securities are identified as such in the Schedule of Investments, and the value of loaned securities and cash collateral at period end, as applicable, are presented in the Statement of Assets and Liabilities. Security lending income represents the income earned on investing cash collateral, less rebates paid to borrowers and any lending agent fees associated with the loan, plus any premium payments received for lending certain types of securities. Security lending income is presented in the Statement of Operations as a component of income from Fidelity Central Funds. Affiliated security lending activity, if any, was as follows:
| | Total Security Lending Income Fees Paid to NFS | Security Lending Income From Securities Loaned to NFS | Value of Securities Loaned to NFS at Period End |
| Fidelity International Discovery Fund | $–(a) | $– | $– |
(a) Amount less than five-hundred dollars.
8. Expense Reductions.
Commissions paid to certain brokers with whom the investment adviser, or its affiliates, places trades on behalf of the Fund include an amount in addition to trade execution, which may be rebated back to the Fund to offset certain expenses. This amount totaled $666 for the period. In addition, through arrangements with the Fund's custodian, credits realized as a result of certain uninvested cash balances were used to reduce the Fund's expenses. During the period, custodian credits reduced the Fund's expenses by $4.
In addition, during the period the investment adviser or an affiliate reimbursed and/or waived a portion of fund-level operating expenses in the amount of $38.
In addition, during the period the investment adviser or an affiliate reimbursed the Fund $13 for an operational error which is included in the accompanying Statement of Operations.
9. Distributions to Shareholders.
Distributions to shareholders of each class were as follows:
| | Year ended
October 31, 2020 | Year ended
October 31, 2019 |
| Distributions to shareholders | | |
| Class A | $3,793 | $5,794 |
| Class M | 430 | 790 |
| Class C | 132 | 484 |
| International Discovery | 162,657 | 224,704 |
| Class K | 39,624 | 72,802 |
| Class I | 10,816 | 19,867 |
| Class Z | 2,018 | 4,169 |
| Total | $219,470 | $328,610 |
10. Share Transactions.
Share transactions for each class were as follows and may contain automatic conversions between classes or exchanges between affiliated funds:
| | Shares | Shares | Dollars | Dollars |
| | Year ended October 31, 2020 | Year ended October 31, 2019 | Year ended October 31, 2020 | Year ended October 31, 2019 |
| Class A | | | | |
| Shares sold | 272 | 522 | $11,717 | $20,985 |
| Reinvestment of distributions | 86 | 154 | 3,755 | 5,740 |
| Shares redeemed | (851) | (1,183) | (36,666) | (47,771) |
| Net increase (decrease) | (493) | (507) | $(21,194) | $(21,046) |
| Class M | | | | |
| Shares sold | 24 | 64 | $1,052 | $2,568 |
| Reinvestment of distributions | 10 | 21 | 427 | 785 |
| Shares redeemed | (123) | (228) | (5,204) | (9,095) |
| Net increase (decrease) | (89) | (143) | $(3,725) | $(5,742) |
| Class C | | | | |
| Shares sold | 21 | 28 | $907 | $1,131 |
| Reinvestment of distributions | 3 | 13 | 129 | 478 |
| Shares redeemed | (77) | (299) | (3,294) | (11,875) |
| Net increase (decrease) | (53) | (258) | $(2,258) | $(10,266) |
| International Discovery | | | | |
| Shares sold | 16,409 | 14,442 | $717,307 | $585,326 |
| Reinvestment of distributions | 3,541 | 4,741 | 155,371 | 177,779 |
| Shares redeemed | (27,210) | (26,635) | (1,183,873) | (1,075,827) |
| Net increase (decrease) | (7,260) | (7,452) | $(311,195) | $(312,722) |
| Class K | | | | |
| Shares sold | 7,748 | 7,723 | $337,174 | $309,132 |
| Reinvestment of distributions | 906 | 1,948 | 39,624 | 72,802 |
| Shares redeemed | (14,222)(a) | (24,994)(b),(c) | (623,171)(a) | (1,014,241)(b),(c) |
| Net increase (decrease) | (5,568) | (15,323) | $(246,373) | $(632,307) |
| Class I | | | | |
| Shares sold | 2,297 | 3,057 | $86,875 | $119,482 |
| Reinvestment of distributions | 70 | 164 | 3,049 | 6,118 |
| Shares redeemed | (4,575) | (6,985) | (180,333) | (278,018) |
| Net increase (decrease) | (2,208) | (3,764) | $(90,409) | $(152,418) |
| Class Z | | | | |
| Shares sold | 226 | 656 | $9,843 | $25,184 |
| Reinvestment of distributions | 26 | 60 | 1,127 | 2,239 |
| Shares redeemed | (957) | (1,776) | (35,088) | (71,319) |
| Net increase (decrease) | (705) | (1,060) | $(24,118) | $(43,896) |
(a) Amount includes in-kind redemptions (see the Unaffiliated Redemptions In-Kind note for additional details).
(b) Amount includes in-kind redemptions (see the Prior Fiscal Year Unaffiliated Redemptions In-Kind note for additional details).
(c) Amount includes in-kind redemptions (see the Prior Fiscal Year Affiliated Redemptions In-Kind note for additional details).
11. Other.
The Fund's organizational documents provide former and current trustees and officers with a limited indemnification against liabilities arising in connection with the performance of their duties to the Fund. In the normal course of business, the Fund may also enter into contracts that provide general indemnifications. The Fund's maximum exposure under these arrangements is unknown as this would be dependent on future claims that may be made against the Fund. The risk of material loss from such claims is considered remote.
At the end of the period, Strategic Advisers International Fund and Strategic Advisers Fidelity International Fund were the owners of record of approximately 12% and 19%, respectively, of the total outstanding shares of the Fund. Mutual funds managed by the investment adviser or its affiliates were the owners of record, in the aggregate, of approximately 33% of the total outstanding shares of the Fund.
12. Coronavirus (COVID-19) Pandemic.
An outbreak of COVID-19 first detected in China during December 2019 has since spread globally and was declared a pandemic by the World Health Organization during March 2020. Developments that disrupt global economies and financial markets, such as the COVID-19 pandemic, may magnify factors that affect the Fund's performance.
Report of Independent Registered Public Accounting Firm
To the Board of Trustees of Fidelity Investment Trust and Shareholders of Fidelity International Discovery Fund
Opinion on the Financial Statements
We have audited the accompanying statement of assets and liabilities, including the schedule of investments, of Fidelity International Discovery Fund (one of the funds constituting Fidelity Investment Trust, referred to hereafter as the “Fund”) as of October 31, 2020, the related statement of operations for the year ended October 31, 2020, the statement of changes in net assets for each of the two years in the period ended October 31, 2020, including the related notes, and the financial highlights for each of the five years in the period ended October 31, 2020 (collectively referred to as the “financial statements”). In our opinion, the financial statements present fairly, in all material respects, the financial position of the Fund as of October 31, 2020, the results of its operations for the year then ended, the changes in its net assets for each of the two years in the period ended October 31, 2020 and the financial highlights for each of the five years in the period ended October 31, 2020 in conformity with accounting principles generally accepted in the United States of America.
Basis for Opinion
These financial statements are the responsibility of the Fund’s management. Our responsibility is to express an opinion on the Fund’s financial statements based on our audits. We are a public accounting firm registered with the Public Company Accounting Oversight Board (United States) (PCAOB) and are required to be independent with respect to the Fund in accordance with the U.S. federal securities laws and the applicable rules and regulations of the Securities and Exchange Commission and the PCAOB.
We conducted our audits of these financial statements in accordance with the standards of the PCAOB. Those standards require that we plan and perform the audit to obtain reasonable assurance about whether the financial statements are free of material misstatement, whether due to error or fraud.
Our audits included performing procedures to assess the risks of material misstatement of the financial statements, whether due to error or fraud, and performing procedures that respond to those risks. Such procedures included examining, on a test basis, evidence regarding the amounts and disclosures in the financial statements. Our audits also included evaluating the accounting principles used and significant estimates made by management, as well as evaluating the overall presentation of the financial statements. Our procedures included confirmation of securities owned as of October 31, 2020 by correspondence with the custodian, issuers of privately offered securities and brokers; when replies were not received from brokers, we performed other auditing procedures. We believe that our audits provide a reasonable basis for our opinion.
/s/ PricewaterhouseCoopers LLP
Boston, Massachusetts
December 14, 2020
We have served as the auditor of one or more investment companies in the Fidelity group of funds since 1932.
Trustees and Officers
The Trustees, Members of the Advisory Board (if any), and officers of the trust and fund, as applicable, are listed below. The Board of Trustees governs the fund and is responsible for protecting the interests of shareholders. The Trustees are experienced executives who meet periodically throughout the year to oversee the fund's activities, review contractual arrangements with companies that provide services to the fund, oversee management of the risks associated with such activities and contractual arrangements, and review the fund's performance. Except for Jonathan Chiel,each of the Trustees oversees 305 funds. Mr. Chiel oversees 176 funds.
The Trustees hold office without limit in time except that (a) any Trustee may resign; (b) any Trustee may be removed by written instrument, signed by at least two-thirds of the number of Trustees prior to such removal; (c) any Trustee who requests to be retired or who has become incapacitated by illness or injury may be retired by written instrument signed by a majority of the other Trustees; and (d) any Trustee may be removed at any special meeting of shareholders by a two-thirds vote of the outstanding voting securities of the trust. Each Trustee who is not an interested person (as defined in the 1940 Act) of the trust and the fund is referred to herein as an Independent Trustee. Each Independent Trustee shall retire not later than the last day of the calendar year in which his or her 75th birthday occurs. The Independent Trustees may waive this mandatory retirement age policy with respect to individual Trustees. Officers and Advisory Board Members hold office without limit in time, except that any officer or Advisory Board Member may resign or may be removed by a vote of a majority of the Trustees at any regular meeting or any special meeting of the Trustees. Except as indicated, each individual has held the office shown or other offices in the same company for the past five years.
The fund's Statement of Additional Information (SAI) includes more information about the Trustees. To request a free copy, call Fidelity at 1-800-544-8544 if you’re an individual investing directly with Fidelity, call 1-800-835-5092 if you’re a plan sponsor or participant with Fidelity as your recordkeeper or call 1-877-208-0098 on institutional accounts or if you’re an advisor or invest through one.
Experience, Skills, Attributes, and Qualifications of the Trustees. The Governance and Nominating Committee has adopted a statement of policy that describes the experience, qualifications, attributes, and skills that are necessary and desirable for potential Independent Trustee candidates (Statement of Policy). The Board believes that each Trustee satisfied at the time he or she was initially elected or appointed a Trustee, and continues to satisfy, the standards contemplated by the Statement of Policy. The Governance and Nominating Committee also engages professional search firms to help identify potential Independent Trustee candidates who have the experience, qualifications, attributes, and skills consistent with the Statement of Policy. From time to time, additional criteria based on the composition and skills of the current Independent Trustees, as well as experience or skills that may be appropriate in light of future changes to board composition, business conditions, and regulatory or other developments, have also been considered by the professional search firms and the Governance and Nominating Committee. In addition, the Board takes into account the Trustees' commitment and participation in Board and committee meetings, as well as their leadership of standing and ad hoc committees throughout their tenure.
In determining that a particular Trustee was and continues to be qualified to serve as a Trustee, the Board has considered a variety of criteria, none of which, in isolation, was controlling. The Board believes that, collectively, the Trustees have balanced and diverse experience, qualifications, attributes, and skills, which allow the Board to operate effectively in governing the fund and protecting the interests of shareholders. Information about the specific experience, skills, attributes, and qualifications of each Trustee, which in each case led to the Board's conclusion that the Trustee should serve (or continue to serve) as a trustee of the fund, is provided below.
Board Structure and Oversight Function. Robert A. Lawrence is an interested person and currently serves as Acting Chairman. The Trustees have determined that an interested Chairman is appropriate and benefits shareholders because an interested Chairman has a personal and professional stake in the quality and continuity of services provided to the fund. Independent Trustees exercise their informed business judgment to appoint an individual of their choosing to serve as Chairman, regardless of whether the Trustee happens to be independent or a member of management. The Independent Trustees have determined that they can act independently and effectively without having an Independent Trustee serve as Chairman and that a key structural component for assuring that they are in a position to do so is for the Independent Trustees to constitute a substantial majority for the Board. The Independent Trustees also regularly meet in executive session. Ned C. Lautenbach and David M. Thomas serve as Co-Lead Independent Trustees and as such each (i) acts as a liaison between the Independent Trustees and management with respect to matters important to the Independent Trustees and (ii) with management prepares agendas for Board meetings.
Fidelity® funds are overseen by different Boards of Trustees. The fund's Board oversees Fidelity's high income and certain equity funds, and other Boards oversee Fidelity's investment-grade bond, money market, asset allocation, and other equity funds. The asset allocation funds may invest in Fidelity® funds overseen by the fund's Board. The use of separate Boards, each with its own committee structure, allows the Trustees of each group of Fidelity® funds to focus on the unique issues of the funds they oversee, including common research, investment, and operational issues. On occasion, the separate Boards establish joint committees to address issues of overlapping consequences for the Fidelity® funds overseen by each Board.
The Trustees operate using a system of committees to facilitate the timely and efficient consideration of all matters of importance to the Trustees, the fund, and fund shareholders and to facilitate compliance with legal and regulatory requirements and oversight of the fund's activities and associated risks. The Board, acting through its committees, has charged FMR and its affiliates with (i) identifying events or circumstances the occurrence of which could have demonstrably adverse effects on the fund's business and/or reputation; (ii) implementing processes and controls to lessen the possibility that such events or circumstances occur or to mitigate the effects of such events or circumstances if they do occur; and (iii) creating and maintaining a system designed to evaluate continuously business and market conditions in order to facilitate the identification and implementation processes described in (i) and (ii) above. Because the day-to-day operations and activities of the fund are carried out by or through FMR, its affiliates, and other service providers, the fund's exposure to risks is mitigated but not eliminated by the processes overseen by the Trustees. While each of the Board's committees has responsibility for overseeing different aspects of the fund's activities, oversight is exercised primarily through the Operations, Audit, and Compliance Committees. Appropriate personnel, including but not limited to the fund's Chief Compliance Officer (CCO), FMR's internal auditor, the independent accountants, the fund's Treasurer and portfolio management personnel, make periodic reports to the Board's committees, as appropriate, including an annual review of Fidelity's risk management program for the Fidelity® funds. The responsibilities of each standing committee, including their oversight responsibilities, are described further under "Standing Committees of the Trustees."
Interested Trustees*:
Correspondence intended for a Trustee who is an interested person may be sent to Fidelity Investments, 245 Summer Street, Boston, Massachusetts 02210.
Name, Year of Birth; Principal Occupations and Other Relevant Experience+
Jonathan Chiel (1957)
Year of Election or Appointment: 2016
Trustee
Mr. Chiel also serves as Trustee of other Fidelity® funds. Mr. Chiel is Executive Vice President and General Counsel for FMR LLC (diversified financial services company, 2012-present). Previously, Mr. Chiel served as general counsel (2004-2012) and senior vice president and deputy general counsel (2000-2004) for John Hancock Financial Services; a partner with Choate, Hall & Stewart (1996-2000) (law firm); and an Assistant United States Attorney for the United States Attorney’s Office of the District of Massachusetts (1986-95), including Chief of the Criminal Division (1993-1995). Mr. Chiel is a director on the boards of the Boston Bar Foundation and the Maimonides School.
Robert A. Lawrence (1952)
Year of Election or Appointment: 2020
Trustee
Acting Chairman of the Board of Trustees
Mr. Lawrence also serves as Trustee of other funds. Previously, Mr. Lawrence served as a Member of the Advisory Board of certain funds. Prior to his retirement in 2008, Mr. Lawrence served as Vice President of certain Fidelity® funds (2006-2008), Senior Vice President, Head of High Income Division of Fidelity Management & Research Company (investment adviser firm, 2006-2008), and President of Fidelity Strategic Investments (investment adviser firm, 2002-2005).
* Determined to be an “Interested Trustee” by virtue of, among other things, his or her affiliation with the trust or various entities under common control with FMR.
+ The information includes the Trustee's principal occupation during the last five years and other information relating to the experience, attributes, and skills relevant to the Trustee's qualifications to serve as a Trustee, which led to the conclusion that the Trustee should serve as a Trustee for the fund.
Independent Trustees:
Correspondence intended for an Independent Trustee may be sent to Fidelity Investments, P.O. Box 55235, Boston, Massachusetts 02205-5235.
Name, Year of Birth; Principal Occupations and Other Relevant Experience+
Dennis J. Dirks (1948)
Year of Election or Appointment: 2005
Trustee
Mr. Dirks also serves as Trustee of other Fidelity® funds. Prior to his retirement in May 2003, Mr. Dirks served as Chief Operating Officer and as a member of the Board of The Depository Trust & Clearing Corporation (financial markets infrastructure), President, Chief Operating Officer and a member of the Board of The Depository Trust Company (DTC), President and a member of the Board of the National Securities Clearing Corporation (NSCC), Chief Executive Officer and a member of the Board of the Government Securities Clearing Corporation and Chief Executive Officer and a member of the Board of the Mortgage-Backed Securities Clearing Corporation. Mr. Dirks currently serves as a member of the Finance Committee (2016-present) and Board (2017-present) and is Treasurer (2018-present) of the Asolo Repertory Theatre.
Donald F. Donahue (1950)
Year of Election or Appointment: 2018
Trustee
Mr. Donahue also serves as Trustee of other Fidelity® funds. Mr. Donahue serves as President and Chief Executive Officer of Miranda Partners, LLC (risk consulting for the financial services industry, 2012-present). Previously, Mr. Donahue served as Chief Executive Officer (2006-2012), Chief Operating Officer (2003-2006) and Managing Director, Customer Marketing and Development (1999-2003) of The Depository Trust & Clearing Corporation (financial markets infrastructure). Mr. Donahue currently serves as a member (2007-present) and Co-Chairman (2016-present) of the Board of United Way of New York, a member of the Board of NYC Leadership Academy (2012-present) and a member of the Board of Advisors of Ripple Labs, Inc. (financial services, 2015-present). Mr. Donahue previously served as a member of the Advisory Board of certain Fidelity® funds (2015-2018).
Vicki L. Fuller (1957)
Year of Election or Appointment: 2020
Trustee
Ms. Fuller also serves as Trustee of other Fidelity® funds. Previously, Ms. Fuller served as a member of the Advisory Board of certain Fidelity® funds (2018-2020), Chief Investment Officer of the New York State Common Retirement Fund (2012-2018) and held a variety of positions at AllianceBernstein L.P. (global asset management, 1985-2012), including Managing Director (2006-2012) and Senior Vice President and Senior Portfolio Manager (2001-2006). Ms. Fuller currently serves as a member of the Board, Audit Committee and Nominating and Governance Committee of The Williams Companies, Inc. (natural gas infrastructure, 2018-present), as a member of the Board, Audit Committee and Nominating and Governance Committee of two Blackstone business development companies (2020-present) and as a member of the Board of Treliant, LLC (consulting, 2019-present).
Patricia L. Kampling (1959)
Year of Election or Appointment: 2020
Trustee
Ms. Kampling also serves as Trustee of other Fidelity® funds. Prior to her retirement, Ms. Kampling served as Chairman of the Board and Chief Executive Officer (2012-2019), President and Chief Operating Officer (2011-2012) and Executive Vice President and Chief Financial Officer (2010-2011) of Alliant Energy Corporation. Ms. Kampling currently serves as a member of the Board, Compensation Committee and Executive Committee and as Chair of the Audit Committee of Briggs & Stratton Corporation (manufacturing, 2011-present) and as a member of the Board, Audit, Finance and Risk Committee and Safety, Environmental, Technology and Operations Committee of American Water Works Company, Inc. (utilities company, 2019-present). In addition, Ms. Kampling currently serves as a member of the Board of the Nature Conservancy, Wisconsin Chapter (2019-present). Previously, Ms. Kampling served as a Member of the Advisory Board of certain Fidelity® funds (2020), a member of the Board of Interstate Power and Light Company (2012-2019) and Wisconsin Power and Light Company (2012-2019) (each a subsidiary of Alliant Energy Corporation) and as a member of the Board and Workforce Development Committee of the Business Roundtable (2018-2019).
Alan J. Lacy (1953)
Year of Election or Appointment: 2008
Trustee
Mr. Lacy also serves as Trustee of other Fidelity® funds. Previously, Mr. Lacy served as Senior Adviser (2007-2014) of Oak Hill Capital Partners, L.P. (private equity), Chief Executive Officer (2005) and Vice Chairman (2005-2006) of Sears Holdings Corporation (retail), Chief Executive Officer and Chairman of the Board of Sears, Roebuck and Co. (retail, 2000-2005), Chairman (2014-2017) and a member of the Board (2010-2017) of Dave & Buster’s Entertainment, Inc. (restaurant and entertainment complexes) and a member of the Board of Bristol-Myers Squibb Company (global pharmaceuticals, 2008-2020). Mr. Lacy currently serves as a Trustee of the California Chapter of The Nature Conservancy (2015-present) and a member of the Board of the Center for Advanced Study in the Behavioral Sciences at Stanford University (2015-present).
Ned C. Lautenbach (1944)
Year of Election or Appointment: 2000
Trustee
Co-Lead Independent Trustee
Mr. Lautenbach also serves as Trustee of other Fidelity® funds. Mr. Lautenbach currently serves as Chair of the Board of Governors, State University System of Florida (2013-present) and is a member of the Council on Foreign Relations (1994-present). He is also a member and has in the past served as Chairman of the Board of Directors of Artis-Naples (2012-present). Previously, Mr. Lautenbach served as a member and then Lead Director of the Board of Directors of Eaton Corporation (diversified industrial, 1997-2016). He was also a Partner at Clayton, Dubilier & Rice, LLC (private equity investment, 1998-2010); as well as Director of Sony Corporation (2006-2007). In addition, Mr. Lautenbach had a 30-year career with IBM (technology company), during which time he served as Senior Vice President and as a member of the Corporate Executive Committee (1968-1998).
Joseph Mauriello (1944)
Year of Election or Appointment: 2008
Trustee
Mr. Mauriello also serves as Trustee of other Fidelity® funds. Prior to his retirement in January 2006, Mr. Mauriello served in numerous senior management positions including Deputy Chairman and Chief Operating Officer (2004-2005), and Vice Chairman of Financial Services (2002-2004) of KPMG LLP US (professional services, 1965-2005). Mr. Mauriello currently serves as a member of the Independent Directors Council Governing Council (2015-present). Previously, Mr. Mauriello served as a member of the Board of XL Group plc. (global insurance and re-insurance, 2006-2018).
Cornelia M. Small (1944)
Year of Election or Appointment: 2005
Trustee
Ms. Small also serves as Trustee of other Fidelity® funds. Previously, Ms. Small served as Chief Investment Officer, Director of Global Equity Investments and a member of Scudder, Stevens & Clark and Scudder Kemper Investments. Ms. Small previously served as a member of the Board (2009-2019) and Chair of the Investment Committee (2010-2019) of the Teagle Foundation and a member of the Investment Committee of the Berkshire Taconic Community Foundation (2008-2019).
Garnett A. Smith (1947)
Year of Election or Appointment: 2018
Trustee
Mr. Smith also serves as Trustee of other Fidelity® funds. Prior to his retirement, Mr. Smith served as Chairman and Chief Executive Officer (1990-1997) and President (1986-1990) of Inbrand Corp. (manufacturer of personal absorbent products). Prior to his employment with Inbrand Corp., he was employed by a retail fabric chain and North Carolina National Bank (now Bank of America). Mr. Smith previously served as a member of the Advisory Board of certain Fidelity® funds (2012-2013).
David M. Thomas (1949)
Year of Election or Appointment: 2008
Trustee
Co-Lead Independent Trustee
Mr. Thomas also serves as Trustee of other Fidelity® funds. Previously, Mr. Thomas served as Executive Chairman (2005-2006) and Chairman and Chief Executive Officer (2000-2005) of IMS Health, Inc. (pharmaceutical and healthcare information solutions). Mr. Thomas currently serves as Non-Executive Chairman of the Board of Fortune Brands Home and Security (home and security products, 2011-present), and a member of the Board (2004-present) and Presiding Director (2013-present) of Interpublic Group of Companies, Inc. (marketing communication).
Susan Tomasky (1953)
Year of Election or Appointment: 2020
Trustee
Ms. Tomasky also serves as Trustee of other Fidelity® funds. Prior to her retirement, Ms. Tomasky served in various executive officer positions at American Electric Power Company, Inc. (1998-2011), including most recently as President of AEP Transmission (2007-2011). Ms. Tomasky currently serves as a member of the Board and Sustainability Committee and as Chair of the Audit Committee of Marathon Petroleum Corporation (2018-present) and as a member of the Board, Corporate Governance Committee and Organization and Compensation Committee and as Chair of the Audit Committee of Public Service Enterprise Group, Inc. (utilities company, 2012-present). In addition, Ms. Tomasky currently serves as a member of the Board of the Columbus Regional Airport Authority (2007-present), as a member of the Board of the Royal Shakespeare Company – America (2009-present), as a member of the Board of the Columbus Association for the Performing Arts (2011-present) and as a member of the Board of Kenyon College (2016-present). Previously, Ms. Tomasky served as a Member of the Advisory Board of certain Fidelity® funds (2020), a member of the Board (2011-2019) and as Lead Independent Director (2015-2018) of Andeavor Corporation (previously Tesoro Corporation) (independent oil refiner and marketer) and as a member of the Board of Summit Midstream Partners LP (energy, 2012-2018).
Michael E. Wiley (1950)
Year of Election or Appointment: 2020
Trustee
Mr. Wiley also serves as Trustee of other Fidelity® funds. Previously, Mr. Wiley served as a member of the Advisory Board of certain Fidelity® funds (2018-2020), Chairman, President and CEO of Baker Hughes, Inc. (oilfield services, 2000-2004). Mr. Wiley also previously served as a member of the Board of Andeavor Corporation (independent oil refiner and marketer, 2005-2018), a member of the Board of Andeavor Logistics LP (natural resources logistics, 2015-2018) and a member of the Board of High Point Resources (exploration and production, 2005-2020).
+ The information includes the Trustee's principal occupation during the last five years and other information relating to the experience, attributes, and skills relevant to the Trustee's qualifications to serve as a Trustee, which led to the conclusion that the Trustee should serve as a Trustee for the fund.
Advisory Board Members and Officers:
Correspondence intended for a Member of the Advisory Board (if any) may be sent to Fidelity Investments, P.O. Box 55235, Boston, Massachusetts 02205-5235. Correspondence intended for an officer or Peter S. Lynch may be sent to Fidelity Investments, 245 Summer Street, Boston, Massachusetts 02210. Officers appear below in alphabetical order.
Name, Year of Birth; Principal Occupation
Lloyd James Austin, III (1953)
Year of Election or Appointment: 2020
Member of the Advisory Board
General Austin also serves as a Member of the Advisory Board of other Fidelity® funds. Prior to his retirement, General Austin (United States Army, Retired) held a variety of positions within the U.S. Government, including Commander, U.S. Central Command (2013-2016), Vice Chief of Staff, U.S. Army (2012-2013) and Commanding General, U.S. Forces – Iraq, Operation New Dawn (2010-2012). General Austin currently serves as a Partner of Pine Island Capital Partners (private equity, 2020-present) and as President of the Austin Strategy Group LLC (consulting, 2016-present). General Austin serves as a member of the Board of Directors of Nucor Corporation (steel products, 2017-present), as a member of the Board of Directors of Tenet Healthcare Corporation (2018-present) and as a member of the Board of Directors of Raytheon Technologies Corporation (aerospace and defense, 2020-present). In addition, General Austin currently serves as a member of the Board of Trustees of the Carnegie Corporation of New York (2017-present) and as a member of the Board of Trustees of Auburn University (2017-present). Previously, General Austin served as a member of the Board of Directors of United Technologies Corporation (aerospace, defense and building, 2016-2020).
Thomas A. Kennedy (1955)
Year of Election or Appointment: 2020
Member of the Advisory Board
Mr. Kennedy also serves as a Member of the Advisory Board of other Fidelity® funds. Previously, Mr. Kennedy held a variety of positions at Raytheon Company (aerospace and defense, 1983-2020), including Chairman and Chief Executive Officer (2014-2020) and Executive Vice President and Chief Operating Officer (2013-2014). Mr. Kennedy currently serves as Executive Chairman of the Board of Directors of Raytheon Technologies Corporation (aerospace and defense, 2020-present). He is also a member of the Rutgers School of Engineering Industry Advisory Board (2011-present) and a member of the UCLA Engineering Dean’s Executive Board (2016-present).
Peter S. Lynch (1944)
Year of Election or Appointment: 2003
Member of the Advisory Board
Mr. Lynch also serves as a Member of the Advisory Board of other Fidelity® funds. Mr. Lynch is Vice Chairman and a Director of Fidelity Management & Research Company LLC (investment adviser firm). In addition, Mr. Lynch serves as a Trustee of Boston College and as the Chairman of the Inner-City Scholarship Fund. Previously, Mr. Lynch served as Vice Chairman and a Director of FMR Co., Inc. (investment adviser firm) and on the Special Olympics International Board of Directors (1997-2006).
Elizabeth Paige Baumann (1968)
Year of Election or Appointment: 2017
Anti-Money Laundering (AML) Officer
Ms. Baumann also serves as AML Officer of other funds. She is Chief AML Officer (2012-present) and Senior Vice President (2014-present) of FMR LLC (diversified financial services company) and is an employee of Fidelity Investments. Previously, Ms. Baumann served as AML Officer of certain funds (2017-2019), as AML Officer of the funds (2012-2016), and Vice President (2007-2014) and Deputy Anti-Money Laundering Officer (2007-2012) of FMR LLC.
Craig S. Brown (1977)
Year of Election or Appointment: 2019
Assistant Treasurer
Mr. Brown also serves as Assistant Treasurer of other funds. Mr. Brown is an employee of Fidelity Investments (2013-present).
John J. Burke III (1964)
Year of Election or Appointment: 2018
Chief Financial Officer
Mr. Burke also serves as Chief Financial Officer of other funds. Mr. Burke serves as Head of Investment Operations for Fidelity Fund and Investment Operations (2018-present) and is an employee of Fidelity Investments (1998-present). Previously Mr. Burke served as head of Asset Management Investment Operations (2012-2018).
William C. Coffey (1969)
Year of Election or Appointment: 2019
Assistant Secretary
Mr. Coffey also serves as Assistant Secretary of other funds. He is Senior Vice President and Deputy General Counsel of FMR LLC (diversified financial services company, 2010-present), and is an employee of Fidelity Investments. Previously, Mr. Coffey served as Secretary and CLO of certain funds (2018-2019); CLO, Secretary, and Senior Vice President of Fidelity Management & Research Company and FMR Co., Inc. (investment adviser firms, 2018-2019); Secretary of Fidelity SelectCo, LLC and Fidelity Investments Money Management, Inc. (investment adviser firms, 2018-2019); CLO of Fidelity Management & Research (Hong Kong) Limited, FMR Investment Management (UK) Limited, and Fidelity Management & Research (Japan) Limited (investment adviser firms, 2018-2019); and Assistant Secretary of certain funds (2009-2018).
Timothy M. Cohen (1969)
Year of Election or Appointment: 2018
Vice President
Mr. Cohen also serves as Vice President of other funds. Mr. Cohen serves as Co-Head of Equity (2018-present), a Director of Fidelity Management & Research (Japan) Limited (investment adviser firm, 2016-present), and is an employee of Fidelity Investments. Previously, Mr. Cohen served as Executive Vice President of Fidelity SelectCo, LLC (2019), Head of Global Equity Research (2016-2018), Chief Investment Officer - Equity and a Director of Fidelity Management & Research (U.K.) Inc. (investment adviser firm, 2013-2015) and as a Director of Fidelity Management & Research (Hong Kong) Limited (investment adviser firm, 2017).
Jonathan Davis (1968)
Year of Election or Appointment: 2010
Assistant Treasurer
Mr. Davis also serves as Assistant Treasurer of other funds. Mr. Davis serves as Assistant Treasurer of FMR Capital, Inc. (2017-present) and is an employee of Fidelity Investments. Previously, Mr. Davis served as Vice President and Associate General Counsel of FMR LLC (diversified financial services company, 2003-2010).
Laura M. Del Prato (1964)
Year of Election or Appointment: 2018
Assistant Treasurer
Ms. Del Prato also serves as an officer of other funds. Ms. Del Prato is an employee of Fidelity Investments (2017-present). Previously, Ms. Del Prato served as President and Treasurer of The North Carolina Capital Management Trust: Cash Portfolio and Term Portfolio (2018-2020). Prior to joining Fidelity Investments, Ms. Del Prato served as a Managing Director and Treasurer of the JPMorgan Mutual Funds (2014-2017). Prior to JPMorgan, Ms. Del Prato served as a partner at Cohen Fund Audit Services (accounting firm, 2012-2013) and KPMG LLP (accounting firm, 2004-2012).
Colm A. Hogan (1973)
Year of Election or Appointment: 2020
Assistant Treasurer
Mr. Hogan also serves as an officer of other funds. Mr. Hogan serves as Assistant Treasurer of FMR Capital, Inc. (2017-present) and is an employee of Fidelity Investments (2005-present). Previously, Mr. Hogan served as Deputy Treasurer of certain Fidelity® funds (2016-2020) and Assistant Treasurer of certain Fidelity® funds (2016-2018).
Pamela R. Holding (1964)
Year of Election or Appointment: 2018
Vice President
Ms. Holding also serves as Vice President of other funds. Ms. Holding serves as Co-Head of Equity (2018-present) and is an employee of Fidelity Investments (2013-present). Previously, Ms. Holding served as Executive Vice President of Fidelity SelectCo, LLC (2019) and as Chief Investment Officer of Fidelity Institutional Asset Management (2013-2018).
Cynthia Lo Bessette (1969)
Year of Election or Appointment: 2019
Secretary and Chief Legal Officer (CLO)
Ms. Lo Bessette also serves as an officer of other funds. Ms. Lo Bessette serves as CLO, Secretary, and Senior Vice President of Fidelity Management & Research Company LLC (investment adviser firm, 2019-present); and CLO of Fidelity Management & Research (Hong Kong) Limited, FMR Investment Management (UK) Limited, and Fidelity Management & Research (Japan) Limited (investment adviser firms, 2019-present). She is a Senior Vice President and Deputy General Counsel of FMR LLC (diversified financial services company, 2019-present), and is an employee of Fidelity Investments. Previously, Ms. Lo Bessette served as CLO, Secretary, and Senior Vice President of FMR Co., Inc. (investment adviser firm, 2019); Secretary of Fidelity SelectCo, LLC and Fidelity Investments Money Management, Inc. (investment adviser firms, 2019). Prior to joining Fidelity Investments, Ms. Lo Bessette was Executive Vice President, General Counsel (2016-2019) and Senior Vice President, Deputy General Counsel (2015-2016) of OppenheimerFunds (investment management company) and Deputy Chief Legal Officer (2013-2015) of Jennison Associates LLC (investment adviser firm).
Chris Maher (1972)
Year of Election or Appointment: 2020
Deputy Treasurer
Mr. Maher also serves as an officer of other funds. Mr. Maher serves as Assistant Treasurer of FMR Capital, Inc. (2017-present), and is an employee of Fidelity Investments (2008-present). Previously, Mr. Maher served as Assistant Treasurer of certain funds (2013-2020); Vice President of Asset Management Compliance (2013), Vice President of the Program Management Group of FMR (investment adviser firm, 2010-2013), and Vice President of Valuation Oversight (2008-2010).
Jason P. Pogorelec (1975)
Year of Election or Appointment: 2020
Chief Compliance Officer
Mr. Pogorelec also serves as Chief Compliance Officer of other funds. Mr. Pogorelec is a senior Vice President of Asset Management Compliance for Fidelity Investments and is an employee of Fidelity Investments (2006-present). Previously, Mr. Pogorelec served as Vice President, Associate General Counsel for Fidelity Investments (2010-2020) and Assistant Secretary of certain Fidelity funds (2015-2020).
Stacie M. Smith (1974)
Year of Election or Appointment: 2016
President and Treasurer
Ms. Smith also serves as an officer of other funds. Ms. Smith serves as Assistant Treasurer of FMR Capital, Inc. (2017-present), is an employee of Fidelity Investments (2009-present), and has served in other fund officer roles. Prior to joining Fidelity Investments, Ms. Smith served as Senior Audit Manager of Ernst & Young LLP (accounting firm, 1996-2009). Previously, Ms. Smith served as Assistant Treasurer (2013-2019) and Deputy Treasurer (2013-2016) of certain Fidelity® funds.
Marc L. Spector (1972)
Year of Election or Appointment: 2016
Assistant Treasurer
Mr. Spector also serves as an officer of other funds. Mr. Spector serves as Assistant Treasurer of FMR Capital, Inc. (2017-present) and is an employee of Fidelity Investments (2016-present). Prior to joining Fidelity Investments, Mr. Spector served as Director at the Siegfried Group (accounting firm, 2013-2016), and prior to Siegfried Group as audit senior manager at Deloitte & Touche LLP (accounting firm, 2005-2013).
Jim Wegmann (1979)
Year of Election or Appointment: 2019
Assistant Treasurer
Mr. Wegmann also serves as Assistant Treasurer of other funds. Mr. Wegmann is an employee of Fidelity Investments (2011-present).
Shareholder Expense Example
As a shareholder, you incur two types of costs: (1) transaction costs, which may include sales charges (loads) on purchase payments or redemption proceeds, as applicable and (2) ongoing costs, which generally include management fees, distribution and/or service (12b-1) fees and other Fund expenses. This Example is intended to help you understand your ongoing costs (in dollars) of investing in a fund and to compare these costs with the ongoing costs of investing in other mutual funds.
The Example is based on an investment of $1,000 invested at the beginning of the period and held for the entire period (May 1, 2020 to October 31, 2020).
Actual Expenses
The first line of the accompanying table provides information about actual account values and actual expenses. You may use the information in this line, together with the amount you invested, to estimate the expenses that you paid over the period. Simply divide your account value by $1,000.00 (for example, an $8,600 account value divided by $1,000.00 = 8.6), then multiply the result by the number in the first line for a class/Fund under the heading entitled "Expenses Paid During Period" to estimate the expenses you paid on your account during this period. If any fund is a shareholder of any underlying mutual funds or exchange-traded funds (ETFs) (the Underlying Funds), such fund indirectly bears its proportional share of the expenses of the Underlying Funds in addition to the direct expenses incurred presented in the table. These fees and expenses are not included in the annualized expense ratio used to calculate the expense estimate in the table below.
Hypothetical Example for Comparison Purposes
The second line of the accompanying table provides information about hypothetical account values and hypothetical expenses based on the actual expense ratio and an assumed rate of return of 5% per year before expenses, which is not the actual return. The hypothetical account values and expenses may not be used to estimate the actual ending account balance or expenses you paid for the period. You may use this information to compare the ongoing costs of investing in the Fund and other funds. To do so, compare this 5% hypothetical example with the 5% hypothetical examples that appear in the shareholder reports of the other funds. If any fund is a shareholder of any Underlying Funds, such fund indirectly bears its proportional share of the expenses of the Underlying Funds in addition to the direct expenses as presented in the table. These fees and expenses are not included in the annualized expense ratio used to calculate the expense estimate in the table below.
Please note that the expenses shown in the table are meant to highlight your ongoing costs only and do not reflect any transaction costs. Therefore, the second line of the table is useful in comparing ongoing costs only, and will not help you determine the relative total costs of owning different funds. In addition, if these transactional costs were included, your costs would have been higher.
| | Annualized Expense Ratio-A | Beginning
Account Value
May 1, 2020 | Ending
Account Value
October 31, 2020 | Expenses Paid
During Period-B
May 1, 2020
to October 31, 2020 |
| Fidelity International Discovery Fund | | | | |
| Class A | 1.39% | | | |
| Actual | | $1,000.00 | $1,170.90 | $7.59 |
| Hypothetical-C | | $1,000.00 | $1,018.15 | $7.05 |
| Class M | 1.64% | | | |
| Actual | | $1,000.00 | $1,169.50 | $8.94 |
| Hypothetical-C | | $1,000.00 | $1,016.89 | $8.31 |
| Class C | 2.18% | | | |
| Actual | | $1,000.00 | $1,166.50 | $11.87 |
| Hypothetical-C | | $1,000.00 | $1,014.18 | $11.04 |
| International Discovery | 1.05% | | | |
| Actual | | $1,000.00 | $1,173.20 | $5.74 |
| Hypothetical-C | | $1,000.00 | $1,019.86 | $5.33 |
| Class K | .94% | | | |
| Actual | | $1,000.00 | $1,173.60 | $5.14 |
| Hypothetical-C | | $1,000.00 | $1,020.41 | $4.77 |
| Class I | 1.07% | | | |
| Actual | | $1,000.00 | $1,173.10 | $5.84 |
| Hypothetical-C | | $1,000.00 | $1,019.76 | $5.43 |
| Class Z | .95% | | | |
| Actual | | $1,000.00 | $1,173.80 | $5.19 |
| Hypothetical-C | | $1,000.00 | $1,020.36 | $4.82 |
A Annualized expense ratio reflects expenses net of applicable fee waivers.
B Expenses are equal to the annualized expense ratio, multiplied by the average account value over the period, multiplied by 184/ 366 (to reflect the one-half year period). The fees and expenses of any Underlying Funds are not included in each annualized expense ratio.
C 5% return per year before expenses
Distributions (Unaudited)
The Board of Trustees of Fidelity International Discovery fund voted to pay to shareholders of record at the opening of business on record date, the following distributions per share derived from capital gains realized from sales of portfolio securities, and dividends derived from net investment income:
| | Pay Date | Record Date | Dividends | Capital Gains |
| Fidelity International Discovery Fund | | | | |
| Class A | 12/07/20 | 12/04/20 | $0.118 | $1.712 |
| Class M | 12/07/20 | 12/04/20 | $0.019 | $1.712 |
| Class C | 12/07/20 | 12/04/20 | $0.000 | $1.704 |
| International Discovery | 12/07/20 | 12/04/20 | $0.251 | $1.712 |
| Class K | 12/07/20 | 12/04/20 | $0.290 | $1.712 |
| Class I | 12/07/20 | 12/04/20 | $0.239 | $1.712 |
| Class Z | 12/07/20 | 12/04/20 | $0.289 | $1.712 |
|
The fund hereby designates as a capital gain dividend with respect to the taxable year ended October 31, 2020, $324,458,188, or, if subsequently determined to be different, the net capital gain of such year.
Class A, Class M, International Discovery, Class K, Class I and Class Z designate 1 % and Class C designates 3% of the dividends distributed during the fiscal year as qualifying for the dividends–received deduction for corporate shareholders.
Class A, Class M, Class C, International Discovery, Class K, Class I and Class Z designate 100% of the dividends distributed during the fiscal year as amounts which may be taken into account as a dividend for purposes of the maximum rate under section 1(h)(11) of the Internal Revenue Code.
The amounts per share which represent income derived from sources within, and taxes paid to, foreign countries or possessions of the United States are as follows:
| | Pay Date | Income | Taxes |
| Fidelity International Discovery Fund | | | |
| Class A | 12/09/2019 | 0.6875 | 0.0655 |
| Class M | 12/09/2019 | 0.5715 | 0.0655 |
| Class C | 12/09/2019 | 0.2505 | 0.0655 |
| International Discovery Fund | 12/09/2019 | 0.8445 | 0.0655 |
| Class K | 12/09/2019 | 0.8895 | 0.0655 |
| Class I | 12/09/2019 | 0.8265 | 0.0655 |
| Class Z | 12/09/2019 | 0.8885 | 0.0655 |
|
The fund will notify shareholders in January 2021 of amounts for use in preparing 2020 income tax returns.
Proxy Voting Results
A special meeting of shareholders was held on June 9, 2020. The results of votes taken among shareholders on the proposals before them are reported below. Each vote reported represents one dollar of net asset value held on the record date for the meeting.
PROPOSAL 1
To elect a Board of Trustees.
| | # of
Votes | % of
Votes |
| Dennis J. Dirks |
| Affirmative | 91,643,443,973.030 | 98.167 |
| Withheld | 1,711,119,384.419 | 1.833 |
| TOTAL | 93,354,563,357.449 | 100.000 |
| Donald F. Donahue |
| Affirmative | 91,659,003,496.045 | 98.184 |
| Withheld | 1,695,559,852.789 | 1.816 |
| TOTAL | 93,354,563,357.449 | 100.000 |
| Bettina Doulton |
| Affirmative | 91,774,146,516.145 | 98.307 |
| Withheld | 1,580,416,862.377 | 1.693 |
| TOTAL | 93,354,563,357.449 | 100.000 |
| Vicki L. Fuller |
| Affirmative | 91,845,419,368.993 | 98.383 |
| Withheld | 1,509,143,998.591 | 1.617 |
| TOTAL | 93,354,563,357.449 | 100.00 |
| Patricia L. Kampling |
| Affirmative | 91,723,732,274.457 | 98.253 |
| Withheld | 1,630,831,098.411 | 1.747 |
| TOTAL | 93,354,563,357.449 | 100.000 |
| Alan J. Lacy |
| Affirmative | 91,490,319,407.772 | 98.003 |
| Withheld | 1,864,243,948.299 | 1.997 |
| TOTAL | 93,354,563,357.449 | 100.000 |
| Ned C. Lautenbach |
| Affirmative | 91,285,367,239.075 | 97.784 |
| Withheld | 2,069,196,119.052 | 2.216 |
| TOTAL | 93,354,563,357.449 | 100.000 |
| Robert A. Lawrence |
| Affirmative | 91,556,271,429.466 | 98.074 |
| Withheld | 1,798,291,912.707 | 1.926 |
| TOTAL | 93,354,563,357.449 | 100.000 |
| Joseph Mauriello |
| Affirmative | 91,497,480,147.082 | 98.011 |
| Withheld | 1,857,083,211.045 | 1.989 |
| TOTAL | 93,354,563,357.449 | 100.000 |
| Cornelia M. Small |
| Affirmative | 91,606,808,161.438 | 98.128 |
| Withheld | 1,747,755,220.497 | 1.872 |
| TOTAL | 93,354,563,357.449 | 100.000 |
| Garnett A. Smith |
| Affirmative | 91,505,784,053.038 | 98.020 |
| Withheld | 1,848,779,305.090 | 1.980 |
| TOTAL | 93,354,563,357.449 | 100.000 |
| David M. Thomas |
| Affirmative | 91,536,969,704.881 | 98.053 |
| Withheld | 1,817,593,630.919 | 1.947 |
| TOTAL | 93,354,563,357.449 | 100.000 |
| Susan Tomasky |
| Affirmative | 91,697,125,678.165 | 98.225 |
| Withheld | 1,657,437,703.277 | 1.775 |
| TOTAL | 93,354,563,357.449 | 100.000 |
| Michael E. Wiley |
| Affirmative | 91,506,805,575.815 | 98.021 |
| Withheld | 1,847,757,759.985 | 1.979 |
| TOTAL | 93,354,563,357.449 | 100.000 |
PROPOSAL 2
To convert a fundamental investment policy to a non-fundamental investment policy.
| | # of
Votes | % of
Votes |
| Affirmative | 2,829,642,448.733 | 60.988 |
| Against | 1,321,421,649.765 | 28.481 |
| Abstain | 378,426,001.590 | 8.156 |
| Broker Non-Vote | 110,160,981.036 | 2.374 |
| TOTAL | 4,639,651,081.124 | 100.000 |
PROPOSAL 5
A shareholder proposal to institute procedures to avoid holding investments in companies that contribute to genocide or crimes against humanity.
| | # of
Votes | % of
Votes |
| Affirmative | 1,135,323,469.370 | 24.470 |
| Against | 3,141,555,400.577 | 67.711 |
| Abstain | 248,012,762.335 | 5.346 |
| Broker Non-Vote | 114,759,448.841 | 2.473 |
| TOTAL | 4,639,651,081.124 | 100.000 |
| Proposal 1 reflects trust wide proposal and voting results. |
| Proposals 2 and 5 were not approved by shareholders. |
IGI-ANN-1220
1.807258.116
Fidelity's Broadly Diversified International Equity Funds
Fidelity® Diversified International Fund
Fidelity® International Capital Appreciation Fund
Fidelity® Overseas Fund
Fidelity® Worldwide Fund
Annual Report
October 31, 2020
Includes Fidelity and Fidelity Advisor share classes
See the inside front cover for important information about access to your fund’s shareholder reports.
Beginning on January 1, 2021, as permitted by regulations adopted by the Securities and Exchange Commission, paper copies of a fund’s shareholder reports will no longer be sent by mail, unless you specifically request paper copies of the reports from the fund or from your financial intermediary, such as a financial advisor, broker-dealer or bank. Instead, the reports will be made available on a website, and you will be notified by mail each time a report is posted and provided with a website link to access the report.
If you already elected to receive shareholder reports electronically, you will not be affected by this change and you need not take any action. You may elect to receive shareholder reports and other communications from a fund electronically, by contacting your financial intermediary. For Fidelity customers, visit Fidelity's web site or call Fidelity using the contact information listed below.
You may elect to receive all future reports in paper free of charge. If you wish to continue receiving paper copies of your shareholder reports, you may contact your financial intermediary or, if you are a Fidelity customer, visit Fidelity’s website, or call Fidelity at the applicable toll-free number listed below. Your election to receive reports in paper will apply to all funds held with the fund complex/your financial intermediary.
| Account Type | Website | Phone Number |
| Brokerage, Mutual Fund, or Annuity Contracts: | fidelity.com/mailpreferences | 1-800-343-3548 |
| Employer Provided Retirement Accounts: | netbenefits.fidelity.com/preferences (choose 'no' under Required Disclosures to continue to print) | 1-800-343-0860 |
| Advisor Sold Accounts Serviced Through Your Financial Intermediary: | Contact Your Financial Intermediary | Your Financial Intermediary's phone number |
| Advisor Sold Accounts Serviced by Fidelity: | institutional.fidelity.com | 1-877-208-0098 |
Contents
To view a fund's proxy voting guidelines and proxy voting record for the 12-month period ended June 30, visit http://www.fidelity.com/proxyvotingresults or visit the Securities and Exchange Commission's (SEC) web site at http://www.sec.gov.
You may also call 1-800-544-8544 if you’re an individual investing directly with Fidelity, call 1-800-835-5092 if you’re a plan sponsor or participant with Fidelity as your recordkeeper or call 1-877-208-0098 on institutional accounts or if you’re an advisor or invest through one to request a free copy of the proxy voting guidelines.
Standard & Poor's, S&P and S&P 500 are registered service marks of The McGraw-Hill Companies, Inc. and have been licensed for use by Fidelity Distributors Corporation.
Other third-party marks appearing herein are the property of their respective owners.
All other marks appearing herein are registered or unregistered trademarks or service marks of FMR LLC or an affiliated company. © 2020 FMR LLC. All rights reserved.
This report and the financial statements contained herein are submitted for the general information of the shareholders of the Funds. This report is not authorized for distribution to prospective investors in the Funds unless preceded or accompanied by an effective prospectus.
A fund files its complete schedule of portfolio holdings with the SEC for the first and third quarters of each fiscal year on Form N-PORT. Forms N-PORT are available on the SEC’s web site at http://www.sec.gov. A fund's Forms N-PORT may be reviewed and copied at the SEC’s Public Reference Room in Washington, DC. Information regarding the operation of the SEC's Public Reference Room may be obtained by calling 1-800-SEC-0330.
For a complete list of a fund's portfolio holdings, view the most recent holdings listing, semiannual report, or annual report on Fidelity's web site at http://www.fidelity.com, http://www.institutional.fidelity.com, or http://www.401k.com, as applicable.
NOT FDIC INSURED •MAY LOSE VALUE •NO BANK GUARANTEE
Neither the Funds nor Fidelity Distributors Corporation is a bank.
Note to Shareholders:
Early in 2020, the outbreak and spread of a new coronavirus emerged as a public health emergency that had a major influence on financial markets, primarily based on its impact on the global economy and the outlook for corporate earnings. The virus causes a respiratory disease known as COVID-19. On March 11, the World Health Organization declared the COVID-19 outbreak a pandemic, citing sustained risk of further global spread.
In the weeks following, as the crisis worsened, we witnessed an escalating human tragedy with wide-scale social and economic consequences from coronavirus-containment measures. The outbreak of COVID-19 prompted a number of measures to limit the spread, including travel and border restrictions, quarantines, and restrictions on large gatherings. In turn, these resulted in lower consumer activity, diminished demand for a wide range of products and services, disruption in manufacturing and supply chains, and – given the wide variability in outcomes regarding the outbreak – significant market uncertainty and volatility. Amid the turmoil, global governments and central banks took unprecedented action to help support consumers, businesses, and the broader economies, and to limit disruption to financial systems.
The situation continues to unfold, and the extent and duration of its impact on financial markets and the economy remain highly uncertain. Extreme events such as the coronavirus crisis are “exogenous shocks” that can have significant adverse effects on mutual funds and their investments. Although multiple asset classes may be affected by market disruption, the duration and impact may not be the same for all types of assets.
Fidelity is committed to helping you stay informed amid news about COVID-19 and during increased market volatility, and we’re taking extra steps to be responsive to customer needs. We encourage you to visit our websites, where we offer ongoing updates, commentary, and analysis on the markets and our funds.
Fidelity® Diversified International Fund
Performance: The Bottom Line
Average annual total return reflects the change in the value of an investment, assuming reinvestment of distributions from dividend income and capital gains (the profits earned upon the sale of securities that have grown in value, if any) and assuming a constant rate of performance each year. The hypothetical investment and the average annual total returns do not reflect the deduction of taxes that a shareholder would pay on fund distributions or the redemption of fund shares. During periods of reimbursement by Fidelity, a fund’s total return will be greater than it would be had the reimbursement not occurred. How a fund did yesterday is no guarantee of how it will do tomorrow.
Average Annual Total Returns
| For the periods ended October 31, 2020 | Past 1 year | Past 5 years | Past 10 years |
| Fidelity® Diversified International Fund | 9.07% | 6.29% | 6.32% |
| Class K | 9.22% | 6.42% | 6.46% |
$10,000 Over 10 Years
Let's say hypothetically that $10,000 was invested in Fidelity® Diversified International Fund, a class of the fund, on October 31, 2010.
The chart shows how the value of your investment would have changed, and also shows how the MSCI EAFE Index performed over the same period.

| Period Ending Values |
| $18,449 | Fidelity® Diversified International Fund |
| $14,800 | MSCI EAFE Index |
Fidelity® Diversified International Fund
Management's Discussion of Fund Performance
Market Recap: The MSCI ACWI (All Country World Index) ex USA Index returned -2.46% for the 12 months ending October 31, 2020, in what was a bumpy ride for non-U.S. equities, marked by a steep but brief decline due to the early-2020 outbreak and spread of the coronavirus, followed by a sharp upturn. Declared a pandemic on March 11, the crisis and containment efforts caused broad contraction in economic activity, elevated volatility and dislocation in financial markets. A historically rapid and expansive monetary- and fiscal-policy response around the world provided a partial offset to the economic disruption. Other supporting factors included resilient corporate earnings and near-term potential for a COVID-19 vaccine breakthrough. This was evident in the index’s 12.28% gain in the final six months of the year. Currency fluctuation generally boosted foreign developed-markets equities for the year, while the reverse was true for emerging-markets stocks. Late in the period, the index was pressured by a second wave of COVID-19 cases in some regions, and stretched valuations and crowded positioning in big tech. For the full year, the U.K. (-22%), Asia Pacific ex Japan (-8%), Canada (-5%) and Europe ex U.K. (-4%) notably lagged. Emerging markets (+9%) and Japan (+1%) outperformed. By sector, energy (-38%), financials and real estate (-20% each) lagged, whereas information technology (+ 25%) and communication services (+15%) topped the index.
Comments from Portfolio Manager Bill Bower: For the fiscal year ending October 31, 2020, the fund's share classes gained about 9%, outperforming the -6.69% result of the benchmark MSCI EAFE Index. From a regional standpoint, stock picks in Europe ex U.K. and an overweighting and security selection in emerging markets, specifically China, contributed most to the fund's relative result. Versus the benchmark, security selection was the primary contributor, especially within the industrials sector. Strong picks in consumer discretionary also helped, as did choices in communication services, especially within the media & entertainment industry. Not owning Royal Dutch Shell, a benchmark component that returned -55%, was the biggest individual relative contributor versus the benchmark. Another key contributor was our out-of-benchmark position in Tencent Holdings (+87%). The fund's non-benchmark stake in Alibaba Group Holding gained roughly 72%. Conversely, an underweighting in Japan hindered the fund's relative result. By sector, the primary detractor from performance versus the benchmark was an underweighting in utilities. An underweighting in the consumer staples sector, as well as stock picks within the household & personal products industry, also hindered relative performance. The fund's biggest individual relative detractor was an underweighting in Nestle, which gained 8% the past year. The company was still among the fund's largest holdings at period end. Also hindering performance was our lighter-than-benchmark stake in SoftBank Group, which gained 69%. Softbank was not held at period end. The fund's non-benchmark stake in Axis Bank, a position not held at period end, returned -57%. Notable changes in positioning include increased exposure to Switzerland and a lower allocation to Netherlands. By sector, meaningful changes in positioning include increased exposure to communication services and a lower allocation to financials.
The views expressed above reflect those of the portfolio manager(s) only through the end of the period as stated on the cover of this report and do not necessarily represent the views of Fidelity or any other person in the Fidelity organization. Any such views are subject to change at any time based upon market or other conditions and Fidelity disclaims any responsibility to update such views. These views may not be relied on as investment advice and, because investment decisions for a Fidelity fund are based on numerous factors, may not be relied on as an indication of trading intent on behalf of any Fidelity fund.
Fidelity® Diversified International Fund
Investment Summary (Unaudited)
Geographic Diversification (% of fund's net assets)
| As of October 31, 2020 |
| | Japan | 19.3% |
| | United States of America* | 9.8% |
| | Germany | 8.8% |
| | Switzerland | 8.7% |
| | United Kingdom | 7.5% |
| | France | 7.2% |
| | Netherlands | 5.8% |
| | Cayman Islands | 4.7% |
| | India | 3.5% |
| | Other | 24.7% |
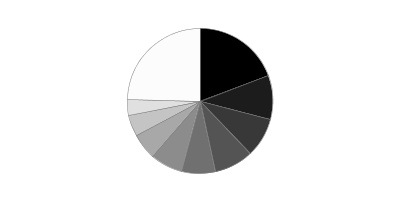
* Includes Short-Term investments and Net Other Assets (Liabilities).
Percentages are based on country or territory of incorporation and are adjusted for the effect of futures contracts, if applicable.
Asset Allocation as of October 31, 2020
| | % of fund's net assets |
| Stocks | 95.2 |
| Short-Term Investments and Net Other Assets (Liabilities) | 4.8 |
Top Ten Stocks as of October 31, 2020
| | % of fund's net assets |
| Nestle SA (Reg. S) (Switzerland, Food Products) | 2.8 |
| Roche Holding AG (participation certificate) (Switzerland, Pharmaceuticals) | 2.5 |
| ASML Holding NV (Netherlands, Semiconductors & Semiconductor Equipment) | 2.4 |
| Hoya Corp. (Japan, Health Care Equipment & Supplies) | 1.9 |
| Keyence Corp. (Japan, Electronic Equipment & Components) | 1.8 |
| SAP SE (Germany, Software) | 1.6 |
| Sony Corp. (Japan, Household Durables) | 1.6 |
| AIA Group Ltd. (Hong Kong, Insurance) | 1.6 |
| Reliance Industries Ltd. (India, Oil, Gas & Consumable Fuels) | 1.6 |
| London Stock Exchange Group PLC (United Kingdom, Capital Markets) | 1.5 |
| | 19.3 |
Top Market Sectors as of October 31, 2020
| | % of fund's net assets |
| Information Technology | 16.6 |
| Industrials | 15.4 |
| Health Care | 14.4 |
| Financials | 11.8 |
| Consumer Discretionary | 11.4 |
| Consumer Staples | 8.6 |
| Materials | 5.6 |
| Communication Services | 5.6 |
| Utilities | 2.7 |
| Energy | 1.7 |
Fidelity® Diversified International Fund
Schedule of Investments October 31, 2020
Showing Percentage of Net Assets
| Common Stocks - 95.0% | | | |
| | | Shares | Value |
| Australia - 0.8% | | | |
| Aristocrat Leisure Ltd. | | 1,677,601 | $33,781,401 |
| CSL Ltd. | | 351,066 | 71,075,892 |
|
| TOTAL AUSTRALIA | | | 104,857,293 |
|
| Bailiwick of Jersey - 1.2% | | | |
| Experian PLC | | 2,446,208 | 89,614,135 |
| Ferguson PLC | | 705,218 | 70,042,939 |
|
| TOTAL BAILIWICK OF JERSEY | | | 159,657,074 |
|
| Belgium - 0.9% | | | |
| KBC Groep NV | | 1,480,253 | 72,975,931 |
| UCB SA | | 536,743 | 52,947,472 |
|
| TOTAL BELGIUM | | | 125,923,403 |
|
| Bermuda - 1.5% | | | |
| Credicorp Ltd. (United States) | | 232,718 | 26,688,100 |
| Hiscox Ltd. (a) | | 2,780,610 | 29,697,198 |
| IHS Markit Ltd. | | 947,950 | 76,660,717 |
| Marvell Technology Group Ltd. | | 1,705,936 | 63,989,659 |
|
| TOTAL BERMUDA | | | 197,035,674 |
|
| Canada - 2.2% | | | |
| Alimentation Couche-Tard, Inc. Class B (sub. vtg.) | | 2,776,611 | 85,509,532 |
| Constellation Software, Inc. | | 60,974 | 64,007,826 |
| Fairfax India Holdings Corp. (a)(b) | | 2,015,283 | 15,416,915 |
| Franco-Nevada Corp. | | 408,472 | 55,673,970 |
| Wheaton Precious Metals Corp. | | 1,435,330 | 65,868,105 |
|
| TOTAL CANADA | | | 286,476,348 |
|
| Cayman Islands - 4.7% | | | |
| Alibaba Group Holding Ltd. sponsored ADR (a) | | 625,282 | 190,517,173 |
| Anta Sports Products Ltd. | | 4,412,719 | 48,552,716 |
| JD.com, Inc. Class A | | 896,039 | 36,548,103 |
| KE Holdings, Inc. ADR (a) | | 582,936 | 40,659,786 |
| Li Ning Co. Ltd. | | 2,763,500 | 14,258,626 |
| New Oriental Education & Technology Group, Inc. sponsored ADR (a) | | 350,894 | 56,276,380 |
| Tencent Holdings Ltd. | | 2,563,274 | 195,848,626 |
| Zai Lab Ltd. ADR (a) | | 444,523 | 36,473,112 |
|
| TOTAL CAYMAN ISLANDS | | | 619,134,522 |
|
| China - 0.7% | | | |
| Kweichow Moutai Co. Ltd. (A Shares) | | 393,927 | 98,531,812 |
| Denmark - 2.6% | | | |
| DSV Panalpina A/S | | 921,695 | 149,241,916 |
| GN Store Nord A/S | | 351,045 | 25,246,462 |
| ORSTED A/S (b) | | 833,694 | 132,318,924 |
| Vestas Wind Systems A/S | | 229,736 | 39,414,431 |
|
| TOTAL DENMARK | | | 346,221,733 |
|
| France - 7.2% | | | |
| Amundi SA (b) | | 918,863 | 60,249,658 |
| Capgemini SA | | 762,220 | 88,008,513 |
| Dassault Systemes SA | | 263,151 | 44,914,470 |
| Legrand SA | | 998,684 | 73,834,687 |
| LVMH Moet Hennessy Louis Vuitton SE | | 414,361 | 194,230,749 |
| Pernod Ricard SA | | 555,072 | 89,470,701 |
| Sanofi SA | | 2,005,666 | 181,098,394 |
| Sartorius Stedim Biotech | | 81,960 | 31,080,055 |
| SR Teleperformance SA | | 447,463 | 134,297,206 |
| Worldline SA (a)(b) | | 713,497 | 52,883,203 |
|
| TOTAL FRANCE | | | 950,067,636 |
|
| Germany - 8.8% | | | |
| adidas AG | | 480,267 | 142,632,454 |
| Allianz SE | | 604,746 | 106,394,190 |
| Deutsche Borse AG | | 615,368 | 90,553,571 |
| Deutsche Post AG | | 2,694,292 | 119,365,988 |
| Hannover Reuck SE | | 476,473 | 69,199,057 |
| Linde PLC | | 668,909 | 146,616,243 |
| RWE AG | | 2,127,389 | 78,764,925 |
| SAP SE | | 2,036,911 | 217,307,125 |
| Symrise AG | | 715,312 | 88,182,377 |
| Vonovia SE | | 1,569,544 | 100,209,283 |
|
| TOTAL GERMANY | | | 1,159,225,213 |
|
| Hong Kong - 2.0% | | | |
| AIA Group Ltd. | | 22,295,598 | 212,191,139 |
| Techtronic Industries Co. Ltd. | | 4,379,769 | 58,415,752 |
|
| TOTAL HONG KONG | | | 270,606,891 |
|
| India - 3.5% | | | |
| HDFC Bank Ltd. | | 6,088,894 | 96,662,090 |
| Housing Development Finance Corp. Ltd. | | 2,697,247 | 69,560,006 |
| Kotak Mahindra Bank Ltd. (a) | | 3,782,705 | 78,471,009 |
| Reliance Industries Ltd. | | 499,134 | 7,907,334 |
| Reliance Industries Ltd. | | 7,487,012 | 206,343,701 |
|
| TOTAL INDIA | | | 458,944,140 |
|
| Indonesia - 0.7% | | | |
| PT Bank Central Asia Tbk | | 28,856,238 | 56,779,144 |
| PT Bank Rakyat Indonesia Tbk | | 163,636,090 | 37,042,627 |
|
| TOTAL INDONESIA | | | 93,821,771 |
|
| Ireland - 1.9% | | | |
| Aon PLC | | 319,483 | 58,788,067 |
| DCC PLC (United Kingdom) | | 81,936 | 5,332,880 |
| Kerry Group PLC Class A | | 466,871 | 55,842,232 |
| Kingspan Group PLC (Ireland) | | 806,070 | 70,268,388 |
| Ryanair Holdings PLC (a) | | 465,300 | 6,411,503 |
| Ryanair Holdings PLC sponsored ADR (a) | | 621,199 | 50,068,639 |
|
| TOTAL IRELAND | | | 246,711,709 |
|
| Italy - 1.5% | | | |
| Enel SpA | | 8,490,280 | 67,502,014 |
| FinecoBank SpA | | 3,170,452 | 43,386,486 |
| GVS SpA (b) | | 1,035,990 | 14,599,446 |
| Recordati SpA | | 1,174,307 | 60,847,044 |
| Reply SpA | | 171,603 | 18,446,841 |
|
| TOTAL ITALY | | | 204,781,831 |
|
| Japan - 19.3% | | | |
| Astellas Pharma, Inc. | | 1,542,017 | 21,145,588 |
| Bandai Namco Holdings, Inc. | | 861,803 | 64,406,667 |
| Daikin Industries Ltd. | | 702,761 | 131,509,956 |
| Fast Retailing Co. Ltd. | | 65,505 | 45,692,480 |
| Hoya Corp. | | 2,222,139 | 250,783,803 |
| Iriso Electronics Co. Ltd. | | 196,307 | 7,474,250 |
| Itochu Corp. | | 4,363,011 | 104,793,069 |
| Kao Corp. | | 1,396,842 | 99,453,350 |
| Keyence Corp. | | 522,527 | 237,134,508 |
| KH Neochem Co. Ltd. | | 648,064 | 15,164,924 |
| Minebea Mitsumi, Inc. | | 6,774,319 | 122,353,410 |
| Misumi Group, Inc. | | 1,438,709 | 42,729,044 |
| Murata Manufacturing Co. Ltd. | | 733,105 | 51,411,674 |
| Nabtesco Corp. | | 566,783 | 21,174,018 |
| Nexon Co. Ltd. | | 775,620 | 21,617,236 |
| Nintendo Co. Ltd. | | 72,100 | 38,983,662 |
| Nitori Holdings Co. Ltd. | | 551,739 | 113,413,637 |
| NOF Corp. | | 366,244 | 13,764,302 |
| Oracle Corp. Japan | | 269,538 | 26,937,653 |
| ORIX Corp. | | 4,057,293 | 47,451,003 |
| PALTAC Corp. | | 200,766 | 11,224,343 |
| Park24 Co. Ltd. | | 157,087 | 2,121,909 |
| Persol Holdings Co., Ltd. | | 2,711,853 | 41,074,272 |
| Recruit Holdings Co. Ltd. | | 2,448,990 | 93,185,726 |
| Relo Group, Inc. | | 539,902 | 12,956,987 |
| Shin-Etsu Chemical Co. Ltd. | | 1,027,847 | 137,286,284 |
| Shiseido Co. Ltd. | | 425,018 | 26,311,600 |
| SMC Corp. | | 248,429 | 132,140,791 |
| Sony Corp. | | 2,557,782 | 213,233,285 |
| Tokyo Electron Ltd. | | 421,911 | 113,245,499 |
| Tsuruha Holdings, Inc. | | 817,745 | 114,504,775 |
| Welcia Holdings Co. Ltd. | | 2,017,814 | 79,080,810 |
| Z Holdings Corp. | | 13,075,666 | 91,177,405 |
|
| TOTAL JAPAN | | | 2,544,937,920 |
|
| Korea (South) - 1.8% | | | |
| LG Chemical Ltd. | | 89,398 | 48,640,106 |
| Samsung Electronics Co. Ltd. | | 2,194,620 | 110,071,925 |
| SK Hynix, Inc. | | 1,060,920 | 75,099,587 |
|
| TOTAL KOREA (SOUTH) | | | 233,811,618 |
|
| Luxembourg - 1.3% | | | |
| B&M European Value Retail SA | | 18,921,214 | 118,836,274 |
| Eurofins Scientific SA (a) | | 41,372 | 32,948,151 |
| Globant SA (a) | | 109,234 | 19,728,753 |
|
| TOTAL LUXEMBOURG | | | 171,513,178 |
|
| Netherlands - 5.8% | | | |
| Adyen BV (a)(b) | | 20,527 | 34,500,633 |
| ASML Holding NV | | 894,255 | 323,013,849 |
| IMCD NV | | 94,500 | 10,946,510 |
| JDE Peet's BV | | 1,019,691 | 36,340,043 |
| Koninklijke Philips Electronics NV | | 2,616,764 | 121,200,071 |
| NXP Semiconductors NV | | 921,146 | 124,465,248 |
| Wolters Kluwer NV | | 1,417,878 | 114,899,653 |
|
| TOTAL NETHERLANDS | | | 765,366,007 |
|
| New Zealand - 0.4% | | | |
| Ryman Healthcare Group Ltd. | | 5,200,194 | 48,123,008 |
| Norway - 1.2% | | | |
| Adevinta ASA Class B (a) | | 3,241,013 | 50,075,096 |
| NEL ASA (a)(c) | | 8,223,863 | 15,574,829 |
| Schibsted ASA (A Shares) | | 2,281,543 | 93,014,464 |
|
| TOTAL NORWAY | | | 158,664,389 |
|
| Spain - 1.7% | | | |
| Cellnex Telecom SA (b) | | 2,182,114 | 140,081,916 |
| Iberdrola SA | | 7,079,479 | 83,481,791 |
|
| TOTAL SPAIN | | | 223,563,707 |
|
| Sweden - 1.2% | | | |
| Hexagon AB (B Shares) | | 1,014,617 | 74,160,175 |
| Indutrade AB (a) | | 1,345,758 | 68,267,909 |
| Svenska Handelsbanken AB (A Shares) (a) | | 2,469,422 | 20,008,950 |
|
| TOTAL SWEDEN | | | 162,437,034 |
|
| Switzerland - 8.7% | | | |
| Dufry AG (a)(c) | | 923,804 | 34,959,375 |
| Idorsia Ltd. (a) | | 240,480 | 6,304,749 |
| Lonza Group AG | | 210,097 | 127,299,916 |
| Nestle SA (Reg. S) | | 3,304,417 | 371,674,002 |
| Roche Holding AG (participation certificate) | | 1,027,522 | 330,175,222 |
| Sika AG | | 691,749 | 170,268,553 |
| Sonova Holding AG Class B | | 209,467 | 49,685,449 |
| Straumann Holding AG | | 12,868 | 13,416,007 |
| Swiss Re Ltd. | | 574,628 | 41,197,497 |
|
| TOTAL SWITZERLAND | | | 1,144,980,770 |
|
| Taiwan - 1.1% | | | |
| Taiwan Semiconductor Manufacturing Co. Ltd. sponsored ADR | | 1,685,509 | 141,363,640 |
| United Kingdom - 7.5% | | | |
| AstraZeneca PLC (United Kingdom) | | 1,858,788 | 186,632,542 |
| Beazley PLC | | 5,301,402 | 20,191,821 |
| Big Yellow Group PLC | | 2,164,163 | 30,840,405 |
| Compass Group PLC | | 1,920,937 | 26,293,301 |
| John David Group PLC | | 2,228,138 | 21,395,129 |
| London Stock Exchange Group PLC | | 1,868,948 | 201,468,713 |
| Ocado Group PLC (a) | | 2,201,187 | 64,903,275 |
| Prudential PLC | | 5,693,963 | 69,640,033 |
| Reckitt Benckiser Group PLC | | 838,747 | 73,883,997 |
| RELX PLC (Euronext N.V.) | | 5,645,373 | 111,805,896 |
| Rentokil Initial PLC (a) | | 11,621,597 | 79,193,397 |
| S4 Capital PLC (a) | | 2,539,704 | 13,160,746 |
| Smith & Nephew PLC | | 3,168,514 | 55,018,520 |
| THG Holdings Ltd. | | 3,360,300 | 28,714,160 |
|
| TOTAL UNITED KINGDOM | | | 983,141,935 |
|
| United States of America - 4.8% | | | |
| Alphabet, Inc. Class C (a) | | 45,097 | 73,102,688 |
| Danaher Corp. | | 205,844 | 47,249,432 |
| IQVIA Holdings, Inc. (a) | | 464,366 | 71,507,720 |
| Marsh & McLennan Companies, Inc. | | 613,559 | 63,478,814 |
| MasterCard, Inc. Class A | | 321,324 | 92,746,959 |
| Microsoft Corp. | | 333,019 | 67,426,357 |
| NICE Systems Ltd. sponsored ADR (a) | | 270,580 | 61,762,591 |
| Regeneron Pharmaceuticals, Inc. (a) | | 95,887 | 52,120,338 |
| Visa, Inc. Class A | | 536,113 | 97,417,093 |
|
| TOTAL UNITED STATES OF AMERICA | | | 626,811,992 |
|
| TOTAL COMMON STOCKS | | | |
| (Cost $8,227,093,911) | | | 12,526,712,248 |
|
| Convertible Preferred Stocks - 0.2% | | | |
| United States of America - 0.2% | | | |
| Rivian Automotive, Inc. Series E (d)(e) | | | |
| (Cost $19,081,790) | | 1,231,878 | 19,081,790 |
|
| Money Market Funds - 4.7% | | | |
| Fidelity Cash Central Fund 0.10% (f) | | 599,182,944 | 599,302,780 |
| Fidelity Securities Lending Cash Central Fund 0.11% (f)(g) | | 18,708,310 | 18,710,181 |
| TOTAL MONEY MARKET FUNDS | | | |
| (Cost $617,985,931) | | | 618,012,961 |
| TOTAL INVESTMENT IN SECURITIES - 99.9% | | | |
| (Cost $8,864,161,632) | | | 13,163,806,999 |
| NET OTHER ASSETS (LIABILITIES) - 0.1% | | | 16,651,940 |
| NET ASSETS - 100% | | | $13,180,458,939 |
Categorizations in the Schedule of Investments are based on country or territory of incorporation.
Legend
(a) Non-income producing
(b) Security exempt from registration under Rule 144A of the Securities Act of 1933. These securities may be resold in transactions exempt from registration, normally to qualified institutional buyers. At the end of the period, the value of these securities amounted to $450,050,695 or 3.4% of net assets.
(c) Security or a portion of the security is on loan at period end.
(d) Restricted securities (including private placements) - Investment in securities not registered under the Securities Act of 1933 (excluding 144A issues). At the end of the period, the value of restricted securities (excluding 144A issues) amounted to $19,081,790 or 0.2% of net assets.
(e) Level 3 security
(f) Affiliated fund that is generally available only to investment companies and other accounts managed by Fidelity Investments. The rate quoted is the annualized seven-day yield of the fund at period end. A complete unaudited listing of the fund's holdings as of its most recent quarter end is available upon request. In addition, each Fidelity Central Fund's financial statements, which are not covered by the Fund's Report of Independent Registered Public Accounting Firm, are available on the SEC's website or upon request.
(g) Investment made with cash collateral received from securities on loan.
Additional information on each restricted holding is as follows:
| Security | Acquisition Date | Acquisition Cost |
| Rivian Automotive, Inc. Series E | 7/10/20 | $19,081,790 |
Affiliated Central Funds
Information regarding fiscal year to date income earned by the Fund from investments in Fidelity Central Funds is as follows:
| Fund | Income earned |
| Fidelity Cash Central Fund | $2,529,902 |
| Fidelity Securities Lending Cash Central Fund | 671,885 |
| Total | $3,201,787 |
Amounts in the income column in the above table include any capital gain distributions from underlying funds, which are presented in the corresponding line-item in the Statement of Operations, if applicable. Amount for Fidelity Securities Lending Cash Central Fund represents the income earned on investing cash collateral, less rebates paid to borrowers and any lending agent fees associated with the loan, plus any premium payments received for lending certain types of securities.
Investment Valuation
The following is a summary of the inputs used, as of October 31, 2020, involving the Fund's assets and liabilities carried at fair value. The inputs or methodology used for valuing securities may not be an indication of the risk associated with investing in those securities. For more information on valuation inputs, and their aggregation into the levels used below, please refer to the Investment Valuation section in the accompanying Notes to Financial Statements.
| | Valuation Inputs at Reporting Date: |
| Description | Total | Level 1 | Level 2 | Level 3 |
| Investments in Securities: | | | | |
| Equities: | | | | |
| Communication Services | $717,061,839 | $369,434,910 | $347,626,929 | $-- |
| Consumer Discretionary | 1,478,951,318 | 721,045,562 | 738,823,966 | 19,081,790 |
| Consumer Staples | 1,130,602,854 | 267,162,508 | 863,440,346 | -- |
| Energy | 214,251,035 | -- | 214,251,035 | -- |
| Financials | 1,587,492,019 | 698,217,305 | 889,274,714 | -- |
| Health Care | 1,886,978,393 | 494,425,437 | 1,392,552,956 | -- |
| Industrials | 2,034,739,570 | 1,138,174,367 | 896,565,203 | -- |
| Information Technology | 2,207,518,031 | 1,334,335,177 | 873,182,854 | -- |
| Materials | 741,464,864 | 526,609,248 | 214,855,616 | -- |
| Real Estate | 184,666,461 | 171,709,474 | 12,956,987 | -- |
| Utilities | 362,067,654 | 294,565,640 | 67,502,014 | -- |
| Money Market Funds | 618,012,961 | 618,012,961 | -- | -- |
| Total Investments in Securities: | $13,163,806,999 | $6,633,692,589 | $6,511,032,620 | $19,081,790 |
See accompanying notes which are an integral part of the financial statements.
Fidelity® Diversified International Fund
Financial Statements
Statement of Assets and Liabilities
| | | October 31, 2020 |
| Assets | | |
Investment in securities, at value (including securities loaned of $18,351,619) — See accompanying schedule:
Unaffiliated issuers (cost $8,246,175,701) | $12,545,794,038 | |
| Fidelity Central Funds (cost $617,985,931) | 618,012,961 | |
| Total Investment in Securities (cost $8,864,161,632) | | $13,163,806,999 |
| Foreign currency held at value (cost $462,199) | | 462,199 |
| Receivable for investments sold | | 35,348,232 |
| Receivable for fund shares sold | | 9,560,160 |
| Dividends receivable | | 41,389,301 |
| Distributions receivable from Fidelity Central Funds | | 69,617 |
| Prepaid expenses | | 22,483 |
| Other receivables | | 2,650,607 |
| Total assets | | 13,253,309,598 |
| Liabilities | | |
| Payable for investments purchased | $20,678,155 | |
| Payable for fund shares redeemed | 8,612,385 | |
| Accrued management fee | 9,924,192 | |
| Other affiliated payables | 1,574,352 | |
| Other payables and accrued expenses | 13,351,481 | |
| Collateral on securities loaned | 18,710,094 | |
| Total liabilities | | 72,850,659 |
| Net Assets | | $13,180,458,939 |
| Net Assets consist of: | | |
| Paid in capital | | $8,780,672,916 |
| Total accumulated earnings (loss) | | 4,399,786,023 |
| Net Assets | | $13,180,458,939 |
| Net Asset Value and Maximum Offering Price | | |
| Diversified International: | | |
| Net Asset Value, offering price and redemption price per share ($9,419,191,954 ÷ 226,352,680 shares) | | $41.61 |
| Class K: | | |
| Net Asset Value, offering price and redemption price per share ($3,761,266,985 ÷ 90,504,895 shares) | | $41.56 |
See accompanying notes which are an integral part of the financial statements.
Statement of Operations
| | | Year ended October 31, 2020 |
| Investment Income | | |
| Dividends | | $181,945,616 |
| Income from Fidelity Central Funds (including $671,885 from security lending) | | 3,201,787 |
| Income before foreign taxes withheld | | 185,147,403 |
| Less foreign taxes withheld | | (17,354,779) |
| Total income | | 167,792,624 |
| Expenses | | |
| Management fee | | |
| Basic fee | $84,332,418 | |
| Performance adjustment | 27,275,043 | |
| Transfer agent fees | 15,761,652 | |
| Accounting fees | 1,887,879 | |
| Custodian fees and expenses | 1,179,538 | |
| Independent trustees' fees and expenses | 73,128 | |
| Registration fees | 146,370 | |
| Audit | 109,796 | |
| Legal | 23,807 | |
| Miscellaneous | 196,718 | |
| Total expenses before reductions | 130,986,349 | |
| Expense reductions | (1,340,770) | |
| Total expenses after reductions | | 129,645,579 |
| Net investment income (loss) | | 38,147,045 |
| Realized and Unrealized Gain (Loss) | | |
| Net realized gain (loss) on: | | |
| Investment securities: | | |
| Unaffiliated issuers | 471,353,940 | |
| Fidelity Central Funds | (15,536) | |
| Forward foreign currency contracts | (63,398) | |
| Foreign currency transactions | (1,703,554) | |
| Total net realized gain (loss) | | 469,571,452 |
| Change in net unrealized appreciation (depreciation) on: | | |
| Investment securities: | | |
| Unaffiliated issuers (net of increase in deferred foreign taxes of $1,583,058) | 594,308,466 | |
| Fidelity Central Funds | (1) | |
| Forward foreign currency contracts | (83) | |
| Assets and liabilities in foreign currencies | 1,871,529 | |
| Total change in net unrealized appreciation (depreciation) | | 596,179,911 |
| Net gain (loss) | | 1,065,751,363 |
| Net increase (decrease) in net assets resulting from operations | | $1,103,898,408 |
See accompanying notes which are an integral part of the financial statements.
Statement of Changes in Net Assets
| | Year ended October 31, 2020 | Year ended October 31, 2019 |
| Increase (Decrease) in Net Assets | | |
| Operations | | |
| Net investment income (loss) | $38,147,045 | $194,597,492 |
| Net realized gain (loss) | 469,571,452 | 264,127,258 |
| Change in net unrealized appreciation (depreciation) | 596,179,911 | 1,508,654,754 |
| Net increase (decrease) in net assets resulting from operations | 1,103,898,408 | 1,967,379,504 |
| Distributions to shareholders | (182,593,177) | (905,624,719) |
| Share transactions - net increase (decrease) | (722,178,785) | (2,354,610,292) |
| Total increase (decrease) in net assets | 199,126,446 | (1,292,855,507) |
| Net Assets | | |
| Beginning of period | 12,981,332,493 | 14,274,188,000 |
| End of period | $13,180,458,939 | $12,981,332,493 |
See accompanying notes which are an integral part of the financial statements.
Financial Highlights
Fidelity Diversified International Fund
| Years ended October 31, | 2020 | 2019 | 2018 | 2017 | 2016 |
| Selected Per–Share Data | | | | | |
| Net asset value, beginning of period | $38.67 | $35.72 | $41.39 | $34.28 | $36.07 |
| Income from Investment Operations | | | | | |
| Net investment income (loss)A | .10 | .50 | .50 | .41 | .39 |
| Net realized and unrealized gain (loss) | 3.37 | 4.77 | (4.05) | 7.15 | (1.71) |
| Total from investment operations | 3.47 | 5.27 | (3.55) | 7.56 | (1.32) |
| Distributions from net investment income | (.53) | (.43) | (.43) | (.38) | (.33)B |
| Distributions from net realized gain | – | (1.89) | (1.69) | (.07) | (.14)B |
| Total distributions | (.53) | (2.32) | (2.12) | (.45) | (.47) |
| Redemption fees added to paid in capitalA | – | – | – | –C | –C |
| Net asset value, end of period | $41.61 | $38.67 | $35.72 | $41.39 | $34.28 |
| Total ReturnD | 9.07% | 16.02% | (9.05)% | 22.38% | (3.70)% |
| Ratios to Average Net AssetsE,F | | | | | |
| Expenses before reductions | 1.05% | .75% | .81% | .94% | 1.05% |
| Expenses net of fee waivers, if any | 1.05% | .75% | .80% | .94% | 1.05% |
| Expenses net of all reductions | 1.04% | .75% | .79% | .93% | 1.05% |
| Net investment income (loss) | .26% | 1.42% | 1.27% | 1.10% | 1.15% |
| Supplemental Data | | | | | |
| Net assets, end of period (000 omitted) | $9,419,192 | $8,734,682 | $9,275,299 | $11,349,633 | $10,990,703 |
| Portfolio turnover rateG,H | 29% | 37% | 30% | 37% | 24% |
A Calculated based on average shares outstanding during the period.
B The amounts shown reflect certain reclassifications related to book to tax differences that were made in the year shown.
C Amount represents less than $.005 per share.
D Total returns would have been lower if certain expenses had not been reduced during the applicable periods shown.
E Fees and expenses of any underlying mutual funds or exchange-traded funds (ETFs) are not included in the Fund's expense ratio. The Fund indirectly bears its proportionate share of these expenses. For additional expense information related to investments in Fidelity Central Funds, please refer to the "Investments in Fidelity Central Funds" note found in the Notes to Financial Statements section of the most recent Annual or Semi-Annual report.
F Expense ratios reflect operating expenses of the class. Expenses before reductions do not reflect amounts reimbursed, waived, or reduced through arrangements with the investment adviser, brokerage services, or other offset arrangements, if applicable, and do not represent the amount paid by the class during periods when reimbursements, waivers or reductions occur.
G Portfolio turnover rate excludes securities received or delivered in-kind.
H Amount does not include the portfolio activity of any underlying mutual funds or exchange-traded funds (ETFs).
See accompanying notes which are an integral part of the financial statements.
Fidelity Diversified International Fund Class K
| Years ended October 31, | 2020 | 2019 | 2018 | 2017 | 2016 |
| Selected Per–Share Data | | | | | |
| Net asset value, beginning of period | $38.61 | $35.68 | $41.35 | $34.25 | $36.04 |
| Income from Investment Operations | | | | | |
| Net investment income (loss)A | .15 | .55 | .55 | .45 | .44 |
| Net realized and unrealized gain (loss) | 3.37 | 4.74 | (4.05) | 7.15 | (1.71) |
| Total from investment operations | 3.52 | 5.29 | (3.50) | 7.60 | (1.27) |
| Distributions from net investment income | (.57) | (.47) | (.48) | (.43) | (.38)B |
| Distributions from net realized gain | – | (1.89) | (1.69) | (.07) | (.14)B |
| Total distributions | (.57) | (2.36) | (2.17) | (.50) | (.52) |
| Redemption fees added to paid in capitalA | – | – | –C | –C | –C |
| Net asset value, end of period | $41.56 | $38.61 | $35.68 | $41.35 | $34.25 |
| Total ReturnD | 9.22% | 16.14% | (8.95)% | 22.55% | (3.57)% |
| Ratios to Average Net AssetsE,F | | | | | |
| Expenses before reductions | .94% | .63% | .69% | .82% | .92% |
| Expenses net of fee waivers, if any | .94% | .63% | .69% | .81% | .92% |
| Expenses net of all reductions | .93% | .63% | .67% | .81% | .92% |
| Net investment income (loss) | .38% | 1.54% | 1.39% | 1.22% | 1.28% |
| Supplemental Data | | | | | |
| Net assets, end of period (000 omitted) | $3,761,267 | $4,246,651 | $4,998,889 | $8,498,740 | $8,608,956 |
| Portfolio turnover rateG,H | 29% | 37% | 30% | 37% | 24% |
A Calculated based on average shares outstanding during the period.
B The amounts shown reflect certain reclassifications related to book to tax differences that were made in the year shown.
C Amount represents less than $.005 per share.
D Total returns would have been lower if certain expenses had not been reduced during the applicable periods shown.
E Fees and expenses of any underlying mutual funds or exchange-traded funds (ETFs) are not included in the Fund's expense ratio. The Fund indirectly bears its proportionate share of these expenses. For additional expense information related to investments in Fidelity Central Funds, please refer to the "Investments in Fidelity Central Funds" note found in the Notes to Financial Statements section of the most recent Annual or Semi-Annual report.
F Expense ratios reflect operating expenses of the class. Expenses before reductions do not reflect amounts reimbursed, waived, or reduced through arrangements with the investment adviser, brokerage services, or other offset arrangements, if applicable, and do not represent the amount paid by the class during periods when reimbursements, waivers or reductions occur.
G Portfolio turnover rate excludes securities received or delivered in-kind.
H Amount does not include the portfolio activity of any underlying mutual funds or exchange-traded funds (ETFs).
See accompanying notes which are an integral part of the financial statements.
Notes to Financial Statements
For the period ended October 31, 2020
1. Organization.
Fidelity Diversified International Fund (the Fund) is a fund of Fidelity Investment Trust (the Trust) and is authorized to issue an unlimited number of shares. The Trust is registered under the Investment Company Act of 1940, as amended (the 1940 Act), as an open-end management investment company organized as a Massachusetts business trust. The Fund offers Diversified International and Class K shares, each of which has equal rights as to assets and voting privileges. Each class has exclusive voting rights with respect to matters that affect that class. The Fund's investments in emerging markets can be subject to social, economic, regulatory, and political uncertainties and can be extremely volatile.
Effective January 1, 2020:
Investment advisers Fidelity Investments Money Management, Inc., FMR Co., Inc., and Fidelity SelectCo, LLC, merged with and into Fidelity Management & Research Company. In connection with the merger transactions, the resulting, merged investment adviser was then redomiciled from Massachusetts to Delaware, changed its corporate structure from a corporation to a limited liability company, and changed its name to "Fidelity Management & Research Company LLC".
Fidelity Investments Institutional Operations Company, Inc. converted from a Massachusetts corporation to a Massachusetts LLC, and changed its name to "Fidelity Investments Institutional Operations Company LLC".
2. Investments in Fidelity Central Funds.
The Fund invests in Fidelity Central Funds, which are open-end investment companies generally available only to other investment companies and accounts managed by the investment adviser and its affiliates. The Fund's Schedule of Investments lists each of the Fidelity Central Funds held as of period end, if any, as an investment of the Fund, but does not include the underlying holdings of each Fidelity Central Fund. As an Investing Fund, the Fund indirectly bears its proportionate share of the expenses of the underlying Fidelity Central Funds.
The Money Market Central Funds seek preservation of capital and current income and are managed by the investment adviser. Annualized expenses of the Money Market Central Funds as of their most recent shareholder report date ranged from less than .005% to .01%.
A complete unaudited list of holdings for each Fidelity Central Fund is available upon request or at the Securities and Exchange Commission (the SEC) website at www.sec.gov. In addition, the financial statements of the Fidelity Central Funds, which are not covered by the Fund's Report of Independent Registered Public Accounting Firm, are available on the SEC website or upon request.
3. Significant Accounting Policies.
The Fund is an investment company and applies the accounting and reporting guidance of the Financial Accounting Standards Board (FASB) Accounting Standards Codification Topic 946 Financial Services – Investment Companies. The financial statements have been prepared in conformity with accounting principles generally accepted in the United States of America (GAAP), which require management to make certain estimates and assumptions at the date of the financial statements. Actual results could differ from those estimates. Subsequent events, if any, through the date that the financial statements were issued have been evaluated in the preparation of the financial statements. The following summarizes the significant accounting policies of the Fund:
Investment Valuation. Investments are valued as of 4:00 p.m. Eastern time on the last calendar day of the period. The Board of Trustees (the Board) has delegated the day to day responsibility for the valuation of the Fund's investments to the Fair Value Committee (the Committee) established by the Fund's investment adviser. In accordance with valuation policies and procedures approved by the Board, the Fund attempts to obtain prices from one or more third party pricing vendors or brokers to value its investments. When current market prices, quotations or currency exchange rates are not readily available or reliable, investments will be fair valued in good faith by the Committee, in accordance with procedures adopted by the Board. Factors used in determining fair value vary by investment type and may include market or investment specific events. The frequency with which these procedures are used cannot be predicted and they may be utilized to a significant extent. The Committee oversees the Fund's valuation policies and procedures and reports to the Board on the Committee's activities and fair value determinations. The Board monitors the appropriateness of the procedures used in valuing the Fund's investments and ratifies the fair value determinations of the Committee.
The Fund categorizes the inputs to valuation techniques used to value its investments into a disclosure hierarchy consisting of three levels as shown below:
- Level 1 – quoted prices in active markets for identical investments
- Level 2 – other significant observable inputs (including quoted prices for similar investments, interest rates, prepayment speeds, etc.)
- Level 3 – unobservable inputs (including the Fund's own assumptions based on the best information available)
Valuation techniques used to value the Fund's investments by major category are as follows:
Equity securities, including restricted securities, for which market quotations are readily available, are valued at the last reported sale price or official closing price as reported by a third party pricing vendor on the primary market or exchange on which they are traded and are categorized as Level 1 in the hierarchy. In the event there were no sales during the day or closing prices are not available, securities are valued at the last quoted bid price or may be valued using the last available price and are generally categorized as Level 2 in the hierarchy. For foreign equity securities, when market or security specific events arise, comparisons to the valuation of American Depositary Receipts (ADRs), futures contracts, Exchange-Traded Funds (ETFs) and certain indexes as well as quoted prices for similar securities may be used and would be categorized as Level 2 in the hierarchy. For equity securities, including restricted securities, where observable inputs are limited, assumptions about market activity and risk are used and these securities may be categorized as Level 3 in the hierarchy.
Investments in open-end mutual funds, including the Fidelity Central Funds, are valued at their closing net asset value (NAV) each business day and are categorized as Level 1 in the hierarchy.
Changes in valuation techniques may result in transfers in or out of an assigned level within the disclosure hierarchy. The aggregate value of investments by input level as of October 31, 2020 is included at the end of the Fund's Schedule of Investments.
Foreign Currency. Certain Funds may use foreign currency contracts to facilitate transactions in foreign-denominated securities. Gains and losses from these transactions may arise from changes in the value of the foreign currency or if the counterparties do not perform under the contracts' terms.
Foreign-denominated assets, including investment securities, and liabilities are translated into U.S. dollars at the exchange rates at period end. Purchases and sales of investment securities, income and dividends received, and expenses denominated in foreign currencies are translated into U.S. dollars at the exchange rate in effect on the transaction date.
The effects of exchange rate fluctuations on investments are included with the net realized and unrealized gain (loss) on investment securities. Other foreign currency transactions resulting in realized and unrealized gain (loss) are disclosed separately.
Investment Transactions and Income. For financial reporting purposes, the Fund's investment holdings and NAV include trades executed through the end of the last business day of the period. The NAV per share for processing shareholder transactions is calculated as of the close of business of the New York Stock Exchange (NYSE), normally 4:00 p.m. Eastern time and includes trades executed through the end of the prior business day. Gains and losses on securities sold are determined on the basis of identified cost and include proceeds received from litigation. Dividend income is recorded on the ex-dividend date, except for certain dividends from foreign securities where the ex-dividend date may have passed, which are recorded as soon as the Fund is informed of the ex-dividend date. Non-cash dividends included in dividend income, if any, are recorded at the fair market value of the securities received. Income and capital gain distributions from Fidelity Central Funds, if any, are recorded on the ex-dividend date. Certain distributions received by the Fund represent a return of capital or capital gain. The Fund determines the components of these distributions subsequent to the ex-dividend date, based upon receipt of tax filings or other correspondence relating to the underlying investment. These distributions are recorded as a reduction of cost of investments and/or as a realized gain. Investment income is recorded net of foreign taxes withheld where recovery of such taxes is uncertain.
Class Allocations and Expenses. Investment income, realized and unrealized capital gains and losses, common expenses of the Fund, and certain fund-level expense reductions, if any, are allocated daily on a pro-rata basis to each class based on the relative net assets of each class to the total net assets of the Fund. Each class differs with respect to transfer agent fees incurred. Certain expense reductions may also differ by class. For the reporting period, the allocated portion of income and expenses to each class as a percent of its average net assets may vary due to the timing of recording these transactions in relation to fluctuating net assets of the classes. Expenses directly attributable to a fund are charged to that fund. Expenses attributable to more than one fund are allocated among the respective funds on the basis of relative net assets or other appropriate methods. Expense estimates are accrued in the period to which they relate and adjustments are made when actual amounts are known.
Deferred Trustee Compensation. Under a Deferred Compensation Plan (the Plan) for the Fund, certain independent Trustees have elected to defer receipt of a portion of their annual compensation. Deferred amounts are invested in a cross-section of Fidelity funds, are marked-to-market and remain in the Fund until distributed in accordance with the Plan. The investment of deferred amounts and the offsetting payable to the Trustees of $1,918,896 are included in the accompanying Statement of Assets and Liabilities in other receivables and other payables and accrued expenses, respectively.
Income Tax Information and Distributions to Shareholders. Each year, the Fund intends to qualify as a regulated investment company under Subchapter M of the Internal Revenue Code, including distributing substantially all of its taxable income and realized gains. As a result, no provision for U.S. Federal income taxes is required. As of October 31, 2020, the Fund did not have any unrecognized tax benefits in the financial statements; nor is the Fund aware of any tax positions for which it is reasonably possible that the total amounts of unrecognized tax benefits will significantly change in the next twelve months. The Fund files a U.S. federal tax return, in addition to state and local tax returns as required. The Fund's federal income tax returns are subject to examination by the Internal Revenue Service (IRS) for a period of three fiscal years after they are filed. State and local tax returns may be subject to examination for an additional fiscal year depending on the jurisdiction. Foreign taxes are provided for based on the Fund's understanding of the tax rules and rates that exist in the foreign markets in which it invests. The Fund is subject to a tax imposed on capital gains by certain countries in which it invests. An estimated deferred tax liability for net unrealized appreciation on the applicable securities is included in Other payables and accrued expenses on the Statement of Assets & Liabilities.
Distributions are declared and recorded on the ex-dividend date. Income and capital gain distributions are declared separately for each class. Income and capital gain distributions are determined in accordance with income tax regulations, which may differ from GAAP. In addition, the Fund claimed a portion of the payment made to redeeming shareholders as a distribution for income tax purposes.
Capital accounts within the financial statements are adjusted for permanent book-tax differences. These adjustments have no impact on net assets or the results of operations. Capital accounts are not adjusted for temporary book-tax differences which will reverse in a subsequent period.
Book-tax differences are primarily due to foreign currency transactions, passive foreign investment companies (PFIC), redemptions in kind, deferred trustees compensation, capital loss carryforwards and losses deferred due to wash sales.
As of period end, the cost and unrealized appreciation (depreciation) in securities, and derivatives if applicable, for federal income tax purposes were as follows:
| Gross unrealized appreciation | $4,487,777,781 |
| Gross unrealized depreciation | (225,666,083) |
| Net unrealized appreciation (depreciation) | $4,262,111,698 |
| Tax Cost | $8,901,695,301 |
The tax-based components of distributable earnings as of period end were as follows:
| Undistributed ordinary income | $9,159,574 |
| Undistributed long-term capital gain | $139,864,807 |
| Net unrealized appreciation (depreciation) on securities and other investments | $4,263,616,486 |
The tax character of distributions paid was as follows:
| | October 31, 2020 | October 31, 2019 |
| Ordinary Income | $182,593,177 | $ 172,128,327 |
| Long-term Capital Gains | – | 733,496,392 |
| Total | $182,593,177 | $ 905,624,719 |
Restricted Securities (including Private Placements). The Fund may invest in securities that are subject to legal or contractual restrictions on resale. These securities generally may be resold in transactions exempt from registration or to the public if the securities are registered. Disposal of these securities may involve time-consuming negotiations and expense, and prompt sale at an acceptable price may be difficult. Information regarding restricted securities is included at the end of the Fund's Schedule of Investments.
4. Derivative Instruments.
Risk Exposures and the Use of Derivative Instruments. The Fund's investment objective allows the Fund to enter into various types of derivative contracts, including forward foreign currency contracts. Derivatives are investments whose value is primarily derived from underlying assets, indices or reference rates and may be transacted on an exchange or over-the-counter (OTC). Derivatives may involve a future commitment to buy or sell a specified asset based on specified terms, to exchange future cash flows at periodic intervals based on a notional principal amount, or for one party to make one or more payments upon the occurrence of specified events in exchange for periodic payments from the other party.
The Fund used derivatives to increase returns and to manage exposure to certain risks as defined below. The success of any strategy involving derivatives depends on analysis of numerous economic factors, and if the strategies for investment do not work as intended, the Fund may not achieve its objectives.
The Fund's use of derivatives increased or decreased its exposure to the following risk:
| Foreign Exchange Risk | Foreign exchange rate risk relates to fluctuations in the value of an asset or liability due to changes in currency exchange rates.
|
The Fund is also exposed to additional risks from investing in derivatives, such as liquidity risk and counterparty credit risk. Liquidity risk is the risk that the Fund will be unable to close out the derivative in the open market in a timely manner. Counterparty credit risk is the risk that the counterparty will not be able to fulfill its obligation to the Fund.
Investing in derivatives may involve greater risks than investing in the underlying assets directly and, to varying degrees, may involve risk of loss in excess of any initial investment and collateral received and amounts recognized in the Statement of Assets and Liabilities. In addition, there may be the risk that the change in value of the derivative contract does not correspond to the change in value of the underlying instrument.
Forward Foreign Currency Contracts. Forward foreign currency contracts represent obligations to purchase or sell foreign currency on a specified future date at a price fixed at the time the contracts are entered into. The Fund used forward foreign currency contracts to facilitate transactions in foreign-denominated securities and to manage exposure to certain foreign currencies.
Forward foreign currency contracts are valued daily and fluctuations in exchange rates on open contracts are recorded as unrealized appreciation or (depreciation) and reflected in the Statement of Assets and Liabilities. When the contract is closed, the Fund realizes a gain or loss equal to the difference between the closing value and the value at the time it was opened. The net realized gain (loss) and change in net unrealized appreciation (depreciation) on forward foreign currency contracts during the period is presented in the Statement of Operations.
Any open forward foreign currency contracts at period end are presented in the Schedule of Investments under the caption "Forward Foreign Currency Contracts." The contract amount and unrealized appreciation (depreciation) reflects each contract's exposure to the underlying currency at period end.
5. Purchases and Sales of Investments.
Purchases and sales of securities, other than short-term securities and in-kind transactions are noted in the table below.
| | Purchases ($) | Sales ($) |
| Fidelity Diversified International Fund | 3,578,795,585 | 4,433,740,161 |
Unaffiliated Redemptions In-Kind. During the period, 10,333,035 shares of the Fund were redeemed in-kind for investments and cash with a value of $388,760,021. The net realized gain of $142,444,028 on investments delivered through in-kind redemptions is included in the accompanying Statement of Operations. The amount of the in-kind redemptions is included in share transactions in the accompanying Statement of Changes in Net Assets as well as the Notes to Financial Statements. The Fund recognized no gain or loss for federal income tax purposes.
Prior Fiscal Year Unaffiliated Redemptions In-Kind. During the prior period, 18,179,740 shares of the Fund were redeemed in-kind for investments and cash with a value of $627,237,242. The Fund had a net realized gain of $175,534,803 on investments delivered through in-kind redemptions. The amount of the in-kind redemptions is included in share transactions in the accompanying Statement of Changes in Net Assets as well as the Notes to Financial Statements. The Fund recognized no gain or loss for federal income tax purposes.
6. Fees and Other Transactions with Affiliates.
Management Fee. Fidelity Management & Research Company LLC (the investment adviser) and its affiliates provide the Fund with investment management related services for which the Fund pays a monthly management fee. The management fee is the sum of an individual fund fee rate that is based on an annual rate of .424% of the Fund's average net assets and an annualized group fee rate that averaged .23% during the period. The group fee rate is based upon the monthly average net assets of a group of registered investment companies with which the investment adviser has management contracts. The group fee rate decreases as assets under management increase and increases as assets under management decrease. In addition, the management fee is subject to a performance adjustment (up to a maximum of +/- .20% of the Fund's average net assets over a 36 month performance period). The upward or downward adjustment to the management fee is based on the relative investment performance of Diversified International as compared to its benchmark index, the MSCI EAFE Index, over the same 36 month performance period. For the reporting period, the total annual management fee rate, including the performance adjustment, was .87% of the Fund's average net assets. The performance adjustment included in the management fee rate may be higher or lower than the maximum performance adjustment rate due to the difference between the average net assets for the reporting and performance periods.
Transfer Agent Fees. Fidelity Investments Institutional Operations Company LLC (FIIOC), an affiliate of the investment adviser, is the transfer, dividend disbursing and shareholder servicing agent for each class of the Fund. FIIOC receives account fees and asset-based fees that vary according to the account size and type of account of the shareholders of Diversified International, except for Class K. FIIOC receives an asset-based fee of Class K's average net assets. FIIOC pays for typesetting, printing and mailing of shareholder reports, except proxy statements. Effective February 1, 2020, the Board approved to change the fee for Class K from .046% to .044%.
For the period, transfer agent fees for each class were as follows:
| | Amount | % of Class-Level Average Net Assets |
| Diversified International | $14,063,000 | .16 |
| Class K | 1,698,652 | .04 |
| | $15,761,652 | |
Accounting Fees. Fidelity Service Company, Inc. (FSC), an affiliate of the investment adviser, maintains the Fund's accounting records. The accounting fee is based on the level of average net assets for each month. For the period, the fees were equivalent to the following annual rates:
| | % of Average Net Assets |
| Fidelity Diversified International Fund | .01 |
Brokerage Commissions. A portion of portfolio transactions were placed with brokerage firms which are affiliates of the investment adviser. Brokerage commissions are included in net realized gain (loss) and change in net unrealized appreciation (depreciation) in the Statement of Operations. The commissions paid to these affiliated firms were as follows:
| | Amount |
| Fidelity Diversified International Fund | $12,502 |
Interfund Trades. Funds may purchase from or sell securities to other Fidelity Funds under procedures adopted by the Board. The procedures have been designed to ensure these interfund trades are executed in accordance with Rule 17a-7 of the 1940 Act. Interfund trades are included within the respective purchases and sales amounts shown in the Purchases and Sales of Investments note.
Prior Fiscal Year Affiliated Redemptions In-Kind. During the prior period, 14,735,066 shares of the Fund were redeemed in-kind for investments and cash with a value of $563,382,003. The Fund had a net realized gain of $187,169,018 on investments delivered through in-kind redemptions. The amount of the in-kind redemptions is included in share transactions in the accompanying Statement of Changes in Net Assets as well as the Notes to Financial Statements. The Fund recognized no gain or loss for federal income tax purposes.
Other. During the period, the investment adviser reimbursed the Fund for certain losses in the amount of $4,023.
7. Committed Line of Credit.
Certain Funds participate with other funds managed by the investment adviser or an affiliate in a $4.25 billion credit facility (the "line of credit") to be utilized for temporary or emergency purposes to fund shareholder redemptions or for other short-term liquidity purposes. The participating funds have agreed to pay commitment fees on their pro-rata portion of the line of credit, which are reflected in Miscellaneous expenses on the Statement of Operations, and are as follows:
| | Amount |
| Fidelity Diversified International Fund | $30,122 |
During the period, there were no borrowings on this line of credit.
8. Security Lending.
Funds lend portfolio securities from time to time in order to earn additional income. Lending agents are used, including National Financial Services (NFS), an affiliate of the investment adviser. Pursuant to a securities lending agreement, NFS will receive a fee, which is capped at 9.9% of a fund's daily lending revenue, for its services as lending agent. A fund may lend securities to certain qualified borrowers, including NFS. On the settlement date of the loan, a fund receives collateral (in the form of U.S. Treasury obligations, letters of credit and/or cash) against the loaned securities and maintains collateral in an amount not less than 100% of the market value of the loaned securities during the period of the loan. The market value of the loaned securities is determined at the close of business of a fund and any additional required collateral is delivered to a fund on the next business day. A fund or borrower may terminate the loan at any time, and if the borrower defaults on its obligation to return the securities loaned because of insolvency or other reasons, a fund may apply collateral received from the borrower against the obligation. A fund may experience delays and costs in recovering the securities loaned. Any cash collateral received is invested in the Fidelity Securities Lending Cash Central Fund. Any loaned securities are identified as such in the Schedule of Investments, and the value of loaned securities and cash collateral at period end, as applicable, are presented in the Statement of Assets and Liabilities. Security lending income represents the income earned on investing cash collateral, less rebates paid to borrowers and any lending agent fees associated with the loan, plus any premium payments received for lending certain types of securities. Security lending income is presented in the Statement of Operations as a component of income from Fidelity Central Funds. Affiliated security lending activity, if any, was as follows:
| | Total Security Lending Income Fees Paid to NFS | Security Lending Income From Securities Loaned to NFS | Value of Securities Loaned to NFS at Period End |
| Fidelity Diversified International Fund | $32,770 | $– | $– |
9. Expense Reductions.
Commissions paid to certain brokers with whom the investment adviser, or its affiliates, places trades on behalf of the Fund include an amount in addition to trade execution, which may be rebated back to the Fund to offset certain expenses. This amount totaled $1,285,055 for the period. In addition, through arrangements with the Fund's custodian, credits realized as a result of certain uninvested cash balances were used to reduce the Fund's expenses. During the period, custodian credits reduced the Fund's expenses by $2,113.
In addition, during the period the investment adviser or an affiliate reimbursed and/or waived a portion of fund-level operating expenses in the amount of $53,602.
10. Distributions to Shareholders.
Distributions to shareholders of each class were as follows:
| | Year ended
October 31, 2020 | Year ended
October 31, 2019 |
| Distributions to shareholders | | |
| Diversified International | $119,920,878 | $589,277,164 |
| Class K | 62,672,299 | 316,347,555 |
| Total | $182,593,177 | $905,624,719 |
11. Share Transactions.
Share transactions for each class were as follows and may contain automatic conversions between classes or exchanges between affiliated funds:
| | Shares | Shares | Dollars | Dollars |
| | Year ended October 31, 2020 | Year ended October 31, 2019 | Year ended October 31, 2020 | Year ended October 31, 2019 |
| Diversified International | | | | |
| Shares sold | 38,741,958 | 27,702,187 | $1,486,815,140 | $976,921,173 |
| Reinvestment of distributions | 2,775,559 | 16,919,211 | 108,718,654 | 546,998,101 |
| Shares redeemed | (41,070,036) | (78,402,082)(a),(b) | (1,568,595,127) | (2,804,225,170)(a),(b) |
| Net increase (decrease) | 447,481 | (33,780,684) | $26,938,667 | $(1,280,305,896) |
| Class K | | | | |
| Shares sold | 24,863,226 | 17,427,136 | $944,668,040 | $617,045,574 |
| Reinvestment of distributions | 1,604,103 | 9,807,521 | 62,672,299 | 316,292,568 |
| Shares redeemed | (45,948,568)(c) | (57,363,841)(a) | (1,756,457,791)(c) | (2,007,642,538)(a) |
| Net increase (decrease) | (19,481,239) | (30,129,184) | $(749,117,452) | $(1,074,304,396) |
(a) Amount includes in-kind redemptions (see the Prior Fiscal Year Unaffiliated Redemptions In-Kind note for additional details).
(b) Amount includes in-kind redemptions (see the Prior Fiscal Year Affiliated Redemptions In-Kind note for additional details).
(c) Amount includes in-kind redemptions (see the Unaffiliated Redemptions In-Kind note for additional details).
12. Other.
The Fund's organizational documents provide former and current trustees and officers with a limited indemnification against liabilities arising in connection with the performance of their duties to the Fund. In the normal course of business, the Fund may also enter into contracts that provide general indemnifications. The Fund's maximum exposure under these arrangements is unknown as this would be dependent on future claims that may be made against the Fund. The risk of material loss from such claims is considered remote.
At the end of the period, Strategic Advisers Fidelity International Fund was the owner of record of approximately 12% of the total outstanding shares of the Fund.
13. Coronavirus (COVID-19) Pandemic.
An outbreak of COVID-19 first detected in China during December 2019 has since spread globally and was declared a pandemic by the World Health Organization during March 2020. Developments that disrupt global economies and financial markets, such as the COVID-19 pandemic, may magnify factors that affect the Fund's performance.
Fidelity® International Capital Appreciation Fund
Performance: The Bottom Line
Average annual total return reflects the change in the value of an investment, assuming reinvestment of distributions from dividend income and capital gains (the profits earned upon the sale of securities that have grown in value, if any) and assuming a constant rate of performance each year. The hypothetical investment and the average annual total returns do not reflect the deduction of taxes that a shareholder would pay on fund distributions or the redemption of fund shares. During periods of reimbursement by Fidelity, a fund’s total return will be greater than it would be had the reimbursement not occurred. How a fund did yesterday is no guarantee of how it will do tomorrow.
Average Annual Total Returns
| For the periods ended October 31, 2020 | Past 1 year | Past 5 years | Past 10 years |
| Fidelity® International Capital Appreciation Fund | 13.35% | 10.23% | 9.23% |
$10,000 Over 10 Years
Let's say hypothetically that $10,000 was invested in Fidelity® International Capital Appreciation Fund on October 31, 2010.
The chart shows how the value of your investment would have changed, and also shows how the MSCI ACWI (All Country World Index) ex USA Index performed over the same period.
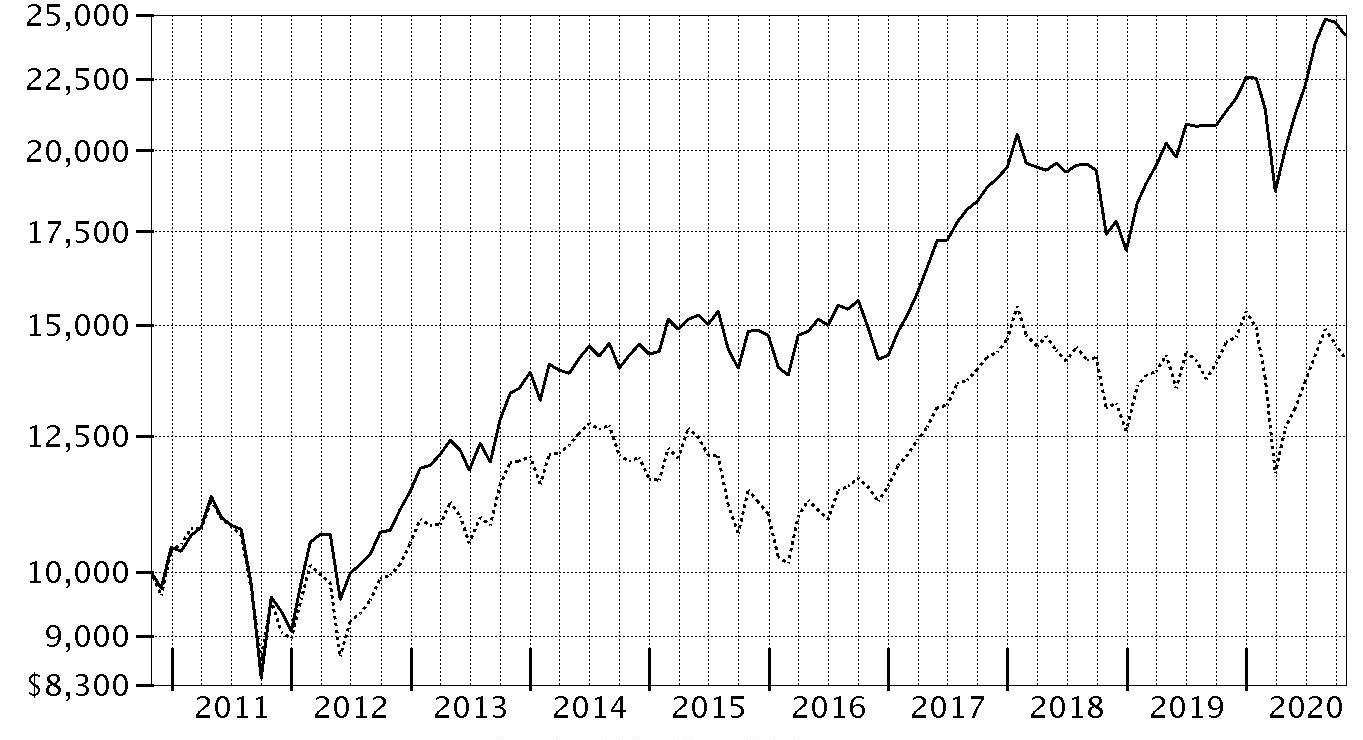
| Period Ending Values |
| $24,178 | Fidelity® International Capital Appreciation Fund |
| $14,220 | MSCI ACWI (All Country World Index) ex USA Index |
Fidelity® International Capital Appreciation Fund
Management's Discussion of Fund Performance
Market Recap: The MSCI ACWI (All Country World Index) ex USA Index returned -2.46% for the 12 months ending October 31, 2020, in what was a bumpy ride for non-U.S. equities, marked by a steep but brief decline due to the early-2020 outbreak and spread of the coronavirus, followed by a sharp upturn. Declared a pandemic on March 11, the crisis and containment efforts caused broad contraction in economic activity, elevated volatility and dislocation in financial markets. A historically rapid and expansive monetary- and fiscal-policy response around the world provided a partial offset to the economic disruption. Other supporting factors included resilient corporate earnings and near-term potential for a COVID-19 vaccine breakthrough. This was evident in the index’s 12.28% gain in the final six months of the year. Currency fluctuation generally boosted foreign developed-markets equities for the year, while the reverse was true for emerging-markets stocks. Late in the period, the index was pressured by a second wave of COVID-19 cases in some regions, and stretched valuations and crowded positioning in big tech. For the full year, the U.K. (-22%), Asia Pacific ex Japan (-8%), Canada (-5%) and Europe ex U.K. (-4%) notably lagged. Emerging markets (+9%) and Japan (+1%) outperformed. By sector, energy (-38%), financials and real estate (-20% each) lagged, whereas information technology (+ 25%) and communication services (+15%) topped the index.
Comments from Portfolio Manager Sammy Simnegar: For the fiscal year ending October 31, 2020, the fund gained 13.35%, outperforming the -2.46% result of the benchmark MSCI All Country World ex USA Index. From a regional standpoint, security selection in Europe ex U.K. and emerging markets contributed most to the fund's relative result. By sector, the top contributor to performance versus the benchmark was stock picking in industrials. An overweighting in information technology and security selection in consumer discretionary also bolstered performance. Our non-benchmark stake in MercadoLibre was the fund's largest individual relative contributor, driven by a 145% increase. Also boosting value was our outsized position in Wuliangye Yibin, which gained 60%. Wuliangye Yibin was not held at period end. Another notable relative contributor was our overweighting in Orsted (+91%), a position we established this period. In contrast, an underweighting in emerging markets and an overweighting Europe ex U.K., primarily driven by France, hindered the portfolio's relative return. In terms of sectors, the largest detractor from performance versus the benchmark was an overweighting in industrials. Weak picks among information technology stocks also hindered relative performance. Further weighing on the fund's relative result was an underweighting in health care, primarily within the pharmaceuticals, biotechnology & life sciences industry. The fund's biggest individual relative detractor was our outsized stake in Capitec Bank Holdings, which returned -62%. This is a position that was sold the past year. Also hindering performance was our overweighting in MTU Aero Engines, which returned roughly -63%. MTU Aero Engines was not held at period end. Also hampering performance was our outsized stake in Aristocrat Leisure, which returned approximately -58%. Aristocrat Leisure was not held at period end. Notable changes in positioning include a higher allocation to U.S. and China. By sector, meaningful changes in positioning include a lower allocation to consumer staples and financials.
The views expressed above reflect those of the portfolio manager(s) only through the end of the period as stated on the cover of this report and do not necessarily represent the views of Fidelity or any other person in the Fidelity organization. Any such views are subject to change at any time based upon market or other conditions and Fidelity disclaims any responsibility to update such views. These views may not be relied on as investment advice and, because investment decisions for a Fidelity fund are based on numerous factors, may not be relied on as an indication of trading intent on behalf of any Fidelity fund.
Fidelity® International Capital Appreciation Fund
Investment Summary (Unaudited)
Geographic Diversification (% of fund's net assets)
| As of October 31, 2020 |
| | United States of America* | 13.6% |
| | Cayman Islands | 12.7% |
| | Japan | 10.8% |
| | France | 8.0% |
| | Switzerland | 6.8% |
| | Germany | 6.0% |
| | Netherlands | 4.9% |
| | Korea (South) | 4.8% |
| | United Kingdom | 4.7% |
| | Other | 27.7% |
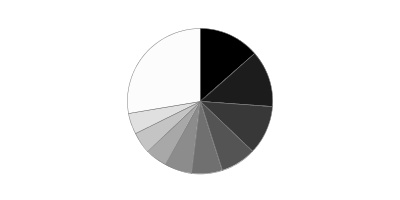
* Includes Short-Term investments and Net Other Assets (Liabilities).
Percentages are based on country or territory of incorporation and are adjusted for the effect of futures contracts, if applicable.
Asset Allocation as of October 31, 2020
| | % of fund's net assets |
| Stocks | 99.6 |
| Short-Term Investments and Net Other Assets (Liabilities) | 0.4 |
Top Ten Stocks as of October 31, 2020
| | % of fund's net assets |
| Alibaba Group Holding Ltd. sponsored ADR (Cayman Islands, Internet & Direct Marketing Retail) | 3.5 |
| Tencent Holdings Ltd. (Cayman Islands, Interactive Media & Services) | 3.0 |
| Taiwan Semiconductor Manufacturing Co. Ltd. (Taiwan, Semiconductors & Semiconductor Equipment) | 2.5 |
| Nestle SA (Reg. S) (Switzerland, Food Products) | 2.3 |
| Samsung Electronics Co. Ltd. (Korea (South), Technology Hardware, Storage & Peripherals) | 2.1 |
| ASML Holding NV (Netherlands) (Netherlands, Semiconductors & Semiconductor Equipment) | 1.5 |
| Meituan Class B (Cayman Islands, Internet & Direct Marketing Retail) | 1.5 |
| LVMH Moet Hennessy Louis Vuitton SE (France, Textiles, Apparel & Luxury Goods) | 1.4 |
| AstraZeneca PLC (United Kingdom) (United Kingdom, Pharmaceuticals) | 1.4 |
| Sony Corp. (Japan, Household Durables) | 1.3 |
| | 20.5 |
Top Market Sectors as of October 31, 2020
| | % of fund's net assets |
| Information Technology | 21.3 |
| Consumer Discretionary | 17.6 |
| Industrials | 15.2 |
| Communication Services | 11.4 |
| Health Care | 8.0 |
| Financials | 6.2 |
| Consumer Staples | 6.0 |
| Utilities | 5.6 |
| Materials | 5.5 |
| Real Estate | 1.7 |
Fidelity® International Capital Appreciation Fund
Schedule of Investments October 31, 2020
Showing Percentage of Net Assets
| Common Stocks - 99.6% | | | |
| | | Shares | Value |
| Bailiwick of Jersey - 1.7% | | | |
| Experian PLC | | 1,082,164 | $39,643,886 |
| Ferguson PLC | | 378,800 | 37,622,785 |
|
| TOTAL BAILIWICK OF JERSEY | | | 77,266,671 |
|
| Bermuda - 0.8% | | | |
| IHS Markit Ltd. | | 442,800 | 35,809,236 |
| Canada - 4.5% | | | |
| Canadian National Railway Co. | | 479,174 | 47,600,900 |
| Canadian Pacific Railway Ltd. | | 144,091 | 43,059,664 |
| Constellation Software, Inc. | | 37,094 | 38,939,651 |
| Thomson Reuters Corp. | | 491,500 | 38,211,792 |
| Waste Connection, Inc. (Canada) | | 354,452 | 35,133,927 |
|
| TOTAL CANADA | | | 202,945,934 |
|
| Cayman Islands - 12.7% | | | |
| Alibaba Group Holding Ltd. sponsored ADR (a) | | 521,124 | 158,781,272 |
| JD.com, Inc. sponsored ADR (a) | | 651,600 | 53,118,432 |
| Meituan Class B (a) | | 1,804,000 | 67,063,889 |
| NetEase, Inc. ADR | | 476,500 | 41,355,435 |
| New Oriental Education & Technology Group, Inc. sponsored ADR (a) | | 260,776 | 41,823,255 |
| Sea Ltd. ADR (a) | | 227,700 | 35,908,290 |
| Shenzhou International Group Holdings Ltd. | | 2,266,000 | 39,138,007 |
| Tencent Holdings Ltd. | | 1,751,400 | 133,816,862 |
|
| TOTAL CAYMAN ISLANDS | | | 571,005,442 |
|
| China - 0.8% | | | |
| Kweichow Moutai Co. Ltd. (A Shares) | | 151,100 | 37,794,203 |
| Denmark - 3.1% | | | |
| DSV Panalpina A/S | | 270,800 | 43,848,248 |
| Novo Nordisk A/S Series B | | 858,500 | 54,742,819 |
| ORSTED A/S (b) | | 267,400 | 42,440,128 |
|
| TOTAL DENMARK | | | 141,031,195 |
|
| France - 8.0% | | | |
| Air Liquide SA | | 338,410 | 49,463,215 |
| Dassault Systemes SA | | 227,857 | 38,890,509 |
| Hermes International SCA | | 43,991 | 40,936,060 |
| Kering SA | | 68,562 | 41,402,605 |
| L'Oreal SA | | 153,671 | 49,664,242 |
| LVMH Moet Hennessy Louis Vuitton SE | | 137,060 | 64,246,554 |
| SR Teleperformance SA | | 125,754 | 37,742,586 |
| Worldline SA (a)(b) | | 512,400 | 37,978,230 |
|
| TOTAL FRANCE | | | 360,324,001 |
|
| Germany - 6.0% | | | |
| Delivery Hero AG (a)(b) | | 345,800 | 39,782,259 |
| Deutsche Borse AG | | 229,800 | 33,815,880 |
| Infineon Technologies AG | | 1,503,100 | 41,848,083 |
| Merck KGaA | | 259,700 | 38,457,739 |
| RWE AG | | 1,090,100 | 40,360,106 |
| Symrise AG | | 280,500 | 34,579,536 |
| Vonovia SE | | 671,800 | 42,891,818 |
|
| TOTAL GERMANY | | | 271,735,421 |
|
| Hong Kong - 2.2% | | | |
| AIA Group Ltd. | | 5,937,400 | 56,507,283 |
| Techtronic Industries Co. Ltd. | | 3,155,500 | 42,086,901 |
|
| TOTAL HONG KONG | | | 98,594,184 |
|
| India - 2.0% | | | |
| HDFC Bank Ltd. | | 2,502,864 | 39,733,335 |
| Reliance Industries Ltd. | | 1,909,077 | 52,614,583 |
|
| TOTAL INDIA | | | 92,347,918 |
|
| Indonesia - 0.9% | | | |
| PT Bank Central Asia Tbk | | 19,930,900 | 39,217,151 |
| Ireland - 1.8% | | | |
| Flutter Entertainment PLC (Ireland) | | 252,100 | 43,909,116 |
| Linde PLC | | 161,000 | 35,474,740 |
|
| TOTAL IRELAND | | | 79,383,856 |
|
| Italy - 1.1% | | | |
| Enel SpA | | 6,208,200 | 49,358,326 |
| Japan - 10.8% | | | |
| Daikin Industries Ltd. | | 237,300 | 44,406,722 |
| Hoya Corp. | | 400,000 | 45,142,775 |
| Keyence Corp. | | 111,260 | 50,492,291 |
| Nitori Holdings Co. Ltd. | | 185,500 | 38,130,764 |
| Olympus Corp. | | 2,028,000 | 38,824,198 |
| Recruit Holdings Co. Ltd. | | 1,159,900 | 44,134,979 |
| SMC Corp. | | 73,600 | 39,148,257 |
| Sony Corp. | | 733,600 | 61,157,651 |
| Tokyo Electron Ltd. | | 168,300 | 45,173,550 |
| Unicharm Corp. | | 859,900 | 39,788,346 |
| Z Holdings Corp. | | 5,724,700 | 39,918,677 |
|
| TOTAL JAPAN | | | 486,318,210 |
|
| Korea (South) - 4.8% | | | |
| LG Chemical Ltd. | | 75,860 | 41,274,284 |
| NAVER Corp. | | 161,570 | 41,250,373 |
| Samsung Electronics Co. Ltd. | | 1,837,210 | 92,145,903 |
| Samsung SDI Co. Ltd. | | 102,530 | 40,301,672 |
|
| TOTAL KOREA (SOUTH) | | | 214,972,232 |
|
| Luxembourg - 0.8% | | | |
| Spotify Technology SA (a) | | 148,600 | 35,647,654 |
| Netherlands - 4.9% | | | |
| ASML Holding NV (Netherlands) | | 189,560 | 68,583,397 |
| Ferrari NV | | 206,847 | 36,894,502 |
| Takeaway.com Holding BV (a)(b) | | 323,800 | 36,021,898 |
| Wolters Kluwer NV | | 472,000 | 38,249,156 |
| Yandex NV Series A (a) | | 689,800 | 39,711,786 |
|
| TOTAL NETHERLANDS | | | 219,460,739 |
|
| Portugal - 0.8% | | | |
| Energias de Portugal SA | | 7,530,009 | 37,113,899 |
| Spain - 2.0% | | | |
| Cellnex Telecom SA (b) | | 654,116 | 41,991,309 |
| Iberdrola SA | | 4,143,417 | 48,859,510 |
|
| TOTAL SPAIN | | | 90,850,819 |
|
| Sweden - 2.7% | | | |
| Atlas Copco AB (A Shares) | | 977,300 | 43,151,709 |
| Hexagon AB (B Shares) | | 569,000 | 41,589,230 |
| Swedish Match Co. AB | | 521,100 | 39,271,067 |
|
| TOTAL SWEDEN | | | 124,012,006 |
|
| Switzerland - 6.8% | | | |
| Alcon, Inc. (Switzerland) (a) | | 652,000 | 37,045,859 |
| Givaudan SA | | 9,608 | 39,146,614 |
| Lonza Group AG | | 73,266 | 44,392,617 |
| Nestle SA (Reg. S) | | 931,330 | 104,754,074 |
| Partners Group Holding AG | | 42,259 | 38,095,086 |
| Sika AG | | 185,816 | 45,737,141 |
|
| TOTAL SWITZERLAND | | | 309,171,391 |
|
| Taiwan - 2.5% | | | |
| Taiwan Semiconductor Manufacturing Co. Ltd. | | 7,459,000 | 112,830,550 |
| United Kingdom - 4.7% | | | |
| Ashtead Group PLC | | 1,071,500 | 38,867,591 |
| AstraZeneca PLC (United Kingdom) | | 613,900 | 61,638,938 |
| Atlassian Corp. PLC (a) | | 190,600 | 36,522,772 |
| Aveva Group PLC | | 582,600 | 32,379,131 |
| London Stock Exchange Group PLC | | 379,800 | 40,941,651 |
|
| TOTAL UNITED KINGDOM | | | 210,350,083 |
|
| United States of America - 13.2% | | | |
| Adobe, Inc. (a) | | 77,700 | 34,739,670 |
| Alphabet, Inc. Class A (a) | | 22,000 | 35,554,420 |
| American Tower Corp. | | 152,400 | 34,998,660 |
| Autodesk, Inc. (a) | | 147,200 | 34,671,488 |
| Charter Communications, Inc. Class A (a) | | 58,100 | 35,081,942 |
| MasterCard, Inc. Class A | | 120,224 | 34,701,455 |
| MercadoLibre, Inc. (a) | | 29,700 | 36,057,285 |
| Microsoft Corp. | | 168,000 | 34,014,960 |
| Netflix, Inc. (a) | | 71,300 | 33,920,262 |
| NextEra Energy, Inc. | | 482,568 | 35,328,803 |
| NICE Systems Ltd. sponsored ADR (a)(c) | | 180,745 | 41,256,854 |
| NVIDIA Corp. | | 65,200 | 32,688,672 |
| Roper Technologies, Inc. | | 96,900 | 35,982,846 |
| S&P Global, Inc. | | 102,800 | 33,176,644 |
| SolarEdge Technologies, Inc. (a) | | 126,400 | 32,572,016 |
| Thermo Fisher Scientific, Inc. | | 75,500 | 35,720,560 |
| Visa, Inc. Class A | | 196,812 | 35,762,709 |
|
| TOTAL UNITED STATES OF AMERICA | | | 596,229,246 |
|
| TOTAL COMMON STOCKS | | | |
| (Cost $3,500,414,087) | | | 4,493,770,367 |
|
| Money Market Funds - 2.4% | | | |
| Fidelity Cash Central Fund 0.10% (d) | | 90,349,221 | 90,367,291 |
| Fidelity Securities Lending Cash Central Fund 0.11% (d)(e) | | 19,329,214 | 19,331,147 |
| TOTAL MONEY MARKET FUNDS | | | |
| (Cost $109,698,438) | | | 109,698,438 |
| TOTAL INVESTMENT IN SECURITIES - 102.0% | | | |
| (Cost $3,610,112,525) | | | 4,603,468,805 |
| NET OTHER ASSETS (LIABILITIES) - (2.0)% | | | (89,126,111) |
| NET ASSETS - 100% | | | $4,514,342,694 |
Categorizations in the Schedule of Investments are based on country or territory of incorporation.
Legend
(a) Non-income producing
(b) Security exempt from registration under Rule 144A of the Securities Act of 1933. These securities may be resold in transactions exempt from registration, normally to qualified institutional buyers. At the end of the period, the value of these securities amounted to $198,213,824 or 4.4% of net assets.
(c) Security or a portion of the security is on loan at period end.
(d) Affiliated fund that is generally available only to investment companies and other accounts managed by Fidelity Investments. The rate quoted is the annualized seven-day yield of the fund at period end. A complete unaudited listing of the fund's holdings as of its most recent quarter end is available upon request. In addition, each Fidelity Central Fund's financial statements, which are not covered by the Fund's Report of Independent Registered Public Accounting Firm, are available on the SEC's website or upon request.
(e) Investment made with cash collateral received from securities on loan.
Affiliated Central Funds
Information regarding fiscal year to date income earned by the Fund from investments in Fidelity Central Funds is as follows:
| Fund | Income earned |
| Fidelity Cash Central Fund | $285,893 |
| Fidelity Securities Lending Cash Central Fund | 90,662 |
| Total | $376,555 |
Amounts in the income column in the above table include any capital gain distributions from underlying funds, which are presented in the corresponding line-item in the Statement of Operations, if applicable. Amount for Fidelity Securities Lending Cash Central Fund represents the income earned on investing cash collateral, less rebates paid to borrowers and any lending agent fees associated with the loan, plus any premium payments received for lending certain types of securities.
Investment Valuation
The following is a summary of the inputs used, as of October 31, 2020, involving the Fund's assets and liabilities carried at fair value. The inputs or methodology used for valuing securities may not be an indication of the risk associated with investing in those securities. For more information on valuation inputs, and their aggregation into the levels used below, please refer to the Investment Valuation section in the accompanying Notes to Financial Statements.
| | Valuation Inputs at Reporting Date: |
| Description | Total | Level 1 | Level 2 | Level 3 |
| Investments in Securities: | | | | |
| Equities: | | | | |
| Communication Services | $514,157,010 | $299,171,098 | $214,985,912 | $-- |
| Consumer Discretionary | 798,463,549 | 634,928,580 | 163,534,969 | -- |
| Consumer Staples | 271,271,932 | 39,271,067 | 232,000,865 | -- |
| Energy | 52,614,583 | -- | 52,614,583 | -- |
| Financials | 281,487,030 | 105,087,610 | 176,399,420 | -- |
| Health Care | 355,965,505 | 111,224,158 | 244,741,347 | -- |
| Industrials | 684,701,185 | 479,744,556 | 204,956,629 | -- |
| Information Technology | 958,082,793 | 506,707,347 | 451,375,446 | -- |
| Materials | 245,675,530 | 204,401,246 | 41,274,284 | -- |
| Real Estate | 77,890,478 | 77,890,478 | -- | -- |
| Utilities | 253,460,772 | 204,102,446 | 49,358,326 | -- |
| Money Market Funds | 109,698,438 | 109,698,438 | -- | -- |
| Total Investments in Securities: | $4,603,468,805 | $2,772,227,024 | $1,831,241,781 | $-- |
See accompanying notes which are an integral part of the financial statements.
Fidelity® International Capital Appreciation Fund
Financial Statements
Statement of Assets and Liabilities
| | | October 31, 2020 |
| Assets | | |
Investment in securities, at value (including securities loaned of $18,877,102) — See accompanying schedule:
Unaffiliated issuers (cost $3,500,414,087) | $4,493,770,367 | |
| Fidelity Central Funds (cost $109,698,438) | 109,698,438 | |
| Total Investment in Securities (cost $3,610,112,525) | | $4,603,468,805 |
| Foreign currency held at value (cost $8,214,053) | | 8,214,053 |
| Receivable for investments sold | | 33,130,960 |
| Receivable for fund shares sold | | 4,619,160 |
| Dividends receivable | | 6,489,223 |
| Distributions receivable from Fidelity Central Funds | | 7,789 |
| Prepaid expenses | | 6,965 |
| Other receivables | | 1,427,434 |
| Total assets | | 4,657,364,389 |
| Liabilities | | |
| Payable for investments purchased | $114,889,177 | |
| Payable for fund shares redeemed | 2,161,219 | |
| Accrued management fee | 3,142,281 | |
| Other affiliated payables | 706,762 | |
| Other payables and accrued expenses | 2,791,131 | |
| Collateral on securities loaned | 19,331,125 | |
| Total liabilities | | 143,021,695 |
| Net Assets | | $4,514,342,694 |
| Net Assets consist of: | | |
| Paid in capital | | $3,467,836,240 |
| Total accumulated earnings (loss) | | 1,046,506,454 |
| Net Assets | | $4,514,342,694 |
| Net Asset Value, offering price and redemption price per share ($4,514,342,694 ÷ 183,739,718 shares) | | $24.57 |
See accompanying notes which are an integral part of the financial statements.
Statement of Operations
| | | Year ended October 31, 2020 |
| Investment Income | | |
| Dividends | | $53,918,515 |
| Income from Fidelity Central Funds (including $90,662 from security lending) | | 376,555 |
| Income before foreign taxes withheld | | 54,295,070 |
| Less foreign taxes withheld | | (5,002,667) |
| Total income | | 49,292,403 |
| Expenses | | |
| Management fee | | |
| Basic fee | $26,902,173 | |
| Performance adjustment | 5,278,156 | |
| Transfer agent fees | 6,149,571 | |
| Accounting fees | 1,514,760 | |
| Custodian fees and expenses | 565,503 | |
| Independent trustees' fees and expenses | 21,580 | |
| Registration fees | 200,594 | |
| Audit | 95,795 | |
| Legal | 11,106 | |
| Interest | 7,192 | |
| Miscellaneous | 57,340 | |
| Total expenses before reductions | 40,803,770 | |
| Expense reductions | (1,558,308) | |
| Total expenses after reductions | | 39,245,462 |
| Net investment income (loss) | | 10,046,941 |
| Realized and Unrealized Gain (Loss) | | |
| Net realized gain (loss) on: | | |
| Investment securities: | | |
| Unaffiliated issuers | 53,348,691 | |
| Fidelity Central Funds | 2,401 | |
| Foreign currency transactions | (1,068,592) | |
| Total net realized gain (loss) | | 52,282,500 |
| Change in net unrealized appreciation (depreciation) on: | | |
| Investment securities: | | |
| Unaffiliated issuers (net of increase in deferred foreign taxes of $1,649,166) | 403,997,930 | |
| Fidelity Central Funds | (21) | |
| Assets and liabilities in foreign currencies | 202,370 | |
| Total change in net unrealized appreciation (depreciation) | | 404,200,279 |
| Net gain (loss) | | 456,482,779 |
| Net increase (decrease) in net assets resulting from operations | | $466,529,720 |
See accompanying notes which are an integral part of the financial statements.
Statement of Changes in Net Assets
| | Year ended October 31, 2020 | Year ended October 31, 2019 |
| Increase (Decrease) in Net Assets | | |
| Operations | | |
| Net investment income (loss) | $10,046,941 | $21,808,052 |
| Net realized gain (loss) | 52,282,500 | 115,137,860 |
| Change in net unrealized appreciation (depreciation) | 404,200,279 | 391,442,046 |
| Net increase (decrease) in net assets resulting from operations | 466,529,720 | 528,387,958 |
| Distributions to shareholders | (120,186,215) | (61,297,938) |
| Share transactions | | |
| Proceeds from sales of shares | 1,441,046,707 | 1,248,280,152 |
| Reinvestment of distributions | 99,745,074 | 49,190,814 |
| Cost of shares redeemed | (853,557,177) | (448,878,222) |
| Net increase (decrease) in net assets resulting from share transactions | 687,234,604 | 848,592,744 |
| Total increase (decrease) in net assets | 1,033,578,109 | 1,315,682,764 |
| Net Assets | | |
| Beginning of period | 3,480,764,585 | 2,165,081,821 |
| End of period | $4,514,342,694 | $3,480,764,585 |
| Other Information | | |
| Shares | | |
| Sold | 64,137,836 | 60,147,411 |
| Issued in reinvestment of distributions | 4,470,868 | 2,708,745 |
| Redeemed | (40,187,064) | (22,432,438) |
| Net increase (decrease) | 28,421,640 | 40,423,718 |
See accompanying notes which are an integral part of the financial statements.
Financial Highlights
Fidelity International Capital Appreciation Fund
| | | | | | |
| Years ended October 31, | 2020 | 2019 | 2018 | 2017 | 2016 |
| Selected Per–Share Data | | | | | |
| Net asset value, beginning of period | $22.41 | $18.84 | $21.06 | $16.81 | $16.98 |
| Income from Investment Operations | | | | | |
| Net investment income (loss)A | .06 | .17B | .11 | .09 | .12 |
| Net realized and unrealized gain (loss) | 2.86 | 3.93 | (1.63) | 4.27 | (.03) |
| Total from investment operations | 2.92 | 4.10 | (1.52) | 4.36 | .09 |
| Distributions from net investment income | (.13) | (.08) | (.07) | (.11) | (.07) |
| Distributions from net realized gain | (.62) | (.45) | (.63) | – | (.19) |
| Total distributions | (.76)C | (.53) | (.70) | (.11) | (.26) |
| Redemption fees added to paid in capitalA | – | – | – | –D | –D |
| Net asset value, end of period | $24.57 | $22.41 | $18.84 | $21.06 | $16.81 |
| Total ReturnE | 13.35% | 22.45% | (7.51)% | 26.13% | .53% |
| Ratios to Average Net AssetsF,G | | | | | |
| Expenses before reductions | 1.03% | 1.01% | 1.06% | 1.12% | 1.14% |
| Expenses net of fee waivers, if any | 1.03% | 1.01% | 1.06% | 1.12% | 1.14% |
| Expenses net of all reductions | .99% | 1.00% | 1.01% | 1.10% | 1.12% |
| Net investment income (loss) | .25% | .81%B | .54% | .50% | .69% |
| Supplemental Data | | | | | |
| Net assets, end of period (000 omitted) | $4,514,343 | $3,480,765 | $2,165,082 | $2,112,031 | $1,782,912 |
| Portfolio turnover rateH | 135% | 131%I | 157%I | 178%I | 167% |
A Calculated based on average shares outstanding during the period.
B Net investment income per share reflects one or more large, non-recurring dividend(s) which amounted to $.08 per share. Such dividends are not annualized in the ratio of net investment income (loss) to average net assets. Excluding such non-recurring dividend(s) the ratio of net investment income (loss) to average net assets would have been .40%.
C Total distributions per share do not sum due to rounding.
D Amount represents less than $.005 per share.
E Total returns would have been lower if certain expenses had not been reduced during the applicable periods shown.
F Fees and expenses of any underlying mutual funds or exchange-traded funds (ETFs) are not included in the Fund's expense ratio. The Fund indirectly bears its proportionate share of these expenses. For additional expense information related to investments in Fidelity Central Funds, please refer to the "Investments in Fidelity Central Funds" note found in the Notes to Financial Statements section of the most recent Annual or Semi-Annual report.
G Expense ratios reflect operating expenses of the class. Expenses before reductions do not reflect amounts reimbursed, waived, or reduced through arrangements with the investment advisor, brokerage services, or other offset arrangements, if applicable, and do not represent the amount paid by the class during periods when reimbursements, waivers or reductions occur.
H Amount does not include the portfolio activity of any underlying mutual funds or exchange-traded funds (ETFs).
I Portfolio turnover rate excludes securities received or delivered in-kind.
See accompanying notes which are an integral part of the financial statements.
Notes to Financial Statements
For the period ended October 31, 2020
1. Organization.
Fidelity International Capital Appreciation Fund (the Fund) is a fund of Fidelity Investment Trust (the Trust) and is authorized to issue an unlimited number of shares. Share transactions on the Statement of Changes in Net Assets may contain exchanges between affiliated funds. The Trust is registered under the Investment Company Act of 1940, as amended (the 1940 Act), as an open-end management investment company organized as a Massachusetts business trust. The Fund's investments in emerging markets can be subject to social, economic, regulatory, and political uncertainties and can be extremely volatile.
Effective January 1, 2020:
Investment advisers Fidelity Investments Money Management, Inc., FMR Co., Inc., and Fidelity SelectCo, LLC, merged with and into Fidelity Management & Research Company. In connection with the merger transactions, the resulting, merged investment adviser was then redomiciled from Massachusetts to Delaware, changed its corporate structure from a corporation to a limited liability company, and changed its name to "Fidelity Management & Research Company LLC".
Fidelity Investments Institutional Operations Company, Inc. converted from a Massachusetts corporation to a Massachusetts LLC, and changed its name to "Fidelity Investments Institutional Operations Company LLC".
2. Investments in Fidelity Central Funds.
The Fund invests in Fidelity Central Funds, which are open-end investment companies generally available only to other investment companies and accounts managed by the investment adviser and its affiliates. The Fund's Schedule of Investments lists each of the Fidelity Central Funds held as of period end, if any, as an investment of the Fund, but does not include the underlying holdings of each Fidelity Central Fund. As an Investing Fund, the Fund indirectly bears its proportionate share of the expenses of the underlying Fidelity Central Funds.
The Money Market Central Funds seek preservation of capital and current income and are managed by the investment adviser. Annualized expenses of the Money Market Central Funds as of their most recent shareholder report date ranged from less than .005% to .01%.
A complete unaudited list of holdings for each Fidelity Central Fund is available upon request or at the Securities and Exchange Commission (the SEC) website at www.sec.gov. In addition, the financial statements of the Fidelity Central Funds, which are not covered by the Fund's Report of Independent Registered Public Accounting Firm, are available on the SEC website or upon request.
3. Significant Accounting Policies.
The Fund is an investment company and applies the accounting and reporting guidance of the Financial Accounting Standards Board (FASB) Accounting Standards Codification Topic 946 Financial Services – Investment Companies. The financial statements have been prepared in conformity with accounting principles generally accepted in the United States of America (GAAP), which require management to make certain estimates and assumptions at the date of the financial statements. Actual results could differ from those estimates. Subsequent events, if any, through the date that the financial statements were issued have been evaluated in the preparation of the financial statements. The following summarizes the significant accounting policies of the Fund:
Investment Valuation. Investments are valued as of 4:00 p.m. Eastern time on the last calendar day of the period. The Board of Trustees (the Board) has delegated the day to day responsibility for the valuation of the Fund's investments to the Fair Value Committee (the Committee) established by the Fund's investment adviser. In accordance with valuation policies and procedures approved by the Board, the Fund attempts to obtain prices from one or more third party pricing vendors or brokers to value its investments. When current market prices, quotations or currency exchange rates are not readily available or reliable, investments will be fair valued in good faith by the Committee, in accordance with procedures adopted by the Board. Factors used in determining fair value vary by investment type and may include market or investment specific events. The frequency with which these procedures are used cannot be predicted and they may be utilized to a significant extent. The Committee oversees the Fund's valuation policies and procedures and reports to the Board on the Committee's activities and fair value determinations. The Board monitors the appropriateness of the procedures used in valuing the Fund's investments and ratifies the fair value determinations of the Committee.
The Fund categorizes the inputs to valuation techniques used to value its investments into a disclosure hierarchy consisting of three levels as shown below:
- Level 1 – quoted prices in active markets for identical investments
- Level 2 – other significant observable inputs (including quoted prices for similar investments, interest rates, prepayment speeds, etc.)
- Level 3 – unobservable inputs (including the Fund's own assumptions based on the best information available)
Valuation techniques used to value the Fund's investments by major category are as follows:
Equity securities, including restricted securities, for which market quotations are readily available, are valued at the last reported sale price or official closing price as reported by a third party pricing vendor on the primary market or exchange on which they are traded and are categorized as Level 1 in the hierarchy. In the event there were no sales during the day or closing prices are not available, securities are valued at the last quoted bid price or may be valued using the last available price and are generally categorized as Level 2 in the hierarchy. For foreign equity securities, when market or security specific events arise, comparisons to the valuation of American Depositary Receipts (ADRs), futures contracts, Exchange-Traded Funds (ETFs) and certain indexes as well as quoted prices for similar securities may be used and would be categorized as Level 2 in the hierarchy. For equity securities, including restricted securities, where observable inputs are limited, assumptions about market activity and risk are used and these securities may be categorized as Level 3 in the hierarchy.
Investments in open-end mutual funds, including the Fidelity Central Funds, are valued at their closing net asset value (NAV) each business day and are categorized as Level 1 in the hierarchy.
Changes in valuation techniques may result in transfers in or out of an assigned level within the disclosure hierarchy. The aggregate value of investments by input level as of October 31, 2020 is included at the end of the Fund's Schedule of Investments.
Foreign Currency. Certain Funds may use foreign currency contracts to facilitate transactions in foreign-denominated securities. Gains and losses from these transactions may arise from changes in the value of the foreign currency or if the counterparties do not perform under the contracts' terms.
Foreign-denominated assets, including investment securities, and liabilities are translated into U.S. dollars at the exchange rates at period end. Purchases and sales of investment securities, income and dividends received, and expenses denominated in foreign currencies are translated into U.S. dollars at the exchange rate in effect on the transaction date.
The effects of exchange rate fluctuations on investments are included with the net realized and unrealized gain (loss) on investment securities. Other foreign currency transactions resulting in realized and unrealized gain (loss) are disclosed separately.
Investment Transactions and Income. For financial reporting purposes, the Fund's investment holdings and NAV include trades executed through the end of the last business day of the period. The NAV per share for processing shareholder transactions is calculated as of the close of business of the New York Stock Exchange (NYSE), normally 4:00 p.m. Eastern time and includes trades executed through the end of the prior business day. Gains and losses on securities sold are determined on the basis of identified cost and include proceeds received from litigation. Dividend income is recorded on the ex-dividend date, except for certain dividends from foreign securities where the ex-dividend date may have passed, which are recorded as soon as the Fund is informed of the ex-dividend date. Non-cash dividends included in dividend income, if any, are recorded at the fair market value of the securities received. Income and capital gain distributions from Fidelity Central Funds, if any, are recorded on the ex-dividend date. Certain distributions received by the Fund represent a return of capital or capital gain. The Fund determines the components of these distributions subsequent to the ex-dividend date, based upon receipt of tax filings or other correspondence relating to the underlying investment. These distributions are recorded as a reduction of cost of investments and/or as a realized gain. Investment income is recorded net of foreign taxes withheld where recovery of such taxes is uncertain.
Expenses. Expenses directly attributable to a fund are charged to that fund. Expenses attributable to more than one fund are allocated among the respective funds on the basis of relative net assets or other appropriate methods. Expense estimates are accrued in the period to which they relate and adjustments are made when actual amounts are known.
Income Tax Information and Distributions to Shareholders. Each year, the Fund intends to qualify as a regulated investment company under Subchapter M of the Internal Revenue Code, including distributing substantially all of its taxable income and realized gains. As a result, no provision for U.S. Federal income taxes is required. As of October 31, 2020, the Fund did not have any unrecognized tax benefits in the financial statements; nor is the Fund aware of any tax positions for which it is reasonably possible that the total amounts of unrecognized tax benefits will significantly change in the next twelve months. The Fund files a U.S. federal tax return, in addition to state and local tax returns as required. The Fund's federal income tax returns are subject to examination by the Internal Revenue Service (IRS) for a period of three fiscal years after they are filed. State and local tax returns may be subject to examination for an additional fiscal year depending on the jurisdiction. Foreign taxes are provided for based on the Fund's understanding of the tax rules and rates that exist in the foreign markets in which it invests. The Fund is subject to a tax imposed on capital gains by certain countries in which it invests. An estimated deferred tax liability for net unrealized appreciation on the applicable securities is included in Other payables and accrued expenses on the Statement of Assets & Liabilities.
Distributions are declared and recorded on the ex-dividend date. Income and capital gain distributions are determined in accordance with income tax regulations, which may differ from GAAP. In addition, the Fund claimed a portion of the payment made to redeeming shareholders as a distribution for income tax purposes.
Capital accounts within the financial statements are adjusted for permanent book-tax differences. These adjustments have no impact on net assets or the results of operations. Capital accounts are not adjusted for temporary book-tax differences which will reverse in a subsequent period.
Book-tax differences are primarily due to foreign currency transactions, passive foreign investment companies (PFIC) and losses deferred due to wash sales.
As of period end, the cost and unrealized appreciation (depreciation) in securities, and derivatives if applicable, for federal income tax purposes were as follows:
| Gross unrealized appreciation | $1,034,721,297 |
| Gross unrealized depreciation | (51,489,250) |
| Net unrealized appreciation (depreciation) | $983,232,047 |
| Tax Cost | $3,620,236,758 |
The tax-based components of distributable earnings as of period end were as follows:
| Undistributed ordinary income | $8,889,250 |
| Undistributed long-term capital gain | $56,903,414 |
| Net unrealized appreciation (depreciation) on securities and other investments | $983,313,676 |
The tax character of distributions paid was as follows:
| | October 31, 2020 | October 31, 2019 |
| Ordinary Income | $21,331,063 | $ 9,527,582 |
| Long-term Capital Gains | 98,855,152 | 51,770,356 |
| Total | $120,186,215 | $ 61,297,938 |
Restricted Securities (including Private Placements). The Fund may invest in securities that are subject to legal or contractual restrictions on resale. These securities generally may be resold in transactions exempt from registration or to the public if the securities are registered. Disposal of these securities may involve time-consuming negotiations and expense, and prompt sale at an acceptable price may be difficult. Information regarding restricted securities is included at the end of the Fund's Schedule of Investments.
4. Purchases and Sales of Investments.
Purchases and sales of securities, other than short-term securities are noted in the table below.
| | Purchases ($) | Sales ($) |
| Fidelity International Capital Appreciation Fund | 5,894,414,888 | 5,245,348,843 |
Prior Fiscal Year Unaffiliated Redemptions In-Kind. During the prior period, 478,492 shares of the Fund were redeemed in-kind for investments and cash with a value of $9,668,871. The Fund had a net realized gain of $2,622,350 on investments delivered through in-kind redemptions. The amount of the in-kind redemptions is included in share transactions in the accompanying Statement of Changes in Net Assets. The Fund recognized no gain or loss for federal income tax purposes.
5. Fees and Other Transactions with Affiliates.
Management Fee. Fidelity Management & Research Company LLC (the investment adviser) and its affiliates provide the Fund with investment management related services for which the Fund pays a monthly management fee. The management fee is the sum of an individual fund fee rate that is based on an annual rate of .45% of the Fund's average net assets and an annualized group fee rate that averaged .23% during the period. The group fee rate is based upon the monthly average net assets of a group of registered investment companies with which the investment adviser has management contracts. The group fee rate decreases as assets under management increase and increases as assets under management decrease. In addition, the management fee is subject to a performance adjustment (up to a maximum of +/- .20% of the Fund's average net assets over a 36 month performance period). The upward or downward adjustment to the management fee is based on the Fund's relative investment performance as compared to its benchmark index, the MSCI All Country World ex USA Index, over the same 36 month performance period. For the reporting period, the total annual management fee rate, including the performance adjustment, was .81% of the Fund's average net assets. The performance adjustment included in the management fee rate may be higher or lower than the maximum performance adjustment rate due to the difference between the average net assets for the reporting and performance periods.
Transfer Agent Fees. Fidelity Investments Institutional Operations Company LLC (FIIOC), an affiliate of the investment adviser, is the Fund's transfer, dividend disbursing and shareholder servicing agent. FIIOC receives account fees and asset-based fees that vary according to account size and type of account. FIIOC pays for typesetting, printing and mailing of shareholder reports, except proxy statements. For the period, the transfer agent fees were equivalent to an annual rate of .16% of average net assets.
Accounting Fees. Fidelity Service Company, Inc. (FSC), an affiliate of the investment adviser, maintains the Fund's accounting records. The accounting fee is based on the level of average net assets for each month. For the period, the fees were equivalent to the following annual rates:
| | % of Average Net Assets |
| Fidelity International Capital Appreciation Fund | .04 |
Brokerage Commissions. A portion of portfolio transactions were placed with brokerage firms which are affiliates of the investment adviser. Brokerage commissions are included in net realized gain (loss) and change in net unrealized appreciation (depreciation) in the Statement of Operations. The commissions paid to these affiliated firms were as follows:
| | Amount |
| Fidelity International Capital Appreciation Fund | $27,660 |
Interfund Lending Program. Pursuant to an Exemptive Order issued by the SEC, the Fund, along with other registered investment companies having management contracts with Fidelity Management & Research Company LLC (FMR), or other affiliated entities of FMR, may participate in an interfund lending program. This program provides an alternative credit facility allowing the Fund to borrow from, or lend money to, other participating affiliated funds. At period end, there were no interfund loans outstanding. Activity in this program during the period for which loans were outstanding was as follows:
| | Borrower or Lender | Average Loan Balance | Weighted Average Interest Rate | Interest Expense |
| Fidelity International Capital Appreciation Fund | Borrower | $17,206,406 | .47% | $7,192 |
Interfund Trades. Funds may purchase from or sell securities to other Fidelity Funds under procedures adopted by the Board. The procedures have been designed to ensure these interfund trades are executed in accordance with Rule 17a-7 of the 1940 Act. Interfund trades are included within the respective purchases and sales amounts shown in the Purchases and Sales of Investments note.
6. Committed Line of Credit.
Certain Funds participate with other funds managed by the investment adviser or an affiliate in a $4.25 billion credit facility (the "line of credit") to be utilized for temporary or emergency purposes to fund shareholder redemptions or for other short-term liquidity purposes. The participating funds have agreed to pay commitment fees on their pro-rata portion of the line of credit, which are reflected in Miscellaneous expenses on the Statement of Operations, and are as follows:
| | Amount |
| Fidelity International Capital Appreciation Fund | $8,995 |
During the period, there were no borrowings on this line of credit.
7. Security Lending.
Funds lend portfolio securities from time to time in order to earn additional income. Lending agents are used, including National Financial Services (NFS), an affiliate of the investment adviser. Pursuant to a securities lending agreement, NFS will receive a fee, which is capped at 9.9% of a fund's daily lending revenue, for its services as lending agent. A fund may lend securities to certain qualified borrowers, including NFS. On the settlement date of the loan, a fund receives collateral (in the form of U.S. Treasury obligations, letters of credit and/or cash) against the loaned securities and maintains collateral in an amount not less than 100% of the market value of the loaned securities during the period of the loan. The market value of the loaned securities is determined at the close of business of a fund and any additional required collateral is delivered to a fund on the next business day. A fund or borrower may terminate the loan at any time, and if the borrower defaults on its obligation to return the securities loaned because of insolvency or other reasons, a fund may apply collateral received from the borrower against the obligation. A fund may experience delays and costs in recovering the securities loaned. Any cash collateral received is invested in the Fidelity Securities Lending Cash Central Fund. Any loaned securities are identified as such in the Schedule of Investments, and the value of loaned securities and cash collateral at period end, as applicable, are presented in the Statement of Assets and Liabilities. Security lending income represents the income earned on investing cash collateral, less rebates paid to borrowers and any lending agent fees associated with the loan, plus any premium payments received for lending certain types of securities. Security lending income is presented in the Statement of Operations as a component of income from Fidelity Central Funds. Affiliated security lending activity, if any, was as follows:
| | Total Security Lending Income Fees Paid to NFS | Security Lending Income From Securities Loaned to NFS | Value of Securities Loaned to NFS at Period End |
| Fidelity International Capital Appreciation Fund | $1,648 | $– | $– |
8. Expense Reductions.
Commissions paid to certain brokers with whom the investment adviser, or its affiliates, places trades on behalf of the Fund include an amount in addition to trade execution, which may be rebated back to the Fund to offset certain expenses. This amount totaled $1,542,976 for the period. In addition, through arrangements with the Fund's custodian, credits realized as a result of certain uninvested cash balances were used to reduce the Fund's expenses by $465.
In addition, during the period the investment adviser or an affiliate reimbursed and/or waived a portion of operating expenses in the amount of $14,867.
9. Other.
The Fund's organizational documents provide former and current trustees and officers with a limited indemnification against liabilities arising in connection with the performance of their duties to the Fund. In the normal course of business, the Fund may also enter into contracts that provide general indemnifications. The Fund's maximum exposure under these arrangements is unknown as this would be dependent on future claims that may be made against the Fund. The risk of material loss from such claims is considered remote.
At the end of the period, Strategic Advisers Fidelity International Fund was the owner of record of approximately 30% of the total outstanding shares of the Fund. Mutual funds managed by the investment adviser or its affiliates were the owners of record, in the aggregate, of approximately 35% of the total outstanding shares of the Fund.
10. Coronavirus (COVID-19) Pandemic.
An outbreak of COVID-19 first detected in China during December 2019 has since spread globally and was declared a pandemic by the World Health Organization during March 2020. Developments that disrupt global economies and financial markets, such as the COVID-19 pandemic, may magnify factors that affect the Fund's performance.
Fidelity® Overseas Fund
Performance: The Bottom Line
Average annual total return reflects the change in the value of an investment, assuming reinvestment of distributions from dividend income and capital gains (the profits earned upon the sale of securities that have grown in value, if any) and assuming a constant rate of performance each year. The hypothetical investment and the average annual total returns do not reflect the deduction of taxes that a shareholder would pay on fund distributions or the redemption of fund shares. During periods of reimbursement by Fidelity, a fund’s total return will be greater than it would be had the reimbursement not occurred. How a fund did yesterday is no guarantee of how it will do tomorrow.
Average Annual Total Returns
| For the periods ended October 31, 2020 | Past 1 year | Past 5 years | Past 10 years |
| Fidelity® Overseas Fund | 4.25% | 6.48% | 7.18% |
| Class K | 4.36% | 6.61% | 7.33% |
$10,000 Over 10 Years
Let's say hypothetically that $10,000 was invested in Fidelity® Overseas Fund, a class of the fund, on October 31, 2010.
The chart shows how the value of your investment would have changed, and also shows how the MSCI EAFE Index performed over the same period.
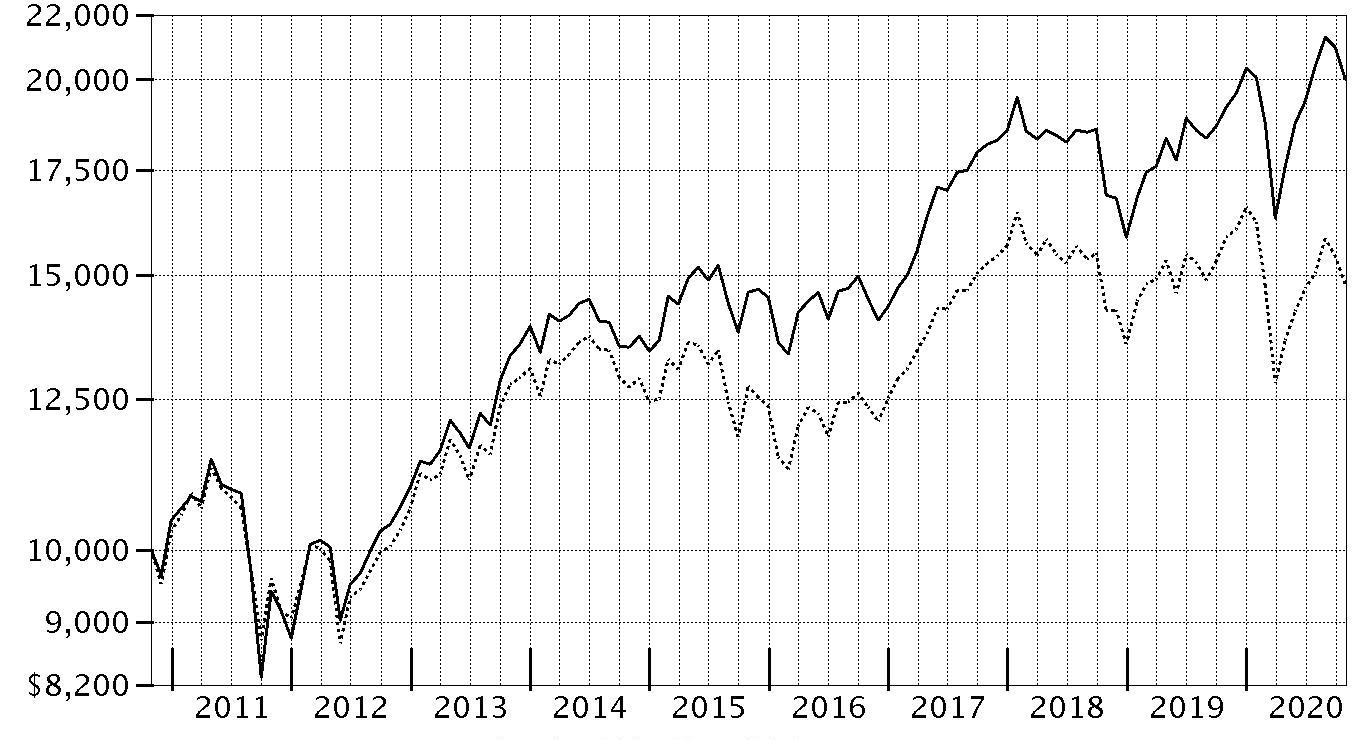
| Period Ending Values |
| $20,009 | Fidelity® Overseas Fund |
| $14,800 | MSCI EAFE Index |
Fidelity® Overseas Fund
Management's Discussion of Fund Performance
Market Recap: The MSCI ACWI (All Country World Index) ex USA Index returned -2.46% for the 12 months ending October 31, 2020, in what was a bumpy ride for non-U.S. equities, marked by a steep but brief decline due to the early-2020 outbreak and spread of the coronavirus, followed by a sharp upturn. Declared a pandemic on March 11, the crisis and containment efforts caused broad contraction in economic activity, elevated volatility and dislocation in financial markets. A historically rapid and expansive monetary- and fiscal-policy response around the world provided a partial offset to the economic disruption.Other supporting factors included resilient corporate earnings and near-term potential for a COVID-19 vaccine breakthrough. This was evident in the index’s 12.28% gain in the final six months of the year. Currency fluctuation generally boosted foreign developed-markets equities for the year, while the reverse was true for emerging-markets stocks. Late in the period, the index was pressured by a second wave of COVID-19 cases in some regions, and stretched valuations and crowded positioning in big tech. For the full year, the U.K. (-22%), Asia Pacific ex Japan (-8%), Canada (-5%) and Europe ex U.K. (-4%) notably lagged. Emerging markets (+9%) and Japan (+1%) outperformed. By sector, energy (-38%), financials and real estate (-20% each) lagged, whereas information technology (+ 25%) and communication services (+15%) topped the index.
Comments from Portfolio Manager Vincent Montemaggiore: For the fiscal year ending October 31, 2020, the fund's share classes gained about 4%, outperforming the -6.69% result of the benchmark MSCI EAFE Index. From a regional standpoint, an overweighting and stock picks in Europe ex U.K. and security selection in the U.K. and Japan contributed most to the fund's relative result. By sector, the primary contributor to performance versus the benchmark was our stock picks in industrials. Strong stock choices in the financials sector, especially within the banks industry, also helped. Also bolstering the fund's relative result was an overweighting in information technology. Not owning Royal Dutch Shell, a benchmark component that returned -55%, was the biggest individual contributor versus the benchmark. Also boosting value was our overweighting in DSV Panalpina, which gained roughly 68%. DSV Panalpina was among the largest holdings as of October 31. The fund's non-benchmark stake in Indutrade gained about 65%. Conversely, an underweighting in Japan hindered the fund's relative result. By sector, the primary detractor from performance versus the benchmark was our security selection in information technology. Also hampering the fund's relative result was an underweighting in utilities and materials. The biggest individual relative detractor was an overweight position in Compass Group (-48%). Our second-largest relative detractor this period was avoiding Softbank, a benchmark component that gained 69%. Another key detractor was our out-of-benchmark position in IRB Brasil Russeguros (-52%), a position not held at period end. Notable changes in positioning include increased exposure to Sweden and a lower allocation to Germany. By sector, notable changes include increased exposure to information technology and a lower allocation to consumer staples.
The views expressed above reflect those of the portfolio manager(s) only through the end of the period as stated on the cover of this report and do not necessarily represent the views of Fidelity or any other person in the Fidelity organization. Any such views are subject to change at any time based upon market or other conditions and Fidelity disclaims any responsibility to update such views. These views may not be relied on as investment advice and, because investment decisions for a Fidelity fund are based on numerous factors, may not be relied on as an indication of trading intent on behalf of any Fidelity fund.
Fidelity® Overseas Fund
Investment Summary (Unaudited)
Geographic Diversification (% of fund's net assets)
| As of October 31, 2020 |
| | Japan | 16.7% |
| | France | 10.9% |
| | Switzerland | 10.8% |
| | United Kingdom | 10.0% |
| | United States of America* | 9.7% |
| | Netherlands | 7.4% |
| | Sweden | 5.9% |
| | Germany | 5.2% |
| | Spain | 2.3% |
| | Other | 21.1% |
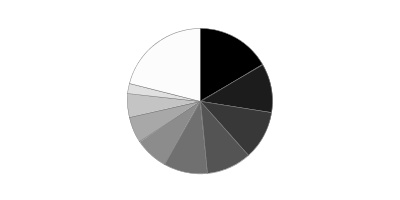
* Includes Short-Term investments and Net Other Assets (Liabilities).
Percentages are based on country or territory of incorporation and are adjusted for the effect of futures contracts, if applicable.
Asset Allocation as of October 31, 2020
| | % of fund's net assets |
| Stocks | 96.4 |
| Short-Term Investments and Net Other Assets (Liabilities) | 3.6 |
Top Ten Stocks as of October 31, 2020
| | % of fund's net assets |
| Nestle SA (Reg. S) (Switzerland, Food Products) | 3.0 |
| Roche Holding AG (participation certificate) (Switzerland, Pharmaceuticals) | 2.3 |
| LVMH Moet Hennessy Louis Vuitton SE (France, Textiles, Apparel & Luxury Goods) | 1.9 |
| ASML Holding NV (Netherlands) (Netherlands, Semiconductors & Semiconductor Equipment) | 1.8 |
| AIA Group Ltd. (Hong Kong, Insurance) | 1.6 |
| Iberdrola SA (Spain, Electric Utilities) | 1.5 |
| Hoya Corp. (Japan, Health Care Equipment & Supplies) | 1.5 |
| Sony Corp. (Japan, Household Durables) | 1.4 |
| DSV Panalpina A/S (Denmark, Air Freight & Logistics) | 1.4 |
| London Stock Exchange Group PLC (United Kingdom, Capital Markets) | 1.3 |
| | 17.7 |
Top Market Sectors as of October 31, 2020
| | % of fund's net assets |
| Industrials | 17.9 |
| Information Technology | 17.5 |
| Financials | 16.0 |
| Health Care | 15.2 |
| Consumer Staples | 10.3 |
| Consumer Discretionary | 9.8 |
| Materials | 3.8 |
| Communication Services | 2.1 |
| Utilities | 1.5 |
| Real Estate | 1.5 |
Fidelity® Overseas Fund
Schedule of Investments October 31, 2020
Showing Percentage of Net Assets
| Common Stocks - 96.4% | | | |
| | | Shares | Value |
| Austria - 0.3% | | | |
| Erste Group Bank AG | | 990,600 | $20,282,086 |
| Bailiwick of Jersey - 1.3% | | | |
| Experian PLC | | 1,598,579 | 58,562,181 |
| Sanne Group PLC | | 4,819,178 | 37,834,065 |
|
| TOTAL BAILIWICK OF JERSEY | | | 96,396,246 |
|
| Belgium - 0.6% | | | |
| KBC Groep NV | | 946,654 | 46,669,696 |
| Bermuda - 2.1% | | | |
| Credicorp Ltd. (United States) | | 195,100 | 22,374,068 |
| Genpact Ltd. | | 973,500 | 33,459,195 |
| Hiscox Ltd. (a) | | 2,668,713 | 28,502,127 |
| IHS Markit Ltd. | | 790,000 | 63,887,300 |
|
| TOTAL BERMUDA | | | 148,222,690 |
|
| Canada - 1.0% | | | |
| Constellation Software, Inc. | | 65,000 | 68,234,144 |
| Cayman Islands - 0.8% | | | |
| Alibaba Group Holding Ltd. sponsored ADR (a) | | 197,300 | 60,115,337 |
| China - 0.5% | | | |
| Gree Electric Appliances, Inc. of Zhuhai (A Shares) | | 3,686,000 | 32,351,447 |
| Denmark - 1.4% | | | |
| DSV Panalpina A/S | | 608,800 | 98,577,597 |
| Finland - 0.7% | | | |
| Nordea Bank ABP (Stockholm Stock Exchange) | | 6,410,800 | 48,114,775 |
| France - 10.9% | | | |
| ALTEN (a) | | 459,856 | 36,766,969 |
| Amundi SA (b) | | 523,506 | 34,326,181 |
| BNP Paribas SA (a) | | 1,147,400 | 40,015,324 |
| Capgemini SA | | 584,933 | 67,538,353 |
| Dassault Systemes SA | | 314,300 | 53,644,553 |
| Edenred SA | | 1,231,479 | 57,427,050 |
| Kering SA | | 105,626 | 63,784,481 |
| Legrand SA | | 805,900 | 59,581,784 |
| LVMH Moet Hennessy Louis Vuitton SE | | 283,063 | 132,685,119 |
| Pernod Ricard SA | | 401,300 | 64,684,567 |
| Sanofi SA | | 961,200 | 86,790,012 |
| SR Teleperformance SA | | 292,766 | 87,867,948 |
|
| TOTAL FRANCE | | | 785,112,341 |
|
| Germany - 5.2% | | | |
| adidas AG | | 258,342 | 76,723,892 |
| Allianz SE | | 381,500 | 67,118,069 |
| Deutsche Borse AG | | 399,200 | 58,743,688 |
| Hannover Reuck SE | | 375,200 | 54,490,992 |
| SAP SE | | 393,045 | 41,931,866 |
| Vonovia SE | | 1,115,100 | 71,194,800 |
|
| TOTAL GERMANY | | | 370,203,307 |
|
| Hong Kong - 1.6% | | | |
| AIA Group Ltd. | | 11,975,400 | 113,971,994 |
| India - 1.4% | | | |
| HDFC Bank Ltd. | | 2,623,200 | 41,643,687 |
| Reliance Industries Ltd. | | 2,079,600 | 57,314,234 |
| Reliance Industries Ltd. | | 140,753 | 2,229,824 |
|
| TOTAL INDIA | | | 101,187,745 |
|
| Indonesia - 0.3% | | | |
| PT Bank Rakyat Indonesia Tbk | | 92,972,500 | 21,046,370 |
| Ireland - 2.1% | | | |
| DCC PLC (United Kingdom) | | 265,430 | 17,275,756 |
| Kerry Group PLC Class A | | 447,748 | 53,554,939 |
| Linde PLC | | 191,300 | 42,151,042 |
| United Drug PLC (United Kingdom) | | 3,744,303 | 35,192,152 |
|
| TOTAL IRELAND | | | 148,173,889 |
|
| Italy - 1.8% | | | |
| FinecoBank SpA | | 3,649,600 | 49,943,453 |
| GVS SpA (b) | | 522,300 | 7,360,390 |
| Recordati SpA | | 1,381,730 | 71,594,724 |
|
| TOTAL ITALY | | | 128,898,567 |
|
| Japan - 16.7% | | | |
| A/S One Corp. | | 153,700 | 22,212,616 |
| Astellas Pharma, Inc. | | 2,845,200 | 39,016,059 |
| Curves Holdings Co. Ltd. | | 1,062,250 | 6,526,457 |
| Daikin Industries Ltd. | | 345,000 | 64,560,974 |
| Elecom Co. Ltd. | | 611,350 | 30,616,683 |
| Hoya Corp. | | 923,000 | 104,166,954 |
| Iriso Electronics Co. Ltd. | | 496,500 | 18,903,886 |
| IT Holdings Corp. | | 1,240,600 | 23,726,652 |
| Kao Corp. | | 809,300 | 57,621,117 |
| Keyence Corp. | | 182,060 | 82,622,924 |
| KH Neochem Co. Ltd. | | 1,022,650 | 23,930,367 |
| Koshidaka Holdings Co. Ltd. | | 1,062,250 | 3,973,701 |
| Nexon Co. Ltd. | | 1,898,600 | 52,915,712 |
| Nitori Holdings Co. Ltd. | | 259,600 | 53,362,514 |
| NOF Corp. | | 946,200 | 35,560,399 |
| Olympus Corp. | | 2,094,800 | 40,103,023 |
| Oracle Corp. Japan | | 240,200 | 24,005,610 |
| Otsuka Corp. | | 358,800 | 16,487,459 |
| Persol Holdings Co., Ltd. | | 2,264,500 | 34,298,574 |
| Recruit Holdings Co. Ltd. | | 1,711,700 | 65,131,343 |
| Relo Group, Inc. | | 1,359,400 | 32,623,936 |
| S Foods, Inc. | | 604,100 | 20,119,979 |
| SMC Corp. | | 127,300 | 67,711,591 |
| Sony Corp. | | 1,212,300 | 101,065,185 |
| Suzuki Motor Corp. | | 944,400 | 40,559,810 |
| Tokyo Electron Ltd. | | 293,200 | 78,698,067 |
| Tsuruha Holdings, Inc. | | 426,500 | 59,720,679 |
|
| TOTAL JAPAN | | | 1,200,242,271 |
|
| Kenya - 0.4% | | | |
| Safaricom Ltd. | | 98,250,200 | 27,858,627 |
| Korea (South) - 1.2% | | | |
| LG Chemical Ltd. | | 74,990 | 40,800,930 |
| Samsung Electronics Co. Ltd. | | 903,970 | 45,338,928 |
|
| TOTAL KOREA (SOUTH) | | | 86,139,858 |
|
| Mexico - 0.2% | | | |
| Grupo Financiero Banorte S.A.B. de CV Series O (a) | | 3,367,500 | 15,002,652 |
| Netherlands - 7.4% | | | |
| ASM International NV (Netherlands) | | 222,200 | 31,778,826 |
| ASML Holding NV (Netherlands) | | 360,900 | 130,574,741 |
| BE Semiconductor Industries NV | | 648,600 | 26,204,548 |
| Euronext NV (b) | | 358,800 | 37,420,833 |
| IMCD NV | | 706,424 | 81,829,393 |
| JDE Peet's BV | | 1,671,706 | 59,576,743 |
| Koninklijke Philips Electronics NV | | 1,903,398 | 88,159,258 |
| Wolters Kluwer NV | | 949,600 | 76,952,115 |
|
| TOTAL NETHERLANDS | | | 532,496,457 |
|
| New Zealand - 0.5% | | | |
| EBOS Group Ltd. | | 2,243,701 | 38,191,013 |
| Norway - 1.0% | | | |
| Adevinta ASA Class B (a) | | 1,480,971 | 22,881,662 |
| Schibsted ASA (A Shares) | | 1,285,900 | 52,423,864 |
|
| TOTAL NORWAY | | | 75,305,526 |
|
| South Africa - 0.9% | | | |
| Naspers Ltd. Class N | | 333,000 | 65,010,779 |
| Spain - 2.3% | | | |
| Amadeus IT Holding SA Class A | | 1,193,857 | 56,993,543 |
| Iberdrola SA | | 9,328,418 | 110,001,462 |
|
| TOTAL SPAIN | | | 166,995,005 |
|
| Sweden - 5.9% | | | |
| Addlife AB | | 3,592,872 | 54,031,976 |
| AddTech AB (B Shares) | | 4,038,464 | 44,703,397 |
| ASSA ABLOY AB (B Shares) | | 2,468,800 | 52,912,480 |
| Atlas Copco AB (A Shares) | | 1,359,086 | 60,009,090 |
| Hexagon AB (B Shares) | | 1,031,206 | 75,372,694 |
| Indutrade AB (a) | | 1,525,867 | 77,404,518 |
| Swedish Match Co. AB | | 793,200 | 59,777,030 |
|
| TOTAL SWEDEN | | | 424,211,185 |
|
| Switzerland - 10.8% | | | |
| Alcon, Inc. (a) | | 709,700 | 40,339,348 |
| Julius Baer Group Ltd. | | 1,210,979 | 54,067,812 |
| Lonza Group AG | | 147,172 | 89,173,017 |
| Nestle SA (Reg. S) | | 1,901,240 | 213,847,546 |
| Roche Holding AG (participation certificate) | | 520,798 | 167,348,821 |
| Sika AG | | 353,652 | 87,048,646 |
| Sonova Holding AG Class B | | 229,861 | 54,522,894 |
| Zurich Insurance Group Ltd. | | 211,490 | 70,245,488 |
|
| TOTAL SWITZERLAND | | | 776,593,572 |
|
| Taiwan - 1.0% | | | |
| Taiwan Semiconductor Manufacturing Co. Ltd. | | 4,545,000 | 68,751,153 |
| United Kingdom - 10.0% | | | |
| Beazley PLC | | 7,068,600 | 26,922,672 |
| Compass Group PLC | | 4,022,398 | 55,057,568 |
| Cranswick PLC | | 729,261 | 30,402,300 |
| Dechra Pharmaceuticals PLC | | 860,495 | 38,927,813 |
| Diageo PLC | | 2,806,200 | 90,690,434 |
| Diploma PLC | | 1,553,695 | 44,805,192 |
| Hilton Food Group PLC | | 1,974,389 | 29,670,723 |
| James Fisher and Sons PLC | | 937,658 | 13,775,106 |
| JTC PLC (b) | | 2,622,500 | 18,278,274 |
| London Stock Exchange Group PLC | | 867,358 | 93,499,391 |
| Mondi PLC | | 2,267,600 | 42,978,197 |
| Prudential PLC | | 2,311,171 | 28,266,784 |
| RELX PLC (London Stock Exchange) | | 3,270,300 | 64,715,190 |
| Rentokil Initial PLC (a) | | 9,771,700 | 66,587,588 |
| Smith & Nephew PLC | | 2,328,600 | 40,434,136 |
| Ultra Electronics Holdings PLC | | 367,094 | 8,940,721 |
| Victrex PLC | | 145,608 | 3,480,319 |
| Volution Group PLC | | 7,137,967 | 17,939,638 |
|
| TOTAL UNITED KINGDOM | | | 715,372,046 |
|
| United States of America - 6.1% | | | |
| Ares Management Corp. | | 943,800 | 39,922,740 |
| Aspen Technology, Inc. (a) | | 44,140 | 4,847,013 |
| Becton, Dickinson & Co. | | 171,600 | 39,661,908 |
| Black Knight, Inc. (a) | | 434,800 | 38,240,660 |
| Boston Scientific Corp. (a) | | 987,900 | 33,855,333 |
| Fidelity National Information Services, Inc. | | 257,100 | 32,032,089 |
| Global Payments, Inc. | | 304,424 | 48,019,842 |
| Intercontinental Exchange, Inc. | | 433,300 | 40,903,520 |
| Marsh & McLennan Companies, Inc. | | 568,800 | 58,848,048 |
| NICE Systems Ltd. sponsored ADR (a) | | 249,397 | 56,927,359 |
| Roper Technologies, Inc. | | 130,400 | 48,422,736 |
|
| TOTAL UNITED STATES OF AMERICA | | | 441,681,248 |
|
| TOTAL COMMON STOCKS | | | |
| (Cost $5,365,017,041) | | | 6,921,409,623 |
|
| Money Market Funds - 3.4% | | | |
| Fidelity Cash Central Fund 0.10% (c) | | | |
| (Cost $244,924,728) | | 244,875,753 | 244,924,728 |
| TOTAL INVESTMENT IN SECURITIES - 99.8% | | | |
| (Cost $5,609,941,769) | | | 7,166,334,351 |
| NET OTHER ASSETS (LIABILITIES) - 0.2% | | | 16,684,883 |
| NET ASSETS - 100% | | | $7,183,019,234 |
Categorizations in the Schedule of Investments are based on country or territory of incorporation.
Legend
(a) Non-income producing
(b) Security exempt from registration under Rule 144A of the Securities Act of 1933. These securities may be resold in transactions exempt from registration, normally to qualified institutional buyers. At the end of the period, the value of these securities amounted to $97,385,678 or 1.4% of net assets.
(c) Affiliated fund that is generally available only to investment companies and other accounts managed by Fidelity Investments. The rate quoted is the annualized seven-day yield of the fund at period end. A complete unaudited listing of the fund's holdings as of its most recent quarter end is available upon request. In addition, each Fidelity Central Fund's financial statements, which are not covered by the Fund's Report of Independent Registered Public Accounting Firm, are available on the SEC's website or upon request.
Affiliated Central Funds
Information regarding fiscal year to date income earned by the Fund from investments in Fidelity Central Funds is as follows:
| Fund | Income earned |
| Fidelity Cash Central Fund | $827,557 |
| Fidelity Securities Lending Cash Central Fund | 558,860 |
| Total | $1,386,417 |
Amounts in the income column in the above table include any capital gain distributions from underlying funds, which are presented in the corresponding line-item in the Statement of Operations, if applicable. Amount for Fidelity Securities Lending Cash Central Fund represents the income earned on investing cash collateral, less rebates paid to borrowers and any lending agent fees associated with the loan, plus any premium payments received for lending certain types of securities.
Investment Valuation
The following is a summary of the inputs used, as of October 31, 2020, involving the Fund's assets and liabilities carried at fair value. The inputs or methodology used for valuing securities may not be an indication of the risk associated with investing in those securities. For more information on valuation inputs, and their aggregation into the levels used below, please refer to the Investment Valuation section in the accompanying Notes to Financial Statements.
| | Valuation Inputs at Reporting Date: |
| Description | Total | Level 1 | Level 2 | Level 3 |
| Investments in Securities: | | | | |
| Equities: | | | | |
| Communication Services | $156,079,865 | $103,164,153 | $52,915,712 | $-- |
| Consumer Discretionary | 691,216,290 | 200,623,710 | 490,592,580 | -- |
| Consumer Staples | 739,666,057 | 297,666,302 | 441,999,755 | -- |
| Energy | 59,544,058 | -- | 59,544,058 | -- |
| Financials | 1,150,176,515 | 693,372,702 | 456,803,813 | -- |
| Health Care | 1,091,081,447 | 375,486,538 | 715,594,909 | -- |
| Industrials | 1,294,730,486 | 951,553,343 | 343,177,143 | -- |
| Information Technology | 1,249,144,807 | 687,486,838 | 561,657,969 | -- |
| Materials | 275,949,900 | 175,658,204 | 100,291,696 | -- |
| Real Estate | 103,818,736 | 71,194,800 | 32,623,936 | -- |
| Utilities | 110,001,462 | 110,001,462 | -- | -- |
| Money Market Funds | 244,924,728 | 244,924,728 | -- | -- |
| Total Investments in Securities: | $7,166,334,351 | $3,911,132,780 | $3,255,201,571 | $-- |
See accompanying notes which are an integral part of the financial statements.
Fidelity® Overseas Fund
Financial Statements
Statement of Assets and Liabilities
| | | October 31, 2020 |
| Assets | | |
Investment in securities, at value — See accompanying schedule:
Unaffiliated issuers (cost $5,365,017,041) | $6,921,409,623 | |
| Fidelity Central Funds (cost $244,924,728) | 244,924,728 | |
| Total Investment in Securities (cost $5,609,941,769) | | $7,166,334,351 |
| Foreign currency held at value (cost $296,904) | | 296,299 |
| Receivable for investments sold | | 40,817,798 |
| Receivable for fund shares sold | | 3,071,628 |
| Dividends receivable | | 23,018,683 |
| Distributions receivable from Fidelity Central Funds | | 16,156 |
| Prepaid expenses | | 12,148 |
| Other receivables | | 502,853 |
| Total assets | | 7,234,069,916 |
| Liabilities | | |
| Payable for investments purchased | $36,638,507 | |
| Payable for fund shares redeemed | 4,290,740 | |
| Accrued management fee | 5,344,735 | |
| Other affiliated payables | 1,001,124 | |
| Other payables and accrued expenses | 3,775,576 | |
| Total liabilities | | 51,050,682 |
| Net Assets | | $7,183,019,234 |
| Net Assets consist of: | | |
| Paid in capital | | $5,602,314,105 |
| Total accumulated earnings (loss) | | 1,580,705,129 |
| Net Assets | | $7,183,019,234 |
| Net Asset Value and Maximum Offering Price | | |
| Overseas: | | |
| Net Asset Value, offering price and redemption price per share ($6,160,616,826 ÷ 121,013,463 shares) | | $50.91 |
| Class K: | | |
| Net Asset Value, offering price and redemption price per share ($1,022,402,408 ÷ 20,115,018 shares) | | $50.83 |
See accompanying notes which are an integral part of the financial statements.
Statement of Operations
| | | Year ended October 31, 2020 |
| Investment Income | | |
| Dividends | | $102,194,143 |
| Income from Fidelity Central Funds (including $558,860 from security lending) | | 1,386,417 |
| Income before foreign taxes withheld | | 103,580,560 |
| Less foreign taxes withheld | | (10,573,730) |
| Total income | | 93,006,830 |
| Expenses | | |
| Management fee | | |
| Basic fee | $46,762,609 | |
| Performance adjustment | 14,030,710 | |
| Transfer agent fees | 9,738,566 | |
| Accounting fees | 1,652,924 | |
| Custodian fees and expenses | 719,710 | |
| Independent trustees' fees and expenses | 40,664 | |
| Registration fees | 98,442 | |
| Audit | 116,393 | |
| Legal | 16,578 | |
| Interest | 1,783 | |
| Miscellaneous | 100,732 | |
| Total expenses before reductions | 73,279,111 | |
| Expense reductions | (649,878) | |
| Total expenses after reductions | | 72,629,233 |
| Net investment income (loss) | | 20,377,597 |
| Realized and Unrealized Gain (Loss) | | |
| Net realized gain (loss) on: | | |
| Investment securities: | | |
| Unaffiliated issuers | 134,850,371 | |
| Fidelity Central Funds | 13,342 | |
| Foreign currency transactions | (993,331) | |
| Total net realized gain (loss) | | 133,870,382 |
| Change in net unrealized appreciation (depreciation) on: | | |
| Investment securities: | | |
| Unaffiliated issuers (net of increase in deferred foreign taxes of $2,956,354) | 32,690,798 | |
| Fidelity Central Funds | (5,898) | |
| Assets and liabilities in foreign currencies | 984,447 | |
| Total change in net unrealized appreciation (depreciation) | | 33,669,347 |
| Net gain (loss) | | 167,539,729 |
| Net increase (decrease) in net assets resulting from operations | | $187,917,326 |
See accompanying notes which are an integral part of the financial statements.
Statement of Changes in Net Assets
| | Year ended October 31, 2020 | Year ended October 31, 2019 |
| Increase (Decrease) in Net Assets | | |
| Operations | | |
| Net investment income (loss) | $20,377,597 | $122,171,577 |
| Net realized gain (loss) | 133,870,382 | 53,149,924 |
| Change in net unrealized appreciation (depreciation) | 33,669,347 | 769,608,048 |
| Net increase (decrease) in net assets resulting from operations | 187,917,326 | 944,929,549 |
| Distributions to shareholders | (103,794,461) | (357,799,774) |
| Share transactions - net increase (decrease) | (123,936,452) | (216,144,637) |
| Total increase (decrease) in net assets | (39,813,587) | 370,985,138 |
| Net Assets | | |
| Beginning of period | 7,222,832,821 | 6,851,847,683 |
| End of period | $7,183,019,234 | $7,222,832,821 |
See accompanying notes which are an integral part of the financial statements.
Financial Highlights
Fidelity Overseas Fund
| Years ended October 31, | 2020 | 2019 | 2018 | 2017 | 2016 |
| Selected Per–Share Data | | | | | |
| Net asset value, beginning of period | $49.51 | $46.04 | $50.18 | $40.73 | $41.56 |
| Income from Investment Operations | | | | | |
| Net investment income (loss)A | .13 | .77 | .68 | .58 | .75B |
| Net realized and unrealized gain (loss) | 1.97 | 5.12 | (4.27) | 9.65 | (1.15) |
| Total from investment operations | 2.10 | 5.89 | (3.59) | 10.23 | (.40) |
| Distributions from net investment income | (.70) | (.68) | (.52) | (.72) | (.43) |
| Distributions from net realized gain | – | (1.74) | (.03) | (.05) | (.01) |
| Total distributions | (.70) | (2.42) | (.55) | (.78)C | (.43)C |
| Redemption fees added to paid in capitalA | – | – | – | –D | –D |
| Net asset value, end of period | $50.91 | $49.51 | $46.04 | $50.18 | $40.73 |
| Total ReturnE | 4.25% | 13.78% | (7.23)% | 25.63% | (.97)% |
| Ratios to Average Net AssetsF,G | | | | | |
| Expenses before reductions | 1.04% | .90% | .97% | 1.00% | 1.03% |
| Expenses net of fee waivers, if any | 1.04% | .90% | .97% | 1.00% | 1.03% |
| Expenses net of all reductions | 1.03% | .89% | .96% | 1.00% | 1.03% |
| Net investment income (loss) | .27% | 1.68% | 1.35% | 1.30% | 1.88%B |
| Supplemental Data | | | | | |
| Net assets, end of period (000 omitted) | $6,160,617 | $6,182,831 | $5,825,757 | $6,828,078 | $4,569,084 |
| Portfolio turnover rateH | 41% | 46%I | 33% | 26%I | 33% |
A Calculated based on average shares outstanding during the period.
B Net investment income per share reflects one or more large, non-recurring dividend(s) which amounted to $.18 per share. Excluding such non-recurring dividend(s), the ratio of net investment income (loss) to average net assets would have been 1.42%.
C Total distributions per share do not sum due to rounding.
D Amount represents less than $.005 per share.
E Total returns would have been lower if certain expenses had not been reduced during the applicable periods shown.
F Fees and expenses of any underlying mutual funds or exchange-traded funds (ETFs) are not included in the Fund's expense ratio. The Fund indirectly bears its proportionate share of these expenses. For additional expense information related to investments in Fidelity Central Funds, please refer to the "Investments in Fidelity Central Funds" note found in the Notes to Financial Statements section of the most recent Annual or Semi-Annual report.
G Expense ratios reflect operating expenses of the class. Expenses before reductions do not reflect amounts reimbursed, waived, or reduced through arrangements with the investment adviser, brokerage services, or other offset arrangements, if applicable, and do not represent the amount paid by the class during periods when reimbursements, waivers or reductions occur.
H Amount does not include the portfolio activity of any underlying mutual funds or exchange-traded funds (ETFs).
I Portfolio turnover rate excludes securities received or delivered in-kind.
See accompanying notes which are an integral part of the financial statements.
Fidelity Overseas Fund Class K
| Years ended October 31, | 2020 | 2019 | 2018 | 2017 | 2016 |
| Selected Per–Share Data | | | | | |
| Net asset value, beginning of period | $49.43 | $45.98 | $50.11 | $40.67 | $41.49 |
| Income from Investment Operations | | | | | |
| Net investment income (loss)A | .19 | .82 | .73 | .64 | .80B |
| Net realized and unrealized gain (loss) | 1.96 | 5.11 | (4.26) | 9.62 | (1.14) |
| Total from investment operations | 2.15 | 5.93 | (3.53) | 10.26 | (.34) |
| Distributions from net investment income | (.75) | (.73) | (.57) | (.77) | (.47) |
| Distributions from net realized gain | – | (1.74) | (.03) | (.05) | (.01) |
| Total distributions | (.75) | (2.48)C | (.60) | (.82) | (.48) |
| Redemption fees added to paid in capitalA | – | – | – | –D | –D |
| Net asset value, end of period | $50.83 | $49.43 | $45.98 | $50.11 | $40.67 |
| Total ReturnE | 4.36% | 13.90% | (7.13)% | 25.80% | (.85)% |
| Ratios to Average Net AssetsF,G | | | | | |
| Expenses before reductions | .94% | .78% | .86% | .89% | .91% |
| Expenses net of fee waivers, if any | .93% | .78% | .86% | .89% | .91% |
| Expenses net of all reductions | .93% | .77% | .85% | .88% | .90% |
| Net investment income (loss) | .38% | 1.79% | 1.46% | 1.42% | 2.00%B |
| Supplemental Data | | | | | |
| Net assets, end of period (000 omitted) | $1,022,402 | $1,040,002 | $1,026,091 | $1,157,882 | $744,679 |
| Portfolio turnover rateH | 41% | 46%I | 33% | 26%I | 33% |
A Calculated based on average shares outstanding during the period.
B Net investment income per share reflects one or more large, non-recurring dividend(s) which amounted to $.18 per share. Excluding such non-recurring dividend(s), the ratio of net investment income (loss) to average net assets would have been 1.55%.
C Total distributions per share do not sum due to rounding.
D Amount represents less than $.005 per share.
E Total returns would have been lower if certain expenses had not been reduced during the applicable periods shown.
F Fees and expenses of any underlying mutual funds or exchange-traded funds (ETFs) are not included in the Fund's expense ratio. The Fund indirectly bears its proportionate share of these expenses. For additional expense information related to investments in Fidelity Central Funds, please refer to the "Investments in Fidelity Central Funds" note found in the Notes to Financial Statements section of the most recent Annual or Semi-Annual report.
G Expense ratios reflect operating expenses of the class. Expenses before reductions do not reflect amounts reimbursed, waived, or reduced through arrangements with the investment adviser, brokerage services, or other offset arrangements, if applicable, and do not represent the amount paid by the class during periods when reimbursements, waivers or reductions occur.
H Amount does not include the portfolio activity of any underlying mutual funds or exchange-traded funds (ETFs).
I Portfolio turnover rate excludes securities received or delivered in-kind.
See accompanying notes which are an integral part of the financial statements.
Notes to Financial Statements
For the period ended October 31, 2020
1. Organization.
Fidelity Overseas Fund (the Fund) is a fund of Fidelity Investment Trust (the Trust) and is authorized to issue an unlimited number of shares. The Trust is registered under the Investment Company Act of 1940, as amended (the 1940 Act), as an open-end management investment company organized as a Massachusetts business trust. The Fund offers Overseas and Class K shares, each of which has equal rights as to assets and voting privileges. Each class has exclusive voting rights with respect to matters that affect that class.
Effective January 1, 2020:
Investment advisers Fidelity Investments Money Management, Inc., FMR Co., Inc., and Fidelity SelectCo, LLC, merged with and into Fidelity Management & Research Company. In connection with the merger transactions, the resulting, merged investment adviser was then redomiciled from Massachusetts to Delaware, changed its corporate structure from a corporation to a limited liability company, and changed its name to "Fidelity Management & Research Company LLC".
Fidelity Investments Institutional Operations Company, Inc. converted from a Massachusetts corporation to a Massachusetts LLC, and changed its name to "Fidelity Investments Institutional Operations Company LLC".
2. Investments in Fidelity Central Funds.
The Fund invests in Fidelity Central Funds, which are open-end investment companies generally available only to other investment companies and accounts managed by the investment adviser and its affiliates. The Fund's Schedule of Investments lists each of the Fidelity Central Funds held as of period end, if any, as an investment of the Fund, but does not include the underlying holdings of each Fidelity Central Fund. As an Investing Fund, the Fund indirectly bears its proportionate share of the expenses of the underlying Fidelity Central Funds.
The Money Market Central Funds seek preservation of capital and current income and are managed by the investment adviser. Annualized expenses of the Money Market Central Funds as of their most recent shareholder report date ranged from less than .005% to .01%.
A complete unaudited list of holdings for each Fidelity Central Fund is available upon request or at the Securities and Exchange Commission (the SEC) website at www.sec.gov. In addition, the financial statements of the Fidelity Central Funds, which are not covered by the Fund's Report of Independent Registered Public Accounting Firm, are available on the SEC website or upon request.
3. Significant Accounting Policies.
The Fund is an investment company and applies the accounting and reporting guidance of the Financial Accounting Standards Board (FASB) Accounting Standards Codification Topic 946 Financial Services – Investment Companies. The financial statements have been prepared in conformity with accounting principles generally accepted in the United States of America (GAAP), which require management to make certain estimates and assumptions at the date of the financial statements. Actual results could differ from those estimates. Subsequent events, if any, through the date that the financial statements were issued have been evaluated in the preparation of the financial statements. The following summarizes the significant accounting policies of the Fund:
Investment Valuation. Investments are valued as of 4:00 p.m. Eastern time on the last calendar day of the period. The Board of Trustees (the Board) has delegated the day to day responsibility for the valuation of the Fund's investments to the Fair Value Committee (the Committee) established by the Fund's investment adviser. In accordance with valuation policies and procedures approved by the Board, the Fund attempts to obtain prices from one or more third party pricing vendors or brokers to value its investments. When current market prices, quotations or currency exchange rates are not readily available or reliable, investments will be fair valued in good faith by the Committee, in accordance with procedures adopted by the Board. Factors used in determining fair value vary by investment type and may include market or investment specific events. The frequency with which these procedures are used cannot be predicted and they may be utilized to a significant extent. The Committee oversees the Fund's valuation policies and procedures and reports to the Board on the Committee's activities and fair value determinations. The Board monitors the appropriateness of the procedures used in valuing the Fund's investments and ratifies the fair value determinations of the Committee.
The Fund categorizes the inputs to valuation techniques used to value its investments into a disclosure hierarchy consisting of three levels as shown below:
- Level 1 – quoted prices in active markets for identical investments
- Level 2 – other significant observable inputs (including quoted prices for similar investments, interest rates, prepayment speeds, etc.)
- Level 3 – unobservable inputs (including the Fund's own assumptions based on the best information available)
Valuation techniques used to value the Fund's investments by major category are as follows:
Equity securities, including restricted securities, for which market quotations are readily available, are valued at the last reported sale price or official closing price as reported by a third party pricing vendor on the primary market or exchange on which they are traded and are categorized as Level 1 in the hierarchy. In the event there were no sales during the day or closing prices are not available, securities are valued at the last quoted bid price or may be valued using the last available price and are generally categorized as Level 2 in the hierarchy. For foreign equity securities, when market or security specific events arise, comparisons to the valuation of American Depositary Receipts (ADRs), futures contracts, Exchange-Traded Funds (ETFs) and certain indexes as well as quoted prices for similar securities may be used and would be categorized as Level 2 in the hierarchy. For equity securities, including restricted securities, where observable inputs are limited, assumptions about market activity and risk are used and these securities may be categorized as Level 3 in the hierarchy.
Investments in open-end mutual funds, including the Fidelity Central Funds, are valued at their closing net asset value (NAV) each business day and are categorized as Level 1 in the hierarchy.
Changes in valuation techniques may result in transfers in or out of an assigned level within the disclosure hierarchy. The aggregate value of investments by input level as of October 31, 2020 is included at the end of the Fund's Schedule of Investments.
Foreign Currency. Certain Funds may use foreign currency contracts to facilitate transactions in foreign-denominated securities. Gains and losses from these transactions may arise from changes in the value of the foreign currency or if the counterparties do not perform under the contracts' terms.
Foreign-denominated assets, including investment securities, and liabilities are translated into U.S. dollars at the exchange rates at period end. Purchases and sales of investment securities, income and dividends received, and expenses denominated in foreign currencies are translated into U.S. dollars at the exchange rate in effect on the transaction date.
The effects of exchange rate fluctuations on investments are included with the net realized and unrealized gain (loss) on investment securities. Other foreign currency transactions resulting in realized and unrealized gain (loss) are disclosed separately.
Investment Transactions and Income. For financial reporting purposes, the Fund's investment holdings and NAV include trades executed through the end of the last business day of the period. The NAV per share for processing shareholder transactions is calculated as of the close of business of the New York Stock Exchange (NYSE), normally 4:00 p.m. Eastern time and includes trades executed through the end of the prior business day. Gains and losses on securities sold are determined on the basis of identified cost and include proceeds received from litigation. Dividend income is recorded on the ex-dividend date, except for certain dividends from foreign securities where the ex-dividend date may have passed, which are recorded as soon as the Fund is informed of the ex-dividend date. Non-cash dividends included in dividend income, if any, are recorded at the fair market value of the securities received. Income and capital gain distributions from Fidelity Central Funds, if any, are recorded on the ex-dividend date. Certain distributions received by the Fund represent a return of capital or capital gain. The Fund determines the components of these distributions subsequent to the ex-dividend date, based upon receipt of tax filings or other correspondence relating to the underlying investment. These distributions are recorded as a reduction of cost of investments and/or as a realized gain. Investment income is recorded net of foreign taxes withheld where recovery of such taxes is uncertain.
Class Allocations and Expenses. Investment income, realized and unrealized capital gains and losses, common expenses of the Fund, and certain fund-level expense reductions, if any, are allocated daily on a pro-rata basis to each class based on the relative net assets of each class to the total net assets of the Fund. Each class differs with respect to transfer agent fees incurred. Certain expense reductions may also differ by class. For the reporting period, the allocated portion of income and expenses to each class as a percent of its average net assets may vary due to the timing of recording these transactions in relation to fluctuating net assets of the classes. Expenses directly attributable to a fund are charged to that fund. Expenses attributable to more than one fund are allocated among the respective funds on the basis of relative net assets or other appropriate methods. Expense estimates are accrued in the period to which they relate and adjustments are made when actual amounts are known.
Deferred Trustee Compensation. Under a Deferred Compensation Plan (the Plan) for the Fund, certain independent Trustees have elected to defer receipt of a portion of their annual compensation. Deferred amounts are invested in a cross-section of Fidelity funds, are marked-to-market and remain in the Fund until distributed in accordance with the Plan. The investment of deferred amounts and the offsetting payable to the Trustees of $366,117 are included in the accompanying Statement of Assets and Liabilities in other receivables and other payables and accrued expenses, respectively.
Income Tax Information and Distributions to Shareholders. Each year, the Fund intends to qualify as a regulated investment company under Subchapter M of the Internal Revenue Code, including distributing substantially all of its taxable income and realized gains. As a result, no provision for U.S. Federal income taxes is required. As of October 31, 2020, the Fund did not have any unrecognized tax benefits in the financial statements; nor is the Fund aware of any tax positions for which it is reasonably possible that the total amounts of unrecognized tax benefits will significantly change in the next twelve months. The Fund files a U.S. federal tax return, in addition to state and local tax returns as required. The Fund's federal income tax returns are subject to examination by the Internal Revenue Service (IRS) for a period of three fiscal years after they are filed. State and local tax returns may be subject to examination for an additional fiscal year depending on the jurisdiction. Foreign taxes are provided for based on the Fund's understanding of the tax rules and rates that exist in the foreign markets in which it invests. The Fund is subject to a tax imposed on capital gains by certain countries in which it invests. An estimated deferred tax liability for net unrealized appreciation on the applicable securities is included in Other payables and accrued expenses on the Statement of Assets & Liabilities.
Distributions are declared and recorded on the ex-dividend date. Income and capital gain distributions are declared separately for each class. Income and capital gain distributions are determined in accordance with income tax regulations, which may differ from GAAP. In addition, the Fund claimed a portion of the payment made to redeeming shareholders as a distribution for income tax purposes.
Capital accounts within the financial statements are adjusted for permanent book-tax differences. These adjustments have no impact on net assets or the results of operations. Capital accounts are not adjusted for temporary book-tax differences which will reverse in a subsequent period.
Book-tax differences are primarily due to foreign currency transactions, certain foreign taxes, passive foreign investment companies (PFIC), deferred trustees compensation, capital loss carryforwards and losses deferred due to wash sales.
As of period end, the cost and unrealized appreciation (depreciation) in securities, and derivatives if applicable, for federal income tax purposes were as follows:
| Gross unrealized appreciation | $1,822,785,287 |
| Gross unrealized depreciation | (284,444,520) |
| Net unrealized appreciation (depreciation) | $1,538,340,767 |
| Tax Cost | $5,627,993,584 |
The tax-based components of distributable earnings as of period end were as follows:
| Undistributed ordinary income | $16,163,683 |
| Undistributed long-term capital gain | $28,797,966 |
| Net unrealized appreciation (depreciation) on securities and other investments | $1,539,166,164 |
The tax character of distributions paid was as follows:
| | October 31, 2020 | October 31, 2019 |
| Ordinary Income | $103,794,461 | $ 101,047,796 |
| Long-term Capital Gains | – | 256,751,978 |
| Total | $103,794,461 | $ 357,799,774 |
Restricted Securities (including Private Placements). The Fund may invest in securities that are subject to legal or contractual restrictions on resale. These securities generally may be resold in transactions exempt from registration or to the public if the securities are registered. Disposal of these securities may involve time-consuming negotiations and expense, and prompt sale at an acceptable price may be difficult. Information regarding restricted securities is included at the end of the Fund's Schedule of Investments.
4. Purchases and Sales of Investments.
Purchases and sales of securities, other than short-term securities are noted in the table below.
| | Purchases ($) | Sales ($) |
| Fidelity Overseas Fund | 2,876,261,986 | 3,203,344,975 |
5. Fees and Other Transactions with Affiliates.
Management Fee. Fidelity Management & Research Company LLC (the investment adviser) and its affiliates provide the Fund with investment management related services for which the Fund pays a monthly management fee. The management fee is the sum of an individual fund fee rate that is based on an annual rate of .424% of the Fund's average net assets and an annualized group fee rate that averaged .23% during the period. The group fee rate is based upon the monthly average net assets of a group of registered investment companies with which the investment adviser has management contracts. The group fee rate decreases as assets under management increase and increases as assets under management decrease. In addition, the management fee is subject to a performance adjustment (up to a maximum of +/- .20 % of the Fund's average net assets over a 36 month performance period). The upward or downward adjustment to the management fee is based on the relative investment performance of Overseas as compared to its benchmark index, the MSCI EAFE Index, over the same 36 month performance period. For the reporting period, the total annual management fee rate, including the performance adjustment, was .85% of the Fund's average net assets. The performance adjustment included in the management fee rate may be higher or lower than the maximum performance adjustment rate due to the difference between the average net assets for the reporting and performance periods.
Transfer Agent Fees. Fidelity Investments Institutional Operations Company LLC (FIIOC), an affiliate of the investment adviser, is the transfer, dividend disbursing and shareholder servicing agent for each class of the Fund. FIIOC receives account fees and asset-based fees that vary according to the account size and type of account of the shareholders of Overseas, except for Class K. FIIOC receives an asset-based fee of Class K's average net assets. FIIOC pays for typesetting, printing and mailing of shareholder reports, except proxy statements. Effective February 1, 2020, the Board approved to change the fee for Class K from .046% to .044%.
For the period, transfer agent fees for each class were as follows:
| | Amount | % of Class-Level Average Net Assets |
| Overseas | $9,306,652 | .15 |
| Class K | 431,914 | .04 |
| | $9,738,566 | |
Accounting Fees. Fidelity Service Company, Inc. (FSC), an affiliate of the investment adviser, maintains the Fund's accounting records. The accounting fee is based on the level of average net assets for each month. For the period, the fees were equivalent to the following annual rates:
| | % of Average Net Assets |
| Fidelity Overseas Fund | .02 |
Brokerage Commissions. A portion of portfolio transactions were placed with brokerage firms which are affiliates of the investment adviser. Brokerage commissions are included in net realized gain (loss) and change in net unrealized appreciation (depreciation) in the Statement of Operations. The commissions paid to these affiliated firms were as follows:
| | Amount |
| Fidelity Overseas Fund | $9,914 |
Interfund Lending Program. Pursuant to an Exemptive Order issued by the SEC, the Fund, along with other registered investment companies having management contracts with Fidelity Management & Research Company LLC (FMR), or other affiliated entities of FMR, may participate in an interfund lending program. This program provides an alternative credit facility allowing the Fund to borrow from, or lend money to, other participating affiliated funds. At period end, there were no interfund loans outstanding. Activity in this program during the period for which loans were outstanding was as follows:
| | Borrower or Lender | Average Loan Balance | Weighted Average Interest Rate | Interest Expense |
| Fidelity Overseas Fund | Borrower | $23,411,000 | .34% | $1,783 |
Interfund Trades. Funds may purchase from or sell securities to other Fidelity Funds under procedures adopted by the Board. The procedures have been designed to ensure these interfund trades are executed in accordance with Rule 17a-7 of the 1940 Act. Interfund trades are included within the respective purchases and sales amounts shown in the Purchases and Sales of Investments note.
Prior Fiscal Year Affiliated Redemptions In-Kind. During the prior period, 11,501,120 shares of the Fund were redeemed in-kind for investments, including accrued interest, and cash with a value of $556,026,228. The Fund had a net realized gain of $170,099,039 on investments delivered through in-kind redemptions. The amount of the in-kind redemptions is included in share transactions in the accompanying Statement of Changes in Net Assets as well as the Notes to Financial Statements. The Fund recognized no gain or loss for federal income tax purposes.
Other. During the period, the investment adviser reimbursed the Fund for certain losses in the amount of $17,964.
6. Committed Line of Credit.
Certain Funds participate with other funds managed by the investment adviser or an affiliate in a $4.25 billion credit facility (the "line of credit") to be utilized for temporary or emergency purposes to fund shareholder redemptions or for other short-term liquidity purposes. The participating funds have agreed to pay commitment fees on their pro-rata portion of the line of credit, which are reflected in Miscellaneous expenses on the Statement of Operations, and are as follows:
| | Amount |
| Fidelity Overseas Fund | $16,731 |
During the period, there were no borrowings on this line of credit.
7. Security Lending.
Funds lend portfolio securities from time to time in order to earn additional income. Lending agents are used, including National Financial Services (NFS), an affiliate of the investment adviser. Pursuant to a securities lending agreement, NFS will receive a fee, which is capped at 9.9% of a fund's daily lending revenue, for its services as lending agent. A fund may lend securities to certain qualified borrowers, including NFS. On the settlement date of the loan, a fund receives collateral (in the form of U.S. Treasury obligations, letters of credit and/or cash) against the loaned securities and maintains collateral in an amount not less than 100% of the market value of the loaned securities during the period of the loan. The market value of the loaned securities is determined at the close of business of a fund and any additional required collateral is delivered to a fund on the next business day. A fund or borrower may terminate the loan at any time, and if the borrower defaults on its obligation to return the securities loaned because of insolvency or other reasons, a fund may apply collateral received from the borrower against the obligation. A fund may experience delays and costs in recovering the securities loaned. Any cash collateral received is invested in the Fidelity Securities Lending Cash Central Fund. Any loaned securities are identified as such in the Schedule of Investments, and the value of loaned securities and cash collateral at period end, as applicable, are presented in the Statement of Assets and Liabilities. Security lending income represents the income earned on investing cash collateral, less rebates paid to borrowers and any lending agent fees associated with the loan, plus any premium payments received for lending certain types of securities. Security lending income is presented in the Statement of Operations as a component of income from Fidelity Central Funds. Affiliated security lending activity, if any, was as follows:
| | Total Security Lending Income Fees Paid to NFS | Security Lending Income From Securities Loaned to NFS | Value of Securities Loaned to NFS at Period End |
| Fidelity Overseas Fund | $2,701 | $– | $– |
8. Expense Reductions.
Commissions paid to certain brokers with whom the investment adviser, or its affiliates, places trades on behalf of the Fund include an amount in addition to trade execution, which may be rebated back to the Fund to offset certain expenses. This amount totaled $618,404 for the period. In addition, through arrangements with the Fund's custodian, credits realized as a result of certain uninvested cash balances were used to reduce the Fund's expenses. During the period, custodian credits reduced the Fund's expenses by $1,146.
In addition, during the period the investment adviser or an affiliate reimbursed and/or waived a portion of fund-level operating expenses in the amount of $30,328.
9. Distributions to Shareholders.
Distributions to shareholders of each class were as follows:
| | Year ended
October 31, 2020 | Year ended
October 31, 2019 |
| Distributions to shareholders | | |
| Overseas | $88,028,325 | $302,291,778 |
| Class K | 15,766,136 | 55,507,996 |
| Total | $103,794,461 | $357,799,774 |
10. Share Transactions.
Share transactions for each class were as follows and may contain automatic conversions between classes or exchanges between affiliated funds:
| | Shares | Shares | Dollars | Dollars |
| | Year ended October 31, 2020 | Year ended October 31, 2019 | Year ended October 31, 2020 | Year ended October 31, 2019 |
| Overseas | | | | |
| Shares sold | 22,194,543 | 31,856,786 | $1,095,517,512 | $1,436,433,707 |
| Reinvestment of distributions | 1,551,196 | 6,585,978 | 77,916,561 | 274,832,872 |
| Shares redeemed | (27,600,967) | (40,100,962)(a) | (1,280,750,561) | (1,855,714,404)(a) |
| Net increase (decrease) | (3,855,228) | (1,658,198) | $(107,316,488) | $(144,447,825) |
| Class K | | | | |
| Shares sold | 6,459,409 | 4,549,646 | $328,765,506 | $206,368,715 |
| Reinvestment of distributions | 314,693 | 1,333,686 | 15,766,136 | 55,507,996 |
| Shares redeemed | (7,698,662) | (7,161,298) | (361,151,606) | (333,573,523) |
| Net increase (decrease) | (924,560) | (1,277,966) | $(16,619,964) | $(71,696,812) |
(a) Amount includes in-kind redemptions (see the Prior Fiscal Year Affiliated Redemptions In-Kind note for additional details).
11. Other.
The Fund's organizational documents provide former and current trustees and officers with a limited indemnification against liabilities arising in connection with the performance of their duties to the Fund. In the normal course of business, the Fund may also enter into contracts that provide general indemnifications. The Fund's maximum exposure under these arrangements is unknown as this would be dependent on future claims that may be made against the Fund. The risk of material loss from such claims is considered remote.
At the end of the period, Strategic Advisers Fidelity International Fund was the owner of record of approximately 22% of the total outstanding shares of the Fund. Mutual funds managed by the investment adviser or its affiliates were the owners of record, in the aggregate, of approximately 43% of the total outstanding shares of the Fund.
12. Coronavirus (COVID-19) Pandemic.
An outbreak of COVID-19 first detected in China during December 2019 has since spread globally and was declared a pandemic by the World Health Organization during March 2020. Developments that disrupt global economies and financial markets, such as the COVID-19 pandemic, may magnify factors that affect the Fund's performance.
Fidelity® Worldwide Fund
Performance: The Bottom Line
Average annual total return reflects the change in the value of an investment, assuming reinvestment of distributions from dividend income and capital gains (the profits earned upon the sale of securities that have grown in value, if any) and assuming a constant rate of performance each year. The hypothetical investment and the average annual total returns do not reflect the deduction of taxes that a shareholder would pay on fund distributions or the redemption of fund shares. During periods of reimbursement by Fidelity, a fund’s total return will be greater than it would be had the reimbursement not occurred. How a fund did yesterday is no guarantee of how it will do tomorrow.
Average Annual Total Returns
| For the periods ended October 31, 2020 | Past 1 year | Past 5 years | Past 10 years |
| Class A (incl. 5.75% sales charge) | 13.78% | 10.63% | 10.24% |
| Class M (incl. 3.50% sales charge) | 16.19% | 10.83% | 10.18% |
| Class C (incl. contingent deferred sales charge) | 18.76% | 11.07% | 10.04% |
| Fidelity® Worldwide Fund | 21.07% | 12.29% | 11.24% |
| Class I | 21.08% | 12.26% | 11.20% |
| Class Z | 21.19% | 12.32% | 11.23% |
Class C shares' contingent deferred sales charges included in the past one year, past five years and past ten years total return figures are 1%, 0% and 0%, respectively.
The initial offering of Class Z shares took place on October 2, 2018. Returns prior to October 2, 2018, are those of Class I.
$10,000 Over 10 Years
Let's say hypothetically that $10,000 was invested in Fidelity® Worldwide Fund, a class of the fund, on October 31, 2010.
The chart shows how the value of your investment would have changed, and also shows how the MSCI World Index performed over the same period.
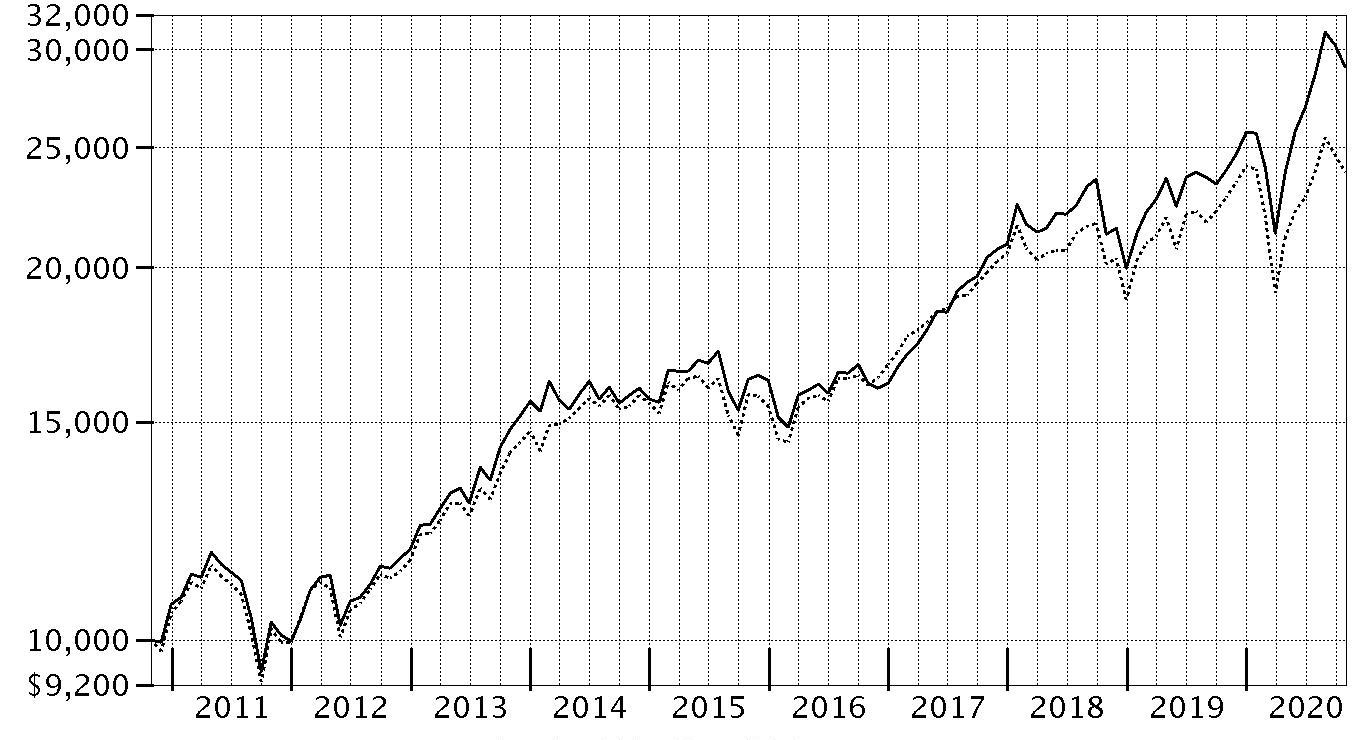
| Period Ending Values |
| $29,018 | Fidelity® Worldwide Fund |
| $23,888 | MSCI World Index |
Fidelity® Worldwide Fund
Management's Discussion of Fund Performance
Market Recap: The MSCI ACWI (All Country World Index) Index gained 5.29% for the year ending October 31, 2020, a volatile period for global equities, marked by a steep but brief decline due to the early-2020 outbreak and spread of the coronavirus, followed by a historic rebound. Declared a pandemic in March, the COVID-19 crisis caused broad contraction in economic activity, along with elevated uncertainty and dislocation in financial markets. A historically rapid and expansive monetary/fiscal-policy response partially offset the economic disruption and fueled a sharp uptrend from March 24 into September. Other supporting factors included resilient corporate earnings and near-term potential for a COVID-19 vaccine breakthrough. Currency fluctuation generally supported global equities for the year. Late in the period, markets digested the inability of the U.S. Congress to reach a deal on additional fiscal stimulus, U.S. election uncertainty and a second wave of COVID-19 cases. By region for the full period, the U.S. (+12%), which represented 57% of the index, on average, led the way, followed by emerging markets (+9%). In contrast, the following regions lagged: U.K. (-22%), Asia-Pacific ex Japan (-8%), Canada (-5%) and Europe ex U.K. (-4%). Among sectors, information technology (+33%), consumer discretionary (+24%) and communication services (+16%) stood out. Conversely, energy (-42%), financials (-18%) and real estate (-15%) trailed the index.
Comments from Lead Portfolio Manager William Kennedy and Co-Managers Stephen DuFour and Andrew Sergeant: For the fiscal year ending October 31, 2020, the fund's share classes (excluding sales charges, if applicable) gained about 20% to 21%, outperforming the 4.82% result of the benchmark MSCI World Index. From a regional standpoint, security selection had a big impact on relative performance, notably in the U.S. and Europe ex U.K. By sector, stock picks and a sizable overweighting in information technology led the way. Versus the benchmark, investment choices and an underweighting in financials, underexposure to energy, and stock picks in health care, industrials, communication services and real estate also helped. The biggest individual relative contributors were overweightings in online payments processors Square (+147%) and PayPal Holdings (+80%), semiconductor company Nvidia (+146%) and online shopping platform Shopify (+188%). Conversely, no regions detracted from relative performance, although our overweighting in the U.K. was a headwind. By sector, underexposure to materials, consumer staples and consumer discretionary nicked the fund’s relative result. In terms of individual stocks, largely avoiding electric car company Tesla and untimely ownership of multinational retailer Walmart (0%) hurt most. Neither stock was held at period end.
The views expressed above reflect those of the portfolio manager(s) only through the end of the period as stated on the cover of this report and do not necessarily represent the views of Fidelity or any other person in the Fidelity organization. Any such views are subject to change at any time based upon market or other conditions and Fidelity disclaims any responsibility to update such views. These views may not be relied on as investment advice and, because investment decisions for a Fidelity fund are based on numerous factors, may not be relied on as an indication of trading intent on behalf of any Fidelity fund.
Notes to shareholders: On September 30, 2020, Andrew Sergeant assumed co-management responsibilities for the fund, joining Bill Kennedy and Stephen DuFour.
Fidelity® Worldwide Fund
Investment Summary (Unaudited)
Geographic Diversification (% of fund's net assets)
| As of October 31, 2020 |
| | United States of America* | 63.5% |
| | Japan | 5.2% |
| | Switzerland | 4.3% |
| | United Kingdom | 3.8% |
| | Germany | 3.2% |
| | Cayman Islands | 2.7% |
| | France | 2.1% |
| | Netherlands | 1.8% |
| | Sweden | 1.5% |
| | Other | 11.9% |

* Includes Short-Term investments and Net Other Assets (Liabilities).
Percentages are based on country or territory of incorporation and are adjusted for the effect of futures contracts, if applicable.
Asset Allocation as of October 31, 2020
| | % of fund's net assets |
| Stocks | 97.4 |
| Short-Term Investments and Net Other Assets (Liabilities) | 2.6 |
Top Ten Stocks as of October 31, 2020
| | % of fund's net assets |
| Microsoft Corp. (United States of America, Software) | 3.8 |
| Amazon.com, Inc. (United States of America, Internet & Direct Marketing Retail) | 3.2 |
| Alphabet, Inc. Class A (United States of America, Interactive Media & Services) | 2.8 |
| PayPal Holdings, Inc. (United States of America, IT Services) | 2.8 |
| MasterCard, Inc. Class A (United States of America, IT Services) | 2.8 |
| Estee Lauder Companies, Inc. Class A (United States of America, Personal Products) | 2.8 |
| Union Pacific Corp. (United States of America, Road & Rail) | 2.6 |
| Facebook, Inc. Class A (United States of America, Interactive Media & Services) | 2.6 |
| Square, Inc. (United States of America, IT Services) | 2.6 |
| Adobe, Inc. (United States of America, Software) | 2.3 |
| | 28.3 |
Top Market Sectors as of October 31, 2020
| | % of fund's net assets |
| Information Technology | 26.5 |
| Health Care | 15.8 |
| Consumer Discretionary | 15.1 |
| Industrials | 10.4 |
| Communication Services | 9.7 |
| Financials | 9.1 |
| Consumer Staples | 6.3 |
| Materials | 1.7 |
| Real Estate | 1.2 |
| Utilities | 1.1 |
Fidelity® Worldwide Fund
Schedule of Investments October 31, 2020
Showing Percentage of Net Assets
| Common Stocks - 97.1% | | | |
| | | Shares | Value |
| Australia - 0.4% | | | |
| Bapcor Ltd. | | 859,452 | $4,632,257 |
| Inghams Group Ltd. | | 778,550 | 1,566,585 |
| National Storage (REIT) unit | | 3,259,926 | 4,137,281 |
| Rio Tinto Ltd. | | 304 | 19,776 |
|
| TOTAL AUSTRALIA | | | 10,355,899 |
|
| Austria - 0.3% | | | |
| Erste Group Bank AG | | 161,800 | 3,312,782 |
| Wienerberger AG | | 150,500 | 3,796,561 |
|
| TOTAL AUSTRIA | | | 7,109,343 |
|
| Bailiwick of Jersey - 0.9% | | | |
| Clarivate Analytics PLC (a) | | 632,800 | 17,560,200 |
| Experian PLC | | 130,258 | 4,771,858 |
|
| TOTAL BAILIWICK OF JERSEY | | | 22,332,058 |
|
| Belgium - 0.5% | | | |
| KBC Groep NV | | 142,864 | 7,043,143 |
| UCB SA | | 45,800 | 4,517,980 |
|
| TOTAL BELGIUM | | | 11,561,123 |
|
| Bermuda - 0.7% | | | |
| Marvell Technology Group Ltd. | | 460,000 | 17,254,600 |
| Canada - 0.6% | | | |
| Alimentation Couche-Tard, Inc. Class B (sub. vtg.) | | 86,500 | 2,663,886 |
| Constellation Software, Inc. | | 4,400 | 4,618,927 |
| Lightspeed POS, Inc. | | 56,000 | 1,793,680 |
| Nuvei Corp. (a)(b) | | 15,800 | 587,128 |
| Shopify, Inc. Class A (a) | | 4,000 | 3,687,548 |
| Suncor Energy, Inc. | | 162,900 | 1,837,714 |
|
| TOTAL CANADA | | | 15,188,883 |
|
| Cayman Islands - 2.7% | | | |
| Akeso, Inc. (b) | | 541,000 | 1,695,750 |
| Alibaba Group Holding Ltd. (a) | | 226,400 | 8,579,173 |
| Alibaba Group Holding Ltd. sponsored ADR (a) | | 52,000 | 15,843,880 |
| Bilibili, Inc. ADR (a) | | 42,900 | 1,916,343 |
| Hansoh Pharmaceutical Group Co. Ltd. (a)(b) | | 712,000 | 3,173,118 |
| JD.com, Inc. Class A | | 138,000 | 5,628,816 |
| Kangji Medical Holdings Ltd. | | 777,500 | 2,010,318 |
| New Oriental Education & Technology Group, Inc. sponsored ADR (a) | | 20,700 | 3,319,866 |
| Sea Ltd. ADR (a) | | 35,000 | 5,519,500 |
| Sino Biopharmaceutical Ltd. | | 1,764,000 | 1,779,359 |
| Tencent Holdings Ltd. | | 178,900 | 13,668,972 |
| Zai Lab Ltd. (a) | | 31,900 | 2,654,047 |
|
| TOTAL CAYMAN ISLANDS | | | 65,789,142 |
|
| China - 0.4% | | | |
| AVIC Jonhon OptronicTechnology Co. Ltd. | | 429,200 | 3,560,992 |
| Kweichow Moutai Co. Ltd. (A Shares) | | 9,100 | 2,276,156 |
| Venus MedTech Hangzhou, Inc. (H Shares) (a)(b) | | 174,500 | 1,678,036 |
| WuXi AppTec Co. Ltd. (H Shares) (b) | | 168,200 | 2,679,484 |
|
| TOTAL CHINA | | | 10,194,668 |
|
| Denmark - 1.0% | | | |
| Ascendis Pharma A/S sponsored ADR (a) | | 7,000 | 1,143,450 |
| DSV Panalpina A/S | | 46,200 | 7,480,757 |
| Netcompany Group A/S (a)(b) | | 28,474 | 2,365,409 |
| ORSTED A/S (b) | | 43,400 | 6,888,188 |
| Vestas Wind Systems A/S | | 41,500 | 7,119,907 |
|
| TOTAL DENMARK | | | 24,997,711 |
|
| Finland - 0.2% | | | |
| Musti Group OYJ | | 83,200 | 1,906,001 |
| Nanoform Finland PLC | | 504,800 | 2,409,277 |
|
| TOTAL FINLAND | | | 4,315,278 |
|
| France - 2.1% | | | |
| AXA SA | | 326,300 | 5,240,149 |
| BNP Paribas SA (a) | | 125,600 | 4,380,272 |
| Capgemini SA | | 49,800 | 5,750,077 |
| LVMH Moet Hennessy Louis Vuitton SE | | 20,539 | 9,627,608 |
| Sanofi SA | | 106,500 | 9,616,247 |
| Sartorius Stedim Biotech | | 8,000 | 3,033,680 |
| SR Teleperformance SA | | 16,400 | 4,922,137 |
| VINCI SA | | 55,263 | 4,364,955 |
| Worldline SA (a)(b) | | 51,400 | 3,809,682 |
|
| TOTAL FRANCE | | | 50,744,807 |
|
| Germany - 3.0% | | | |
| adidas AG | | 21,369 | 6,346,288 |
| Akasol AG (a)(b) | | 27,300 | 1,479,896 |
| Allianz SE | | 50,700 | 8,919,754 |
| Deutsche Borse AG | | 8,762 | 1,289,359 |
| Deutsche Post AG | | 233,400 | 10,340,387 |
| Exasol AG | | 167,800 | 3,205,024 |
| Instone Real Estate Group BV (a)(b) | | 94,872 | 1,962,350 |
| Linde PLC | | 16,434 | 3,602,121 |
| Nexus AG | | 46,000 | 2,560,832 |
| Rheinmetall AG | | 22,400 | 1,635,728 |
| RWE AG | | 62,100 | 2,299,204 |
| SAP SE | | 79,984 | 8,533,065 |
| Shop Apotheke Europe NV (a)(b) | | 23,700 | 3,930,554 |
| Siemens AG | | 85,700 | 10,050,918 |
| Vonovia SE | | 108,246 | 6,911,086 |
|
| TOTAL GERMANY | | | 73,066,566 |
|
| Hong Kong - 0.3% | | | |
| AIA Group Ltd. | | 876,400 | 8,340,853 |
| Hungary - 0.2% | | | |
| OTP Bank PLC (a) | | 117,200 | 3,650,189 |
| Richter Gedeon PLC | | 86,900 | 1,772,603 |
|
| TOTAL HUNGARY | | | 5,422,792 |
|
| India - 1.2% | | | |
| Avenue Supermarts Ltd. (a)(b) | | 16,542 | 497,141 |
| HDFC Bank Ltd. | | 246,824 | 3,918,367 |
| HDFC Bank Ltd. sponsored ADR (a) | | 124,486 | 7,150,476 |
| Housing Development Finance Corp. Ltd. | | 280,094 | 7,223,417 |
| Lupin Ltd. (a) | | 1,335 | 16,274 |
| Reliance Industries Ltd. | | 161,400 | 4,448,220 |
| Reliance Industries Ltd. | | 10,760 | 170,461 |
| Reliance Industries Ltd. sponsored GDR (b) | | 36,700 | 2,014,830 |
| Sunteck Realty Ltd. | | 186,516 | 669,746 |
| TCNS Clothing Co. Ltd. (a)(b) | | 199,223 | 995,730 |
| V-Mart Retail Ltd. (a) | | 119,603 | 3,100,235 |
|
| TOTAL INDIA | | | 30,204,897 |
|
| Indonesia - 0.1% | | | |
| PT Bank Central Asia Tbk | | 855,300 | 1,682,936 |
| PT Bank Rakyat Indonesia Tbk | | 5,932,300 | 1,342,907 |
| PT Kino Indonesia Tbk | | 234,500 | 49,350 |
|
| TOTAL INDONESIA | | | 3,075,193 |
|
| Ireland - 1.2% | | | |
| Cairn Homes PLC | | 2,864,939 | 2,619,271 |
| CRH PLC | | 167,700 | 5,868,120 |
| Dalata Hotel Group PLC | | 548,174 | 1,545,003 |
| DCC PLC (United Kingdom) | | 5,935 | 386,285 |
| Flutter Entertainment PLC | | 18,000 | 3,115,418 |
| Horizon Therapeutics PLC (a) | | 186,000 | 13,936,980 |
| Kerry Group PLC Class A | | 15,000 | 1,794,143 |
|
| TOTAL IRELAND | | | 29,265,220 |
|
| Israel - 0.1% | | | |
| Maytronics Ltd. | | 90,197 | 1,385,450 |
| Italy - 0.3% | | | |
| GVS SpA (b) | | 169,300 | 2,385,820 |
| Recordati SpA | | 59,300 | 3,072,646 |
| Reply SpA | | 29,900 | 3,214,166 |
|
| TOTAL ITALY | | | 8,672,632 |
|
| Japan - 5.2% | | | |
| Astellas Pharma, Inc. | | 304,400 | 4,174,219 |
| Daiichi Sankyo Kabushiki Kaisha | | 228,000 | 6,017,754 |
| Daiichikosho Co. Ltd. | | 55,700 | 1,905,886 |
| FANUC Corp. | | 39,800 | 8,406,749 |
| GMO Payment Gateway, Inc. | | 23,800 | 2,916,178 |
| Hoya Corp. | | 85,500 | 9,649,268 |
| IT Holdings Corp. | | 101,600 | 1,943,115 |
| Kao Corp. | | 42,300 | 3,011,705 |
| Kenedix, Inc. | | 420,000 | 2,176,474 |
| Keyence Corp. | | 20,340 | 9,230,750 |
| Lifenet Insurance Co. (a) | | 157,600 | 2,320,888 |
| Minebea Mitsumi, Inc. | | 266,700 | 4,816,965 |
| Misumi Group, Inc. | | 60,900 | 1,808,704 |
| Mitsubishi UFJ Financial Group, Inc. | | 622,000 | 2,451,865 |
| Nintendo Co. Ltd. | | 10,900 | 5,893,508 |
| NSD Co. Ltd. | | 249,500 | 4,382,382 |
| Oracle Corp. Japan | | 33,800 | 3,377,975 |
| ORIX Corp. | | 398,100 | 4,655,874 |
| PALTAC Corp. | | 40,500 | 2,264,257 |
| Persol Holdings Co., Ltd. | | 154,300 | 2,337,059 |
| Recruit Holdings Co. Ltd. | | 94,700 | 3,603,399 |
| Relo Group, Inc. | | 218,400 | 5,241,333 |
| Shiseido Co. Ltd. | | 30,500 | 1,888,164 |
| SMC Corp. | | 7,800 | 4,148,864 |
| SoftBank Group Corp. | | 93,300 | 6,076,985 |
| Sony Corp. | | 119,100 | 9,928,948 |
| THK Co. Ltd. | | 94,400 | 2,505,840 |
| Z Holdings Corp. | | 1,046,800 | 7,299,399 |
| Zozo, Inc. | | 148,200 | 3,759,524 |
|
| TOTAL JAPAN | | | 128,194,031 |
|
| Kenya - 0.1% | | | |
| Safaricom Ltd. | | 5,920,700 | 1,678,801 |
| Korea (South) - 0.3% | | | |
| Samsung Electronics Co. Ltd. | | 157,070 | 7,877,900 |
| Luxembourg - 0.4% | | | |
| B&M European Value Retail SA | | 315,800 | 1,983,408 |
| Eurofins Scientific SA (a) | | 8,961 | 7,136,430 |
|
| TOTAL LUXEMBOURG | | | 9,119,838 |
|
| Malta - 0.1% | | | |
| Kambi Group PLC (a) | | 56,160 | 1,823,950 |
| Netherlands - 1.8% | | | |
| Airbus Group NV | | 44,900 | 3,285,157 |
| Argenx SE ADR (a) | | 60,053 | 14,900,951 |
| ASML Holding NV (Netherlands) | | 33,800 | 12,228,945 |
| IMCD NV | | 25,200 | 2,919,069 |
| JDE Peet's BV | | 99,900 | 3,560,265 |
| NXP Semiconductors NV | | 46,300 | 6,256,056 |
| RHI Magnesita NV | | 42,522 | 1,410,234 |
|
| TOTAL NETHERLANDS | | | 44,560,677 |
|
| New Zealand - 0.3% | | | |
| EBOS Group Ltd. | | 177,292 | 3,017,764 |
| Ryman Healthcare Group Ltd. | | 554,675 | 5,133,007 |
|
| TOTAL NEW ZEALAND | | | 8,150,771 |
|
| Norway - 0.6% | | | |
| Adevinta ASA Class B (a) | | 273,771 | 4,229,884 |
| Equinor ASA | | 186,980 | 2,374,794 |
| Kongsberg Gruppen ASA | | 252,600 | 4,090,645 |
| Schibsted ASA (A Shares) | | 107,300 | 4,374,431 |
|
| TOTAL NORWAY | | | 15,069,754 |
|
| Philippines - 0.0% | | | |
| D&L Industries, Inc. | | 7,836,300 | 1,004,747 |
| Poland - 0.4% | | | |
| Allegro.eu SA (a)(b) | | 300,800 | 6,113,111 |
| CD Projekt RED SA (a) | | 34,600 | 2,931,552 |
|
| TOTAL POLAND | | | 9,044,663 |
|
| South Africa - 0.2% | | | |
| Naspers Ltd. Class N | | 19,600 | 3,826,460 |
| Spain - 0.6% | | | |
| Amadeus IT Holding SA Class A | | 67,600 | 3,227,157 |
| Cellnex Telecom SA (b) | | 152,544 | 9,792,640 |
| Euskaltel, S.A. (b) | | 271,300 | 2,581,471 |
|
| TOTAL SPAIN | | | 15,601,268 |
|
| Sweden - 1.5% | | | |
| ASSA ABLOY AB (B Shares) | | 147,400 | 3,159,146 |
| EQT AB | | 116,200 | 2,214,073 |
| Ericsson (B Shares) | | 646,000 | 7,212,277 |
| Indutrade AB (a) | | 151,500 | 7,685,325 |
| Nibe Industrier AB (B Shares) | | 83,000 | 2,001,686 |
| Readly International AB | | 182,200 | 1,146,633 |
| Securitas AB (B Shares) | | 285,000 | 4,033,956 |
| Stillfront Group AB (a) | | 43,418 | 5,093,994 |
| Svenska Handelsbanken AB (A Shares) (a) | | 420,500 | 3,407,179 |
|
| TOTAL SWEDEN | | | 35,954,269 |
|
| Switzerland - 4.3% | | | |
| ADC Therapeutics SA (a) | | 73,500 | 2,108,715 |
| Dufry AG (a) | | 49,100 | 1,858,084 |
| Garmin Ltd. | | 77,000 | 8,009,540 |
| Lonza Group AG | | 18,242 | 11,053,014 |
| Nestle SA (Reg. S) | | 243,640 | 27,404,124 |
| Partners Group Holding AG | | 6,908 | 6,227,333 |
| Roche Holding AG (participation certificate) | | 64,809 | 20,825,175 |
| Schindler Holding AG (participation certificate) | | 12,788 | 3,270,392 |
| Siemens Energy AG (a) | | 42,850 | 938,219 |
| Sika AG | | 43,179 | 10,628,170 |
| Swiss Re Ltd. | | 104,960 | 7,525,024 |
| Zur Rose Group AG (a) | | 16,270 | 4,533,491 |
|
| TOTAL SWITZERLAND | | | 104,381,281 |
|
| Taiwan - 0.3% | | | |
| MediaTek, Inc. | | 141,000 | 3,341,536 |
| Taiwan Semiconductor Manufacturing Co. Ltd. | | 268,000 | 4,053,973 |
|
| TOTAL TAIWAN | | | 7,395,509 |
|
| Thailand - 0.1% | | | |
| Thai Beverage PCL | | 4,528,500 | 1,925,828 |
| United Kingdom - 3.8% | | | |
| Anglo American PLC (United Kingdom) | | 153,709 | 3,606,643 |
| AstraZeneca PLC (United Kingdom) | | 149,292 | 14,989,738 |
| Beazley PLC | | 733,200 | 2,792,590 |
| Big Yellow Group PLC | | 197,600 | 2,815,899 |
| Compass Group PLC | | 227,950 | 3,120,122 |
| Cranswick PLC | | 54,155 | 2,257,678 |
| Dechra Pharmaceuticals PLC | | 75,800 | 3,429,106 |
| Diageo PLC | | 129,719 | 4,192,243 |
| Hilton Food Group PLC | | 374,800 | 5,632,419 |
| HomeServe PLC | | 250,800 | 3,590,271 |
| John David Group PLC | | 520,200 | 4,995,088 |
| JTC PLC (b) | | 412,000 | 2,871,553 |
| Lloyds Banking Group PLC | | 6,302,400 | 2,294,749 |
| London Stock Exchange Group PLC | | 59,881 | 6,455,047 |
| M&G PLC | | 3,388,470 | 6,437,587 |
| Ocado Group PLC (a) | | 144,100 | 4,248,872 |
| Prudential PLC | | 520,123 | 6,361,366 |
| Reckitt Benckiser Group PLC | | 57,024 | 5,023,161 |
| Rotork PLC | | 515,276 | 1,875,788 |
| THG Holdings Ltd. | | 175,700 | 1,501,377 |
| Vistry Group PLC | | 194,444 | 1,372,867 |
| Zegona Communications PLC | | 1,660,100 | 2,387,232 |
|
| TOTAL UNITED KINGDOM | | | 92,251,396 |
|
| United States of America - 60.9% | | | |
| 10X Genomics, Inc. (a) | | 79,000 | 10,815,100 |
| Abbott Laboratories | | 121,000 | 12,718,310 |
| Abcam PLC ADR | | 40,000 | 760,000 |
| Activision Blizzard, Inc. | | 69,000 | 5,225,370 |
| Adobe, Inc. (a) | | 124,124 | 55,495,840 |
| Allegro MicroSystems LLC (a) | | 15,800 | 289,140 |
| Alnylam Pharmaceuticals, Inc. (a) | | 10,000 | 1,229,700 |
| Alphabet, Inc. Class A (a) | | 43,000 | 69,492,730 |
| Amazon.com, Inc. (a) | | 25,800 | 78,332,670 |
| ANSYS, Inc. (a) | | 35,000 | 10,652,950 |
| Apple, Inc. | | 412,000 | 44,850,320 |
| Array Technologies, Inc. | | 58,100 | 2,140,985 |
| Arthur J. Gallagher & Co. | | 89,000 | 9,230,190 |
| Aspen Technology, Inc. (a) | | 17,000 | 1,866,770 |
| Autodesk, Inc. (a) | | 61,000 | 14,367,940 |
| AutoZone, Inc. (a) | | 2,500 | 2,822,450 |
| Axon Enterprise, Inc. (a) | | 9,000 | 890,100 |
| Bank of America Corp. | | 437,000 | 10,356,900 |
| Bio-Rad Laboratories, Inc. Class A (a) | | 8,000 | 4,691,360 |
| BRP Group, Inc. (a) | | 159,300 | 4,062,150 |
| Cable One, Inc. | | 5,000 | 8,659,300 |
| Caesars Entertainment, Inc. (a) | | 419,000 | 18,779,580 |
| Callaway Golf Co. | | 17,000 | 263,330 |
| Carrier Global Corp. | | 375,000 | 12,521,250 |
| Cerence, Inc. (a)(c) | | 1,000 | 54,580 |
| Ceridian HCM Holding, Inc. (a) | | 24,000 | 2,069,280 |
| Charter Communications, Inc. Class A (a) | | 5,000 | 3,019,100 |
| Churchill Downs, Inc. | | 11,000 | 1,640,650 |
| Cintas Corp. | | 97,000 | 30,511,350 |
| Costco Wholesale Corp. | | 40,000 | 14,304,800 |
| D.R. Horton, Inc. | | 221,000 | 14,765,010 |
| Danaher Corp. | | 135,000 | 30,987,900 |
| Deckers Outdoor Corp. (a) | | 31,000 | 7,854,470 |
| Dollar General Corp. | | 104,000 | 21,705,840 |
| Dynatrace, Inc. (a) | | 6,000 | 211,860 |
| Encompass Health Corp. | | 2 | 123 |
| EPAM Systems, Inc. (a) | | 15,000 | 4,634,250 |
| Estee Lauder Companies, Inc. Class A | | 306,000 | 67,215,960 |
| Facebook, Inc. Class A (a) | | 242,000 | 63,672,620 |
| First Solar, Inc. (a) | | 26,900 | 2,341,511 |
| Floor & Decor Holdings, Inc. Class A (a) | | 28,000 | 2,044,000 |
| Freeport-McMoRan, Inc. | | 883,000 | 15,311,220 |
| Humana, Inc. | | 94,300 | 37,652,104 |
| InterActiveCorp (a) | | 5,000 | 603,600 |
| Intuit, Inc. | | 44,700 | 14,066,196 |
| Intuitive Surgical, Inc. (a) | | 5,000 | 3,335,400 |
| Laird Superfood, Inc. | | 38,700 | 1,780,200 |
| Lennar Corp. Class A | | 102,000 | 7,163,460 |
| Lowe's Companies, Inc. | | 89,000 | 14,070,900 |
| lululemon athletica, Inc. (a) | | 11,000 | 3,512,190 |
| Marriott International, Inc. Class A | | 13,000 | 1,207,440 |
| MasterCard, Inc. Class A | | 234,900 | 67,801,536 |
| McCormick & Co., Inc. (non-vtg.) | | 13,000 | 2,346,630 |
| MercadoLibre, Inc. (a) | | 18,200 | 22,095,710 |
| Microsoft Corp. | | 462,000 | 93,541,142 |
| Moody's Corp. | | 114,500 | 30,102,050 |
| NextEra Energy, Inc. | | 238,000 | 17,423,980 |
| NIKE, Inc. Class B | | 107,000 | 12,848,560 |
| Norfolk Southern Corp. | | 29,000 | 6,064,480 |
| NVIDIA Corp. | | 78,000 | 39,106,080 |
| Ollie's Bargain Outlet Holdings, Inc. (a) | | 55,000 | 4,789,950 |
| ON Semiconductor Corp. (a) | | 155,000 | 3,888,950 |
| Outset Medical, Inc. | | 19,986 | 928,749 |
| Overstock.com, Inc. (a) | | 65,000 | 3,646,500 |
| Parametric Technology Corp. (a) | | 28,000 | 2,348,640 |
| PayPal Holdings, Inc. (a) | | 371,000 | 69,054,230 |
| Penn National Gaming, Inc. (a) | | 135,823 | 7,331,726 |
| Prelude Therapeutics, Inc. | | 59,344 | 2,090,689 |
| Prologis (REIT), Inc. | | 58,200 | 5,773,440 |
| Relay Therapeutics, Inc. (a) | | 10,100 | 373,094 |
| Royalty Pharma PLC (c) | | 349,600 | 12,830,320 |
| S&P Global, Inc. | | 158,628 | 51,194,014 |
| Salesforce.com, Inc. (a) | | 74,000 | 17,187,980 |
| ServiceNow, Inc. (a) | | 9,000 | 4,478,130 |
| Shattuck Labs, Inc. | | 28,100 | 726,385 |
| Square, Inc. (a) | | 410,000 | 63,500,800 |
| Stamps.com, Inc. (a) | | 2,000 | 446,480 |
| Sunrun, Inc. (a) | | 121,310 | 6,310,546 |
| T-Mobile U.S., Inc. | | 65,700 | 7,198,749 |
| Taysha Gene Therapies, Inc. | | 26,000 | 540,800 |
| Thermo Fisher Scientific, Inc. | | 95,000 | 44,946,400 |
| Tractor Supply Co. | | 10,000 | 1,332,100 |
| Twilio, Inc. Class A (a) | | 8,000 | 2,231,760 |
| Ulta Beauty, Inc. (a) | | 1,000 | 206,770 |
| Union Pacific Corp. | | 360,000 | 63,788,400 |
| UnitedHealth Group, Inc. | | 173,000 | 52,789,220 |
| Vaxcyte, Inc. | | 68,000 | 2,541,160 |
| Verisk Analytics, Inc. | | 9,000 | 1,601,730 |
| Visa, Inc. Class A | | 50,000 | 9,085,500 |
| Vista Outdoor, Inc. (a) | | 28,000 | 553,560 |
| Workday, Inc. Class A (a) | | 3,000 | 630,360 |
| Zoetis, Inc. Class A | | 35,000 | 5,549,250 |
| Zoominfo Technologies, Inc. | | 50,000 | 1,899,500 |
|
| TOTAL UNITED STATES OF AMERICA | | | 1,489,376,499 |
|
| TOTAL COMMON STOCKS | | | |
| (Cost $1,748,885,637) | | | 2,376,514,757 |
|
| Preferred Stocks - 0.3% | | | |
| Convertible Preferred Stocks - 0.1% | | | |
| Hong Kong - 0.1% | | | |
| Antengene Corp. Series C1 (d)(e) | | 447,701 | 1,265,152 |
| Nonconvertible Preferred Stocks - 0.2% | | | |
| Germany - 0.2% | | | |
| Volkswagen AG | | 41,000 | 5,973,606 |
| TOTAL PREFERRED STOCKS | | | |
| (Cost $8,568,524) | | | 7,238,758 |
|
| Money Market Funds - 3.4% | | | |
| Fidelity Cash Central Fund 0.10% (f) | | 69,087,528 | 69,101,346 |
| Fidelity Securities Lending Cash Central Fund 0.11% (f)(g) | | 13,679,978 | 13,681,346 |
| TOTAL MONEY MARKET FUNDS | | | |
| (Cost $82,779,148) | | | 82,782,692 |
| TOTAL INVESTMENT IN SECURITIES - 100.8% | | | |
| (Cost $1,840,233,309) | | | 2,466,536,207 |
| NET OTHER ASSETS (LIABILITIES) - (0.8)% | | | (20,760,899) |
| NET ASSETS - 100% | | | $2,445,775,308 |
Categorizations in the Schedule of Investments are based on country or territory of incorporation.
Legend
(a) Non-income producing
(b) Security exempt from registration under Rule 144A of the Securities Act of 1933. These securities may be resold in transactions exempt from registration, normally to qualified institutional buyers. At the end of the period, the value of these securities amounted to $57,501,891 or 2.4% of net assets.
(c) Security or a portion of the security is on loan at period end.
(d) Level 3 security
(e) Restricted securities (including private placements) - Investment in securities not registered under the Securities Act of 1933 (excluding 144A issues). At the end of the period, the value of restricted securities (excluding 144A issues) amounted to $1,265,152 or 0.1% of net assets.
(f) Affiliated fund that is generally available only to investment companies and other accounts managed by Fidelity Investments. The rate quoted is the annualized seven-day yield of the fund at period end. A complete unaudited listing of the fund's holdings as of its most recent quarter end is available upon request. In addition, each Fidelity Central Fund's financial statements, which are not covered by the Fund's Report of Independent Registered Public Accounting Firm, are available on the SEC's website or upon request.
(g) Investment made with cash collateral received from securities on loan.
Additional information on each restricted holding is as follows:
| Security | Acquisition Date | Acquisition Cost |
| Antengene Corp. Series C1 | 7/11/20 | $1,265,152 |
Affiliated Central Funds
Information regarding fiscal year to date income earned by the Fund from investments in Fidelity Central Funds is as follows:
| Fund | Income earned |
| Fidelity Cash Central Fund | $236,191 |
| Fidelity Securities Lending Cash Central Fund | 89,030 |
| Total | $325,221 |
Amounts in the income column in the above table include any capital gain distributions from underlying funds, which are presented in the corresponding line-item in the Statement of Operations, if applicable. Amount for Fidelity Securities Lending Cash Central Fund represents the income earned on investing cash collateral, less rebates paid to borrowers and any lending agent fees associated with the loan, plus any premium payments received for lending certain types of securities.
Investment Valuation
The following is a summary of the inputs used, as of October 31, 2020, involving the Fund's assets and liabilities carried at fair value. The inputs or methodology used for valuing securities may not be an indication of the risk associated with investing in those securities. For more information on valuation inputs, and their aggregation into the levels used below, please refer to the Investment Valuation section in the accompanying Notes to Financial Statements.
| | Valuation Inputs at Reporting Date: |
| Description | Total | Level 1 | Level 2 | Level 3 |
| Investments in Securities: | | | | |
| Equities: | | | | |
| Communication Services | $236,268,200 | $201,423,450 | $34,844,750 | $-- |
| Consumer Discretionary | 360,768,110 | 305,304,980 | 55,463,130 | -- |
| Consumer Staples | 153,923,929 | 106,089,472 | 47,834,457 | -- |
| Energy | 10,846,019 | 6,227,338 | 4,618,681 | -- |
| Financials | 221,583,483 | 161,507,614 | 60,075,869 | -- |
| Health Care | 389,342,258 | 301,574,328 | 86,502,778 | 1,265,152 |
| Industrials | 259,149,671 | 208,821,068 | 50,328,603 | -- |
| Information Technology | 650,325,272 | 585,007,720 | 65,317,552 | -- |
| Materials | 45,247,592 | 38,354,949 | 6,892,643 | -- |
| Real Estate | 29,687,609 | 17,462,775 | 12,224,834 | -- |
| Utilities | 26,611,372 | 26,611,372 | -- | -- |
| Money Market Funds | 82,782,692 | 82,782,692 | -- | -- |
| Total Investments in Securities: | $2,466,536,207 | $2,041,167,758 | $424,103,297 | $1,265,152 |
See accompanying notes which are an integral part of the financial statements.
Fidelity® Worldwide Fund
Financial Statements
Statement of Assets and Liabilities
| | | October 31, 2020 |
| Assets | | |
Investment in securities, at value (including securities loaned of $13,421,572) — See accompanying schedule:
Unaffiliated issuers (cost $1,757,454,161) | $2,383,753,515 | |
| Fidelity Central Funds (cost $82,779,148) | 82,782,692 | |
| Total Investment in Securities (cost $1,840,233,309) | | $2,466,536,207 |
| Foreign currency held at value (cost $236,312) | | 236,351 |
| Receivable for investments sold | | 27,037,258 |
| Receivable for fund shares sold | | 2,204,440 |
| Dividends receivable | | 3,254,398 |
| Distributions receivable from Fidelity Central Funds | | 11,193 |
| Prepaid expenses | | 3,933 |
| Other receivables | | 79,211 |
| Total assets | | 2,499,362,991 |
| Liabilities | | |
| Payable to custodian bank | $285,713 | |
| Payable for investments purchased | 35,624,672 | |
| Payable for fund shares redeemed | 1,706,666 | |
| Accrued management fee | 1,784,789 | |
| Distribution and service plan fees payable | 32,317 | |
| Other affiliated payables | 400,892 | |
| Other payables and accrued expenses | 71,584 | |
| Collateral on securities loaned | 13,681,050�� | |
| Total liabilities | | 53,587,683 |
| Net Assets | | $2,445,775,308 |
| Net Assets consist of: | | |
| Paid in capital | | $1,616,676,441 |
| Total accumulated earnings (loss) | | 829,098,867 |
| Net Assets | | $2,445,775,308 |
| Net Asset Value and Maximum Offering Price | | |
| Class A: | | |
| Net Asset Value and redemption price per share ($63,689,913 ÷ 2,022,485 shares)(a) | | $31.49 |
| Maximum offering price per share (100/94.25 of $31.49) | | $33.41 |
| Class M: | | |
| Net Asset Value and redemption price per share ($17,387,010 ÷ 557,405 shares)(a) | | $31.19 |
| Maximum offering price per share (100/96.50 of $31.19) | | $32.32 |
| Class C: | | |
| Net Asset Value and offering price per share ($11,676,893 ÷ 387,387 shares)(a) | | $30.14 |
| Worldwide: | | |
| Net Asset Value, offering price and redemption price per share ($2,217,129,102 ÷ 69,359,418 shares) | | $31.97 |
| Class I: | | |
| Net Asset Value, offering price and redemption price per share ($64,614,508 ÷ 2,034,117 shares) | | $31.77 |
| Class Z: | | |
| Net Asset Value, offering price and redemption price per share ($71,277,882 ÷ 2,244,090 shares) | | $31.76 |
(a) Redemption price per share is equal to net asset value less any applicable contingent deferred sales charge.
See accompanying notes which are an integral part of the financial statements.
Statement of Operations
| | | Year ended October 31, 2020 |
| Investment Income | | |
| Dividends | | $27,444,454 |
| Income from Fidelity Central Funds (including $89,030 from security lending) | | 325,221 |
| Income before foreign taxes withheld | | 27,769,675 |
| Less foreign taxes withheld | | (1,490,593) |
| Total income | | 26,279,082 |
| Expenses | | |
| Management fee | | |
| Basic fee | $14,975,865 | |
| Performance adjustment | 4,222,761 | |
| Transfer agent fees | 3,679,673 | |
| Distribution and service plan fees | 328,828 | |
| Accounting fees | 685,194 | |
| Custodian fees and expenses | 175,507 | |
| Independent trustees' fees and expenses | 12,930 | |
| Registration fees | 126,015 | |
| Audit | 89,415 | |
| Legal | 11,014 | |
| Miscellaneous | 46,853 | |
| Total expenses before reductions | 24,354,055 | |
| Expense reductions | (203,696) | |
| Total expenses after reductions | | 24,150,359 |
| Net investment income (loss) | | 2,128,723 |
| Realized and Unrealized Gain (Loss) | | |
| Net realized gain (loss) on: | | |
| Investment securities: | | |
| Unaffiliated issuers | 221,806,596 | |
| Fidelity Central Funds | 1,362 | |
| Foreign currency transactions | (93,480) | |
| Total net realized gain (loss) | | 221,714,478 |
| Change in net unrealized appreciation (depreciation) on: | | |
| Investment securities: | | |
| Unaffiliated issuers (net of decrease in deferred foreign taxes of $1,736) | 192,930,390 | |
| Fidelity Central Funds | (454) | |
| Assets and liabilities in foreign currencies | 152,055 | |
| Total change in net unrealized appreciation (depreciation) | | 193,081,991 |
| Net gain (loss) | | 414,796,469 |
| Net increase (decrease) in net assets resulting from operations | | $416,925,192 |
See accompanying notes which are an integral part of the financial statements.
Statement of Changes in Net Assets
| | Year ended October 31, 2020 | Year ended October 31, 2019 |
| Increase (Decrease) in Net Assets | | |
| Operations | | |
| Net investment income (loss) | $2,128,723 | $16,430,287 |
| Net realized gain (loss) | 221,714,478 | 104,750,827 |
| Change in net unrealized appreciation (depreciation) | 193,081,991 | 163,942,786 |
| Net increase (decrease) in net assets resulting from operations | 416,925,192 | 285,123,900 |
| Distributions to shareholders | (109,767,429) | (191,789,642) |
| Share transactions - net increase (decrease) | (208,021,277) | 20,629,262 |
| Total increase (decrease) in net assets | 99,136,486 | 113,963,520 |
| Net Assets | | |
| Beginning of period | 2,346,638,822 | 2,232,675,302 |
| End of period | $2,445,775,308 | $2,346,638,822 |
See accompanying notes which are an integral part of the financial statements.
Financial Highlights
Fidelity Worldwide Fund Class A
| Years ended October 31, | 2020 | 2019 | 2018 | 2017 | 2016 |
| Selected Per–Share Data | | | | | |
| Net asset value, beginning of period | $27.36 | $26.57 | $27.28 | $21.83 | $22.88 |
| Income from Investment Operations | | | | | |
| Net investment income (loss)A | (.05) | .11 | .03 | .11 | .12 |
| Net realized and unrealized gain (loss) | 5.50 | 2.84 | 1.00 | 5.53 | (.35) |
| Total from investment operations | 5.45 | 2.95 | 1.03 | 5.64 | (.23) |
| Distributions from net investment income | (.12) | (.02) | (.09) | (.12) | (.07) |
| Distributions from net realized gain | (1.20) | (2.14) | (1.65) | (.07) | (.75) |
| Total distributions | (1.32) | (2.16) | (1.74) | (.19) | (.82) |
| Redemption fees added to paid in capitalA | – | – | – | –B | –B |
| Net asset value, end of period | $31.49 | $27.36 | $26.57 | $27.28 | $21.83 |
| Total ReturnC,D | 20.72% | 12.35% | 3.96% | 26.06% | (1.09)% |
| Ratios to Average Net AssetsE,F | | | | | |
| Expenses before reductions | 1.34% | 1.26% | 1.23% | 1.12% | 1.22% |
| Expenses net of fee waivers, if any | 1.34% | 1.26% | 1.23% | 1.12% | 1.22% |
| Expenses net of all reductions | 1.33% | 1.25% | 1.22% | 1.11% | 1.22% |
| Net investment income (loss) | (.18)% | .41% | .12% | .47% | .55% |
| Supplemental Data | | | | | |
| Net assets, end of period (000 omitted) | $63,690 | $52,516 | $42,947 | $32,823 | $29,052 |
| Portfolio turnover rateG | 112% | 147% | 117% | 111% | 117% |
A Calculated based on average shares outstanding during the period.
B Amount represents less than $.005 per share.
C Total returns would have been lower if certain expenses had not been reduced during the applicable periods shown.
D Total returns do not include the effect of the sales charges.
E Fees and expenses of any underlying mutual funds or exchange-traded funds (ETFs) are not included in the Fund's expense ratio. The Fund indirectly bears its proportionate share of these expenses. For additional expense information related to investments in Fidelity Central Funds, please refer to the "Investments in Fidelity Central Funds" note found in the Notes to Financial Statements section of the most recent Annual or Semi-Annual report.
F Expense ratios reflect operating expenses of the class. Expenses before reductions do not reflect amounts reimbursed, waived, or reduced through arrangements with the investment adviser, brokerage services, or other offset arrangements, if applicable, and do not represent the amount paid by the class during periods when reimbursements, waivers or reductions occur.
G Amount does not include the portfolio activity of any underlying mutual funds or exchange-traded funds (ETFs).
See accompanying notes which are an integral part of the financial statements.
Fidelity Worldwide Fund Class M
| Years ended October 31, | 2020 | 2019 | 2018 | 2017 | 2016 |
| Selected Per–Share Data | | | | | |
| Net asset value, beginning of period | $27.10 | $26.39 | $27.11 | $21.67 | $22.72 |
| Income from Investment Operations | | | | | |
| Net investment income (loss)A | (.13) | .03 | (.05) | .04 | .05 |
| Net realized and unrealized gain (loss) | 5.46 | 2.82 | 1.00 | 5.50 | (.35) |
| Total from investment operations | 5.33 | 2.85 | .95 | 5.54 | (.30) |
| Distributions from net investment income | (.04) | – | (.02) | (.03) | –B |
| Distributions from net realized gain | (1.20) | (2.14) | (1.65) | (.07) | (.75) |
| Total distributions | (1.24) | (2.14) | (1.67) | (.10) | (.75) |
| Redemption fees added to paid in capitalA | – | – | – | –B | –B |
| Net asset value, end of period | $31.19 | $27.10 | $26.39 | $27.11 | $21.67 |
| Total ReturnC,D | 20.40% | 12.05% | 3.65% | 25.68% | (1.38)% |
| Ratios to Average Net AssetsE,F | | | | | |
| Expenses before reductions | 1.61% | 1.55% | 1.52% | 1.42% | 1.53% |
| Expenses net of fee waivers, if any | 1.61% | 1.54% | 1.52% | 1.42% | 1.52% |
| Expenses net of all reductions | 1.61% | 1.54% | 1.51% | 1.41% | 1.52% |
| Net investment income (loss) | (.45)% | .13% | (.17)% | .17% | .25% |
| Supplemental Data | | | | | |
| Net assets, end of period (000 omitted) | $17,387 | $13,066 | $12,746 | $10,634 | $9,270 |
| Portfolio turnover rateG | 112% | 147% | 117% | 111% | 117% |
A Calculated based on average shares outstanding during the period.
B Amount represents less than $.005 per share.
C Total returns would have been lower if certain expenses had not been reduced during the applicable periods shown.
D Total returns do not include the effect of the sales charges.
E Fees and expenses of any underlying mutual funds or exchange-traded funds (ETFs) are not included in the Fund's expense ratio. The Fund indirectly bears its proportionate share of these expenses. For additional expense information related to investments in Fidelity Central Funds, please refer to the "Investments in Fidelity Central Funds" note found in the Notes to Financial Statements section of the most recent Annual or Semi-Annual report.
F Expense ratios reflect operating expenses of the class. Expenses before reductions do not reflect amounts reimbursed, waived, or reduced through arrangements with the investment adviser, brokerage services, or other offset arrangements, if applicable, and do not represent the amount paid by the class during periods when reimbursements, waivers or reductions occur.
G Amount does not include the portfolio activity of any underlying mutual funds or exchange-traded funds (ETFs).
See accompanying notes which are an integral part of the financial statements.
Fidelity Worldwide Fund Class C
| Years ended October 31, | 2020 | 2019 | 2018 | 2017 | 2016 |
| Selected Per–Share Data | | | | | |
| Net asset value, beginning of period | $26.33 | $25.82 | $26.67 | $21.33 | $22.48 |
| Income from Investment Operations | | | | | |
| Net investment income (loss)A | (.27) | (.10) | (.18) | (.07) | (.05) |
| Net realized and unrealized gain (loss) | 5.28 | 2.75 | .98 | 5.42 | (.35) |
| Total from investment operations | 5.01 | 2.65 | .80 | 5.35 | (.40) |
| Distributions from net investment income | – | – | – | – | – |
| Distributions from net realized gain | (1.20) | (2.14) | (1.65) | (.01) | (.75) |
| Total distributions | (1.20) | (2.14) | (1.65) | (.01) | (.75) |
| Redemption fees added to paid in capitalA | – | – | – | –B | –B |
| Net asset value, end of period | $30.14 | $26.33 | $25.82 | $26.67 | $21.33 |
| Total ReturnC,D | 19.76% | 11.49% | 3.12% | 25.10% | (1.88)% |
| Ratios to Average Net AssetsE,F | | | | | |
| Expenses before reductions | 2.14% | 2.06% | 2.01% | 1.89% | 2.01% |
| Expenses net of fee waivers, if any | 2.14% | 2.06% | 2.01% | 1.89% | 2.01% |
| Expenses net of all reductions | 2.13% | 2.06% | 2.00% | 1.88% | 2.00% |
| Net investment income (loss) | (.98)% | (.39)% | (.66)% | (.30)% | (.24)% |
| Supplemental Data | | | | | |
| Net assets, end of period (000 omitted) | $11,677 | $10,618 | $12,744 | $10,264 | $10,315 |
| Portfolio turnover rateG | 112% | 147% | 117% | 111% | 117% |
A Calculated based on average shares outstanding during the period.
B Amount represents less than $.005 per share.
C Total returns would have been lower if certain expenses had not been reduced during the applicable periods shown.
D Total returns do not include the effect of the contingent deferred sales charge.
E Fees and expenses of any underlying mutual funds or exchange-traded funds (ETFs) are not included in the Fund's expense ratio. The Fund indirectly bears its proportionate share of these expenses. For additional expense information related to investments in Fidelity Central Funds, please refer to the "Investments in Fidelity Central Funds" note found in the Notes to Financial Statements section of the most recent Annual or Semi-Annual report.
F Expense ratios reflect operating expenses of the class. Expenses before reductions do not reflect amounts reimbursed, waived, or reduced through arrangements with the investment adviser, brokerage services, or other offset arrangements, if applicable, and do not represent the amount paid by the class during periods when reimbursements, waivers or reductions occur.
G Amount does not include the portfolio activity of any underlying mutual funds or exchange-traded funds (ETFs).
See accompanying notes which are an integral part of the financial statements.
Fidelity Worldwide Fund
| Years ended October 31, | 2020 | 2019 | 2018 | 2017 | 2016 |
| Selected Per–Share Data | | | | | |
| Net asset value, beginning of period | $27.74 | $26.90 | $27.61 | $22.09 | $23.14 |
| Income from Investment Operations | | | | | |
| Net investment income (loss)A | .03 | .18 | .11 | .19 | .19 |
| Net realized and unrealized gain (loss) | 5.58 | 2.89 | 1.00 | 5.60 | (.35) |
| Total from investment operations | 5.61 | 3.07 | 1.11 | 5.79 | (.16) |
| Distributions from net investment income | (.18) | (.09) | (.17) | (.20) | (.14) |
| Distributions from net realized gain | (1.20) | (2.14) | (1.65) | (.07) | (.75) |
| Total distributions | (1.38) | (2.23) | (1.82) | (.27) | (.89) |
| Redemption fees added to paid in capitalA | – | – | – | –B | –B |
| Net asset value, end of period | $31.97 | $27.74 | $26.90 | $27.61 | $22.09 |
| Total ReturnC | 21.07% | 12.71% | 4.23% | 26.49% | (.78)% |
| Ratios to Average Net AssetsD,E | | | | | |
| Expenses before reductions | 1.05% | .99% | .94% | .81% | .91% |
| Expenses net of fee waivers, if any | 1.05% | .99% | .94% | .81% | .91% |
| Expenses net of all reductions | 1.05% | .98% | .93% | .80% | .90% |
| Net investment income (loss) | .11% | .69% | .41% | .79% | .87% |
| Supplemental Data | | | | | |
| Net assets, end of period (000 omitted) | $2,217,129 | $2,020,487 | $2,112,988 | $1,656,173 | $1,421,364 |
| Portfolio turnover rateF | 112% | 147% | 117% | 111% | 117% |
A Calculated based on average shares outstanding during the period.
B Amount represents less than $.005 per share.
C Total returns would have been lower if certain expenses had not been reduced during the applicable periods shown.
D Fees and expenses of any underlying mutual funds or exchange-traded funds (ETFs) are not included in the Fund's expense ratio. The Fund indirectly bears its proportionate share of these expenses. For additional expense information related to investments in Fidelity Central Funds, please refer to the "Investments in Fidelity Central Funds" note found in the Notes to Financial Statements section of the most recent Annual or Semi-Annual report.
E Expense ratios reflect operating expenses of the class. Expenses before reductions do not reflect amounts reimbursed, waived, or reduced through arrangements with the investment adviser, brokerage services, or other offset arrangements, if applicable, and do not represent the amount paid by the class during periods when reimbursements, waivers or reductions occur.
F Amount does not include the portfolio activity of any underlying mutual funds or exchange-traded funds (ETFs).
See accompanying notes which are an integral part of the financial statements.
Fidelity Worldwide Fund Class I
| Years ended October 31, | 2020 | 2019 | 2018 | 2017 | 2016 |
| Selected Per–Share Data | | | | | |
| Net asset value, beginning of period | $27.58 | $26.77 | $27.49 | $21.99 | $23.03 |
| Income from Investment Operations | | | | | |
| Net investment income (loss)A | .03 | .18 | .11 | .19 | .17 |
| Net realized and unrealized gain (loss) | 5.55 | 2.86 | .99 | 5.56 | (.35) |
| Total from investment operations | 5.58 | 3.04 | 1.10 | 5.75 | (.18) |
| Distributions from net investment income | (.19) | (.09) | (.18) | (.18) | (.11) |
| Distributions from net realized gain | (1.20) | (2.14) | (1.65) | (.07) | (.75) |
| Total distributions | (1.39) | (2.23) | (1.82)B | (.25) | (.86) |
| Redemption fees added to paid in capitalA | – | – | – | –C | –C |
| Net asset value, end of period | $31.77 | $27.58 | $26.77 | $27.49 | $21.99 |
| Total ReturnD | 21.08% | 12.70% | 4.22% | 26.45% | (.86)% |
| Ratios to Average Net AssetsE,F | | | | | |
| Expenses before reductions | 1.06% | .99% | .96% | .83% | .99% |
| Expenses net of fee waivers, if any | 1.06% | .99% | .95% | .83% | .99% |
| Expenses net of all reductions | 1.05% | .98% | .94% | .82% | .98% |
| Net investment income (loss) | .10% | .69% | .40% | .77% | .78% |
| Supplemental Data | | | | | |
| Net assets, end of period (000 omitted) | $64,615 | $44,754 | $50,956 | $21,711 | $12,924 |
| Portfolio turnover rateG | 112% | 147% | 117% | 111% | 117% |
A Calculated based on average shares outstanding during the period.
B Total distributions per share do not sum due to rounding.
C Amount represents less than $.005 per share.
D Total returns would have been lower if certain expenses had not been reduced during the applicable periods shown.
E Fees and expenses of any underlying mutual funds or exchange-traded funds (ETFs) are not included in the Fund's expense ratio. The Fund indirectly bears its proportionate share of these expenses. For additional expense information related to investments in Fidelity Central Funds, please refer to the "Investments in Fidelity Central Funds" note found in the Notes to Financial Statements section of the most recent Annual or Semi-Annual report.
F Expense ratios reflect operating expenses of the class. Expenses before reductions do not reflect amounts reimbursed, waived, or reduced through arrangements with the investment adviser, brokerage services, or other offset arrangements, if applicable, and do not represent the amount paid by the class during periods when reimbursements, waivers or reductions occur.
G Amount does not include the portfolio activity of any underlying mutual funds or exchange-traded funds (ETFs).
See accompanying notes which are an integral part of the financial statements.
Fidelity Worldwide Fund Class Z
| Years ended October 31, | 2020 | 2019 | 2018 A |
| Selected Per–Share Data | | | |
| Net asset value, beginning of period | $27.59 | $26.78 | $29.54 |
| Income from Investment Operations | | | |
| Net investment income (loss)B | .07 | .22 | (.01) |
| Net realized and unrealized gain (loss) | 5.53 | 2.86 | (2.75) |
| Total from investment operations | 5.60 | 3.08 | (2.76) |
| Distributions from net investment income | (.23) | (.13) | – |
| Distributions from net realized gain | (1.20) | (2.14) | – |
| Total distributions | (1.43) | (2.27) | – |
| Net asset value, end of period | $31.76 | $27.59 | $26.78 |
| Total ReturnC,D | 21.19% | 12.85% | (9.34)% |
| Ratios to Average Net AssetsE,F | | | |
| Expenses before reductions | .93% | .85% | .88%G |
| Expenses net of fee waivers, if any | .93% | .84% | .88%G |
| Expenses net of all reductions | .93% | .84% | .87%G |
| Net investment income (loss) | .23% | .83% | (.27)%G |
| Supplemental Data | | | |
| Net assets, end of period (000 omitted) | $71,278 | $205,197 | $294 |
| Portfolio turnover rateH | 112% | 147% | 117% |
A For the period October 2, 2018 (commencement of sale of shares) to October 31, 2018.
B Calculated based on average shares outstanding during the period.
C Total returns for periods of less than one year are not annualized.
D Total returns would have been lower if certain expenses had not been reduced during the applicable periods shown.
E Fees and expenses of any underlying mutual funds or exchange-traded funds (ETFs) are not included in the Fund's expense ratio. The Fund indirectly bears its proportionate share of these expenses. For additional expense information related to investments in Fidelity Central Funds, please refer to the "Investments in Fidelity Central Funds" note found in the Notes to Financial Statements section of the most recent Annual or Semi-Annual report.
F Expense ratios reflect operating expenses of the class. Expenses before reductions do not reflect amounts reimbursed, waived, or reduced through arrangements with the investment adviser, brokerage services, or other offset arrangements, if applicable, and do not represent the amount paid by the class during periods when reimbursements, waivers or reductions occur.
G Annualized
H Amount does not include the portfolio activity of any underlying mutual funds or exchange-traded funds (ETFs).
See accompanying notes which are an integral part of the financial statements.
Notes to Financial Statements
For the period ended October 31, 2020
1. Organization.
Fidelity Worldwide Fund (the Fund) is a fund of Fidelity Investment Trust (the Trust) and is authorized to issue an unlimited number of shares. The Trust is registered under the Investment Company Act of 1940, as amended (the 1940 Act), as an open-end management investment company organized as a Massachusetts business trust. The Fund offers Class A, Class M, Class C, Worldwide, Class I and Class Z shares, each of which has equal rights as to assets and voting privileges. Each class has exclusive voting rights with respect to matters that affect that class. Class C shares will automatically convert to Class A shares after a holding period of ten years from the initial date of purchase, with certain exceptions.
Effective January 1, 2020:
Investment advisers Fidelity Investments Money Management, Inc., FMR Co., Inc., and Fidelity SelectCo, LLC, merged with and into Fidelity Management & Research Company. In connection with the merger transactions, the resulting, merged investment adviser was then redomiciled from Massachusetts to Delaware, changed its corporate structure from a corporation to a limited liability company, and changed its name to "Fidelity Management & Research Company LLC".
Broker-dealer Fidelity Distributors Corporation merged with and into Fidelity Investments Institutional Services Company, Inc. ("FIISC"). FIISC was then redomiciled from Massachusetts to Delaware, changed its corporate structure from a corporation to a limited liability company, and changed its name to "Fidelity Distributors Company LLC".
Fidelity Investments Institutional Operations Company, Inc. converted from a Massachusetts corporation to a Massachusetts LLC, and changed its name to "Fidelity Investments Institutional Operations Company LLC".
2. Investments in Fidelity Central Funds.
The Fund invests in Fidelity Central Funds, which are open-end investment companies generally available only to other investment companies and accounts managed by the investment adviser and its affiliates. The Fund's Schedule of Investments lists each of the Fidelity Central Funds held as of period end, if any, as an investment of the Fund, but does not include the underlying holdings of each Fidelity Central Fund. As an Investing Fund, the Fund indirectly bears its proportionate share of the expenses of the underlying Fidelity Central Funds.
The Money Market Central Funds seek preservation of capital and current income and are managed by the investment adviser. Annualized expenses of the Money Market Central Funds as of their most recent shareholder report date ranged from less than .005% to .01%.
A complete unaudited list of holdings for each Fidelity Central Fund is available upon request or at the Securities and Exchange Commission (the SEC) website at www.sec.gov. In addition, the financial statements of the Fidelity Central Funds, which are not covered by the Fund's Report of Independent Registered Public Accounting Firm, are available on the SEC website or upon request.
3. Significant Accounting Policies.
The Fund is an investment company and applies the accounting and reporting guidance of the Financial Accounting Standards Board (FASB) Accounting Standards Codification Topic 946 Financial Services – Investment Companies. The financial statements have been prepared in conformity with accounting principles generally accepted in the United States of America (GAAP), which require management to make certain estimates and assumptions at the date of the financial statements. Actual results could differ from those estimates. Subsequent events, if any, through the date that the financial statements were issued have been evaluated in the preparation of the financial statements. The following summarizes the significant accounting policies of the Fund:
Investment Valuation. Investments are valued as of 4:00 p.m. Eastern time on the last calendar day of the period. The Board of Trustees (the Board) has delegated the day to day responsibility for the valuation of the Fund's investments to the Fair Value Committee (the Committee) established by the Fund's investment adviser. In accordance with valuation policies and procedures approved by the Board, the Fund attempts to obtain prices from one or more third party pricing vendors or brokers to value its investments. When current market prices, quotations or currency exchange rates are not readily available or reliable, investments will be fair valued in good faith by the Committee, in accordance with procedures adopted by the Board. Factors used in determining fair value vary by investment type and may include market or investment specific events. The frequency with which these procedures are used cannot be predicted and they may be utilized to a significant extent. The Committee oversees the Fund's valuation policies and procedures and reports to the Board on the Committee's activities and fair value determinations. The Board monitors the appropriateness of the procedures used in valuing the Fund's investments and ratifies the fair value determinations of the Committee.
The Fund categorizes the inputs to valuation techniques used to value its investments into a disclosure hierarchy consisting of three levels as shown below:
- Level 1 – quoted prices in active markets for identical investments
- Level 2 – other significant observable inputs (including quoted prices for similar investments, interest rates, prepayment speeds, etc.)
- Level 3 – unobservable inputs (including the Fund's own assumptions based on the best information available)
Valuation techniques used to value the Fund's investments by major category are as follows:
Equity securities, including restricted securities, for which market quotations are readily available, are valued at the last reported sale price or official closing price as reported by a third party pricing vendor on the primary market or exchange on which they are traded and are categorized as Level 1 in the hierarchy. In the event there were no sales during the day or closing prices are not available, securities are valued at the last quoted bid price or may be valued using the last available price and are generally categorized as Level 2 in the hierarchy. For foreign equity securities, when market or security specific events arise, comparisons to the valuation of American Depositary Receipts (ADRs), futures contracts, Exchange-Traded Funds (ETFs) and certain indexes as well as quoted prices for similar securities may be used and would be categorized as Level 2 in the hierarchy. For equity securities, including restricted securities, where observable inputs are limited, assumptions about market activity and risk are used and these securities may be categorized as Level 3 in the hierarchy.
Investments in open-end mutual funds, including the Fidelity Central Funds, are valued at their closing net asset value (NAV) each business day and are categorized as Level 1 in the hierarchy.
Changes in valuation techniques may result in transfers in or out of an assigned level within the disclosure hierarchy. The aggregate value of investments by input level as of October 31, 2020 is included at the end of the Fund's Schedule of Investments.
Foreign Currency. Certain Funds may use foreign currency contracts to facilitate transactions in foreign-denominated securities. Gains and losses from these transactions may arise from changes in the value of the foreign currency or if the counterparties do not perform under the contracts' terms.
Foreign-denominated assets, including investment securities, and liabilities are translated into U.S. dollars at the exchange rates at period end. Purchases and sales of investment securities, income and dividends received, and expenses denominated in foreign currencies are translated into U.S. dollars at the exchange rate in effect on the transaction date.
The effects of exchange rate fluctuations on investments are included with the net realized and unrealized gain (loss) on investment securities. Other foreign currency transactions resulting in realized and unrealized gain (loss) are disclosed separately.
Investment Transactions and Income. For financial reporting purposes, the Fund's investment holdings and NAV include trades executed through the end of the last business day of the period. The NAV per share for processing shareholder transactions is calculated as of the close of business of the New York Stock Exchange (NYSE), normally 4:00 p.m. Eastern time and includes trades executed through the end of the prior business day. Gains and losses on securities sold are determined on the basis of identified cost and include proceeds received from litigation. Dividend income is recorded on the ex-dividend date, except for certain dividends from foreign securities where the ex-dividend date may have passed, which are recorded as soon as the Fund is informed of the ex-dividend date. Non-cash dividends included in dividend income, if any, are recorded at the fair market value of the securities received. Income and capital gain distributions from Fidelity Central Funds, if any, are recorded on the ex-dividend date. Certain distributions received by the Fund represent a return of capital or capital gain. The Fund determines the components of these distributions subsequent to the ex-dividend date, based upon receipt of tax filings or other correspondence relating to the underlying investment. These distributions are recorded as a reduction of cost of investments and/or as a realized gain. Investment income is recorded net of foreign taxes withheld where recovery of such taxes is uncertain.
Class Allocations and Expenses. Investment income, realized and unrealized capital gains and losses, common expenses of the Fund, and certain fund-level expense reductions, if any, are allocated daily on a pro-rata basis to each class based on the relative net assets of each class to the total net assets of the Fund. Each class differs with respect to transfer agent and distribution and service plan fees incurred. Certain expense reductions may also differ by class. For the reporting period, the allocated portion of income and expenses to each class as a percent of its average net assets may vary due to the timing of recording these transactions in relation to fluctuating net assets of the classes. Expenses directly attributable to a fund are charged to that fund. Expenses attributable to more than one fund are allocated among the respective funds on the basis of relative net assets or other appropriate methods. Expense estimates are accrued in the period to which they relate and adjustments are made when actual amounts are known.
Income Tax Information and Distributions to Shareholders. Each year, the Fund intends to qualify as a regulated investment company under Subchapter M of the Internal Revenue Code, including distributing substantially all of its taxable income and realized gains. As a result, no provision for U.S. Federal income taxes is required. As of October 31, 2020, the Fund did not have any unrecognized tax benefits in the financial statements; nor is the Fund aware of any tax positions for which it is reasonably possible that the total amounts of unrecognized tax benefits will significantly change in the next twelve months. The Fund files a U.S. federal tax return, in addition to state and local tax returns as required. The Fund's federal income tax returns are subject to examination by the Internal Revenue Service (IRS) for a period of three fiscal years after they are filed. State and local tax returns may be subject to examination for an additional fiscal year depending on the jurisdiction. Foreign taxes are provided for based on the Fund's understanding of the tax rules and rates that exist in the foreign markets in which it invests. The Fund is subject to a tax imposed on capital gains by certain countries in which it invests. An estimated deferred tax liability for net unrealized appreciation on the applicable securities is included in Other payables and accrued expenses on the Statement of Assets & Liabilities.
Distributions are declared and recorded on the ex-dividend date. Income and capital gain distributions are declared separately for each class. Income and capital gain distributions are determined in accordance with income tax regulations, which may differ from GAAP. In addition, the Fund claimed a portion of the payment made to redeeming shareholders as a distribution for income tax purposes.
Capital accounts within the financial statements are adjusted for permanent book-tax differences. These adjustments have no impact on net assets or the results of operations. Capital accounts are not adjusted for temporary book-tax differences which will reverse in a subsequent period.
Book-tax differences are primarily due to foreign currency transactions, passive foreign investment companies (PFIC) and losses deferred due to wash sales.
As of period end, the cost and unrealized appreciation (depreciation) in securities, and derivatives if applicable, for federal income tax purposes were as follows:
| Gross unrealized appreciation | $686,210,332 |
| Gross unrealized depreciation | (69,862,821) |
| Net unrealized appreciation (depreciation) | $616,347,511 |
| Tax Cost | $1,850,188,696 |
The tax-based components of distributable earnings as of period end were as follows:
| Undistributed ordinary income | $14,345,983 |
| Undistributed long-term capital gain | $198,344,392 |
| Net unrealized appreciation (depreciation) on securities and other investments | $616,406,758 |
The tax character of distributions paid was as follows:
| | October 31, 2020 | October 31, 2019 |
| Ordinary Income | $14,226,954 | $ 7,158,030 |
| Long-term Capital Gains | 95,540,474 | 184,631,612 |
| Total | $109,767,428 | $ 191,789,642 |
Restricted Securities (including Private Placements). The Fund may invest in securities that are subject to legal or contractual restrictions on resale. These securities generally may be resold in transactions exempt from registration or to the public if the securities are registered. Disposal of these securities may involve time-consuming negotiations and expense, and prompt sale at an acceptable price may be difficult. Information regarding restricted securities is included at the end of the Fund's Schedule of Investments.
4. Purchases and Sales of Investments.
Purchases and sales of securities, other than short-term securities, are noted in the table below.
| | Purchases ($) | Sales ($) |
| Fidelity Worldwide Fund | 2,509,580,729 | 2,805,903,898 |
5. Fees and Other Transactions with Affiliates.
Management Fee. Fidelity Management & Research Company LLC (the investment adviser) and its affiliates provide the Fund with investment management related services for which the Fund pays a monthly management fee. The management fee is the sum of an individual fund fee rate that is based on an annual rate of .424% of the Fund's average net assets and an annualized group fee rate that averaged .23% during the period. The group fee rate is based upon the monthly average net assets of a group of registered investment companies with which the investment adviser has management contracts. The group fee rate decreases as assets under management increase and increases as assets under management decrease. In addition, the management fee is subject to a performance adjustment (up to a maximum of +/- .20 % of the Fund's average net assets over a 36 month performance period). The upward or downward adjustment to the management fee is based on the relative investment performance of Worldwide as compared to its benchmark index, the MSCI World Index, over the same 36 month performance period. For the reporting period, the total annual management fee rate, including the performance adjustment, was .84% of the Fund's average net assets. The performance adjustment included in the management fee rate may be higher or lower than the maximum performance adjustment rate due to the difference between the average net assets for the reporting and performance periods.
Distribution and Service Plan Fees. In accordance with Rule 12b-1 of the 1940 Act, the Fund has adopted separate Distribution and Service Plans for each class of shares. Certain classes pay Fidelity Distributors Company LLC (FDC), an affiliate of the investment adviser, separate Distribution and Service Fees, each of which is based on an annual percentage of each class' average net assets. In addition, FDC may pay financial intermediaries for selling shares of the Fund and providing shareholder support services. For the period, the Distribution and Service Fee rates, total fees and amounts retained by FDC were as follows:
| | Distribution Fee | Service Fee | Total Fees | Retained by FDC |
| Class A | -% | .25% | $143,648 | $6,193 |
| Class M | .25% | .25% | 74,140 | 192 |
| Class C | .75% | .25% | 111,040 | 14,290 |
| | | | $328,828 | $20,675 |
Sales Load. FDC may receive a front-end sales charge of up to 5.75% for selling Class A shares and 3.50% for selling Class M shares, some of which is paid to financial intermediaries for selling shares of the Fund. Depending on the holding period, FDC may receive contingent deferred sales charges levied on Class A, Class M and Class C redemptions. The deferred sales charges are 1.00% for Class C shares, 1.00% for certain purchases of Class A shares and .25% for certain purchases of Class M shares.
For the period, sales charge amounts retained by FDC were as follows:
| | Retained by FDC |
| Class A | $26,190 |
| Class M | 2,264 |
| Class C(a) | 1,060 |
| | $29,514 |
(a) When Class C shares are initially sold, FDC pays commissions from its own resources to financial intermediaries through which the sales are made.
Transfer Agent Fees. Fidelity Investments Institutional Operations Company LLC (FIIOC), an affiliate of the investment adviser, is the transfer, dividend disbursing and shareholder servicing agent for each class of the Fund. FIIOC receives account fees and asset-based fees that vary according to the account size and type of account of the shareholders of the respective classes of the Fund, except for Class Z. FIIOC receives an asset-based fee of Class Z's average net assets. FIIOC pays for typesetting, printing and mailing of shareholder reports, except proxy statements. Effective February 1, 2020, the Board approved to change the fee for Class Z from .046% to .044%.
For the period, transfer agent fees for each class were as follows:
| | Amount | % of Class-Level Average Net Assets |
| Class A | $114,312 | .20 |
| Class M | 33,309 | .22 |
| Class C | 27,867 | .25 |
| Worldwide | 3,385,749 | .16 |
| Class I | 84,718 | .17 |
| Class Z | 33,718 | .04 |
| | $3,679,673 | |
Accounting Fees. Fidelity Service Company, Inc. (FSC), an affiliate of the investment adviser, maintains the Fund's accounting records. The accounting fee is based on the level of average net assets for each month. For the period, the fees were equivalent to the following annual rates:
| | % of Average Net Assets |
| Fidelity Worldwide Fund | .03 |
Brokerage Commissions. A portion of portfolio transactions were placed with brokerage firms which are affiliates of the investment adviser. Brokerage commissions are included in net realized gain (loss) and change in net unrealized appreciation (depreciation) in the Statement of Operations. The commissions paid to these affiliated firms were as follows:
| | Amount |
| Fidelity Worldwide Fund | $40,537 |
Interfund Trades. Funds may purchase from or sell securities to other Fidelity Funds under procedures adopted by the Board. The procedures have been designed to ensure these interfund trades are executed in accordance with Rule 17a-7 of the 1940 Act. Interfund trades are included within the respective purchases and sales amounts shown in the Purchases and Sales of Investments note.
6. Committed Line of Credit.
Certain Funds participate with other funds managed by the investment adviser or an affiliate in a $4.25 billion credit facility (the "line of credit") to be utilized for temporary or emergency purposes to fund shareholder redemptions or for other short-term liquidity purposes. The participating funds have agreed to pay commitment fees on their pro-rata portion of the line of credit, which are reflected in Miscellaneous expenses on the Statement of Operations, and are as follows:
| | Amount |
| Fidelity Worldwide Fund | $5,315 |
During the period, there were no borrowings on this line of credit.
7. Security Lending.
Funds lend portfolio securities from time to time in order to earn additional income. Lending agents are used, including National Financial Services (NFS), an affiliate of the investment adviser. Pursuant to a securities lending agreement, NFS will receive a fee, which is capped at 9.9% of a fund's daily lending revenue, for its services as lending agent. A fund may lend securities to certain qualified borrowers, including NFS. On the settlement date of the loan, a fund receives collateral (in the form of U.S. Treasury obligations, letters of credit and/or cash) against the loaned securities and maintains collateral in an amount not less than 100% of the market value of the loaned securities during the period of the loan. The market value of the loaned securities is determined at the close of business of a fund and any additional required collateral is delivered to a fund on the next business day. A fund or borrower may terminate the loan at any time, and if the borrower defaults on its obligation to return the securities loaned because of insolvency or other reasons, a fund may apply collateral received from the borrower against the obligation. A fund may experience delays and costs in recovering the securities loaned. Any cash collateral received is invested in the Fidelity Securities Lending Cash Central Fund. Any loaned securities are identified as such in the Schedule of Investments, and the value of loaned securities and cash collateral at period end, as applicable, are presented in the Statement of Assets and Liabilities. Security lending income represents the income earned on investing cash collateral, less rebates paid to borrowers and any lending agent fees associated with the loan, plus any premium payments received for lending certain types of securities. Security lending income is presented in the Statement of Operations as a component of income from Fidelity Central Funds. Affiliated security lending activity, if any, was as follows:
| | Total Security Lending Income Fees Paid to NFS | Security Lending Income From Securities Loaned to NFS | Value of Securities Loaned to NFS at Period End |
| Fidelity Worldwide Fund | $2,621 | $– | $– |
8. Expense Reductions.
Commissions paid to certain brokers with whom the investment adviser, or its affiliates, places trades on behalf of the Fund include an amount in addition to trade execution, which may be rebated back to the Fund to offset certain expenses. This amount totaled $187,324 for the period. In addition, through arrangements with the Fund's custodian, credits realized as a result of certain uninvested cash balances were used to reduce the Fund's expenses.
In addition, during the period the investment adviser or an affiliate reimbursed and/or waived a portion of fund-level operating expenses in the amount of $9,222.
In addition, during the period the investment adviser or an affiliate reimbursed the Fund $7,150 for an operational error which is included in the accompanying Statement of Operations.
9. Distributions to Shareholders.
Distributions to shareholders of each class were as follows:
| | Year ended
October 31, 2020 | Year ended
October 31, 2019 |
| Distributions to shareholders | | |
| Class A | $2,540,627 | $3,477,297 |
| Class M | 597,019 | 999,954 |
| Class C | 485,913 | 1,007,630 |
| Worldwide | 99,015,506 | 181,843,298 |
| Class I | 2,193,016 | 4,378,836 |
| Class Z | 4,935,348 | 82,627 |
| Total | $109,767,429 | $191,789,642 |
10. Share Transactions.
Share transactions for each class were as follows and may contain automatic conversions between classes or exchanges between affiliated funds:
| | Shares | Shares | Dollars | Dollars |
| | Year ended October 31, 2020 | Year ended October 31, 2019 | Year ended October 31, 2020 | Year ended October 31, 2019 |
| Class A | | | | |
| Shares sold | 475,915 | 578,893 | $13,883,005 | $14,794,108 |
| Reinvestment of distributions | 93,342 | 145,668 | 2,520,240 | 3,446,501 |
| Shares redeemed | (466,219) | (421,777) | (12,948,526) | (10,875,966) |
| Net increase (decrease) | 103,038 | 302,784 | $3,454,719 | $7,364,643 |
| Class M | | | | |
| Shares sold | 169,701 | 119,291 | $4,832,166 | $3,039,881 |
| Reinvestment of distributions | 21,955 | 42,261 | 588,617 | 992,713 |
| Shares redeemed | (116,311) | (162,441) | (3,349,819) | (4,259,086) |
| Net increase (decrease) | 75,345 | (889) | $2,070,964 | $(226,492) |
| Class C | | | | |
| Shares sold | 68,467 | 89,819 | $1,909,883 | $2,211,760 |
| Reinvestment of distributions | 18,008 | 41,980 | 468,757 | 962,606 |
| Shares redeemed | (102,322) | (222,064) | (2,788,194) | (5,536,447) |
| Net increase (decrease) | (15,847) | (90,265) | $(409,554) | $(2,362,081) |
| Worldwide | | | | |
| Shares sold | 11,137,411 | 17,812,491 | $329,813,105 | $465,593,029 |
| Reinvestment of distributions | 3,477,030 | 7,338,910 | 95,061,988 | 175,546,728 |
| Shares redeemed | (18,098,665) | (30,843,648) | (510,876,592) | (816,878,675) |
| Net increase (decrease) | (3,484,224) | (5,692,247) | $(86,001,499) | $(175,738,918) |
| Class I | | | | |
| Shares sold | 1,129,208 | 779,027 | $33,641,446 | $20,400,452 |
| Reinvestment of distributions | 79,304 | 180,011 | 2,154,693 | 4,282,467 |
| Shares redeemed | (797,116) | (1,239,611) | (22,006,317) | (32,127,178) |
| Net increase (decrease) | 411,396 | (280,573) | $13,789,822 | $(7,444,259) |
| Class Z | | | | |
| Shares sold | 1,477,770 | 7,651,988 | $42,218,184 | $205,105,406 |
| Reinvestment of distributions | 179,413 | 3,156 | 4,867,461 | 74,996 |
| Shares redeemed | (6,851,775) | (227,428) | (188,011,374) | (6,144,033) |
| Net increase (decrease) | (5,194,592) | 7,427,716 | $(140,925,729) | $199,036,369 |
11. Other.
The Fund's organizational documents provide former and current trustees and officers with a limited indemnification against liabilities arising in connection with the performance of their duties to the Fund. In the normal course of business, the Fund may also enter into contracts that provide general indemnifications. The Fund's maximum exposure under these arrangements is unknown as this would be dependent on future claims that may be made against the Fund. The risk of material loss from such claims is considered remote.
12. Coronavirus (COVID-19) Pandemic.
An outbreak of COVID-19 first detected in China during December 2019 has since spread globally and was declared a pandemic by the World Health Organization during March 2020. Developments that disrupt global economies and financial markets, such as the COVID-19 pandemic, may magnify factors that affect the Fund's performance.
Report of Independent Registered Public Accounting Firm
To the Board of Trustees of Fidelity Investment Trust and Shareholders of Fidelity Diversified International Fund, Fidelity International Capital Appreciation Fund and Fidelity Worldwide Fund:
Opinion on the Financial Statements and Financial Highlights
Opinions on the Financial Statements
We have audited the accompanying statements of assets and liabilities of Fidelity Diversified International Fund, Fidelity International Capital Appreciation Fund and Fidelity Worldwide Fund (the "Funds"), each a fund of Fidelity Investment Trust, including the schedules of investments, as of October 31, 2020, the related statements of operations for the year then ended, the statements of changes in net assets for each of the two years in the period then ended, the financial highlights for each of the five years in the period then ended, and the related notes. In our opinion, the financial statements and financial highlights present fairly, in all material respects, the financial position of each of the Funds as of October 31, 2020, and the results of their operations for the year then ended, the changes in their net assets for each of the two years in the period then ended, and the financial highlights for each of the five years in the period then ended in conformity with accounting principles generally accepted in the United States of America.
Basis for Opinion
These financial statements and financial highlights are the responsibility of the Funds’ management. Our responsibility is to express an opinion on the Funds’ financial statements and financial highlights based on our audits. We are a public accounting firm registered with the Public Company Accounting Oversight Board (United States) (PCAOB) and are required to be independent with respect to the Funds in accordance with the U.S. federal securities laws and the applicable rules and regulations of the Securities and Exchange Commission and the PCAOB.
We conducted our audits in accordance with the standards of the PCAOB. Those standards require that we plan and perform the audit to obtain reasonable assurance about whether the financial statements and financial highlights are free of material misstatement, whether due to error or fraud. The Funds are not required to have, nor were we engaged to perform, an audit of their internal control over financial reporting. As part of our audits we are required to obtain an understanding of internal control over financial reporting but not for the purpose of expressing an opinion on the effectiveness of the Funds’ internal control over financial reporting. Accordingly, we express no such opinion.
Our audits included performing procedures to assess the risks of material misstatement of the financial statements and financial highlights, whether due to error or fraud, and performing procedures that respond to those risks. Such procedures included examining, on a test basis, evidence regarding the amounts and disclosures in the financial statements and financial highlights. Our audits also included evaluating the accounting principles used and significant estimates made by management, as well as evaluating the overall presentation of the financial statements and financial highlights. Our procedures included confirmation of securities owned as of October 31, 2020, by correspondence with the custodian and brokers; when replies were not received from brokers, we performed other auditing procedures. We believe that our audits provide a reasonable basis for our opinion.
/s/ Deloitte &Touche LLP
Boston, Massachusetts
December 14, 2020
We have served as the auditor of one or more of the Fidelity investment companies since 1999.
Report of Independent Registered Public Accounting Firm
To the Board of Trustees of Fidelity Investment Trust and Shareholders of Fidelity Overseas Fund
Opinion on the Financial Statements
We have audited the accompanying statement of assets and liabilities, including the schedule of investments, of Fidelity Overseas Fund (one of the funds constituting Fidelity Investment Trust, referred to hereafter as the “Fund”) as of October 31, 2020, the related statement of operations for the year ended October 31, 2020, the statement of changes in net assets for each of the two years in the period ended October 31, 2020, including the related notes, and the financial highlights for each of the five years in the period ended October 31, 2020 (collectively referred to as the “financial statements”). In our opinion, the financial statements present fairly, in all material respects, the financial position of the Fund as of October 31, 2020, the results of its operations for the year then ended, the changes in its net assets for each of the two years in the period ended October 31, 2020 and the financial highlights for each of the five years in the period ended October 31, 2020 in conformity with accounting principles generally accepted in the United States of America.
Basis for Opinion
These financial statements are the responsibility of the Fund’s management. Our responsibility is to express an opinion on the Fund’s financial statements based on our audits. We are a public accounting firm registered with the Public Company Accounting Oversight Board (United States) (PCAOB) and are required to be independent with respect to the Fund in accordance with the U.S. federal securities laws and the applicable rules and regulations of the Securities and Exchange Commission and the PCAOB.
We conducted our audits of these financial statements in accordance with the standards of the PCAOB. Those standards require that we plan and perform the audit to obtain reasonable assurance about whether the financial statements are free of material misstatement, whether due to error or fraud.
Our audits included performing procedures to assess the risks of material misstatement of the financial statements, whether due to error or fraud, and performing procedures that respond to those risks. Such procedures included examining, on a test basis, evidence regarding the amounts and disclosures in the financial statements. Our audits also included evaluating the accounting principles used and significant estimates made by management, as well as evaluating the overall presentation of the financial statements. Our procedures included confirmation of securities owned as of October 31, 2020 by correspondence with the custodian and brokers; when replies were not received from brokers, we performed other auditing procedures. We believe that our audits provide a reasonable basis for our opinion.
/s/ PricewaterhouseCoopers LLP
Boston, Massachusetts
December 14, 2020
We have served as the auditor of one or more investment companies in the Fidelity group of funds since 1932.
Trustees and Officers
The Trustees, Members of the Advisory Board (if any), and officers of the trust and funds, as applicable, are listed below. The Board of Trustees governs each fund and is responsible for protecting the interests of shareholders. The Trustees are experienced executives who meet periodically throughout the year to oversee each fund's activities, review contractual arrangements with companies that provide services to each fund, oversee management of the risks associated with such activities and contractual arrangements, and review each fund's performance. Except for Jonathan Chiel, each of the Trustees oversees 305 funds. Mr. Chiel oversees 176 funds.
The Trustees hold office without limit in time except that (a) any Trustee may resign; (b) any Trustee may be removed by written instrument, signed by at least two-thirds of the number of Trustees prior to such removal; (c) any Trustee who requests to be retired or who has become incapacitated by illness or injury may be retired by written instrument signed by a majority of the other Trustees; and (d) any Trustee may be removed at any special meeting of shareholders by a two-thirds vote of the outstanding voting securities of the trust. Each Trustee who is not an interested person (as defined in the 1940 Act) of the trust and the funds is referred to herein as an Independent Trustee. Each Independent Trustee shall retire not later than the last day of the calendar year in which his or her 75th birthday occurs. The Independent Trustees may waive this mandatory retirement age policy with respect to individual Trustees. Officers and Advisory Board Members hold office without limit in time, except that any officer or Advisory Board Member may resign or may be removed by a vote of a majority of the Trustees at any regular meeting or any special meeting of the Trustees. Except as indicated, each individual has held the office shown or other offices in the same company for the past five years.
Each fund's Statement of Additional Information (SAI) includes more information about the Trustees. To request a free copy, call Fidelity at 1-800-544-8544 if you’re an individual investing directly with Fidelity, call 1-800-835-5092 if you’re a plan sponsor or participant with Fidelity as your recordkeeper or call 1-877-208-0098 on institutional accounts or if you’re an advisor or invest through one.
Experience, Skills, Attributes, and Qualifications of the Trustees. The Governance and Nominating Committee has adopted a statement of policy that describes the experience, qualifications, attributes, and skills that are necessary and desirable for potential Independent Trustee candidates (Statement of Policy). The Board believes that each Trustee satisfied at the time he or she was initially elected or appointed a Trustee, and continues to satisfy, the standards contemplated by the Statement of Policy. The Governance and Nominating Committee also engages professional search firms to help identify potential Independent Trustee candidates who have the experience, qualifications, attributes, and skills consistent with the Statement of Policy. From time to time, additional criteria based on the composition and skills of the current Independent Trustees, as well as experience or skills that may be appropriate in light of future changes to board composition, business conditions, and regulatory or other developments, have also been considered by the professional search firms and the Governance and Nominating Committee. In addition, the Board takes into account the Trustees' commitment and participation in Board and committee meetings, as well as their leadership of standing and ad hoc committees throughout their tenure.
In determining that a particular Trustee was and continues to be qualified to serve as a Trustee, the Board has considered a variety of criteria, none of which, in isolation, was controlling. The Board believes that, collectively, the Trustees have balanced and diverse experience, qualifications, attributes, and skills, which allow the Board to operate effectively in governing each fund and protecting the interests of shareholders. Information about the specific experience, skills, attributes, and qualifications of each Trustee, which in each case led to the Board's conclusion that the Trustee should serve (or continue to serve) as a trustee of the funds, is provided below.
Board Structure and Oversight Function. Robert A. Lawrence is an interested person and currently serves as Acting Chairman. The Trustees have determined that an interested Chairman is appropriate and benefits shareholders because an interested Chairman has a personal and professional stake in the quality and continuity of services provided to the funds. Independent Trustees exercise their informed business judgment to appoint an individual of their choosing to serve as Chairman, regardless of whether the Trustee happens to be independent or a member of management. The Independent Trustees have determined that they can act independently and effectively without having an Independent Trustee serve as Chairman and that a key structural component for assuring that they are in a position to do so is for the Independent Trustees to constitute a substantial majority for the Board. The Independent Trustees also regularly meet in executive session. Ned C. Lautenbach and David M. Thomas serve as Co-Lead Independent Trustees and as such each (i) acts as a liaison between the Independent Trustees and management with respect to matters important to the Independent Trustees and (ii) with management prepares agendas for Board meetings.
Fidelity® funds are overseen by different Boards of Trustees. The funds' Board oversees Fidelity's high income and certain equity funds, and other Boards oversee Fidelity's investment-grade bond, money market, asset allocation, and other equity funds. The asset allocation funds may invest in Fidelity® funds overseen by the funds' Board. The use of separate Boards, each with its own committee structure, allows the Trustees of each group of Fidelity® funds to focus on the unique issues of the funds they oversee, including common research, investment, and operational issues. On occasion, the separate Boards establish joint committees to address issues of overlapping consequences for the Fidelity® funds overseen by each Board.
The Trustees operate using a system of committees to facilitate the timely and efficient consideration of all matters of importance to the Trustees, each fund, and fund shareholders and to facilitate compliance with legal and regulatory requirements and oversight of the funds' activities and associated risks. The Board, acting through its committees, has charged FMR and its affiliates with (i) identifying events or circumstances the occurrence of which could have demonstrably adverse effects on the funds' business and/or reputation; (ii) implementing processes and controls to lessen the possibility that such events or circumstances occur or to mitigate the effects of such events or circumstances if they do occur; and (iii) creating and maintaining a system designed to evaluate continuously business and market conditions in order to facilitate the identification and implementation processes described in (i) and (ii) above. Because the day-to-day operations and activities of the funds are carried out by or through FMR, its affiliates, and other service providers, the funds' exposure to risks is mitigated but not eliminated by the processes overseen by the Trustees. While each of the Board's committees has responsibility for overseeing different aspects of the funds' activities, oversight is exercised primarily through the Operations, Audit, and Compliance Committees. Appropriate personnel, including but not limited to the funds' Chief Compliance Officer (CCO), FMR's internal auditor, the independent accountants, the funds' Treasurer and portfolio management personnel, make periodic reports to the Board's committees, as appropriate, including an annual review of Fidelity's risk management program for the Fidelity® funds. The responsibilities of each standing committee, including their oversight responsibilities, are described further under "Standing Committees of the Trustees."
Interested Trustees*:
Correspondence intended for a Trustee who is an interested person may be sent to Fidelity Investments, 245 Summer Street, Boston, Massachusetts 02210.
Name, Year of Birth; Principal Occupations and Other Relevant Experience+
Jonathan Chiel (1957)
Year of Election or Appointment: 2016
Trustee
Mr. Chiel also serves as Trustee of other Fidelity® funds. Mr. Chiel is Executive Vice President and General Counsel for FMR LLC (diversified financial services company, 2012-present). Previously, Mr. Chiel served as general counsel (2004-2012) and senior vice president and deputy general counsel (2000-2004) for John Hancock Financial Services; a partner with Choate, Hall & Stewart (1996-2000) (law firm); and an Assistant United States Attorney for the United States Attorney’s Office of the District of Massachusetts (1986-95), including Chief of the Criminal Division (1993-1995). Mr. Chiel is a director on the boards of the Boston Bar Foundation and the Maimonides School.
Robert A. Lawrence (1952)
Year of Election or Appointment: 2020
Trustee
Acting Chairman of the Board of Trustees
Mr. Lawrence also serves as Trustee of other funds. Previously, Mr. Lawrence served as a Member of the Advisory Board of certain funds. Prior to his retirement in 2008, Mr. Lawrence served as Vice President of certain Fidelity® funds (2006-2008), Senior Vice President, Head of High Income Division of Fidelity Management & Research Company (investment adviser firm, 2006-2008), and President of Fidelity Strategic Investments (investment adviser firm, 2002-2005).
* Determined to be an “Interested Trustee” by virtue of, among other things, his or her affiliation with the trust or various entities under common control with FMR.
+ The information includes the Trustee's principal occupation during the last five years and other information relating to the experience, attributes, and skills relevant to the Trustee's qualifications to serve as a Trustee, which led to the conclusion that the Trustee should serve as a Trustee for each fund.
Independent Trustees:
Correspondence intended for an Independent Trustee may be sent to Fidelity Investments, P.O. Box 55235, Boston, Massachusetts 02205-5235.
Name, Year of Birth; Principal Occupations and Other Relevant Experience+
Dennis J. Dirks (1948)
Year of Election or Appointment: 2005
Trustee
Mr. Dirks also serves as Trustee of other Fidelity® funds. Prior to his retirement in May 2003, Mr. Dirks served as Chief Operating Officer and as a member of the Board of The Depository Trust & Clearing Corporation (financial markets infrastructure), President, Chief Operating Officer and a member of the Board of The Depository Trust Company (DTC), President and a member of the Board of the National Securities Clearing Corporation (NSCC), Chief Executive Officer and a member of the Board of the Government Securities Clearing Corporation and Chief Executive Officer and a member of the Board of the Mortgage-Backed Securities Clearing Corporation. Mr. Dirks currently serves as a member of the Finance Committee (2016-present) and Board (2017-present) and is Treasurer (2018-present) of the Asolo Repertory Theatre.
Donald F. Donahue (1950)
Year of Election or Appointment: 2018
Trustee
Mr. Donahue also serves as Trustee of other Fidelity® funds. Mr. Donahue serves as President and Chief Executive Officer of Miranda Partners, LLC (risk consulting for the financial services industry, 2012-present). Previously, Mr. Donahue served as Chief Executive Officer (2006-2012), Chief Operating Officer (2003-2006) and Managing Director, Customer Marketing and Development (1999-2003) of The Depository Trust & Clearing Corporation (financial markets infrastructure). Mr. Donahue currently serves as a member (2007-present) and Co-Chairman (2016-present) of the Board of United Way of New York, a member of the Board of NYC Leadership Academy (2012-present) and a member of the Board of Advisors of Ripple Labs, Inc. (financial services, 2015-present). Mr. Donahue previously served as a member of the Advisory Board of certain Fidelity® funds (2015-2018).
Vicki L. Fuller (1957)
Year of Election or Appointment: 2020
Trustee
Ms. Fuller also serves as Trustee of other Fidelity® funds. Previously, Ms. Fuller served as a member of the Advisory Board of certain Fidelity® funds (2018-2020), Chief Investment Officer of the New York State Common Retirement Fund (2012-2018) and held a variety of positions at AllianceBernstein L.P. (global asset management, 1985-2012), including Managing Director (2006-2012) and Senior Vice President and Senior Portfolio Manager (2001-2006). Ms. Fuller currently serves as a member of the Board, Audit Committee and Nominating and Governance Committee of The Williams Companies, Inc. (natural gas infrastructure, 2018-present), as a member of the Board, Audit Committee and Nominating and Governance Committee of two Blackstone business development companies (2020-present) and as a member of the Board of Treliant, LLC (consulting, 2019-present).
Patricia L. Kampling (1959)
Year of Election or Appointment: 2020
Trustee
Ms. Kampling also serves as Trustee of other Fidelity® funds. Prior to her retirement, Ms. Kampling served as Chairman of the Board and Chief Executive Officer (2012-2019), President and Chief Operating Officer (2011-2012) and Executive Vice President and Chief Financial Officer (2010-2011) of Alliant Energy Corporation. Ms. Kampling currently serves as a member of the Board, Compensation Committee and Executive Committee and as Chair of the Audit Committee of Briggs & Stratton Corporation (manufacturing, 2011-present) and as a member of the Board, Audit, Finance and Risk Committee and Safety, Environmental, Technology and Operations Committee of American Water Works Company, Inc. (utilities company, 2019-present). In addition, Ms. Kampling currently serves as a member of the Board of the Nature Conservancy, Wisconsin Chapter (2019-present). Previously, Ms. Kampling served as a Member of the Advisory Board of certain Fidelity® funds (2020), a member of the Board of Interstate Power and Light Company (2012-2019) and Wisconsin Power and Light Company (2012-2019) (each a subsidiary of Alliant Energy Corporation) and as a member of the Board and Workforce Development Committee of the Business Roundtable (2018-2019).
Alan J. Lacy (1953)
Year of Election or Appointment: 2008
Trustee
Mr. Lacy also serves as Trustee of other Fidelity® funds. Previously, Mr. Lacy served as Senior Adviser (2007-2014) of Oak Hill Capital Partners, L.P. (private equity), Chief Executive Officer (2005) and Vice Chairman (2005-2006) of Sears Holdings Corporation (retail), Chief Executive Officer and Chairman of the Board of Sears, Roebuck and Co. (retail, 2000-2005), Chairman (2014-2017) and a member of the Board (2010-2017) of Dave & Buster’s Entertainment, Inc. (restaurant and entertainment complexes) and a member of the Board of Bristol-Myers Squibb Company (global pharmaceuticals, 2008-2020). Mr. Lacy currently serves as a Trustee of the California Chapter of The Nature Conservancy (2015-present) and a member of the Board of the Center for Advanced Study in the Behavioral Sciences at Stanford University (2015-present).
Ned C. Lautenbach (1944)
Year of Election or Appointment: 2000
Trustee
Co-Lead Independent Trustee
Mr. Lautenbach also serves as Trustee of other Fidelity® funds. Mr. Lautenbach currently serves as Chair of the Board of Governors, State University System of Florida (2013-present) and is a member of the Council on Foreign Relations (1994-present). He is also a member and has in the past served as Chairman of the Board of Directors of Artis-Naples (2012-present). Previously, Mr. Lautenbach served as a member and then Lead Director of the Board of Directors of Eaton Corporation (diversified industrial, 1997-2016). He was also a Partner at Clayton, Dubilier & Rice, LLC (private equity investment, 1998-2010); as well as Director of Sony Corporation (2006-2007). In addition, Mr. Lautenbach had a 30-year career with IBM (technology company), during which time he served as Senior Vice President and as a member of the Corporate Executive Committee (1968-1998).
Joseph Mauriello (1944)
Year of Election or Appointment: 2008
Trustee
Mr. Mauriello also serves as Trustee of other Fidelity® funds. Prior to his retirement in January 2006, Mr. Mauriello served in numerous senior management positions including Deputy Chairman and Chief Operating Officer (2004-2005), and Vice Chairman of Financial Services (2002-2004) of KPMG LLP US (professional services, 1965-2005). Mr. Mauriello currently serves as a member of the Independent Directors Council Governing Council (2015-present). Previously, Mr. Mauriello served as a member of the Board of XL Group plc. (global insurance and re-insurance, 2006-2018).
Cornelia M. Small (1944)
Year of Election or Appointment: 2005
Trustee
Ms. Small also serves as Trustee of other Fidelity® funds. Previously, Ms. Small served as Chief Investment Officer, Director of Global Equity Investments and a member of Scudder, Stevens & Clark and Scudder Kemper Investments. Ms. Small previously served as a member of the Board (2009-2019) and Chair of the Investment Committee (2010-2019) of the Teagle Foundation and a member of the Investment Committee of the Berkshire Taconic Community Foundation (2008-2019).
Garnett A. Smith (1947)
Year of Election or Appointment: 2018
Trustee
Mr. Smith also serves as Trustee of other Fidelity® funds. Prior to his retirement, Mr. Smith served as Chairman and Chief Executive Officer (1990-1997) and President (1986-1990) of Inbrand Corp. (manufacturer of personal absorbent products). Prior to his employment with Inbrand Corp., he was employed by a retail fabric chain and North Carolina National Bank (now Bank of America). Mr. Smith previously served as a member of the Advisory Board of certain Fidelity® funds (2012-2013).
David M. Thomas (1949)
Year of Election or Appointment: 2008
Trustee
Co-Lead Independent Trustee
Mr. Thomas also serves as Trustee of other Fidelity® funds. Previously, Mr. Thomas served as Executive Chairman (2005-2006) and Chairman and Chief Executive Officer (2000-2005) of IMS Health, Inc. (pharmaceutical and healthcare information solutions). Mr. Thomas currently serves as Non-Executive Chairman of the Board of Fortune Brands Home and Security (home and security products, 2011-present), and a member of the Board (2004-present) and Presiding Director (2013-present) of Interpublic Group of Companies, Inc. (marketing communication).
Susan Tomasky (1953)
Year of Election or Appointment: 2020
Trustee
Ms. Tomasky also serves as Trustee of other Fidelity® funds. Prior to her retirement, Ms. Tomasky served in various executive officer positions at American Electric Power Company, Inc. (1998-2011), including most recently as President of AEP Transmission (2007-2011). Ms. Tomasky currently serves as a member of the Board and Sustainability Committee and as Chair of the Audit Committee of Marathon Petroleum Corporation (2018-present) and as a member of the Board, Corporate Governance Committee and Organization and Compensation Committee and as Chair of the Audit Committee of Public Service Enterprise Group, Inc. (utilities company, 2012-present). In addition, Ms. Tomasky currently serves as a member of the Board of the Columbus Regional Airport Authority (2007-present), as a member of the Board of the Royal Shakespeare Company – America (2009-present), as a member of the Board of the Columbus Association for the Performing Arts (2011-present) and as a member of the Board of Kenyon College (2016-present). Previously, Ms. Tomasky served as a Member of the Advisory Board of certain Fidelity® funds (2020), a member of the Board (2011-2019) and as Lead Independent Director (2015-2018) of Andeavor Corporation (previously Tesoro Corporation) (independent oil refiner and marketer) and as a member of the Board of Summit Midstream Partners LP (energy, 2012-2018).
Michael E. Wiley (1950)
Year of Election or Appointment: 2020
Trustee
Mr. Wiley also serves as Trustee of other Fidelity® funds. Previously, Mr. Wiley served as a member of the Advisory Board of certain Fidelity® funds (2018-2020), Chairman, President and CEO of Baker Hughes, Inc. (oilfield services, 2000-2004). Mr. Wiley also previously served as a member of the Board of Andeavor Corporation (independent oil refiner and marketer, 2005-2018), a member of the Board of Andeavor Logistics LP (natural resources logistics, 2015-2018) and a member of the Board of High Point Resources (exploration and production, 2005-2020).
+ The information includes the Trustee's principal occupation during the last five years and other information relating to the experience, attributes, and skills relevant to the Trustee's qualifications to serve as a Trustee, which led to the conclusion that the Trustee should serve as a Trustee for each fund.
Advisory Board Members and Officers:
Correspondence intended for a Member of the Advisory Board (if any) may be sent to Fidelity Investments, P.O. Box 55235, Boston, Massachusetts 02205-5235. Correspondence intended for an officer or Peter S. Lynch may be sent to Fidelity Investments, 245 Summer Street, Boston, Massachusetts 02210. Officers appear below in alphabetical order.
Name, Year of Birth; Principal Occupation
Lloyd James Austin, III (1953)
Year of Election or Appointment: 2020
Member of the Advisory Board
General Austin also serves as a Member of the Advisory Board of other Fidelity® funds. Prior to his retirement, General Austin (United States Army, Retired) held a variety of positions within the U.S. Government, including Commander, U.S. Central Command (2013-2016), Vice Chief of Staff, U.S. Army (2012-2013) and Commanding General, U.S. Forces – Iraq, Operation New Dawn (2010-2012). General Austin currently serves as a Partner of Pine Island Capital Partners (private equity, 2020-present) and as President of the Austin Strategy Group LLC (consulting, 2016-present). General Austin serves as a member of the Board of Directors of Nucor Corporation (steel products, 2017-present), as a member of the Board of Directors of Tenet Healthcare Corporation (2018-present) and as a member of the Board of Directors of Raytheon Technologies Corporation (aerospace and defense, 2020-present). In addition, General Austin currently serves as a member of the Board of Trustees of the Carnegie Corporation of New York (2017-present) and as a member of the Board of Trustees of Auburn University (2017-present). Previously, General Austin served as a member of the Board of Directors of United Technologies Corporation (aerospace, defense and building, 2016-2020).
Thomas A. Kennedy (1955)
Year of Election or Appointment: 2020
Member of the Advisory Board
Mr. Kennedy also serves as a Member of the Advisory Board of other Fidelity® funds. Previously, Mr. Kennedy held a variety of positions at Raytheon Company (aerospace and defense, 1983-2020), including Chairman and Chief Executive Officer (2014-2020) and Executive Vice President and Chief Operating Officer (2013-2014). Mr. Kennedy currently serves as Executive Chairman of the Board of Directors of Raytheon Technologies Corporation (aerospace and defense, 2020-present). He is also a member of the Rutgers School of Engineering Industry Advisory Board (2011-present) and a member of the UCLA Engineering Dean’s Executive Board (2016-present).
Peter S. Lynch (1944)
Year of Election or Appointment: 2003
Member of the Advisory Board
Mr. Lynch also serves as a Member of the Advisory Board of other Fidelity® funds. Mr. Lynch is Vice Chairman and a Director of Fidelity Management & Research Company LLC (investment adviser firm). In addition, Mr. Lynch serves as a Trustee of Boston College and as the Chairman of the Inner-City Scholarship Fund. Previously, Mr. Lynch served as Vice Chairman and a Director of FMR Co., Inc. (investment adviser firm) and on the Special Olympics International Board of Directors (1997-2006).
Elizabeth Paige Baumann (1968)
Year of Election or Appointment: 2017
Anti-Money Laundering (AML) Officer
Ms. Baumann also serves as AML Officer of other funds. She is Chief AML Officer (2012-present) and Senior Vice President (2014-present) of FMR LLC (diversified financial services company) and is an employee of Fidelity Investments. Previously, Ms. Baumann served as AML Officer of certain funds (2017-2019), as AML Officer of the funds (2012-2016), and Vice President (2007-2014) and Deputy Anti-Money Laundering Officer (2007-2012) of FMR LLC.
Craig S. Brown (1977)
Year of Election or Appointment: 2019
Assistant Treasurer
Mr. Brown also serves as Assistant Treasurer of other funds. Mr. Brown is an employee of Fidelity Investments (2013-present).
John J. Burke III (1964)
Year of Election or Appointment: 2018
Chief Financial Officer
Mr. Burke also serves as Chief Financial Officer of other funds. Mr. Burke serves as Head of Investment Operations for Fidelity Fund and Investment Operations (2018-present) and is an employee of Fidelity Investments (1998-present). Previously Mr. Burke served as head of Asset Management Investment Operations (2012-2018).
William C. Coffey (1969)
Year of Election or Appointment: 2019
Assistant Secretary
Mr. Coffey also serves as Assistant Secretary of other funds. He is Senior Vice President and Deputy General Counsel of FMR LLC (diversified financial services company, 2010-present), and is an employee of Fidelity Investments. Previously, Mr. Coffey served as Secretary and CLO of certain funds (2018-2019); CLO, Secretary, and Senior Vice President of Fidelity Management & Research Company and FMR Co., Inc. (investment adviser firms, 2018-2019); Secretary of Fidelity SelectCo, LLC and Fidelity Investments Money Management, Inc. (investment adviser firms, 2018-2019); CLO of Fidelity Management & Research (Hong Kong) Limited, FMR Investment Management (UK) Limited, and Fidelity Management & Research (Japan) Limited (investment adviser firms, 2018-2019); and Assistant Secretary of certain funds (2009-2018).
Timothy M. Cohen (1969)
Year of Election or Appointment: 2018
Vice President
Mr. Cohen also serves as Vice President of other funds. Mr. Cohen serves as Co-Head of Equity (2018-present), a Director of Fidelity Management & Research (Japan) Limited (investment adviser firm, 2016-present), and is an employee of Fidelity Investments. Previously, Mr. Cohen served as Executive Vice President of Fidelity SelectCo, LLC (2019), Head of Global Equity Research (2016-2018), Chief Investment Officer - Equity and a Director of Fidelity Management & Research (U.K.) Inc. (investment adviser firm, 2013-2015) and as a Director of Fidelity Management & Research (Hong Kong) Limited (investment adviser firm, 2017).
Jonathan Davis (1968)
Year of Election or Appointment: 2010
Assistant Treasurer
Mr. Davis also serves as Assistant Treasurer of other funds. Mr. Davis serves as Assistant Treasurer of FMR Capital, Inc. (2017-present) and is an employee of Fidelity Investments. Previously, Mr. Davis served as Vice President and Associate General Counsel of FMR LLC (diversified financial services company, 2003-2010).
Laura M. Del Prato (1964)
Year of Election or Appointment: 2018
Assistant Treasurer
Ms. Del Prato also serves as an officer of other funds. Ms. Del Prato is an employee of Fidelity Investments (2017-present). Previously, Ms. Del Prato served as President and Treasurer of The North Carolina Capital Management Trust: Cash Portfolio and Term Portfolio (2018-2020). Prior to joining Fidelity Investments, Ms. Del Prato served as a Managing Director and Treasurer of the JPMorgan Mutual Funds (2014-2017). Prior to JPMorgan, Ms. Del Prato served as a partner at Cohen Fund Audit Services (accounting firm, 2012-2013) and KPMG LLP (accounting firm, 2004-2012).
Colm A. Hogan (1973)
Year of Election or Appointment: 2020
Assistant Treasurer
Mr. Hogan also serves as an officer of other funds. Mr. Hogan serves as Assistant Treasurer of FMR Capital, Inc. (2017-present) and is an employee of Fidelity Investments (2005-present). Previously, Mr. Hogan served as Deputy Treasurer of certain Fidelity® funds (2016-2020) and Assistant Treasurer of certain Fidelity® funds (2016-2018).
Pamela R. Holding (1964)
Year of Election or Appointment: 2018
Vice President
Ms. Holding also serves as Vice President of other funds. Ms. Holding serves as Co-Head of Equity (2018-present) and is an employee of Fidelity Investments (2013-present). Previously, Ms. Holding served as Executive Vice President of Fidelity SelectCo, LLC (2019) and as Chief Investment Officer of Fidelity Institutional Asset Management (2013-2018).
Cynthia Lo Bessette (1969)
Year of Election or Appointment: 2019
Secretary and Chief Legal Officer (CLO)
Ms. Lo Bessette also serves as an officer of other funds. Ms. Lo Bessette serves as CLO, Secretary, and Senior Vice President of Fidelity Management & Research Company LLC (investment adviser firm, 2019-present); and CLO of Fidelity Management & Research (Hong Kong) Limited, FMR Investment Management (UK) Limited, and Fidelity Management & Research (Japan) Limited (investment adviser firms, 2019-present). She is a Senior Vice President and Deputy General Counsel of FMR LLC (diversified financial services company, 2019-present), and is an employee of Fidelity Investments. Previously, Ms. Lo Bessette served as CLO, Secretary, and Senior Vice President of FMR Co., Inc. (investment adviser firm, 2019); Secretary of Fidelity SelectCo, LLC and Fidelity Investments Money Management, Inc. (investment adviser firms, 2019). Prior to joining Fidelity Investments, Ms. Lo Bessette was Executive Vice President, General Counsel (2016-2019) and Senior Vice President, Deputy General Counsel (2015-2016) of OppenheimerFunds (investment management company) and Deputy Chief Legal Officer (2013-2015) of Jennison Associates LLC (investment adviser firm).
Chris Maher (1972)
Year of Election or Appointment: 2020
Deputy Treasurer
Mr. Maher also serves as an officer of other funds. Mr. Maher serves as Assistant Treasurer of FMR Capital, Inc. (2017-present), and is an employee of Fidelity Investments (2008-present). Previously, Mr. Maher served as Assistant Treasurer of certain funds (2013-2020); Vice President of Asset Management Compliance (2013), Vice President of the Program Management Group of FMR (investment adviser firm, 2010-2013), and Vice President of Valuation Oversight (2008-2010).
Jason P. Pogorelec (1975)
Year of Election or Appointment: 2020
Chief Compliance Officer
Mr. Pogorelec also serves as Chief Compliance Officer of other funds. Mr. Pogorelec is a senior Vice President of Asset Management Compliance for Fidelity Investments and is an employee of Fidelity Investments (2006-present). Previously, Mr. Pogorelec served as Vice President, Associate General Counsel for Fidelity Investments (2010-2020) and Assistant Secretary of certain Fidelity funds (2015-2020).
Stacie M. Smith (1974)
Year of Election or Appointment: 2016
President and Treasurer
Ms. Smith also serves as an officer of other funds. Ms. Smith serves as Assistant Treasurer of FMR Capital, Inc. (2017-present), is an employee of Fidelity Investments (2009-present), and has served in other fund officer roles. Prior to joining Fidelity Investments, Ms. Smith served as Senior Audit Manager of Ernst & Young LLP (accounting firm, 1996-2009). Previously, Ms. Smith served as Assistant Treasurer (2013-2019) and Deputy Treasurer (2013-2016) of certain Fidelity® funds.
Marc L. Spector (1972)
Year of Election or Appointment: 2016
Assistant Treasurer
Mr. Spector also serves as an officer of other funds. Mr. Spector serves as Assistant Treasurer of FMR Capital, Inc. (2017-present) and is an employee of Fidelity Investments (2016-present). Prior to joining Fidelity Investments, Mr. Spector served as Director at the Siegfried Group (accounting firm, 2013-2016), and prior to Siegfried Group as audit senior manager at Deloitte & Touche LLP (accounting firm, 2005-2013).
Jim Wegmann (1979)
Year of Election or Appointment: 2019
Assistant Treasurer
Mr. Wegmann also serves as Assistant Treasurer of other funds. Mr. Wegmann is an employee of Fidelity Investments (2011-present).
Shareholder Expense Example
As a shareholder, you incur two types of costs: (1) transaction costs, which may include sales charges (loads) on purchase payments or redemption proceeds, as applicable and (2) ongoing costs, which generally include management fees, distribution and/or service (12b-1) fees and other Fund expenses. This Example is intended to help you understand your ongoing costs (in dollars) of investing in a fund and to compare these costs with the ongoing costs of investing in other mutual funds.
The Example is based on an investment of $1,000 invested at the beginning of the period and held for the entire period (May 1, 2020 to October 31, 2020).
Actual Expenses
The first line of the accompanying table provides information about actual account values and actual expenses. You may use the information in this line, together with the amount you invested, to estimate the expenses that you paid over the period. Simply divide your account value by $1,000.00 (for example, an $8,600 account value divided by $1,000.00 = 8.6), then multiply the result by the number in the first line for a class/Fund under the heading entitled "Expenses Paid During Period" to estimate the expenses you paid on your account during this period. If any fund is a shareholder of any underlying mutual funds or exchange-traded funds (ETFs) (the Underlying Funds), such fund indirectly bears its proportional share of the expenses of the Underlying Funds in addition to the direct expenses incurred presented in the table. These fees and expenses are not included in the annualized expense ratio used to calculate the expense estimate in the table below.
Hypothetical Example for Comparison Purposes
The second line of the accompanying table provides information about hypothetical account values and hypothetical expenses based on the actual expense ratio and an assumed rate of return of 5% per year before expenses, which is not the actual return. The hypothetical account values and expenses may not be used to estimate the actual ending account balance or expenses you paid for the period. You may use this information to compare the ongoing costs of investing in the Fund and other funds. To do so, compare this 5% hypothetical example with the 5% hypothetical examples that appear in the shareholder reports of the other funds. If any fund is a shareholder of any Underlying Funds, such fund indirectly bears its proportional share of the expenses of the Underlying Funds in addition to the direct expenses as presented in the table. These fees and expenses are not included in the annualized expense ratio used to calculate the expense estimate in the table below.
Please note that the expenses shown in the table are meant to highlight your ongoing costs only and do not reflect any transaction costs. Therefore, the second line of the table is useful in comparing ongoing costs only, and will not help you determine the relative total costs of owning different funds. In addition, if these transactional costs were included, your costs would have been higher.
| | Annualized Expense Ratio-A | Beginning
Account Value
May 1, 2020 | Ending
Account Value
October 31, 2020 | Expenses Paid
During Period-B
May 1, 2020
to October 31, 2020 |
| Fidelity Diversified International Fund | | | | |
| Diversified International | 1.06% | | | |
| Actual | | $1,000.00 | $1,172.10 | $5.79 |
| Hypothetical-C | | $1,000.00 | $1,019.81 | $5.38 |
| Class K | .95% | | | |
| Actual | | $1,000.00 | $1,173.00 | $5.19 |
| Hypothetical-C | | $1,000.00 | $1,020.36 | $4.82 |
| Fidelity International Capital Appreciation Fund | 1.02% | | | |
| Actual | | $1,000.00 | $1,206.20 | $5.66 |
| Hypothetical-C | | $1,000.00 | $1,020.01 | $5.18 |
| Fidelity Overseas Fund | | | | |
| Overseas | 1.04% | | | |
| Actual | | $1,000.00 | $1,136.10 | $5.58 |
| Hypothetical-C | | $1,000.00 | $1,019.91 | $5.28 |
| Class K | .94% | | | |
| Actual | | $1,000.00 | $1,136.90 | $5.05 |
| Hypothetical-C | | $1,000.00 | $1,020.41 | $4.77 |
| Fidelity Worldwide Fund | | | | |
| Class A | 1.33% | | | |
| Actual | | $1,000.00 | $1,213.50 | $7.40 |
| Hypothetical-C | | $1,000.00 | $1,018.45 | $6.75 |
| Class M | 1.61% | | | |
| Actual | | $1,000.00 | $1,211.70 | $8.95 |
| Hypothetical-C | | $1,000.00 | $1,017.04 | $8.16 |
| Class C | 2.13% | | | |
| Actual | | $1,000.00 | $1,208.50 | $11.82 |
| Hypothetical-C | | $1,000.00 | $1,014.43 | $10.79 |
| Worldwide | 1.04% | | | |
| Actual | | $1,000.00 | $1,215.10 | $5.79 |
| Hypothetical-C | | $1,000.00 | $1,019.91 | $5.28 |
| Class I | 1.05% | | | |
| Actual | | $1,000.00 | $1,215.40 | $5.85 |
| Hypothetical-C | | $1,000.00 | $1,019.86 | $5.33 |
| Class Z | .91% | | | |
| Actual | | $1,000.00 | $1,215.90 | $5.07 |
| Hypothetical-C | | $1,000.00 | $1,020.56 | $4.62 |
A Annualized expense ratio reflects expenses net of applicable fee waivers.
B Expenses are equal to the annualized expense ratio, multiplied by the average account value over the period, multiplied by 184/ 366 (to reflect the one-half year period). The fees and expenses of any Underlying Funds are not included in each annualized expense ratio.
C 5% return per year before expenses
Distributions (Unaudited)
The Board of Trustees of each fund voted to pay to shareholders of record at the opening of business on record date, the following distributions per share derived from capital gains realized from sales of portfolio securities and dividends derived from net investment income:
| | Pay Date | Record Date | Dividends | Capital Gains |
| Fidelity Diversified International Fund | | | | |
| Diversified International | 12/07/20 | 12/04/20 | $0.017 | $0.446 |
| Class K | 12/07/20 | 12/04/20 | $0.061 | $0.446 |
| Fidelity International Capital Appreciation Fund | 12/07/20 | 12/04/20 | $0.048 | $0.307 |
| Fidelity Overseas Fund | | | | |
| Overseas | 12/07/20 | 12/04/20 | $0.107 | $0.206 |
| Class K | 12/07/20 | 12/04/20 | $0.164 | $0.206 |
| Fidelity Worldwide Fund | | | | |
| Class A | 12/07/20 | 12/04/20 | $0.000 | $2.702 |
| Class M | 12/07/20 | 12/04/20 | $0.000 | $2.642 |
| Class C | 12/07/20 | 12/04/20 | $0.000 | $2.577 |
| Worldwide | 12/07/20 | 12/04/20 | $0.016 | $2.750 |
| Class I | 12/07/20 | 12/04/20 | $0.024 | $2.750 |
| Class Z | 12/07/20 | 12/04/20 | $0.047 | $2.750 |
|
The funds hereby designate as capital gain dividend the amounts noted below for the taxable year ended October 31, 2020, or, if subsequently determined to be different, the net capital gain of such year.
| Fidelity Diversified International Fund | $142,222,351 |
| Fidelity International Capital Appreciation Fund | $60,709,316 |
| Fidelity Overseas Fund | $30,736,212 |
| Fidelity Worldwide Fund | $198,477,975 |
|
A percentage of the dividends distributed during the fiscal year for the following funds qualify for the dividends–received deduction for corporate shareholders:
| | Class A | Class M | Retail Class | Class I | Class Z | Class K |
| Fidelity Diversified International Fund | | | | | | |
| December, 2019 | – | – | 4% | – | – | 4% |
| Fidelity International Capital Appreciation Fund | | | | | | |
| December, 2019 | – | – | 12% | – | – | – |
| Fidelity Overseas Fund | | | | | | |
| December, 2019 | – | – | 3% | – | – | 3% |
| Fidelity Worldwide Fund | | | | | | |
| December, 2019 | 100% | 100% | 70% | 68% | 55% | – |
|
A percentage of the dividends distributed during the fiscal year for the following funds may be taken into account as a dividend for purposes of the maximum rate under section 1(h)(11) of the Internal Revenue Code.
| | Class A | Class M | Retail Class | Class I | Class Z | Class K |
| Fidelity Diversified International Fund | | | | | | |
| December, 2019 | – | – | 100% | – | – | 100% |
| Fidelity International Capital Appreciation Fund | | | | | | |
| December, 2019 | – | – | 100% | – | – | – |
| Fidelity Overseas Fund | | | | | | |
| December, 2019 | – | – | 100% | – | – | 100% |
| Fidelity Worldwide Fund | | | | | | |
| December, 2019 | 100% | 100% | 100% | 100% | 100% | – |
|
The amounts per share which represent income derived from sources within, and taxes paid to, foreign countries or possessions of the United States are as follows:
| | Pay Date | Income | Taxes |
| Fidelity Diversified International Fund | | | |
| Diversified International | 12/09/19 | $0.5881 | $0.0551 |
| Class K | 12/09/19 | $0.6281 | $0.0551 |
| Fidelity International Capital Appreciation Fund | 12/09/19 | $0.1537 | $0.0197 |
| Fidelity Overseas Fund | | | |
| Overseas | 12/09/19 | $0.7710 | $0.0740 |
| Class K | 12/09/19 | $0.8190 | $0.0740 |
|
The funds will notify shareholders in January 2021 of amounts for use in preparing 2020 income tax returns.
Proxy Voting Results
A special meeting of shareholders was held on June 9, 2020. The results of votes taken among shareholders on the proposals before them are reported below. Each vote reported represents one dollar of net asset value held on the record date for the meeting.
PROPOSAL 1
To elect a Board of Trustees.
| | # of
Votes | % of
Votes |
| Dennis J. Dirks |
| Affirmative | 91,643,443,973.030 | 98.167 |
| Withheld | 1,711,119,384.419 | 1.833 |
| TOTAL | 93,354,563,357.449 | 100.000 |
| Donald F. Donahue |
| Affirmative | 91,659,003,496.045 | 98.184 |
| Withheld | 1,695,559,852.789 | 1.816 |
| TOTAL | 93,354,563,357.449 | 100.000 |
| Bettina Doulton |
| Affirmative | 91,774,146,516.145 | 98.307 |
| Withheld | 1,580,416,862.377 | 1.693 |
| TOTAL | 93,354,563,357.449 | 100.000 |
| Vicki L. Fuller |
| Affirmative | 91,845,419,368.993 | 98.383 |
| Withheld | 1,509,143,998.591 | 1.617 |
| TOTAL | 93,354,563,357.449 | 100.00 |
| Patricia L. Kampling |
| Affirmative | 91,723,732,274.457 | 98.253 |
| Withheld | 1,630,831,098.411 | 1.747 |
| TOTAL | 93,354,563,357.449 | 100.000 |
| Alan J. Lacy |
| Affirmative | 91,490,319,407.772 | 98.003 |
| Withheld | 1,864,243,948.299 | 1.997 |
| TOTAL | 93,354,563,357.449 | 100.000 |
| Ned C. Lautenbach |
| Affirmative | 91,285,367,239.075 | 97.784 |
| Withheld | 2,069,196,119.052 | 2.216 |
| TOTAL | 93,354,563,357.449 | 100.000 |
| Robert A. Lawrence |
| Affirmative | 91,556,271,429.466 | 98.074 |
| Withheld | 1,798,291,912.707 | 1.926 |
| TOTAL | 93,354,563,357.449 | 100.000 |
| Joseph Mauriello |
| Affirmative | 91,497,480,147.082 | 98.011 |
| Withheld | 1,857,083,211.045 | 1.989 |
| TOTAL | 93,354,563,357.449 | 100.000 |
| Cornelia M. Small |
| Affirmative | 91,606,808,161.438 | 98.128 |
| Withheld | 1,747,755,220.497 | 1.872 |
| TOTAL | 93,354,563,357.449 | 100.000 |
| Garnett A. Smith |
| Affirmative | 91,505,784,053.038 | 98.020 |
| Withheld | 1,848,779,305.090 | 1.980 |
| TOTAL | 93,354,563,357.449 | 100.000 |
| David M. Thomas |
| Affirmative | 91,536,969,704.881 | 98.053 |
| Withheld | 1,817,593,630.919 | 1.947 |
| TOTAL | 93,354,563,357.449 | 100.000 |
| Susan Tomasky |
| Affirmative | 91,697,125,678.165 | 98.225 |
| Withheld | 1,657,437,703.277 | 1.775 |
| TOTAL | 93,354,563,357.449 | 100.000 |
| Michael E. Wiley |
| Affirmative | 91,506,805,575.815 | 98.021 |
| Withheld | 1,847,757,759.985 | 1.979 |
| TOTAL | 93,354,563,357.449 | 100.000 |
PROPOSAL 2
For Fidelity Diversified International Fund, to convert a fundamental investment policy to a non-fundamental investment policy.
| | # of
Votes | % of
Votes |
| Affirmative | 3,692,760,717.884 | 60.695 |
| Against | 1,746,721,226.682 | 28.709 |
| Abstain | 538,993,512.379 | 8.859 |
| Broker Non-Vote | 105,652,718.910 | 1.737 |
| TOTAL | 6,084,128,175.855 | 100.000 |
For Fidelity International Capital Appreciation Fund, to convert a fundamental investment policy to a non-fundamental investment policy.
| | # of
Votes | % of
Votes |
| Affirmative | 2,038,735,234.699 | 77.227 |
| Against | 315,855,386.439 | 11.965 |
| Abstain | 248,539,363.125 | 9.415 |
| Broker Non-Vote | 36,791,268.000 | 1.394 |
| TOTAL | 2,639,921,252.263 | 100.000 |
For Fidelity Overseas Fund, a shareholder proposal to institute procedures to avoid holding investments in companies that contribute to genocide or crimes against humanity.
| | # of
Votes | % of
Votes |
| Affirmative | 3,601,587,261.391 | 74.194 |
| Against | 854,273,571.821 | 17.598 |
| Abstain | 345,976,972.384 | 7.127 |
| Broker Non-Vote | 52,468,666.590 | 1.081 |
| TOTAL | 4,854,306,472.187 | 100.000 |
For Fidelity Worldwide Fund, to convert a fundamental investment policy to a non-fundamental investment policy.
| | # of
Votes | % of
Votes |
| Affirmative | 689,212,590.029 | 61.267 |
| Against | 169,767,529.510 | 15.091 |
| Abstain | 194,536,185.126 | 17.293 |
| Broker Non-Vote | 71,419,297.670 | 6.349 |
| TOTAL | 1,124,935,602.335 | 100.000 |
PROPOSAL 5
For Fidelity Diversified International Fund, a shareholder proposal to institute procedures to avoid holding investments in companies that contribute to genocide or crimes against humanity.
| | # of
Votes | % of
Votes |
| Affirmative | 1,727,477,289.624 | 28.393 |
| Against | 3,916,691,059.258 | 64.376 |
| Abstain | 327,431,258.482 | 5.382 |
| Broker Non-Vote | 112,528,568.490 | 1.850 |
| TOTAL | 6,084,128,175.855 | 100.000 |
PROPOSAL 6
For Fidelity Overseas Fund, a shareholder proposal to institute procedures to avoid holding investments in companies that contribute to genocide or crimes against humanity.
| | # of
Votes | % of
Votes |
| Affirmative | 1,190,659,846.577 | 24.528 |
| Against | 3,326,298,264.601 | 68.523 |
| Abstain | 272,505,275.347 | 5.614 |
| Broker Non-Vote | 64,843,085.663 | 1.336
|
| TOTAL | 4,854,306,472.187 | 100.000 |
| Proposal 1 reflects trust wide proposal and voting results. |
| Proposal 2 was not approved by shareholders for Fidelity Diversified International Fund and Fidelity Worldwide Fund. |
| Proposal 5 was not approved by shareholders for Fidelity Diversified International Fund. |
| Proposal 6 was not approved by shareholders for Fidelity Overseas Fund. |
IBD-ANN-1220
1.754543.120
Fidelity's Targeted International Equity Funds®
Fidelity® Canada Fund
Fidelity® China Region Fund
Fidelity® Emerging Asia Fund
Fidelity® Emerging Markets Fund
Fidelity® Europe Fund
Fidelity® Japan Fund
Fidelity® Japan Smaller Companies Fund
Fidelity® Latin America Fund
Fidelity® Nordic Fund
Fidelity® Pacific Basin Fund
Annual Report
October 31, 2020
Includes Fidelity and Fidelity Advisor share classes
See the inside front cover for important information about access to your fund’s shareholder reports.
Beginning on January 1, 2021, as permitted by regulations adopted by the Securities and Exchange Commission, paper copies of a fund’s shareholder reports will no longer be sent by mail, unless you specifically request paper copies of the reports from the fund or from your financial intermediary, such as a financial advisor, broker-dealer or bank. Instead, the reports will be made available on a website, and you will be notified by mail each time a report is posted and provided with a website link to access the report.
If you already elected to receive shareholder reports electronically, you will not be affected by this change and you need not take any action. You may elect to receive shareholder reports and other communications from a fund electronically, by contacting your financial intermediary. For Fidelity customers, visit Fidelity's web site or call Fidelity using the contact information listed below.
You may elect to receive all future reports in paper free of charge. If you wish to continue receiving paper copies of your shareholder reports, you may contact your financial intermediary or, if you are a Fidelity customer, visit Fidelity’s website, or call Fidelity at the applicable toll-free number listed below. Your election to receive reports in paper will apply to all funds held with the fund complex/your financial intermediary.
| Account Type | Website | Phone Number |
| Brokerage, Mutual Fund, or Annuity Contracts: | fidelity.com/mailpreferences | 1-800-343-3548 |
| Employer Provided Retirement Accounts: | netbenefits.fidelity.com/preferences (choose 'no' under Required Disclosures to continue to print) | 1-800-343-0860 |
| Advisor Sold Accounts Serviced Through Your Financial Intermediary: | Contact Your Financial Intermediary | Your Financial Intermediary's phone number |
| Advisor Sold Accounts Serviced by Fidelity: | institutional.fidelity.com | 1-877-208-0098 |
Contents
To view a fund's proxy voting guidelines and proxy voting record for the 12-month period ended June 30, visit http://www.fidelity.com/proxyvotingresults or visit the Securities and Exchange Commission's (SEC) web site at http://www.sec.gov.
You may also call 1-800-544-8544 if you’re an individual investing directly with Fidelity, call 1-800-835-5092 if you’re a plan sponsor or participant with Fidelity as your recordkeeper or call 1-877-208-0098 on institutional accounts or if you’re an advisor or invest through one to request a free copy of the proxy voting guidelines.
Standard & Poor's, S&P and S&P 500 are registered service marks of The McGraw-Hill Companies, Inc. and have been licensed for use by Fidelity Distributors Corporation.
Other third-party marks appearing herein are the property of their respective owners.
All other marks appearing herein are registered or unregistered trademarks or service marks of FMR LLC or an affiliated company. © 2020 FMR LLC. All rights reserved.
This report and the financial statements contained herein are submitted for the general information of the shareholders of the Funds. This report is not authorized for distribution to prospective investors in the Funds unless preceded or accompanied by an effective prospectus.
A fund files its complete schedule of portfolio holdings with the SEC for the first and third quarters of each fiscal year on Form N-PORT. Forms N-PORT are available on the SEC’s web site at http://www.sec.gov. A fund's Forms N-PORT may be reviewed and copied at the SEC’s Public Reference Room in Washington, DC. Information regarding the operation of the SEC's Public Reference Room may be obtained by calling 1-800-SEC-0330.
For a complete list of a fund's portfolio holdings, view the most recent holdings listing, semiannual report, or annual report on Fidelity's web site at http://www.fidelity.com, http://www.institutional.fidelity.com, or http://www.401k.com, as applicable.
NOT FDIC INSURED •MAY LOSE VALUE •NO BANK GUARANTEE
Neither the Funds nor Fidelity Distributors Corporation is a bank.
Note to Shareholders:
Early in 2020, the outbreak and spread of a new coronavirus emerged as a public health emergency that had a major influence on financial markets, primarily based on its impact on the global economy and the outlook for corporate earnings. The virus causes a respiratory disease known as COVID-19. On March 11, the World Health Organization declared the COVID-19 outbreak a pandemic, citing sustained risk of further global spread.
In the weeks following, as the crisis worsened, we witnessed an escalating human tragedy with wide-scale social and economic consequences from coronavirus-containment measures. The outbreak of COVID-19 prompted a number of measures to limit the spread, including travel and border restrictions, quarantines, and restrictions on large gatherings. In turn, these resulted in lower consumer activity, diminished demand for a wide range of products and services, disruption in manufacturing and supply chains, and – given the wide variability in outcomes regarding the outbreak – significant market uncertainty and volatility. Amid the turmoil, global governments and central banks took unprecedented action to help support consumers, businesses, and the broader economies, and to limit disruption to financial systems.
The situation continues to unfold, and the extent and duration of its impact on financial markets and the economy remain highly uncertain. Extreme events such as the coronavirus crisis are “exogenous shocks” that can have significant adverse effects on mutual funds and their investments. Although multiple asset classes may be affected by market disruption, the duration and impact may not be the same for all types of assets.
Fidelity is committed to helping you stay informed amid news about COVID-19 and during increased market volatility, and we’re taking extra steps to be responsive to customer needs. We encourage you to visit our websites, where we offer ongoing updates, commentary, and analysis on the markets and our funds.
Fidelity® Canada Fund
Performance: The Bottom Line
Average annual total return reflects the change in the value of an investment, assuming reinvestment of distributions from dividend income and capital gains (the profits earned upon the sale of securities that have grown in value, if any) and assuming a constant rate of performance each year. The hypothetical investment and the average annual total returns do not reflect the deduction of taxes that a shareholder would pay on fund distributions or the redemption of fund shares. During periods of reimbursement by Fidelity, a fund’s total return will be greater than it would be had the reimbursement not occurred. How a fund did yesterday is no guarantee of how it will do tomorrow.
Average Annual Total Returns
| For the periods ended October 31, 2020 | Past 1 year | Past 5 years | Past 10 years |
| Class A (incl. 5.75% sales charge) | (13.00)% | 2.16% | 1.14% |
| Class M (incl. 3.50% sales charge) | (11.17)% | 2.35% | 1.09% |
| Class C (incl. contingent deferred sales charge) | (9.28)% | 2.63% | 1.00% |
| Fidelity® Canada Fund | (7.40)% | 3.71% | 2.06% |
| Class I | (7.35)% | 3.75% | 2.08% |
| Class Z | (7.24)% | 3.80% | 2.11% |
Class C shares' contingent deferred sales charges included in the past one year, past five years and past ten years total return figures are 1%, 0% and 0%, respectively.
The initial offering of Class Z shares took place on October 2, 2018. Returns prior to October 2, 2018, are those of Class I.
$10,000 Over 10 Years
Let's say hypothetically that $10,000 was invested in Fidelity® Canada Fund, a class of the fund, on October 31, 2010.
The chart shows how the value of your investment would have changed, and also shows how the S&P/TSX Composite Index performed over the same period.
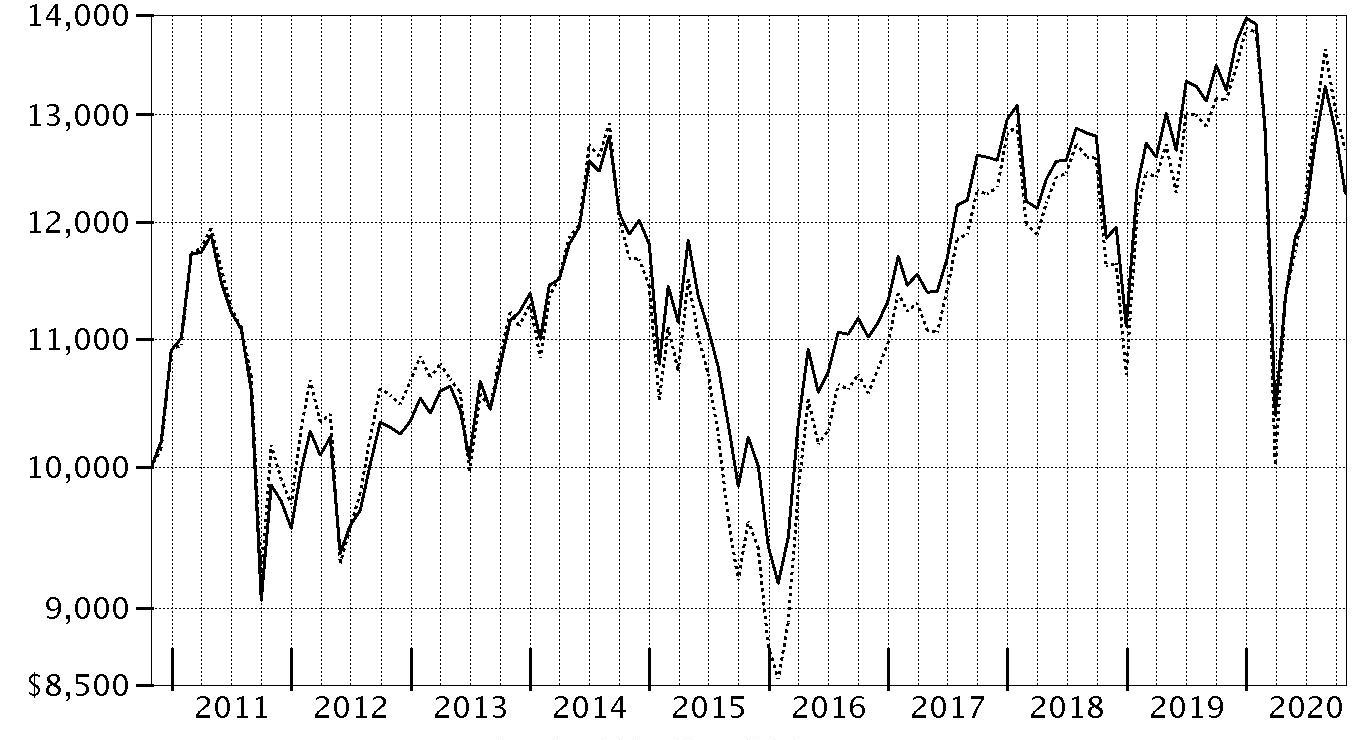
| Period Ending Values |
| $12,262 | Fidelity® Canada Fund |
| $12,654 | S&P/TSX Composite Index |
Fidelity® Canada Fund
Management's Discussion of Fund Performance
Market Recap: The MSCI ACWI (All Country World Index) ex USA Index returned -2.46% for the 12 months ending October 31, 2020, in what was a bumpy ride for non-U.S. equities, marked by a steep but brief decline due to the early-2020 outbreak and spread of the coronavirus, followed by a sharp upturn. Declared a pandemic on March 11, the crisis and containment efforts caused broad contraction in economic activity, elevated volatility and dislocation in financial markets. A historically rapid and expansive monetary- and fiscal-policy response around the world provided a partial offset to the economic disruption. Other supporting factors included resilient corporate earnings and near-term potential for a COVID-19 vaccine breakthrough. This was evident in the index’s 12.28% gain in the final six months of the year. Currency fluctuation generally boosted foreign developed-markets equities for the year, while the reverse was true for emerging-markets stocks. Late in the period, the index was pressured by a second wave of COVID-19 cases in some regions, and stretched valuations and crowded positioning in big tech. For the full year, the U.K. (-22%), Asia Pacific ex Japan (-8%), Canada (-5%) and Europe ex U.K. (-4%) notably lagged. Emerging markets (+9%) and Japan (+1%) outperformed. By sector, energy (-38%), financials and real estate (-20% each) lagged, whereas information technology (+ 25%) and communication services (+15%) topped the index.
Comments from Portfolio Manager Ryan Oldham: For the fiscal year ending October 31, 2020, the fund's share classes returned about -8% to -7%, trailing the -3.69% result of the benchmark S&P/TSX Composite Index. Versus the benchmark, security selection was the primary detractor, especially within the software & services area of the information technology sector. Stock selection in energy and materials also hampered the fund's relative result. Largely avoiding Shopify (+194%), a stake we established late in the period, detracted more than any other position the past 12 months. Also holding back performance was our overweighting in Suncor Energy, which returned about -61%. Avoiding Barrick Gold, a benchmark component that gained 56%, also hurt the fund’s relative performance. In contrast, security selection in industrials, primarily driven by the transportation industry, aided the fund’s relative return, as did positioning in health care and consumer staples. The fund's biggest individual relative contributor was an outsized stake in Franco-Nevada, which gained 41% the past year. An overweighting Canadian Pacific Railway (+32%) and an outsized stake in Wheaton Precious Metals (+65%) also added value.
The views expressed above reflect those of the portfolio manager(s) only through the end of the period as stated on the cover of this report and do not necessarily represent the views of Fidelity or any other person in the Fidelity organization. Any such views are subject to change at any time based upon market or other conditions and Fidelity disclaims any responsibility to update such views. These views may not be relied on as investment advice and, because investment decisions for a Fidelity fund are based on numerous factors, may not be relied on as an indication of trading intent on behalf of any Fidelity fund.
Fidelity® Canada Fund
Investment Summary (Unaudited)
Geographic Diversification (% of fund's net assets)
| As of October 31, 2020 |
| | Canada | 99.9% |
| | United States of America* | 0.1% |

* Includes Short-Term investments and Net Other Assets (Liabilities).
Percentages are based on country or territory of incorporation and are adjusted for the effect of futures contracts, if applicable.
Asset Allocation as of October 31, 2020
| | % of fund's net assets |
| Stocks | 99.6 |
| Bonds | 0.3 |
| Short-Term Investments and Net Other Assets (Liabilities) | 0.1 |
Top Ten Stocks as of October 31, 2020
| | % of fund's net assets |
| Royal Bank of Canada (Banks) | 9.9 |
| The Toronto-Dominion Bank (Banks) | 9.0 |
| Canadian Pacific Railway Ltd. (Road & Rail) | 7.2 |
| Franco-Nevada Corp. (Metals & Mining) | 5.9 |
| Alimentation Couche-Tard, Inc. Class B (sub. vtg.) (Food & Staples Retailing) | 5.2 |
| TELUS Corp. (Diversified Telecommunication Services) | 4.4 |
| Wheaton Precious Metals Corp. (Metals & Mining) | 4.0 |
| Brookfield Asset Management, Inc. (Canada) Class A (Capital Markets) | 3.6 |
| Sun Life Financial, Inc. (Insurance) | 3.3 |
| Nutrien Ltd. (Chemicals) | 3.2 |
| | 55.7 |
Top Market Sectors as of October 31, 2020
| | % of fund's net assets |
| Financials | 29.1 |
| Materials | 15.4 |
| Industrials | 13.9 |
| Consumer Staples | 10.4 |
| Energy | 10.1 |
| Information Technology | 7.8 |
| Communication Services | 6.9 |
| Consumer Discretionary | 4.7 |
| Real Estate | 1.0 |
| Health Care | 0.6 |
Market Sectors may include more than one industry category.
The Fund may invest up to 35% of its total assets in any industry that represents more than 20% of the Canadian market. As of October 31, 2020, the Fund did not have more than 25% of its total assets invested in any one industry.
Fidelity® Canada Fund
Schedule of Investments October 31, 2020
Showing Percentage of Net Assets
| Common Stocks - 99.6% | | | |
| | | Shares | Value |
| COMMUNICATION SERVICES - 6.6% | | | |
| Diversified Telecommunication Services - 4.4% | | | |
| TELUS Corp. | | 1,715,200 | $29,326,920 |
| Wireless Telecommunication Services - 2.2% | | | |
| Rogers Communications, Inc. Class B (non-vtg.) | | 367,000 | 14,908,084 |
|
| TOTAL COMMUNICATION SERVICES | | | 44,235,004 |
|
| CONSUMER DISCRETIONARY - 4.7% | | | |
| Hotels, Restaurants & Leisure - 1.8% | | | |
| Restaurant Brands International, Inc. | | 228,100 | 11,852,708 |
| Multiline Retail - 2.0% | | | |
| Dollarama, Inc. | | 389,500 | 13,413,090 |
| Specialty Retail - 0.0% | | | |
| Diversified Royalty Corp. | | 107,600 | 142,950 |
| Textiles, Apparel & Luxury Goods - 0.9% | | | |
| Canada Goose Holdings, Inc. (a)(b) | | 106,900 | 3,333,855 |
| Gildan Activewear, Inc. | | 140,100 | 2,902,319 |
| | | | 6,236,174 |
|
| TOTAL CONSUMER DISCRETIONARY | | | 31,644,922 |
|
| CONSUMER STAPLES - 10.4% | | | |
| Beverages - 0.2% | | | |
| Guru Beverages rights (a)(c) | | 219,700 | 898,720 |
| Food & Staples Retailing - 9.9% | | | |
| Alimentation Couche-Tard, Inc. Class B (sub. vtg.) | | 1,135,000 | 34,953,877 |
| George Weston Ltd. | | 126,800 | 8,892,084 |
| Metro, Inc. Class A (sub. vtg.) | | 346,495 | 16,163,525 |
| North West Co., Inc. | | 256,400 | 6,321,955 |
| | | | 66,331,441 |
| Personal Products - 0.3% | | | |
| Jamieson Wellness, Inc. | | 71,700 | 2,074,096 |
|
| TOTAL CONSUMER STAPLES | | | 69,304,257 |
|
| ENERGY - 10.1% | | | |
| Energy Equipment & Services - 0.3% | | | |
| Computer Modelling Group Ltd. | | 480,800 | 1,706,961 |
| Oil, Gas & Consumable Fuels - 9.8% | | | |
| Canadian Natural Resources Ltd. | | 982,198 | 15,629,061 |
| Enbridge, Inc. | | 723,300 | 19,929,703 |
| Parkland Corp. | | 184,100 | 4,496,445 |
| PrairieSky Royalty Ltd. | | 1,779,218 | 10,910,614 |
| Suncor Energy, Inc. | | 1,318,700 | 14,876,575 |
| | | | 65,842,398 |
|
| TOTAL ENERGY | | | 67,549,359 |
|
| FINANCIALS - 29.1% | | | |
| Banks - 18.9% | | | |
| Royal Bank of Canada | | 944,000 | 66,008,436 |
| The Toronto-Dominion Bank | | 1,365,100 | 60,227,110 |
| | | | 126,235,546 |
| Capital Markets - 3.6% | | | |
| Brookfield Asset Management, Inc. (Canada) Class A | | 809,400 | 24,051,750 |
| Insurance - 6.6% | | | |
| Fairfax Financial Holdings Ltd. (sub. vtg.) | | 30,500 | 8,017,954 |
| Intact Financial Corp. | | 136,025 | 14,050,710 |
| Sun Life Financial, Inc. | | 556,700 | 22,150,167 |
| | | | 44,218,831 |
|
| TOTAL FINANCIALS | | | 194,506,127 |
|
| HEALTH CARE - 0.6% | | | |
| Health Care Providers & Services - 0.6% | | | |
| Andlauer Healthcare Group, Inc. | | 135,100 | 4,319,793 |
| INDUSTRIALS - 13.9% | | | |
| Commercial Services & Supplies - 1.5% | | | |
| GFL Environmental, Inc. | | 541,000 | 10,354,739 |
| Professional Services - 2.2% | | | |
| Thomson Reuters Corp. | | 189,600 | 14,740,500 |
| Road & Rail - 10.2% | | | |
| Canadian National Railway Co. | | 204,600 | 20,324,859 |
| Canadian Pacific Railway Ltd. | | 160,100 | 47,843,739 |
| | | | 68,168,598 |
|
| TOTAL INDUSTRIALS | | | 93,263,837 |
|
| INFORMATION TECHNOLOGY - 7.8% | | | |
| IT Services - 3.2% | | | |
| CGI Group, Inc. Class A (sub. vtg.) (a) | | 207,800 | 12,894,112 |
| Shopify, Inc. Class A (a) | | 9,300 | 8,573,549 |
| | | | 21,467,661 |
| Software - 4.6% | | | |
| Absolute Software Corp. | | 74,600 | 841,488 |
| Constellation Software, Inc. | | 13,500 | 14,171,707 |
| Dye & Durham Ltd. (a) | | 121,900 | 2,012,910 |
| Dye & Durham Ltd. | | 97,000 | 1,441,567 |
| Open Text Corp. | | 333,028 | 12,235,773 |
| | | | 30,703,445 |
|
| TOTAL INFORMATION TECHNOLOGY | | | 52,171,106 |
|
| MATERIALS - 15.4% | | | |
| Chemicals - 3.2% | | | |
| Nutrien Ltd. | | 527,881 | 21,459,157 |
| Containers & Packaging - 1.3% | | | |
| CCL Industries, Inc. Class B | | 230,300 | 8,781,235 |
| Metals & Mining - 10.6% | | | |
| Franco-Nevada Corp. | | 291,300 | 39,703,646 |
| Lundin Mining Corp. | | 545,900 | 3,298,428 |
| OceanaGold Corp. (a) | | 872,600 | 1,139,626 |
| Wheaton Precious Metals Corp. | | 576,100 | 26,437,555 |
| | | | 70,579,255 |
| Paper & Forest Products - 0.3% | | | |
| Western Forest Products, Inc. | | 3,025,683 | 1,953,079 |
|
| TOTAL MATERIALS | | | 102,772,726 |
|
| REAL ESTATE - 1.0% | | | |
| Equity Real Estate Investment Trusts (REITs) - 0.7% | | | |
| Allied Properties (REIT) | | 195,500 | 4,741,128 |
| Real Estate Management & Development - 0.3% | | | |
| Colliers International Group, Inc. | | 19,800 | 1,402,333 |
| Information Services Corp. | | 15,700 | 220,835 |
| | | | 1,623,168 |
|
| TOTAL REAL ESTATE | | | 6,364,296 |
|
| TOTAL COMMON STOCKS | | | |
| (Cost $492,697,966) | | | 666,131,427 |
| | | Principal Amount | Value |
|
| Convertible Bonds - 0.3% | | | |
| COMMUNICATION SERVICES - 0.3% | | | |
| Entertainment - 0.3% | | | |
Cineplex, Inc. 5.75% 9/30/25
(Cost $1,739,690)(d) | CAD | 2,730,000 | 1,743,159 |
| | | Shares | Value |
|
| Money Market Funds - 0.6% | | | |
| Fidelity Cash Central Fund 0.10% (e) | | 647,886 | 648,015 |
| Fidelity Securities Lending Cash Central Fund 0.11% (e)(f) | | 3,721,861 | 3,722,233 |
| TOTAL MONEY MARKET FUNDS | | | |
| (Cost $4,370,248) | | | 4,370,248 |
| TOTAL INVESTMENT IN SECURITIES - 100.5% | | | |
| (Cost $498,807,904) | | | 672,244,834 |
| NET OTHER ASSETS (LIABILITIES) - (0.5)% | | | (3,458,737) |
| NET ASSETS - 100% | | | $668,786,097 |
Currency Abbreviations
CAD – Canadian dollar
Legend
(a) Non-income producing
(b) Security or a portion of the security is on loan at period end.
(c) Restricted securities (including private placements) - Investment in securities not registered under the Securities Act of 1933 (excluding 144A issues). At the end of the period, the value of restricted securities (excluding 144A issues) amounted to $898,720 or 0.1% of net assets.
(d) Security exempt from registration under Rule 144A of the Securities Act of 1933. These securities may be resold in transactions exempt from registration, normally to qualified institutional buyers. At the end of the period, the value of these securities amounted to $1,743,159 or 0.3% of net assets.
(e) Affiliated fund that is generally available only to investment companies and other accounts managed by Fidelity Investments. The rate quoted is the annualized seven-day yield of the fund at period end. A complete unaudited listing of the fund's holdings as of its most recent quarter end is available upon request. In addition, each Fidelity Central Fund's financial statements, which are not covered by the Fund's Report of Independent Registered Public Accounting Firm, are available on the SEC's website or upon request.
(f) Investment made with cash collateral received from securities on loan.
Additional information on each restricted holding is as follows:
| Security | Acquisition Date | Acquisition Cost |
| Guru Beverages rights | 9/25/20 | $894,491 |
Affiliated Central Funds
Information regarding fiscal year to date income earned by the Fund from investments in Fidelity Central Funds is as follows:
| Fund | Income earned |
| Fidelity Cash Central Fund | $21,496 |
| Fidelity Securities Lending Cash Central Fund | 72,082 |
| Total | $93,578 |
Amounts in the income column in the above table include any capital gain distributions from underlying funds, which are presented in the corresponding line-item in the Statement of Operations, if applicable. Amount for Fidelity Securities Lending Cash Central Fund represents the income earned on investing cash collateral, less rebates paid to borrowers and any lending agent fees associated with the loan, plus any premium payments received for lending certain types of securities.
Investment Valuation
The following is a summary of the inputs used, as of October 31, 2020, involving the Fund's assets and liabilities carried at fair value. The inputs or methodology used for valuing securities may not be an indication of the risk associated with investing in those securities. For more information on valuation inputs, and their aggregation into the levels used below, please refer to the Investment Valuation section in the accompanying Notes to Financial Statements.
| | Valuation Inputs at Reporting Date: |
| Description | Total | Level 1 | Level 2 | Level 3 |
| Investments in Securities: | | | | |
| Equities: | | | | |
| Communication Services | $44,235,004 | $44,235,004 | $-- | $-- |
| Consumer Discretionary | 31,644,922 | 31,644,922 | -- | -- |
| Consumer Staples | 69,304,257 | 68,405,537 | 898,720 | -- |
| Energy | 67,549,359 | 67,549,359 | -- | -- |
| Financials | 194,506,127 | 194,506,127 | -- | -- |
| Health Care | 4,319,793 | 4,319,793 | -- | -- |
| Industrials | 93,263,837 | 93,263,837 | -- | -- |
| Information Technology | 52,171,106 | 50,729,539 | 1,441,567 | -- |
| Materials | 102,772,726 | 102,772,726 | -- | -- |
| Real Estate | 6,364,296 | 6,364,296 | -- | -- |
| Corporate Bonds | 1,743,159 | -- | 1,743,159 | -- |
| Money Market Funds | 4,370,248 | 4,370,248 | -- | -- |
| Total Investments in Securities: | $672,244,834 | $668,161,388 | $4,083,446 | $-- |
See accompanying notes which are an integral part of the financial statements.
Fidelity® Canada Fund
Financial Statements
Statement of Assets and Liabilities
| | | October 31, 2020 |
| Assets | | |
Investment in securities, at value (including securities loaned of $3,329,921) — See accompanying schedule:
Unaffiliated issuers (cost $494,437,656) | $667,874,586 | |
| Fidelity Central Funds (cost $4,370,248) | 4,370,248 | |
| Total Investment in Securities (cost $498,807,904) | | $672,244,834 |
| Foreign currency held at value (cost $40,333) | | 40,333 |
| Receivable for fund shares sold | | 59,483 |
| Dividends receivable | | 1,464,848 |
| Interest receivable | | 10,330 |
| Distributions receivable from Fidelity Central Funds | | 1,202 |
| Prepaid expenses | | 1,277 |
| Other receivables | | 1,841 |
| Total assets | | 673,824,148 |
| Liabilities | | |
| Payable for investments purchased | $68,362 | |
| Payable for fund shares redeemed | 716,859 | |
| Accrued management fee | 309,189 | |
| Distribution and service plan fees payable | 10,639 | |
| Other affiliated payables | 152,496 | |
| Other payables and accrued expenses | 61,848 | |
| Collateral on securities loaned | 3,718,658 | |
| Total liabilities | | 5,038,051 |
| Net Assets | | $668,786,097 |
| Net Assets consist of: | | |
| Paid in capital | | $478,610,722 |
| Total accumulated earnings (loss) | | 190,175,375 |
| Net Assets | | $668,786,097 |
| Net Asset Value and Maximum Offering Price | | |
| Class A: | | |
| Net Asset Value and redemption price per share ($23,395,384 ÷ 508,462 shares)(a) | | $46.01 |
| Maximum offering price per share (100/94.25 of $46.01) | | $48.82 |
| Class M: | | |
| Net Asset Value and redemption price per share ($5,910,535 ÷ 129,213 shares)(a) | | $45.74 |
| Maximum offering price per share (100/96.50 of $45.74) | | $47.40 |
| Class C: | | |
| Net Asset Value and offering price per share ($3,151,169 ÷ 70,082 shares)(a) | | $44.96 |
| Canada: | | |
| Net Asset Value, offering price and redemption price per share ($612,715,871 ÷ 13,245,922 shares) | | $46.26 |
| Class I: | | |
| Net Asset Value, offering price and redemption price per share ($8,392,044 ÷ 181,480 shares) | | $46.24 |
| Class Z: | | |
| Net Asset Value, offering price and redemption price per share ($15,221,094 ÷ 330,118 shares) | | $46.11 |
(a) Redemption price per share is equal to net asset value less any applicable contingent deferred sales charge.
See accompanying notes which are an integral part of the financial statements.
Statement of Operations
| | | Year ended October 31, 2020 |
| Investment Income | | |
| Dividends | | $22,299,111 |
| Interest | | 3,996 |
| Income from Fidelity Central Funds (including $72,082 from security lending) | | 93,578 |
| Income before foreign taxes withheld | | 22,396,685 |
| Less foreign taxes withheld | | (3,506,511) |
| Total income | | 18,890,174 |
| Expenses | | |
| Management fee | | |
| Basic fee | $5,250,085 | |
| Performance adjustment | (642,120) | |
| Transfer agent fees | 1,563,787 | |
| Distribution and service plan fees | 146,536 | |
| Accounting fees | 371,098 | |
| Custodian fees and expenses | 18,082 | |
| Independent trustees' fees and expenses | 4,573 | |
| Registration fees | 82,918 | |
| Audit | 70,546 | |
| Legal | 3,245 | |
| Miscellaneous | 23,851 | |
| Total expenses before reductions | 6,892,601 | |
| Expense reductions | (20,032) | |
| Total expenses after reductions | | 6,872,569 |
| Net investment income (loss) | | 12,017,605 |
| Realized and Unrealized Gain (Loss) | | |
| Net realized gain (loss) on: | | |
| Investment securities: | | |
| Unaffiliated issuers | 11,161,262 | |
| Fidelity Central Funds | 2,343 | |
| Foreign currency transactions | (31,397) | |
| Total net realized gain (loss) | | 11,132,208 |
| Change in net unrealized appreciation (depreciation) on: | | |
| Investment securities: | | |
| Unaffiliated issuers | (85,634,105) | |
| Assets and liabilities in foreign currencies | (4,196) | |
| Total change in net unrealized appreciation (depreciation) | | (85,638,301) |
| Net gain (loss) | | (74,506,093) |
| Net increase (decrease) in net assets resulting from operations | | $(62,488,488) |
See accompanying notes which are an integral part of the financial statements.
Statement of Changes in Net Assets
| | Year ended October 31, 2020 | Year ended October 31, 2019 |
| Increase (Decrease) in Net Assets | | |
| Operations | | |
| Net investment income (loss) | $12,017,605 | $15,955,454 |
| Net realized gain (loss) | 11,132,208 | 54,068,876 |
| Change in net unrealized appreciation (depreciation) | (85,638,301) | 39,660,707 |
| Net increase (decrease) in net assets resulting from operations | (62,488,488) | 109,685,037 |
| Distributions to shareholders | (38,692,729) | (61,875,999) |
| Share transactions - net increase (decrease) | (114,078,173) | (142,935,933) |
| Total increase (decrease) in net assets | (215,259,390) | (95,126,895) |
| Net Assets | | |
| Beginning of period | 884,045,487 | 979,172,382 |
| End of period | $668,786,097 | $884,045,487 |
See accompanying notes which are an integral part of the financial statements.
Financial Highlights
Fidelity Canada Fund Class A
| Years ended October 31, | 2020 | 2019 | 2018 | 2017 | 2016 |
| Selected Per–Share Data | | | | | |
| Net asset value, beginning of period | $51.95 | $49.75 | $54.11 | $48.09 | $45.25 |
| Income from Investment Operations | | | | | |
| Net investment income (loss)A | .61 | .66 | .60 | .50 | .48 |
| Net realized and unrealized gain (loss) | (4.38) | 4.56 | (3.88) | 6.16 | 2.84 |
| Total from investment operations | (3.77) | 5.22 | (3.28) | 6.66 | 3.32 |
| Distributions from net investment income | (.77) | (.39) | (.59) | (.45) | (.42) |
| Distributions from net realized gain | (1.40) | (2.63) | (.49) | (.19) | (.06) |
| Total distributions | (2.17) | (3.02) | (1.08) | (.64) | (.48) |
| Redemption fees added to paid in capitalA | – | – | –B | –B | –B |
| Net asset value, end of period | $46.01 | $51.95 | $49.75 | $54.11 | $48.09 |
| Total ReturnC,D | (7.70)% | 11.34% | (6.19)% | 13.98% | 7.45% |
| Ratios to Average Net AssetsE,F | | | | | |
| Expenses before reductions | 1.20% | 1.20% | 1.21% | 1.34% | 1.48% |
| Expenses net of fee waivers, if any | 1.20% | 1.20% | 1.21% | 1.34% | 1.48% |
| Expenses net of all reductions | 1.19% | 1.19% | 1.20% | 1.34% | 1.48% |
| Net investment income (loss) | 1.27% | 1.32% | 1.13% | .98% | 1.06% |
| Supplemental Data | | | | | |
| Net assets, end of period (000 omitted) | $23,395 | $30,598 | $29,420 | $37,557 | $44,144 |
| Portfolio turnover rateG | 11% | 8%H | 29% | 26% | 44% |
A Calculated based on average shares outstanding during the period.
B Amount represents less than $.005 per share.
C Total returns would have been lower if certain expenses had not been reduced during the applicable periods shown.
D Total returns do not include the effect of the sales charges.
E Fees and expenses of any underlying mutual funds or exchange-traded funds (ETFs) are not included in the Fund's expense ratio. The Fund indirectly bears its proportionate share of these expenses. For additional expense information related to investments in Fidelity Central Funds, please refer to the "Investments in Fidelity Central Funds" note found in the Notes to Financial Statements section of the most recent Annual or Semi-Annual report.
F Expense ratios reflect operating expenses of the class. Expenses before reductions do not reflect amounts reimbursed, waived, or reduced through arrangements with the investment adviser, brokerage services, or other offset arrangements, if applicable, and do not represent the amount paid by the class during periods when reimbursements, waivers or reductions occur.
G Amount does not include the portfolio activity of any underlying mutual funds or exchange-traded funds (ETFs).
H Portfolio turnover rate excludes securities received or delivered in-kind.
See accompanying notes which are an integral part of the financial statements.
Fidelity Canada Fund Class M
| Years ended October 31, | 2020 | 2019 | 2018 | 2017 | 2016 |
| Selected Per–Share Data | | | | | |
| Net asset value, beginning of period | $51.67 | $49.46 | $53.77 | $47.82 | $44.99 |
| Income from Investment Operations | | | | | |
| Net investment income (loss)A | .47 | .51 | .44 | .35 | .35 |
| Net realized and unrealized gain (loss) | (4.36) | 4.55 | (3.86) | 6.13 | 2.83 |
| Total from investment operations | (3.89) | 5.06 | (3.42) | 6.48 | 3.18 |
| Distributions from net investment income | (.64) | (.22) | (.40) | (.34) | (.29) |
| Distributions from net realized gain | (1.40) | (2.63) | (.49) | (.19) | (.06) |
| Total distributions | (2.04) | (2.85) | (.89) | (.53) | (.35) |
| Redemption fees added to paid in capitalA | – | – | –B | –B | –B |
| Net asset value, end of period | $45.74 | $51.67 | $49.46 | $53.77 | $47.82 |
| Total ReturnC,D | (7.95)% | 11.02% | (6.47)% | 13.64% | 7.14% |
| Ratios to Average Net AssetsE,F | | | | | |
| Expenses before reductions | 1.47% | 1.49% | 1.51% | 1.63% | 1.77% |
| Expenses net of fee waivers, if any | 1.47% | 1.48% | 1.51% | 1.63% | 1.77% |
| Expenses net of all reductions | 1.47% | 1.48% | 1.51% | 1.63% | 1.77% |
| Net investment income (loss) | .99% | 1.03% | .83% | .69% | .78% |
| Supplemental Data | | | | | |
| Net assets, end of period (000 omitted) | $5,911 | $8,589 | $7,844 | $10,356 | $11,140 |
| Portfolio turnover rateG | 11% | 8%H | 29% | 26% | 44% |
A Calculated based on average shares outstanding during the period.
B Amount represents less than $.005 per share.
C Total returns would have been lower if certain expenses had not been reduced during the applicable periods shown.
D Total returns do not include the effect of the sales charges.
E Fees and expenses of any underlying mutual funds or exchange-traded funds (ETFs) are not included in the Fund's expense ratio. The Fund indirectly bears its proportionate share of these expenses. For additional expense information related to investments in Fidelity Central Funds, please refer to the "Investments in Fidelity Central Funds" note found in the Notes to Financial Statements section of the most recent Annual or Semi-Annual report.
F Expense ratios reflect operating expenses of the class. Expenses before reductions do not reflect amounts reimbursed, waived, or reduced through arrangements with the investment adviser, brokerage services, or other offset arrangements, if applicable, and do not represent the amount paid by the class during periods when reimbursements, waivers or reductions occur.
G Amount does not include the portfolio activity of any underlying mutual funds or exchange-traded funds (ETFs).
H Portfolio turnover rate excludes securities received or delivered in-kind.
See accompanying notes which are an integral part of the financial statements.
Fidelity Canada Fund Class C
| Years ended October 31, | 2020 | 2019 | 2018 | 2017 | 2016 |
| Selected Per–Share Data | | | | | |
| Net asset value, beginning of period | $50.61 | $48.48 | $52.72 | $46.87 | $44.02 |
| Income from Investment Operations | | | | | |
| Net investment income (loss)A | .24 | .29 | .21 | .13 | .15 |
| Net realized and unrealized gain (loss) | (4.31) | 4.47 | (3.78) | 6.01 | 2.78 |
| Total from investment operations | (4.07) | 4.76 | (3.57) | 6.14 | 2.93 |
| Distributions from net investment income | (.18) | – | (.18) | (.11) | (.02) |
| Distributions from net realized gain | (1.40) | (2.63) | (.49) | (.19) | (.06) |
| Total distributions | (1.58) | (2.63) | (.67) | (.29)B | (.08) |
| Redemption fees added to paid in capitalA | – | – | –C | –C | –C |
| Net asset value, end of period | $44.96 | $50.61 | $48.48 | $52.72 | $46.87 |
| Total ReturnD,E | (8.39)% | 10.53% | (6.85)% | 13.16% | 6.67% |
| Ratios to Average Net AssetsF,G | | | | | |
| Expenses before reductions | 1.95% | 1.92% | 1.94% | 2.06% | 2.21% |
| Expenses net of fee waivers, if any | 1.95% | 1.92% | 1.93% | 2.06% | 2.21% |
| Expenses net of all reductions | 1.95% | 1.91% | 1.93% | 2.06% | 2.21% |
| Net investment income (loss) | .51% | .60% | .40% | .26% | .33% |
| Supplemental Data | | | | | |
| Net assets, end of period (000 omitted) | $3,151 | $6,226 | $11,196 | $15,938 | $18,489 |
| Portfolio turnover rateH | 11% | 8%I | 29% | 26% | 44% |
A Calculated based on average shares outstanding during the period.
B Total distributions per share do not sum due to rounding.
C Amount represents less than $.005 per share.
D Total returns would have been lower if certain expenses had not been reduced during the applicable periods shown.
E Total returns do not include the effect of the contingent deferred sales charge.
F Fees and expenses of any underlying mutual funds or exchange-traded funds (ETFs) are not included in the Fund's expense ratio. The Fund indirectly bears its proportionate share of these expenses. For additional expense information related to investments in Fidelity Central Funds, please refer to the "Investments in Fidelity Central Funds" note found in the Notes to Financial Statements section of the most recent Annual or Semi-Annual report.
G Expense ratios reflect operating expenses of the class. Expenses before reductions do not reflect amounts reimbursed, waived, or reduced through arrangements with the investment adviser, brokerage services, or other offset arrangements, if applicable, and do not represent the amount paid by the class during periods when reimbursements, waivers or reductions occur.
H Amount does not include the portfolio activity of any underlying mutual funds or exchange-traded funds (ETFs).
I Portfolio turnover rate excludes securities received or delivered in-kind.
See accompanying notes which are an integral part of the financial statements.
Fidelity Canada Fund
| Years ended October 31, | 2020 | 2019 | 2018 | 2017 | 2016 |
| Selected Per–Share Data | | | | | |
| Net asset value, beginning of period | $52.21 | $50.02 | $54.41 | $48.35 | $45.55 |
| Income from Investment Operations | | | | | |
| Net investment income (loss)A | .76 | .82 | .77 | .66 | .62 |
| Net realized and unrealized gain (loss) | (4.38) | 4.58 | (3.90) | 6.20 | 2.85 |
| Total from investment operations | (3.62) | 5.40 | (3.13) | 6.86 | 3.47 |
| Distributions from net investment income | (.92) | (.58) | (.77) | (.61) | (.61) |
| Distributions from net realized gain | (1.40) | (2.63) | (.49) | (.19) | (.06) |
| Total distributions | (2.33)B | (3.21) | (1.26) | (.80) | (.67) |
| Redemption fees added to paid in capitalA | – | – | –C | –C | –C |
| Net asset value, end of period | $46.26 | $52.21 | $50.02 | $54.41 | $48.35 |
| Total ReturnD | (7.40)% | 11.70% | (5.89)% | 14.35% | 7.79% |
| Ratios to Average Net AssetsE,F | | | | | |
| Expenses before reductions | .88% | .88% | .89% | 1.02% | 1.17% |
| Expenses net of fee waivers, if any | .88% | .88% | .89% | 1.02% | 1.17% |
| Expenses net of all reductions | .88% | .87% | .88% | 1.02% | 1.17% |
| Net investment income (loss) | 1.58% | 1.64% | 1.45% | 1.30% | 1.37% |
| Supplemental Data | | | | | |
| Net assets, end of period (000 omitted) | $612,716 | $803,629 | $903,662 | $1,130,803 | $1,233,050 |
| Portfolio turnover rateG | 11% | 8%H | 29% | 26% | 44% |
A Calculated based on average shares outstanding during the period.
B Total distributions per share do not sum due to rounding.
C Amount represents less than $.005 per share.
D Total returns would have been lower if certain expenses had not been reduced during the applicable periods shown.
E Fees and expenses of any underlying mutual funds or exchange-traded funds (ETFs) are not included in the Fund's expense ratio. The Fund indirectly bears its proportionate share of these expenses. For additional expense information related to investments in Fidelity Central Funds, please refer to the "Investments in Fidelity Central Funds" note found in the Notes to Financial Statements section of the most recent Annual or Semi-Annual report.
F Expense ratios reflect operating expenses of the class. Expenses before reductions do not reflect amounts reimbursed, waived, or reduced through arrangements with the investment adviser, brokerage services, or other offset arrangements, if applicable, and do not represent the amount paid by the class during periods when reimbursements, waivers or reductions occur.
G Amount does not include the portfolio activity of any underlying mutual funds or exchange-traded funds (ETFs).
H Portfolio turnover rate excludes securities received or delivered in-kind.
See accompanying notes which are an integral part of the financial statements.
Fidelity Canada Fund Class I
| Years ended October 31, | 2020 | 2019 | 2018 | 2017 | 2016 |
| Selected Per–Share Data | | | | | |
| Net asset value, beginning of period | $52.11 | $49.93 | $54.29 | $48.28 | $45.44 |
| Income from Investment Operations | | | | | |
| Net investment income (loss)A | .79 | .85 | .79 | .67 | .66 |
| Net realized and unrealized gain (loss) | (4.39) | 4.55 | (3.90) | 6.19 | 2.83 |
| Total from investment operations | (3.60) | 5.40 | (3.11) | 6.86 | 3.49 |
| Distributions from net investment income | (.87) | (.59) | (.77) | (.66) | (.59) |
| Distributions from net realized gain | (1.40) | (2.63) | (.49) | (.19) | (.06) |
| Total distributions | (2.27) | (3.22) | (1.25)B | (.85) | (.65) |
| Redemption fees added to paid in capitalA | – | – | –C | –C | –C |
| Net asset value, end of period | $46.24 | $52.11 | $49.93 | $54.29 | $48.28 |
| Total ReturnD | (7.35)% | 11.74% | (5.86)% | 14.38% | 7.83% |
| Ratios to Average Net AssetsE,F | | | | | |
| Expenses before reductions | .81% | .84% | .86% | 1.00% | 1.14% |
| Expenses net of fee waivers, if any | .81% | .84% | .85% | .99% | 1.13% |
| Expenses net of all reductions | .81% | .83% | .85% | .99% | 1.13% |
| Net investment income (loss) | 1.65% | 1.68% | 1.49% | 1.33% | 1.41% |
| Supplemental Data | | | | | |
| Net assets, end of period (000 omitted) | $8,392 | $14,507 | $26,923 | $30,581 | $41,217 |
| Portfolio turnover rateG | 11% | 8%H | 29% | 26% | 44% |
A Calculated based on average shares outstanding during the period.
B Total distributions per share do not sum due to rounding.
C Amount represents less than $.005 per share.
D Total returns would have been lower if certain expenses had not been reduced during the applicable periods shown.
E Fees and expenses of any underlying mutual funds or exchange-traded funds (ETFs) are not included in the Fund's expense ratio. The Fund indirectly bears its proportionate share of these expenses. For additional expense information related to investments in Fidelity Central Funds, please refer to the "Investments in Fidelity Central Funds" note found in the Notes to Financial Statements section of the most recent Annual or Semi-Annual report.
F Expense ratios reflect operating expenses of the class. Expenses before reductions do not reflect amounts reimbursed, waived, or reduced through arrangements with the investment adviser, brokerage services, or other offset arrangements, if applicable, and do not represent the amount paid by the class during periods when reimbursements, waivers or reductions occur.
G Amount does not include the portfolio activity of any underlying mutual funds or exchange-traded funds (ETFs).
H Portfolio turnover rate excludes securities received or delivered in-kind.
See accompanying notes which are an integral part of the financial statements.
Fidelity Canada Fund Class Z
| Years ended October 31, | 2020 | 2019 | 2018 A |
| Selected Per–Share Data | | | |
| Net asset value, beginning of period | $52.07 | $49.94 | $53.92 |
| Income from Investment Operations | | | |
| Net investment income (loss)B | .84 | .92 | .06 |
| Net realized and unrealized gain (loss) | (4.37) | 4.53 | (4.04) |
| Total from investment operations | (3.53) | 5.45 | (3.98) |
| Distributions from net investment income | (1.03) | (.69) | – |
| Distributions from net realized gain | (1.40) | (2.63) | – |
| Total distributions | (2.43) | (3.32) | – |
| Net asset value, end of period | $46.11 | $52.07 | $49.94 |
| Total ReturnC,D | (7.24)% | 11.87% | (7.38)% |
| Ratios to Average Net AssetsE,F | | | |
| Expenses before reductions | .72% | .72% | .80%G |
| Expenses net of fee waivers, if any | .72% | .72% | .80%G |
| Expenses net of all reductions | .72% | .71% | .79%G |
| Net investment income (loss) | 1.74% | 1.80% | 1.48%G |
| Supplemental Data | | | |
| Net assets, end of period (000 omitted) | $15,221 | $20,496 | $128 |
| Portfolio turnover rateH | 11% | 8%I | 29%G |
A For the period October 2, 2018 (commencement of sale of shares) to October 31, 2018.
B Calculated based on average shares outstanding during the period.
C Total returns for periods of less than one year are not annualized.
D Total returns would have been lower if certain expenses had not been reduced during the applicable periods shown.
E Fees and expenses of any underlying mutual funds or exchange-traded funds (ETFs) are not included in the Fund's expense ratio. The Fund indirectly bears its proportionate share of these expenses. For additional expense information related to investments in Fidelity Central Funds, please refer to the "Investments in Fidelity Central Funds" note found in the Notes to Financial Statements section of the most recent Annual or Semi-Annual report.
F Expense ratios reflect operating expenses of the class. Expenses before reductions do not reflect amounts reimbursed, waived, or reduced through arrangements with the investment adviser, brokerage services, or other offset arrangements, if applicable, and do not represent the amount paid by the class during periods when reimbursements, waivers or reductions occur.
G Annualized
H Amount does not include the portfolio activity of any underlying mutual funds or exchange-traded funds (ETFs).
I Portfolio turnover rate excludes securities received or delivered in-kind.
See accompanying notes which are an integral part of the financial statements.
Notes to Financial Statements
For the period ended October 31, 2020
1. Organization.
Fidelity Canada Fund (the Fund) is a fund of Fidelity Investment Trust (the Trust) and is authorized to issue an unlimited number of shares. The Trust is registered under the Investment Company Act of 1940, as amended (the 1940 Act), as an open-end management investment company organized as a Massachusetts business trust. The Fund offers Class A, Class M, Class C, Canada, Class I and Class Z shares, each of which has equal rights as to assets and voting privileges. Each class has exclusive voting rights with respect to matters that affect that class. Class C shares will automatically convert to Class A shares after a holding period of ten years from the initial date of purchase, with certain exceptions.
Effective January 1, 2020:
Investment advisers Fidelity Investments Money Management, Inc., FMR Co., Inc., and Fidelity SelectCo, LLC, merged with and into Fidelity Management & Research Company. In connection with the merger transactions, the resulting, merged investment adviser was then redomiciled from Massachusetts to Delaware, changed its corporate structure from a corporation to a limited liability company, and changed its name to "Fidelity Management & Research Company LLC".
Broker-dealer Fidelity Distributors Corporation merged with and into Fidelity Investments Institutional Services Company, Inc. ("FIISC"). FIISC was then redomiciled from Massachusetts to Delaware, changed its corporate structure from a corporation to a limited liability company, and changed its name to "Fidelity Distributors Company LLC".
Fidelity Investments Institutional Operations Company, Inc. converted from a Massachusetts corporation to a Massachusetts LLC, and changed its name to "Fidelity Investments Institutional Operations Company LLC".
2. Investments in Fidelity Central Funds.
The Fund invests in Fidelity Central Funds, which are open-end investment companies generally available only to other investment companies and accounts managed by the investment adviser and its affiliates. The Fund's Schedule of Investments lists each of the Fidelity Central Funds held as of period end, if any, as an investment of the Fund, but does not include the underlying holdings of each Fidelity Central Fund. As an Investing Fund, the Fund indirectly bears its proportionate share of the expenses of the underlying Fidelity Central Funds.
The Money Market Central Funds seek preservation of capital and current income and are managed by the investment adviser. Annualized expenses of the Money Market Central Funds as of their most recent shareholder report date ranged from less than .005% to .01%.
A complete unaudited list of holdings for each Fidelity Central Fund is available upon request or at the Securities and Exchange Commission (the SEC) website at www.sec.gov. In addition, the financial statements of the Fidelity Central Funds, which are not covered by the Fund's Report of Independent Registered Public Accounting Firm, are available on the SEC website or upon request.
3. Significant Accounting Policies.
The Fund is an investment company and applies the accounting and reporting guidance of the Financial Accounting Standards Board (FASB) Accounting Standards Codification Topic 946 Financial Services – Investment Companies. The financial statements have been prepared in conformity with accounting principles generally accepted in the United States of America (GAAP), which require management to make certain estimates and assumptions at the date of the financial statements. Actual results could differ from those estimates. Subsequent events, if any, through the date that the financial statements were issued have been evaluated in the preparation of the financial statements. The following summarizes the significant accounting policies of the Fund:
Investment Valuation. Investments are valued as of 4:00 p.m. Eastern time on the last calendar day of the period. The Board of Trustees (the Board) has delegated the day to day responsibility for the valuation of the Fund's investments to the Fair Value Committee (the Committee) established by the Fund's investment adviser. In accordance with valuation policies and procedures approved by the Board, the Fund attempts to obtain prices from one or more third party pricing vendors or brokers to value its investments. When current market prices, quotations or currency exchange rates are not readily available or reliable, investments will be fair valued in good faith by the Committee, in accordance with procedures adopted by the Board. Factors used in determining fair value vary by investment type and may include market or investment specific events, changes in interest rates and credit quality. The frequency with which these procedures are used cannot be predicted and they may be utilized to a significant extent. The Committee oversees the Fund's valuation policies and procedures and reports to the Board on the Committee's activities and fair value determinations. The Board monitors the appropriateness of the procedures used in valuing the Fund's investments and ratifies the fair value determinations of the Committee.
The Fund categorizes the inputs to valuation techniques used to value its investments into a disclosure hierarchy consisting of three levels as shown below:
- Level 1 – quoted prices in active markets for identical investments
- Level 2 – other significant observable inputs (including quoted prices for similar investments, interest rates, prepayment speeds, etc.)
- Level 3 – unobservable inputs (including the Fund's own assumptions based on the best information available)
Valuation techniques used to value the Fund's investments by major category are as follows:
Equity securities, including restricted securities, for which market quotations are readily available, are valued at the last reported sale price or official closing price as reported by a third party pricing vendor on the primary market or exchange on which they are traded and are categorized as Level 1 in the hierarchy. In the event there were no sales during the day or closing prices are not available, securities are valued at the last quoted bid price or may be valued using the last available price and are generally categorized as Level 2 in the hierarchy. For foreign equity securities, when market or security specific events arise, comparisons to the valuation of American Depositary Receipts (ADRs), futures contracts, Exchange-Traded Funds (ETFs) and certain indexes as well as quoted prices for similar securities may be used and would be categorized as Level 2 in the hierarchy. For equity securities, including restricted securities, where observable inputs are limited, assumptions about market activity and risk are used and these securities may be categorized as Level 3 in the hierarchy.
Debt securities, including restricted securities, are valued based on evaluated prices received from third party pricing vendors or from brokers who make markets in such securities. Corporate bonds are valued by pricing vendors who utilize matrix pricing which considers yield or price of bonds of comparable quality, coupon, maturity and type or by broker-supplied prices. When independent prices are unavailable or unreliable, debt securities may be valued utilizing pricing methodologies which consider similar factors that would be used by third party pricing vendors. Debt securities are generally categorized as Level 2 in the hierarchy but may be Level 3 depending on the circumstances.
Investments in open-end mutual funds, including the Fidelity Central Funds, are valued at their closing net asset value (NAV) each business day and are categorized as Level 1 in the hierarchy.
Changes in valuation techniques may result in transfers in or out of an assigned level within the disclosure hierarchy. The aggregate value of investments by input level as of October 31, 2020 is included at the end of the Fund's Schedule of Investments.
Foreign Currency. Certain Funds may use foreign currency contracts to facilitate transactions in foreign-denominated securities. Gains and losses from these transactions may arise from changes in the value of the foreign currency or if the counterparties do not perform under the contracts' terms.
Foreign-denominated assets, including investment securities, and liabilities are translated into U.S. dollars at the exchange rates at period end. Purchases and sales of investment securities, income and dividends received, and expenses denominated in foreign currencies are translated into U.S. dollars at the exchange rate in effect on the transaction date.
The effects of exchange rate fluctuations on investments are included with the net realized and unrealized gain (loss) on investment securities. Other foreign currency transactions resulting in realized and unrealized gain (loss) are disclosed separately.
Investment Transactions and Income. For financial reporting purposes, the Fund's investment holdings and NAV include trades executed through the end of the last business day of the period. The NAV per share for processing shareholder transactions is calculated as of the close of business of the New York Stock Exchange (NYSE), normally 4:00 p.m. Eastern time and includes trades executed through the end of the prior business day. Gains and losses on securities sold are determined on the basis of identified cost and include proceeds received from litigation. Dividend income is recorded on the ex-dividend date, except for certain dividends from foreign securities where the ex-dividend date may have passed, which are recorded as soon as the Fund is informed of the ex-dividend date. Non-cash dividends included in dividend income, if any, are recorded at the fair market value of the securities received. Income and capital gain distributions from Fidelity Central Funds, if any, are recorded on the ex-dividend date. Certain distributions received by the Fund represent a return of capital or capital gain. The Fund determines the components of these distributions subsequent to the ex-dividend date, based upon receipt of tax filings or other correspondence relating to the underlying investment. These distributions are recorded as a reduction of cost of investments and/or as a realized gain. Interest income is accrued as earned and includes coupon interest and amortization of premium and accretion of discount on debt securities as applicable. Investment income is recorded net of foreign taxes withheld where recovery of such taxes is uncertain.
Class Allocations and Expenses. Investment income, realized and unrealized capital gains and losses, common expenses of the Fund, and certain fund-level expense reductions, if any, are allocated daily on a pro-rata basis to each class based on the relative net assets of each class to the total net assets of the Fund. Each class differs with respect to transfer agent and distribution and service plan fees incurred. Certain expense reductions may also differ by class. For the reporting period, the allocated portion of income and expenses to each class as a percent of its average net assets may vary due to the timing of recording these transactions in relation to fluctuating net assets of the classes. Expenses directly attributable to a fund are charged to that fund. Expenses attributable to more than one fund are allocated among the respective funds on the basis of relative net assets or other appropriate methods. Expense estimates are accrued in the period to which they relate and adjustments are made when actual amounts are known.
Income Tax Information and Distributions to Shareholders. Each year, the Fund intends to qualify as a regulated investment company under Subchapter M of the Internal Revenue Code, including distributing substantially all of its taxable income and realized gains. As a result, no provision for U.S. Federal income taxes is required. As of October 31, 2020, the Fund did not have any unrecognized tax benefits in the financial statements; nor is the Fund aware of any tax positions for which it is reasonably possible that the total amounts of unrecognized tax benefits will significantly change in the next twelve months. The Fund files a U.S. federal tax return, in addition to state and local tax returns as required. The Fund's federal income tax returns are subject to examination by the Internal Revenue Service (IRS) for a period of three fiscal years after they are filed. State and local tax returns may be subject to examination for an additional fiscal year depending on the jurisdiction. Foreign taxes are provided for based on the Fund's understanding of the tax rules and rates that exist in the foreign markets in which it invests.
Distributions are declared and recorded on the ex-dividend date. Income and capital gain distributions are declared separately for each class. Income and capital gain distributions are determined in accordance with income tax regulations, which may differ from GAAP. In addition, the Fund claimed a portion of the payment made to redeeming shareholders as a distribution for income tax purposes.
Capital accounts within the financial statements are adjusted for permanent book-tax differences. These adjustments have no impact on net assets or the results of operations. Capital accounts are not adjusted for temporary book-tax differences which will reverse in a subsequent period.
Book-tax differences are primarily due to foreign currency transactions, passive foreign investment companies (PFIC), market discount and losses deferred due to wash sales.
As of period end, the cost and unrealized appreciation (depreciation) in securities, and derivatives if applicable, for federal income tax purposes were as follows:
| Gross unrealized appreciation | $251,552,669 |
| Gross unrealized depreciation | (78,833,580) |
| Net unrealized appreciation (depreciation) | $172,719,089 |
| Tax Cost | $499,525,745 |
The tax-based components of distributable earnings as of period end were as follows:
| Undistributed ordinary income | $11,806,915 |
| Undistributed long-term capital gain | $5,658,411 |
| Net unrealized appreciation (depreciation) on securities and other investments | $172,710,049 |
The tax character of distributions paid was as follows:
| | October 31, 2020 | October 31, 2019 |
| Ordinary Income | $15,760,276 | $ 10,899,530 |
| Long-term Capital Gains | 22,932,453 | 50,976,469 |
| Total | $38,692,729 | $ 61,875,999 |
Restricted Securities (including Private Placements). The Fund may invest in securities that are subject to legal or contractual restrictions on resale. These securities generally may be resold in transactions exempt from registration or to the public if the securities are registered. Disposal of these securities may involve time-consuming negotiations and expense, and prompt sale at an acceptable price may be difficult. Information regarding restricted securities is included at the end of the Fund's Schedule of Investments.
4. Purchases and Sales of Investments.
Purchases and sales of securities, other than short-term securities, are noted in the table below.
| | Purchases ($) | Sales ($) |
| Fidelity Canada Fund | 87,320,704 | 220,683,222 |
5. Fees and Other Transactions with Affiliates.
Management Fee. Fidelity Management & Research Company LLC (the investment adviser) and its affiliates provide the Fund with investment management related services for which the Fund pays a monthly management fee. The management fee is the sum of an individual fund fee rate that is based on an annual rate of .45% of the Fund's average net assets and an annualized group fee rate that averaged .23% during the period. The group fee rate is based upon the monthly average net assets of a group of registered investment companies with which the investment adviser has management contracts. The group fee rate decreases as assets under management increase and increases as assets under management decrease. In addition, the management fee is subject to a performance adjustment (up to a maximum of +/- .20% of the Fund's average net assets over a 36 month performance period). The upward or downward adjustment to the management fee is based on the relative investment performance of Canada as compared to its benchmark index, the S&P/TSX Composite Index, over the same 36 month performance period. For the reporting period, the total annual management fee rate, including the performance adjustment, was .60% of the Fund's average net assets. The performance adjustment included in the management fee rate may be higher or lower than the maximum performance adjustment rate due to the difference between the average net assets for the reporting and performance periods.
Distribution and Service Plan Fees. In accordance with Rule 12b-1 of the 1940 Act, the Fund has adopted separate Distribution and Service Plans for each class of shares. Certain classes pay Fidelity Distributors Company LLC (FDC), an affiliate of the investment adviser, separate Distribution and Service Fees, each of which is based on an annual percentage of each class' average net assets. In addition, FDC may pay financial intermediaries for selling shares of the Fund and providing shareholder support services. For the period, the Distribution and Service Fee rates, total fees and amounts retained by FDC were as follows:
| | Distribution Fee | Service Fee | Total Fees | Retained by FDC |
| Class A | -% | .25% | $66,485 | $595 |
| Class M | .25% | .25% | 35,684 | 304 |
| Class C | .75% | .25% | 44,367 | 983 |
| | | | $146,536 | $1,882 |
Sales Load. FDC may receive a front-end sales charge of up to 5.75% for selling Class A shares and 3.50% for selling Class M shares, some of which is paid to financial intermediaries for selling shares of the Fund. Depending on the holding period, FDC may receive contingent deferred sales charges levied on Class A, Class M and Class C redemptions. The deferred sales charges are 1.00% for Class C shares, 1.00% for certain purchases of Class A shares and .25% for certain purchases of Class M shares.
For the period, sales charge amounts retained by FDC were as follows:
| | Retained by FDC |
| Class A | $1,846 |
| Class M | 665 |
| Class C(a) | 167 |
| | $2,678 |
(a) When Class C shares are initially sold, FDC pays commissions from its own resources to financial intermediaries through which the sales are made.
Transfer Agent Fees. Fidelity Investments Institutional Operations Company LLC (FIIOC), an affiliate of the investment adviser, is the transfer, dividend disbursing and shareholder servicing agent for each class of the Fund. FIIOC receives account fees and asset-based fees that vary according to the account size and type of account of the shareholders of the respective classes of the Fund, except for Class Z. FIIOC receives an asset-based fee of Class Z's average net assets. FIIOC pays for typesetting, printing and mailing of shareholder reports, except proxy statements. Effective February 1, 2020, the Board approved to change the fee for Class Z from .046% to .044%.
For the period, transfer agent fees for each class were as follows:
| | Amount | % of Class-Level Average Net Assets |
| Class A | $72,088 | .27 |
| Class M | 20,770 | .29 |
| Class C | 11,816 | .27 |
| Canada | 1,432,672 | .21 |
| Class I | 18,836 | .14 |
| Class Z | 7,605 | .04 |
| | $1,563,787 | |
Accounting Fees. Fidelity Service Company, Inc. (FSC), an affiliate of the investment adviser, maintains the Fund's accounting records. The accounting fee is based on the level of average net assets for each month. For the period, the fees were equivalent to the following annual rates:
| | % of Average Net Assets |
| Fidelity Canada Fund | .05 |
Brokerage Commissions. A portion of portfolio transactions were placed with brokerage firms which are affiliates of the investment adviser. Brokerage commissions are included in net realized gain (loss) and change in net unrealized appreciation (depreciation) in the Statement of Operations. The commissions paid to these affiliated firms were as follows:
| | Amount |
| Fidelity Canada Fund | $51 |
Interfund Trades. Funds may purchase from or sell securities to other Fidelity Funds under procedures adopted by the Board. The procedures have been designed to ensure these interfund trades are executed in accordance with Rule 17a-7 of the 1940 Act. Interfund trades are included within the respective purchases and sales amounts shown in the Purchases and Sales of Investments note.
Prior Fiscal Year Affiliated Redemptions In-Kind. During the prior period, 1,326,664 shares of the Fund were redeemed in-kind for investments and cash with a value of $69,285,297. The
Fund had a net realized gain of $25,479,297 on investments delivered through in-kind redemptions. The amount of the in-kind redemptions is included in share transactions in the accompanying Statement of Changes in Net Assets as well as the Notes to Financial Statements. The Fund recognized no gain or loss for federal income tax purposes.
6. Committed Line of Credit.
Certain Funds participate with other funds managed by the investment adviser or an affiliate in a $4.25 billion credit facility (the "line of credit") to be utilized for temporary or emergency purposes to fund shareholder redemptions or for other short-term liquidity purposes. The participating funds have agreed to pay commitment fees on their pro-rata portion of the line of credit, which are reflected in Miscellaneous expenses on the Statement of Operations, and are as follows:
| | Amount |
| Fidelity Canada Fund | $1,866 |
During the period, there were no borrowings on this line of credit.
7. Security Lending.
Funds lend portfolio securities from time to time in order to earn additional income. Lending agents are used, including National Financial Services (NFS), an affiliate of the investment adviser. Pursuant to a securities lending agreement, NFS will receive a fee, which is capped at 9.9% of a fund's daily lending revenue, for its services as lending agent. A fund may lend securities to certain qualified borrowers, including NFS. On the settlement date of the loan, a fund receives collateral (in the form of U.S. Treasury obligations, letters of credit and/or cash) against the loaned securities and maintains collateral in an amount not less than 100% of the market value of the loaned securities during the period of the loan. The market value of the loaned securities is determined at the close of business of a fund and any additional required collateral is delivered to a fund on the next business day. A fund or borrower may terminate the loan at any time, and if the borrower defaults on its obligation to return the securities loaned because of insolvency or other reasons, a fund may apply collateral received from the borrower against the obligation. A fund may experience delays and costs in recovering the securities loaned. Any cash collateral received is invested in the Fidelity Securities Lending Cash Central Fund. Any loaned securities are identified as such in the Schedule of Investments, and the value of loaned securities and cash collateral at period end, as applicable, are presented in the Statement of Assets and Liabilities. Security lending income represents the income earned on investing cash collateral, less rebates paid to borrowers and any lending agent fees associated with the loan, plus any premium payments received for lending certain types of securities. Security lending income is presented in the Statement of Operations as a component of income from Fidelity Central Funds. Affiliated security lending activity, if any, was as follows:
| | Total Security Lending Income Fees Paid to NFS | Security Lending Income From Securities Loaned to NFS | Value of Securities Loaned to NFS at Period End |
| Fidelity Canada Fund | $31 | $– | $– |
8. Expense Reductions.
Commissions paid to certain brokers with whom the investment adviser, or its affiliates, places trades on behalf of the Fund include an amount in addition to trade execution, which may be rebated back to the Fund to offset certain expenses. This amount totaled $9,385 for the period.
In addition, during the period the investment adviser or an affiliate reimbursed and/or waived a portion of fund-level operating expenses in the amount of $3,597.
In addition, during the period the investment adviser or an affiliate reimbursed the Fund $7,050 for an operational error which is included in the accompanying Statement of Operations.
9. Distributions to Shareholders.
Distributions to shareholders of each class were as follows:
| | Year ended
October 31, 2020 | Year ended
October 31, 2019 |
| Distributions to shareholders | | |
| Class A | $1,268,788 | $1,725,249 |
| Class M | 336,513 | 438,995 |
| Class C | 180,277 | 599,233 |
| Canada | 35,323,208 | 57,337,031 |
| Class I | 642,320 | 1,761,950 |
| Class Z | 941,623 | 13,541 |
| Total | $38,692,729 | $61,875,999 |
10. Share Transactions.
Share transactions for each class were as follows and may contain automatic conversions between classes or exchanges between affiliated funds:
| | Shares | Shares | Dollars | Dollars |
| | Year ended October 31, 2020 | Year ended October 31, 2019 | Year ended October 31, 2020 | Year ended October 31, 2019 |
| Class A | | | | |
| Shares sold | 46,439 | 95,319 | $2,172,552 | $4,762,032 |
| Reinvestment of distributions | 22,901 | 34,965 | 1,177,102 | 1,594,742 |
| Shares redeemed | (149,855) | (132,619) | (7,199,345) | (6,599,280) |
| Net increase (decrease) | (80,515) | (2,335) | $(3,849,691) | $(242,506) |
| Class M | | | | |
| Shares sold | 8,286 | 24,151 | $397,961 | $1,232,542 |
| Reinvestment of distributions | 6,547 | 9,616 | 335,323 | 437,340 |
| Shares redeemed | (51,867) | (26,108) | (2,210,068) | (1,303,095) |
| Net increase (decrease) | (37,034) | 7,659 | $(1,476,784) | $366,787 |
| Class C | | | | |
| Shares sold | 3,703 | 5,030 | $167,936 | $242,358 |
| Reinvestment of distributions | 3,299 | 12,492 | 166,843 | 558,623 |
| Shares redeemed | (59,945) | (125,453) | (2,760,164) | (6,065,682) |
| Net increase (decrease) | (52,943) | (107,931) | $(2,425,385) | $(5,264,701) |
| Canada | | | | |
| Shares sold | 395,512 | 720,245 | $18,632,031 | $35,658,625 |
| Reinvestment of distributions | 643,578 | 1,185,764 | 33,163,571 | 54,201,287 |
| Shares redeemed | (3,185,779) | (4,577,840)(a) | (150,419,840) | (231,547,759)(a) |
| Net increase (decrease) | (2,146,689) | (2,671,831) | $(98,624,238) | $(141,687,847) |
| Class I | | | | |
| Shares sold | 161,893 | 739,392 | $7,404,128 | $35,133,991 |
| Reinvestment of distributions | 11,916 | 37,998 | 613,432 | 1,732,719 |
| Shares redeemed | (270,737) | (1,038,167)(a) | (12,875,085) | (52,836,490)(a) |
| Net increase (decrease) | (96,928) | (260,777) | $(4,857,525) | $(15,969,780) |
| Class Z | | | | |
| Shares sold | 39,258 | 412,219 | $1,907,626 | $20,955,321 |
| Reinvestment of distributions | 18,328 | 266 | 939,856 | 12,119 |
| Shares redeemed | (121,084) | (21,441) | (5,692,032) | (1,105,326) |
| Net increase (decrease) | (63,498) | 391,044 | $(2,844,550) | $19,862,114 |
(a) Amount includes in-kind redemptions (see the Prior Fiscal Year Affiliated Redemptions In-Kind note for additional details).
11. Other.
The Fund's organizational documents provide former and current trustees and officers with a limited indemnification against liabilities arising in connection with the performance of their duties to the Fund. In the normal course of business, the Fund may also enter into contracts that provide general indemnifications. The Fund's maximum exposure under these arrangements is unknown as this would be dependent on future claims that may be made against the Fund. The risk of material loss from such claims is considered remote.
12. Coronavirus (COVID-19) Pandemic.
An outbreak of COVID-19 first detected in China during December 2019 has since spread globally and was declared a pandemic by the World Health Organization during March 2020. Developments that disrupt global economies and financial markets, such as the COVID-19 pandemic, may magnify factors that affect the Fund's performance.
Fidelity® China Region Fund
Performance: The Bottom Line
Average annual total return reflects the change in the value of an investment, assuming reinvestment of distributions from dividend income and capital gains (the profits earned upon the sale of securities that have grown in value, if any) and assuming a constant rate of performance each year. The hypothetical investment and the average annual total returns do not reflect the deduction of taxes that a shareholder would pay on fund distributions or the redemption of fund shares. During periods of reimbursement by Fidelity, a fund’s total return will be greater than it would be had the reimbursement not occurred. How a fund did yesterday is no guarantee of how it will do tomorrow.
Average Annual Total Returns
| For the periods ended October 31, 2020 | Past 1 year | Past 5 years | Past 10 years |
| Class A (incl. 5.75% sales charge) | 34.32% | 13.92% | 8.97% |
| Class M (incl. 3.50% sales charge) | 37.07% | 14.08% | 8.89% |
| Class C (incl. contingent deferred sales charge) | 40.46% | 14.43% | 8.81% |
| Fidelity® China Region Fund | 42.95% | 15.63% | 9.97% |
| Class I | 42.91% | 15.62% | 9.97% |
| Class Z | 43.13% | 15.69% | 10.00% |
The initial offering of Class Z shares took place on October 2, 2018. Returns prior to October 2, 2018, are those of Class I.
$10,000 Over 10 Years
Let's say hypothetically that $10,000 was invested in Fidelity® China Region Fund, a class of the fund, on October 31, 2010, and the current % sales charge was paid.
The chart shows how the value of your investment would have changed, and also shows how the MSCI Golden Dragon Index performed over the same period.

| Period Ending Values |
| $25,858 | Fidelity® China Region Fund |
| $20,285 | MSCI Golden Dragon Index |
Fidelity® China Region Fund
Management's Discussion of Fund Performance
Market Recap: The MSCI ACWI (All Country World Index) ex USA Index returned -2.46% for the 12 months ending October 31, 2020, in what was a bumpy ride for non-U.S. equities, marked by a steep but brief decline due to the early-2020 outbreak and spread of the coronavirus, followed by a sharp upturn. Declared a pandemic on March 11, the crisis and containment efforts caused broad contraction in economic activity, elevated volatility and dislocation in financial markets. A historically rapid and expansive monetary- and fiscal-policy response around the world provided a partial offset to the economic disruption. Other supporting factors included resilient corporate earnings and near-term potential for a COVID-19 vaccine breakthrough. This was evident in the index’s 12.28% gain in the final six months of the year. Currency fluctuation generally boosted foreign developed-markets equities for the year, while the reverse was true for emerging-markets stocks. Late in the period, the index was pressured by a second wave of COVID-19 cases in some regions, and stretched valuations and crowded positioning in big tech. For the full year, the U.K. (-22%), Asia Pacific ex Japan (-8%), Canada (-5%) and Europe ex U.K. (-4%) notably lagged. Emerging markets (+9%) and Japan (+1%) outperformed. By sector, energy (-38%), financials and real estate (-20% each) lagged, whereas information technology (+ 25%) and communication services (+15%) topped the index.
Comments from Co-Managers Stephen Lieu and Ivan Xie: For the fiscal year ending October 31, 2020, the fund's share classes (excluding sales charges, if applicable) gained about 41% to 43%, outperforming the 26.58% result of the benchmark MSCI Golden Dragon Index. From a country standpoint, stock picks in China and an underweighting in Hong Kong contributed the most to the fund's relative result. By sector, the top contributor to performance versus the benchmark was stock picking in communication services, primarily driven by the media & entertainment industry. An overweighting in the consumer discretionary sector, especially within the retailing industry, also boosted the fund's relative result. Also lifting the fund's relative result was an underweighting in financials, primarily driven by the banking industry. The fund's largest individual relative contributor was an overweighting in Tencent Holdings, which gained about 87% the past 12 months. It was the fund's largest holding, on average. Also helping performance was our outsized stake in Pinduoduo, which gained roughly 121%. We decreased the fund’s Pinduoduo position by period end. In contrast, choices in the consumer discretionary, financials, and energy sectors detracted from the fund's relative result, as did picks in Hong Kong. Looking at individual stocks, it hurt to overweight China Oilfield Services (-56%), avoid strong-performing benchmark component JD.com (+162%), and underweight benchmark position Taiwan Semiconductor (+58%).
The views expressed above reflect those of the portfolio manager(s) only through the end of the period as stated on the cover of this report and do not necessarily represent the views of Fidelity or any other person in the Fidelity organization. Any such views are subject to change at any time based upon market or other conditions and Fidelity disclaims any responsibility to update such views. These views may not be relied on as investment advice and, because investment decisions for a Fidelity fund are based on numerous factors, may not be relied on as an indication of trading intent on behalf of any Fidelity fund.
Fidelity® China Region Fund
Investment Summary (Unaudited)
Geographic Diversification (% of fund's net assets)
| As of October 31, 2020 |
| | Cayman Islands | 47.2% |
| | China | 17.8% |
| | Taiwan | 11.1% |
| | Hong Kong | 7.0% |
| | United States of America* | 5.7% |
| | Korea (South) | 4.5% |
| | Bermuda | 1.7% |
| | Netherlands | 1.1% |
| | Sweden | 1.0% |
| | Other | 2.9% |

* Includes Short-Term investments and Net Other Assets (Liabilities).
Percentages are based on country or territory of incorporation and are adjusted for the effect of futures contracts, if applicable.
Asset Allocation as of October 31, 2020
| | % of fund's net assets |
| Stocks | 97.7 |
| Short-Term Investments and Net Other Assets (Liabilities) | 2.3 |
Top Ten Stocks as of October 31, 2020
| | % of fund's net assets |
| Tencent Holdings Ltd. (Interactive Media & Services) | 13.9 |
| Alibaba Group Holding Ltd. sponsored ADR (Internet & Direct Marketing Retail) | 13.5 |
| Taiwan Semiconductor Manufacturing Co. Ltd. (Semiconductors & Semiconductor Equipment) | 6.4 |
| AIA Group Ltd. (Insurance) | 3.5 |
| China Construction Bank Corp. (H Shares) (Banks) | 2.3 |
| Meituan Class B (Internet & Direct Marketing Retail) | 2.1 |
| MediaTek, Inc. (Semiconductors & Semiconductor Equipment) | 2.0 |
| New Oriental Education & Technology Group, Inc. sponsored ADR (Diversified Consumer Services) | 1.7 |
| Industrial & Commercial Bank of China Ltd. (H Shares) (Banks) | 1.6 |
| SK Hynix, Inc. (Semiconductors & Semiconductor Equipment) | 1.6 |
| | 48.6 |
Top Market Sectors as of October 31, 2020
| | % of fund's net assets |
| Consumer Discretionary | 27.5 |
| Information Technology | 21.5 |
| Communication Services | 17.8 |
| Financials | 10.5 |
| Health Care | 5.9 |
| Materials | 4.3 |
| Real Estate | 3.7 |
| Industrials | 3.3 |
| Consumer Staples | 1.6 |
| Utilities | 1.0 |
Market Sectors may include more than one industry category.
The Fund may invest up to 35% of its total assets in any industry that represents more than 20% of the Hong Kong, Taiwanese and Chinese markets. As of October 31, 2020, the Fund did not have more than 25% of its total assets invested in any one industry.
Fidelity® China Region Fund
Schedule of Investments October 31, 2020
Showing Percentage of Net Assets
| Common Stocks - 96.3% | | | |
| | | Shares | Value |
| COMMUNICATION SERVICES - 17.8% | | | |
| Entertainment - 2.7% | | | |
| Bilibili, Inc. ADR (a)(b) | | 496,700 | $22,187,589 |
| DouYu International Holdings Ltd. ADR (a) | | 1,124,400 | 17,203,320 |
| iQIYI, Inc. ADR (a) | | 272,400 | 6,728,280 |
| | | | 46,119,189 |
| Interactive Media & Services - 15.1% | | | |
| Momo, Inc. ADR | | 396,700 | 5,950,500 |
| Tencent Holdings Ltd. | | 3,101,100 | 236,941,576 |
| YY, Inc. ADR | | 140,234 | 12,814,583 |
| | | | 255,706,659 |
|
| TOTAL COMMUNICATION SERVICES | | | 301,825,848 |
|
| CONSUMER DISCRETIONARY - 27.5% | | | |
| Automobiles - 0.9% | | | |
| Guangzhou Automobile Group Co. Ltd. (H Shares) | | 11,328,000 | 11,616,588 |
| Li Auto, Inc. ADR (a)(b) | | 97,900 | 1,974,643 |
| XPeng, Inc. ADR (a) | | 67,700 | 1,312,026 |
| | | | 14,903,257 |
| Diversified Consumer Services - 1.7% | | | |
| New Oriental Education & Technology Group, Inc. sponsored ADR (a) | | 183,700 | 29,461,806 |
| Hotels, Restaurants & Leisure - 2.3% | | | |
| Sands China Ltd. | | 2,905,600 | 10,175,690 |
| SJM Holdings Ltd. | | 12,978,000 | 13,442,546 |
| Summit Ascent Holdings Ltd. (a) | | 58,410,000 | 6,705,566 |
| Wynn Macau Ltd. (a) | | 6,489,200 | 8,956,393 |
| | | | 39,280,195 |
| Household Durables - 1.1% | | | |
| Gree Electric Appliances, Inc. of Zhuhai (A Shares) | | 2,078,707 | 18,244,487 |
| Internet & Direct Marketing Retail - 18.6% | | | |
| Alibaba Group Holding Ltd. sponsored ADR (a) | | 754,800 | 229,980,012 |
| Ctrip.com International Ltd. ADR(a) | | 414,800 | 11,929,648 |
| Farfetch Ltd. Class A (a) | | 441,000 | 12,405,330 |
| Meituan Class B (a) | | 965,288 | 35,884,683 |
| momo.com, Inc. | | 238,000 | 5,690,237 |
| Pinduoduo, Inc. ADR (a) | | 232,905 | 20,956,792 |
| | | | 316,846,702 |
| Leisure Products - 0.3% | | | |
| Bafang Electric Suzhou Co. Ltd. (A Shares) | | 150,700 | 4,155,061 |
| Specialty Retail - 0.1% | | | |
| Dufry AG (a) | | 46,323 | 1,752,994 |
| Textiles, Apparel & Luxury Goods - 2.5% | | | |
| Anhui Korrun Co. Ltd. (A Shares) | | 2,814,731 | 12,933,410 |
| Compagnie Financiere Richemont SA Series A | | 223,140 | 13,947,098 |
| LVMH Moet Hennessy Louis Vuitton SE | | 33,900 | 15,890,546 |
| | | | 42,771,054 |
|
| TOTAL CONSUMER DISCRETIONARY | | | 467,415,556 |
|
| CONSUMER STAPLES - 1.6% | | | |
| Beverages - 1.4% | | | |
| Kweichow Moutai Co. Ltd. (A Shares) | | 94,445 | 23,623,253 |
| Tobacco - 0.2% | | | |
| Smoore International Holdings Ltd. (a)(c) | | 759,000 | 3,950,422 |
|
| TOTAL CONSUMER STAPLES | | | 27,573,675 |
|
| ENERGY - 0.6% | | | |
| Energy Equipment & Services - 0.6% | | | |
| China Oilfield Services Ltd. (H Shares) | | 17,780,000 | 10,687,494 |
| FINANCIALS - 10.5% | | | |
| Banks - 4.5% | | | |
| China Construction Bank Corp. (H Shares) | | 55,877,000 | 38,505,586 |
| Dah Sing Banking Group Ltd. | | 2,852,000 | 2,450,090 |
| E.SUN Financial Holdings Co. Ltd. | | 9,150,048 | 7,771,896 |
| Industrial & Commercial Bank of China Ltd. (H Shares) | | 48,991,000 | 27,820,253 |
| | | | 76,547,825 |
| Consumer Finance - 0.3% | | | |
| LexinFintech Holdings Ltd. ADR (a) | | 540,609 | 4,454,618 |
| Insurance - 5.7% | | | |
| AIA Group Ltd. | | 6,318,200 | 60,131,424 |
| China Life Insurance Co. Ltd. | | 8,421,700 | 5,637,231 |
| China Life Insurance Co. Ltd. (H Shares) | | 6,493,000 | 14,167,242 |
| China Pacific Insurance (Group) Co. Ltd. (H Shares) | | 1,333,000 | 4,152,461 |
| Ping An Insurance Group Co. of China Ltd. (H Shares) | | 1,302,000 | 13,462,255 |
| | | | 97,550,613 |
|
| TOTAL FINANCIALS | | | 178,553,056 |
|
| HEALTH CARE - 5.7% | | | |
| Biotechnology - 2.7% | | | |
| Akeso, Inc. (c) | | 5,755,000 | 18,038,891 |
| Innovent Biologics, Inc. (a)(c) | | 1,872,500 | 13,815,801 |
| Shenzhen New Industries Biomedical Engineering Co. Ltd. | | 324,400 | 8,293,240 |
| Zai Lab Ltd. (a) | | 66,600 | 5,541,051 |
| | | | 45,688,983 |
| Health Care Equipment & Supplies - 0.9% | | | |
| Kangji Medical Holdings Ltd. | | 1,231,000 | 3,182,895 |
| Shenzhen Mindray Bio-Medical Electronics Co. Ltd. (A Shares) | | 167,315 | 9,696,046 |
| Venus MedTech Hangzhou, Inc. (H Shares) (a)(c) | | 218,500 | 2,101,151 |
| | | | 14,980,092 |
| Life Sciences Tools & Services - 0.4% | | | |
| Hangzhou Tigermed Consulting Co. Ltd. (H Shares) (a)(c) | | 78,400 | 1,259,052 |
| Pharmaron Beijing Co. Ltd. (H Shares) (c) | | 385,200 | 5,559,997 |
| | | | 6,819,049 |
| Pharmaceuticals - 1.7% | | | |
| Hansoh Pharmaceutical Group Co. Ltd. (a)(c) | | 4,460,000 | 19,876,556 |
| Hua Medicine (a)(c) | | 4,283,000 | 2,336,935 |
| Sino Biopharmaceutical Ltd. | | 7,584,000 | 7,650,033 |
| | | | 29,863,524 |
|
| TOTAL HEALTH CARE | | | 97,351,648 |
|
| INDUSTRIALS - 3.3% | | | |
| Air Freight & Logistics - 1.4% | | | |
| ZTO Express, Inc. (a) | | 769,900 | 22,761,829 |
| Machinery - 1.4% | | | |
| Anhui Heli Co. Ltd. ELS (UBS AG London Branch Bank Warrant Program) Class A warrants 1/21/22 (a)(c) | | 999,376 | 2,114,486 |
| HIWIN Technologies Corp. | | 1,320,820 | 11,495,829 |
| Shenzhen Inovance Technology Co. Ltd. (A Shares) | | 1,124,209 | 10,819,424 |
| | | | 24,429,739 |
| Professional Services - 0.5% | | | |
| Guangzhou GRG Metrology & Test Co. Ltd. ELS (UBS AG London Branch Bank Warrant Program) Class A warrants 1/13/21 (a)(c) | | 1,926,391 | 8,782,362 |
|
| TOTAL INDUSTRIALS | | | 55,973,930 |
|
| INFORMATION TECHNOLOGY - 20.3% | | | |
| Communications Equipment - 1.0% | | | |
| Ericsson (B Shares) sponsored ADR | | 1,466,900 | 16,443,949 |
| Electronic Equipment & Components - 2.9% | | | |
| AVIC Jonhon OptronicTechnology Co. Ltd. | | 2,363,022 | 19,605,549 |
| Largan Precision Co. Ltd. | | 101,000 | 10,679,332 |
| Sunny Optical Technology Group Co. Ltd. | | 1,097,300 | 18,145,612 |
| | | | 48,430,493 |
| IT Services - 0.9% | | | |
| TravelSky Technology Ltd. (H Shares) | | 7,260,000 | 15,245,766 |
| Semiconductors & Semiconductor Equipment - 13.3% | | | |
| ASM Pacific Technology Ltd. | | 711,300 | 7,156,582 |
| eMemory Technology, Inc. | | 191,000 | 3,805,446 |
| MediaTek, Inc. | | 1,408,000 | 33,367,961 |
| Micron Technology, Inc. (a) | | 529,300 | 26,644,962 |
| NXP Semiconductors NV | | 141,270 | 19,088,402 |
| SK Hynix, Inc. | | 389,880 | 27,598,525 |
| Taiwan Semiconductor Manufacturing Co. Ltd. | | 7,201,000 | 108,927,845 |
| | | | 226,589,723 |
| Software - 0.7% | | | |
| Beijing Shiji Information Technology Co. Ltd. (A Shares) | | 882,527 | 4,884,314 |
| China Youzan Ltd. (a) | | 19,408,000 | 4,581,314 |
| Ming Yuan Cloud Group Holdings Ltd. | | 474,500 | 2,025,921 |
| | | | 11,491,549 |
| Technology Hardware, Storage & Peripherals - 1.5% | | | |
| Canaan, Inc. ADR (b) | | 2,714,809 | 5,918,284 |
| Samsung Electronics Co. Ltd. | | 310,370 | 15,566,715 |
| Xiaomi Corp. Class B (a)(c) | | 1,566,800 | 4,456,034 |
| | | | 25,941,033 |
|
| TOTAL INFORMATION TECHNOLOGY | | | 344,142,513 |
|
| MATERIALS - 4.3% | | | |
| Chemicals - 0.8% | | | |
| LG Chemical Ltd. | | 25,138 | 13,677,207 |
| Construction Materials - 1.5% | | | |
| China Jushi Co. Ltd. (A Shares) | | 7,969,705 | 16,659,042 |
| West China Cement Ltd. | | 57,872,000 | 8,584,689 |
| | | | 25,243,731 |
| Containers & Packaging - 0.9% | | | |
| Greatview Aseptic Pack Co. Ltd. | | 20,422,000 | 8,745,700 |
| Shenzhen YUTO Packaging Technology Co. Ltd. (A Shares) | | 1,659,825 | 7,356,414 |
| | | | 16,102,114 |
| Metals & Mining - 1.1% | | | |
| Zijin Mining Group Co. Ltd. (H Shares) | | 25,466,000 | 18,428,154 |
|
| TOTAL MATERIALS | | | 73,451,206 |
|
| REAL ESTATE - 3.7% | | | |
| Equity Real Estate Investment Trusts (REITs) - 0.6% | | | |
| Link (REIT) | | 1,293,463 | 9,852,175 |
| Real Estate Management & Development - 3.1% | | | |
| China Overseas Land and Investment Ltd. | | 6,808,000 | 17,036,466 |
| KE Holdings, Inc. ADR (a) | | 134,400 | 9,374,400 |
| Longfor Properties Co. Ltd. (c) | | 1,855,500 | 10,136,140 |
| Shimao Property Holdings Ltd. | | 1,792,000 | 6,321,986 |
| Shimao Services Holdings Ltd. (a)(c) | | 29,377 | 62,903 |
| Sun Hung Kai Properties Ltd. | | 827,000 | 10,644,995 |
| | | | 53,576,890 |
|
| TOTAL REAL ESTATE | | | 63,429,065 |
|
| UTILITIES - 1.0% | | | |
| Gas Utilities - 1.0% | | | |
| China Gas Holdings Ltd. | | 5,200,932 | 15,933,200 |
| TOTAL COMMON STOCKS | | | |
| (Cost $986,716,259) | | | 1,636,337,191 |
|
| Preferred Stocks - 1.4% | | | |
| Convertible Preferred Stocks - 0.2% | | | |
| HEALTH CARE - 0.2% | | | |
| Pharmaceuticals - 0.2% | | | |
| Antengene Corp. Series C1 (d)(e) | | 1,094,111 | 3,091,833 |
| Nonconvertible Preferred Stocks - 1.2% | | | |
| INFORMATION TECHNOLOGY - 1.2% | | | |
| Technology Hardware, Storage & Peripherals - 1.2% | | | |
| Samsung Electronics Co. Ltd. | | 486,190 | 21,580,666 |
| TOTAL PREFERRED STOCKS | | | |
| (Cost $19,064,728) | | | 24,672,499 |
|
| Money Market Funds - 2.7% | | | |
| Fidelity Cash Central Fund 0.10% (f) | | 31,707,104 | 31,713,446 |
| Fidelity Securities Lending Cash Central Fund 0.11% (f)(g) | | 14,461,887 | 14,463,334 |
| TOTAL MONEY MARKET FUNDS | | | |
| (Cost $46,176,780) | | | 46,176,780 |
| TOTAL INVESTMENT IN SECURITIES - 100.4% | | | |
| (Cost $1,051,957,767) | | | 1,707,186,470 |
| NET OTHER ASSETS (LIABILITIES) - (0.4)% | | | (7,334,949) |
| NET ASSETS - 100% | | | $1,699,851,521 |
Security Type Abbreviations
ELS – Equity-Linked Security
Legend
(a) Non-income producing
(b) Security or a portion of the security is on loan at period end.
(c) Security exempt from registration under Rule 144A of the Securities Act of 1933. These securities may be resold in transactions exempt from registration, normally to qualified institutional buyers. At the end of the period, the value of these securities amounted to $92,490,730 or 5.4% of net assets.
(d) Restricted securities (including private placements) - Investment in securities not registered under the Securities Act of 1933 (excluding 144A issues). At the end of the period, the value of restricted securities (excluding 144A issues) amounted to $3,091,833 or 0.2% of net assets.
(e) Level 3 security
(f) Affiliated fund that is generally available only to investment companies and other accounts managed by Fidelity Investments. The rate quoted is the annualized seven-day yield of the fund at period end. A complete unaudited listing of the fund's holdings as of its most recent quarter end is available upon request. In addition, each Fidelity Central Fund's financial statements, which are not covered by the Fund's Report of Independent Registered Public Accounting Firm, are available on the SEC's website or upon request.
(g) Investment made with cash collateral received from securities on loan.
Additional information on each restricted holding is as follows:
| Security | Acquisition Date | Acquisition Cost |
| Antengene Corp. Series C1 | 7/11/20 | $3,091,833 |
Affiliated Central Funds
Information regarding fiscal year to date income earned by the Fund from investments in Fidelity Central Funds is as follows:
| Fund | Income earned |
| Fidelity Cash Central Fund | $107,760 |
| Fidelity Securities Lending Cash Central Fund | 328,206 |
| Total | $435,966 |
Amounts in the income column in the above table include any capital gain distributions from underlying funds, which are presented in the corresponding line-item in the Statement of Operations, if applicable. Amount for Fidelity Securities Lending Cash Central Fund represents the income earned on investing cash collateral, less rebates paid to borrowers and any lending agent fees associated with the loan, plus any premium payments received for lending certain types of securities.
Investment Valuation
The following is a summary of the inputs used, as of October 31, 2020, involving the Fund's assets and liabilities carried at fair value. The inputs or methodology used for valuing securities may not be an indication of the risk associated with investing in those securities. For more information on valuation inputs, and their aggregation into the levels used below, please refer to the Investment Valuation section in the accompanying Notes to Financial Statements.
| | Valuation Inputs at Reporting Date: |
| Description | Total | Level 1 | Level 2 | Level 3 |
| Investments in Securities: | | | | |
| Equities: | | | | |
| Communication Services | $301,825,848 | $64,884,272 | $236,941,576 | $-- |
| Consumer Discretionary | 467,415,556 | 402,244,954 | 65,170,602 | -- |
| Consumer Staples | 27,573,675 | 3,950,422 | 23,623,253 | -- |
| Energy | 10,687,494 | 10,687,494 | -- | -- |
| Financials | 178,553,056 | 24,466,296 | 154,086,760 | -- |
| Health Care | 100,443,481 | 76,179,467 | 21,172,181 | 3,091,833 |
| Industrials | 55,973,930 | 34,257,658 | 21,716,272 | -- |
| Information Technology | 365,723,179 | 163,103,531 | 202,619,648 | -- |
| Materials | 73,451,206 | 35,758,543 | 37,692,663 | -- |
| Real Estate | 63,429,065 | 52,784,070 | 10,644,995 | -- |
| Utilities | 15,933,200 | 15,933,200 | -- | -- |
| Money Market Funds | 46,176,780 | 46,176,780 | -- | -- |
| Total Investments in Securities: | $1,707,186,470 | $930,426,687 | $773,667,950 | $3,091,833 |
See accompanying notes which are an integral part of the financial statements.
Fidelity® China Region Fund
Financial Statements
Statement of Assets and Liabilities
| | | October 31, 2020 |
| Assets | | |
Investment in securities, at value (including securities loaned of $13,725,951) — See accompanying schedule:
Unaffiliated issuers (cost $1,005,780,987) | $1,661,009,690 | |
| Fidelity Central Funds (cost $46,176,780) | 46,176,780 | |
| Total Investment in Securities (cost $1,051,957,767) | | $1,707,186,470 |
| Foreign currency held at value (cost $4,750,069) | | 4,750,065 |
| Receivable for investments sold | | 14,528 |
| Receivable for fund shares sold | | 5,031,323 |
| Dividends receivable | | 255,719 |
| Distributions receivable from Fidelity Central Funds | | 8,049 |
| Prepaid expenses | | 2,429 |
| Other receivables | | 93,585 |
| Total assets | | 1,717,342,168 |
| Liabilities | | |
| Payable for investments purchased | $343,407 | |
| Payable for fund shares redeemed | 1,244,015 | |
| Accrued management fee | 947,838 | |
| Distribution and service plan fees payable | 22,505 | |
| Other affiliated payables | 271,770 | |
| Other payables and accrued expenses | 199,236 | |
| Collateral on securities loaned | 14,461,876 | |
| Total liabilities | | 17,490,647 |
| Net Assets | | $1,699,851,521 |
| Net Assets consist of: | | |
| Paid in capital | | $958,832,988 |
| Total accumulated earnings (loss) | | 741,018,533 |
| Net Assets | | $1,699,851,521 |
| Net Asset Value and Maximum Offering Price | | |
| Class A: | | |
| Net Asset Value and redemption price per share ($39,303,036 ÷ 772,160 shares)(a) | | $50.90 |
| Maximum offering price per share (100/94.25 of $50.90) | | $54.01 |
| Class M: | | |
| Net Asset Value and redemption price per share ($12,028,095 ÷ 237,504 shares)(a) | | $50.64 |
| Maximum offering price per share (100/96.50 of $50.64) | | $52.48 |
| Class C: | | |
| Net Asset Value and offering price per share ($11,307,561 ÷ 230,300 shares)(a) | | $49.10 |
| China Region: | | |
| Net Asset Value, offering price and redemption price per share ($1,518,404,228 ÷ 29,467,250 shares) | | $51.53 |
| Class I: | | |
| Net Asset Value, offering price and redemption price per share ($47,687,785 ÷ 932,042 shares) | | $51.16 |
| Class Z: | | |
| Net Asset Value, offering price and redemption price per share ($71,120,816 ÷ 1,392,573 shares) | | $51.07 |
(a) Redemption price per share is equal to net asset value less any applicable contingent deferred sales charge.
See accompanying notes which are an integral part of the financial statements.
Statement of Operations
| | | Year ended October 31, 2020 |
| Investment Income | | |
| Dividends | | $21,182,625 |
| Income from Fidelity Central Funds (including $328,206 from security lending) | | 435,966 |
| Income before foreign taxes withheld | | 21,618,591 |
| Less foreign taxes withheld | | (2,051,251) |
| Total income | | 19,567,340 |
| Expenses | | |
| Management fee | $9,487,856 | |
| Transfer agent fees | 2,259,006 | |
| Distribution and service plan fees | 235,609 | |
| Accounting fees | 629,220 | |
| Custodian fees and expenses | 368,986 | |
| Independent trustees' fees and expenses | 7,631 | |
| Registration fees | 127,910 | |
| Audit | 84,607 | |
| Legal | 2,144 | |
| Interest | 469 | |
| Miscellaneous | 30,732 | |
| Total expenses before reductions | 13,234,170 | |
| Expense reductions | (305,595) | |
| Total expenses after reductions | | 12,928,575 |
| Net investment income (loss) | | 6,638,765 |
| Realized and Unrealized Gain (Loss) | | |
| Net realized gain (loss) on: | | |
| Investment securities: | | |
| Unaffiliated issuers | 91,609,505 | |
| Fidelity Central Funds | 1,664 | |
| Foreign currency transactions | 149,606 | |
| Total net realized gain (loss) | | 91,760,775 |
| Change in net unrealized appreciation (depreciation) on: | | |
| Investment securities: | | |
| Unaffiliated issuers | 397,428,266 | |
| Fidelity Central Funds | 25 | |
| Assets and liabilities in foreign currencies | 697 | |
| Total change in net unrealized appreciation (depreciation) | | 397,428,988 |
| Net gain (loss) | | 489,189,763 |
| Net increase (decrease) in net assets resulting from operations | | $495,828,528 |
See accompanying notes which are an integral part of the financial statements.
Statement of Changes in Net Assets
| | Year ended October 31, 2020 | Year ended October 31, 2019 |
| Increase (Decrease) in Net Assets | | |
| Operations | | |
| Net investment income (loss) | $6,638,765 | $8,621,197 |
| Net realized gain (loss) | 91,760,775 | 44,259,090 |
| Change in net unrealized appreciation (depreciation) | 397,428,988 | 200,242,414 |
| Net increase (decrease) in net assets resulting from operations | 495,828,528 | 253,122,701 |
| Distributions to shareholders | (8,548,175) | (8,434,846) |
| Share transactions - net increase (decrease) | (4,177,297) | (60,489,131) |
| Total increase (decrease) in net assets | 483,103,056 | 184,198,724 |
| Net Assets | | |
| Beginning of period | 1,216,748,465 | 1,032,549,741 |
| End of period | $1,699,851,521 | $1,216,748,465 |
See accompanying notes which are an integral part of the financial statements.
Financial Highlights
Fidelity China Region Fund Class A
| Years ended October 31, | 2020 | 2019 | 2018 | 2017 | 2016 |
| Selected Per–Share Data | | | | | |
| Net asset value, beginning of period | $35.86 | $28.73 | $34.22 | $25.46 | $29.34 |
| Income from Investment Operations | | | | | |
| Net investment income (loss)A | .08 | .15 | .15 | .08 | .18 |
| Net realized and unrealized gain (loss) | 15.11 | 7.10 | (5.56) | 8.90 | (.20) |
| Total from investment operations | 15.19 | 7.25 | (5.41) | 8.98 | (.02) |
| Distributions from net investment income | (.15) | (.12) | (.08) | (.18) | (.27) |
| Distributions from net realized gain | – | – | – | (.05) | (3.59) |
| Total distributions | (.15) | (.12) | (.08) | (.23) | (3.86) |
| Redemption fees added to paid in capitalA | – | – | –B | .01 | –B |
| Net asset value, end of period | $50.90 | $35.86 | $28.73 | $34.22 | $25.46 |
| Total ReturnC,D | 42.52% | 25.30% | (15.86)% | 35.67% | (.13)% |
| Ratios to Average Net AssetsE,F | | | | | |
| Expenses before reductions | 1.24% | 1.27% | 1.27% | 1.30% | 1.33% |
| Expenses net of fee waivers, if any | 1.24% | 1.26% | 1.27% | 1.30% | 1.33% |
| Expenses net of all reductions | 1.22% | 1.26% | 1.24% | 1.29% | 1.32% |
| Net investment income (loss) | .18% | .44% | .43% | .28% | .75% |
| Supplemental Data | | | | | |
| Net assets, end of period (000 omitted) | $39,303 | $29,963 | $23,424 | $35,539 | $22,937 |
| Portfolio turnover rateG | 60% | 80% | 60% | 68% | 70% |
A Calculated based on average shares outstanding during the period.
B Amount represents less than $.005 per share.
C Total returns would have been lower if certain expenses had not been reduced during the applicable periods shown.
D Total returns do not include the effect of the sales charges.
E Fees and expenses of any underlying mutual funds or exchange-traded funds (ETFs) are not included in the Fund's expense ratio. The Fund indirectly bears its proportionate share of these expenses. For additional expense information related to investments in Fidelity Central Funds, please refer to the "Investments in Fidelity Central Funds" note found in the Notes to Financial Statements section of the most recent Annual or Semi-Annual report.
F Expense ratios reflect operating expenses of the class. Expenses before reductions do not reflect amounts reimbursed, waived, or reduced through arrangements with the investment adviser, brokerage services, or other offset arrangements, if applicable, and do not represent the amount paid by the class during periods when reimbursements, waivers or reductions occur.
G Amount does not include the portfolio activity of any underlying mutual funds or exchange-traded funds (ETFs).
See accompanying notes which are an integral part of the financial statements.
Fidelity China Region Fund Class M
| Years ended October 31, | 2020 | 2019 | 2018 | 2017 | 2016 |
| Selected Per–Share Data | | | | | |
| Net asset value, beginning of period | $35.66 | $28.55 | $34.05 | $25.34 | $29.18 |
| Income from Investment Operations | | | | | |
| Net investment income (loss)A | (.05) | .04 | .03 | (.02) | .10 |
| Net realized and unrealized gain (loss) | 15.04 | 7.07 | (5.53) | 8.88 | (.22) |
| Total from investment operations | 14.99 | 7.11 | (5.50) | 8.86 | (.12) |
| Distributions from net investment income | (.01) | – | – | (.11) | (.13) |
| Distributions from net realized gain | – | – | – | (.05) | (3.59) |
| Total distributions | (.01) | – | – | (.16) | (3.72) |
| Redemption fees added to paid in capitalA | – | – | –B | .01 | –B |
| Net asset value, end of period | $50.64 | $35.66 | $28.55 | $34.05 | $25.34 |
| Total ReturnC,D | 42.04% | 24.90% | (16.15)% | 35.25% | (.50)% |
| Ratios to Average Net AssetsE,F | | | | | |
| Expenses before reductions | 1.56% | 1.59% | 1.62% | 1.65% | 1.67% |
| Expenses net of fee waivers, if any | 1.56% | 1.59% | 1.62% | 1.65% | 1.67% |
| Expenses net of all reductions | 1.53% | 1.58% | 1.58% | 1.64% | 1.67% |
| Net investment income (loss) | (.13)% | .12% | .08% | (.07)% | .40% |
| Supplemental Data | | | �� | | |
| Net assets, end of period (000 omitted) | $12,028 | $9,251 | $8,132 | $9,763 | $5,644 |
| Portfolio turnover rateG | 60% | 80% | 60% | 68% | 70% |
A Calculated based on average shares outstanding during the period.
B Amount represents less than $.005 per share.
C Total returns would have been lower if certain expenses had not been reduced during the applicable periods shown.
D Total returns do not include the effect of the sales charges.
E Fees and expenses of any underlying mutual funds or exchange-traded funds (ETFs) are not included in the Fund's expense ratio. The Fund indirectly bears its proportionate share of these expenses. For additional expense information related to investments in Fidelity Central Funds, please refer to the "Investments in Fidelity Central Funds" note found in the Notes to Financial Statements section of the most recent Annual or Semi-Annual report.
F Expense ratios reflect operating expenses of the class. Expenses before reductions do not reflect amounts reimbursed, waived, or reduced through arrangements with the investment adviser, brokerage services, or other offset arrangements, if applicable, and do not represent the amount paid by the class during periods when reimbursements, waivers or reductions occur.
G Amount does not include the portfolio activity of any underlying mutual funds or exchange-traded funds (ETFs).
See accompanying notes which are an integral part of the financial statements.
Fidelity China Region Fund Class C
| Years ended October 31, | 2020 | 2019 | 2018 | 2017 | 2016 |
| Selected Per–Share Data | | | | | |
| Net asset value, beginning of period | $34.71 | $27.90 | $33.41 | $24.82 | $28.68 |
| Income from Investment Operations | | | | | |
| Net investment income (loss)A | (.22) | (.09) | (.11) | (.13) | –B |
| Net realized and unrealized gain (loss) | 14.61 | 6.90 | (5.40) | 8.73 | (.21) |
| Total from investment operations | 14.39 | 6.81 | (5.51) | 8.60 | (.21) |
| Distributions from net investment income | – | – | – | – | (.06) |
| Distributions from net realized gain | – | – | – | (.02) | (3.59) |
| Total distributions | – | – | – | (.02) | (3.65) |
| Redemption fees added to paid in capitalA | – | – | –B | .01 | –B |
| Net asset value, end of period | $49.10 | $34.71 | $27.90 | $33.41 | $24.82 |
| Total ReturnC,D | 41.46% | 24.41% | (16.49)% | 34.71% | (.88)% |
| Ratios to Average Net AssetsE,F | | | | | |
| Expenses before reductions | 1.98% | 2.00% | 2.01% | 2.05% | 2.07% |
| Expenses net of fee waivers, if any | 1.98% | 2.00% | 2.01% | 2.05% | 2.07% |
| Expenses net of all reductions | 1.96% | 1.99% | 1.98% | 2.03% | 2.06% |
| Net investment income (loss) | (.55)% | (.29)% | (.31)% | (.46)% | .01% |
| Supplemental Data | | | | | |
| Net assets, end of period (000 omitted) | $11,308 | $9,437 | $10,138 | $12,952 | $11,218 |
| Portfolio turnover rateG | 60% | 80% | 60% | 68% | 70% |
A Calculated based on average shares outstanding during the period.
B Amount represents less than $.005 per share.
C Total returns would have been lower if certain expenses had not been reduced during the applicable periods shown.
D Total returns do not include the effect of the contingent deferred sales charge.
E Fees and expenses of any underlying mutual funds or exchange-traded funds (ETFs) are not included in the Fund's expense ratio. The Fund indirectly bears its proportionate share of these expenses. For additional expense information related to investments in Fidelity Central Funds, please refer to the "Investments in Fidelity Central Funds" note found in the Notes to Financial Statements section of the most recent Annual or Semi-Annual report.
F Expense ratios reflect operating expenses of the class. Expenses before reductions do not reflect amounts reimbursed, waived, or reduced through arrangements with the investment adviser, brokerage services, or other offset arrangements, if applicable, and do not represent the amount paid by the class during periods when reimbursements, waivers or reductions occur.
G Amount does not include the portfolio activity of any underlying mutual funds or exchange-traded funds (ETFs).
See accompanying notes which are an integral part of the financial statements.
Fidelity China Region Fund
| Years ended October 31, | 2020 | 2019 | 2018 | 2017 | 2016 |
| Selected Per–Share Data | | | | | |
| Net asset value, beginning of period | $36.30 | $29.11 | $34.64 | $25.78 | $29.66 |
| Income from Investment Operations | | | | | |
| Net investment income (loss)A | .21 | .25 | .26 | .17 | .26 |
| Net realized and unrealized gain (loss) | 15.28 | 7.19 | (5.65) | 9.00 | (.21) |
| Total from investment operations | 15.49 | 7.44 | (5.39) | 9.17 | .05 |
| Distributions from net investment income | (.26) | (.25) | (.14) | (.27) | (.35) |
| Distributions from net realized gain | – | – | – | (.05) | (3.59) |
| Total distributions | (.26) | (.25) | (.14) | (.32) | (3.93)B |
| Redemption fees added to paid in capitalA | – | – | –C | .01 | –C |
| Net asset value, end of period | $51.53 | $36.30 | $29.11 | $34.64 | $25.78 |
| Total ReturnD | 42.95% | 25.72% | (15.62)% | 36.10% | .15% |
| Ratios to Average Net AssetsE,F | | | | | |
| Expenses before reductions | .93% | .95% | .96% | 1.00% | 1.02% |
| Expenses net of fee waivers, if any | .93% | .95% | .96% | 1.00% | 1.02% |
| Expenses net of all reductions | .91% | .95% | .93% | .99% | 1.01% |
| Net investment income (loss) | .49% | .76% | .74% | .58% | 1.06% |
| Supplemental Data | | | | | |
| Net assets, end of period (000 omitted) | $1,518,404 | $1,093,827 | $969,679 | $1,294,775 | $1,004,985 |
| Portfolio turnover rateG | 60% | 80% | 60% | 68% | 70% |
A Calculated based on average shares outstanding during the period.
B Total distributions per share do not sum due to rounding.
C Amount represents less than $.005 per share.
D Total returns would have been lower if certain expenses had not been reduced during the applicable periods shown.
E Fees and expenses of any underlying mutual funds or exchange-traded funds (ETFs) are not included in the Fund's expense ratio. The Fund indirectly bears its proportionate share of these expenses. For additional expense information related to investments in Fidelity Central Funds, please refer to the "Investments in Fidelity Central Funds" note found in the Notes to Financial Statements section of the most recent Annual or Semi-Annual report.
F Expense ratios reflect operating expenses of the class. Expenses before reductions do not reflect amounts reimbursed, waived, or reduced through arrangements with the investment adviser, brokerage services, or other offset arrangements, if applicable, and do not represent the amount paid by the class during periods when reimbursements, waivers or reductions occur.
G Amount does not include the portfolio activity of any underlying mutual funds or exchange-traded funds (ETFs).
See accompanying notes which are an integral part of the financial statements.
Fidelity China Region Fund Class I
| Years ended October 31, | 2020 | 2019 | 2018 | 2017 | 2016 |
| Selected Per–Share Data | | | | | |
| Net asset value, beginning of period | $36.05 | $28.90 | $34.41 | $25.62 | $29.51 |
| Income from Investment Operations | | | | | |
| Net investment income (loss)A | .20 | .25 | .26 | .16 | .26 |
| Net realized and unrealized gain (loss) | 15.17 | 7.13 | (5.61) | 8.95 | (.20) |
| Total from investment operations | 15.37 | 7.38 | (5.35) | 9.11 | .06 |
| Distributions from net investment income | (.26) | (.23) | (.16) | (.28) | (.36) |
| Distributions from net realized gain | – | – | – | (.05) | (3.59) |
| Total distributions | (.26) | (.23) | (.16) | (.33) | (3.95) |
| Redemption fees added to paid in capitalA | – | – | –B | .01 | –B |
| Net asset value, end of period | $51.16 | $36.05 | $28.90 | $34.41 | $25.62 |
| Total ReturnC | 42.91% | 25.71% | (15.63)% | 36.11% | .16% |
| Ratios to Average Net AssetsD,E | | | | | |
| Expenses before reductions | .95% | .97% | .98% | 1.01% | 1.00% |
| Expenses net of fee waivers, if any | .95% | .96% | .98% | 1.01% | 1.00% |
| Expenses net of all reductions | .93% | .96% | .95% | .99% | .99% |
| Net investment income (loss) | .48% | .74% | .72% | .57% | 1.07% |
| Supplemental Data | | | | | |
| Net assets, end of period (000 omitted) | $47,688 | $27,410 | $20,854 | $27,880 | $19,334 |
| Portfolio turnover rateF | 60% | 80% | 60% | 68% | 70% |
A Calculated based on average shares outstanding during the period.
B Amount represents less than $.005 per share.
C Total returns would have been lower if certain expenses had not been reduced during the applicable periods shown.
D Fees and expenses of any underlying mutual funds or exchange-traded funds (ETFs) are not included in the Fund's expense ratio. The Fund indirectly bears its proportionate share of these expenses. For additional expense information related to investments in Fidelity Central Funds, please refer to the "Investments in Fidelity Central Funds" note found in the Notes to Financial Statements section of the most recent Annual or Semi-Annual report.
E Expense ratios reflect operating expenses of the class. Expenses before reductions do not reflect amounts reimbursed, waived, or reduced through arrangements with the investment adviser, brokerage services, or other offset arrangements, if applicable, and do not represent the amount paid by the class during periods when reimbursements, waivers or reductions occur.
F Amount does not include the portfolio activity of any underlying mutual funds or exchange-traded funds (ETFs).
See accompanying notes which are an integral part of the financial statements.
Fidelity China Region Fund Class Z
| Years ended October 31, | 2020 | 2019 | 2018 A |
| Selected Per–Share Data | | | |
| Net asset value, beginning of period | $36.00 | $28.91 | $32.63 |
| Income from Investment Operations | | | |
| Net investment income (loss)B | .26 | .30 | .01 |
| Net realized and unrealized gain (loss) | 15.14 | 7.11 | (3.73) |
| Total from investment operations | 15.40 | 7.41 | (3.72) |
| Distributions from net investment income | (.33) | (.32) | – |
| Distributions from net realized gain | – | – | – |
| Total distributions | (.33) | (.32) | – |
| Net asset value, end of period | $51.07 | $36.00 | $28.91 |
| Total ReturnC,D | 43.13% | 25.86% | (11.40)% |
| Ratios to Average Net AssetsE,F | | | |
| Expenses before reductions | .81% | .82% | .91%G |
| Expenses net of fee waivers, if any | .81% | .82% | .90%G |
| Expenses net of all reductions | .79% | .81% | .87%G |
| Net investment income (loss) | .61% | .89% | .57%G |
| Supplemental Data | | | |
| Net assets, end of period (000 omitted) | $71,121 | $46,861 | $323 |
| Portfolio turnover rateH | 60% | 80% | 60% |
A For the period October 2, 2018 (commencement of sale of shares) to October 31, 2018.
B Calculated based on average shares outstanding during the period.
C Total returns for periods of less than one year are not annualized.
D Total returns would have been lower if certain expenses had not been reduced during the applicable periods shown.
E Fees and expenses of any underlying mutual funds or exchange-traded funds (ETFs) are not included in the Fund's expense ratio. The Fund indirectly bears its proportionate share of these expenses. For additional expense information related to investments in Fidelity Central Funds, please refer to the "Investments in Fidelity Central Funds" note found in the Notes to Financial Statements section of the most recent Annual or Semi-Annual report.
F Expense ratios reflect operating expenses of the class. Expenses before reductions do not reflect amounts reimbursed, waived, or reduced through arrangements with the investment adviser, brokerage services, or other offset arrangements, if applicable, and do not represent the amount paid by the class during periods when reimbursements, waivers or reductions occur.
G Annualized
H Amount does not include the portfolio activity of any underlying mutual funds or exchange-traded funds (ETFs).
See accompanying notes which are an integral part of the financial statements.
Notes to Financial Statements
For the period ended October 31, 2020
1. Organization.
Fidelity China Region Fund (the Fund) is a fund of Fidelity Investment Trust (the Trust) and is authorized to issue an unlimited number of shares. The Trust is registered under the Investment Company Act of 1940, as amended (the 1940 Act), as an open-end management investment company organized as a Massachusetts business trust. The Fund offers Class A, Class M, Class C, China Region, Class I and Class Z shares, each of which has equal rights as to assets and voting privileges. Each class has exclusive voting rights with respect to matters that affect that class. Class C shares will automatically convert to Class A shares after a holding period of ten years from the initial date of purchase, with certain exceptions. The Fund's investments in emerging markets can be subject to social, economic, regulatory, and political uncertainties and can be extremely volatile.
Effective January 1, 2020:
Investment advisers Fidelity Investments Money Management, Inc., FMR Co., Inc., and Fidelity SelectCo, LLC, merged with and into Fidelity Management & Research Company. In connection with the merger transactions, the resulting, merged investment adviser was then redomiciled from Massachusetts to Delaware, changed its corporate structure from a corporation to a limited liability company, and changed its name to "Fidelity Management & Research Company LLC".
Broker-dealer Fidelity Distributors Corporation merged with and into Fidelity Investments Institutional Services Company, Inc. ("FIISC"). FIISC was then redomiciled from Massachusetts to Delaware, changed its corporate structure from a corporation to a limited liability company, and changed its name to "Fidelity Distributors Company LLC".
Fidelity Investments Institutional Operations Company, Inc. converted from a Massachusetts corporation to a Massachusetts LLC, and changed its name to "Fidelity Investments Institutional Operations Company LLC".
2. Investments in Fidelity Central Funds.
The Fund invests in Fidelity Central Funds, which are open-end investment companies generally available only to other investment companies and accounts managed by the investment adviser and its affiliates. The Fund's Schedule of Investments lists each of the Fidelity Central Funds held as of period end, if any, as an investment of the Fund, but does not include the underlying holdings of each Fidelity Central Fund. As an Investing Fund, the Fund indirectly bears its proportionate share of the expenses of the underlying Fidelity Central Funds.
The Money Market Central Funds seek preservation of capital and current income and are managed by the investment adviser. Annualized expenses of the Money Market Central Funds as of their most recent shareholder report date ranged from less than .005% to .01%.
A complete unaudited list of holdings for each Fidelity Central Fund is available upon request or at the Securities and Exchange Commission (the SEC) website at www.sec.gov. In addition, the financial statements of the Fidelity Central Funds, which are not covered by the Fund's Report of Independent Registered Public Accounting Firm, are available on the SEC website or upon request.
3. Significant Accounting Policies.
The Fund is an investment company and applies the accounting and reporting guidance of the Financial Accounting Standards Board (FASB) Accounting Standards Codification Topic 946 Financial Services – Investment Companies. The financial statements have been prepared in conformity with accounting principles generally accepted in the United States of America (GAAP), which require management to make certain estimates and assumptions at the date of the financial statements. Actual results could differ from those estimates. Subsequent events, if any, through the date that the financial statements were issued have been evaluated in the preparation of the financial statements. The following summarizes the significant accounting policies of the Fund:
Investment Valuation. Investments are valued as of 4:00 p.m. Eastern time on the last calendar day of the period. The Board of Trustees (the Board) has delegated the day to day responsibility for the valuation of the Fund's investments to the Fair Value Committee (the Committee) established by the Fund's investment adviser. In accordance with valuation policies and procedures approved by the Board, the Fund attempts to obtain prices from one or more third party pricing vendors or brokers to value its investments. When current market prices, quotations or currency exchange rates are not readily available or reliable, investments will be fair valued in good faith by the Committee, in accordance with procedures adopted by the Board. Factors used in determining fair value vary by investment type and may include market or investment specific events. The frequency with which these procedures are used cannot be predicted and they may be utilized to a significant extent. The Committee oversees the Fund's valuation policies and procedures and reports to the Board on the Committee's activities and fair value determinations. The Board monitors the appropriateness of the procedures used in valuing the Fund's investments and ratifies the fair value determinations of the Committee.
The Fund categorizes the inputs to valuation techniques used to value its investments into a disclosure hierarchy consisting of three levels as shown below:
- Level 1 – quoted prices in active markets for identical investments
- Level 2 – other significant observable inputs (including quoted prices for similar investments, interest rates, prepayment speeds, etc.)
- Level 3 – unobservable inputs (including the Fund's own assumptions based on the best information available)
Valuation techniques used to value the Fund's investments by major category are as follows:
Equity securities, including restricted securities, for which market quotations are readily available, are valued at the last reported sale price or official closing price as reported by a third party pricing vendor on the primary market or exchange on which they are traded and are categorized as Level 1 in the hierarchy. In the event there were no sales during the day or closing prices are not available, securities are valued at the last quoted bid price or may be valued using the last available price and are generally categorized as Level 2 in the hierarchy. For foreign equity securities, when market or security specific events arise, comparisons to the valuation of American Depositary Receipts (ADRs), futures contracts, Exchange-Traded Funds (ETFs) and certain indexes as well as quoted prices for similar securities may be used and would be categorized as Level 2 in the hierarchy. For equity securities, including restricted securities, where observable inputs are limited, assumptions about market activity and risk are used and these securities may be categorized as Level 3 in the hierarchy. Securities, including private placements or other restricted securities, for which observable inputs are not available are valued using alternate valuation approaches, including the market approach, the income approach and cost approach, and are categorized as Level 3 in the hierarchy. The market approach considers factors including the price of recent investments in the same or a similar security or financial metrics of comparable securities. The income approach considers factors including expected future cash flows, security specific risks and corresponding discount rates. The cost approach considers factors including the value of the security's underlying assets and liabilities.
Investments in open-end mutual funds, including the Fidelity Central Funds, are valued at their closing net asset value (NAV) each business day and are categorized as Level 1 in the hierarchy.
Changes in valuation techniques may result in transfers in or out of an assigned level within the disclosure hierarchy. The aggregate value of investments by input level as of October 31, 2020 is included at the end of the Fund's Schedule of Investments.
Foreign Currency. Certain Funds may use foreign currency contracts to facilitate transactions in foreign-denominated securities. Gains and losses from these transactions may arise from changes in the value of the foreign currency or if the counterparties do not perform under the contracts' terms.
Foreign-denominated assets, including investment securities, and liabilities are translated into U.S. dollars at the exchange rates at period end. Purchases and sales of investment securities, income and dividends received, and expenses denominated in foreign currencies are translated into U.S. dollars at the exchange rate in effect on the transaction date.
The effects of exchange rate fluctuations on investments are included with the net realized and unrealized gain (loss) on investment securities. Other foreign currency transactions resulting in realized and unrealized gain (loss) are disclosed separately.
Investment Transactions and Income. For financial reporting purposes, the Fund's investment holdings and NAV include trades executed through the end of the last business day of the period. The NAV per share for processing shareholder transactions is calculated as of the close of business of the New York Stock Exchange (NYSE), normally 4:00 p.m. Eastern time and includes trades executed through the end of the prior business day. Gains and losses on securities sold are determined on the basis of identified cost and include proceeds received from litigation. Dividend income is recorded on the ex-dividend date, except for certain dividends from foreign securities where the ex-dividend date may have passed, which are recorded as soon as the Fund is informed of the ex-dividend date. Non-cash dividends included in dividend income, if any, are recorded at the fair market value of the securities received. Income and capital gain distributions from Fidelity Central Funds, if any, are recorded on the ex-dividend date. Investment income is recorded net of foreign taxes withheld where recovery of such taxes is uncertain.
Class Allocations and Expenses. Investment income, realized and unrealized capital gains and losses, common expenses of the Fund, and certain fund-level expense reductions, if any, are allocated daily on a pro-rata basis to each class based on the relative net assets of each class to the total net assets of the Fund. Each class differs with respect to transfer agent and distribution and service plan fees incurred. Certain expense reductions may also differ by class. For the reporting period, the allocated portion of income and expenses to each class as a percent of its average net assets may vary due to the timing of recording these transactions in relation to fluctuating net assets of the classes. Expenses directly attributable to a fund are charged to that fund. Expenses attributable to more than one fund are allocated among the respective funds on the basis of relative net assets or other appropriate methods. Expense estimates are accrued in the period to which they relate and adjustments are made when actual amounts are known.
Income Tax Information and Distributions to Shareholders. Each year, the Fund intends to qualify as a regulated investment company under Subchapter M of the Internal Revenue Code, including distributing substantially all of its taxable income and realized gains. As a result, no provision for U.S. Federal income taxes is required. As of October 31, 2020, the Fund did not have any unrecognized tax benefits in the financial statements; nor is the Fund aware of any tax positions for which it is reasonably possible that the total amounts of unrecognized tax benefits will significantly change in the next twelve months. The Fund files a U.S. federal tax return, in addition to state and local tax returns as required. The Fund's federal income tax returns are subject to examination by the Internal Revenue Service (IRS) for a period of three fiscal years after they are filed. State and local tax returns may be subject to examination for an additional fiscal year depending on the jurisdiction. Foreign taxes are provided for based on the Fund's understanding of the tax rules and rates that exist in the foreign markets in which it invests.
Distributions are declared and recorded on the ex-dividend date. Income and capital gain distributions are declared separately for each class. Income and capital gain distributions are determined in accordance with income tax regulations, which may differ from GAAP. In addition, the Fund claimed a portion of the payment made to redeeming shareholders as a distribution for income tax purposes.
Capital accounts within the financial statements are adjusted for permanent book-tax differences. These adjustments have no impact on net assets or the results of operations. Capital accounts are not adjusted for temporary book-tax differences which will reverse in a subsequent period.
Book-tax differences are primarily due to foreign currency transactions, passive foreign investment companies (PFIC)and losses deferred due to wash sales.
As of period end, the cost and unrealized appreciation (depreciation) in securities, and derivatives if applicable, for federal income tax purposes were as follows:
| Gross unrealized appreciation | $705,900,094 |
| Gross unrealized depreciation | (59,022,423) |
| Net unrealized appreciation (depreciation) | $646,877,671 |
| Tax Cost | $1,060,308,799 |
The tax-based components of distributable earnings as of period end were as follows:
| Undistributed ordinary income | $81,930,720 |
| Undistributed long-term capital gain | $12,206,000 |
| Net unrealized appreciation (depreciation) on securities and other investments | $646,881,814 |
The tax character of distributions paid was as follows:
| | October 31, 2020 | October 31, 2020 |
| Ordinary Income | $8,548,175 | $ 8,434,846 |
Restricted Securities (including Private Placements). The Fund may invest in securities that are subject to legal or contractual restrictions on resale. These securities generally may be resold in transactions exempt from registration or to the public if the securities are registered. Disposal of these securities may involve time-consuming negotiations and expense, and prompt sale at an acceptable price may be difficult. Information regarding restricted securities is included at the end of the Fund's Schedule of Investments.
4. Purchases and Sales of Investments.
Purchases and sales of securities, other than short-term securities are, noted in the table below.
| | Purchases ($) | Sales ($) |
| Fidelity China Region Fund | 811,544,847 | 841,700,902 |
5. Fees and Other Transactions with Affiliates.
Management Fee. Fidelity Management & Research Company LLC (the investment adviser) and its affiliates provide the Fund with investment management related services for which the Fund pays a monthly management fee. The management fee is the sum of an individual fund fee rate that is based on an annual rate of .45% of the Fund's average net assets and an annualized group fee rate that averaged .23% during the period. The group fee rate is based upon the monthly average net assets of a group of registered investment companies with which the investment adviser has management contracts. The group fee rate decreases as assets under management increase and increases as assets under management decrease. For the reporting period, the total annual management fee rate was .68% of the Fund's average net assets.
Distribution and Service Plan Fees. In accordance with Rule 12b-1 of the 1940 Act, the Fund has adopted separate Distribution and Service Plans for each class of shares. Certain classes pay Fidelity Distributors Company LLC (FDC), an affiliate of the investment adviser, separate Distribution and Service Fees, each of which is based on an annual percentage of each class' average net assets. In addition, FDC may pay financial intermediaries for selling shares of the Fund and providing shareholder support services. For the period, the Distribution and Service Fee rates, total fees and amounts retained by FDC were as follows:
| | Distribution Fee | Service Fee | Total Fees | Retained by FDC |
| Class A | -% | .25% | $82,362 | $1,889 |
| Class M | .25% | .25% | 51,218 | 647 |
| Class C | .75% | .25% | 102,029 | 14,745 |
| | | | $235,609 | $17,281 |
During the period, the investment adviser or its affiliates waived a portion of these fees.
Sales Load. FDC may receive a front-end sales charge of up to 5.75% for selling Class A shares and 3.50% for selling Class M shares, some of which is paid to financial intermediaries for selling shares of the Fund. Depending on the holding period, FDC may receive contingent deferred sales charges levied on Class A, Class M and Class C redemptions. The deferred sales charges are 1.00% for Class C shares, 1.00% for certain purchases of Class A shares and .25% for certain purchases of Class M shares.
For the period, sales charge amounts retained by FDC were as follows:
| | Retained by FDC |
| Class A | $18,251 |
| Class M | 1,653 |
| Class C(a) | 3,290 |
| | $23,194 |
(a) When Class C shares are initially sold, FDC pays commissions from its own resources to financial intermediaries through which the sales are made.
Transfer Agent Fees. Fidelity Investments Institutional Operations Company LLC (FIIOC), an affiliate of the investment adviser, is the transfer, dividend disbursing and shareholder servicing agent for each class of the Fund. FIIOC receives account fees and asset-based fees that vary according to the account size and type of account of the shareholders of the respective classes of the Fund, except for Class Z. FIIOC receives an asset-based fee of Class Z's average net assets. FIIOC pays for typesetting, printing and mailing of shareholder reports, except proxy statements. Effective February 1, 2020, the Board approved to change the fee for Class Z from .046% to .044%.
For the period, transfer agent fees for each class were as follows:
| | Amount | % of Class-Level Average Net Assets |
| Class A | $72,636 | .22 |
| Class M | 29,418 | .29 |
| Class C | 21,199 | .21 |
| China Region | 2,054,345 | .16 |
| Class I | 58,909 | .18 |
| Class Z | 22,499 | .04 |
| | $2,259,006 | |
Accounting Fees. Fidelity Service Company, Inc. (FSC), an affiliate of the investment adviser, maintains the Fund's accounting records. The accounting fee is based on the level of average net assets for each month. For the period, the fees were equivalent to the following annual rates:
| | % of Average Net Assets |
| Fidelity China Region Fund | .05 |
Brokerage Commissions. A portion of portfolio transactions were placed with brokerage firms which are affiliates of the investment adviser. Brokerage commissions are included in net realized gain (loss) and change in net unrealized appreciation (depreciation) in the Statement of Operations. The commissions paid to these affiliated firms were as follows:
| | Amount |
| Fidelity China Region Fund | $16,175 |
Interfund Lending Program. Pursuant to an Exemptive Order issued by the SEC, the Fund, along with other registered investment companies having management contracts with Fidelity Management & Research Company LLC (FMR), or other affiliated entities of FMR, may participate in an interfund lending program. This program provides an alternative credit facility allowing the Fund to borrow from, or lend money to, other participating affiliated funds. At period end, there were no interfund loans outstanding. Activity in this program during the period for which loans were outstanding was as follows:
| | Borrower or Lender | Average Loan Balance | Weighted Average Interest Rate | Interest Expense |
| Fidelity China Region Fund | Borrower | $9,480,000 | 1.78% | $469 |
Interfund Trades. Funds may purchase from or sell securities to other Fidelity Funds under procedures adopted by the Board. The procedures have been designed to ensure these interfund trades are executed in accordance with Rule 17a-7 of the 1940 Act. Interfund trades are included within the respective purchases and sales amounts shown in the Purchases and Sales of Investments note.
Other. During the period, the investment adviser reimbursed the Fund for certain losses in the amount of $75,355.
6. Committed Line of Credit.
Certain Funds participate with other funds managed by the investment adviser or an affiliate in a $4.25 billion credit facility (the "line of credit") to be utilized for temporary or emergency purposes to fund shareholder redemptions or for other short-term liquidity purposes. The participating funds have agreed to pay commitment fees on their pro-rata portion of the line of credit, which are reflected in Miscellaneous expenses on the Statement of Operations, and are as follows:
| | Amount |
| Fidelity China Region Fund | $3,163 |
During the period, there were no borrowings on this line of credit.
7. Security Lending.
Funds lend portfolio securities from time to time in order to earn additional income. Lending agents are used, including National Financial Services (NFS), an affiliate of the investment adviser. Pursuant to a securities lending agreement, NFS will receive a fee, which is capped at 9.9% of a fund's daily lending revenue, for its services as lending agent. A fund may lend securities to certain qualified borrowers, including NFS. On the settlement date of the loan, a fund receives collateral (in the form of U.S. Treasury obligations, letters of credit and/or cash) against the loaned securities and maintains collateral in an amount not less than 100% of the market value of the loaned securities during the period of the loan. The market value of the loaned securities is determined at the close of business of a fund and any additional required collateral is delivered to a fund on the next business day. A fund or borrower may terminate the loan at any time, and if the borrower defaults on its obligation to return the securities loaned because of insolvency or other reasons, a fund may apply collateral received from the borrower against the obligation. A fund may experience delays and costs in recovering the securities loaned. Any cash collateral received is invested in the Fidelity Securities Lending Cash Central Fund. Any loaned securities are identified as such in the Schedule of Investments, and the value of loaned securities and cash collateral at period end, as applicable, are presented in the Statement of Assets and Liabilities. Security lending income represents the income earned on investing cash collateral, less rebates paid to borrowers and any lending agent fees associated with the loan, plus any premium payments received for lending certain types of securities. Security lending income is presented in the Statement of Operations as a component of income from Fidelity Central Funds. Affiliated security lending activity, if any, was as follows:
| | Total Security Lending Income Fees Paid to NFS | Security Lending Income From Securities Loaned to NFS | Value of Securities Loaned to NFS at Period End |
| Fidelity China Region Fund | $20,655 | $– | $– |
8. Expense Reductions.
Commissions paid to certain brokers with whom the investment adviser, or its affiliates, places trades on behalf of the Fund include an amount in addition to trade execution, which may be rebated back to the Fund to offset certain expenses. This amount totaled $291,308 for the period. In addition, through arrangements with the Fund's custodian and each class' transfer agent, credits realized as a result of certain uninvested cash balances were used to reduce the Fund's expenses. During the period, custodian credits reduced the Fund's expenses by $1,422.
In addition, during the period the investment adviser or an affiliate reimbursed and/or waived a portion of fund-level operating expenses in the amount of $5,155.
In addition, during the period the investment adviser or an affiliate reimbursed the Fund $7,710 for an operational error which is included in the accompanying Statement of Operations.
9. Distributions to Shareholders.
Distributions to shareholders of each class were as follows:
| | Year ended
October 31, 2020 | Year ended
October 31, 2019 |
| Distributions to shareholders | | |
| Class A | $125,875 | $92,117 |
| Class M | 2,316 | – |
| China Region | 7,803,466 | 8,164,383 |
| Class I | 196,223 | 170,585 |
| Class Z | 420,295 | 7,761 |
| Total | $8,548,175 | $8,434,846 |
10. Share Transactions.
Share transactions for each class were as follows and may contain automatic conversions between classes or exchanges between affiliated funds:
| | Shares | Shares | Dollars | Dollars |
| | Year ended October 31, 2020 | Year ended October 31, 2019 | Year ended October 31, 2020 | Year ended October 31, 2019 |
| Class A | | | | |
| Shares sold | 252,850 | 199,202 | $10,700,822 | $6,700,557 |
| Reinvestment of distributions | 3,337 | 3,062 | 122,352 | 90,830 |
| Shares redeemed | (319,557) | (182,149) | (12,564,945) | (5,889,031) |
| Net increase (decrease) | (63,370) | 20,115 | $(1,741,771) | $902,356 |
| Class M | | | | |
| Shares sold | 44,515 | 40,302 | $1,766,098 | $1,338,213 |
| Reinvestment of distributions | 63 | – | 2,314 | – |
| Shares redeemed | (66,503) | (65,723) | (2,606,169) | (2,122,809) |
| Net increase (decrease) | (21,925) | (25,421) | $(837,757) | $(784,596) |
| Class C | | | | |
| Shares sold | 63,570 | 43,065 | $2,554,562 | $1,400,507 |
| Shares redeemed | (105,168) | (134,542) | (4,175,715) | (4,290,419) |
| Net increase (decrease) | (41,598) | (91,477) | $(1,621,153) | $(2,889,912) |
| China Region | | | | |
| Shares sold | 9,843,654 | 6,473,996 | $415,483,498 | $219,994,317 |
| Reinvestment of distributions | 199,161 | 260,477 | 7,372,929 | 7,798,692 |
| Shares redeemed | (10,708,896) | (9,909,366) | (439,021,765) | (329,544,092) |
| Net increase (decrease) | (666,081) | (3,174,893) | $(16,165,338) | $(101,751,083) |
| Class I | | | | |
| Shares sold | 879,811 | 427,700 | $38,355,592 | $14,190,055 |
| Reinvestment of distributions | 4,369 | 4,738 | 160,612 | 140,863 |
| Shares redeemed | (712,536) | (393,573) | (29,163,388) | (12,947,213) |
| Net increase (decrease) | 171,644 | 38,865 | $9,352,816 | $1,383,705 |
| Class Z | | | | |
| Shares sold | 663,465 | 1,429,776 | $29,709,073 | $47,427,389 |
| Reinvestment of distributions | 11,468 | 262 | 420,295 | 7,761 |
| Shares redeemed | (583,926) | (139,654) | (23,293,462) | (4,784,751) |
| Net increase (decrease) | 91,007 | 1,290,384 | $6,835,906 | $42,650,399 |
11. Other.
The Fund's organizational documents provide former and current trustees and officers with a limited indemnification against liabilities arising in connection with the performance of their duties to the Fund. In the normal course of business, the Fund may also enter into contracts that provide general indemnifications. The Fund's maximum exposure under these arrangements is unknown as this would be dependent on future claims that may be made against the Fund. The risk of material loss from such claims is considered remote.
12. Coronavirus (COVID-19) Pandemic.
An outbreak of COVID-19 first detected in China during December 2019 has since spread globally and was declared a pandemic by the World Health Organization during March 2020. Developments that disrupt global economies and financial markets, such as the COVID-19 pandemic, may magnify factors that affect the Fund's performance.
Fidelity® Emerging Asia Fund
Performance: The Bottom Line
Average annual total return reflects the change in the value of an investment, assuming reinvestment of distributions from dividend income and capital gains (the profits earned upon the sale of securities that have grown in value, if any) and assuming a constant rate of performance each year. The hypothetical investment and the average annual total returns do not reflect the deduction of taxes that a shareholder would pay on fund distributions or the redemption of fund shares. During periods of reimbursement by Fidelity, a fund’s total return will be greater than it would be had the reimbursement not occurred. How a fund did yesterday is no guarantee of how it will do tomorrow.
Average Annual Total Returns
| For the periods ended October 31, 2020 | Past 1 year | Past 5 years | Past 10 years |
| Fidelity® Emerging Asia Fund | 50.46% | 18.17% | 10.10% |
$10,000 Over 10 Years
Let's say hypothetically that $10,000 was invested in Fidelity® Emerging Asia Fund on October 31, 2010.
The chart shows how the value of your investment would have changed, and also shows how the MSCI AC (All Country) Asia ex Japan Index performed over the same period.

| Period Ending Values |
| $26,179 | Fidelity® Emerging Asia Fund |
| $16,933 | MSCI AC (All Country) Asia ex Japan Index |
Fidelity® Emerging Asia Fund
Management's Discussion of Fund Performance
Market Recap: The MSCI ACWI (All Country World Index) ex USA Index returned -2.46% for the 12 months ending October 31, 2020, in what was a bumpy ride for non-U.S. equities, marked by a steep but brief decline due to the early-2020 outbreak and spread of the coronavirus, followed by a sharp upturn. Declared a pandemic on March 11, the crisis and containment efforts caused broad contraction in economic activity, elevated volatility and dislocation in financial markets. A historically rapid and expansive monetary- and fiscal-policy response around the world provided a partial offset to the economic disruption. Other supporting factors included resilient corporate earnings and near-term potential for a COVID-19 vaccine breakthrough. This was evident in the index’s 12.28% gain in the final six months of the year. Currency fluctuation generally boosted foreign developed-markets equities for the year, while the reverse was true for emerging-markets stocks. Late in the period, the index was pressured by a second wave of COVID-19 cases in some regions, and stretched valuations and crowded positioning in big tech. For the full year, the U.K. (-22%), Asia Pacific ex Japan (-8%), Canada (-5%) and Europe ex U.K. (-4%) notably lagged. Emerging markets (+9%) and Japan (+1%) outperformed. By sector, energy (-38%), financials and real estate (-20% each) lagged, whereas information technology (+ 25%) and communication services (+15%) topped the index.
Comments from Portfolio Manager Xiaoting Zhao: For the fiscal year ending October 31, 2020, the fund gained 50.46%, outperforming the 15.85% result of the benchmark Fidelity Emerging Asia Fund Linked Index. From a regional standpoint, stock picks in emerging markets, especially China, contributed the most by far to the fund's relative result. Picks in Japan contributed to a significant, but lesser, extent. By sector, stock picks in communication services, as well as positioning in the information technology and industrials sectors, bolstered the fund's relative result. An overweighting in Pinduoduo, which gained 112% the past year, added more value than any other individual position. Outsized stakes in Bilibili (+186%) and Tencent Holdings (+87%) also contributed on a relative basis. Conversely, a lighter-than-benchmark stake in Alibaba Group Holding (+72%), on average, detracted. Also hampering performance was an underweighting in JD.com, which gained 162% within the benchmark. JD.com was not held at period end. Another notable relative detractor was an out-of-benchmark stake in Thai Beverage Public (-36%).
The views expressed above reflect those of the portfolio manager(s) only through the end of the period as stated on the cover of this report and do not necessarily represent the views of Fidelity or any other person in the Fidelity organization. Any such views are subject to change at any time based upon market or other conditions and Fidelity disclaims any responsibility to update such views. These views may not be relied on as investment advice and, because investment decisions for a Fidelity fund are based on numerous factors, may not be relied on as an indication of trading intent on behalf of any Fidelity fund.
Note to shareholders: On January 1, 2020, John Dance came off of the fund, leaving Xiaoting Zhao as sole portfolio manager.
Fidelity® Emerging Asia Fund
Investment Summary (Unaudited)
Geographic Diversification (% of fund's net assets)
| As of October 31, 2020 |
| | Cayman Islands | 31.9% |
| | India | 12.0% |
| | China | 11.1% |
| | Korea (South) | 10.5% |
| | Japan | 8.9% |
| | Taiwan | 7.6% |
| | United States of America* | 7.1% |
| | Thailand | 1.8% |
| | Mauritius | 1.6% |
| | Other | 7.5% |

* Includes Short-Term investments and Net Other Assets (Liabilities).
Percentages are based on country or territory of incorporation and are adjusted for the effect of futures contracts, if applicable.
Asset Allocation as of October 31, 2020
| | % of fund's net assets |
| Stocks | 98.2 |
| Short-Term Investments and Net Other Assets (Liabilities) | 1.8 |
Top Ten Stocks as of October 31, 2020
| | % of fund's net assets |
| Alibaba Group Holding Ltd. (Cayman Islands, Internet & Direct Marketing Retail) | 11.4 |
| Taiwan Semiconductor Manufacturing Co. Ltd. (Taiwan, Semiconductors & Semiconductor Equipment) | 5.9 |
| Tencent Holdings Ltd. (Cayman Islands, Interactive Media & Services) | 4.7 |
| Samsung Electronics Co. Ltd. (Korea (South), Technology Hardware, Storage & Peripherals) | 4.6 |
| Bilibili, Inc. ADR (Cayman Islands, Entertainment) | 2.7 |
| Reliance Industries Ltd. (India, Oil, Gas & Consumable Fuels) | 2.3 |
| SK Hynix, Inc. (Korea (South), Semiconductors & Semiconductor Equipment) | 2.2 |
| Micron Technology, Inc. (United States of America, Semiconductors & Semiconductor Equipment) | 1.8 |
| MakeMyTrip Ltd. (Mauritius, Internet & Direct Marketing Retail) | 1.6 |
| Bajaj Finance Ltd. (India, Consumer Finance) | 1.4 |
| | 38.6 |
Top Market Sectors as of October 31, 2020
| | % of fund's net assets |
| Information Technology | 31.2 |
| Consumer Discretionary | 24.7 |
| Communication Services | 15.0 |
| Financials | 9.8 |
| Health Care | 6.9 |
| Industrials | 4.3 |
| Energy | 2.4 |
| Materials | 1.8 |
| Consumer Staples | 1.4 |
| Real Estate | 0.7 |
Fidelity® Emerging Asia Fund
Schedule of Investments October 31, 2020
Showing Percentage of Net Assets
| Common Stocks - 97.2% | | | |
| | | Shares | Value |
| Australia - 0.0% | | | |
| Blue Sky Alternative Investments Ltd. (a)(b) | | 1,118,552 | $8 |
| Cayman Islands - 31.9% | | | |
| Agora, Inc. ADR (a) | | 3,400 | 130,900 |
| Akeso, Inc. (c) | | 2,213,000 | 6,936,588 |
| Alibaba Group Holding Ltd.(a) | | 2,625,000 | 99,471,412 |
| Alibaba Group Holding Ltd. sponsored ADR (a) | | 265,600 | 80,925,664 |
| Archosaur Games, Inc. (a)(c) | | 6,536,000 | 15,394,693 |
| Bilibili, Inc. ADR (a)(d) | | 935,500 | 41,788,785 |
| China Literature Ltd. (a)(c) | | 701,800 | 5,748,378 |
| CMGE Technology Group Ltd. | | 22,018,000 | 8,349,941 |
| CStone Pharmaceuticals Co. Ltd. (a)(c) | | 162,470 | 238,492 |
| Ctrip.com International Ltd. ADR (a) | | 735,400 | 21,150,104 |
| Frontage Holdings Corp. (a)(c)(d) | | 9,728,000 | 4,266,391 |
| GSX Techedu, Inc. ADR (a)(d) | | 82,100 | 5,453,082 |
| Hua Medicine (a)(c) | | 5,702,500 | 3,111,458 |
| Huazhu Group Ltd. ADR (d) | | 92,700 | 3,673,701 |
| iClick Interactive Asia Group Ltd. (A Shares) ADR (a)(d) | | 809,400 | 6,450,918 |
| Innovent Biologics, Inc. (a)(c) | | 1,021,500 | 7,536,898 |
| iQIYI, Inc. ADR (a) | | 272,700 | 6,735,690 |
| Kangji Medical Holdings Ltd. | | 1,338,000 | 3,641,638 |
| Kangji Medical Holdings Ltd. | | 504,000 | 1,303,151 |
| KE Holdings, Inc. ADR (a) | | 58,700 | 4,094,325 |
| Li Ning Co. Ltd. | | 1,291,200 | 6,662,109 |
| Lufax Holding Ltd. ADR (a) | | 256,200 | 3,458,700 |
| Meituan Class B (a) | | 66,116 | 2,457,869 |
| Phoenix Tree Holdings Ltd. ADR | | 138,800 | 259,556 |
| Pinduoduo, Inc. ADR (a) | | 205,600 | 18,499,888 |
| Semiconductor Manufacturing International Corp. (a) | | 5,328,000 | 15,718,305 |
| So-Young International, Inc. ADR (a)(d) | | 329,800 | 3,848,766 |
| Sunny Optical Technology Group Co. Ltd. | | 424,700 | 7,023,094 |
| TAL Education Group ADR (a) | | 221,868 | 14,745,347 |
| Tencent Holdings Ltd. | | 976,940 | 74,643,740 |
| Wuxi Biologics (Cayman), Inc. (a)(c) | | 399,500 | 11,161,780 |
| YY, Inc. ADR | | 96,400 | 8,809,032 |
| Zai Lab Ltd. (a) | | 16,700 | 1,389,423 |
| Zai Lab Ltd. ADR (a) | | 109,800 | 9,009,090 |
|
| TOTAL CAYMAN ISLANDS | | | 504,088,908 |
|
| China - 11.1% | | | |
| Anhui Korrun Co. Ltd. (A Shares) | | 1,796,361 | 8,254,101 |
| AVIC Jonhon OptronicTechnology Co. Ltd. | | 1,111,900 | 9,225,225 |
| Bafang Electric Suzhou Co. Ltd. (A Shares) | | 78,980 | 2,177,616 |
| Beijing Enlight Media Co. Ltd. (A Shares) | | 3,172,500 | 5,772,595 |
| Beijing Shiji Information Technology Co. Ltd. (A Shares) | | 1,942,917 | 10,753,004 |
| China Jushi Co. Ltd. (A Shares) | | 3,449,218 | 7,209,887 |
| Guangzhou Automobile Group Co. Ltd. | | 6,153,966 | 12,378,714 |
| Guangzhou GRG Metrology & Test Co. Ltd. (A Shares) | | 1,668,290 | 7,608,326 |
| Hangzhou Tigermed Consulting Co. Ltd. (A Shares) | | 477,497 | 8,879,037 |
| Leader Harmonious Drive Systems Co. Ltd. (A Shares) (a) | | 883,000 | 10,738,826 |
| Milkyway Chemical Supply Chain Service Co. Ltd. (A Shares) | | 677,684 | 11,111,392 |
| Pharmaron Beijing Co. Ltd. (A Shares) | | 605,942 | 10,425,955 |
| Shanghai Bairun Investment Holding Group Co. Ltd. (A Shares) | | 1,030,940 | 10,288,962 |
| Shenzhen Inovance Technology Co. Ltd. (A Shares) | | 1,507,585 | 14,509,047 |
| Shenzhen Mindray Bio-Medical Electronics Co. Ltd. (A Shares) | | 157,208 | 9,110,337 |
| Shenzhen New Industries Biomedical Engineering Co. Ltd. | | 362,800 | 9,274,930 |
| Sungrow Power Supply Co. Ltd. (A Shares) | | 1,552,995 | 9,041,504 |
| TravelSky Technology Ltd. (H Shares) | | 2,217,000 | 4,655,629 |
| WuXi AppTec Co. Ltd. (H Shares) (c) | | 828,160 | 13,192,875 |
|
| TOTAL CHINA | | | 174,607,962 |
|
| France - 0.8% | | | |
| LVMH Moet Hennessy Louis Vuitton SE | | 11,100 | 5,203,099 |
| Ubisoft Entertainment SA (a) | | 84,000 | 7,409,690 |
|
| TOTAL FRANCE | | | 12,612,789 |
|
| Germany - 0.5% | | | |
| Delivery Hero AG (a)(c) | | 72,100 | 8,294,682 |
| Hong Kong - 0.9% | | | |
| AIA Group Ltd. | | 1,460,650 | 13,901,264 |
| India - 12.0% | | | |
| Asian Paints Ltd. | | 202,100 | 5,992,231 |
| Aster DM Healthcare Ltd. (a)(c) | | 979,760 | 1,763,631 |
| Bajaj Finance Ltd. | | 515,200 | 22,845,864 |
| Computer Age Management Services Private Ltd. (a) | | 664,185 | 11,611,738 |
| Eicher Motors Ltd. | | 276,870 | 7,784,403 |
| HDFC Asset Management Co. Ltd. (c) | | 637,124 | 19,219,617 |
| HDFC Bank Ltd. | | 1,227,938 | 19,493,697 |
| HDFC Bank Ltd. sponsored ADR (a) | | 119,700 | 6,875,568 |
| Housing Development Finance Corp. Ltd. | | 478,664 | 12,344,391 |
| Indian Energy Exchange Ltd. (c) | | 1,278,100 | 3,277,814 |
| Kotak Mahindra Bank Ltd. (a) | | 501,800 | 10,409,681 |
| Maruti Suzuki India Ltd. | | 88,244 | 8,239,018 |
| Mindspace Business Parks (a)(c) | | 182,800 | 751,539 |
| Mindspace Business Parks | | 178,600 | 657,557 |
| Oberoi Realty Ltd. (a) | | 744,153 | 4,419,569 |
| Page Industries Ltd. | | 20,254 | 5,450,882 |
| Reliance Industries Ltd. | | 1,290,854 | 35,576,221 |
| Reliance Industries Ltd. | | 86,056 | 1,363,308 |
| TCNS Clothing Co. Ltd. (a)(c) | | 609,537 | 3,046,508 |
| Titan Co. Ltd. | | 543,900 | 8,509,730 |
|
| TOTAL INDIA | | | 189,632,967 |
|
| Indonesia - 1.3% | | | |
| PT Bank Central Asia Tbk | | 5,396,077 | 10,617,622 |
| PT Bank Rakyat Indonesia Tbk | | 41,775,055 | 9,456,702 |
|
| TOTAL INDONESIA | | | 20,074,324 |
|
| Japan - 8.9% | | | |
| BASE, Inc. (d) | | 28,000 | 3,001,204 |
| Capcom Co. Ltd. | | 135,600 | 7,416,176 |
| Freee KK (a)(d) | | 213,800 | 16,729,606 |
| Hennge K.K. (a)(d) | | 211,300 | 15,285,905 |
| Iriso Electronics Co. Ltd. | | 147,800 | 5,627,380 |
| Lifenet Insurance Co. (a) | | 589,800 | 8,685,657 |
| Money Forward, Inc. (a) | | 224,500 | 20,310,417 |
| Rakus Co. Ltd. | | 808,000 | 15,878,559 |
| Square Enix Holdings Co. Ltd. | | 123,000 | 7,146,644 |
| Uzabase, Inc. (a)(d) | | 532,500 | 18,073,270 |
| Yume No Machi Souzou Iinkai Co. Ltd. (d) | | 445,000 | 13,194,777 |
| Z Holdings Corp. | | 1,291,600 | 9,006,404 |
|
| TOTAL JAPAN | | | 140,355,999 |
|
| Korea (South) - 9.6% | | | |
| Kakao Corp. | | 46,800 | 13,616,518 |
| Kakao Games Corp. | | 3,000 | 119,824 |
| LG Chemical Ltd. | | 29,153 | 15,861,708 |
| Samsung Electronics Co. Ltd. | | 1,440,370 | 72,242,256 |
| Samsung SDI Co. Ltd. | | 36,300 | 14,268,513 |
| SK Hynix, Inc. | | 491,976 | 34,825,618 |
|
| TOTAL KOREA (SOUTH) | | | 150,934,437 |
|
| Mauritius - 1.6% | | | |
| MakeMyTrip Ltd. (a)(d) | | 1,332,578 | 25,012,489 |
| Netherlands - 0.9% | | | |
| ASML Holding NV (Netherlands) | | 17,055 | 6,170,552 |
| NXP Semiconductors NV | | 59,900 | 8,093,688 |
|
| TOTAL NETHERLANDS | | | 14,264,240 |
|
| Philippines - 0.5% | | | |
| Jollibee Food Corp. | | 2,393,300 | 8,367,727 |
| Spain - 1.2% | | | |
| Amadeus IT Holding SA Class A | | 407,100 | 19,434,548 |
| Switzerland - 1.0% | | | |
| Compagnie Financiere Richemont SA Series A | | 118,350 | 7,397,325 |
| Dufry AG (a)(d) | | 221,405 | 8,378,596 |
|
| TOTAL SWITZERLAND | | | 15,775,921 |
|
| Taiwan - 7.6% | | | |
| eMemory Technology, Inc. | | 401,000 | 7,989,444 |
| Taiwan Semiconductor Manufacturing Co. Ltd. | | 6,217,892 | 94,056,600 |
| Taiwan Semiconductor Manufacturing Co. Ltd. sponsored ADR | | 223,700 | 18,761,719 |
|
| TOTAL TAIWAN | | | 120,807,763 |
|
| Thailand - 1.8% | | | |
| Airports of Thailand PCL (For. Reg.) | | 8,230,700 | 13,645,753 |
| Home Product Center PCL (For. Reg.) | | 13,329,433 | 5,960,903 |
| Thai Beverage PCL | | 20,161,607 | 8,574,095 |
|
| TOTAL THAILAND | | | 28,180,751 |
|
| United States of America - 5.3% | | | |
| Advanced Micro Devices, Inc. (a) | | 88,600 | 6,670,694 |
| ANSYS, Inc. (a) | | 26,300 | 8,004,931 |
| Aspen Technology, Inc. (a) | | 60,700 | 6,665,467 |
| DouYu International Holdings Ltd. ADR (a) | | 225,513 | 3,450,349 |
| Eventbrite, Inc. (a) | | 1,071,600 | 9,890,868 |
| Lam Research Corp. | | 18,317 | 6,265,879 |
| Micron Technology, Inc. (a) | | 564,200 | 28,401,828 |
| New Frontier Health Corp. (a)(d) | | 463,500 | 4,009,275 |
| ON Semiconductor Corp. (a) | | 416,800 | 10,457,512 |
|
| TOTAL UNITED STATES OF AMERICA | | | 83,816,803 |
|
| Vietnam - 0.3% | | | |
| Vietnam Dairy Products Corp. | | 1,043,400 | 4,875,084 |
| TOTAL COMMON STOCKS | | | |
| (Cost $1,092,479,427) | | | 1,535,038,666 |
|
| Preferred Stocks - 1.0% | | | |
| Convertible Preferred Stocks - 0.1% | | | |
| Hong Kong - 0.1% | | | |
| Antengene Corp. Series C1 (b)(e) | | 827,043 | 2,337,129 |
| Nonconvertible Preferred Stocks - 0.9% | | | |
| Korea (South) - 0.9% | | | |
| Samsung Electronics Co. Ltd. | | 315,550 | 14,006,416 |
| TOTAL PREFERRED STOCKS | | | |
| (Cost $13,279,023) | | | 16,343,545 |
|
| Money Market Funds - 5.3% | | | |
| Fidelity Cash Central Fund 0.10% (f) | | 29,688,785 | 29,694,723 |
| Fidelity Securities Lending Cash Central Fund 0.11% (f)(g) | | 53,153,514 | 53,158,830 |
| TOTAL MONEY MARKET FUNDS | | | |
| (Cost $82,853,553) | | | 82,853,553 |
| TOTAL INVESTMENT IN SECURITIES - 103.5% | | | |
| (Cost $1,188,612,003) | | | 1,634,235,764 |
| NET OTHER ASSETS (LIABILITIES) - (3.5)% | | | (55,454,246) |
| NET ASSETS - 100% | | | $1,578,781,518 |
Categorizations in the Schedule of Investments are based on country or territory of incorporation.
Legend
(a) Non-income producing
(b) Level 3 security
(c) Security exempt from registration under Rule 144A of the Securities Act of 1933. These securities may be resold in transactions exempt from registration, normally to qualified institutional buyers. At the end of the period, the value of these securities amounted to $103,941,344 or 6.6% of net assets.
(d) Security or a portion of the security is on loan at period end.
(e) Restricted securities (including private placements) - Investment in securities not registered under the Securities Act of 1933 (excluding 144A issues). At the end of the period, the value of restricted securities (excluding 144A issues) amounted to $2,337,129 or 0.1% of net assets.
(f) Affiliated fund that is generally available only to investment companies and other accounts managed by Fidelity Investments. The rate quoted is the annualized seven-day yield of the fund at period end. A complete unaudited listing of the fund's holdings as of its most recent quarter end is available upon request. In addition, each Fidelity Central Fund's financial statements, which are not covered by the Fund's Report of Independent Registered Public Accounting Firm, are available on the SEC's website or upon request.
(g) Investment made with cash collateral received from securities on loan.
Additional information on each restricted holding is as follows:
| Security | Acquisition Date | Acquisition Cost |
| Antengene Corp. Series C1 | 7/11/20 | $2,337,129 |
Affiliated Central Funds
Information regarding fiscal year to date income earned by the Fund from investments in Fidelity Central Funds is as follows:
| Fund | Income earned |
| Fidelity Cash Central Fund | $114,221 |
| Fidelity Securities Lending Cash Central Fund | 452,112 |
| Total | $566,333 |
Amounts in the income column in the above table include any capital gain distributions from underlying funds, which are presented in the corresponding line-item in the Statement of Operations, if applicable. Amount for Fidelity Securities Lending Cash Central Fund represents the income earned on investing cash collateral, less rebates paid to borrowers and any lending agent fees associated with the loan, plus any premium payments received for lending certain types of securities.
Investment Valuation
The following is a summary of the inputs used, as of October 31, 2020, involving the Fund's assets and liabilities carried at fair value. The inputs or methodology used for valuing securities may not be an indication of the risk associated with investing in those securities. For more information on valuation inputs, and their aggregation into the levels used below, please refer to the Investment Valuation section in the accompanying Notes to Financial Statements.
| | Valuation Inputs at Reporting Date: |
| Description | Total | Level 1 | Level 2 | Level 3 |
| Investments in Securities: | | | | |
| Equities: | | | | |
| Communication Services | $235,599,011 | $117,877,110 | $117,721,901 | $-- |
| Consumer Discretionary | 394,148,446 | 198,712,231 | 195,436,215 | -- |
| Consumer Staples | 23,738,141 | -- | 23,738,141 | -- |
| Energy | 36,939,529 | -- | 36,939,529 | -- |
| Financials | 155,201,155 | 6,875,568 | 148,325,579 | 8 |
| Health Care | 107,588,078 | 64,493,908 | 40,757,041 | 2,337,129 |
| Industrials | 66,654,848 | -- | 66,654,848 | -- |
| Information Technology | 492,266,631 | 132,555,333 | 359,711,298 | -- |
| Materials | 29,063,826 | -- | 29,063,826 | -- |
| Real Estate | 10,182,546 | 4,353,881 | 5,828,665 | -- |
| Money Market Funds | 82,853,553 | 82,853,553 | -- | -- |
| Total Investments in Securities: | $1,634,235,764 | $607,721,584 | $1,024,177,043 | $2,337,137 |
See accompanying notes which are an integral part of the financial statements.
Fidelity® Emerging Asia Fund
Financial Statements
Statement of Assets and Liabilities
| | | October 31, 2020 |
| Assets | | |
Investment in securities, at value (including securities loaned of $50,597,324) — See accompanying schedule:
Unaffiliated issuers (cost $1,105,758,450) | $1,551,382,211 | |
| Fidelity Central Funds (cost $82,853,553) | 82,853,553 | |
| Total Investment in Securities (cost $1,188,612,003) | | $1,634,235,764 |
| Receivable for investments sold | | 6,529,562 |
| Receivable for fund shares sold | | 3,744,127 |
| Dividends receivable | | 565,723 |
| Distributions receivable from Fidelity Central Funds | | 52,767 |
| Prepaid expenses | | 2,003 |
| Other receivables | | 472,028 |
| Total assets | | 1,645,601,974 |
| Liabilities | | |
| Payable for investments purchased | $6,568,716 | |
| Payable for fund shares redeemed | 1,207,395 | |
| Accrued management fee | 1,087,180 | |
| Other affiliated payables | 244,092 | |
| Other payables and accrued expenses | 4,553,014 | |
| Collateral on securities loaned | 53,160,059 | |
| Total liabilities | | 66,820,456 |
| Net Assets | | $1,578,781,518 |
| Net Assets consist of: | | |
| Paid in capital | | $876,431,056 |
| Total accumulated earnings (loss) | | 702,350,462 |
| Net Assets | | $1,578,781,518 |
| Net Asset Value, offering price and redemption price per share ($1,578,781,518 ÷ 24,822,028 shares) | | $63.60 |
See accompanying notes which are an integral part of the financial statements.
Statement of Operations
| | | Year ended October 31, 2020 |
| Investment Income | | |
| Dividends | | $10,938,896 |
| Income from Fidelity Central Funds (including $452,112 from security lending) | | 566,333 |
| Income before foreign taxes withheld | | 11,505,229 |
| Less foreign taxes withheld | | (1,432,933) |
| Total income | | 10,072,296 |
| Expenses | | |
| Management fee | | |
| Basic fee | $7,931,976 | |
| Performance adjustment | 2,250,883 | |
| Transfer agent fees | 1,821,440 | |
| Accounting fees | 534,544 | |
| Custodian fees and expenses | 412,440 | |
| Independent trustees' fees and expenses | 6,273 | |
| Registration fees | 62,039 | |
| Audit | 106,777 | |
| Legal | 1,984 | |
| Interest | 5,354 | |
| Miscellaneous | 19,093 | |
| Total expenses before reductions | 13,152,803 | |
| Expense reductions | (323,137) | |
| Total expenses after reductions | | 12,829,666 |
| Net investment income (loss) | | (2,757,370) |
| Realized and Unrealized Gain (Loss) | | |
| Net realized gain (loss) on: | | |
| Investment securities: | | |
| Unaffiliated issuers (net of foreign taxes of $534,877) | 292,735,463 | |
| Fidelity Central Funds | (6,714) | |
| Foreign currency transactions | (360,372) | |
| Total net realized gain (loss) | | 292,368,377 |
| Change in net unrealized appreciation (depreciation) on: | | |
| Investment securities: | | |
| Unaffiliated issuers (net of increase in deferred foreign taxes of $2,893,357) | 190,600,088 | |
| Assets and liabilities in foreign currencies | 45,230 | |
| Total change in net unrealized appreciation (depreciation) | | 190,645,318 |
| Net gain (loss) | | 483,013,695 |
| Net increase (decrease) in net assets resulting from operations | | $480,256,325 |
See accompanying notes which are an integral part of the financial statements.
Statement of Changes in Net Assets
| | Year ended October 31, 2020 | Year ended October 31, 2019 |
| Increase (Decrease) in Net Assets | | |
| Operations | | |
| Net investment income (loss) | $(2,757,370) | $8,305,694 |
| Net realized gain (loss) | 292,368,377 | 64,132,240 |
| Change in net unrealized appreciation (depreciation) | 190,645,318 | 160,772,599 |
| Net increase (decrease) in net assets resulting from operations | 480,256,325 | 233,210,533 |
| Distributions to shareholders | (61,694,228) | (30,935,746) |
| Share transactions | | |
| Proceeds from sales of shares | 382,512,284 | 122,462,574 |
| Reinvestment of distributions | 56,885,103 | 27,229,181 |
| Cost of shares redeemed | (272,798,218) | (272,286,267) |
| Net increase (decrease) in net assets resulting from share transactions | 166,599,169 | (122,594,512) |
| Total increase (decrease) in net assets | 585,161,266 | 79,680,275 |
| Net Assets | | |
| Beginning of period | 993,620,252 | 913,939,977 |
| End of period | $1,578,781,518 | $993,620,252 |
| Other Information | | |
| Shares | | |
| Sold | 6,985,258 | 2,933,364 |
| Issued in reinvestment of distributions | 1,329,091 | 736,521 |
| Redeemed | (5,557,270) | (6,512,148) |
| Net increase (decrease) | 2,757,079 | (2,842,263) |
See accompanying notes which are an integral part of the financial statements.
Financial Highlights
Fidelity Emerging Asia Fund
| | | | | | |
| Years ended October 31, | 2020 | 2019 | 2018 | 2017 | 2016 |
| Selected Per–Share Data | | | | | |
| Net asset value, beginning of period | $45.03 | $36.69 | $43.94 | $33.37 | $31.20 |
| Income from Investment Operations | | | | | |
| Net investment income (loss)A | (.12) | .34 | .41 | .40 | .39 |
| Net realized and unrealized gain (loss) | 21.49 | 9.27 | (7.27) | 10.56 | 1.91 |
| Total from investment operations | 21.37 | 9.61 | (6.86) | 10.96 | 2.30 |
| Distributions from net investment income | (.29)B | (.39) | (.37) | (.34) | (.13) |
| Distributions from net realized gain | (2.51)B | (.88) | (.02) | (.05) | – |
| Total distributions | (2.80) | (1.27) | (.39) | (.39) | (.13) |
| Redemption fees added to paid in capitalA | – | – | –C | –C | –C |
| Net asset value, end of period | $63.60 | $45.03 | $36.69 | $43.94 | $33.37 |
| Total ReturnD | 50.46% | 26.95% | (15.75)% | 33.28% | 7.42% |
| Ratios to Average Net AssetsE,F | | | | | |
| Expenses before reductions | 1.13% | 1.11% | 1.02% | 1.10% | 1.16% |
| Expenses net of fee waivers, if any | 1.13% | 1.11% | 1.02% | 1.10% | 1.16% |
| Expenses net of all reductions | 1.10% | 1.11% | 1.00% | 1.08% | 1.16% |
| Net investment income (loss) | (.24)% | .82% | .93% | 1.07% | 1.25% |
| Supplemental Data | | | | | |
| Net assets, end of period (000 omitted) | $1,578,782 | $993,620 | $913,940 | $1,286,331 | $922,265 |
| Portfolio turnover rateG | 114% | 61%H | 36% | 40% | 77% |
A Calculated based on average shares outstanding during the period.
B The amounts shown reflect certain reclassifications related to book to tax differences that were made in the year shown.
C Amount represents less than $.005 per share.
D Total returns would have been lower if certain expenses had not been reduced during the applicable periods shown.
E Fees and expenses of any underlying mutual funds or exchange-traded funds (ETFs) are not included in the Fund's expense ratio. The Fund indirectly bears its proportionate share of these expenses. For additional expense information related to investments in Fidelity Central Funds, please refer to the "Investments in Fidelity Central Funds" note found in the Notes to Financial Statements section of the most recent Annual or Semi-Annual report.
F Expense ratios reflect operating expenses of the class. Expenses before reductions do not reflect amounts reimbursed, waived, or reduced through arrangements with the investment advisor, brokerage services, or other offset arrangements, if applicable, and do not represent the amount paid by the class during periods when reimbursements, waivers or reductions occur.
G Amount does not include the portfolio activity of any underlying mutual funds or exchange-traded funds (ETFs).
H Portfolio turnover rate excludes securities received or delivered in-kind.
See accompanying notes which are an integral part of the financial statements.
Notes to Financial Statements
For the period ended October 31, 2020
1. Organization.
Fidelity Emerging Asia Fund (the Fund) is a fund of Fidelity Investment Trust (the Trust) and is authorized to issue an unlimited number of shares. Share transactions on the Statement of Changes in Net Assets may contain exchanges between affiliated funds. The Trust is registered under the Investment Company Act of 1940, as amended (the 1940 Act), as an open-end management investment company organized as a Massachusetts business trust. The Fund's investments in emerging markets can be subject to social, economic, regulatory, and political uncertainties and can be extremely volatile.
Effective January 1, 2020:
Investment advisers Fidelity Investments Money Management, Inc., FMR Co., Inc., and Fidelity SelectCo, LLC, merged with and into Fidelity Management & Research Company. In connection with the merger transactions, the resulting, merged investment adviser was then redomiciled from Massachusetts to Delaware, changed its corporate structure from a corporation to a limited liability company, and changed its name to "Fidelity Management & Research Company LLC".
Fidelity Investments Institutional Operations Company, Inc. converted from a Massachusetts corporation to a Massachusetts LLC, and changed its name to "Fidelity Investments Institutional Operations Company LLC".
2. Investments in Fidelity Central Funds.
The Fund invests in Fidelity Central Funds, which are open-end investment companies generally available only to other investment companies and accounts managed by the investment adviser and its affiliates. The Fund's Schedule of Investments lists each of the Fidelity Central Funds held as of period end, if any, as an investment of the Fund, but does not include the underlying holdings of each Fidelity Central Fund. As an Investing Fund, the Fund indirectly bears its proportionate share of the expenses of the underlying Fidelity Central Funds.
The Money Market Central Funds seek preservation of capital and current income and are managed by the investment adviser. Annualized expenses of the Money Market Central Funds as of their most recent shareholder report date ranged from less than .005% to .01%.
A complete unaudited list of holdings for each Fidelity Central Fund is available upon request or at the Securities and Exchange Commission (the SEC) website at www.sec.gov. In addition, the financial statements of the Fidelity Central Funds, which are not covered by the Fund's Report of Independent Registered Public Accounting Firm, are available on the SEC website or upon request.
3. Significant Accounting Policies.
The Fund is an investment company and applies the accounting and reporting guidance of the Financial Accounting Standards Board (FASB) Accounting Standards Codification Topic 946 Financial Services – Investment Companies. The financial statements have been prepared in conformity with accounting principles generally accepted in the United States of America (GAAP), which require management to make certain estimates and assumptions at the date of the financial statements. Actual results could differ from those estimates. Subsequent events, if any, through the date that the financial statements were issued have been evaluated in the preparation of the financial statements. The following summarizes the significant accounting policies of the Fund:
Investment Valuation. Investments are valued as of 4:00 p.m. Eastern time on the last calendar day of the period. The Board of Trustees (the Board) has delegated the day to day responsibility for the valuation of the Fund's investments to the Fair Value Committee (the Committee) established by the Fund's investment adviser. In accordance with valuation policies and procedures approved by the Board, the Fund attempts to obtain prices from one or more third party pricing vendors or brokers to value its investments. When current market prices, quotations or currency exchange rates are not readily available or reliable, investments will be fair valued in good faith by the Committee, in accordance with procedures adopted by the Board. Factors used in determining fair value vary by investment type and may include market or investment specific events. The frequency with which these procedures are used cannot be predicted and they may be utilized to a significant extent. The Committee oversees the Fund's valuation policies and procedures and reports to the Board on the Committee's activities and fair value determinations. The Board monitors the appropriateness of the procedures used in valuing the Fund's investments and ratifies the fair value determinations of the Committee.
The Fund categorizes the inputs to valuation techniques used to value its investments into a disclosure hierarchy consisting of three levels as shown below:
- Level 1 – quoted prices in active markets for identical investments
- Level 2 – other significant observable inputs (including quoted prices for similar investments, interest rates, prepayment speeds, etc.)
- Level 3 – unobservable inputs (including the Fund's own assumptions based on the best information available)
Valuation techniques used to value the Fund's investments by major category are as follows:
Equity securities, including restricted securities, for which market quotations are readily available, are valued at the last reported sale price or official closing price as reported by a third party pricing vendor on the primary market or exchange on which they are traded and are categorized as Level 1 in the hierarchy. In the event there were no sales during the day or closing prices are not available, securities are valued at the last quoted bid price or may be valued using the last available price and are generally categorized as Level 2 in the hierarchy. For foreign equity securities, when market or security specific events arise, comparisons to the valuation of American Depositary Receipts (ADRs), futures contracts, Exchange-Traded Funds (ETFs) and certain indexes as well as quoted prices for similar securities may be used and would be categorized as Level 2 in the hierarchy. For equity securities, including restricted securities, where observable inputs are limited, assumptions about market activity and risk are used and these securities may be categorized as Level 3 in the hierarchy. Securities, including private placements or other restricted securities, for which observable inputs are not available are valued using alternate valuation approaches, including the market approach, the income approach and cost approach, and are categorized as Level 3 in the hierarchy. The market approach considers factors including the price of recent investments in the same or a similar security or financial metrics of comparable securities. The income approach considers factors including expected future cash flows, security specific risks and corresponding discount rates. The cost approach considers factors including the value of the security's underlying assets and liabilities.
Investments in open-end mutual funds, including the Fidelity Central Funds, are valued at their closing net asset value (NAV) each business day and are categorized as Level 1 in the hierarchy.
Changes in valuation techniques may result in transfers in or out of an assigned level within the disclosure hierarchy. The aggregate value of investments by input level as of October 31, 2020 is included at the end of the Fund's Schedule of Investments.
Foreign Currency. Certain Funds may use foreign currency contracts to facilitate transactions in foreign-denominated securities. Gains and losses from these transactions may arise from changes in the value of the foreign currency or if the counterparties do not perform under the contracts' terms.
Foreign-denominated assets, including investment securities, and liabilities are translated into U.S. dollars at the exchange rates at period end. Purchases and sales of investment securities, income and dividends received, and expenses denominated in foreign currencies are translated into U.S. dollars at the exchange rate in effect on the transaction date.
The effects of exchange rate fluctuations on investments are included with the net realized and unrealized gain (loss) on investment securities. Other foreign currency transactions resulting in realized and unrealized gain (loss) are disclosed separately.
Investment Transactions and Income. For financial reporting purposes, the Fund's investment holdings and NAV include trades executed through the end of the last business day of the period. The NAV per share for processing shareholder transactions is calculated as of the close of business of the New York Stock Exchange (NYSE), normally 4:00 p.m. Eastern time and includes trades executed through the end of the prior business day. Gains and losses on securities sold are determined on the basis of identified cost and include proceeds received from litigation. Dividend income is recorded on the ex-dividend date, except for certain dividends from foreign securities where the ex-dividend date may have passed, which are recorded as soon as the Fund is informed of the ex-dividend date. Non-cash dividends included in dividend income, if any, are recorded at the fair market value of the securities received. Income and capital gain distributions from Fidelity Central Funds, if any, are recorded on the ex-dividend date. Certain distributions received by the Fund represent a return of capital or capital gain. The Fund determines the components of these distributions subsequent to the ex-dividend date, based upon receipt of tax filings or other correspondence relating to the underlying investment. These distributions are recorded as a reduction of cost of investments and/or as a realized gain. Investment income is recorded net of foreign taxes withheld where recovery of such taxes is uncertain.
Expenses. Expenses directly attributable to a fund are charged to that fund. Expenses attributable to more than one fund are allocated among the respective funds on the basis of relative net assets or other appropriate methods. Expense estimates are accrued in the period to which they relate and adjustments are made when actual amounts are known.
Income Tax Information and Distributions to Shareholders. Each year, the Fund intends to qualify as a regulated investment company under Subchapter M of the Internal Revenue Code, including distributing substantially all of its taxable income and realized gains. As a result, no provision for U.S. Federal income taxes is required. As of October 31, 2020, the Fund did not have any unrecognized tax benefits in the financial statements; nor is the Fund aware of any tax positions for which it is reasonably possible that the total amounts of unrecognized tax benefits will significantly change in the next twelve months. The Fund files a U.S. federal tax return, in addition to state and local tax returns as required. The Fund's federal income tax returns are subject to examination by the Internal Revenue Service (IRS) for a period of three fiscal years after they are filed. State and local tax returns may be subject to examination for an additional fiscal year depending on the jurisdiction. Foreign taxes are provided for based on the Fund's understanding of the tax rules and rates that exist in the foreign markets in which it invests. The Fund is subject to a tax imposed on capital gains by certain countries in which it invests. An estimated deferred tax liability for net unrealized appreciation on the applicable securities is included in Other payables and accrued expenses on the Statement of Assets & Liabilities.
Distributions are declared and recorded on the ex-dividend date. Income and capital gain distributions are determined in accordance with income tax regulations, which may differ from GAAP. These differences resulted in distribution reclassifications. In addition, the Fund claimed a portion of the payment made to redeeming shareholders as a distribution for income tax purposes.
Capital accounts within the financial statements are adjusted for permanent book-tax differences. These adjustments have no impact on net assets or the results of operations. Capital accounts are not adjusted for temporary book-tax differences which will reverse in a subsequent period.
Book-tax differences are primarily due to foreign currency transactions, certain foreign taxes, passive foreign investment companies (PFIC), net operating losses and losses deferred due to wash sales.
As of period end, the cost and unrealized appreciation (depreciation) in securities, and derivatives if applicable, for federal income tax purposes were as follows:
| Gross unrealized appreciation | $496,162,937 |
| Gross unrealized depreciation | (52,331,121) |
| Net unrealized appreciation (depreciation) | $443,831,816 |
| Tax Cost | $1,190,403,948 |
The tax-based components of distributable earnings as of period end were as follows:
| Undistributed ordinary income | $124,671,290 |
| Undistributed long-term capital gain | $138,440,248 |
| Net unrealized appreciation (depreciation) on securities and other investments | $443,618,368 |
The tax character of distributions paid was as follows:
| | October 31, 2020 | October 31, 2019 |
| Ordinary Income | $7,703,502 | $ 9,516,819 |
| Long-term Capital Gains | 53,990,726 | 21,418,927 |
| Total | $61,694,228 | $ 30,935,746 |
Restricted Securities (including Private Placements). The Fund may invest in securities that are subject to legal or contractual restrictions on resale. These securities generally may be resold in transactions exempt from registration or to the public if the securities are registered. Disposal of these securities may involve time-consuming negotiations and expense, and prompt sale at an acceptable price may be difficult. Information regarding restricted securities is included at the end of the Fund's Schedule of Investments.
4. Purchases and Sales of Investments.
Purchases and sales of securities, other than short-term securities, are noted in the table below.
| | Purchases ($) | Sales ($) |
| Fidelity Emerging Asia Fund | 1,374,918,837 | 1,300,315,354 |
5. Fees and Other Transactions with Affiliates.
Management Fee. Fidelity Management & Research Company LLC (the investment adviser) and its affiliates provide the Fund with investment management related services for which the Fund pays a monthly management fee. The management fee is the sum of an individual fund fee rate that is based on an annual rate of .45% of the Fund's average net assets and an annualized group fee rate that averaged .23% during the period. The group fee rate is based upon the monthly average net assets of a group of registered investment companies with which the investment adviser has management contracts. The group fee rate decreases as assets under management increase and increases as assets under management decrease. In addition, the management fee is subject to a performance adjustment (up to a maximum of +/- .20% of the Fund's average net assets over a 36 month performance period). The upward or downward adjustment to the management fee is based on the Fund's relative investment performance as compared to its benchmark index, the MSCI All Country Asia ex Japan Index, over the same 36 month performance period). For the reporting period, the total annual management fee rate, including the performance adjustment, was .87% of the Fund's average net assets. The performance adjustment included in the management fee rate may be higher or lower than the maximum performance adjustment rate due to the difference between the average net assets for the reporting and performance periods.
Transfer Agent Fees. Fidelity Investments Institutional Operations Company LLC (FIIOC), an affiliate of the investment adviser, is the Fund's transfer, dividend disbursing and shareholder servicing agent. FIIOC receives account fees and asset-based fees that vary according to account size and type of account. FIIOC pays for typesetting, printing and mailing of shareholder reports, except proxy statements. For the period, the transfer agent fees were equivalent to an annual rate of .16% of average net assets.
Accounting Fees. Fidelity Service Company, Inc. (FSC), an affiliate of the investment adviser, maintains the Fund's accounting records. The accounting fee is based on the level of average net assets for each month. For the period, the fees were equivalent to the following annual rates:
| | % of Average Net Assets |
| Fidelity Emerging Asia Fund | .05 |
Brokerage Commissions. A portion of portfolio transactions were placed with brokerage firms which are affiliates of the investment adviser. Brokerage commissions are included in net realized gain (loss) and change in net unrealized appreciation (depreciation) in the Statement of Operations. The commissions paid to these affiliated firms were as follows:
| | Amount |
| Fidelity Emerging Asia Fund | $17,625 |
Interfund Lending Program. Pursuant to an Exemptive Order issued by the SEC, the Fund, along with other registered investment companies having management contracts with Fidelity Management & Research Company LLC (FMR), or other affiliated entities of FMR, may participate in an interfund lending program. This program provides an alternative credit facility allowing the Fund to borrow from, or lend money to, other participating affiliated funds. At period end, there were no interfund loans outstanding. Activity in this program during the period for which loans were outstanding was as follows:
| | Borrower or Lender | Average Loan Balance | Weighted Average Interest Rate | Interest Expense |
| Fidelity Emerging Asia Fund | Borrower | $9,863,867 | 1.26% | $5,172 |
Interfund Trades. Funds may purchase from or sell securities to other Fidelity Funds under procedures adopted by the Board. The procedures have been designed to ensure these interfund trades are executed in accordance with Rule 17a-7 of the 1940 Act. Interfund trades are included within the respective purchases and sales amounts shown in the Purchases and Sales of Investments note.
Prior Fiscal Year Affiliated Redemptions In-Kind. During the prior period, 667,060 shares of the Fund were redeemed in-kind for investments and cash with a value of $27,823,070. The Fund had a net realized gain of $9,780,162 on investments delivered through in-kind redemptions. The amount of the in-kind redemptions is included in share transactions in the accompanying Statement of Changes in Net Assets. The Fund recognized no gain or loss for federal income tax purposes.
6. Committed Line of Credit.
Certain Funds participate with other funds managed by the investment adviser or an affiliate in a $4.25 billion credit facility (the "line of credit") to be utilized for temporary or emergency purposes to fund shareholder redemptions or for other short-term liquidity purposes. The participating funds have agreed to pay commitment fees on their pro-rata portion of the line of credit, which are reflected in Miscellaneous expenses on the Statement of Operations, and are as follows:
| | Amount |
| Fidelity Emerging Asia Fund | $2,607 |
During the period, there were no borrowings on this line of credit.
7. Security Lending.
Funds lend portfolio securities from time to time in order to earn additional income. Lending agents are used, including National Financial Services (NFS), an affiliate of the investment adviser. Pursuant to a securities lending agreement, NFS will receive a fee, which is capped at 9.9% of a fund's daily lending revenue, for its services as lending agent. A fund may lend securities to certain qualified borrowers, including NFS. On the settlement date of the loan, a fund receives collateral (in the form of U.S. Treasury obligations, letters of credit and/or cash) against the loaned securities and maintains collateral in an amount not less than 100% of the market value of the loaned securities during the period of the loan. The market value of the loaned securities is determined at the close of business of a fund and any additional required collateral is delivered to a fund on the next business day. A fund or borrower may terminate the loan at any time, and if the borrower defaults on its obligation to return the securities loaned because of insolvency or other reasons, a fund may apply collateral received from the borrower against the obligation. A fund may experience delays and costs in recovering the securities loaned. Any cash collateral received is invested in the Fidelity Securities Lending Cash Central Fund. Any loaned securities are identified as such in the Schedule of Investments, and the value of loaned securities and cash collateral at period end, as applicable, are presented in the Statement of Assets and Liabilities. Security lending income represents the income earned on investing cash collateral, less rebates paid to borrowers and any lending agent fees associated with the loan, plus any premium payments received for lending certain types of securities. Security lending income is presented in the Statement of Operations as a component of income from Fidelity Central Funds. Affiliated security lending activity, if any, was as follows:
| | Total Security Lending Income Fees Paid to NFS | Security Lending Income From Securities Loaned to NFS | Value of Securities Loaned to NFS at Period End |
| Fidelity Emerging Asia Fund | $30,642 | $36,915 | $2,643,649 |
8. Bank Borrowings.
The Fund is permitted to have bank borrowings for temporary or emergency purposes to fund shareholder redemptions or for other short-term liquidity requirements. The Fund has established borrowing arrangements with certain banks. The interest rate on the borrowings is the bank's base rate, as revised from time to time. Any open loans, including accrued interest, at period end are presented under the caption "Notes payable" in the Statement of Assets and Liabilities, if applicable. Activity in this program during the period for which loans were outstanding was as follows:
| | Average Loan Balance | Weighted Average Interest Rate | Interest Expense |
| Fidelity Emerging Asia Fund | $1,703,857 | .55% | $182 |
9. Expense Reductions.
Commissions paid to certain brokers with whom the investment adviser, or its affiliates, places trades on behalf of the Fund include an amount in addition to trade execution, which may be rebated back to the Fund to offset certain expenses. This amount totaled $318,730 for the period. In addition, through arrangements with the Fund's custodian, credits realized as a result of certain uninvested cash balances were used to reduce the Fund's expenses by $284.
In addition, during the period the investment adviser or an affiliate reimbursed and/or waived a portion of operating expenses in the amount of $4,123.
10. Other.
The Fund's organizational documents provide former and current trustees and officers with a limited indemnification against liabilities arising in connection with the performance of their duties to the Fund. In the normal course of business, the Fund may also enter into contracts that provide general indemnifications. The Fund's maximum exposure under these arrangements is unknown as this would be dependent on future claims that may be made against the Fund. The risk of material loss from such claims is considered remote.
11. Coronavirus (COVID-19) Pandemic.
An outbreak of COVID-19 first detected in China during December 2019 has since spread globally and was declared a pandemic by the World Health Organization during March 2020. Developments that disrupt global economies and financial markets, such as the COVID-19 pandemic, may magnify factors that affect the Fund's performance.
Fidelity® Emerging Markets Fund
Performance: The Bottom Line
Average annual total return reflects the change in the value of an investment, assuming reinvestment of distributions from dividend income and capital gains (the profits earned upon the sale of securities that have grown in value, if any) and assuming a constant rate of performance each year. The hypothetical investment and the average annual total returns do not reflect the deduction of taxes that a shareholder would pay on fund distributions or the redemption of fund shares. During periods of reimbursement by Fidelity, a fund’s total return will be greater than it would be had the reimbursement not occurred. How a fund did yesterday is no guarantee of how it will do tomorrow.
Average Annual Total Returns
| For the periods ended October 31, 2020 | Past 1 year | Past 5 years | Past 10 years |
| Fidelity® Emerging Markets Fund | 24.09% | 13.27% | 5.56% |
| Class K | 24.24% | 13.44% | 5.74% |
$10,000 Over 10 Years
Let's say hypothetically that $10,000 was invested in Fidelity® Emerging Markets Fund, a class of the fund, on October 31, 2010.
The chart shows how the value of your investment would have changed, and also shows how the MSCI Emerging Markets Index performed over the same period.
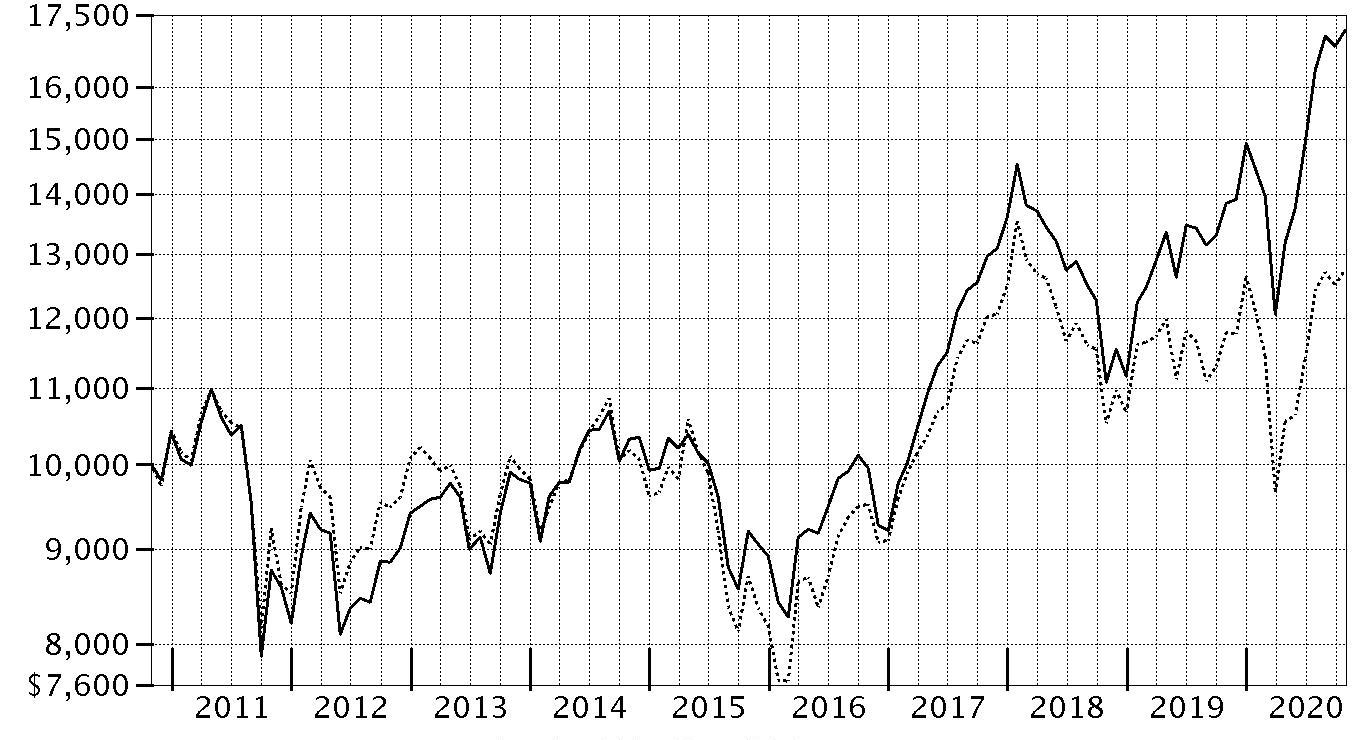
| Period Ending Values |
| $17,172 | Fidelity® Emerging Markets Fund |
| $12,759 | MSCI Emerging Markets Index |
Fidelity® Emerging Markets Fund
Management's Discussion of Fund Performance
Market Recap: The MSCI ACWI (All Country World Index) ex USA Index returned -2.46% for the 12 months ending October 31, 2020, in what was a bumpy ride for non-U.S. equities, marked by a steep but brief decline due to the early-2020 outbreak and spread of the coronavirus, followed by a sharp upturn. Declared a pandemic on March 11, the crisis and containment efforts caused broad contraction in economic activity, elevated volatility and dislocation in financial markets. A historically rapid and expansive monetary- and fiscal-policy response around the world provided a partial offset to the economic disruption. Other supporting factors included resilient corporate earnings and near-term potential for a COVID-19 vaccine breakthrough. This was evident in the index’s 12.28% gain in the final six months of the year. Currency fluctuation generally boosted foreign developed-markets equities for the year, while the reverse was true for emerging-markets stocks. Late in the period, the index was pressured by a second wave of COVID-19 cases in some regions, and stretched valuations and crowded positioning in big tech. For the full year, the U.K. (-22%), Asia Pacific ex Japan (-8%), Canada (-5%) and Europe ex U.K. (-4%) notably lagged. Emerging markets (+9%) and Japan (+1%) outperformed. By sector, energy (-38%), financials and real estate (-20% each) lagged, whereas information technology (+ 25%) and communication services (+15%) topped the index.
Comments from Portfolio Manager John Dance: For the fiscal year ending October 31, 2020, the fund's share classes gained about 24%, notably outperforming the 8.27% result of the benchmark MSCI Emerging Markets Index (Net MA). From a regional standpoint, stock picks in Emerging Asia – China especially – along with an underweighting and security selection in Latin America and non-benchmark exposure to the U.S., contributed most to the fund's relative result. Among sectors, security selection was the primary contributor versus the benchmark, especially within the food, beverage & tobacco area of the consumer staples sector. Investment choices among communication services and energy stocks also helped. The biggest individual relative contributor was an overweight position in Tencent Holdings (+86%), one of the fund's biggest holdings. Another key relative contributor was an out-of-benchmark stake in Nvidia (+152%). This was among the portfolio’s largest holdings at period end. Adding further value was an outsized stake in Pinduoduo (+121%). This period we increased our stake in the company. Conversely, an underweighting in Emerging Asia and exposure to Emerging Europe, specifically Hungary, hindered the fund's relative result. By sector, the primary detractor from performance versus the benchmark was an underweighting in communication services, though picks in consumer discretionary and real estate also hurt. Not owning Meituan, a benchmark component that gained about 211%, was the biggest individual relative detractor. Also weighing on the portfolio’s relative return was the decision to avoid JD.com, a benchmark component that gained roughly 162% the past 12 months. Another notable relative detractor was an overweighting in Rumo (-42%). Notable changes in positioning include decreased exposure to Brazil and a higher allocation to China. By sector, meaningful changes in positioning include increased exposure to communication services and health care.
The views expressed above reflect those of the portfolio manager(s) only through the end of the period as stated on the cover of this report and do not necessarily represent the views of Fidelity or any other person in the Fidelity organization. Any such views are subject to change at any time based upon market or other conditions and Fidelity disclaims any responsibility to update such views. These views may not be relied on as investment advice and, because investment decisions for a Fidelity fund are based on numerous factors, may not be relied on as an indication of trading intent on behalf of any Fidelity fund.
Fidelity® Emerging Markets Fund
Investment Summary (Unaudited)
Geographic Diversification (% of fund's net assets)
| As of October 31, 2020 |
| | Cayman Islands | 24.6% |
| | China | 14.6% |
| | United States of America* | 11.1% |
| | India | 10.5% |
| | Taiwan | 8.6% |
| | Korea (South) | 5.3% |
| | Brazil | 4.1% |
| | France | 3.0% |
| | South Africa | 2.7% |
| | Other | 15.5% |

* Includes Short-Term investments and Net Other Assets (Liabilities).
Percentages are based on country or territory of incorporation and are adjusted for the effect of futures contracts, if applicable.
Asset Allocation as of October 31, 2020
| | % of fund's net assets |
| Stocks | 97.0 |
| Short-Term Investments and Net Other Assets (Liabilities) | 3.0 |
Top Ten Stocks as of October 31, 2020
| | % of fund's net assets |
| Alibaba Group Holding Ltd. (Cayman Islands, Internet & Direct Marketing Retail) | 10.1 |
| Tencent Holdings Ltd. (Cayman Islands, Interactive Media & Services) | 9.0 |
| Taiwan Semiconductor Manufacturing Co. Ltd. (Taiwan, Semiconductors & Semiconductor Equipment) | 6.6 |
| Samsung Electronics Co. Ltd. (Korea (South), Technology Hardware, Storage & Peripherals) | 4.0 |
| Reliance Industries Ltd. (India, Oil, Gas & Consumable Fuels) | 3.4 |
| Naspers Ltd. Class N (South Africa, Internet & Direct Marketing Retail) | 2.1 |
| Kweichow Moutai Co. Ltd. (A Shares) (China, Beverages) | 1.9 |
| NVIDIA Corp. (United States of America, Semiconductors & Semiconductor Equipment) | 1.7 |
| Ping An Insurance Group Co. of China Ltd. (H Shares) (China, Insurance) | 1.7 |
| Pinduoduo, Inc. ADR (Cayman Islands, Internet & Direct Marketing Retail) | 1.6 |
| | 42.1 |
Top Market Sectors as of October 31, 2020
| | % of fund's net assets |
| Information Technology | 22.0 |
| Consumer Discretionary | 19.7 |
| Communication Services | 13.6 |
| Financials | 12.8 |
| Health Care | 7.7 |
| Consumer Staples | 6.4 |
| Industrials | 5.1 |
| Energy | 4.8 |
| Materials | 3.0 |
| Real Estate | 1.0 |
Fidelity® Emerging Markets Fund
Schedule of Investments October 31, 2020
Showing Percentage of Net Assets
| Common Stocks - 97.0% | | | |
| | | Shares | Value |
| Bermuda - 0.6% | | | |
| Credicorp Ltd. (United States) | | 213,831 | $24,522,139 |
| Vostok Emerging Finance Ltd. (depository receipt) (a) | | 33,013,400 | 10,054,202 |
|
| TOTAL BERMUDA | | | 34,576,341 |
|
| Brazil - 4.1% | | | |
| BM&F BOVESPA SA | | 3,800,300 | 33,810,911 |
| Boa Vista Servicos SA (a) | | 11,284,338 | 26,686,964 |
| Hapvida Participacoes e Investimentos SA (b) | | 2,637,300 | 29,586,002 |
| Localiza Rent A Car SA | | 4,598,345 | 48,628,443 |
| Lojas Renner SA | | 3,086,350 | 20,143,746 |
| Rumo SA (a) | | 11,754,667 | 37,571,013 |
| Suzano Papel e Celulose SA (a) | | 4,310,100 | 37,595,396 |
|
| TOTAL BRAZIL | | | 234,022,475 |
|
| Cayman Islands - 24.6% | | | |
| Alibaba Group Holding Ltd.(a) | | 2,113,000 | 80,069,750 |
| Alibaba Group Holding Ltd. sponsored ADR (a) | | 1,636,554 | 498,641,638 |
| Chailease Holding Co. Ltd. | | 6,005,000 | 29,071,009 |
| Hansoh Pharmaceutical Group Co. Ltd. (a)(b) | | 8,376,000 | 37,328,707 |
| Kangji Medical Holdings Ltd. | | 2,014,500 | 5,208,727 |
| New Oriental Education & Technology Group, Inc. sponsored ADR (a) | | 399,087 | 64,005,573 |
| Pinduoduo, Inc. ADR (a) | | 1,021,100 | 91,878,578 |
| Sea Ltd. ADR (a) | | 227,200 | 35,829,440 |
| Shenzhou International Group Holdings Ltd. | | 3,503,700 | 60,515,373 |
| Tencent Holdings Ltd. | | 6,755,800 | 516,181,320 |
|
| TOTAL CAYMAN ISLANDS | | | 1,418,730,115 |
|
| China - 14.6% | | | |
| Angel Yeast Co. Ltd. (A Shares) | | 7,650,832 | 60,478,513 |
| Anhui Conch Cement Co. Ltd. (H Shares) | | 8,625,500 | 53,794,637 |
| AVIC Jonhon OptronicTechnology Co. Ltd. | | 8,777,094 | 72,821,899 |
| Chongqing Fuling Zhacai Group Co. Ltd. Group (A Shares) | | 2,383,122 | 14,905,453 |
| Foshan Haitian Flavouring & Food Co. Ltd. (A Shares) | | 2,296,147 | 55,016,715 |
| Guangzhou GRG Metrology & Test Co. Ltd. (A Shares) | | 6,336,292 | 28,896,999 |
| Hangzhou Tigermed Consulting Co. Ltd. (H Shares) (a)(b) | | 1,348,500 | 21,656,014 |
| Kweichow Moutai Co. Ltd. (A Shares) | | 436,562 | 109,195,981 |
| Midea Group Co. Ltd. (A Shares) | | 5,128,948 | 59,922,940 |
| Ping An Insurance Group Co. of China Ltd. (H Shares) | | 9,257,000 | 95,714,358 |
| Shandong Sinocera Functional Material Co. Ltd. (A Shares) | | 5,642,510 | 34,696,203 |
| Shanghai Bairun Investment Holding Group Co. Ltd. (A Shares) | | 3,721,722 | 37,143,436 |
| Shanghai M&G Stationery, Inc. (A Shares) | | 4,200,263 | 50,513,707 |
| Shenzhen Expressway Co. Ltd. (H Shares) | | 37,734,640 | 33,585,168 |
| Shenzhen Mindray Bio-Medical Electronics Co. Ltd. (A Shares) | | 1,299,756 | 75,321,964 |
| Wuliangye Yibin Co. Ltd. (A Shares) | | 878,330 | 32,149,846 |
| Zhejiang Starry Pharmaceutical Co. Ltd. | | 528,203 | 5,523,103 |
|
| TOTAL CHINA | | | 841,336,936 |
|
| France - 3.0% | | | |
| Dassault Systemes SA | | 222,276 | 37,937,947 |
| Hermes International SCA | | 49,219 | 45,801,004 |
| LVMH Moet Hennessy Louis Vuitton SE | | 103,199 | 48,374,290 |
| Sartorius Stedim Biotech | | 112,800 | 42,774,892 |
|
| TOTAL FRANCE | | | 174,888,133 |
|
| Hong Kong - 1.8% | | | |
| AIA Group Ltd. | | 4,806,600 | 45,745,260 |
| Hong Kong Exchanges and Clearing Ltd. | | 955,374 | 45,621,342 |
| Hysan Development Co. Ltd. | | 4,117,400 | 13,091,765 |
|
| TOTAL HONG KONG | | | 104,458,367 |
|
| Hungary - 0.6% | | | |
| Richter Gedeon PLC | | 1,628,800 | 33,224,585 |
| India - 10.5% | | | |
| Bajaj Finance Ltd. | | 701,200 | 31,093,789 |
| FSN Ecommerce Ventures Pvt Ltd. (c)(d) | | 56,464 | 4,589,497 |
| HDFC Bank Ltd. | | 3,598,694 | 57,129,798 |
| Housing Development Finance Corp. Ltd. | | 3,102,646 | 80,014,946 |
| Indian Energy Exchange Ltd. (b) | | 74,207 | 190,311 |
| Kotak Mahindra Bank Ltd. (a) | | 2,613,648 | 54,219,294 |
| Petronet LNG Ltd. | | 18,729,700 | 57,998,828 |
| Power Grid Corp. of India Ltd. | | 23,573,300 | 54,074,873 |
| Reliance Industries Ltd. | | 6,875,818 | 189,499,060 |
| Reliance Industries Ltd. | | 458,387 | 7,261,815 |
| Tata Consultancy Services Ltd. | | 1,834,800 | 65,734,555 |
|
| TOTAL INDIA | | | 601,806,766 |
|
| Indonesia - 2.0% | | | |
| PT Bank Central Asia Tbk | | 36,612,100 | 72,040,010 |
| PT Bank Rakyat Indonesia Tbk | | 198,794,294 | 45,001,459 |
|
| TOTAL INDONESIA | | | 117,041,469 |
|
| Japan - 1.8% | | | |
| Hoya Corp. | | 568,800 | 64,193,026 |
| Tokyo Electron Ltd. | | 148,000 | 39,724,809 |
|
| TOTAL JAPAN | | | 103,917,835 |
|
| Kenya - 1.2% | | | |
| Safaricom Ltd. | | 242,077,200 | 68,640,456 |
| Korea (South) - 5.3% | | | |
| NAVER Corp. | | 301,990 | 77,100,948 |
| Samsung Electronics Co. Ltd. | | 4,529,747 | 227,191,028 |
|
| TOTAL KOREA (SOUTH) | | | 304,291,976 |
|
| Luxembourg - 0.9% | | | |
| Globant SA (a) | | 287,672 | 51,956,440 |
| Mexico - 0.7% | | | |
| Banco del Bajio SA (a)(b) | | 19,933,700 | 16,483,374 |
| Grupo Aeroportuario Norte S.A.B. de CV (a) | | 5,181,011 | 23,380,071 |
|
| TOTAL MEXICO | | | 39,863,445 |
|
| Netherlands - 1.7% | | | |
| ASML Holding NV (Netherlands) | | 152,400 | 55,138,794 |
| Yandex NV Series A (a)(e) | | 700,787 | 40,344,308 |
|
| TOTAL NETHERLANDS | | | 95,483,102 |
|
| Philippines - 0.8% | | | |
| Ayala Land, Inc. | | 70,697,200 | 47,979,495 |
| Poland - 0.8% | | | |
| CD Projekt RED SA (a) | | 563,338 | 47,729,896 |
| Russia - 1.3% | | | |
| Lukoil PJSC sponsored ADR | | 511,800 | 26,132,508 |
| Sberbank of Russia | | 19,413,510 | 49,202,725 |
|
| TOTAL RUSSIA | | | 75,335,233 |
|
| South Africa - 2.7% | | | |
| Clicks Group Ltd. | | 2,356,177 | 34,078,355 |
| Naspers Ltd. Class N | | 609,112 | 118,915,451 |
|
| TOTAL SOUTH AFRICA | | | 152,993,806 |
|
| Switzerland - 0.8% | | | |
| Sika AG | | 182,553 | 44,933,979 |
| Taiwan - 8.6% | | | |
| E.SUN Financial Holdings Co. Ltd. | | 48,277,525 | 41,006,112 |
| eMemory Technology, Inc. | | 1,732,000 | 34,508,022 |
| Taiwan Semiconductor Manufacturing Co. Ltd. | | 25,044,000 | 378,834,737 |
| Voltronic Power Technology Corp. | | 1,172,868 | 40,176,540 |
|
| TOTAL TAIWAN | | | 494,525,411 |
|
| Thailand - 0.5% | | | |
| Thai Beverage PCL | | 62,714,300 | 26,670,411 |
| United States of America - 8.1% | | | |
| Adobe, Inc. (a) | | 101,978 | 45,594,364 |
| Aspen Technology, Inc. (a) | | 448,500 | 49,249,785 |
| AstraZeneca PLC sponsored ADR | | 536,900 | 26,930,904 |
| Intuitive Surgical, Inc. (a) | | 71,500 | 47,696,220 |
| Lam Research Corp. | | 146,908 | 50,254,289 |
| Micron Technology, Inc. (a) | | 924,300 | 46,529,262 |
| NVIDIA Corp. | | 193,477 | 97,001,629 |
| Staar Surgical Co. (a) | | 211,900 | 15,362,750 |
| Thermo Fisher Scientific, Inc. | | 86,338 | 40,848,235 |
| Yum China Holdings, Inc. | | 930,900 | 49,551,807 |
|
| TOTAL UNITED STATES OF AMERICA | | | 469,019,245 |
|
| TOTAL COMMON STOCKS | | | |
| (Cost $3,501,558,709) | | | 5,583,425,917 |
|
| Money Market Funds - 4.1% | | | |
| Fidelity Cash Central Fund 0.10% (f) | | 225,852,863 | 225,898,034 |
| Fidelity Securities Lending Cash Central Fund 0.11% (f)(g) | | 9,440,231 | 9,441,175 |
| TOTAL MONEY MARKET FUNDS | | | |
| (Cost $235,339,209) | | | 235,339,209 |
| TOTAL INVESTMENT IN SECURITIES - 101.1% | | | |
| (Cost $3,736,897,918) | | | 5,818,765,126 |
| NET OTHER ASSETS (LIABILITIES) - (1.1)% | | | (65,137,243) |
| NET ASSETS - 100% | | | $5,753,627,883 |
Categorizations in the Schedule of Investments are based on country or territory of incorporation.
Legend
(a) Non-income producing
(b) Security exempt from registration under Rule 144A of the Securities Act of 1933. These securities may be resold in transactions exempt from registration, normally to qualified institutional buyers. At the end of the period, the value of these securities amounted to $105,244,408 or 1.8% of net assets.
(c) Level 3 security
(d) Restricted securities (including private placements) - Investment in securities not registered under the Securities Act of 1933 (excluding 144A issues). At the end of the period, the value of restricted securities (excluding 144A issues) amounted to $4,589,497 or 0.1% of net assets.
(e) Security or a portion of the security is on loan at period end.
(f) Affiliated fund that is generally available only to investment companies and other accounts managed by Fidelity Investments. The rate quoted is the annualized seven-day yield of the fund at period end. A complete unaudited listing of the fund's holdings as of its most recent quarter end is available upon request. In addition, each Fidelity Central Fund's financial statements, which are not covered by the Fund's Report of Independent Registered Public Accounting Firm, are available on the SEC's website or upon request.
(g) Investment made with cash collateral received from securities on loan.
Additional information on each restricted holding is as follows:
| Security | Acquisition Date | Acquisition Cost |
| FSN Ecommerce Ventures Pvt Ltd. | 10/7/20 - 10/26/20 | $4,649,356 |
Affiliated Central Funds
Information regarding fiscal year to date income earned by the Fund from investments in Fidelity Central Funds is as follows:
| Fund | Income earned |
| Fidelity Cash Central Fund | $676,288 |
| Fidelity Securities Lending Cash Central Fund | 37,269 |
| Total | $713,557 |
Amounts in the income column in the above table include any capital gain distributions from underlying funds, which are presented in the corresponding line-item in the Statement of Operations, if applicable. Amount for Fidelity Securities Lending Cash Central Fund represents the income earned on investing cash collateral, less rebates paid to borrowers and any lending agent fees associated with the loan, plus any premium payments received for lending certain types of securities.
Investment Valuation
The following is a summary of the inputs used, as of October 31, 2020, involving the Fund's assets and liabilities carried at fair value. The inputs or methodology used for valuing securities may not be an indication of the risk associated with investing in those securities. For more information on valuation inputs, and their aggregation into the levels used below, please refer to the Investment Valuation section in the accompanying Notes to Financial Statements.
| | Valuation Inputs at Reporting Date: |
| Description | Total | Level 1 | Level 2 | Level 3 |
| Investments in Securities: | | | | |
| Equities: | | | | |
| Communication Services | $785,826,368 | $192,544,100 | $593,282,268 | $-- |
| Consumer Discretionary | 1,142,409,647 | 830,537,719 | 307,282,431 | 4,589,497 |
| Consumer Staples | 369,638,710 | -- | 369,638,710 | -- |
| Energy | 280,892,211 | 26,132,508 | 254,759,703 | -- |
| Financials | 730,921,039 | 200,569,089 | 530,351,950 | -- |
| Health Care | 445,655,129 | 295,408,309 | 150,246,820 | -- |
| Industrials | 289,438,905 | 210,028,199 | 79,410,706 | -- |
| Information Technology | 1,252,477,560 | 413,031,738 | 839,445,822 | -- |
| Materials | 171,020,215 | 136,324,012 | 34,696,203 | -- |
| Real Estate | 61,071,260 | 13,091,765 | 47,979,495 | -- |
| Utilities | 54,074,873 | -- | 54,074,873 | -- |
| Money Market Funds | 235,339,209 | 235,339,209 | -- | -- |
| Total Investments in Securities: | $5,818,765,126 | $2,553,006,648 | $3,261,168,981 | $4,589,497 |
See accompanying notes which are an integral part of the financial statements.
Fidelity® Emerging Markets Fund
Financial Statements
Statement of Assets and Liabilities
| | | October 31, 2020 |
| Assets | | |
Investment in securities, at value (including securities loaned of $9,021,219) — See accompanying schedule:
Unaffiliated issuers (cost $3,501,558,709) | $5,583,425,917 | |
| Fidelity Central Funds (cost $235,339,209) | 235,339,209 | |
| Total Investment in Securities (cost $3,736,897,918) | | $5,818,765,126 |
| Foreign currency held at value (cost $2,007,604) | | 2,009,052 |
| Receivable for investments sold | | 8,952,339 |
| Receivable for fund shares sold | | 6,613,589 |
| Dividends receivable | | 3,741,918 |
| Distributions receivable from Fidelity Central Funds | | 15,481 |
| Prepaid expenses | | 7,877 |
| Other receivables | | 1,933,981 |
| Total assets | | 5,842,039,363 |
| Liabilities | | |
| Payable for investments purchased | $65,087,493 | |
| Payable for fund shares redeemed | 3,176,427 | |
| Accrued management fee | 3,241,303 | |
| Other affiliated payables | 748,328 | |
| Other payables and accrued expenses | 6,716,754 | |
| Collateral on securities loaned | 9,441,175 | |
| Total liabilities | | 88,411,480 |
| Net Assets | | $5,753,627,883 |
| Net Assets consist of: | | |
| Paid in capital | | $3,605,987,056 |
| Total accumulated earnings (loss) | | 2,147,640,827 |
| Net Assets | | $5,753,627,883 |
| Net Asset Value and Maximum Offering Price | | |
| Emerging Markets: | | |
| Net Asset Value, offering price and redemption price per share ($4,526,530,840 ÷ 112,421,624 shares) | | $40.26 |
| Class K: | | |
| Net Asset Value, offering price and redemption price per share ($1,227,097,043 ÷ 30,448,988 shares) | | $40.30 |
See accompanying notes which are an integral part of the financial statements.
Statement of Operations
| | | Year ended October 31, 2020 |
| Investment Income | | |
| Dividends | | $69,522,023 |
| Income from Fidelity Central Funds (including $37,269 from security lending) | | 713,557 |
| Income before foreign taxes withheld | | 70,235,580 |
| Less foreign taxes withheld | | (8,793,575) |
| Total income | | 61,442,005 |
| Expenses | | |
| Management fee | $31,368,578 | |
| Transfer agent fees | 6,233,541 | |
| Accounting fees | 1,549,208 | |
| Custodian fees and expenses | 1,359,655 | |
| Independent trustees' fees and expenses | 25,550 | |
| Registration fees | 170,486 | |
| Audit | 107,986 | |
| Legal | 7,761 | |
| Interest | 68 | |
| Miscellaneous | 87,445 | |
| Total expenses before reductions | 40,910,278 | |
| Expense reductions | (411,885) | |
| Total expenses after reductions | | 40,498,393 |
| Net investment income (loss) | | 20,943,612 |
| Realized and Unrealized Gain (Loss) | | |
| Net realized gain (loss) on: | | |
| Investment securities: | | |
| Unaffiliated issuers (net of foreign taxes of $8,565) | 150,922,436 | |
| Fidelity Central Funds | 4,559 | |
| Foreign currency transactions | (946,561) | |
| Total net realized gain (loss) | | 149,980,434 |
| Change in net unrealized appreciation (depreciation) on: | | |
| Investment securities: | | |
| Unaffiliated issuers (net of increase in deferred foreign taxes of $1,627,991) | 815,023,378 | |
| Assets and liabilities in foreign currencies | (16,565) | |
| Total change in net unrealized appreciation (depreciation) | | 815,006,813 |
| Net gain (loss) | | 964,987,247 |
| Net increase (decrease) in net assets resulting from operations | | $985,930,859 |
See accompanying notes which are an integral part of the financial statements.
Statement of Changes in Net Assets
| | Year ended October 31, 2020 | Year ended October 31, 2019 |
| Increase (Decrease) in Net Assets | | |
| Operations | | |
| Net investment income (loss) | $20,943,612 | $90,392,260 |
| Net realized gain (loss) | 149,980,434 | 373,300,632 |
| Change in net unrealized appreciation (depreciation) | 815,006,813 | 477,537,004 |
| Net increase (decrease) in net assets resulting from operations | 985,930,859 | 941,229,896 |
| Distributions to shareholders | (76,670,557) | (35,645,109) |
| Share transactions - net increase (decrease) | 720,715,607 | (1,146,375,276) |
| Total increase (decrease) in net assets | 1,629,975,909 | (240,790,489) |
| Net Assets | | |
| Beginning of period | 4,123,651,974 | 4,364,442,463 |
| End of period | $5,753,627,883 | $4,123,651,974 |
See accompanying notes which are an integral part of the financial statements.
Financial Highlights
Fidelity Emerging Markets Fund
| Years ended October 31, | 2020 | 2019 | 2018 | 2017 | 2016 |
| Selected Per–Share Data | | | | | |
| Net asset value, beginning of period | $33.03 | $26.66 | $31.37 | $24.25 | $22.55 |
| Income from Investment Operations | | | | | |
| Net investment income (loss)A | .15 | .61B | .24 | .22 | .14 |
| Net realized and unrealized gain (loss) | 7.68 | 5.98 | (4.76) | 7.05 | 1.66 |
| Total from investment operations | 7.83 | 6.59 | (4.52) | 7.27 | 1.80 |
| Distributions from net investment income | (.60) | (.22) | (.16) | (.15) | (.11) |
| Distributions from net realized gain | – | –C | (.03) | – | – |
| Total distributions | (.60) | (.22) | (.19) | (.15) | (.11) |
| Redemption fees added to paid in capitalA | – | – | –C | –C | .01 |
| Net asset value, end of period | $40.26 | $33.03 | $26.66 | $31.37 | $24.25 |
| Total ReturnD | 24.09% | 24.91% | (14.51)% | 30.21% | 8.07% |
| Ratios to Average Net AssetsE,F | | | | | |
| Expenses before reductions | .92% | .94% | .96% | .97% | 1.01% |
| Expenses net of fee waivers, if any | .92% | .94% | .96% | .97% | 1.01% |
| Expenses net of all reductions | .91% | .92% | .92% | .96% | 1.00% |
| Net investment income (loss) | .43% | 2.02%B | .75% | .83% | .61% |
| Supplemental Data | | | | | |
| Net assets, end of period (000 omitted) | $4,526,531 | $3,104,887 | $3,493,583 | $3,933,401 | $3,014,957 |
| Portfolio turnover rateG | 34% | 85%H | 86% | 81% | 79% |
A Calculated based on average shares outstanding during the period.
B Net investment income per share reflects one or more large, non-recurring dividend(s) which amounted to $.34 per share. Such dividends are not annualized in the ratio of net investment income (loss) to average net assets. Excluding such non-recurring dividend(s) the ratio of net investment income (loss) to average net assets would have been .88%.
C Amount represents less than $.005 per share.
D Total returns would have been lower if certain expenses had not been reduced during the applicable periods shown.
E Fees and expenses of any underlying mutual funds or exchange-traded funds (ETFs) are not included in the Fund's expense ratio. The Fund indirectly bears its proportionate share of these expenses. For additional expense information related to investments in Fidelity Central Funds, please refer to the "Investments in Fidelity Central Funds" note found in the Notes to Financial Statements section of the most recent Annual or Semi-Annual report.
F Expense ratios reflect operating expenses of the class. Expenses before reductions do not reflect amounts reimbursed, waived, or reduced through arrangements with the investment adviser, brokerage services, or other offset arrangements, if applicable, and do not represent the amount paid by the class during periods when reimbursements, waivers or reductions occur.
G Amount does not include the portfolio activity of any underlying mutual funds or exchange-traded funds (ETFs).
H Portfolio turnover rate excludes securities received or delivered in-kind.
See accompanying notes which are an integral part of the financial statements.
Fidelity Emerging Markets Fund Class K
| Years ended October 31, | 2020 | 2019 | 2018 | 2017 | 2016 |
| Selected Per–Share Data | | | | | |
| Net asset value, beginning of period | $33.07 | $26.70 | $31.41 | $24.28 | $22.58 |
| Income from Investment Operations | | | | | |
| Net investment income (loss)A | .19 | .65B | .28 | .26 | .18 |
| Net realized and unrealized gain (loss) | 7.69 | 5.99 | (4.76) | 7.06 | 1.66 |
| Total from investment operations | 7.88 | 6.64 | (4.48) | 7.32 | 1.84 |
| Distributions from net investment income | (.65) | (.26) | (.20) | (.19) | (.15) |
| Distributions from net realized gain | – | –C | (.03) | – | – |
| Total distributions | (.65) | (.27)D | (.23) | (.19) | (.15) |
| Redemption fees added to paid in capitalA | – | – | –C | –C | .01 |
| Net asset value, end of period | $40.30 | $33.07 | $26.70 | $31.41 | $24.28 |
| Total ReturnE | 24.24% | 25.08% | (14.39)% | 30.44% | 8.27% |
| Ratios to Average Net AssetsF,G | | | | | |
| Expenses before reductions | .80% | .80% | .82% | .83% | .84% |
| Expenses net of fee waivers, if any | .80% | .80% | .82% | .82% | .84% |
| Expenses net of all reductions | .79% | .79% | .78% | .81% | .83% |
| Net investment income (loss) | .55% | 2.15%B | .89% | .98% | .78% |
| Supplemental Data | | | | | |
| Net assets, end of period (000 omitted) | $1,227,097 | $1,018,765 | $870,859 | $924,783 | $658,276 |
| Portfolio turnover rateH | 34% | 85%I | 86% | 81% | 79% |
A Calculated based on average shares outstanding during the period.
B Net investment income per share reflects one or more large, non-recurring dividend(s) which amounted to $.34 per share. Such dividends are not annualized in the ratio of net investment income (loss) to average net assets. Excluding such non-recurring dividend(s) the ratio of net investment income (loss) to average net assets would have been 1.02%.
C Amount represents less than $.005 per share.
D Total distributions per share do not sum due to rounding.
E Total returns would have been lower if certain expenses had not been reduced during the applicable periods shown.
F Fees and expenses of any underlying mutual funds or exchange-traded funds (ETFs) are not included in the Fund's expense ratio. The Fund indirectly bears its proportionate share of these expenses. For additional expense information related to investments in Fidelity Central Funds, please refer to the "Investments in Fidelity Central Funds" note found in the Notes to Financial Statements section of the most recent Annual or Semi-Annual report.
G Expense ratios reflect operating expenses of the class. Expenses before reductions do not reflect amounts reimbursed, waived, or reduced through arrangements with the investment adviser, brokerage services, or other offset arrangements, if applicable, and do not represent the amount paid by the class during periods when reimbursements, waivers or reductions occur.
H Amount does not include the portfolio activity of any underlying mutual funds or exchange-traded funds (ETFs).
I Portfolio turnover rate excludes securities received or delivered in-kind.
See accompanying notes which are an integral part of the financial statements.
Notes to Financial Statements
For the period ended October 31, 2020
1. Organization.
Fidelity Emerging Markets Fund (the Fund) is a fund of Fidelity Investment Trust (the Trust) and is authorized to issue an unlimited number of shares. The Trust is registered under the Investment Company Act of 1940, as amended (the 1940 Act), as an open-end management investment company organized as a Massachusetts business trust. The Fund offers Emerging Markets and Class K shares, each of which has equal rights as to assets and voting privileges. Each class has exclusive voting rights with respect to matters that affect that class. The Fund's investments in emerging markets can be subject to social, economic, regulatory, and political uncertainties and can be extremely volatile.
Effective January 1, 2020:
Investment advisers Fidelity Investments Money Management, Inc., FMR Co., Inc., and Fidelity SelectCo, LLC, merged with and into Fidelity Management & Research Company. In connection with the merger transactions, the resulting, merged investment adviser was then redomiciled from Massachusetts to Delaware, changed its corporate structure from a corporation to a limited liability company, and changed its name to "Fidelity Management & Research Company LLC".
Fidelity Investments Institutional Operations Company, Inc. converted from a Massachusetts corporation to a Massachusetts LLC, and changed its name to "Fidelity Investments Institutional Operations Company LLC".
2. Investments in Fidelity Central Funds.
The Fund invests in Fidelity Central Funds, which are open-end investment companies generally available only to other investment companies and accounts managed by the investment adviser and its affiliates. The Fund's Schedule of Investments lists each of the Fidelity Central Funds held as of period end, if any, as an investment of the Fund, but does not include the underlying holdings of each Fidelity Central Fund. As an Investing Fund, the Fund indirectly bears its proportionate share of the expenses of the underlying Fidelity Central Funds.
The Money Market Central Funds seek preservation of capital and current income and are managed by the investment adviser. Annualized expenses of the Money Market Central Funds as of their most recent shareholder report date ranged from less than .005% to .01%.
A complete unaudited list of holdings for each Fidelity Central Fund is available upon request or at the Securities and Exchange Commission (the SEC) website at www.sec.gov. In addition, the financial statements of the Fidelity Central Funds, which are not covered by the Fund's Report of Independent Registered Public Accounting Firm, are available on the SEC website or upon request.
3. Significant Accounting Policies.
The Fund is an investment company and applies the accounting and reporting guidance of the Financial Accounting Standards Board (FASB) Accounting Standards Codification Topic 946 Financial Services – Investment Companies. The financial statements have been prepared in conformity with accounting principles generally accepted in the United States of America (GAAP), which require management to make certain estimates and assumptions at the date of the financial statements. Actual results could differ from those estimates. Subsequent events, if any, through the date that the financial statements were issued have been evaluated in the preparation of the financial statements. The following summarizes the significant accounting policies of the Fund:
Investment Valuation. Investments are valued as of 4:00 p.m. Eastern time on the last calendar day of the period. The Board of Trustees (the Board) has delegated the day to day responsibility for the valuation of the Fund's investments to the Fair Value Committee (the Committee) established by the Fund's investment adviser. In accordance with valuation policies and procedures approved by the Board, the Fund attempts to obtain prices from one or more third party pricing vendors or brokers to value its investments. When current market prices, quotations or currency exchange rates are not readily available or reliable, investments will be fair valued in good faith by the Committee, in accordance with procedures adopted by the Board. Factors used in determining fair value vary by investment type and may include market or investment specific events. The frequency with which these procedures are used cannot be predicted and they may be utilized to a significant extent. The Committee oversees the Fund's valuation policies and procedures and reports to the Board on the Committee's activities and fair value determinations. The Board monitors the appropriateness of the procedures used in valuing the Fund's investments and ratifies the fair value determinations of the Committee.
The Fund categorizes the inputs to valuation techniques used to value its investments into a disclosure hierarchy consisting of three levels as shown below:
- Level 1 – quoted prices in active markets for identical investments
- Level 2 – other significant observable inputs (including quoted prices for similar investments, interest rates, prepayment speeds, etc.)
- Level 3 – unobservable inputs (including the Fund's own assumptions based on the best information available)
Valuation techniques used to value the Fund's investments by major category are as follows:
Equity securities, including restricted securities, for which market quotations are readily available, are valued at the last reported sale price or official closing price as reported by a third party pricing vendor on the primary market or exchange on which they are traded and are categorized as Level 1 in the hierarchy. In the event there were no sales during the day or closing prices are not available, securities are valued at the last quoted bid price or may be valued using the last available price and are generally categorized as Level 2 in the hierarchy. For foreign equity securities, when market or security specific events arise, comparisons to the valuation of American Depositary Receipts (ADRs), futures contracts, Exchange-Traded Funds (ETFs) and certain indexes as well as quoted prices for similar securities may be used and would be categorized as Level 2 in the hierarchy. For equity securities, including restricted securities, where observable inputs are limited, assumptions about market activity and risk are used and these securities may be categorized as Level 3 in the hierarchy.
Investments in open-end mutual funds, including the Fidelity Central Funds, are valued at their closing net asset value (NAV) each business day and are categorized as Level 1 in the hierarchy.
Changes in valuation techniques may result in transfers in or out of an assigned level within the disclosure hierarchy. The aggregate value of investments by input level as of October 31, 2020 is included at the end of the Fund's Schedule of Investments.
Foreign Currency. Certain Funds may use foreign currency contracts to facilitate transactions in foreign-denominated securities. Gains and losses from these transactions may arise from changes in the value of the foreign currency or if the counterparties do not perform under the contracts' terms.
Foreign-denominated assets, including investment securities, and liabilities are translated into U.S. dollars at the exchange rates at period end. Purchases and sales of investment securities, income and dividends received, and expenses denominated in foreign currencies are translated into U.S. dollars at the exchange rate in effect on the transaction date.
The effects of exchange rate fluctuations on investments are included with the net realized and unrealized gain (loss) on investment securities. Other foreign currency transactions resulting in realized and unrealized gain (loss) are disclosed separately.
Investment Transactions and Income. For financial reporting purposes, the Fund's investment holdings and NAV include trades executed through the end of the last business day of the period. The NAV per share for processing shareholder transactions is calculated as of the close of business of the New York Stock Exchange (NYSE), normally 4:00 p.m. Eastern time and includes trades executed through the end of the prior business day. Gains and losses on securities sold are determined on the basis of identified cost. Dividend income is recorded on the ex-dividend date, except for certain dividends from foreign securities where the ex-dividend date may have passed, which are recorded as soon as the Fund is informed of the ex-dividend date. Non-cash dividends included in dividend income, if any, are recorded at the fair market value of the securities received. Income and capital gain distributions from Fidelity Central Funds, if any, are recorded on the ex-dividend date. Certain distributions received by the Fund represent a return of capital or capital gain. The Fund determines the components of these distributions subsequent to the ex-dividend date, based upon receipt of tax filings or other correspondence relating to the underlying investment. These distributions are recorded as a reduction of cost of investments and/or as a realized gain. Investment income is recorded net of foreign taxes withheld where recovery of such taxes is uncertain.
Class Allocations and Expenses. Investment income, realized and unrealized capital gains and losses, common expenses of the Fund, and certain fund-level expense reductions, if any, are allocated daily on a pro-rata basis to each class based on the relative net assets of each class to the total net assets of the Fund. Each class differs with respect to transfer agent fees incurred. Certain expense reductions may also differ by class. For the reporting period, the allocated portion of income and expenses to each class as a percent of its average net assets may vary due to the timing of recording these transactions in relation to fluctuating net assets of the classes. Expenses directly attributable to a fund are charged to that fund. Expenses attributable to more than one fund are allocated among the respective funds on the basis of relative net assets or other appropriate methods. Expense estimates are accrued in the period to which they relate and adjustments are made when actual amounts are known.
Income Tax Information and Distributions to Shareholders. Each year, the Fund intends to qualify as a regulated investment company under Subchapter M of the Internal Revenue Code, including distributing substantially all of its taxable income and realized gains. As a result, no provision for U.S. Federal income taxes is required. As of October 31, 2020, the Fund did not have any unrecognized tax benefits in the financial statements; nor is the Fund aware of any tax positions for which it is reasonably possible that the total amounts of unrecognized tax benefits will significantly change in the next twelve months. The Fund files a U.S. federal tax return, in addition to state and local tax returns as required. The Fund's federal income tax returns are subject to examination by the Internal Revenue Service (IRS) for a period of three fiscal years after they are filed. State and local tax returns may be subject to examination for an additional fiscal year depending on the jurisdiction. Foreign taxes are provided for based on the Fund's understanding of the tax rules and rates that exist in the foreign markets in which it invests. The Fund is subject to a tax imposed on capital gains by certain countries in which it invests. An estimated deferred tax liability for net unrealized appreciation on the applicable securities is included in Other payables and accrued expenses on the Statement of Assets & Liabilities.
Distributions are declared and recorded on the ex-dividend date. Income and capital gain distributions are declared separately for each class. Income and capital gain distributions are determined in accordance with income tax regulations, which may differ from GAAP. In addition, the Fund claimed a portion of the payment made to redeeming shareholders as a distribution for income tax purposes.
Capital accounts within the financial statements are adjusted for permanent book-tax differences. These adjustments have no impact on net assets or the results of operations. Capital accounts are not adjusted for temporary book-tax differences which will reverse in a subsequent period.
Book-tax differences are primarily due to foreign currency transactions, passive foreign investment companies (PFIC), certain foreign taxes, capital loss carryforwards and losses deferred due to wash sales.
As of period end, the cost and unrealized appreciation (depreciation) in securities, and derivatives if applicable, for federal income tax purposes were as follows:
| Gross unrealized appreciation | $2,215,999,027 |
| Gross unrealized depreciation | (155,364,713) |
| Net unrealized appreciation (depreciation) | $2,060,634,314 |
| Tax Cost | $3,758,130,812 |
The tax-based components of distributable earnings as of period end were as follows:
| Undistributed ordinary income | $14,090,382 |
| Undistributed long-term capital gain | $79,813,499 |
| Net unrealized appreciation (depreciation) on securities and other investments | $2,059,808,824 |
The tax character of distributions paid was as follows:
| | October 31, 2020 | October 31, 2019 |
| Ordinary Income | $76,670,557 | $ 35,645,109 |
Restricted Securities (including Private Placements). The Fund may invest in securities that are subject to legal or contractual restrictions on resale. These securities generally may be resold in transactions exempt from registration or to the public if the securities are registered. Disposal of these securities may involve time-consuming negotiations and expense, and prompt sale at an acceptable price may be difficult. Information regarding restricted securities is included at the end of the Fund's Schedule of Investments.
4. Purchases and Sales of Investments.
Purchases and sales of securities, other than short-term securities, are noted in the table below.
| | Purchases ($) | Sales ($) |
| Fidelity Emerging Markets Fund | 2,084,915,510 | 1,530,311,710 |
5. Fees and Other Transactions with Affiliates.
Management Fee. Fidelity Management & Research Company LLC (the investment adviser) and its affiliates provide the Fund with investment management related services for which the Fund pays a monthly management fee. The management fee is the sum of an individual fund fee rate that is based on an annual rate of .45% of the Fund's average net assets and an annualized group fee rate that averaged .23% during the period. The group fee rate is based upon the monthly average net assets of a group of registered investment companies with which the investment adviser has management contracts. The group fee rate decreases as assets under management increase and increases as assets under management decrease. For the reporting period, the total annual management fee rate was .68% of the Fund's average net assets.
Transfer Agent Fees. Fidelity Investments Institutional Operations Company LLC (FIIOC), an affiliate of the investment adviser, is the transfer, dividend disbursing and shareholder servicing agent for each class of the Fund. FIIOC receives account fees and asset-based fees that vary according to the account size and type of account of the shareholders of Emerging Markets, except for Class K. FIIOC receives an asset-based fee of Class K's average net assets. FIIOC pays for typesetting, printing and mailing of shareholder reports, except proxy statements. Effective February 1, 2020, the Board approved to change the fee for Class K from .046% to .044%.
For the period, transfer agent fees for each class were as follows:
| | Amount | % of Class-Level Average Net Assets |
| Emerging Markets | $5,765,519 | .16 |
| Class K | 468,022 | .04 |
| | $6,233,541 | |
Accounting Fees. Fidelity Service Company, Inc. (FSC), an affiliate of the investment adviser, maintains the Fund's accounting records. The accounting fee is based on the level of average net assets for each month. For the period, the fees were equivalent to the following annual rates:
| | % of Average Net Assets |
| Fidelity Emerging Markets Fund | .03 |
Brokerage Commissions. A portion of portfolio transactions were placed with brokerage firms which are affiliates of the investment adviser. Brokerage commissions are included in net realized gain (loss) and change in net unrealized appreciation (depreciation) in the Statement of Operations. The commissions paid to these affiliated firms were as follows:
| | Amount |
| Fidelity Emerging Markets Fund | $10,003 |
Interfund Lending Program. Pursuant to an Exemptive Order issued by the SEC, the Fund, along with other registered investment companies having management contracts with Fidelity Management & Research Company LLC (FMR), or other affiliated entities of FMR, may participate in an interfund lending program. This program provides an alternative credit facility allowing the Fund to borrow from, or lend money to, other participating affiliated funds. At period end, there were no interfund loans outstanding. Activity in this program during the period for which loans were outstanding was as follows:
| | Borrower or Lender | Average Loan Balance | Weighted Average Interest Rate | Interest Expense |
| Fidelity Emerging Markets Fund | Borrower | $8,618,000 | .28% | $68 |
Interfund Trades. Funds may purchase from or sell securities to other Fidelity Funds under procedures adopted by the Board. The procedures have been designed to ensure these interfund trades are executed in accordance with Rule 17a-7 of the 1940 Act. Interfund trades are included within the respective purchases and sales amounts shown in the Purchases and Sales of Investments note.
Prior Fiscal Year Affiliated Redemptions In-Kind. During the prior period, 21,444,879 shares of the Fund were redeemed in-kind for investments and cash with a value of $696,283,067. The Fund had a net realized gain of $158,099,354 on investments delivered through in-kind redemptions. The amount of the in-kind redemptions is included in share transactions in the accompanying Statement of Changes in Net Assets as well as the Notes to Financial Statements. The Fund recognized no gain or loss for federal income tax purposes.
6. Committed Line of Credit.
Certain Funds participate with other funds managed by the investment adviser or an affiliate in a $4.25 billion credit facility (the "line of credit") to be utilized for temporary or emergency purposes to fund shareholder redemptions or for other short-term liquidity purposes. The participating funds have agreed to pay commitment fees on their pro-rata portion of the line of credit, which are reflected in Miscellaneous expenses on the Statement of Operations, and are as follows:
| | Amount |
| Fidelity Emerging Markets Fund | $10,546 |
During the period, there were no borrowings on this line of credit.
7. Security Lending.
Funds lend portfolio securities from time to time in order to earn additional income. Lending agents are used, including National Financial Services (NFS), an affiliate of the investment adviser. Pursuant to a securities lending agreement, NFS will receive a fee, which is capped at 9.9% of a fund's daily lending revenue, for its services as lending agent. A fund may lend securities to certain qualified borrowers, including NFS. On the settlement date of the loan, a fund receives collateral (in the form of U.S. Treasury obligations, letters of credit and/or cash) against the loaned securities and maintains collateral in an amount not less than 100% of the market value of the loaned securities during the period of the loan. The market value of the loaned securities is determined at the close of business of a fund and any additional required collateral is delivered to a fund on the next business day. A fund or borrower may terminate the loan at any time, and if the borrower defaults on its obligation to return the securities loaned because of insolvency or other reasons, a fund may apply collateral received from the borrower against the obligation. A fund may experience delays and costs in recovering the securities loaned. Any cash collateral received is invested in the Fidelity Securities Lending Cash Central Fund. Any loaned securities are identified as such in the Schedule of Investments, and the value of loaned securities and cash collateral at period end, as applicable, are presented in the Statement of Assets and Liabilities. Security lending income represents the income earned on investing cash collateral, less rebates paid to borrowers and any lending agent fees associated with the loan, plus any premium payments received for lending certain types of securities. Security lending income is presented in the Statement of Operations as a component of income from Fidelity Central Funds. Affiliated security lending activity, if any, was as follows:
| | Total Security Lending Income Fees Paid to NFS | Security Lending Income From Securities Loaned to NFS | Value of Securities Loaned to NFS at Period End |
| Fidelity Emerging Markets Fund | $2,322 | $1,270 | $– |
8. Expense Reductions.
Commissions paid to certain brokers with whom the investment adviser, or its affiliates, places trades on behalf of the Fund include an amount in addition to trade execution, which may be rebated back to the Fund to offset certain expenses. This amount totaled $381,388 for the period. In addition, through arrangements with the Fund's custodian, credits realized as a result of certain uninvested cash balances were used to reduce the Fund's expenses. During the period, custodian credits reduced the Fund's expenses by $13,045.
In addition, during the period the investment adviser or an affiliate reimbursed and/or waived a portion of fund-level operating expenses in the amount of $17,452.
9. Distributions to Shareholders.
Distributions to shareholders of each class were as follows:
| | Year ended
October 31, 2020 | Year ended
October 31, 2019 |
| Distributions to shareholders | | |
| Emerging Markets | $57,031,002 | $27,210,630 |
| Class K | 19,639,555 | 8,434,479 |
| Total | $76,670,557 | $35,645,109 |
10. Share Transactions.
Share transactions for each class were as follows and may contain automatic conversions between classes or exchanges between affiliated funds:
| | Shares | Shares | Dollars | Dollars |
| | Year ended October 31, 2020 | Year ended October 31, 2019 | Year ended October 31, 2020 | Year ended October 31, 2019 |
| Emerging Markets | | | | |
| Shares sold | 43,168,611 | 64,449,799 | $1,531,210,661 | $1,867,496,661 |
| Reinvestment of distributions | 1,515,070 | 956,493 | 50,270,030 | 25,710,532 |
| Shares redeemed | (26,256,594) | (102,449,927)(a) | (856,791,443) | (2,985,928,831)(a) |
| Net increase (decrease) | 18,427,087 | (37,043,635) | $724,689,248 | $(1,092,721,638) |
| Class K | | | | |
| Shares sold | 10,051,612 | 7,052,169 | $349,351,112 | $210,813,709 |
| Reinvestment of distributions | 591,909 | 313,899 | 19,639,530 | 8,434,479 |
| Shares redeemed | (11,002,042) | (9,176,353) | (372,964,283) | (272,901,826) |
| Net increase (decrease) | (358,521) | (1,810,285) | $(3,973,641) | $(53,653,638) |
(a) Amount includes in-kind redemptions (see the Prior Fiscal Year Affiliated Redemptions In-Kind note for additional details).
11. Other.
The Fund's organizational documents provide former and current trustees and officers with a limited indemnification against liabilities arising in connection with the performance of their duties to the Fund. In the normal course of business, the Fund may also enter into contracts that provide general indemnifications. The Fund's maximum exposure under these arrangements is unknown as this would be dependent on future claims that may be made against the Fund. The risk of material loss from such claims is considered remote.
Mutual funds managed by the investment adviser or its affiliates were the owners of record, in the aggregate, of approximately 24% of the total outstanding shares of the Fund.
12. Coronavirus (COVID-19) Pandemic.
An outbreak of COVID-19 first detected in China during December 2019 has since spread globally and was declared a pandemic by the World Health Organization during March 2020. Developments that disrupt global economies and financial markets, such as the COVID-19 pandemic, may magnify factors that affect the Fund's performance.
13. Proposed Reorganization.
The Board of Trustees of Fidelity Emerging Markets Fund approved an Agreement and Plan of Reorganization (the Agreement) between the Fund and Fidelity Emerging Europe, Middle East, Africa (EMEA)Fund. In addition, the Board approved the creation of additional classes of shares that will commence operations on May 14, 2021. The Agreement provides for the transfer of all the assets and the assumption of all the liabilities of Fidelity Emerging Europe, Middle East, Africa (EMEA)Fund in exchange for corresponding shares of Fidelity Emerging Markets Fund equal in value to the net assets of Fidelity Emerging Europe, Middle East, Africa (EMEA)Fund on the day the reorganization is effective. The reorganization provides shareholders of Fidelity Emerging Europe, Middle East, Africa (EMEA)Fund access to a larger portfolio with similar investment objectives.
A meeting of shareholders of Fidelity Emerging Europe, Middle East, Africa (EMEA) Fund is expected to be held during the second quarter of 2021 to vote on the reorganization. If approved by shareholders, the reorganization is expected to become effective on or about May 14, 2021. The reorganization is expected to qualify as a tax-free transaction for federal income tax purposes with no gain or loss recognized by the funds or their shareholders.
Fidelity® Europe Fund
Performance: The Bottom Line
Average annual total return reflects the change in the value of an investment, assuming reinvestment of distributions from dividend income and capital gains (the profits earned upon the sale of securities that have grown in value, if any) and assuming a constant rate of performance each year. The hypothetical investment and the average annual total returns do not reflect the deduction of taxes that a shareholder would pay on fund distributions or the redemption of fund shares. During periods of reimbursement by Fidelity, a fund’s total return will be greater than it would be had the reimbursement not occurred. How a fund did yesterday is no guarantee of how it will do tomorrow.
Average Annual Total Returns
| For the periods ended October 31, 2020 | Past 1 year | Past 5 years | Past 10 years |
| Class A (incl. 5.75% sales charge) | (1.39)% | 2.36% | 4.14% |
| Class M (incl. 3.50% sales charge) | 0.65% | 2.52% | 4.17% |
| Class C (incl. contingent deferred sales charge) | 2.83% | 2.76% | 4.21% |
| Fidelity® Europe Fund | 4.95% | 3.91% | 4.98% |
| Class I | 4.99% | 3.94% | 5.00% |
| Class Z | 5.11% | 3.98% | 5.02% |
Class A shares bear a 0.25% 12b-1 fee. The initial offering of Class A shares took place on March 18, 2014. Returns prior to March 18, 2014, are those of Fidelity® Europe Fund, the original class of the fund, which has no 12b-1 fee. Had Class A's 12b-1 fee been reflected, returns prior to March 18, 2014, would have been lower.
Class M shares bear a 0.50% 12b-1 fee. The initial offering of Class M shares took place on March 18, 2014. Returns prior to March 18, 2014, are those of Fidelity® Europe Fund, the original class of the fund, which has no 12b-1 fee. Had Class M's 12b-1 fee been reflected, returns prior to March 18, 2014, would have been lower.
Class C shares bear a 1.00% 12b-1 fee. The initial offering of Class C shares took place on March 18, 2014. Returns prior to March 18, 2014, are those of Fidelity® Europe Fund, the original class of the fund, which has no 12b-1 fee. Had Class C's 12b-1 fee been reflected, returns prior to March 18, 2014, would have been lower.
Class C shares' contingent deferred sales charges included in the past one year, past five years and past ten years total return figures are 1%, 0% and 0%, respectively.
The initial offering of Class I shares took place on march 18, 2014. Returns prior to March 18, 2014 are those of Fidelity® Europe Fund, the original class of the fund.
The initial offering of Class Z shares took place on October 2, 2018. Returns between March 18, 2014 and October 2, 2018, are those of Class I. Returns prior to March 18, 2014 are those of Fidelity® Europe Fund, the original class of the fund.
$10,000 Over 10 Years
Let's say hypothetically that $10,000 was invested in Fidelity® Europe Fund, a class of the fund, on October 31, 2010.
The chart shows how the value of your investment would have changed, and also shows how the MSCI Europe Index performed over the same period.
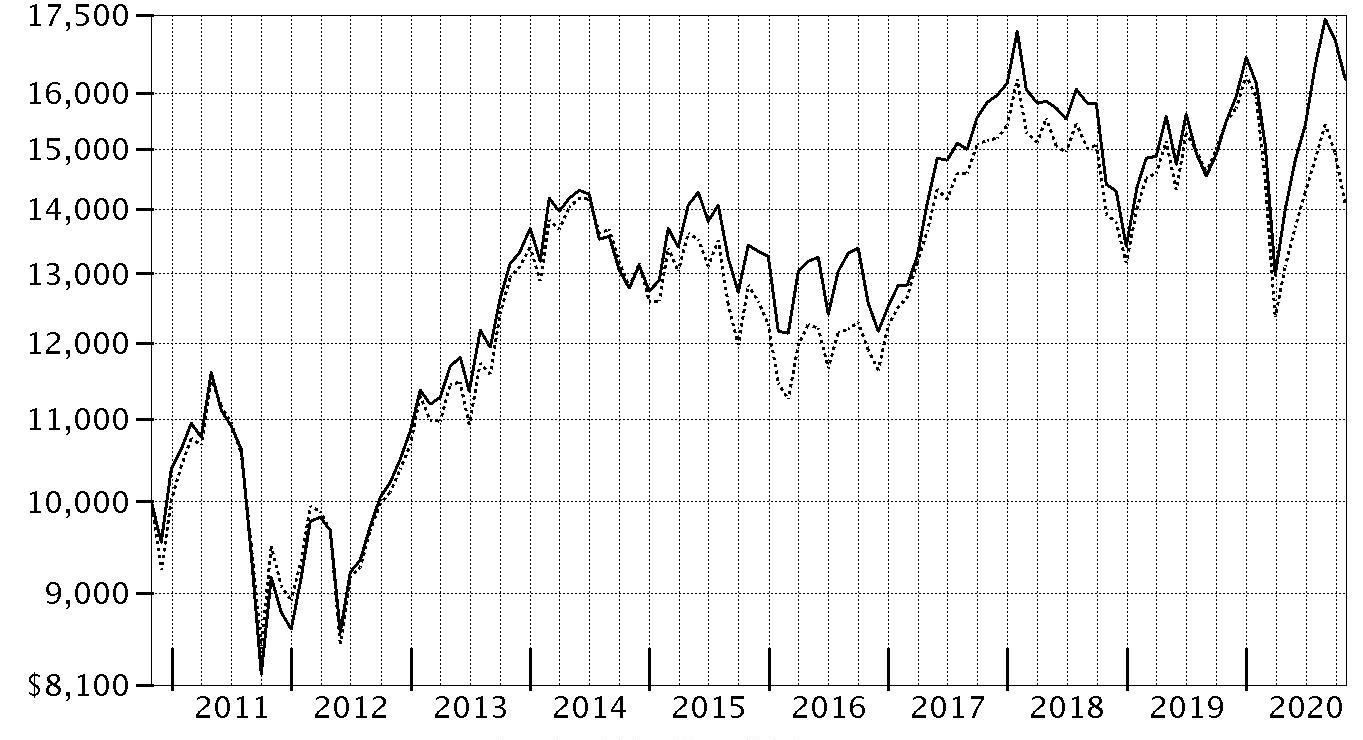
| Period Ending Values |
| $16,259 | Fidelity® Europe Fund |
| $14,080 | MSCI Europe Index |
Fidelity® Europe Fund
Management's Discussion of Fund Performance
Market Recap: The MSCI ACWI (All Country World Index) ex USA Index returned -2.46% for the 12 months ending October 31, 2020, in what was a bumpy ride for non-U.S. equities, marked by a steep but brief decline due to the early-2020 outbreak and spread of the coronavirus, followed by a sharp upturn. Declared a pandemic on March 11, the crisis and containment efforts caused broad contraction in economic activity, elevated volatility and dislocation in financial markets. A historically rapid and expansive monetary- and fiscal-policy response around the world provided a partial offset to the economic disruption. Other supporting factors included resilient corporate earnings and near-term potential for a COVID-19 vaccine breakthrough. This was evident in the index’s 12.28% gain in the final six months of the year. Currency fluctuation generally boosted foreign developed-markets equities for the year, while the reverse was true for emerging-markets stocks. Late in the period, the index was pressured by a second wave of COVID-19 cases in some regions, and stretched valuations and crowded positioning in big tech. For the full year, the U.K. (-22%), Asia Pacific ex Japan (-8%), Canada (-5%) and Europe ex U.K. (-4%) notably lagged. Emerging markets (+9%) and Japan (+1%) outperformed. By sector, energy (-38%), financials and real estate (-20% each) lagged, whereas information technology (+ 25%) and communication services (+15%) topped the index.
Comments from Portfolio Manager Andrew Sergeant: For the fiscal year ending October 31, 2020, the fund's share classes gained about 4% to 5%, outperforming the -9.08% result of the benchmark MSCI Europe Index (Net MA). By sector, the top contributor to performance versus the benchmark were stock picks in consumer discretionary. Strong stock choices in financials also boosted performance, as did selections in communication services, primarily driven by the media & entertainment industry. Our non-benchmark stake in Kambi Group was the fund's top individual relative contributor, driven by a 96% rise. Our second-largest relative contributor this period was avoiding Royal Dutch Shell, a benchmark component that returned -55%. Another notable relative contributor was an overweighting in Vestas Wind Systems (+111%). In contrast, the largest detractor from performance versus the benchmark came from stock choices and an underweighting in materials. The fund's largest individual relative detractor was an outsized stake in BP, which returned -60% the past 12 months. Also hurting performance was our overweighting in Lloyds Banking Group, which returned roughly -53%. Lloyds Banking was not held at period end. Notable changes in positioning include increased exposure to Switzerland and a lower allocation to France. By sector, meaningful changes in positioning include a higher allocation to consumer discretionary and health care, and a decrease in financials.
The views expressed above reflect those of the portfolio manager(s) only through the end of the period as stated on the cover of this report and do not necessarily represent the views of Fidelity or any other person in the Fidelity organization. Any such views are subject to change at any time based upon market or other conditions and Fidelity disclaims any responsibility to update such views. These views may not be relied on as investment advice and, because investment decisions for a Fidelity fund are based on numerous factors, may not be relied on as an indication of trading intent on behalf of any Fidelity fund.
Fidelity® Europe Fund
Investment Summary (Unaudited)
Geographic Diversification (% of fund's net assets)
| As of October 31, 2020 |
| | United Kingdom | 19.5% |
| | Sweden | 13.5% |
| | Netherlands | 9.6% |
| | Switzerland | 9.3% |
| | Germany | 8.5% |
| | Denmark | 6.1% |
| | France | 4.1% |
| | United States of America* | 3.7% |
| | Italy | 3.2% |
| | Other | 22.5% |
* Includes Short-Term investments and Net Other Assets (Liabilities).
Percentages are based on country or territory of incorporation and are adjusted for the effect of futures contracts, if applicable.
Asset Allocation as of October 31, 2020
| | % of fund's net assets |
| Stocks | 97.5 |
| Short-Term Investments and Net Other Assets (Liabilities) | 2.5 |
Top Ten Stocks as of October 31, 2020
| | % of fund's net assets |
| Nestle SA (Reg. S) (Switzerland, Food Products) | 4.8 |
| Roche Holding AG (participation certificate) (Switzerland, Pharmaceuticals) | 4.4 |
| AstraZeneca PLC (United Kingdom) (United Kingdom, Pharmaceuticals) | 3.2 |
| Naspers Ltd. Class N (South Africa, Internet & Direct Marketing Retail) | 3.0 |
| Sanofi SA (France, Pharmaceuticals) | 2.9 |
| ASML Holding NV (Netherlands) (Netherlands, Semiconductors & Semiconductor Equipment) | 2.5 |
| ORSTED A/S (Denmark, Electric Utilities) | 2.4 |
| Unilever PLC (United Kingdom, Personal Products) | 2.4 |
| Swedish Match Co. AB (Sweden, Tobacco) | 2.3 |
| Swedbank AB (A Shares) (Sweden, Banks) | 2.2 |
| | 30.1 |
Top Market Sectors as of October 31, 2020
| | % of fund's net assets |
| Health Care | 17.1 |
| Financials | 14.2 |
| Consumer Discretionary | 12.8 |
| Industrials | 12.6 |
| Consumer Staples | 12.6 |
| Information Technology | 8.8 |
| Materials | 6.3 |
| Communication Services | 4.4 |
| Real Estate | 3.4 |
| Energy | 2.9 |
Fidelity® Europe Fund
Schedule of Investments October 31, 2020
Showing Percentage of Net Assets
| Common Stocks - 96.5% | | | |
| | | Shares | Value |
| Bailiwick of Jersey - 0.9% | | | |
| Glencore Xstrata PLC | | 3,848,700 | $7,763,739 |
| Belgium - 2.1% | | | |
| Fagron NV | | 132,187 | 2,932,778 |
| KBC Groep NV | | 120,300 | 5,930,746 |
| UCB SA | | 82,000 | 8,088,960 |
|
| TOTAL BELGIUM | | | 16,952,484 |
|
| Bermuda - 2.2% | | | |
| Hiscox Ltd. (a) | | 833,314 | 8,899,879 |
| Lancashire Holdings Ltd. | | 1,103,715 | 9,101,077 |
|
| TOTAL BERMUDA | | | 18,000,956 |
|
| Denmark - 6.1% | | | |
| A.P. Moller - Maersk A/S Series B | | 6,312 | 10,115,829 |
| GN Store Nord A/S | | 112,800 | 8,112,353 |
| ORSTED A/S (b) | | 124,000 | 19,680,538 |
| Vestas Wind Systems A/S | | 69,400 | 11,906,543 |
|
| TOTAL DENMARK | | | 49,815,263 |
|
| Finland - 3.1% | | | |
| Nokian Tyres PLC (c) | | 506,000 | 15,551,967 |
| UPM-Kymmene Corp. | | 350,000 | 9,889,043 |
|
| TOTAL FINLAND | | | 25,441,010 |
|
| France - 4.1% | | | |
| Sanofi SA | | 267,500 | 24,153,483 |
| Total SA | | 327,807 | 9,931,479 |
|
| TOTAL FRANCE | | | 34,084,962 |
|
| Germany - 8.5% | | | |
| Bertrandt AG | | 50,059 | 1,716,971 |
| Delivery Hero AG (a)(b) | | 38,800 | 4,463,712 |
| Deutsche Post AG | | 300,000 | 13,290,986 |
| Instone Real Estate Group BV (a)(b) | | 577,055 | 11,935,912 |
| JOST Werke AG (a)(b) | | 265,040 | 9,939,458 |
| LEG Immobilien AG | | 70,739 | 9,558,444 |
| SAP SE | | 145,837 | 15,558,568 |
| Talanx AG | | 81,300 | 2,393,663 |
| WashTec AG | | 29,300 | 1,296,721 |
|
| TOTAL GERMANY | | | 70,154,435 |
|
| Hungary - 0.9% | | | |
| Richter Gedeon PLC | | 342,700 | 6,990,463 |
| Ireland - 1.7% | | | |
| Irish Residential Properties REIT PLC | | 4,085,947 | 6,519,416 |
| United Drug PLC (United Kingdom) | | 785,800 | 7,385,618 |
|
| TOTAL IRELAND | | | 13,905,034 |
|
| Israel - 0.8% | | | |
| NICE Systems Ltd. (a) | | 30,000 | 6,861,564 |
| Italy - 2.2% | | | |
| Prada SpA (a) | | 1,937,100 | 7,608,474 |
| Recordati SpA | | 200,700 | 10,399,326 |
|
| TOTAL ITALY | | | 18,007,800 |
|
| Luxembourg - 2.0% | | | |
| B&M European Value Retail SA | | 1,407,300 | 8,838,666 |
| Stabilus SA | | 130,000 | 7,361,287 |
|
| TOTAL LUXEMBOURG | | | 16,199,953 |
|
| Malta - 2.1% | | | |
| Kambi Group PLC (a) | | 544,059 | 17,669,812 |
| Netherlands - 9.6% | | | |
| ASML Holding NV (Netherlands) | | 57,900 | 20,948,400 |
| ASR Nederland NV | | 288,100 | 8,757,481 |
| BE Semiconductor Industries NV | | 146,500 | 5,918,850 |
| Heineken NV (Bearer) | | 119,800 | 10,631,810 |
| Intertrust NV (b) | | 786,719 | 12,186,155 |
| JDE Peet's BV | | 192,300 | 6,853,243 |
| Koninklijke Philips Electronics NV | | 200,000 | 9,263,355 |
| RHI Magnesita NV | | 135,642 | 4,498,540 |
|
| TOTAL NETHERLANDS | | | 79,057,834 |
|
| Norway - 2.3% | | | |
| Schibsted ASA: | | | |
| (A Shares) | | 168,533 | 6,870,792 |
| (B Shares) | | 185,500 | 6,657,026 |
| TGS Nopec Geophysical Co. ASA | | 615,283 | 5,671,613 |
|
| TOTAL NORWAY | | | 19,199,431 |
|
| South Africa - 3.0% | | | |
| Naspers Ltd. Class N | | 126,500 | 24,696,287 |
| Spain - 1.4% | | | |
| Amadeus IT Holding SA Class A | | 96,800 | 4,621,136 |
| Prosegur Cash SA (b) | | 8,817,139 | 6,828,806 |
|
| TOTAL SPAIN | | | 11,449,942 |
|
| Sweden - 13.5% | | | |
| Dustin Group AB (b) | | 1,799,954 | 11,448,957 |
| Ericsson (B Shares) | | 815,200 | 9,101,313 |
| HEXPOL AB (B Shares) | | 1,405,300 | 12,381,498 |
| Securitas AB (B Shares) | | 996,200 | 14,100,444 |
| Stillfront Group AB (a) | | 81,400 | 9,550,211 |
| Swedbank AB (A Shares) (a) | | 1,156,400 | 18,128,855 |
| Swedish Match Co. AB | | 248,700 | 18,742,495 |
| VNV Global AB (a) | | 1,939,670 | 16,828,028 |
| VNV Global AB warrants 8/10/23 (a) | | 338,136 | 402,796 |
|
| TOTAL SWEDEN | | | 110,684,597 |
|
| Switzerland - 9.3% | | | |
| Dufry AG (a) | | 29,808 | 1,128,020 |
| Nestle SA (Reg. S) | | 349,160 | 39,272,794 |
| Roche Holding AG (participation certificate) | | 113,150 | 36,358,663 |
|
| TOTAL SWITZERLAND | | | 76,759,477 |
|
| United Kingdom - 19.5% | | | |
| AstraZeneca PLC (United Kingdom) | | 259,100 | 26,015,066 |
| Auto Trader Group PLC (b) | | 1,791,800 | 13,471,524 |
| Avon Rubber PLC | | 80,799 | 4,108,498 |
| Beazley PLC | | 685,000 | 2,609,007 |
| BP PLC | | 3,400,329 | 8,673,167 |
| Close Brothers Group PLC | | 455,531 | 6,355,812 |
| Cranswick PLC | | 201,813 | 8,413,421 |
| Keywords Studios PLC | | 355,236 | 9,738,006 |
| London Stock Exchange Group PLC | | 58,000 | 6,252,280 |
| Mondi PLC | | 468,239 | 8,874,611 |
| Prudential PLC | | 1,416,774 | 17,327,859 |
| Sabre Insurance Group PLC (b) | | 4,624,222 | 13,718,656 |
| THG Holdings Ltd. | | 566,900 | 4,844,227 |
| Ultra Electronics Holdings PLC | | 163,300 | 3,977,237 |
| Unilever PLC | | 341,132 | 19,462,884 |
| Volution Group PLC | | 2,794,243 | 7,022,687 |
|
| TOTAL UNITED KINGDOM | | | 160,864,942 |
|
| United States of America - 1.2% | | | |
| Autoliv, Inc. (depositary receipt) | | 126,400 | 9,582,559 |
| TOTAL COMMON STOCKS | | | |
| (Cost $768,898,466) | | | 794,142,544 |
|
| Nonconvertible Preferred Stocks - 1.0% | | | |
| Italy - 1.0% | | | |
| Buzzi Unicem SpA (Risparmio Shares) | | | |
| (Cost $6,549,395) | | 598,891 | 8,495,531 |
|
| Money Market Funds - 4.0% | | | |
| Fidelity Cash Central Fund 0.10% (d) | | 16,968,981 | 16,972,375 |
| Fidelity Securities Lending Cash Central Fund 0.11% (d)(e) | | 15,845,980 | 15,847,565 |
| TOTAL MONEY MARKET FUNDS | | | |
| (Cost $32,819,940) | | | 32,819,940 |
| TOTAL INVESTMENT IN SECURITIES - 101.5% | | | |
| (Cost $808,267,801) | | | 835,458,015 |
| NET OTHER ASSETS (LIABILITIES) - (1.5)% | | | (12,485,878) |
| NET ASSETS - 100% | | | $822,972,137 |
Categorizations in the Schedule of Investments are based on country or territory of incorporation.
Legend
(a) Non-income producing
(b) Security exempt from registration under Rule 144A of the Securities Act of 1933. These securities may be resold in transactions exempt from registration, normally to qualified institutional buyers. At the end of the period, the value of these securities amounted to $103,673,718 or 12.6% of net assets.
(c) Security or a portion of the security is on loan at period end.
(d) Affiliated fund that is generally available only to investment companies and other accounts managed by Fidelity Investments. The rate quoted is the annualized seven-day yield of the fund at period end. A complete unaudited listing of the fund's holdings as of its most recent quarter end is available upon request. In addition, each Fidelity Central Fund's financial statements, which are not covered by the Fund's Report of Independent Registered Public Accounting Firm, are available on the SEC's website or upon request.
(e) Investment made with cash collateral received from securities on loan.
Affiliated Central Funds
Information regarding fiscal year to date income earned by the Fund from investments in Fidelity Central Funds is as follows:
| Fund | Income earned |
| Fidelity Cash Central Fund | $90,710 |
| Fidelity Securities Lending Cash Central Fund | 96,944 |
| Total | $187,654 |
Amounts in the income column in the above table include any capital gain distributions from underlying funds, which are presented in the corresponding line-item in the Statement of Operations, if applicable. Amount for Fidelity Securities Lending Cash Central Fund represents the income earned on investing cash collateral, less rebates paid to borrowers and any lending agent fees associated with the loan, plus any premium payments received for lending certain types of securities.
Investment Valuation
The following is a summary of the inputs used, as of October 31, 2020, involving the Fund's assets and liabilities carried at fair value. The inputs or methodology used for valuing securities may not be an indication of the risk associated with investing in those securities. For more information on valuation inputs, and their aggregation into the levels used below, please refer to the Investment Valuation section in the accompanying Notes to Financial Statements.
| | Valuation Inputs at Reporting Date: |
| Description | Total | Level 1 | Level 2 | Level 3 |
| Investments in Securities: | | | | |
| Equities: | | | | |
| Communication Services | $36,549,553 | $23,078,029 | $13,471,524 | $-- |
| Consumer Discretionary | 105,832,681 | 81,136,394 | 24,696,287 | -- |
| Consumer Staples | 103,376,647 | 64,103,853 | 39,272,794 | -- |
| Energy | 24,276,259 | 5,671,613 | 18,604,646 | -- |
| Financials | 116,706,139 | 93,126,000 | 23,580,139 | -- |
| Health Care | 139,700,065 | 43,909,498 | 95,790,567 | -- |
| Industrials | 103,851,622 | 81,829,250 | 22,022,372 | -- |
| Information Technology | 72,747,837 | 27,139,556 | 45,608,281 | -- |
| Materials | 51,902,962 | 44,139,223 | 7,763,739 | -- |
| Real Estate | 28,013,772 | 28,013,772 | -- | -- |
| Utilities | 19,680,538 | 19,680,538 | -- | -- |
| Money Market Funds | 32,819,940 | 32,819,940 | -- | -- |
| Total Investments in Securities: | $835,458,015 | $544,647,666 | $290,810,349 | $-- |
See accompanying notes which are an integral part of the financial statements.
Fidelity® Europe Fund
Financial Statements
Statement of Assets and Liabilities
| | | October 31, 2020 |
| Assets | | |
Investment in securities, at value (including securities loaned of $15,440,892) — See accompanying schedule:
Unaffiliated issuers (cost $775,447,861) | $802,638,075 | |
| Fidelity Central Funds (cost $32,819,940) | 32,819,940 | |
| Total Investment in Securities (cost $808,267,801) | | $835,458,015 |
| Receivable for investments sold | | 1,488,420 |
| Receivable for fund shares sold | | 317,889 |
| Dividends receivable | | 3,353,875 |
| Distributions receivable from Fidelity Central Funds | | 2,990 |
| Prepaid expenses | | 1,403 |
| Other receivables | | 1,012 |
| Total assets | | 840,623,604 |
| Liabilities | | |
| Payable for investments purchased | $166,443 | |
| Payable for fund shares redeemed | 734,858 | |
| Accrued management fee | 653,129 | |
| Distribution and service plan fees payable | 12,088 | |
| Other affiliated payables | 155,089 | |
| Other payables and accrued expenses | 82,295 | |
| Collateral on securities loaned | 15,847,565 | |
| Total liabilities | | 17,651,467 |
| Net Assets | | $822,972,137 |
| Net Assets consist of: | | |
| Paid in capital | | $796,697,896 |
| Total accumulated earnings (loss) | | 26,274,241 |
| Net Assets | | $822,972,137 |
| Net Asset Value and Maximum Offering Price | | |
| Class A: | | |
| Net Asset Value and redemption price per share ($23,189,253 ÷ 655,604 shares)(a) | | $35.37 |
| Maximum offering price per share (100/94.25 of $35.37) | | $37.53 |
| Class M: | | |
| Net Asset Value and redemption price per share ($5,203,681 ÷ 146,895 shares)(a) | | $35.42 |
| Maximum offering price per share (100/96.50 of $35.42) | | $36.70 |
| Class C: | | |
| Net Asset Value and offering price per share ($5,241,970 ÷ 149,731 shares)(a) | | $35.01 |
| Europe: | | |
| Net Asset Value, offering price and redemption price per share ($755,125,292 ÷ 21,362,267 shares) | | $35.35 |
| Class I: | | |
| Net Asset Value, offering price and redemption price per share ($14,733,159 ÷ 416,947 shares) | | $35.34 |
| Class Z: | | |
| Net Asset Value, offering price and redemption price per share ($19,478,782 ÷ 552,348 shares) | | $35.27 |
(a) Redemption price per share is equal to net asset value less any applicable contingent deferred sales charge.
See accompanying notes which are an integral part of the financial statements.
Statement of Operations
| | | Year ended October 31, 2020 |
| Investment Income | | |
| Dividends | | $17,375,483 |
| Income from Fidelity Central Funds (including $96,944 from security lending) | | 187,654 |
| Income before foreign taxes withheld | | 17,563,137 |
| Less foreign taxes withheld | | (1,648,010) |
| Total income | | 15,915,127 |
| Expenses | | |
| Management fee | | |
| Basic fee | $5,757,940 | |
| Performance adjustment | 844,877 | |
| Transfer agent fees | 1,422,383 | |
| Distribution and service plan fees | 138,332 | |
| Accounting fees | 402,044 | |
| Custodian fees and expenses | 77,074 | |
| Independent trustees' fees and expenses | 4,839 | |
| Registration fees | 85,796 | |
| Audit | 80,318 | |
| Legal | 5,416 | |
| Miscellaneous | 17,384 | |
| Total expenses before reductions | 8,836,403 | |
| Expense reductions | (78,730) | |
| Total expenses after reductions | | 8,757,673 |
| Net investment income (loss) | | 7,157,454 |
| Realized and Unrealized Gain (Loss) | | |
| Net realized gain (loss) on: | | |
| Investment securities: | | |
| Unaffiliated issuers | (2,804,390) | |
| Fidelity Central Funds | (3,173) | |
| Foreign currency transactions | (21,957) | |
| Total net realized gain (loss) | | (2,829,520) |
| Change in net unrealized appreciation (depreciation) on: | | |
| Investment securities: | | |
| Unaffiliated issuers | 27,152,175 | |
| Assets and liabilities in foreign currencies | 141,105 | |
| Total change in net unrealized appreciation (depreciation) | | 27,293,280 |
| Net gain (loss) | | 24,463,760 |
| Net increase (decrease) in net assets resulting from operations | | $31,621,214 |
See accompanying notes which are an integral part of the financial statements.
Statement of Changes in Net Assets
| | Year ended October 31, 2020 | Year ended October 31, 2019 |
| Increase (Decrease) in Net Assets | | |
| Operations | | |
| Net investment income (loss) | $7,157,454 | $39,970,728 |
| Net realized gain (loss) | (2,829,520) | 30,077,932 |
| Change in net unrealized appreciation (depreciation) | 27,293,280 | (5,038,098) |
| Net increase (decrease) in net assets resulting from operations | 31,621,214 | 65,010,562 |
| Distributions to shareholders | (66,453,077) | (96,043,890) |
| Share transactions - net increase (decrease) | (39,838,924) | (57,264,097) |
| Total increase (decrease) in net assets | (74,670,787) | (88,297,425) |
| Net Assets | | |
| Beginning of period | 897,642,924 | 985,940,349 |
| End of period | $822,972,137 | $897,642,924 |
See accompanying notes which are an integral part of the financial statements.
Financial Highlights
Fidelity Europe Fund Class A
| Years ended October 31, | 2020 | 2019 | 2018 | 2017 | 2016 |
| Selected Per–Share Data | | | | | |
| Net asset value, beginning of period | $36.30 | $37.61 | $42.47 | $34.17 | $37.06 |
| Income from Investment Operations | | | | | |
| Net investment income (loss)A | .19 | 1.41B | .34 | .26 | .22 |
| Net realized and unrealized gain (loss) | 1.46 | .82 | (4.21)C | 8.39 | (2.67) |
| Total from investment operations | 1.65 | 2.23 | (3.87) | 8.65 | (2.45) |
| Distributions from net investment income | (1.50) | (.11) | (.33) | (.22) | (.29) |
| Distributions from net realized gain | (1.08) | (3.43) | (.66) | (.13) | (.15) |
| Total distributions | (2.58) | (3.54) | (.99) | (.35) | (.44) |
| Redemption fees added to paid in capitalA | – | – | – | –D | –D |
| Net asset value, end of period | $35.37 | $36.30 | $37.61 | $42.47 | $34.17 |
| Total ReturnE,F | 4.62% | 7.21% | (9.31)%C | 25.61% | (6.69)% |
| Ratios to Average Net AssetsG,H | | | | | |
| Expenses before reductions | 1.34% | 1.09% | 1.28% | 1.32% | 1.39% |
| Expenses net of fee waivers, if any | 1.34% | 1.09% | 1.28% | 1.32% | 1.39% |
| Expenses net of all reductions | 1.33% | 1.07% | 1.28% | 1.28% | 1.38% |
| Net investment income (loss) | .56% | 4.02%B | .82% | .70% | .62% |
| Supplemental Data | | | | | |
| Net assets, end of period (000 omitted) | $23,189 | $20,819 | $19,531 | $20,925 | $17,267 |
| Portfolio turnover rateI | 39% | 45% | 57% | 73% | 62% |
A Calculated based on average shares outstanding during the period.
B Net investment income per share reflects one or more large, non-recurring dividend(s) which amounted to $.20 per share. Such dividends are not annualized in the ratio of net investment income (loss) to average net assets. Excluding such non-recurring dividend(s) the ratio of net investment income (loss) to average net assets would have been 3.44%.
C Net realized and unrealized gain (loss) per share reflects proceeds received from litigation which amounted to $.18 per share. Excluding these litigation proceeds, the total return would have been (9.74) %.
D Amount represents less than $.005 per share.
E Total returns would have been lower if certain expenses had not been reduced during the applicable periods shown.
F Total returns do not include the effect of the sales charges.
G Fees and expenses of any underlying mutual funds or exchange-traded funds (ETFs) are not included in the Fund's expense ratio. The Fund indirectly bears its proportionate share of these expenses. For additional expense information related to investments in Fidelity Central Funds, please refer to the "Investments in Fidelity Central Funds" note found in the Notes to Financial Statements section of the most recent Annual or Semi-Annual report.
H Expense ratios reflect operating expenses of the class. Expenses before reductions do not reflect amounts reimbursed, waived, or reduced through arrangements with the investment adviser, brokerage services, or other offset arrangements, if applicable, and do not represent the amount paid by the class during periods when reimbursements, waivers or reductions occur.
I Amount does not include the portfolio activity of any underlying mutual funds or exchange-traded funds (ETFs).
See accompanying notes which are an integral part of the financial statements.
Fidelity Europe Fund Class M
| Years ended October 31, | 2020 | 2019 | 2018 | 2017 | 2016 |
| Selected Per–Share Data | | | | | |
| Net asset value, beginning of period | $36.32 | $37.57 | $42.47 | $34.13 | $36.94 |
| Income from Investment Operations | | | | | |
| Net investment income (loss)A | .09 | 1.30B | .21 | .15 | .11 |
| Net realized and unrealized gain (loss) | 1.45 | .83 | (4.23)C | 8.41 | (2.67) |
| Total from investment operations | 1.54 | 2.13 | (4.02) | 8.56 | (2.56) |
| Distributions from net investment income | (1.36) | – | (.23) | (.09) | (.09) |
| Distributions from net realized gain | (1.08) | (3.38) | (.66) | (.13) | (.15) |
| Total distributions | (2.44) | (3.38) | (.88)D | (.22) | (.25)D |
| Redemption fees added to paid in capitalA | – | – | – | –E | –E |
| Net asset value, end of period | $35.42 | $36.32 | $37.57 | $42.47 | $34.13 |
| Total ReturnF,G | 4.30% | 6.88% | (9.63)%C | 25.25% | (6.99)% |
| Ratios to Average Net AssetsH,I | | | | | |
| Expenses before reductions | 1.65% | 1.41% | 1.61% | 1.63% | 1.70% |
| Expenses net of fee waivers, if any | 1.65% | 1.40% | 1.61% | 1.63% | 1.70% |
| Expenses net of all reductions | 1.64% | 1.38% | 1.61% | 1.59% | 1.68% |
| Net investment income (loss) | .25% | 3.70%B | .50% | .39% | .31% |
| Supplemental Data | | | | | |
| Net assets, end of period (000 omitted) | $5,204 | $5,782 | $7,257 | $8,874 | $6,980 |
| Portfolio turnover rateJ | 39% | 45% | 57% | 73% | 62% |
A Calculated based on average shares outstanding during the period.
B Net investment income per share reflects one or more large, non-recurring dividend(s) which amounted to $.20 per share. Such dividends are not annualized in the ratio of net investment income (loss) to average net assets. Excluding such non-recurring dividend(s) the ratio of net investment income (loss) to average net assets would have been 3.12%.
C Net realized and unrealized gain (loss) per share reflects proceeds received from litigation which amounted to $.18 per share. Excluding these litigation proceeds, the total return would have been (10.06) %.
D Total distributions per share do not sum due to rounding.
E Amount represents less than $.005 per share.
F Total returns would have been lower if certain expenses had not been reduced during the applicable periods shown.
G Total returns do not include the effect of the sales charges.
H Fees and expenses of any underlying mutual funds or exchange-traded funds (ETFs) are not included in the Fund's expense ratio. The Fund indirectly bears its proportionate share of these expenses. For additional expense information related to investments in Fidelity Central Funds, please refer to the "Investments in Fidelity Central Funds" note found in the Notes to Financial Statements section of the most recent Annual or Semi-Annual report.
I Expense ratios reflect operating expenses of the class. Expenses before reductions do not reflect amounts reimbursed, waived, or reduced through arrangements with the investment adviser, brokerage services, or other offset arrangements, if applicable, and do not represent the amount paid by the class during periods when reimbursements, waivers or reductions occur.
J Amount does not include the portfolio activity of any underlying mutual funds or exchange-traded funds (ETFs).
See accompanying notes which are an integral part of the financial statements.
Fidelity Europe Fund Class C
| Years ended October 31, | 2020 | 2019 | 2018 | 2017 | 2016 |
| Selected Per–Share Data | | | | | |
| Net asset value, beginning of period | $35.87 | $37.23 | $42.15 | $33.82 | $36.81 |
| Income from Investment Operations | | | | | |
| Net investment income (loss)A | (.09) | 1.12B | .02 | (.03) | (.06) |
| Net realized and unrealized gain (loss) | 1.45 | .82 | (4.18)C | 8.36 | (2.65) |
| Total from investment operations | 1.36 | 1.94 | (4.16) | 8.33 | (2.71) |
| Distributions from net investment income | (1.14) | – | (.10) | – | (.12) |
| Distributions from net realized gain | (1.08) | (3.30) | (.66) | – | (.15) |
| Total distributions | (2.22) | (3.30) | (.76) | – | (.28)D |
| Redemption fees added to paid in capitalA | – | – | – | –E | –E |
| Net asset value, end of period | $35.01 | $35.87 | $37.23 | $42.15 | $33.82 |
| Total ReturnF,G | 3.81% | 6.35% | (10.04)%C | 24.63% | (7.43)% |
| Ratios to Average Net AssetsH,I | | | | | |
| Expenses before reductions | 2.15% | 1.90% | 2.06% | 2.11% | 2.18% |
| Expenses net of fee waivers, if any | 2.15% | 1.90% | 2.06% | 2.11% | 2.18% |
| Expenses net of all reductions | 2.14% | 1.87% | 2.06% | 2.07% | 2.17% |
| Net investment income (loss) | (.25)% | 3.21%B | .04% | (.09)% | (.17)% |
| Supplemental Data | | | | | |
| Net assets, end of period (000 omitted) | $5,242 | $6,145 | $10,060 | $10,721 | $9,007 |
| Portfolio turnover rateJ | 39% | 45% | 57% | 73% | 62% |
A Calculated based on average shares outstanding during the period.
B Net investment income per share reflects one or more large, non-recurring dividend(s) which amounted to $.20 per share. Such dividends are not annualized in the ratio of net investment income (loss) to average net assets. Excluding such non-recurring dividend(s) the ratio of net investment income (loss) to average net assets would have been 2.63 %.
C Net realized and unrealized gain (loss) per share reflects proceeds received from litigation which amounted to $.18 per share. Excluding these litigation proceeds, the total return would have been (10.47) %.
D Total distributions per share do not sum due to rounding.
E Amount represents less than $.005 per share.
F Total returns would have been lower if certain expenses had not been reduced during the applicable periods shown.
G Total returns do not include the effect of the contingent deferred sales charge.
H Fees and expenses of any underlying mutual funds or exchange-traded funds (ETFs) are not included in the Fund's expense ratio. The Fund indirectly bears its proportionate share of these expenses. For additional expense information related to investments in Fidelity Central Funds, please refer to the "Investments in Fidelity Central Funds" note found in the Notes to Financial Statements section of the most recent Annual or Semi-Annual report.
I Expense ratios reflect operating expenses of the class. Expenses before reductions do not reflect amounts reimbursed, waived, or reduced through arrangements with the investment adviser, brokerage services, or other offset arrangements, if applicable, and do not represent the amount paid by the class during periods when reimbursements, waivers or reductions occur.
J Amount does not include the portfolio activity of any underlying mutual funds or exchange-traded funds (ETFs).
See accompanying notes which are an integral part of the financial statements.
Fidelity Europe Fund
| Years ended October 31, | 2020 | 2019 | 2018 | 2017 | 2016 |
| Selected Per–Share Data | | | | | |
| Net asset value, beginning of period | $36.28 | $37.70 | $42.53 | $34.26 | $37.19 |
| Income from Investment Operations | | | | | |
| Net investment income (loss)A | .30 | 1.52B | .48 | .38 | .33 |
| Net realized and unrealized gain (loss) | 1.46 | .81 | (4.24)C | 8.40 | (2.68) |
| Total from investment operations | 1.76 | 2.33 | (3.76) | 8.78 | (2.35) |
| Distributions from net investment income | (1.61) | (.32) | (.41) | (.38) | (.43) |
| Distributions from net realized gain | (1.08) | (3.43) | (.66) | (.13) | (.15) |
| Total distributions | (2.69) | (3.75) | (1.07) | (.51) | (.58) |
| Redemption fees added to paid in capitalA | – | – | – | –D | –D |
| Net asset value, end of period | $35.35 | $36.28 | $37.70 | $42.53 | $34.26 |
| Total ReturnE | 4.95% | 7.56% | (9.05)%C | 26.05% | (6.42)% |
| Ratios to Average Net AssetsF | | | | | |
| Expenses before reductions | 1.03% | .78% | .96% | 1.00% | 1.07% |
| Expenses net of fee waivers, if any | 1.03% | .77% | .96% | 1.00% | 1.07% |
| Expenses net of all reductions | 1.02% | .75% | .96% | .96% | 1.06% |
| Net investment income (loss) | .86% | 4.33%B | 1.14% | 1.02% | .94% |
| Supplemental Data | | | | | |
| Net assets, end of period (000 omitted) | $755,125 | $836,373 | $941,670 | $1,343,213 | $1,066,488 |
| Portfolio turnover rateG | 39% | 45% | 57% | 73% | 62% |
A Calculated based on average shares outstanding during the period.
B Net investment income per share reflects one or more large, non-recurring dividend(s) which amounted to $.20 per share. Such dividends are not annualized in the ratio of net investment income (loss) to average net assets. Excluding such non-recurring dividend(s) the ratio of net investment income (loss) to average net assets would have been 3.75%.
C Net realized and unrealized gain (loss) per share reflects proceeds received from litigation which amounted to $.18 per share. Excluding these litigation proceeds, the total return would have been (9.48) %.
D Amount represents less than $.005 per share.
E Total returns would have been lower if certain expenses had not been reduced during the applicable periods shown.
F Fees and expenses of any underlying mutual funds or exchange-traded funds (ETFs) are not included in the Fund's expense ratio. The Fund indirectly bears its proportionate share of these expenses. For additional expense information related to investments in Fidelity Central Funds, please refer to the "Investments in Fidelity Central Funds" note found in the Notes to Financial Statements section of the most recent Annual or Semi-Annual report.
G Amount does not include the portfolio activity of any underlying mutual funds or exchange-traded funds (ETFs).
See accompanying notes which are an integral part of the financial statements.
Fidelity Europe Fund Class I
| Years ended October 31, | 2020 | 2019 | 2018 | 2017 | 2016 |
| Selected Per–Share Data | | | | | |
| Net asset value, beginning of period | $36.27 | $37.69 | $42.53 | $34.29 | $37.21 |
| Income from Investment Operations | | | | | |
| Net investment income (loss)A | .31 | 1.53B | .48 | .39 | .35 |
| Net realized and unrealized gain (loss) | 1.46 | .80 | (4.23)C | 8.38 | (2.67) |
| Total from investment operations | 1.77 | 2.33 | (3.75) | 8.77 | (2.32) |
| Distributions from net investment income | (1.62) | (.32) | (.43) | (.41) | (.45) |
| Distributions from net realized gain | (1.08) | (3.43) | (.66) | (.13) | (.15) |
| Total distributions | (2.70) | (3.75) | (1.09) | (.53)D | (.60) |
| Redemption fees added to paid in capitalA | – | – | – | –E | –E |
| Net asset value, end of period | $35.34 | $36.27 | $37.69 | $42.53 | $34.29 |
| Total ReturnF | 4.99% | 7.58% | (9.02)%C | 26.04% | (6.33)% |
| Ratios to Average Net AssetsG,H | | | | | |
| Expenses before reductions | 1.00% | .75% | .95% | .98% | 1.01% |
| Expenses net of fee waivers, if any | 1.00% | .74% | .95% | .98% | 1.01% |
| Expenses net of all reductions | .99% | .72% | .95% | .94% | 1.00% |
| Net investment income (loss) | .90% | 4.36%B | 1.16% | 1.04% | 1.00% |
| Supplemental Data | | | | | |
| Net assets, end of period (000 omitted) | $14,733 | $6,686 | $7,318 | $8,469 | $5,340 |
| Portfolio turnover rateI | 39% | 45% | 57% | 73% | 62% |
A Calculated based on average shares outstanding during the period.
B Net investment income per share reflects one or more large, non-recurring dividend(s) which amounted to $.20 per share. Such dividends are not annualized in the ratio of net investment income (loss) to average net assets. Excluding such non-recurring dividend(s) the ratio of net investment income (loss) to average net assets would have been 3.78%.
C Net realized and unrealized gain (loss) per share reflects proceeds received from litigation which amounted to $.18 per share. Excluding these litigation proceeds, the total return would have been (9.45) %.
D Total distributions per share do not sum due to rounding.
E Amount represents less than $.005 per share.
F Total returns would have been lower if certain expenses had not been reduced during the applicable periods shown.
G Fees and expenses of any underlying mutual funds or exchange-traded funds (ETFs) are not included in the Fund's expense ratio. The Fund indirectly bears its proportionate share of these expenses. For additional expense information related to investments in Fidelity Central Funds, please refer to the "Investments in Fidelity Central Funds" note found in the Notes to Financial Statements section of the most recent Annual or Semi-Annual report.
H Expense ratios reflect operating expenses of the class. Expenses before reductions do not reflect amounts reimbursed, waived, or reduced through arrangements with the investment adviser, brokerage services, or other offset arrangements, if applicable, and do not represent the amount paid by the class during periods when reimbursements, waivers or reductions occur.
I Amount does not include the portfolio activity of any underlying mutual funds or exchange-traded funds (ETFs).
See accompanying notes which are an integral part of the financial statements.
Fidelity Europe Fund Class Z
| Years ended October 31, | 2020 | 2019 | 2018 A |
| Selected Per–Share Data | | | |
| Net asset value, beginning of period | $36.21 | $37.69 | $41.00 |
| Income from Investment Operations | | | |
| Net investment income (loss)B | .34 | 1.53C | .06 |
| Net realized and unrealized gain (loss) | 1.47 | .82 | (3.37)D |
| Total from investment operations | 1.81 | 2.35 | (3.31) |
| Distributions from net investment income | (1.67) | (.41) | – |
| Distributions from net realized gain | (1.08) | (3.43) | – |
| Total distributions | (2.75) | (3.83)E | – |
| Net asset value, end of period | $35.27 | $36.21 | $37.69 |
| Total ReturnF,G | 5.11% | 7.71% | (8.07)%D |
| Ratios to Average Net AssetsH,I | | | |
| Expenses before reductions | .91% | .65% | .91%J |
| Expenses net of fee waivers, if any | .90% | .64% | .90%J |
| Expenses net of all reductions | .90% | .62% | .90%J |
| Net investment income (loss) | .99% | 4.46%C | 2.04%J |
| Supplemental Data | | | |
| Net assets, end of period (000 omitted) | $19,479 | $21,838 | $104 |
| Portfolio turnover rateK | 39% | 45% | 57% |
A For the period October 2, 2018 (commencement of sale of shares) to October 31, 2018.
B Calculated based on average shares outstanding during the period.
C Net investment income per share reflects one or more large, non-recurring dividend(s) which amounted to $.20 per share. Such dividends are not annualized in the ratio of net investment income (loss) to average net assets. Excluding such non-recurring dividend(s) the ratio of net investment income (loss) to average net assets would have been 3.88%.
D Net realized and unrealized gain (loss) per share reflects proceeds received from litigation which amounted to $.16 per share. Excluding these litigation proceeds, the total return would have been (8.50) %.
E Total distributions per share do not sum due to rounding.
F Total returns for periods of less than one year are not annualized.
G Total returns would have been lower if certain expenses had not been reduced during the applicable periods shown.
H Fees and expenses of any underlying mutual funds or exchange-traded funds (ETFs) are not included in the Fund's expense ratio. The Fund indirectly bears its proportionate share of these expenses. For additional expense information related to investments in Fidelity Central Funds, please refer to the "Investments in Fidelity Central Funds" note found in the Notes to Financial Statements section of the most recent Annual or Semi-Annual report.
I Expense ratios reflect operating expenses of the class. Expenses before reductions do not reflect amounts reimbursed, waived, or reduced through arrangements with the investment adviser, brokerage services, or other offset arrangements, if applicable, and do not represent the amount paid by the class during periods when reimbursements, waivers or reductions occur.
J Annualized
K Amount does not include the portfolio activity of any underlying mutual funds or exchange-traded funds (ETFs).
See accompanying notes which are an integral part of the financial statements.
Notes to Financial Statements
For the period ended October 31, 2020
1. Organization.
Fidelity Europe Fund (the Fund) is a fund of Fidelity Investment Trust (the Trust) and is authorized to issue an unlimited number of shares. The Trust is registered under the Investment Company Act of 1940, as amended (the 1940 Act), as an open-end management investment company organized as a Massachusetts business trust. The Fund offers Class A, Class M, Class C, Europe, Class I and Class Z shares, each of which has equal rights as to assets and voting privileges. Each class has exclusive voting rights with respect to matters that affect that class. Class C shares will automatically convert to Class A shares after a holding period of ten years from the initial date of purchase, with certain exceptions.
Effective January 1, 2020:
Investment advisers Fidelity Investments Money Management, Inc., FMR Co., Inc., and Fidelity SelectCo, LLC, merged with and into Fidelity Management & Research Company. In connection with the merger transactions, the resulting, merged investment adviser was then redomiciled from Massachusetts to Delaware, changed its corporate structure from a corporation to a limited liability company, and changed its name to "Fidelity Management & Research Company LLC".
Broker-dealer Fidelity Distributors Corporation merged with and into Fidelity Investments Institutional Services Company, Inc. ("FIISC"). FIISC was then redomiciled from Massachusetts to Delaware, changed its corporate structure from a corporation to a limited liability company, and changed its name to "Fidelity Distributors Company LLC".
Fidelity Investments Institutional Operations Company, Inc. converted from a Massachusetts corporation to a Massachusetts LLC, and changed its name to "Fidelity Investments Institutional Operations Company LLC".
2. Investments in Fidelity Central Funds.
The Fund invests in Fidelity Central Funds, which are open-end investment companies generally available only to other investment companies and accounts managed by the investment adviser and its affiliates. The Fund's Schedule of Investments lists each of the Fidelity Central Funds held as of period end, if any, as an investment of the Fund, but does not include the underlying holdings of each Fidelity Central Fund. As an Investing Fund, the Fund indirectly bears its proportionate share of the expenses of the underlying Fidelity Central Funds.
The Money Market Central Funds seek preservation of capital and current income and are managed by the investment adviser. Annualized expenses of the Money Market Central Funds as of their most recent shareholder report date ranged from less than .005% to .01%.
A complete unaudited list of holdings for each Fidelity Central Fund is available upon request or at the Securities and Exchange Commission (the SEC) website at www.sec.gov. In addition, the financial statements of the Fidelity Central Funds, which are not covered by the Fund's Report of Independent Registered Public Accounting Firm, are available on the SEC website or upon request.
3. Significant Accounting Policies.
The Fund is an investment company and applies the accounting and reporting guidance of the Financial Accounting Standards Board (FASB) Accounting Standards Codification Topic 946 Financial Services – Investment Companies. The financial statements have been prepared in conformity with accounting principles generally accepted in the United States of America (GAAP), which require management to make certain estimates and assumptions at the date of the financial statements. Actual results could differ from those estimates. Subsequent events, if any, through the date that the financial statements were issued have been evaluated in the preparation of the financial statements. The following summarizes the significant accounting policies of the Fund:
Investment Valuation. Investments are valued as of 4:00 p.m. Eastern time on the last calendar day of the period. The Board of Trustees (the Board) has delegated the day to day responsibility for the valuation of the Fund's investments to the Fair Value Committee (the Committee) established by the Fund's investment adviser. In accordance with valuation policies and procedures approved by the Board, the Fund attempts to obtain prices from one or more third party pricing vendors or brokers to value its investments. When current market prices, quotations or currency exchange rates are not readily available or reliable, investments will be fair valued in good faith by the Committee, in accordance with procedures adopted by the Board. Factors used in determining fair value vary by investment type and may include market or investment specific events. The frequency with which these procedures are used cannot be predicted and they may be utilized to a significant extent. The Committee oversees the Fund's valuation policies and procedures and reports to the Board on the Committee's activities and fair value determinations. The Board monitors the appropriateness of the procedures used in valuing the Fund's investments and ratifies the fair value determinations of the Committee.
The Fund categorizes the inputs to valuation techniques used to value its investments into a disclosure hierarchy consisting of three levels as shown below:
- Level 1 – quoted prices in active markets for identical investments
- Level 2 – other significant observable inputs (including quoted prices for similar investments, interest rates, prepayment speeds, etc.)
- Level 3 – unobservable inputs (including the Fund's own assumptions based on the best information available)
Valuation techniques used to value the Fund's investments by major category are as follows:
Equity securities, including restricted securities, for which market quotations are readily available, are valued at the last reported sale price or official closing price as reported by a third party pricing vendor on the primary market or exchange on which they are traded and are categorized as Level 1 in the hierarchy. In the event there were no sales during the day or closing prices are not available, securities are valued at the last quoted bid price or may be valued using the last available price and are generally categorized as Level 2 in the hierarchy. For foreign equity securities, when market or security specific events arise, comparisons to the valuation of American Depositary Receipts (ADRs), futures contracts, Exchange-Traded Funds (ETFs) and certain indexes as well as quoted prices for similar securities may be used and would be categorized as Level 2 in the hierarchy. For equity securities, including restricted securities, where observable inputs are limited, assumptions about market activity and risk are used and these securities may be categorized as Level 3 in the hierarchy.
Investments in open-end mutual funds ,including the Fidelity Central Funds, are valued at their closing net asset value (NAV) each business day and are categorized as Level 1 in the hierarchy.
Changes in valuation techniques may result in transfers in or out of an assigned level within the disclosure hierarchy. The aggregate value of investments by input level as of October 31, 2020 is included at the end of the Fund's Schedule of Investments.
Foreign Currency. Certain Funds may use foreign currency contracts to facilitate transactions in foreign-denominated securities. Gains and losses from these transactions may arise from changes in the value of the foreign currency or if the counterparties do not perform under the contracts' terms.
Foreign-denominated assets, including investment securities, and liabilities are translated into U.S. dollars at the exchange rates at period end. Purchases and sales of investment securities, income and dividends received, and expenses denominated in foreign currencies are translated into U.S. dollars at the exchange rate in effect on the transaction date.
The effects of exchange rate fluctuations on investments are included with the net realized and unrealized gain (loss) on investment securities. Other foreign currency transactions resulting in realized and unrealized gain (loss) are disclosed separately.
Investment Transactions and Income. For financial reporting purposes, the Fund's investment holdings and NAV include trades executed through the end of the last business day of the period. The NAV per share for processing shareholder transactions is calculated as of the close of business of the New York Stock Exchange (NYSE), normally 4:00 p.m. Eastern time and includes trades executed through the end of the prior business day. Gains and losses on securities sold are determined on the basis of identified cost and include proceeds received from litigation. Dividend income is recorded on the ex-dividend date, except for certain dividends from foreign securities where the ex-dividend date may have passed, which are recorded as soon as the Fund is informed of the ex-dividend date. Non-cash dividends included in dividend income, if any, are recorded at the fair market value of the securities received. Income and capital gain distributions from Fidelity Central Funds, if any, are recorded on the ex-dividend date. Investment income is recorded net of foreign taxes withheld where recovery of such taxes is uncertain.
Class Allocations and Expenses. Investment income, realized and unrealized capital gains and losses, common expenses of the Fund, and certain fund-level expense reductions, if any, are allocated daily on a pro-rata basis to each class based on the relative net assets of each class to the total net assets of the Fund. Each class differs with respect to transfer agent and distribution and service plan fees incurred. Certain expense reductions may also differ by class. For the reporting period, the allocated portion of income and expenses to each class as a percent of its average net assets may vary due to the timing of recording these transactions in relation to fluctuating net assets of the classes. Expenses directly attributable to a fund are charged to that fund. Expenses attributable to more than one fund are allocated among the respective funds on the basis of relative net assets or other appropriate methods. Expense estimates are accrued in the period to which they relate and adjustments are made when actual amounts are known.
Income Tax Information and Distributions to Shareholders. Each year, the Fund intends to qualify as a regulated investment company under Subchapter M of the Internal Revenue Code, including distributing substantially all of its taxable income and realized gains. As a result, no provision for U.S. Federal income taxes is required. As of October 31, 2020, the Fund did not have any unrecognized tax benefits in the financial statements; nor is the Fund aware of any tax positions for which it is reasonably possible that the total amounts of unrecognized tax benefits will significantly change in the next twelve months. The Fund files a U.S. federal tax return, in addition to state and local tax returns as required. The Fund's federal income tax returns are subject to examination by the Internal Revenue Service (IRS) for a period of three fiscal years after they are filed. State and local tax returns may be subject to examination for an additional fiscal year depending on the jurisdiction. Foreign taxes are provided for based on the Fund's understanding of the tax rules and rates that exist in the foreign markets in which it invests.
Distributions are declared and recorded on the ex-dividend date. Income and capital gain distributions are declared separately for each class. Income and capital gain distributions are determined in accordance with income tax regulations, which may differ from GAAP.
Capital accounts within the financial statements are adjusted for permanent book-tax differences. These adjustments have no impact on net assets or the results of operations. Capital accounts are not adjusted for temporary book-tax differences which will reverse in a subsequent period.
Book-tax differences are primarily due to foreign currency transactions, passive foreign investment companies (PFIC), capital loss carryforwards and losses deferred due to wash sales.
As of period end, the cost and unrealized appreciation (depreciation) in securities, and derivatives if applicable, for federal income tax purposes were as follows:
| Gross unrealized appreciation | $117,812,438 |
| Gross unrealized depreciation | (97,722,275) |
| Net unrealized appreciation (depreciation) | $20,090,163 |
| Tax Cost | $815,367,852 |
The tax-based components of distributable earnings as of period end were as follows:
| Undistributed ordinary income | $10,293,273 |
| Capital loss carryforward | $(4,256,530) |
| Net unrealized appreciation (depreciation) on securities and other investments | $20,237,498 |
Capital loss carryforwards are only available to offset future capital gains of the Fund to the extent provided by regulations and may be limited. The capital loss carryforward information presented below, including any applicable limitation, is estimated as of fiscal period end and is subject to adjustment.
| No expiration | |
| Long-term | $(4,256,530) |
The tax character of distributions paid was as follows:
| | October 31, 2020 | October 31, 2018 |
| Ordinary Income | $43,898,989 | $ 33,149,624 |
| Long-term Capital Gains | 22,554,088 | 62,894,266 |
| Total | $66,453,077 | $ 96,043,890 |
Restricted Securities (including Private Placements). The Fund may invest in securities that are subject to legal or contractual restrictions on resale. These securities generally may be resold in transactions exempt from registration or to the public if the securities are registered. Disposal of these securities may involve time-consuming negotiations and expense, and prompt sale at an acceptable price may be difficult. Information regarding restricted securities is included at the end of the Fund's Schedule of Investments.
4. Purchases and Sales of Investments.
Purchases and sales of securities, other than short-term securities, are noted in the table below.
| | Purchases ($) | Sales ($) |
| Fidelity Europe Fund | 323,543,760 | 422,575,165 |
5. Fees and Other Transactions with Affiliates.
Management Fee. Fidelity Management & Research Company LLC (the investment adviser) and its affiliates provide the Fund with investment management related services for which the Fund pays a monthly management fee. The management fee is the sum of an individual fund fee rate that is based on an annual rate of .45% of the Fund's average net assets and an annualized group fee rate that averaged .23% during the period. The group fee rate is based upon the monthly average net assets of a group of registered investment companies with which the investment adviser has management contracts. The group fee rate decreases as assets under management increase and increases as assets under management decrease. In addition, the management fee is subject to a performance adjustment (up to a maximum of +/- .20% of the Fund's average net assets over a 36 month performance period). The upward or downward adjustment to the management fee is based on the relative investment performance of Europe as compared to its benchmark index, the MSCI Europe Index, over the same 36 month performance period. For the reporting period, the total annual management fee rate, including the performance adjustment, was .78% of the Fund's average net assets. The performance adjustment included in the management fee rate may be higher or lower than the maximum performance adjustment rate due to the difference between the average net assets for the reporting and performance periods.
Distribution and Service Plan Fees. In accordance with Rule 12b-1 of the 1940 Act, the Fund has adopted separate Distribution and Service Plans for each class of shares. Certain classes pay Fidelity Distributors Company LLC (FDC), an affiliate of the investment adviser, separate Distribution and Service Fees, each of which is based on an annual percentage of each class' average net assets. In addition, FDC may pay financial intermediaries for selling shares of the Fund and providing shareholder support services. For the period, the Distribution and Service Fee rates, total fees and amounts retained by FDC were as follows:
| | Distribution Fee | Service Fee | Total Fees | Retained by FDC |
| Class A | -% | .25% | $54,973 | $558 |
| Class M | .25% | .25% | 27,218 | 276 |
| Class C | .75% | .25% | 56,141 | 1,796 |
| | | | $138,332 | $2,630 |
During the period, the investment adviser or its affiliates waived a portion of these fees.
Sales Load. FDC may receive a front-end sales charge of up to 5.75% for selling Class A shares and 3.50% for selling Class M shares, some of which is paid to financial intermediaries for selling shares of the Fund. Depending on the holding period, FDC may receive contingent deferred sales charges levied on Class A, Class M and Class C redemptions. The deferred sales charges are 1.00% for Class C shares, 1.00% for certain purchases of Class A shares and .25% for certain purchases of Class M shares.
For the period, sales charge amounts retained by FDC were as follows:
| | Retained by FDC |
| Class A | $1,384 |
| Class M | 309 |
| Class C(a) | 165 |
| | $1,858 |
(a) When Class C shares are initially sold, FDC pays commissions from its own resources to financial intermediaries through which the sales are made.
Transfer Agent Fees. Fidelity Investments Institutional Operations Company LLC (FIIOC), an affiliate of the investment adviser, is the transfer, dividend disbursing and shareholder servicing agent for each class of the Fund. FIIOC receives account fees and asset-based fees that vary according to the account size and type of account of the shareholders of the respective classes of the Fund, except for Class Z. FIIOC receives an asset-based fee of Class Z's average net assets. FIIOC pays for typesetting, printing and mailing of shareholder reports, except proxy statements. Effective February 1, 2020, the Board approved to change the fee for Class Z from .046% to .044%.
For the period, transfer agent fees for each class were as follows:
| | Amount | % of Class-Level Average Net Assets |
| Class A | $49,300 | .22 |
| Class M | 15,562 | .29 |
| Class C | 15,824 | .28 |
| Europe | 1,321,344 | .17 |
| Class I | 11,691 | .14 |
| Class Z | 8,662 | .04 |
| | $1,422,383 | |
Accounting Fees. Fidelity Service Company, Inc. (FSC), an affiliate of the investment adviser, maintains the Fund's accounting records. The accounting fee is based on the level of average net assets for each month. For the period, the fees were equivalent to the following annual rates:
| | % of Average Net Assets |
| Fidelity Europe Fund | .05 |
Interfund Trades. Funds may purchase from or sell securities to other Fidelity Funds under procedures adopted by the Board. The procedures have been designed to ensure these interfund trades are executed in accordance with Rule 17a-7 of the 1940 Act. Interfund trades are included within the respective purchases and sales amounts shown in the Purchases and Sales of Investments note.
6. Committed Line of Credit.
Certain Funds participate with other funds managed by the investment adviser or an affiliate in a $4.25 billion credit facility (the "line of credit") to be utilized for temporary or emergency purposes to fund shareholder redemptions or for other short-term liquidity purposes. The participating funds have agreed to pay commitment fees on their pro-rata portion of the line of credit, which are reflected in Miscellaneous expenses on the Statement of Operations, and are as follows:
| | Amount |
| Fidelity Europe Fund | $1,990 |
During the period, there were no borrowings on this line of credit.
7. Security Lending.
Funds lend portfolio securities from time to time in order to earn additional income. Lending agents are used, including National Financial Services (NFS), an affiliate of the investment adviser. Pursuant to a securities lending agreement, NFS will receive a fee, which is capped at 9.9% of a fund's daily lending revenue, for its services as lending agent. A fund may lend securities to certain qualified borrowers, including NFS. On the settlement date of the loan, a fund receives collateral (in the form of U.S. Treasury obligations, letters of credit and/or cash) against the loaned securities and maintains collateral in an amount not less than 100% of the market value of the loaned securities during the period of the loan. The market value of the loaned securities is determined at the close of business of a fund and any additional required collateral is delivered to a fund on the next business day. A fund or borrower may terminate the loan at any time, and if the borrower defaults on its obligation to return the securities loaned because of insolvency or other reasons, a fund may apply collateral received from the borrower against the obligation. A fund may experience delays and costs in recovering the securities loaned. Any cash collateral received is invested in the Fidelity Securities Lending Cash Central Fund. Any loaned securities are identified as such in the Schedule of Investments, and the value of loaned securities and cash collateral at period end, as applicable, are presented in the Statement of Assets and Liabilities. Security lending income represents the income earned on investing cash collateral, less rebates paid to borrowers and any lending agent fees associated with the loan, plus any premium payments received for lending certain types of securities. Security lending income is presented in the Statement of Operations as a component of income from Fidelity Central Funds. Affiliated security lending activity, if any, was as follows:
| | Total Security Lending Income Fees Paid to NFS | Security Lending Income From Securities Loaned to NFS | Value of Securities Loaned to NFS at Period End |
| Fidelity Europe Fund | $– | $– | $– |
8. Expense Reductions.
Commissions paid to certain brokers with whom the investment adviser, or its affiliates, places trades on behalf of the Fund include an amount in addition to trade execution, which may be rebated back to the Fund to offset certain expenses. This amount totaled $67,678 for the period.
In addition, during the period the investment adviser or an affiliate reimbursed and/or waived a portion of fund-level operating expenses in the amount of $3,742.
In addition, during the period the investment adviser or an affiliate reimbursed the Fund $7,310 for an operational error which is included in the accompanying Statement of Operations.
9. Distributions to Shareholders.
Distributions to shareholders of each class were as follows:
| | Year ended
October 31, 2020 | Year ended
October 31, 2019 |
| Distributions to shareholders | | |
| Class A | $1,460,264 | $1,831,498 |
| Class M | 383,255 | 614,305 |
| Class C | 378,670 | 867,653 |
| Europe | 62,094,177 | 92,001,047 |
| Class I | 489,497 | 707,340 |
| Class Z | 1,647,214 | 22,047 |
| Total | $66,453,077 | $96,043,890 |
10. Share Transactions.
Share transactions for each class were as follows and may contain automatic conversions between classes or exchanges between affiliated funds:
| | Shares | Shares | Dollars | Dollars |
| | Year ended October 31, 2020 | Year ended October 31, 2019 | Year ended October 31, 2020 | Year ended October 31, 2019 |
| Class A | | | | |
| Shares sold | 239,733 | 187,597 | $7,954,936 | $6,415,473 |
| Reinvestment of distributions | 40,511 | 55,527 | 1,417,478 | 1,772,425 |
| Shares redeemed | (198,204) | (188,928) | (6,449,066) | (6,512,432) |
| Net increase (decrease) | 82,040 | 54,196 | $2,923,348 | $1,675,466 |
| Class M | | | | |
| Shares sold | 25,130 | 5,598 | $855,505 | $196,494 |
| Reinvestment of distributions | 10,836 | 19,078 | 380,764 | 611,073 |
| Shares redeemed | (48,257) | (58,673) | (1,635,183) | (2,065,750) |
| Net increase (decrease) | (12,291) | (33,997) | $(398,914) | $(1,258,183) |
| Class C | | | | |
| Shares sold | 10,039 | 7,894 | $348,740 | $273,437 |
| Reinvestment of distributions | 10,763 | 27,024 | 375,411 | 858,558 |
| Shares redeemed | (42,364) | (133,837) | (1,373,234) | (4,597,859) |
| Net increase (decrease) | (21,562) | (98,919) | $(649,083) | $(3,465,864) |
| Europe | | | | |
| Shares sold | 2,322,956 | 1,130,150 | $81,218,086 | $39,213,489 |
| Reinvestment of distributions | 1,665,756 | 2,737,998 | 58,084,924 | 87,123,097 |
| Shares redeemed | (5,681,366) | (5,789,436) | (188,258,765) | (200,269,069) |
| Net increase (decrease) | (1,692,654) | (1,921,288) | $(48,955,755) | $(73,932,483) |
| Class I | | | | |
| Shares sold | 339,419 | 84,926 | $12,281,627 | $2,952,630 |
| Reinvestment of distributions | 12,750 | 20,748 | 444,205 | 659,789 |
| Shares redeemed | (119,592) | (115,475) | (4,016,494) | (3,974,243) |
| Net increase (decrease) | 232,577 | (9,801) | $8,709,338 | $(361,824) |
| Class Z | | | | |
| Shares sold | 74,630 | 644,857 | $2,633,488 | $21,625,731 |
| Reinvestment of distributions | 47,346 | 695 | 1,645,259 | 22,047 |
| Shares redeemed | (172,676) | (45,265) | (5,746,605) | (1,568,987) |
| Net increase (decrease) | (50,700) | 600,287 | $(1,467,858) | $20,078,791 |
11. Other.
The Fund's organizational documents provide former and current trustees and officers with a limited indemnification against liabilities arising in connection with the performance of their duties to the Fund. In the normal course of business, the Fund may also enter into contracts that provide general indemnifications. The Fund's maximum exposure under these arrangements is unknown as this would be dependent on future claims that may be made against the Fund. The risk of material loss from such claims is considered remote.
12. Coronavirus (COVID-19) Pandemic.
An outbreak of COVID-19 first detected in China during December 2019 has since spread globally and was declared a pandemic by the World Health Organization during March 2020. Developments that disrupt global economies and financial markets, such as the COVID-19 pandemic, may magnify factors that affect the Fund's performance.
Fidelity® Japan Fund
Performance: The Bottom Line
Average annual total return reflects the change in the value of an investment, assuming reinvestment of distributions from dividend income and capital gains (the profits earned upon the sale of securities that have grown in value, if any) and assuming a constant rate of performance each year. The hypothetical investment and the average annual total returns do not reflect the deduction of taxes that a shareholder would pay on fund distributions or the redemption of fund shares. During periods of reimbursement by Fidelity, a fund’s total return will be greater than it would be had the reimbursement not occurred. How a fund did yesterday is no guarantee of how it will do tomorrow.
Average Annual Total Returns
| For the periods ended October 31, 2020 | Past 1 year | Past 5 years | Past 10 years |
| Class A (incl. 5.75% sales charge) | 5.42% | 7.43% | 5.78% |
| Class M (incl. 3.50% sales charge) | 7.64% | 7.58% | 5.71% |
| Class C (incl. contingent deferred sales charge) | 10.09% | 7.95% | 5.67% |
| Fidelity® Japan Fund | 12.16% | 9.03% | 6.74% |
| Class I | 12.20% | 9.07% | 6.78% |
| Class Z | 12.36% | 9.13% | 6.81% |
Class A shares bear a 0.25% 12b-1 fee. The initial offering of Class A shares took place on December 14, 2010. Returns prior to December 14, 2010, are those of Fidelity® Japan Fund, the original class of the fund, which has no 12b-1 fee. Had Class A's 12b-1 fee been reflected, returns prior to December 14, 2010, would have been lower.
Class M shares bear a 0.50% 12b-1 fee. The initial offering of Class M shares took place on December 14, 2010. Returns prior to December 14, 2010, are those of Fidelity® Japan Fund, the original class of the fund, which has no 12b-1 fee. Had Class M's 12b-1 fee been reflected, returns prior to December 14, 2010, would have been lower.
Class C shares bear a 1.00% 12b-1 fee. The initial offering of Class C shares took place on December 14, 2010. Returns prior to December 14, 2010, are those of Fidelity® Japan Fund, the original class of the fund, which has no 12b-1 fee. Had Class C's 12b-1 fee been reflected, returns prior to December 14, 2010, would have been lower.
Class C shares' contingent deferred sales charges included in the past one year, past five years and past ten years total return figures are 1%, 0% and 0%, respectively.
The initial offering of Class I shares took place on December 14, 2010. Returns prior to December 14, 2010 are those of Fidelity® Japan Fund, the original class of the fund.
The initial offering of Class Z shares took place on October 2, 2018. Returns between December 14, 2010 and October 2, 2018, are those of Class I. Returns prior to December 14, 2010 are those of Fidelity® Japan Fund, the original class of the fund.
$10,000 Over 10 Years
Let's say hypothetically that $10,000 was invested in Fidelity® Japan Fund, a class of the fund, on October 31, 2010, and the current % sales charge was paid.
The chart shows how the value of your investment would have changed, and also shows how the Tokyo Stock Price Index (TOPIX) performed over the same period.

| Period Ending Values |
| $19,205 | Fidelity® Japan Fund |
| $18,687 | Tokyo Stock Price Index (TOPIX) |
Fidelity® Japan Fund
Management's Discussion of Fund Performance
Market Recap: The MSCI ACWI (All Country World Index) ex USA Index returned -2.46% for the 12 months ending October 31, 2020, in what was a bumpy ride for non-U.S. equities, marked by a steep but brief decline due to the early-2020 outbreak and spread of the coronavirus, followed by a sharp upturn. Declared a pandemic on March 11, the crisis and containment efforts caused broad contraction in economic activity, elevated volatility and dislocation in financial markets. A historically rapid and expansive monetary- and fiscal-policy response around the world provided a partial offset to the economic disruption. Other supporting factors included resilient corporate earnings and near-term potential for a COVID-19 vaccine breakthrough. This was evident in the index’s 12.28% gain in the final six months of the year. Currency fluctuation generally boosted foreign developed-markets equities for the year, while the reverse was true for emerging-markets stocks. Late in the period, the index was pressured by a second wave of COVID-19 cases in some regions, and stretched valuations and crowded positioning in big tech. For the full year, the U.K. (-22%), Asia Pacific ex Japan (-8%), Canada (-5%) and Europe ex U.K. (-4%) notably lagged. Emerging markets (+9%) and Japan (+1%) outperformed. By sector, energy (-38%), financials and real estate (-20% each) lagged, whereas information technology (+ 25%) and communication services (+15%) topped the index.
Comments from Portfolio Manager Kirk Neureiter: For the fiscal year ending October 31, 2020, the fund's share classes gained roughly 11% to 12% (excluding sales charges, if applicable), outperforming the 0.36% result of the benchmark Tokyo Stock Exchange TOPIX Total Return Index. By sector, the primary contributor to performance versus the benchmark was our stock selection in industrials. Strong picks in communication services also boosted performance, as did security selection and an overweighting in information technology, especially within the software & services industry. The biggest individual relative contributor was an overweight position in Softbank Group (+69%). Softbank was among our largest holdings. Also lifting performance was our outsized stake in Hoya, which gained 28%. Hoya was among the fund's biggest holdings. Another top relative contributor was an out-of-benchmark stake in Money Forward (+155%). By sector, the primary detractor from performance versus the benchmark was an underweighting in communication services. Weak picks in the consumer staples sector, especially within the household & personal products industry, also hampered relative performance. Also modestly holding back the fund's relative performance was an overweighting in real estate. Not owning Keyence, a benchmark component that gained about 42%, was the largest individual relative detractor versus the benchmark. Another notable relative detractor was an overweighting in Orix (-23%), which was among our biggest holdings. Avoiding M3, a benchmark component that gained 179%, also hurt performance.
The views expressed above reflect those of the portfolio manager(s) only through the end of the period as stated on the cover of this report and do not necessarily represent the views of Fidelity or any other person in the Fidelity organization. Any such views are subject to change at any time based upon market or other conditions and Fidelity disclaims any responsibility to update such views. These views may not be relied on as investment advice and, because investment decisions for a Fidelity fund are based on numerous factors, may not be relied on as an indication of trading intent on behalf of any Fidelity fund.
Fidelity® Japan Fund
Investment Summary (Unaudited)
Geographic Diversification (% of fund's net assets)
| As of October 31, 2020 |
| | Japan | 96.2% |
| | United States of America* | 3.5% |
| | Cayman Islands | 0.3% |

* Includes Short-Term investments and Net Other Assets (Liabilities).
Percentages are based on country or territory of incorporation and are adjusted for the effect of futures contracts, if applicable.
Asset Allocation as of October 31, 2020
| | % of fund's net assets |
| Stocks | 96.5 |
| Short-Term Investments and Net Other Assets (Liabilities) | 3.5 |
Top Ten Stocks as of October 31, 2020
| | % of fund's net assets |
| Sony Corp. (Household Durables) | 4.7 |
| Hoya Corp. (Health Care Equipment & Supplies) | 4.6 |
| SoftBank Group Corp. (Wireless Telecommunication Services) | 4.6 |
| Shin-Etsu Chemical Co. Ltd. (Chemicals) | 2.2 |
| ORIX Corp. (Diversified Financial Services) | 2.2 |
| Daikin Industries Ltd. (Building Products) | 2.1 |
| Takeda Pharmaceutical Co. Ltd. (Pharmaceuticals) | 2.1 |
| Tokio Marine Holdings, Inc. (Insurance) | 2.0 |
| Kao Corp. (Personal Products) | 1.9 |
| Nidec Corp. (Electrical Equipment) | 1.9 |
| | 28.3 |
Top Market Sectors as of October 31, 2020
| | % of fund's net assets |
| Industrials | 19.5 |
| Information Technology | 15.5 |
| Consumer Discretionary | 13.4 |
| Health Care | 11.8 |
| Communication Services | 9.4 |
| Consumer Staples | 8.9 |
| Financials | 7.4 |
| Materials | 7.0 |
| Real Estate | 3.6 |
Fidelity® Japan Fund
Schedule of Investments October 31, 2020
Showing Percentage of Net Assets
| Common Stocks - 96.5% | | | |
| | | Shares | Value |
| COMMUNICATION SERVICES - 9.4% | | | |
| Entertainment - 3.0% | | | |
| Daiichikosho Co. Ltd. | | 124,500 | $4,260,014 |
| Nexon Co. Ltd. | | 196,000 | 5,462,699 |
| Nintendo Co. Ltd. | | 25,800 | 13,949,771 |
| | | | 23,672,484 |
| Interactive Media & Services - 1.8% | | | |
| Hypebeast Ltd. (a) | | 20,787,500 | 1,984,231 |
| Z Holdings Corp. | | 1,709,100 | 11,917,657 |
| | | | 13,901,888 |
| Wireless Telecommunication Services - 4.6% | | | |
| SoftBank Group Corp. | | 554,700 | 36,129,725 |
|
| TOTAL COMMUNICATION SERVICES | | | 73,704,097 |
|
| CONSUMER DISCRETIONARY - 13.4% | | | |
| Auto Components - 2.0% | | | |
| DaikyoNishikawa Corp. | | 526,700 | 2,919,472 |
| DENSO Corp. | | 267,500 | 12,464,588 |
| | | | 15,384,060 |
| Automobiles - 1.5% | | | |
| Suzuki Motor Corp. | | 281,300 | 12,081,189 |
| Distributors - 0.7% | | | |
| Arata Corp. | | 112,800 | 5,481,768 |
| Hotels, Restaurants & Leisure - 0.7% | | | |
| Curves Holdings Co. Ltd. | | 580,500 | 3,566,588 |
| Koshidaka Holdings Co. Ltd. | | 580,500 | 2,171,554 |
| | | | 5,738,142 |
| Household Durables - 4.7% | | | |
| Sony Corp. | | 440,600 | 36,731,272 |
| Internet & Direct Marketing Retail - 0.9% | | | |
| Zozo, Inc. | | 278,500 | 7,064,962 |
| Leisure Products - 1.0% | | | |
| Bandai Namco Holdings, Inc. | | 101,400 | 7,578,108 |
| Multiline Retail - 0.6% | | | |
| Ryohin Keikaku Co. Ltd. | | 211,400 | 4,437,143 |
| Specialty Retail - 0.9% | | | |
| Nitori Holdings Co. Ltd. | | 35,700 | 7,338,373 |
| Textiles, Apparel & Luxury Goods - 0.4% | | | |
| Descente Ltd. (a) | | 181,400 | 2,813,668 |
|
| TOTAL CONSUMER DISCRETIONARY | | | 104,648,685 |
|
| CONSUMER STAPLES - 8.9% | | | |
| Food & Staples Retailing - 4.8% | | | |
| Ain Holdings, Inc. | | 101,800 | 7,120,653 |
| Nishimoto Co. Ltd. | | 137,900 | 2,466,983 |
| Seven & i Holdings Co. Ltd. | | 365,000 | 11,094,059 |
| Sundrug Co. Ltd. | | 81,100 | 3,011,389 |
| Tsuruha Holdings, Inc. | | 55,700 | 7,799,395 |
| Welcia Holdings Co. Ltd. | | 158,800 | 6,223,583 |
| | | | 37,716,062 |
| Food Products - 0.6% | | | |
| Morinaga & Co. Ltd. | | 124,000 | 4,711,408 |
| Personal Products - 3.5% | | | |
| Kao Corp. | | 211,500 | 15,058,527 |
| Kose Corp. | | 33,500 | 4,270,431 |
| Shiseido Co. Ltd. | | 122,600 | 7,589,801 |
| | | | 26,918,759 |
|
| TOTAL CONSUMER STAPLES | | | 69,346,229 |
|
| FINANCIALS - 7.4% | | | |
| Banks - 2.0% | | | |
| Mitsubishi UFJ Financial Group, Inc. | | 3,300,700 | 13,011,045 |
| Shinsei Bank Ltd. | | 206,600 | 2,485,718 |
| | | | 15,496,763 |
| Capital Markets - 0.9% | | | |
| JAFCO Co. Ltd. | | 58,700 | 2,654,767 |
| SBI Holdings, Inc. Japan | | 188,400 | 4,342,856 |
| | | | 6,997,623 |
| Diversified Financial Services - 2.2% | | | |
| ORIX Corp. | | 1,486,900 | 17,389,648 |
| Insurance - 2.3% | | | |
| Lifenet Insurance Co. (a)(b) | | 180,600 | 2,659,596 |
| Tokio Marine Holdings, Inc. | | 346,800 | 15,500,130 |
| | | | 18,159,726 |
|
| TOTAL FINANCIALS | | | 58,043,760 |
|
| HEALTH CARE - 11.8% | | | |
| Health Care Equipment & Supplies - 7.9% | | | |
| Hoya Corp. | | 320,300 | 36,148,077 |
| Olympus Corp. | | 659,300 | 12,621,693 |
| Paramount Bed Holdings Co. Ltd. | | 89,700 | 3,455,948 |
| Sysmex Corp. | | 41,000 | 3,851,078 |
| Terumo Corp. | | 156,400 | 5,756,146 |
| | | | 61,832,942 |
| Health Care Providers & Services - 0.5% | | | |
| Ship Healthcare Holdings, Inc. | | 91,100 | 4,322,909 |
| Pharmaceuticals - 3.4% | | | |
| Astellas Pharma, Inc. | | 754,100 | 10,340,929 |
| Takeda Pharmaceutical Co. Ltd. | | 522,341 | 16,141,701 |
| | | | 26,482,630 |
|
| TOTAL HEALTH CARE | | | 92,638,481 |
|
| INDUSTRIALS - 19.5% | | | |
| Building Products - 3.0% | | | |
| Daikin Industries Ltd. | | 90,500 | 16,935,560 |
| Toto Ltd. | | 152,600 | 6,967,029 |
| | | | 23,902,589 |
| Commercial Services & Supplies - 1.7% | | | |
| Park24 Co. Ltd. | | 435,800 | 5,886,726 |
| Secom Co. Ltd. | | 84,500 | 7,138,467 |
| | | | 13,025,193 |
| Construction & Engineering - 0.7% | | | |
| Mirait Holdings Corp. (b) | | 362,300 | 5,157,755 |
| Electrical Equipment - 1.9% | | | |
| Nidec Corp. | | 145,900 | 14,736,203 |
| Machinery - 5.9% | | | |
| FANUC Corp. | | 43,300 | 9,146,036 |
| Hoshizaki Corp. | | 68,900 | 5,502,302 |
| Kitz Corp. | | 548,200 | 2,966,784 |
| Minebea Mitsumi, Inc. | | 415,300 | 7,500,883 |
| Misumi Group, Inc. | | 450,460 | 13,378,470 |
| Nabtesco Corp. | | 212,000 | 7,919,948 |
| | | | 46,414,423 |
| Professional Services - 3.9% | | | |
| Persol Holdings Co., Ltd. | | 888,300 | 13,454,371 |
| Recruit Holdings Co. Ltd. | | 230,500 | 8,770,681 |
| SMS Co., Ltd. | | 269,900 | 7,946,433 |
| | | | 30,171,485 |
| Road & Rail - 0.6% | | | |
| Hitachi Transport System Ltd. | | 157,300 | 4,986,218 |
| Trading Companies & Distributors - 1.8% | | | |
| Itochu Corp. | | 327,800 | 7,873,271 |
| Trusco Nakayama Corp. | | 244,800 | 6,313,104 |
| | | | 14,186,375 |
|
| TOTAL INDUSTRIALS | | | 152,580,241 |
|
| INFORMATION TECHNOLOGY - 15.5% | | | |
| Electronic Equipment & Components - 5.3% | | | |
| Azbil Corp. | | 101,800 | 4,131,380 |
| Dexerials Corp. | | 587,800 | 6,724,459 |
| Iriso Electronics Co. Ltd. | | 118,600 | 4,515,611 |
| Murata Manufacturing Co. Ltd. | | 201,200 | 14,109,887 |
| Shimadzu Corp. | | 147,200 | 4,208,942 |
| TDK Corp. | | 67,700 | 7,961,569 |
| | | | 41,651,848 |
| IT Services - 7.5% | | | |
| DTS Corp. | | 187,800 | 3,652,523 |
| Future Corp. | | 140,000 | 2,396,489 |
| GMO Internet, Inc. | | 322,500 | 8,601,802 |
| IT Holdings Corp. | | 233,700 | 4,469,546 |
| ITOCHU Techno-Solutions Corp. | | 188,400 | 6,391,921 |
| Net One Systems Co. Ltd. | | 224,900 | 6,724,187 |
| Nomura Research Institute Ltd. | | 126,900 | 3,740,695 |
| NSD Co. Ltd. | | 376,800 | 6,618,362 |
| NTT Data Corp. | | 546,300 | 6,165,659 |
| Otsuka Corp. | | 92,200 | 4,236,744 |
| Poletowin Pitcrew Holdings, Inc. | | 64,800 | 564,518 |
| SCSK Corp. | | 94,500 | 4,698,682 |
| | | | 58,261,128 |
| Semiconductors & Semiconductor Equipment - 1.1% | | | |
| Renesas Electronics Corp. (a) | | 1,067,700 | 8,813,493 |
| Software - 1.6% | | | |
| Money Forward, Inc. (a) | | 87,500 | 7,916,087 |
| Oracle Corp. Japan | | 49,200 | 4,917,053 |
| | | | 12,833,140 |
|
| TOTAL INFORMATION TECHNOLOGY | | | 121,559,609 |
|
| MATERIALS - 7.0% | | | |
| Chemicals - 7.0% | | | |
| JSR Corp. | | 260,100 | 5,878,789 |
| Kansai Paint Co. Ltd. | | 362,200 | 9,338,282 |
| KH Neochem Co. Ltd. | | 220,399 | 5,157,414 |
| Nissan Chemical Corp. | | 97,200 | 5,158,470 |
| NOF Corp. | | 128,400 | 4,825,571 |
| Shin-Etsu Chemical Co. Ltd. | | 131,300 | 17,537,327 |
| Tokyo Ohka Kogyo Co. Ltd. | | 110,800 | 6,560,437 |
| | | | 54,456,290 |
| REAL ESTATE - 3.6% | | | |
| Real Estate Management & Development - 3.6% | | | |
| Daiwa House Industry Co. Ltd. | | 227,300 | 5,972,253 |
| Kenedix, Inc. | | 1,589,000 | 8,234,326 |
| Open House Co. Ltd. | | 227,500 | 7,746,866 |
| Relo Group, Inc. | | 266,800 | 6,402,873 |
| | | | 28,356,318 |
| TOTAL COMMON STOCKS | | | |
| (Cost $581,874,115) | | | 755,333,710 |
|
| Money Market Funds - 3.3% | | | |
| Fidelity Cash Central Fund 0.10% (c) | | 23,812,624 | 23,817,386 |
| Fidelity Securities Lending Cash Central Fund 0.11% (c)(d) | | 2,357,767 | 2,358,003 |
| TOTAL MONEY MARKET FUNDS | | | |
| (Cost $26,175,389) | | | 26,175,389 |
| TOTAL INVESTMENT IN SECURITIES - 99.8% | | | |
| (Cost $608,049,504) | | | 781,509,099 |
| NET OTHER ASSETS (LIABILITIES) - 0.2% | | | 1,226,876 |
| NET ASSETS - 100% | | | $782,735,975 |
Legend
(a) Non-income producing
(b) Security or a portion of the security is on loan at period end.
(c) Affiliated fund that is generally available only to investment companies and other accounts managed by Fidelity Investments. The rate quoted is the annualized seven-day yield of the fund at period end. A complete unaudited listing of the fund's holdings as of its most recent quarter end is available upon request. In addition, each Fidelity Central Fund's financial statements, which are not covered by the Fund's Report of Independent Registered Public Accounting Firm, are available on the SEC's website or upon request.
(d) Investment made with cash collateral received from securities on loan.
Affiliated Central Funds
Information regarding fiscal year to date income earned by the Fund from investments in Fidelity Central Funds is as follows:
| Fund | Income earned |
| Fidelity Cash Central Fund | $140,640 |
| Fidelity Securities Lending Cash Central Fund | 134,105 |
| Total | $274,745 |
Amounts in the income column in the above table include any capital gain distributions from underlying funds, which are presented in the corresponding line-item in the Statement of Operations, if applicable. Amount for Fidelity Securities Lending Cash Central Fund represents the income earned on investing cash collateral, less rebates paid to borrowers and any lending agent fees associated with the loan, plus any premium payments received for lending certain types of securities.
Investment Valuation
The following is a summary of the inputs used, as of October 31, 2020, involving the Fund's assets and liabilities carried at fair value. The inputs or methodology used for valuing securities may not be an indication of the risk associated with investing in those securities. For more information on valuation inputs, and their aggregation into the levels used below, please refer to the Investment Valuation section in the accompanying Notes to Financial Statements.
| | Valuation Inputs at Reporting Date: |
| Description | Total | Level 1 | Level 2 | Level 3 |
| Investments in Securities: | | | | |
| Equities: | | | | |
| Communication Services | $73,704,097 | $1,984,231 | $71,719,866 | $-- |
| Consumer Discretionary | 104,648,685 | -- | 104,648,685 | -- |
| Consumer Staples | 69,346,229 | -- | 69,346,229 | -- |
| Financials | 58,043,760 | -- | 58,043,760 | -- |
| Health Care | 92,638,481 | -- | 92,638,481 | -- |
| Industrials | 152,580,241 | -- | 152,580,241 | -- |
| Information Technology | 121,559,609 | -- | 121,559,609 | -- |
| Materials | 54,456,290 | -- | 54,456,290 | -- |
| Real Estate | 28,356,318 | -- | 28,356,318 | -- |
| Money Market Funds | 26,175,389 | 26,175,389 | -- | -- |
| Total Investments in Securities: | $781,509,099 | $28,159,620 | $753,349,479 | $-- |
See accompanying notes which are an integral part of the financial statements.
Fidelity® Japan Fund
Financial Statements
Statement of Assets and Liabilities
| | | October 31, 2020 |
| Assets | | |
Investment in securities, at value (including securities loaned of $2,241,797) — See accompanying schedule:
Unaffiliated issuers (cost $581,874,115) | $755,333,710 | |
| Fidelity Central Funds (cost $26,175,389) | 26,175,389 | |
| Total Investment in Securities (cost $608,049,504) | | $781,509,099 |
| Receivable for fund shares sold | | 243,385 |
| Dividends receivable | | 4,963,971 |
| Distributions receivable from Fidelity Central Funds | | 8,534 |
| Prepaid expenses | | 1,313 |
| Other receivables | | 13,230 |
| Total assets | | 786,739,532 |
| Liabilities | | |
| Payable for investments purchased | $750,355 | |
| Payable for fund shares redeemed | 119,091 | |
| Accrued management fee | 553,373 | |
| Distribution and service plan fees payable | 10,256 | |
| Other affiliated payables | 129,081 | |
| Other payables and accrued expenses | 85,171 | |
| Collateral on securities loaned | 2,356,230 | |
| Total liabilities | | 4,003,557 |
| Net Assets | | $782,735,975 |
| Net Assets consist of: | | |
| Paid in capital | | $597,911,782 |
| Total accumulated earnings (loss) | | 184,824,193 |
| Net Assets | | $782,735,975 |
| Net Asset Value and Maximum Offering Price | | |
| Class A: | | |
| Net Asset Value and redemption price per share ($16,181,092 ÷ 924,658 shares)(a) | | $17.50 |
| Maximum offering price per share (100/94.25 of $17.50) | | $18.57 |
| Class M: | | |
| Net Asset Value and redemption price per share ($3,727,797 ÷ 214,299 shares)(a) | | $17.40 |
| Maximum offering price per share (100/96.50 of $17.40) | | $18.03 |
| Class C: | | |
| Net Asset Value and offering price per share ($6,167,148 ÷ 359,173 shares)(a) | | $17.17 |
| Japan: | | |
| Net Asset Value, offering price and redemption price per share ($274,433,435 ÷ 15,611,127 shares) | | $17.58 |
| Class I: | | |
| Net Asset Value, offering price and redemption price per share ($473,858,625 ÷ 26,982,015 shares) | | $17.56 |
| Class Z: | | |
| Net Asset Value, offering price and redemption price per share ($8,367,878 ÷ 476,610 shares) | | $17.56 |
(a) Redemption price per share is equal to net asset value less any applicable contingent deferred sales charge.
See accompanying notes which are an integral part of the financial statements.
Statement of Operations
| | | Year ended October 31, 2020 |
| Investment Income | | |
| Dividends | | $13,812,178 |
| Income from Fidelity Central Funds (including $134,105 from security lending) | | 274,745 |
| Income before foreign taxes withheld | | 14,086,923 |
| Less foreign taxes withheld | | (1,310,910) |
| Total income | | 12,776,013 |
| Expenses | | |
| Management fee | | |
| Basic fee | $5,094,812 | |
| Performance adjustment | 883,541 | |
| Transfer agent fees | 1,171,145 | |
| Distribution and service plan fees | 126,293 | |
| Accounting fees | 361,678 | |
| Custodian fees and expenses | 63,124 | |
| Independent trustees' fees and expenses | 4,228 | |
| Registration fees | 84,030 | |
| Audit | 73,339 | |
| Legal | 1,124 | |
| Interest | 360 | |
| Miscellaneous | 9,618 | |
| Total expenses before reductions | 7,873,292 | |
| Expense reductions | (53,172) | |
| Total expenses after reductions | | 7,820,120 |
| Net investment income (loss) | | 4,955,893 |
| Realized and Unrealized Gain (Loss) | | |
| Net realized gain (loss) on: | | |
| Investment securities: | | |
| Unaffiliated issuers | 13,220,010 | |
| Fidelity Central Funds | (1,559) | |
| Foreign currency transactions | 453,835 | |
| Total net realized gain (loss) | | 13,672,286 |
| Change in net unrealized appreciation (depreciation) on: | | |
| Investment securities: | | |
| Unaffiliated issuers | 63,225,150 | |
| Fidelity Central Funds | 218 | |
| Assets and liabilities in foreign currencies | 43,952 | |
| Total change in net unrealized appreciation (depreciation) | | 63,269,320 |
| Net gain (loss) | | 76,941,606 |
| Net increase (decrease) in net assets resulting from operations | | $81,897,499 |
See accompanying notes which are an integral part of the financial statements.
Statement of Changes in Net Assets
| | Year ended October 31, 2020 | Year ended October 31, 2019 |
| Increase (Decrease) in Net Assets | | |
| Operations | | |
| Net investment income (loss) | $4,955,893 | $5,498,549 |
| Net realized gain (loss) | 13,672,286 | 12,481,915 |
| Change in net unrealized appreciation (depreciation) | 63,269,320 | 61,239,025 |
| Net increase (decrease) in net assets resulting from operations | 81,897,499 | 79,219,489 |
| Distributions to shareholders | (9,407,855) | (2,139,920) |
| Share transactions - net increase (decrease) | (47,240,810) | 158,952,766 |
| Total increase (decrease) in net assets | 25,248,834 | 236,032,335 |
| Net Assets | | |
| Beginning of period | 757,487,141 | 521,454,806 |
| End of period | $782,735,975 | $757,487,141 |
See accompanying notes which are an integral part of the financial statements.
Financial Highlights
Fidelity Japan Fund Class A
| Years ended October 31, | 2020 | 2019 | 2018 | 2017 | 2016 |
| Selected Per–Share Data | | | | | |
| Net asset value, beginning of period | $15.80 | $14.15 | $15.08 | $12.59 | $11.87 |
| Income from Investment Operations | | | | | |
| Net investment income (loss)A | .05 | .07 | .03 | .06 | .06 |
| Net realized and unrealized gain (loss) | 1.81 | 1.58 | (.85) | 2.52 | .72 |
| Total from investment operations | 1.86 | 1.65 | (.82) | 2.58 | .78 |
| Distributions from net investment income | (.07) | – | (.08) | (.06) | (.05) |
| Distributions from net realized gain | (.09) | – | (.04) | (.03) | (.01) |
| Total distributions | (.16) | – | (.11)B | (.09) | (.06) |
| Redemption fees added to paid in capitalA | – | – | –C | –C | –C |
| Net asset value, end of period | $17.50 | $15.80 | $14.15 | $15.08 | $12.59 |
| Total ReturnD,E | 11.85% | 11.66% | (5.48)% | 20.70% | 6.56% |
| Ratios to Average Net AssetsF,G | | | | | |
| Expenses before reductions | 1.37% | 1.33% | 1.33% | 1.11% | 1.08% |
| Expenses net of fee waivers, if any | 1.37% | 1.32% | 1.33% | 1.11% | 1.08% |
| Expenses net of all reductions | 1.37% | 1.32% | 1.32% | 1.11% | 1.08% |
| Net investment income (loss) | .35% | .51% | .17% | .45% | .51% |
| Supplemental Data | | | | | |
| Net assets, end of period (000 omitted) | $16,181 | $16,069 | $14,587 | $16,155 | $23,910 |
| Portfolio turnover rateH | 22% | 27% | 40% | 23% | 15% |
A Calculated based on average shares outstanding during the period.
B Total distributions per share do not sum due to rounding.
C Amount represents less than $.005 per share.
D Total returns would have been lower if certain expenses had not been reduced during the applicable periods shown.
E Total returns do not include the effect of the sales charges.
F Fees and expenses of any underlying mutual funds or exchange-traded funds (ETFs) are not included in the Fund's expense ratio. The Fund indirectly bears its proportionate share of these expenses. For additional expense information related to investments in Fidelity Central Funds, please refer to the "Investments in Fidelity Central Funds" note found in the Notes to Financial Statements section of the most recent Annual or Semi-Annual report.
G Expense ratios reflect operating expenses of the class. Expenses before reductions do not reflect amounts reimbursed, waived, or reduced through arrangements with the investment adviser, brokerage services, or other offset arrangements, if applicable, and do not represent the amount paid by the class during periods when reimbursements, waivers or reductions occur.
H Amount does not include the portfolio activity of any underlying mutual funds or exchange-traded funds (ETFs).
See accompanying notes which are an integral part of the financial statements.
Fidelity Japan Fund Class M
| Years ended October 31, | 2020 | 2019 | 2018 | 2017 | 2016 |
| Selected Per–Share Data | | | | | |
| Net asset value, beginning of period | $15.71 | $14.11 | $15.06 | $12.57 | $11.85 |
| Income from Investment Operations | | | | | |
| Net investment income (loss)A | .01 | .03 | (.03) | .01 | .02 |
| Net realized and unrealized gain (loss) | 1.80 | 1.57 | (.84) | 2.52 | .71 |
| Total from investment operations | 1.81 | 1.60 | (.87) | 2.53 | .73 |
| Distributions from net investment income | (.03) | – | (.05) | (.01) | –B |
| Distributions from net realized gain | (.09) | – | (.04) | (.03) | (.01) |
| Total distributions | (.12) | – | (.08)C | (.04) | (.01) |
| Redemption fees added to paid in capitalA | – | – | –B | –B | –B |
| Net asset value, end of period | $17.40 | $15.71 | $14.11 | $15.06 | $12.57 |
| Total ReturnD,E | 11.55% | 11.34% | (5.81)% | 20.24% | 6.15% |
| Ratios to Average Net AssetsF,G | | | | | |
| Expenses before reductions | 1.67% | 1.64% | 1.67% | 1.46% | 1.44% |
| Expenses net of fee waivers, if any | 1.67% | 1.64% | 1.67% | 1.46% | 1.44% |
| Expenses net of all reductions | 1.67% | 1.63% | 1.66% | 1.46% | 1.44% |
| Net investment income (loss) | .04% | .19% | (.17)% | .10% | .16% |
| Supplemental Data | | | | | |
| Net assets, end of period (000 omitted) | $3,728 | $3,945 | $3,993 | $4,464 | $4,193 |
| Portfolio turnover rateH | 22% | 27% | 40% | 23% | 15% |
A Calculated based on average shares outstanding during the period.
B Amount represents less than $.005 per share.
C Total distributions per share do not sum due to rounding.
D Total returns would have been lower if certain expenses had not been reduced during the applicable periods shown.
E Total returns do not include the effect of the sales charges.
F Fees and expenses of any underlying mutual funds or exchange-traded funds (ETFs) are not included in the Fund's expense ratio. The Fund indirectly bears its proportionate share of these expenses. For additional expense information related to investments in Fidelity Central Funds, please refer to the "Investments in Fidelity Central Funds" note found in the Notes to Financial Statements section of the most recent Annual or Semi-Annual report.
G Expense ratios reflect operating expenses of the class. Expenses before reductions do not reflect amounts reimbursed, waived, or reduced through arrangements with the investment adviser, brokerage services, or other offset arrangements, if applicable, and do not represent the amount paid by the class during periods when reimbursements, waivers or reductions occur.
H Amount does not include the portfolio activity of any underlying mutual funds or exchange-traded funds (ETFs).
See accompanying notes which are an integral part of the financial statements.
Fidelity Japan Fund Class C
| Years ended October 31, | 2020 | 2019 | 2018 | 2017 | 2016 |
| Selected Per–Share Data | | | | | |
| Net asset value, beginning of period | $15.49 | $13.97 | $14.92 | $12.44 | $11.77 |
| Income from Investment Operations | | | | | |
| Net investment income (loss)A | (.05) | (.02) | (.08) | (.03) | (.02) |
| Net realized and unrealized gain (loss) | 1.77 | 1.54 | (.83) | 2.51 | .69 |
| Total from investment operations | 1.72 | 1.52 | (.91) | 2.48 | .67 |
| Distributions from net investment income | – | – | –B | – | – |
| Distributions from net realized gain | (.04) | – | (.04) | – | – |
| Total distributions | (.04) | – | (.04) | – | – |
| Redemption fees added to paid in capitalA | – | – | –B | –B | –B |
| Net asset value, end of period | $17.17 | $15.49 | $13.97 | $14.92 | $12.44 |
| Total ReturnC,D | 11.09% | 10.88% | (6.13)% | 19.94% | 5.69% |
| Ratios to Average Net AssetsE,F | | | | | |
| Expenses before reductions | 2.06% | 2.01% | 2.04% | 1.81% | 1.81% |
| Expenses net of fee waivers, if any | 2.05% | 2.00% | 2.03% | 1.81% | 1.81% |
| Expenses net of all reductions | 2.05% | 2.00% | 2.03% | 1.81% | 1.81% |
| Net investment income (loss) | (.34)% | (.17)% | (.53)% | (.25)% | (.21)% |
| Supplemental Data | | | | | |
| Net assets, end of period (000 omitted) | $6,167 | $8,829 | $12,586 | $13,542 | $15,077 |
| Portfolio turnover rateG | 22% | 27% | 40% | 23% | 15% |
A Calculated based on average shares outstanding during the period.
B Amount represents less than $.005 per share.
C Total returns would have been lower if certain expenses had not been reduced during the applicable periods shown.
D Total returns do not include the effect of the contingent deferred sales charge.
E Fees and expenses of any underlying mutual funds or exchange-traded funds (ETFs) are not included in the Fund's expense ratio. The Fund indirectly bears its proportionate share of these expenses. For additional expense information related to investments in Fidelity Central Funds, please refer to the "Investments in Fidelity Central Funds" note found in the Notes to Financial Statements section of the most recent Annual or Semi-Annual report.
F Expense ratios reflect operating expenses of the class. Expenses before reductions do not reflect amounts reimbursed, waived, or reduced through arrangements with the investment adviser, brokerage services, or other offset arrangements, if applicable, and do not represent the amount paid by the class during periods when reimbursements, waivers or reductions occur.
G Amount does not include the portfolio activity of any underlying mutual funds or exchange-traded funds (ETFs).
See accompanying notes which are an integral part of the financial statements.
Fidelity Japan Fund
| Years ended October 31, | 2020 | 2019 | 2018 | 2017 | 2016 |
| Selected Per–Share Data | | | | | |
| Net asset value, beginning of period | $15.86 | $14.20 | $15.13 | $12.64 | $11.91 |
| Income from Investment Operations | | | | | |
| Net investment income (loss)A | .10 | .12 | .07 | .10 | .09 |
| Net realized and unrealized gain (loss) | 1.81 | 1.59 | (.86) | 2.54 | .72 |
| Total from investment operations | 1.91 | 1.71 | (.79) | 2.64 | .81 |
| Distributions from net investment income | (.11) | (.05) | (.11) | (.11) | (.07) |
| Distributions from net realized gain | (.09) | – | (.04) | (.03) | (.01) |
| Total distributions | (.19)B | (.05) | (.14)B | (.15)B | (.08) |
| Redemption fees added to paid in capitalA | – | – | –C | –C | –C |
| Net asset value, end of period | $17.58 | $15.86 | $14.20 | $15.13 | $12.64 |
| Total ReturnD | 12.16% | 12.10% | (5.28)% | 21.13% | 6.80% |
| Ratios to Average Net AssetsE,F | | | | | |
| Expenses before reductions | 1.06% | 1.01% | 1.05% | .82% | .78% |
| Expenses net of fee waivers, if any | 1.06% | 1.01% | 1.05% | .82% | .78% |
| Expenses net of all reductions | 1.06% | 1.00% | 1.04% | .82% | .78% |
| Net investment income (loss) | .65% | .82% | .45% | .74% | .81% |
| Supplemental Data | | | | | |
| Net assets, end of period (000 omitted) | $274,433 | $401,344 | $297,644 | $247,372 | $352,936 |
| Portfolio turnover rateG | 22% | 27% | 40% | 23% | 15% |
A Calculated based on average shares outstanding during the period.
B Total distributions per share do not sum due to rounding.
C Amount represents less than $.005 per share.
D Total returns would have been lower if certain expenses had not been reduced during the applicable periods shown.
E Fees and expenses of any underlying mutual funds or exchange-traded funds (ETFs) are not included in the Fund's expense ratio. The Fund indirectly bears its proportionate share of these expenses. For additional expense information related to investments in Fidelity Central Funds, please refer to the "Investments in Fidelity Central Funds" note found in the Notes to Financial Statements section of the most recent Annual or Semi-Annual report.
F Expense ratios reflect operating expenses of the class. Expenses before reductions do not reflect amounts reimbursed, waived, or reduced through arrangements with the investment adviser, brokerage services, or other offset arrangements, if applicable, and do not represent the amount paid by the class during periods when reimbursements, waivers or reductions occur.
G Amount does not include the portfolio activity of any underlying mutual funds or exchange-traded funds (ETFs).
See accompanying notes which are an integral part of the financial statements.
Fidelity Japan Fund Class I
| Years ended October 31, | 2020 | 2019 | 2018 | 2017 | 2016 |
| Selected Per–Share Data | | | | | |
| Net asset value, beginning of period | $15.85 | $14.18 | $15.12 | $12.62 | $11.89 |
| Income from Investment Operations | | | | | |
| Net investment income (loss)A | .11 | .13 | .08 | .11 | .10 |
| Net realized and unrealized gain (loss) | 1.81 | 1.58 | (.85) | 2.53 | .70 |
| Total from investment operations | 1.92 | 1.71 | (.77) | 2.64 | .80 |
| Distributions from net investment income | (.12) | (.04) | (.14) | (.11) | (.07) |
| Distributions from net realized gain | (.09) | – | (.04) | (.03) | (.01) |
| Total distributions | (.21) | (.04) | (.17)B | (.14) | (.07)B |
| Redemption fees added to paid in capitalA | – | – | –C | –C | –C |
| Net asset value, end of period | $17.56 | $15.85 | $14.18 | $15.12 | $12.62 |
| Total ReturnD | 12.20% | 12.12% | (5.18)% | 21.22% | 6.77% |
| Ratios to Average Net AssetsE,F | | | | | |
| Expenses before reductions | 1.01% | .96% | .98% | .76% | .77% |
| Expenses net of fee waivers, if any | 1.01% | .96% | .98% | .76% | .77% |
| Expenses net of all reductions | 1.00% | .95% | .97% | .76% | .76% |
| Net investment income (loss) | .71% | .87% | .52% | .80% | .83% |
| Supplemental Data | | | | | |
| Net assets, end of period (000 omitted) | $473,859 | $319,164 | $192,555 | $175,816 | $7,032 |
| Portfolio turnover rateG | 22% | 27% | 40% | 23% | 15% |
A Calculated based on average shares outstanding during the period.
B Total distributions per share do not sum due to rounding.
C Amount represents less than $.005 per share.
D Total returns would have been lower if certain expenses had not been reduced during the applicable periods shown.
E Fees and expenses of any underlying mutual funds or exchange-traded funds (ETFs) are not included in the Fund's expense ratio. The Fund indirectly bears its proportionate share of these expenses. For additional expense information related to investments in Fidelity Central Funds, please refer to the "Investments in Fidelity Central Funds" note found in the Notes to Financial Statements section of the most recent Annual or Semi-Annual report.
F Expense ratios reflect operating expenses of the class. Expenses before reductions do not reflect amounts reimbursed, waived, or reduced through arrangements with the investment adviser, brokerage services, or other offset arrangements, if applicable, and do not represent the amount paid by the class during periods when reimbursements, waivers or reductions occur.
G Amount does not include the portfolio activity of any underlying mutual funds or exchange-traded funds (ETFs).
See accompanying notes which are an integral part of the financial statements.
Fidelity Japan Fund Class Z
| Years ended October 31, | 2020 | 2019 | 2018 A |
| Selected Per–Share Data | | | |
| Net asset value, beginning of period | $15.84 | $14.19 | $15.77 |
| Income from Investment Operations | | | |
| Net investment income (loss)B | .13 | .14 | (.01) |
| Net realized and unrealized gain (loss) | 1.81 | 1.57 | (1.57) |
| Total from investment operations | 1.94 | 1.71 | (1.58) |
| Distributions from net investment income | (.13) | (.06) | – |
| Distributions from net realized gain | (.09) | – | – |
| Total distributions | (.22) | (.06) | – |
| Net asset value, end of period | $17.56 | $15.84 | $14.19 |
| Total ReturnC,D | 12.36% | 12.14% | (10.02)% |
| Ratios to Average Net AssetsE,F | | | |
| Expenses before reductions | .92% | .87% | .96%G |
| Expenses net of fee waivers, if any | .92% | .87% | .96%G |
| Expenses net of all reductions | .92% | .86% | .95%G |
| Net investment income (loss) | .79% | .96% | (.73)%G |
| Supplemental Data | | | |
| Net assets, end of period (000 omitted) | $8,368 | $8,136 | $90 |
| Portfolio turnover rateH | 22% | 27% | 40% |
A For the period October 2, 2018 (commencement of sale of shares) to October 31, 2018.
B Calculated based on average shares outstanding during the period.
C Total returns for periods of less than one year are not annualized.
D Total returns would have been lower if certain expenses had not been reduced during the applicable periods shown.
E Fees and expenses of any underlying mutual funds or exchange-traded funds (ETFs) are not included in the Fund's expense ratio. The Fund indirectly bears its proportionate share of these expenses. For additional expense information related to investments in Fidelity Central Funds, please refer to the "Investments in Fidelity Central Funds" note found in the Notes to Financial Statements section of the most recent Annual or Semi-Annual report.
F Expense ratios reflect operating expenses of the class. Expenses before reductions do not reflect amounts reimbursed, waived, or reduced through arrangements with the investment adviser, brokerage services, or other offset arrangements, if applicable, and do not represent the amount paid by the class during periods when reimbursements, waivers or reductions occur.
G Annualized
H Amount does not include the portfolio activity of any underlying mutual funds or exchange-traded funds (ETFs).
See accompanying notes which are an integral part of the financial statements.
Notes to Financial Statements
For the period ended October 31, 2020
1. Organization.
Fidelity Japan Fund (the Fund) is a fund of Fidelity Investment Trust (the Trust) and is authorized to issue an unlimited number of shares. The Trust is registered under the Investment Company Act of 1940, as amended (the 1940 Act), as an open-end management investment company organized as a Massachusetts business trust. The Fund offers Class A, Class M, Class C, Japan, Class I and Class Z shares, each of which has equal rights as to assets and voting privileges. Each class has exclusive voting rights with respect to matters that affect that class. Class C shares will automatically convert to Class A shares after a holding period of ten years from the initial date of purchase, with certain exceptions.
Effective January 1, 2020:
Investment advisers Fidelity Investments Money Management, Inc., FMR Co., Inc., and Fidelity SelectCo, LLC, merged with and into Fidelity Management & Research Company. In connection with the merger transactions, the resulting, merged investment adviser was then redomiciled from Massachusetts to Delaware, changed its corporate structure from a corporation to a limited liability company, and changed its name to "Fidelity Management & Research Company LLC".
Broker-dealer Fidelity Distributors Corporation merged with and into Fidelity Investments Institutional Services Company, Inc. ("FIISC"). FIISC was then redomiciled from Massachusetts to Delaware, changed its corporate structure from a corporation to a limited liability company, and changed its name to "Fidelity Distributors Company LLC".
Fidelity Investments Institutional Operations Company, Inc. converted from a Massachusetts corporation to a Massachusetts LLC, and changed its name to "Fidelity Investments Institutional Operations Company LLC".
2. Investments in Fidelity Central Funds.
The Fund invests in Fidelity Central Funds, which are open-end investment companies generally available only to other investment companies and accounts managed by the investment adviser and its affiliates. The Fund's Schedule of Investments lists each of the Fidelity Central Funds held as of period end, if any, as an investment of the Fund, but does not include the underlying holdings of each Fidelity Central Fund. As an Investing Fund, the Fund indirectly bears its proportionate share of the expenses of the underlying Fidelity Central Funds.
The Money Market Central Funds seek preservation of capital and current income and are managed by the investment adviser. Annualized expenses of the Money Market Central Funds as of their most recent shareholder report date ranged from less than .005% to .01%.
A complete unaudited list of holdings for each Fidelity Central Fund is available upon request or at the Securities and Exchange Commission (the SEC) website at www.sec.gov. In addition, the financial statements of the Fidelity Central Funds, which are not covered by the Fund's Report of Independent Registered Public Accounting Firm, are available on the SEC website or upon request.
3. Significant Accounting Policies.
The Fund is an investment company and applies the accounting and reporting guidance of the Financial Accounting Standards Board (FASB) Accounting Standards Codification Topic 946 Financial Services – Investment Companies. The financial statements have been prepared in conformity with accounting principles generally accepted in the United States of America (GAAP), which require management to make certain estimates and assumptions at the date of the financial statements. Actual results could differ from those estimates. Subsequent events, if any, through the date that the financial statements were issued have been evaluated in the preparation of the financial statements. The following summarizes the significant accounting policies of the Fund:
Investment Valuation. Investments are valued as of 4:00 p.m. Eastern time on the last calendar day of the period. The Board of Trustees (the Board) has delegated the day to day responsibility for the valuation of the Fund's investments to the Fair Value Committee (the Committee) established by the Fund's investment adviser. In accordance with valuation policies and procedures approved by the Board, the Fund attempts to obtain prices from one or more third party pricing vendors or brokers to value its investments. When current market prices, quotations or currency exchange rates are not readily available or reliable, investments will be fair valued in good faith by the Committee, in accordance with procedures adopted by the Board. Factors used in determining fair value vary by investment type and may include market or investment specific events. The frequency with which these procedures are used cannot be predicted and they may be utilized to a significant extent. The Committee oversees the Fund's valuation policies and procedures and reports to the Board on the Committee's activities and fair value determinations. The Board monitors the appropriateness of the procedures used in valuing the Fund's investments and ratifies the fair value determinations of the Committee.
The Fund categorizes the inputs to valuation techniques used to value its investments into a disclosure hierarchy consisting of three levels as shown below:
- Level 1 – quoted prices in active markets for identical investments
- Level 2 – other significant observable inputs (including quoted prices for similar investments, interest rates, prepayment speeds, etc.)
- Level 3 – unobservable inputs (including the Fund's own assumptions based on the best information available)
Valuation techniques used to value the Fund's investments by major category are as follows:
Equity securities, including restricted securities, for which market quotations are readily available, are valued at the last reported sale price or official closing price as reported by a third party pricing vendor on the primary market or exchange on which they are traded and are categorized as Level 1 in the hierarchy. In the event there were no sales during the day or closing prices are not available, securities are valued at the last quoted bid price or may be valued using the last available price and are generally categorized as Level 2 in the hierarchy. For foreign equity securities, when market or security specific events arise, comparisons to the valuation of American Depositary Receipts (ADRs), futures contracts, Exchange-Traded Funds (ETFs) and certain indexes as well as quoted prices for similar securities may be used and would be categorized as Level 2 in the hierarchy. For equity securities, including restricted securities, where observable inputs are limited, assumptions about market activity and risk are used and these securities may be categorized as Level 3 in the hierarchy.
Investments in open-end mutual funds including the Fidelity Central Funds, are valued at their closing net asset value (NAV) each business day and are categorized as Level 1 in the hierarchy.
Changes in valuation techniques may result in transfers in or out of an assigned level within the disclosure hierarchy. The aggregate value of investments by input level as of October 31, 2020 is included at the end of the Fund's Schedule of Investments.
Foreign Currency. Certain Funds may use foreign currency contracts to facilitate transactions in foreign-denominated securities. Gains and losses from these transactions may arise from changes in the value of the foreign currency or if the counterparties do not perform under the contracts' terms.
Foreign-denominated assets, including investment securities, and liabilities are translated into U.S. dollars at the exchange rates at period end. Purchases and sales of investment securities, income and dividends received, and expenses denominated in foreign currencies are translated into U.S. dollars at the exchange rate in effect on the transaction date.
The effects of exchange rate fluctuations on investments are included with the net realized and unrealized gain (loss) on investment securities. Other foreign currency transactions resulting in realized and unrealized gain (loss) are disclosed separately.
Investment Transactions and Income. For financial reporting purposes, the Fund's investment holdings and NAV include trades executed through the end of the last business day of the period. The NAV per share for processing shareholder transactions is calculated as of the close of business of the New York Stock Exchange (NYSE), normally 4:00 p.m. Eastern time and includes trades executed through the end of the prior business day. Gains and losses on securities sold are determined on the basis of identified cost. Dividend income is recorded on the ex-dividend date, except for certain dividends from foreign securities where the ex-dividend date may have passed, which are recorded as soon as the Fund is informed of the ex-dividend date. Non-cash dividends included in dividend income, if any, are recorded at the fair market value of the securities received. Income and capital gain distributions from Fidelity Central Funds, if any, are recorded on the ex-dividend date. Investment income is recorded net of foreign taxes withheld where recovery of such taxes is uncertain.
Class Allocations and Expenses. Investment income, realized and unrealized capital gains and losses, common expenses of the Fund, and certain fund-level expense reductions, if any, are allocated daily on a pro-rata basis to each class based on the relative net assets of each class to the total net assets of the Fund. Each class differs with respect to transfer agent and distribution and service plan fees incurred. Certain expense reductions may also differ by class. For the reporting period, the allocated portion of income and expenses to each class as a percent of its average net assets may vary due to the timing of recording these transactions in relation to fluctuating net assets of the classes. Expenses directly attributable to a fund are charged to that fund. Expenses attributable to more than one fund are allocated among the respective funds on the basis of relative net assets or other appropriate methods. Expense estimates are accrued in the period to which they relate and adjustments are made when actual amounts are known.
Income Tax Information and Distributions to Shareholders. Each year, the Fund intends to qualify as a regulated investment company under Subchapter M of the Internal Revenue Code, including distributing substantially all of its taxable income and realized gains. As a result, no provision for U.S. Federal income taxes is required. As of October 31, 2020, the Fund did not have any unrecognized tax benefits in the financial statements; nor is the Fund aware of any tax positions for which it is reasonably possible that the total amounts of unrecognized tax benefits will significantly change in the next twelve months. The Fund files a U.S. federal tax return, in addition to state and local tax returns as required. The Fund's federal income tax returns are subject to examination by the Internal Revenue Service (IRS) for a period of three fiscal years after they are filed. State and local tax returns may be subject to examination for an additional fiscal year depending on the jurisdiction. Foreign taxes are provided for based on the Fund's understanding of the tax rules and rates that exist in the foreign markets in which it invests.
Distributions are declared and recorded on the ex-dividend date. Income and capital gain distributions are declared separately for each class. Income and capital gain distributions are determined in accordance with income tax regulations, which may differ from GAAP.
Capital accounts within the financial statements are adjusted for permanent book-tax differences. These adjustments have no impact on net assets or the results of operations. Capital accounts are not adjusted for temporary book-tax differences which will reverse in a subsequent period.
Book-tax differences are primarily due to foreign currency transactions, passive foreign investment companies (PFIC) and losses deferred due to wash sales.
As of period end, the cost and unrealized appreciation (depreciation) in securities, and derivatives if applicable, for federal income tax purposes were as follows:
| Gross unrealized appreciation | $212,704,853 |
| Gross unrealized depreciation | (44,768,097) |
| Net unrealized appreciation (depreciation) | $167,936,756 |
| Tax Cost | $613,572,343 |
The tax-based components of distributable earnings as of period end were as follows:
| Undistributed ordinary income | $5,908,546 |
| Undistributed long-term capital gain | $10,938,042 |
| Net unrealized appreciation (depreciation) on securities and other investments | $167,976,898 |
The tax character of distributions paid was as follows:
| | October 31, 2020 | October 31, 2019 |
| Ordinary Income | $9,407,855 | $ 2,139,920 |
4. Purchases and Sales of Investments.
Purchases and sales of securities, other than short-term securities, are noted in the table below.
| | Purchases ($) | Sales ($) |
| Fidelity Japan Fund | 162,523,820 | 209,266,961 |
5. Fees and Other Transactions with Affiliates.
Management Fee. Fidelity Management & Research Company LLC (the investment adviser) and its affiliates provide the Fund with investment management related services for which the Fund pays a monthly management fee. The management fee is the sum of an individual fund fee rate that is based on an annual rate of .45% of the Fund's average net assets and an annualized group fee rate that averaged .23% during the period. The group fee rate is based upon the monthly average net assets of a group of registered investment companies with which the investment adviser has management contracts. The group fee rate decreases as assets under management increase and increases as assets under management decrease. In addition, the management fee is subject to a performance adjustment (up to a maximum of +/- .20% of the Fund's average net assets over a 36 month performance period). The upward or downward adjustment to the management fee is based on the relative investment performance of Japan as compared to its benchmark index, the TOPIX, over the same 36 month performance period. For the reporting period, the total annual management fee rate, including the performance adjustment, was .80% of the Fund's average net assets. The performance adjustment included in the management fee rate may be higher or lower than the maximum performance adjustment rate due to the difference between the average net assets for the reporting and performance periods.
Distribution and Service Plan Fees. In accordance with Rule 12b-1 of the 1940 Act, the Fund has adopted separate Distribution and Service Plans for each class of shares. Certain classes pay Fidelity Distributors Company LLC (FDC), an affiliate of the investment adviser, separate Distribution and Service Fees, each of which is based on an annual percentage of each class' average net assets. In addition, FDC may pay financial intermediaries for selling shares of the Fund and providing shareholder support services. For the period, the Distribution and Service Fee rates, total fees and amounts retained by FDC were as follows:
| | Distribution Fee | Service Fee | Total Fees | Retained by FDC |
| Class A | -% | .25% | $38,531 | $347 |
| Class M | .25% | .25% | 18,134 | 165 |
| Class C | .75% | .25% | 69,628 | 4,008 |
| | | | $126,293 | $4,520 |
During the period, the investment adviser or its affiliates waived a portion of these fees.
Sales Load. FDC may receive a front-end sales charge of up to 5.75% for selling Class A shares and 3.50% for selling Class M shares, some of which is paid to financial intermediaries for selling shares of the Fund. Depending on the holding period, FDC may receive contingent deferred sales charges levied on Class A, Class M and Class C redemptions. The deferred sales charges are 1.00% for Class C shares, 1.00% for certain purchases of Class A shares and .25% for certain purchases of Class M shares.
For the period, sales charge amounts retained by FDC were as follows:
| | Retained by FDC |
| Class A | $2,155 |
| Class M | 347 |
| Class C(a) | 183 |
| | $2,685 |
(a) When Class C shares are initially sold, FDC pays commissions from its own resources to financial intermediaries through which the sales are made.
Transfer Agent Fees. Fidelity Investments Institutional Operations Company LLC (FIIOC), an affiliate of the investment adviser, is the transfer, dividend disbursing and shareholder servicing agent for each class of the Fund. FIIOC receives account fees and asset-based fees that vary according to the account size and type of account of the shareholders of the respective classes of the Fund, Class Z. FIIOC receives an asset-based fee of Class Z's average net assets. FIIOC pays for typesetting, printing and mailing of shareholder reports, except proxy statements. Effective February 1, 2020, the Board approved to change the fee Class Z from .046% to .044%.
For the period, transfer agent fees for each class were as follows:
| | Amount | % of Class-Level Average Net Assets |
| Class A | $37,187 | .24 |
| Class M | 10,558 | .29 |
| Class C | 11,956 | .17 |
| Japan | 633,476 | .18 |
| Class I | 474,656 | .13 |
| Class Z | 3,312 | .04 |
| | $1,171,145 | |
Accounting Fees. Fidelity Service Company, Inc. (FSC), an affiliate of the investment adviser, maintains the Fund's accounting records. The accounting fee is based on the level of average net assets for each month. For the period, the fees were equivalent to the following annual rates:
| | % of Average Net Assets |
| Fidelity Japan Fund | .05 |
Brokerage Commissions. A portion of portfolio transactions were placed with brokerage firms which are affiliates of the investment adviser. Brokerage commissions are included in net realized gain (loss) and change in net unrealized appreciation (depreciation) in the Statement of Operations. The commissions paid to these affiliated firms were as follows:
| | Amount |
| Fidelity Japan Fund | $111 |
Interfund Lending Program. Pursuant to an Exemptive Order issued by the SEC, the Fund, along with other registered investment companies having management contracts with Fidelity Management & Research Company LLC (FMR), or other affiliated entities of FMR, may participate in an interfund lending program. This program provides an alternative credit facility allowing the Fund to borrow from, or lend money to, other participating affiliated funds. At period end, there were no interfund loans outstanding. Activity in this program during the period for which loans were outstanding was as follows:
| | Borrower or Lender | Average Loan Balance | Weighted Average Interest Rate | Interest Expense |
| Fidelity Japan Fund | Borrower | $38,150,000 | .34% | $360 |
Interfund Trades. Funds may purchase from or sell securities to other Fidelity Funds under procedures adopted by the Board. The procedures have been designed to ensure these interfund trades are executed in accordance with Rule 17a-7 of the 1940 Act. Interfund trades are included within the respective purchases and sales amounts shown in the Purchases and Sales of Investments note.
6. Committed Line of Credit.
Certain Funds participate with other funds managed by the investment adviser or an affiliate in a $4.25 billion credit facility (the "line of credit") to be utilized for temporary or emergency purposes to fund shareholder redemptions or for other short-term liquidity purposes. The participating funds have agreed to pay commitment fees on their pro-rata portion of the line of credit, which are reflected in Miscellaneous expenses on the Statement of Operations, and are as follows:
| | Amount |
| Fidelity Japan Fund | $1,743 |
During the period, there were no borrowings on this line of credit.
7. Security Lending.
Funds lend portfolio securities from time to time in order to earn additional income. Lending agents are used, including National Financial Services (NFS), an affiliate of the investment adviser. Pursuant to a securities lending agreement, NFS will receive a fee, which is capped at 9.9% of a fund's daily lending revenue, for its services as lending agent. A fund may lend securities to certain qualified borrowers, including NFS. On the settlement date of the loan, a fund receives collateral (in the form of U.S. Treasury obligations, letters of credit and/or cash) against the loaned securities and maintains collateral in an amount not less than 100% of the market value of the loaned securities during the period of the loan. The market value of the loaned securities is determined at the close of business of a fund and any additional required collateral is delivered to a fund on the next business day. A fund or borrower may terminate the loan at any time, and if the borrower defaults on its obligation to return the securities loaned because of insolvency or other reasons, a fund may apply collateral received from the borrower against the obligation. A fund may experience delays and costs in recovering the securities loaned. Any cash collateral received is invested in the Fidelity Securities Lending Cash Central Fund. Any loaned securities are identified as such in the Schedule of Investments, and the value of loaned securities and cash collateral at period end, as applicable, are presented in the Statement of Assets and Liabilities. Security lending income represents the income earned on investing cash collateral, less rebates paid to borrowers and any lending agent fees associated with the loan, plus any premium payments received for lending certain types of securities. Security lending income is presented in the Statement of Operations as a component of income from Fidelity Central Funds. Affiliated security lending activity, if any, was as follows:
| | Total Security Lending Income Fees Paid to NFS | Security Lending Income From Securities Loaned to NFS | Value of Securities Loaned to NFS at Period End |
| Fidelity Japan Fund | $– | $– | $– |
8. Expense Reductions.
Commissions paid to certain brokers with whom the investment adviser, or its affiliates, places trades on behalf of the Fund include an amount in addition to trade execution, which may be rebated back to the Fund to offset certain expenses. This amount totaled $44,603 for the period. In addition, through arrangements with each class' transfer agent, credits realized as a result of certain uninvested cash balances were used to reduce the Fund's expenses. In addition, through arrangements with the Fund's custodian, credits realized as a result of certain uninvested cash balances were used to reduce the Fund's expenses. During the period, custodian credits reduced the Fund's expenses by $13.
In addition, during the period the investment adviser or an affiliate reimbursed and/or waived a portion of fund-level operating expenses in the amount of $3,156.
In addition, during the period the investment adviser or an affiliate reimbursed the Fund $5,400 for an operational error which is included in the accompanying Statement of Operations.
9. Distributions to Shareholders.
Distributions to shareholders of each class were as follows:
| | Year ended
October 31, 2020 | Year ended
October 31, 2019 |
| Distributions to shareholders | | |
| Class A | $163,723 | $– |
| Class M | 28,502 | – |
| Class C | 19,501 | – |
| Japan | 4,845,634 | 1,540,617 |
| Class I | 4,237,814 | 598,003 |
| Class Z | 112,681 | 1,300 |
| Total | $9,407,855 | $2,139,920 |
10. Share Transactions.
Share transactions for each class were as follows and may contain automatic conversions between classes or exchanges between affiliated funds:
| | Shares | Shares | Dollars | Dollars |
| | Year ended October 31, 2020 | Year ended October 31, 2019 | Year ended October 31, 2020 | Year ended October 31, 2019 |
| Class A | | | | |
| Shares sold | 162,321 | 257,296 | $2,626,524 | $3,675,072 |
| Reinvestment of distributions | 9,441 | – | 152,856 | – |
| Shares redeemed | (263,934) | (271,258) | (4,069,957) | (3,843,441) |
| Net increase (decrease) | (92,172) | (13,962) | $(1,290,577) | $(168,369) |
| Class M | | | | |
| Shares sold | 11,613 | 9,337 | $178,589 | $133,363 |
| Reinvestment of distributions | 1,756 | – | 28,335 | – |
| Shares redeemed | (50,170) | (41,158) | (770,692) | (593,314) |
| Net increase (decrease) | (36,801) | (31,821) | $(563,768) | $(459,951) |
| Class C | | | | |
| Shares sold | 29,572 | 37,703 | $482,519 | $525,026 |
| Reinvestment of distributions | 1,183 | – | 18,905 | – |
| Shares redeemed | (241,451) | (368,937) | (3,672,760) | (5,208,165) |
| Net increase (decrease) | (210,696) | (331,234) | $(3,171,336) | $(4,683,139) |
| Japan | | | | |
| Shares sold | 1,793,121 | 11,302,166 | $28,617,350 | $161,493,452 |
| Reinvestment of distributions | 290,812 | 110,302 | 4,716,973 | 1,507,832 |
| Shares redeemed | (11,782,054) | (7,058,309) | (186,990,158) | (100,437,866) |
| Net increase (decrease) | (9,698,121) | 4,354,159 | $(153,655,835) | $62,563,418 |
| Class I | | | | |
| Shares sold | 6,947,524 | 6,909,379 | $113,300,467 | $99,292,734 |
| Reinvestment of distributions | 261,592 | 43,742 | 4,235,166 | 597,082 |
| Shares redeemed | (368,399) | (389,348) | (5,684,536) | (5,566,323) |
| Net increase (decrease) | 6,840,717 | 6,563,773 | $111,851,097 | $94,323,493 |
| Class Z | | | | |
| Shares sold | 107,375 | 534,414 | $1,776,759 | $7,783,555 |
| Reinvestment of distributions | 6,830 | 64 | 110,515 | 875 |
| Shares redeemed | (151,176) | (27,238) | (2,297,665) | (407,116) |
| Net increase (decrease) | (36,971) | 507,240 | $(410,391) | $7,377,314 |
11. Other.
The Fund's organizational documents provide former and current trustees and officers with a limited indemnification against liabilities arising in connection with the performance of their duties to the Fund. In the normal course of business, the Fund may also enter into contracts that provide general indemnifications. The Fund's maximum exposure under these arrangements is unknown as this would be dependent on future claims that may be made against the Fund. The risk of material loss from such claims is considered remote.
At the end of the period, Strategic Advisers Fidelity International Fund was the owners of record of approximately 48% of the total outstanding shares of the Fund. Mutual funds managed by the investment adviser or its affiliates were the owners of record, in the aggregate, of approximately 73% of the total outstanding shares of the Fund.
12. Coronavirus (COVID-19) Pandemic.
An outbreak of COVID-19 first detected in China during December 2019 has since spread globally and was declared a pandemic by the World Health Organization during March 2020. Developments that disrupt global economies and financial markets, such as the COVID-19 pandemic, may magnify factors that affect the Fund's performance.
Fidelity® Japan Smaller Companies Fund
Performance: The Bottom Line
Average annual total return reflects the change in the value of an investment, assuming reinvestment of distributions from dividend income and capital gains (the profits earned upon the sale of securities that have grown in value, if any) and assuming a constant rate of performance each year. The hypothetical investment and the average annual total returns do not reflect the deduction of taxes that a shareholder would pay on fund distributions or the redemption of fund shares. During periods of reimbursement by Fidelity, a fund’s total return will be greater than it would be had the reimbursement not occurred. How a fund did yesterday is no guarantee of how it will do tomorrow.
Average Annual Total Returns
| For the periods ended October 31, 2020 | Past 1 year | Past 5 years | Past 10 years |
| Fidelity® Japan Smaller Companies Fund | 1.31% | 8.32% | 10.62% |
$10,000 Over 10 Years
Let's say hypothetically that $10,000 was invested in Fidelity® Japan Smaller Companies Fund on October 31, 2010.
The chart shows how the value of your investment would have changed, and also shows how the Russell/Nomura Mid-Small Cap™ Index performed over the same period.
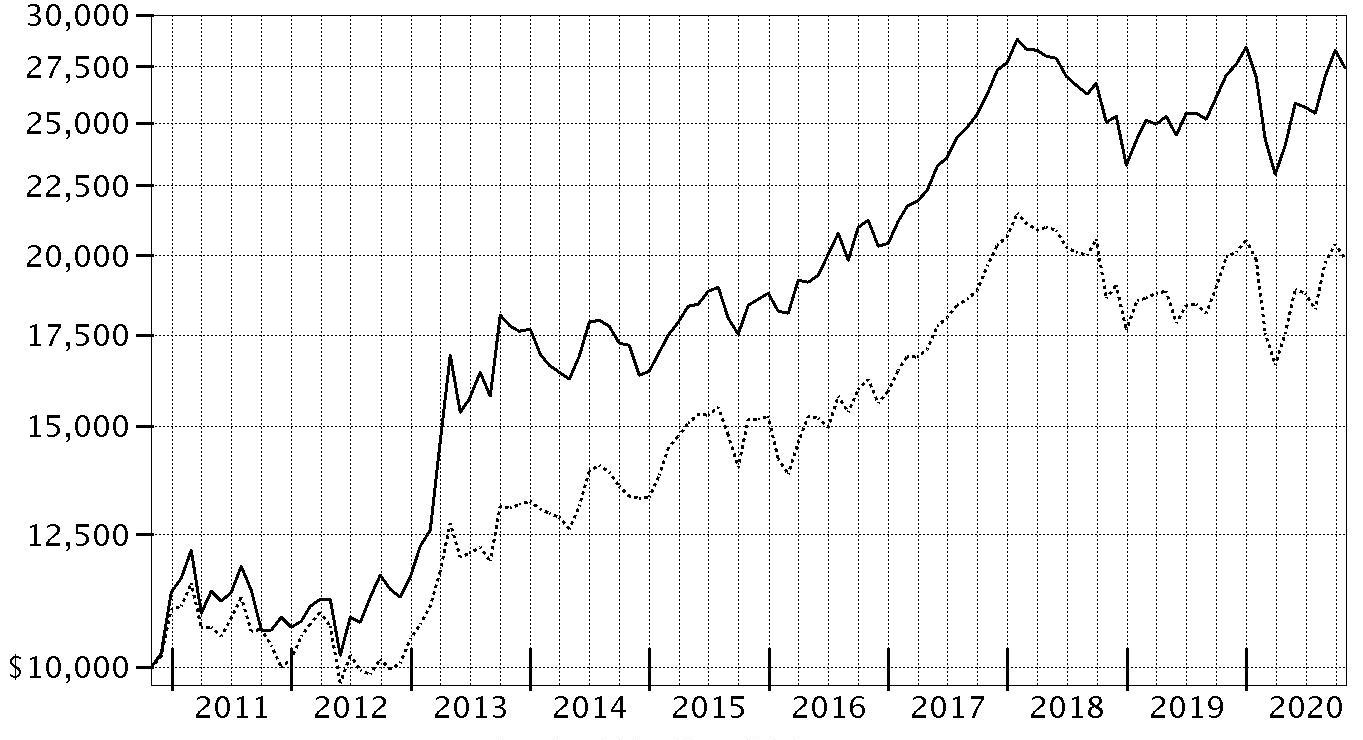
| Period Ending Values |
| $27,441 | Fidelity® Japan Smaller Companies Fund |
| $19,862 | Russell/Nomura Mid-Small Cap™ Index |
Fidelity® Japan Smaller Companies Fund
Management's Discussion of Fund Performance
Market Recap: The MSCI ACWI (All Country World Index) ex USA Index returned -2.46% for the 12 months ending October 31, 2020, in what was a bumpy ride for non-U.S. equities, marked by a steep but brief decline due to the early-2020 outbreak and spread of the coronavirus, followed by a sharp upturn. Declared a pandemic on March 11, the crisis and containment efforts caused broad contraction in economic activity, elevated volatility and dislocation in financial markets. A historically rapid and expansive monetary- and fiscal-policy response around the world provided a partial offset to the economic disruption.Other supporting factors included resilient corporate earnings and near-term potential for a COVID-19 vaccine breakthrough. This was evident in the index’s 12.28% gain in the final six months of the year. Currency fluctuation generally boosted foreign developed-markets equities for the year, while the reverse was true for emerging-markets stocks. Late in the period, the index was pressured by a second wave of COVID-19 cases in some regions, and stretched valuations and crowded positioning in big tech. For the full year, the U.K. (-22%), Asia Pacific ex Japan (-8%), Canada (-5%) and Europe ex U.K. (-4%) notably lagged. Emerging markets (+9%) and Japan (+1%) outperformed. By sector, energy (-38%), financials and real estate (-20% each) lagged, whereas information technology (+ 25%) and communication services (+15%) topped the index.
Comments from Portfolio Manager David Jenkins: For the fiscal year ending October 31, 2020, the fund gained 1.31%, outperforming the -0.42% result of the benchmark Russell/Nomura Mid-Small Cap℠ Index. Versus the benchmark, security selection was the primary contributor, especially within the transportation and capital goods areas of the industrials sector. Stock picks in information technology also helped. The fund's top individual relative contributor was an outsized stake in Z Holdings (formerly Yahoo Japan), a top holding that gained 129% the past 12 months. Also lifting performance was our overweighting in package delivery company SG Holdings (+146%), a new position the past year, and our overweighting in home retailer Arcland Sakamoto (+65%). Both stocks were top holdings at period end. By sector, stock selection and an underweighting in health care detracted most from performance versus the benchmark. Security selection in the financials sector, primarily within the diversified financials industry, and stock picks in materials also hindered relative performance. The fund's biggest individual relative detractor was an outsized stake in Yamada Consulting Group (-45%). Not owning health care internet company and benchmark component M3 (+179%) and overweighting karaoke company Koshidaka Holdings (-42%) also hurt relative performance.
The views expressed above reflect those of the portfolio manager(s) only through the end of the period as stated on the cover of this report and do not necessarily represent the views of Fidelity or any other person in the Fidelity organization. Any such views are subject to change at any time based upon market or other conditions and Fidelity disclaims any responsibility to update such views. These views may not be relied on as investment advice and, because investment decisions for a Fidelity fund are based on numerous factors, may not be relied on as an indication of trading intent on behalf of any Fidelity fund.
Fidelity® Japan Smaller Companies Fund
Investment Summary (Unaudited)
Geographic Diversification (% of fund's net assets)
| As of October 31, 2020 |
| | Japan | 97.2% |
| | United States of America* | 2.8% |

* Includes Short-Term investments and Net Other Assets (Liabilities).
Percentages are based on country or territory of incorporation and are adjusted for the effect of futures contracts, if applicable.
Asset Allocation as of October 31, 2020
| | % of fund's net assets |
| Stocks | 97.2 |
| Short-Term Investments and Net Other Assets (Liabilities) | 2.8 |
Top Ten Stocks as of October 31, 2020
| | % of fund's net assets |
| Central Automotive Products Ltd. (Distributors) | 3.2 |
| Z Holdings Corp. (Interactive Media & Services) | 3.1 |
| Arc Land Sakamoto Co. Ltd. (Specialty Retail) | 2.3 |
| SK Kaken Co. Ltd. (Chemicals) | 2.3 |
| GMO Internet, Inc. (IT Services) | 2.2 |
| Nitori Holdings Co. Ltd. (Specialty Retail) | 2.1 |
| Amano Corp. (Electronic Equipment & Components) | 2.1 |
| Inaba Denki Sangyo Co. Ltd. (Trading Companies & Distributors) | 2.0 |
| Renesas Electronics Corp. (Semiconductors & Semiconductor Equipment) | 1.8 |
| SG Holdings Co. Ltd. (Air Freight & Logistics) | 1.8 |
| | 22.9 |
Top Market Sectors as of October 31, 2020
| | % of fund's net assets |
| Industrials | 25.6 |
| Information Technology | 18.5 |
| Consumer Discretionary | 17.8 |
| Materials | 7.8 |
| Communication Services | 6.7 |
| Consumer Staples | 6.4 |
| Health Care | 5.2 |
| Financials | 4.6 |
| Real Estate | 2.2 |
| Energy | 1.7 |
Fidelity® Japan Smaller Companies Fund
Schedule of Investments October 31, 2020
Showing Percentage of Net Assets
| Common Stocks - 97.2% | | | |
| | | Shares | Value |
| COMMUNICATION SERVICES - 6.7% | | | |
| Entertainment - 2.8% | | | |
| Daiichikosho Co. Ltd. | | 202,900 | $6,942,625 |
| Nexon Co. Ltd. | | 280,000 | 7,803,855 |
| | | | 14,746,480 |
| Interactive Media & Services - 3.9% | | | |
| Dip Corp. | | 215,000 | 4,130,871 |
| Z Holdings Corp. | | 2,345,000 | 16,351,826 |
| | | | 20,482,697 |
|
| TOTAL COMMUNICATION SERVICES | | | 35,229,177 |
|
| CONSUMER DISCRETIONARY - 17.8% | | | |
| Auto Components - 0.8% | | | |
| DaikyoNishikawa Corp. | | 798,900 | 4,428,264 |
| Automobiles - 1.3% | | | |
| Isuzu Motors Ltd. | | 831,000 | 6,742,314 |
| Distributors - 4.9% | | | |
| Central Automotive Products Ltd. | | 845,500 | 16,469,378 |
| PALTAC Corp. | | 161,000 | 9,001,122 |
| | | | 25,470,500 |
| Hotels, Restaurants & Leisure - 1.6% | | | |
| Curves Holdings Co. Ltd. | | 882,000 | 5,419,002 |
| Koshidaka Holdings Co. Ltd. (a) | | 817,000 | 3,056,261 |
| | | | 8,475,263 |
| Internet & Direct Marketing Retail - 1.3% | | | |
| Aucnet, Inc. | | 535,000 | 7,112,489 |
| Specialty Retail - 7.0% | | | |
| Arc Land Sakamoto Co. Ltd. | | 633,700 | 12,208,607 |
| Fuji Corp. | | 340,600 | 6,773,564 |
| Nitori Holdings Co. Ltd. | | 53,600 | 11,017,838 |
| Workman Co. Ltd. (a) | | 75,000 | 6,650,228 |
| | | | 36,650,237 |
| Textiles, Apparel & Luxury Goods - 0.9% | | | |
| Hagihara Industries, Inc. | | 323,400 | 4,611,479 |
|
| TOTAL CONSUMER DISCRETIONARY | | | 93,490,546 |
|
| CONSUMER STAPLES - 6.4% | | | |
| Food & Staples Retailing - 0.9% | | | |
| Jm Holdings Co. Ltd. | | 208,400 | 4,740,322 |
| Food Products - 5.5% | | | |
| Kotobuki Spirits Co. Ltd. | | 100,000 | 4,636,847 |
| Meiji Holdings Co. Ltd. | | 105,000 | 7,607,201 |
| Morinaga & Co. Ltd. | | 214,700 | 8,157,576 |
| S Foods, Inc. | | 252,700 | 8,416,353 |
| | | | 28,817,977 |
|
| TOTAL CONSUMER STAPLES | | | 33,558,299 |
|
| ENERGY - 1.7% | | | |
| Oil, Gas & Consumable Fuels - 1.7% | | | |
| San-Ai Oil Co. Ltd. | | 865,800 | 8,729,505 |
| FINANCIALS - 4.6% | | | |
| Diversified Financial Services - 1.0% | | | |
| ORIX Corp. | | 456,800 | 5,342,384 |
| Insurance - 3.6% | | | |
| Lifenet Insurance Co. (a)(b) | | 300,000 | 4,417,933 |
| T&D Holdings, Inc. | | 909,000 | 9,084,620 |
| Tokio Marine Holdings, Inc. | | 114,500 | 5,117,546 |
| | | | 18,620,099 |
|
| TOTAL FINANCIALS | | | 23,962,483 |
|
| HEALTH CARE - 5.2% | | | |
| Health Care Equipment & Supplies - 2.0% | | | |
| Medikit Co. Ltd. | | 278,200 | 8,174,394 |
| Paramount Bed Holdings Co. Ltd. | | 58,400 | 2,250,026 |
| | | | 10,424,420 |
| Health Care Providers & Services - 1.5% | | | |
| A/S One Corp. | | 55,000 | 7,948,561 |
| Pharmaceuticals - 1.7% | | | |
| Santen Pharmaceutical Co. Ltd. | | 495,000 | 8,818,919 |
|
| TOTAL HEALTH CARE | | | 27,191,900 |
|
| INDUSTRIALS - 25.6% | | | |
| Air Freight & Logistics - 3.1% | | | |
| AIT Corp. | | 703,220 | 6,750,666 |
| SG Holdings Co. Ltd. | | 390,000 | 9,406,971 |
| | | | 16,157,637 |
| Building Products - 1.6% | | | |
| Sekisui Jushi Corp. | | 426,300 | 8,608,253 |
| Commercial Services & Supplies - 2.6% | | | |
| Aeon Delight Co. Ltd. | | 178,800 | 4,707,071 |
| ProNexus, Inc. | | 187,123 | 1,946,572 |
| Secom Joshinetsu Co. Ltd. | | 213,000 | 6,938,119 |
| | | | 13,591,762 |
| Construction & Engineering - 1.3% | | | |
| Hokuriku Electrical Construction Co. Ltd. | | 609,900 | 6,688,662 |
| Electrical Equipment - 0.6% | | | |
| Denyo Co. Ltd. | | 150,600 | 3,362,233 |
| Machinery - 2.7% | | | |
| CKD Corp. (a) | | 404,000 | 6,724,118 |
| Kito Corp. | | 330,000 | 4,068,879 |
| Nitto Kohki Co. Ltd. | | 210,000 | 3,489,422 |
| | | | 14,282,419 |
| Marine - 1.8% | | | |
| Nippon Concept Corp. | | 645,000 | 9,237,268 |
| Professional Services - 3.6% | | | |
| Funai Soken Holdings, Inc. | | 161,480 | 3,493,036 |
| Persol Holdings Co., Ltd. | | 500,000 | 7,573,101 |
| Yamada Consulting Group Co. Ltd. | | 782,700 | 7,533,976 |
| | | | 18,600,113 |
| Trading Companies & Distributors - 7.2% | | | |
| Inaba Denki Sangyo Co. Ltd. | | 436,400 | 10,505,657 |
| Itochu Corp. | | 240,000 | 5,764,445 |
| Mitani Shoji Co. Ltd. | | 113,100 | 7,131,535 |
| Tsubakimoto Kogyo Co. Ltd. | | 182,000 | 5,806,904 |
| Yuasa Trading Co. Ltd. | | 305,800 | 8,711,891 |
| | | | 37,920,432 |
| Transportation Infrastructure - 1.1% | | | |
| Kamigumi Co. Ltd. | | 327,000 | 5,850,325 |
|
| TOTAL INDUSTRIALS | | | 134,299,104 |
|
| INFORMATION TECHNOLOGY - 18.5% | | | |
| Electronic Equipment & Components - 4.0% | | | |
| Amano Corp. | | 460,200 | 10,831,458 |
| Anritsu Corp. | | 175,000 | 3,831,182 |
| Dexerials Corp. | | 536,500 | 6,137,585 |
| | | | 20,800,225 |
| IT Services - 9.5% | | | |
| Argo Graphics, Inc. | | 185,000 | 5,690,833 |
| Densan System Co. Ltd. | | 110,000 | 3,655,521 |
| GMO Internet, Inc. | | 435,000 | 11,602,431 |
| IT Holdings Corp. | | 265,000 | 5,068,163 |
| Nomura Research Institute Ltd. | | 270,000 | 7,958,926 |
| Otsuka Corp. | | 192,000 | 8,822,720 |
| TKC Corp. | | 117,200 | 7,262,948 |
| | | | 50,061,542 |
| Semiconductors & Semiconductor Equipment - 1.8% | | | |
| Renesas Electronics Corp. (b) | | 1,140,000 | 9,410,305 |
| Software - 1.4% | | | |
| Oracle Corp. Japan | | 76,200 | 7,615,435 |
| Technology Hardware, Storage & Peripherals - 1.8% | | | |
| Elecom Co. Ltd. | | 186,500 | 9,340,004 |
|
| TOTAL INFORMATION TECHNOLOGY | | | 97,227,511 |
|
| MATERIALS - 7.8% | | | |
| Chemicals - 6.2% | | | |
| C. Uyemura & Co. Ltd. | | 136,400 | 8,882,012 |
| Lintec Corp. | | 288,000 | 6,384,335 |
| Nihon Parkerizing Co. Ltd. | | 540,000 | 5,321,742 |
| SK Kaken Co. Ltd. | | 31,700 | 12,044,508 |
| | | | 32,632,597 |
| Construction Materials - 1.6% | | | |
| Taiheiyo Cement Corp. | | 343,500 | 8,062,656 |
|
| TOTAL MATERIALS | | | 40,695,253 |
|
| REAL ESTATE - 2.2% | | | |
| Real Estate Management & Development - 2.2% | | | |
| Century21 Real Estate Japan Ltd. | | 415,400 | 4,179,322 |
| Kenedix, Inc. | | 1,390,000 | 7,203,092 |
| | | | 11,382,414 |
| UTILITIES - 0.7% | | | |
| Gas Utilities - 0.7% | | | |
| Nippon Gas Co. Ltd. | | 75,000 | 3,577,254 |
| TOTAL COMMON STOCKS | | | |
| (Cost $366,240,273) | | | 509,343,446 |
|
| Money Market Funds - 0.7% | | | |
| Fidelity Cash Central Fund 0.10% (c) | | 109 | 109 |
| Fidelity Securities Lending Cash Central Fund 0.11% (c)(d) | | 3,502,401 | 3,502,751 |
| TOTAL MONEY MARKET FUNDS | | | |
| (Cost $3,502,792) | | | 3,502,860 |
| TOTAL INVESTMENT IN SECURITIES - 97.9% | | | |
| (Cost $369,743,065) | | | 512,846,306 |
| NET OTHER ASSETS (LIABILITIES) - 2.1% | | | 10,927,202 |
| NET ASSETS - 100% | | | $523,773,508 |
Legend
(a) Security or a portion of the security is on loan at period end.
(b) Non-income producing
(c) Affiliated fund that is generally available only to investment companies and other accounts managed by Fidelity Investments. The rate quoted is the annualized seven-day yield of the fund at period end. A complete unaudited listing of the fund's holdings as of its most recent quarter end is available upon request. In addition, each Fidelity Central Fund's financial statements, which are not covered by the Fund's Report of Independent Registered Public Accounting Firm, are available on the SEC's website or upon request.
(d) Investment made with cash collateral received from securities on loan.
Affiliated Central Funds
Information regarding fiscal year to date income earned by the Fund from investments in Fidelity Central Funds is as follows:
| Fund | Income earned |
| Fidelity Cash Central Fund | $169,990 |
| Fidelity Securities Lending Cash Central Fund | 73,653 |
| Total | $243,643 |
Amounts in the income column in the above table include any capital gain distributions from underlying funds, which are presented in the corresponding line-item in the Statement of Operations, if applicable. Amount for Fidelity Securities Lending Cash Central Fund represents the income earned on investing cash collateral, less rebates paid to borrowers and any lending agent fees associated with the loan, plus any premium payments received for lending certain types of securities.
Investment Valuation
The following is a summary of the inputs used, as of October 31, 2020, involving the Fund's assets and liabilities carried at fair value. The inputs or methodology used for valuing securities may not be an indication of the risk associated with investing in those securities. For more information on valuation inputs, and their aggregation into the levels used below, please refer to the Investment Valuation section in the accompanying Notes to Financial Statements.
| | Valuation Inputs at Reporting Date: |
| Description | Total | Level 1 | Level 2 | Level 3 |
| Investments in Securities: | | | | |
| Equities: | | | | |
| Communication Services | $35,229,177 | $-- | $35,229,177 | $-- |
| Consumer Discretionary | 93,490,546 | -- | 93,490,546 | -- |
| Consumer Staples | 33,558,299 | -- | 33,558,299 | -- |
| Energy | 8,729,505 | -- | 8,729,505 | -- |
| Financials | 23,962,483 | -- | 23,962,483 | -- |
| Health Care | 27,191,900 | -- | 27,191,900 | -- |
| Industrials | 134,299,104 | -- | 134,299,104 | -- |
| Information Technology | 97,227,511 | -- | 97,227,511 | -- |
| Materials | 40,695,253 | -- | 40,695,253 | -- |
| Real Estate | 11,382,414 | -- | 11,382,414 | -- |
| Utilities | 3,577,254 | -- | 3,577,254 | -- |
| Money Market Funds | 3,502,860 | 3,502,860 | -- | -- |
| Total Investments in Securities: | $512,846,306 | $3,502,860 | $509,343,446 | $-- |
See accompanying notes which are an integral part of the financial statements.
Fidelity® Japan Smaller Companies Fund
Financial Statements
Statement of Assets and Liabilities
| | | October 31, 2020 |
| Assets | | |
Investment in securities, at value (including securities loaned of $3,333,934) — See accompanying schedule:
Unaffiliated issuers (cost $366,240,273) | $509,343,446 | |
| Fidelity Central Funds (cost $3,502,792) | 3,502,860 | |
| Total Investment in Securities (cost $369,743,065) | | $512,846,306 |
| Foreign currency held at value (cost $100,518) | | 82,799 |
| Receivable for investments sold | | 11,986,702 |
| Receivable for fund shares sold | | 91,231 |
| Dividends receivable | | 3,762,664 |
| Distributions receivable from Fidelity Central Funds | | 6,542 |
| Prepaid expenses | | 1,078 |
| Other receivables | | 9,627 |
| Total assets | | 528,786,949 |
| Liabilities | | |
| Payable for fund shares redeemed | $63,836 | |
| Accrued management fee | 329,474 | |
| Notes payable to affiliates | 952,000 | |
| Other affiliated payables | 103,964 | |
| Other payables and accrued expenses | 61,883 | |
| Collateral on securities loaned | 3,502,284 | |
| Total liabilities | | 5,013,441 |
| Net Assets | | $523,773,508 |
| Net Assets consist of: | | |
| Paid in capital | | $397,072,763 |
| Total accumulated earnings (loss) | | 126,700,745 |
| Net Assets | | $523,773,508 |
| Net Asset Value, offering price and redemption price per share ($523,773,508 ÷ 31,470,262 shares) | | $16.64 |
See accompanying notes which are an integral part of the financial statements.
Statement of Operations
| | | Year ended October 31, 2020 |
| Investment Income | | |
| Dividends | | $12,767,732 |
| Income from Fidelity Central Funds (including $73,653 from security lending) | | 243,643 |
| Income before foreign taxes withheld | | 13,011,375 |
| Less foreign taxes withheld | | (1,189,052) |
| Total income | | 11,822,323 |
| Expenses | | |
| Management fee | $4,178,033 | |
| Transfer agent fees | 1,015,698 | |
| Accounting fees | 305,838 | |
| Custodian fees and expenses | 51,880 | |
| Independent trustees' fees and expenses | 3,567 | |
| Registration fees | 21,407 | |
| Audit | 60,560 | |
| Legal | 988 | |
| Interest | 505 | |
| Miscellaneous | 8,636 | |
| Total expenses before reductions | 5,647,112 | |
| Expense reductions | (40,271) | |
| Total expenses after reductions | | 5,606,841 |
| Net investment income (loss) | | 6,215,482 |
| Realized and Unrealized Gain (Loss) | | |
| Net realized gain (loss) on: | | |
| Investment securities: | | |
| Unaffiliated issuers | 9,376,435 | |
| Fidelity Central Funds | (1,389) | |
| Foreign currency transactions | 1,939 | |
| Total net realized gain (loss) | | 9,376,985 |
| Change in net unrealized appreciation (depreciation) on: | | |
| Investment securities: | | |
| Unaffiliated issuers | (11,130,440) | |
| Assets and liabilities in foreign currencies | 29,200 | |
| Total change in net unrealized appreciation (depreciation) | | (11,101,240) |
| Net gain (loss) | | (1,724,255) |
| Net increase (decrease) in net assets resulting from operations | | $4,491,227 |
See accompanying notes which are an integral part of the financial statements.
Statement of Changes in Net Assets
| | Year ended October 31, 2020 | Year ended October 31, 2019 |
| Increase (Decrease) in Net Assets | | |
| Operations | | |
| Net investment income (loss) | $6,215,482 | $8,691,787 |
| Net realized gain (loss) | 9,376,985 | 30,593,565 |
| Change in net unrealized appreciation (depreciation) | (11,101,240) | 11,900,266 |
| Net increase (decrease) in net assets resulting from operations | 4,491,227 | 51,185,618 |
| Distributions to shareholders | (47,487,878) | (34,049,418) |
| Share transactions | | |
| Proceeds from sales of shares | 30,552,737 | 28,621,928 |
| Reinvestment of distributions | 44,675,432 | 31,582,463 |
| Cost of shares redeemed | (194,108,757) | (107,091,949) |
| Net increase (decrease) in net assets resulting from share transactions | (118,880,588) | (46,887,558) |
| Total increase (decrease) in net assets | (161,877,239) | (29,751,358) |
| Net Assets | | |
| Beginning of period | 685,650,747 | 715,402,105 |
| End of period | $523,773,508 | $685,650,747 |
| Other Information | | |
| Shares | | |
| Sold | 1,899,560 | 1,769,793 |
| Issued in reinvestment of distributions | 2,601,947 | 1,977,612 |
| Redeemed | (11,990,650) | (6,565,669) |
| Net increase (decrease) | (7,489,143) | (2,818,264) |
See accompanying notes which are an integral part of the financial statements.
Financial Highlights
Fidelity Japan Smaller Companies Fund
| | | | | | |
| Years ended October 31, | 2020 | 2019 | 2018 | 2017 | 2016 |
| Selected Per–Share Data | | | | | |
| Net asset value, beginning of period | $17.60 | $17.12 | $18.84 | $15.66 | $13.76 |
| Income from Investment Operations | | | | | |
| Net investment income (loss)A | .16 | .22 | .18 | .17 | .17 |
| Net realized and unrealized gain (loss) | .11B | 1.10 | (1.00) | 3.42 | 1.93 |
| Total from investment operations | .27 | 1.32 | (.82) | 3.59 | 2.10 |
| Distributions from net investment income | (.23) | (.11) | (.16) | (.17) | (.09) |
| Distributions from net realized gain | (1.00) | (.73) | (.74) | (.25) | (.11) |
| Total distributions | (1.23) | (.84) | (.90) | (.41)C | (.20) |
| Redemption fees added to paid in capitalA | – | – | –D | –D | –D |
| Net asset value, end of period | $16.64 | $17.60 | $17.12 | $18.84 | $15.66 |
| Total ReturnE | 1.31% | 8.22% | (4.71)% | 23.68% | 15.44% |
| Ratios to Average Net AssetsF,G | | | | | |
| Expenses before reductions | .92% | .93% | .94% | .95% | .96% |
| Expenses net of fee waivers, if any | .92% | .93% | .93% | .95% | .96% |
| Expenses net of all reductions | .92% | .93% | .93% | .94% | .96% |
| Net investment income (loss) | 1.02% | 1.31% | .95% | 1.04% | 1.18% |
| Supplemental Data | | | | | |
| Net assets, end of period (000 omitted) | $523,774 | $685,651 | $715,402 | $764,052 | $587,034 |
| Portfolio turnover rateH | 20% | 16% | 17% | 20% | 30% |
A Calculated based on average shares outstanding during the period.
B The amount shown for a share outstanding does not correspond with the aggregate net gain (loss) on investments for the period due to the timing of sales and repurchases of shares in relation to fluctuating market values of the investments of the Fund.
C Total distributions per share do not sum due to rounding.
D Amount represents less than $.005 per share.
E Total returns would have been lower if certain expenses had not been reduced during the applicable periods shown.
F Fees and expenses of any underlying mutual funds or exchange-traded funds (ETFs) are not included in the Fund's expense ratio. The Fund indirectly bears its proportionate share of these expenses. For additional expense information related to investments in Fidelity Central Funds, please refer to the "Investments in Fidelity Central Funds" note found in the Notes to Financial Statements section of the most recent Annual or Semi-Annual report.
G Expense ratios reflect operating expenses of the class. Expenses before reductions do not reflect amounts reimbursed, waived, or reduced through arrangements with the investment advisor, brokerage services, or other offset arrangements, if applicable, and do not represent the amount paid by the class during periods when reimbursements, waivers or reductions occur.
H Amount does not include the portfolio activity of any underlying mutual funds or exchange-traded funds (ETFs).
See accompanying notes which are an integral part of the financial statements.
Notes to Financial Statements
For the period ended October 31, 2020
1. Organization.
Fidelity Japan Smaller Companies Fund (the Fund) is a fund of Fidelity Investment Trust (the Trust) and is authorized to issue an unlimited number of shares. Share transactions on the Statement of Changes in Net Assets may contain exchanges between affiliated funds. The Trust is registered under the Investment Company Act of 1940, as amended (the 1940 Act), as an open-end management investment company organized as a Massachusetts business trust.
Effective January 1, 2020:
Investment advisers Fidelity Investments Money Management, Inc., FMR Co., Inc., and Fidelity SelectCo, LLC, merged with and into Fidelity Management & Research Company. In connection with the merger transactions, the resulting, merged investment adviser was then redomiciled from Massachusetts to Delaware, changed its corporate structure from a corporation to a limited liability company, and changed its name to "Fidelity Management & Research Company LLC".
Fidelity Investments Institutional Operations Company, Inc. converted from a Massachusetts corporation to a Massachusetts LLC, and changed its name to "Fidelity Investments Institutional Operations Company LLC".
2. Investments in Fidelity Central Funds.
The Fund invests in Fidelity Central Funds, which are open-end investment companies generally available only to other investment companies and accounts managed by the investment adviser and its affiliates. The Fund's Schedule of Investments lists each of the Fidelity Central Funds held as of period end, if any, as an investment of the Fund, but does not include the underlying holdings of each Fidelity Central Fund. As an Investing Fund, the Fund indirectly bears its proportionate share of the expenses of the underlying Fidelity Central Funds.
The Money Market Central Funds seek preservation of capital and current income and are managed by the investment adviser. Annualized expenses of the Money Market Central Funds as of their most recent shareholder report date ranged from less than .005% to .01%.
A complete unaudited list of holdings for each Fidelity Central Fund is available upon request or at the Securities and Exchange Commission (the SEC) website at www.sec.gov. In addition, the financial statements of the Fidelity Central Funds, which are not covered by the Fund's Report of Independent Registered Public Accounting Firm, are available on the SEC website or upon request.
3. Significant Accounting Policies.
The Fund is an investment company and applies the accounting and reporting guidance of the Financial Accounting Standards Board (FASB) Accounting Standards Codification Topic 946 Financial Services – Investment Companies. The financial statements have been prepared in conformity with accounting principles generally accepted in the United States of America (GAAP), which require management to make certain estimates and assumptions at the date of the financial statements. Actual results could differ from those estimates. Subsequent events, if any, through the date that the financial statements were issued have been evaluated in the preparation of the financial statements. The following summarizes the significant accounting policies of the Fund:
Investment Valuation. Investments are valued as of 4:00 p.m. Eastern time on the last calendar day of the period. The Board of Trustees (the Board) has delegated the day to day responsibility for the valuation of the Fund's investments to the Fair Value Committee (the Committee) established by the Fund's investment adviser. In accordance with valuation policies and procedures approved by the Board, the Fund attempts to obtain prices from one or more third party pricing vendors or brokers to value its investments. When current market prices, quotations or currency exchange rates are not readily available or reliable, investments will be fair valued in good faith by the Committee, in accordance with procedures adopted by the Board. Factors used in determining fair value vary by investment type and may include market or investment specific events. The frequency with which these procedures are used cannot be predicted and they may be utilized to a significant extent. The Committee oversees the Fund's valuation policies and procedures and reports to the Board on the Committee's activities and fair value determinations. The Board monitors the appropriateness of the procedures used in valuing the Fund's investments and ratifies the fair value determinations of the Committee.
The Fund categorizes the inputs to valuation techniques used to value its investments into a disclosure hierarchy consisting of three levels as shown below:
- Level 1 – quoted prices in active markets for identical investments
- Level 2 – other significant observable inputs (including quoted prices for similar investments, interest rates, prepayment speeds, etc.)
- Level 3 – unobservable inputs (including the Fund's own assumptions based on the best information available)
Valuation techniques used to value the Fund's investments by major category are as follows:
Equity securities, including restricted securities, for which market quotations are readily available, are valued at the last reported sale price or official closing price as reported by a third party pricing vendor on the primary market or exchange on which they are traded and are categorized as Level 1 in the hierarchy. In the event there were no sales during the day or closing prices are not available, securities are valued at the last quoted bid price or may be valued using the last available price and are generally categorized as Level 2 in the hierarchy. For foreign equity securities, when market or security specific events arise, comparisons to the valuation of American Depositary Receipts (ADRs), futures contracts, Exchange-Traded Funds (ETFs) and certain indexes as well as quoted prices for similar securities may be used and would be categorized as Level 2 in the hierarchy. For equity securities, including restricted securities, where observable inputs are limited, assumptions about market activity and risk are used and these securities may be categorized as Level 3 in the hierarchy.
Investments in open-end mutual funds, including the Fidelity Central Funds, are valued at their closing net asset value (NAV) each business day and are categorized as Level 1 in the hierarchy.
Changes in valuation techniques may result in transfers in or out of an assigned level within the disclosure hierarchy. The aggregate value of investments by input level as of October 31, 2020 is included at the end of the Fund's Schedule of Investments.
Foreign Currency. Certain Funds may use foreign currency contracts to facilitate transactions in foreign-denominated securities. Gains and losses from these transactions may arise from changes in the value of the foreign currency or if the counterparties do not perform under the contracts' terms.
Foreign-denominated assets, including investment securities, and liabilities are translated into U.S. dollars at the exchange rates at period end. Purchases and sales of investment securities, income and dividends received, and expenses denominated in foreign currencies are translated into U.S. dollars at the exchange rate in effect on the transaction date.
The effects of exchange rate fluctuations on investments are included with the net realized and unrealized gain (loss) on investment securities. Other foreign currency transactions resulting in realized and unrealized gain (loss) are disclosed separately.
Investment Transactions and Income. For financial reporting purposes, the Fund's investment holdings and NAV include trades executed through the end of the last business day of the period. The NAV per share for processing shareholder transactions is calculated as of the close of business of the New York Stock Exchange (NYSE), normally 4:00 p.m. Eastern time and includes trades executed through the end of the prior business day. Gains and losses on securities sold are determined on the basis of identified cost. Dividend income is recorded on the ex-dividend date, except for certain dividends from foreign securities where the ex-dividend date may have passed, which are recorded as soon as the Fund is informed of the ex-dividend date. Non-cash dividends included in dividend income, if any, are recorded at the fair market value of the securities received. Income and capital gain distributions from Fidelity Central Funds, if any, are recorded on the ex-dividend date. Investment income is recorded net of foreign taxes withheld where recovery of such taxes is uncertain.
Expenses. Expenses directly attributable to a fund are charged to that fund. Expenses attributable to more than one fund are allocated among the respective funds on the basis of relative net assets or other appropriate methods. Expense estimates are accrued in the period to which they relate and adjustments are made when actual amounts are known.
Income Tax Information and Distributions to Shareholders. Each year, the Fund intends to qualify as a regulated investment company under Subchapter M of the Internal Revenue Code, including distributing substantially all of its taxable income and realized gains. As a result, no provision for U.S. Federal income taxes is required. As of October 31, 2020, the Fund did not have any unrecognized tax benefits in the financial statements; nor is the Fund aware of any tax positions for which it is reasonably possible that the total amounts of unrecognized tax benefits will significantly change in the next twelve months. The Fund files a U.S. federal tax return, in addition to state and local tax returns as required. The Fund's federal income tax returns are subject to examination by the Internal Revenue Service (IRS) for a period of three fiscal years after they are filed. State and local tax returns may be subject to examination for an additional fiscal year depending on the jurisdiction. Foreign taxes are provided for based on the Fund's understanding of the tax rules and rates that exist in the foreign markets in which it invests.
Distributions are declared and recorded on the ex-dividend date. Income and capital gain distributions are determined in accordance with income tax regulations, which may differ from GAAP. In addition, the Fund claimed a portion of the payment made to redeeming shareholders as a distribution for income tax purposes.
Capital accounts within the financial statements are adjusted for permanent book-tax differences. These adjustments have no impact on net assets or the results of operations. Capital accounts are not adjusted for temporary book-tax differences which will reverse in a subsequent period.
Book-tax differences are primarily due to foreign currency transactions, passive foreign investment companies (PFIC) and losses deferred due to wash sales.
As of period end, the cost and unrealized appreciation (depreciation) in securities, and derivatives if applicable, for federal income tax purposes were as follows:
| Gross unrealized appreciation | $146,320,201 |
| Gross unrealized depreciation | (28,471,127) |
| Net unrealized appreciation (depreciation) | $117,849,074 |
| Tax Cost | $394,997,232 |
The tax-based components of distributable earnings as of period end were as follows:
| Undistributed ordinary income | $7,319,733 |
| Undistributed long-term capital gain | $1,511,580 |
| Net unrealized appreciation (depreciation) on securities and other investments | $117,869,431 |
The tax character of distributions paid was as follows:
| | October 31, 2020 | October 31, 2019 |
| Ordinary Income | $18,871,405 | $ 4,534,525 |
| Long-term Capital Gains | 28,616,473 | 29,514,893 |
| Total | $47,487,878 | $ 34,049,418 |
4. Purchases and Sales of Investments.
Purchases and sales of securities, other than short-term securities, are noted in the table below.
| | Purchases ($) | Sales ($) |
| Fidelity Japan Smaller Companies Fund | 114,290,933 | 248,870,070 |
5. Fees and Other Transactions with Affiliates.
Management Fee. Fidelity Management & Research Company LLC (the investment adviser) and its affiliates provide the Fund with investment management related services for which the Fund pays a monthly management fee. The management fee is the sum of an individual fund fee rate that is based on an annual rate of .45% of the Fund's average net assets and an annualized group fee rate that averaged .23% during the period. The group fee rate is based upon the monthly average net assets of a group of registered investment companies with which the investment adviser has management contracts. The group fee rate decreases as assets under management increase and increases as assets under management decrease. For the reporting period, the total annual management fee rate was .68% of the Fund's average net assets.
Transfer Agent Fees. Fidelity Investments Institutional Operations Company LLC (FIIOC), an affiliate of the investment adviser, is the Fund's transfer, dividend disbursing and shareholder servicing agent. FIIOC receives account fees and asset-based fees that vary according to account size and type of account. FIIOC pays for typesetting, printing and mailing of shareholder reports, except proxy statements. For the period, the transfer agent fees were equivalent to an annual rate of .17% of average net assets.
Accounting Fees. Fidelity Service Company, Inc. (FSC), an affiliate of the investment adviser, maintains the Fund's accounting records. The accounting fee is based on the level of average net assets for each month. For the period, the fees were equivalent to the following annual rates:
| | % of Average Net Assets |
| Fidelity Japan Smaller Companies Fund | .05 |
Brokerage Commissions. A portion of portfolio transactions were placed with brokerage firms which are affiliates of the investment adviser. Brokerage commissions are included in net realized gain (loss) and change in net unrealized appreciation (depreciation) in the Statement of Operations. The commissions paid to these affiliated firms were as follows:
| | Amount |
| Fidelity Japan Smaller Companies Fund | $5 |
Interfund Lending Program. Pursuant to an Exemptive Order issued by the SEC, the Fund, along with other registered investment companies having management contracts with Fidelity Management & Research Company LLC (FMR), or other affiliated entities of FMR, may participate in an interfund lending program. This program provides an alternative credit facility allowing the Fund to borrow from, or lend money to, other participating affiliated funds. Any open loans, including accrued interest, at period end are presented under the caption "Notes payable to affiliates" in the Statement of Assets and Liabilities. Activity in this program during the period for which loans were outstanding was as follows:
| | Borrower or Lender | Average Loan Balance | Weighted Average Interest Rate | Interest Expense |
| Fidelity Japan Smaller Companies Fund | Borrower | $9,082,167 | .33% | $505 |
Interfund Trades. Funds may purchase from or sell securities to other Fidelity Funds under procedures adopted by the Board. The procedures have been designed to ensure these interfund trades are executed in accordance with Rule 17a-7 of the 1940 Act. Interfund trades are included within the respective purchases and sales amounts shown in the Purchases and Sales of Investments note.
6. Committed Line of Credit.
Certain Funds participate with other funds managed by the investment adviser or an affiliate in a $4.25 billion credit facility (the "line of credit") to be utilized for temporary or emergency purposes to fund shareholder redemptions or for other short-term liquidity purposes. The participating funds have agreed to pay commitment fees on their pro-rata portion of the line of credit, which are reflected in Miscellaneous expenses on the Statement of Operations, and are as follows:
| | Amount |
| Fidelity Japan Smaller Companies Fund | $1,461 |
During the period, there were no borrowings on this line of credit.
7. Security Lending.
Funds lend portfolio securities from time to time in order to earn additional income. Lending agents are used, including National Financial Services (NFS), an affiliate of the investment adviser. Pursuant to a securities lending agreement, NFS will receive a fee, which is capped at 9.9% of a fund's daily lending revenue, for its services as lending agent. A fund may lend securities to certain qualified borrowers, including NFS. On the settlement date of the loan, a fund receives collateral (in the form of U.S. Treasury obligations, letters of credit and/or cash) against the loaned securities and maintains collateral in an amount not less than 100% of the market value of the loaned securities during the period of the loan. The market value of the loaned securities is determined at the close of business of a fund and any additional required collateral is delivered to a fund on the next business day. A fund or borrower may terminate the loan at any time, and if the borrower defaults on its obligation to return the securities loaned because of insolvency or other reasons, a fund may apply collateral received from the borrower against the obligation. A fund may experience delays and costs in recovering the securities loaned. Any cash collateral received is invested in the Fidelity Securities Lending Cash Central Fund. Any loaned securities are identified as such in the Schedule of Investments, and the value of loaned securities and cash collateral at period end, as applicable, are presented in the Statement of Assets and Liabilities. Security lending income represents the income earned on investing cash collateral, less rebates paid to borrowers and any lending agent fees associated with the loan, plus any premium payments received for lending certain types of securities. Security lending income is presented in the Statement of Operations as a component of income from Fidelity Central Funds. Affiliated security lending activity, if any, was as follows:
| | Total Security Lending Income Fees Paid to NFS | Security Lending Income From Securities Loaned to NFS | Value of Securities Loaned to NFS at Period End |
| Fidelity Japan Smaller Companies Fund | $200 | $– | $– |
8. Expense Reductions.
Commissions paid to certain brokers with whom the investment adviser, or its affiliates, places trades on behalf of the Fund include an amount in addition to trade execution, which may be rebated back to the Fund to offset certain expenses. This amount totaled $37,207 for the period. In addition, through arrangements with the Fund's custodian, credits realized as a result of certain uninvested cash balances were used to reduce the Fund's expenses by $247.
In addition, during the period the investment adviser or an affiliate reimbursed and/or waived a portion of operating expenses in the amount of $2,817.
9. Other.
The Fund's organizational documents provide former and current trustees and officers with a limited indemnification against liabilities arising in connection with the performance of their duties to the Fund. In the normal course of business, the Fund may also enter into contracts that provide general indemnifications. The Fund's maximum exposure under these arrangements is unknown as this would be dependent on future claims that may be made against the Fund. The risk of material loss from such claims is considered remote.
At the end of the period, Strategic Advisers International Fund, VIP FundsManager 50% Portfolio and VIP FundsManager 60% Portfolio were the owners of record of approximately 22%, 10% and 10%, respectively, of the total outstanding shares of the Fund. Mutual funds managed by the investment adviser or its affiliates were the owners of record, in the aggregate, of approximately 56% of the total outstanding shares of the Fund.
10. Coronavirus (COVID-19) Pandemic.
An outbreak of COVID-19 first detected in China during December 2019 has since spread globally and was declared a pandemic by the World Health Organization during March 2020. Developments that disrupt global economies and financial markets, such as the COVID-19 pandemic, may magnify factors that affect the Fund's performance.
Fidelity® Latin America Fund
Performance: The Bottom Line
Average annual total return reflects the change in the value of an investment, assuming reinvestment of distributions from dividend income and capital gains (the profits earned upon the sale of securities that have grown in value, if any) and assuming a constant rate of performance each year. The hypothetical investment and the average annual total returns do not reflect the deduction of taxes that a shareholder would pay on fund distributions or the redemption of fund shares. During periods of reimbursement by Fidelity, a fund’s total return will be greater than it would be had the reimbursement not occurred. How a fund did yesterday is no guarantee of how it will do tomorrow.
Average Annual Total Returns
| For the periods ended October 31, 2020 | Past 1 year | Past 5 years | Past 10 years |
| Class A (incl. 5.75% sales charge) | (40.92)% | (0.10)% | (7.30)% |
| Class M (incl. 3.50% sales charge) | (39.64)% | 0.10% | (7.33)% |
| Class C (incl. contingent deferred sales charge) | (38.39)% | 0.33% | (7.45)% |
| Fidelity® Latin America Fund | (37.13)% | 1.39% | (6.47)% |
| Class I | (37.07)% | 1.46% | (6.43)% |
| Class Z | (37.00)% | 1.51% | (6.40)% |
Class C shares' contingent deferred sales charges included in the past one year, past five years and past ten years total return figures are 1%, 0% and 0%, respectively.
The initial offering of Class Z shares took place on October 2, 2018 Returns prior to October 2, 2018, are those of Class I.
$10,000 Over 10 Years
Let's say hypothetically that $10,000 was invested in Fidelity® Latin America Fund, a class of the fund, on October 31, 2010.
The chart shows how the value of your investment would have changed, and also shows how the MSCI EM (Emerging Markets) Latin America Index performed over the same period.
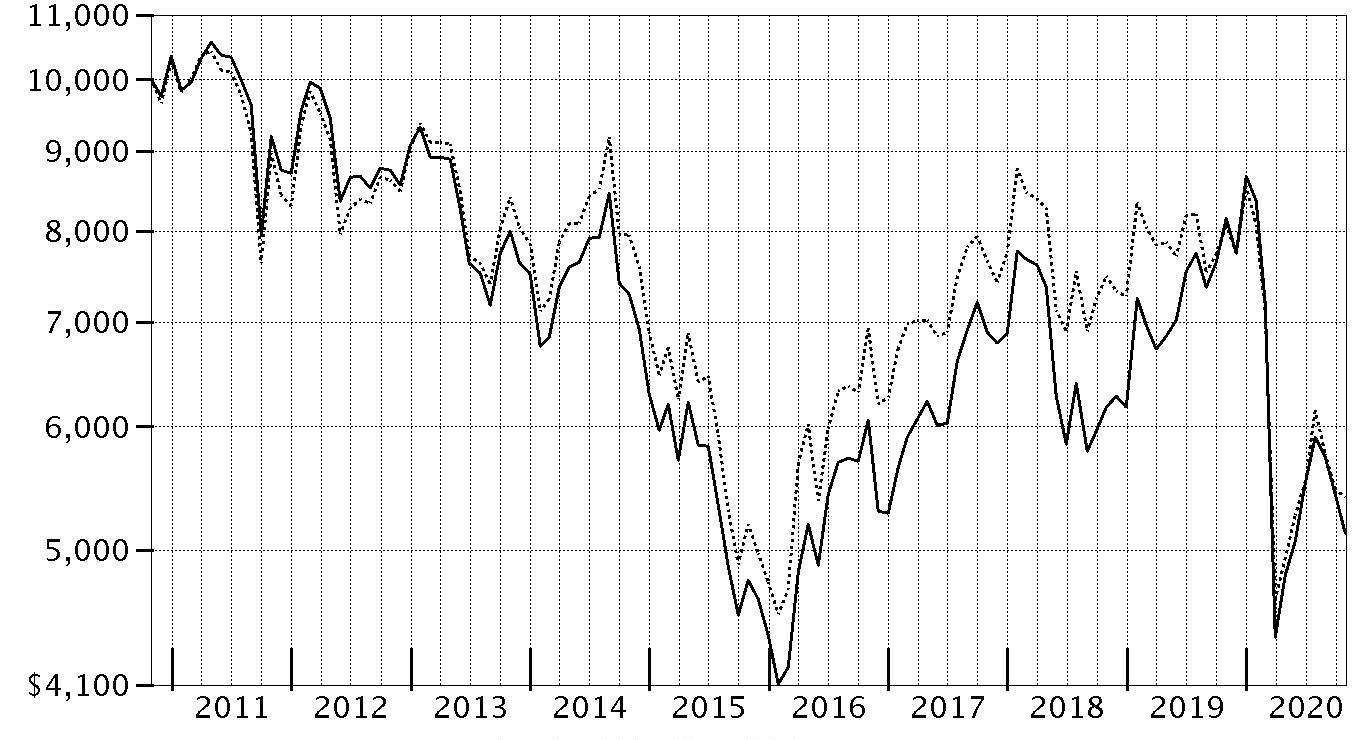
| Period Ending Values |
| $5,124 | Fidelity® Latin America Fund |
| $5,407 | MSCI EM (Emerging Markets) Latin America Index |
Fidelity® Latin America Fund
Management's Discussion of Fund Performance
Market Recap: The MSCI ACWI (All Country World Index) ex USA Index returned -2.46% for the 12 months ending October 31, 2020, in what was a bumpy ride for non-U.S. equities, marked by a steep but brief decline due to the early-2020 outbreak and spread of the coronavirus, followed by a sharp upturn. Declared a pandemic on March 11, the crisis and containment efforts caused broad contraction in economic activity, elevated volatility and dislocation in financial markets. A historically rapid and expansive monetary- and fiscal-policy response around the world provided a partial offset to the economic disruption. Other supporting factors included resilient corporate earnings and near-term potential for a COVID-19 vaccine breakthrough. This was evident in the index’s 12.28% gain in the final six months of the year. Currency fluctuation generally boosted foreign developed-markets equities for the year, while the reverse was true for emerging-markets stocks. Late in the period, the index was pressured by a second wave of COVID-19 cases in some regions, and stretched valuations and crowded positioning in big tech. For the full year, the U.K. (-22%), Asia Pacific ex Japan (-8%), Canada (-5%) and Europe ex U.K. (-4%) notably lagged. Emerging markets (+9%) and Japan (+1%) outperformed. By sector, energy (-38%), financials and real estate (-20% each) lagged, whereas information technology (+ 25%) and communication services (+15%) topped the index.
Comments from Portfolio Manager Will Pruett: For the fiscal year ending October 31, 2020, the fund's share classes returned roughly -37% to -38% (excluding sales charges, if applicable), lagging the -33.03% result of the benchmark, the MSCI Emerging Markets Latin America Index. Choices among the stocks of cyclical firms hurt the fund’s relative return the past 12 months. Not holding iron ore miner Vale (-5%) detracted more than any other position. It also hurt to not own copper producers Grupo Mexico SAB de CV (+13%) and Southern Copper (+53%), as well as Mexico-based cement manufacturer Cemex SA de CV (+11%). The fund’s exposure to poor-performing banks also detracted. An overweighted stake in Itausa (-52%), and non-benchmark positions in Banco BMG (-70%) and insurance firm IRB Brasil Resseguros (-59%) hurt fund performance. I reduced the fund’s Itausa stake and eliminated shares of IRB Brasil Resseguros by period end. By country, positioning in Brazil hurt the fund’s relative return the most as Brazil’s economy contracted meaningfully, even though the country showed some signs of improvement by October 31. Security selection in Mexico also held back fund performance, as did positioning in Panama, Peru and Chile to a lesser extent. Conversely, positioning in Latin American tech stocks added considerable value, as did an overweighting in the health care sector. A non-benchmark position in Locaweb Servicos de Internet (+187%), a provider of web hosting, email, cloud computing, electronic payment, and digital marketing services, contributed more relative value than any other fund position.
The views expressed above reflect those of the portfolio manager(s) only through the end of the period as stated on the cover of this report and do not necessarily represent the views of Fidelity or any other person in the Fidelity organization. Any such views are subject to change at any time based upon market or other conditions and Fidelity disclaims any responsibility to update such views. These views may not be relied on as investment advice and, because investment decisions for a Fidelity fund are based on numerous factors, may not be relied on as an indication of trading intent on behalf of any Fidelity fund.
Fidelity® Latin America Fund
Investment Summary (Unaudited)
Geographic Diversification (% of fund's net assets)
| As of October 31, 2020 |
| | Brazil | 52.9% |
| | Mexico | 24.3% |
| | United States of America* | 15.3% |
| | Panama | 2.7% |
| | Luxembourg | 2.6% |
| | Cayman Islands | 2.1% |
| | Bermuda | 0.1% |

* Includes Short-Term investments and Net Other Assets (Liabilities).
Percentages are based on country or territory of incorporation and are adjusted for the effect of futures contracts, if applicable.
Asset Allocation as of October 31, 2020
| | % of fund's net assets |
| Stocks | 99.8 |
| Short-Term Investments and Net Other Assets (Liabilities) | 0.2 |
Top Ten Stocks as of October 31, 2020
| | % of fund's net assets |
| Petroleo Brasileiro SA - Petrobras (PN) (non-vtg.) (Brazil, Oil, Gas & Consumable Fuels) | 8.8 |
| Afya Ltd. (United States of America, Diversified Consumer Services) | 8.3 |
| Genomma Lab Internacional SA de CV (Mexico, Pharmaceuticals) | 7.8 |
| Qualitas Controladora S.A.B. de CV (Mexico, Insurance) | 6.9 |
| Itausa-Investimentos Itau SA (PN) (Brazil, Banks) | 4.5 |
| Vasta Platform Ltd. (United States of America, Diversified Consumer Services) | 4.1 |
| Suzano Papel e Celulose SA (Brazil, Paper & Forest Products) | 3.7 |
| Qualicorp Consultoria E Corret (Brazil, Health Care Providers & Services) | 3.3 |
| Rumo SA (Brazil, Road & Rail) | 3.3 |
| Lojas Renner SA (Brazil, Multiline Retail) | 3.2 |
| | 53.9 |
Top Market Sectors as of October 31, 2020
| | % of fund's net assets |
| Financials | 29.0 |
| Consumer Discretionary | 19.7 |
| Health Care | 16.8 |
| Industrials | 11.7 |
| Energy | 8.8 |
| Information Technology | 7.4 |
| Materials | 3.7 |
| Consumer Staples | 2.7 |
Market Sectors may include more than one industry category.
The Fund may invest up to 35% of its total assets in any industry that represents more than 20% of the Latin American market. As of October 31, 2020, the Fund did not have more than 25% of its total assets invested in any one industry.
Fidelity® Latin America Fund
Schedule of Investments October 31, 2020
Showing Percentage of Net Assets
| Common Stocks - 81.1% | | | |
| | | Shares | Value |
| Bermuda - 0.1% | | | |
| Vostok Emerging Finance Ltd. (depository receipt) (a) | | 1,082,958 | $329,814 |
| Brazil - 34.2% | | | |
| Atacadao SA | | 2,603,727 | 8,372,113 |
| Azul SA sponsored ADR (a)(b) | | 616,725 | 7,308,191 |
| Banco do Brasil SA | | 1,209,655 | 6,282,334 |
| Boa Vista Servicos SA (a) | | 1,443,086 | 3,412,835 |
| Companhia de Locacao das Americas | | 1,724,375 | 7,555,100 |
| CVC Brasil Operadora e Agencia de Viagens SA | | 2,291,236 | 4,903,559 |
| CVC Brasil Operadora e Agencia de Viagens SA warrants 1/29/21 (a) | | 350,536 | 121,571 |
| Hapvida Participacoes e Investimentos SA (c) | | 729,551 | 8,184,316 |
| Hypermarcas SA | | 1,918,437 | 9,328,139 |
| Locaweb Servicos de Internet SA (c) | | 696,368 | 8,392,169 |
| Lojas Renner SA | | 1,499,704 | 9,788,150 |
| Qualicorp Consultoria E Corret | | 1,834,085 | 10,174,178 |
| Rumo SA (a) | | 3,124,068 | 9,985,344 |
| Suzano Papel e Celulose SA (a) | | 1,306,589 | 11,396,889 |
|
| TOTAL BRAZIL | | | 105,204,888 |
|
| Cayman Islands - 2.1% | | | |
| PagSeguro Digital Ltd. (a)(b) | | 178,832 | 6,547,040 |
| Luxembourg - 2.6% | | | |
| Globant SA (a) | | 43,204 | 7,803,074 |
| Mexico - 24.3% | | | |
| Banco del Bajio SA (a)(c) | | 7,559,022 | 6,250,630 |
| Credito Real S.A.B. de CV (a) | | 14,635,664 | 7,679,558 |
| Genomma Lab Internacional SA de CV (a) | | 27,186,637 | 24,108,651 |
| Grupo Aeroportuario Norte S.A.B. de CV (a) | | 1,616,088 | 7,292,834 |
| Qualitas Controladora S.A.B. de CV | | 5,325,872 | 21,269,341 |
| Unifin Financiera SAPI de CV (a) | | 9,563,606 | 8,295,988 |
|
| TOTAL MEXICO | | | 74,897,002 |
|
| Panama - 2.7% | | | |
| Intercorp Financial Services, Inc. | | 404,931 | 8,410,417 |
| United States of America - 15.1% | | | |
| Afya Ltd. (a)(b) | | 1,066,950 | 25,606,800 |
| First Cash Financial Services, Inc. | | 155,350 | 8,084,414 |
| Vasta Platform Ltd. (a)(b) | | 1,096,725 | 12,678,141 |
|
| TOTAL UNITED STATES OF AMERICA | | | 46,369,355 |
|
| TOTAL COMMON STOCKS | | | |
| (Cost $284,856,560) | | | 249,561,590 |
|
| Nonconvertible Preferred Stocks - 18.7% | | | |
| Brazil - 18.7% | | | |
| Banco BMG SA (c) | | 11,175,912 | 8,940,028 |
| Itausa-Investimentos Itau SA (PN) | | 8,644,896 | 13,695,153 |
| Lojas Americanas SA (PN) | | 1,912,409 | 7,742,358 |
| Petroleo Brasileiro SA - Petrobras (PN) (non-vtg.) | | 8,246,496 | 27,220,284 |
| TOTAL PREFERRED STOCKS | | | |
| (Cost $89,195,582) | | | 57,597,823 |
|
| Money Market Funds - 7.2% | | | |
| Fidelity Cash Central Fund 0.10% (d) | | 96,549 | 96,569 |
| Fidelity Securities Lending Cash Central Fund 0.11% (d)(e) | | 22,135,491 | 22,137,705 |
| TOTAL MONEY MARKET FUNDS | | | |
| (Cost $22,234,274) | | | 22,234,274 |
| TOTAL INVESTMENT IN SECURITIES - 107.0% | | | |
| (Cost $396,286,416) | | | 329,393,687 |
| NET OTHER ASSETS (LIABILITIES) - (7.0)% | | | (21,569,822) |
| NET ASSETS - 100% | | | $307,823,865 |
Categorizations in the Schedule of Investments are based on country or territory of incorporation.
Legend
(a) Non-income producing
(b) Security or a portion of the security is on loan at period end.
(c) Security exempt from registration under Rule 144A of the Securities Act of 1933. These securities may be resold in transactions exempt from registration, normally to qualified institutional buyers. At the end of the period, the value of these securities amounted to $31,767,143 or 10.3% of net assets.
(d) Affiliated fund that is generally available only to investment companies and other accounts managed by Fidelity Investments. The rate quoted is the annualized seven-day yield of the fund at period end. A complete unaudited listing of the fund's holdings as of its most recent quarter end is available upon request. In addition, each Fidelity Central Fund's financial statements, which are not covered by the Fund's Report of Independent Registered Public Accounting Firm, are available on the SEC's website or upon request.
(e) Investment made with cash collateral received from securities on loan.
Affiliated Central Funds
Information regarding fiscal year to date income earned by the Fund from investments in Fidelity Central Funds is as follows:
| Fund | Income earned |
| Fidelity Cash Central Fund | $11,978 |
| Fidelity Securities Lending Cash Central Fund | 77,969 |
| Total | $89,947 |
Amounts in the income column in the above table include any capital gain distributions from underlying funds, which are presented in the corresponding line-item in the Statement of Operations, if applicable. Amount for Fidelity Securities Lending Cash Central Fund represents the income earned on investing cash collateral, less rebates paid to borrowers and any lending agent fees associated with the loan, plus any premium payments received for lending certain types of securities.
The value, beginning of period, for the Fidelity Cash Central Fund was $8,485,602. Net realized gain (loss) and change in net unrealized appreciation (depreciation) on Fidelity Cash Central Fund is presented in the Statement of Operations, if applicable. Purchases and sales of the Fidelity Cash Central Fund were $201,396,622 and $187,747,047, respectively, during the period.
Other Affiliated Issuers
An affiliated company is a company in which the Fund has ownership of at least 5% of the voting securities. Fiscal year to date transactions with companies which are or were affiliates are as follows:
| Affiliate | Value, beginning of period | Purchases | Sales Proceeds | Dividend Income | Realized Gain (loss) | Change in Unrealized appreciation (depreciation) | Value, end of period |
| Vasta Platform Ltd. | $-- | $21,333,989 | $1,223,257 | $-- | $(295,014) | $(7,137,577) | $-- |
| Total | $-- | $21,333,989 | $1,223,257 | $-- | $(295,014) | $(7,137,577) | $-- |
Investment Valuation
The following is a summary of the inputs used, as of October 31, 2020, involving the Fund's assets and liabilities carried at fair value. The inputs or methodology used for valuing securities may not be an indication of the risk associated with investing in those securities. For more information on valuation inputs, and their aggregation into the levels used below, please refer to the Investment Valuation section in the accompanying Notes to Financial Statements.
| | Valuation Inputs at Reporting Date: |
| Description | Total | Level 1 | Level 2 | Level 3 |
| Investments in Securities: | | | | |
| Equities: | | | | |
| Consumer Discretionary | $60,840,579 | $60,840,579 | $-- | $-- |
| Consumer Staples | 8,372,113 | 8,372,113 | -- | -- |
| Energy | 27,220,284 | 27,220,284 | -- | -- |
| Financials | 89,237,677 | 89,237,677 | -- | -- |
| Health Care | 51,795,284 | 51,795,284 | -- | -- |
| Industrials | 35,554,304 | 35,554,304 | -- | -- |
| Information Technology | 22,742,283 | 22,742,283 | -- | -- |
| Materials | 11,396,889 | 11,396,889 | -- | -- |
| Money Market Funds | 22,234,274 | 22,234,274 | -- | -- |
| Total Investments in Securities: | $329,393,687 | $329,393,687 | $-- | $-- |
See accompanying notes which are an integral part of the financial statements.
Fidelity® Latin America Fund
Financial Statements
Statement of Assets and Liabilities
| | | October 31, 2020 |
| Assets | | |
Investment in securities, at value (including securities loaned of $21,357,916) — See accompanying schedule:
Unaffiliated issuers (cost $374,052,142) | $307,159,413 | |
| Fidelity Central Funds (cost $22,234,274) | 22,234,274 | |
| Total Investment in Securities (cost $396,286,416) | | $329,393,687 |
| Receivable for investments sold | | 1,048,568 |
| Receivable for fund shares sold | | 203,995 |
| Dividends receivable | | 373,548 |
| Distributions receivable from Fidelity Central Funds | | 15,942 |
| Prepaid expenses | | 660 |
| Other receivables | | 21,294 |
| Total assets | | 331,057,694 |
| Liabilities | | |
| Payable for investments purchased | $367,473 | |
| Payable for fund shares redeemed | 349,600 | |
| Accrued management fee | 188,972 | |
| Distribution and service plan fees payable | 4,147 | |
| Other affiliated payables | 86,931 | |
| Other payables and accrued expenses | 101,581 | |
| Collateral on securities loaned | 22,135,125 | |
| Total liabilities | | 23,233,829 |
| Net Assets | | $307,823,865 |
| Net Assets consist of: | | |
| Paid in capital | | $418,264,938 |
| Total accumulated earnings (loss) | | (110,441,073) |
| Net Assets | | $307,823,865 |
| Net Asset Value and Maximum Offering Price | | |
| Class A: | | |
| Net Asset Value and redemption price per share ($9,130,751 ÷ 524,609 shares)(a) | | $17.40 |
| Maximum offering price per share (100/94.25 of $17.40) | | $18.46 |
| Class M: | | |
| Net Asset Value and redemption price per share ($2,912,498 ÷ 167,039 shares)(a) | | $17.44 |
| Maximum offering price per share (100/96.50 of $17.44) | | $18.07 |
| Class C: | | |
| Net Asset Value and offering price per share ($810,494 ÷ 46,018 shares)(a) | | $17.61 |
| Latin America: | | |
| Net Asset Value, offering price and redemption price per share ($277,941,748 ÷ 16,010,539 shares) | | $17.36 |
| Class I: | | |
| Net Asset Value, offering price and redemption price per share ($3,508,151 ÷ 202,360 shares) | | $17.34 |
| Class Z: | | |
| Net Asset Value, offering price and redemption price per share ($13,520,223 ÷ 780,646 shares) | | $17.32 |
(a) Redemption price per share is equal to net asset value less any applicable contingent deferred sales charge.
See accompanying notes which are an integral part of the financial statements.
Statement of Operations
| | | Year ended October 31, 2020 |
| Investment Income | | |
| Dividends | | $6,937,919 |
| Income from Fidelity Central Funds (including $77,969 from security lending) | | 89,947 |
| Income before foreign taxes withheld | | 7,027,866 |
| Less foreign taxes withheld | | (626,226) |
| Total income | | 6,401,640 |
| Expenses | | |
| Management fee | $2,910,199 | |
| Transfer agent fees | 980,083 | |
| Distribution and service plan fees | 70,534 | |
| Accounting fees | 218,130 | |
| Custodian fees and expenses | 146,219 | |
| Independent trustees' fees and expenses | 2,576 | |
| Registration fees | 94,072 | |
| Audit | 72,371 | |
| Legal | 2,041 | |
| Miscellaneous | 16,695 | |
| Total expenses before reductions | 4,512,920 | |
| Expense reductions | (93,430) | |
| Total expenses after reductions | | 4,419,490 |
| Net investment income (loss) | | 1,982,150 |
| Realized and Unrealized Gain (Loss) | | |
| Net realized gain (loss) on: | | |
| Investment securities: | | |
| Unaffiliated issuers | 1,474,415 | |
| Fidelity Central Funds | 2,289 | |
| Other affiliated issuers | (295,014) | |
| Foreign currency transactions | (655,829) | |
| Total net realized gain (loss) | | 525,861 |
| Change in net unrealized appreciation (depreciation) on: | | |
| Investment securities: | | |
| Unaffiliated issuers | (203,779,750) | |
| Affiliated issuers | (7,137,577) | |
| Assets and liabilities in foreign currencies | (142,156) | |
| Total change in net unrealized appreciation (depreciation) | | (211,059,483) |
| Net gain (loss) | | (210,533,622) |
| Net increase (decrease) in net assets resulting from operations | | $(208,551,472) |
See accompanying notes which are an integral part of the financial statements.
Statement of Changes in Net Assets
| | Year ended October 31, 2020 | Year ended October 31, 2019 |
| Increase (Decrease) in Net Assets | | |
| Operations | | |
| Net investment income (loss) | $1,982,150 | $16,389,171 |
| Net realized gain (loss) | 525,861 | 57,255,402 |
| Change in net unrealized appreciation (depreciation) | (211,059,483) | 72,722,053 |
| Net increase (decrease) in net assets resulting from operations | (208,551,472) | 146,366,626 |
| Distributions to shareholders | (13,930,227) | (10,500,914) |
| Share transactions - net increase (decrease) | (48,747,456) | (30,101,947) |
| Total increase (decrease) in net assets | (271,229,155) | 105,763,765 |
| Net Assets | | |
| Beginning of period | 579,053,020 | 473,289,255 |
| End of period | $307,823,865 | $579,053,020 |
See accompanying notes which are an integral part of the financial statements.
Financial Highlights
Fidelity Latin America Fund Class A
| Years ended October 31, | 2020 | 2019 | 2018 | 2017 | 2016 |
| Selected Per–Share Data | | | | | |
| Net asset value, beginning of period | $28.36 | $21.98 | $24.93 | $22.45 | $18.09 |
| Income from Investment Operations | | | | | |
| Net investment income (loss)A | .04 | .69 | .50 | .42 | .40 |
| Net realized and unrealized gain (loss) | (10.40) | 6.11 | (3.16) | 2.48 | 4.27 |
| Total from investment operations | (10.36) | 6.80 | (2.66) | 2.90 | 4.67 |
| Distributions from net investment income | (.60) | (.42) | (.29) | (.43) | (.31) |
| Total distributions | (.60) | (.42) | (.29) | (.43) | (.31) |
| Redemption fees added to paid in capitalA | – | – | –B | .01 | –B |
| Net asset value, end of period | $17.40 | $28.36 | $21.98 | $24.93 | $22.45 |
| Total ReturnC,D | (37.31)% | 31.60% | (10.78)% | 13.55% | 26.29% |
| Ratios to Average Net AssetsE,F | | | | | |
| Expenses before reductions | 1.36% | 1.36% | 1.38% | 1.39% | 1.40% |
| Expenses net of fee waivers, if any | 1.35% | 1.36% | 1.38% | 1.39% | 1.40% |
| Expenses net of all reductions | 1.33% | 1.36% | 1.36% | 1.38% | 1.39% |
| Net investment income (loss) | .18% | 2.81% | 2.08% | 1.90% | 2.14% |
| Supplemental Data | | | | | |
| Net assets, end of period (000 omitted) | $9,131 | $17,953 | $14,157 | $17,801 | $19,115 |
| Portfolio turnover rateG | 54% | 48% | 53% | 51% | 108% |
A Calculated based on average shares outstanding during the period.
B Amount represents less than $.005 per share.
C Total returns would have been lower if certain expenses had not been reduced during the applicable periods shown.
D Total returns do not include the effect of the sales charges.
E Fees and expenses of any underlying mutual funds or exchange-traded funds (ETFs) are not included in the Fund's expense ratio. The Fund indirectly bears its proportionate share of these expenses. For additional expense information related to investments in Fidelity Central Funds, please refer to the "Investments in Fidelity Central Funds" note found in the Notes to Financial Statements section of the most recent Annual or Semi-Annual report.
F Expense ratios reflect operating expenses of the class. Expenses before reductions do not reflect amounts reimbursed, waived, or reduced through arrangements with the investment adviser, brokerage services, or other offset arrangements, if applicable, and do not represent the amount paid by the class during periods when reimbursements, waivers or reductions occur.
G Amount does not include the portfolio activity of any underlying mutual funds or exchange-traded funds (ETFs).
See accompanying notes which are an integral part of the financial statements.
Fidelity Latin America Fund Class M
| Years ended October 31, | 2020 | 2019 | 2018 | 2017 | 2016 |
| Selected Per–Share Data | | | | | |
| Net asset value, beginning of period | $28.41 | $22.00 | $24.96 | $22.47 | $18.11 |
| Income from Investment Operations | | | | | |
| Net investment income (loss)A | (.02) | .63 | .43 | .36 | .35 |
| Net realized and unrealized gain (loss) | (10.42) | 6.13 | (3.16) | 2.49 | 4.27 |
| Total from investment operations | (10.44) | 6.76 | (2.73) | 2.85 | 4.62 |
| Distributions from net investment income | (.53) | (.35) | (.23) | (.37) | (.26) |
| Total distributions | (.53) | (.35) | (.23) | (.37) | (.26) |
| Redemption fees added to paid in capitalA | – | – | –B | .01 | –B |
| Net asset value, end of period | $17.44 | $28.41 | $22.00 | $24.96 | $22.47 |
| Total ReturnC,D | (37.45)% | 31.26% | (11.04)% | 13.24% | 25.93% |
| Ratios to Average Net AssetsE,F | | | | | |
| Expenses before reductions | 1.62% | 1.64% | 1.66% | 1.66% | 1.68% |
| Expenses net of fee waivers, if any | 1.61% | 1.63% | 1.66% | 1.66% | 1.68% |
| Expenses net of all reductions | 1.59% | 1.63% | 1.63% | 1.66% | 1.68% |
| Net investment income (loss) | (.09)% | 2.54% | 1.80% | 1.62% | 1.86% |
| Supplemental Data | | | | | |
| Net assets, end of period (000 omitted) | $2,912 | $6,032 | $5,098 | $6,740 | $7,378 |
| Portfolio turnover rateG | 54% | 48% | 53% | 51% | 108% |
A Calculated based on average shares outstanding during the period.
B Amount represents less than $.005 per share.
C Total returns would have been lower if certain expenses had not been reduced during the applicable periods shown.
D Total returns do not include the effect of the sales charges.
E Fees and expenses of any underlying mutual funds or exchange-traded funds (ETFs) are not included in the Fund's expense ratio. The Fund indirectly bears its proportionate share of these expenses. For additional expense information related to investments in Fidelity Central Funds, please refer to the "Investments in Fidelity Central Funds" note found in the Notes to Financial Statements section of the most recent Annual or Semi-Annual report.
F Expense ratios reflect operating expenses of the class. Expenses before reductions do not reflect amounts reimbursed, waived, or reduced through arrangements with the investment adviser, brokerage services, or other offset arrangements, if applicable, and do not represent the amount paid by the class during periods when reimbursements, waivers or reductions occur.
G Amount does not include the portfolio activity of any underlying mutual funds or exchange-traded funds (ETFs).
See accompanying notes which are an integral part of the financial statements.
Fidelity Latin America Fund Class C
| Years ended October 31, | 2020 | 2019 | 2018 | 2017 | 2016 |
| Selected Per–Share Data | | | | | |
| Net asset value, beginning of period | $28.67 | $22.16 | $25.12 | $22.61 | $18.18 |
| Income from Investment Operations | | | | | |
| Net investment income (loss)A | (.13) | .51 | .32 | .26 | .26 |
| Net realized and unrealized gain (loss) | (10.56) | 6.21 | (3.18) | 2.52 | 4.30 |
| Total from investment operations | (10.69) | 6.72 | (2.86) | 2.78 | 4.56 |
| Distributions from net investment income | (.37) | (.21) | (.10) | (.28) | (.13) |
| Total distributions | (.37) | (.21) | (.10) | (.28) | (.13) |
| Redemption fees added to paid in capitalA | – | – | –B | .01 | –B |
| Net asset value, end of period | $17.61 | $28.67 | $22.16 | $25.12 | $22.61 |
| Total ReturnC,D | (37.78)% | 30.62% | (11.43)% | 12.71% | 25.31% |
| Ratios to Average Net AssetsE,F | | | | | |
| Expenses before reductions | 2.11% | 2.12% | 2.13% | 2.14% | 2.15% |
| Expenses net of fee waivers, if any | 2.11% | 2.12% | 2.13% | 2.14% | 2.14% |
| Expenses net of all reductions | 2.09% | 2.12% | 2.11% | 2.14% | 2.14% |
| Net investment income (loss) | (.58)% | 2.06% | 1.33% | 1.15% | 1.39% |
| Supplemental Data | | | | | |
| Net assets, end of period (000 omitted) | $810 | $3,438 | $3,498 | $5,094 | $6,590 |
| Portfolio turnover rateG | 54% | 48% | 53% | 51% | 108% |
A Calculated based on average shares outstanding during the period.
B Amount represents less than $.005 per share.
C Total returns would have been lower if certain expenses had not been reduced during the applicable periods shown.
D Total returns do not include the effect of the contingent deferred sales charge.
E Fees and expenses of any underlying mutual funds or exchange-traded funds (ETFs) are not included in the Fund's expense ratio. The Fund indirectly bears its proportionate share of these expenses. For additional expense information related to investments in Fidelity Central Funds, please refer to the "Investments in Fidelity Central Funds" note found in the Notes to Financial Statements section of the most recent Annual or Semi-Annual report.
F Expense ratios reflect operating expenses of the class. Expenses before reductions do not reflect amounts reimbursed, waived, or reduced through arrangements with the investment adviser, brokerage services, or other offset arrangements, if applicable, and do not represent the amount paid by the class during periods when reimbursements, waivers or reductions occur.
G Amount does not include the portfolio activity of any underlying mutual funds or exchange-traded funds (ETFs).
See accompanying notes which are an integral part of the financial statements.
Fidelity Latin America Fund
| Years ended October 31, | 2020 | 2019 | 2018 | 2017 | 2016 |
| Selected Per–Share Data | | | | | |
| Net asset value, beginning of period | $28.30 | $21.94 | $24.89 | $22.41 | $18.08 |
| Income from Investment Operations | | | | | |
| Net investment income (loss)A | .10 | .77 | .57 | .49 | .45 |
| Net realized and unrealized gain (loss) | (10.36) | 6.09 | (3.15) | 2.46 | 4.26 |
| Total from investment operations | (10.26) | 6.86 | (2.58) | 2.95 | 4.71 |
| Distributions from net investment income | (.68) | (.50) | (.37) | (.48) | (.38) |
| Total distributions | (.68) | (.50) | (.37) | (.48) | (.38) |
| Redemption fees added to paid in capitalA | – | – | –B | .01 | –B |
| Net asset value, end of period | $17.36 | $28.30 | $21.94 | $24.89 | $22.41 |
| Total ReturnC | (37.13)% | 32.06% | (10.50)% | 13.87% | 26.65% |
| Ratios to Average Net AssetsD,E | | | | | |
| Expenses before reductions | 1.05% | 1.05% | 1.07% | 1.09% | 1.14% |
| Expenses net of fee waivers, if any | 1.05% | 1.04% | 1.07% | 1.09% | 1.14% |
| Expenses net of all reductions | 1.03% | 1.04% | 1.05% | 1.09% | 1.13% |
| Net investment income (loss) | .48% | 3.13% | 2.39% | 2.19% | 2.40% |
| Supplemental Data | | | | | |
| Net assets, end of period (000 omitted) | $277,942 | $517,901 | $445,845 | $597,161 | $596,514 |
| Portfolio turnover rateF | 54% | 48% | 53% | 51% | 108% |
A Calculated based on average shares outstanding during the period.
B Amount represents less than $.005 per share.
C Total returns would have been lower if certain expenses had not been reduced during the applicable periods shown.
D Fees and expenses of any underlying mutual funds or exchange-traded funds (ETFs) are not included in the Fund's expense ratio. The Fund indirectly bears its proportionate share of these expenses. For additional expense information related to investments in Fidelity Central Funds, please refer to the "Investments in Fidelity Central Funds" note found in the Notes to Financial Statements section of the most recent Annual or Semi-Annual report.
E Expense ratios reflect operating expenses of the class. Expenses before reductions do not reflect amounts reimbursed, waived, or reduced through arrangements with the investment adviser, brokerage services, or other offset arrangements, if applicable, and do not represent the amount paid by the class during periods when reimbursements, waivers or reductions occur.
F Amount does not include the portfolio activity of any underlying mutual funds or exchange-traded funds (ETFs).
See accompanying notes which are an integral part of the financial statements.
Fidelity Latin America Fund Class I
| Years ended October 31, | 2020 | 2019 | 2018 | 2017 | 2016 |
| Selected Per–Share Data | | | | | |
| Net asset value, beginning of period | $28.28 | $21.92 | $24.88 | $22.40 | $18.08 |
| Income from Investment Operations | | | | | |
| Net investment income (loss)A | .12 | .78 | .59 | .51 | .46 |
| Net realized and unrealized gain (loss) | (10.34) | 6.08 | (3.15) | 2.45 | 4.26 |
| Total from investment operations | (10.22) | 6.86 | (2.56) | 2.96 | 4.72 |
| Distributions from net investment income | (.72) | (.50) | (.40) | (.49) | (.40) |
| Total distributions | (.72) | (.50) | (.40) | (.49) | (.40) |
| Redemption fees added to paid in capitalA | – | – | –B | .01 | –B |
| Net asset value, end of period | $17.34 | $28.28 | $21.92 | $24.88 | $22.40 |
| Total ReturnC | (37.07)% | 32.09% | (10.44)% | 13.94% | 26.77% |
| Ratios to Average Net AssetsD,E | | | | | |
| Expenses before reductions | .99% | 1.01% | 1.01% | 1.01% | 1.07% |
| Expenses net of fee waivers, if any | .99% | 1.00% | 1.01% | 1.01% | 1.07% |
| Expenses net of all reductions | .97% | 1.00% | .98% | 1.01% | 1.06% |
| Net investment income (loss) | .54% | 3.17% | 2.45% | 2.27% | 2.47% |
| Supplemental Data | | | | | |
| Net assets, end of period (000 omitted) | $3,508 | $7,124 | $4,546 | $8,600 | $3,825 |
| Portfolio turnover rateF | 54% | 48% | 53% | 51% | 108% |
A Calculated based on average shares outstanding during the period.
B Amount represents less than $.005 per share.
C Total returns would have been lower if certain expenses had not been reduced during the applicable periods shown.
D Fees and expenses of any underlying mutual funds or exchange-traded funds (ETFs) are not included in the Fund's expense ratio. The Fund indirectly bears its proportionate share of these expenses. For additional expense information related to investments in Fidelity Central Funds, please refer to the "Investments in Fidelity Central Funds" note found in the Notes to Financial Statements section of the most recent Annual or Semi-Annual report.
E Expense ratios reflect operating expenses of the class. Expenses before reductions do not reflect amounts reimbursed, waived, or reduced through arrangements with the investment adviser, brokerage services, or other offset arrangements, if applicable, and do not represent the amount paid by the class during periods when reimbursements, waivers or reductions occur.
F Amount does not include the portfolio activity of any underlying mutual funds or exchange-traded funds (ETFs).
See accompanying notes which are an integral part of the financial statements.
Fidelity Latin America Fund Class Z
| Years ended October 31, | 2020 | 2019 | 2018 A |
| Selected Per–Share Data | | | |
| Net asset value, beginning of period | $28.24 | $21.92 | $21.51 |
| Income from Investment Operations | | | |
| Net investment income (loss)B | .14 | .85 | (.01) |
| Net realized and unrealized gain (loss) | (10.32) | 6.03 | .42 |
| Total from investment operations | (10.18) | 6.88 | .41 |
| Distributions from net investment income | (.74) | (.56) | – |
| Total distributions | (.74) | (.56) | – |
| Net asset value, end of period | $17.32 | $28.24 | $21.92 |
| Total ReturnC,D | (37.00)% | 32.28% | 1.91% |
| Ratios to Average Net AssetsE,F | | | |
| Expenses before reductions | .86% | .86% | .95%G |
| Expenses net of fee waivers, if any | .86% | .86% | .95%G |
| Expenses net of all reductions | .84% | .86% | .93%G |
| Net investment income (loss) | .67% | 3.31% | (.37)%G |
| Supplemental Data | | | |
| Net assets, end of period (000 omitted) | $13,520 | $26,605 | $145 |
| Portfolio turnover rateH | 54% | 48% | 53% |
A For the period October 2, 2018 (commencement of sale of shares) to October 31, 2018.
B Calculated based on average shares outstanding during the period.
C Total returns for periods of less than one year are not annualized.
D Total returns would have been lower if certain expenses had not been reduced during the applicable periods shown.
E Fees and expenses of any underlying mutual funds or exchange-traded funds (ETFs) are not included in the Fund's expense ratio. The Fund indirectly bears its proportionate share of these expenses. For additional expense information related to investments in Fidelity Central Funds, please refer to the "Investments in Fidelity Central Funds" note found in the Notes to Financial Statements section of the most recent Annual or Semi-Annual report.
F Expense ratios reflect operating expenses of the class. Expenses before reductions do not reflect amounts reimbursed, waived, or reduced through arrangements with the investment adviser, brokerage services, or other offset arrangements, if applicable, and do not represent the amount paid by the class during periods when reimbursements, waivers or reductions occur.
G Annualized
H Amount does not include the portfolio activity of any underlying mutual funds or exchange-traded funds (ETFs).
See accompanying notes which are an integral part of the financial statements.
Notes to Financial Statements
For the period ended October 31, 2020
1. Organization.
Fidelity Latin America Fund (the Fund) is a non-diversified fund of Fidelity Investment Trust (the Trust) and is authorized to issue an unlimited number of shares. The Trust is registered under the Investment Company Act of 1940, as amended (the 1940 Act), as an open-end management investment company organized as a Massachusetts business trust. The Fund offers Class A, Class M, Class C, Latin America, Class I and Class Z shares, each of which has equal rights as to assets and voting privileges. Each class has exclusive voting rights with respect to matters that affect that class. Class C shares will automatically convert to Class A shares after a holding period of ten years from the initial date of purchase, with certain exceptions. The Fund's investments in emerging markets can be subject to social, economic, regulatory, and political uncertainties and can be extremely volatile.
Effective January 1, 2020:
Investment advisers Fidelity Investments Money Management, Inc., FMR Co., Inc., and Fidelity SelectCo, LLC, merged with and into Fidelity Management & Research Company. In connection with the merger transactions, the resulting, merged investment adviser was then redomiciled from Massachusetts to Delaware, changed its corporate structure from a corporation to a limited liability company, and changed its name to "Fidelity Management & Research Company LLC".
Broker-dealer Fidelity Distributors Corporation merged with and into Fidelity Investments Institutional Services Company, Inc. ("FIISC"). FIISC was then redomiciled from Massachusetts to Delaware, changed its corporate structure from a corporation to a limited liability company, and changed its name to "Fidelity Distributors Company LLC".
Fidelity Investments Institutional Operations Company, Inc. converted from a Massachusetts corporation to a Massachusetts LLC, and changed its name to "Fidelity Investments Institutional Operations Company LLC".
2. Investments in Fidelity Central Funds.
The Fund invests in Fidelity Central Funds, which are open-end investment companies generally available only to other investment companies and accounts managed by the investment adviser and its affiliates. The Fund's Schedule of Investments lists each of the Fidelity Central Funds held as of period end, if any, as an investment of the Fund, but does not include the underlying holdings of each Fidelity Central Fund. As an Investing Fund, the Fund indirectly bears its proportionate share of the expenses of the underlying Fidelity Central Funds.
The Money Market Central Funds seek preservation of capital and current income and are managed by the investment adviser. Annualized expenses of the Money Market Central Funds as of their most recent shareholder report date ranged from less than .005% to .01%.
A complete unaudited list of holdings for each Fidelity Central Fund is available upon request or at the Securities and Exchange Commission (the SEC) website at www.sec.gov. In addition, the financial statements of the Fidelity Central Funds, which are not covered by the Fund's Report of Independent Registered Public Accounting Firm, are available on the SEC website or upon request.
3. Significant Accounting Policies.
The Fund is an investment company and applies the accounting and reporting guidance of the Financial Accounting Standards Board (FASB) Accounting Standards Codification Topic 946 Financial Services – Investment Companies. The financial statements have been prepared in conformity with accounting principles generally accepted in the United States of America (GAAP), which require management to make certain estimates and assumptions at the date of the financial statements. Actual results could differ from those estimates. Subsequent events, if any, through the date that the financial statements were issued have been evaluated in the preparation of the financial statements. The following summarizes the significant accounting policies of the Fund:
Investment Valuation. Investments are valued as of 4:00 p.m. Eastern time on the last calendar day of the period. The Board of Trustees (the Board) has delegated the day to day responsibility for the valuation of the Fund's investments to the Fair Value Committee (the Committee) established by the Fund's investment adviser. In accordance with valuation policies and procedures approved by the Board, the Fund attempts to obtain prices from one or more third party pricing vendors or brokers to value its investments. When current market prices, quotations or currency exchange rates are not readily available or reliable, investments will be fair valued in good faith by the Committee, in accordance with procedures adopted by the Board. Factors used in determining fair value vary by investment type and may include market or investment specific events. The frequency with which these procedures are used cannot be predicted and they may be utilized to a significant extent. The Committee oversees the Fund's valuation policies and procedures and reports to the Board on the Committee's activities and fair value determinations. The Board monitors the appropriateness of the procedures used in valuing the Fund's investments and ratifies the fair value determinations of the Committee.
The Fund categorizes the inputs to valuation techniques used to value its investments into a disclosure hierarchy consisting of three levels as shown below:
- Level 1 – quoted prices in active markets for identical investments
- Level 2 – other significant observable inputs (including quoted prices for similar investments, interest rates, prepayment speeds, etc.)
- Level 3 – unobservable inputs (including the Fund's own assumptions based on the best information available)
Valuation techniques used to value the Fund's investments by major category are as follows:
Equity securities, including restricted securities, for which market quotations are readily available, are valued at the last reported sale price or official closing price as reported by a third party pricing vendor on the primary market or exchange on which they are traded and are categorized as Level 1 in the hierarchy. In the event there were no sales during the day or closing prices are not available, securities are valued at the last quoted bid price or may be valued using the last available price and are generally categorized as Level 2 in the hierarchy. For foreign equity securities, when market or security specific events arise, comparisons to the valuation of American Depositary Receipts (ADRs), futures contracts, Exchange-Traded Funds (ETFs) and certain indexes as well as quoted prices for similar securities may be used and would be categorized as Level 2 in the hierarchy. For equity securities, including restricted securities, where observable inputs are limited, assumptions about market activity and risk are used and these securities may be categorized as Level 3 in the hierarchy.
Investments in open-end mutual funds, including the Fidelity Central Funds, are valued at their closing net asset value (NAV) each business day and are categorized as Level 1 in the hierarchy.
Changes in valuation techniques may result in transfers in or out of an assigned level within the disclosure hierarchy. The aggregate value of investments by input level as of October 31, 2020 is included at the end of the Fund's Schedule of Investments.
Foreign Currency. Certain Funds may use foreign currency contracts to facilitate transactions in foreign-denominated securities. Gains and losses from these transactions may arise from changes in the value of the foreign currency or if the counterparties do not perform under the contracts' terms.
Foreign-denominated assets, including investment securities, and liabilities are translated into U.S. dollars at the exchange rates at period end. Purchases and sales of investment securities, income and dividends received, and expenses denominated in foreign currencies are translated into U.S. dollars at the exchange rate in effect on the transaction date.
The effects of exchange rate fluctuations on investments are included with the net realized and unrealized gain (loss) on investment securities. Other foreign currency transactions resulting in realized and unrealized gain (loss) are disclosed separately.
Investment Transactions and Income. For financial reporting purposes, the Fund's investment holdings and NAV include trades executed through the end of the last business day of the period. The NAV per share for processing shareholder transactions is calculated as of the close of business of the New York Stock Exchange (NYSE), normally 4:00 p.m. Eastern time and includes trades executed through the end of the prior business day. Gains and losses on securities sold are determined on the basis of identified cost and include proceeds received from litigation. Dividend income is recorded on the ex-dividend date, except for certain dividends from foreign securities where the ex-dividend date may have passed, which are recorded as soon as the Fund is informed of the ex-dividend date. Non-cash dividends included in dividend income, if any, are recorded at the fair market value of the securities received. Income and capital gain distributions from Fidelity Central Funds, if any, are recorded on the ex-dividend date. Certain distributions received by the Fund represent a return of capital or capital gain. The Fund determines the components of these distributions subsequent to the ex-dividend date, based upon receipt of tax filings or other correspondence relating to the underlying investment. These distributions are recorded as a reduction of cost of investments and/or as a realized gain. Investment income is recorded net of foreign taxes withheld where recovery of such taxes is uncertain.
Class Allocations and Expenses. Investment income, realized and unrealized capital gains and losses, common expenses of the Fund, and certain fund-level expense reductions, if any, are allocated daily on a pro-rata basis to each class based on the relative net assets of each class to the total net assets of the Fund. Each class differs with respect to transfer agent and distribution and service plan fees incurred. Certain expense reductions may also differ by class. For the reporting period, the allocated portion of income and expenses to each class as a percent of its average net assets may vary due to the timing of recording these transactions in relation to fluctuating net assets of the classes. Expenses directly attributable to a fund are charged to that fund. Expenses attributable to more than one fund are allocated among the respective funds on the basis of relative net assets or other appropriate methods. Expense estimates are accrued in the period to which they relate and adjustments are made when actual amounts are known.
Income Tax Information and Distributions to Shareholders. Each year, the Fund intends to qualify as a regulated investment company under Subchapter M of the Internal Revenue Code, including distributing substantially all of its taxable income and realized gains. As a result, no provision for U.S. Federal income taxes is required. As of October 31, 2020, the Fund did not have any unrecognized tax benefits in the financial statements; nor is the Fund aware of any tax positions for which it is reasonably possible that the total amounts of unrecognized tax benefits will significantly change in the next twelve months. The Fund files a U.S. federal tax return, in addition to state and local tax returns as required. The Fund's federal income tax returns are subject to examination by the Internal Revenue Service (IRS) for a period of three fiscal years after they are filed. State and local tax returns may be subject to examination for an additional fiscal year depending on the jurisdiction. Foreign taxes are provided for based on the Fund's understanding of the tax rules and rates that exist in the foreign markets in which it invests.
Distributions are declared and recorded on the ex-dividend date. Income and capital gain distributions are declared separately for each class. Income and capital gain distributions are determined in accordance with income tax regulations, which may differ from GAAP.
Capital accounts within the financial statements are adjusted for permanent book-tax differences. These adjustments have no impact on net assets or the results of operations. Capital accounts are not adjusted for temporary book-tax differences which will reverse in a subsequent period.
Book-tax differences are primarily due to foreign currency transactions, passive foreign investment companies (PFIC), capital loss carryforwards and losses deferred due to wash sales.
As of period end, the cost and unrealized appreciation (depreciation) in securities, and derivatives if applicable, for federal income tax purposes were as follows:
| Gross unrealized appreciation | $39,890,477 |
| Gross unrealized depreciation | (111,322,340) |
| Net unrealized appreciation (depreciation) | $(71,431,863) |
| Tax Cost | $400,825,550 |
The tax-based components of distributable earnings as of period end were as follows:
| Capital loss carryforward | $(38,986,386) |
| Net unrealized appreciation (depreciation) on securities and other investments | $(71,454,686) |
Capital loss carryforwards are only available to offset future capital gains of the Fund to the extent provided by regulations and may be limited. The capital loss carryforward information presented below, including any applicable limitation, is estimated as of fiscal period end and is subject to adjustment.
| No expiration | |
| Short-term | $(38,986,386) |
The tax character of distributions paid was as follows:
| | October 31, 2020 | October 31, 2019 |
| Ordinary Income | $13,930,227 | $ 10,500,914 |
Restricted Securities (including Private Placements). The Fund may invest in securities that are subject to legal or contractual restrictions on resale. These securities generally may be resold in transactions exempt from registration or to the public if the securities are registered. Disposal of these securities may involve time-consuming negotiations and expense, and prompt sale at an acceptable price may be difficult. Information regarding restricted securities is included at the end of the Fund's Schedule of Investments.
4. Purchases and Sales of Investments.
Purchases and sales of securities, other than short-term securities, are noted in the table below.
| | Purchases ($) | Sales ($) |
| Fidelity Latin America Fund | 226,955,298 | 282,732,770 |
5. Fees and Other Transactions with Affiliates.
Management Fee. Fidelity Management & Research Company LLC (the investment adviser) and its affiliates provide the Fund with investment management related services for which the Fund pays a monthly management fee. The management fee is the sum of an individual fund fee rate that is based on an annual rate of .45% of the Fund's average net assets and an annualized group fee rate that averaged .23% during the period. The group fee rate is based upon the monthly average net assets of a group of registered investment companies with which the investment adviser has management contracts. The group fee rate decreases as assets under management increase and increases as assets under management decrease. For the reporting period, the total annual management fee rate was .69% of the Fund's average net assets.
Distribution and Service Plan Fees. In accordance with Rule 12b-1 of the 1940 Act, the Fund has adopted separate Distribution and Service Plans for each class of shares. Certain classes pay Fidelity Distributors Company LLC (FDC), an affiliate of the investment adviser, separate Distribution and Service Fees, each of which is based on an annual percentage of each class' average net assets. In addition, FDC may pay financial intermediaries for selling shares of the Fund and providing shareholder support services. For the period, the Distribution and Service Fee rates, total fees and amounts retained by FDC were as follows:
| | Distribution Fee | Service Fee | Total Fees | Retained by FDC |
| Class A | -% | .25% | $31,526 | $463 |
| Class M | .25% | .25% | 20,820 | 443 |
| Class C | .75% | .25% | 18,188 | 1,753 |
| | | | $70,534 | $2,659 |
Sales Load. FDC may receive a front-end sales charge of up to 5.75% for selling Class A shares and 3.50% for selling Class M shares, some of which is paid to financial intermediaries for selling shares of the Fund. Depending on the holding period, FDC may receive contingent deferred sales charges levied on Class A, Class M and Class C redemptions. The deferred sales charges are 1.00% for Class C shares, 1.00% for certain purchases of Class A shares and .25% for certain purchases of Class M shares.
For the period, sales charge amounts retained by FDC were as follows:
| | Retained by FDC |
| Class A | $1,755 |
| Class M | 510 |
| Class C(a) | 881 |
| | $3,146 |
(a) When Class C shares are initially sold, FDC pays commissions from its own resources to financial intermediaries through which the sales are made.
Transfer Agent Fees. Fidelity Investments Institutional Operations Company LLC (FIIOC), an affiliate of the investment adviser, is the transfer, dividend disbursing and shareholder servicing agent for each class of the Fund. FIIOC receives account fees and asset-based fees that vary according to the account size and type of account of the shareholders of the respective classes of the Fund, except for Class Z. FIIOC receives an asset-based fee of Class Z's average net assets. FIIOC pays for typesetting, printing and mailing of shareholder reports, except proxy statements. Effective February 1, 2020, the Board approved to change the fee for Class Z from .046% to .044%.
For the period, transfer agent fees for each class were as follows:
| | Amount | % of Class-Level Average Net Assets |
| Class A | $36,051 | .29 |
| Class M | 12,287 | .30 |
| Class C | 5,162 | .29 |
| Latin America | 906,519 | .24 |
| Class I | 11,938 | .18 |
| Class Z | 8,126 | .04 |
| | $980,083 | |
Accounting Fees. Fidelity Service Company, Inc. (FSC), an affiliate of the investment adviser, maintains the Fund's accounting records. The accounting fee is based on the level of average net assets for each month. For the period, the fees were equivalent to the following annual rates:
| | % of Average Net Assets |
| Fidelity Latin America Fund | .05 |
Brokerage Commissions. A portion of portfolio transactions were placed with brokerage firms which are affiliates of the investment adviser. Brokerage commissions are included in net realized gain (loss) and change in net unrealized appreciation (depreciation) in the Statement of Operations. The commissions paid to these affiliated firms were as follows:
| | Amount |
| Fidelity Latin America Fund | $1,826 |
Interfund Trades. Funds may purchase from or sell securities to other Fidelity Funds under procedures adopted by the Board. The procedures have been designed to ensure these interfund trades are executed in accordance with Rule 17a-7 of the 1940 Act. Interfund trades are included within the respective purchases and sales amounts shown in the Purchases and Sales of Investments note.
6. Committed Line of Credit.
Certain Funds participate with other funds managed by the investment adviser or an affiliate in a $4.25 billion credit facility (the "line of credit") to be utilized for temporary or emergency purposes to fund shareholder redemptions or for other short-term liquidity purposes. The participating funds have agreed to pay commitment fees on their pro-rata portion of the line of credit, which are reflected in Miscellaneous expenses on the Statement of Operations, and are as follows:
| | Amount |
| Fidelity Latin America Fund | $1,065 |
During the period, there were no borrowings on this line of credit.
7. Security Lending.
Funds lend portfolio securities from time to time in order to earn additional income. Lending agents are used, including National Financial Services (NFS), an affiliate of the investment adviser. Pursuant to a securities lending agreement, NFS will receive a fee, which is capped at 9.9% of a fund's daily lending revenue, for its services as lending agent. A fund may lend securities to certain qualified borrowers, including NFS. On the settlement date of the loan, a fund receives collateral (in the form of U.S. Treasury obligations, letters of credit and/or cash) against the loaned securities and maintains collateral in an amount not less than 100% of the market value of the loaned securities during the period of the loan. The market value of the loaned securities is determined at the close of business of a fund and any additional required collateral is delivered to a fund on the next business day. A fund or borrower may terminate the loan at any time, and if the borrower defaults on its obligation to return the securities loaned because of insolvency or other reasons, a fund may apply collateral received from the borrower against the obligation. A fund may experience delays and costs in recovering the securities loaned. Any cash collateral received is invested in the Fidelity Securities Lending Cash Central Fund. Any loaned securities are identified as such in the Schedule of Investments, and the value of loaned securities and cash collateral at period end, as applicable, are presented in the Statement of Assets and Liabilities. Security lending income represents the income earned on investing cash collateral, less rebates paid to borrowers and any lending agent fees associated with the loan, plus any premium payments received for lending certain types of securities. Security lending income is presented in the Statement of Operations as a component of income from Fidelity Central Funds. Affiliated security lending activity, if any, was as follows:
| | Total Security Lending Income Fees Paid to NFS | Security Lending Income From Securities Loaned to NFS | Value of Securities Loaned to NFS at Period End |
| Fidelity Latin America Fund | $8,232 | $– | $– |
8. Expense Reductions.
Commissions paid to certain brokers with whom the investment adviser, or its affiliates, places trades on behalf of the Fund include an amount in addition to trade execution, which may be rebated back to the Fund to offset certain expenses. This amount totaled $85,579 for the period.
In addition, during the period the investment adviser or an affiliate reimbursed and/or waived a portion of fund-level operating expenses in the amount of $2,351.
In addition, during the period the investment adviser or an affiliate reimbursed the Fund $5,500 for an operational error which is included in the accompanying Statement of Operations.
9. Distributions to Shareholders.
Distributions to shareholders of each class were as follows:
| | Year ended
October 31, 2020 | Year ended
October 31, 2019 |
| Distributions to shareholders | | |
| Class A | $377,476 | $268,347 |
| Class M | 110,623 | 80,020 |
| Class C | 43,517 | 31,875 |
| Latin America | 12,445,183 | 10,028,288 |
| Class I | 292,870 | 87,883 |
| Class Z | 660,558 | 4,501 |
| Total | $13,930,227 | $10,500,914 |
10. Share Transactions.
Share transactions for each class were as follows and may contain automatic conversions between classes or exchanges between affiliated funds:
| | Shares | Shares | Dollars | Dollars |
| | Year ended October 31, 2020 | Year ended October 31, 2019 | Year ended October 31, 2020 | Year ended October 31, 2019 |
| Class A | | | | |
| Shares sold | 58,793 | 190,162 | $1,227,367 | $4,542,667 |
| Reinvestment of distributions | 13,321 | 12,291 | 367,553 | 261,098 |
| Shares redeemed | (180,467) | (213,594) | (3,825,749) | (5,187,663) |
| Net increase (decrease) | (108,353) | (11,141) | $(2,230,829) | $(383,898) |
| Class M | | | | |
| Shares sold | 10,639 | 28,150 | $235,009 | $685,184 |
| Reinvestment of distributions | 3,964 | 3,725 | 109,913 | 79,471 |
| Shares redeemed | (59,887) | (51,275) | (1,237,441) | (1,242,844) |
| Net increase (decrease) | (45,284) | (19,400) | $(892,519) | $(478,189) |
| Class C | | | | |
| Shares sold | 9,815 | 66,110 | $242,018 | $1,652,333 |
| Reinvestment of distributions | 1,420 | 1,372 | 40,064 | 29,690 |
| Shares redeemed | (85,138) | (105,422) | (2,000,990) | (2,560,121) |
| Net increase (decrease) | (73,903) | (37,940) | $(1,718,908) | $(878,098) |
| Latin America | | | | |
| Shares sold | 4,448,914 | 4,153,117 | $97,253,119 | $98,919,671 |
| Reinvestment of distributions | 404,088 | 450,184 | 11,085,949 | 9,512,373 |
| Shares redeemed | (7,144,685) | (6,619,628) | (149,090,348) | (162,591,256) |
| Net increase (decrease) | (2,291,683) | (2,016,327) | $(40,751,280) | $(54,159,212) |
| Class I | | | | |
| Shares sold | 476,368 | 150,061 | $12,550,386 | $3,880,633 |
| Reinvestment of distributions | 10,595 | 4,028 | 290,124 | 85,022 |
| Shares redeemed | (536,551) | (109,553) | (11,981,884) | (2,603,516) |
| Net increase (decrease) | (49,588) | 44,536 | $858,626 | $1,362,139 |
| Class Z | | | | |
| Shares sold | 436,475 | 1,000,685 | $8,485,713 | $26,118,988 |
| Reinvestment of distributions | 24,183 | 198 | 660,494 | 4,168 |
| Shares redeemed | (622,264) | (65,246) | (13,158,753) | (1,687,845) |
| Net increase (decrease) | (161,606) | 935,637 | $(4,012,546) | $24,435,311 |
11. Other.
The Fund's organizational documents provide former and current trustees and officers with a limited indemnification against liabilities arising in connection with the performance of their duties to the Fund. In the normal course of business, the Fund may also enter into contracts that provide general indemnifications. The Fund's maximum exposure under these arrangements is unknown as this would be dependent on future claims that may be made against the Fund. The risk of material loss from such claims is considered remote.
12. Coronavirus (COVID-19) Pandemic.
An outbreak of COVID-19 first detected in China during December 2019 has since spread globally and was declared a pandemic by the World Health Organization during March 2020. Developments that disrupt global economies and financial markets, such as the COVID-19 pandemic, may magnify factors that affect the Fund's performance.
Fidelity® Nordic Fund
Performance: The Bottom Line
Average annual total return reflects the change in the value of an investment, assuming reinvestment of distributions from dividend income and capital gains (the profits earned upon the sale of securities that have grown in value, if any) and assuming a constant rate of performance each year. The hypothetical investment and the average annual total returns do not reflect the deduction of taxes that a shareholder would pay on fund distributions or the redemption of fund shares. During periods of reimbursement by Fidelity, a fund’s total return will be greater than it would be had the reimbursement not occurred. How a fund did yesterday is no guarantee of how it will do tomorrow.
Average Annual Total Returns
| For the periods ended October 31, 2020 | Past 1 year | Past 5 years | Past 10 years |
| Fidelity® Nordic Fund | 26.73% | 9.33% | 9.30% |
$10,000 Over 10 Years
Let's say hypothetically that $10,000 was invested in Fidelity® Nordic Fund on October 31, 2010.
The chart shows how the value of your investment would have changed, and also shows how the FTSE® Capped Nordic Index performed over the same period.
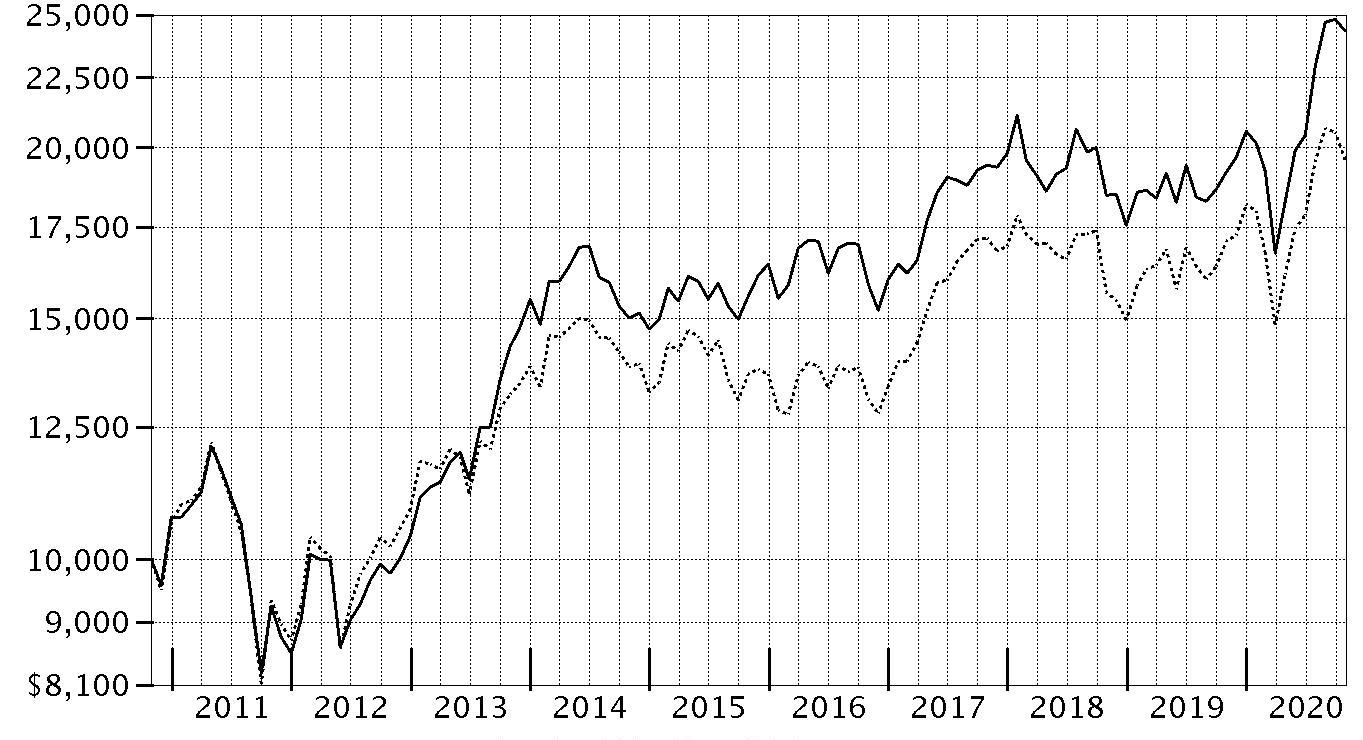
| Period Ending Values |
| $24,332 | Fidelity® Nordic Fund |
| $19,581 | FTSE® Capped Nordic Index |
Fidelity® Nordic Fund
Management's Discussion of Fund Performance
Market Recap: The MSCI ACWI (All Country World Index) ex USA Index returned -2.46% for the 12 months ending October 31, 2020, in what was a bumpy ride for non-U.S. equities, marked by a steep but brief decline due to the early-2020 outbreak and spread of the coronavirus, followed by a sharp upturn. Declared a pandemic on March 11, the crisis and containment efforts caused broad contraction in economic activity, elevated volatility and dislocation in financial markets. A historically rapid and expansive monetary- and fiscal-policy response around the world provided a partial offset to the economic disruption. Other supporting factors included resilient corporate earnings and near-term potential for a COVID-19 vaccine breakthrough. This was evident in the index’s 12.28% gain in the final six months of the year. Currency fluctuation generally boosted foreign developed-markets equities for the year, while the reverse was true for emerging-markets stocks. Late in the period, the index was pressured by a second wave of COVID-19 cases in some regions, and stretched valuations and crowded positioning in big tech. For the full year, the U.K. (-22%), Asia Pacific ex Japan (-8%), Canada (-5%) and Europe ex U.K. (-4%) notably lagged. Emerging markets (+9%) and Japan (+1%) outperformed. By sector, energy (-38%), financials and real estate (-20% each) lagged, whereas information technology (+ 25%) and communication services (+15%) topped the index.
Comments from Portfolio Manager Andrew Sergeant: For the fiscal year ending October 31, 2020, the fund gained 26.73%, outperforming the 14.68% result of the benchmark FTSE Capped Nordic Index. Versus the benchmark, security selection was the primary contributor, especially within the food, beverage & tobacco area of the consumer staples sector. Security selection and an underweighting in communication services and stock picks in industrials also boosted the fund's relative result. Our top individual relative contributor was an out-of-benchmark stake in Kambi Group (+97%). Also lifting performance was our outsized stake in Vestas Wind Systems, which gained 111%. Vestas Wind Systems was among our biggest holdings. The fund's non-benchmark stake in AddLife gained 169%. Conversely, the primary detractor from performance versus the benchmark was our security selection in energy. Our largest individual relative detractor was an out-of-benchmark stake in Dustin Group (-17%). Another notable relative detractor was an overweighting in UPM Kymmene (-9%), which was among the fund's biggest holdings the past 12 months.
The views expressed above reflect those of the portfolio manager(s) only through the end of the period as stated on the cover of this report and do not necessarily represent the views of Fidelity or any other person in the Fidelity organization. Any such views are subject to change at any time based upon market or other conditions and Fidelity disclaims any responsibility to update such views. These views may not be relied on as investment advice and, because investment decisions for a Fidelity fund are based on numerous factors, may not be relied on as an indication of trading intent on behalf of any Fidelity fund.
Fidelity® Nordic Fund
Investment Summary (Unaudited)
Geographic Diversification (% of fund's net assets)
| As of October 31, 2020 |
| | Sweden | 40.9% |
| | Denmark | 26.5% |
| | Finland | 13.7% |
| | Norway | 9.3% |
| | United States of America* | 6.7% |
| | Malta | 2.9% |

* Includes Short-Term investments and Net Other Assets (Liabilities).
Percentages are based on country or territory of incorporation and are adjusted for the effect of futures contracts, if applicable.
Asset Allocation as of October 31, 2020
| | % of fund's net assets |
| Stocks | 94.7 |
| Short-Term Investments and Net Other Assets (Liabilities) | 5.3 |
Top Ten Stocks as of October 31, 2020
| | % of fund's net assets |
| Novo Nordisk A/S Series B (Denmark, Pharmaceuticals) | 9.1 |
| Ericsson (B Shares) (Sweden, Communications Equipment) | 5.7 |
| ORSTED A/S (Denmark, Electric Utilities) | 4.7 |
| Swedbank AB (A Shares) (Sweden, Banks) | 4.3 |
| Vestas Wind Systems A/S (Denmark, Electrical Equipment) | 4.1 |
| DSV Panalpina A/S (Denmark, Air Freight & Logistics) | 4.1 |
| Volvo AB (B Shares) (Sweden, Machinery) | 3.7 |
| Kone OYJ (B Shares) (Finland, Machinery) | 3.6 |
| Swedish Match Co. AB (Sweden, Tobacco) | 3.5 |
| Investor AB (B Shares) (Sweden, Diversified Financial Services) | 3.3 |
| | 46.1 |
Top Market Sectors as of October 31, 2020
| | % of fund's net assets |
| Industrials | 28.1 |
| Health Care | 13.5 |
| Financials | 12.7 |
| Consumer Discretionary | 9.5 |
| Consumer Staples | 6.8 |
| Information Technology | 6.6 |
| Materials | 5.4 |
| Utilities | 4.7 |
| Communication Services | 3.5 |
| Energy | 2.3 |
Market Sectors may include more than one industry category.
The Fund may invest up to 35% of its total assets in any industry that represents more than 20% of the Nordic market. As of October 31, 2020, the Fund did not have more than 25% of its total assets invested in any one industry.
Fidelity® Nordic Fund
Schedule of Investments October 31, 2020
Showing Percentage of Net Assets
| Common Stocks - 94.7% | | | |
| | | Shares | Value |
| Denmark - 26.5% | | | |
| A.P. Moller - Maersk A/S Series B | | 4,474 | $7,170,187 |
| DSV Panalpina A/S | | 76,100 | 12,322,200 |
| GN Store Nord A/S | | 90,500 | 6,508,581 |
| Novo Nordisk A/S Series B | | 429,300 | 27,374,595 |
| ORSTED A/S (a) | | 88,888 | 14,107,772 |
| Vestas Wind Systems A/S | | 72,700 | 12,472,704 |
|
| TOTAL DENMARK | | | 79,956,039 |
|
| Finland - 13.7% | | | |
| Kone OYJ (B Shares) | | 136,000 | 10,824,537 |
| Nanoform Finland PLC | | 331,900 | 1,584,071 |
| Nokian Tyres PLC (b) | | 322,800 | 9,921,295 |
| Olvi PLC (A Shares) | | 187,187 | 9,788,529 |
| UPM-Kymmene Corp. | | 323,400 | 9,137,476 |
|
| TOTAL FINLAND | | | 41,255,908 |
|
| Malta - 2.9% | | | |
| Kambi Group PLC (c) | | 265,588 | 8,625,700 |
| Norway - 9.3% | | | |
| DNB ASA | | 381,300 | 5,140,370 |
| Entra ASA (a) | | 207,200 | 2,704,312 |
| Equinor ASA | | 399,200 | 5,070,156 |
| Kongsberg Gruppen ASA (b) | | 335,000 | 5,425,044 |
| Schibsted ASA (B Shares) | | 168,350 | 6,041,565 |
| Skandiabanken ASA (a) | | 285,131 | 1,806,961 |
| TGS Nopec Geophysical Co. ASA | | 200,900 | 1,851,875 |
|
| TOTAL NORWAY | | | 28,040,283 |
|
| Sweden - 40.9% | | | |
| Addlife AB | | 363,084 | 5,460,296 |
| Dustin Group AB (a) | | 907,400 | 5,771,694 |
| Eltel AB (a)(b)(c) | | 1,937,623 | 4,507,417 |
| Ericsson (B Shares) | | 1,528,400 | 17,063,845 |
| HEXPOL AB (B Shares) | | 808,770 | 7,125,727 |
| Investor AB (B Shares) | | 167,250 | 10,044,323 |
| INVISIO AB | | 260,000 | 4,686,685 |
| John Mattson Fastighetsforetag (c) | | 120,731 | 2,032,444 |
| Lagercrantz Group AB (B Shares) | | 451,653 | 2,783,495 |
| Momentum Group AB Class B (c) | | 281,969 | 3,884,901 |
| Nibe Industrier AB (B Shares) | | 196,400 | 4,736,519 |
| Securitas AB (B Shares) | | 544,700 | 7,709,809 |
| Stillfront Group AB (c) | | 38,000 | 4,458,330 |
| Swedbank AB (A Shares) (c) | | 829,699 | 13,007,171 |
| Swedish Match Co. AB | | 139,200 | 10,490,371 |
| VNV Global AB (c) | | 935,496 | 8,116,099 |
| VNV Global AB warrants 8/10/23 (c) | | 162,854 | 193,996 |
| Volvo AB (B Shares) | | 570,000 | 11,091,376 |
|
| TOTAL SWEDEN | | | 123,164,498 |
|
| United States of America - 1.4% | | | |
| Autoliv, Inc. (depositary receipt) | | 57,200 | 4,336,411 |
| TOTAL COMMON STOCKS | | | |
| (Cost $232,157,255) | | | 285,378,839 |
|
| Money Market Funds - 9.7% | | | |
| Fidelity Cash Central Fund 0.10% (d) | | 16,850,291 | 16,853,661 |
| Fidelity Securities Lending Cash Central Fund 0.11% (d)(e) | | 12,354,661 | 12,355,896 |
| TOTAL MONEY MARKET FUNDS | | | |
| (Cost $29,209,557) | | | 29,209,557 |
| TOTAL INVESTMENT IN SECURITIES - 104.4% | | | |
| (Cost $261,366,812) | | | 314,588,396 |
| NET OTHER ASSETS (LIABILITIES) - (4.4)% | | | (13,164,756) |
| NET ASSETS - 100% | | | $301,423,640 |
Categorizations in the Schedule of Investments are based on country or territory of incorporation.
Legend
(a) Security exempt from registration under Rule 144A of the Securities Act of 1933. These securities may be resold in transactions exempt from registration, normally to qualified institutional buyers. At the end of the period, the value of these securities amounted to $28,898,156 or 9.6% of net assets.
(b) Security or a portion of the security is on loan at period end.
(c) Non-income producing
(d) Affiliated fund that is generally available only to investment companies and other accounts managed by Fidelity Investments. The rate quoted is the annualized seven-day yield of the fund at period end. A complete unaudited listing of the fund's holdings as of its most recent quarter end is available upon request. In addition, each Fidelity Central Fund's financial statements, which are not covered by the Fund's Report of Independent Registered Public Accounting Firm, are available on the SEC's website or upon request.
(e) Investment made with cash collateral received from securities on loan.
Affiliated Central Funds
Information regarding fiscal year to date income earned by the Fund from investments in Fidelity Central Funds is as follows:
| Fund | Income earned |
| Fidelity Cash Central Fund | $20,103 |
| Fidelity Securities Lending Cash Central Fund | 99,855 |
| Total | $119,958 |
Amounts in the income column in the above table include any capital gain distributions from underlying funds, which are presented in the corresponding line-item in the Statement of Operations, if applicable. Amount for Fidelity Securities Lending Cash Central Fund represents the income earned on investing cash collateral, less rebates paid to borrowers and any lending agent fees associated with the loan, plus any premium payments received for lending certain types of securities.
The value, beginning of period, for the Fidelity Cash Central Fund was $2,849,470. Net realized gain (loss) and change in net unrealized appreciation (depreciation) on Fidelity Cash Central Fund is presented in the Statement of Operations, if applicable. Purchases and sales of the Fidelity Cash Central Fund were $68,673,281 and $54,668,853, respectively, during the period.
Investment Valuation
The following is a summary of the inputs used, as of October 31, 2020, involving the Fund's assets and liabilities carried at fair value. The inputs or methodology used for valuing securities may not be an indication of the risk associated with investing in those securities. For more information on valuation inputs, and their aggregation into the levels used below, please refer to the Investment Valuation section in the accompanying Notes to Financial Statements.
| | Valuation Inputs at Reporting Date: |
| Description | Total | Level 1 | Level 2 | Level 3 |
| Investments in Securities: | | | | |
| Equities: | | | | |
| Communication Services | $10,499,895 | $10,499,895 | $-- | $-- |
| Consumer Discretionary | 28,655,100 | 28,655,100 | -- | -- |
| Consumer Staples | 20,278,900 | 20,278,900 | -- | -- |
| Energy | 6,922,031 | 6,922,031 | -- | -- |
| Financials | 38,308,920 | 38,308,920 | -- | -- |
| Health Care | 40,927,543 | 13,552,948 | 27,374,595 | -- |
| Industrials | 84,831,379 | 65,188,488 | 19,642,891 | -- |
| Information Technology | 19,847,340 | 2,783,495 | 17,063,845 | -- |
| Materials | 16,263,203 | 16,263,203 | -- | -- |
| Real Estate | 4,736,756 | 4,736,756 | -- | -- |
| Utilities | 14,107,772 | 14,107,772 | -- | -- |
| Money Market Funds | 29,209,557 | 29,209,557 | -- | -- |
| Total Investments in Securities: | $314,588,396 | $250,507,065 | $64,081,331 | $-- |
See accompanying notes which are an integral part of the financial statements.
Fidelity® Nordic Fund
Financial Statements
Statement of Assets and Liabilities
| | | October 31, 2020 |
| Assets | | |
Investment in securities, at value (including securities loaned of $12,137,288) — See accompanying schedule:
Unaffiliated issuers (cost $232,157,255) | $285,378,839 | |
| Fidelity Central Funds (cost $29,209,557) | 29,209,557 | |
| Total Investment in Securities (cost $261,366,812) | | $314,588,396 |
| Receivable for investments sold | | 239,662 |
| Receivable for fund shares sold | | 488,131 |
| Dividends receivable | | 576,414 |
| Distributions receivable from Fidelity Central Funds | | 2,901 |
| Prepaid expenses | | 446 |
| Other receivables | | 12 |
| Total assets | | 315,895,962 |
| Liabilities | | |
| Payable to custodian bank | $9 | |
| Payable for investments purchased | 1,518,466 | |
| Payable for fund shares redeemed | 306,896 | |
| Accrued management fee | 177,188 | |
| Other affiliated payables | 55,191 | |
| Other payables and accrued expenses | 58,676 | |
| Collateral on securities loaned | 12,355,896 | |
| Total liabilities | | 14,472,322 |
| Net Assets | | $301,423,640 |
| Net Assets consist of: | | |
| Paid in capital | | $245,184,045 |
| Total accumulated earnings (loss) | | 56,239,595 |
| Net Assets | | $301,423,640 |
| Net Asset Value, offering price and redemption price per share ($301,423,640 ÷ 5,333,871 shares) | | $56.51 |
See accompanying notes which are an integral part of the financial statements.
Statement of Operations
| | | Year ended October 31, 2020 |
| Investment Income | | |
| Dividends | | $3,810,513 |
| Income from Fidelity Central Funds (including $99,855 from security lending) | | 119,958 |
| Income before foreign taxes withheld | | 3,930,471 |
| Less foreign taxes withheld | | (599,694) |
| Total income | | 3,330,777 |
| Expenses | | |
| Management fee | $1,794,214 | |
| Transfer agent fees | 470,702 | |
| Accounting fees | 136,361 | |
| Custodian fees and expenses | 25,313 | |
| Independent trustees' fees and expenses | 1,468 | |
| Registration fees | 22,072 | |
| Audit | 73,067 | |
| Legal | 1,407 | |
| Miscellaneous | 5,977 | |
| Total expenses before reductions | 2,530,581 | |
| Expense reductions | (14,805) | |
| Total expenses after reductions | | 2,515,776 |
| Net investment income (loss) | | 815,001 |
| Realized and Unrealized Gain (Loss) | | |
| Net realized gain (loss) on: | | |
| Investment securities: | | |
| Unaffiliated issuers | 7,539,338 | |
| Fidelity Central Funds | (1,238) | |
| Foreign currency transactions | 105,655 | |
| Total net realized gain (loss) | | 7,643,755 |
| Change in net unrealized appreciation (depreciation) on: | | |
| Investment securities: | | |
| Unaffiliated issuers | 52,849,043 | |
| Fidelity Central Funds | 111 | |
| Assets and liabilities in foreign currencies | 36,439 | |
| Total change in net unrealized appreciation (depreciation) | | 52,885,593 |
| Net gain (loss) | | 60,529,348 |
| Net increase (decrease) in net assets resulting from operations | | $61,344,349 |
See accompanying notes which are an integral part of the financial statements.
Statement of Changes in Net Assets
| | Year ended October 31, 2020 | Year ended October 31, 2019 |
| Increase (Decrease) in Net Assets | | |
| Operations | | |
| Net investment income (loss) | $815,001 | $8,850,311 |
| Net realized gain (loss) | 7,643,755 | 3,914,483 |
| Change in net unrealized appreciation (depreciation) | 52,885,593 | (2,260,924) |
| Net increase (decrease) in net assets resulting from operations | 61,344,349 | 10,503,870 |
| Distributions to shareholders | (12,119,885) | (26,423,359) |
| Share transactions | | |
| Proceeds from sales of shares | 30,960,753 | 21,795,602 |
| Reinvestment of distributions | 11,280,829 | 24,699,755 |
| Cost of shares redeemed | (51,938,088) | (58,864,048) |
| Net increase (decrease) in net assets resulting from share transactions | (9,696,506) | (12,368,691) |
| Total increase (decrease) in net assets | 39,527,958 | (28,288,180) |
| Net Assets | | |
| Beginning of period | 261,895,682 | 290,183,862 |
| End of period | $301,423,640 | $261,895,682 |
| Other Information | | |
| Shares | | |
| Sold | 579,201 | 481,565 |
| Issued in reinvestment of distributions | 242,286 | 565,212 |
| Redeemed | (1,096,848) | (1,283,144) |
| Net increase (decrease) | (275,361) | (236,367) |
See accompanying notes which are an integral part of the financial statements.
Financial Highlights
Fidelity Nordic Fund
| | | | | | |
| Years ended October 31, | 2020 | 2019 | 2018 | 2017 | 2016 |
| Selected Per–Share Data | | | | | |
| Net asset value, beginning of period | $46.69 | $49.64 | $54.34 | $45.28 | $44.99 |
| Income from Investment Operations | | | | | |
| Net investment income (loss)A | .15 | 1.50B | .47 | .51 | .64 |
| Net realized and unrealized gain (loss) | 11.86 | .15 | (3.01) | 9.32 | .27 |
| Total from investment operations | 12.01 | 1.65 | (2.54) | 9.83 | .91 |
| Distributions from net investment income | (1.60) | (.05) | (.50) | (.65) | (.57) |
| Distributions from net realized gain | (.59) | (4.55) | (1.67) | (.12) | (.05) |
| Total distributions | (2.19) | (4.60) | (2.17) | (.77) | (.62) |
| Redemption fees added to paid in capitalA | – | – | .01 | –C | –C |
| Net asset value, end of period | $56.51 | $46.69 | $49.64 | $54.34 | $45.28 |
| Total ReturnD | 26.73% | 3.96% | (4.80)% | 22.14% | 1.97% |
| Ratios to Average Net AssetsE,F | | | | | |
| Expenses before reductions | .96% | .98% | .98% | .99% | .99% |
| Expenses net of fee waivers, if any | .96% | .98% | .97% | .99% | .98% |
| Expenses net of all reductions | .96% | .96% | .97% | .96% | .98% |
| Net investment income (loss) | .31% | 3.28%B | .89% | 1.04% | 1.37% |
| Supplemental Data | | | | | |
| Net assets, end of period (000 omitted) | $301,424 | $261,896 | $290,184 | $376,747 | $430,020 |
| Portfolio turnover rateG | 29% | 34% | 56% | 69% | 63% |
A Calculated based on average shares outstanding during the period.
B Net investment income per share reflects one or more large, non-recurring dividend(s) which amounted to $.82 per share. Excluding such non-recurring dividend(s), the ratio of net investment income(loss) to average net assets would have been 1.50%
C Amount represents less than $.005 per share.
D Total returns would have been lower if certain expenses had not been reduced during the applicable periods shown.
E Fees and expenses of any underlying mutual funds or exchange-traded funds (ETFs) are not included in the Fund's expense ratio. The Fund indirectly bears its proportionate share of these expenses. For additional expense information related to investments in Fidelity Central Funds, please refer to the "Investments in Fidelity Central Funds" note found in the Notes to Financial Statements section of the most recent Annual or Semi-Annual report.
F Expense ratios reflect operating expenses of the class. Expenses before reductions do not reflect amounts reimbursed, waived, or reduced through arrangements with the investment advisor, brokerage services, or other offset arrangements, if applicable, and do not represent the amount paid by the class during periods when reimbursements, waivers or reductions occur.
G Amount does not include the portfolio activity of any underlying mutual funds or exchange-traded funds (ETFs).
See accompanying notes which are an integral part of the financial statements.
Notes to Financial Statements
For the period ended October 31, 2020
1. Organization.
Fidelity Nordic Fund (the Fund) is a fund of Fidelity Investment Trust (the Trust) and is authorized to issue an unlimited number of shares. Share transactions on the Statement of Changes in Net Assets may contain exchanges between affiliated funds. The Trust is registered under the Investment Company Act of 1940, as amended (the 1940 Act), as an open-end management investment company organized as a Massachusetts business trust.
Effective January 1, 2020:
Investment advisers Fidelity Investments Money Management, Inc., FMR Co., Inc., and Fidelity SelectCo, LLC, merged with and into Fidelity Management & Research Company. In connection with the merger transactions, the resulting, merged investment adviser was then redomiciled from Massachusetts to Delaware, changed its corporate structure from a corporation to a limited liability company, and changed its name to "Fidelity Management & Research Company LLC".
Fidelity Investments Institutional Operations Company, Inc. converted from a Massachusetts corporation to a Massachusetts LLC, and changed its name to "Fidelity Investments Institutional Operations Company LLC".
2. Investments in Fidelity Central Funds.
The Fund invests in Fidelity Central Funds, which are open-end investment companies generally available only to other investment companies and accounts managed by the investment adviser and its affiliates. The Fund's Schedule of Investments lists each of the Fidelity Central Funds held as of period end, if any, as an investment of the Fund, but does not include the underlying holdings of each Fidelity Central Fund. As an Investing Fund, the Fund indirectly bears its proportionate share of the expenses of the underlying Fidelity Central Funds.
The Money Market Central Funds seek preservation of capital and current income and are managed by the investment adviser. Annualized expenses of the Money Market Central Funds as of their most recent shareholder report date ranged from less than .005% to .01%.
A complete unaudited list of holdings for each Fidelity Central Fund is available upon request or at the Securities and Exchange Commission (the SEC) website at www.sec.gov. In addition, the financial statements of the Fidelity Central Funds, which are not covered by the Fund's Report of Independent Registered Public Accounting Firm, are available on the SEC website or upon request.
3. Significant Accounting Policies.
The Fund is an investment company and applies the accounting and reporting guidance of the Financial Accounting Standards Board (FASB) Accounting Standards Codification Topic 946 Financial Services – Investment Companies. The financial statements have been prepared in conformity with accounting principles generally accepted in the United States of America (GAAP), which require management to make certain estimates and assumptions at the date of the financial statements. Actual results could differ from those estimates. Subsequent events, if any, through the date that the financial statements were issued have been evaluated in the preparation of the financial statements. The following summarizes the significant accounting policies of the Fund:
Investment Valuation. Investments are valued as of 4:00 p.m. Eastern time on the last calendar day of the period. The Board of Trustees (the Board) has delegated the day to day responsibility for the valuation of the Fund's investments to the Fair Value Committee (the Committee) established by the Fund's investment adviser. In accordance with valuation policies and procedures approved by the Board, the Fund attempts to obtain prices from one or more third party pricing vendors or brokers to value its investments. When current market prices, quotations or currency exchange rates are not readily available or reliable, investments will be fair valued in good faith by the Committee, in accordance with procedures adopted by the Board. Factors used in determining fair value vary by investment type and may include market or investment specific events. The frequency with which these procedures are used cannot be predicted and they may be utilized to a significant extent. The Committee oversees the Fund's valuation policies and procedures and reports to the Board on the Committee's activities and fair value determinations. The Board monitors the appropriateness of the procedures used in valuing the Fund's investments and ratifies the fair value determinations of the Committee.
The Fund categorizes the inputs to valuation techniques used to value its investments into a disclosure hierarchy consisting of three levels as shown below:
- Level 1 – quoted prices in active markets for identical investments
- Level 2 – other significant observable inputs (including quoted prices for similar investments, interest rates, prepayment speeds, etc.)
- Level 3 – unobservable inputs (including the Fund's own assumptions based on the best information available)
Valuation techniques used to value the Fund's investments by major category are as follows:
Equity securities, including restricted securities, for which market quotations are readily available, are valued at the last reported sale price or official closing price as reported by a third party pricing vendor on the primary market or exchange on which they are traded and are categorized as Level 1 in the hierarchy. In the event there were no sales during the day or closing prices are not available, securities are valued at the last quoted bid price or may be valued using the last available price and are generally categorized as Level 2 in the hierarchy. For foreign equity securities, when market or security specific events arise, comparisons to the valuation of American Depositary Receipts (ADRs), futures contracts, Exchange-Traded Funds (ETFs) and certain indexes as well as quoted prices for similar securities may be used and would be categorized as Level 2 in the hierarchy. For equity securities, including restricted securities, where observable inputs are limited, assumptions about market activity and risk are used and these securities may be categorized as Level 3 in the hierarchy.
Investments in open-end mutual funds, including the Fidelity Central Funds, are valued at their closing net asset value (NAV) each business day and are categorized as Level 1 in the hierarchy.
Changes in valuation techniques may result in transfers in or out of an assigned level within the disclosure hierarchy. The aggregate value of investments by input level as of October 31, 2020 is included at the end of the Fund's Schedule of Investments.
Foreign Currency. Certain Funds may use foreign currency contracts to facilitate transactions in foreign-denominated securities. Gains and losses from these transactions may arise from changes in the value of the foreign currency or if the counterparties do not perform under the contracts' terms.
Foreign-denominated assets, including investment securities, and liabilities are translated into U.S. dollars at the exchange rates at period end. Purchases and sales of investment securities, income and dividends received, and expenses denominated in foreign currencies are translated into U.S. dollars at the exchange rate in effect on the transaction date.
The effects of exchange rate fluctuations on investments are included with the net realized and unrealized gain (loss) on investment securities. Other foreign currency transactions resulting in realized and unrealized gain (loss) are disclosed separately.
Investment Transactions and Income. For financial reporting purposes, the Fund's investment holdings and NAV include trades executed through the end of the last business day of the period. The NAV per share for processing shareholder transactions is calculated as of the close of business of the New York Stock Exchange (NYSE), normally 4:00 p.m. Eastern time and includes trades executed through the end of the prior business day. Gains and losses on securities sold are determined on the basis of identified cost. Dividend income is recorded on the ex-dividend date, except for certain dividends from foreign securities where the ex-dividend date may have passed, which are recorded as soon as the Fund is informed of the ex-dividend date. Non-cash dividends included in dividend income, if any, are recorded at the fair market value of the securities received. Income and capital gain distributions from Fidelity Central Funds, if any, are recorded on the ex-dividend date. Investment income is recorded net of foreign taxes withheld where recovery of such taxes is uncertain.
Expenses. Expenses directly attributable to a fund are charged to that fund. Expenses attributable to more than one fund are allocated among the respective funds on the basis of relative net assets or other appropriate methods. Expense estimates are accrued in the period to which they relate and adjustments are made when actual amounts are known.
Income Tax Information and Distributions to Shareholders. Each year, the Fund intends to qualify as a regulated investment company under Subchapter M of the Internal Revenue Code, including distributing substantially all of its taxable income and realized gains. As a result, no provision for U.S. Federal income taxes is required. As of October 31, 2020, the Fund did not have any unrecognized tax benefits in the financial statements; nor is the Fund aware of any tax positions for which it is reasonably possible that the total amounts of unrecognized tax benefits will significantly change in the next twelve months. The Fund files a U.S. federal tax return, in addition to state and local tax returns as required. The Fund's federal income tax returns are subject to examination by the Internal Revenue Service (IRS) for a period of three fiscal years after they are filed. State and local tax returns may be subject to examination for an additional fiscal year depending on the jurisdiction. Foreign taxes are provided for based on the Fund's understanding of the tax rules and rates that exist in the foreign markets in which it invests.
Distributions are declared and recorded on the ex-dividend date. Income and capital gain distributions are determined in accordance with income tax regulations, which may differ from GAAP. In addition, the Fund claimed a portion for the payment made to redeeming shareholders as a distribution fro income tax purposes.
Capital accounts within the financial statements are adjusted for permanent book-tax differences. These adjustments have no impact on net assets or the results of operations. Capital accounts are not adjusted for temporary book-tax differences which will reverse in a subsequent period.
Book-tax differences are primarily due to foreign currency transactions, passive foreign investment companies (PFIC) and losses deferred due to wash sales.
As of period end, the cost and unrealized appreciation (depreciation) in securities, and derivatives if applicable, for federal income tax purposes were as follows:
| Gross unrealized appreciation | $67,072,293 |
| Gross unrealized depreciation | (21,809,657) |
| Net unrealized appreciation (depreciation) | $45,262,636 |
| Tax Cost | $269,325,760 |
The tax-based components of distributable earnings as of period end were as follows:
| Undistributed ordinary income | $8,495,912 |
| Undistributed long-term capital gain | $2,463,113 |
| Net unrealized appreciation (depreciation) on securities and other investments | $45,280,571 |
The tax character of distributions paid was as follows:
| | October 31, 2020 | October 31, 2019 |
| Ordinary Income | $8,845,138 | $ 5,998,258 |
| Long-term Capital Gains | 3,274,747 | 20,425,101 |
| Total | $12,119,885 | $ 26,423,359 |
Restricted Securities (including Private Placements). The Fund may invest in securities that are subject to legal or contractual restrictions on resale. These securities generally may be resold in transactions exempt from registration or to the public if the securities are registered. Disposal of these securities may involve time-consuming negotiations and expense, and prompt sale at an acceptable price may be difficult. Information regarding restricted securities is included at the end of the Fund's Schedule of Investments.
4. Purchases and Sales of Investments.
Purchases and sales of securities, other than short-term securities, are noted in the table below.
| | Purchases ($) | Sales ($) |
| Fidelity Nordic Fund | 73,679,891 | 102,139,208 |
5. Fees and Other Transactions with Affiliates.
Management Fee. Fidelity Management & Research Company LLC (the investment adviser) and its affiliates provide the Fund with investment management related services for which the Fund pays a monthly management fee. The management fee is the sum of an individual fund fee rate that is based on an annual rate of .45% of the Fund's average net assets and an annualized group fee rate that averaged .23% during the period. The group fee rate is based upon the monthly average net assets of a group of registered investment companies with which the investment adviser has management contracts. The group fee rate decreases as assets under management increase and increases as assets under management decrease. For the reporting period, the total annual management fee rate was .68% of the Fund's average net assets.
Transfer Agent Fees. Fidelity Investments Institutional Operations Company LLC (FIIOC), an affiliate of the investment adviser, is the Fund's transfer, dividend disbursing and shareholder servicing agent. FIIOC receives account fees and asset-based fees that vary according to account size and type of account. FIIOC pays for typesetting, printing and mailing of shareholder reports, except proxy statements. For the period, the transfer agent fees were equivalent to an annual rate of .18% of average net assets.
Accounting Fees. Fidelity Service Company, Inc. (FSC), an affiliate of the investment adviser, maintains the Fund's accounting records. The accounting fee is based on the level of average net assets for each month. For the period, the fees were equivalent to the following annual rates:
| | % of Average Net Assets |
| Fidelity Nordic Fund | .05 |
Interfund Trades. Funds may purchase from or sell securities to other Fidelity Funds under procedures adopted by the Board. The procedures have been designed to ensure these interfund trades are executed in accordance with Rule 17a-7 of the 1940 Act. Interfund trades are included within the respective purchases and sales amounts shown in the Purchases and Sales of Investments note.
6. Committed Line of Credit.
Certain Funds participate with other funds managed by the investment adviser or an affiliate in a $4.25 billion credit facility (the "line of credit") to be utilized for temporary or emergency purposes to fund shareholder redemptions or for other short-term liquidity purposes. The participating funds have agreed to pay commitment fees on their pro-rata portion of the line of credit, which are reflected in Miscellaneous expenses on the Statement of Operations, and are as follows:
| | Amount |
| Fidelity Nordic Fund | $607 |
During the period, there were no borrowings on this line of credit.
7. Security Lending.
Funds lend portfolio securities from time to time in order to earn additional income. Lending agents are used, including National Financial Services (NFS), an affiliate of the investment adviser. Pursuant to a securities lending agreement, NFS will receive a fee, which is capped at 9.9% of a fund's daily lending revenue, for its services as lending agent. A fund may lend securities to certain qualified borrowers, including NFS. On the settlement date of the loan, a fund receives collateral (in the form of U.S. Treasury obligations, letters of credit and/or cash) against the loaned securities and maintains collateral in an amount not less than 100% of the market value of the loaned securities during the period of the loan. The market value of the loaned securities is determined at the close of business of a fund and any additional required collateral is delivered to a fund on the next business day. A fund or borrower may terminate the loan at any time, and if the borrower defaults on its obligation to return the securities loaned because of insolvency or other reasons, a fund may apply collateral received from the borrower against the obligation. A fund may experience delays and costs in recovering the securities loaned. Any cash collateral received is invested in the Fidelity Securities Lending Cash Central Fund. Any loaned securities are identified as such in the Schedule of Investments, and the value of loaned securities and cash collateral at period end, as applicable, are presented in the Statement of Assets and Liabilities. Security lending income represents the income earned on investing cash collateral, less rebates paid to borrowers and any lending agent fees associated with the loan, plus any premium payments received for lending certain types of securities. Security lending income is presented in the Statement of Operations as a component of income from Fidelity Central Funds. Affiliated security lending activity, if any, was as follows:
| | Total Security Lending Income Fees Paid to NFS | Security Lending Income From Securities Loaned to NFS | Value of Securities Loaned to NFS at Period End |
| Fidelity Nordic Fund | $– | $– | $– |
8. Expense Reductions.
Commissions paid to certain brokers with whom the investment adviser, or its affiliates, places trades on behalf of the Fund include an amount in addition to trade execution, which may be rebated back to the Fund to offset certain expenses. This amount totaled $13,723 for the period.
In addition, during the period the investment adviser or an affiliate reimbursed and/or waived a portion of operating expenses in the amount of $1,082.
9. Other.
The Fund's organizational documents provide former and current trustees and officers with a limited indemnification against liabilities arising in connection with the performance of their duties to the Fund. In the normal course of business, the Fund may also enter into contracts that provide general indemnifications. The Fund's maximum exposure under these arrangements is unknown as this would be dependent on future claims that may be made against the Fund. The risk of material loss from such claims is considered remote.
10. Coronavirus (COVID-19) Pandemic.
An outbreak of COVID-19 first detected in China during December 2019 has since spread globally and was declared a pandemic by the World Health Organization during March 2020. Developments that disrupt global economies and financial markets, such as the COVID-19 pandemic, may magnify factors that affect the Fund's performance.
Fidelity® Pacific Basin Fund
Performance: The Bottom Line
Average annual total return reflects the change in the value of an investment, assuming reinvestment of distributions from dividend income and capital gains (the profits earned upon the sale of securities that have grown in value, if any) and assuming a constant rate of performance each year. The hypothetical investment and the average annual total returns do not reflect the deduction of taxes that a shareholder would pay on fund distributions or the redemption of fund shares. During periods of reimbursement by Fidelity, a fund’s total return will be greater than it would be had the reimbursement not occurred. How a fund did yesterday is no guarantee of how it will do tomorrow.
Average Annual Total Returns
| For the periods ended October 31, 2020 | Past 1 year | Past 5 years | Past 10 years |
| Fidelity® Pacific Basin Fund | 23.95% | 13.23% | 10.21% |
$10,000 Over 10 Years
Let's say hypothetically that $10,000 was invested in Fidelity® Pacific Basin Fund on October 31, 2010.
The chart shows how the value of your investment would have changed, and also shows how the MSCI AC (All Country) Pacific Index performed over the same period.
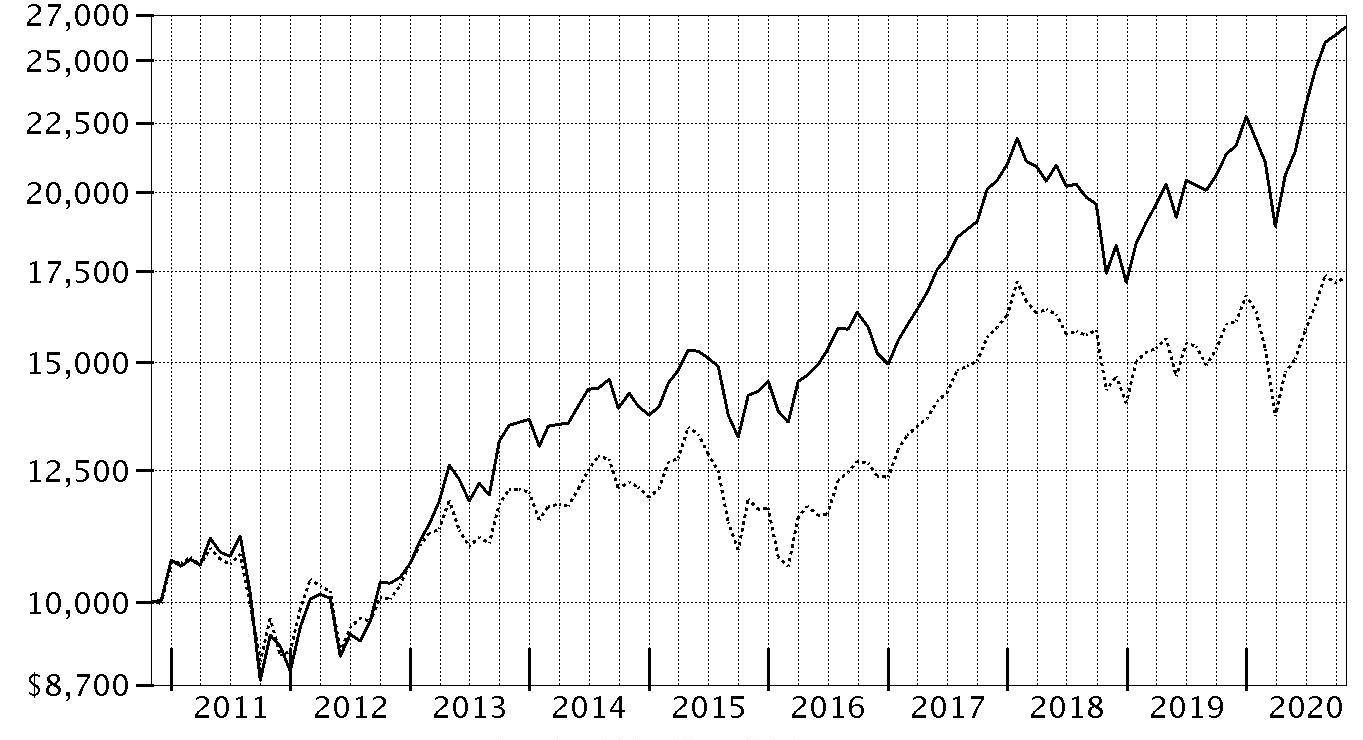
| Period Ending Values |
| $26,446 | Fidelity® Pacific Basin Fund |
| $17,332 | MSCI AC (All Country) Pacific Index |
Fidelity® Pacific Basin Fund
Management's Discussion of Fund Performance
Market Recap: The MSCI ACWI (All Country World Index) ex USA Index returned -2.46% for the 12 months ending October 31, 2020, in what was a bumpy ride for non-U.S. equities, marked by a steep but brief decline due to the early-2020 outbreak and spread of the coronavirus, followed by a sharp upturn. Declared a pandemic on March 11, the crisis and containment efforts caused broad contraction in economic activity, elevated volatility and dislocation in financial markets. A historically rapid and expansive monetary- and fiscal-policy response around the world provided a partial offset to the economic disruption.Other supporting factors included resilient corporate earnings and near-term potential for a COVID-19 vaccine breakthrough. This was evident in the index’s 12.28% gain in the final six months of the year. Currency fluctuation generally boosted foreign developed-markets equities for the year, while the reverse was true for emerging-markets stocks. Late in the period, the index was pressured by a second wave of COVID-19 cases in some regions, and stretched valuations and crowded positioning in big tech. For the full year, the U.K. (-22%), Asia Pacific ex Japan (-8%), Canada (-5%) and Europe ex U.K. (-4%) notably lagged. Emerging markets (+9%) and Japan (+1%) outperformed. By sector, energy (-38%), financials and real estate (-20% each) lagged, whereas information technology (+ 25%) and communication services (+15%) topped the index.
Comments from Co-Managers Kirk Neureiter and Bruce MacDonald: For the fiscal year ending October 31, 2020, the fund gained 23.95%, outperforming the 8.32% result of the benchmark MSCI AC (All Country) Pacific Free (Net of MA Tax) Index. From a regional standpoint, security selection in Japan, as well as in emerging markets, which was primarily driven by China, contributed to the fund's relative result. Among sectors, security selection was the primary contributor versus the benchmark, especially within the industrials sector. Strong picks in the consumer staples sector, primarily driven by the food, beverage & tobacco industry, also boosted the fund's relative result. Also boosting performance was security selection in communication services. The fund's biggest individual relative contributor was an overweighting in Tencent Holdings, which gained 86% the past 12 months. The company was among our biggest holdings. Also bolstering performance was our outsized stake in Kweichow Moutai, which gained roughly 50%. We decreased our position the past year. Another notable relative contributor was our outsized stake in Lasertec (+102%), a position not held at period end. In contrast, out-of-benchmark exposure to India detracted from the fund's relative result. By sector, the largest detractor from performance versus the benchmark was an overweighting in energy. An underweighting in the consumer discretionary sector also hampered relative performance. Also detracting from the fund's relative result was an overweighting in industrials. Not owning Meituan, a benchmark component that gained about 211%, was the largest individual detractor versus the benchmark. Also hurting performance was our overweighting in United Overseas Bank, which returned -22%. This was a stake we established the past 12 months. The fund's non-benchmark stake in TCNS Clothing returned roughly -53%. Notable changes in positioning include reduced exposure to Australia and a higher allocation to Taiwan. By sector, meaningful changes in positioning include increased exposure to consumer discretionary and a lower allocation to industrials.
The views expressed above reflect those of the portfolio manager(s) only through the end of the period as stated on the cover of this report and do not necessarily represent the views of Fidelity or any other person in the Fidelity organization. Any such views are subject to change at any time based upon market or other conditions and Fidelity disclaims any responsibility to update such views. These views may not be relied on as investment advice and, because investment decisions for a Fidelity fund are based on numerous factors, may not be relied on as an indication of trading intent on behalf of any Fidelity fund.
Note to shareholders: On January 1, 2020, John Dance came off of the fund, leaving Kirk Neureiter and Bruce MacDonald as co-managers of the fund.
Fidelity® Pacific Basin Fund
Investment Summary (Unaudited)
Geographic Diversification (% of fund's net assets)
| As of October 31, 2020 |
| | Japan | 31.6% |
| | Cayman Islands | 19.8% |
| | China | 8.6% |
| | Taiwan | 7.3% |
| | Australia | 7.1% |
| | India | 5.5% |
| | Korea (South) | 4.3% |
| | Hong Kong | 3.8% |
| | United States of America* | 3.2% |
| | Other | 8.8% |

* Includes Short-Term investments and Net Other Assets (Liabilities).
Percentages are based on country or territory of incorporation and are adjusted for the effect of futures contracts, if applicable.
Asset Allocation as of October 31, 2020
| | % of fund's net assets |
| Stocks | 98.0 |
| Short-Term Investments and Net Other Assets (Liabilities) | 2.0 |
Top Ten Stocks as of October 31, 2020
| | % of fund's net assets |
| Alibaba Group Holding Ltd. sponsored ADR (Cayman Islands, Internet & Direct Marketing Retail) | 7.4 |
| Tencent Holdings Ltd. (Cayman Islands, Interactive Media & Services) | 5.7 |
| Taiwan Semiconductor Manufacturing Co. Ltd. (Taiwan, Semiconductors & Semiconductor Equipment) | 4.7 |
| AIA Group Ltd. (Hong Kong, Insurance) | 1.9 |
| Hoya Corp. (Japan, Health Care Equipment & Supplies) | 1.8 |
| Samsung Electronics Co. Ltd. (Korea (South), Technology Hardware, Storage & Peripherals) | 1.7 |
| SoftBank Group Corp. (Japan, Wireless Telecommunication Services) | 1.7 |
| Reliance Industries Ltd. (India, Oil, Gas & Consumable Fuels) | 1.6 |
| CSL Ltd. (Australia, Biotechnology) | 1.6 |
| Nintendo Co. Ltd. (Japan, Entertainment) | 1.5 |
| | 29.6 |
Top Market Sectors as of October 31, 2020
| | % of fund's net assets |
| Information Technology | 17.5 |
| Consumer Discretionary | 17.4 |
| Financials | 13.1 |
| Health Care | 12.9 |
| Communication Services | 11.4 |
| Industrials | 11.4 |
| Consumer Staples | 6.5 |
| Real Estate | 4.6 |
| Energy | 2.0 |
| Utilities | 0.7 |
Fidelity® Pacific Basin Fund
Schedule of Investments October 31, 2020
Showing Percentage of Net Assets
| Common Stocks - 96.3% | | | |
| | | Shares | Value |
| Australia - 7.1% | | | |
| Aristocrat Leisure Ltd. | | 373,311 | $7,517,263 |
| Blue Sky Alternative Investments Ltd. (a)(b) | | 1,733,447 | 12 |
| BWX Ltd. | | 2,012,663 | 5,339,294 |
| CSL Ltd. | | 84,826 | 17,173,647 |
| Hansen Technologies Ltd. | | 1,098,650 | 3,052,591 |
| HUB24 Ltd. (c) | | 797,005 | 12,877,873 |
| Macquarie Group Ltd. | | 130,520 | 11,637,159 |
| Magellan Financial Group Ltd. | | 140,866 | 5,459,760 |
| National Storage (REIT) unit | | 7,986,135 | 10,135,471 |
| Pro Medicus Ltd. | | 70,223 | 1,602,902 |
| Treasury Wine Estates Ltd. | | 409,759 | 2,641,652 |
|
| TOTAL AUSTRALIA | | | 77,437,624 |
|
| Bermuda - 0.9% | | | |
| Haier Electronics Group Co. Ltd. | | 2,686,000 | 10,186,185 |
| Cayman Islands - 19.8% | | | |
| 51job, Inc. sponsored ADR (a) | | 85,600 | 6,000,560 |
| Akeso, Inc. (d) | | 1,486,000 | 4,657,827 |
| Alibaba Group Holding Ltd. sponsored ADR (a) | | 265,000 | 80,742,850 |
| Anta Sports Products Ltd. | | 296,000 | 3,256,859 |
| Chailease Holding Co. Ltd. | | 681,000 | 3,296,812 |
| China High Precision Automation Group Ltd. (a)(b) | | 1,875,000 | 2 |
| China Metal Recycling (Holdings) Ltd. (a)(b) | | 2,572,200 | 3 |
| China Yongda Automobiles Services Holdings Ltd. | | 2,784,000 | 3,935,845 |
| Hansoh Pharmaceutical Group Co. Ltd. (a)(d) | | 1,920,000 | 8,556,724 |
| Hypebeast Ltd. (a) | | 20,020,000 | 1,910,971 |
| International Housewares Retail Co. Ltd. | | 19,363,700 | 5,095,382 |
| Kangji Medical Holdings Ltd. | | 419,500 | 1,084,667 |
| KE Holdings, Inc. ADR (a) | | 43,400 | 3,027,150 |
| New Oriental Education & Technology Group, Inc. sponsored ADR (a) | | 45,200 | 7,249,176 |
| Shenzhou International Group Holdings Ltd. | | 424,700 | 7,335,354 |
| Sino Biopharmaceutical Ltd. | | 5,596,500 | 5,645,228 |
| SITC International Holdings Co. Ltd. | | 3,415,000 | 5,268,417 |
| Tencent Holdings Ltd. | | 816,500 | 62,385,216 |
| Tencent Music Entertainment Group ADR (a) | | 266,700 | 3,968,496 |
| Zai Lab Ltd. (a) | | 11,900 | 990,068 |
|
| TOTAL CAYMAN ISLANDS | | | 214,407,607 |
|
| China - 8.6% | | | |
| AVIC Jonhon OptronicTechnology Co. Ltd. | | 1,373,410 | 11,394,925 |
| Centre Testing International Group Co. Ltd. (A Shares) | | 2,386,109 | 9,632,599 |
| Chongqing Fuling Zhacai Group Co. Ltd. Group (A Shares) | | 663,909 | 4,152,479 |
| Foshan Haitian Flavouring & Food Co. Ltd. (A Shares) | | 366,692 | 8,786,105 |
| Gree Electric Appliances, Inc. of Zhuhai (A Shares) | | 693,094 | 6,083,178 |
| Hangzhou Tigermed Consulting Co. Ltd.: | | | |
| (A Shares) | | 358,900 | 6,673,731 |
| (H Shares) (a)(d) | | 25,100 | 403,089 |
| Kweichow Moutai Co. Ltd. (A Shares) | | 58,350 | 14,594,915 |
| Midea Group Co. Ltd. (A Shares) | | 761,800 | 8,900,323 |
| Qingdao Port International Co. Ltd. (H Shares) (d) | | 7,112,000 | 4,036,479 |
| Shenzhen Mindray Bio-Medical Electronics Co. Ltd. (A Shares) | | 158,199 | 9,167,766 |
| Venus MedTech Hangzhou, Inc. (H Shares) (a)(d) | | 70,500 | 677,946 |
| Yunnan Baiyao Group Co. Ltd. (A Shares) | | 543,033 | 8,376,726 |
|
| TOTAL CHINA | | | 92,880,261 |
|
| Hong Kong - 3.8% | | | |
| AIA Group Ltd. | | 2,155,400 | 20,513,322 |
| Hong Kong Exchanges and Clearing Ltd. | | 214,027 | 10,220,290 |
| Link (REIT) | | 279,500 | 2,128,923 |
| Sino Land Ltd. | | 7,051,817 | 8,332,105 |
|
| TOTAL HONG KONG | | | 41,194,640 |
|
| India - 5.5% | | | |
| Axis Bank Ltd. (a) | | 871,998 | 5,745,840 |
| CCL Products (India) Ltd. (a) | | 1,250,367 | 4,037,138 |
| HDFC Asset Management Co. Ltd. (d) | | 63,463 | 1,914,438 |
| HDFC Bank Ltd. | | 416,032 | 6,604,569 |
| Housing Development Finance Corp. Ltd. | | 247,184 | 6,374,693 |
| Indraprastha Gas Ltd. | | 758,600 | 4,094,635 |
| Oberoi Realty Ltd. (a) | | 352,703 | 2,094,724 |
| Petronet LNG Ltd. | | 1,275,200 | 3,948,814 |
| Power Grid Corp. of India Ltd. | | 1,496,460 | 3,432,735 |
| Reliance Industries Ltd. | | 636,375 | 17,538,635 |
| Reliance Industries Ltd. | | 42,425 | 672,101 |
| TCNS Clothing Co. Ltd. (a)(d) | | 594,671 | 2,972,206 |
|
| TOTAL INDIA | | | 59,430,528 |
|
| Indonesia - 1.4% | | | |
| PT Bank Central Asia Tbk | | 5,219,800 | 10,270,770 |
| PT Bank Rakyat Indonesia Tbk | | 24,531,400 | 5,553,222 |
|
| TOTAL INDONESIA | | | 15,823,992 |
|
| Japan - 31.6% | | | |
| Astellas Pharma, Inc. | | 434,100 | 5,952,788 |
| Azbil Corp. | | 113,900 | 4,622,438 |
| Bank of Kyoto Ltd. | | 88,500 | 3,908,559 |
| Create SD Holdings Co. Ltd. | | 211,800 | 6,830,535 |
| Daiichikosho Co. Ltd. | | 136,000 | 4,653,509 |
| Daikin Industries Ltd. | | 71,100 | 13,305,175 |
| Hoshizaki Corp. | | 88,800 | 7,091,502 |
| Hoya Corp. | | 170,300 | 19,219,537 |
| Iriso Electronics Co. Ltd. | | 135,100 | 5,143,837 |
| IT Holdings Corp. | | 107,300 | 2,052,128 |
| Kao Corp. | | 138,100 | 9,832,542 |
| Kenedix, Inc. | | 1,044,500 | 5,412,683 |
| Keyence Corp. | | 33,600 | 15,248,436 |
| Kyowa Hakko Kirin Co., Ltd. | | 290,000 | 7,201,683 |
| Minebea Mitsumi, Inc. | | 416,300 | 7,518,944 |
| Misumi Group, Inc. | | 271,800 | 8,072,344 |
| Murata Manufacturing Co. Ltd. | | 125,096 | 8,772,815 |
| Net One Systems Co. Ltd. | | 74,900 | 2,239,402 |
| Nexon Co. Ltd. | | 327,400 | 9,124,936 |
| Nihon M&A Center, Inc. (c) | | 231,800 | 13,611,665 |
| Nintendo Co. Ltd. | | 29,600 | 16,004,388 |
| Nitori Holdings Co. Ltd. | | 53,200 | 10,935,615 |
| NOF Corp. | | 134,800 | 5,066,098 |
| Nomura Research Institute Ltd. | | 78,000 | 2,299,245 |
| NSD Co. Ltd. | | 539,600 | 9,477,888 |
| Open House Co. Ltd. | | 334,600 | 11,393,853 |
| Oracle Corp. Japan | | 21,700 | 2,168,700 |
| ORIX Corp. | | 805,100 | 9,415,835 |
| PALTAC Corp. | | 86,600 | 4,841,597 |
| Park24 Co. Ltd. | | 289,300 | 3,907,824 |
| Recruit Holdings Co. Ltd. | | 268,900 | 10,231,827 |
| SCSK Corp. | | 39,700 | 1,973,944 |
| SMC Corp. | | 16,300 | 8,670,062 |
| SMS Co., Ltd. | | 318,400 | 9,374,376 |
| SoftBank Group Corp. | | 284,700 | 18,543,596 |
| Sony Corp. | | 153,700 | 12,813,428 |
| Terumo Corp. | | 373,600 | 13,749,975 |
| Tokio Marine Holdings, Inc. | | 195,300 | 8,728,880 |
| Tsuruha Holdings, Inc. | | 73,300 | 10,263,835 |
| Zozo, Inc. | | 501,200 | 12,714,395 |
|
| TOTAL JAPAN | | | 342,390,819 |
|
| Korea (South) - 2.6% | | | |
| KB Financial Group, Inc. | | 160,340 | 5,722,747 |
| Samsung Electronics Co. Ltd. | | 215,680 | 10,817,505 |
| SK Hynix, Inc. | | 165,288 | 11,700,279 |
|
| TOTAL KOREA (SOUTH) | | | 28,240,531 |
|
| Multi-National - 0.7% | | | |
| HKT Trust/HKT Ltd. unit | | 5,559,000 | 7,184,931 |
| Netherlands - 1.1% | | | |
| ASML Holding NV (Netherlands) | | 32,800 | 11,867,142 |
| New Zealand - 1.9% | | | |
| Auckland International Airport Ltd. | | 970,400 | 4,488,953 |
| EBOS Group Ltd. | | 416,179 | 7,083,964 |
| Ryman Healthcare Group Ltd. | | 928,240 | 8,590,007 |
|
| TOTAL NEW ZEALAND | | | 20,162,924 |
|
| Philippines - 1.0% | | | |
| Ayala Land, Inc. | | 10,417,600 | 7,070,028 |
| Jollibee Food Corp. | | 1,088,000 | 3,803,989 |
|
| TOTAL PHILIPPINES | | | 10,874,017 |
|
| Singapore - 1.3% | | | |
| United Overseas Bank Ltd. | | 1,013,100 | 14,076,468 |
| Taiwan - 7.3% | | | |
| eMemory Technology, Inc. | | 181,000 | 3,606,208 |
| MediaTek, Inc. | | 548,000 | 12,986,962 |
| Taiwan Semiconductor Manufacturing Co. Ltd. | | 3,345,000 | 50,599,034 |
| Voltronic Power Technology Corp. | | 357,413 | 12,243,166 |
|
| TOTAL TAIWAN | | | 79,435,370 |
|
| Thailand - 0.5% | | | |
| Thai Beverage PCL | | 13,315,300 | 5,662,577 |
| United States of America - 1.2% | | | |
| GI Dynamics, Inc. CDI (a)(b) | | 5,561,290 | 7,818 |
| ResMed, Inc. CDI | | 679,762 | 13,353,525 |
|
| TOTAL UNITED STATES OF AMERICA | | | 13,361,343 |
|
| TOTAL COMMON STOCKS | | | |
| (Cost $680,067,921) | | | 1,044,616,959 |
|
| Nonconvertible Preferred Stocks - 1.7% | | | |
| Korea (South) - 1.7% | | | |
| Samsung Electronics Co. Ltd. | | | |
| (Cost $14,974,475) | | 418,780 | 18,588,518 |
|
| Money Market Funds - 2.0% | | | |
| Fidelity Cash Central Fund 0.10% (e) | | 21,637,606 | 21,641,933 |
| Fidelity Securities Lending Cash Central Fund 0.11% (e)(f) | | 53,913 | 53,918 |
| TOTAL MONEY MARKET FUNDS | | | |
| (Cost $21,695,851) | | | 21,695,851 |
| TOTAL INVESTMENT IN SECURITIES - 100.0% | | | |
| (Cost $716,738,247) | | | 1,084,901,328 |
| NET OTHER ASSETS (LIABILITIES) - 0.0% | | | (227,952) |
| NET ASSETS - 100% | | | $1,084,673,376 |
Categorizations in the Schedule of Investments are based on country or territory of incorporation.
Legend
(a) Non-income producing
(b) Level 3 security
(c) Security or a portion of the security is on loan at period end.
(d) Security exempt from registration under Rule 144A of the Securities Act of 1933. These securities may be resold in transactions exempt from registration, normally to qualified institutional buyers. At the end of the period, the value of these securities amounted to $23,218,709 or 2.1% of net assets.
(e) Affiliated fund that is generally available only to investment companies and other accounts managed by Fidelity Investments. The rate quoted is the annualized seven-day yield of the fund at period end. A complete unaudited listing of the fund's holdings as of its most recent quarter end is available upon request. In addition, each Fidelity Central Fund's financial statements, which are not covered by the Fund's Report of Independent Registered Public Accounting Firm, are available on the SEC's website or upon request.
(f) Investment made with cash collateral received from securities on loan.
Affiliated Central Funds
Information regarding fiscal year to date income earned by the Fund from investments in Fidelity Central Funds is as follows:
| Fund | Income earned |
| Fidelity Cash Central Fund | $87,456 |
| Fidelity Securities Lending Cash Central Fund | 161,378 |
| Total | $248,834 |
Amounts in the income column in the above table include any capital gain distributions from underlying funds, which are presented in the corresponding line-item in the Statement of Operations, if applicable. Amount for Fidelity Securities Lending Cash Central Fund represents the income earned on investing cash collateral, less rebates paid to borrowers and any lending agent fees associated with the loan, plus any premium payments received for lending certain types of securities.
Investment Valuation
The following is a summary of the inputs used, as of October 31, 2020, involving the Fund's assets and liabilities carried at fair value. The inputs or methodology used for valuing securities may not be an indication of the risk associated with investing in those securities. For more information on valuation inputs, and their aggregation into the levels used below, please refer to the Investment Valuation section in the accompanying Notes to Financial Statements.
| | Valuation Inputs at Reporting Date: |
| Description | Total | Level 1 | Level 2 | Level 3 |
| Investments in Securities: | | | | |
| Equities: | | | | |
| Communication Services | $123,776,043 | $13,064,398 | $110,711,645 | $-- |
| Consumer Discretionary | 188,383,645 | 117,801,651 | 70,581,994 | -- |
| Consumer Staples | 72,141,072 | -- | 72,141,072 | -- |
| Energy | 22,159,550 | -- | 22,159,550 | -- |
| Financials | 142,321,249 | 13,517,102 | 128,804,135 | 12 |
| Health Care | 140,169,618 | 20,930,882 | 119,230,918 | 7,818 |
| Industrials | 123,453,893 | 27,548,622 | 95,905,271 | -- |
| Information Technology | 188,611,999 | 16,593,170 | 172,018,827 | 2 |
| Materials | 5,066,101 | -- | 5,066,098 | 3 |
| Real Estate | 49,594,937 | 13,488,178 | 36,106,759 | -- |
| Utilities | 7,527,370 | -- | 7,527,370 | -- |
| Money Market Funds | 21,695,851 | 21,695,851 | -- | -- |
| Total Investments in Securities: | $1,084,901,328 | $244,639,854 | $840,253,639 | $7,835 |
See accompanying notes which are an integral part of the financial statements.
Fidelity® Pacific Basin Fund
Financial Statements
Statement of Assets and Liabilities
| | | October 31, 2020 |
| Assets | | |
Investment in securities, at value (including securities loaned of $49,555) — See accompanying schedule:
Unaffiliated issuers (cost $695,042,396) | $1,063,205,477 | |
| Fidelity Central Funds (cost $21,695,851) | 21,695,851 | |
| Total Investment in Securities (cost $716,738,247) | | $1,084,901,328 |
| Foreign currency held at value (cost $418) | | 407 |
| Receivable for investments sold | | 477,180 |
| Receivable for fund shares sold | | 1,068,564 |
| Dividends receivable | | 2,335,372 |
| Distributions receivable from Fidelity Central Funds | | 1,708 |
| Prepaid expenses | | 1,642 |
| Other receivables | | 44,189 |
| Total assets | | 1,088,830,390 |
| Liabilities | | |
| Payable for investments purchased | $2,233,913 | |
| Payable for fund shares redeemed | 167,747 | |
| Accrued management fee | 772,238 | |
| Other affiliated payables | 173,737 | |
| Other payables and accrued expenses | 757,331 | |
| Collateral on securities loaned | 52,048 | |
| Total liabilities | | 4,157,014 |
| Net Assets | | $1,084,673,376 |
| Net Assets consist of: | | |
| Paid in capital | | $667,085,623 |
| Total accumulated earnings (loss) | | 417,587,753 |
| Net Assets | | $1,084,673,376 |
| Net Asset Value, offering price and redemption price per share ($1,084,673,376 ÷ 27,009,705 shares) | | $40.16 |
See accompanying notes which are an integral part of the financial statements.
Statement of Operations
| | | Year ended October 31, 2020 |
| Investment Income | | |
| Dividends | | $15,984,559 |
| Income from Fidelity Central Funds (including $161,378 from security lending) | | 248,834 |
| Income before foreign taxes withheld | | 16,233,393 |
| Less foreign taxes withheld | | (1,475,281) |
| Total income | | 14,758,112 |
| Expenses | | |
| Management fee | | |
| Basic fee | $6,384,042 | |
| Performance adjustment | 1,809,094 | |
| Transfer agent fees | 1,449,500 | |
| Accounting fees | 440,210 | |
| Custodian fees and expenses | 168,411 | |
| Independent trustees' fees and expenses | 5,202 | |
| Registration fees | 34,797 | |
| Audit | 83,190 | |
| Legal | 1,575 | |
| Miscellaneous | 14,348 | |
| Total expenses before reductions | 10,390,369 | |
| Expense reductions | (82,337) | |
| Total expenses after reductions | | 10,308,032 |
| Net investment income (loss) | | 4,450,080 |
| Realized and Unrealized Gain (Loss) | | |
| Net realized gain (loss) on: | | |
| Investment securities: | | |
| Unaffiliated issuers (net of foreign taxes of $67) | 56,084,208 | |
| Fidelity Central Funds | 867 | |
| Foreign currency transactions | (81,118) | |
| Total net realized gain (loss) | | 56,003,957 |
| Change in net unrealized appreciation (depreciation) on: | | |
| Investment securities: | | |
| Unaffiliated issuers (net of decrease in deferred foreign taxes of $251,328) | 145,359,167 | |
| Assets and liabilities in foreign currencies | 12,321 | |
| Total change in net unrealized appreciation (depreciation) | | 145,371,488 |
| Net gain (loss) | | 201,375,445 |
| Net increase (decrease) in net assets resulting from operations | | $205,825,525 |
See accompanying notes which are an integral part of the financial statements.
Statement of Changes in Net Assets
| | Year ended October 31, 2020 | Year ended October 31, 2019 |
| Increase (Decrease) in Net Assets | | |
| Operations | | |
| Net investment income (loss) | $4,450,080 | $7,436,011 |
| Net realized gain (loss) | 56,003,957 | (1,372,773) |
| Change in net unrealized appreciation (depreciation) | 145,371,488 | 161,491,391 |
| Net increase (decrease) in net assets resulting from operations | 205,825,525 | 167,554,629 |
| Distributions to shareholders | (7,073,863) | (77,993,885) |
| Share transactions | | |
| Proceeds from sales of shares | 149,577,623 | 84,737,459 |
| Reinvestment of distributions | 5,463,324 | 60,437,260 |
| Cost of shares redeemed | (160,273,327) | (151,213,172) |
| Net increase (decrease) in net assets resulting from share transactions | (5,232,380) | (6,038,453) |
| Total increase (decrease) in net assets | 193,519,282 | 83,522,291 |
| Net Assets | | |
| Beginning of period | 891,154,094 | 807,631,803 |
| End of period | $1,084,673,376 | $891,154,094 |
| Other Information | | |
| Shares | | |
| Sold | 4,337,162 | 2,829,464 |
| Issued in reinvestment of distributions | 163,622 | 2,238,417 |
| Redeemed | (4,784,617) | (5,146,136) |
| Net increase (decrease) | (283,833) | (78,255) |
See accompanying notes which are an integral part of the financial statements.
Financial Highlights
Fidelity Pacific Basin Fund
| | | | | | |
| Years ended October 31, | 2020 | 2019 | 2018 | 2017 | 2016 |
| Selected Per–Share Data | | | | | |
| Net asset value, beginning of period | $32.65 | $29.51 | $35.53 | $28.82 | $27.01 |
| Income from Investment Operations | | | | | |
| Net investment income (loss)A | .16 | .26 | .22 | .25 | .24 |
| Net realized and unrealized gain (loss) | 7.61 | 5.74 | (4.69) | 7.09 | 2.88 |
| Total from investment operations | 7.77 | 6.00 | (4.47) | 7.34 | 3.12 |
| Distributions from net investment income | (.26) | (.20) | (.23) | (.17) | (.36) |
| Distributions from net realized gain | – | (2.67) | (1.32) | (.46) | (.95) |
| Total distributions | (.26) | (2.86)B | (1.55) | (.63) | (1.31) |
| Redemption fees added to paid in capitalA | – | – | –C | –C | –C |
| Net asset value, end of period | $40.16 | $32.65 | $29.51 | $35.53 | $28.82 |
| Total ReturnD | 23.95% | 22.37% | (13.24)% | 26.22% | 12.05% |
| Ratios to Average Net AssetsE,F | | | | | |
| Expenses before reductions | 1.11% | .97% | 1.07% | 1.11% | 1.19% |
| Expenses net of fee waivers, if any | 1.11% | .97% | 1.07% | 1.11% | 1.19% |
| Expenses net of all reductions | 1.10% | .97% | 1.06% | 1.10% | 1.19% |
| Net investment income (loss) | .47% | .88% | .62% | .84% | .87% |
| Supplemental Data | | | | | |
| Net assets, end of period (000 omitted) | $1,084,673 | $891,154 | $807,632 | $975,259 | $688,318 |
| Portfolio turnover rateG | 27% | 32% | 37% | 36% | 30% |
A Calculated based on average shares outstanding during the period.
B Total distributions per share do not sum due to rounding.
C Amount represents less than $.005 per share.
D Total returns would have been lower if certain expenses had not been reduced during the applicable periods shown.
E Fees and expenses of any underlying mutual funds or exchange-traded funds (ETFs) are not included in the Fund's expense ratio. The Fund indirectly bears its proportionate share of these expenses. For additional expense information related to investments in Fidelity Central Funds, please refer to the "Investments in Fidelity Central Funds" note found in the Notes to Financial Statements section of the most recent Annual or Semi-Annual report.
F Expense ratios reflect operating expenses of the class. Expenses before reductions do not reflect amounts reimbursed, waived, or reduced through arrangements with the investment advisor, brokerage services, or other offset arrangements, if applicable, and do not represent the amount paid by the class during periods when reimbursements, waivers or reductions occur.
G Amount does not include the portfolio activity of any underlying mutual funds or exchange-traded funds (ETFs).
See accompanying notes which are an integral part of the financial statements.
Notes to Financial Statements
For the period ended October 31, 2020
1. Organization.
Fidelity Pacific Basin Fund (the Fund) is a fund of Fidelity Investment Trust (the Trust) and is authorized to issue an unlimited number of shares. Share transactions on the Statement of Changes in Net Assets may contain exchanges between affiliated funds. The Trust is registered under the Investment Company Act of 1940, as amended (the 1940 Act), as an open-end management investment company organized as a Massachusetts business trust. The Fund's investments in emerging markets can be subject to social, economic, regulatory, and political uncertainties and can be extremely volatile.
Effective January 1, 2020:
Investment advisers Fidelity Investments Money Management, Inc., FMR Co., Inc., and Fidelity SelectCo, LLC, merged with and into Fidelity Management & Research Company. In connection with the merger transactions, the resulting, merged investment adviser was then redomiciled from Massachusetts to Delaware, changed its corporate structure from a corporation to a limited liability company, and changed its name to "Fidelity Management & Research Company LLC".
Fidelity Investments Institutional Operations Company, Inc. converted from a Massachusetts corporation to a Massachusetts LLC, and changed its name to "Fidelity Investments Institutional Operations Company LLC".
2. Investments in Fidelity Central Funds.
The Fund invests in Fidelity Central Funds, which are open-end investment companies generally available only to other investment companies and accounts managed by the investment adviser and its affiliates. The Fund's Schedule of Investments lists each of the Fidelity Central Funds held as of period end, if any, as an investment of the Fund, but does not include the underlying holdings of each Fidelity Central Fund. As an Investing Fund, the Fund indirectly bears its proportionate share of the expenses of the underlying Fidelity Central Funds.
The Money Market Central Funds seek preservation of capital and current income and are managed by the investment adviser. Annualized expenses of the Money Market Central Funds as of their most recent shareholder report date ranged from less than .005% to .01%.
A complete unaudited list of holdings for each Fidelity Central Fund is available upon request or at the Securities and Exchange Commission (the SEC) website at www.sec.gov. In addition, the financial statements of the Fidelity Central Funds, which are not covered by the Fund's Report of Independent Registered Public Accounting Firm, are available on the SEC website or upon request.
3. Significant Accounting Policies.
The Fund is an investment company and applies the accounting and reporting guidance of the Financial Accounting Standards Board (FASB) Accounting Standards Codification Topic 946 Financial Services – Investment Companies. The financial statements have been prepared in conformity with accounting principles generally accepted in the United States of America (GAAP), which require management to make certain estimates and assumptions at the date of the financial statements. Actual results could differ from those estimates. Subsequent events, if any, through the date that the financial statements were issued have been evaluated in the preparation of the financial statements. The following summarizes the significant accounting policies of the Fund:
Investment Valuation. Investments are valued as of 4:00 p.m. Eastern time on the last calendar day of the period. The Board of Trustees (the Board) has delegated the day to day responsibility for the valuation of the Fund's investments to the Fair Value Committee (the Committee) established by the Fund's investment adviser. In accordance with valuation policies and procedures approved by the Board, the Fund attempts to obtain prices from one or more third party pricing vendors or brokers to value its investments. When current market prices, quotations or currency exchange rates are not readily available or reliable, investments will be fair valued in good faith by the Committee, in accordance with procedures adopted by the Board. Factors used in determining fair value vary by investment type and may include market or investment specific events. The frequency with which these procedures are used cannot be predicted and they may be utilized to a significant extent. The Committee oversees the Fund's valuation policies and procedures and reports to the Board on the Committee's activities and fair value determinations. The Board monitors the appropriateness of the procedures used in valuing the Fund's investments and ratifies the fair value determinations of the Committee.
The Fund categorizes the inputs to valuation techniques used to value its investments into a disclosure hierarchy consisting of three levels as shown below:
- Level 1 – quoted prices in active markets for identical investments
- Level 2 – other significant observable inputs (including quoted prices for similar investments, interest rates, prepayment speeds, etc.)
- Level 3 – unobservable inputs (including the Fund's own assumptions based on the best information available)
Valuation techniques used to value the Fund's investments by major category are as follows:
Equity securities, including restricted securities, for which market quotations are readily available, are valued at the last reported sale price or official closing price as reported by a third party pricing vendor on the primary market or exchange on which they are traded and are categorized as Level 1 in the hierarchy. In the event there were no sales during the day or closing prices are not available, securities are valued at the last quoted bid price or may be valued using the last available price and are generally categorized as Level 2 in the hierarchy. For foreign equity securities, when market or security specific events arise, comparisons to the valuation of American Depositary Receipts (ADRs), futures contracts, Exchange-Traded Funds (ETFs) and certain indexes as well as quoted prices for similar securities may be used and would be categorized as Level 2 in the hierarchy. For equity securities, including restricted securities, where observable inputs are limited, assumptions about market activity and risk are used and these securities may be categorized as Level 3 in the hierarchy.
Investments in open-end mutual funds, including the Fidelity Central Funds, are valued at their closing net asset value (NAV) each business day and are categorized as Level 1 in the hierarchy.
Changes in valuation techniques may result in transfers in or out of an assigned level within the disclosure hierarchy. The aggregate value of investments by input level as of October 31, 2020 is included at the end of the Fund's Schedule of Investments.
Foreign Currency. Certain Funds may use foreign currency contracts to facilitate transactions in foreign-denominated securities. Gains and losses from these transactions may arise from changes in the value of the foreign currency or if the counterparties do not perform under the contracts' terms.
Foreign-denominated assets, including investment securities, and liabilities are translated into U.S. dollars at the exchange rates at period end. Purchases and sales of investment securities, income and dividends received, and expenses denominated in foreign currencies are translated into U.S. dollars at the exchange rate in effect on the transaction date.
The effects of exchange rate fluctuations on investments are included with the net realized and unrealized gain (loss) on investment securities. Other foreign currency transactions resulting in realized and unrealized gain (loss) are disclosed separately.
Investment Transactions and Income. For financial reporting purposes, the Fund's investment holdings and NAV include trades executed through the end of the last business day of the period. The NAV per share for processing shareholder transactions is calculated as of the close of business of the New York Stock Exchange (NYSE), normally 4:00 p.m. Eastern time and includes trades executed through the end of the prior business day. Gains and losses on securities sold are determined on the basis of identified cost. Dividend income is recorded on the ex-dividend date, except for certain dividends from foreign securities where the ex-dividend date may have passed, which are recorded as soon as the Fund is informed of the ex-dividend date. Non-cash dividends included in dividend income, if any, are recorded at the fair market value of the securities received. Income and capital gain distributions from Fidelity Central Funds, if any, are recorded on the ex-dividend date. Investment income is recorded net of foreign taxes withheld where recovery of such taxes is uncertain.
Expenses. Expenses directly attributable to a fund are charged to that fund. Expenses attributable to more than one fund are allocated among the respective funds on the basis of relative net assets or other appropriate methods. Expense estimates are accrued in the period to which they relate and adjustments are made when actual amounts are known.
Income Tax Information and Distributions to Shareholders. Each year, the Fund intends to qualify as a regulated investment company under Subchapter M of the Internal Revenue Code, including distributing substantially all of its taxable income and realized gains. As a result, no provision for U.S. Federal income taxes is required. As of October 31, 2020, the Fund did not have any unrecognized tax benefits in the financial statements; nor is the Fund aware of any tax positions for which it is reasonably possible that the total amounts of unrecognized tax benefits will significantly change in the next twelve months. The Fund files a U.S. federal tax return, in addition to state and local tax returns as required. The Fund's federal income tax returns are subject to examination by the Internal Revenue Service (IRS) for a period of three fiscal years after they are filed. State and local tax returns may be subject to examination for an additional fiscal year depending on the jurisdiction. Foreign taxes are provided for based on the Fund's understanding of the tax rules and rates that exist in the foreign markets in which it invests. The Fund is subject to a tax imposed on capital gains by certain countries in which it invests. An estimated deferred tax liability for net unrealized appreciation on the applicable securities is included in Other payables and accrued expenses on the Statement of Assets & Liabilities.
Distributions are declared and recorded on the ex-dividend date. Income and capital gain distributions are determined in accordance with income tax regulations, which may differ from GAAP. In addition, the Fund claimed a portion of the payment made to redeeming shareholders as a distribution for income tax purposes.
Capital accounts within the financial statements are adjusted for permanent book-tax differences. These adjustments have no impact on net assets or the results of operations. Capital accounts are not adjusted for temporary book-tax differences which will reverse in a subsequent period.
Book-tax differences are primarily due to foreign currency transactions, certain foreign taxes, passive foreign investment companies (PFIC), capital loss carryforwards and losses deferred due to wash sales.
As of period end, the cost and unrealized appreciation (depreciation) in securities, and derivatives if applicable, for federal income tax purposes were as follows:
| Gross unrealized appreciation | $409,453,103 |
| Gross unrealized depreciation | (44,461,782) |
| Net unrealized appreciation (depreciation) | $364,991,321 |
| Tax Cost | $719,910,007 |
The tax-based components of distributable earnings as of period end were as follows:
| Undistributed ordinary income | $3,226,600 |
| Undistributed long-term capital gain | $49,995,159 |
| Net unrealized appreciation (depreciation) on securities and other investments | $364,994,129 |
The tax character of distributions paid was as follows:
| | October 31, 2020 | October 31, 2019 |
| Ordinary Income | $7,073,863 | $ 5,312,193 |
| Long-term Capital Gains | – | 72,681,692 |
| Total | $7,073,863 | $ 77,993,885 |
Restricted Securities (including Private Placements). The Fund may invest in securities that are subject to legal or contractual restrictions on resale. These securities generally may be resold in transactions exempt from registration or to the public if the securities are registered. Disposal of these securities may involve time-consuming negotiations and expense, and prompt sale at an acceptable price may be difficult. Information regarding restricted securities is included at the end of the Fund's Schedule of Investments.
4. Purchases and Sales of Investments.
Purchases and sales of securities, other than short-term securities, are noted in the table below.
| | Purchases ($) | Sales ($) |
| Fidelity Pacific Basin Fund | 247,397,491 | 269,311,354 |
5. Fees and Other Transactions with Affiliates.
Management Fee. Fidelity Management & Research Company LLC (the investment adviser) and its affiliates provide the Fund with investment management related services for which the Fund pays a monthly management fee. The management fee is the sum of an individual fund fee rate that is based on an annual rate of .45% of the Fund's average net assets and an annualized group fee rate that averaged .23% during the period. The group fee rate is based upon the monthly average net assets of a group of registered investment companies with which the investment adviser has management contracts. The group fee rate decreases as assets under management increase and increases as assets under management decrease. In addition, the management fee is subject to a performance adjustment (up to a maximum of +/- .20% of the Fund's average net assets over a 36 month performance period). The upward or downward adjustment to the management fee is based on the Fund's relative investment performance as compared to its benchmark index, the MSCI All Country Pacific Index, over the same 36 month performance period. For the reporting period, the total annual management fee rate, including the performance adjustment, was .87% of the Fund's average net assets. The performance adjustment included in the management fee rate may be higher or lower than the maximum performance adjustment rate due to the difference between the average net assets for the reporting and performance periods.
Transfer Agent Fees. Fidelity Investments Institutional Operations Company LLC (FIIOC), an affiliate of the investment adviser, is the Fund's transfer, dividend disbursing and shareholder servicing agent. FIIOC receives account fees and asset-based fees that vary according to account size and type of account. FIIOC pays for typesetting, printing and mailing of shareholder reports, except proxy statements. For the period, the transfer agent fees were equivalent to an annual rate of .15% of average net assets.
Accounting Fees. Fidelity Service Company, Inc. (FSC), an affiliate of the investment adviser, maintains the Fund's accounting records. The accounting fee is based on the level of average net assets for each month. For the period, the fees were equivalent to the following annual rates:
| | % of Average Net Assets |
| Fidelity Pacific Basin Fund | .05 |
Brokerage Commissions. A portion of portfolio transactions were placed with brokerage firms which are affiliates of the investment adviser. Brokerage commissions are included in net realized gain (loss) and change in net unrealized appreciation (depreciation) in the Statement of Operations. The commissions paid to these affiliated firms were as follows:
| | Amount |
| Fidelity Pacific Basin Fund | $465 |
Interfund Trades. Funds may purchase from or sell securities to other Fidelity Funds under procedures adopted by the Board. The procedures have been designed to ensure these interfund trades are executed in accordance with Rule 17a-7 of the 1940 Act. Interfund trades are included within the respective purchases and sales amounts shown in the Purchases and Sales of Investments note.
6. Committed Line of Credit.
Certain Funds participate with other funds managed by the investment adviser or an affiliate in a $4.25 billion credit facility (the "line of credit") to be utilized for temporary or emergency purposes to fund shareholder redemptions or for other short-term liquidity purposes. The participating funds have agreed to pay commitment fees on their pro-rata portion of the line of credit, which are reflected in Miscellaneous expenses on the Statement of Operations, and are as follows:
| | Amount |
| Fidelity Pacific Basin Fund | $2,153 |
During the period, there were no borrowings on this line of credit.
7. Security Lending.
Funds lend portfolio securities from time to time in order to earn additional income. Lending agents are used, including National Financial Services (NFS), an affiliate of the investment adviser. Pursuant to a securities lending agreement, NFS will receive a fee, which is capped at 9.9% of a fund's daily lending revenue, for its services as lending agent. A fund may lend securities to certain qualified borrowers, including NFS. On the settlement date of the loan, a fund receives collateral (in the form of U.S. Treasury obligations, letters of credit and/or cash) against the loaned securities and maintains collateral in an amount not less than 100% of the market value of the loaned securities during the period of the loan. The market value of the loaned securities is determined at the close of business of a fund and any additional required collateral is delivered to a fund on the next business day. A fund or borrower may terminate the loan at any time, and if the borrower defaults on its obligation to return the securities loaned because of insolvency or other reasons, a fund may apply collateral received from the borrower against the obligation. A fund may experience delays and costs in recovering the securities loaned. Any cash collateral received is invested in the Fidelity Securities Lending Cash Central Fund. Any loaned securities are identified as such in the Schedule of Investments, and the value of loaned securities and cash collateral at period end, as applicable, are presented in the Statement of Assets and Liabilities. Security lending income represents the income earned on investing cash collateral, less rebates paid to borrowers and any lending agent fees associated with the loan, plus any premium payments received for lending certain types of securities. Security lending income is presented in the Statement of Operations as a component of income from Fidelity Central Funds. Affiliated security lending activity, if any, was as follows:
| | Total Security Lending Income Fees Paid to NFS | Security Lending Income From Securities Loaned to NFS | Value of Securities Loaned to NFS at Period End |
| Fidelity Pacific Basin Fund | $– | $– | $– |
8. Expense Reductions.
Commissions paid to certain brokers with whom the investment adviser, or its affiliates, places trades on behalf of the Fund include an amount in addition to trade execution, which may be rebated back to the Fund to offset certain expenses. This amount totaled $78,596 for the period.
In addition, during the period the investment adviser or an affiliate reimbursed and/or waived a portion of operating expenses in the amount of $3,741.
9. Other.
The Fund's organizational documents provide former and current trustees and officers with a limited indemnification against liabilities arising in connection with the performance of their duties to the Fund. In the normal course of business, the Fund may also enter into contracts that provide general indemnifications. The Fund's maximum exposure under these arrangements is unknown as this would be dependent on future claims that may be made against the Fund. The risk of material loss from such claims is considered remote.
At the end of the period, Strategic Advisers Fidelity International Fund was the owner of record of approximately 18% of the total outstanding shares of the Fund. Mutual funds managed by the investment adviser or its affiliates were the owners of record, in the aggregate, of approximately 27% of the total outstanding shares of the Fund.
10. Coronavirus (COVID-19) Pandemic.
An outbreak of COVID-19 first detected in China during December 2019 has since spread globally and was declared a pandemic by the World Health Organization during March 2020. Developments that disrupt global economies and financial markets, such as the COVID-19 pandemic, may magnify factors that affect the Fund's performance.
Report of Independent Registered Public Accounting Firm
To the Board of Trustees of Fidelity Investment Trust and the Shareholders of Fidelity Canada Fund, Fidelity China Region Fund, Fidelity Emerging Asia Fund, Fidelity Emerging Markets Fund, Fidelity Europe Fund, Fidelity Japan Fund, Fidelity Japan Smaller Companies Fund, Fidelity Latin America Fund, Fidelity Nordic Fund and Fidelity Pacific Basin Fund
Opinions on the Financial Statements
We have audited the accompanying statements of assets and liabilities, including the schedules of investments, of Fidelity Canada Fund, Fidelity China Region Fund, Fidelity Emerging Asia Fund, Fidelity Emerging Markets Fund, Fidelity Europe Fund, Fidelity Japan Fund, Fidelity Japan Smaller Companies Fund, Fidelity Latin America Fund, Fidelity Nordic Fund, and Fidelity Pacific Basin Fund (ten of the funds constituting Fidelity Investment Trust, hereafter collectively referred to as the “Funds”) as of October 31, 2020, the related statements of operations for the year ended October 31, 2020, the statements of changes in net assets for each of the two years in the period ended October 31, 2020, including the related notes, and the financial highlights for each of the periods indicated therein (collectively referred to as the “financial statements”). In our opinion, the financial statements present fairly, in all material respects, the financial position of each of the Funds as of October 31, 2020, the results of each of their operations for the year then ended, the changes in each of their net assets for each of the two years in the period ended October 31, 2020 and each of the financial highlights for each of the periods indicated therein in conformity with accounting principles generally accepted in the United States of America.
Basis for Opinions
These financial statements are the responsibility of the Funds' management. Our responsibility is to express an opinion on the Funds' financial statements based on our audits. We are a public accounting firm registered with the Public Company Accounting Oversight Board (United States) (PCAOB) and are required to be independent with respect to the Funds in accordance with the U.S. federal securities laws and the applicable rules and regulations of the Securities and Exchange Commission and the PCAOB.
We conducted our audits of these financial statements in accordance with the standards of the PCAOB. Those standards require that we plan and perform the audit to obtain reasonable assurance about whether the financial statements are free of material misstatement, whether due to error or fraud.
Our audits included performing procedures to assess the risks of material misstatement of the financial statements, whether due to error or fraud, and performing procedures that respond to those risks. Such procedures included examining, on a test basis, evidence regarding the amounts and disclosures in the financial statements. Our audits also included evaluating the accounting principles used and significant estimates made by management, as well as evaluating the overall presentation of the financial statements. Our procedures included confirmation of securities owned as of October 31, 2020 by correspondence with the custodian, issuers of privately offered securities and brokers; when replies were not received from brokers, we performed other auditing procedures. We believe that our audits provide a reasonable basis for our opinions.
/s/ PricewaterhouseCoopers LLP
Boston, Massachusetts
December 14, 2020
We have served as the auditor of one or more investment companies in the Fidelity group of funds since 1932.
Trustees and Officers
The Trustees, Members of the Advisory Board (if any), and officers of the trust and funds, as applicable, are listed below. The Board of Trustees governs each fund and is responsible for protecting the interests of shareholders. The Trustees are experienced executives who meet periodically throughout the year to oversee each fund's activities, review contractual arrangements with companies that provide services to each fund, oversee management of the risks associated with such activities and contractual arrangements, and review each fund's performance. Except for Jonathan Chiel, each of the Trustees oversees 305 funds. Mr. Chiel oversees 176 funds.
The Trustees hold office without limit in time except that (a) any Trustee may resign; (b) any Trustee may be removed by written instrument, signed by at least two-thirds of the number of Trustees prior to such removal; (c) any Trustee who requests to be retired or who has become incapacitated by illness or injury may be retired by written instrument signed by a majority of the other Trustees; and (d) any Trustee may be removed at any special meeting of shareholders by a two-thirds vote of the outstanding voting securities of the trust. Each Trustee who is not an interested person (as defined in the 1940 Act) of the trust and the funds is referred to herein as an Independent Trustee. Each Independent Trustee shall retire not later than the last day of the calendar year in which his or her 75th birthday occurs. The Independent Trustees may waive this mandatory retirement age policy with respect to individual Trustees. Officers and Advisory Board Members hold office without limit in time, except that any officer or Advisory Board Member may resign or may be removed by a vote of a majority of the Trustees at any regular meeting or any special meeting of the Trustees. Except as indicated, each individual has held the office shown or other offices in the same company for the past five years.
Each fund's Statement of Additional Information (SAI) includes more information about the Trustees. To request a free copy, call Fidelity at 1-800-544-8544 if you’re an individual investing directly with Fidelity, call 1-800-835-5092 if you’re a plan sponsor or participant with Fidelity as your recordkeeper or call 1-877-208-0098 on institutional accounts or if you’re an advisor or invest through one.
Experience, Skills, Attributes, and Qualifications of the Trustees. The Governance and Nominating Committee has adopted a statement of policy that describes the experience, qualifications, attributes, and skills that are necessary and desirable for potential Independent Trustee candidates (Statement of Policy). The Board believes that each Trustee satisfied at the time he or she was initially elected or appointed a Trustee, and continues to satisfy, the standards contemplated by the Statement of Policy. The Governance and Nominating Committee also engages professional search firms to help identify potential Independent Trustee candidates who have the experience, qualifications, attributes, and skills consistent with the Statement of Policy. From time to time, additional criteria based on the composition and skills of the current Independent Trustees, as well as experience or skills that may be appropriate in light of future changes to board composition, business conditions, and regulatory or other developments, have also been considered by the professional search firms and the Governance and Nominating Committee. In addition, the Board takes into account the Trustees' commitment and participation in Board and committee meetings, as well as their leadership of standing and ad hoc committees throughout their tenure.
In determining that a particular Trustee was and continues to be qualified to serve as a Trustee, the Board has considered a variety of criteria, none of which, in isolation, was controlling. The Board believes that, collectively, the Trustees have balanced and diverse experience, qualifications, attributes, and skills, which allow the Board to operate effectively in governing each fund and protecting the interests of shareholders. Information about the specific experience, skills, attributes, and qualifications of each Trustee, which in each case led to the Board's conclusion that the Trustee should serve (or continue to serve) as a trustee of the funds, is provided below.
Board Structure and Oversight Function. Robert A. Lawrence is an interested person and currently serves as Acting Chairman. The Trustees have determined that an interested Chairman is appropriate and benefits shareholders because an interested Chairman has a personal and professional stake in the quality and continuity of services provided to the funds. Independent Trustees exercise their informed business judgment to appoint an individual of their choosing to serve as Chairman, regardless of whether the Trustee happens to be independent or a member of management. The Independent Trustees have determined that they can act independently and effectively without having an Independent Trustee serve as Chairman and that a key structural component for assuring that they are in a position to do so is for the Independent Trustees to constitute a substantial majority for the Board. The Independent Trustees also regularly meet in executive session. Ned C. Lautenbach and David M. Thomas serve as Co-Lead Independent Trustees and as such each (i) acts as a liaison between the Independent Trustees and management with respect to matters important to the Independent Trustees and (ii) with management prepares agendas for Board meetings.
Fidelity® funds are overseen by different Boards of Trustees. The funds' Board oversees Fidelity's high income and certain equity funds, and other Boards oversee Fidelity's investment-grade bond, money market, asset allocation, and other equity funds. The asset allocation funds may invest in Fidelity® funds overseen by the funds' Board. The use of separate Boards, each with its own committee structure, allows the Trustees of each group of Fidelity® funds to focus on the unique issues of the funds they oversee, including common research, investment, and operational issues. On occasion, the separate Boards establish joint committees to address issues of overlapping consequences for the Fidelity® funds overseen by each Board.
The Trustees operate using a system of committees to facilitate the timely and efficient consideration of all matters of importance to the Trustees, each fund, and fund shareholders and to facilitate compliance with legal and regulatory requirements and oversight of the funds' activities and associated risks. The Board, acting through its committees, has charged FMR and its affiliates with (i) identifying events or circumstances the occurrence of which could have demonstrably adverse effects on the funds' business and/or reputation; (ii) implementing processes and controls to lessen the possibility that such events or circumstances occur or to mitigate the effects of such events or circumstances if they do occur; and (iii) creating and maintaining a system designed to evaluate continuously business and market conditions in order to facilitate the identification and implementation processes described in (i) and (ii) above. Because the day-to-day operations and activities of the funds are carried out by or through FMR, its affiliates, and other service providers, the funds' exposure to risks is mitigated but not eliminated by the processes overseen by the Trustees. While each of the Board's committees has responsibility for overseeing different aspects of the funds' activities, oversight is exercised primarily through the Operations, Audit, and Compliance Committees. Appropriate personnel, including but not limited to the funds' Chief Compliance Officer (CCO), FMR's internal auditor, the independent accountants, the funds' Treasurer and portfolio management personnel, make periodic reports to the Board's committees, as appropriate, including an annual review of Fidelity's risk management program for the Fidelity® funds. The responsibilities of each standing committee, including their oversight responsibilities, are described further under "Standing Committees of the Trustees."
Interested Trustees*:
Correspondence intended for a Trustee who is an interested person may be sent to Fidelity Investments, 245 Summer Street, Boston, Massachusetts 02210.
Name, Year of Birth; Principal Occupations and Other Relevant Experience+
Jonathan Chiel (1957)
Year of Election or Appointment: 2016
Trustee
Mr. Chiel also serves as Trustee of other Fidelity® funds. Mr. Chiel is Executive Vice President and General Counsel for FMR LLC (diversified financial services company, 2012-present). Previously, Mr. Chiel served as general counsel (2004-2012) and senior vice president and deputy general counsel (2000-2004) for John Hancock Financial Services; a partner with Choate, Hall & Stewart (1996-2000) (law firm); and an Assistant United States Attorney for the United States Attorney’s Office of the District of Massachusetts (1986-95), including Chief of the Criminal Division (1993-1995). Mr. Chiel is a director on the boards of the Boston Bar Foundation and the Maimonides School.
Robert A. Lawrence (1952)
Year of Election or Appointment: 2020
Trustee
Acting Chairman of the Board of Trustees
Mr. Lawrence also serves as Trustee of other funds. Previously, Mr. Lawrence served as a Member of the Advisory Board of certain funds. Prior to his retirement in 2008, Mr. Lawrence served as Vice President of certain Fidelity® funds (2006-2008), Senior Vice President, Head of High Income Division of Fidelity Management & Research Company (investment adviser firm, 2006-2008), and President of Fidelity Strategic Investments (investment adviser firm, 2002-2005).
* Determined to be an “Interested Trustee” by virtue of, among other things, his or her affiliation with the trust or various entities under common control with FMR.
+ The information includes the Trustee's principal occupation during the last five years and other information relating to the experience, attributes, and skills relevant to the Trustee's qualifications to serve as a Trustee, which led to the conclusion that the Trustee should serve as a Trustee for each fund.
Independent Trustees:
Correspondence intended for an Independent Trustee may be sent to Fidelity Investments, P.O. Box 55235, Boston, Massachusetts 02205-5235.
Name, Year of Birth; Principal Occupations and Other Relevant Experience+
Dennis J. Dirks (1948)
Year of Election or Appointment: 2005
Trustee
Mr. Dirks also serves as Trustee of other Fidelity® funds. Prior to his retirement in May 2003, Mr. Dirks served as Chief Operating Officer and as a member of the Board of The Depository Trust & Clearing Corporation (financial markets infrastructure), President, Chief Operating Officer and a member of the Board of The Depository Trust Company (DTC), President and a member of the Board of the National Securities Clearing Corporation (NSCC), Chief Executive Officer and a member of the Board of the Government Securities Clearing Corporation and Chief Executive Officer and a member of the Board of the Mortgage-Backed Securities Clearing Corporation. Mr. Dirks currently serves as a member of the Finance Committee (2016-present) and Board (2017-present) and is Treasurer (2018-present) of the Asolo Repertory Theatre.
Donald F. Donahue (1950)
Year of Election or Appointment: 2018
Trustee
Mr. Donahue also serves as Trustee of other Fidelity® funds. Mr. Donahue serves as President and Chief Executive Officer of Miranda Partners, LLC (risk consulting for the financial services industry, 2012-present). Previously, Mr. Donahue served as Chief Executive Officer (2006-2012), Chief Operating Officer (2003-2006) and Managing Director, Customer Marketing and Development (1999-2003) of The Depository Trust & Clearing Corporation (financial markets infrastructure). Mr. Donahue currently serves as a member (2007-present) and Co-Chairman (2016-present) of the Board of United Way of New York, a member of the Board of NYC Leadership Academy (2012-present) and a member of the Board of Advisors of Ripple Labs, Inc. (financial services, 2015-present). Mr. Donahue previously served as a member of the Advisory Board of certain Fidelity® funds (2015-2018).
Vicki L. Fuller (1957)
Year of Election or Appointment: 2020
Trustee
Ms. Fuller also serves as Trustee of other Fidelity® funds. Previously, Ms. Fuller served as a member of the Advisory Board of certain Fidelity® funds (2018-2020), Chief Investment Officer of the New York State Common Retirement Fund (2012-2018) and held a variety of positions at AllianceBernstein L.P. (global asset management, 1985-2012), including Managing Director (2006-2012) and Senior Vice President and Senior Portfolio Manager (2001-2006). Ms. Fuller currently serves as a member of the Board, Audit Committee and Nominating and Governance Committee of The Williams Companies, Inc. (natural gas infrastructure, 2018-present), as a member of the Board, Audit Committee and Nominating and Governance Committee of two Blackstone business development companies (2020-present) and as a member of the Board of Treliant, LLC (consulting, 2019-present).
Patricia L. Kampling (1959)
Year of Election or Appointment: 2020
Trustee
Ms. Kampling also serves as Trustee of other Fidelity® funds. Prior to her retirement, Ms. Kampling served as Chairman of the Board and Chief Executive Officer (2012-2019), President and Chief Operating Officer (2011-2012) and Executive Vice President and Chief Financial Officer (2010-2011) of Alliant Energy Corporation. Ms. Kampling currently serves as a member of the Board, Compensation Committee and Executive Committee and as Chair of the Audit Committee of Briggs & Stratton Corporation (manufacturing, 2011-present) and as a member of the Board, Audit, Finance and Risk Committee and Safety, Environmental, Technology and Operations Committee of American Water Works Company, Inc. (utilities company, 2019-present). In addition, Ms. Kampling currently serves as a member of the Board of the Nature Conservancy, Wisconsin Chapter (2019-present). Previously, Ms. Kampling served as a Member of the Advisory Board of certain Fidelity® funds (2020), a member of the Board of Interstate Power and Light Company (2012-2019) and Wisconsin Power and Light Company (2012-2019) (each a subsidiary of Alliant Energy Corporation) and as a member of the Board and Workforce Development Committee of the Business Roundtable (2018-2019).
Alan J. Lacy (1953)
Year of Election or Appointment: 2008
Trustee
Mr. Lacy also serves as Trustee of other Fidelity® funds. Previously, Mr. Lacy served as Senior Adviser (2007-2014) of Oak Hill Capital Partners, L.P. (private equity), Chief Executive Officer (2005) and Vice Chairman (2005-2006) of Sears Holdings Corporation (retail), Chief Executive Officer and Chairman of the Board of Sears, Roebuck and Co. (retail, 2000-2005), Chairman (2014-2017) and a member of the Board (2010-2017) of Dave & Buster’s Entertainment, Inc. (restaurant and entertainment complexes) and a member of the Board of Bristol-Myers Squibb Company (global pharmaceuticals, 2008-2020). Mr. Lacy currently serves as a Trustee of the California Chapter of The Nature Conservancy (2015-present) and a member of the Board of the Center for Advanced Study in the Behavioral Sciences at Stanford University (2015-present).
Ned C. Lautenbach (1944)
Year of Election or Appointment: 2000
Trustee
Co-Lead Independent Trustee
Mr. Lautenbach also serves as Trustee of other Fidelity® funds. Mr. Lautenbach currently serves as Chair of the Board of Governors, State University System of Florida (2013-present) and is a member of the Council on Foreign Relations (1994-present). He is also a member and has in the past served as Chairman of the Board of Directors of Artis-Naples (2012-present). Previously, Mr. Lautenbach served as a member and then Lead Director of the Board of Directors of Eaton Corporation (diversified industrial, 1997-2016). He was also a Partner at Clayton, Dubilier & Rice, LLC (private equity investment, 1998-2010); as well as Director of Sony Corporation (2006-2007). In addition, Mr. Lautenbach had a 30-year career with IBM (technology company), during which time he served as Senior Vice President and as a member of the Corporate Executive Committee (1968-1998).
Joseph Mauriello (1944)
Year of Election or Appointment: 2008
Trustee
Mr. Mauriello also serves as Trustee of other Fidelity® funds. Prior to his retirement in January 2006, Mr. Mauriello served in numerous senior management positions including Deputy Chairman and Chief Operating Officer (2004-2005), and Vice Chairman of Financial Services (2002-2004) of KPMG LLP US (professional services, 1965-2005). Mr. Mauriello currently serves as a member of the Independent Directors Council Governing Council (2015-present). Previously, Mr. Mauriello served as a member of the Board of XL Group plc. (global insurance and re-insurance, 2006-2018).
Cornelia M. Small (1944)
Year of Election or Appointment: 2005
Trustee
Ms. Small also serves as Trustee of other Fidelity® funds. Previously, Ms. Small served as Chief Investment Officer, Director of Global Equity Investments and a member of Scudder, Stevens & Clark and Scudder Kemper Investments. Ms. Small previously served as a member of the Board (2009-2019) and Chair of the Investment Committee (2010-2019) of the Teagle Foundation and a member of the Investment Committee of the Berkshire Taconic Community Foundation (2008-2019).
Garnett A. Smith (1947)
Year of Election or Appointment: 2018
Trustee
Mr. Smith also serves as Trustee of other Fidelity® funds. Prior to his retirement, Mr. Smith served as Chairman and Chief Executive Officer (1990-1997) and President (1986-1990) of Inbrand Corp. (manufacturer of personal absorbent products). Prior to his employment with Inbrand Corp., he was employed by a retail fabric chain and North Carolina National Bank (now Bank of America). Mr. Smith previously served as a member of the Advisory Board of certain Fidelity® funds (2012-2013).
David M. Thomas (1949)
Year of Election or Appointment: 2008
Trustee
Co-Lead Independent Trustee
Mr. Thomas also serves as Trustee of other Fidelity® funds. Previously, Mr. Thomas served as Executive Chairman (2005-2006) and Chairman and Chief Executive Officer (2000-2005) of IMS Health, Inc. (pharmaceutical and healthcare information solutions). Mr. Thomas currently serves as Non-Executive Chairman of the Board of Fortune Brands Home and Security (home and security products, 2011-present), and a member of the Board (2004-present) and Presiding Director (2013-present) of Interpublic Group of Companies, Inc. (marketing communication).
Susan Tomasky (1953)
Year of Election or Appointment: 2020
Trustee
Ms. Tomasky also serves as Trustee of other Fidelity® funds. Prior to her retirement, Ms. Tomasky served in various executive officer positions at American Electric Power Company, Inc. (1998-2011), including most recently as President of AEP Transmission (2007-2011). Ms. Tomasky currently serves as a member of the Board and Sustainability Committee and as Chair of the Audit Committee of Marathon Petroleum Corporation (2018-present) and as a member of the Board, Corporate Governance Committee and Organization and Compensation Committee and as Chair of the Audit Committee of Public Service Enterprise Group, Inc. (utilities company, 2012-present). In addition, Ms. Tomasky currently serves as a member of the Board of the Columbus Regional Airport Authority (2007-present), as a member of the Board of the Royal Shakespeare Company – America (2009-present), as a member of the Board of the Columbus Association for the Performing Arts (2011-present) and as a member of the Board of Kenyon College (2016-present). Previously, Ms. Tomasky served as a Member of the Advisory Board of certain Fidelity® funds (2020), a member of the Board (2011-2019) and as Lead Independent Director (2015-2018) of Andeavor Corporation (previously Tesoro Corporation) (independent oil refiner and marketer) and as a member of the Board of Summit Midstream Partners LP (energy, 2012-2018).
Michael E. Wiley (1950)
Year of Election or Appointment: 2020
Trustee
Mr. Wiley also serves as Trustee of other Fidelity® funds. Previously, Mr. Wiley served as a member of the Advisory Board of certain Fidelity® funds (2018-2020), Chairman, President and CEO of Baker Hughes, Inc. (oilfield services, 2000-2004). Mr. Wiley also previously served as a member of the Board of Andeavor Corporation (independent oil refiner and marketer, 2005-2018), a member of the Board of Andeavor Logistics LP (natural resources logistics, 2015-2018) and a member of the Board of High Point Resources (exploration and production, 2005-2020).
+ The information includes the Trustee's principal occupation during the last five years and other information relating to the experience, attributes, and skills relevant to the Trustee's qualifications to serve as a Trustee, which led to the conclusion that the Trustee should serve as a Trustee for each fund.
Advisory Board Members and Officers:
Correspondence intended for a Member of the Advisory Board (if any) may be sent to Fidelity Investments, P.O. Box 55235, Boston, Massachusetts 02205-5235. Correspondence intended for an officer or Peter S. Lynch may be sent to Fidelity Investments, 245 Summer Street, Boston, Massachusetts 02210. Officers appear below in alphabetical order.
Name, Year of Birth; Principal Occupation
Lloyd James Austin, III (1953)
Year of Election or Appointment: 2020
Member of the Advisory Board
General Austin also serves as a Member of the Advisory Board of other Fidelity® funds. Prior to his retirement, General Austin (United States Army, Retired) held a variety of positions within the U.S. Government, including Commander, U.S. Central Command (2013-2016), Vice Chief of Staff, U.S. Army (2012-2013) and Commanding General, U.S. Forces – Iraq, Operation New Dawn (2010-2012). General Austin currently serves as a Partner of Pine Island Capital Partners (private equity, 2020-present) and as President of the Austin Strategy Group LLC (consulting, 2016-present). General Austin serves as a member of the Board of Directors of Nucor Corporation (steel products, 2017-present), as a member of the Board of Directors of Tenet Healthcare Corporation (2018-present) and as a member of the Board of Directors of Raytheon Technologies Corporation (aerospace and defense, 2020-present). In addition, General Austin currently serves as a member of the Board of Trustees of the Carnegie Corporation of New York (2017-present) and as a member of the Board of Trustees of Auburn University (2017-present). Previously, General Austin served as a member of the Board of Directors of United Technologies Corporation (aerospace, defense and building, 2016-2020).
Thomas A. Kennedy (1955)
Year of Election or Appointment: 2020
Member of the Advisory Board
Mr. Kennedy also serves as a Member of the Advisory Board of other Fidelity® funds. Previously, Mr. Kennedy held a variety of positions at Raytheon Company (aerospace and defense, 1983-2020), including Chairman and Chief Executive Officer (2014-2020) and Executive Vice President and Chief Operating Officer (2013-2014). Mr. Kennedy currently serves as Executive Chairman of the Board of Directors of Raytheon Technologies Corporation (aerospace and defense, 2020-present). He is also a member of the Rutgers School of Engineering Industry Advisory Board (2011-present) and a member of the UCLA Engineering Dean’s Executive Board (2016-present).
Peter S. Lynch (1944)
Year of Election or Appointment: 2003
Member of the Advisory Board
Mr. Lynch also serves as a Member of the Advisory Board of other Fidelity® funds. Mr. Lynch is Vice Chairman and a Director of Fidelity Management & Research Company LLC (investment adviser firm). In addition, Mr. Lynch serves as a Trustee of Boston College and as the Chairman of the Inner-City Scholarship Fund. Previously, Mr. Lynch served as Vice Chairman and a Director of FMR Co., Inc. (investment adviser firm) and on the Special Olympics International Board of Directors (1997-2006).
Elizabeth Paige Baumann (1968)
Year of Election or Appointment: 2017
Anti-Money Laundering (AML) Officer
Ms. Baumann also serves as AML Officer of other funds. She is Chief AML Officer (2012-present) and Senior Vice President (2014-present) of FMR LLC (diversified financial services company) and is an employee of Fidelity Investments. Previously, Ms. Baumann served as AML Officer of certain funds (2017-2019), as AML Officer of the funds (2012-2016), and Vice President (2007-2014) and Deputy Anti-Money Laundering Officer (2007-2012) of FMR LLC.
Craig S. Brown (1977)
Year of Election or Appointment: 2019
Assistant Treasurer
Mr. Brown also serves as Assistant Treasurer of other funds. Mr. Brown is an employee of Fidelity Investments (2013-present).
John J. Burke III (1964)
Year of Election or Appointment: 2018
Chief Financial Officer
Mr. Burke also serves as Chief Financial Officer of other funds. Mr. Burke serves as Head of Investment Operations for Fidelity Fund and Investment Operations (2018-present) and is an employee of Fidelity Investments (1998-present). Previously Mr. Burke served as head of Asset Management Investment Operations (2012-2018).
William C. Coffey (1969)
Year of Election or Appointment: 2019
Assistant Secretary
Mr. Coffey also serves as Assistant Secretary of other funds. He is Senior Vice President and Deputy General Counsel of FMR LLC (diversified financial services company, 2010-present), and is an employee of Fidelity Investments. Previously, Mr. Coffey served as Secretary and CLO of certain funds (2018-2019); CLO, Secretary, and Senior Vice President of Fidelity Management & Research Company and FMR Co., Inc. (investment adviser firms, 2018-2019); Secretary of Fidelity SelectCo, LLC and Fidelity Investments Money Management, Inc. (investment adviser firms, 2018-2019); CLO of Fidelity Management & Research (Hong Kong) Limited, FMR Investment Management (UK) Limited, and Fidelity Management & Research (Japan) Limited (investment adviser firms, 2018-2019); and Assistant Secretary of certain funds (2009-2018).
Timothy M. Cohen (1969)
Year of Election or Appointment: 2018
Vice President
Mr. Cohen also serves as Vice President of other funds. Mr. Cohen serves as Co-Head of Equity (2018-present), a Director of Fidelity Management & Research (Japan) Limited (investment adviser firm, 2016-present), and is an employee of Fidelity Investments. Previously, Mr. Cohen served as Executive Vice President of Fidelity SelectCo, LLC (2019), Head of Global Equity Research (2016-2018), Chief Investment Officer - Equity and a Director of Fidelity Management & Research (U.K.) Inc. (investment adviser firm, 2013-2015) and as a Director of Fidelity Management & Research (Hong Kong) Limited (investment adviser firm, 2017).
Jonathan Davis (1968)
Year of Election or Appointment: 2010
Assistant Treasurer
Mr. Davis also serves as Assistant Treasurer of other funds. Mr. Davis serves as Assistant Treasurer of FMR Capital, Inc. (2017-present) and is an employee of Fidelity Investments. Previously, Mr. Davis served as Vice President and Associate General Counsel of FMR LLC (diversified financial services company, 2003-2010).
Laura M. Del Prato (1964)
Year of Election or Appointment: 2018
Assistant Treasurer
Ms. Del Prato also serves as an officer of other funds. Ms. Del Prato is an employee of Fidelity Investments (2017-present). Previously, Ms. Del Prato served as President and Treasurer of The North Carolina Capital Management Trust: Cash Portfolio and Term Portfolio (2018-2020). Prior to joining Fidelity Investments, Ms. Del Prato served as a Managing Director and Treasurer of the JPMorgan Mutual Funds (2014-2017). Prior to JPMorgan, Ms. Del Prato served as a partner at Cohen Fund Audit Services (accounting firm, 2012-2013) and KPMG LLP (accounting firm, 2004-2012).
Colm A. Hogan (1973)
Year of Election or Appointment: 2020
Assistant Treasurer
Mr. Hogan also serves as an officer of other funds. Mr. Hogan serves as Assistant Treasurer of FMR Capital, Inc. (2017-present) and is an employee of Fidelity Investments (2005-present). Previously, Mr. Hogan served as Deputy Treasurer of certain Fidelity® funds (2016-2020) and Assistant Treasurer of certain Fidelity® funds (2016-2018).
Pamela R. Holding (1964)
Year of Election or Appointment: 2018
Vice President
Ms. Holding also serves as Vice President of other funds. Ms. Holding serves as Co-Head of Equity (2018-present) and is an employee of Fidelity Investments (2013-present). Previously, Ms. Holding served as Executive Vice President of Fidelity SelectCo, LLC (2019) and as Chief Investment Officer of Fidelity Institutional Asset Management (2013-2018).
Cynthia Lo Bessette (1969)
Year of Election or Appointment: 2019
Secretary and Chief Legal Officer (CLO)
Ms. Lo Bessette also serves as an officer of other funds. Ms. Lo Bessette serves as CLO, Secretary, and Senior Vice President of Fidelity Management & Research Company LLC (investment adviser firm, 2019-present); and CLO of Fidelity Management & Research (Hong Kong) Limited, FMR Investment Management (UK) Limited, and Fidelity Management & Research (Japan) Limited (investment adviser firms, 2019-present). She is a Senior Vice President and Deputy General Counsel of FMR LLC (diversified financial services company, 2019-present), and is an employee of Fidelity Investments. Previously, Ms. Lo Bessette served as CLO, Secretary, and Senior Vice President of FMR Co., Inc. (investment adviser firm, 2019); Secretary of Fidelity SelectCo, LLC and Fidelity Investments Money Management, Inc. (investment adviser firms, 2019). Prior to joining Fidelity Investments, Ms. Lo Bessette was Executive Vice President, General Counsel (2016-2019) and Senior Vice President, Deputy General Counsel (2015-2016) of OppenheimerFunds (investment management company) and Deputy Chief Legal Officer (2013-2015) of Jennison Associates LLC (investment adviser firm).
Chris Maher (1972)
Year of Election or Appointment: 2020
Deputy Treasurer
Mr. Maher also serves as an officer of other funds. Mr. Maher serves as Assistant Treasurer of FMR Capital, Inc. (2017-present), and is an employee of Fidelity Investments (2008-present). Previously, Mr. Maher served as Assistant Treasurer of certain funds (2013-2020); Vice President of Asset Management Compliance (2013), Vice President of the Program Management Group of FMR (investment adviser firm, 2010-2013), and Vice President of Valuation Oversight (2008-2010).
Jason P. Pogorelec (1975)
Year of Election or Appointment: 2020
Chief Compliance Officer
Mr. Pogorelec also serves as Chief Compliance Officer of other funds. Mr. Pogorelec is a senior Vice President of Asset Management Compliance for Fidelity Investments and is an employee of Fidelity Investments (2006-present). Previously, Mr. Pogorelec served as Vice President, Associate General Counsel for Fidelity Investments (2010-2020) and Assistant Secretary of certain Fidelity funds (2015-2020).
Stacie M. Smith (1974)
Year of Election or Appointment: 2016
President and Treasurer
Ms. Smith also serves as an officer of other funds. Ms. Smith serves as Assistant Treasurer of FMR Capital, Inc. (2017-present), is an employee of Fidelity Investments (2009-present), and has served in other fund officer roles. Prior to joining Fidelity Investments, Ms. Smith served as Senior Audit Manager of Ernst & Young LLP (accounting firm, 1996-2009). Previously, Ms. Smith served as Assistant Treasurer (2013-2019) and Deputy Treasurer (2013-2016) of certain Fidelity® funds.
Marc L. Spector (1972)
Year of Election or Appointment: 2016
Assistant Treasurer
Mr. Spector also serves as an officer of other funds. Mr. Spector serves as Assistant Treasurer of FMR Capital, Inc. (2017-present) and is an employee of Fidelity Investments (2016-present). Prior to joining Fidelity Investments, Mr. Spector served as Director at the Siegfried Group (accounting firm, 2013-2016), and prior to Siegfried Group as audit senior manager at Deloitte & Touche LLP (accounting firm, 2005-2013).
Jim Wegmann (1979)
Year of Election or Appointment: 2019
Assistant Treasurer
Mr. Wegmann also serves as Assistant Treasurer of other funds. Mr. Wegmann is an employee of Fidelity Investments (2011-present).
Shareholder Expense Example
As a shareholder, you incur two types of costs: (1) transaction costs, which may include sales charges (loads) on purchase payments or redemption proceeds, as applicable and (2) ongoing costs, which generally include management fees, distribution and/or service (12b-1) fees and other Fund expenses. This Example is intended to help you understand your ongoing costs (in dollars) of investing in a fund and to compare these costs with the ongoing costs of investing in other mutual funds.
The Example is based on an investment of $1,000 invested at the beginning of the period and held for the entire period (May 1, 2020 to October 31, 2020).
Actual Expenses
The first line of the accompanying table provides information about actual account values and actual expenses. You may use the information in this line, together with the amount you invested, to estimate the expenses that you paid over the period. Simply divide your account value by $1,000.00 (for example, an $8,600 account value divided by $1,000.00 = 8.6), then multiply the result by the number in the first line for a class/Fund under the heading entitled "Expenses Paid During Period" to estimate the expenses you paid on your account during this period. If any fund is a shareholder of any underlying mutual funds or exchange-traded funds (ETFs) (the Underlying Funds), such fund indirectly bears its proportional share of the expenses of the Underlying Funds in addition to the direct expenses incurred presented in the table. These fees and expenses are not included in the annualized expense ratio used to calculate the expense estimate in the table below.
Hypothetical Example for Comparison Purposes
The second line of the accompanying table provides information about hypothetical account values and hypothetical expenses based on the actual expense ratio and an assumed rate of return of 5% per year before expenses, which is not the actual return. The hypothetical account values and expenses may not be used to estimate the actual ending account balance or expenses you paid for the period. You may use this information to compare the ongoing costs of investing in the Fund and other funds. To do so, compare this 5% hypothetical example with the 5% hypothetical examples that appear in the shareholder reports of the other funds. If any fund is a shareholder of any Underlying Funds, such fund indirectly bears its proportional share of the expenses of the Underlying Funds in addition to the direct expenses as presented in the table. These fees and expenses are not included in the annualized expense ratio used to calculate the expense estimate in the table below.
Please note that the expenses shown in the table are meant to highlight your ongoing costs only and do not reflect any transaction costs. Therefore, the second line of the table is useful in comparing ongoing costs only, and will not help you determine the relative total costs of owning different funds. In addition, if these transactional costs were included, your costs would have been higher.
| | Annualized Expense Ratio-A | Beginning
Account Value
May 1, 2020 | Ending
Account Value
October 31, 2020 | Expenses Paid
During Period-B
May 1, 2020
to October 31, 2020 |
| Fidelity Canada Fund | | | | |
| Class A | 1.16% | | | |
| Actual | | $1,000.00 | $1,079.80 | $6.06 |
| Hypothetical-C | | $1,000.00 | $1,019.30 | $5.89 |
| Class M | 1.40% | | | |
| Actual | | $1,000.00 | $1,078.30 | $7.31 |
| Hypothetical-C | | $1,000.00 | $1,018.10 | $7.10 |
| Class C | 1.89% | | | |
| Actual | | $1,000.00 | $1,075.60 | $9.86 |
| Hypothetical-C | | $1,000.00 | $1,015.63 | $9.58 |
| Canada | .83% | | | |
| Actual | | $1,000.00 | $1,081.60 | $4.34 |
| Hypothetical-C | | $1,000.00 | $1,020.96 | $4.22 |
| Class I | .79% | | | |
| Actual | | $1,000.00 | $1,081.60 | $4.13 |
| Hypothetical-C | | $1,000.00 | $1,021.17 | $4.01 |
| Class Z | .67% | | | |
| Actual | | $1,000.00 | $1,082.40 | $3.51 |
| Hypothetical-C | | $1,000.00 | $1,021.77 | $3.40 |
| Fidelity China Region Fund | | | | |
| Class A | 1.22% | | | |
| Actual | | $1,000.00 | $1,323.80 | $7.13 |
| Hypothetical-C | | $1,000.00 | $1,019.00 | $6.19 |
| Class M | 1.54% | | | |
| Actual | | $1,000.00 | $1,321.50 | $8.99 |
| Hypothetical-C | | $1,000.00 | $1,017.39 | $7.81 |
| Class C | 1.96% | | | |
| Actual | | $1,000.00 | $1,318.80 | $11.42 |
| Hypothetical-C | | $1,000.00 | $1,015.28 | $9.93 |
| China Region | .92% | | | |
| Actual | | $1,000.00 | $1,326.00 | $5.38 |
| Hypothetical-C | | $1,000.00 | $1,020.51 | $4.67 |
| Class I | .93% | | | |
| Actual | | $1,000.00 | $1,325.70 | $5.44 |
| Hypothetical-C | | $1,000.00 | $1,020.46 | $4.72 |
| Class Z | .80% | | | |
| Actual | | $1,000.00 | $1,326.50 | $4.68 |
| Hypothetical-C | | $1,000.00 | $1,021.11 | $4.06 |
| Fidelity Emerging Asia Fund | 1.09% | | | |
| Actual | | $1,000.00 | $1,427.60 | $6.65 |
| Hypothetical-C | | $1,000.00 | $1,019.66 | $5.53 |
| Fidelity Emerging Markets Fund | | | | |
| Emerging Markets | .91% | | | |
| Actual | | $1,000.00 | $1,302.50 | $5.27 |
| Hypothetical-C | | $1,000.00 | $1,020.56 | $4.62 |
| Class K | .79% | | | |
| Actual | | $1,000.00 | $1,303.40 | $4.57 |
| Hypothetical-C | | $1,000.00 | $1,021.17 | $4.01 |
| Fidelity Europe Fund | | | | |
| Class A | 1.40% | | | |
| Actual | | $1,000.00 | $1,160.10 | $7.60 |
| Hypothetical-C | | $1,000.00 | $1,018.10 | $7.10 |
| Class M | 1.72% | | | |
| Actual | | $1,000.00 | $1,157.90 | $9.33 |
| Hypothetical-C | | $1,000.00 | $1,016.49 | $8.72 |
| Class C | 2.22% | | | |
| Actual | | $1,000.00 | $1,155.40 | $12.03 |
| Hypothetical-C | | $1,000.00 | $1,013.98 | $11.24 |
| Europe | 1.10% | | | |
| Actual | | $1,000.00 | $1,161.70 | $5.98 |
| Hypothetical-C | | $1,000.00 | $1,019.61 | $5.58 |
| Class I | 1.05% | | | |
| Actual | | $1,000.00 | $1,162.10 | $5.71 |
| Hypothetical-C | | $1,000.00 | $1,019.86 | $5.33 |
| Class Z | .98% | | | |
| Actual | | $1,000.00 | $1,162.50 | $5.33 |
| Hypothetical-C | | $1,000.00 | $1,020.21 | $4.98 |
| Fidelity Japan Fund | | | | |
| Class A | 1.38% | | | |
| Actual | | $1,000.00 | $1,217.80 | $7.69 |
| Hypothetical-C | | $1,000.00 | $1,018.20 | $7.00 |
| Class M | 1.67% | | | |
| Actual | | $1,000.00 | $1,215.90 | $9.30 |
| Hypothetical-C | | $1,000.00 | $1,016.74 | $8.47 |
| Class C | 2.06% | | | |
| Actual | | $1,000.00 | $1,213.40 | $11.46 |
| Hypothetical-C | | $1,000.00 | $1,014.78 | $10.43 |
| Japan | 1.07% | | | |
| Actual | | $1,000.00 | $1,219.10 | $5.97 |
| Hypothetical-C | | $1,000.00 | $1,019.76 | $5.43 |
| Class I | 1.02% | | | |
| Actual | | $1,000.00 | $1,219.40 | $5.69 |
| Hypothetical-C | | $1,000.00 | $1,020.01 | $5.18 |
| Class Z | .93% | | | |
| Actual | | $1,000.00 | $1,220.30 | $5.19 |
| Hypothetical-C | | $1,000.00 | $1,020.46 | $4.72 |
| Fidelity Japan Smaller Companies Fund | .92% | | | |
| Actual | | $1,000.00 | $1,138.90 | $4.95 |
| Hypothetical-C | | $1,000.00 | $1,020.51 | $4.67 |
| Fidelity Latin America Fund | | | | |
| Class A | 1.33% | | | |
| Actual | | $1,000.00 | $1,062.30 | $6.89 |
| Hypothetical-C | | $1,000.00 | $1,018.45 | $6.75 |
| Class M | 1.58% | | | |
| Actual | | $1,000.00 | $1,061.50 | $8.19 |
| Hypothetical-C | | $1,000.00 | $1,017.19 | $8.01 |
| Class C | 2.06% | | | |
| Actual | | $1,000.00 | $1,058.30 | $10.66 |
| Hypothetical-C | | $1,000.00 | $1,014.78 | $10.43 |
| Latin America | 1.06% | | | |
| Actual | | $1,000.00 | $1,063.70 | $5.50 |
| Hypothetical-C | | $1,000.00 | $1,019.81 | $5.38 |
| Class I | .95% | | | |
| Actual | | $1,000.00 | $1,064.50 | $4.93 |
| Hypothetical-C | | $1,000.00 | $1,020.36 | $4.82 |
| Class Z | .85% | | | |
| Actual | | $1,000.00 | $1,065.20 | $4.41 |
| Hypothetical-C | | $1,000.00 | $1,020.86 | $4.32 |
| Fidelity Nordic Fund | .95% | | | |
| Actual | | $1,000.00 | $1,332.50 | $5.57 |
| Hypothetical-C | | $1,000.00 | $1,020.36 | $4.82 |
| Fidelity Pacific Basin Fund | 1.09% | | | |
| Actual | | $1,000.00 | $1,283.50 | $6.26 |
| Hypothetical-C | | $1,000.00 | $1,019.66 | $5.53 |
A Annualized expense ratio reflects expenses net of applicable fee waivers.
B Expenses are equal to the annualized expense ratio, multiplied by the average account value over the period, multiplied by 184/ 366 (to reflect the one-half year period). The fees and expenses of any Underlying Funds are not included in each annualized expense ratio.
C 5% return per year before expenses
Distributions (Unaudited)
The Board of Trustees of each fund voted to pay to shareholders of record at the opening of business on record date, the following distributions per share derived from capital gains realized from sales of portfolio securities and dividends derived from net investment income:
| | Pay Date | Record Date | Dividends | Capital Gains |
| Fidelity Canada Fund | | | | |
| Class A | 12/07/20 | 12/04/20 | $0.629 | $0.590 |
| Class M | 12/07/20 | 12/04/20 | $0.471 | $0.590 |
| Class C | 12/07/20 | 12/04/20 | $0.146 | $0.590 |
| Canada | 12/07/20 | 12/04/20 | $0.783 | $0.590 |
| Class I | 12/07/20 | 12/04/20 | $0.734 | $0.590 |
| Class Z | 12/07/20 | 12/04/20 | $0.871 | $0.590 |
| Fidelity China Region Fund | | | | |
| Class A | 12/07/20 | 12/04/20 | $0.437 | $2.156 |
| Class M | 12/07/20 | 12/04/20 | $0.319 | $2.156 |
| Class C | 12/07/20 | 12/04/20 | $0.174 | $2.156 |
| China Region | 12/07/20 | 12/04/20 | $0.542 | $2.156 |
| Class I | 12/07/20 | 12/04/20 | $0.552 | $2.156 |
| Class Z | 12/07/20 | 12/04/20 | $0.586 | $2.156 |
| Fidelity Emerging Asia Fund | | | | |
| Emerging Asia | 12/07/20 | 12/04/20 | $0.000 | $9.634 |
| Fidelity Emerging Markets Fund | | | | |
| Emerging Markets | 12/07/20 | 12/04/20 | $0.090 | $0.544 |
| Class K | 12/07/20 | 12/04/20 | $0.122 | $0.544 |
| Fidelity Europe Fund | | | | |
| Class A | 12/07/20 | 12/04/20 | $0.380 | $0.000 |
| Class M | 12/07/20 | 12/04/20 | $0.261 | $0.000 |
| Class C | 12/07/20 | 12/04/20 | $0.062 | $0.000 |
| Europe | 12/07/20 | 12/04/20 | $0.487 | $0.000 |
| Class I | 12/07/20 | 12/04/20 | $0.510 | $0.000 |
| Class Z | 12/07/20 | 12/04/20 | $0.533 | $0.000 |
| Fidelity Japan Fund | | | | |
| Class A | 12/07/20 | 12/04/20 | $0.066 | $0.253 |
| Class M | 12/07/20 | 12/04/20 | $0.016 | $0.253 |
| Class C | 12/07/20 | 12/04/20 | $0.000 | $0.245 |
| Japan | 12/07/20 | 12/04/20 | $0.107 | $0.253 |
| Class I | 12/07/20 | 12/04/20 | $0.130 | $0.253 |
| Class Z | 12/07/20 | 12/04/20 | $0.141 | $0.253 |
| Fidelity Japan Smaller Companies Fund | | | | |
| Japan Smaller Companies | 12/07/20 | 12/04/20 | $0.187 | $0.096 |
| Fidelity Latin America Fund | | | | |
| Class A | 12/07/20 | 12/04/20 | $0.000 | $0.000 |
| Class M | 12/07/20 | 12/04/20 | $0.000 | $0.000 |
| Class C | 12/07/20 | 12/04/20 | $0.000 | $0.000 |
| Latin America | 12/07/20 | 12/04/20 | $0.000 | $0.000 |
| Class I | 12/07/20 | 12/04/20 | $0.000 | $0.000 |
| Class Z | 12/07/20 | 12/04/20 | $0.000 | $0.000 |
| Fidelity Nordic Fund | | | | |
| Nordic | 12/07/20 | 12/04/20 | $0.957 | $1.214 |
| Fidelity Pacific Basin Fund | | | | |
| Pacific Basin | 12/07/20 | 12/04/20 | $0.097 | $1.854 |
|
The funds hereby designate as capital gain dividend the amounts noted below for the taxable year ended October 31, 2020, or, if subsequently determined to be different, the net capital gain of such year.
| Fidelity Canada Fund | $5,658,411 |
| Fidelity China Region Fund | $12,206,000 |
| Fidelity Emerging Asia Fund | $138,457,544 |
| Fidelity Emerging Markets Fund | $86,272,002 |
| Fidelity Japan Fund | $10,938,042 |
| Fidelity Japan Smaller Companies Fund | $1,529,626 |
| Fidelity Nordic Fund | $2,468,974 |
| Fidelity Pacific Basin Fund | $49,995,159 |
|
A percentage of the dividends distributed during the fiscal year for the following funds qualify for the dividends–received deduction for corporate shareholders:
| | Class A | Class M | Class C | Retail Class | Class I | Class K | Class Z |
| Fidelity Canada Fund | | | | | | | |
| December, 2019 | – | – | 1% | – | – | – | – |
| Fidelity China Region Fund | | | | | | | |
| December, 2019 | 1% | 5% | – | 1% | 1% | – | 1% |
| Fidelity Emerging Asia Fund | | | | | | | |
| December, 2019 | – | – | – | 1% | – | – | – |
| Fidelity Emerging Markets Fund | | | | | | | |
| December, 2019 | – | – | – | 7% | – | 6% | – |
| Fidelity Europe Fund | | | | | | | |
| December, 2019 | 1% | 1% | 1% | 1% | 1% | – | 1% |
| Fidelity Latin America Fund | | | | | | | |
| December 06, 2019 | 1% | 1% | 1% | 1% | 1% | – | 1% |
| December 30, 2019 | 3% | 3% | 3% | 3% | 3% | – | 3% |
| Fidelity Nordic Fund | | | | | | | |
| December, 2019 | – | – | – | 2% | – | – | – |
| Fidelity Pacific Basin Fund | | | | | | | |
| December, 2019 | – | – | – | 2% | – | – | – |
|
A percentage of the dividends distributed during the fiscal year for the following funds may be taken into account as a dividend for purposes of the maximum rate under section 1(h)(11) of the Internal Revenue Code.
| | Class A | Class M | Class C | Retail Class | Class I | Class K | Class Z |
| Fidelity Canada Fund | | | | | | | |
| December, 2019 | 100% | 100% | 100% | 100% | 100% | – | 100% |
| Fidelity China Region Fund | | | | | | | |
| December, 2019 | 100% | 100% | – | 99% | 100% | – | 81% |
| Fidelity Emerging Asia Fund | | | | | | | |
| December, 2019 | – | – | – | 100% | – | – | – |
| Fidelity Emerging Markets Fund | | | | | | | |
| December, 2019 | – | – | – | 72% | – | 67% | – |
| Fidelity Europe Fund | | | | | | | |
| December, 2019 | 73% | 80% | 93% | 69% | 69% | – | 67% |
| Fidelity Japan Fund | | | | | | | |
| December, 2019 | 100% | 100% | 100% | 100% | 100% | – | 100% |
| Fidelity Japan Smaller Companies Fund | | | | | | | |
| December, 2019 | – | – | – | 69% | – | – | |
| Fidelity Latin America Fund | | | | | | | |
| December 06, 2019 | 31% | 35% | 50% | 27% | 26% | – | 25% |
| December 30, 2019 | 14% | 14% | 14% | 14% | 14% | – | 14% |
| Fidelity Nordic Fund | | | | | | | |
| December, 2019 | – | – | – | 69% | – | – | – |
| Fidelity Pacific Basin | | | | | | | |
| December, 2019 | – | – | – | 100% | – | – | – |
|
The amounts per share which represent income derived from sources within, and taxes paid to, foreign countries or possessions of the United States are as follows:
| | Pay Date | Income | Taxes |
| Fidelity Canada Fund | | | |
| Class A | 12/09/19 | $0.9921 | $0.1941 |
| Class M | 12/09/19 | $0.8621 | $0.1941 |
| Class C | 12/09/19 | $0.4021 | $0.1941 |
| Canada | 12/09/19 | $1.1481 | $0.1941 |
| Class I | 12/09/19 | $1.0941 | $0.1941 |
| Class Z | 12/09/19 | $1.2561 | $0.1941 |
| Fidelity China Region Fund | | | |
| Class A | 12/09/19 | $0.1990 | $0.0500 |
| Class M | 12/09/19 | $0.0590 | $0.0500 |
| Class C | 12/09/19 | $0.0000 | $0.0000 |
| China Region | 12/09/19 | $0.3090 | $0.0500 |
| Class I | 12/09/19 | $0.3070 | $0.0500 |
| Class Z | 12/09/19 | $0.3780 | $0.0500 |
| Fidelity Emerging Asia Fund | | | |
| Emerging Asia | 12/09/19 | $0.4366 | $0.0876 |
| Fidelity Emerging Markets Fund | | | |
| Emerging Markets | 12/09/19 | $0.6737 | $0.0747 |
| Class K | 12/09/19 | $0.7207 | $0.0747 |
| Fidelity Europe Fund | | | |
| Class A | 12/09/19 | $1.7342 | $0.0652 |
| Class M | 12/09/19 | $1.5952 | $0.0652 |
| Class C | 12/09/19 | $1.3712 | $0.0652 |
| Europe | 12/09/19 | $1.8442 | $0.0652 |
| Class I | 12/09/19 | $1.8562 | $0.0652 |
| Class Z | 12/09/19 | $1.9032 | $0.0652 |
| Fidelity Japan Fund | | | |
| Class A | 12/09/19 | $0.1872 | $0.0272 |
| Class M | 12/09/19 | $0.1422 | $0.0272 |
| Class C | 12/09/19 | $0.0622 | $0.0272 |
| Japan | 12/09/19 | $0.2202 | $0.0272 |
| Class I | 12/09/19 | $0.2332 | $0.0272 |
| Class Z | 12/09/19 | $0.2462 | $0.0272 |
| Fidelity Japan Smaller Companies Fund | | | |
| Japan Smaller Companies | 12/09/19 | $0.3717 | $0.0408 |
| Fidelity Latin America Fund | | | |
| Class A | 12/09/19 | $0.6045 | $0.0555 |
| Class M | 12/09/19 | $0.5305 | $0.0555 |
| Class C | 12/09/19 | $0.3715 | $0.0555 |
| Latin America | 12/09/19 | $0.6885 | $0.0555 |
| Class I | 12/09/19 | $0.7265 | $0.0555 |
| Class Z | 12/09/19 | $0.7465 | $0.0555 |
| Fidelity Nordic Fund | | | |
| Nordic | 12/09/19 | $1.6976 | $0.0986 |
| Fidelity Pacific Basin Fund | | | |
| Pacific Basin | 12/09/19 | $0.3041 | $0.0461 |
|
The funds will notify shareholders in January 2021 of amounts for use in preparing 2020 income tax returns.
Proxy Voting Results
A special meeting of shareholders was held on June 9, 2020. The results of votes taken among shareholders on the proposals before them are reported below. Each vote reported represents one dollar of net asset value held on the record date for the meeting.
PROPOSAL 1
To elect a Board of Trustees.
| | # of
Votes | % of
Votes |
| Dennis J. Dirks |
| Affirmative | 91,643,443,973.030 | 98.167 |
| Withheld | 1,711,119,384.419 | 1.833 |
| TOTAL | 93,354,563,357.449 | 100.000 |
| Donald F. Donahue |
| Affirmative | 91,659,003,496.045 | 98.184 |
| Withheld | 1,695,559,852.789 | 1.816 |
| TOTAL | 93,354,563,357.449 | 100.000 |
| Bettina Doulton |
| Affirmative | 91,774,146,516.145 | 98.307 |
| Withheld | 1,580,416,862.377 | 1.693 |
| TOTAL | 93,354,563,357.449 | 100.000 |
| Vicki L. Fuller |
| Affirmative | 91,845,419,368.993 | 98.383 |
| Withheld | 1,509,143,998.591 | 1.617 |
| TOTAL | 93,354,563,357.449 | 100.00 |
| Patricia L. Kampling |
| Affirmative | 91,723,732,274.457 | 98.253 |
| Withheld | 1,630,831,098.411 | 1.747 |
| TOTAL | 93,354,563,357.449 | 100.000 |
| Alan J. Lacy |
| Affirmative | 91,490,319,407.772 | 98.003 |
| Withheld | 1,864,243,948.299 | 1.997 |
| TOTAL | 93,354,563,357.449 | 100.000 |
| Ned C. Lautenbach |
| Affirmative | 91,285,367,239.075 | 97.784 |
| Withheld | 2,069,196,119.052 | 2.216 |
| TOTAL | 93,354,563,357.449 | 100.000 |
| Robert A. Lawrence |
| Affirmative | 91,556,271,429.466 | 98.074 |
| Withheld | 1,798,291,912.707 | 1.926 |
| TOTAL | 93,354,563,357.449 | 100.000 |
| Joseph Mauriello |
| Affirmative | 91,497,480,147.082 | 98.011 |
| Withheld | 1,857,083,211.045 | 1.989 |
| TOTAL | 93,354,563,357.449 | 100.000 |
| Cornelia M. Small |
| Affirmative | 91,606,808,161.438 | 98.128 |
| Withheld | 1,747,755,220.497 | 1.872 |
| TOTAL | 93,354,563,357.449 | 100.000 |
| Garnett A. Smith |
| Affirmative | 91,505,784,053.038 | 98.020 |
| Withheld | 1,848,779,305.090 | 1.980 |
| TOTAL | 93,354,563,357.449 | 100.000 |
| David M. Thomas |
| Affirmative | 91,536,969,704.881 | 98.053 |
| Withheld | 1,817,593,630.919 | 1.947 |
| TOTAL | 93,354,563,357.449 | 100.000 |
| Susan Tomasky |
| Affirmative | 91,697,125,678.165 | 98.225 |
| Withheld | 1,657,437,703.277 | 1.775 |
| TOTAL | 93,354,563,357.449 | 100.000 |
| Michael E. Wiley |
| Affirmative | 91,506,805,575.815 | 98.021 |
| Withheld | 1,847,757,759.985 | 1.979 |
| TOTAL | 93,354,563,357.449 | 100.000 |
PROPOSAL 2
For Fidelity Canada Fund, to convert a fundamental investment policy to a non-fundamental investment policy.
| | # of
Votes | % of
Votes |
| Affirmative | 246,106,397.122 | 65.153 |
| Against | 67,217,479.270 | 17.795 |
| Abstain | 41,939,958.258 | 11.103 |
| Broker Non-Vote | 22,469,509.194 | 5.949 |
| TOTAL | 377,733,343.843 | 100.000 |
PROPOSAL 2
For Fidelity China Region Fund, to convert a fundamental investment policy to a non-fundamental investment policy.
| | # of
Votes | % of
Votes |
| Affirmative | 406,241,543.122 | 64.622 |
| Against | 105,421,382.540 | 16.770 |
| Abstain | 73,005,270.515 | 11.613 |
| Broker Non-Vote | 43,978,563.844 | 6.996 |
| TOTAL | 628,646,760.020 | 100.000 |
PROPOSAL 2
For Fidelity Emerging Markets Fund, to convert a fundamental investment policy to a non-fundamental investment policy.
| | # of
Votes | % of
Votes |
| Affirmative | 1,987,107,972.757 | 76.182 |
| Against | 340,475,546.748 | 13.053 |
| Abstain | 216,628,773.288 | 8.305 |
| Broker Non-Vote | 64,153,279.800 | 2.460 |
| TOTAL | 2,608,365,572.594 | 100.000 |
PROPOSAL 2
For Fidelity Europe Fund, to convert a fundamental investment policy to a non-fundamental investment policy.
| | # of
Votes | % of
Votes |
| Affirmative | 280,374,624.590 | 68.102 |
| Against | 64,348,611.698 | 15.630 |
| Abstain | 47,160,756.013 | 11.455 |
| Broker Non-Vote | 19,811,132.780 | 4.812 |
| TOTAL | 411,695,125.081 | 100.000 |
PROPOSAL 2
For Fidelity Japan Fund, to convert a fundamental investment policy to a non-fundamental investment policy.
| For Fidelity Japan Fund, to convert a fundamental investment policy to a non-fundamental investment policy. | # of
Votes | % of
Votes |
| Affirmative | 338,129,939.750 | 58.081 |
| Against | 185,235,717.596 | 31.818 |
| Abstain | 48,250,809.431 | 8.288 |
| Broker Non-Vote | 10,553,988.660 | 1.813 |
| TOTAL | 582,170,455.437 | 100.000 |
PROPOSAL 2
For Fidelity Japan Smaller Companies Fund, to convert a fundamental investment policy to a non-fundamental investment policy.
| | # of
Votes | % of
Votes |
| Affirmative | 342,566,533.579 | 79.752 |
| Against | 42,623,162.356 | 9.923 |
| Abstain | 27,326,624.551 | 6.362 |
| Broker Non-Vote | 17,024,382.660 | 3.963 |
| TOTAL | 429,540,703.146 | 100.000 |
PROPOSAL 2
For Fidelity Nordic Fund, to convert a fundamental investment policy to a non-fundamental investment policy.
| | # of
Votes | % of
Votes |
| Affirmative | 65,033,142.420 | 55.476 |
| Against | 36,471,140.955 | 31.111 |
| Abstain | 10,017,947.286 | 8.546 |
| Broker Non-Vote | 5,706,310.200 | 4.868 |
| TOTAL | 117,228,540.861 | 100.000 |
PROPOSAL 2
For Pacific Basin Fund, to convert a fundamental investment policy to a non-fundamental investment policy.
| | # of
Votes | % of
Votes |
| Affirmative | 390,132,235.578 | 77.483 |
| Against | 58,770,459.614 | 11.672 |
| Abstain | 40,582,310.900 | 8.060 |
| Broker Non-Vote | 14,023,939.650 | 2.785 |
| TOTAL | 503,508,945.742 | 100.000 |
| Proposal 1 reflects trust wide proposal and voting results. |
| Proposal 2 was not approved by shareholders for Fidelity Canada Fund, Fidelity China Region Fund, and Fidelity Nordic Fund. |
TIF-ANN-1220
1.754542.120
Fidelity® International Growth Fund
Annual Report
October 31, 2020
Includes Fidelity and Fidelity Advisor share classes
See the inside front cover for important information about access to your fund’s shareholder reports.
Beginning on January 1, 2021, as permitted by regulations adopted by the Securities and Exchange Commission, paper copies of a fund’s shareholder reports will no longer be sent by mail, unless you specifically request paper copies of the reports from the fund or from your financial intermediary, such as a financial advisor, broker-dealer or bank. Instead, the reports will be made available on a website, and you will be notified by mail each time a report is posted and provided with a website link to access the report.
If you already elected to receive shareholder reports electronically, you will not be affected by this change and you need not take any action. You may elect to receive shareholder reports and other communications from a fund electronically, by contacting your financial intermediary. For Fidelity customers, visit Fidelity's web site or call Fidelity using the contact information listed below.
You may elect to receive all future reports in paper free of charge. If you wish to continue receiving paper copies of your shareholder reports, you may contact your financial intermediary or, if you are a Fidelity customer, visit Fidelity’s website, or call Fidelity at the applicable toll-free number listed below. Your election to receive reports in paper will apply to all funds held with the fund complex/your financial intermediary.
| Account Type | Website | Phone Number |
| Brokerage, Mutual Fund, or Annuity Contracts: | fidelity.com/mailpreferences | 1-800-343-3548 |
| Employer Provided Retirement Accounts: | netbenefits.fidelity.com/preferences (choose 'no' under Required Disclosures to continue to print) | 1-800-343-0860 |
| Advisor Sold Accounts Serviced Through Your Financial Intermediary: | Contact Your Financial Intermediary | Your Financial Intermediary's phone number |
| Advisor Sold Accounts Serviced by Fidelity: | institutional.fidelity.com | 1-877-208-0098 |
Contents
To view a fund's proxy voting guidelines and proxy voting record for the 12-month period ended June 30, visit http://www.fidelity.com/proxyvotingresults or visit the Securities and Exchange Commission's (SEC) web site at http://www.sec.gov.
You may also call 1-800-544-8544 if you’re an individual investing directly with Fidelity, call 1-800-835-5092 if you’re a plan sponsor or participant with Fidelity as your recordkeeper or call 1-877-208-0098 on institutional accounts or if you’re an advisor or invest through one to request a free copy of the proxy voting guidelines.
Standard & Poor's, S&P and S&P 500 are registered service marks of The McGraw-Hill Companies, Inc. and have been licensed for use by Fidelity Distributors Corporation.
Other third-party marks appearing herein are the property of their respective owners.
All other marks appearing herein are registered or unregistered trademarks or service marks of FMR LLC or an affiliated company. © 2020 FMR LLC. All rights reserved.
This report and the financial statements contained herein are submitted for the general information of the shareholders of the Fund. This report is not authorized for distribution to prospective investors in the Fund unless preceded or accompanied by an effective prospectus.
A fund files its complete schedule of portfolio holdings with the SEC for the first and third quarters of each fiscal year on Form N-PORT. Forms N-PORT are available on the SEC’s web site at http://www.sec.gov. A fund's Forms N-PORT may be reviewed and copied at the SEC’s Public Reference Room in Washington, DC. Information regarding the operation of the SEC's Public Reference Room may be obtained by calling 1-800-SEC-0330.
For a complete list of a fund's portfolio holdings, view the most recent holdings listing, semiannual report, or annual report on Fidelity's web site at http://www.fidelity.com, http://www.institutional.fidelity.com, or http://www.401k.com, as applicable.
NOT FDIC INSURED •MAY LOSE VALUE •NO BANK GUARANTEE
Neither the Fund nor Fidelity Distributors Corporation is a bank.
Note to Shareholders:
Early in 2020, the outbreak and spread of a new coronavirus emerged as a public health emergency that had a major influence on financial markets, primarily based on its impact on the global economy and the outlook for corporate earnings. The virus causes a respiratory disease known as COVID-19. On March 11, the World Health Organization declared the COVID-19 outbreak a pandemic, citing sustained risk of further global spread.
In the weeks following, as the crisis worsened, we witnessed an escalating human tragedy with wide-scale social and economic consequences from coronavirus-containment measures. The outbreak of COVID-19 prompted a number of measures to limit the spread, including travel and border restrictions, quarantines, and restrictions on large gatherings. In turn, these resulted in lower consumer activity, diminished demand for a wide range of products and services, disruption in manufacturing and supply chains, and – given the wide variability in outcomes regarding the outbreak – significant market uncertainty and volatility. Amid the turmoil, global governments and central banks took unprecedented action to help support consumers, businesses, and the broader economies, and to limit disruption to the financial systems.
The situation continues to unfold, and the extent and duration of its impact on financial markets and the economy remain highly uncertain. Extreme events such as the coronavirus crisis are “exogenous shocks” that can have significant adverse effects on mutual funds and their investments. Although multiple asset classes may be affected by market disruption, the duration and impact may not be the same for all types of assets.
Fidelity is committed to helping you stay informed amid news about COVID-19 and during increased market volatility, and we’re taking extra steps to be responsive to customer needs. We encourage you to visit our websites, where we offer ongoing updates, commentary, and analysis on the markets and our funds.
Performance: The Bottom Line
Average annual total return reflects the change in the value of an investment, assuming reinvestment of distributions from dividend income and capital gains (the profits earned upon the sale of securities that have grown in value, if any) and assuming a constant rate of performance each year. The hypothetical investment and the average annual total returns do not reflect the deduction of taxes that a shareholder would pay on fund distributions or the redemption of fund shares. During periods of reimbursement by Fidelity, a fund’s total return will be greater than it would be had the reimbursement not occurred. How a fund did yesterday is no guarantee of how it will do tomorrow.
Average Annual Total Returns
| For the periods ended October 31, 2020 | Past 1 year | Past 5 years | Past 10 years |
| Class A (incl. 5.75% sales charge) | 1.47% | 6.71% | 6.81% |
| Class M (incl. 3.50% sales charge) | 3.51% | 6.89% | 6.75% |
| Class C (incl. contingent deferred sales charge) | 5.81% | 7.16% | 6.62% |
| Fidelity® International Growth Fund | 7.93% | 8.30% | 7.75% |
| Class I | 7.90% | 8.32% | 7.76% |
| Class Z | 8.01% | 8.46% | 7.86% |
Class C shares' contingent deferred sales charges included in the past one year, past five years and past ten years total return figures are 1%, 0% and 0%, respectively.
The initial offering of Class Z shares took place on August 13, 2013. Returns prior to August 13, 2013, are those of Class I.
$10,000 Over 10 Years
Let's say hypothetically that $10,000 was invested in Fidelity® International Growth Fund, a class of the fund, on October 31, 2010.
The chart shows how the value of your investment would have changed, and also shows how the MSCI EAFE Growth Index performed over the same period.
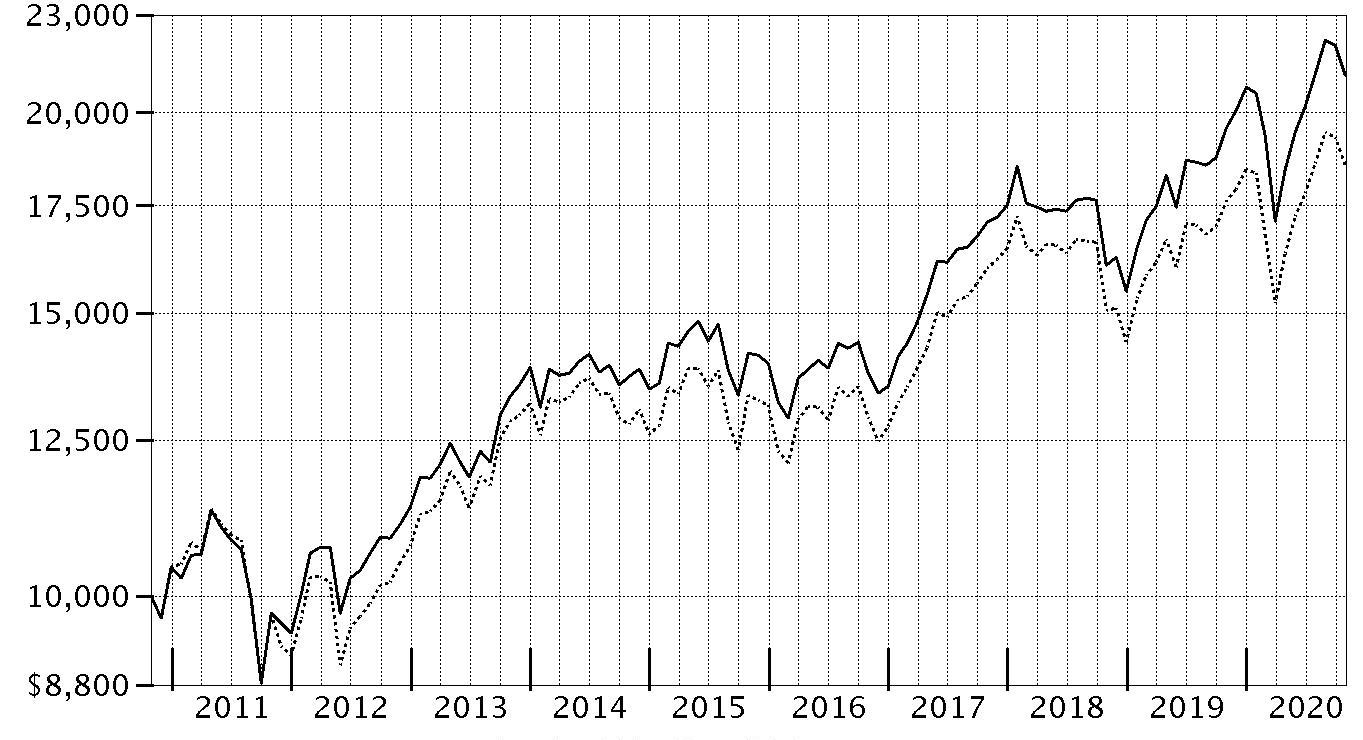
| Period Ending Values |
| $21,099 | Fidelity® International Growth Fund |
| $18,545 | MSCI EAFE Growth Index |
Management's Discussion of Fund Performance
Market Recap: The MSCI ACWI (All Country World Index) ex USA Index returned -2.46% for the 12 months ending October 31, 2020, in what was a bumpy ride for non-U.S. equities, marked by a steep but brief decline due to the early-2020 outbreak and spread of the coronavirus, followed by a sharp upturn. Declared a pandemic on March 11, the crisis and containment efforts caused broad contraction in economic activity, elevated volatility and dislocation in financial markets. A historically rapid and expansive monetary- and fiscal-policy response around the world provided a partial offset to the economic disruption. Other supporting factors included resilient corporate earnings and near-term potential for a COVID-19 vaccine breakthrough. This was evident in the index’s 12.28% gain in the final six months of the year. Currency fluctuation generally boosted foreign developed-markets equities for the year, while the reverse was true for emerging-markets stocks. Late in the period, the index was pressured by a second wave of COVID-19 cases in some regions, and stretched valuations and crowded positioning in big tech. For the full year, the U.K. (-22%), Asia Pacific ex Japan (-8%), Canada (-5%) and Europe ex U.K. (-4%) notably lagged. Emerging markets (+9%) and Japan (+1%) outperformed. By sector, energy (-38%), financials and real estate (-20% each) lagged, whereas information technology (+ 25%) and communication services (+15%) topped the index.
Comments from Portfolio Manager Jed Weiss: For the fiscal year ending October 31, 2020, the fund's share classes (excluding sales charges, if applicable) gained roughly 7% to 8%, outperforming the 5.34% result of the benchmark MSCI EAFE Growth Index (Net MA). From a regional standpoint, stock picks in Japan, as well as out-of-benchmark exposure to the U.S. and emerging markets, contributed most to the fund's relative result. By sector, the primary contributor to performance versus the benchmark was the portfolio’s positioning among consumer staples stocks, primarily driven by the food, beverage & tobacco industry. Strong investment choices within financials and consumer discretionary also added value, as did the fund’s positioning in real estate. Our non-benchmark stake in Alibaba Group Holding was the biggest individual relative contributor, driven by a 72% gain. Also lifting performance was our overweighting in Keyence, which gained 42% and was among the portfolio’s biggest holdings. Another notable relative contributor was an outsized stake in ASML Holding (+39%), which also was one of our largest holdings. Conversely, stock picks in Europe ex U.K. – particularly in Germany and Switzerland – along with an underweighting in Denmark, detracted from the fund's relative result. By sector, the primary detractor from performance versus the benchmark was an underweighting in health care, especially within the pharmaceuticals, biotechnology & life sciences industry. Security selection in materials and an overweighting in financials also hampered relative performance. The biggest individual relative detractor was an overweight position in Amadeus IT Group (-35%). Another key relative detractor was an overweighting in SAP (-19%), which was among the fund's biggest holdings. Further weighing on the portfolio’s relative return was our outsized stake in MTU Aero Engines (-52%), a position that was sold the past year. Notable changes in positioning include reduced exposure to Germany and United Kingdom. By sector, meaningful changes in positioning include increased exposure to health care and a lower allocation to consumer discretionary.
The views expressed above reflect those of the portfolio manager(s) only through the end of the period as stated on the cover of this report and do not necessarily represent the views of Fidelity or any other person in the Fidelity organization. Any such views are subject to change at any time based upon market or other conditions and Fidelity disclaims any responsibility to update such views. These views may not be relied on as investment advice and, because investment decisions for a Fidelity fund are based on numerous factors, may not be relied on as an indication of trading intent on behalf of any Fidelity fund.
Investment Summary (Unaudited)
Geographic Diversification (% of fund's net assets)
| As of October 31, 2020 |
| | United States of America* | 19.8% |
| | Japan | 15.2% |
| | Switzerland | 13.0% |
| | Germany | 7.7% |
| | France | 5.2% |
| | Cayman Islands | 5.0% |
| | Sweden | 4.8% |
| | Hong Kong | 4.7% |
| | Netherlands | 4.4% |
| | Other | 20.2% |
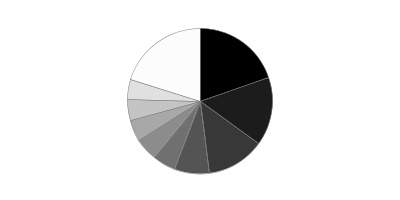
* Includes Short-Term investments and Net Other Assets (Liabilities).
Percentages are based on country or territory of incorporation and are adjusted for the effect of futures contracts, if applicable.
Asset Allocation as of October 31, 2020
| | % of fund's net assets |
| Stocks | 97.6 |
| Short-Term Investments and Net Other Assets (Liabilities) | 2.4 |
Top Ten Stocks as of October 31, 2020
| | % of fund's net assets |
| Nestle SA (Reg. S) (Switzerland, Food Products) | 6.5 |
| Roche Holding AG (participation certificate) (Switzerland, Pharmaceuticals) | 4.7 |
| ASML Holding NV (Netherlands) (Netherlands, Semiconductors & Semiconductor Equipment) | 4.4 |
| Keyence Corp. (Japan, Electronic Equipment & Components) | 4.0 |
| AIA Group Ltd. (Hong Kong, Insurance) | 3.0 |
| SAP SE (Germany, Software) | 3.0 |
| CSL Ltd. (Australia, Biotechnology) | 2.8 |
| Linde PLC (Germany, Chemicals) | 2.7 |
| Alibaba Group Holding Ltd. sponsored ADR (Cayman Islands, Internet & Direct Marketing Retail) | 2.7 |
| LVMH Moet Hennessy Louis Vuitton SE (France, Textiles, Apparel & Luxury Goods) | 2.5 |
| | 36.3 |
Top Market Sectors as of October 31, 2020
| | % of fund's net assets |
| Information Technology | 24.1 |
| Industrials | 19.0 |
| Financials | 14.1 |
| Health Care | 13.2 |
| Consumer Staples | 7.2 |
| Consumer Discretionary | 7.0 |
| Materials | 6.1 |
| Communication Services | 5.9 |
| Real Estate | 1.0 |
Schedule of Investments October 31, 2020
Showing Percentage of Net Assets
| Common Stocks - 97.6% | | | |
| | | Shares | Value |
| Australia - 2.8% | | | |
| CSL Ltd. | | 593,558 | $120,170,180 |
| Bailiwick of Jersey - 1.9% | | | |
| Experian PLC | | 2,198,200 | 80,528,636 |
| Belgium - 0.7% | | | |
| UCB SA | | 303,300 | 29,919,288 |
| Brazil - 0.3% | | | |
| BM&F BOVESPA SA | | 1,601,100 | 14,244,836 |
| Canada - 1.9% | | | |
| Canadian National Railway Co. | | 182,600 | 18,139,391 |
| Canadian Pacific Railway Ltd. | | 111,400 | 33,290,397 |
| Franco-Nevada Corp. | | 218,101 | 29,726,759 |
|
| TOTAL CANADA | | | 81,156,547 |
|
| Cayman Islands - 5.0% | | | |
| Alibaba Group Holding Ltd. (a) | | 170,600 | 6,464,694 |
| Alibaba Group Holding Ltd. sponsored ADR (a) | | 373,100 | 113,679,839 |
| Tencent Holdings Ltd. | | 1,235,400 | 94,391,545 |
|
| TOTAL CAYMAN ISLANDS | | | 214,536,078 |
|
| Finland - 1.2% | | | |
| Kone OYJ (B Shares) | | 572,100 | 45,534,687 |
| Tikkurila Oyj | | 372,804 | 5,965,718 |
|
| TOTAL FINLAND | | | 51,500,405 |
|
| France - 5.2% | | | |
| Edenred SA | | 781,848 | 36,459,594 |
| Legrand SA | | 578,000 | 42,732,685 |
| LVMH Moet Hennessy Louis Vuitton SE | | 225,000 | 105,468,224 |
| Sanofi SA | | 413,100 | 37,300,202 |
|
| TOTAL FRANCE | | | 221,960,705 |
|
| Germany - 7.7% | | | |
| Deutsche Borse AG | | 296,300 | 43,601,590 |
| Linde PLC | | 527,479 | 115,616,608 |
| SAP SE | | 1,188,301 | 126,773,469 |
| Vonovia SE | | 694,900 | 44,366,664 |
|
| TOTAL GERMANY | | | 330,358,331 |
|
| Hong Kong - 4.7% | | | |
| AIA Group Ltd. | | 13,439,000 | 127,901,333 |
| Hong Kong Exchanges and Clearing Ltd. | | 1,507,100 | 71,967,549 |
|
| TOTAL HONG KONG | | | 199,868,882 |
|
| India - 0.8% | | | |
| Housing Development Finance Corp. Ltd. | | 1,324,478 | 34,157,308 |
| Ireland - 1.0% | | | |
| CRH PLC sponsored ADR | | 1,245,766 | 43,788,675 |
| Italy - 0.7% | | | |
| Interpump Group SpA | | 755,126 | 28,494,423 |
| Japan - 15.2% | | | |
| Azbil Corp. | | 1,106,770 | 44,916,380 |
| FANUC Corp. | | 349,600 | 73,844,206 |
| Hoya Corp. | | 846,100 | 95,488,255 |
| Keyence Corp. | | 375,348 | 170,341,366 |
| Lasertec Corp. | | 255,000 | 22,088,306 |
| Misumi Group, Inc. | | 2,715,000 | 80,634,342 |
| Nabtesco Corp. | | 435,600 | 16,273,252 |
| OSG Corp. | | 747,300 | 11,195,341 |
| Recruit Holdings Co. Ltd. | | 1,835,100 | 69,826,796 |
| SHO-BOND Holdings Co. Ltd. | | 720,600 | 34,782,117 |
| USS Co. Ltd. | | 1,812,000 | 33,142,526 |
|
| TOTAL JAPAN | | | 652,532,887 |
|
| Kenya - 0.5% | | | |
| Safaricom Ltd. | | 74,574,100 | 21,145,322 |
| Netherlands - 4.4% | | | |
| ASML Holding NV (Netherlands) | | 514,700 | 186,220,059 |
| New Zealand - 0.3% | | | |
| Auckland International Airport Ltd. | | 2,810,440 | 13,000,756 |
| Norway - 1.1% | | | |
| Adevinta ASA Class B (a) | | 1,161,858 | 17,951,224 |
| Schibsted ASA (B Shares) | | 789,200 | 28,321,968 |
|
| TOTAL NORWAY | | | 46,273,192 |
|
| South Africa - 0.5% | | | |
| Clicks Group Ltd. | | 1,480,638 | 21,415,075 |
| Spain - 1.9% | | | |
| Amadeus IT Holding SA Class A | | 970,400 | 46,325,929 |
| Cellnex Telecom SA (b) | | 532,300 | 34,171,269 |
|
| TOTAL SPAIN | | | 80,497,198 |
|
| Sweden - 4.8% | | | |
| ASSA ABLOY AB (B Shares) | | 4,053,483 | 86,876,150 |
| Atlas Copco AB (A Shares) | | 1,794,100 | 79,216,701 |
| Epiroc AB Class A | | 2,553,900 | 38,171,885 |
|
| TOTAL SWEDEN | | | 204,264,736 |
|
| Switzerland - 13.0% | | | |
| Nestle SA (Reg. S) | | 2,470,569 | 277,884,496 |
| Roche Holding AG (participation certificate) | | 632,283 | 203,172,467 |
| Schindler Holding AG: | | | |
| (participation certificate) | | 194,898 | 49,843,046 |
| (Reg.) | | 18,350 | 4,710,824 |
| Temenos Group AG | | 209,300 | 22,469,592 |
|
| TOTAL SWITZERLAND | | | 558,080,425 |
|
| Taiwan - 1.4% | | | |
| Taiwan Semiconductor Manufacturing Co. Ltd. | | 4,058,000 | 61,384,418 |
| United Kingdom - 3.2% | | | |
| Dechra Pharmaceuticals PLC | | 303,100 | 13,711,898 |
| InterContinental Hotel Group PLC ADR (c) | | 423,270 | 21,646,028 |
| London Stock Exchange Group PLC | | 463,200 | 49,931,998 |
| Prudential PLC | | 625,412 | 7,649,103 |
| Rightmove PLC | | 2,354,100 | 18,847,372 |
| Spectris PLC | | 839,757 | 26,936,533 |
|
| TOTAL UNITED KINGDOM | | | 138,722,932 |
|
| United States of America - 17.4% | | | |
| Alphabet, Inc. Class A (a) | | 23,336 | 37,713,543 |
| Autoliv, Inc. | | 246,469 | 18,682,350 |
| Black Knight, Inc. (a) | | 425,200 | 37,396,340 |
| Lam Research Corp. | | 133,700 | 45,736,096 |
| Marsh & McLennan Companies, Inc. | | 597,351 | 61,801,934 |
| MasterCard, Inc. Class A | | 254,400 | 73,430,016 |
| Moody's Corp. | | 239,900 | 63,069,710 |
| MSCI, Inc. | | 186,600 | 65,280,144 |
| NICE Systems Ltd. sponsored ADR (a)(c) | | 249,200 | 56,882,392 |
| PriceSmart, Inc. | | 155,186 | 10,707,834 |
| ResMed, Inc. | | 353,800 | 67,908,372 |
| S&P Global, Inc. | | 193,300 | 62,383,709 |
| Sherwin-Williams Co. | | 99,900 | 68,729,202 |
| Visa, Inc. Class A | | 418,960 | 76,129,222 |
|
| TOTAL UNITED STATES OF AMERICA | | | 745,850,864 |
|
| TOTAL COMMON STOCKS | | | |
| (Cost $2,958,718,096) | | | 4,180,072,158 |
|
| Money Market Funds - 2.8% | | | |
| Fidelity Cash Central Fund 0.10% (d) | | 92,601,601 | 92,620,121 |
| Fidelity Securities Lending Cash Central Fund 0.11% (d)(e) | | 28,864,614 | 28,867,501 |
| TOTAL MONEY MARKET FUNDS | | | |
| (Cost $121,486,479) | | | 121,487,622 |
| TOTAL INVESTMENT IN SECURITIES - 100.4% | | | |
| (Cost $3,080,204,575) | | | 4,301,559,780 |
| NET OTHER ASSETS (LIABILITIES) - (0.4)% | | | (16,136,145) |
| NET ASSETS - 100% | | | $4,285,423,635 |
Categorizations in the Schedule of Investments are based on country or territory of incorporation.
Legend
(a) Non-income producing
(b) Security exempt from registration under Rule 144A of the Securities Act of 1933. These securities may be resold in transactions exempt from registration, normally to qualified institutional buyers. At the end of the period, the value of these securities amounted to $34,171,269 or 0.8% of net assets.
(c) Security or a portion of the security is on loan at period end.
(d) Affiliated fund that is generally available only to investment companies and other accounts managed by Fidelity Investments. The rate quoted is the annualized seven-day yield of the fund at period end. A complete unaudited listing of the fund's holdings as of its most recent quarter end is available upon request. In addition, each Fidelity Central Fund's financial statements, which are not covered by the Fund's Report of Independent Registered Public Accounting Firm, are available on the SEC's website or upon request.
(e) Investment made with cash collateral received from securities on loan.
Affiliated Central Funds
Information regarding fiscal year to date income earned by the Fund from investments in Fidelity Central Funds is as follows:
| Fund | Income earned |
| Fidelity Cash Central Fund | $570,197 |
| Fidelity Securities Lending Cash Central Fund | 337,303 |
| Total | $907,500 |
Amounts in the income column in the above table include any capital gain distributions from underlying funds, which are presented in the corresponding line-item in the Statement of Operations, if applicable. Amount for Fidelity Securities Lending Cash Central Fund represents the income earned on investing cash collateral, less rebates paid to borrowers and any lending agent fees associated with the loan, plus any premium payments received for lending certain types of securities.
Investment Valuation
The following is a summary of the inputs used, as of October 31, 2020, involving the Fund's assets and liabilities carried at fair value. The inputs or methodology used for valuing securities may not be an indication of the risk associated with investing in those securities. For more information on valuation inputs, and their aggregation into the levels used below, please refer to the Investment Valuation section in the accompanying Notes to Financial Statements.
| | Valuation Inputs at Reporting Date: |
| Description | Total | Level 1 | Level 2 | Level 3 |
| Investments in Securities: | | | | |
| Equities: | | | | |
| Communication Services | $252,542,243 | $158,150,698 | $94,391,545 | $-- |
| Consumer Discretionary | 299,083,661 | 154,008,217 | 145,075,444 | -- |
| Consumer Staples | 310,007,405 | 10,707,834 | 299,299,571 | -- |
| Financials | 601,989,214 | 382,349,472 | 219,639,742 | -- |
| Health Care | 567,670,662 | 111,539,558 | 456,131,104 | -- |
| Industrials | 807,095,635 | 340,134,039 | 466,961,596 | -- |
| Information Technology | 1,033,489,712 | 421,765,714 | 611,723,998 | -- |
| Materials | 263,826,962 | 263,826,962 | -- | -- |
| Real Estate | 44,366,664 | 44,366,664 | -- | -- |
| Money Market Funds | 121,487,622 | 121,487,622 | -- | -- |
| Total Investments in Securities: | $4,301,559,780 | $2,008,336,780 | $2,293,223,000 | $-- |
See accompanying notes which are an integral part of the financial statements.
Financial Statements
Statement of Assets and Liabilities
| | | October 31, 2020 |
| Assets | | |
Investment in securities, at value (including securities loaned of $28,192,680) — See accompanying schedule:
Unaffiliated issuers (cost $2,958,718,096) | $4,180,072,158 | |
| Fidelity Central Funds (cost $121,486,479) | 121,487,622 | |
| Total Investment in Securities (cost $3,080,204,575) | | $4,301,559,780 |
| Foreign currency held at value (cost $1,134) | | 1,123 |
| Receivable for investments sold | | 6,693,271 |
| Receivable for fund shares sold | | 4,946,591 |
| Dividends receivable | | 10,497,309 |
| Distributions receivable from Fidelity Central Funds | | 13,950 |
| Prepaid expenses | | 7,172 |
| Other receivables | | 91,544 |
| Total assets | | 4,323,810,740 |
| Liabilities | | |
| Payable for investments purchased | $1,456,692 | |
| Payable for fund shares redeemed | 4,154,731 | |
| Accrued management fee | 2,953,681 | |
| Distribution and service plan fees payable | 100,864 | |
| Other affiliated payables | 633,188 | |
| Other payables and accrued expenses | 221,151 | |
| Collateral on securities loaned | 28,866,798 | |
| Total liabilities | | 38,387,105 |
| Net Assets | | $4,285,423,635 |
| Net Assets consist of: | | |
| Paid in capital | | $3,234,617,090 |
| Total accumulated earnings (loss) | | 1,050,806,545 |
| Net Assets | | $4,285,423,635 |
| Net Asset Value and Maximum Offering Price | | |
| Class A: | | |
| Net Asset Value and redemption price per share ($174,561,115 ÷ 10,870,176 shares)(a) | | $16.06 |
| Maximum offering price per share (100/94.25 of $16.06) | | $17.04 |
| Class M: | | |
| Net Asset Value and redemption price per share ($30,353,462 ÷ 1,895,881 shares)(a) | | $16.01 |
| Maximum offering price per share (100/96.50 of $16.01) | | $16.59 |
| Class C: | | |
| Net Asset Value and offering price per share ($55,012,946 ÷ 3,508,321 shares)(a) | | $15.68 |
| International Growth: | | |
| Net Asset Value, offering price and redemption price per share ($1,292,391,732 ÷ 79,790,213 shares) | | $16.20 |
| Class I: | | |
| Net Asset Value, offering price and redemption price per share ($1,382,837,312 ÷ 85,574,306 shares) | | $16.16 |
| Class Z: | | |
| Net Asset Value, offering price and redemption price per share ($1,350,267,068 ÷ 83,377,632 shares) | | $16.19 |
(a) Redemption price per share is equal to net asset value less any applicable contingent deferred sales charge.
See accompanying notes which are an integral part of the financial statements.
Statement of Operations
| | | Year ended October 31, 2020 |
| Investment Income | | |
| Dividends | | $51,782,940 |
| Income from Fidelity Central Funds (including $337,303 from security lending) | | 907,500 |
| Income before foreign taxes withheld | | 52,690,440 |
| Less foreign taxes withheld | | (4,504,840) |
| Total income | | 48,185,600 |
| Expenses | | |
| Management fee | | |
| Basic fee | $27,138,974 | |
| Performance adjustment | 3,867,745 | |
| Transfer agent fees | 5,374,186 | |
| Distribution and service plan fees | 1,154,241 | |
| Accounting fees | 1,520,149 | |
| Custodian fees and expenses | 275,571 | |
| Independent trustees' fees and expenses | 21,763 | |
| Registration fees | 259,408 | |
| Audit | 78,752 | |
| Legal | 7,696 | |
| Miscellaneous | 118,936 | |
| Total expenses before reductions | 39,817,421 | |
| Expense reductions | (328,635) | |
| Total expenses after reductions | | 39,488,786 |
| Net investment income (loss) | | 8,696,814 |
| Realized and Unrealized Gain (Loss) | | |
| Net realized gain (loss) on: | | |
| Investment securities: | | |
| Unaffiliated issuers (net of foreign taxes of $19,505) | (71,450,147) | |
| Fidelity Central Funds | (9,264) | |
| Foreign currency transactions | 27,390 | |
| Total net realized gain (loss) | | (71,432,021) |
| Change in net unrealized appreciation (depreciation) on: | | |
| Investment securities: | | |
| Unaffiliated issuers (net of decrease in deferred foreign taxes of $382,270) | 365,421,728 | |
| Assets and liabilities in foreign currencies | 506,776 | |
| Total change in net unrealized appreciation (depreciation) | | 365,928,504 |
| Net gain (loss) | | 294,496,483 |
| Net increase (decrease) in net assets resulting from operations | | $303,193,297 |
See accompanying notes which are an integral part of the financial statements.
Statement of Changes in Net Assets
| | Year ended October 31, 2020 | Year ended October 31, 2019 |
| Increase (Decrease) in Net Assets | | |
| Operations | | |
| Net investment income (loss) | $8,696,814 | $38,864,369 |
| Net realized gain (loss) | (71,432,021) | (16,958,958) |
| Change in net unrealized appreciation (depreciation) | 365,928,504 | 515,068,399 |
| Net increase (decrease) in net assets resulting from operations | 303,193,297 | 536,973,810 |
| Distributions to shareholders | (37,153,475) | (19,640,106) |
| Share transactions - net increase (decrease) | 692,520,315 | 555,139,771 |
| Total increase (decrease) in net assets | 958,560,137 | 1,072,473,475 |
| Net Assets | | |
| Beginning of period | 3,326,863,498 | 2,254,390,023 |
| End of period | $4,285,423,635 | $3,326,863,498 |
See accompanying notes which are an integral part of the financial statements.
Financial Highlights
Fidelity International Growth Fund Class A
| Years ended October 31, | 2020 | 2019 | 2018 | 2017 | 2016 |
| Selected Per–Share Data | | | | | |
| Net asset value, beginning of period | $15.03 | $12.47 | $13.34 | $10.88 | $11.30 |
| Income from Investment Operations | | | | | |
| Net investment income (loss)A | (.01) | .15B | .09 | .07 | .12C |
| Net realized and unrealized gain (loss) | 1.16 | 2.48 | (.90) | 2.49 | (.48) |
| Total from investment operations | 1.15 | 2.63 | (.81) | 2.56 | (.36) |
| Distributions from net investment income | (.12) | (.07) | (.04) | (.10) | (.05) |
| Distributions from net realized gain | – | – | (.02) | – | (.01) |
| Total distributions | (.12) | (.07) | (.06) | (.10) | (.06) |
| Redemption fees added to paid in capitalA | – | – | – | –D | –D |
| Net asset value, end of period | $16.06 | $15.03 | $12.47 | $13.34 | $10.88 |
| Total ReturnE,F | 7.66% | 21.25% | (6.12)% | 23.80% | (3.22)% |
| Ratios to Average Net AssetsG,H | | | | | |
| Expenses before reductions | 1.30% | 1.28% | 1.24% | 1.28% | 1.27% |
| Expenses net of fee waivers, if any | 1.30% | 1.28% | 1.23% | 1.28% | 1.27% |
| Expenses net of all reductions | 1.29% | 1.27% | 1.22% | 1.27% | 1.27% |
| Net investment income (loss) | (.08)% | 1.14%B | .64% | .62% | 1.05%C |
| Supplemental Data | | | | | |
| Net assets, end of period (000 omitted) | $174,561 | $164,247 | $138,802 | $156,988 | $221,861 |
| Portfolio turnover rateI | 23% | 21% | 34% | 22% | 29% |
A Calculated based on average shares outstanding during the period.
B Net investment income per share reflects one or more large, non-recurring dividend(s) which amounted to $.07 per share. Excluding such non-recurring dividend(s), the ratio of net investment income (loss) to average net assets would have been .65%.
C Net investment income per share reflects one or more large, non-recurring dividend(s) which amounted to $.04 per share. Excluding such non-recurring dividend(s), the ratio of net investment income (loss) to average net assets would have been .68%.
D Amount represents less than $.005 per share.
E Total returns would have been lower if certain expenses had not been reduced during the applicable periods shown.
F Total returns do not include the effect of the sales charges.
G Fees and expenses of any underlying mutual funds or exchange-traded funds (ETFs) are not included in the Fund's expense ratio. The Fund indirectly bears its proportionate share of these expenses. For additional expense information related to investments in Fidelity Central Funds, please refer to the "Investments in Fidelity Central Funds" note found in the Notes to Financial Statements section of the most recent Annual or Semi-Annual report.
H Expense ratios reflect operating expenses of the class. Expenses before reductions do not reflect amounts reimbursed, waived, or reduced through arrangements with the investment adviser, brokerage services, or other offset arrangements, if applicable, and do not represent the amount paid by the class during periods when reimbursements, waivers or reductions occur.
I Amount does not include the portfolio activity of any underlying mutual funds or exchange-traded funds (ETFs).
See accompanying notes which are an integral part of the financial statements.
Fidelity International Growth Fund Class M
| Years ended October 31, | 2020 | 2019 | 2018 | 2017 | 2016 |
| Selected Per–Share Data | | | | | |
| Net asset value, beginning of period | $14.99 | $12.43 | $13.30 | $10.84 | $11.26 |
| Income from Investment Operations | | | | | |
| Net investment income (loss)A | (.06) | .11B | .05 | .04 | .08C |
| Net realized and unrealized gain (loss) | 1.15 | 2.48 | (.90) | 2.49 | (.48) |
| Total from investment operations | 1.09 | 2.59 | (.85) | 2.53 | (.40) |
| Distributions from net investment income | (.07) | (.03) | (.01) | (.07) | (.01) |
| Distributions from net realized gain | – | – | (.02) | – | (.01) |
| Total distributions | (.07) | (.03) | (.02)D | (.07) | (.02) |
| Redemption fees added to paid in capitalA | – | – | – | –E | –E |
| Net asset value, end of period | $16.01 | $14.99 | $12.43 | $13.30 | $10.84 |
| Total ReturnF,G | 7.27% | 20.92% | (6.40)% | 23.51% | (3.58)% |
| Ratios to Average Net AssetsH,I | | | | | |
| Expenses before reductions | 1.59% | 1.58% | 1.54% | 1.59% | 1.61% |
| Expenses net of fee waivers, if any | 1.59% | 1.58% | 1.53% | 1.59% | 1.61% |
| Expenses net of all reductions | 1.58% | 1.58% | 1.52% | 1.58% | 1.61% |
| Net investment income (loss) | (.37)% | .83%B | .34% | .31% | .71%C |
| Supplemental Data | | | | | |
| Net assets, end of period (000 omitted) | $30,353 | $28,534 | $26,479 | $33,597 | $27,966 |
| Portfolio turnover rateJ | 23% | 21% | 34% | 22% | 29% |
A Calculated based on average shares outstanding during the period.
B Net investment income per share reflects one or more large, non-recurring dividend(s) which amounted to $.07 per share. Excluding such non-recurring dividend(s), the ratio of net investment income (loss) to average net assets would have been .34%.
C Net investment income per share reflects one or more large, non-recurring dividend(s) which amounted to $.04 per share. Excluding such non-recurring dividend(s), the ratio of net investment income (loss) to average net assets would have been .34%.
D Total distributions per share do not sum due to rounding.
E Amount represents less than $.005 per share.
F Total returns would have been lower if certain expenses had not been reduced during the applicable periods shown.
G Total returns do not include the effect of the sales charges.
H Fees and expenses of any underlying mutual funds or exchange-traded funds (ETFs) are not included in the Fund's expense ratio. The Fund indirectly bears its proportionate share of these expenses. For additional expense information related to investments in Fidelity Central Funds, please refer to the "Investments in Fidelity Central Funds" note found in the Notes to Financial Statements section of the most recent Annual or Semi-Annual report.
I Expense ratios reflect operating expenses of the class. Expenses before reductions do not reflect amounts reimbursed, waived, or reduced through arrangements with the investment adviser, brokerage services, or other offset arrangements, if applicable, and do not represent the amount paid by the class during periods when reimbursements, waivers or reductions occur.
J Amount does not include the portfolio activity of any underlying mutual funds or exchange-traded funds (ETFs).
See accompanying notes which are an integral part of the financial statements.
Fidelity International Growth Fund Class C
| Years ended October 31, | 2020 | 2019 | 2018 | 2017 | 2016 |
| Selected Per–Share Data | | | | | |
| Net asset value, beginning of period | $14.68 | $12.20 | $13.10 | $10.67 | $11.12 |
| Income from Investment Operations | | | | | |
| Net investment income (loss)A | (.13) | .05B | (.01) | (.02) | .03C |
| Net realized and unrealized gain (loss) | 1.13 | 2.43 | (.89) | 2.47 | (.47) |
| Total from investment operations | 1.00 | 2.48 | (.90) | 2.45 | (.44) |
| Distributions from net investment income | – | – | – | (.02) | – |
| Distributions from net realized gain | – | – | – | – | (.01) |
| Total distributions | – | – | – | (.02) | (.01) |
| Redemption fees added to paid in capitalA | – | – | – | –D | –D |
| Net asset value, end of period | $15.68 | $14.68 | $12.20 | $13.10 | $10.67 |
| Total ReturnE,F | 6.81% | 20.33% | (6.87)% | 22.96% | (3.98)% |
| Ratios to Average Net AssetsG,H | | | | | |
| Expenses before reductions | 2.07% | 2.04% | 1.99% | 2.04% | 2.07% |
| Expenses net of fee waivers, if any | 2.07% | 2.04% | 1.99% | 2.04% | 2.07% |
| Expenses net of all reductions | 2.06% | 2.03% | 1.98% | 2.04% | 2.06% |
| Net investment income (loss) | (.85)% | .38%B | (.11)% | (.15)% | .26%C |
| Supplemental Data | | | | | |
| Net assets, end of period (000 omitted) | $55,013 | $57,291 | $60,489 | $68,908 | $52,738 |
| Portfolio turnover rateI | 23% | 21% | 34% | 22% | 29% |
A Calculated based on average shares outstanding during the period.
B Net investment income per share reflects one or more large, non-recurring dividend(s) which amounted to $.06 per share. Excluding such non-recurring dividend(s), the ratio of net investment income (loss) to average net assets would have been (.11)%.
C Net investment income per share reflects one or more large, non-recurring dividend(s) which amounted to $.04 per share. Excluding such non-recurring dividend(s), the ratio of net investment income (loss) to average net assets would have been (.12) %.
D Amount represents less than $.005 per share.
E Total returns would have been lower if certain expenses had not been reduced during the applicable periods shown.
F Total returns do not include the effect of the contingent deferred sales charge.
��G Fees and expenses of any underlying mutual funds or exchange-traded funds (ETFs) are not included in the Fund's expense ratio. The Fund indirectly bears its proportionate share of these expenses. For additional expense information related to investments in Fidelity Central Funds, please refer to the "Investments in Fidelity Central Funds" note found in the Notes to Financial Statements section of the most recent Annual or Semi-Annual report.
H Expense ratios reflect operating expenses of the class. Expenses before reductions do not reflect amounts reimbursed, waived, or reduced through arrangements with the investment adviser, brokerage services, or other offset arrangements, if applicable, and do not represent the amount paid by the class during periods when reimbursements, waivers or reductions occur.
I Amount does not include the portfolio activity of any underlying mutual funds or exchange-traded funds (ETFs).
See accompanying notes which are an integral part of the financial statements.
Fidelity International Growth Fund
| Years ended October 31, | 2020 | 2019 | 2018 | 2017 | 2016 |
| Selected Per–Share Data | | | | | |
| Net asset value, beginning of period | $15.16 | $12.57 | $13.45 | $10.97 | $11.38 |
| Income from Investment Operations | | | | | |
| Net investment income (loss)A | .03 | .19B | .13 | .10 | .15C |
| Net realized and unrealized gain (loss) | 1.17 | 2.51 | (.92) | 2.51 | (.47) |
| Total from investment operations | 1.20 | 2.70 | (.79) | 2.61 | (.32) |
| Distributions from net investment income | (.16) | (.11) | (.08) | (.13) | (.08) |
| Distributions from net realized gain | – | – | (.02) | – | (.01) |
| Total distributions | (.16) | (.11) | (.09)D | (.13) | (.09) |
| Redemption fees added to paid in capitalA | – | – | – | –E | –E |
| Net asset value, end of period | $16.20 | $15.16 | $12.57 | $13.45 | $10.97 |
| Total ReturnF | 7.93% | 21.66% | (5.89)% | 24.14% | (2.87)% |
| Ratios to Average Net AssetsG,H | | | | | |
| Expenses before reductions | 1.01% | .99% | .95% | 1.03% | .99% |
| Expenses net of fee waivers, if any | 1.01% | .99% | .95% | 1.03% | .99% |
| Expenses net of all reductions | 1.00% | .99% | .94% | 1.03% | .98% |
| Net investment income (loss) | .21% | 1.42%B | .93% | .87% | 1.34%C |
| Supplemental Data | | | | | |
| Net assets, end of period (000 omitted) | $1,292,392 | $1,040,532 | $811,101 | $961,775 | $1,038,771 |
| Portfolio turnover rateI | 23% | 21% | 34% | 22% | 29% |
A Calculated based on average shares outstanding during the period.
B Net investment income per share reflects one or more large, non-recurring dividend(s) which amounted to $.07 per share. Excluding such non-recurring dividend(s), the ratio of net investment income (loss) to average net assets would have been .93%.
C Net investment income per share reflects one or more large, non-recurring dividend(s) which amounted to $.04 per share. Excluding such non-recurring dividend(s), the ratio of net investment income (loss) to average net assets would have been .96%.
D Total distributions per share do not sum due to rounding.
E Amount represents less than $.005 per share.
F Total returns would have been lower if certain expenses had not been reduced during the applicable periods shown.
G Fees and expenses of any underlying mutual funds or exchange-traded funds (ETFs) are not included in the Fund's expense ratio. The Fund indirectly bears its proportionate share of these expenses. For additional expense information related to investments in Fidelity Central Funds, please refer to the "Investments in Fidelity Central Funds" note found in the Notes to Financial Statements section of the most recent Annual or Semi-Annual report.
H Expense ratios reflect operating expenses of the class. Expenses before reductions do not reflect amounts reimbursed, waived, or reduced through arrangements with the investment adviser, brokerage services, or other offset arrangements, if applicable, and do not represent the amount paid by the class during periods when reimbursements, waivers or reductions occur.
I Amount does not include the portfolio activity of any underlying mutual funds or exchange-traded funds (ETFs).
See accompanying notes which are an integral part of the financial statements.
Fidelity International Growth Fund Class I
| Years ended October 31, | 2020 | 2019 | 2018 | 2017 | 2016 |
| Selected Per–Share Data | | | | | |
| Net asset value, beginning of period | $15.13 | $12.55 | $13.43 | $10.95 | $11.36 |
| Income from Investment Operations | | | | | |
| Net investment income (loss)A | .03 | .20B | .13 | .11 | .15C |
| Net realized and unrealized gain (loss) | 1.16 | 2.49 | (.91) | 2.51 | (.47) |
| Total from investment operations | 1.19 | 2.69 | (.78) | 2.62 | (.32) |
| Distributions from net investment income | (.16) | (.11) | (.09) | (.14) | (.08) |
| Distributions from net realized gain | – | – | (.02) | – | (.01) |
| Total distributions | (.16) | (.11) | (.10)D | (.14) | (.09) |
| Redemption fees added to paid in capitalA | – | – | – | –E | –E |
| Net asset value, end of period | $16.16 | $15.13 | $12.55 | $13.43 | $10.95 |
| Total ReturnF | 7.90% | 21.64% | (5.83)% | 24.23% | (2.87)% |
| Ratios to Average Net AssetsG,H | | | | | |
| Expenses before reductions | 1.01% | .97% | .93% | .98% | .98% |
| Expenses net of fee waivers, if any | 1.01% | .97% | .93% | .98% | .98% |
| Expenses net of all reductions | 1.00% | .97% | .92% | .97% | .98% |
| Net investment income (loss) | .21% | 1.44%B | .94% | .92% | 1.34%C |
| Supplemental Data | | | | | |
| Net assets, end of period (000 omitted) | $1,382,837 | $953,360 | $660,961 | $728,227 | $359,676 |
| Portfolio turnover rateI | 23% | 21% | 34% | 22% | 29% |
A Calculated based on average shares outstanding during the period.
B Net investment income per share reflects one or more large, non-recurring dividend(s) which amounted to $.07 per share. Excluding such non-recurring dividend(s), the ratio of net investment income (loss) to average net assets would have been .96%.
C Net investment income per share reflects one or more large, non-recurring dividend(s) which amounted to $.04 per share. Excluding such non-recurring dividend(s), the ratio of net investment income (loss) to average net assets would have been .97%.
D Total distributions per share do not sum due to rounding.
E Amount represents less than $.005 per share.
F Total returns would have been lower if certain expenses had not been reduced during the applicable periods shown.
G Fees and expenses of any underlying mutual funds or exchange-traded funds (ETFs) are not included in the Fund's expense ratio. The Fund indirectly bears its proportionate share of these expenses. For additional expense information related to investments in Fidelity Central Funds, please refer to the "Investments in Fidelity Central Funds" note found in the Notes to Financial Statements section of the most recent Annual or Semi-Annual report.
H Expense ratios reflect operating expenses of the class. Expenses before reductions do not reflect amounts reimbursed, waived, or reduced through arrangements with the investment adviser, brokerage services, or other offset arrangements, if applicable, and do not represent the amount paid by the class during periods when reimbursements, waivers or reductions occur.
I Amount does not include the portfolio activity of any underlying mutual funds or exchange-traded funds (ETFs).
See accompanying notes which are an integral part of the financial statements.
Fidelity International Growth Fund Class Z
| Years ended October 31, | 2020 | 2019 | 2018 | 2017 | 2016 |
| Selected Per–Share Data | | | | | |
| Net asset value, beginning of period | $15.16 | $12.57 | $13.45 | $10.97 | $11.38 |
| Income from Investment Operations | | | | | |
| Net investment income (loss)A | .05 | .22B | .15 | .13 | .16C |
| Net realized and unrealized gain (loss) | 1.16 | 2.50 | (.91) | 2.50 | (.47) |
| Total from investment operations | 1.21 | 2.72 | (.76) | 2.63 | (.31) |
| Distributions from net investment income | (.18) | (.13) | (.10) | (.15) | (.09) |
| Distributions from net realized gain | – | – | (.02) | – | (.01) |
| Total distributions | (.18) | (.13) | (.12) | (.15) | (.10) |
| Redemption fees added to paid in capitalA | – | – | – | –D | –D |
| Net asset value, end of period | $16.19 | $15.16 | $12.57 | $13.45 | $10.97 |
| Total ReturnE | 8.01% | 21.85% | (5.71)% | 24.33% | (2.73)% |
| Ratios to Average Net AssetsF,G | | | | | |
| Expenses before reductions | .88% | .84% | .80% | .84% | .85% |
| Expenses net of fee waivers, if any | .88% | .84% | .80% | .84% | .85% |
| Expenses net of all reductions | .87% | .84% | .79% | .84% | .84% |
| Net investment income (loss) | .34% | 1.57%B | 1.08% | 1.05% | 1.48%C |
| Supplemental Data | | | | | |
| Net assets, end of period (000 omitted) | $1,350,267 | $1,082,899 | $556,558 | $373,878 | $16,977 |
| Portfolio turnover rateH | 23% | 21% | 34% | 22% | 29% |
A Calculated based on average shares outstanding during the period.
B Net investment income per share reflects one or more large, non-recurring dividend(s) which amounted to $.07 per share. Excluding such non-recurring dividend(s), the ratio of net investment income (loss) to average net assets would have been 1.08%.
C Net investment income per share reflects one or more large, non-recurring dividend(s) which amounted to $.04 per share. Excluding such non-recurring dividend(s), the ratio of net investment income (loss) to average net assets would have been 1.10%.
D Amount represents less than $.005 per share.
E Total returns would have been lower if certain expenses had not been reduced during the applicable periods shown.
F Fees and expenses of any underlying mutual funds or exchange-traded funds (ETFs) are not included in the Fund's expense ratio. The Fund indirectly bears its proportionate share of these expenses. For additional expense information related to investments in Fidelity Central Funds, please refer to the "Investments in Fidelity Central Funds" note found in the Notes to Financial Statements section of the most recent Annual or Semi-Annual report.
G Expense ratios reflect operating expenses of the class. Expenses before reductions do not reflect amounts reimbursed, waived, or reduced through arrangements with the investment adviser, brokerage services, or other offset arrangements, if applicable, and do not represent the amount paid by the class during periods when reimbursements, waivers or reductions occur.
H Amount does not include the portfolio activity of any underlying mutual funds or exchange-traded funds (ETFs).
See accompanying notes which are an integral part of the financial statements.
Notes to Financial Statements
For the period ended October 31, 2020
1. Organization.
Fidelity International Growth Fund (the Fund) is a fund of Fidelity Investment Trust (the Trust) and is authorized to issue an unlimited number of shares. The Trust is registered under the Investment Company Act of 1940, as amended (the 1940 Act), as an open-end management investment company organized as a Massachusetts business trust. The Fund offers Class A, Class M, Class C, International Growth, Class I and Class Z shares, each of which has equal rights as to assets and voting privileges. Each class has exclusive voting rights with respect to matters that affect that class. Class C shares will automatically convert to Class A shares after a holding period of ten years from the initial date of purchase, with certain exceptions.
Effective January 1, 2020:
Investment advisers Fidelity Investments Money Management, Inc., FMR Co., Inc., and Fidelity SelectCo, LLC, merged with and into Fidelity Management & Research Company. In connection with the merger transactions, the resulting, merged investment adviser was then redomiciled from Massachusetts to Delaware, changed its corporate structure from a corporation to a limited liability company, and changed its name to "Fidelity Management & Research Company LLC".
Broker-dealer Fidelity Distributors Corporation merged with and into Fidelity Investments Institutional Services Company, Inc. ("FIISC"). FIISC was then redomiciled from Massachusetts to Delaware, changed its corporate structure from a corporation to a limited liability company, and changed its name to "Fidelity Distributors Company LLC".
Fidelity Investments Institutional Operations Company, Inc. converted from a Massachusetts corporation to a Massachusetts LLC, and changed its name to "Fidelity Investments Institutional Operations Company LLC".
2. Investments in Fidelity Central Funds.
The Fund invests in Fidelity Central Funds, which are open-end investment companies generally available only to other investment companies and accounts managed by the investment adviser and its affiliates. The Fund's Schedule of Investments lists each of the Fidelity Central Funds held as of period end, if any, as an investment of the Fund, but does not include the underlying holdings of each Fidelity Central Fund. As an Investing Fund, the Fund indirectly bears its proportionate share of the expenses of the underlying Fidelity Central Funds.
The Money Market Central Funds seek preservation of capital and current income and are managed by the investment adviser. Annualized expenses of the Money Market Central Funds as of their most recent shareholder report date ranged from less than .005% to .01%.
A complete unaudited list of holdings for each Fidelity Central Fund is available upon request or at the Securities and Exchange Commission (the SEC) website at www.sec.gov. In addition, the financial statements of the Fidelity Central Funds, which are not covered by the Fund's Report of Independent Registered Public Accounting Firm, are available on the SEC website or upon request.
3. Significant Accounting Policies.
The Fund is an investment company and applies the accounting and reporting guidance of the Financial Accounting Standards Board (FASB) Accounting Standards Codification Topic 946 Financial Services – Investment Companies. The financial statements have been prepared in conformity with accounting principles generally accepted in the United States of America (GAAP), which require management to make certain estimates and assumptions at the date of the financial statements. Actual results could differ from those estimates. Subsequent events, if any, through the date that the financial statements were issued have been evaluated in the preparation of the financial statements. The following summarizes the significant accounting policies of the Fund:
Investment Valuation. Investments are valued as of 4:00 p.m. Eastern time on the last calendar day of the period. The Board of Trustees (the Board) has delegated the day to day responsibility for the valuation of the Fund's investments to the Fair Value Committee (the Committee) established by the Fund's investment adviser. In accordance with valuation policies and procedures approved by the Board, the Fund attempts to obtain prices from one or more third party pricing vendors or brokers to value its investments. When current market prices, quotations or currency exchange rates are not readily available or reliable, investments will be fair valued in good faith by the Committee, in accordance with procedures adopted by the Board. Factors used in determining fair value vary by investment type and may include market or investment specific events. The frequency with which these procedures are used cannot be predicted and they may be utilized to a significant extent. The Committee oversees the Fund's valuation policies and procedures and reports to the Board on the Committee's activities and fair value determinations. The Board monitors the appropriateness of the procedures used in valuing the Fund's investments and ratifies the fair value determinations of the Committee.
The Fund categorizes the inputs to valuation techniques used to value its investments into a disclosure hierarchy consisting of three levels as shown below:
- Level 1 – quoted prices in active markets for identical investments
- Level 2 – other significant observable inputs (including quoted prices for similar investments, interest rates, prepayment speeds, etc.)
- Level 3 – unobservable inputs (including the Fund's own assumptions based on the best information available)
Valuation techniques used to value the Fund's investments by major category are as follows:
Equity securities, including restricted securities, for which market quotations are readily available, are valued at the last reported sale price or official closing price as reported by a third party pricing vendor on the primary market or exchange on which they are traded and are categorized as Level 1 in the hierarchy. In the event there were no sales during the day or closing prices are not available, securities are valued at the last quoted bid price or may be valued using the last available price and are generally categorized as Level 2 in the hierarchy. For foreign equity securities, when market or security specific events arise, comparisons to the valuation of American Depositary Receipts (ADRs), futures contracts, Exchange-Traded Funds (ETFs) and certain indexes as well as quoted prices for similar securities may be used and would be categorized as Level 2 in the hierarchy. For equity securities, including restricted securities, where observable inputs are limited, assumptions about market activity and risk are used and these securities may be categorized as Level 3 in the hierarchy.
Investments in open-end mutual funds, including the Fidelity Central Funds, are valued at their closing net asset value (NAV) each business day and are categorized as Level 1 in the hierarchy.
Changes in valuation techniques may result in transfers in or out of an assigned level within the disclosure hierarchy. The aggregate value of investments by input level as of October 31, 2020 is included at the end of the Fund's Schedule of Investments.
Foreign Currency. Certain Funds may use foreign currency contracts to facilitate transactions in foreign-denominated securities. Gains and losses from these transactions may arise from changes in the value of the foreign currency or if the counterparties do not perform under the contracts' terms.
Foreign-denominated assets, including investment securities, and liabilities are translated into U.S. dollars at the exchange rates at period end. Purchases and sales of investment securities, income and dividends received, and expenses denominated in foreign currencies are translated into U.S. dollars at the exchange rate in effect on the transaction date.
The effects of exchange rate fluctuations on investments are included with the net realized and unrealized gain (loss) on investment securities. Other foreign currency transactions resulting in realized and unrealized gain (loss) are disclosed separately.
Investment Transactions and Income. For financial reporting purposes, the Fund's investment holdings and NAV include trades executed through the end of the last business day of the period. The NAV per share for processing shareholder transactions is calculated as of the close of business of the New York Stock Exchange (NYSE), normally 4:00 p.m. Eastern time and includes trades executed through the end of the prior business day. Gains and losses on securities sold are determined on the basis of identified cost and include proceeds received from litigation. Dividend income is recorded on the ex-dividend date, except for certain dividends from foreign securities where the ex-dividend date may have passed, which are recorded as soon as the Fund is informed of the ex-dividend date. Non-cash dividends included in dividend income, if any, are recorded at the fair market value of the securities received. Income and capital gain distributions from Fidelity Central Funds, if any, are recorded on the ex-dividend date. Certain distributions received by the Fund represent a return of capital or capital gain. The Fund determines the components of these distributions subsequent to the ex-dividend date, based upon receipt of tax filings or other correspondence relating to the underlying investment. These distributions are recorded as a reduction of cost of investments and/or as a realized gain. Investment income is recorded net of foreign taxes withheld where recovery of such taxes is uncertain.
Class Allocations and Expenses. Investment income, realized and unrealized capital gains and losses, common expenses of the Fund, and certain fund-level expense reductions, if any, are allocated daily on a pro-rata basis to each class based on the relative net assets of each class to the total net assets of the Fund. Each class differs with respect to transfer agent and distribution and service plan fees incurred. Certain expense reductions may also differ by class. For the reporting period, the allocated portion of income and expenses to each class as a percent of its average net assets may vary due to the timing of recording these transactions in relation to fluctuating net assets of the classes. Expenses directly attributable to a fund are charged to that fund. Expenses attributable to more than one fund are allocated among the respective funds on the basis of relative net assets or other appropriate methods. Expense estimates are accrued in the period to which they relate and adjustments are made when actual amounts are known.
Income Tax Information and Distributions to Shareholders. Each year, the Fund intends to qualify as a regulated investment company under Subchapter M of the Internal Revenue Code, including distributing substantially all of its taxable income and realized gains. As a result, no provision for U.S. Federal income taxes is required. As of October 31, 2020, the Fund did not have any unrecognized tax benefits in the financial statements; nor is the Fund aware of any tax positions for which it is reasonably possible that the total amounts of unrecognized tax benefits will significantly change in the next twelve months. The Fund files a U.S. federal tax return, in addition to state and local tax returns as required. The Fund's federal income tax returns are subject to examination by the Internal Revenue Service (IRS) for a period of three fiscal years after they are filed. State and local tax returns may be subject to examination for an additional fiscal year depending on the jurisdiction. Foreign taxes are provided for based on the Fund's understanding of the tax rules and rates that exist in the foreign markets in which it invests. The Fund is subject to a tax imposed on capital gains by certain countries in which it invests.
Distributions are declared and recorded on the ex-dividend date. Income and capital gain distributions are declared separately for each class. Income and capital gain distributions are determined in accordance with income tax regulations, which may differ from GAAP. In addition, the Fund claimed a portion of the payment made to redeeming shareholders as a distribution for income tax purposes.
Capital accounts within the financial statements are adjusted for permanent book-tax differences. These adjustments have no impact on net assets or the results of operations. Capital accounts are not adjusted for temporary book-tax differences which will reverse in a subsequent period.
Book-tax differences are primarily due to foreign currency transactions, certain foreign taxes passive foreign investment companies (PFIC), capital loss carryfowards and losses deferred due to wash sales.
As of period end, the cost and unrealized appreciation (depreciation) in securities, and derivatives if applicable, for federal income tax purposes were as follows:
| Gross unrealized appreciation | $1,276,408,909 |
| Gross unrealized depreciation | (63,052,750) |
| Net unrealized appreciation (depreciation) | $1,213,356,159 |
| Tax Cost | $3,088,203,621 |
The tax-based components of distributable earnings as of period end were as follows:
| Undistributed ordinary income | $6,667,488 |
| Capital loss carryforward | $(169,750,694) |
| Net unrealized appreciation (depreciation) on securities and other investments | $1,213,889,751 |
Capital loss carryforwards are only available to offset future capital gains of the Fund to the extent provided by regulations and may be limited. The capital loss carryforward information presented below, including any applicable limitation, is estimated as of fiscal period end and is subject to adjustment.
| No expiration | |
| Short-term | $(145,416,972) |
| Long-term | (24,333,722) |
| Total capital loss carryforward | $(169,750,694) |
The tax character of distributions paid was as follows:
| | October 31, 2020 | October 31, 2019 |
| Ordinary Income | $37,153,475 | $ 19,640,106 |
Restricted Securities (including Private Placements). The Fund may invest in securities that are subject to legal or contractual restrictions on resale. These securities generally may be resold in transactions exempt from registration or to the public if the securities are registered. Disposal of these securities may involve time-consuming negotiations and expense, and prompt sale at an acceptable price may be difficult. Information regarding restricted securities is included at the end of the Fund's Schedule of Investments.
4. Purchases and Sales of Investments.
Purchases and sales of securities, other than short-term securities, are noted in the table below.
| | Purchases ($) | Sales ($) |
| Fidelity International Growth Fund | 1,503,525,987 | 867,841,237 |
5. Fees and Other Transactions with Affiliates.
Management Fee. Fidelity Management & Research Company LLC (the investment adviser) and its affiliates provide the Fund with investment management related services for which the Fund pays a monthly management fee. The management fee is the sum of an individual fund fee rate that is based on an annual rate of .45% of the Fund's average net assets and an annualized group fee rate that averaged .23% during the period. The group fee rate is based upon the monthly average net assets of a group of registered investment companies with which the investment adviser has management contracts. The group fee rate decreases as assets under management increase and increases as assets under management decrease. In addition, the management fee is subject to a performance adjustment (up to a maximum of +/- .20% of the Fund's average net assets over a 36 month performance period). The upward or downward adjustment to the management fee is based on the relative investment performance of International Growth as compared to its benchmark index, the MSCI EAFE Growth Index, over the same 36 month performance period. For the reporting period, the total annual management fee rate, including the performance adjustment, was .78% of the Fund's average net assets. The performance adjustment included in the management fee rate may be higher or lower than the maximum performance adjustment rate due to the difference between the average net assets for the reporting and performance periods.
Distribution and Service Plan Fees. In accordance with Rule 12b-1 of the 1940 Act, the Fund has adopted separate Distribution and Service Plans for each class of shares. Certain classes pay Fidelity Distributors Company LLC (FDC), an affiliate of the investment adviser, separate Distribution and Service Fees, each of which is based on an annual percentage of each class' average net assets. In addition, FDC may pay financial intermediaries for selling shares of the Fund and providing shareholder support services. For the period, the Distribution and Service Fee rates, total fees and amounts retained by FDC were as follows:
| | Distribution Fee | Service Fee | Total Fees | Retained by FDC |
| Class A | -% | .25% | $435,741 | $12,805 |
| Class M | .25% | .25% | 148,108 | 555 |
| Class C | .75% | .25% | 570,392 | 70,325 |
| | | | $1,154,241 | $83,685 |
Sales Load. FDC may receive a front-end sales charge of up to 5.75% for selling Class A shares and 3.50% for selling Class M shares, some of which is paid to financial intermediaries for selling shares of the Fund. Depending on the holding period, FDC may receive contingent deferred sales charges levied on Class A, Class M and Class C redemptions. The deferred sales charges are 1.00% for Class C shares, 1.00% for certain purchases of Class A shares and .25% for certain purchases of Class M shares.
For the period, sales charge amounts retained by FDC were as follows:
| | Retained by FDC |
| Class A | $67,213 |
| Class M | 3,550 |
| Class(a) | 4,442 |
| | $75,205 |
(a) When Class C shares are initially sold, FDC pays commissions from its own resources to financial intermediaries through which the sales are made.
Transfer Agent Fees. Fidelity Investments Institutional Operations Company LLC (FIIOC), an affiliate of the investment adviser, is the transfer, dividend disbursing and shareholder servicing agent for each class of the Fund. FIIOC receives account fees and asset-based fees that vary according to the account size and type of account of the shareholders of the respective classes of the Fund, except for Class Z. FIIOC receives an asset-based fee of Class Z's average net assets. FIIOC pays for typesetting, printing and mailing of shareholder reports, except proxy statements. Effective February 1, 2020, the Board approved to change the fee for Class Z from .046% to .044%.
For the period, transfer agent fees for each class were as follows:
| | Amount | % of Class-Level Average Net Assets |
| Class A | $372,128 | .21 |
| Class M | 74,999 | .25 |
| Class C | 132,190 | .23 |
| International Growth | 2,152,078 | .18 |
| Class I | 2,073,210 | .18 |
| Class Z | 569,581 | .04 |
| | $5,374,186 | |
Accounting Fees. Fidelity Service Company, Inc. (FSC), an affiliate of the investment adviser, maintains the Fund's accounting records. The accounting fee is based on the level of average net assets for each month. For the period, the fees were equivalent to the following annual rates:
| | % of Average Net Assets |
| Fidelity International Growth Fund | .04 |
Brokerage Commissions. A portion of portfolio transactions were placed with brokerage firms which are affiliates of the investment adviser. Brokerage commissions are included in net realized gain (loss) and change in net unrealized appreciation (depreciation) in the Statement of Operations. The commissions paid to these affiliated firms were as follows:
| | Amount |
| Fidelity International Growth Fund | $2,604 |
Interfund Trades. Funds may purchase from or sell securities to other Fidelity Funds under procedures adopted by the Board. The procedures have been designed to ensure these interfund trades are executed in accordance with Rule 17a-7 of the 1940 Act. Interfund trades are included within the respective purchases and sales amounts shown in the Purchases and Sales of Investments note.
6. Committed Line of Credit.
Certain Funds participate with other funds managed by the investment adviser or an affiliate in a $4.25 billion credit facility (the "line of credit") to be utilized for temporary or emergency purposes to fund shareholder redemptions or for other short-term liquidity purposes. The participating funds have agreed to pay commitment fees on their pro-rata portion of the line of credit, which are reflected in Miscellaneous expenses on the Statement of Operations, and are as follows:
| | Amount |
| Fidelity International Growth Fund | $9,063 |
During the period, there were no borrowings on this line of credit.
Other. During the period, the investment adviser reimbursed the Fund for certain losses in the amount of $17,172.
7. Security Lending.
Funds lend portfolio securities from time to time in order to earn additional income. Lending agents are used, including National Financial Services (NFS), an affiliate of the investment adviser. Pursuant to a securities lending agreement, NFS will receive a fee, which is capped at 9.9% of a fund's daily lending revenue, for its services as lending agent. A fund may lend securities to certain qualified borrowers, including NFS. On the settlement date of the loan, a fund receives collateral (in the form of U.S. Treasury obligations, letters of credit and/or cash) against the loaned securities and maintains collateral in an amount not less than 100% of the market value of the loaned securities during the period of the loan. The market value of the loaned securities is determined at the close of business of a fund and any additional required collateral is delivered to a fund on the next business day. A fund or borrower may terminate the loan at any time, and if the borrower defaults on its obligation to return the securities loaned because of insolvency or other reasons, a fund may apply collateral received from the borrower against the obligation. A fund may experience delays and costs in recovering the securities loaned. Any cash collateral received is invested in the Fidelity Securities Lending Cash Central Fund. Any loaned securities are identified as such in the Schedule of Investments, and the value of loaned securities and cash collateral at period end, as applicable, are presented in the Statement of Assets and Liabilities. Security lending income represents the income earned on investing cash collateral, less rebates paid to borrowers and any lending agent fees associated with the loan, plus any premium payments received for lending certain types of securities. Security lending income is presented in the Statement of Operations as a component of income from Fidelity Central Funds. Affiliated security lending activity, if any, was as follows:
| | Total Security Lending Income Fees Paid to NFS | Security Lending Income From Securities Loaned to NFS | Value of Securities Loaned to NFS at Period End |
| Fidelity International Growth Fund | $14,094 | $7,522 | $– |
8. Expense Reductions.
Commissions paid to certain brokers with whom the investment adviser, or its affiliates, places trades on behalf of the Fund include an amount in addition to trade execution, which may be rebated back to the Fund to offset certain expenses. This amount totaled $294,028 for the period. In addition, through arrangements with the Fund's custodian, credits realized as a result of certain uninvested cash balances were used to reduce the Fund's expenses. During the period, custodian credits reduced the Fund's expenses by $129.
In addition, during the period the investment adviser or an affiliate reimbursed and/or waived a portion of fund-level operating expenses in the amount of $14,968.
In addition, during the period the investment adviser or an affiliate reimbursed the Fund $19,510 for an operational error which is included in the accompanying Statement of Operations.
9. Distributions to Shareholders.
Distributions to shareholders of each class were as follows:
| | Year ended
October 31, 2020 | Year ended
October 31, 2019 |
| Distributions to shareholders | | |
| Class A | $1,293,004 | $799,140 |
| Class M | 126,570 | 67,406 |
| International Growth | 11,436,124 | 6,773,948 |
| Class I | 10,268,278 | 5,925,234 |
| Class Z | 14,029,499 | 6,074,378 |
| Total | $37,153,475 | $19,640,106 |
10. Share Transactions.
Share transactions for each class were as follows and may contain automatic conversions between classes or exchanges between affiliated funds:
| | Shares | Shares | Dollars | Dollars |
| | Year ended October 31, 2020 | Year ended October 31, 2019 | Year ended October 31, 2020 | Year ended October 31, 2019 |
| Class A | | | | |
| Shares sold | 2,989,987 | 2,189,906 | $46,017,495 | $29,617,042 |
| Reinvestment of distributions | 82,376 | 65,987 | 1,271,885 | 797,127 |
| Shares redeemed | (3,126,648) | (2,460,516) | (46,955,285) | (33,266,170) |
| Net increase (decrease) | (54,285) | (204,623) | $334,095 | $(2,852,001) |
| Class M | | | | |
| Shares sold | 343,032 | 222,854 | $5,286,547 | $2,985,191 |
| Reinvestment of distributions | 8,192 | 5,584 | 126,490 | 67,395 |
| Shares redeemed | (359,470) | (454,872) | (5,488,737) | (6,157,629) |
| Net increase (decrease) | (8,246) | (226,434) | $(75,700) | $(3,105,043) |
| Class C | | | | |
| Shares sold | 519,965 | 508,793 | $7,918,151 | $6,676,253 |
| Shares redeemed | (913,274) | (1,564,780) | (13,538,212) | (20,317,328) |
| Net increase (decrease) | (393,309) | (1,055,987) | $(5,620,061) | $(13,641,075) |
| International Growth | | | | |
| Shares sold | 37,056,964 | 36,412,153 | $574,286,693 | $507,126,063 |
| Reinvestment of distributions | 682,465 | 517,780 | 10,605,506 | 6,291,030 |
| Shares redeemed | (26,595,096) | (32,793,153) | (398,275,317) | (452,090,577) |
| Net increase (decrease) | 11,144,333 | 4,136,780 | $186,616,882 | $61,326,516 |
| Class I | | | | |
| Shares sold | 49,267,116 | 29,610,999 | $739,103,903 | $400,447,377 |
| Reinvestment of distributions | 633,597 | 473,993 | 9,820,759 | 5,744,799 |
| Shares redeemed | (27,351,629) | (19,735,978) | (417,449,643) | (262,889,780) |
| Net increase (decrease) | 22,549,084 | 10,349,014 | $331,475,019 | $143,302,396 |
| Class Z | | | | |
| Shares sold | 38,341,456 | 50,657,565 | $574,337,458 | $674,068,605 |
| Reinvestment of distributions | 522,005 | 188,590 | 8,101,516 | 2,287,593 |
| Shares redeemed | (26,937,241) | (23,664,663) | (402,648,894) | (306,247,220) |
| Net increase (decrease) | 11,926,220 | 27,181,492 | $179,790,080 | $370,108,978 |
11. Other.
The Fund's organizational documents provide former and current trustees and officers with a limited indemnification against liabilities arising in connection with the performance of their duties to the Fund. In the normal course of business, the Fund may also enter into contracts that provide general indemnifications. The Fund's maximum exposure under these arrangements is unknown as this would be dependent on future claims that may be made against the Fund. The risk of material loss from such claims is considered remote.
12. Coronavirus (COVID-19) Pandemic.
An outbreak of COVID-19 first detected in China during December 2019 has since spread globally and was declared a pandemic by the World Health Organization during March 2020. Developments that disrupt global economies and financial markets, such as the COVID-19 pandemic, may magnify factors that affect the Fund's performance.
Report of Independent Registered Public Accounting Firm
To the Board of Trustees of Fidelity Investment Trust and Shareholders of Fidelity International Growth Fund
Opinion on the Financial Statements
We have audited the accompanying statement of assets and liabilities, including the schedule of investments, of Fidelity International Growth Fund (one of the funds constituting Fidelity Investment Trust, referred to hereafter as the “Fund”) as of October 31, 2020, the related statement of operations for the year ended October 31, 2020, the statement of changes in net assets for each of the two years in the period ended October 31, 2020, including the related notes, and the financial highlights for each of the five years in the period ended October 31, 2020 (collectively referred to as the “financial statements”). In our opinion, the financial statements present fairly, in all material respects, the financial position of the Fund as of October 31, 2020, the results of its operations for the year then ended, the changes in its net assets for each of the two years in the period ended October 31, 2020 and the financial highlights for each of the five years in the period ended October 31, 2020 in conformity with accounting principles generally accepted in the United States of America.
Basis for Opinion
These financial statements are the responsibility of the Fund’s management. Our responsibility is to express an opinion on the Fund’s financial statements based on our audits. We are a public accounting firm registered with the Public Company Accounting Oversight Board (United States) (PCAOB) and are required to be independent with respect to the Fund in accordance with the U.S. federal securities laws and the applicable rules and regulations of the Securities and Exchange Commission and the PCAOB.
We conducted our audits of these financial statements in accordance with the standards of the PCAOB. Those standards require that we plan and perform the audit to obtain reasonable assurance about whether the financial statements are free of material misstatement, whether due to error or fraud.
Our audits included performing procedures to assess the risks of material misstatement of the financial statements, whether due to error or fraud, and performing procedures that respond to those risks. Such procedures included examining, on a test basis, evidence regarding the amounts and disclosures in the financial statements. Our audits also included evaluating the accounting principles used and significant estimates made by management, as well as evaluating the overall presentation of the financial statements. Our procedures included confirmation of securities owned as of October 31, 2020 by correspondence with the custodian and brokers; when replies were not received from brokers, we performed other auditing procedures. We believe that our audits provide a reasonable basis for our opinion.
/s/ PricewaterhouseCoopers LLP
Boston, Massachusetts
December 14, 2020
We have served as the auditor of one or more investment companies in the Fidelity group of funds since 1932.
Trustees and Officers
The Trustees, Members of the Advisory Board (if any), and officers of the trust and fund, as applicable, are listed below. The Board of Trustees governs the fund and is responsible for protecting the interests of shareholders. The Trustees are experienced executives who meet periodically throughout the year to oversee the fund's activities, review contractual arrangements with companies that provide services to the fund, oversee management of the risks associated with such activities and contractual arrangements, and review the fund's performance. Except for Jonathan Chiel, each of the Trustees oversees 305 funds. Mr. Chiel oversees 176 funds.
The Trustees hold office without limit in time except that (a) any Trustee may resign; (b) any Trustee may be removed by written instrument, signed by at least two-thirds of the number of Trustees prior to such removal; (c) any Trustee who requests to be retired or who has become incapacitated by illness or injury may be retired by written instrument signed by a majority of the other Trustees; and (d) any Trustee may be removed at any special meeting of shareholders by a two-thirds vote of the outstanding voting securities of the trust. Each Trustee who is not an interested person (as defined in the 1940 Act) of the trust and the fund is referred to herein as an Independent Trustee. Each Independent Trustee shall retire not later than the last day of the calendar year in which his or her 75th birthday occurs. The Independent Trustees may waive this mandatory retirement age policy with respect to individual Trustees. Officers and Advisory Board Members hold office without limit in time, except that any officer or Advisory Board Member may resign or may be removed by a vote of a majority of the Trustees at any regular meeting or any special meeting of the Trustees. Except as indicated, each individual has held the office shown or other offices in the same company for the past five years.
The fund's Statement of Additional Information (SAI) includes more information about the Trustees. To request a free copy, call Fidelity at 1-800-544-8544 if you’re an individual investing directly with Fidelity, call 1-800-835-5092 if you’re a plan sponsor or participant with Fidelity as your recordkeeper or call 1-877-208-0098 on institutional accounts or if you’re an advisor or invest through one.
Experience, Skills, Attributes, and Qualifications of the Trustees. The Governance and Nominating Committee has adopted a statement of policy that describes the experience, qualifications, attributes, and skills that are necessary and desirable for potential Independent Trustee candidates (Statement of Policy). The Board believes that each Trustee satisfied at the time he or she was initially elected or appointed a Trustee, and continues to satisfy, the standards contemplated by the Statement of Policy. The Governance and Nominating Committee also engages professional search firms to help identify potential Independent Trustee candidates who have the experience, qualifications, attributes, and skills consistent with the Statement of Policy. From time to time, additional criteria based on the composition and skills of the current Independent Trustees, as well as experience or skills that may be appropriate in light of future changes to board composition, business conditions, and regulatory or other developments, have also been considered by the professional search firms and the Governance and Nominating Committee. In addition, the Board takes into account the Trustees' commitment and participation in Board and committee meetings, as well as their leadership of standing and ad hoc committees throughout their tenure.
In determining that a particular Trustee was and continues to be qualified to serve as a Trustee, the Board has considered a variety of criteria, none of which, in isolation, was controlling. The Board believes that, collectively, the Trustees have balanced and diverse experience, qualifications, attributes, and skills, which allow the Board to operate effectively in governing the fund and protecting the interests of shareholders. Information about the specific experience, skills, attributes, and qualifications of each Trustee, which in each case led to the Board's conclusion that the Trustee should serve (or continue to serve) as a trustee of the fund, is provided below.
Board Structure and Oversight Function. Robert A. Lawrence is an interested person and currently serves as Acting Chairman. The Trustees have determined that an interested Chairman is appropriate and benefits shareholders because an interested Chairman has a personal and professional stake in the quality and continuity of services provided to the fund. Independent Trustees exercise their informed business judgment to appoint an individual of their choosing to serve as Chairman, regardless of whether the Trustee happens to be independent or a member of management. The Independent Trustees have determined that they can act independently and effectively without having an Independent Trustee serve as Chairman and that a key structural component for assuring that they are in a position to do so is for the Independent Trustees to constitute a substantial majority for the Board. The Independent Trustees also regularly meet in executive session. Ned C. Lautenbach and David M. Thomas serve as Co-Lead Independent Trustees and as such each (i) acts as a liaison between the Independent Trustees and management with respect to matters important to the Independent Trustees and (ii) with management prepares agendas for Board meetings.
Fidelity® funds are overseen by different Boards of Trustees. The fund's Board oversees Fidelity's high income and certain equity funds, and other Boards oversee Fidelity's investment-grade bond, money market, asset allocation, and other equity funds. The asset allocation funds may invest in Fidelity® funds overseen by the fund's Board. The use of separate Boards, each with its own committee structure, allows the Trustees of each group of Fidelity® funds to focus on the unique issues of the funds they oversee, including common research, investment, and operational issues. On occasion, the separate Boards establish joint committees to address issues of overlapping consequences for the Fidelity® funds overseen by each Board.
The Trustees operate using a system of committees to facilitate the timely and efficient consideration of all matters of importance to the Trustees, the fund, and fund shareholders and to facilitate compliance with legal and regulatory requirements and oversight of the fund's activities and associated risks. The Board, acting through its committees, has charged FMR and its affiliates with (i) identifying events or circumstances the occurrence of which could have demonstrably adverse effects on the fund's business and/or reputation; (ii) implementing processes and controls to lessen the possibility that such events or circumstances occur or to mitigate the effects of such events or circumstances if they do occur; and (iii) creating and maintaining a system designed to evaluate continuously business and market conditions in order to facilitate the identification and implementation processes described in (i) and (ii) above. Because the day-to-day operations and activities of the fund are carried out by or through FMR, its affiliates, and other service providers, the fund's exposure to risks is mitigated but not eliminated by the processes overseen by the Trustees. While each of the Board's committees has responsibility for overseeing different aspects of the fund's activities, oversight is exercised primarily through the Operations, Audit, and Compliance Committees. Appropriate personnel, including but not limited to the fund's Chief Compliance Officer (CCO), FMR's internal auditor, the independent accountants, the fund's Treasurer and portfolio management personnel, make periodic reports to the Board's committees, as appropriate, including an annual review of Fidelity's risk management program for the Fidelity® funds. The responsibilities of each standing committee, including their oversight responsibilities, are described further under "Standing Committees of the Trustees."
Interested Trustees*:
Correspondence intended for a Trustee who is an interested person may be sent to Fidelity Investments, 245 Summer Street, Boston, Massachusetts 02210.
Name, Year of Birth; Principal Occupations and Other Relevant Experience+
Jonathan Chiel (1957)
Year of Election or Appointment: 2016
Trustee
Mr. Chiel also serves as Trustee of other Fidelity® funds. Mr. Chiel is Executive Vice President and General Counsel for FMR LLC (diversified financial services company, 2012-present). Previously, Mr. Chiel served as general counsel (2004-2012) and senior vice president and deputy general counsel (2000-2004) for John Hancock Financial Services; a partner with Choate, Hall & Stewart (1996-2000) (law firm); and an Assistant United States Attorney for the United States Attorney’s Office of the District of Massachusetts (1986-95), including Chief of the Criminal Division (1993-1995). Mr. Chiel is a director on the boards of the Boston Bar Foundation and the Maimonides School.
Robert A. Lawrence (1952)
Year of Election or Appointment: 2020
Trustee
Acting Chairman of the Board of Trustees
Mr. Lawrence also serves as Trustee of other funds. Previously, Mr. Lawrence served as a Member of the Advisory Board of certain funds. Prior to his retirement in 2008, Mr. Lawrence served as Vice President of certain Fidelity® funds (2006-2008), Senior Vice President, Head of High Income Division of Fidelity Management & Research Company (investment adviser firm, 2006-2008), and President of Fidelity Strategic Investments (investment adviser firm, 2002-2005).
* Determined to be an “Interested Trustee” by virtue of, among other things, his or her affiliation with the trust or various entities under common control with FMR.
+ The information includes the Trustee's principal occupation during the last five years and other information relating to the experience, attributes, and skills relevant to the Trustee's qualifications to serve as a Trustee, which led to the conclusion that the Trustee should serve as a Trustee for the fund.
Independent Trustees:
Correspondence intended for an Independent Trustee may be sent to Fidelity Investments, P.O. Box 55235, Boston, Massachusetts 02205-5235.
Name, Year of Birth; Principal Occupations and Other Relevant Experience+
Dennis J. Dirks (1948)
Year of Election or Appointment: 2005
Trustee
Mr. Dirks also serves as Trustee of other Fidelity® funds. Prior to his retirement in May 2003, Mr. Dirks served as Chief Operating Officer and as a member of the Board of The Depository Trust & Clearing Corporation (financial markets infrastructure), President, Chief Operating Officer and a member of the Board of The Depository Trust Company (DTC), President and a member of the Board of the National Securities Clearing Corporation (NSCC), Chief Executive Officer and a member of the Board of the Government Securities Clearing Corporation and Chief Executive Officer and a member of the Board of the Mortgage-Backed Securities Clearing Corporation. Mr. Dirks currently serves as a member of the Finance Committee (2016-present) and Board (2017-present) and is Treasurer (2018-present) of the Asolo Repertory Theatre.
Donald F. Donahue (1950)
Year of Election or Appointment: 2018
Trustee
Mr. Donahue also serves as Trustee of other Fidelity® funds. Mr. Donahue serves as President and Chief Executive Officer of Miranda Partners, LLC (risk consulting for the financial services industry, 2012-present). Previously, Mr. Donahue served as Chief Executive Officer (2006-2012), Chief Operating Officer (2003-2006) and Managing Director, Customer Marketing and Development (1999-2003) of The Depository Trust & Clearing Corporation (financial markets infrastructure). Mr. Donahue currently serves as a member (2007-present) and Co-Chairman (2016-present) of the Board of United Way of New York, a member of the Board of NYC Leadership Academy (2012-present) and a member of the Board of Advisors of Ripple Labs, Inc. (financial services, 2015-present). Mr. Donahue previously served as a member of the Advisory Board of certain Fidelity® funds (2015-2018).
Vicki L. Fuller (1957)
Year of Election or Appointment: 2020
Trustee
Ms. Fuller also serves as Trustee of other Fidelity® funds. Previously, Ms. Fuller served as a member of the Advisory Board of certain Fidelity® funds (2018-2020), Chief Investment Officer of the New York State Common Retirement Fund (2012-2018) and held a variety of positions at AllianceBernstein L.P. (global asset management, 1985-2012), including Managing Director (2006-2012) and Senior Vice President and Senior Portfolio Manager (2001-2006). Ms. Fuller currently serves as a member of the Board, Audit Committee and Nominating and Governance Committee of The Williams Companies, Inc. (natural gas infrastructure, 2018-present), as a member of the Board, Audit Committee and Nominating and Governance Committee of two Blackstone business development companies (2020-present) and as a member of the Board of Treliant, LLC (consulting, 2019-present).
Patricia L. Kampling (1959)
Year of Election or Appointment: 2020
Trustee
Ms. Kampling also serves as Trustee of other Fidelity® funds. Prior to her retirement, Ms. Kampling served as Chairman of the Board and Chief Executive Officer (2012-2019), President and Chief Operating Officer (2011-2012) and Executive Vice President and Chief Financial Officer (2010-2011) of Alliant Energy Corporation. Ms. Kampling currently serves as a member of the Board, Compensation Committee and Executive Committee and as Chair of the Audit Committee of Briggs & Stratton Corporation (manufacturing, 2011-present) and as a member of the Board, Audit, Finance and Risk Committee and Safety, Environmental, Technology and Operations Committee of American Water Works Company, Inc. (utilities company, 2019-present). In addition, Ms. Kampling currently serves as a member of the Board of the Nature Conservancy, Wisconsin Chapter (2019-present). Previously, Ms. Kampling served as a Member of the Advisory Board of certain Fidelity® funds (2020), a member of the Board of Interstate Power and Light Company (2012-2019) and Wisconsin Power and Light Company (2012-2019) (each a subsidiary of Alliant Energy Corporation) and as a member of the Board and Workforce Development Committee of the Business Roundtable (2018-2019).
Alan J. Lacy (1953)
Year of Election or Appointment: 2008
Trustee
Mr. Lacy also serves as Trustee of other Fidelity® funds. Previously, Mr. Lacy served as Senior Adviser (2007-2014) of Oak Hill Capital Partners, L.P. (private equity), Chief Executive Officer (2005) and Vice Chairman (2005-2006) of Sears Holdings Corporation (retail), Chief Executive Officer and Chairman of the Board of Sears, Roebuck and Co. (retail, 2000-2005), Chairman (2014-2017) and a member of the Board (2010-2017) of Dave & Buster’s Entertainment, Inc. (restaurant and entertainment complexes) and a member of the Board of Bristol-Myers Squibb Company (global pharmaceuticals, 2008-2020). Mr. Lacy currently serves as a Trustee of the California Chapter of The Nature Conservancy (2015-present) and a member of the Board of the Center for Advanced Study in the Behavioral Sciences at Stanford University (2015-present).
Ned C. Lautenbach (1944)
Year of Election or Appointment: 2000
Trustee
Co-Lead Independent Trustee
Mr. Lautenbach also serves as Trustee of other Fidelity® funds. Mr. Lautenbach currently serves as Chair of the Board of Governors, State University System of Florida (2013-present) and is a member of the Council on Foreign Relations (1994-present). He is also a member and has in the past served as Chairman of the Board of Directors of Artis-Naples (2012-present). Previously, Mr. Lautenbach served as a member and then Lead Director of the Board of Directors of Eaton Corporation (diversified industrial, 1997-2016). He was also a Partner at Clayton, Dubilier & Rice, LLC (private equity investment, 1998-2010); as well as Director of Sony Corporation (2006-2007). In addition, Mr. Lautenbach had a 30-year career with IBM (technology company), during which time he served as Senior Vice President and as a member of the Corporate Executive Committee (1968-1998).
Joseph Mauriello (1944)
Year of Election or Appointment: 2008
Trustee
Mr. Mauriello also serves as Trustee of other Fidelity® funds. Prior to his retirement in January 2006, Mr. Mauriello served in numerous senior management positions including Deputy Chairman and Chief Operating Officer (2004-2005), and Vice Chairman of Financial Services (2002-2004) of KPMG LLP US (professional services, 1965-2005). Mr. Mauriello currently serves as a member of the Independent Directors Council Governing Council (2015-present). Previously, Mr. Mauriello served as a member of the Board of XL Group plc. (global insurance and re-insurance, 2006-2018).
Cornelia M. Small (1944)
Year of Election or Appointment: 2005
Trustee
Ms. Small also serves as Trustee of other Fidelity® funds. Previously, Ms. Small served as Chief Investment Officer, Director of Global Equity Investments and a member of Scudder, Stevens & Clark and Scudder Kemper Investments. Ms. Small previously served as a member of the Board (2009-2019) and Chair of the Investment Committee (2010-2019) of the Teagle Foundation and a member of the Investment Committee of the Berkshire Taconic Community Foundation (2008-2019).
Garnett A. Smith (1947)
Year of Election or Appointment: 2018
Trustee
Mr. Smith also serves as Trustee of other Fidelity® funds. Prior to his retirement, Mr. Smith served as Chairman and Chief Executive Officer (1990-1997) and President (1986-1990) of Inbrand Corp. (manufacturer of personal absorbent products). Prior to his employment with Inbrand Corp., he was employed by a retail fabric chain and North Carolina National Bank (now Bank of America). Mr. Smith previously served as a member of the Advisory Board of certain Fidelity® funds (2012-2013).
David M. Thomas (1949)
Year of Election or Appointment: 2008
Trustee
Co-Lead Independent Trustee
Mr. Thomas also serves as Trustee of other Fidelity® funds. Previously, Mr. Thomas served as Executive Chairman (2005-2006) and Chairman and Chief Executive Officer (2000-2005) of IMS Health, Inc. (pharmaceutical and healthcare information solutions). Mr. Thomas currently serves as Non-Executive Chairman of the Board of Fortune Brands Home and Security (home and security products, 2011-present), and a member of the Board (2004-present) and Presiding Director (2013-present) of Interpublic Group of Companies, Inc. (marketing communication).
Susan Tomasky (1953)
Year of Election or Appointment: 2020
Trustee
Ms. Tomasky also serves as Trustee of other Fidelity® funds. Prior to her retirement, Ms. Tomasky served in various executive officer positions at American Electric Power Company, Inc. (1998-2011), including most recently as President of AEP Transmission (2007-2011). Ms. Tomasky currently serves as a member of the Board and Sustainability Committee and as Chair of the Audit Committee of Marathon Petroleum Corporation (2018-present) and as a member of the Board, Corporate Governance Committee and Organization and Compensation Committee and as Chair of the Audit Committee of Public Service Enterprise Group, Inc. (utilities company, 2012-present). In addition, Ms. Tomasky currently serves as a member of the Board of the Columbus Regional Airport Authority (2007-present), as a member of the Board of the Royal Shakespeare Company – America (2009-present), as a member of the Board of the Columbus Association for the Performing Arts (2011-present) and as a member of the Board of Kenyon College (2016-present). Previously, Ms. Tomasky served as a Member of the Advisory Board of certain Fidelity® funds (2020), a member of the Board (2011-2019) and as Lead Independent Director (2015-2018) of Andeavor Corporation (previously Tesoro Corporation) (independent oil refiner and marketer) and as a member of the Board of Summit Midstream Partners LP (energy, 2012-2018).
Michael E. Wiley (1950)
Year of Election or Appointment: 2020
Trustee
Mr. Wiley also serves as Trustee of other Fidelity® funds. Previously, Mr. Wiley served as a member of the Advisory Board of certain Fidelity® funds (2018-2020), Chairman, President and CEO of Baker Hughes, Inc. (oilfield services, 2000-2004). Mr. Wiley also previously served as a member of the Board of Andeavor Corporation (independent oil refiner and marketer, 2005-2018), a member of the Board of Andeavor Logistics LP (natural resources logistics, 2015-2018) and a member of the Board of High Point Resources (exploration and production, 2005-2020).
+ The information includes the Trustee's principal occupation during the last five years and other information relating to the experience, attributes, and skills relevant to the Trustee's qualifications to serve as a Trustee, which led to the conclusion that the Trustee should serve as a Trustee for the fund.
Advisory Board Members and Officers:
Correspondence intended for a Member of the Advisory Board (if any) may be sent to Fidelity Investments, P.O. Box 55235, Boston, Massachusetts 02205-5235. Correspondence intended for an officer or Peter S. Lynch may be sent to Fidelity Investments, 245 Summer Street, Boston, Massachusetts 02210. Officers appear below in alphabetical order.
Name, Year of Birth; Principal Occupation
Lloyd James Austin, III (1953)
Year of Election or Appointment: 2020
Member of the Advisory Board
General Austin also serves as a Member of the Advisory Board of other Fidelity® funds. Prior to his retirement, General Austin (United States Army, Retired) held a variety of positions within the U.S. Government, including Commander, U.S. Central Command (2013-2016), Vice Chief of Staff, U.S. Army (2012-2013) and Commanding General, U.S. Forces – Iraq, Operation New Dawn (2010-2012). General Austin currently serves as a Partner of Pine Island Capital Partners (private equity, 2020-present) and as President of the Austin Strategy Group LLC (consulting, 2016-present). General Austin serves as a member of the Board of Directors of Nucor Corporation (steel products, 2017-present), as a member of the Board of Directors of Tenet Healthcare Corporation (2018-present) and as a member of the Board of Directors of Raytheon Technologies Corporation (aerospace and defense, 2020-present). In addition, General Austin currently serves as a member of the Board of Trustees of the Carnegie Corporation of New York (2017-present) and as a member of the Board of Trustees of Auburn University (2017-present). Previously, General Austin served as a member of the Board of Directors of United Technologies Corporation (aerospace, defense and building, 2016-2020).
Thomas A. Kennedy (1955)
Year of Election or Appointment: 2020
Member of the Advisory Board
Mr. Kennedy also serves as a Member of the Advisory Board of other Fidelity® funds. Previously, Mr. Kennedy held a variety of positions at Raytheon Company (aerospace and defense, 1983-2020), including Chairman and Chief Executive Officer (2014-2020) and Executive Vice President and Chief Operating Officer (2013-2014). Mr. Kennedy currently serves as Executive Chairman of the Board of Directors of Raytheon Technologies Corporation (aerospace and defense, 2020-present). He is also a member of the Rutgers School of Engineering Industry Advisory Board (2011-present) and a member of the UCLA Engineering Dean’s Executive Board (2016-present).
Peter S. Lynch (1944)
Year of Election or Appointment: 2003
Member of the Advisory Board
Mr. Lynch also serves as a Member of the Advisory Board of other Fidelity® funds. Mr. Lynch is Vice Chairman and a Director of Fidelity Management & Research Company LLC (investment adviser firm). In addition, Mr. Lynch serves as a Trustee of Boston College and as the Chairman of the Inner-City Scholarship Fund. Previously, Mr. Lynch served as Vice Chairman and a Director of FMR Co., Inc. (investment adviser firm) and on the Special Olympics International Board of Directors (1997-2006).
Elizabeth Paige Baumann (1968)
Year of Election or Appointment: 2017
Anti-Money Laundering (AML) Officer
Ms. Baumann also serves as AML Officer of other funds. She is Chief AML Officer (2012-present) and Senior Vice President (2014-present) of FMR LLC (diversified financial services company) and is an employee of Fidelity Investments. Previously, Ms. Baumann served as AML Officer of certain funds (2017-2019), as AML Officer of the funds (2012-2016), and Vice President (2007-2014) and Deputy Anti-Money Laundering Officer (2007-2012) of FMR LLC.
Craig S. Brown (1977)
Year of Election or Appointment: 2019
Assistant Treasurer
Mr. Brown also serves as Assistant Treasurer of other funds. Mr. Brown is an employee of Fidelity Investments (2013-present).
John J. Burke III (1964)
Year of Election or Appointment: 2018
Chief Financial Officer
Mr. Burke also serves as Chief Financial Officer of other funds. Mr. Burke serves as Head of Investment Operations for Fidelity Fund and Investment Operations (2018-present) and is an employee of Fidelity Investments (1998-present). Previously Mr. Burke served as head of Asset Management Investment Operations (2012-2018).
William C. Coffey (1969)
Year of Election or Appointment: 2019
Assistant Secretary
Mr. Coffey also serves as Assistant Secretary of other funds. He is Senior Vice President and Deputy General Counsel of FMR LLC (diversified financial services company, 2010-present), and is an employee of Fidelity Investments. Previously, Mr. Coffey served as Secretary and CLO of certain funds (2018-2019); CLO, Secretary, and Senior Vice President of Fidelity Management & Research Company and FMR Co., Inc. (investment adviser firms, 2018-2019); Secretary of Fidelity SelectCo, LLC and Fidelity Investments Money Management, Inc. (investment adviser firms, 2018-2019); CLO of Fidelity Management & Research (Hong Kong) Limited, FMR Investment Management (UK) Limited, and Fidelity Management & Research (Japan) Limited (investment adviser firms, 2018-2019); and Assistant Secretary of certain funds (2009-2018).
Timothy M. Cohen (1969)
Year of Election or Appointment: 2018
Vice President
Mr. Cohen also serves as Vice President of other funds. Mr. Cohen serves as Co-Head of Equity (2018-present), a Director of Fidelity Management & Research (Japan) Limited (investment adviser firm, 2016-present), and is an employee of Fidelity Investments. Previously, Mr. Cohen served as Executive Vice President of Fidelity SelectCo, LLC (2019), Head of Global Equity Research (2016-2018), Chief Investment Officer - Equity and a Director of Fidelity Management & Research (U.K.) Inc. (investment adviser firm, 2013-2015) and as a Director of Fidelity Management & Research (Hong Kong) Limited (investment adviser firm, 2017).
Jonathan Davis (1968)
Year of Election or Appointment: 2010
Assistant Treasurer
Mr. Davis also serves as Assistant Treasurer of other funds. Mr. Davis serves as Assistant Treasurer of FMR Capital, Inc. (2017-present) and is an employee of Fidelity Investments. Previously, Mr. Davis served as Vice President and Associate General Counsel of FMR LLC (diversified financial services company, 2003-2010).
Laura M. Del Prato (1964)
Year of Election or Appointment: 2018
Assistant Treasurer
Ms. Del Prato also serves as an officer of other funds. Ms. Del Prato is an employee of Fidelity Investments (2017-present). Previously, Ms. Del Prato served as President and Treasurer of The North Carolina Capital Management Trust: Cash Portfolio and Term Portfolio (2018-2020). Prior to joining Fidelity Investments, Ms. Del Prato served as a Managing Director and Treasurer of the JPMorgan Mutual Funds (2014-2017). Prior to JPMorgan, Ms. Del Prato served as a partner at Cohen Fund Audit Services (accounting firm, 2012-2013) and KPMG LLP (accounting firm, 2004-2012).
Colm A. Hogan (1973)
Year of Election or Appointment: 2020
Assistant Treasurer
Mr. Hogan also serves as an officer of other funds. Mr. Hogan serves as Assistant Treasurer of FMR Capital, Inc. (2017-present) and is an employee of Fidelity Investments (2005-present). Previously, Mr. Hogan served as Deputy Treasurer of certain Fidelity® funds (2016-2020) and Assistant Treasurer of certain Fidelity® funds (2016-2018).
Pamela R. Holding (1964)
Year of Election or Appointment: 2018
Vice President
Ms. Holding also serves as Vice President of other funds. Ms. Holding serves as Co-Head of Equity (2018-present) and is an employee of Fidelity Investments (2013-present). Previously, Ms. Holding served as Executive Vice President of Fidelity SelectCo, LLC (2019) and as Chief Investment Officer of Fidelity Institutional Asset Management (2013-2018).
Cynthia Lo Bessette (1969)
Year of Election or Appointment: 2019
Secretary and Chief Legal Officer (CLO)
Ms. Lo Bessette also serves as an officer of other funds. Ms. Lo Bessette serves as CLO, Secretary, and Senior Vice President of Fidelity Management & Research Company LLC (investment adviser firm, 2019-present); and CLO of Fidelity Management & Research (Hong Kong) Limited, FMR Investment Management (UK) Limited, and Fidelity Management & Research (Japan) Limited (investment adviser firms, 2019-present). She is a Senior Vice President and Deputy General Counsel of FMR LLC (diversified financial services company, 2019-present), and is an employee of Fidelity Investments. Previously, Ms. Lo Bessette served as CLO, Secretary, and Senior Vice President of FMR Co., Inc. (investment adviser firm, 2019); Secretary of Fidelity SelectCo, LLC and Fidelity Investments Money Management, Inc. (investment adviser firms, 2019). Prior to joining Fidelity Investments, Ms. Lo Bessette was Executive Vice President, General Counsel (2016-2019) and Senior Vice President, Deputy General Counsel (2015-2016) of OppenheimerFunds (investment management company) and Deputy Chief Legal Officer (2013-2015) of Jennison Associates LLC (investment adviser firm).
Chris Maher (1972)
Year of Election or Appointment: 2020
Deputy Treasurer
Mr. Maher also serves as an officer of other funds. Mr. Maher serves as Assistant Treasurer of FMR Capital, Inc. (2017-present), and is an employee of Fidelity Investments (2008-present). Previously, Mr. Maher served as Assistant Treasurer of certain funds (2013-2020); Vice President of Asset Management Compliance (2013), Vice President of the Program Management Group of FMR (investment adviser firm, 2010-2013), and Vice President of Valuation Oversight (2008-2010).
Jason P. Pogorelec (1975)
Year of Election or Appointment: 2020
Chief Compliance Officer
Mr. Pogorelec also serves as Chief Compliance Officer of other funds. Mr. Pogorelec is a senior Vice President of Asset Management Compliance for Fidelity Investments and is an employee of Fidelity Investments (2006-present). Previously, Mr. Pogorelec served as Vice President, Associate General Counsel for Fidelity Investments (2010-2020) and Assistant Secretary of certain Fidelity funds (2015-2020).
Stacie M. Smith (1974)
Year of Election or Appointment: 2016
President and Treasurer
Ms. Smith also serves as an officer of other funds. Ms. Smith serves as Assistant Treasurer of FMR Capital, Inc. (2017-present), is an employee of Fidelity Investments (2009-present), and has served in other fund officer roles. Prior to joining Fidelity Investments, Ms. Smith served as Senior Audit Manager of Ernst & Young LLP (accounting firm, 1996-2009). Previously, Ms. Smith served as Assistant Treasurer (2013-2019) and Deputy Treasurer (2013-2016) of certain Fidelity® funds.
Marc L. Spector (1972)
Year of Election or Appointment: 2016
Assistant Treasurer
Mr. Spector also serves as an officer of other funds. Mr. Spector serves as Assistant Treasurer of FMR Capital, Inc. (2017-present) and is an employee of Fidelity Investments (2016-present). Prior to joining Fidelity Investments, Mr. Spector served as Director at the Siegfried Group (accounting firm, 2013-2016), and prior to Siegfried Group as audit senior manager at Deloitte & Touche LLP (accounting firm, 2005-2013).
Jim Wegmann (1979)
Year of Election or Appointment: 2019
Assistant Treasurer
Mr. Wegmann also serves as Assistant Treasurer of other funds. Mr. Wegmann is an employee of Fidelity Investments (2011-present).
Shareholder Expense Example
As a shareholder, you incur two types of costs: (1) transaction costs, which may include sales charges (loads) on purchase payments or redemption proceeds, as applicable and (2) ongoing costs, which generally include management fees, distribution and/or service (12b-1) fees and other Fund expenses. This Example is intended to help you understand your ongoing costs (in dollars) of investing in a fund and to compare these costs with the ongoing costs of investing in other mutual funds.
The Example is based on an investment of $1,000 invested at the beginning of the period and held for the entire period (May 1, 2020 to October 31, 2020).
Actual Expenses
The first line of the accompanying table provides information about actual account values and actual expenses. You may use the information in this line, together with the amount you invested, to estimate the expenses that you paid over the period. Simply divide your account value by $1,000.00 (for example, an $8,600 account value divided by $1,000.00 = 8.6), then multiply the result by the number in the first line for a class/Fund under the heading entitled "Expenses Paid During Period" to estimate the expenses you paid on your account during this period. If any fund is a shareholder of any underlying mutual funds or exchange-traded funds (ETFs) (the Underlying Funds), such fund indirectly bears its proportional share of the expenses of the Underlying Funds in addition to the direct expenses incurred presented in the table. These fees and expenses are not included in the annualized expense ratio used to calculate the expense estimate in the table below.
Hypothetical Example for Comparison Purposes
The second line of the accompanying table provides information about hypothetical account values and hypothetical expenses based on the actual expense ratio and an assumed rate of return of 5% per year before expenses, which is not the actual return. The hypothetical account values and expenses may not be used to estimate the actual ending account balance or expenses you paid for the period. You may use this information to compare the ongoing costs of investing in the Fund and other funds. To do so, compare this 5% hypothetical example with the 5% hypothetical examples that appear in the shareholder reports of the other funds. If any fund is a shareholder of any Underlying Funds, such fund indirectly bears its proportional share of the expenses of the Underlying Funds in addition to the direct expenses as presented in the table. These fees and expenses are not included in the annualized expense ratio used to calculate the expense estimate in the table below.
Please note that the expenses shown in the table are meant to highlight your ongoing costs only and do not reflect any transaction costs. Therefore, the second line of the table is useful in comparing ongoing costs only, and will not help you determine the relative total costs of owning different funds. In addition, if these transactional costs were included, your costs would have been higher.
| | Annualized Expense Ratio-A | Beginning
Account Value
May 1, 2020 | Ending
Account Value
October 31, 2020 | Expenses Paid
During Period-B
May 1, 2020
to October 31, 2020 |
| Fidelity International Growth Fund | | | | |
| Class A | 1.28% | | | |
| Actual | | $1,000.00 | $1,143.10 | $6.90 |
| Hypothetical-C | | $1,000.00 | $1,018.70 | $6.50 |
| Class M | 1.57% | | | |
| Actual | | $1,000.00 | $1,141.10 | $8.45 |
| Hypothetical-C | | $1,000.00 | $1,017.24 | $7.96 |
| Class C | 2.05% | | | |
| Actual | | $1,000.00 | $1,137.90 | $11.02 |
| Hypothetical-C | | $1,000.00 | $1,014.83 | $10.38 |
| International Growth | .99% | | | |
| Actual | | $1,000.00 | $1,144.10 | $5.34 |
| Hypothetical-C | | $1,000.00 | $1,020.16 | $5.03 |
| Class I | 1.00% | | | |
| Actual | | $1,000.00 | $1,144.50 | $5.39 |
| Hypothetical-C | | $1,000.00 | $1,020.11 | $5.08 |
| Class Z | .86% | | | |
| Actual | | $1,000.00 | $1,145.00 | $4.64 |
| Hypothetical-C | | $1,000.00 | $1,020.81 | $4.37 |
A Annualized expense ratio reflects expenses net of applicable fee waivers.
B Expenses are equal to the annualized expense ratio, multiplied by the average account value over the period, multiplied by 184/ 366 (to reflect the one-half year period). The fees and expenses of any Underlying Funds are not included in each annualized expense ratio.
C 5% return per year before expenses
Distributions (Unaudited)
Class A designates 15%; Class M designates 23%; International Growth designates 11%; Class I designates 11%; Class Z designates 10%; of the dividend distributed in December 2019 during the fiscal year as qualifying for the dividends–received deduction for corporate shareholders.
Class A, Class M, International Growth, Class I, and Class Z designate 100% of the dividend distributed during the fiscal year as amounts which may be taken into account as a dividend for purposes of the maximum rate under section 1(h)(11) of the Internal Revenue Code.
The amounts per share which represent income derived from sources within, and taxes paid to, foreign countries or possessions of the United States are as follows:
| | Pay Date | Income | Taxes |
| Fidelity International Growth Fund | | | |
| Class A | 12/09/19 | $0.1335 | $0.0175 |
| Class M | 12/09/19 | $0.0845 | $0.0175 |
| International Growth | 12/09/19 | $0.1725 | $0.0175 |
| Class I | 12/09/19 | $0.1765 | $0.0175 |
| Class Z | 12/09/19 | $0.1935 | $0.0175 |
|
The fund will notify shareholders in January 2021 of amounts for use in preparing 2020 income tax returns.
Proxy Voting Results
A special meeting of shareholders was held on June 9, 2020. The results of votes taken among shareholders on the proposals before them are reported below. Each vote reported represents one dollar of net asset value held on the record date for the meeting.
PROPOSAL 1
To elect a Board of Trustees.
| | # of
Votes | % of
Votes |
| Dennis J. Dirks |
| Affirmative | 91,643,443,973.030 | 98.167 |
| Withheld | 1,711,119,384.419 | 1.833 |
| TOTAL | 93,354,563,357.449 | 100.000 |
| Donald F. Donahue |
| Affirmative | 91,659,003,496.045 | 98.184 |
| Withheld | 1,695,559,852.789 | 1.816 |
| TOTAL | 93,354,563,357.449 | 100.000 |
| Bettina Doulton |
| Affirmative | 91,774,146,516.145 | 98.307 |
| Withheld | 1,580,416,862.377 | 1.693 |
| TOTAL | 93,354,563,357.449 | 100.000 |
| Vicki L. Fuller |
| Affirmative | 91,845,419,368.993 | 98.383 |
| Withheld | 1,509,143,998.591 | 1.617 |
| TOTAL | 93,354,563,357.449 | 100.00 |
| Patricia L. Kampling |
| Affirmative | 91,723,732,274.457 | 98.253 |
| Withheld | 1,630,831,098.411 | 1.747 |
| TOTAL | 93,354,563,357.449 | 100.000 |
| Alan J. Lacy |
| Affirmative | 91,490,319,407.772 | 98.003 |
| Withheld | 1,864,243,948.299 | 1.997 |
| TOTAL | 93,354,563,357.449 | 100.000 |
| Ned C. Lautenbach |
| Affirmative | 91,285,367,239.075 | 97.784 |
| Withheld | 2,069,196,119.052 | 2.216 |
| TOTAL | 93,354,563,357.449 | 100.000 |
| Robert A. Lawrence |
| Affirmative | 91,556,271,429.466 | 98.074 |
| Withheld | 1,798,291,912.707 | 1.926 |
| TOTAL | 93,354,563,357.449 | 100.000 |
| Joseph Mauriello |
| Affirmative | 91,497,480,147.082 | 98.011 |
| Withheld | 1,857,083,211.045 | 1.989 |
| TOTAL | 93,354,563,357.449 | 100.000 |
| Cornelia M. Small |
| Affirmative | 91,606,808,161.438 | 98.128 |
| Withheld | 1,747,755,220.497 | 1.872 |
| TOTAL | 93,354,563,357.449 | 100.000 |
| Garnett A. Smith |
| Affirmative | 91,505,784,053.038 | 98.020 |
| Withheld | 1,848,779,305.090 | 1.980 |
| TOTAL | 93,354,563,357.449 | 100.000 |
| David M. Thomas |
| Affirmative | 91,536,969,704.881 | 98.053 |
| Withheld | 1,817,593,630.919 | 1.947 |
| TOTAL | 93,354,563,357.449 | 100.000 |
| Susan Tomasky |
| Affirmative | 91,697,125,678.165 | 98.225 |
| Withheld | 1,657,437,703.277 | 1.775 |
| TOTAL | 93,354,563,357.449 | 100.000 |
| Michael E. Wiley |
| Affirmative | 91,506,805,575.815 | 98.021 |
| Withheld | 1,847,757,759.985 | 1.979 |
| TOTAL | 93,354,563,357.449 | 100.000 |
PROPOSAL 2
To convert a fundamental investment policy to a non-fundamental investment policy.
| | # of
Votes | % of
Votes |
| Affirmative | 1,214,101,391.749 | 50.310 |
| Against | 269,740,086.430 | 11.178 |
| Abstain | 179,103,176.841 | 7.422 |
| Broker Non-Vote | 750,276,592.950 | 31.090 |
| TOTAL | 2,413,221,247.970 | 100.000 |
| Proposal 1 reflects trust wide proposal and voting results. |
| Proposal 2 was not approved by shareholders. |
IGF-ANN-1220
1.912350.110
Fidelity® Emerging Europe, Middle East, Africa (EMEA) Fund
Annual Report
October 31, 2020
Includes Fidelity and Fidelity Advisor share classes
See the inside front cover for important information about access to your fund’s shareholder reports.
Beginning on January 1, 2021, as permitted by regulations adopted by the Securities and Exchange Commission, paper copies of a fund’s shareholder reports will no longer be sent by mail, unless you specifically request paper copies of the reports from the fund or from your financial intermediary, such as a financial advisor, broker-dealer or bank. Instead, the reports will be made available on a website, and you will be notified by mail each time a report is posted and provided with a website link to access the report.
If you already elected to receive shareholder reports electronically, you will not be affected by this change and you need not take any action. You may elect to receive shareholder reports and other communications from a fund electronically, by contacting your financial intermediary. For Fidelity customers, visit Fidelity's web site or call Fidelity using the contact information listed below.
You may elect to receive all future reports in paper free of charge. If you wish to continue receiving paper copies of your shareholder reports, you may contact your financial intermediary or, if you are a Fidelity customer, visit Fidelity’s website, or call Fidelity at the applicable toll-free number listed below. Your election to receive reports in paper will apply to all funds held with the fund complex/your financial intermediary.
| Account Type | Website | Phone Number |
| Brokerage, Mutual Fund, or Annuity Contracts: | fidelity.com/mailpreferences | 1-800-343-3548 |
| Employer Provided Retirement Accounts: | netbenefits.fidelity.com/preferences (choose 'no' under Required Disclosures to continue to print) | 1-800-343-0860 |
| Advisor Sold Accounts Serviced Through Your Financial Intermediary: | Contact Your Financial Intermediary | Your Financial Intermediary's phone number |
| Advisor Sold Accounts Serviced by Fidelity: | institutional.fidelity.com | 1-877-208-0098 |
Contents
To view a fund's proxy voting guidelines and proxy voting record for the 12-month period ended June 30, visit http://www.fidelity.com/proxyvotingresults or visit the Securities and Exchange Commission's (SEC) web site at http://www.sec.gov.
You may also call 1-800-544-8544 if you’re an individual investing directly with Fidelity, call 1-800-835-5092 if you’re a plan sponsor or participant with Fidelity as your recordkeeper or call 1-877-208-0098 on institutional accounts or if you’re an advisor or invest through one to request a free copy of the proxy voting guidelines.
Standard & Poor's, S&P and S&P 500 are registered service marks of The McGraw-Hill Companies, Inc. and have been licensed for use by Fidelity Distributors Corporation.
Other third-party marks appearing herein are the property of their respective owners.
All other marks appearing herein are registered or unregistered trademarks or service marks of FMR LLC or an affiliated company. © 2020 FMR LLC. All rights reserved.
This report and the financial statements contained herein are submitted for the general information of the shareholders of the Fund. This report is not authorized for distribution to prospective investors in the Fund unless preceded or accompanied by an effective prospectus.
A fund files its complete schedule of portfolio holdings with the SEC for the first and third quarters of each fiscal year on Form N-PORT. Forms N-PORT are available on the SEC’s web site at http://www.sec.gov. A fund's Forms N-PORT may be reviewed and copied at the SEC’s Public Reference Room in Washington, DC. Information regarding the operation of the SEC's Public Reference Room may be obtained by calling 1-800-SEC-0330.
For a complete list of a fund's portfolio holdings, view the most recent holdings listing, semiannual report, or annual report on Fidelity's web site at http://www.fidelity.com, http://www.institutional.fidelity.com, or http://www.401k.com, as applicable.
NOT FDIC INSURED •MAY LOSE VALUE •NO BANK GUARANTEE
Neither the Fund nor Fidelity Distributors Corporation is a bank.
Note to Shareholders:
Early in 2020, the outbreak and spread of a new coronavirus emerged as a public health emergency that had a major influence on financial markets, primarily based on its impact on the global economy and the outlook for corporate earnings. The virus causes a respiratory disease known as COVID-19. On March 11, the World Health Organization declared the COVID-19 outbreak a pandemic, citing sustained risk of further global spread.
In the weeks following, as the crisis worsened, we witnessed an escalating human tragedy with wide-scale social and economic consequences from coronavirus-containment measures. The outbreak of COVID-19 prompted a number of measures to limit the spread, including travel and border restrictions, quarantines, and restrictions on large gatherings. In turn, these resulted in lower consumer activity, diminished demand for a wide range of products and services, disruption in manufacturing and supply chains, and – given the wide variability in outcomes regarding the outbreak – significant market uncertainty and volatility. Amid the turmoil, global governments and central banks took unprecedented action to help support consumers, businesses, and the broader economies, and to limit disruption to financial systems.
The situation continues to unfold, and the extent and duration of its impact on financial markets and the economy remain highly uncertain. Extreme events such as the coronavirus crisis are “exogenous shocks” that can have significant adverse effects on mutual funds and their investments. Although multiple asset classes may be affected by market disruption, the duration and impact may not be the same for all types of assets.
Fidelity is committed to helping you stay informed amid news about COVID-19 and during increased market volatility, and we’re taking extra steps to be responsive to customer needs. We encourage you to visit our websites, where we offer ongoing updates, commentary, and analysis on the markets and our funds.
Performance: The Bottom Line
Average annual total return reflects the change in the value of an investment, assuming reinvestment of distributions from dividend income and capital gains (the profits earned upon the sale of securities that have grown in value, if any) and assuming a constant rate of performance each year. The hypothetical investment and the average annual total returns do not reflect the deduction of taxes that a shareholder would pay on fund distributions or the redemption of fund shares. During periods of reimbursement by Fidelity, a fund’s total return will be greater than it would be had the reimbursement not occurred. How a fund did yesterday is no guarantee of how it will do tomorrow.
Average Annual Total Returns
| For the periods ended October 31, 2020 | Past 1 year | Past 5 years | Past 10 years |
| Class A (incl. 5.75% sales charge) | (22.61)% | 1.91% | 0.02% |
| Class M (incl. 3.50% sales charge) | (21.05)% | 2.11% | (0.04)% |
| Class C (incl. contingent deferred sales charge) | (19.37)% | 2.32% | (0.16)% |
| Fidelity® Emerging Europe, Middle East, Africa (EMEA) Fund | (17.74)% | 3.40% | 0.86% |
| Class I | (17.70)% | 3.43% | 0.93% |
Class C shares' contingent deferred sales charges included in the past one year, past five years and past ten years total return figures are 1%, 0% and 0%, respectively.
$10,000 Over 10 Years
Let's say hypothetically that $10,000 was invested in Fidelity® Emerging Europe, Middle East, Africa (EMEA) Fund, a class of the fund, on October 31, 2010.
The chart shows how the value of your investment would have changed, and also shows how the MSCI EM (Emerging Markets) Europe, Middle East and Africa Index performed over the same period.
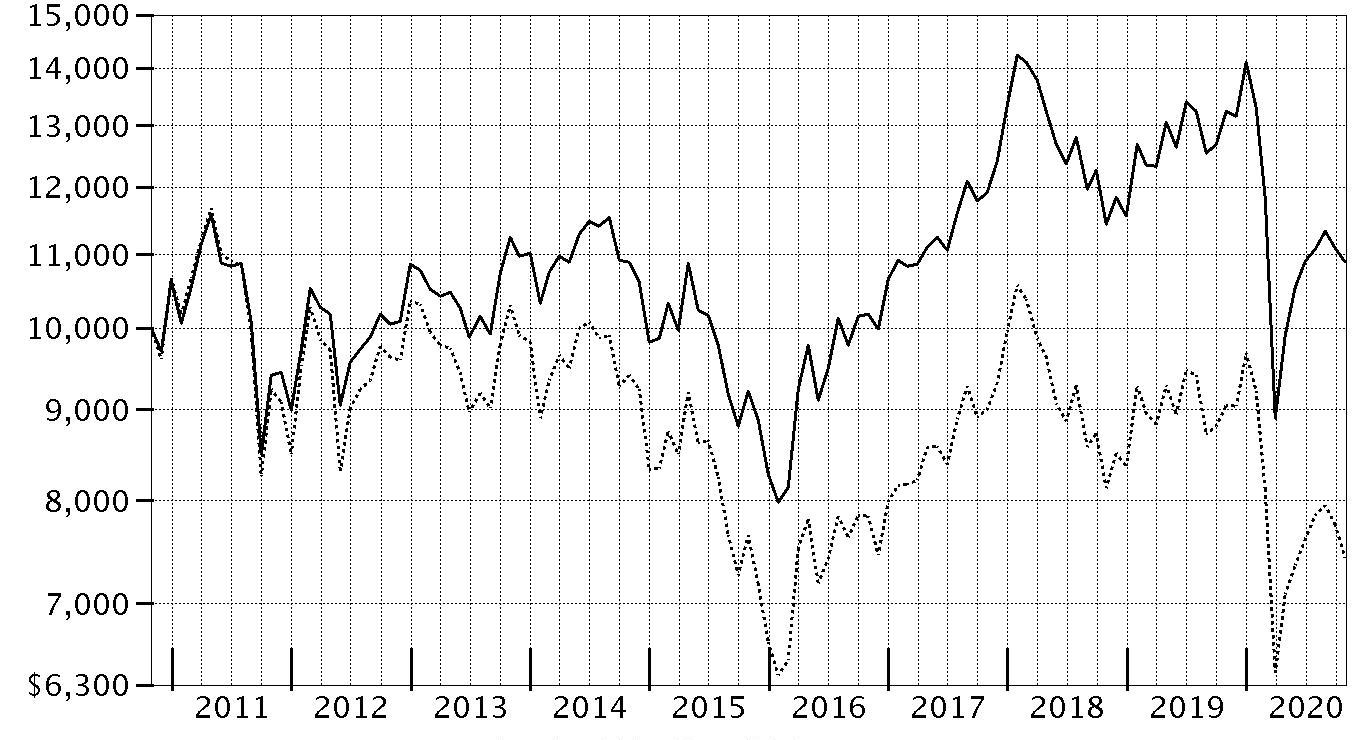
| Period Ending Values |
| $10,891 | Fidelity® Emerging Europe, Middle East, Africa (EMEA) Fund |
| $7,422 | MSCI EM (Emerging Markets) Europe, Middle East and Africa Index |
Management's Discussion of Fund Performance
Market Recap: The MSCI ACWI (All Country World Index) ex USA Index returned -2.46% for the 12 months ending October 31, 2020, in what was a bumpy ride for non-U.S. equities, marked by a steep but brief decline due to the early-2020 outbreak and spread of the coronavirus, followed by a sharp upturn. Declared a pandemic on March 11, the crisis and containment efforts caused broad contraction in economic activity, elevated volatility and dislocation in financial markets. A historically rapid and expansive monetary- and fiscal-policy response around the world provided a partial offset to the economic disruption. Other supporting factors included resilient corporate earnings and near-term potential for a COVID-19 vaccine breakthrough. This was evident in the index’s 12.28% gain in the final six months of the year. Currency fluctuation generally boosted foreign developed-markets equities for the year, while the reverse was true for emerging-markets stocks. Late in the period, the index was pressured by a second wave of COVID-19 cases in some regions, and stretched valuations and crowded positioning in big tech. For the full year, the U.K. (-22%), Asia Pacific ex Japan (-8%), Canada (-5%) and Europe ex U.K. (-4%) notably lagged. Emerging markets (+9%) and Japan (+1%) outperformed. By sector, energy (-38%), financials and real estate (-20% each) lagged, whereas information technology (+ 25%) and communication services (+15%) topped the index.
Comments from Portfolio Manager Adam Kutas: For the fiscal year ending October 30, 2020, the fund's share classes posted returns in the range of about -19% to -18%, trailing the -17.97% result of the benchmark MSCI EM Europe, Mid East, Africa Index (Net MA). By sector, stock picks in the energy and financials sectors, as well as an overweighting in consumer staples, contributed. A non-benchmark stake in DRDGOLD (+121%) added more value than any other position. Other notable contributors included an overweighting in Abdullah al Othaim Markets (+100%) and an outsized stake in AngloGold Ashanti (+3%). We reduced the fund’s stakes in DRDGOLD and Abdullah al Othaim Markets by period end. Conversely, picks in the consumer discretionary sector and positioning in industrials detracted from the fund's relative result. The fund's largest individual relative detractor was our lighter-than-benchmark stake in Naspers, which gained about 36% the past year. The company was the fund’s largest holding as of October 31. Also holding back performance was an overweighting in Eurobank Ergasais, which returned -66%. By sector, meaningful changes in positioning included increased exposure to consumer discretionary and a lower allocation to energy.
The views expressed above reflect those of the portfolio manager(s) only through the end of the period as stated on the cover of this report and do not necessarily represent the views of Fidelity or any other person in the Fidelity organization. Any such views are subject to change at any time based upon market or other conditions and Fidelity disclaims any responsibility to update such views. These views may not be relied on as investment advice and, because investment decisions for a Fidelity fund are based on numerous factors, may not be relied on as an indication of trading intent on behalf of any Fidelity fund.
Note to Shareholders: On January 1, 2021, the fund will close to new accounts.
Investment Summary (Unaudited)
Geographic Diversification (% of fund's net assets)
| As of October 31, 2020 |
| | South Africa | 39.0% |
| | Saudi Arabia | 19.6% |
| | Russia | 17.7% |
| | Netherlands | 3.3% |
| | Romania | 2.8% |
| | Qatar | 2.7% |
| | Nigeria | 2.6% |
| | United Kingdom | 2.2% |
| | Kenya | 1.7% |
| | Other* | 8.4% |

* Includes Short-Term investments and Net Other Assets (Liabilities).
Percentages are based on country or territory of incorporation and are adjusted for the effect of futures contracts, if applicable.
Asset Allocation as of October 31, 2020
| | % of fund's net assets |
| Stocks | 99.3 |
| Short-Term Investments and Net Other Assets (Liabilities) | 0.7 |
Top Ten Stocks as of October 31, 2020
| | % of fund's net assets |
| Naspers Ltd. Class N (South Africa, Internet & Direct Marketing Retail) | 9.3 |
| Al Rajhi Bank (Saudi Arabia, Banks) | 4.7 |
| Sberbank of Russia (Russia, Banks) | 4.4 |
| SABIC (Saudi Arabia, Chemicals) | 4.3 |
| Gazprom OAO (Russia, Oil, Gas & Consumable Fuels) | 4.2 |
| AngloGold Ashanti Ltd. (South Africa, Metals & Mining) | 3.6 |
| Saudi Arabian Oil Co. (Saudi Arabia, Oil, Gas & Consumable Fuels) | 3.3 |
| National Commercial Bank (Saudi Arabia, Banks) | 3.2 |
| MMC Norilsk Nickel PJSC (Russia, Metals & Mining) | 3.1 |
| Vodacom Group Ltd. (South Africa, Wireless Telecommunication Services) | 2.6 |
| | 42.7 |
Top Market Sectors as of October 31, 2020
| | % of fund's net assets |
| Financials | 25.4 |
| Materials | 17.3 |
| Energy | 15.5 |
| Consumer Discretionary | 15.4 |
| Consumer Staples | 11.9 |
| Communication Services | 7.1 |
| Industrials | 3.4 |
| Health Care | 1.9 |
| Information Technology | 1.2 |
| Real Estate | 0.2 |
Market Sectors may include more than one industry category.
The Fund may invest up to 35% of its total assets in any industry that represents more than 20% of the emerging Europe, Middle East and Africa markets. As of October 31, 2020, the Fund did not have more than 25% of its total assets invested in any one industry.
Schedule of Investments October 31, 2020
Showing Percentage of Net Assets
| Common Stocks - 99.3% | | | |
| | | Shares | Value |
| Cyprus - 0.3% | | | |
| Purcari Wineries PLC (a) | | 40,000 | $200,273 |
| Greece - 1.6% | | | |
| EFG Eurobank Ergasias SA (a) | | 897,200 | 297,490 |
| Jumbo SA | | 26,536 | 370,862 |
| Sarantis SA | | 34,100 | 335,588 |
|
| TOTAL GREECE | | | 1,003,940 |
|
| Hungary - 0.6% | | | |
| Richter Gedeon PLC | | 18,000 | 367,168 |
| Iceland - 1.5% | | | |
| Festi hf | | 460,100 | 492,469 |
| Siminn HF | | 8,100,000 | 427,177 |
|
| TOTAL ICELAND | | | 919,646 |
|
| Kenya - 1.7% | | | |
| Safaricom Ltd. | | 3,735,944 | 1,059,319 |
| Kuwait - 1.2% | | | |
| Mobile Telecommunication Co. | | 412,200 | 789,893 |
| Netherlands - 3.3% | | | |
| X5 Retail Group NV GDR (Reg. S) | | 44,100 | 1,549,674 |
| Yandex NV Series A (a) | | 9,600 | 552,672 |
|
| TOTAL NETHERLANDS | | | 2,102,346 |
|
| Nigeria - 2.6% | | | |
| Guaranty Trust Bank PLC | | 9,963,598 | 838,187 |
| Nigerian Breweries PLC | | 6,192,722 | 833,540 |
|
| TOTAL NIGERIA | | | 1,671,727 |
|
| Qatar - 2.7% | | | |
| Qatar Fuel Co. | | 155,000 | 732,216 |
| Qatar Gas Transport Co. Ltd. (Nakilat) (a) | | 1,279,200 | 945,083 |
|
| TOTAL QATAR | | | 1,677,299 |
|
| Romania - 2.8% | | | |
| Banca Transilvania SA | | 2,064,623 | 934,800 |
| BRD-Groupe Societe Generale | | 308,935 | 842,220 |
|
| TOTAL ROMANIA | | | 1,777,020 |
|
| Russia - 17.7% | | | |
| Detsky Mir PJSC (b) | | 198,600 | 274,987 |
| Gazprom OAO | | 1,348,713 | 2,627,801 |
| Lukoil PJSC | | 24,100 | 1,232,018 |
| Lukoil PJSC sponsored ADR | | 12,995 | 663,525 |
| MMC Norilsk Nickel PJSC | | 8,300 | 1,975,463 |
| Moscow Exchange MICEX-RTS OAO | | 372,000 | 627,463 |
| NOVATEK OAO | | 76,600 | 920,815 |
| Sberbank of Russia | | 1,105,550 | 2,801,970 |
|
| TOTAL RUSSIA | | | 11,124,042 |
|
| Saudi Arabia - 19.6% | | | |
| Abdullah Al Othaim Markets Co. | | 13,200 | 461,083 |
| Al Rajhi Bank | | 169,130 | 2,967,430 |
| Aldrees Petroleum and Transport Services Co. | | 26,500 | 448,697 |
| Bupa Arabia for Cooperative Insurance Co. (a) | | 28,700 | 877,002 |
| Dr Sulaiman Alabama Habib Medical Services Group Co. | | 9,500 | 239,128 |
| Jarir Marketing Co. | | 5,000 | 230,915 |
| National Commercial Bank | | 193,300 | 2,012,736 |
| SABIC | | 112,900 | 2,709,383 |
| Saudi Arabian Oil Co. | | 228,700 | 2,055,086 |
| Saudi Dairy & Foodstuffs Co. | | 7,000 | 316,561 |
|
| TOTAL SAUDI ARABIA | | | 12,318,021 |
|
| Slovenia - 0.9% | | | |
| Krka dd Novo mesto | | 6,500 | 582,907 |
| South Africa - 39.0% | | | |
| African Rainbow Minerals Ltd. | | 43,300 | 609,044 |
| Anglo American Platinum Ltd. | | 23,000 | 1,522,944 |
| AngloGold Ashanti Ltd. | | 98,600 | 2,272,283 |
| AVI Ltd. | | 151,600 | 686,624 |
| Capitec Bank Holdings Ltd. | | 19,538 | 1,373,124 |
| Cashbuild Ltd. | | 67,500 | 913,297 |
| City Lodge Hotels Ltd. | | 4,914,000 | 764,741 |
| Clicks Group Ltd. | | 61,583 | 890,700 |
| Distell Group Holdings Ltd. | | 84,300 | 421,631 |
| DRDGOLD Ltd. | | 1,260,214 | 1,393,869 |
| Imperial Holdings Ltd. | | 328,100 | 695,776 |
| Italtile Ltd. | | 220,000 | 177,301 |
| JSE Ltd. | | 70,000 | 467,066 |
| KAP Industrial Holdings Ltd. (a) | | 4,195,700 | 597,395 |
| Massmart Holdings Ltd. (a) | | 277,000 | 562,586 |
| Nampak Ltd. (a) | | 1,322,200 | 69,475 |
| Naspers Ltd. Class N | | 30,003 | 5,857,415 |
| PSG Group Ltd. | | 271,700 | 878,080 |
| Shoprite Holdings Ltd. | | 88,000 | 700,564 |
| Spar Group Ltd. | | 58,600 | 621,224 |
| Standard Bank Group Ltd. | | 221,386 | 1,447,619 |
| Vodacom Group Ltd. | | 214,000 | 1,612,700 |
|
| TOTAL SOUTH AFRICA | | | 24,535,458 |
|
| United Arab Emirates - 1.6% | | | |
| Abu Dhabi National Oil Co. for Distribution PJSC | | 595,231 | 542,865 |
| Aldar Properties PJSC | | 150,000 | 111,893 |
| Dubai Financial Market PJSC (a) | | 1,467,402 | 334,377 |
|
| TOTAL UNITED ARAB EMIRATES | | | 989,135 |
|
| United Kingdom - 2.2% | | | |
| Antofagasta PLC | | 30,000 | 400,115 |
| Georgia Capital PLC (a) | | 47,500 | 227,684 |
| Network International Holdings PLC (a)(b) | | 98,000 | 282,357 |
| Shenzhen Transsion Holdings Co. Ltd. (UBS AG London Branch Bank Warrant Program) Class A warrants 7/14/22 (a)(b) | | 25,000 | 458,187 |
|
| TOTAL UNITED KINGDOM | | | 1,368,343 |
|
| TOTAL COMMON STOCKS | | | |
| (Cost $59,083,335) | | | 62,486,537 |
| TOTAL INVESTMENT IN SECURITIES - 99.3% | | | |
| (Cost $59,083,335) | | | 62,486,537 |
| NET OTHER ASSETS (LIABILITIES) - 0.7% | | | 430,326 |
| NET ASSETS - 100% | | | $62,916,863 |
Categorizations in the Schedule of Investments are based on country or territory of incorporation.
Legend
(a) Non-income producing
(b) Security exempt from registration under Rule 144A of the Securities Act of 1933. These securities may be resold in transactions exempt from registration, normally to qualified institutional buyers. At the end of the period, the value of these securities amounted to $1,015,531 or 1.6% of net assets.
Affiliated Central Funds
Information regarding fiscal year to date income earned by the Fund from investments in Fidelity Central Funds is as follows:
| Fund | Income earned |
| Fidelity Cash Central Fund | $4,639 |
| Fidelity Securities Lending Cash Central Fund | 12,648 |
| Total | $17,287 |
Amounts in the income column in the above table include any capital gain distributions from underlying funds, which are presented in the corresponding line-item in the Statement of Operations, if applicable. Amount for Fidelity Securities Lending Cash Central Fund represents the income earned on investing cash collateral, less rebates paid to borrowers and any lending agent fees associated with the loan, plus any premium payments received for lending certain types of securities.
Investment Valuation
The following is a summary of the inputs used, as of October 31, 2020, involving the Fund's assets and liabilities carried at fair value. The inputs or methodology used for valuing securities may not be an indication of the risk associated with investing in those securities. For more information on valuation inputs, and their aggregation into the levels used below, please refer to the Investment Valuation section in the accompanying Notes to Financial Statements.
| | Valuation Inputs at Reporting Date: |
| Description | Total | Level 1 | Level 2 | Level 3 |
| Investments in Securities: | | | | |
| Equities: | | | | |
| Communication Services | $4,441,761 | $2,829,061 | $1,612,700 | $-- |
| Consumer Discretionary | 9,624,852 | 1,912,098 | 7,712,754 | -- |
| Consumer Staples | 7,580,048 | 3,696,719 | 3,883,329 | -- |
| Energy | 9,625,241 | 5,765,422 | 3,859,819 | -- |
| Financials | 16,049,168 | 9,959,389 | 6,089,779 | -- |
| Health Care | 1,189,203 | 1,189,203 | -- | -- |
| Industrials | 2,171,251 | -- | 2,171,251 | -- |
| Information Technology | 740,544 | 282,357 | 458,187 | -- |
| Materials | 10,952,576 | 3,109,498 | 7,843,078 | -- |
| Real Estate | 111,893 | 111,893 | -- | -- |
| Total Investments in Securities: | $62,486,537 | $28,855,640 | $33,630,897 | $-- |
See accompanying notes which are an integral part of the financial statements.
Financial Statements
Statement of Assets and Liabilities
| | | October 31, 2020 |
| Assets | | |
Investment in securities, at value — See accompanying schedule:
Unaffiliated issuers (cost $59,083,335) | | $62,486,537 |
| Foreign currency held at value (cost $133,230) | | 133,233 |
| Receivable for investments sold | | 926,955 |
| Receivable for fund shares sold | | 12,912 |
| Dividends receivable | | 43,338 |
| Distributions receivable from Fidelity Central Funds | | 62 |
| Prepaid expenses | | 139 |
| Other receivables | | 964 |
| Total assets | | 63,604,140 |
| Liabilities | | |
| Payable to custodian bank | $120,041 | |
| Payable for investments purchased | 367,223 | |
| Payable for fund shares redeemed | 108,692 | |
| Accrued management fee | 48,953 | |
| Distribution and service plan fees payable | 2,770 | |
| Other affiliated payables | 17,340 | |
| Other payables and accrued expenses | 22,258 | |
| Total liabilities | | 687,277 |
| Net Assets | | $62,916,863 |
| Net Assets consist of: | | |
| Paid in capital | | $74,538,762 |
| Total accumulated earnings (loss) | | (11,621,899) |
| Net Assets | | $62,916,863 |
| Net Asset Value and Maximum Offering Price | | |
| Class A: | | |
| Net Asset Value and redemption price per share ($3,918,043 ÷ 498,758 shares)(a) | | $7.86 |
| Maximum offering price per share (100/94.25 of $7.86) | | $8.34 |
| Class M: | | |
| Net Asset Value and redemption price per share ($1,641,146 ÷ 209,907 shares)(a) | | $7.82 |
| Maximum offering price per share (100/96.50 of $7.82) | | $8.10 |
| Class C: | | |
| Net Asset Value and offering price per share ($1,369,956 ÷ 174,799 shares)(a) | | $7.84 |
| Emerging Europe, Middle East, Africa (EMEA): | | |
| Net Asset Value, offering price and redemption price per share ($39,750,613 ÷ 5,053,193 shares) | | $7.87 |
| Class I: | | |
| Net Asset Value, offering price and redemption price per share ($16,237,105 ÷ 2,071,429 shares) | | $7.84 |
(a) Redemption price per share is equal to net asset value less any applicable contingent deferred sales charge.
See accompanying notes which are an integral part of the financial statements.
Statement of Operations
| | | Year ended October 31, 2020 |
| Investment Income | | |
| Dividends | | $3,473,936 |
| Non-Cash dividends | | 1,039,935 |
| Income from Fidelity Central Funds (including $12,648 from security lending) | | 17,287 |
| Income before foreign taxes withheld | | 4,531,158 |
| Less foreign taxes withheld | | (339,494) |
| Total income | | 4,191,664 |
| Expenses | | |
| Management fee | $659,452 | |
| Transfer agent fees | 211,444 | |
| Distribution and service plan fees | 39,709 | |
| Accounting fees | 43,690 | |
| Custodian fees and expenses | 77,255 | |
| Independent trustees' fees and expenses | 513 | |
| Registration fees | 76,006 | |
| Audit | 66,948 | |
| Legal | 1,027 | |
| Miscellaneous | 3,625 | |
| Total expenses before reductions | 1,179,669 | |
| Expense reductions | (43,390) | |
| Total expenses after reductions | | 1,136,279 |
| Net investment income (loss) | | 3,055,385 |
| Realized and Unrealized Gain (Loss) | | |
| Net realized gain (loss) on: | | |
| Investment securities: | | |
| Unaffiliated issuers | (4,286,860) | |
| Fidelity Central Funds | 25 | |
| Foreign currency transactions | (75,536) | |
| Total net realized gain (loss) | | (4,362,371) |
| Change in net unrealized appreciation (depreciation) on: | | |
| Investment securities: | | |
| Unaffiliated issuers | (18,548,225) | |
| Assets and liabilities in foreign currencies | (8,523) | |
| Total change in net unrealized appreciation (depreciation) | | (18,556,748) |
| Net gain (loss) | | (22,919,119) |
| Net increase (decrease) in net assets resulting from operations | | $(19,863,734) |
See accompanying notes which are an integral part of the financial statements.
Statement of Changes in Net Assets
| | Year ended October 31, 2020 | Year ended October 31, 2019 |
| Increase (Decrease) in Net Assets | | |
| Operations | | |
| Net investment income (loss) | $3,055,385 | $5,134,259 |
| Net realized gain (loss) | (4,362,371) | 3,156,801 |
| Change in net unrealized appreciation (depreciation) | (18,556,748) | 6,962,341 |
| Net increase (decrease) in net assets resulting from operations | (19,863,734) | 15,253,401 |
| Distributions to shareholders | (4,884,674) | (2,353,924) |
| Share transactions - net increase (decrease) | (19,465,201) | (3,268,959) |
| Total increase (decrease) in net assets | (44,213,609) | 9,630,518 |
| Net Assets | | |
| Beginning of period | 107,130,472 | 97,499,954 |
| End of period | $62,916,863 | $107,130,472 |
See accompanying notes which are an integral part of the financial statements.
Financial Highlights
Fidelity Emerging Europe, Middle East, Africa (EMEA) Fund Class A
| Years ended October 31, | 2020 | 2019 | 2018 | 2017 | 2016 |
| Selected Per–Share Data | | | | | |
| Net asset value, beginning of period | $10.01 | $8.87 | $9.39 | $8.13 | $7.49 |
| Income from Investment Operations | | | | | |
| Net investment income (loss)A | .29B | .43C | .25 | .12 | .14 |
| Net realized and unrealized gain (loss) | (2.00) | .90 | (.63) | 1.22 | .61 |
| Total from investment operations | (1.71) | 1.33 | (.38) | 1.34 | .75 |
| Distributions from net investment income | (.44) | (.18) | (.13) | (.09) | (.11) |
| Distributions from net realized gain | – | –D | (.01) | – | – |
| Total distributions | (.44) | (.19)E | (.14) | (.09) | (.11) |
| Redemption fees added to paid in capitalA | – | – | –D | .01 | –D |
| Net asset value, end of period | $7.86 | $10.01 | $8.87 | $9.39 | $8.13 |
| Total ReturnF,G | (17.88)% | 15.21% | (4.17)% | 16.69% | 10.22% |
| Ratios to Average Net AssetsH,I | | | | | |
| Expenses before reductions | 1.62% | 1.57% | 1.59% | 1.63% | 1.69% |
| Expenses net of fee waivers, if any | 1.57% | 1.57% | 1.59% | 1.62% | 1.65% |
| Expenses net of all reductions | 1.56% | 1.56% | 1.57% | 1.61% | 1.64% |
| Net investment income (loss) | 3.44%B | 4.54%C | 2.49% | 1.41% | 1.90% |
| Supplemental Data | | | | | |
| Net assets, end of period (000 omitted) | $3,918 | $5,497 | $5,034 | $5,538 | $7,867 |
| Portfolio turnover rateJ | 55% | 49% | 39% | 47% | 54% |
A Calculated based on average shares outstanding during the period.
B Net investment income per share reflects one or more large, non-recurring dividend which amounted to $.10 per share. Excluding such non-recurring dividend, the ratio of net investment income (loss) to average net assets would have been 2.20%.
C Net investment income per share reflects one or more large, non-recurring dividend which amounted to $.19 per share. Excluding such non-recurring dividend, the ratio of net investment income (loss) to average net assets would have been 2.51%.
D Amount represents less than $.005 per share.
E Total distributions per share do not sum due to rounding.
F Total returns would have been lower if certain expenses had not been reduced during the applicable periods shown.
G Total returns do not include the effect of the sales charges.
H Fees and expenses of any underlying mutual funds or exchange-traded funds (ETFs) are not included in the Fund's expense ratio. The Fund indirectly bears its proportionate share of these expenses. For additional expense information related to investments in Fidelity Central Funds, please refer to the "Investments in Fidelity Central Funds" note found in the Notes to Financial Statements section of the most recent Annual or Semi-Annual report.
I Expense ratios reflect operating expenses of the class. Expenses before reductions do not reflect amounts reimbursed, waived, or reduced through arrangements with the investment adviser, brokerage services, or other offset arrangements, if applicable, and do not represent the amount paid by the class during periods when reimbursements, waivers or reductions occur.
J Amount does not include the portfolio activity of any underlying mutual funds or exchange-traded funds (ETFs).
See accompanying notes which are an integral part of the financial statements.
Fidelity Emerging Europe, Middle East, Africa (EMEA) Fund Class M
| Years ended October 31, | 2020 | 2019 | 2018 | 2017 | 2016 |
| Selected Per–Share Data | | | | | |
| Net asset value, beginning of period | $9.96 | $8.82 | $9.35 | $8.10 | $7.44 |
| Income from Investment Operations | | | | | |
| Net investment income (loss)A | .27B | .40C | .22 | .10 | .12 |
| Net realized and unrealized gain (loss) | (2.01) | .90 | (.63) | 1.21 | .61 |
| Total from investment operations | (1.74) | 1.30 | (.41) | 1.31 | .73 |
| Distributions from net investment income | (.40) | (.16) | (.11) | (.07) | (.07) |
| Distributions from net realized gain | – | –D | (.01) | – | – |
| Total distributions | (.40) | (.16) | (.12) | (.07) | (.07) |
| Redemption fees added to paid in capitalA | – | – | –D | .01 | –D |
| Net asset value, end of period | $7.82 | $9.96 | $8.82 | $9.35 | $8.10 |
| Total ReturnE,F | (18.19)% | 15.00% | (4.51)% | 16.40% | 9.98% |
| Ratios to Average Net AssetsG,H | | | | | |
| Expenses before reductions | 1.90% | 1.89% | 1.92% | 1.95% | 2.00% |
| Expenses net of fee waivers, if any | 1.84% | 1.88% | 1.90% | 1.90% | 1.90% |
| Expenses net of all reductions | 1.83% | 1.87% | 1.88% | 1.88% | 1.89% |
| Net investment income (loss) | 3.16%B | 4.23%C | 2.18% | 1.14% | 1.65% |
| Supplemental Data | | | | | |
| Net assets, end of period (000 omitted) | $1,641 | $2,272 | $2,153 | $2,490 | $2,580 |
| Portfolio turnover rateI | 55% | 49% | 39% | 47% | 54% |
A Calculated based on average shares outstanding during the period.
B Net investment income per share reflects one or more large, non-recurring dividend which amounted to $.10 per share. Excluding such non-recurring dividend, the ratio of net investment income (loss) to average net assets would have been 1.93%.
C Net investment income per share reflects one or more large, non-recurring dividend which amounted to $.19 per share. Excluding such non-recurring dividend, the ratio of net investment income (loss) to average net assets would have been 2.20%.
D Amount represents less than $.005 per share.
E Total returns would have been lower if certain expenses had not been reduced during the applicable periods shown.
F Total returns do not include the effect of the sales charges.
G Fees and expenses of any underlying mutual funds or exchange-traded funds (ETFs) are not included in the Fund's expense ratio. The Fund indirectly bears its proportionate share of these expenses. For additional expense information related to investments in Fidelity Central Funds, please refer to the "Investments in Fidelity Central Funds" note found in the Notes to Financial Statements section of the most recent Annual or Semi-Annual report.
H Expense ratios reflect operating expenses of the class. Expenses before reductions do not reflect amounts reimbursed, waived, or reduced through arrangements with the investment adviser, brokerage services, or other offset arrangements, if applicable, and do not represent the amount paid by the class during periods when reimbursements, waivers or reductions occur.
I Amount does not include the portfolio activity of any underlying mutual funds or exchange-traded funds (ETFs).
See accompanying notes which are an integral part of the financial statements.
Fidelity Emerging Europe, Middle East, Africa (EMEA) Fund Class C
| Years ended October 31, | 2020 | 2019 | 2018 | 2017 | 2016 |
| Selected Per–Share Data | | | | | |
| Net asset value, beginning of period | $9.96 | $8.80 | $9.30 | $8.06 | $7.39 |
| Income from Investment Operations | | | | | |
| Net investment income (loss)A | .23B | .36C | .17 | .06 | .09 |
| Net realized and unrealized gain (loss) | (2.02) | .89 | (.62) | 1.20 | .60 |
| Total from investment operations | (1.79) | 1.25 | (.45) | 1.26 | .69 |
| Distributions from net investment income | (.33) | (.09) | (.04) | (.03) | (.02) |
| Distributions from net realized gain | – | –D | (.01) | – | – |
| Total distributions | (.33) | (.09) | (.05) | (.03) | (.02) |
| Redemption fees added to paid in capitalA | – | – | –D | .01 | –D |
| Net asset value, end of period | $7.84 | $9.96 | $8.80 | $9.30 | $8.06 |
| Total ReturnE,F | (18.58)% | 14.37% | (4.92)% | 15.85% | 9.33% |
| Ratios to Average Net AssetsG,H | | | | | |
| Expenses before reductions | 2.40% | 2.37% | 2.38% | 2.42% | 2.47% |
| Expenses net of fee waivers, if any | 2.34% | 2.37% | 2.38% | 2.39% | 2.40% |
| Expenses net of all reductions | 2.33% | 2.35% | 2.37% | 2.37% | 2.39% |
| Net investment income (loss) | 2.66%B | 3.75%C | 1.69% | .65% | 1.15% |
| Supplemental Data | | | | | |
| Net assets, end of period (000 omitted) | $1,370 | $2,424 | $2,845 | $4,336 | $6,269 |
| Portfolio turnover rateI | 55% | 49% | 39% | 47% | 54% |
A Calculated based on average shares outstanding during the period.
B Net investment income per share reflects one or more large, non-recurring dividend which amounted to $.10 per share. Excluding such non-recurring dividend, the ratio of net investment income (loss) to average net assets would have been 1.43%.
C Net investment income per share reflects one or more large, non-recurring dividend which amounted to $.19 per share. Excluding such non-recurring dividend, the ratio of net investment income (loss) to average net assets would have been 1.72%.
D Amount represents less than $.005 per share.
E Total returns would have been lower if certain expenses had not been reduced during the applicable periods shown.
F Total returns do not include the effect of the contingent deferred sales charge.
G Fees and expenses of any underlying mutual funds or exchange-traded funds (ETFs) are not included in the Fund's expense ratio. The Fund indirectly bears its proportionate share of these expenses. For additional expense information related to investments in Fidelity Central Funds, please refer to the "Investments in Fidelity Central Funds" note found in the Notes to Financial Statements section of the most recent Annual or Semi-Annual report.
H Expense ratios reflect operating expenses of the class. Expenses before reductions do not reflect amounts reimbursed, waived, or reduced through arrangements with the investment adviser, brokerage services, or other offset arrangements, if applicable, and do not represent the amount paid by the class during periods when reimbursements, waivers or reductions occur.
I Amount does not include the portfolio activity of any underlying mutual funds or exchange-traded funds (ETFs).
See accompanying notes which are an integral part of the financial statements.
Fidelity Emerging Europe, Middle East, Africa (EMEA) Fund
| Years ended October 31, | 2020 | 2019 | 2018 | 2017 | 2016 |
| Selected Per–Share Data | | | | | |
| Net asset value, beginning of period | $10.03 | $8.88 | $9.41 | $8.14 | $7.50 |
| Income from Investment Operations | | | | | |
| Net investment income (loss)A | .31B | .46C | .27 | .15 | .16 |
| Net realized and unrealized gain (loss) | (2.01) | .91 | (.63) | 1.21 | .61 |
| Total from investment operations | (1.70) | 1.37 | (.36) | 1.36 | .77 |
| Distributions from net investment income | (.46) | (.21) | (.16) | (.10) | (.13) |
| Distributions from net realized gain | – | –D | (.01) | – | – |
| Total distributions | (.46) | (.22)E | (.17) | (.10) | (.13) |
| Redemption fees added to paid in capitalA | – | – | –D | .01 | –D |
| Net asset value, end of period | $7.87 | $10.03 | $8.88 | $9.41 | $8.14 |
| Total ReturnF | (17.74)% | 15.68% | (4.00)% | 17.04% | 10.54% |
| Ratios to Average Net AssetsG,H | | | | | |
| Expenses before reductions | 1.34% | 1.31% | 1.34% | 1.38% | 1.46% |
| Expenses net of fee waivers, if any | 1.31% | 1.31% | 1.34% | 1.38% | 1.40% |
| Expenses net of all reductions | 1.30% | 1.30% | 1.32% | 1.37% | 1.39% |
| Net investment income (loss) | 3.69%B | 4.80%C | 2.74% | 1.66% | 2.15% |
| Supplemental Data | | | | | |
| Net assets, end of period (000 omitted) | $39,751 | $74,522 | $82,387 | $80,392 | $76,193 |
| Portfolio turnover rateI | 55% | 49% | 39% | 47% | 54% |
A Calculated based on average shares outstanding during the period.
B Net investment income per share reflects one or more large, non-recurring dividend which amounted to $.11 per share. Excluding such non-recurring dividend, the ratio of net investment income (loss) to average net assets would have been 2.46%.
C Net investment income per share reflects one or more large, non-recurring dividend which amounted to $.19 per share. Excluding such non-recurring dividend, the ratio of net investment income (loss) to average net assets would have been 2.77%.
D Amount represents less than $.005 per share.
E Total distributions per share do not sum due to rounding.
F Total returns would have been lower if certain expenses had not been reduced during the applicable periods shown.
G Fees and expenses of any underlying mutual funds or exchange-traded funds (ETFs) are not included in the Fund's expense ratio. The Fund indirectly bears its proportionate share of these expenses. For additional expense information related to investments in Fidelity Central Funds, please refer to the "Investments in Fidelity Central Funds" note found in the Notes to Financial Statements section of the most recent Annual or Semi-Annual report.
H Expense ratios reflect operating expenses of the class. Expenses before reductions do not reflect amounts reimbursed, waived, or reduced through arrangements with the investment adviser, brokerage services, or other offset arrangements, if applicable, and do not represent the amount paid by the class during periods when reimbursements, waivers or reductions occur.
I Amount does not include the portfolio activity of any underlying mutual funds or exchange-traded funds (ETFs).
See accompanying notes which are an integral part of the financial statements.
Fidelity Emerging Europe, Middle East, Africa (EMEA) Fund Class I
| Years ended October 31, | 2020 | 2019 | 2018 | 2017 | 2016 |
| Selected Per–Share Data | | | | | |
| Net asset value, beginning of period | $10.00 | $8.88 | $9.40 | $8.14 | $7.50 |
| Income from Investment Operations | | | | | |
| Net investment income (loss)A | .31B | .45C | .28 | .16 | .17 |
| Net realized and unrealized gain (loss) | (1.99) | .90 | (.62) | 1.20 | .61 |
| Total from investment operations | (1.68) | 1.35 | (.34) | 1.36 | .78 |
| Distributions from net investment income | (.48) | (.22) | (.17) | (.11) | (.14) |
| Distributions from net realized gain | – | –D | (.01) | – | – |
| Total distributions | (.48) | (.23)E | (.18) | (.11) | (.14) |
| Redemption fees added to paid in capitalA | – | – | –D | .01 | –D |
| Net asset value, end of period | $7.84 | $10.00 | $8.88 | $9.40 | $8.14 |
| Total ReturnF | (17.70)% | 15.45% | (3.80)% | 17.01% | 10.69% |
| Ratios to Average Net AssetsG,H | | | | | |
| Expenses before reductions | 1.39% | 1.36% | 1.24% | 1.27% | 1.31% |
| Expenses net of fee waivers, if any | 1.33% | 1.36% | 1.24% | 1.27% | 1.31% |
| Expenses net of all reductions | 1.32% | 1.34% | 1.23% | 1.26% | 1.30% |
| Net investment income (loss) | 3.68%B | 4.76%C | 2.83% | 1.77% | 2.24% |
| Supplemental Data | | | | | |
| Net assets, end of period (000 omitted) | $16,237 | $22,415 | $5,080 | $6,891 | $5,807 |
| Portfolio turnover rateI | 55% | 49% | 39% | 47% | 54% |
A Calculated based on average shares outstanding during the period.
B Net investment income per share reflects one or more large, non-recurring dividend which amounted to $.10 per share. Excluding such non-recurring dividend, the ratio of net investment income (loss) to average net assets would have been 2.44%.
C Net investment income per share reflects one or more large, non-recurring dividend which amounted to $.19 per share. Excluding such non-recurring dividend, the ratio of net investment income (loss) to average net assets would have been 2.73%.
D Amount represents less than $.005 per share.
E Total distributions per share do not sum due to rounding.
F Total returns would have been lower if certain expenses had not been reduced during the applicable periods shown.
G Fees and expenses of any underlying mutual funds or exchange-traded funds (ETFs) are not included in the Fund's expense ratio. The Fund indirectly bears its proportionate share of these expenses. For additional expense information related to investments in Fidelity Central Funds, please refer to the "Investments in Fidelity Central Funds" note found in the Notes to Financial Statements section of the most recent Annual or Semi-Annual report.
H Expense ratios reflect operating expenses of the class. Expenses before reductions do not reflect amounts reimbursed, waived, or reduced through arrangements with the investment adviser, brokerage services, or other offset arrangements, if applicable, and do not represent the amount paid by the class during periods when reimbursements, waivers or reductions occur.
I Amount does not include the portfolio activity of any underlying mutual funds or exchange-traded funds (ETFs).
See accompanying notes which are an integral part of the financial statements.
Notes to Financial Statements
For the period ended October 31, 2020
1. Organization.
Fidelity Emerging Europe, Middle East, Africa (EMEA) Fund (the Fund) is a non-diversified fund of Fidelity Investment Trust (the Trust) and is authorized to issue an unlimited number of shares. The Trust is registered under the Investment Company Act of 1940, as amended (the 1940 Act), as an open-end management investment company organized as a Massachusetts business trust. The Fund offers Class A, Class M, Class C, Emerging Europe, Middle East, Africa (EMEA) and Class I shares, each of which has equal rights as to assets and voting privileges. Each class has exclusive voting rights with respect to matters that affect that class. Class C shares will automatically convert to Class A shares after a holding period of ten years from the initial date of purchase, with certain exceptions. The Fund's investments in emerging markets can be subject to social, economic, regulatory, and political uncertainties and can be extremely volatile.
Effective January 1, 2020:
Investment advisers Fidelity Investments Money Management, Inc., FMR Co., Inc., and Fidelity SelectCo, LLC, merged with and into Fidelity Management & Research Company. In connection with the merger transactions, the resulting, merged investment adviser was then redomiciled from Massachusetts to Delaware, changed its corporate structure from a corporation to a limited liability company, and changed its name to "Fidelity Management & Research Company LLC".
Broker-dealer Fidelity Distributors Corporation merged with and into Fidelity Investments Institutional Services Company, Inc. ("FIISC"). FIISC was then redomiciled from Massachusetts to Delaware, changed its corporate structure from a corporation to a limited liability company, and changed its name to "Fidelity Distributors Company LLC".
Fidelity Investments Institutional Operations Company, Inc. converted from a Massachusetts corporation to a Massachusetts LLC, and changed its name to "Fidelity Investments Institutional Operations Company LLC".
Effective January 1, 2021, the Fund will be closed to new accounts with certain exceptions.
2. Investments in Fidelity Central Funds.
The Fund invests in Fidelity Central Funds, which are open-end investment companies generally available only to other investment companies and accounts managed by the investment adviser and its affiliates. The Fund's Schedule of Investments lists each of the Fidelity Central Funds held as of period end, if any, as an investment of the Fund, but does not include the underlying holdings of each Fidelity Central Fund. As an Investing Fund, the Fund indirectly bears its proportionate share of the expenses of the underlying Fidelity Central Funds.
The Money Market Central Funds seek preservation of capital and current income and are managed by the investment adviser. Annualized expenses of the Money Market Central Funds as of their most recent shareholder report date ranged from less than .005% to .01%.
A complete unaudited list of holdings for each Fidelity Central Fund is available upon request or at the Securities and Exchange Commission (the SEC) website at www.sec.gov. In addition, the financial statements of the Fidelity Central Funds, which are not covered by the Fund's Report of Independent Registered Public Accounting Firm, are available on the SEC website or upon request.
3. Significant Accounting Policies.
The Fund is an investment company and applies the accounting and reporting guidance of the Financial Accounting Standards Board (FASB) Accounting Standards Codification Topic 946 Financial Services – Investment Companies. The financial statements have been prepared in conformity with accounting principles generally accepted in the United States of America (GAAP), which require management to make certain estimates and assumptions at the date of the financial statements. Actual results could differ from those estimates. Subsequent events, if any, through the date that the financial statements were issued have been evaluated in the preparation of the financial statements. The following summarizes the significant accounting policies of the Fund:
Investment Valuation. Investments are valued as of 4:00 p.m. Eastern time on the last calendar day of the period. The Board of Trustees (the Board) has delegated the day to day responsibility for the valuation of the Fund's investments to the Fair Value Committee (the Committee) established by the Fund's investment adviser. In accordance with valuation policies and procedures approved by the Board, the Fund attempts to obtain prices from one or more third party pricing vendors or brokers to value its investments. When current market prices, quotations or currency exchange rates are not readily available or reliable, investments will be fair valued in good faith by the Committee, in accordance with procedures adopted by the Board. Factors used in determining fair value vary by investment type and may include market or investment specific events. The frequency with which these procedures are used cannot be predicted and they may be utilized to a significant extent. The Committee oversees the Fund's valuation policies and procedures and reports to the Board on the Committee's activities and fair value determinations. The Board monitors the appropriateness of the procedures used in valuing the Fund's investments and ratifies the fair value determinations of the Committee.
The Fund categorizes the inputs to valuation techniques used to value its investments into a disclosure hierarchy consisting of three levels as shown below:
- Level 1 – quoted prices in active markets for identical investments
- Level 2 – other significant observable inputs (including quoted prices for similar investments, interest rates, prepayment speeds, etc.)
- Level 3 – unobservable inputs (including the Fund's own assumptions based on the best information available)
Valuation techniques used to value the Fund's investments by major category are as follows:
Equity securities, including restricted securities, for which market quotations are readily available, are valued at the last reported sale price or official closing price as reported by a third party pricing vendor on the primary market or exchange on which they are traded and are categorized as Level 1 in the hierarchy. In the event there were no sales during the day or closing prices are not available, securities are valued at the last quoted bid price or may be valued using the last available price and are generally categorized as Level 2 in the hierarchy. For foreign equity securities, when market or security specific events arise, comparisons to the valuation of American Depositary Receipts (ADRs), futures contracts, Exchange-Traded Funds (ETFs) and certain indexes as well as quoted prices for similar securities may be used and would be categorized as Level 2 in the hierarchy. For equity securities, including restricted securities, where observable inputs are limited, assumptions about market activity and risk are used and these securities may be categorized as Level 3 in the hierarchy.
Investments in open-end mutual funds, including the Fidelity Central Funds, are valued at their closing net asset value (NAV) each business day and are categorized as Level 1 in the hierarchy.
Changes in valuation techniques may result in transfers in or out of an assigned level within the disclosure hierarchy. The aggregate value of investments by input level as of October 31, 2020 is included at the end of the Fund's Schedule of Investments.
Foreign Currency. Certain Funds may use foreign currency contracts to facilitate transactions in foreign-denominated securities. Gains and losses from these transactions may arise from changes in the value of the foreign currency or if the counterparties do not perform under the contracts' terms.
Foreign-denominated assets, including investment securities, and liabilities are translated into U.S. dollars at the exchange rates at period end. Purchases and sales of investment securities, income and dividends received, and expenses denominated in foreign currencies are translated into U.S. dollars at the exchange rate in effect on the transaction date.
The effects of exchange rate fluctuations on investments are included with the net realized and unrealized gain (loss) on investment securities. Other foreign currency transactions resulting in realized and unrealized gain (loss) are disclosed separately.
Investment Transactions and Income. For financial reporting purposes, the Fund's investment holdings and NAV include trades executed through the end of the last business day of the period. The NAV per share for processing shareholder transactions is calculated as of the close of business of the New York Stock Exchange (NYSE), normally 4:00 p.m. Eastern time and includes trades executed through the end of the prior business day. Gains and losses on securities sold are determined on the basis of identified cost. Dividend income is recorded on the ex-dividend date, except for certain dividends from foreign securities where the ex-dividend date may have passed, which are recorded as soon as the Fund is informed of the ex-dividend date. Non-cash dividends included in dividend income, if any, are recorded at the fair market value of the securities received. Income and capital gain distributions from Fidelity Central Funds, if any, are recorded on the ex-dividend date. Large, non-recurring dividends recognized by the Fund are presented separately on the Statement of Operations in "Non-cash dividends" and the impact of these dividends is presented in the Financial Highlights. Investment income is recorded net of foreign taxes withheld where recovery of such taxes is uncertain.
Class Allocations and Expenses. Investment income, realized and unrealized capital gains and losses, common expenses of the Fund, and certain fund-level expense reductions, if any, are allocated daily on a pro-rata basis to each class based on the relative net assets of each class to the total net assets of the Fund. Each class differs with respect to transfer agent and distribution and service plan fees incurred. Certain expense reductions may also differ by class. For the reporting period, the allocated portion of income and expenses to each class as a percent of its average net assets may vary due to the timing of recording these transactions in relation to fluctuating net assets of the classes. Expenses directly attributable to a fund are charged to that fund. Expenses attributable to more than one fund are allocated among the respective funds on the basis of relative net assets or other appropriate methods. Expense estimates are accrued in the period to which they relate and adjustments are made when actual amounts are known.
Income Tax Information and Distributions to Shareholders. Each year, the Fund intends to qualify as a regulated investment company under Subchapter M of the Internal Revenue Code, including distributing substantially all of its taxable income and realized gains. As a result, no provision for U.S. Federal income taxes is required. As of October 31, 2020, the Fund did not have any unrecognized tax benefits in the financial statements; nor is the Fund aware of any tax positions for which it is reasonably possible that the total amounts of unrecognized tax benefits will significantly change in the next twelve months. The Fund files a U.S. federal tax return, in addition to state and local tax returns as required. The Fund's federal income tax returns are subject to examination by the Internal Revenue Service (IRS) for a period of three fiscal years after they are filed. State and local tax returns may be subject to examination for an additional fiscal year depending on the jurisdiction. Foreign taxes are provided for based on the Fund's understanding of the tax rules and rates that exist in the foreign markets in which it invests.
Distributions are declared and recorded on the ex-dividend date. Income and capital gain distributions are declared separately for each class. Income and capital gain distributions are determined in accordance with income tax regulations, which may differ from GAAP. In addition, the Fund claimed a portion of the payment made to redeeming shareholders as a distribution for income tax purposes.
Capital accounts within the financial statements are adjusted for permanent book-tax differences. These adjustments have no impact on net assets or the results of operations. Capital accounts are not adjusted for temporary book-tax differences which will reverse in a subsequent period.
Book-tax differences are primarily due to foreign currency transactions, passive foreign investment companies (PFIC), capital loss carryforwards and losses deferred due to wash sales.
As of period end, the cost and unrealized appreciation (depreciation) in securities, and derivatives if applicable, for federal income tax purposes were as follows:
| Gross unrealized appreciation | $13,628,876 |
| Gross unrealized depreciation | (10,886,866) |
| Net unrealized appreciation (depreciation) | $2,742,010 |
| Tax Cost | $59,744,527 |
The tax-based components of distributable earnings as of period end were as follows:
| Undistributed ordinary income | $2,275,693 |
| Capital loss carryforward | $(16,445,112) |
| Net unrealized appreciation (depreciation) on securities and other investments | $2,733,870 |
Capital loss carryforwards are only available to offset future capital gains of the Fund to the extent provided by regulations and may be limited. The capital loss carryforward information presented below, including any applicable limitation, is estimated as of fiscal period end and is subject to adjustment.
| No expiration | |
| Short-term | $(8,146,534) |
| Long-term | (8,298,578) |
| Total capital loss carryforward | $(16,445,112) |
The tax character of distributions paid was as follows:
| | October 31, 2020 | October 31, 2019 |
| Ordinary Income | $4,884,674 | $ 2,353,924 |
Restricted Securities (including Private Placements). The Fund may invest in securities that are subject to legal or contractual restrictions on resale. These securities generally may be resold in transactions exempt from registration or to the public if the securities are registered. Disposal of these securities may involve time-consuming negotiations and expense, and prompt sale at an acceptable price may be difficult. Information regarding restricted securities is included at the end of the Fund's Schedule of Investments.
4. Purchases and Sales of Investments.
Purchases and sales of securities, other than short-term securities, are noted in the table below.
| | Purchases ($) | Sales ($) |
| Fidelity Emerging Europe, Middle East, Africa (EMEA) Fund | 45,840,954 | 66,083,597 |
5. Fees and Other Transactions with Affiliates.
Management Fee. Fidelity Management & Research Company LLC (the investment adviser) and its affiliates provide the Fund with investment management related services for which the Fund pays a monthly management fee. The management fee is the sum of an individual fund fee rate that is based on an annual rate of .55% of the Fund's average net assets and an annualized group fee rate that averaged .23% during the period. The group fee rate is based upon the monthly average net assets of a group of registered investment companies with which the investment adviser has management contracts. The group fee rate decreases as assets under management increase and increases as assets under management decrease. For the reporting period, the total annual management fee rate was .79% of the Fund's average net assets.
Distribution and Service Plan Fees. In accordance with Rule 12b-1 of the 1940 Act, the Fund has adopted separate Distribution and Service Plans for each class of shares. Certain classes pay Fidelity Distributors Company LLC (FDC), an affiliate of the investment adviser, separate Distribution and Service Fees, each of which is based on an annual percentage of each class' average net assets. In addition, FDC may pay financial intermediaries for selling shares of the Fund and providing shareholder support services. For the period, the Distribution and Service Fee rates, total fees and amounts retained by FDC were as follows:
| | Distribution Fee | Service Fee | Total Fees | Retained by FDC |
| Class A | -% | .25% | $11,161 | $174 |
| Class M | .25% | .25% | 9,380 | 216 |
| Class C | .75% | .25% | 19,168 | 601 |
| | | | $39,709 | $991 |
Sales Load. FDC may receive a front-end sales charge of up to 5.75% for selling Class A shares and 3.50% for selling Class M shares, some of which is paid to financial intermediaries for selling shares of the Fund. Depending on the holding period, FDC may receive contingent deferred sales charges levied on Class A, Class M and Class C redemptions. The deferred sales charges are 1.00% for Class C shares, 1.00% for certain purchases of Class A shares and .25% for certain purchases of Class M shares.
For the period, sales charge amounts retained by FDC were as follows:
| | Retained by FDC |
| Class A | $475 |
| Class M | 571 |
| Class C(a) | 7 |
| | $1,053 |
(a) When Class C shares are initially sold, FDC pays commissions from its own resources to financial intermediaries through which the sales are made.
Transfer Agent Fees. Fidelity Investments Institutional Operations Company LLC (FIIOC), an affiliate of the investment adviser, is the transfer, dividend disbursing and shareholder servicing agent for each class of the Fund. FIIOC receives account fees and asset-based fees that vary according to the account size and type of account of the shareholders of the respective classes of the Fund. FIIOC pays for typesetting, printing and mailing of shareholder reports, except proxy statements.
For the period, transfer agent fees for each class were as follows:
| | Amount | % of Class-Level Average Net Assets |
| Class A | $11,773 | .26 |
| Class M | 5,470 | .29 |
| Class C | 5,489 | .29 |
| Emerging Europe, Middle East, Africa (EMEA) | 133,446 | .24 |
| Class I | 55,266 | .28 |
| | $211,444 | |
Accounting Fees. Fidelity Service Company, Inc. (FSC), an affiliate of the investment adviser, maintains the Fund's accounting records. The accounting fee is based on the level of average net assets for each month. For the period, the fees were equivalent to the following annual rates:
| | % of Average Net Assets |
| Fidelity Emerging Europe, Middle East, Africa (EMEA) Fund | .05 |
Brokerage Commissions. A portion of portfolio transactions were placed with brokerage firms which are affiliates of the investment adviser. Brokerage commissions are included in net realized gain (loss) and change in net unrealized appreciation (depreciation) in the Statement of Operations. The commissions paid to these affiliated firms were as follows:
| | Amount |
| Fidelity Emerging Europe, Middle East, Africa (EMEA) Fund | $142 |
Interfund Trades. Funds may purchase from or sell securities to other Fidelity Funds under procedures adopted by the Board. The procedures have been designed to ensure these interfund trades are executed in accordance with Rule 17a-7 of the 1940 Act. Interfund trades are included within the respective purchases and sales amounts shown in the Purchases and Sales of Investments note.
6. Committed Line of Credit.
Certain Funds participate with other funds managed by the investment adviser or an affiliate in a $4.25 billion credit facility (the "line of credit") to be utilized for temporary or emergency purposes to fund shareholder redemptions or for other short-term liquidity purposes. The participating funds have agreed to pay commitment fees on their pro-rata portion of the line of credit, which are reflected in Miscellaneous expenses on the Statement of Operations, and are as follows:
| | Amount |
| Fidelity Emerging Europe, Middle East, Africa (EMEA) Fund | $209 |
During the period, there were no borrowings on this line of credit.
7. Security Lending.
Funds lend portfolio securities from time to time in order to earn additional income. Lending agents are used, including National Financial Services (NFS), an affiliate of the investment adviser. Pursuant to a securities lending agreement, NFS will receive a fee, which is capped at 9.9% of a fund's daily lending revenue, for its services as lending agent. A fund may lend securities to certain qualified borrowers, including NFS. On the settlement date of the loan, a fund receives collateral (in the form of U.S. Treasury obligations, letters of credit and/or cash) against the loaned securities and maintains collateral in an amount not less than 100% of the market value of the loaned securities during the period of the loan. The market value of the loaned securities is determined at the close of business of a fund and any additional required collateral is delivered to a fund on the next business day. A fund or borrower may terminate the loan at any time, and if the borrower defaults on its obligation to return the securities loaned because of insolvency or other reasons, a fund may apply collateral received from the borrower against the obligation. A fund may experience delays and costs in recovering the securities loaned. Any cash collateral received is invested in the Fidelity Securities Lending Cash Central Fund. Any loaned securities are identified as such in the Schedule of Investments, and the value of loaned securities and cash collateral at period end, as applicable, are presented in the Statement of Assets and Liabilities. Security lending income represents the income earned on investing cash collateral, less rebates paid to borrowers and any lending agent fees associated with the loan, plus any premium payments received for lending certain types of securities. Security lending income is presented in the Statement of Operations as a component of income from Fidelity Central Funds. Affiliated security lending activity, if any, was as follows:
| | Total Security Lending Income Fees Paid to NFS | Security Lending Income From Securities Loaned to NFS | Value of Securities Loaned to NFS at Period End |
| Fidelity Emerging Europe, Middle East, Africa (EMEA) Fund | $4 | $– | $– |
8. Expense Reductions.
The investment adviser contractually agreed to reimburse expenses of each class to the extent annual operating expenses exceeded certain levels of class-level average net assets as noted in the table below. This reimbursement will remain in place through February 28, 2022. Some expenses, for example the compensation of the independent Trustees, and certain miscellaneous expenses such as proxy and shareholder meeting expenses, are excluded from this reimbursement.
The following classes were in reimbursement during the period:
| | Expense Limitations | Reimbursement |
| Class A | 1.65% / 1.55%(a) | $1,926 |
| Class M | 1.90% / 1.80%(a) | 953 |
| Class C | 2.40% / 2.30%(a) | 1,075 |
| Emerging Europe, Middle East, Africa (EMEA) | 1.40% / 1.30%(a) | 16,444 |
| Class I | 1.40% / 1.30%(a) | 11,161 |
| | | $31,559 |
(a) Expense limitation effective February 1, 2020.
Commissions paid to certain brokers with whom the investment adviser, or its affiliates, places trades on behalf of the Fund include an amount in addition to trade execution, which may be rebated back to the Fund to offset certain expenses. This amount totaled $7,085 for the period.
In addition, during the period the investment adviser or an affiliate reimbursed and/or waived a portion of fund-level operating expenses in the amount of $434.
In addition, during the period the investment adviser or an affiliate reimbursed the Fund $4,312 for an operational error which is included in the accompanying Statement of Operations.
9. Distributions to Shareholders.
Distributions to shareholders of each class were as follows:
| | Year ended
October 31, 2020 | Year ended
October 31, 2019 |
| Distributions to shareholders | | |
| Class A | $240,672 | $99,906 |
| Class M | 91,270 | 40,149 |
| Class C | 79,886 | 29,829 |
| Emerging Europe, Middle East, Africa (EMEA) | 3,440,635 | 1,999,708 |
| Class I | 1,032,211 | 184,332 |
| Total | $4,884,674 | $2,353,924 |
10. Share Transactions.
Share transactions for each class were as follows and may contain automatic conversions between classes or exchanges between affiliated funds:
| | Shares | Shares | Dollars | Dollars |
| | Year ended October 31, 2020 | Year ended October 31, 2019 | Year ended October 31, 2020 | Year ended October 31, 2019 |
| Class A | | | | |
| Shares sold | 68,472 | 83,951 | $570,865 | $792,142 |
| Reinvestment of distributions | 24,754 | 11,024 | 237,390 | 98,665 |
| Shares redeemed | (143,494) | (113,793) | (1,119,939) | (1,083,165) |
| Net increase (decrease) | (50,268) | (18,818) | $(311,684) | $(192,358) |
| Class M | | | | |
| Shares sold | 22,557 | 18,323 | $197,215 | $172,236 |
| Reinvestment of distributions | 9,528 | 4,497 | 91,186 | 40,115 |
| Shares redeemed | (50,418) | (38,654) | (409,200) | (363,904) |
| Net increase (decrease) | (18,333) | (15,834) | $(120,799) | $(151,553) |
| Class C | | | | |
| Shares sold | 44,541 | 16,370 | $320,292 | $153,563 |
| Reinvestment of distributions | 7,201 | 2,996 | 69,414 | 26,845 |
| Shares redeemed | (120,427) | (99,392) | (937,777) | (928,396) |
| Net increase (decrease) | (68,685) | (80,026) | $(548,071) | $(747,988) |
| Emerging Europe, Middle East, Africa (EMEA) | | | | |
| Shares sold | 1,288,092 | 2,923,695 | $11,148,587 | $27,670,486 |
| Reinvestment of distributions | 331,610 | 208,558 | 3,180,144 | 1,864,507 |
| Shares redeemed | (3,999,313) | (4,975,055) | (31,723,665) | (47,144,605) |
| Net increase (decrease) | (2,379,611) | (1,842,802) | $(17,394,934) | $(17,609,612) |
| Class I | | | | |
| Shares sold | 1,707,215 | 2,259,653 | $13,961,194 | $21,094,519 |
| Reinvestment of distributions | 93,311 | 16,413 | 891,116 | 146,566 |
| Shares redeemed | (1,969,603) | (607,935) | (15,942,023) | (5,808,533) |
| Net increase (decrease) | (169,077) | 1,668,131 | $(1,089,713) | $15,432,552 |
11. Other.
The Fund's organizational documents provide former and current trustees and officers with a limited indemnification against liabilities arising in connection with the performance of their duties to the Fund. In the normal course of business, the Fund may also enter into contracts that provide general indemnifications. The Fund's maximum exposure under these arrangements is unknown as this would be dependent on future claims that may be made against the Fund. The risk of material loss from such claims is considered remote.
12. Coronavirus (COVID-19) Pandemic.
An outbreak of COVID-19 first detected in China during December 2019 has since spread globally and was declared a pandemic by the World Health Organization during March 2020. Developments that disrupt global economies and financial markets, such as the COVID-19 pandemic, may magnify factors that affect the Fund's performance.
13. Proposed Reorganization.
The Board of Trustees of the Fund approved an Agreement and Plan of Reorganization (the Agreement) between the Fund and Fidelity Emerging Markets Fund. The Agreement provides for the transfer of all the assets and the assumption of all the liabilities of the Fund in exchange for corresponding shares of Fidelity Emerging Markets Fund equal in value to the net assets of the Fund on the day the reorganization is effective.
A meeting of shareholders of the Fund is expected to be held during the second quarter of 2021 to vote on the reorganization. If approved by shareholders, the reorganization is expected to become effective on or about May 14, 2021. The reorganization is expected to qualify as a tax-free transaction for federal income tax purposes with no gain or loss recognized by the funds or their shareholders.
Report of Independent Registered Public Accounting Firm
To the Board of Trustees of Fidelity Investment Trust and Shareholders of Fidelity Emerging Europe, Middle East, Africa (EMEA) Fund
Opinion on the Financial Statements and Financial Highlights
We have audited the accompanying statement of assets and liabilities of Fidelity Emerging Europe, Middle East, Africa (EMEA) Fund (the "Fund"), a fund of Fidelity Investment Trust, including the schedule of investments, as of October 31, 2020, the related statement of operations for the year then ended, the statement of changes in net assets for each of the two years in the period then ended, the financial highlights for each of the five years in the period then ended, and the related notes. In our opinion, the financial statements and financial highlights present fairly, in all material respects, the financial position of the Fund as of October 31, 2020, and the results of its operations for the year then ended, the changes in its net assets for each of the two years in the period then ended, and the financial highlights for each of the five years in the period then ended in conformity with accounting principles generally accepted in the United States of America.
Basis for Opinion
These financial statements and financial highlights are the responsibility of the Fund's management. Our responsibility is to express an opinion on the Fund's financial statements and financial highlights based on our audits. We are a public accounting firm registered with the Public Company Accounting Oversight Board (United States) (PCAOB) and are required to be independent with respect to the Fund in accordance with the U.S. federal securities laws and the applicable rules and regulations of the Securities and Exchange Commission and the PCAOB.
We conducted our audits in accordance with the standards of the PCAOB. Those standards require that we plan and perform the audit to obtain reasonable assurance about whether the financial statements and financial highlights are free of material misstatement, whether due to error or fraud. The Fund is not required to have, nor were we engaged to perform, an audit of its internal control over financial reporting. As part of our audits we are required to obtain an understanding of internal control over financial reporting but not for the purpose of expressing an opinion on the effectiveness of the Fund’s internal control over financial reporting. Accordingly, we express no such opinion.
Our audits included performing procedures to assess the risks of material misstatement of the financial statements and financial highlights, whether due to error or fraud, and performing procedures that respond to those risks. Such procedures included examining, on a test basis, evidence regarding the amounts and disclosures in the financial statements and financial highlights. Our audits also included evaluating the accounting principles used and significant estimates made by management, as well as evaluating the overall presentation of the financial statements and financial highlights. Our procedures included confirmation of securities owned as of October 31, 2020, by correspondence with the custodian and brokers; when replies were not received from brokers, we performed other auditing procedures. We believe that our audits provide a reasonable basis for our opinion.
/s/ Deloitte & Touche LLP
Boston, Massachusetts
December 14, 2020
We have served as the auditor of one or more of the Fidelity investment companies since 1999.
Trustees and Officers
The Trustees, Members of the Advisory Board (if any), and officers of the trust and fund, as applicable, are listed below. The Board of Trustees governs the fund and is responsible for protecting the interests of shareholders. The Trustees are experienced executives who meet periodically throughout the year to oversee the fund's activities, review contractual arrangements with companies that provide services to the fund, oversee management of the risks associated with such activities and contractual arrangements, and review the fund's performance. Except for Jonathan Chiel, each of the Trustees oversees 305 funds. Mr. Chiel oversees 174 funds.
The Trustees hold office without limit in time except that (a) any Trustee may resign; (b) any Trustee may be removed by written instrument, signed by at least two-thirds of the number of Trustees prior to such removal; (c) any Trustee who requests to be retired or who has become incapacitated by illness or injury may be retired by written instrument signed by a majority of the other Trustees; and (d) any Trustee may be removed at any special meeting of shareholders by a two-thirds vote of the outstanding voting securities of the trust. Each Trustee who is not an interested person (as defined in the 1940 Act) of the trust and the fund is referred to herein as an Independent Trustee. Each Independent Trustee shall retire not later than the last day of the calendar year in which his or her 75th birthday occurs. The Independent Trustees may waive this mandatory retirement age policy with respect to individual Trustees. Officers and Advisory Board Members hold office without limit in time, except that any officer or Advisory Board Member may resign or may be removed by a vote of a majority of the Trustees at any regular meeting or any special meeting of the Trustees. Except as indicated, each individual has held the office shown or other offices in the same company for the past five years.
The fund's Statement of Additional Information (SAI) includes more information about the Trustees. To request a free copy, call Fidelity at 1-800-544-8544 if you’re an individual investing directly with Fidelity, call 1-800-835-5092 if you’re a plan sponsor or participant with Fidelity as your recordkeeper or call 1-877-208-0098 on institutional accounts or if you’re an advisor or invest through one.
Experience, Skills, Attributes, and Qualifications of the Trustees. The Governance and Nominating Committee has adopted a statement of policy that describes the experience, qualifications, attributes, and skills that are necessary and desirable for potential Independent Trustee candidates (Statement of Policy). The Board believes that each Trustee satisfied at the time he or she was initially elected or appointed a Trustee, and continues to satisfy, the standards contemplated by the Statement of Policy. The Governance and Nominating Committee also engages professional search firms to help identify potential Independent Trustee candidates who have the experience, qualifications, attributes, and skills consistent with the Statement of Policy. From time to time, additional criteria based on the composition and skills of the current Independent Trustees, as well as experience or skills that may be appropriate in light of future changes to board composition, business conditions, and regulatory or other developments, have also been considered by the professional search firms and the Governance and Nominating Committee. In addition, the Board takes into account the Trustees' commitment and participation in Board and committee meetings, as well as their leadership of standing and ad hoc committees throughout their tenure.
In determining that a particular Trustee was and continues to be qualified to serve as a Trustee, the Board has considered a variety of criteria, none of which, in isolation, was controlling. The Board believes that, collectively, the Trustees have balanced and diverse experience, qualifications, attributes, and skills, which allow the Board to operate effectively in governing the fund and protecting the interests of shareholders. Information about the specific experience, skills, attributes, and qualifications of each Trustee, which in each case led to the Board's conclusion that the Trustee should serve (or continue to serve) as a trustee of the fund, is provided below.
Board Structure and Oversight Function. Robert A. Lawrence is an interested person and currently serves as Acting Chairman. The Trustees have determined that an interested Chairman is appropriate and benefits shareholders because an interested Chairman has a personal and professional stake in the quality and continuity of services provided to the fund. Independent Trustees exercise their informed business judgment to appoint an individual of their choosing to serve as Chairman, regardless of whether the Trustee happens to be independent or a member of management. The Independent Trustees have determined that they can act independently and effectively without having an Independent Trustee serve as Chairman and that a key structural component for assuring that they are in a position to do so is for the Independent Trustees to constitute a substantial majority for the Board. The Independent Trustees also regularly meet in executive session. Ned C. Lautenbach and David M. Thomas serve as Co-Lead Independent Trustees and as such each (i) acts as a liaison between the Independent Trustees and management with respect to matters important to the Independent Trustees and (ii) with management prepares agendas for Board meetings.
Fidelity® funds are overseen by different Boards of Trustees. The fund's Board oversees Fidelity's high income and certain equity funds, and other Boards oversee Fidelity's investment-grade bond, money market, asset allocation, and other equity funds. The asset allocation funds may invest in Fidelity® funds overseen by the fund's Board. The use of separate Boards, each with its own committee structure, allows the Trustees of each group of Fidelity® funds to focus on the unique issues of the funds they oversee, including common research, investment, and operational issues. On occasion, the separate Boards establish joint committees to address issues of overlapping consequences for the Fidelity® funds overseen by each Board.
The Trustees operate using a system of committees to facilitate the timely and efficient consideration of all matters of importance to the Trustees, the fund, and fund shareholders and to facilitate compliance with legal and regulatory requirements and oversight of the fund's activities and associated risks. The Board, acting through its committees, has charged FMR and its affiliates with (i) identifying events or circumstances the occurrence of which could have demonstrably adverse effects on the fund's business and/or reputation; (ii) implementing processes and controls to lessen the possibility that such events or circumstances occur or to mitigate the effects of such events or circumstances if they do occur; and (iii) creating and maintaining a system designed to evaluate continuously business and market conditions in order to facilitate the identification and implementation processes described in (i) and (ii) above. Because the day-to-day operations and activities of the fund are carried out by or through FMR, its affiliates, and other service providers, the fund's exposure to risks is mitigated but not eliminated by the processes overseen by the Trustees. While each of the Board's committees has responsibility for overseeing different aspects of the fund's activities, oversight is exercised primarily through the Operations, Audit, and Compliance Committees. Appropriate personnel, including but not limited to the fund's Chief Compliance Officer (CCO), FMR's internal auditor, the independent accountants, the fund's Treasurer and portfolio management personnel, make periodic reports to the Board's committees, as appropriate, including an annual review of Fidelity's risk management program for the Fidelity® funds. The responsibilities of each standing committee, including their oversight responsibilities, are described further under "Standing Committees of the Trustees."
Interested Trustees*:
Correspondence intended for a Trustee who is an interested person may be sent to Fidelity Investments, 245 Summer Street, Boston, Massachusetts 02210.
Name, Year of Birth; Principal Occupations and Other Relevant Experience+
Jonathan Chiel (1957)
Year of Election or Appointment: 2016
Trustee
Mr. Chiel also serves as Trustee of other Fidelity® funds. Mr. Chiel is Executive Vice President and General Counsel for FMR LLC (diversified financial services company, 2012-present). Previously, Mr. Chiel served as general counsel (2004-2012) and senior vice president and deputy general counsel (2000-2004) for John Hancock Financial Services; a partner with Choate, Hall & Stewart (1996-2000) (law firm); and an Assistant United States Attorney for the United States Attorney’s Office of the District of Massachusetts (1986-95), including Chief of the Criminal Division (1993-1995). Mr. Chiel is a director on the boards of the Boston Bar Foundation and the Maimonides School.
Robert A. Lawrence (1952)
Year of Election or Appointment: 2020
Trustee
Acting Chairman of the Board of Trustees
Mr. Lawrence also serves as Trustee of other funds. Previously, Mr. Lawrence served as a Member of the Advisory Board of certain funds. Prior to his retirement in 2008, Mr. Lawrence served as Vice President of certain Fidelity® funds (2006-2008), Senior Vice President, Head of High Income Division of Fidelity Management & Research Company (investment adviser firm, 2006-2008), and President of Fidelity Strategic Investments (investment adviser firm, 2002-2005).
* Determined to be an “Interested Trustee” by virtue of, among other things, his or her affiliation with the trust or various entities under common control with FMR.
+ The information includes the Trustee's principal occupation during the last five years and other information relating to the experience, attributes, and skills relevant to the Trustee's qualifications to serve as a Trustee, which led to the conclusion that the Trustee should serve as a Trustee for the fund.
Independent Trustees:
Correspondence intended for an Independent Trustee may be sent to Fidelity Investments, P.O. Box 55235, Boston, Massachusetts 02205-5235.
Name, Year of Birth; Principal Occupations and Other Relevant Experience+
Dennis J. Dirks (1948)
Year of Election or Appointment: 2005
Trustee
Mr. Dirks also serves as Trustee of other Fidelity® funds. Prior to his retirement in May 2003, Mr. Dirks served as Chief Operating Officer and as a member of the Board of The Depository Trust & Clearing Corporation (financial markets infrastructure), President, Chief Operating Officer and a member of the Board of The Depository Trust Company (DTC), President and a member of the Board of the National Securities Clearing Corporation (NSCC), Chief Executive Officer and a member of the Board of the Government Securities Clearing Corporation and Chief Executive Officer and a member of the Board of the Mortgage-Backed Securities Clearing Corporation. Mr. Dirks currently serves as a member of the Finance Committee (2016-present) and Board (2017-present) and is Treasurer (2018-present) of the Asolo Repertory Theatre.
Donald F. Donahue (1950)
Year of Election or Appointment: 2018
Trustee
Mr. Donahue also serves as Trustee of other Fidelity® funds. Mr. Donahue serves as President and Chief Executive Officer of Miranda Partners, LLC (risk consulting for the financial services industry, 2012-present). Previously, Mr. Donahue served as Chief Executive Officer (2006-2012), Chief Operating Officer (2003-2006) and Managing Director, Customer Marketing and Development (1999-2003) of The Depository Trust & Clearing Corporation (financial markets infrastructure). Mr. Donahue currently serves as a member (2007-present) and Co-Chairman (2016-present) of the Board of United Way of New York, a member of the Board of NYC Leadership Academy (2012-present) and a member of the Board of Advisors of Ripple Labs, Inc. (financial services, 2015-present). Mr. Donahue previously served as a member of the Advisory Board of certain Fidelity® funds (2015-2018).
Vicki L. Fuller (1957)
Year of Election or Appointment: 2020
Trustee
Ms. Fuller also serves as Trustee of other Fidelity® funds. Previously, Ms. Fuller served as a member of the Advisory Board of certain Fidelity® funds (2018-2020), Chief Investment Officer of the New York State Common Retirement Fund (2012-2018) and held a variety of positions at AllianceBernstein L.P. (global asset management, 1985-2012), including Managing Director (2006-2012) and Senior Vice President and Senior Portfolio Manager (2001-2006). Ms. Fuller currently serves as a member of the Board, Audit Committee and Nominating and Governance Committee of The Williams Companies, Inc. (natural gas infrastructure, 2018-present), as a member of the Board, Audit Committee and Nominating and Governance Committee of two Blackstone business development companies (2020-present) and as a member of the Board of Treliant, LLC (consulting, 2019-present).
Patricia L. Kampling (1959)
Year of Election or Appointment: 2020
Trustee
Ms. Kampling also serves as Trustee of other Fidelity® funds. Prior to her retirement, Ms. Kampling served as Chairman of the Board and Chief Executive Officer (2012-2019), President and Chief Operating Officer (2011-2012) and Executive Vice President and Chief Financial Officer (2010-2011) of Alliant Energy Corporation. Ms. Kampling currently serves as a member of the Board, Compensation Committee and Executive Committee and as Chair of the Audit Committee of Briggs & Stratton Corporation (manufacturing, 2011-present) and as a member of the Board, Audit, Finance and Risk Committee and Safety, Environmental, Technology and Operations Committee of American Water Works Company, Inc. (utilities company, 2019-present). In addition, Ms. Kampling currently serves as a member of the Board of the Nature Conservancy, Wisconsin Chapter (2019-present). Previously, Ms. Kampling served as a Member of the Advisory Board of certain Fidelity® funds (2020), a member of the Board of Interstate Power and Light Company (2012-2019) and Wisconsin Power and Light Company (2012-2019) (each a subsidiary of Alliant Energy Corporation) and as a member of the Board and Workforce Development Committee of the Business Roundtable (2018-2019).
Alan J. Lacy (1953)
Year of Election or Appointment: 2008
Trustee
Mr. Lacy also serves as Trustee of other Fidelity® funds. Previously, Mr. Lacy served as Senior Adviser (2007-2014) of Oak Hill Capital Partners, L.P. (private equity), Chief Executive Officer (2005) and Vice Chairman (2005-2006) of Sears Holdings Corporation (retail), Chief Executive Officer and Chairman of the Board of Sears, Roebuck and Co. (retail, 2000-2005), Chairman (2014-2017) and a member of the Board (2010-2017) of Dave & Buster’s Entertainment, Inc. (restaurant and entertainment complexes) and a member of the Board of Bristol-Myers Squibb Company (global pharmaceuticals, 2008-2020). Mr. Lacy currently serves as a Trustee of the California Chapter of The Nature Conservancy (2015-present) and a member of the Board of the Center for Advanced Study in the Behavioral Sciences at Stanford University (2015-present).
Ned C. Lautenbach (1944)
Year of Election or Appointment: 2000
Trustee
Co-Lead Independent Trustee
Mr. Lautenbach also serves as Trustee of other Fidelity® funds. Mr. Lautenbach currently serves as Chair of the Board of Governors, State University System of Florida (2013-present) and is a member of the Council on Foreign Relations (1994-present). He is also a member and has in the past served as Chairman of the Board of Directors of Artis-Naples (2012-present). Previously, Mr. Lautenbach served as a member and then Lead Director of the Board of Directors of Eaton Corporation (diversified industrial, 1997-2016). He was also a Partner at Clayton, Dubilier & Rice, LLC (private equity investment, 1998-2010); as well as Director of Sony Corporation (2006-2007). In addition, Mr. Lautenbach had a 30-year career with IBM (technology company), during which time he served as Senior Vice President and as a member of the Corporate Executive Committee (1968-1998).
Joseph Mauriello (1944)
Year of Election or Appointment: 2008
Trustee
Mr. Mauriello also serves as Trustee of other Fidelity® funds. Prior to his retirement in January 2006, Mr. Mauriello served in numerous senior management positions including Deputy Chairman and Chief Operating Officer (2004-2005), and Vice Chairman of Financial Services (2002-2004) of KPMG LLP US (professional services, 1965-2005). Mr. Mauriello currently serves as a member of the Independent Directors Council Governing Council (2015-present). Previously, Mr. Mauriello served as a member of the Board of XL Group plc. (global insurance and re-insurance, 2006-2018).
Cornelia M. Small (1944)
Year of Election or Appointment: 2005
Trustee
Ms. Small also serves as Trustee of other Fidelity® funds. Previously, Ms. Small served as Chief Investment Officer, Director of Global Equity Investments and a member of Scudder, Stevens & Clark and Scudder Kemper Investments. Ms. Small previously served as a member of the Board (2009-2019) and Chair of the Investment Committee (2010-2019) of the Teagle Foundation and a member of the Investment Committee of the Berkshire Taconic Community Foundation (2008-2019).
Garnett A. Smith (1947)
Year of Election or Appointment: 2018
Trustee
Mr. Smith also serves as Trustee of other Fidelity® funds. Prior to his retirement, Mr. Smith served as Chairman and Chief Executive Officer (1990-1997) and President (1986-1990) of Inbrand Corp. (manufacturer of personal absorbent products). Prior to his employment with Inbrand Corp., he was employed by a retail fabric chain and North Carolina National Bank (now Bank of America). Mr. Smith previously served as a member of the Advisory Board of certain Fidelity® funds (2012-2013).
David M. Thomas (1949)
Year of Election or Appointment: 2008
Trustee
Co-Lead Independent Trustee
Mr. Thomas also serves as Trustee of other Fidelity® funds. Previously, Mr. Thomas served as Executive Chairman (2005-2006) and Chairman and Chief Executive Officer (2000-2005) of IMS Health, Inc. (pharmaceutical and healthcare information solutions). Mr. Thomas currently serves as Non-Executive Chairman of the Board of Fortune Brands Home and Security (home and security products, 2011-present), and a member of the Board (2004-present) and Presiding Director (2013-present) of Interpublic Group of Companies, Inc. (marketing communication).
Susan Tomasky (1953)
Year of Election or Appointment: 2020
Trustee
Ms. Tomasky also serves as Trustee of other Fidelity® funds. Prior to her retirement, Ms. Tomasky served in various executive officer positions at American Electric Power Company, Inc. (1998-2011), including most recently as President of AEP Transmission (2007-2011). Ms. Tomasky currently serves as a member of the Board and Sustainability Committee and as Chair of the Audit Committee of Marathon Petroleum Corporation (2018-present) and as a member of the Board, Corporate Governance Committee and Organization and Compensation Committee and as Chair of the Audit Committee of Public Service Enterprise Group, Inc. (utilities company, 2012-present). In addition, Ms. Tomasky currently serves as a member of the Board of the Columbus Regional Airport Authority (2007-present), as a member of the Board of the Royal Shakespeare Company – America (2009-present), as a member of the Board of the Columbus Association for the Performing Arts (2011-present) and as a member of the Board of Kenyon College (2016-present). Previously, Ms. Tomasky served as a Member of the Advisory Board of certain Fidelity® funds (2020), a member of the Board (2011-2019) and as Lead Independent Director (2015-2018) of Andeavor Corporation (previously Tesoro Corporation) (independent oil refiner and marketer) and as a member of the Board of Summit Midstream Partners LP (energy, 2012-2018).
Michael E. Wiley (1950)
Year of Election or Appointment: 2020
Trustee
Mr. Wiley also serves as Trustee of other Fidelity® funds. Previously, Mr. Wiley served as a member of the Advisory Board of certain Fidelity® funds (2018-2020), Chairman, President and CEO of Baker Hughes, Inc. (oilfield services, 2000-2004). Mr. Wiley also previously served as a member of the Board of Andeavor Corporation (independent oil refiner and marketer, 2005-2018), a member of the Board of Andeavor Logistics LP (natural resources logistics, 2015-2018) and a member of the Board of High Point Resources (exploration and production, 2005-2020).
+ The information includes the Trustee's principal occupation during the last five years and other information relating to the experience, attributes, and skills relevant to the Trustee's qualifications to serve as a Trustee, which led to the conclusion that the Trustee should serve as a Trustee for the fund.
Advisory Board Members and Officers:
Correspondence intended for a Member of the Advisory Board (if any) may be sent to Fidelity Investments, P.O. Box 55235, Boston, Massachusetts 02205-5235. Correspondence intended for an officer or Peter S. Lynch may be sent to Fidelity Investments, 245 Summer Street, Boston, Massachusetts 02210. Officers appear below in alphabetical order.
Name, Year of Birth; Principal Occupation
Lloyd James Austin, III (1953)
Year of Election or Appointment: 2020
Member of the Advisory Board
General Austin also serves as a Member of the Advisory Board of other Fidelity® funds. Prior to his retirement, General Austin (United States Army, Retired) held a variety of positions within the U.S. Government, including Commander, U.S. Central Command (2013-2016), Vice Chief of Staff, U.S. Army (2012-2013) and Commanding General, U.S. Forces – Iraq, Operation New Dawn (2010-2012). General Austin currently serves as a Partner of Pine Island Capital Partners (private equity, 2020-present) and as President of the Austin Strategy Group LLC (consulting, 2016-present). General Austin serves as a member of the Board of Directors of Nucor Corporation (steel products, 2017-present), as a member of the Board of Directors of Tenet Healthcare Corporation (2018-present) and as a member of the Board of Directors of Raytheon Technologies Corporation (aerospace and defense, 2020-present). In addition, General Austin currently serves as a member of the Board of Trustees of the Carnegie Corporation of New York (2017-present) and as a member of the Board of Trustees of Auburn University (2017-present). Previously, General Austin served as a member of the Board of Directors of United Technologies Corporation (aerospace, defense and building, 2016-2020).
Thomas A. Kennedy (1955)
Year of Election or Appointment: 2020
Member of the Advisory Board
Mr. Kennedy also serves as a Member of the Advisory Board of other Fidelity® funds. Previously, Mr. Kennedy held a variety of positions at Raytheon Company (aerospace and defense, 1983-2020), including Chairman and Chief Executive Officer (2014-2020) and Executive Vice President and Chief Operating Officer (2013-2014). Mr. Kennedy currently serves as Executive Chairman of the Board of Directors of Raytheon Technologies Corporation (aerospace and defense, 2020-present). He is also a member of the Rutgers School of Engineering Industry Advisory Board (2011-present) and a member of the UCLA Engineering Dean’s Executive Board (2016-present).
Peter S. Lynch (1944)
Year of Election or Appointment: 2003
Member of the Advisory Board
Mr. Lynch also serves as a Member of the Advisory Board of other Fidelity® funds. Mr. Lynch is Vice Chairman and a Director of Fidelity Management & Research Company LLC (investment adviser firm). In addition, Mr. Lynch serves as a Trustee of Boston College and as the Chairman of the Inner-City Scholarship Fund. Previously, Mr. Lynch served as Vice Chairman and a Director of FMR Co., Inc. (investment adviser firm) and on the Special Olympics International Board of Directors (1997-2006).
Elizabeth Paige Baumann (1968)
Year of Election or Appointment: 2017
Anti-Money Laundering (AML) Officer
Ms. Baumann also serves as AML Officer of other funds. She is Chief AML Officer (2012-present) and Senior Vice President (2014-present) of FMR LLC (diversified financial services company) and is an employee of Fidelity Investments. Previously, Ms. Baumann served as AML Officer of certain funds (2017-2019), as AML Officer of the funds (2012-2016), and Vice President (2007-2014) and Deputy Anti-Money Laundering Officer (2007-2012) of FMR LLC.
Craig S. Brown (1977)
Year of Election or Appointment: 2019
Assistant Treasurer
Mr. Brown also serves as Assistant Treasurer of other funds. Mr. Brown is an employee of Fidelity Investments (2013-present).
John J. Burke III (1964)
Year of Election or Appointment: 2018
Chief Financial Officer
Mr. Burke also serves as Chief Financial Officer of other funds. Mr. Burke serves as Head of Investment Operations for Fidelity Fund and Investment Operations (2018-present) and is an employee of Fidelity Investments (1998-present). Previously Mr. Burke served as head of Asset Management Investment Operations (2012-2018).
William C. Coffey (1969)
Year of Election or Appointment: 2019
Assistant Secretary
Mr. Coffey also serves as Assistant Secretary of other funds. He is Senior Vice President and Deputy General Counsel of FMR LLC (diversified financial services company, 2010-present), and is an employee of Fidelity Investments. Previously, Mr. Coffey served as Secretary and CLO of certain funds (2018-2019); CLO, Secretary, and Senior Vice President of Fidelity Management & Research Company and FMR Co., Inc. (investment adviser firms, 2018-2019); Secretary of Fidelity SelectCo, LLC and Fidelity Investments Money Management, Inc. (investment adviser firms, 2018-2019); CLO of Fidelity Management & Research (Hong Kong) Limited, FMR Investment Management (UK) Limited, and Fidelity Management & Research (Japan) Limited (investment adviser firms, 2018-2019); and Assistant Secretary of certain funds (2009-2018).
Timothy M. Cohen (1969)
Year of Election or Appointment: 2018
Vice President
Mr. Cohen also serves as Vice President of other funds. Mr. Cohen serves as Co-Head of Equity (2018-present), a Director of Fidelity Management & Research (Japan) Limited (investment adviser firm, 2016-present), and is an employee of Fidelity Investments. Previously, Mr. Cohen served as Executive Vice President of Fidelity SelectCo, LLC (2019), Head of Global Equity Research (2016-2018), Chief Investment Officer - Equity and a Director of Fidelity Management & Research (U.K.) Inc. (investment adviser firm, 2013-2015) and as a Director of Fidelity Management & Research (Hong Kong) Limited (investment adviser firm, 2017).
Jonathan Davis (1968)
Year of Election or Appointment: 2010
Assistant Treasurer
Mr. Davis also serves as Assistant Treasurer of other funds. Mr. Davis serves as Assistant Treasurer of FMR Capital, Inc. (2017-present) and is an employee of Fidelity Investments. Previously, Mr. Davis served as Vice President and Associate General Counsel of FMR LLC (diversified financial services company, 2003-2010).
Laura M. Del Prato (1964)
Year of Election or Appointment: 2018
Assistant Treasurer
Ms. Del Prato also serves as an officer of other funds. Ms. Del Prato is an employee of Fidelity Investments (2017-present). Previously, Ms. Del Prato served as President and Treasurer of The North Carolina Capital Management Trust: Cash Portfolio and Term Portfolio (2018-2020). Prior to joining Fidelity Investments, Ms. Del Prato served as a Managing Director and Treasurer of the JPMorgan Mutual Funds (2014-2017). Prior to JPMorgan, Ms. Del Prato served as a partner at Cohen Fund Audit Services (accounting firm, 2012-2013) and KPMG LLP (accounting firm, 2004-2012).
Colm A. Hogan (1973)
Year of Election or Appointment: 2020
Assistant Treasurer
Mr. Hogan also serves as an officer of other funds. Mr. Hogan serves as Assistant Treasurer of FMR Capital, Inc. (2017-present) and is an employee of Fidelity Investments (2005-present). Previously, Mr. Hogan served as Deputy Treasurer of certain Fidelity® funds (2016-2020) and Assistant Treasurer of certain Fidelity® funds (2016-2018).
Pamela R. Holding (1964)
Year of Election or Appointment: 2018
Vice President
Ms. Holding also serves as Vice President of other funds. Ms. Holding serves as Co-Head of Equity (2018-present) and is an employee of Fidelity Investments (2013-present). Previously, Ms. Holding served as Executive Vice President of Fidelity SelectCo, LLC (2019) and as Chief Investment Officer of Fidelity Institutional Asset Management (2013-2018).
Cynthia Lo Bessette (1969)
Year of Election or Appointment: 2019
Secretary and Chief Legal Officer (CLO)
Ms. Lo Bessette also serves as an officer of other funds. Ms. Lo Bessette serves as CLO, Secretary, and Senior Vice President of Fidelity Management & Research Company LLC (investment adviser firm, 2019-present); and CLO of Fidelity Management & Research (Hong Kong) Limited, FMR Investment Management (UK) Limited, and Fidelity Management & Research (Japan) Limited (investment adviser firms, 2019-present). She is a Senior Vice President and Deputy General Counsel of FMR LLC (diversified financial services company, 2019-present), and is an employee of Fidelity Investments. Previously, Ms. Lo Bessette served as CLO, Secretary, and Senior Vice President of FMR Co., Inc. (investment adviser firm, 2019); Secretary of Fidelity SelectCo, LLC and Fidelity Investments Money Management, Inc. (investment adviser firms, 2019). Prior to joining Fidelity Investments, Ms. Lo Bessette was Executive Vice President, General Counsel (2016-2019) and Senior Vice President, Deputy General Counsel (2015-2016) of OppenheimerFunds (investment management company) and Deputy Chief Legal Officer (2013-2015) of Jennison Associates LLC (investment adviser firm).
Chris Maher (1972)
Year of Election or Appointment: 2020
Deputy Treasurer
Mr. Maher also serves as an officer of other funds. Mr. Maher serves as Assistant Treasurer of FMR Capital, Inc. (2017-present), and is an employee of Fidelity Investments (2008-present). Previously, Mr. Maher served as Assistant Treasurer of certain funds (2013-2020); Vice President of Asset Management Compliance (2013), Vice President of the Program Management Group of FMR (investment adviser firm, 2010-2013), and Vice President of Valuation Oversight (2008-2010).
Jason P. Pogorelec (1975)
Year of Election or Appointment: 2020
Chief Compliance Officer
Mr. Pogorelec also serves as Chief Compliance Officer of other funds. Mr. Pogorelec is a senior Vice President of Asset Management Compliance for Fidelity Investments and is an employee of Fidelity Investments (2006-present). Previously, Mr. Pogorelec served as Vice President, Associate General Counsel for Fidelity Investments (2010-2020) and Assistant Secretary of certain Fidelity funds (2015-2020).
Stacie M. Smith (1974)
Year of Election or Appointment: 2016
President and Treasurer
Ms. Smith also serves as an officer of other funds. Ms. Smith serves as Assistant Treasurer of FMR Capital, Inc. (2017-present), is an employee of Fidelity Investments (2009-present), and has served in other fund officer roles. Prior to joining Fidelity Investments, Ms. Smith served as Senior Audit Manager of Ernst & Young LLP (accounting firm, 1996-2009). Previously, Ms. Smith served as Assistant Treasurer (2013-2019) and Deputy Treasurer (2013-2016) of certain Fidelity® funds.
Marc L. Spector (1972)
Year of Election or Appointment: 2016
Assistant Treasurer
Mr. Spector also serves as an officer of other funds. Mr. Spector serves as Assistant Treasurer of FMR Capital, Inc. (2017-present) and is an employee of Fidelity Investments (2016-present). Prior to joining Fidelity Investments, Mr. Spector served as Director at the Siegfried Group (accounting firm, 2013-2016), and prior to Siegfried Group as audit senior manager at Deloitte & Touche LLP (accounting firm, 2005-2013).
Jim Wegmann (1979)
Year of Election or Appointment: 2019
Assistant Treasurer
Mr. Wegmann also serves as Assistant Treasurer of other funds. Mr. Wegmann is an employee of Fidelity Investments (2011-present).
Shareholder Expense Example
As a shareholder, you incur two types of costs: (1) transaction costs, which may include sales charges (loads) on purchase payments or redemption proceeds, as applicable and (2) ongoing costs, which generally include management fees, distribution and/or service (12b-1) fees and other Fund expenses. This Example is intended to help you understand your ongoing costs (in dollars) of investing in a fund and to compare these costs with the ongoing costs of investing in other mutual funds.
The Example is based on an investment of $1,000 invested at the beginning of the period and held for the entire period (May 1, 2020 to October 31, 2020).
Actual Expenses
The first line of the accompanying table provides information about actual account values and actual expenses. You may use the information in this line, together with the amount you invested, to estimate the expenses that you paid over the period. Simply divide your account value by $1,000.00 (for example, an $8,600 account value divided by $1,000.00 = 8.6), then multiply the result by the number in the first line for a class/Fund under the heading entitled "Expenses Paid During Period" to estimate the expenses you paid on your account during this period. If any fund is a shareholder of any underlying mutual funds or exchange-traded funds (ETFs) (the Underlying Funds), such fund indirectly bears its proportional share of the expenses of the Underlying Funds in addition to the direct expenses incurred presented in the table. These fees and expenses are not included in the annualized expense ratio used to calculate the expense estimate in the table below.
Hypothetical Example for Comparison Purposes
The second line of the accompanying table provides information about hypothetical account values and hypothetical expenses based on the actual expense ratio and an assumed rate of return of 5% per year before expenses, which is not the actual return. The hypothetical account values and expenses may not be used to estimate the actual ending account balance or expenses you paid for the period. You may use this information to compare the ongoing costs of investing in the Fund and other funds. To do so, compare this 5% hypothetical example with the 5% hypothetical examples that appear in the shareholder reports of the other funds. If any fund is a shareholder of any Underlying Funds, such fund indirectly bears its proportional share of the expenses of the Underlying Funds in addition to the direct expenses as presented in the table. These fees and expenses are not included in the annualized expense ratio used to calculate the expense estimate in the table below.
Please note that the expenses shown in the table are meant to highlight your ongoing costs only and do not reflect any transaction costs. Therefore, the second line of the table is useful in comparing ongoing costs only, and will not help you determine the relative total costs of owning different funds. In addition, if these transactional costs were included, your costs would have been higher.
| | Annualized Expense Ratio-A | Beginning
Account Value
May 1, 2020 | Ending
Account Value
October 31, 2020 | Expenses Paid
During Period-B
May 1, 2020
to October 31, 2020 |
| Fidelity Emerging Europe, Middle East, Africa (EMEA) Fund | | | | |
| Class A | 1.55% | | | |
| Actual | | $1,000.00 | $1,097.80 | $8.17 |
| Hypothetical-C | | $1,000.00 | $1,017.34 | $7.86 |
| Class M | 1.80% | | | |
| Actual | | $1,000.00 | $1,095.20 | $9.48 |
| Hypothetical-C | | $1,000.00 | $1,016.09 | $9.12 |
| Class C | 2.30% | | | |
| Actual | | $1,000.00 | $1,093.40 | $12.10 |
| Hypothetical-C | | $1,000.00 | $1,013.57 | $11.64 |
| Emerging Europe, Middle East, Africa (EMEA) | 1.30% | | | |
| Actual | | $1,000.00 | $1,099.20 | $6.86 |
| Hypothetical-C | | $1,000.00 | $1,018.60 | $6.60 |
| Class I | 1.30% | | | |
| Actual | | $1,000.00 | $1,098.00 | $6.86 |
| Hypothetical-C | | $1,000.00 | $1,018.60 | $6.60 |
A Annualized expense ratio reflects expenses net of applicable fee waivers.
B Expenses are equal to the annualized expense ratio, multiplied by the average account value over the period, multiplied by 184/ 366 (to reflect the one-half year period). The fees and expenses of any Underlying Funds are not included in each annualized expense ratio.
C 5% return per year before expenses
Distributions (Unaudited)
Class A designates 85%, Class M designates 92%, Class C designates 100%, Emerging Europe, Middle East Africa (EMEA) designates 81%, and Class I designates 80% of the dividends distributed during the fiscal year as amounts which may be taken into account as a dividend for purposes of the maximum rate under section 1(h)(11) of the Internal Revenue Code.
The amounts per share which represent income derived from sources within, and taxes paid to, foreign countries or possessions of the United States are as follows:
| | Pay Date | Income | Taxes |
| Fidelity Emerging Europe, Middle East, Africa (EMEA) Fund | | | |
| Class A | 12/09/19 | $0.504 | $0.065 |
| Class M | 12/09/19 | $0.467 | $0.065 |
| Class C | 12/09/19 | $0.396 | $0.065 |
| Emerging Europe, Middle East Africa (EMEA) | 12/09/19 | $0.529 | $0.065 |
| Class I | 12/09/19 | $0.540 | $0.065 |
|
The fund will notify shareholders in January 2021 of amounts for use in preparing 2020 income tax returns.
Proxy Voting Results
A special meeting of shareholders was held on June 9, 2020. The results of votes taken among shareholders on the proposals before them are reported below. Each vote reported represents one dollar of net asset value held on the record date for the meeting.
PROPOSAL 1
To elect a Board of Trustees.
| | # of
Votes | % of
Votes |
| Dennis J. Dirks |
| Affirmative | 91,643,443,973.030 | 98.167 |
| Withheld | 1,711,119,384.419 | 1.833 |
| TOTAL | 93,354,563,357.449 | 100.000 |
| Donald F. Donahue |
| Affirmative | 91,659,003,496.045 | 98.184 |
| Withheld | 1,695,559,852.789 | 1.816 |
| TOTAL | 93,354,563,357.449 | 100.000 |
| Bettina Doulton |
| Affirmative | 91,774,146,516.145 | 98.307 |
| Withheld | 1,580,416,862.377 | 1.693 |
| TOTAL | 93,354,563,357.449 | 100.000 |
| Vicki L. Fuller |
| Affirmative | 91,845,419,368.993 | 98.383 |
| Withheld | 1,509,143,998.591 | 1.617 |
| TOTAL | 93,354,563,357.449 | 100.00 |
| Patricia L. Kampling |
| Affirmative | 91,723,732,274.457 | 98.253 |
| Withheld | 1,630,831,098.411 | 1.747 |
| TOTAL | 93,354,563,357.449 | 100.000 |
| Alan J. Lacy |
| Affirmative | 91,490,319,407.772 | 98.003 |
| Withheld | 1,864,243,948.299 | 1.997 |
| TOTAL | 93,354,563,357.449 | 100.000 |
| Ned C. Lautenbach |
| Affirmative | 91,285,367,239.075 | 97.784 |
| Withheld | 2,069,196,119.052 | 2.216 |
| TOTAL | 93,354,563,357.449 | 100.000 |
| Robert A. Lawrence |
| Affirmative | 91,556,271,429.466 | 98.074 |
| Withheld | 1,798,291,912.707 | 1.926 |
| TOTAL | 93,354,563,357.449 | 100.000 |
| Joseph Mauriello |
| Affirmative | 91,497,480,147.082 | 98.011 |
| Withheld | 1,857,083,211.045 | 1.989 |
| TOTAL | 93,354,563,357.449 | 100.000 |
| Cornelia M. Small |
| Affirmative | 91,606,808,161.438 | 98.128 |
| Withheld | 1,747,755,220.497 | 1.872 |
| TOTAL | 93,354,563,357.449 | 100.000 |
| Garnett A. Smith |
| Affirmative | 91,505,784,053.038 | 98.020 |
| Withheld | 1,848,779,305.090 | 1.980 |
| TOTAL | 93,354,563,357.449 | 100.000 |
| David M. Thomas |
| Affirmative | 91,536,969,704.881 | 98.053 |
| Withheld | 1,817,593,630.919 | 1.947 |
| TOTAL | 93,354,563,357.449 | 100.000 |
| Susan Tomasky |
| Affirmative | 91,697,125,678.165 | 98.225 |
| Withheld | 1,657,437,703.277 | 1.775 |
| TOTAL | 93,354,563,357.449 | 100.000 |
| Michael E. Wiley |
| Affirmative | 91,506,805,575.815 | 98.021 |
| Withheld | 1,847,757,759.985 | 1.979 |
| TOTAL | 93,354,563,357.449 | 100.000 |
PROPOSAL 2
To convert a fundamental investment policy to a non-fundamental investment policy.
| | # of
Votes | % of
Votes |
| Affirmative | 28,805,901.093 | 71.003 |
| Against | 3,848,496.948 | 9.486 |
| Abstain | 3,009,461.624 | 7.418 |
| Broker Non-Vote | 4,906,260.912 | 12.093 |
| TOTAL | 40,570,120.576 | 100.000 |
|
| Proposal 1 reflects trust wide proposal and voting results. |
EME-ANN-1220
1.861972.112
Fidelity® Series Emerging Markets Fund
Fidelity® Series Emerging Markets Opportunities Fund
Fidelity® Series International Growth Fund
Fidelity® Series International Small Cap Fund
Fidelity® Series International Value Fund
Annual Report
October 31, 2020
See the inside front cover for important information about access to your fund’s shareholder reports.
Beginning on January 1, 2021, as permitted by regulations adopted by the Securities and Exchange Commission, paper copies of a fund’s shareholder reports will no longer be sent by mail, unless you specifically request paper copies of the reports from the fund or from your financial intermediary, such as a financial advisor, broker-dealer or bank. Instead, the reports will be made available on a website, and you will be notified by mail each time a report is posted and provided with a website link to access the report.
If you already elected to receive shareholder reports electronically, you will not be affected by this change and you need not take any action. You may elect to receive shareholder reports and other communications from a fund electronically, by contacting your financial intermediary. For Fidelity customers, visit Fidelity's web site or call Fidelity using the contact information listed below.
You may elect to receive all future reports in paper free of charge. If you wish to continue receiving paper copies of your shareholder reports, you may contact your financial intermediary or, if you are a Fidelity customer, visit Fidelity’s website, or call Fidelity at the applicable toll-free number listed below. Your election to receive reports in paper will apply to all funds held with the fund complex/your financial intermediary.
| Account Type | Website | Phone Number |
| Brokerage, Mutual Fund, or Annuity Contracts: | fidelity.com/mailpreferences | 1-800-343-3548 |
| Employer Provided Retirement Accounts: | netbenefits.fidelity.com/preferences (choose 'no' under Required Disclosures to continue to print) | 1-800-343-0860 |
| Advisor Sold Accounts Serviced Through Your Financial Intermediary: | Contact Your Financial Intermediary | Your Financial Intermediary's phone number |
| Advisor Sold Accounts Serviced by Fidelity: | institutional.fidelity.com | 1-877-208-0098 |
Contents
To view a fund's proxy voting guidelines and proxy voting record for the 12-month period ended June 30, visit http://www.fidelity.com/proxyvotingresults or visit the Securities and Exchange Commission's (SEC) web site at http://www.sec.gov.
You may also call 1-800-544-8544 to request a free copy of the proxy voting guidelines.
Standard & Poor's, S&P and S&P 500 are registered service marks of The McGraw-Hill Companies, Inc. and have been licensed for use by Fidelity Distributors Corporation.
Other third-party marks appearing herein are the property of their respective owners.
All other marks appearing herein are registered or unregistered trademarks or service marks of FMR LLC or an affiliated company. © 2020 FMR LLC. All rights reserved.
This report and the financial statements contained herein are submitted for the general information of the shareholders of the Funds. This report is not authorized for distribution to prospective investors in the Funds unless preceded or accompanied by an effective prospectus.
A fund files its complete schedule of portfolio holdings with the SEC for the first and third quarters of each fiscal year on Form N-PORT. Forms N-PORT are available on the SEC’s web site at http://www.sec.gov. A fund's Forms N-PORT may be reviewed and copied at the SEC’s Public Reference Room in Washington, DC. Information regarding the operation of the SEC's Public Reference Room may be obtained by calling 1-800-SEC-0330.
For a complete list of a fund's portfolio holdings, view the most recent holdings listing, semiannual report, or annual report on Fidelity's web site at http://www.fidelity.com, http://www.institutional.fidelity.com, or http://www.401k.com, as applicable.
NOT FDIC INSURED •MAY LOSE VALUE •NO BANK GUARANTEE
Neither the Funds nor Fidelity Distributors Corporation is a bank.
Note to Shareholders:
Early in 2020, the outbreak and spread of a new coronavirus emerged as a public health emergency that had a major influence on financial markets, primarily based on its impact on the global economy and the outlook for corporate earnings. The virus causes a respiratory disease known as COVID-19. On March 11, the World Health Organization declared the COVID-19 outbreak a pandemic, citing sustained risk of further global spread.
In the weeks following, as the crisis worsened, we witnessed an escalating human tragedy with wide-scale social and economic consequences from coronavirus-containment measures. The outbreak of COVID-19 prompted a number of measures to limit the spread, including travel and border restrictions, quarantines, and restrictions on large gatherings. In turn, these resulted in lower consumer activity, diminished demand for a wide range of products and services, disruption in manufacturing and supply chains, and – given the wide variability in outcomes regarding the outbreak – significant market uncertainty and volatility. Amid the turmoil, global governments and central banks took unprecedented action – to help support consumers, businesses, and the broader economies, and to limit disruption to financial systems.
The situation continues to unfold, and the extent and duration of its impact on financial markets and the economy remain highly uncertain. Extreme events such as the coronavirus crisis are “exogenous shocks” that can have significant adverse effects on mutual funds and their investments. Although multiple asset classes may be affected by market disruption, the duration and impact may not be the same for all types of assets.
Fidelity is committed to helping you stay informed amid news about COVID-19 and during increased market volatility, and we’re taking extra steps to be responsive to customer needs. We encourage you to visit our websites, where we offer ongoing updates, commentary, and analysis on the markets and our funds.
Fidelity® Series Emerging Markets Fund
Performance: The Bottom Line
Average annual total return reflects the change in the value of an investment, assuming reinvestment of distributions from dividend income and capital gains (the profits earned upon the sale of securities that have grown in value, if any) and assuming a constant rate of performance each year. The hypothetical investment and the average annual total returns do not reflect the deduction of taxes that a shareholder would pay on fund distributions or the redemption of fund shares. During periods of reimbursement by Fidelity, a fund’s total return will be greater than it would be had the reimbursement not occurred. How a fund did yesterday is no guarantee of how it will do tomorrow.
Average Annual Total Returns
| For the periods ended October 31, 2020 | Past 1 year | Life of fundA |
| Fidelity® Series Emerging Markets Fund | 4.16% | (0.39)% |
A From August 29, 2018
$10,000 Over Life of Fund
Let's say hypothetically that $10,000 was invested in Fidelity® Series Emerging Markets Fund on August 29, 2018, when the fund started.
The chart shows how the value of your investment would have changed, and also shows how the MSCI Emerging Markets Index performed over the same period.

| Period Ending Values |
| $9,916 | Fidelity® Series Emerging Markets Fund |
| $10,855 | MSCI Emerging Markets Index |
Fidelity® Series Emerging Markets Fund
Management's Discussion of Fund Performance
Market Recap: The MSCI ACWI (All Country World Index) ex USA Index returned -2.46% for the 12 months ending October 31, 2020, in what was a bumpy ride for non-U.S. equities, marked by a steep but brief decline due to the early-2020 outbreak and spread of the coronavirus, followed by a sharp upturn. Declared a pandemic on March 11, the crisis and containment efforts caused broad contraction in economic activity, elevated volatility and dislocation in financial markets. A historically rapid and expansive monetary- and fiscal-policy response around the world provided a partial offset to the economic disruption. Other supporting factors included resilient corporate earnings and near-term potential for a COVID-19 vaccine breakthrough. This was evident in the index’s 12.28% gain in the final six months of the year. Currency fluctuation generally boosted foreign developed-markets equities for the year, while the reverse was true for emerging-markets stocks. Late in the period, the index was pressured by a second wave of COVID-19 cases in some regions, and stretched valuations and crowded positioning in big tech. For the full year, the U.K. (-22%), Asia Pacific ex Japan (-8%), Canada (-5%) and Europe ex U.K. (-4%) notably lagged. Emerging markets (+9%) and Japan (+1%) outperformed. By sector, energy (-38%), financials and real estate (-20% each) lagged, whereas information technology (+ 25%) and communication services (+15%) topped the index.
Comments from Portfolio Manager John Chow: For the fiscal year ending October 31, 2020, the fund gained 4.16%, trailing the 8.27% result of the benchmark MSCI Emerging Markets (Net MA) index. From a regional standpoint, an underweighting in China, along with stock picks in India, South Korea and Hong Kong, hurt the fund's relative result. Among sectors, security selection was the primary detractor versus the benchmark, especially within the financials sector, followed by information technology, communication services and real estate. The biggest individual relative detractor was an underweight position in Alibaba Group Holding (+39%), which was among our biggest holdings. Also hampering relative performance was our out-of-benchmark position in Pilipinas Shell Petroleum (-50%). Lastly, Amorepacific, which I sold, returned approximately -36% while we held it and further pressured the portfolio’s result versus the benchmark. In contrast, stock picks in China and Taiwan contributed most to the fund's relative result. By sector, the top contributor to performance versus the benchmark was security selection in industrials, primarily driven by the capital goods industry. An underweighting in utilities and picks among consumer discretionary stocks also lifted the fund's relative result. The largest individual relative contributor was our outsized stake in Vinda International Holdings, which gained about 48%. This is a position that was sold the past year. Also helping performance was our outsized stake in Shenzhen Inovance Technology, which gained roughly 158%, though we decreased our position in the company the past 12 months. Another notable relative contributor was our overweighting in JD.com (+168%). Notable changes in positioning include a higher allocation to China and South Korea. By sector, meaningful changes in positioning include increased exposure to consumer discretionary and a lower allocation to industrials.
The views expressed above reflect those of the portfolio manager(s) only through the end of the period as stated on the cover of this report and do not necessarily represent the views of Fidelity or any other person in the Fidelity organization. Any such views are subject to change at any time based upon market or other conditions and Fidelity disclaims any responsibility to update such views. These views may not be relied on as investment advice and, because investment decisions for a Fidelity fund are based on numerous factors, may not be relied on as an indication of trading intent on behalf of any Fidelity fund.
Fidelity® Series Emerging Markets Fund
Investment Summary (Unaudited)
Geographic Diversification (% of fund's net assets)
| As of October 31, 2020 |
| | Cayman Islands | 30.0% |
| | China | 13.5% |
| | Korea (South) | 12.7% |
| | Taiwan | 10.1% |
| | India | 9.4% |
| | Brazil | 5.8% |
| | United States of America* | 3.9% |
| | South Africa | 3.1% |
| | Mexico | 1.8% |
| | Other | 9.7% |
* Includes Short-Term investments and Net Other Assets (Liabilities).
Percentages are based on country or territory of incorporation and are adjusted for the effect of futures contracts, if applicable.
Asset Allocation as of October 31, 2020
| | % of fund's net assets |
| Stocks and Equity Futures | 98.1 |
| Short-Term Investments and Net Other Assets (Liabilities) | 1.9 |
Top Ten Stocks as of October 31, 2020
| | % of fund's net assets |
| Alibaba Group Holding Ltd. sponsored ADR (Cayman Islands, Internet & Direct Marketing Retail) | 9.2 |
| Tencent Holdings Ltd. (Cayman Islands, Interactive Media & Services) | 7.5 |
| Taiwan Semiconductor Manufacturing Co. Ltd. (Taiwan, Semiconductors & Semiconductor Equipment) | 6.2 |
| Samsung Electronics Co. Ltd. (Korea (South), Technology Hardware, Storage & Peripherals) | 4.6 |
| Reliance Industries Ltd. (India, Oil, Gas & Consumable Fuels) | 2.9 |
| JD.com, Inc. sponsored ADR (Cayman Islands, Internet & Direct Marketing Retail) | 2.2 |
| Meituan Class B (Cayman Islands, Internet & Direct Marketing Retail) | 2.0 |
| MediaTek, Inc. (Taiwan, Semiconductors & Semiconductor Equipment) | 1.9 |
| Shenzhen Mindray Bio-Medical Electronics Co. Ltd. (A Shares) (China, Health Care Equipment & Supplies) | 1.6 |
| LG Chemical Ltd. (Korea (South), Chemicals) | 1.5 |
| | 39.6 |
Top Market Sectors as of October 31, 2020
| | % of fund's net assets |
| Consumer Discretionary | 20.4 |
| Information Technology | 18.9 |
| Financials | 17.6 |
| Communication Services | 12.9 |
| Energy | 5.7 |
| Consumer Staples | 5.9 |
| Materials | 5.5 |
| Industrials | 3.6 |
| Health Care | 3.5 |
| Real Estate | 1.3 |
Fidelity® Series Emerging Markets Fund
Schedule of Investments October 31, 2020
Showing Percentage of Net Assets
| Common Stocks - 94.2% | | | |
| | | Shares | Value |
| Bermuda - 0.6% | | | |
| China Gas Holdings Ltd. | | 5,503,200 | $16,859,207 |
| Brazil - 4.0% | | | |
| Azul SA sponsored ADR (a)(b) | | 114,460 | 1,356,351 |
| B2W Companhia Global do Varejo (a) | | 228,000 | 2,989,695 |
| Banco do Brasil SA | | 1,202,400 | 6,244,655 |
| BM&F BOVESPA SA | | 3,413,400 | 30,368,698 |
| Natura & Co. Holding SA | | 3,550,766 | 28,527,665 |
| Petroleo Brasileiro SA - Petrobras (ON) | | 5,770,000 | 19,106,127 |
| Rumo SA (a) | | 2,323,670 | 7,427,062 |
| Suzano Papel e Celulose SA (a) | | 1,722,000 | 15,020,364 |
| Vale SA | | 874,000 | 9,222,928 |
|
| TOTAL BRAZIL | | | 120,263,545 |
|
| Cayman Islands - 30.0% | | | |
| Airtac International Group | | 622,000 | 16,697,403 |
| Alibaba Group Holding Ltd. sponsored ADR (a) | | 899,570 | 274,089,982 |
| Anta Sports Products Ltd. | | 471,000 | 5,182,367 |
| Baidu.com, Inc. sponsored ADR (a) | | 119,305 | 15,873,530 |
| Bilibili, Inc. ADR (a) | | 415,300 | 18,551,451 |
| China Yongda Automobiles Services Holdings Ltd. | | 11,391,000 | 16,103,884 |
| Ctrip.com International Ltd. ADR (a) | | 494,800 | 14,230,448 |
| Hansoh Pharmaceutical Group Co. Ltd. (a)(c) | | 1,932,325 | 8,611,652 |
| JD.com, Inc.: | | | |
| Class A | | 330,450 | 13,478,566 |
| sponsored ADR (a) | | 627,522 | 51,155,593 |
| Li Ning Co. Ltd. | | 5,334,500 | 27,524,025 |
| Longfor Properties Co. Ltd. (c) | | 1,855,500 | 10,136,140 |
| Meituan Class B (a) | | 1,633,800 | 60,736,686 |
| NetEase, Inc. ADR | | 126,955 | 11,018,424 |
| New Oriental Education & Technology Group, Inc. sponsored ADR (a) | | 173,860 | 27,883,667 |
| Pinduoduo, Inc. ADR (a) | | 156,300 | 14,063,874 |
| Shenzhou International Group Holdings Ltd. | | 553,400 | 9,558,241 |
| Sino Biopharmaceutical Ltd. | | 4,523,000 | 4,562,381 |
| Sunny Optical Technology Group Co. Ltd. | | 1,274,500 | 21,075,898 |
| TAL Education Group ADR (a) | | 151,700 | 10,081,982 |
| Tencent Holdings Ltd. | | 2,944,025 | 224,940,156 |
| Xiaomi Corp. Class B (a)(c) | | 4,739,200 | 13,478,451 |
| XPeng, Inc. ADR (a)(b) | | 692,400 | 13,418,712 |
| Zai Lab Ltd. (a) | | 114,000 | 9,484,682 |
| ZTO Express, Inc. (a) | | 216,000 | 6,385,966 |
|
| TOTAL CAYMAN ISLANDS | | | 898,324,161 |
|
| Chile - 0.8% | | | |
| Sociedad Quimica y Minera de Chile SA (PN-B) sponsored ADR (b) | | 614,815 | 22,754,303 |
| China - 13.5% | | | |
| Angel Yeast Co. Ltd. (A Shares) | | 2,519,214 | 19,913,954 |
| Bank of China Ltd. (H Shares) | | 17,557,000 | 5,545,577 |
| China Construction Bank Corp. (H Shares) | | 48,731,800 | 33,581,733 |
| China Life Insurance Co. Ltd. (H Shares) | | 10,656,000 | 23,250,598 |
| China Merchants Bank Co. Ltd. (H Shares) | | 3,644,500 | 18,945,289 |
| China Oilfield Services Ltd. (H Shares) | | 12,968,000 | 7,795,018 |
| China Pacific Insurance (Group) Co. Ltd. (H Shares) | | 1,250,800 | 3,896,397 |
| China Petroleum & Chemical Corp. (H Shares) | | 14,228,000 | 5,555,622 |
| Guangzhou Automobile Group Co. Ltd. (H Shares) | | 4,862,000 | 4,985,863 |
| Haier Smart Home Co. Ltd. (A Shares) | | 1,705,000 | 6,351,303 |
| Hangzhou Tigermed Consulting Co. Ltd. (H Shares) (a)(c) | | 950,200 | 15,259,581 |
| Industrial & Commercial Bank of China Ltd. (H Shares) | | 29,448,000 | 16,722,476 |
| Kweichow Moutai Co. Ltd. (A Shares) | | 56,276 | 14,076,152 |
| Midea Group Co. Ltd. (A Shares) | | 2,279,964 | 26,637,460 |
| Nongfu Spring Co. Ltd. (H Shares) (a) | | 1,192,400 | 5,460,200 |
| Ping An Insurance Group Co. of China Ltd. (H Shares) | | 2,752,700 | 28,462,019 |
| Sany Heavy Industry Co. Ltd. (A Shares) | | 8,234,114 | 32,035,064 |
| Shanghai Bairun Investment Holding Group Co. Ltd. (A Shares) | | 2,170,236 | 21,659,335 |
| Shenzhen Inovance Technology Co. Ltd. (A Shares) | | 2,708,860 | 26,070,157 |
| Shenzhen Mindray Bio-Medical Electronics Co. Ltd. (A Shares) | | 810,128 | 46,947,605 |
| Tsingtao Brewery Co. Ltd. (H Shares) | | 1,686,000 | 13,929,481 |
| WuXi AppTec Co. Ltd. (H Shares) (c) | | 1,090,200 | 17,367,262 |
| Yantai Jereh Oilfield Services (A Shares) | | 2,254,891 | 9,050,777 |
|
| TOTAL CHINA | | | 403,498,923 |
|
| Hong Kong - 1.1% | | | |
| China Mobile Ltd. | | 2,292,500 | 14,022,169 |
| China Overseas Land and Investment Ltd. | | 4,038,500 | 10,106,017 |
| CNOOC Ltd. | | 10,476,000 | 9,585,077 |
|
| TOTAL HONG KONG | | | 33,713,263 |
|
| India - 9.4% | | | |
| Axis Bank Ltd. (a) | | 3,880,115 | 25,567,169 |
| Axis Bank Ltd. GDR (Reg. S) (a) | | 127,376 | 4,139,720 |
| Bharti Airtel Ltd. | | 4,340,410 | 25,227,879 |
| HDFC Bank Ltd. | | 200,000 | 3,175,029 |
| HDFC Bank Ltd. sponsored ADR (a) | | 388,121 | 22,293,670 |
| Hemisphere Properties India Ltd. (a) | | 5,529,302 | 5,053,804 |
| Housing Development Finance Corp. Ltd. | | 1,214,379 | 31,317,937 |
| ICICI Bank Ltd. (a) | | 3,880,372 | 20,289,761 |
| Indraprastha Gas Ltd. | | 1,234,640 | 6,664,118 |
| Infosys Ltd. | | 1,200,374 | 17,095,861 |
| Kotak Mahindra Bank Ltd. (a) | | 714,976 | 14,831,949 |
| Reliance Industries Ltd. | | 201,306 | 3,189,111 |
| Reliance Industries Ltd. | | 3,019,600 | 83,220,842 |
| Shriram Transport Finance Co. Ltd. | | 1,733,920 | 16,115,382 |
| Tech Mahindra Ltd. | | 421,878 | 4,617,739 |
|
| TOTAL INDIA | | | 282,799,971 |
|
| Indonesia - 1.4% | | | |
| PT Bank Central Asia Tbk | | 12,545,000 | 24,684,242 |
| PT Bank Mandiri (Persero) Tbk | | 47,070,700 | 18,335,493 |
| PT Telekomunikasi Indonesia Tbk Series B | | 90 | 16 |
|
| TOTAL INDONESIA | | | 43,019,751 |
|
| Korea (South) - 12.7% | | | |
| Hana Financial Group, Inc. | | 810,009 | 21,832,347 |
| Hyundai Fire & Marine Insurance Co. Ltd. | | 490,133 | 10,072,950 |
| Hyundai Motor Co. | | 66,619 | 9,730,033 |
| Kakao Corp. | | 22,365 | 6,507,124 |
| KB Financial Group, Inc. | | 624,901 | 22,303,545 |
| LG Chemical Ltd. | | 82,344 | 44,802,131 |
| LG Household & Health Care Ltd. | | 4,364 | 5,773,444 |
| LG Innotek Co. Ltd. | | 86,457 | 11,694,963 |
| NAVER Corp. | | 23,342 | 5,959,437 |
| POSCO | | 128,881 | 23,739,771 |
| Samsung Electronics Co. Ltd. | | 2,752,993 | 138,077,316 |
| Samsung SDI Co. Ltd. | | 91,312 | 35,892,190 |
| SK Hynix, Inc. | | 630,834 | 44,654,991 |
|
| TOTAL KOREA (SOUTH) | | | 381,040,242 |
|
| Mexico - 1.8% | | | |
| Fomento Economico Mexicano S.A.B. de CV unit | | 892,908 | 4,785,834 |
| Gruma S.A.B. de CV Series B | | 1,330,898 | 14,155,713 |
| Grupo Aeroportuario Norte S.A.B. de CV (a) | | 1,629,300 | 7,352,455 |
| Grupo Financiero Banorte S.A.B. de CV Series O (a) | | 4,975,456 | 22,166,306 |
| Wal-Mart de Mexico SA de CV Series V | | 2,338,977 | 5,651,301 |
|
| TOTAL MEXICO | | | 54,111,609 |
|
| Netherlands - 1.1% | | | |
| X5 Retail Group NV GDR (Reg. S) | | 183,347 | 6,442,814 |
| Yandex NV Series A (a) | | 438,682 | 25,254,923 |
|
| TOTAL NETHERLANDS | | | 31,697,737 |
|
| Philippines - 0.8% | | | |
| Ayala Land, Inc. | | 23,893,200 | 16,215,404 |
| Pilipinas Shell Petroleum Corp. (a) | | 25,482,310 | 8,654,091 |
|
| TOTAL PHILIPPINES | | | 24,869,495 |
|
| Poland - 0.8% | | | |
| CD Projekt RED SA (a) | | 268,709 | 22,766,887 |
| Qatar - 0.3% | | | |
| Qatar National Bank SAQ | | 1,562,000 | 7,593,353 |
| Russia - 1.5% | | | |
| Lukoil PJSC | | 241,521 | 12,346,815 |
| MMC Norilsk Nickel PJSC | | 28,287 | 6,732,522 |
| Sberbank of Russia | | 10,205,367 | 25,865,073 |
|
| TOTAL RUSSIA | | | 44,944,410 |
|
| South Africa - 3.1% | | | |
| Absa Group Ltd. | | 1,990,529 | 10,700,068 |
| AngloGold Ashanti Ltd. | | 540,364 | 12,452,938 |
| Capitec Bank Holdings Ltd. | | 251,328 | 17,663,251 |
| Impala Platinum Holdings Ltd. | | 3,060,086 | 27,235,757 |
| Naspers Ltd. Class N | | 128,574 | 25,101,189 |
|
| TOTAL SOUTH AFRICA | | | 93,153,203 |
|
| Taiwan - 10.1% | | | |
| E.SUN Financial Holdings Co. Ltd. | | 13,666,299 | 11,607,923 |
| eMemory Technology, Inc. | | 455,000 | 9,065,329 |
| Hon Hai Precision Industry Co. Ltd. (Foxconn) | | 4,644,000 | 12,580,307 |
| International Games Systems Co. Ltd. | | 548,000 | 14,404,418 |
| Largan Precision Co. Ltd. | | 43,000 | 4,546,646 |
| MediaTek, Inc. | | 2,380,000 | 56,403,230 |
| Realtek Semiconductor Corp. | | 815,000 | 10,127,320 |
| Taiwan Semiconductor Manufacturing Co. Ltd. | | 12,218,000 | 184,818,832 |
|
| TOTAL TAIWAN | | | 303,554,005 |
|
| Thailand - 1.0% | | | |
| CP ALL PCL (For. Reg.) | | 6,485,600 | 11,164,081 |
| Thai Beverage PCL | | 44,499,500 | 18,924,232 |
|
| TOTAL THAILAND | | | 30,088,313 |
|
| United Arab Emirates - 0.2% | | | |
| National Bank of Abu Dhabi PJSC | | 1,882,569 | 5,873,498 |
| TOTAL COMMON STOCKS | | | |
| (Cost $2,345,769,760) | | | 2,820,925,876 |
|
| Nonconvertible Preferred Stocks - 1.9% | | | |
| Brazil - 1.8% | | | |
| Azul SA (a) | | 2,302,500 | 9,048,767 |
| Banco Bradesco SA (PN) | | 1,545,920 | 5,431,513 |
| Itau Unibanco Holding SA | | 6,069,500 | 24,836,720 |
| Petroleo Brasileiro SA - Petrobras: | | | |
| (PN) sponsored ADR (non-vtg.) | | 1,267,520 | 8,378,307 |
| sponsored ADR | | 755,200 | 5,006,976 |
|
| TOTAL BRAZIL | | | 52,702,283 |
|
| Chile - 0.1% | | | |
| Sociedad Quimica y Minera de Chile SA (PN-B) | | 125,955 | 4,601,356 |
| TOTAL NONCONVERTIBLE PREFERRED STOCKS | | | |
| (Cost $70,109,590) | | | 57,303,639 |
| | | Principal Amount | Value |
|
| Government Obligations - 0.2% | | | |
| United States of America - 0.2% | | | |
U.S. Treasury Bills, yield at date of purchase 0.09% to 0.1% 11/19/20 to 11/27/20
(Cost $5,539,634)(d) | | 5,540,000 | 5,539,685 |
| | | Shares | Value |
|
| Money Market Funds - 2.0% | | | |
| Fidelity Cash Central Fund 0.10% (e) | | 39,076,032 | 39,083,848 |
| Fidelity Securities Lending Cash Central Fund 0.11% (e)(f) | | 21,645,185 | 21,647,350 |
| TOTAL MONEY MARKET FUNDS | | | |
| (Cost $60,731,198) | | | 60,731,198 |
| TOTAL INVESTMENT IN SECURITIES - 98.3% | | | |
| (Cost $2,482,150,182) | | | 2,944,500,398 |
| NET OTHER ASSETS (LIABILITIES) - 1.7% | | | 51,374,590 |
| NET ASSETS - 100% | | | $2,995,874,988 |
| Futures Contracts | | | | | |
| | Number of contracts | Expiration Date | Notional Amount | Value | Unrealized Appreciation/(Depreciation) |
| Purchased | | | | | |
| Equity Index Contracts | | | | | |
| ICE E-mini MSCI Emerging Markets Index Contracts (United States) | 1,099 | Dec. 2020 | $60,549,405 | $62,439 | $62,439 |
The notional amount of futures purchased as a percentage of Net Assets is 2.0%
Categorizations in the Schedule of Investments are based on country or territory of incorporation.
Legend
(a) Non-income producing
(b) Security or a portion of the security is on loan at period end.
(c) Security exempt from registration under Rule 144A of the Securities Act of 1933. These securities may be resold in transactions exempt from registration, normally to qualified institutional buyers. At the end of the period, the value of these securities amounted to $64,853,086 or 2.2% of net assets.
(d) Security or a portion of the security was pledged to cover margin requirements for futures contracts. At period end, the value of securities pledged amounted to $499,978.
(e) Affiliated fund that is generally available only to investment companies and other accounts managed by Fidelity Investments. The rate quoted is the annualized seven-day yield of the fund at period end. A complete unaudited listing of the fund's holdings as of its most recent quarter end is available upon request. In addition, each Fidelity Central Fund's financial statements, which are not covered by the Fund's Report of Independent Registered Public Accounting Firm, are available on the SEC's website or upon request.
(f) Investment made with cash collateral received from securities on loan.
Affiliated Central Funds
Information regarding fiscal year to date income earned by the Fund from investments in Fidelity Central Funds is as follows:
| Fund | Income earned |
| Fidelity Cash Central Fund | $917,944 |
| Fidelity Securities Lending Cash Central Fund | 32,499 |
| Total | $950,443 |
Amounts in the income column in the above table include any capital gain distributions from underlying funds, which are presented in the corresponding line-item in the Statement of Operations, if applicable. Amount for Fidelity Securities Lending Cash Central Fund represents the income earned on investing cash collateral, less rebates paid to borrowers and any lending agent fees associated with the loan, plus any premium payments received for lending certain types of securities.
Other Affiliated Issuers
An affiliated company is a company in which the Fund has ownership of at least 5% of the voting securities. Fiscal year to date transactions with companies which are or were affiliates are as follows:
| Affiliate | Value, beginning of period | Purchases(a) | Sales Proceeds | Dividend Income | Realized Gain (loss) | Change in Unrealized appreciation (depreciation) | Value, end of period |
| City Lodge Hotels Ltd. | $15,272,162 | $712,913 | $11,230,003 | $-- | $(15,147,367) | $10,392,295 | $-- |
| Delfi Ltd. | 21,819,194 | 3,085,719 | 18,615,671 | 237,873 | (9,156,310) | 2,867,068 | -- |
| SH Kelkar & Co. Ltd. | 16,015,747 | -- | 8,082,069 | 105,930 | (11,888,786) | 3,955,108 | -- |
| TK Group Holdings Ltd. | 18,251,918 | 1,372,722 | 12,872,824 | 403,262 | (10,443,879) | 3,692,063 | -- |
| Total | $71,359,021 | $5,171,354 | $50,800,567 | $747,065 | $(46,636,342) | $20,906,534 | $-- |
(a) Includes the value of securities received through in-kind transactions, if applicable.
Investment Valuation
The following is a summary of the inputs used, as of October 31, 2020, involving the Fund's assets and liabilities carried at fair value. The inputs or methodology used for valuing securities may not be an indication of the risk associated with investing in those securities. For more information on valuation inputs, and their aggregation into the levels used below, please refer to the Investment Valuation section in the accompanying Notes to Financial Statements.
| | Valuation Inputs at Reporting Date: |
| Description | Total | Level 1 | Level 2 | Level 3 |
| Investments in Securities: | | | | |
| Equities: | | | | |
| Communication Services | $384,526,414 | $107,869,633 | $276,656,781 | $-- |
| Consumer Discretionary | 613,303,570 | 532,005,019 | 81,298,551 | -- |
| Consumer Staples | 170,464,206 | 78,953,008 | 91,511,198 | -- |
| Energy | 171,888,763 | 40,286,428 | 131,602,335 | -- |
| Financials | 533,714,341 | 163,397,742 | 370,316,599 | -- |
| Health Care | 102,233,163 | 55,285,558 | 46,947,605 | -- |
| Industrials | 106,373,225 | 48,268,004 | 58,105,221 | -- |
| Information Technology | 564,129,073 | 113,798,730 | 450,330,343 | -- |
| Materials | 166,562,070 | 51,598,951 | 114,963,119 | -- |
| Real Estate | 41,511,365 | 20,242,157 | 21,269,208 | -- |
| Utilities | 23,523,325 | 16,859,207 | 6,664,118 | -- |
| Government Obligations | 5,539,685 | -- | 5,539,685 | -- |
| Money Market Funds | 60,731,198 | 60,731,198 | -- | -- |
| Total Investments in Securities: | $2,944,500,398 | $1,289,295,635 | $1,655,204,763 | $-- |
| Derivative Instruments: | | | | |
| Assets | | | | |
| Futures Contracts | $62,439 | $62,439 | $-- | $-- |
| Total Assets | $62,439 | $62,439 | $-- | $-- |
| Total Derivative Instruments: | $62,439 | $62,439 | $-- | $-- |
Value of Derivative Instruments
The following table is a summary of the Fund's value of derivative instruments by primary risk exposure as of October 31, 2020. For additional information on derivative instruments, please refer to the Derivative Instruments section in the accompanying Notes to Financial Statements.
| Primary Risk Exposure / Derivative Type | Value |
| | Asset | Liability |
| Equity Risk | | |
| Futures Contracts(a) | $62,439 | $0 |
| Total Equity Risk | 62,439 | 0 |
| Total Value of Derivatives | $62,439 | $0 |
(a) Reflects gross cumulative appreciation (depreciation) on futures contracts as presented in the Schedule of Investments. In the Statement of Assets and Liabilities, the period end daily variation margin is included in receivable or payable for daily variation margin on futures contracts, and the net cumulative appreciation (depreciation) is included in Total accumulated earnings (loss).
See accompanying notes which are an integral part of the financial statements.
Fidelity® Series Emerging Markets Fund
Financial Statements
Statement of Assets and Liabilities
| | | October 31, 2020 |
| Assets | | |
Investment in securities, at value (including securities loaned of $20,546,019) — See accompanying schedule:
Unaffiliated issuers (cost $2,421,418,984) | $2,883,769,200 | |
| Fidelity Central Funds (cost $60,731,198) | 60,731,198 | |
| Total Investment in Securities (cost $2,482,150,182) | | $2,944,500,398 |
| Foreign currency held at value (cost $5,130,159) | | 5,137,163 |
| Receivable for investments sold | | 114,082,940 |
| Receivable for fund shares sold | | 1,035,932 |
| Dividends receivable | | 1,744,640 |
| Distributions receivable from Fidelity Central Funds | | 7,072 |
| Receivable from investment adviser for expense reductions | | 71,553 |
| Other receivables | | 1,093,897 |
| Total assets | | 3,067,673,595 |
| Liabilities | | |
| Payable for investments purchased | $25,222,976 | |
| Payable for fund shares redeemed | 21,960,135 | |
| Payable for daily variation margin on futures contracts | 71,328 | |
| Other payables and accrued expenses | 2,896,818 | |
| Collateral on securities loaned | 21,647,350 | |
| Total liabilities | | 71,798,607 |
| Net Assets | | $2,995,874,988 |
| Net Assets consist of: | | |
| Paid in capital | | $2,817,037,365 |
| Total accumulated earnings (loss) | | 178,837,623 |
| Net Assets | | $2,995,874,988 |
| Net Asset Value, offering price and redemption price per share ($2,995,874,988 ÷ 310,420,420 shares) | | $9.65 |
See accompanying notes which are an integral part of the financial statements.
Statement of Operations
| | | Year ended October 31, 2020 |
| Investment Income | | |
| Dividends (including $747,065 earned from other affiliated issuers) | | $51,456,123 |
| Interest | | 32,882 |
| Income from Fidelity Central Funds (including $32,499 from security lending) | | 950,443 |
| Income before foreign taxes withheld | | 52,439,448 |
| Less foreign taxes withheld | | (5,629,296) |
| Total income | | 46,810,152 |
| Expenses | | |
| Custodian fees and expenses | $1,147,907 | |
| Independent trustees' fees and expenses | 13,275 | |
| Interest | 444 | |
| Miscellaneous | 5,652 | |
| Total expenses before reductions | 1,167,278 | |
| Expense reductions | (807,694) | |
| Total expenses after reductions | | 359,584 |
| Net investment income (loss) | | 46,450,568 |
| Realized and Unrealized Gain (Loss) | | |
| Net realized gain (loss) on: | | |
| Investment securities: | | |
| Unaffiliated issuers (net of foreign taxes of $70,971) | (253,177,902) | |
| Fidelity Central Funds | 27,676 | |
| Other affiliated issuers | (46,636,342) | |
| Foreign currency transactions | (2,020,753) | |
| Futures contracts | (5,720,685) | |
| Total net realized gain (loss) | | (307,528,006) |
| Change in net unrealized appreciation (depreciation) on: | | |
| Investment securities: | | |
| Unaffiliated issuers (net of increase in deferred foreign taxes of $2,586,760) | 449,307,800 | |
| Fidelity Central Funds | (533) | |
| Other affiliated issuers | 20,906,534 | |
| Assets and liabilities in foreign currencies | 17,531 | |
| Futures contracts | (62,022) | |
| Total change in net unrealized appreciation (depreciation) | | 470,169,310 |
| Net gain (loss) | | 162,641,304 |
| Net increase (decrease) in net assets resulting from operations | | $209,091,872 |
See accompanying notes which are an integral part of the financial statements.
Statement of Changes in Net Assets
| | Year ended October 31, 2020 | Year ended October 31, 2019 |
| Increase (Decrease) in Net Assets | | |
| Operations | | |
| Net investment income (loss) | $46,450,568 | $54,432,890 |
| Net realized gain (loss) | (307,528,006) | (3,519,948) |
| Change in net unrealized appreciation (depreciation) | 470,169,310 | 62,942,738 |
| Net increase (decrease) in net assets resulting from operations | 209,091,872 | 113,855,680 |
| Distributions to shareholders | (52,999,079) | (6,416,055) |
| Share transactions | | |
| Proceeds from sales of shares | 1,051,915,311 | 666,589,712 |
| Reinvestment of distributions | 52,999,079 | 6,416,055 |
| Cost of shares redeemed | (330,297,414) | (146,297,320) |
| Net increase (decrease) in net assets resulting from share transactions | 774,616,976 | 526,708,447 |
| Total increase (decrease) in net assets | 930,709,769 | 634,148,072 |
| Net Assets | | |
| Beginning of period | 2,065,165,219 | 1,431,017,147 |
| End of period | $2,995,874,988 | $2,065,165,219 |
| Other Information | | |
| Shares | | |
| Sold | 123,836,770 | 71,139,663 |
| Issued in reinvestment of distributions | 5,532,263 | 710,527 |
| Redeemed | (36,708,531) | (15,482,137) |
| Net increase (decrease) | 92,660,502 | 56,368,053 |
See accompanying notes which are an integral part of the financial statements.
Financial Highlights
Fidelity Series Emerging Markets Fund
| | | | |
| Years ended October 31, | 2020 | 2019 | 2018 A |
| Selected Per–Share Data | | | |
| Net asset value, beginning of period | $9.48 | $8.87 | $10.00 |
| Income from Investment Operations | | | |
| Net investment income (loss)B | .17 | .30C | .01 |
| Net realized and unrealized gain (loss) | .22 | .35 | (1.14) |
| Total from investment operations | .39 | .65 | (1.13) |
| Distributions from net investment income | (.22) | (.04) | – |
| Total distributions | (.22) | (.04) | – |
| Net asset value, end of period | $9.65 | $9.48 | $8.87 |
| Total ReturnD,E | 4.16% | 7.33% | (11.30)% |
| Ratios to Average Net AssetsF,G | | | |
| Expenses before reductions | .05% | .04% | .04%H |
| Expenses net of fee waivers, if any | .01% | .01% | .01%H |
| Expenses net of all reductions | .01% | .01% | .01%H |
| Net investment income (loss) | 1.86% | 3.24%C | .65%H |
| Supplemental Data | | | |
| Net assets, end of period (000 omitted) | $2,995,875 | $2,065,165 | $1,431,017 |
| Portfolio turnover rateI | 117%J | 47% | 15%J,K |
A For the period August 29, 2018 (commencement of operations) to October 31, 2018.
B Calculated based on average shares outstanding during the period.
C Net investment income per share reflects one or more large, non-recurring dividend which amounted to $.07 per share. Excluding such non-recurring dividend, the ratio of net investment income (loss) to average net assets would have been 2.50%.
D Total returns for periods of less than one year are not annualized.
E Total returns would have been lower if certain expenses had not been reduced during the applicable periods shown.
F Fees and expenses of any underlying mutual funds or exchange-traded funds (ETFs) are not included in the Fund's expense ratio. The Fund indirectly bears its proportionate share of these expenses. For additional expense information related to investments in Fidelity Central Funds, please refer to the "Investments in Fidelity Central Funds" note found in the Notes to Financial Statements section of the most recent Annual or Semi-Annual report.
G Expense ratios reflect operating expenses of the class. Expenses before reductions do not reflect amounts reimbursed, waived, or reduced through arrangements with the investment advisor, brokerage services, or other offset arrangements, if applicable, and do not represent the amount paid by the class during periods when reimbursements, waivers or reductions occur.
H Annualized
I Amount does not include the portfolio activity of any underlying mutual funds or exchange-traded funds (ETFs).
J Portfolio turnover rate excludes securities received or delivered in-kind.
K Amount not annualized.
See accompanying notes which are an integral part of the financial statements.
Fidelity® Series Emerging Markets Opportunities Fund
Performance: The Bottom Line
Average annual total return reflects the change in the value of an investment, assuming reinvestment of distributions from dividend income and capital gains (the profits earned upon the sale of securities that have grown in value, if any) and assuming a constant rate of performance each year. The hypothetical investment and the average annual total returns do not reflect the deduction of taxes that a shareholder would pay on fund distributions or the redemption of fund shares. During periods of reimbursement by Fidelity, a fund’s total return will be greater than it would be had the reimbursement not occurred. How a fund did yesterday is no guarantee of how it will do tomorrow.
Average Annual Total Returns
| For the periods ended October 31, 2020 | Past 1 year | Past 5 years | Past 10 years |
| Fidelity® Series Emerging Markets Opportunities Fund | 13.66% | 10.75% | 4.25% |
$10,000 Over 10 Years
Let's say hypothetically that $10,000 was invested in Fidelity® Series Emerging Markets Opportunities Fund on October 31, 2010.
The chart shows how the value of your investment would have changed, and also shows how the MSCI Emerging Markets Index performed over the same period.
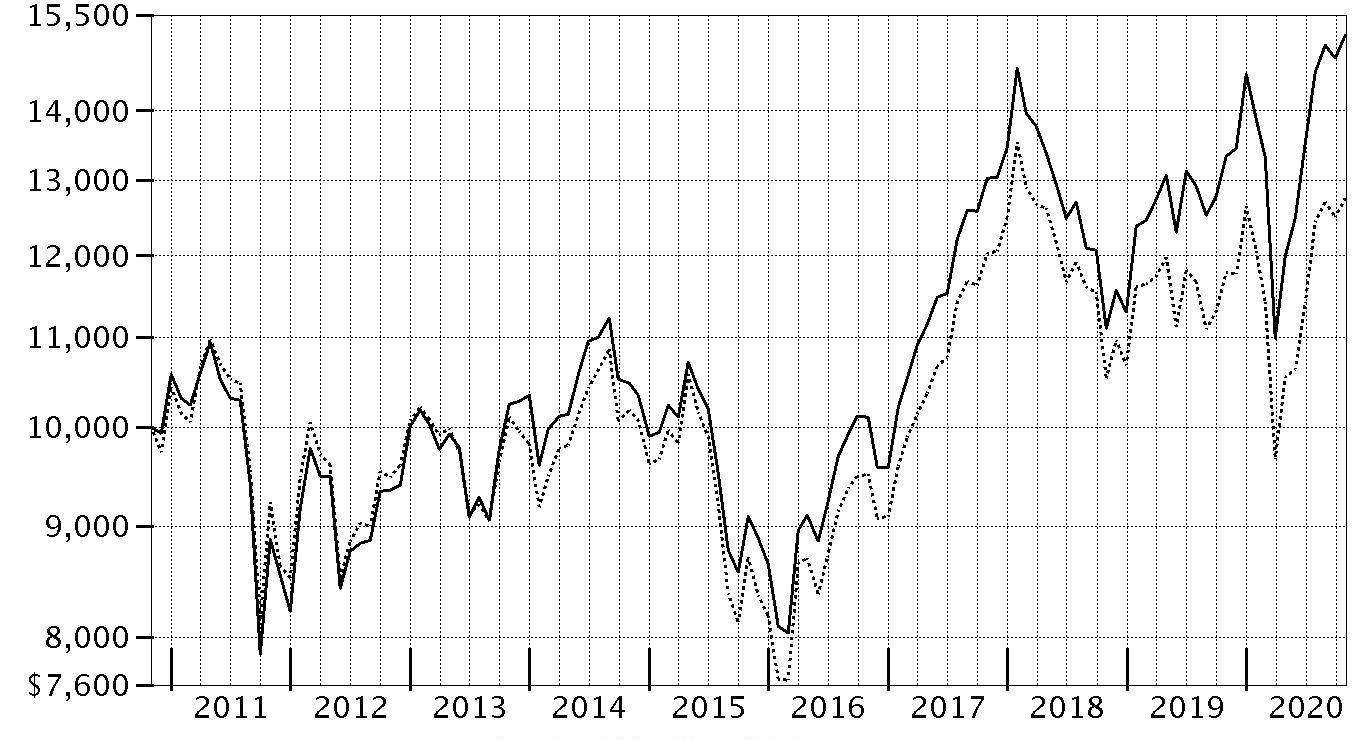
| Period Ending Values |
| $15,162 | Fidelity® Series Emerging Markets Opportunities Fund |
| $12,759 | MSCI Emerging Markets Index |
Fidelity® Series Emerging Markets Opportunities Fund
Management's Discussion of Fund Performance
Market Recap: The MSCI ACWI (All Country World Index) ex USA Index returned -2.46% for the 12 months ending October 31, 2020, in what was a bumpy ride for non-U.S. equities, marked by a steep but brief decline due to the early-2020 outbreak and spread of the coronavirus, followed by a sharp upturn. Declared a pandemic on March 11, the crisis and containment efforts caused broad contraction in economic activity, elevated volatility and dislocation in financial markets. A historically rapid and expansive monetary- and fiscal-policy response around the world provided a partial offset to the economic disruption.Other supporting factors included resilient corporate earnings and near-term potential for a COVID-19 vaccine breakthrough. This was evident as the index advanced 12.28% in the final six months of the period, supported by broad U.S.-dollar weakness. Currency fluctuation generally boosted foreign developed-markets equities for the year, while the reverse was true for emerging-markets stocks. Late in the period, the index was pressured by Congress’s inability to reach a deal on additional fiscal stimulus, as well as concerns about election uncertainty, indications the U.S. economic recovery is stalling, a second wave of COVID-19 cases, and stretched valuations. For the full year, the U.K. (-22%), Asia Pacific ex Japan (-8%), Canada (-5%) and Europe ex U.K. (-4%) lagged the index. Emerging markets (+9%) and Japan (+1%) outperformed. By sector, energy (-38%) fell hard along with oil prices. Financials and real estate (-20% each) also lagged. Conversely, the information technology (+ 25%) and communication services (+15%) sectors topped the index.
Comments from Co-Manager Jane Wu: For the fiscal year ending October 31, 2020, the fund gained 13.66%, outperforming the 8.27% result of the benchmark MSCI Emerging Markets Net MA Index. From a regional standpoint, stock picks in Emerging Asia, specifically China, and an underweighting in the Middle East contributed most to the fund's relative result. By sector, the primary contributor to performance versus the benchmark was our stock picks in communication services. Stock picking and an overweighting in the consumer discretionary sector, especially within the retailing industry, also boosted performance. Also contributing to the fund's relative result was stock selection in health care, primarily driven by the pharmaceuticals, biotechnology & life sciences industry. Our top individual relative contributor was an out-of-benchmark stake in MercadoLibre (+132%). Also bolstering performance was our outsized stake in Pinduoduo, which gained 117%. We reduced our position the past 12 months. Another notable relative contributor was an overweighting in Tencent Holdings (+87%), which was one of the fund's largest holdings. In contrast, stock picks in Latin America and the Middle East, specifically United Arab Emirates, hurt the fund's relative result. By sector, the primary detractor from performance versus the benchmark was our stock selection in financials, especially within the banks industry. Security selection in industrials and consumer staples also hindered the fund's relative result. The biggest individual relative detractor was an overweight position in Banco do Brasil (-55%). A second notable relative detractor was our outsized stake in Axis Bank (-37%), a position that was sold the past year. Also hampering performance was our lighter-than-benchmark stake in Nio. Nio was not held at period end. Notable changes in positioning include decreased exposure to Brazil and a higher allocation to China. By sector, meaningful changes in positioning include increased exposure to communication services and consumer discretionary.
The views expressed above reflect those of the portfolio manager(s) only through the end of the period as stated on the cover of this report and do not necessarily represent the views of Fidelity or any other person in the Fidelity organization. Any such views are subject to change at any time based upon market or other conditions and Fidelity disclaims any responsibility to update such views. These views may not be relied on as investment advice and, because investment decisions for a Fidelity fund are based on numerous factors, may not be relied on as an indication of trading intent on behalf of any Fidelity fund.
Note to shareholders: On October 1, 2020, Guillermo de Las Casas and Will Pruett assumed co-management responsibilities for the fund.
Fidelity® Series Emerging Markets Opportunities Fund
Investment Summary (Unaudited)
Geographic Diversification (% of fund's net assets)
| As of October 31, 2020 |
| | Cayman Islands | 29.9% |
| | Korea (South) | 12.4% |
| | China | 10.9% |
| | India | 10.1% |
| | Taiwan | 7.6% |
| | Brazil | 5.9% |
| | United States of America* | 3.9% |
| | Russia | 2.8% |
| | South Africa | 2.2% |
| | Other | 14.3% |
* Includes Short-Term investments and Net Other Assets (Liabilities).
Percentages are based on country or territory of incorporation and are adjusted for the effect of futures contracts, if applicable.
Asset Allocation as of October 31, 2020
| | % of fund's net assets |
| Stocks and Equity Futures | 99.0 |
| Short-Term Investments and Net Other Assets (Liabilities) | 1.0 |
Top Ten Stocks as of October 31, 2020
| | % of fund's net assets |
| Alibaba Group Holding Ltd. sponsored ADR (Cayman Islands, Internet & Direct Marketing Retail) | 9.4 |
| Tencent Holdings Ltd. (Cayman Islands, Interactive Media & Services) | 8.2 |
| Taiwan Semiconductor Manufacturing Co. Ltd. (Taiwan, Semiconductors & Semiconductor Equipment) | 6.3 |
| Samsung Electronics Co. Ltd. (Korea (South), Technology Hardware, Storage & Peripherals) | 5.3 |
| JD.com, Inc. sponsored ADR (Cayman Islands, Internet & Direct Marketing Retail) | 1.7 |
| Ping An Insurance Group Co. of China Ltd. (H Shares) (China, Insurance) | 1.7 |
| ICICI Bank Ltd. sponsored ADR (India, Banks) | 1.6 |
| Reliance Industries Ltd. (India, Oil, Gas & Consumable Fuels) | 1.5 |
| Meituan Class B (Cayman Islands, Internet & Direct Marketing Retail) | 1.3 |
| Sberbank of Russia (Russia, Banks) | 1.1 |
| | 38.1 |
Top Market Sectors as of October 31, 2020
| | % of fund's net assets |
| Consumer Discretionary | 22.0 |
| Information Technology | 18.5 |
| Financials | 16.9 |
| Communication Services | 13.6 |
| Materials | 6.6 |
| Consumer Staples | 5.6 |
| Energy | 4.4 |
| Health Care | 3.8 |
| Industrials | 3.3 |
| Real Estate | 2.0 |
Fidelity® Series Emerging Markets Opportunities Fund
Schedule of Investments October 31, 2020
Showing Percentage of Net Assets
| Common Stocks - 95.3% | | | |
| | | Shares | Value |
| Belgium - 0.3% | | | |
| Titan Cement International Trading SA (a) | | 6,139,100 | $76,217,964 |
| Bermuda - 1.1% | | | |
| AGTech Holdings Ltd. (b) | | 55,756,000 | 1,977,801 |
| China Gas Holdings Ltd. | | 15,719,200 | 48,156,208 |
| Credicorp Ltd. | | 18,600 | 2,122,260 |
| Credicorp Ltd. (United States) | | 834,714 | 95,725,002 |
| GP Investments Ltd. Class A (depositary receipt) (a)(b) | | 7,609,355 | 4,906,737 |
| Haier Electronics Group Co. Ltd. | | 10,060,635 | 38,153,198 |
| Kunlun Energy Co. Ltd. | | 56,142,000 | 36,208,965 |
| Marvell Technology Group Ltd. | | 710,400 | 26,647,104 |
| Shangri-La Asia Ltd. | | 38,070,000 | 29,906,005 |
|
| TOTAL BERMUDA | | | 283,803,280 |
|
| Brazil - 3.6% | | | |
| Atacadao SA | | 33,645,200 | 108,183,923 |
| B2W Companhia Global do Varejo (b) | | 5,915,800 | 77,572,093 |
| Banco do Brasil SA | | 32,130,100 | 166,867,432 |
| BM&F BOVESPA SA | | 5,023,700 | 44,695,385 |
| BTG Pactual Participations Ltd. unit | | 3,148,800 | 39,785,638 |
| Centrais Eletricas Brasileiras SA (Electrobras) | | 4,892,420 | 26,483,076 |
| Companhia de Saneamento de Minas Gerais | | 1,419,720 | 10,589,848 |
| Equatorial Energia SA | | 9,713,000 | 33,736,803 |
| LOG Commercial Properties e Participacoes SA | | 2,145,200 | 11,720,566 |
| MRV Engenharia e Participacoes SA | | 7,242,100 | 21,267,070 |
| Natura & Co. Holding SA | | 16,665,001 | 133,890,422 |
| Petrobras Distribuidora SA | | 6,161,100 | 20,594,445 |
| Rumo SA (b) | | 24,690,300 | 78,916,704 |
| Suzano Papel e Celulose SA (b) | | 13,683,100 | 119,352,583 |
| Terna Participacoes SA unit | | 212,800 | 1,043,983 |
| Vale SA sponsored ADR (c) | | 7,622,270 | 80,567,394 |
|
| TOTAL BRAZIL | | | 975,267,365 |
|
| British Virgin Islands - 0.1% | | | |
| Mail.Ru Group Ltd. GDR (Reg. S) (b)(c) | | 1,016,686 | 26,688,008 |
| Cayman Islands - 29.9% | | | |
| 51job, Inc. sponsored ADR (b) | | 590,900 | 41,422,090 |
| Agora, Inc. ADR (b)(c) | | 72,200 | 2,779,700 |
| Akeso, Inc. (d) | | 9,056,000 | 28,385,785 |
| Alibaba Group Holding Ltd. sponsored ADR (b) | | 8,309,020 | 2,531,675,301 |
| Ant International Co. Ltd. Class C (b)(e)(f) | | 6,359,848 | 51,705,564 |
| Archosaur Games, Inc. (b)(d) | | 2,498,000 | 5,883,712 |
| Bilibili, Inc. ADR (b)(c) | | 5,278,858 | 235,806,587 |
| Chailease Holding Co. Ltd. | | 14,652,796 | 70,936,148 |
| China Resources Land Ltd. | | 17,635,720 | 71,771,295 |
| China State Construction International Holdings Ltd. | | 61,464,096 | 42,495,654 |
| Haitian International Holdings Ltd. | | 19,805,306 | 49,050,226 |
| Hansoh Pharmaceutical Group Co. Ltd. (b)(d) | | 20,644,000 | 92,002,606 |
| Hua Medicine (b)(d) | | 31,590,000 | 17,236,466 |
| Innovent Biologics, Inc. (b)(d) | | 6,522,500 | 48,124,734 |
| iQIYI, Inc. ADR (b)(c) | | 824,067 | 20,354,455 |
| JD.com, Inc. sponsored ADR (b) | | 5,765,272 | 469,984,973 |
| Kangji Medical Holdings Ltd. | | 10,912,500 | 28,215,551 |
| KE Holdings, Inc. ADR (b) | | 662,500 | 46,209,375 |
| Kingdee International Software Group Co. Ltd. | | 15,781,000 | 41,424,489 |
| LexinFintech Holdings Ltd. ADR (b) | | 881,300 | 7,261,912 |
| Li Ning Co. Ltd. | | 53,481,000 | 275,941,954 |
| Longfor Properties Co. Ltd. (d) | | 3,170,500 | 17,319,661 |
| Meituan Class B (b) | | 9,123,307 | 339,159,894 |
| Ming Yuan Cloud Group Holdings Ltd. | | 710,600 | 3,033,971 |
| NetEase, Inc. ADR | | 624,600 | 54,209,034 |
| New Oriental Education & Technology Group, Inc. sponsored ADR (b) | | 1,694,878 | 271,824,534 |
| PagSeguro Digital Ltd. (b)(c) | | 2,355,734 | 86,243,422 |
| Phoenix Tree Holdings Ltd. ADR | | 549,500 | 1,027,565 |
| Pinduoduo, Inc. ADR (b) | | 1,855,200 | 166,930,896 |
| Semiconductor Manufacturing International Corp. (b) | | 16,264,000 | 47,980,951 |
| Shenzhou International Group Holdings Ltd. | | 9,587,800 | 165,599,022 |
| Shimao Property Holdings Ltd. | | 9,840,500 | 34,716,243 |
| Shimao Services Holdings Ltd. (b)(d) | | 155,425 | 332,803 |
| StoneCo Ltd. Class A (b) | | 843,700 | 44,327,998 |
| Sunny Optical Technology Group Co. Ltd. | | 4,786,800 | 79,157,402 |
| TAL Education Group ADR (b) | | 590,681 | 39,256,659 |
| Tencent Holdings Ltd. | | 28,822,474 | 2,202,199,976 |
| Uni-President China Holdings Ltd. | | 86,431,000 | 74,696,898 |
| Wise Talent Information Technology Co. Ltd. (b) | | 7,540,003 | 18,518,111 |
| Wuxi Biologics (Cayman), Inc. (b)(d) | | 1,621,978 | 45,317,051 |
| YY, Inc. ADR | | 675,800 | 61,754,604 |
| Zai Lab Ltd. (b) | | 920,200 | 76,559,690 |
|
| TOTAL CAYMAN ISLANDS | | | 8,008,834,962 |
|
| Chile - 0.4% | | | |
| Sociedad Quimica y Minera de Chile SA (PN-B) sponsored ADR (c) | | 1,599,121 | 59,183,468 |
| Vina Concha y Toro SA | | 34,096,719 | 54,410,127 |
|
| TOTAL CHILE | | | 113,593,595 |
|
| China - 10.9% | | | |
| Bafang Electric Suzhou Co. Ltd. (A Shares) | | 1,897,674 | 52,322,175 |
| BBMG Corp. (H Shares) | | 155,905,500 | 29,361,113 |
| BYD Co. Ltd. (A Shares) | | 4,749,788 | 113,454,147 |
| China Communications Construction Co. Ltd. (H Shares) | | 50,645,485 | 26,457,815 |
| China Communications Services Corp. Ltd. (H Shares) | | 75,996,000 | 44,112,480 |
| China Life Insurance Co. Ltd. (H Shares) | | 97,540,400 | 212,825,887 |
| China Longyuan Power Grid Corp. Ltd. (H Shares) | | 152,329,690 | 104,140,259 |
| China Merchants Bank Co. Ltd. (H Shares) | | 22,327,124 | 116,063,605 |
| China Petroleum & Chemical Corp. (H Shares) | | 232,938,000 | 90,955,548 |
| China Tower Corp. Ltd. (H Shares) (d) | | 135,610,000 | 21,165,830 |
| Chongqing Changan Automobile Co. Ltd. (A Shares) (b) | | 37,550,325 | 93,028,230 |
| CRRC Corp. Ltd. (H Shares) | | 116,180,000 | 44,958,401 |
| Glodon Co. Ltd. (A Shares) | | 2,724,300 | 29,037,589 |
| Great Wall Motor Co. Ltd. (H Shares) | | 87,942,500 | 142,250,751 |
| Guangzhou Automobile Group Co. Ltd. (H Shares) | | 96,060,000 | 98,507,191 |
| Haier Smart Home Co. Ltd. (A Shares) | | 19,691,903 | 73,354,399 |
| Hangzhou Tigermed Consulting Co. Ltd. (H Shares) (b)(d) | | 5,036,800 | 80,887,662 |
| Industrial & Commercial Bank of China Ltd. (H Shares) | | 311,819,400 | 177,071,188 |
| Jiangsu Hengrui Medicine Co. Ltd. (A Shares) | | 2,041,650 | 27,185,461 |
| Midea Group Co. Ltd. (A Shares) | | 7,350,708 | 85,880,386 |
| NARI Technology Co. Ltd. (A Shares) | | 4,892,500 | 15,220,964 |
| Pharmaron Beijing Co. Ltd. (H Shares) (d) | | 6,327,100 | 91,325,700 |
| PICC Property & Casualty Co. Ltd. (H Shares) | | 108,085,750 | 73,056,347 |
| Ping An Bank Co. Ltd. (A Shares) | | 24,618,174 | 65,403,665 |
| Ping An Insurance Group Co. of China Ltd. (H Shares) | | 43,252,500 | 447,216,728 |
| Shenzhen Mindray Bio-Medical Electronics Co. Ltd. (A Shares) | | 2,324,310 | 134,695,738 |
| Shenzhen New Industries Biomedical Engineering Co. Ltd. | | 1,342,479 | 34,320,283 |
| Sinopec Engineering Group Co. Ltd. (H Shares) | | 32,657,687 | 12,679,734 |
| TravelSky Technology Ltd. (H Shares) | | 14,679,000 | 30,825,427 |
| Tsingtao Brewery Co. Ltd. (H Shares) | | 22,260,000 | 183,908,804 |
| Venus MedTech Hangzhou, Inc. (H Shares) (b)(d) | | 2,872,000 | 27,617,878 |
| WuXi AppTec Co. Ltd. (H Shares) (d) | | 6,123,776 | 97,553,865 |
| Zhuzhou CRRC Times Electric Co. Ltd. (H Shares) | | 14,582,700 | 44,768,560 |
|
| TOTAL CHINA | | | 2,921,613,810 |
|
| Egypt - 0.0% | | | |
| Six of October Development & Investment Co. | | 11,700,184 | 8,942,816 |
| France - 0.1% | | | |
| Ubisoft Entertainment SA (b) | | 435,000 | 38,371,607 |
| Germany - 0.3% | | | |
| Delivery Hero AG (b)(d) | | 788,327 | 90,692,391 |
| Hong Kong - 2.1% | | | |
| AIA Group Ltd. | | 4,226,000 | 40,219,587 |
| China Overseas Land and Investment Ltd. | | 35,012,900 | 87,616,931 |
| China Resources Beer Holdings Co. Ltd. | | 36,060,666 | 223,504,031 |
| China Unicom Ltd. | | 93,543,000 | 57,658,953 |
| CNOOC Ltd. | | 111,208,000 | 101,750,406 |
| Far East Horizon Ltd. | | 58,191,980 | 57,122,343 |
|
| TOTAL HONG KONG | | | 567,872,251 |
|
| Hungary - 0.2% | | | |
| OTP Bank PLC (b) | | 1,761,600 | 54,864,950 |
| India - 10.1% | | | |
| Adani Ports & Special Economic Zone Ltd. | | 15,388,647 | 74,201,763 |
| Axis Bank Ltd. (b) | | 44,309,413 | 291,967,190 |
| Axis Bank Ltd. GDR (Reg. S) (b) | | 299,302 | 9,727,315 |
| Bharti Infratel Ltd. | | 4,950,200 | 12,312,601 |
| DLF Ltd. | | 15,469,700 | 32,811,513 |
| Federal Bank Ltd. (b) | | 36,159,951 | 24,411,878 |
| HDFC Bank Ltd. | | 1,413,400 | 22,437,933 |
| HDFC Bank Ltd. sponsored ADR (b) | | 1,019,200 | 58,542,848 |
| Housing Development Finance Corp. Ltd. | | 1,249,700 | 32,228,839 |
| ICICI Bank Ltd. (b) | | 5,497,528 | 28,745,576 |
| ICICI Bank Ltd. sponsored ADR (b) | | 39,208,807 | 413,652,914 |
| Indraprastha Gas Ltd. | | 11,690,194 | 63,099,229 |
| ITC Ltd. | | 34,941,754 | 77,621,882 |
| JK Cement Ltd. (a) | | 4,635,231 | 115,090,372 |
| JM Financial Ltd. (b) | | 31,647,938 | 33,686,327 |
| Larsen & Toubro Ltd. | | 7,122,744 | 88,712,290 |
| LIC Housing Finance Ltd. | | 8,682,184 | 32,923,648 |
| Mahanagar Gas Ltd. | | 1,990,910 | 21,756,730 |
| Manappuram General Finance & Leasing Ltd. | | 29,499,993 | 61,437,882 |
| Maruti Suzuki India Ltd. | | 810,300 | 75,654,735 |
| Mindspace Business Parks (b)(d) | | 1,401,000 | 5,759,883 |
| Mindspace Business Parks | | 3,669,600 | 13,510,478 |
| NTPC Ltd. | | 28,549,907 | 33,534,540 |
| Oberoi Realty Ltd. (b) | | 8,064,631 | 47,896,328 |
| Petronet LNG Ltd. | | 11,900,280 | 36,850,686 |
| Phoenix Mills Ltd. (b) | | 1,975,097 | 15,288,138 |
| Power Grid Corp. of India Ltd. | | 39,105,093 | 89,703,306 |
| Reliance Industries Ltd. | | 14,754,892 | 406,648,076 |
| Shree Cement Ltd. | | 378,668 | 110,172,128 |
| Shriram Transport Finance Co. Ltd. (a) | | 13,036,173 | 121,160,667 |
| State Bank of India (b) | | 47,422,444 | 120,106,060 |
| Sunteck Realty Ltd. | | 1,028,431 | 3,692,914 |
| Tata Consultancy Services Ltd. | | 1,443,200 | 51,704,878 |
| Torrent Pharmaceuticals Ltd. | | 2,076,478 | 71,472,949 |
|
| TOTAL INDIA | | | 2,698,524,496 |
|
| Indonesia - 0.8% | | | |
| PT Bank Mandiri (Persero) Tbk | | 319,951,700 | 124,631,079 |
| PT Bank Rakyat Indonesia Tbk | | 307,190,600 | 69,539,347 |
| PT United Tractors Tbk | | 14,872,000 | 21,247,504 |
|
| TOTAL INDONESIA | | | 215,417,930 |
|
| Japan - 1.4% | | | |
| Capcom Co. Ltd. | | 905,100 | 49,501,335 |
| Freee KK (b)(c) | | 904,200 | 70,752,616 |
| JTOWER, Inc. (c) | | 252,600 | 17,686,779 |
| Keyence Corp. | | 80,700 | 36,623,475 |
| Money Forward, Inc. (b) | | 868,100 | 78,536,627 |
| Murata Manufacturing Co. Ltd. | | 466,500 | 32,715,022 |
| Rakus Co. Ltd. | | 2,704,500 | 53,147,975 |
| Square Enix Holdings Co. Ltd. | | 649,600 | 37,743,578 |
|
| TOTAL JAPAN | | | 376,707,407 |
|
| Kazakhstan - 0.1% | | | |
| JSC Halyk Bank of Kazakhstan GDR unit | | 1,279,217 | 12,766,586 |
| Korea (South) - 11.4% | | | |
| AMOREPACIFIC Group, Inc. | | 1,614,953 | 62,332,101 |
| Coway Co. Ltd. | | 975,220 | 59,584,186 |
| DuzonBizon Co. Ltd. | | 308,320 | 27,123,699 |
| Hanon Systems | | 3,735,730 | 36,962,816 |
| Hyundai Fire & Marine Insurance Co. Ltd. | | 3,398,291 | 69,839,851 |
| Hyundai Mobis | | 224,353 | 44,853,562 |
| Hyundai Motor Co. | | 169,950 | 24,822,035 |
| Kakao Corp. | | 384,770 | 111,949,309 |
| KB Financial Group, Inc. | | 4,883,765 | 174,308,046 |
| Korea Electric Power Corp. (b) | | 1,853,285 | 32,619,104 |
| Korea Electric Power Corp. sponsored ADR (b) | | 206,300 | 1,782,432 |
| LG Chemical Ltd. | | 114,366 | 62,224,819 |
| LG Corp. | | 1,226,687 | 73,291,692 |
| NAVER Corp. | | 172,509 | 44,043,205 |
| NCSOFT Corp. | | 115,457 | 79,154,629 |
| Netmarble Corp. (b)(d) | | 129,050 | 13,377,628 |
| POSCO | | 907,706 | 167,198,673 |
| S-Oil Corp. | | 655,170 | 31,570,653 |
| Samsung Biologics Co. Ltd. (b)(d) | | 191,320 | 115,360,449 |
| Samsung Electronics Co. Ltd. | | 25,430,518 | 1,275,476,428 |
| Samsung Fire & Marine Insurance Co. Ltd. | | 512,394 | 80,839,929 |
| Samsung SDI Co. Ltd. | | 383,664 | 150,807,574 |
| Shinhan Financial Group Co. Ltd. | | 3,200,723 | 86,652,378 |
| SK Hynix, Inc. | | 3,290,984 | 232,959,637 |
|
| TOTAL KOREA (SOUTH) | | | 3,059,134,835 |
|
| Luxembourg - 0.1% | | | |
| Adecoagro SA (b) | | 2,627,018 | 12,714,767 |
| Globant SA (b) | | 87,466 | 15,797,234 |
|
| TOTAL LUXEMBOURG | | | 28,512,001 |
|
| Mexico - 2.0% | | | |
| America Movil S.A.B. de CV Series L sponsored ADR | | 2,828,000 | 33,709,760 |
| CEMEX S.A.B. de CV sponsored ADR | | 37,292,100 | 154,762,215 |
| Corporacion Inmobiliaria Vesta S.A.B. de CV | | 6,134,619 | 9,856,343 |
| Fibra Uno Administracion SA de CV | | 21,435,500 | 16,239,704 |
| Grupo Aeroportuario del Pacifico S.A.B. de CV Series B | | 5,495,500 | 45,735,597 |
| Grupo Aeroportuario Norte S.A.B. de CV (b) | | 4,345,000 | 19,607,449 |
| Grupo Financiero Banorte S.A.B. de CV Series O (b) | | 19,900,618 | 88,659,850 |
| Macquarie Mexican (REIT) (a)(d) | | 42,747,140 | 49,112,406 |
| Wal-Mart de Mexico SA de CV Series V | | 51,405,500 | 124,202,997 |
|
| TOTAL MEXICO | | | 541,886,321 |
|
| Multi-National - 0.2% | | | |
| HKT Trust/HKT Ltd. unit | | 36,657,000 | 47,378,670 |
| Netherlands - 2.0% | | | |
| Adyen BV (b)(d) | | 39,900 | 67,061,687 |
| ASML Holding NV (Netherlands) | | 79,000 | 28,582,445 |
| NXP Semiconductors NV | | 220,200 | 29,753,424 |
| X5 Retail Group NV GDR (Reg. S) | | 3,136,600 | 110,220,124 |
| Yandex NV Series A (b)(c) | | 5,188,125 | 298,680,356 |
|
| TOTAL NETHERLANDS | | | 534,298,036 |
|
| Nigeria - 0.0% | | | |
| Guaranty Trust Bank PLC GDR (Reg. S) (b) | | 3,040,904 | 7,906,350 |
| Pakistan - 0.1% | | | |
| Habib Bank Ltd. | | 26,708,000 | 21,691,497 |
| Panama - 0.1% | | | |
| Copa Holdings SA Class A (c) | | 790,728 | 38,967,076 |
| Peru - 0.3% | | | |
| Compania de Minas Buenaventura SA sponsored ADR | | 7,323,052 | 89,853,848 |
| Philippines - 0.6% | | | |
| Ayala Land, Inc. | | 90,845,224 | 61,653,191 |
| Metropolitan Bank & Trust Co. | | 92,127,272 | 77,198,405 |
| Robinsons Land Corp. | | 50,258,731 | 15,516,285 |
|
| TOTAL PHILIPPINES | | | 154,367,881 |
|
| Poland - 0.2% | | | |
| Powszechny Zaklad Ubezpieczen SA (b) | | 8,928,000 | 48,715,404 |
| Russia - 2.8% | | | |
| LSR Group OJSC | | 389,330 | 4,457,677 |
| Lukoil PJSC sponsored ADR | | 3,071,800 | 156,846,108 |
| MMC Norilsk Nickel PJSC sponsored ADR | | 6,536,100 | 155,820,624 |
| NOVATEK OAO GDR (Reg. S) | | 608,300 | 73,300,150 |
| Sberbank of Russia | | 44,912,430 | 113,828,665 |
| Sberbank of Russia sponsored ADR | | 18,979,294 | 191,690,869 |
| Tatneft PAO | | 7,391,200 | 38,191,646 |
| Unipro PJSC | | 303,405,802 | 9,872,444 |
|
| TOTAL RUSSIA | | | 744,008,183 |
|
| Singapore - 0.3% | | | |
| First Resources Ltd. (a) | | 85,725,300 | 76,045,998 |
| South Africa - 2.2% | | | |
| Absa Group Ltd. | | 20,987,875 | 112,820,101 |
| AngloGold Ashanti Ltd. | | 5,481,800 | 126,330,612 |
| Bidvest Group Ltd. | | 4,516,577 | 37,139,740 |
| Impala Platinum Holdings Ltd. | | 18,738,902 | 166,782,302 |
| Naspers Ltd. Class N | | 352,458 | 68,809,516 |
| Pick 'n Pay Stores Ltd. | | 22,096,300 | 69,586,832 |
|
| TOTAL SOUTH AFRICA | | | 581,469,103 |
|
| Spain - 0.2% | | | |
| Amadeus IT Holding SA Class A | | 911,300 | 43,504,554 |
| Switzerland - 0.1% | | | |
| Dufry AG (b) | | 760,582 | 28,782,589 |
| Taiwan - 7.6% | | | |
| Formosa Plastics Corp. | | 12,952,000 | 35,810,521 |
| Largan Precision Co. Ltd. | | 471,900 | 49,896,798 |
| MediaTek, Inc. | | 5,911,000 | 140,083,820 |
| Taiwan Semiconductor Manufacturing Co. Ltd. | | 111,387,284 | 1,684,929,422 |
| Unified-President Enterprises Corp. | | 64,756,000 | 138,751,540 |
|
| TOTAL TAIWAN | | | 2,049,472,101 |
|
| Thailand - 0.3% | | | |
| Kasikornbank PCL (For. Reg.) | | 8,227,404 | 19,823,157 |
| PTT Global Chemical PCL (For. Reg.) | | 54,134,300 | 69,361,784 |
|
| TOTAL THAILAND | | | 89,184,941 |
|
| Turkey - 0.3% | | | |
| Aselsan A/S | | 27,985,000 | 55,939,943 |
| Turkiye Garanti Bankasi A/S (b) | | 43,888,855 | 34,568,464 |
|
| TOTAL TURKEY | | | 90,508,407 |
|
| United Arab Emirates - 0.0% | | | |
| Emaar Properties PJSC (b) | | 11,336,074 | 8,240,153 |
| United Kingdom - 0.6% | | | |
| Mondi PLC | | 7,916,963 | 148,636,422 |
| Network International Holdings PLC (b)(d) | | 7,731,782 | 22,276,748 |
|
| TOTAL UNITED KINGDOM | | | 170,913,170 |
|
| United States of America - 2.5% | | | |
| Activision Blizzard, Inc. | | 1,312,400 | 99,388,052 |
| Arco Platform Ltd. Class A (b) | | 537,212 | 18,308,185 |
| DouYu International Holdings Ltd. ADR (b) | | 1,946,428 | 29,780,348 |
| MercadoLibre, Inc. (b) | | 220,714 | 267,957,832 |
| Micron Technology, Inc. (b) | | 4,306,400 | 216,784,176 |
| ON Semiconductor Corp. (b) | | 1,035,400 | 25,978,186 |
|
| TOTAL UNITED STATES OF AMERICA | | | 658,196,779 |
|
| TOTAL COMMON STOCKS | | | |
| (Cost $19,454,497,767) | | | 25,583,217,315 |
|
| Preferred Stocks - 3.3% | | | |
| Convertible Preferred Stocks - 0.0% | | | |
| Hong Kong - 0.0% | | | |
| Antengene Corp. Series C1 (e)(f) | | 3,120,030 | 8,816,849 |
| Nonconvertible Preferred Stocks - 3.3% | | | |
| Brazil - 2.3% | | | |
| Ambev SA sponsored ADR | | 31,045,600 | 66,437,584 |
| Companhia de Saneamento Basico do Estado de Sao Paulo (SABESP) sponsored ADR | | 2,617,700 | 19,318,626 |
| Companhia Paranaense de Energia-Copel: | | | |
| (PN-B) | | 95,800 | 1,031,136 |
| (PN-B) sponsored ADR | | 1,875,482 | 20,255,206 |
| Itau Unibanco Holding SA sponsored ADR | | 49,684,816 | 203,210,897 |
| Metalurgica Gerdau SA (PN) | | 47,649,922 | 81,382,591 |
| Petroleo Brasileiro SA - Petrobras: | | | |
| (PN) sponsored ADR (non-vtg.) | | 15,260,900 | 100,874,549 |
| sponsored ADR | | 15,502,300 | 102,780,249 |
| Telefonica Brasil SA | | 2,232,600 | 16,552,045 |
| | | | 611,842,883 |
| Cayman Islands - 0.0% | | | |
| Chailease Holding Co. Ltd. (b) | | 1,150,092 | 3,919,535 |
| Korea (South) - 1.0% | | | |
| Hyundai Motor Co. Series 2 | | 1,504,729 | 106,385,207 |
| Samsung Electronics Co. Ltd. | | 3,229,352 | 143,342,250 |
| | | | 249,727,457 |
| Russia - 0.0% | | | |
| Tatneft PAO | | 1,268,900 | 6,345,798 |
|
| TOTAL NONCONVERTIBLE PREFERRED STOCKS | | | 871,835,673 |
|
| TOTAL PREFERRED STOCKS | | | |
| (Cost $933,629,224) | | | 880,652,522 |
| | | Principal Amount | Value |
|
| Government Obligations - 0.1% | | | |
| United States of America - 0.1% | | | |
U.S. Treasury Bills, yield at date of purchase 0.1% 12/31/20
(Cost $17,107,291) | | 17,110,000 | 17,107,406 |
| | | Shares | Value |
|
| Money Market Funds - 2.4% | | | |
| Fidelity Cash Central Fund 0.10% (g) | | 391,895,277 | 391,973,656 |
| Fidelity Securities Lending Cash Central Fund 0.11% (g)(h) | | 242,201,617 | 242,225,838 |
| TOTAL MONEY MARKET FUNDS | | | |
| (Cost $634,168,912) | | | 634,199,494 |
| TOTAL INVESTMENT IN SECURITIES - 101.1% | | | |
| (Cost $21,039,403,194) | | | 27,115,176,737 |
| NET OTHER ASSETS (LIABILITIES) - (1.1)% | | | (285,393,584) |
| NET ASSETS - 100% | | | $26,829,783,153 |
| Futures Contracts | | | | | |
| | Number of contracts | Expiration Date | Notional Amount | Value | Unrealized Appreciation/(Depreciation) |
| Purchased | | | | | |
| Equity Index Contracts | | | | | |
| ICE E-mini MSCI Emerging Markets Index Contracts (United States) | 1,851 | Dec. 2020 | $101,980,845 | $254,050 | $254,050 |
The notional amount of futures purchased as a percentage of Net Assets is 0.4%
Categorizations in the Schedule of Investments are based on country or territory of incorporation.
Legend
(a) Affiliated company
(b) Non-income producing
(c) Security or a portion of the security is on loan at period end.
(d) Security exempt from registration under Rule 144A of the Securities Act of 1933. These securities may be resold in transactions exempt from registration, normally to qualified institutional buyers. At the end of the period, the value of these securities amounted to $936,794,945 or 3.5% of net assets.
(e) Restricted securities (including private placements) - Investment in securities not registered under the Securities Act of 1933 (excluding 144A issues). At the end of the period, the value of restricted securities (excluding 144A issues) amounted to $60,522,413 or 0.2% of net assets.
(f) Level 3 security
(g) Affiliated fund that is generally available only to investment companies and other accounts managed by Fidelity Investments. The rate quoted is the annualized seven-day yield of the fund at period end. A complete unaudited listing of the fund's holdings as of its most recent quarter end is available upon request. In addition, each Fidelity Central Fund's financial statements, which are not covered by the Fund's Report of Independent Registered Public Accounting Firm, are available on the SEC's website or upon request.
(h) Investment made with cash collateral received from securities on loan.
Additional information on each restricted holding is as follows:
| Security | Acquisition Date | Acquisition Cost |
| Ant International Co. Ltd. Class C | 5/16/18 | $35,678,747 |
| Antengene Corp. Series C1 | 7/11/20 | $8,816,849 |
Affiliated Central Funds
Information regarding fiscal year to date income earned by the Fund from investments in Fidelity Central Funds is as follows:
| Fund | Income earned |
| Fidelity Cash Central Fund | $4,806,957 |
| Fidelity Securities Lending Cash Central Fund | 1,581,989 |
| Total | $6,388,946 |
Amounts in the income column in the above table include any capital gain distributions from underlying funds, which are presented in the corresponding line-item in the Statement of Operations, if applicable. Amount for Fidelity Securities Lending Cash Central Fund represents the income earned on investing cash collateral, less rebates paid to borrowers and any lending agent fees associated with the loan, plus any premium payments received for lending certain types of securities.
Other Affiliated Issuers
An affiliated company is a company in which the Fund has ownership of at least 5% of the voting securities. Fiscal year to date transactions with companies which are or were affiliates are as follows:
| Affiliate | Value, beginning of period | Purchases(a) | Sales Proceeds | Dividend Income | Realized Gain (loss) | Change in Unrealized appreciation (depreciation) | Value, end of period |
| Direcional Engenharia SA | $32,610,672 | $4,920,646 | $36,291,785 | $1,082,451 | $10,419,757 | $(11,659,290) | $-- |
| First Resources Ltd. | 41,880,508 | 49,974,114 | -- | 1,548,562 | -- | (15,808,624) | 76,045,998 |
| GP Investments Ltd. Class A (depositary receipt) | 12,316,694 | -- | 18,228 | -- | (68,637) | (7,323,092) | 4,906,737 |
| JK Cement Ltd. | 48,363,805 | 26,118,574 | -- | 360,356 | -- | 40,607,993 | 115,090,372 |
| Macquarie Mexican (REIT) | 52,256,017 | 6,045,371 | 195,340 | 3,071,864 | (15,707) | (8,977,935) | 49,112,406 |
| Shanghai Kindly Medical Instruments Co. Ltd. (H Shares) | -- | 8,219,184 | 12,492,572 | -- | 4,273,388 | -- | -- |
| Shriram Transport Finance Co. Ltd. | -- | 10,144,206 | -- | -- | -- | -- | -- |
| Shriram Transport Finance Co. Ltd. | 67,973,136 | 74,250,405 | 2,333,979 | 311,890 | (130,194) | (28,742,907) | 121,160,667 |
| SREI Infrastructure Finance Ltd. | 5,042,943 | -- | 2,630,991 | -- | (19,059,527) | 16,647,575 | -- |
| Titan Cement International Trading SA | 77,877,473 | 34,471,885 | -- | 1,125,631 | -- | (36,131,394) | 76,217,964 |
| Total | $338,321,248 | $214,144,385 | $53,962,895 | $7,500,754 | $(4,580,920) | $(51,387,674) | $442,534,144 |
(a) Includes the value of securities received through in-kind transactions, if applicable.
Investment Valuation
The following is a summary of the inputs used, as of October 31, 2020, involving the Fund's assets and liabilities carried at fair value. The inputs or methodology used for valuing securities may not be an indication of the risk associated with investing in those securities. For more information on valuation inputs, and their aggregation into the levels used below, please refer to the Investment Valuation section in the accompanying Notes to Financial Statements.
| | Valuation Inputs at Reporting Date: |
| Description | Total | Level 1 | Level 2 | Level 3 |
| Investments in Securities: | | | | |
| Equities: | | | | |
| Communication Services | $3,616,182,393 | $1,008,241,179 | $2,607,941,214 | $-- |
| Consumer Discretionary | 5,929,476,377 | 5,094,364,983 | 835,111,394 | -- |
| Consumer Staples | 1,516,508,030 | 1,230,921,217 | 285,586,813 | -- |
| Energy | 1,167,361,373 | 478,338,500 | 689,022,873 | -- |
| Financials | 4,521,489,865 | 1,828,460,288 | 2,641,324,013 | 51,705,564 |
| Health Care | 1,025,078,717 | 605,011,437 | 411,250,431 | 8,816,849 |
| Industrials | 851,364,957 | 545,111,729 | 306,253,228 | -- |
| Information Technology | 4,871,274,529 | 860,492,254 | 4,010,782,275 | -- |
| Materials | 1,848,109,433 | 882,312,321 | 965,797,112 | -- |
| Real Estate | 563,692,268 | 367,563,538 | 196,128,730 | -- |
| Utilities | 553,331,895 | 312,618,986 | 240,712,909 | -- |
| Government Obligations | 17,107,406 | -- | 17,107,406 | -- |
| Money Market Funds | 634,199,494 | 634,199,494 | -- | -- |
| Total Investments in Securities: | $27,115,176,737 | $13,847,635,926 | $13,207,018,398 | $60,522,413 |
| Derivative Instruments: | | | | |
| Assets | | | | |
| Futures Contracts | $254,050 | $254,050 | $-- | $-- |
| Total Assets | $254,050 | $254,050 | $-- | $-- |
| Total Derivative Instruments: | $254,050 | $254,050 | $-- | $-- |
Value of Derivative Instruments
The following table is a summary of the Fund's value of derivative instruments by primary risk exposure as of October 31, 2020. For additional information on derivative instruments, please refer to the Derivative Instruments section in the accompanying Notes to Financial Statements.
| Primary Risk Exposure / Derivative Type | Value |
| | Asset | Liability |
| Equity Risk | | |
| Futures Contracts(a) | $254,050 | $0 |
| Total Equity Risk | 254,050 | 0 |
| Total Value of Derivatives | $254,050 | $0 |
(a) Reflects gross cumulative appreciation (depreciation) on futures contracts as presented in the Schedule of Investments. In the Statement of Assets and Liabilities, the period end daily variation margin is included in receivable or payable for daily variation margin on futures contracts, and the net cumulative appreciation (depreciation) is included in Total accumulated earnings (loss).
See accompanying notes which are an integral part of the financial statements.
Fidelity® Series Emerging Markets Opportunities Fund
Financial Statements
Statement of Assets and Liabilities
| | | October 31, 2020 |
| Assets | | |
Investment in securities, at value (including securities loaned of $230,305,307) — See accompanying schedule:
Unaffiliated issuers (cost $19,916,973,559) | $26,038,443,099 | |
| Fidelity Central Funds (cost $634,168,912) | 634,199,494 | |
| Other affiliated issuers (cost $488,260,723) | 442,534,144 | |
| Total Investment in Securities (cost $21,039,403,194) | | $27,115,176,737 |
| Cash | | 737 |
| Foreign currency held at value (cost $49,636,366) | | 49,434,611 |
| Receivable for investments sold | | 335,565,054 |
| Receivable for fund shares sold | | 147,772 |
| Dividends receivable | | 33,770,585 |
| Distributions receivable from Fidelity Central Funds | | 67,486 |
| Receivable for daily variation margin on futures contracts | | 254,050 |
| Receivable from investment adviser for expense reductions | | 744,938 |
| Other receivables | | 2,737,124 |
| Total assets | | 27,537,899,094 |
| Liabilities | | |
| Payable for investments purchased | $104,666,209 | |
| Payable for fund shares redeemed | 359,567,819 | |
| Other payables and accrued expenses | 1,664,323 | |
| Collateral on securities loaned | 242,217,590 | |
| Total liabilities | | 708,115,941 |
| Net Assets | | $26,829,783,153 |
| Net Assets consist of: | | |
| Paid in capital | | $20,109,266,935 |
| Total accumulated earnings (loss) | | 6,720,516,218 |
| Net Assets | | $26,829,783,153 |
| Net Asset Value, offering price and redemption price per share ($26,829,783,153 ÷ 1,248,223,557 shares) | | $21.49 |
See accompanying notes which are an integral part of the financial statements.
Statement of Operations
| | | Year ended October 31, 2020 |
| Investment Income | | |
| Dividends (including $7,500,754 earned from other affiliated issuers) | | $461,638,909 |
| Interest | | 351,397 |
| Income from Fidelity Central Funds (including $1,581,989 from security lending) | | 6,388,946 |
| Income before foreign taxes withheld | | 468,379,252 |
| Less foreign taxes withheld | | (60,808,622) |
| Total income | | 407,570,630 |
| Expenses | | |
| Custodian fees and expenses | $7,916,800 | |
| Independent trustees' fees and expenses | 121,564 | |
| Miscellaneous | 51,123 | |
| Total expenses before reductions | 8,089,487 | |
| Expense reductions | (4,795,383) | |
| Total expenses after reductions | | 3,294,104 |
| Net investment income (loss) | | 404,276,526 |
| Realized and Unrealized Gain (Loss) | | |
| Net realized gain (loss) on: | | |
| Investment securities: | | |
| Unaffiliated issuers (net of foreign taxes of $44,219) | 593,340,043 | |
| Fidelity Central Funds | 76,542 | |
| Other affiliated issuers | (4,580,920) | |
| Foreign currency transactions | (8,596,039) | |
| Futures contracts | 114,610,793 | |
| Total net realized gain (loss) | | 694,850,419 |
| Change in net unrealized appreciation (depreciation) on: | | |
| Investment securities: | | |
| Unaffiliated issuers (net of decrease in deferred foreign taxes of $652,948) | 2,579,293,312 | |
| Fidelity Central Funds | (2) | |
| Other affiliated issuers | (51,387,674) | |
| Assets and liabilities in foreign currencies | (223,621) | |
| Futures contracts | (9,430,784) | |
| Total change in net unrealized appreciation (depreciation) | | 2,518,251,231 |
| Net gain (loss) | | 3,213,101,650 |
| Net increase (decrease) in net assets resulting from operations | | $3,617,378,176 |
See accompanying notes which are an integral part of the financial statements.
Statement of Changes in Net Assets
| | Year ended October 31, 2020 | Year ended October 31, 2019 |
| Increase (Decrease) in Net Assets | | |
| Operations | | |
| Net investment income (loss) | $404,276,526 | $482,062,738 |
| Net realized gain (loss) | 694,850,419 | (208,079,806) |
| Change in net unrealized appreciation (depreciation) | 2,518,251,231 | 2,514,649,302 |
| Net increase (decrease) in net assets resulting from operations | 3,617,378,176 | 2,788,632,234 |
| Distributions to shareholders | (524,696,384) | (1,185,081,846) |
| Share transactions | | |
| Proceeds from sales of shares | 8,019,585,485 | 3,603,790,396 |
| Reinvestment of distributions | 524,696,384 | 1,185,081,846 |
| Cost of shares redeemed | (3,482,228,176) | (1,315,184,348) |
| Net increase (decrease) in net assets resulting from share transactions | 5,062,053,693 | 3,473,687,894 |
| Total increase (decrease) in net assets | 8,154,735,485 | 5,077,238,282 |
| Net Assets | | |
| Beginning of period | 18,675,047,668 | 13,597,809,386 |
| End of period | $26,829,783,153 | $18,675,047,668 |
| Other Information | | |
| Shares | | |
| Sold | 435,733,944 | 193,300,145 |
| Issued in reinvestment of distributions | 26,208,611 | 72,129,145 |
| Redeemed | (176,977,985) | (72,263,706) |
| Net increase (decrease) | 284,964,570 | 193,165,584 |
See accompanying notes which are an integral part of the financial statements.
Financial Highlights
Fidelity Series Emerging Markets Opportunities Fund
| | | | | | |
| Years ended October 31, | 2020 | 2019 | 2018 | 2017 | 2016 |
| Selected Per–Share Data | | | | | |
| Net asset value, beginning of period | $19.39 | $17.66 | $21.35 | $16.79 | $15.31 |
| Income from Investment Operations | | | | | |
| Net investment income (loss)A | .35 | .57B | .45 | .30 | .19 |
| Net realized and unrealized gain (loss) | 2.26 | 2.71 | (3.52) | 4.49 | 1.47 |
| Total from investment operations | 2.61 | 3.28 | (3.07) | 4.79 | 1.66 |
| Distributions from net investment income | (.50) | (.41) | (.39) | (.19) | (.18) |
| Distributions from net realized gain | (.02) | (1.14) | (.23) | (.04) | – |
| Total distributions | (.51)C | (1.55) | (.62) | (.23) | (.18) |
| Net asset value, end of period | $21.49 | $19.39 | $17.66 | $21.35 | $16.79 |
| Total ReturnD | 13.66% | 20.13% | (14.82)% | 29.04% | 11.02% |
| Ratios to Average Net AssetsE,F | | | | | |
| Expenses before reductions | .04% | .04% | .05% | .59% | 1.03% |
| Expenses net of fee waivers, if any | .01% | .01% | .01% | .57% | 1.03% |
| Expenses net of all reductions | .01% | .01% | .01% | .56% | 1.03% |
| Net investment income (loss) | 1.78% | 3.12%B | 2.16% | 1.63% | 1.24% |
| Supplemental Data | | | | | |
| Net assets, end of period (000 omitted) | $26,829,783 | $18,675,048 | $13,597,809 | $15,747,447 | $6,998,219 |
| Portfolio turnover rateG | 42%H | 54% | 64% | 56% | 45% |
A Calculated based on average shares outstanding during the period.
B Net investment income per share reflects one or more large, non-recurring dividend which amounted to $.15 per share. Excluding such non-recurring dividend, the ratio of net investment income (loss) to average net assets would have been 2.29%.
C Total distributions per share do not sum due to rounding.
D Total returns would have been lower if certain expenses had not been reduced during the applicable periods shown.
E Fees and expenses of any underlying mutual funds or exchange-traded funds (ETFs) are not included in the Fund's expense ratio. The Fund indirectly bears its proportionate share of these expenses. For additional expense information related to investments in Fidelity Central Funds, please refer to the "Investments in Fidelity Central Funds" note found in the Notes to Financial Statements section of the most recent Annual or Semi-Annual report.
F Expense ratios reflect operating expenses of the class. Expenses before reductions do not reflect amounts reimbursed, waived, or reduced through arrangements with the investment advisor, brokerage services, or other offset arrangements, if applicable, and do not represent the amount paid by the class during periods when reimbursements, waivers or reductions occur.
G Amount does not include the portfolio activity of any underlying mutual funds or exchange-traded funds (ETFs).
H Portfolio turnover rate excludes securities received or delivered in-kind.
See accompanying notes which are an integral part of the financial statements.
Fidelity® Series International Growth Fund
Performance: The Bottom Line
Average annual total return reflects the change in the value of an investment, assuming reinvestment of distributions from dividend income and capital gains (the profits earned upon the sale of securities that have grown in value, if any) and assuming a constant rate of performance each year. The hypothetical investment and the average annual total returns do not reflect the deduction of taxes that a shareholder would pay on fund distributions or the redemption of fund shares. During periods of reimbursement by Fidelity, a fund’s total return will be greater than it would be had the reimbursement not occurred. How a fund did yesterday is no guarantee of how it will do tomorrow.
Average Annual Total Returns
| For the periods ended October 31, 2020 | Past 1 year | Past 5 years | Past 10 years |
| Fidelity® Series International Growth Fund | 9.39% | 9.00% | 8.05% |
$10,000 Over 10 Years
Let's say hypothetically that $10,000 was invested in Fidelity® Series International Growth Fund on October 31, 2010.
The chart shows how the value of your investment would have changed, and also shows how the MSCI EAFE Growth Index performed over the same period.

| Period Ending Values |
| $21,684 | Fidelity® Series International Growth Fund |
| $18,545 | MSCI EAFE Growth Index |
Fidelity® Series International Growth Fund
Management's Discussion of Fund Performance
Market Recap: The MSCI ACWI (All Country World Index) ex USA Index returned -2.46% for the 12 months ending October 31, 2020, in what was a bumpy ride for non-U.S. equities, marked by a steep but brief decline due to the early-2020 outbreak and spread of the coronavirus, followed by a sharp upturn. Declared a pandemic on March 11, the crisis and containment efforts caused broad contraction in economic activity, elevated volatility and dislocation in financial markets. A historically rapid and expansive monetary- and fiscal-policy response around the world provided a partial offset to the economic disruption. Other supporting factors included resilient corporate earnings and near-term potential for a COVID-19 vaccine breakthrough. This was evident in the index’s 12.28% gain in the final six months of the year. Currency fluctuation generally boosted foreign developed-markets equities for the year, while the reverse was true for emerging-markets stocks. Late in the period, the index was pressured by a second wave of COVID-19 cases in some regions, and stretched valuations and crowded positioning in big tech. For the full year, the U.K. (-22%), Asia Pacific ex Japan (-8%), Canada (-5%) and Europe ex U.K. (-4%) notably lagged. Emerging markets (+9%) and Japan (+1%) outperformed. By sector, energy (-38%), financials and real estate (-20% each) lagged, whereas information technology (+ 25%) and communication services (+15%) topped the index.
Comments from Portfolio Manager Jed Weiss: For the fiscal year ending October 31, 2020, the fund gained 9.39%, outperforming the 5.34% result of the benchmark MSCI EAFE Growth Index (Net MA). From a regional standpoint, stock picks in Japan, as well as out-of-benchmark exposure to the U.S. and emerging markets, contributed most to the fund's relative result. By sector, the primary contributor to performance versus the benchmark was positioning among consumer staples stocks, primarily driven by the food, beverage & tobacco industry. Strong investment choices within consumer discretionary also added value, as did the portfolio’s positioning in real estate. Our top individual relative contributor was an out-of-benchmark stake in Alibaba Group Holding (+74%), which was among the largest holdings as of October 31. Also bolstering performance was our outsized stake in Keyence, which gained 43% and also was among our biggest positions on October 31. Avoiding Airbus, a benchmark component that returned -49%, also aided performance. Conversely, stock picks and an underweighting in Europe ex U.K. – especially in Germany – hurt the fund's relative result. Underweighted exposure to the strong-performing Japanese market hampered performance as well. By sector, the primary detractor from performance versus the benchmark was an underweighting in health care, especially within the pharmaceuticals, biotechnology & life sciences industry. Security selection in materials and an overweighting in financials also hindered the fund's relative performance. The biggest individual relative detractor was an overweight position in SAP (-19%), which was among the fund's largest holdings. Another notable relative detractor was an overweighting in Amadeus IT Group (-34%). Avoiding Sony, a benchmark component that gained roughly 36%, also hurt relative performance. Notable changes in positioning include reduced exposure to Germany and U.K. By sector, meaningful changes in positioning include increased exposure to health care and a lower allocation to consumer discretionary.
The views expressed above reflect those of the portfolio manager(s) only through the end of the period as stated on the cover of this report and do not necessarily represent the views of Fidelity or any other person in the Fidelity organization. Any such views are subject to change at any time based upon market or other conditions and Fidelity disclaims any responsibility to update such views. These views may not be relied on as investment advice and, because investment decisions for a Fidelity fund are based on numerous factors, may not be relied on as an indication of trading intent on behalf of any Fidelity fund.
Fidelity® Series International Growth Fund
Investment Summary (Unaudited)
Geographic Diversification (% of fund's net assets)
| As of October 31, 2020 |
| | United States of America* | 19.2% |
| | Japan | 15.3% |
| | Switzerland | 13.0% |
| | Germany | 7.6% |
| | France | 5.2% |
| | Cayman Islands | 4.9% |
| | Sweden | 4.7% |
| | Hong Kong | 4.6% |
| | Netherlands | 4.3% |
| | Other | 21.2% |
* Includes Short-Term investments and Net Other Assets (Liabilities).
Percentages are based on country or territory of incorporation and are adjusted for the effect of futures contracts, if applicable.
Asset Allocation as of October 31, 2020
| | % of fund's net assets |
| Stocks | 98.1 |
| Short-Term Investments and Net Other Assets (Liabilities) | 1.9 |
Top Ten Stocks as of October 31, 2020
| | % of fund's net assets |
| Nestle SA (Reg. S) (Switzerland, Food Products) | 6.5 |
| Roche Holding AG (participation certificate) (Switzerland, Pharmaceuticals) | 4.7 |
| ASML Holding NV (Netherlands) (Netherlands, Semiconductors & Semiconductor Equipment) | 4.3 |
| Keyence Corp. (Japan, Electronic Equipment & Components) | 3.9 |
| SAP SE (Germany, Software) | 3.0 |
| AIA Group Ltd. (Hong Kong, Insurance) | 2.9 |
| CSL Ltd. (Australia, Biotechnology) | 2.8 |
| Alibaba Group Holding Ltd. sponsored ADR (Cayman Islands, Internet & Direct Marketing Retail) | 2.8 |
| Linde PLC (Germany, Chemicals) | 2.6 |
| LVMH Moet Hennessy Louis Vuitton SE (France, Textiles, Apparel & Luxury Goods) | 2.5 |
| | 36.0 |
Top Market Sectors as of October 31, 2020
| | % of fund's net assets |
| Information Technology | 24.0 |
| Industrials | 19.1 |
| Financials | 13.9 |
| Health Care | 13.2 |
| Consumer Staples | 7.4 |
| Consumer Discretionary | 6.8 |
| Materials | 6.4 |
| Communication Services | 6.3 |
| Real Estate | 1.0 |
Fidelity® Series International Growth Fund
Schedule of Investments October 31, 2020
Showing Percentage of Net Assets
| Common Stocks - 98.1% | | | |
| | | Shares | Value |
| Australia - 2.8% | | | |
| CSL Ltd. | | 1,593,716 | $322,659,518 |
| Bailiwick of Jersey - 1.9% | | | |
| Experian PLC | | 5,924,289 | 217,029,802 |
| Belgium - 0.7% | | | |
| UCB SA | | 816,800 | 80,573,934 |
| Brazil - 0.3% | | | |
| BM&F BOVESPA SA | | 4,233,354 | 37,663,751 |
| Canada - 2.1% | | | |
| Canadian National Railway Co. | | 483,188 | 47,999,649 |
| Canadian Pacific Railway Ltd. | | 295,308 | 88,248,838 |
| Franco-Nevada Corp. | | 794,628 | 108,306,311 |
|
| TOTAL CANADA | | | 244,554,798 |
|
| Cayman Islands - 4.9% | | | |
| Alibaba Group Holding Ltd. (a) | | 450,000 | 17,052,242 |
| Alibaba Group Holding Ltd. sponsored ADR (a) | | 989,322 | 301,436,520 |
| Tencent Holdings Ltd. | | 3,307,400 | 252,704,060 |
|
| TOTAL CAYMAN ISLANDS | | | 571,192,822 |
|
| Finland - 1.3% | | | |
| Kone OYJ (B Shares) | | 1,492,200 | 118,767,452 |
| Tikkurila Oyj | | 1,808,794 | 28,944,848 |
|
| TOTAL FINLAND | | | 147,712,300 |
|
| France - 5.2% | | | |
| Edenred SA | | 2,073,490 | 96,692,200 |
| Legrand SA | | 1,580,944 | 116,882,323 |
| LVMH Moet Hennessy Louis Vuitton SE | | 609,696 | 285,793,574 |
| Sanofi SA | | 1,117,800 | 100,929,958 |
|
| TOTAL FRANCE | | | 600,298,055 |
|
| Germany - 7.6% | | | |
| Deutsche Borse AG | | 802,845 | 118,141,473 |
| Linde PLC | | 1,364,001 | 298,971,463 |
| SAP SE | | 3,208,329 | 342,279,437 |
| Vonovia SE | | 1,860,635 | 118,794,312 |
|
| TOTAL GERMANY | | | 878,186,685 |
|
| Hong Kong - 4.6% | | | |
| AIA Group Ltd. | | 35,642,101 | 339,212,162 |
| Hong Kong Exchanges and Clearing Ltd. | | 4,017,025 | 191,822,335 |
|
| TOTAL HONG KONG | | | 531,034,497 |
|
| India - 0.8% | | | |
| Housing Development Finance Corp. Ltd. | | 3,521,500 | 90,816,881 |
| Ireland - 1.0% | | | |
| CRH PLC sponsored ADR | | 3,303,840 | 116,129,976 |
| Italy - 0.8% | | | |
| Interpump Group SpA | | 2,454,620 | 92,624,251 |
| Japan - 15.3% | | | |
| Azbil Corp. | | 3,393,205 | 137,707,460 |
| FANUC Corp. | | 931,115 | 196,674,623 |
| Hoya Corp. | | 2,246,400 | 253,521,825 |
| Keyence Corp. | | 987,287 | 448,053,051 |
| Lasertec Corp. | | 670,000 | 58,035,940 |
| Misumi Group, Inc. | | 7,295,105 | 216,661,508 |
| Nabtesco Corp. | | 1,183,746 | 44,222,674 |
| OSG Corp. | | 2,857,646 | 42,810,548 |
| Recruit Holdings Co. Ltd. | | 4,936,105 | 187,822,134 |
| SHO-BOND Holdings Co. Ltd. | | 1,976,400 | 95,397,413 |
| USS Co. Ltd. | | 4,805,600 | 87,897,199 |
|
| TOTAL JAPAN | | | 1,768,804,375 |
|
| Kenya - 0.7% | | | |
| Safaricom Ltd. | | 284,131,800 | 80,564,945 |
| Korea (South) - 0.1% | | | |
| BGF Retail Co. Ltd. | | 98,738 | 10,245,109 |
| Netherlands - 4.3% | | | |
| ASML Holding NV (Netherlands) | | 1,384,246 | 500,824,504 |
| New Zealand - 0.4% | | | |
| Auckland International Airport Ltd. | | 8,916,062 | 41,244,627 |
| Norway - 1.2% | | | |
| Adevinta ASA Class B (a) | | 3,232,424 | 49,942,392 |
| Schibsted ASA (B Shares) | | 2,533,754 | 90,928,663 |
|
| TOTAL NORWAY | | | 140,871,055 |
|
| South Africa - 0.5% | | | |
| Clicks Group Ltd. | | 4,297,922 | 62,162,611 |
| Spain - 1.9% | | | |
| Amadeus IT Holding SA Class A | | 2,632,364 | 125,666,434 |
| Cellnex Telecom SA (b) | | 1,447,700 | 92,935,836 |
|
| TOTAL SPAIN | | | 218,602,270 |
|
| Sweden - 4.7% | | | |
| ASSA ABLOY AB (B Shares) | | 10,935,591 | 234,376,718 |
| Atlas Copco AB (A Shares) | | 4,758,082 | 210,088,377 |
| Epiroc AB Class A | | 6,773,269 | 101,236,714 |
|
| TOTAL SWEDEN | | | 545,701,809 |
|
| Switzerland - 13.0% | | | |
| Nestle SA (Reg. S) | | 6,631,480 | 745,895,172 |
| Roche Holding AG (participation certificate) | | 1,695,684 | 544,876,743 |
| Schindler Holding AG: | | | |
| (participation certificate) | | 422,831 | 108,134,434 |
| (Reg.) | | 156,202 | 40,100,279 |
| Temenos Group AG | | 578,060 | 62,058,156 |
|
| TOTAL SWITZERLAND | | | 1,501,064,784 |
|
| Taiwan - 1.4% | | | |
| Taiwan Semiconductor Manufacturing Co. Ltd. | | 10,860,885 | 164,290,070 |
| United Kingdom - 3.3% | | | |
| Dechra Pharmaceuticals PLC | | 891,200 | 40,316,872 |
| InterContinental Hotel Group PLC ADR | | 1,123,730 | 57,467,552 |
| London Stock Exchange Group PLC | | 1,250,492 | 134,800,441 |
| Prudential PLC | | 1,656,568 | 20,260,660 |
| Rightmove PLC | | 6,774,045 | 54,234,291 |
| Spectris PLC | | 2,227,022 | 71,435,249 |
|
| TOTAL UNITED KINGDOM | | | 378,515,065 |
|
| United States of America - 17.3% | | | |
| Alphabet, Inc. Class A (a) | | 61,787 | 99,854,589 |
| Autoliv, Inc. | | 659,434 | 49,985,097 |
| Black Knight, Inc. (a) | | 1,093,923 | 96,210,528 |
| Lam Research Corp. | | 352,565 | 120,605,435 |
| Marsh & McLennan Companies, Inc. | | 1,626,931 | 168,322,281 |
| MasterCard, Inc. Class A | | 681,431 | 196,688,244 |
| Moody's Corp. | | 628,659 | 165,274,451 |
| MSCI, Inc. | | 504,127 | 176,363,790 |
| NICE Systems Ltd. sponsored ADR (a)(c) | | 671,554 | 153,288,916 |
| PriceSmart, Inc. | | 510,732 | 35,240,508 |
| ResMed, Inc. | | 958,064 | 183,890,804 |
| S&P Global, Inc. | | 506,680 | 163,520,836 |
| Sherwin-Williams Co. | | 264,847 | 182,209,439 |
| Visa, Inc. Class A | | 1,124,770 | 204,381,957 |
|
| TOTAL UNITED STATES OF AMERICA | | | 1,995,836,875 |
|
| TOTAL COMMON STOCKS | | | |
| (Cost $6,375,338,668) | | | 11,339,205,369 |
|
| Money Market Funds - 1.5% | | | |
| Fidelity Cash Central Fund 0.10% (d) | | 142,074,478 | 142,102,893 |
| Fidelity Securities Lending Cash Central Fund 0.11% (d)(e) | | 33,848,056 | 33,851,441 |
| TOTAL MONEY MARKET FUNDS | | | |
| (Cost $175,954,334) | | | 175,954,334 |
| TOTAL INVESTMENT IN SECURITIES - 99.6% | | | |
| (Cost $6,551,293,002) | | | 11,515,159,703 |
| NET OTHER ASSETS (LIABILITIES) - 0.4% | | | 42,835,250 |
| NET ASSETS - 100% | | | $11,557,994,953 |
Categorizations in the Schedule of Investments are based on country or territory of incorporation.
Legend
(a) Non-income producing
(b) Security exempt from registration under Rule 144A of the Securities Act of 1933. These securities may be resold in transactions exempt from registration, normally to qualified institutional buyers. At the end of the period, the value of these securities amounted to $92,935,836 or 0.8% of net assets.
(c) Security or a portion of the security is on loan at period end.
(d) Affiliated fund that is generally available only to investment companies and other accounts managed by Fidelity Investments. The rate quoted is the annualized seven-day yield of the fund at period end. A complete unaudited listing of the fund's holdings as of its most recent quarter end is available upon request. In addition, each Fidelity Central Fund's financial statements, which are not covered by the Fund's Report of Independent Registered Public Accounting Firm, are available on the SEC's website or upon request.
(e) Investment made with cash collateral received from securities on loan.
Affiliated Central Funds
Information regarding fiscal year to date income earned by the Fund from investments in Fidelity Central Funds is as follows:
| Fund | Income earned |
| Fidelity Cash Central Fund | $801,386 |
| Fidelity Securities Lending Cash Central Fund | 600,160 |
| Total | $1,401,546 |
Amounts in the income column in the above table include any capital gain distributions from underlying funds, which are presented in the corresponding line-item in the Statement of Operations, if applicable. Amount for Fidelity Securities Lending Cash Central Fund represents the income earned on investing cash collateral, less rebates paid to borrowers and any lending agent fees associated with the loan, plus any premium payments received for lending certain types of securities.
Other Affiliated Issuers
An affiliated company is a company in which the Fund has ownership of at least 5% of the voting securities. Fiscal year to date transactions with companies which are or were affiliates are as follows:
| Affiliate | Value, beginning of period | Purchases(a) | Sales Proceeds | Dividend Income | Realized Gain (loss) | Change in Unrealized appreciation (depreciation) | Value, end of period |
| SHO-BOND Holdings Co. Ltd. | $113,264,445 | $-- | $41,509,420 | $1,690,797 | $22,158,328 | $1,484,060 | $-- |
| Total | $113,264,445 | $-- | $41,509,420 | $1,690,797 | $22,158,328 | $1,484,060 | $-- |
(a) Includes the value of securities received through in-kind transactions, if applicable.
Investment Valuation
The following is a summary of the inputs used, as of October 31, 2020, involving the Fund's assets and liabilities carried at fair value. The inputs or methodology used for valuing securities may not be an indication of the risk associated with investing in those securities. For more information on valuation inputs, and their aggregation into the levels used below, please refer to the Investment Valuation section in the accompanying Notes to Financial Statements.
| | Valuation Inputs at Reporting Date: |
| Description | Total | Level 1 | Level 2 | Level 3 |
| Investments in Securities: | | | | |
| Equities: | | | | |
| Communication Services | $721,164,776 | $468,460,716 | $252,704,060 | $-- |
| Consumer Discretionary | 799,632,184 | 408,889,169 | 390,743,015 | -- |
| Consumer Staples | 853,543,400 | 35,240,508 | 818,302,892 | -- |
| Financials | 1,606,199,061 | 1,021,108,917 | 585,090,144 | -- |
| Health Care | 1,526,769,654 | 304,781,610 | 1,221,988,044 | -- |
| Industrials | 2,200,322,364 | 924,082,317 | 1,276,240,047 | -- |
| Information Technology | 2,778,217,581 | 1,127,027,119 | 1,651,190,462 | -- |
| Materials | 734,562,037 | 734,562,037 | -- | -- |
| Real Estate | 118,794,312 | 118,794,312 | -- | -- |
| Money Market Funds | 175,954,334 | 175,954,334 | -- | -- |
| Total Investments in Securities: | $11,515,159,703 | $5,318,901,039 | $6,196,258,664 | $-- |
See accompanying notes which are an integral part of the financial statements.
Fidelity® Series International Growth Fund
Financial Statements
Statement of Assets and Liabilities
| | | October 31, 2020 |
| Assets | | |
Investment in securities, at value (including securities loaned of $33,056,385) — See accompanying schedule:
Unaffiliated issuers (cost $6,375,338,668) | $11,339,205,369 | |
| Fidelity Central Funds (cost $175,954,334) | 175,954,334 | |
| Total Investment in Securities (cost $6,551,293,002) | | $11,515,159,703 |
| Foreign currency held at value (cost $13,018,031) | | 13,018,029 |
| Receivable for investments sold | | 15,510,841 |
| Receivable for fund shares sold | | 14,716,666 |
| Dividends receivable | | 46,551,312 |
| Distributions receivable from Fidelity Central Funds | | 8,025 |
| Total assets | | 11,604,964,576 |
| Liabilities | | |
| Payable for investments purchased | $5,192,637 | |
| Payable for fund shares redeemed | 7,614,203 | |
| Other payables and accrued expenses | 311,342 | |
| Collateral on securities loaned | 33,851,441 | |
| Total liabilities | | 46,969,623 |
| Net Assets | | $11,557,994,953 |
| Net Assets consist of: | | |
| Paid in capital | | $4,720,032,183 |
| Total accumulated earnings (loss) | | 6,837,962,770 |
| Net Assets | | $11,557,994,953 |
| Net Asset Value, offering price and redemption price per share ($11,557,994,953 ÷ 641,644,905 shares) | | $18.01 |
See accompanying notes which are an integral part of the financial statements.
Statement of Operations
| | | Year ended October 31, 2020 |
| Investment Income | | |
| Dividends (including $1,690,797 earned from other affiliated issuers) | | $179,409,252 |
| Income from Fidelity Central Funds (including $600,160 from security lending) | | 1,401,546 |
| Income before foreign taxes withheld | | 180,810,798 |
| Less foreign taxes withheld | | (16,223,775) |
| Total income | | 164,587,023 |
| Expenses | | |
| Custodian fees and expenses | $948,340 | |
| Independent trustees' fees and expenses | 82,370 | |
| Interest | 145,208 | |
| Miscellaneous | 33,794 | |
| Total expenses | | 1,209,712 |
| Net investment income (loss) | | 163,377,311 |
| Realized and Unrealized Gain (Loss) | | |
| Net realized gain (loss) on: | | |
| Investment securities: | | |
| Unaffiliated issuers (net of foreign taxes of $95,932) | 1,727,202,733 | |
| Fidelity Central Funds | (15,766) | |
| Other affiliated issuers | 22,158,328 | |
| Foreign currency transactions | 502,756 | |
| Total net realized gain (loss) | | 1,749,848,051 |
| Change in net unrealized appreciation (depreciation) on: | | |
| Investment securities: | | |
| Unaffiliated issuers (net of decrease in deferred foreign taxes of $1,480,544) | (841,823,908) | |
| Fidelity Central Funds | (2,089) | |
| Other affiliated issuers | 1,484,060 | |
| Assets and liabilities in foreign currencies | 2,293,827 | |
| Total change in net unrealized appreciation (depreciation) | | (838,048,110) |
| Net gain (loss) | | 911,799,941 |
| Net increase (decrease) in net assets resulting from operations | | $1,075,177,252 |
See accompanying notes which are an integral part of the financial statements.
Statement of Changes in Net Assets
| | Year ended October 31, 2020 | Year ended October 31, 2019 |
| Increase (Decrease) in Net Assets | | |
| Operations | | |
| Net investment income (loss) | $163,377,311 | $355,554,527 |
| Net realized gain (loss) | 1,749,848,051 | 284,098,541 |
| Change in net unrealized appreciation (depreciation) | (838,048,110) | 2,433,736,270 |
| Net increase (decrease) in net assets resulting from operations | 1,075,177,252 | 3,073,389,338 |
| Distributions to shareholders | (625,700,226) | (924,506,492) |
| Share transactions | | |
| Proceeds from sales of shares | 1,244,524,475 | 1,218,860,154 |
| Reinvestment of distributions | 625,700,226 | 924,506,492 |
| Cost of shares redeemed | (7,263,497,644) | (1,904,058,640) |
| Net increase (decrease) in net assets resulting from share transactions | (5,393,272,943) | 239,308,006 |
| Total increase (decrease) in net assets | (4,943,795,917) | 2,388,190,852 |
| Net Assets | | |
| Beginning of period | 16,501,790,870 | 14,113,600,018 |
| End of period | $11,557,994,953 | $16,501,790,870 |
| Other Information | | |
| Shares | | |
| Sold | 72,559,431 | 79,419,141 |
| Issued in reinvestment of distributions | 36,167,643 | 68,583,568 |
| Redeemed | (433,551,930) | (125,219,315) |
| Net increase (decrease) | (324,824,856) | 22,783,394 |
See accompanying notes which are an integral part of the financial statements.
Financial Highlights
Fidelity Series International Growth Fund
| | | | | | |
| Years ended October 31, | 2020 | 2019 | 2018 | 2017 | 2016 |
| Selected Per–Share Data | | | | | |
| Net asset value, beginning of period | $17.07 | $14.96 | $16.22 | $13.37 | $14.28 |
| Income from Investment Operations | | | | | |
| Net investment income (loss)A | .20 | .37B | .30 | .21 | .17C |
| Net realized and unrealized gain (loss) | 1.38 | 2.74 | (1.05) | 2.97 | (.60) |
| Total from investment operations | 1.58 | 3.11 | (.75) | 3.18 | (.43) |
| Distributions from net investment income | (.37) | (.28) | (.24) | (.16) | (.16) |
| Distributions from net realized gain | (.27) | (.72) | (.27) | (.17) | (.33) |
| Total distributions | (.64) | (1.00) | (.51) | (.33) | (.48)D |
| Net asset value, end of period | $18.01 | $17.07 | $14.96 | $16.22 | $13.37 |
| Total ReturnE | 9.39% | 22.58% | (4.82)% | 24.42% | (3.10)% |
| Ratios to Average Net AssetsF,G | | | | | |
| Expenses before reductions | .01% | .01% | .01% | .51% | .94% |
| Expenses net of fee waivers, if any | .01% | .01% | .01% | .51% | .94% |
| Expenses net of all reductions | .01% | .01% | - %H | .51% | .94% |
| Net investment income (loss) | 1.18% | 2.38%B | 1.84% | 1.41% | 1.27%C |
| Supplemental Data | | | | | |
| Net assets, end of period (000 omitted) | $11,557,995 | $16,501,791 | $14,113,600 | $14,784,814 | $5,618,983 |
| Portfolio turnover rateI | 16%J | 24% | 33% | 23% | 26% |
A Calculated based on average shares outstanding during the period.
B Net investment income per share reflects one or more large, non-recurring dividend which amounted to $.07 per share. Excluding such non-recurring dividend, the ratio of net investment income (loss) to average net assets would have been 1.92%.
C Net investment income per share reflects one or more large, non-recurring dividend which amounted to $.05 per share. Excluding such non-recurring dividend, the ratio of net investment income (loss) to average net assets would have been .93%.
D Total distributions per share do not sum due to rounding.
E Total returns would have been lower if certain expenses had not been reduced during the applicable periods shown.
F Fees and expenses of any underlying mutual funds or exchange-traded funds (ETFs) are not included in the Fund's expense ratio. The Fund indirectly bears its proportionate share of these expenses. For additional expense information related to investments in Fidelity Central Funds, please refer to the "Investments in Fidelity Central Funds" note found in the Notes to Financial Statements section of the most recent Annual or Semi-Annual report.
G Expense ratios reflect operating expenses of the class. Expenses before reductions do not reflect amounts reimbursed, waived, or reduced through arrangements with the investment advisor, brokerage services, or other offset arrangements, if applicable, and do not represent the amount paid by the class during periods when reimbursements, waivers or reductions occur.
H Amount represents less than .005%.
I Amount does not include the portfolio activity of any underlying mutual funds or exchange-traded funds (ETFs).
J Portfolio turnover rate excludes securities received or delivered in-kind.
See accompanying notes which are an integral part of the financial statements.
Fidelity® Series International Small Cap Fund
Performance: The Bottom Line
Average annual total return reflects the change in the value of an investment, assuming reinvestment of distributions from dividend income and capital gains (the profits earned upon the sale of securities that have grown in value, if any) and assuming a constant rate of performance each year. The hypothetical investment and the average annual total returns do not reflect the deduction of taxes that a shareholder would pay on fund distributions or the redemption of fund shares. During periods of reimbursement by Fidelity, a fund’s total return will be greater than it would be had the reimbursement not occurred. How a fund did yesterday is no guarantee of how it will do tomorrow.
Average Annual Total Returns
| For the periods ended October 31, 2020 | Past 1 year | Past 5 years | Past 10 years |
| Fidelity® Series International Small Cap Fund | 9.60% | 8.42% | 8.81% |
$10,000 Over 10 Years
Let's say hypothetically that $10,000 was invested in Fidelity® Series International Small Cap Fund on October 31, 2010.
The chart shows how the value of your investment would have changed, and also shows how the MSCI EAFE Small Cap Index performed over the same period.
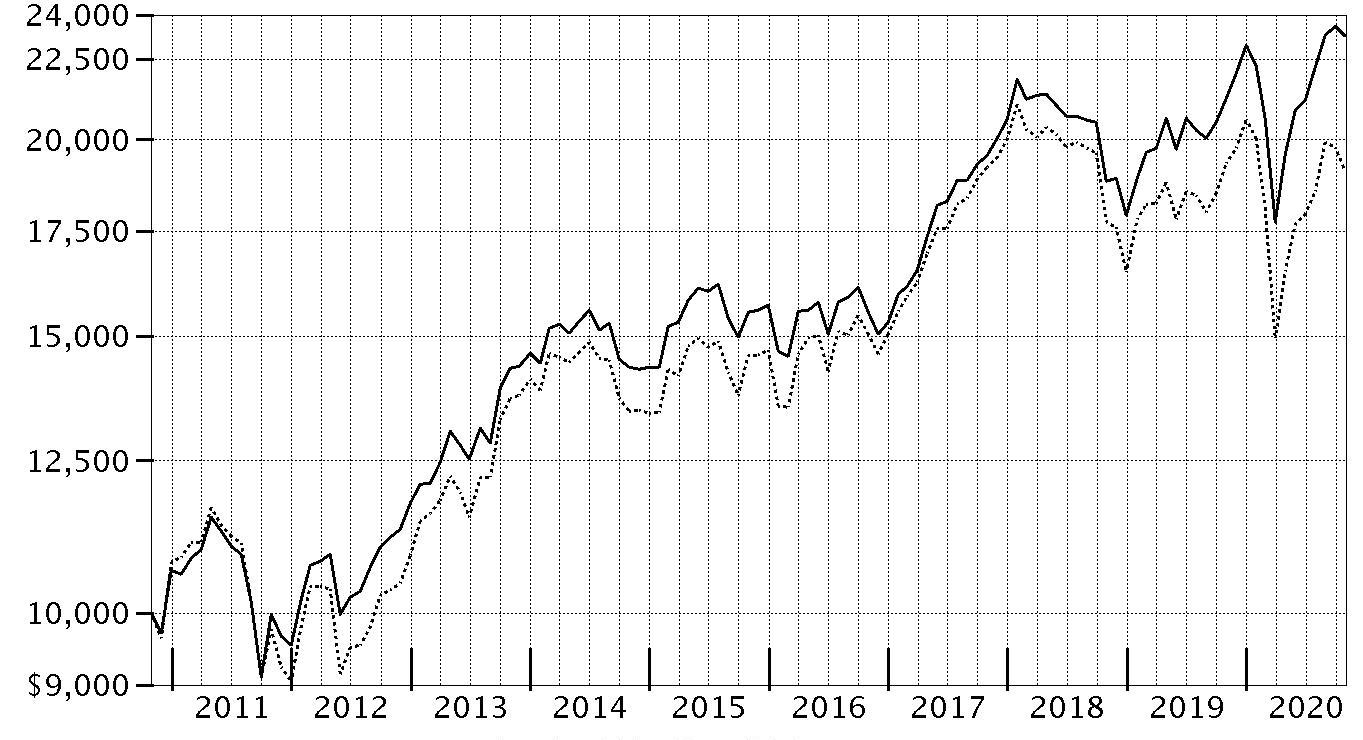
| Period Ending Values |
| $23,271 | Fidelity® Series International Small Cap Fund |
| $19,081 | MSCI EAFE Small Cap Index |
Fidelity® Series International Small Cap Fund
Management's Discussion of Fund Performance
Market Recap: The MSCI ACWI (All Country World Index) ex USA Index returned -2.46% for the 12 months ending October 31, 2020, in what was a bumpy ride for non-U.S. equities, marked by a steep but brief decline due to the early-2020 outbreak and spread of the coronavirus, followed by a sharp upturn. Declared a pandemic on March 11, the crisis and containment efforts caused broad contraction in economic activity, elevated volatility and dislocation in financial markets. A historically rapid and expansive monetary- and fiscal-policy response around the world provided a partial offset to the economic disruption. Other supporting factors included resilient corporate earnings and near-term potential for a COVID-19 vaccine breakthrough. This was evident in the index’s 12.28% gain in the final six months of the year. Currency fluctuation generally boosted foreign developed-markets equities for the year, while the reverse was true for emerging-markets stocks. Late in the period, the index was pressured by a second wave of COVID-19 cases in some regions, and stretched valuations and crowded positioning in big tech. For the full year, the U.K. (-22%), Asia Pacific ex Japan (-8%), Canada (-5%) and Europe ex U.K. (-4%) notably lagged. Emerging markets (+9%) and Japan (+1%) outperformed. By sector, energy (-38%), financials and real estate (-20% each) lagged, whereas information technology (+ 25%) and communication services (+15%) topped the index.
Comments from Lead Manager Jed Weiss and Co-Managers Patrick Drouot and Preeti Sayana: For the fiscal year ending October 31, 2020, the fund gained 9.60%, outperforming the -1.22% result of the benchmark MSCI EAFE Small Cap Index (Net MA). From a regional standpoint, stock picks in Japan and Europe contributed most to the fund's relative result. By sector, the primary contributor to performance versus the benchmark were picks among industrials stocks, especially within the capital goods industry. Also lifting the fund's relative result were investment choices and overweightings in both the health care and information technology sectors. The biggest individual relative contributor was an overweight position in Lasertec (+138%), which was among the portfolio’s biggest holdings. Also bolstering performance was our larger-than-benchmark stake in Azbil, which gained 46% and also was one of the fund's largest holdings. Another key relative contributor was a non-benchmark stake in Addlife (+169%). Conversely, an underweighting in Australia, as well as stock picking in Belgium, hindered the fund's relative result. By sector, the primary detractor from performance versus the benchmark was our stock selection in communication services, especially within the media & entertainment industry. The biggest individual relative detractor was an overweight position in Barco (-49%). Another notable relative detractor was our outsized stake in Hyve Group (-88%). Further weighing on the portfolio’s relative return was an outsized stake in OSG (-30%).
The views expressed above reflect those of the portfolio manager(s) only through the end of the period as stated on the cover of this report and do not necessarily represent the views of Fidelity or any other person in the Fidelity organization. Any such views are subject to change at any time based upon market or other conditions and Fidelity disclaims any responsibility to update such views. These views may not be relied on as investment advice and, because investment decisions for a Fidelity fund are based on numerous factors, may not be relied on as an indication of trading intent on behalf of any Fidelity fund.
Notes to shareholders: On July 1, 2020, Patrick Buchanan came off of the fund.
Fidelity® Series International Small Cap Fund
Investment Summary (Unaudited)
Geographic Diversification (% of fund's net assets)
| As of October 31, 2020 |
| | Japan | 35.0% |
| | United Kingdom | 14.3% |
| | United States of America* | 11.7% |
| | Sweden | 6.4% |
| | Germany | 4.9% |
| | Denmark | 2.5% |
| | Canada | 2.4% |
| | Switzerland | 2.4% |
| | Netherlands | 2.3% |
| | Other | 18.1% |

* Includes Short-Term investments and Net Other Assets (Liabilities).
Percentages are based on country or territory of incorporation and are adjusted for the effect of futures contracts, if applicable.
Asset Allocation as of October 31, 2020
| | % of fund's net assets |
| Stocks | 90.4 |
| Investment Companies | 4.2 |
| Short-Term Investments and Net Other Assets (Liabilities) | 5.4 |
Top Ten Stocks as of October 31, 2020
| | % of fund's net assets |
| Azbil Corp. (Japan, Electronic Equipment & Components) | 3.8 |
| OBIC Co. Ltd. (Japan, IT Services) | 2.9 |
| Lasertec Corp. (Japan, Semiconductors & Semiconductor Equipment) | 2.7 |
| Spirax-Sarco Engineering PLC (United Kingdom, Machinery) | 2.7 |
| Dechra Pharmaceuticals PLC (United Kingdom, Pharmaceuticals) | 2.3 |
| Avon Rubber PLC (United Kingdom, Aerospace & Defense) | 2.2 |
| Tecan Group AG (Switzerland, Life Sciences Tools & Services) | 2.1 |
| AddTech AB (B Shares) (Sweden, Trading Companies & Distributors) | 2.1 |
| Spectris PLC (United Kingdom, Electronic Equipment & Components) | 1.9 |
| SHO-BOND Holdings Co. Ltd. (Japan, Construction & Engineering) | 1.9 |
| | 24.6 |
Top Market Sectors as of October 31, 2020
| | % of fund's net assets |
| Industrials | 24.7 |
| Information Technology | 19.8 |
| Health Care | 16.4 |
| Consumer Discretionary | 8.7 |
| Consumer Staples | 7.6 |
| Financials | 4.0 |
| Materials | 3.3 |
| Communication Services | 3.3 |
| Real Estate | 1.9 |
| Energy | 0.6 |
Fidelity® Series International Small Cap Fund
Schedule of Investments October 31, 2020
Showing Percentage of Net Assets
| Common Stocks - 89.1% | | | |
| | | Shares | Value |
| Australia - 1.1% | | | |
| Bapcor Ltd. | | 883,530 | $4,762,032 |
| Beacon Lighting Group Ltd. | | 1,377,258 | 1,428,901 |
| Imdex Ltd. | | 11,849,932 | 10,038,190 |
| Kogan.Com Ltd. | | 1,013,600 | 14,672,904 |
| Nanosonics Ltd. (a) | | 528,844 | 1,915,991 |
| Reckon Ltd. (b) | | 10,986,940 | 5,982,597 |
|
| TOTAL AUSTRALIA | | | 38,800,615 |
|
| Austria - 0.2% | | | |
| EVN AG | | 202,000 | 3,223,052 |
| Wienerberger AG | | 207,100 | 5,224,371 |
|
| TOTAL AUSTRIA | | | 8,447,423 |
|
| Bailiwick of Jersey - 0.5% | | | |
| Integrated Diagnostics Holdings PLC (c) | | 4,882,404 | 17,161,650 |
| Belgium - 1.3% | | | |
| Barco NV | | 1,529,851 | 23,973,325 |
| Econocom Group SA (a) | | 2,319,647 | 5,100,577 |
| KBC Ancora (a) | | 601,920 | 17,034,935 |
|
| TOTAL BELGIUM | | | 46,108,837 |
|
| Canada - 2.4% | | | |
| Computer Modelling Group Ltd. | | 1,108,300 | 3,934,744 |
| ECN Capital Corp. | | 2,544,900 | 10,085,620 |
| McCoy Global, Inc. (a) | | 1,107,650 | 424,005 |
| MTY Food Group, Inc. | | 109,600 | 3,121,087 |
| New Look Vision Group, Inc. | | 738,260 | 16,845,383 |
| Pason Systems, Inc. (d) | | 208,500 | 805,956 |
| PrairieSky Royalty Ltd. | | 340,000 | 2,084,966 |
| Richelieu Hardware Ltd. | | 1,166,792 | 31,370,179 |
| Spin Master Corp. (a)(c) | | 200,300 | 4,056,214 |
| Summit Industrial Income REIT | | 1,480,000 | 14,963,297 |
| Total Energy Services, Inc. | | 352,400 | 523,720 |
|
| TOTAL CANADA | | | 88,215,171 |
|
| Cayman Islands - 0.2% | | | |
| SITC International Holdings Co. Ltd. | | 3,800,000 | 5,862,367 |
| China - 0.4% | | | |
| Zhejiang Sanhua Intelligent Controls Co. Ltd. (A Shares) | | 4,202,989 | 15,420,182 |
| Denmark - 2.5% | | | |
| Netcompany Group A/S (a)(c) | | 533,675 | 44,333,765 |
| SimCorp A/S | | 249,434 | 29,735,405 |
| Spar Nord Bank A/S | | 1,852,610 | 15,940,793 |
|
| TOTAL DENMARK | | | 90,009,963 |
|
| Finland - 1.2% | | | |
| Admicom OYJ | | 112,700 | 13,125,605 |
| Musti Group OYJ | | 255,527 | 5,853,783 |
| Olvi PLC (A Shares) | | 148,500 | 7,765,479 |
| Tikkurila Oyj | | 1,123,096 | 17,972,109 |
|
| TOTAL FINLAND | | | 44,716,976 |
|
| France - 1.9% | | | |
| Cegedim SA (a) | | 342,786 | 8,902,733 |
| Elis SA (a) | | 271,500 | 2,973,884 |
| Laurent-Perrier Group SA | | 147,831 | 12,155,299 |
| Lectra | | 444,300 | 10,214,542 |
| Somfy SA | | 25,300 | 3,524,091 |
| STEF-TFE Group (a) | | 45,500 | 3,338,469 |
| Vetoquinol SA | | 311,315 | 29,368,414 |
|
| TOTAL FRANCE | | | 70,477,432 |
|
| Germany - 3.6% | | | |
| Befesa SA (c) | | 14,000 | 575,570 |
| CompuGroup Medical AG | | 590,157 | 50,552,853 |
| CTS Eventim AG | | 837,595 | 37,108,211 |
| JOST Werke AG (a)(c) | | 111,000 | 4,162,692 |
| Nexus AG | | 618,016 | 34,405,117 |
| Takkt AG | | 455,300 | 4,825,413 |
|
| TOTAL GERMANY | | | 131,629,856 |
|
| Greece - 0.3% | | | |
| Fourlis Holdings SA (a) | | 970,292 | 3,746,118 |
| Motor Oil (HELLAS) Corinth Refineries SA | | 137,600 | 1,282,047 |
| Mytilineos SA | | 503,000 | 5,494,982 |
|
| TOTAL GREECE | | | 10,523,147 |
|
| India - 0.7% | | | |
| Embassy Office Parks (REIT) | | 3,811,200 | 17,592,265 |
| Indian Energy Exchange Ltd. (c) | | 2,756,200 | 7,068,547 |
|
| TOTAL INDIA | | | 24,660,812 |
|
| Ireland - 0.5% | | | |
| FBD Holdings PLC (a) | | 1,317,819 | 9,515,747 |
| Mincon Group PLC | | 2,300,000 | 2,357,252 |
| Total Produce PLC | | 2,742,400 | 3,577,208 |
| United Drug PLC (United Kingdom) | | 191,000 | 1,795,181 |
|
| TOTAL IRELAND | | | 17,245,388 |
|
| Israel - 2.3% | | | |
| Ituran Location & Control Ltd. (b) | | 1,519,635 | 21,502,835 |
| Maytronics Ltd. | | 760,044 | 11,674,479 |
| Strauss Group Ltd. | | 1,484,064 | 42,911,960 |
| Tel Aviv Stock Exchange Ltd. | | 1,791,957 | 7,772,736 |
|
| TOTAL ISRAEL | | | 83,862,010 |
|
| Italy - 1.8% | | | |
| Interpump Group SpA | | 1,626,300 | 61,367,877 |
| MARR SpA | | 246,900 | 3,347,106 |
|
| TOTAL ITALY | | | 64,714,983 |
|
| Japan - 35.0% | | | |
| Ai Holdings Corp. | | 649,692 | 11,423,092 |
| Aoki Super Co. Ltd. | | 203,237 | 5,323,390 |
| Arc Land Sakamoto Co. Ltd. | | 205,100 | 3,951,373 |
| Artnature, Inc. | | 1,169,300 | 6,775,759 |
| Aucnet, Inc. | | 611,760 | 8,132,965 |
| Azbil Corp. | | 3,381,725 | 137,241,564 |
| Bank of Kyoto Ltd. | | 207,907 | 9,182,110 |
| Broadleaf Co. Ltd. (b) | | 5,442,673 | 28,469,258 |
| Central Automotive Products Ltd. | | 125,279 | 2,440,293 |
| Chugoku Marine Paints Ltd. | | 275,000 | 2,625,272 |
| CKD Corp. | | 170,000 | 2,829,456 |
| Curves Holdings Co. Ltd. | | 3,678,859 | 22,602,887 |
| Daiichikosho Co. Ltd. | | 804,914 | 27,541,724 |
| Daikokutenbussan Co. Ltd. | | 362,500 | 19,721,310 |
| Funai Soken Holdings, Inc. | | 741,857 | 16,047,392 |
| GMO Internet, Inc. | | 277,962 | 7,413,873 |
| Goldcrest Co. Ltd. | | 1,546,300 | 19,757,691 |
| Iwatsuka Confectionary Co. Ltd. | | 105,800 | 3,702,999 |
| Kamigumi Co. Ltd. | | 306,000 | 5,474,616 |
| Kobayashi Pharmaceutical Co. Ltd. | | 276,300 | 26,924,249 |
| Koshidaka Holdings Co. Ltd. | | 3,555,459 | 13,300,381 |
| Kusuri No Aoki Holdings Co. Ltd. | | 318,058 | 25,389,291 |
| Lasertec Corp. | | 1,141,560 | 98,882,847 |
| Medikit Co. Ltd. | | 539,600 | 15,855,151 |
| Mirait Holdings Corp. | | 407,000 | 5,794,111 |
| Miroku Jyoho Service Co., Ltd. | | 752,191 | 15,235,179 |
| Misumi Group, Inc. | | 1,339,500 | 39,782,579 |
| Mitsuboshi Belting Ltd. | | 530,752 | 8,308,753 |
| Nabtesco Corp. | | 1,047,536 | 39,134,107 |
| Nagaileben Co. Ltd. | | 1,608,500 | 40,249,158 |
| Nichias Corp. | | 199,700 | 4,325,167 |
| Nihon Parkerizing Co. Ltd. | | 4,469,518 | 44,047,444 |
| Nitto Kohki Co. Ltd. | | 211,000 | 3,506,038 |
| NOF Corp. | | 117,000 | 4,397,132 |
| NS Tool Co. Ltd. (b) | | 636,700 | 13,666,393 |
| OBIC Co. Ltd. | | 605,900 | 107,270,371 |
| OSG Corp. | | 2,256,975 | 33,811,863 |
| PALTAC Corp. | | 157,500 | 8,805,445 |
| Paramount Bed Holdings Co. Ltd. | | 831,066 | 32,019,184 |
| Poletowin Pitcrew Holdings, Inc. | | 156,700 | 1,365,122 |
| ProNexus, Inc. | | 1,033,577 | 10,751,922 |
| Raiznext Corp. | | 138,200 | 1,601,600 |
| S Foods, Inc. | | 177,100 | 5,898,441 |
| San-Ai Oil Co. Ltd. | | 1,866,110 | 18,815,219 |
| Sekisui Jushi Corp. | | 259,000 | 5,229,973 |
| SHO-BOND Holdings Co. Ltd. | | 1,417,200 | 68,405,795 |
| Shoei Co. Ltd. (b) | | 1,856,600 | 56,538,663 |
| SK Kaken Co. Ltd. | | 61,804 | 23,482,611 |
| Software Service, Inc. | | 241,700 | 26,042,305 |
| Sushiro Global Holdings Ltd. | | 206,000 | 5,592,170 |
| Techno Medica Co. Ltd. | | 283,000 | 4,378,179 |
| The Monogatari Corp. | | 130,668 | 13,353,089 |
| TKC Corp. | | 234,924 | 14,558,369 |
| Tocalo Co. Ltd. | | 1,563,800 | 15,588,478 |
| Tsuruha Holdings, Inc. | | 48,270 | 6,759,009 |
| USS Co. Ltd. | | 2,056,400 | 37,612,743 |
| Welcia Holdings Co. Ltd. | | 633,370 | 24,822,611 |
| Workman Co. Ltd. (d) | | 141,500 | 12,546,764 |
| Yuasa Trading Co. Ltd. | | 121,900 | 3,472,791 |
|
| TOTAL JAPAN | | | 1,278,177,721 |
|
| Korea (South) - 0.7% | | | |
| BGF Retail Co. Ltd. | | 123,588 | 12,823,559 |
| Leeno Industrial, Inc. | | 131,335 | 14,095,840 |
|
| TOTAL KOREA (SOUTH) | | | 26,919,399 |
|
| Luxembourg - 0.3% | | | |
| B&M European Value Retail SA | | 950,531 | 5,969,890 |
| Stabilus SA | | 60,000 | 3,397,517 |
|
| TOTAL LUXEMBOURG | | | 9,367,407 |
|
| Mexico - 0.0% | | | |
| Genomma Lab Internacional SA de CV (a) | | 1,109,000 | 983,442 |
| Netherlands - 2.3% | | | |
| Aalberts Industries NV | | 1,856,035 | 62,341,442 |
| AerCap Holdings NV (a) | | 17,000 | 422,110 |
| Arcadis NV | | 237,000 | 5,520,441 |
| Intertrust NV (c) | | 300,000 | 4,646,953 |
| RHI Magnesita NV | | 139,500 | 4,626,490 |
| Van Lanschot NV (Bearer) | | 414,661 | 8,306,481 |
|
| TOTAL NETHERLANDS | | | 85,863,917 |
|
| New Zealand - 0.2% | | | |
| EBOS Group Ltd. | | 336,913 | 5,734,743 |
| Norway - 1.9% | | | |
| Adevinta ASA Class B (a) | | 128,966 | 1,992,582 |
| Borregaard ASA | | 290,000 | 3,882,200 |
| Kongsberg Gruppen ASA | | 1,436,185 | 23,257,813 |
| Medistim ASA | | 382,845 | 8,301,228 |
| Merkantildata ASA | | 982,000 | 11,356,109 |
| Schibsted ASA (A Shares) | | 79,266 | 3,231,534 |
| Skandiabanken ASA (c) | | 2,666,252 | 16,896,843 |
|
| TOTAL NORWAY | | | 68,918,309 |
|
| Philippines - 0.2% | | | |
| Jollibee Food Corp. | | 2,155,590 | 7,536,618 |
| Pilipinas Shell Petroleum Corp. (a) | | 3,360,340 | 1,141,211 |
|
| TOTAL PHILIPPINES | | | 8,677,829 |
|
| Singapore - 0.1% | | | |
| Boustead Singapore Ltd. | | 8,961,400 | 4,596,839 |
| South Africa - 0.9% | | | |
| Clicks Group Ltd. | | 2,276,031 | 32,919,171 |
| Spain - 1.1% | | | |
| Applus Services SA (a) | | 295,000 | 2,310,520 |
| Fluidra SA | | 1,802,620 | 32,583,020 |
| Prosegur Cash SA (c) | | 1,585,177 | 1,227,707 |
| Prosegur Compania de Seguridad SA (Reg.) | | 2,257,528 | 5,163,808 |
|
| TOTAL SPAIN | | | 41,285,055 |
|
| Sweden - 6.4% | | | |
| Addlife AB | | 4,339,652 | 65,262,545 |
| AddTech AB (B Shares) | | 6,908,008 | 76,467,543 |
| Bygghemma Group First AB (a) | | 477,725 | 7,462,440 |
| Dometic Group AB (a)(c) | | 392,300 | 4,225,258 |
| Granges AB | | 215,000 | 1,941,388 |
| INVISIO AB | | 699,356 | 12,606,390 |
| John Mattson Fastighetsforetag (a) | | 614,732 | 10,348,698 |
| Lagercrantz Group AB (B Shares) | | 8,045,891 | 49,586,067 |
| MIPS AB | | 106,800 | 4,599,227 |
|
| TOTAL SWEDEN | | | 232,499,556 |
|
| Switzerland - 2.4% | | | |
| Dufry AG (a) | | 79,160 | 2,995,640 |
| Tecan Group AG | | 164,557 | 78,065,647 |
| VZ Holding AG | | 67,625 | 5,671,370 |
|
| TOTAL SWITZERLAND | | | 86,732,657 |
|
| Taiwan - 0.3% | | | |
| Addcn Technology Co. Ltd. | | 1,710,570 | 12,346,908 |
| United Kingdom - 14.3% | | | |
| Alliance Pharma PLC | | 24,650,005 | 23,471,550 |
| Avon Rubber PLC (b) | | 1,571,686 | 79,917,679 |
| Bodycote PLC | | 1,811,861 | 15,268,965 |
| Clarkson PLC | | 435,900 | 11,350,640 |
| Dechra Pharmaceuticals PLC | | 1,857,576 | 84,034,621 |
| DP Poland PLC (a)(b)(e) | | 14,923,300 | 1,401,652 |
| GetBusy PLC (a) | | 2,405,000 | 2,492,542 |
| Great Portland Estates PLC | | 906,515 | 6,776,231 |
| H&T Group PLC (b) | | 2,180,017 | 6,213,266 |
| Hill & Smith Holdings PLC | | 281,316 | 4,373,339 |
| Hilton Food Group PLC | | 1,028,638 | 15,458,166 |
| Howden Joinery Group PLC | | 2,482,682 | 20,481,491 |
| ITE Group PLC | | 1,437,500 | 949,763 |
| J.D. Weatherspoon PLC | | 363,500 | 4,059,281 |
| Mears Group PLC | | 1,636,000 | 2,236,007 |
| Mitie Group PLC | | 3,013,200 | 1,100,815 |
| Naked Wines PLC | | 465,914 | 2,815,755 |
| On The Beach Group PLC (c) | | 1,002,700 | 2,792,845 |
| Rightmove PLC | | 4,510,370 | 36,110,879 |
| Spectris PLC | | 2,139,169 | 68,617,226 |
| Spirax-Sarco Engineering PLC | | 670,328 | 97,956,639 |
| Ted Baker PLC (d) | | 1,083,648 | 1,436,155 |
| Ten Entertainment Group PLC | | 1,230,400 | 2,135,937 |
| Topps Tiles PLC | | 4,886,037 | 2,740,830 |
| Trainline PLC (a)(c) | | 849,300 | 3,025,737 |
| Ultra Electronics Holdings PLC | | 933,736 | 22,741,514 |
| Vistry Group PLC | | 508,100 | 3,587,427 |
|
| TOTAL UNITED KINGDOM | | | 523,546,952 |
|
| United States of America - 2.1% | | | |
| Autoliv, Inc. | | 132,700 | 10,058,660 |
| Morningstar, Inc. | | 118,500 | 22,560,030 |
| PriceSmart, Inc. | | 265,788 | 18,339,372 |
| ResMed, Inc. | | 140,400 | 26,948,376 |
|
| TOTAL UNITED STATES OF AMERICA | | | 77,906,438 |
|
| TOTAL COMMON STOCKS | | | |
| (Cost $2,018,391,776) | | | 3,254,333,155 |
|
| Nonconvertible Preferred Stocks - 1.3% | | | |
| Germany - 1.3% | | | |
| Sartorius AG (non-vtg.) | | | |
| (Cost $2,829,712) | | 110,955 | 46,959,907 |
|
| Investment Companies - 4.2% | | | |
| United States of America - 4.2% | | | |
| iShares MSCI EAFE Small-Cap ETF | | | |
| (Cost $160,404,576) | | 2,700,000 | 153,765,005 |
|
| Money Market Funds - 5.4% | | | |
| Fidelity Cash Central Fund 0.10% (f) | | 194,216,651 | 194,255,495 |
| Fidelity Securities Lending Cash Central Fund 0.11% (f)(g) | | 4,961,622 | 4,962,118 |
| TOTAL MONEY MARKET FUNDS | | | |
| (Cost $199,216,653) | | | 199,217,613 |
| TOTAL INVESTMENT IN SECURITIES - 100.0% | | | |
| (Cost $2,380,842,717) | | | 3,654,275,680 |
| NET OTHER ASSETS (LIABILITIES) - 0.0% | | | (1,234,633) |
| NET ASSETS - 100% | | | $3,653,041,047 |
Security Type Abbreviations
ETF – Exchange-Traded Fund
Categorizations in the Schedule of Investments are based on country or territory of incorporation.
Legend
(a) Non-income producing
(b) Affiliated company
(c) Security exempt from registration under Rule 144A of the Securities Act of 1933. These securities may be resold in transactions exempt from registration, normally to qualified institutional buyers. At the end of the period, the value of these securities amounted to $110,173,781 or 3.0% of net assets.
(d) Security or a portion of the security is on loan at period end.
(e) Level 3 security
(f) Affiliated fund that is generally available only to investment companies and other accounts managed by Fidelity Investments. The rate quoted is the annualized seven-day yield of the fund at period end. A complete unaudited listing of the fund's holdings as of its most recent quarter end is available upon request. In addition, each Fidelity Central Fund's financial statements, which are not covered by the Fund's Report of Independent Registered Public Accounting Firm, are available on the SEC's website or upon request.
(g) Investment made with cash collateral received from securities on loan.
Affiliated Central Funds
Information regarding fiscal year to date income earned by the Fund from investments in Fidelity Central Funds is as follows:
| Fund | Income earned |
| Fidelity Cash Central Fund | $1,066,587 |
| Fidelity Securities Lending Cash Central Fund | 420,642 |
| Total | $1,487,229 |
Amounts in the income column in the above table include any capital gain distributions from underlying funds, which are presented in the corresponding line-item in the Statement of Operations, if applicable. Amount for Fidelity Securities Lending Cash Central Fund represents the income earned on investing cash collateral, less rebates paid to borrowers and any lending agent fees associated with the loan, plus any premium payments received for lending certain types of securities.
The value, beginning of period, for the Fidelity Cash Central Fund was $236,030,531. Net realized gain (loss) and change in net unrealized appreciation (depreciation) on Fidelity Cash Central Fund is presented in the Statement of Operations, if applicable. Purchases and sales of the Fidelity Cash Central Fund were $806,985,637 and $848,757,497, respectively, during the period.
Other Affiliated Issuers
An affiliated company is a company in which the Fund has ownership of at least 5% of the voting securities. Fiscal year to date transactions with companies which are or were affiliates are as follows:
| Affiliate | Value, beginning of period | Purchases(a) | Sales Proceeds | Dividend Income | Realized Gain (loss) | Change in Unrealized appreciation (depreciation) | Value, end of period |
| Avon Rubber PLC | $26,053,104 | $20,004,450 | $6,764,862 | $439,485 | $1,326,746 | $39,298,241 | $79,917,679 |
| Broadleaf Co. Ltd. | 20,492,785 | 8,604,466 | -- | 516,109 | -- | (627,993) | 28,469,258 |
| DP Poland PLC | 889,221 | -- | -- | -- | -- | 512,431 | 1,401,652 |
| H&T Group PLC | 10,688,405 | -- | -- | 72,371 | -- | (4,475,139) | 6,213,266 |
| Ituran Location & Control Ltd. | 28,071,960 | 8,703,070 | 1,175,232 | 486,024 | (593,577) | (13,503,386) | 21,502,835 |
| NS Tool Co. Ltd. | 10,101,364 | 2,626,115 | -- | 169,782 | -- | 938,914 | 13,666,393 |
| Reckon Ltd. | 3,095,110 | 2,322,704 | -- | 315,386 | -- | 564,783 | 5,982,597 |
| Shoei Co. Ltd. | 41,274,923 | 178,895 | 906,197 | 964,418 | (49,275) | 16,040,317 | 56,538,663 |
| Total | $140,666,872 | $42,439,700 | $8,846,291 | $2,963,575 | $683,894 | $38,748,168 | $213,692,343 |
(a) Includes the value of securities received through in-kind transactions, if applicable.
Investment Valuation
The following is a summary of the inputs used, as of October 31, 2020, involving the Fund's assets and liabilities carried at fair value. The inputs or methodology used for valuing securities may not be an indication of the risk associated with investing in those securities. For more information on valuation inputs, and their aggregation into the levels used below, please refer to the Investment Valuation section in the accompanying Notes to Financial Statements.
| | Valuation Inputs at Reporting Date: |
| Description | Total | Level 1 | Level 2 | Level 3 |
| Investments in Securities: | | | | |
| Equities: | | | | |
| Communication Services | $119,281,601 | $91,739,877 | $27,541,724 | $-- |
| Consumer Discretionary | 319,890,684 | 105,211,804 | 213,277,228 | 1,401,652 |
| Consumer Staples | 277,430,134 | 106,370,345 | 171,059,789 | -- |
| Energy | 29,011,868 | 9,055,438 | 19,956,430 | -- |
| Financials | 136,248,478 | 119,997,821 | 16,250,657 | -- |
| Health Care | 602,407,975 | 476,213,264 | 126,194,711 | -- |
| Industrials | 899,774,432 | 602,026,377 | 297,748,055 | -- |
| Information Technology | 721,976,110 | 280,037,998 | 441,938,112 | -- |
| Materials | 122,610,546 | 38,019,897 | 84,590,649 | -- |
| Real Estate | 69,438,182 | 32,088,226 | 37,349,956 | -- |
| Utilities | 3,223,052 | 3,223,052 | -- | -- |
| Investment Companies | 153,765,005 | 153,765,005 | -- | -- |
| Money Market Funds | 199,217,613 | 199,217,613 | -- | -- |
| Total Investments in Securities: | $3,654,275,680 | $2,216,966,717 | $1,435,907,311 | $1,401,652 |
See accompanying notes which are an integral part of the financial statements.
Fidelity® Series International Small Cap Fund
Financial Statements
Statement of Assets and Liabilities
| | | October 31, 2020 |
| Assets | | |
Investment in securities, at value (including securities loaned of $4,725,409) — See accompanying schedule:
Unaffiliated issuers (cost $2,041,633,641) | $3,241,365,724 | |
| Fidelity Central Funds (cost $199,216,653) | 199,217,613 | |
| Other affiliated issuers (cost $139,992,423) | 213,692,343 | |
| Total Investment in Securities (cost $2,380,842,717) | | $3,654,275,680 |
| Foreign currency held at value (cost $271,125) | | 271,125 |
| Receivable for investments sold | | 8,312,897 |
| Receivable for fund shares sold | | 464,746 |
| Dividends receivable | | 12,372,465 |
| Distributions receivable from Fidelity Central Funds | | 21,503 |
| Other receivables | | 1,179 |
| Total assets | | 3,675,719,595 |
| Liabilities | | |
| Payable to custodian bank | $440,791 | |
| Payable for investments purchased | 6,695,814 | |
| Payable for fund shares redeemed | 10,152,379 | |
| Other payables and accrued expenses | 427,064 | |
| Collateral on securities loaned | 4,962,500 | |
| Total liabilities | | 22,678,548 |
| Net Assets | | $3,653,041,047 |
| Net Assets consist of: | | |
| Paid in capital | | $2,423,841,838 |
| Total accumulated earnings (loss) | | 1,229,199,209 |
| Net Assets | | $3,653,041,047 |
| Net Asset Value, offering price and redemption price per share ($3,653,041,047 ÷ 208,181,385 shares) | | $17.55 |
See accompanying notes which are an integral part of the financial statements.
Statement of Operations
| | | Year ended October 31, 2020 |
| Investment Income | | |
| Dividends (including $2,963,575 earned from other affiliated issuers) | | $51,412,144 |
| Income from Fidelity Central Funds (including $420,642 from security lending) | | 1,487,229 |
| Income before foreign taxes withheld | | 52,899,373 |
| Less foreign taxes withheld | | (4,577,300) |
| Total income | | 48,322,073 |
| Expenses | | |
| Custodian fees and expenses | $385,892 | |
| Independent trustees' fees and expenses | 19,922 | |
| Miscellaneous | 8,300 | |
| Total expenses | | 414,114 |
| Net investment income (loss) | | 47,907,959 |
| Realized and Unrealized Gain (Loss) | | |
| Net realized gain (loss) on: | | |
| Investment securities: | | |
| Unaffiliated issuers (net of foreign taxes of $112,742) | (45,393,423) | |
| Fidelity Central Funds | (3,953) | |
| Other affiliated issuers | 683,894 | |
| Foreign currency transactions | 298,352 | |
| Total net realized gain (loss) | | (44,415,130) |
| Change in net unrealized appreciation (depreciation) on: | | |
| Investment securities: | | |
| Unaffiliated issuers (net of decrease in deferred foreign taxes of $646,943) | 268,099,090 | |
| Affiliated issuers | 38,748,168 | |
| Assets and liabilities in foreign currencies | 190,475 | |
| Total change in net unrealized appreciation (depreciation) | | 307,037,733 |
| Net gain (loss) | | 262,622,603 |
| Net increase (decrease) in net assets resulting from operations | | $310,530,562 |
See accompanying notes which are an integral part of the financial statements.
Statement of Changes in Net Assets
| | Year ended October 31, 2020 | Year ended October 31, 2019 |
| Increase (Decrease) in Net Assets | | |
| Operations | | |
| Net investment income (loss) | $47,907,959 | $76,424,752 |
| Net realized gain (loss) | (44,415,130) | 85,991,150 |
| Change in net unrealized appreciation (depreciation) | 307,037,733 | 250,247,029 |
| Net increase (decrease) in net assets resulting from operations | 310,530,562 | 412,662,931 |
| Distributions to shareholders | (159,580,831) | (309,676,762) |
| Share transactions | | |
| Proceeds from sales of shares | 461,446,003 | 414,945,342 |
| Reinvestment of distributions | 159,580,831 | 309,676,761 |
| Cost of shares redeemed | (616,999,700) | (555,046,399) |
| Net increase (decrease) in net assets resulting from share transactions | 4,027,134 | 169,575,704 |
| Total increase (decrease) in net assets | 154,976,865 | 272,561,873 |
| Net Assets | | |
| Beginning of period | 3,498,064,182 | 3,225,502,309 |
| End of period | $3,653,041,047 | $3,498,064,182 |
| Other Information | | |
| Shares | | |
| Sold | 28,721,728 | 26,523,897 |
| Issued in reinvestment of distributions | 9,392,633 | 21,746,964 |
| Redeemed | (39,331,425) | (35,158,696) |
| Net increase (decrease) | (1,217,064) | 13,112,165 |
See accompanying notes which are an integral part of the financial statements.
Financial Highlights
Fidelity Series International Small Cap Fund
| | | | | | |
| Years ended October 31, | 2020 | 2019 | 2018 | 2017 | 2016 |
| Selected Per–Share Data | | | | | |
| Net asset value, beginning of period | $16.71 | $16.43 | $18.17 | $15.02 | $16.11 |
| Income from Investment Operations | | | | | |
| Net investment income (loss)A | .22 | .36 | .38 | .25 | .15 |
| Net realized and unrealized gain (loss) | 1.36 | 1.47 | (.99) | 3.47 | (.13) |
| Total from investment operations | 1.58 | 1.83 | (.61) | 3.72 | .02 |
| Distributions from net investment income | (.36) | (.37) | (.29) | (.15) | (.15) |
| Distributions from net realized gain | (.38) | (1.18) | (.85) | (.42) | (.96) |
| Total distributions | (.74) | (1.55) | (1.13)B | (.57) | (1.11) |
| Net asset value, end of period | $17.55 | $16.71 | $16.43 | $18.17 | $15.02 |
| Total ReturnC | 9.60% | 12.77% | (3.72)% | 25.87% | .02% |
| Ratios to Average Net AssetsD,E | | | | | |
| Expenses before reductions | .01% | .01% | .01% | .56% | 1.06% |
| Expenses net of fee waivers, if any | .01% | .01% | .01% | .56% | 1.06% |
| Expenses net of all reductions | .01% | .01% | .01% | .55% | 1.05% |
| Net investment income (loss) | 1.36% | 2.28% | 2.08% | 1.52% | 1.01% |
| Supplemental Data | | | | | |
| Net assets, end of period (000 omitted) | $3,653,041 | $3,498,064 | $3,225,502 | $3,572,161 | $1,303,650 |
| Portfolio turnover rateF | 24%G | 23% | 14% | 21% | 21% |
A Calculated based on average shares outstanding during the period.
B Total distributions per share do not sum due to rounding.
C Total returns would have been lower if certain expenses had not been reduced during the applicable periods shown.
D Fees and expenses of any underlying mutual funds or exchange-traded funds (ETFs) are not included in the Fund's expense ratio. The Fund indirectly bears its proportionate share of these expenses. For additional expense information related to investments in Fidelity Central Funds, please refer to the "Investments in Fidelity Central Funds" note found in the Notes to Financial Statements section of the most recent Annual or Semi-Annual report.
E Expense ratios reflect operating expenses of the class. Expenses before reductions do not reflect amounts reimbursed, waived, or reduced through arrangements with the investment advisor, brokerage services, or other offset arrangements, if applicable, and do not represent the amount paid by the class during periods when reimbursements, waivers or reductions occur.
F Amount does not include the portfolio activity of any underlying mutual funds or exchange-traded funds (ETFs).
G Portfolio turnover rate excludes securities received or delivered in-kind.
See accompanying notes which are an integral part of the financial statements.
Fidelity® Series International Value Fund
Performance: The Bottom Line
Average annual total return reflects the change in the value of an investment, assuming reinvestment of distributions from dividend income and capital gains (the profits earned upon the sale of securities that have grown in value, if any) and assuming a constant rate of performance each year. The hypothetical investment and the average annual total returns do not reflect the deduction of taxes that a shareholder would pay on fund distributions or the redemption of fund shares. During periods of reimbursement by Fidelity, a fund’s total return will be greater than it would be had the reimbursement not occurred. How a fund did yesterday is no guarantee of how it will do tomorrow.
Average Annual Total Returns
| For the periods ended October 31, 2020 | Past 1 year | Past 5 years | Past 10 years |
| Fidelity® Series International Value Fund | (12.55)% | (0.52)% | 1.51% |
$10,000 Over 10 Years
Let's say hypothetically that $10,000 was invested in Fidelity® Series International Value Fund on October 31, 2010.
The chart shows how the value of your investment would have changed, and also shows how the MSCI EAFE Value Index performed over the same period.
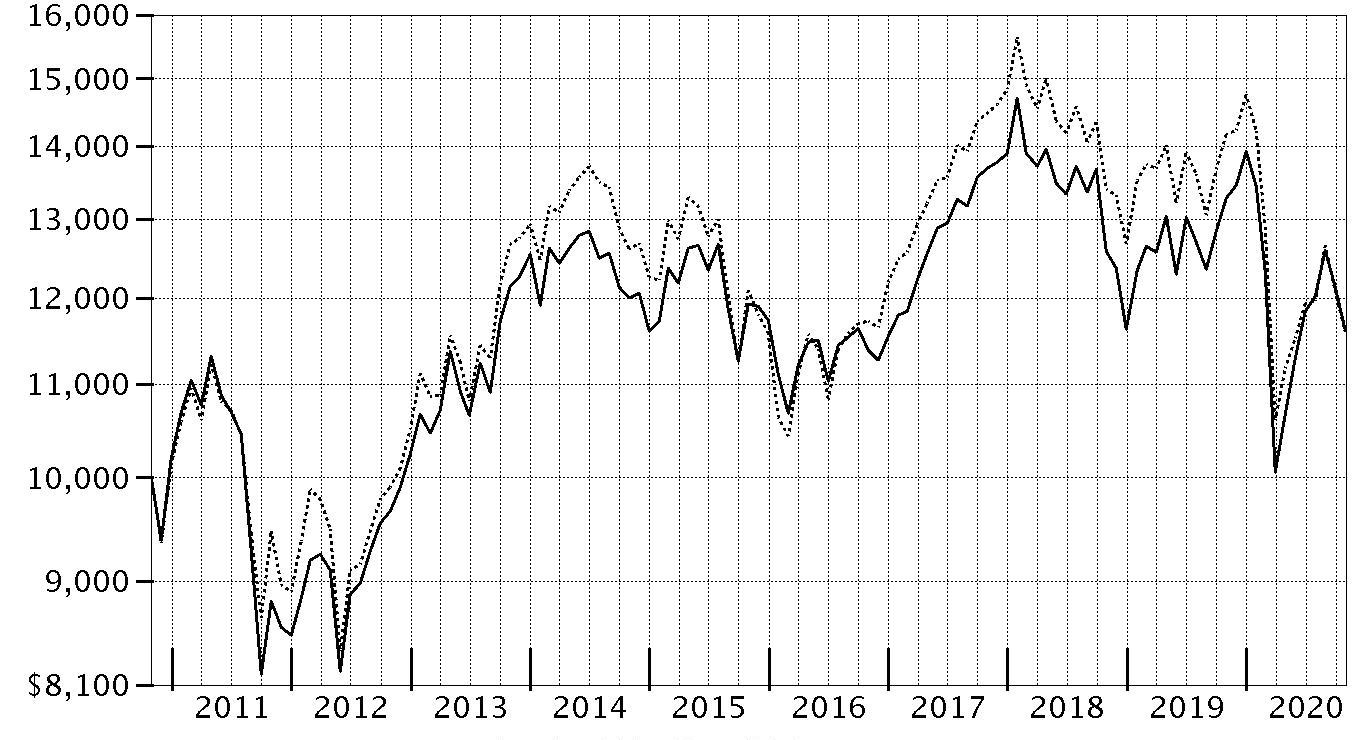
| Period Ending Values |
| $11,613 | Fidelity® Series International Value Fund |
| $11,593 | MSCI EAFE Value Index |
Fidelity® Series International Value Fund
Management's Discussion of Fund Performance
Market Recap: The MSCI ACWI (All Country World Index) ex USA Index returned -2.46% for the 12 months ending October 31, 2020, in what was a bumpy ride for non-U.S. equities, marked by a steep but brief decline due to the early-2020 outbreak and spread of the coronavirus, followed by a sharp upturn. Declared a pandemic on March 11, the crisis and containment efforts caused broad contraction in economic activity, elevated volatility and dislocation in financial markets. A historically rapid and expansive monetary- and fiscal-policy response around the world provided a partial offset to the economic disruption. Other supporting factors included resilient corporate earnings and near-term potential for a COVID-19 vaccine breakthrough. This was evident in the index’s 12.28% gain in the final six months of the year. Currency fluctuation generally boosted foreign developed-markets equities for the year, while the reverse was true for emerging-markets stocks. Late in the period, the index was pressured by a second wave of COVID-19 cases in some regions, and stretched valuations and crowded positioning in big tech. For the full year, the U.K. (-22%), Asia Pacific ex Japan (-8%), Canada (-5%) and Europe ex U.K. (-4%) notably lagged. Emerging markets (+9%) and Japan (+1%) outperformed. By sector, energy (-38%), financials and real estate (-20% each) lagged, whereas information technology (+ 25%) and communication services (+15%) topped the index.
Comments from Portfolio Manager Alex Zavratsky: For the fiscal year ending October 31, 2020, the fund returned -12.55%, outperforming the -18.23% result of the benchmark MSCI EAFE Value Index (Net MA). From a regional standpoint, stock picks in Japan, Italy and Sweden, along with an underweighting in the U.K., contributed most to the fund's relative result. By sector, the top contributor to performance versus the benchmark was security selection and an overweighting in information technology. Strong picks in industrials also helped. Adding further value were investment choices among health care stocks, primarily driven by the health care equipment & services industry. The fund's top individual relative contributor was an underweighting in Royal Dutch Shell, which returned -55% the past 12 months and was no longer held at period end. Our second-largest relative contributor this period was avoiding HSBC Holdings, a benchmark component that returned -45%. Also aiding the portfolio’s relative return was a non-benchmark stake in Hoya that rose 27% the past 12 months. In contrast, an underweighting in Australia and stock picks in U.K. weighed on the fund's relative result. By sector, the largest detractor from performance versus the benchmark was an underweighting in utilities. An overweighting in the financials sector also hindered relative performance, as did an underweighting in consumer discretionary. The fund's largest individual relative detractor was an overweighting in BP, which returned -57% the past year. The company was among the fund's biggest holdings this period. Also pressuring performance was our outsized stake in Banco Santander, which returned -50%. Avoiding Schneider Electric, a benchmark component that gained 35%, also hurt performance. Notable changes in positioning include increased exposure to Switzerland and a lower allocation to U.K. By sector, meaningful changes in positioning include increased exposure to industrials and a lower allocation to energy.
The views expressed above reflect those of the portfolio manager(s) only through the end of the period as stated on the cover of this report and do not necessarily represent the views of Fidelity or any other person in the Fidelity organization. Any such views are subject to change at any time based upon market or other conditions and Fidelity disclaims any responsibility to update such views. These views may not be relied on as investment advice and, because investment decisions for a Fidelity fund are based on numerous factors, may not be relied on as an indication of trading intent on behalf of any Fidelity fund.
Fidelity® Series International Value Fund
Investment Summary (Unaudited)
Geographic Diversification (% of fund's net assets)
| As of October 31, 2020 |
| | Japan | 26.3% |
| | Germany | 15.1% |
| | France | 13.2% |
| | United Kingdom | 10.4% |
| | Switzerland | 7.7% |
| | Italy | 3.6% |
| | Sweden | 3.4% |
| | Australia | 2.4% |
| | Spain | 2.2% |
| | Other* | 15.7% |

* Includes Short-Term investments and Net Other Assets (Liabilities).
Percentages are based on country or territory of incorporation and are adjusted for the effect of futures contracts, if applicable.
Asset Allocation as of October 31, 2020
| | % of fund's net assets |
| Stocks | 98.7 |
| Short-Term Investments and Net Other Assets (Liabilities) | 1.3 |
Top Ten Stocks as of October 31, 2020
| | % of fund's net assets |
| BHP Billiton PLC (United Kingdom, Metals & Mining) | 3.3 |
| Toyota Motor Corp. (Japan, Automobiles) | 3.2 |
| Siemens AG (Germany, Industrial Conglomerates) | 2.9 |
| Novartis AG (Switzerland, Pharmaceuticals) | 2.7 |
| Sanofi SA (France, Pharmaceuticals) | 2.3 |
| Enel SpA (Italy, Electric Utilities) | 2.3 |
| Zurich Insurance Group Ltd. (Switzerland, Insurance) | 2.1 |
| Total SA (France, Oil, Gas & Consumable Fuels) | 2.0 |
| BNP Paribas SA (France, Banks) | 1.8 |
| Vonovia SE (Germany, Real Estate Management & Development) | 1.7 |
| | 24.3 |
Top Market Sectors as of October 31, 2020
| | % of fund's net assets |
| Financials | 28.9 |
| Industrials | 14.7 |
| Materials | 11.8 |
| Health Care | 10.5 |
| Information Technology | 8.6 |
| Consumer Discretionary | 8.0 |
| Energy | 5.1 |
| Utilities | 4.1 |
| Communication Services | 3.2 |
| Real Estate | 2.6 |
Fidelity® Series International Value Fund
Schedule of Investments October 31, 2020
Showing Percentage of Net Assets
| Common Stocks - 97.2% | | | |
| | | Shares | Value |
| Australia - 2.4% | | | |
| Commonwealth Bank of Australia | | 2,385,875 | $115,837,924 |
| Evolution Mining Ltd. | | 11,389,916 | 44,653,399 |
| Macquarie Group Ltd. | | 1,309,185 | 116,726,888 |
|
| TOTAL AUSTRALIA | | | 277,218,211 |
|
| Austria - 0.7% | | | |
| Erste Group Bank AG | | 3,874,589 | 79,330,454 |
| Bailiwick of Jersey - 1.7% | | | |
| Ferguson PLC | | 1,088,600 | 108,120,812 |
| Glencore Xstrata PLC | | 45,903,795 | 92,598,827 |
|
| TOTAL BAILIWICK OF JERSEY | | | 200,719,639 |
|
| Belgium - 1.4% | | | |
| KBC Groep NV | | 3,212,104 | 158,355,552 |
| Denmark - 1.6% | | | |
| A.P. Moller - Maersk A/S Series B | | 54,521 | 87,377,239 |
| ORSTED A/S (a) | | 617,811 | 98,055,266 |
|
| TOTAL DENMARK | | | 185,432,505 |
|
| Finland - 0.8% | | | |
| Sampo Oyj (A Shares) | | 2,467,287 | 93,102,236 |
| France - 13.2% | | | |
| ALTEN (b) | | 249,108 | 19,916,987 |
| Atos Origin SA (b) | | 1,004,155 | 68,532,062 |
| AXA SA | | 11,105,262 | 178,342,726 |
| BNP Paribas SA (b) | | 5,906,100 | 205,973,944 |
| Capgemini SA | | 775,548 | 89,547,409 |
| Natixis SA (b) | | 10,197,866 | 23,706,381 |
| Sanofi SA | | 2,921,306 | 263,774,640 |
| SR Teleperformance SA | | 446,688 | 134,064,605 |
| Total SA | | 7,880,292 | 238,747,041 |
| VINCI SA | | 1,596,137 | 126,071,093 |
| Vivendi SA | | 4,497,686 | 129,855,721 |
| Worldline SA (a)(b) | | 779,531 | 57,777,532 |
|
| TOTAL FRANCE | | | 1,536,310,141 |
|
| Germany - 13.6% | | | |
| Bayer AG | | 2,626,682 | 123,429,212 |
| Deutsche Post AG | | 3,347,000 | 148,283,097 |
| Hannover Reuck SE | | 830,539 | 120,620,719 |
| HeidelbergCement AG | | 1,705,777 | 97,583,421 |
| Infineon Technologies AG | | 3,848,000 | 107,132,874 |
| Linde PLC | | 700,511 | 153,542,995 |
| Muenchener Rueckversicherungs-Gesellschaft AG in Muenchen | | 532,876 | 124,619,297 |
| Rheinmetall AG | | 772,641 | 56,420,992 |
| RWE AG | | 3,217,000 | 119,106,926 |
| Siemens AG | | 2,853,800 | 334,694,390 |
| Vonovia SE | | 3,091,952 | 197,409,116 |
|
| TOTAL GERMANY | | | 1,582,843,039 |
|
| Hong Kong - 0.9% | | | |
| AIA Group Ltd. | | 10,639,600 | 101,258,950 |
| India - 0.4% | | | |
| Reliance Industries Ltd. sponsored GDR(a) | | 885,300 | 48,602,970 |
| Indonesia - 0.3% | | | |
| PT Bank Rakyat Indonesia Tbk | | 165,134,952 | 37,381,927 |
| Ireland - 2.1% | | | |
| CRH PLC | | 5,105,008 | 178,633,274 |
| Ryanair Holdings PLC (b) | | 181,200 | 2,496,807 |
| Ryanair Holdings PLC sponsored ADR (b)(c) | | 790,600 | 63,722,360 |
|
| TOTAL IRELAND | | | 244,852,441 |
|
| Italy - 3.6% | | | |
| Assicurazioni Generali SpA | | 5,167,724 | 69,273,968 |
| Enel SpA | | 32,985,950 | 262,254,964 |
| Mediobanca SpA | | 11,255,945 | 79,809,030 |
|
| TOTAL ITALY | | | 411,337,962 |
|
| Japan - 26.3% | | | |
| DENSO Corp. | | 2,634,856 | 122,775,310 |
| FANUC Corp. | | 734,207 | 155,082,761 |
| Fujitsu Ltd. | | 861,100 | 101,880,732 |
| Hoya Corp. | | 1,459,542 | 164,719,441 |
| Ibiden Co. Ltd. | | 1,519,144 | 61,940,818 |
| Idemitsu Kosan Co. Ltd. | | 2,697,076 | 54,545,590 |
| Itochu Corp. | | 7,027,353 | 168,786,622 |
| Kao Corp. | | 1,148,136 | 81,745,803 |
| Minebea Mitsumi, Inc. | | 6,474,851 | 116,944,611 |
| Mitsubishi Estate Co. Ltd. | | 3,644,833 | 54,365,880 |
| Mitsubishi UFJ Financial Group, Inc. | | 33,369,724 | 131,540,270 |
| Mitsui Fudosan Co. Ltd. | | 2,676,896 | 45,581,037 |
| OBIC Co. Ltd. | | 414,042 | 73,303,250 |
| Oracle Corp. Japan | | 700,011 | 69,959,164 |
| ORIX Corp. | | 8,964,897 | 104,846,595 |
| Recruit Holdings Co. Ltd. | | 1,970,316 | 74,971,856 |
| Shin-Etsu Chemical Co. Ltd. | | 1,392,858 | 186,039,652 |
| Shinsei Bank Ltd. | | 6,453,120 | 77,641,018 |
| SoftBank Group Corp. | | 2,445,237 | 159,267,604 |
| Sony Corp. | | 1,822,395 | 151,926,659 |
| Sumitomo Mitsui Financial Group, Inc. | | 5,062,085 | 140,128,151 |
| Suzuki Motor Corp. | | 2,461,482 | 105,714,996 |
| Takeda Pharmaceutical Co. Ltd. | | 1,842,773 | 56,946,500 |
| Tokio Marine Holdings, Inc. | | 3,181,515 | 142,196,936 |
| Tokyo Electron Ltd. | | 295,163 | 79,224,958 |
| Toyota Motor Corp. | | 5,651,524 | 371,005,067 |
|
| TOTAL JAPAN | | | 3,053,081,281 |
|
| Korea (South) - 0.9% | | | |
| Samsung Electronics Co. Ltd. | | 2,126,305 | 106,645,563 |
| Luxembourg - 0.5% | | | |
| ArcelorMittal SA (Netherlands) (b) | | 4,412,400 | 59,878,482 |
| Netherlands - 2.0% | | | |
| AerCap Holdings NV (b) | | 1,229,133 | 30,519,372 |
| Koninklijke Philips Electronics NV | | 2,137,497 | 99,001,969 |
| NN Group NV | | 2,760,639 | 96,262,435 |
|
| TOTAL NETHERLANDS | | | 225,783,776 |
|
| Portugal - 0.3% | | | |
| Galp Energia SGPS SA Class B | | 4,486,664 | 36,437,047 |
| Singapore - 0.8% | | | |
| United Overseas Bank Ltd. | | 6,533,289 | 90,776,460 |
| Spain - 2.2% | | | |
| Banco Santander SA (Spain) | | 73,899,949 | 147,988,860 |
| Cellnex Telecom SA (a) | | 1,364,738 | 87,610,049 |
| Unicaja Banco SA (a) | | 29,092,431 | 18,516,786 |
|
| TOTAL SPAIN | | | 254,115,695 |
|
| Sweden - 3.4% | | | |
| Ericsson (B Shares) | | 14,124,785 | 157,696,372 |
| Investor AB (B Shares) | | 2,940,460 | 176,591,502 |
| Volvo AB (B Shares) | | 3,120,800 | 60,726,256 |
|
| TOTAL SWEDEN | | | 395,014,130 |
|
| Switzerland - 7.7% | | | |
| Novartis AG | | 4,029,790 | 314,011,664 |
| Roche Holding AG (participation certificate) | | 236,020 | 75,840,669 |
| Siemens Energy AG (b) | | 1,844,800 | 40,392,671 |
| Swiss Life Holding AG | | 167,273 | 56,222,846 |
| UBS Group AG | | 14,134,482 | 165,232,095 |
| Zurich Insurance Group Ltd. | | 728,564 | 241,989,377 |
|
| TOTAL SWITZERLAND | | | 893,689,322 |
|
| United Kingdom - 10.4% | | | |
| Anglo American PLC (United Kingdom) | | 7,722,602 | 181,203,875 |
| AstraZeneca PLC (United Kingdom) | | 994,099 | 99,813,009 |
| Beazley PLC | | 7,674,617 | 29,230,851 |
| BHP Billiton PLC | | 19,605,860 | 379,811,767 |
| BP PLC | | 64,277,388 | 163,951,356 |
| Imperial Brands PLC | | 3,649,375 | 57,867,847 |
| Lloyds Banking Group PLC | | 227,961,482 | 83,002,404 |
| Royal Dutch Shell PLC Class B sponsored ADR | | 2,594,186 | 62,649,592 |
| RSA Insurance Group PLC | | 13,571,551 | 74,477,116 |
| Standard Chartered PLC (United Kingdom) | | 17,019,205 | 77,566,201 |
| Standard Life PLC | | 611,156 | 1,777,485 |
|
| TOTAL UNITED KINGDOM | | | 1,211,351,503 |
|
| TOTAL COMMON STOCKS | | | |
| (Cost $11,545,614,671) | | | 11,283,519,286 |
|
| Nonconvertible Preferred Stocks - 1.5% | | | |
| Germany - 1.5% | | | |
| Porsche Automobil Holding SE (Germany) | | | |
| (Cost $229,686,543) | | 3,254,989 | 174,382,454 |
|
| Money Market Funds - 0.7% | | | |
| Fidelity Cash Central Fund 0.10% (d) | | 82,567,398 | 82,583,911 |
| Fidelity Securities Lending Cash Central Fund 0.11% (d)(e) | | 16,698 | 16,700 |
| TOTAL MONEY MARKET FUNDS | | | |
| (Cost $82,600,611) | | | 82,600,611 |
| TOTAL INVESTMENT IN SECURITIES - 99.4% | | | |
| (Cost $11,857,901,825) | | | 11,540,502,351 |
| NET OTHER ASSETS (LIABILITIES) - 0.6% | | | 65,207,355 |
| NET ASSETS - 100% | | | $11,605,709,706 |
Categorizations in the Schedule of Investments are based on country or territory of incorporation.
Legend
(a) Security exempt from registration under Rule 144A of the Securities Act of 1933. These securities may be resold in transactions exempt from registration, normally to qualified institutional buyers. At the end of the period, the value of these securities amounted to $310,562,603 or 2.7% of net assets.
(b) Non-income producing
(c) Security or a portion of the security is on loan at period end.
(d) Affiliated fund that is generally available only to investment companies and other accounts managed by Fidelity Investments. The rate quoted is the annualized seven-day yield of the fund at period end. A complete unaudited listing of the fund's holdings as of its most recent quarter end is available upon request. In addition, each Fidelity Central Fund's financial statements, which are not covered by the Fund's Report of Independent Registered Public Accounting Firm, are available on the SEC's website or upon request.
(e) Investment made with cash collateral received from securities on loan.
Affiliated Central Funds
Information regarding fiscal year to date income earned by the Fund from investments in Fidelity Central Funds is as follows:
| Fund | Income earned |
| Fidelity Cash Central Fund | $388,872 |
| Fidelity Securities Lending Cash Central Fund | 1,314,614 |
| Total | $1,703,486 |
Amounts in the income column in the above table include any capital gain distributions from underlying funds, which are presented in the corresponding line-item in the Statement of Operations, if applicable. Amount for Fidelity Securities Lending Cash Central Fund represents the income earned on investing cash collateral, less rebates paid to borrowers and any lending agent fees associated with the loan, plus any premium payments received for lending certain types of securities.
Investment Valuation
The following is a summary of the inputs used, as of October 31, 2020, involving the Fund's assets and liabilities carried at fair value. The inputs or methodology used for valuing securities may not be an indication of the risk associated with investing in those securities. For more information on valuation inputs, and their aggregation into the levels used below, please refer to the Investment Valuation section in the accompanying Notes to Financial Statements.
| | Valuation Inputs at Reporting Date: |
| Description | Total | Level 1 | Level 2 | Level 3 |
| Investments in Securities: | | | | |
| Equities: | | | | |
| Communication Services | $376,733,374 | $217,465,770 | $159,267,604 | $-- |
| Consumer Discretionary | 925,804,486 | 174,382,454 | 751,422,032 | -- |
| Consumer Staples | 139,613,650 | 57,867,847 | 81,745,803 | -- |
| Energy | 604,933,596 | 111,252,562 | 493,681,034 | -- |
| Financials | 3,360,327,384 | 1,444,694,954 | 1,915,632,430 | -- |
| Health Care | 1,197,537,104 | -- | 1,197,537,104 | -- |
| Industrials | 1,708,675,544 | 868,823,743 | 839,851,801 | -- |
| Information Technology | 993,557,721 | 235,773,990 | 757,783,731 | -- |
| Materials | 1,373,945,692 | 492,208,773 | 881,736,919 | -- |
| Real Estate | 297,356,033 | 197,409,116 | 99,946,917 | -- |
| Utilities | 479,417,156 | 217,162,192 | 262,254,964 | -- |
| Money Market Funds | 82,600,611 | 82,600,611 | -- | -- |
| Total Investments in Securities: | $11,540,502,351 | $4,099,642,012 | $7,440,860,339 | $-- |
See accompanying notes which are an integral part of the financial statements.
Fidelity® Series International Value Fund
Financial Statements
Statement of Assets and Liabilities
| | | October 31, 2020 |
| Assets | | |
Investment in securities, at value (including securities loaned of $16,120) — See accompanying schedule:
Unaffiliated issuers (cost $11,775,301,214) | $11,457,901,740 | |
| Fidelity Central Funds (cost $82,600,611) | 82,600,611 | |
| Total Investment in Securities (cost $11,857,901,825) | | $11,540,502,351 |
| Foreign currency held at value (cost $982) | | 967 |
| Receivable for investments sold | | 67 |
| Receivable for fund shares sold | | 194,024,222 |
| Dividends receivable | | 62,778,197 |
| Distributions receivable from Fidelity Central Funds | | 6,411 |
| Total assets | | 11,797,312,215 |
| Liabilities | | |
| Payable to custodian bank | $8,528 | |
| Payable for investments purchased | 185,356,697 | |
| Payable for fund shares redeemed | 5,891,719 | |
| Other payables and accrued expenses | 328,865 | |
| Collateral on securities loaned | 16,700 | |
| Total liabilities | | 191,602,509 |
| Net Assets | | $11,605,709,706 |
| Net Assets consist of: | | |
| Paid in capital | | $13,299,655,862 |
| Total accumulated earnings (loss) | | (1,693,946,156) |
| Net Assets | | $11,605,709,706 |
| Net Asset Value, offering price and redemption price per share ($11,605,709,706 ÷ 1,407,592,426 shares) | | $8.25 |
See accompanying notes which are an integral part of the financial statements.
Statement of Operations
| | | Year ended October 31, 2020 |
| Investment Income | | |
| Dividends | | $385,768,945 |
| Non-Cash dividends | | 36,054,975 |
| Income from Fidelity Central Funds (including $1,314,614 from security lending) | | 1,703,486 |
| Income before foreign taxes withheld | | 423,527,406 |
| Less foreign taxes withheld | | (36,473,943) |
| Total income | | 387,053,463 |
| Expenses | | |
| Custodian fees and expenses | $763,903 | |
| Independent trustees' fees and expenses | 78,151 | |
| Interest | 145,995 | |
| Miscellaneous | 32,232 | |
| Total expenses before reductions | 1,020,281 | |
| Expense reductions | (1,248) | |
| Total expenses after reductions | | 1,019,033 |
| Net investment income (loss) | | 386,034,430 |
| Realized and Unrealized Gain (Loss) | | |
| Net realized gain (loss) on: | | |
| Investment securities: | | |
| Unaffiliated issuers | (621,931,797) | |
| Fidelity Central Funds | (16,166) | |
| Foreign currency transactions | 529,328 | |
| Total net realized gain (loss) | | (621,418,635) |
| Change in net unrealized appreciation (depreciation) on: | | |
| Investment securities: | | |
| Unaffiliated issuers | (1,627,528,730) | |
| Assets and liabilities in foreign currencies | 1,875,059 | |
| Total change in net unrealized appreciation (depreciation) | | (1,625,653,671) |
| Net gain (loss) | | (2,247,072,306) |
| Net increase (decrease) in net assets resulting from operations | | $(1,861,037,876) |
See accompanying notes which are an integral part of the financial statements.
Statement of Changes in Net Assets
| | Year ended October 31, 2020 | Year ended October 31, 2019 |
| Increase (Decrease) in Net Assets | | |
| Operations | | |
| Net investment income (loss) | $386,034,430 | $607,840,138 |
| Net realized gain (loss) | (621,418,635) | (614,985,805) |
| Change in net unrealized appreciation (depreciation) | (1,625,653,671) | 848,206,291 |
| Net increase (decrease) in net assets resulting from operations | (1,861,037,876) | 841,060,624 |
| Distributions to shareholders | (664,417,720) | (506,747,337) |
| Share transactions | | |
| Proceeds from sales of shares | 1,780,488,165 | 2,440,637,033 |
| Reinvestment of distributions | 664,417,720 | 506,747,337 |
| Cost of shares redeemed | (4,306,137,056) | (1,319,977,575) |
| Net increase (decrease) in net assets resulting from share transactions | (1,861,231,171) | 1,627,406,795 |
| Total increase (decrease) in net assets | (4,386,686,767) | 1,961,720,082 |
| Net Assets | | |
| Beginning of period | 15,992,396,473 | 14,030,676,391 |
| End of period | $11,605,709,706 | $15,992,396,473 |
| Other Information | | |
| Shares | | |
| Sold | 202,786,325 | 262,484,972 |
| Issued in reinvestment of distributions | 67,797,726 | 57,913,981 |
| Redeemed | (491,561,140) | (141,800,099) |
| Net increase (decrease) | (220,977,089) | 178,598,854 |
See accompanying notes which are an integral part of the financial statements.
Financial Highlights
Fidelity Series International Value Fund
| | | | | | |
| Years ended October 31, | 2020 | 2019 | 2018 | 2017 | 2016 |
| Selected Per–Share Data | | | | | |
| Net asset value, beginning of period | $9.82 | $9.68 | $10.87 | $9.27 | $9.91 |
| Income from Investment Operations | | | | | |
| Net investment income (loss)A | .26 | .39 | .38 | .29 | .24 |
| Net realized and unrealized gain (loss) | (1.43) | .10 | (1.23) | 1.55 | (.68) |
| Total from investment operations | (1.17) | .49 | (.85) | 1.84 | (.44) |
| Distributions from net investment income | (.36) | (.35) | (.31) | (.22) | (.20) |
| Distributions from net realized gain | (.04) | – | (.03) | (.02) | – |
| Total distributions | (.40) | (.35) | (.34) | (.24) | (.20) |
| Net asset value, end of period | $8.25 | $9.82 | $9.68 | $10.87 | $9.27 |
| Total ReturnB | (12.55)% | 5.48% | (8.11)% | 20.33% | (4.49)% |
| Ratios to Average Net AssetsC,D | | | | | |
| Expenses before reductions | .01% | .01% | .01% | .48% | .96% |
| Expenses net of fee waivers, if any | .01% | .01% | .01% | .47% | .96% |
| Expenses net of all reductions | .01% | .01% | - %E | .46% | .95% |
| Net investment income (loss) | 2.92% | 4.23% | 3.60% | 2.86% | 2.58% |
| Supplemental Data | | | | | |
| Net assets, end of period (000 omitted) | $11,605,710 | $15,992,396 | $14,030,676 | $14,793,134 | $5,774,976 |
| Portfolio turnover rateF | 36%G | 41% | 43% | 51% | 45% |
A Calculated based on average shares outstanding during the period.
B Total returns would have been lower if certain expenses had not been reduced during the applicable periods shown.
C Fees and expenses of any underlying mutual funds or exchange-traded funds (ETFs) are not included in the Fund's expense ratio. The Fund indirectly bears its proportionate share of these expenses. For additional expense information related to investments in Fidelity Central Funds, please refer to the "Investments in Fidelity Central Funds" note found in the Notes to Financial Statements section of the most recent Annual or Semi-Annual report.
D Expense ratios reflect operating expenses of the class. Expenses before reductions do not reflect amounts reimbursed, waived, or reduced through arrangements with the investment advisor, brokerage services, or other offset arrangements, if applicable, and do not represent the amount paid by the class during periods when reimbursements, waivers or reductions occur.
E Amount represents less than .005%.
F Amount does not include the portfolio activity of any underlying mutual funds or exchange-traded funds (ETFs).
G Portfolio turnover rate excludes securities received or delivered in-kind.
See accompanying notes which are an integral part of the financial statements.
Notes to Financial Statements
For the period ended October 31, 2020
1. Organization.
Fidelity Series Emerging Markets Fund, Fidelity Series Emerging Markets Opportunities Fund, Fidelity Series International Growth Fund, Fidelity Series International Small Cap Fund and Fidelity Series International Value Fund (the Funds) are funds of Fidelity Investment Trust (the Trust). The Trust is registered under the Investment Company Act of 1940, as amended (the 1940 Act), as an open-end management investment company organized as a Massachusetts business trust. Each Fund is authorized to issue an unlimited number of shares. Shares are offered only to certain other Fidelity funds and Fidelity managed 529 plans. Investments in emerging markets, if applicable, can be subject to social, economic, regulatory, and political uncertainties and can be extremely volatile.
Effective January 1, 2020, investment advisers Fidelity Investments Money Management, Inc., FMR Co., Inc., and Fidelity SelectCo, LLC, merged with and into Fidelity Management & Research Company. In connection with the merger transactions, the resulting, merged investment adviser was then redomiciled from Massachusetts to Delaware, changed its corporate structure from a corporation to a limited liability company, and changed its name to "Fidelity Management & Research Company LLC".
2. Investments in Fidelity Central Funds.
The Funds invest in Fidelity Central Funds, which are open-end investment companies generally available only to other investment companies and accounts managed by the investment adviser and its affiliates. The Funds' Schedules of Investments list each of the Fidelity Central Funds held as of period end, if any, as an investment of each Fund, but do not include the underlying holdings of each Fidelity Central Fund. As an Investing Fund, each Fund indirectly bears its proportionate share of the expenses of the underlying Fidelity Central Funds.
The Money Market Central Funds seek preservation of capital and current income and are managed by the investment adviser. Annualized expenses of the Money Market Central Funds as of their most recent shareholder report date ranged from less than .005% to .01%.
A complete unaudited list of holdings for each Fidelity Central Fund is available upon request or at the Securities and Exchange Commission (the SEC) website at www.sec.gov. In addition, the financial statements of the Fidelity Central Funds, which are not covered by the Funds' Report of Independent Registered Public Accounting Firm, are available on the SEC website or upon request.
3. Significant Accounting Policies.
Each Fund is an investment company and applies the accounting and reporting guidance of the Financial Accounting Standards Board (FASB) Accounting Standards Codification Topic 946 Financial Services – Investment Companies. The financial statements have been prepared in conformity with accounting principles generally accepted in the United States of America (GAAP), which require management to make certain estimates and assumptions at the date of the financial statements. Actual results could differ from those estimates. Subsequent events, if any, through the date that the financial statements were issued have been evaluated in the preparation of the financial statements. The following summarizes the significant accounting policies of the Funds:
Investment Valuation. Investments are valued as of 4:00 p.m. Eastern time on the last calendar day of the period. The Board of Trustees (the Board) has delegated the day to day responsibility for the valuation of each Fund's investments to the Fair Value Committee (the Committee) established by each Fund's investment adviser. In accordance with valuation policies and procedures approved by the Board, each Fund attempts to obtain prices from one or more third party pricing vendors or brokers to value its investments. When current market prices, quotations or currency exchange rates are not readily available or reliable, investments will be fair valued in good faith by the Committee, in accordance with procedures adopted by the Board. Factors used in determining fair value vary by investment type and may include market or investment specific events, changes in interest rates and credit quality. The frequency with which these procedures are used cannot be predicted and they may be utilized to a significant extent. The Committee oversees each Fund's valuation policies and procedures and reports to the Board on the Committee's activities and fair value determinations. The Board monitors the appropriateness of the procedures used in valuing each Fund's investments and ratifies the fair value determinations of the Committee.
Each Fund categorizes the inputs to valuation techniques used to value its investments into a disclosure hierarchy consisting of three levels as shown below:
- Level 1 – quoted prices in active markets for identical investments
- Level 2 – other significant observable inputs (including quoted prices for similar investments, interest rates, prepayment speeds, etc.)
- Level 3 – unobservable inputs (including the Fund's own assumptions based on the best information available)
Valuation techniques used to value each Fund's investments by major category are as follows:
Equity securities, including restricted securities, for which market quotations are readily available, are valued at the last reported sale price or official closing price as reported by a third party pricing vendor on the primary market or exchange on which they are traded and are categorized as Level 1 in the hierarchy. In the event there were no sales during the day or closing prices are not available, securities are valued at the last quoted bid price or may be valued using the last available price and are generally categorized as Level 2 in the hierarchy. For foreign equity securities, when market or security specific events arise, comparisons to the valuation of American Depositary Receipts (ADRs), futures contracts, Exchange-Traded Funds (ETFs) and certain indexes as well as quoted prices for similar securities may be used and would be categorized as Level 2 in the hierarchy. For equity securities, including restricted securities, where observable inputs are limited, assumptions about market activity and risk are used and these securities may be categorized as Level 3 in the hierarchy.
Debt securities, including restricted securities, are valued based on evaluated prices received from third party pricing vendors or from brokers who make markets in such securities. U.S. government and government agency obligations are valued by pricing vendors who utilize matrix pricing which considers yield or price of bonds of comparable quality, coupon, maturity and type or by broker-supplied prices. When independent prices are unavailable or unreliable, debt securities may be valued utilizing pricing methodologies which consider similar factors that would be used by third party pricing vendors. Debt securities are generally categorized as Level 2 in the hierarchy but may be Level 3 depending on the circumstances. ETFs are valued at their last sale price or official closing price as reported by a third party pricing vendor on the primary market or exchange on which they are traded and are categorized as Level 1 in the hierarchy. In the event there were no sales during the day but the exchange reports a closing bid level, ETFs are valued at the closing bid and would be categorized as Level 1 in the hierarchy. In the event there was no closing bid, ETFs may be valued by another method that the Board believes reflects fair value in accordance with the Board's fair value pricing policies and may be categorized as Level 2 in the hierarchy.
Futures contracts are valued at the settlement price established each day by the board of trade or exchange on which they are traded and are categorized as Level 1 in the hierarchy. Investments in open-end mutual funds, including the Fidelity Central Funds, are valued at their closing net asset value (NAV) each business day and are categorized as Level 1 in the hierarchy.
Changes in valuation techniques may result in transfers in or out of an assigned level within the disclosure hierarchy. The aggregate value of investments by input level as of October 31, 2020 is included at the end of each Fund's Schedule of Investments.
Foreign Currency. Certain Funds may use foreign currency contracts to facilitate transactions in foreign-denominated securities. Gains and losses from these transactions may arise from changes in the value of the foreign currency or if the counterparties do not perform under the contracts' terms.
Foreign-denominated assets, including investment securities, and liabilities are translated into U.S. dollars at the exchange rates at period end. Purchases and sales of investment securities, income and dividends received, and expenses denominated in foreign currencies are translated into U.S. dollars at the exchange rate in effect on the transaction date.
The effects of exchange rate fluctuations on investments are included with the net realized and unrealized gain (loss) on investment securities. Other foreign currency transactions resulting in realized and unrealized gain (loss) are disclosed separately.
Investment Transactions and Income. For financial reporting purposes, the Funds' investment holdings and NAV include trades executed through the end of the last business day of the period. The NAV per share for processing shareholder transactions is calculated as of the close of business of the New York Stock Exchange (NYSE), normally 4:00 p.m. Eastern time and includes trades executed through the end of the prior business day. Gains and losses on securities sold are determined on the basis of identified cost and for certain Funds include proceeds received from litigation. Dividend income is recorded on the ex-dividend date, except for certain dividends from foreign securities where the ex-dividend date may have passed, which are recorded as soon as the Funds are informed of the ex-dividend date. Non-cash dividends included in dividend income, if any, are recorded at the fair market value of the securities received. Income and capital gain distributions from Fidelity Central Funds, if any, are recorded on the ex-dividend date. Certain distributions received by the Funds represent a return of capital or capital gain. The Funds determine the components of these distributions subsequent to the ex-dividend date, based upon receipt of tax filings or other correspondence relating to the underlying investment. These distributions are recorded as a reduction of cost of investments and/or as a realized gain. Interest income is accrued as earned and includes coupon interest and amortization of premium and accretion of discount on debt securities as applicable. Investment income is recorded net of foreign taxes withheld where recovery of such taxes is uncertain.
Expenses. Expenses directly attributable to a fund are charged to that fund. Expenses attributable to more than one fund are allocated among the respective funds on the basis of relative net assets or other appropriate methods. Expense estimates are accrued in the period to which they relate and adjustments are made when actual amounts are known.
Income Tax Information and Distributions to Shareholders. Each year, each Fund intends to qualify as a regulated investment company under Subchapter M of the Internal Revenue Code, including distributing substantially all of its taxable income and realized gains. As a result, no provision for U.S. Federal income taxes is required. As of October 31, 2020, each Fund did not have any unrecognized tax benefits in the financial statements; nor is each Fund aware of any tax positions for which it is reasonably possible that the total amounts of unrecognized tax benefits will significantly change in the next twelve months. Each Fund files a U.S. federal tax return, in addition to state and local tax returns as required. Each Fund's federal income tax returns are subject to examination by the Internal Revenue Service (IRS) for a period of three fiscal years after they are filed. State and local tax returns may be subject to examination for an additional fiscal year depending on the jurisdiction. Foreign taxes are provided for based on each Fund's understanding of the tax rules and rates that exist in the foreign markets in which it invests. Fidelity Series Emerging Markets Fund, Fidelity Series Emerging Markets Opportunities Fund, Fidelity Series International Growth Fund and Fidelity Series International Small Cap Fund are subject to a tax imposed on capital gains by certain countries in which they invest. An estimated deferred tax liability for net unrealized appreciation on the applicable securities is included in Other payables and accrued expenses on each applicable Fund's Statement of Assets & Liabilities.
Distributions are declared and recorded on the ex-dividend date. Income and capital gain distributions are determined in accordance with income tax regulations, which may differ from GAAP.
Capital accounts within the financial statements are adjusted for permanent book-tax differences. These adjustments have no impact on net assets or the results of operations. Capital accounts are not adjusted for temporary book-tax differences which will reverse in a subsequent period.
Book-tax differences are primarily due to futures contracts, foreign currency transactions, certain foreign taxes, passive foreign investment companies (PFIC), market discount, capital loss carryforwards and losses deferred due to wash sales.
As of period end, the cost and unrealized appreciation (depreciation) in securities, and derivatives if applicable, for federal income tax purposes were as follows for each Fund:
| | Tax cost | Gross unrealized appreciation | Gross unrealized depreciation | Net unrealized appreciation (depreciation) |
| Fidelity Series Emerging Markets Fund | $2,518,682,310 | $ 599,983,265 | $(174,165,177) | $ 425,818,088 |
| Fidelity Series Emerging Markets Opportunities Fund | 21,230,087,984 | 8,061,107,593 | (2,176,018,840) | 5,885,088,753 |
| Fidelity Series International Growth Fund | 6,558,438,775 | 5,059,982,626 | (103,261,698) | 4,956,720,928 |
| Fidelity Series International Small Cap Fund | 2,400,792,291 | 1,440,301,214 | (186,817,825) | 1,253,483,389 |
| Fidelity Series International Value Fund | 12,052,083,304 | 1,647,611,501 | (2,159,192,454) | (511,580,953) |
The tax-based components of distributable earnings as of period end were as follows for each Fund:
| | Undistributed ordinary income | Undistributed long-term capital gain | Capital loss carryforward | Net unrealized appreciation (depreciation) on securities and other investments |
| Fidelity Series Emerging Markets Fund | $38,677,217 | $– | $(283,118,375) | $425,861,723 |
| Fidelity Series Emerging Markets Opportunities Fund | 331,661,729 | 503,816,512 | – | 5,884,385,025 |
| Fidelity Series International Growth Fund | 159,958,750 | 1,718,720,480 | – | 4,959,187,222 |
| Fidelity Series International Small Cap Fund | 24,973,962 | – | (49,089,033) | 1,253,644,938 |
| Fidelity Series International Value Fund | 349,783,631 | – | (1,534,215,516) | (509,514,270) |
Capital loss carryforwards are only available to offset future capital gains of the Funds to the extent provided by regulations and may be limited. The capital loss carryforward information presented below, including any applicable limitation, is estimated as of fiscal period end and is subject to adjustment.
| | No expiration | | |
| | Short-term | Long-term | Total capital loss carryfoward |
| Fidelity Series Emerging Markets Fund | $(95,504,325) | $(187,614,050) | $(283,118,375) |
| Fidelity Series International Small Cap Fund | (24,154,384) | (24,934,649) | (49,089,033) |
| Fidelity Series International Value Fund | (987,579,233) | (546,636,283) | (1,534,215,516) |
The tax character of distributions paid was as follows:
| October 31, 2020 | | | |
| | Ordinary Income | Long-term Capital Gains | Total |
| Fidelity Series Emerging Markets Fund | $52,999,079 | $– | $52,999,079 |
| Fidelity Series Emerging Markets Opportunities Fund | 524,696,385 | – | 524,696,385 |
| Fidelity Series International Growth Fund | 363,436,552 | 262,263,674 | 625,700,226 |
| Fidelity Series International Small Cap Fund | 87,553,807 | 72,027,024 | 159,580,831 |
| Fidelity Series International Value Fund | 664,417,720 | – | 664,417,720 |
| October 31, 2019 | | | |
| | Ordinary Income | Long-term Capital Gains | Total |
| Fidelity Series Emerging Markets Fund | $6,416,055 | $– | $6,416,055 |
| Fidelity Series Emerging Markets Opportunities Fund | 311,016,955 | 874,064,891 | 1,185,081,846 |
| Fidelity Series International Growth Fund | 265,068,295 | 659,438,197 | 924,506,492 |
| Fidelity Series International Small Cap Fund | 78,568,733 | 231,108,029 | 309,676,762 |
| Fidelity Series International Value Fund | 506,747,337 | – | 506,747,337 |
Restricted Securities (including Private Placements). The Funds may invest in securities that are subject to legal or contractual restrictions on resale. These securities generally may be resold in transactions exempt from registration or to the public if the securities are registered. Disposal of these securities may involve time-consuming negotiations and expense, and prompt sale at an acceptable price may be difficult. Information regarding restricted securities is included at the end of each applicable Fund's Schedule of Investments.
4. Derivative Instruments.
Risk Exposures and the Use of Derivative Instruments. The Funds' investment objective allows the Funds to enter into various types of derivative contracts, including futures contracts. Derivatives are investments whose value is primarily derived from underlying assets, indices or reference rates and may be transacted on an exchange or over-the-counter (OTC). Derivatives may involve a future commitment to buy or sell a specified asset based on specified terms, to exchange future cash flows at periodic intervals based on a notional principal amount, or for one party to make one or more payments upon the occurrence of specified events in exchange for periodic payments from the other party.
The Funds used derivatives to increase returns and to manage exposure to certain risks as defined below. The success of any strategy involving derivatives depends on analysis of numerous economic factors, and if the strategies for investment do not work as intended, the Funds may not achieve their objectives.
The Funds' use of derivatives increased or decreased their exposure to the following risk:
| Equity Risk | Equity risk relates to the fluctuations in the value of financial instruments as a result of changes in market prices (other than those arising from interest rate risk or foreign exchange risk), whether caused by factors specific to an individual investment, its issuer, or all factors affecting all instruments traded in a market or market segment.
|
The Funds are also exposed to additional risks from investing in derivatives, such as liquidity risk and counterparty credit risk. Liquidity risk is the risk that the Funds will be unable to close out the derivative in the open market in a timely manner. Counterparty credit risk is the risk that the counterparty will not be able to fulfill its obligation to the Funds. Derivative counterparty credit risk is managed through formal evaluation of the creditworthiness of all potential counterparties.
Investing in derivatives may involve greater risks than investing in the underlying assets directly and, to varying degrees, may involve risk of loss in excess of any initial investment and collateral received and amounts recognized in the Statement of Assets and Liabilities. In addition, there may be the risk that the change in value of the derivative contract does not correspond to the change in value of the underlying instrument.
Futures Contracts. A futures contract is an agreement between two parties to buy or sell a specified underlying instrument for a fixed price at a specified future date. The Funds used futures contracts to manage their exposure to the stock market.
Upon entering into a futures contract, a fund is required to deposit either cash or securities (initial margin) with a clearing broker in an amount equal to a certain percentage of the face value of the contract. Futures contracts are marked-to-market daily and subsequent daily payments (variation margin) are made or received by a fund depending on the daily fluctuations in the value of the futures contracts and are recorded as unrealized appreciation or (depreciation). This receivable and/or payable, if any, is included in daily variation margin on futures contracts in the Statement of Assets and Liabilities. Realized gain or (loss) is recorded upon the expiration or closing of a futures contract. The net realized gain (loss) and change in net unrealized appreciation (depreciation) on futures contracts during the period is presented in the Statement of Operations.
Any open futures contracts at period end are presented in the Schedule of Investments under the caption "Futures Contracts". The notional amount at value reflects each contract's exposure to the underlying instrument or index at period end and is representative of volume of activity during the period. Securities deposited to meet initial margin requirements are identified in the Schedule of Investments.
5. Purchases and Sales of Investments.
Purchases and sales of securities, other than short-term securities and in-kind transactions, are noted in the table below.
| | Purchases ($) | Sales ($) |
| Fidelity Series Emerging Markets Fund | 3,549,378,304 | 2,751,374,095 |
| Fidelity Series Emerging Markets Opportunities Fund | 14,611,046,784 | 9,092,061,975 |
| Fidelity Series International Growth Fund | 2,193,679,421 | 8,268,632,075 |
| Fidelity Series International Small Cap Fund | 807,281,964 | 922,525,535 |
| Fidelity Series International Value Fund | 4,767,502,611 | 7,236,157,702 |
6. Fees and Other Transactions with Affiliates.
Management Fee. Fidelity Management & Research Company LLC (the investment adviser) and its affiliates provide the Funds with investment management related services for which the Funds do not pay a management fee. Under the management contract, the investment adviser or an affiliate pays all ordinary operating expenses of the Funds, except custody fees, fees and expenses of the independent Trustees, and certain miscellaneous expenses such as proxy and shareholder meeting expenses.
Brokerage Commissions. A portion of portfolio transactions were placed with brokerage firms which are affiliates of the investment adviser. Brokerage commissions are included in net realized gain (loss) and change in net unrealized appreciation (depreciation) in the Statement of Operations. The commissions paid to these affiliated firms were as follows:
| | Amount |
| Fidelity Series Emerging Markets Fund | $4,636 |
| Fidelity Series Emerging Markets Opportunities Fund | 88,629 |
| Fidelity Series International Growth Fund | 13,148 |
| Fidelity Series International Small Cap Fund | 519 |
| Fidelity Series International Value Fund | 2,581 |
Interfund Lending Program. Pursuant to an Exemptive Order issued by the SEC, each Fund, along with other registered investment companies having management contracts with Fidelity Management & Research Company LLC (FMR), or other affiliated entities of FMR, may participate in an interfund lending program. This program provides an alternative credit facility allowing each Fund to borrow from, or lend money to, other participating affiliated funds. At period end, there were no interfund loans outstanding. Activity in this program during the period for which loans were outstanding was as follows:
| | Borrower or Lender | Average Loan Balance | Weighted Average Interest Rate | Interest Expense |
| Fidelity Series Emerging Markets Fund | Borrower | $13,852,000 | .29% | $444 |
| Fidelity Series International Growth Fund | Borrower | 109,066,833 | 1.33% | 145,208 |
| Fidelity Series International Value Fund | Borrower | 60,613,624 | 1.01% | 144,049 |
Interfund Trades. Funds may purchase from or sell securities to other Fidelity Funds under procedures adopted by the Board. The procedures have been designed to ensure these interfund trades are executed in accordance with Rule 17a-7 of the 1940 Act. Interfund trades are included within the respective purchases and sales amounts shown in the Purchases and Sales of Investments note.
Affiliated Exchanges In-Kind. During the period, Fidelity Series Emerging Markets Fund received investments and cash valued at $58,024,325 in exchange for 6,069,490 shares of the Fund. Fidelity Series Emerging Markets Opportunities Fund received investments and cash valued at $522,218,927 in exchange for 26,562,509 shares of the Fund. Fidelity Series International Growth Fund received investments and cash valued at $333,338,148 in exchange for 19,301,572 shares of the Fund. Fidelity Series International Small Cap Fund received investments and cash valued at $84,931,704 in exchange for 5,043,450 shares of the Fund. Fidelity Series International Value Fund received investments and cash valued at $333,338,148 in exchange for 33,670,520 shares of the Fund. The amount of in-kind exchanges is included in the Fund's share transactions in the accompanying Statement of Changes in Net Assets.
Other. During the period, the investment adviser reimbursed the Funds for certain losses as follows:
| | Amount |
| Fidelity Series Emerging Markets Fund | $3,202 |
| Fidelity Series International Growth Fund | 98,839 |
| Fidelity Series International Small Cap Fund | 6,858 |
7. Committed Line of Credit.
Certain Funds participate with other funds managed by the investment adviser or an affiliate in a $4.25 billion credit facility (the "line of credit") to be utilized for temporary or emergency purposes to fund shareholder redemptions or for other short-term liquidity purposes. The participating funds have agreed to pay commitment fees on their pro-rata portion of the line of credit, which are reflected in Miscellaneous expenses on the Statement of Operations, and are as follows:
| | Amount |
| Fidelity Series Emerging Markets Fund | $5,587 |
| Fidelity Series Emerging Markets Opportunities Fund | 51,058 |
| Fidelity Series International Growth Fund | 33,729 |
| Fidelity Series International Small Cap Fund | 8,235 |
| Fidelity Series International Value Fund | 32,167 |
During the period, there were no borrowings on this line of credit.
8. Security Lending.
Funds lend portfolio securities from time to time in order to earn additional income. Lending agents are used, including National Financial Services (NFS), an affiliate of the investment adviser. Pursuant to a securities lending agreement, NFS will receive a fee, which is capped at 9.9% of a fund's daily lending revenue, for its services as lending agent. A fund may lend securities to certain qualified borrowers, including NFS. On the settlement date of the loan, a fund receives collateral (in the form of U.S. Treasury obligations, letters of credit and/or cash) against the loaned securities and maintains collateral in an amount not less than 100% of the market value of the loaned securities during the period of the loan. The market value of the loaned securities is determined at the close of business of a fund and any additional required collateral is delivered to a fund on the next business day. A fund or borrower may terminate the loan at any time, and if the borrower defaults on its obligation to return the securities loaned because of insolvency or other reasons, a fund may apply collateral received from the borrower against the obligation. A fund may experience delays and costs in recovering the securities loaned. Any cash collateral received is invested in the Fidelity Securities Lending Cash Central Fund. Any loaned securities are identified as such in the Schedule of Investments, and the value of loaned securities and cash collateral at period end, as applicable, are presented in the Statement of Assets and Liabilities. Security lending income represents the income earned on investing cash collateral, less rebates paid to borrowers and any lending agent fees associated with the loan, plus any premium payments received for lending certain types of securities. Security lending income is presented in the Statement of Operations as a component of income from Fidelity Central Funds. Affiliated security lending activity, if any, was as follows:
| | Total Security Lending Income Fees Paid to NFS | Security Lending Income From Securities Loaned to NFS | Value of Securities Loaned to NFS at Period End |
| Fidelity Series Emerging Markets Fund | $1,685 | $313 | $– |
| Fidelity Series Emerging Markets Opportunities Fund | 60,854 | – | – |
| Fidelity Series International Growth Fund | 3,294 | 3,052 | – |
| Fidelity Series International Small Cap Fund | 1,490 | – | – |
| Fidelity Series International Value Fund | 4,027 | – | – |
9. Bank Borrowings.
Each Fund is permitted to have bank borrowings for temporary or emergency purposes to fund shareholder redemptions or for other short-term liquidity requirements. Each Fund has established borrowing arrangements with certain banks. The interest rate on the borrowings is the bank's base rate, as revised from time to time. Any open loans, including accrued interest, at period end are presented under the caption "Notes payable" in the Statement of Assets and Liabilities, if applicable. Activity in this program during the period for which loans were outstanding was as follows:
| | Average Loan Balance | Weighted Average Interest Rate | Interest Expense |
| Fidelity Series International Value Fund | $24,240,000 | .58% | $1,946 |
10. Expense Reductions.
The investment adviser contractually agreed to reimburse each Fund to the extent annual operating expenses exceeded certain levels of average net assets as noted in the table below. This reimbursement will remain in place through February 28, 2024. Some expenses, for example the compensation of the independent Trustees, and certain other expenses such as interest expense, are excluded from this reimbursement.
The following Funds were in reimbursement during the period:
| | Expense Limitations | Reimbursement |
| Fidelity Series Emerging Markets Fund | .014% / .013%(a) | $805,737 |
| Fidelity Series Emerging Markets Opportunities Fund | .014% / .013%(a) | 4,794,325 |
(a) Expense limitation effective August 1, 2020.
In addition, through arrangements with each applicable Fund's custodian, credits realized as a result of certain uninvested cash balances were used to reduce each applicable Fund's expenses. All of the applicable expense reductions are noted in the table below.
| | Custodian credits |
| Fidelity Series Emerging Markets Fund | $1,957 |
| Fidelity Series Emerging Markets Opportunities Fund | 1,058 |
| Fidelity Series International Value Fund | 1,248 |
11. Other.
The Funds' organizational documents provide former and current trustees and officers with a limited indemnification against liabilities arising in connection with the performance of their duties to the Funds. In the normal course of business, the Funds may also enter into contracts that provide general indemnifications. The Funds' maximum exposure under these arrangements is unknown as this would be dependent on future claims that may be made against the Funds. The risk of material loss from such claims is considered remote.
At the end of the period, mutual funds and accounts managed by the investment adviser or its affiliates were the owners of record of all of the outstanding shares of the Funds.
12. Coronavirus (COVID-19) Pandemic.
An outbreak of COVID-19 first detected in China during December 2019 has since spread globally and was declared a pandemic by the World Health Organization during March 2020. Developments that disrupt global economies and financial markets, such as the COVID-19 pandemic, may magnify factors that affect the Funds' performance.
Report of Independent Registered Public Accounting Firm
To the Board of Trustees of Fidelity Investment Trust and Shareholders of Fidelity Series Emerging Markets Fund, Fidelity Series Emerging Markets Opportunities Fund, Fidelity Series International Small Cap Fund and Fidelity Series International Value Fund:
Opinion on the Financial Statements and Financial Highlights
We have audited the accompanying statements of assets and liabilities of Fidelity Series Emerging Markets Fund, Fidelity Series Emerging Markets Opportunities Fund, Fidelity Series International Small Cap Fund and Fidelity Series International Value Fund (the "Funds"), each a fund of Fidelity Investment Trust, including the schedules of investments, as of October 31, 2020, the related statements of operations for the year then ended, the statements of changes in net assets for each of the two years in the period then ended and the financial highlights for each of the five years in the period then ended, except for Fidelity Series Emerging Markets Fund; the related statement of operations for the year then ended, the statement of changes in net assets for each of the two years in the period then ended, and the financial highlights for each of the two years in the period then ended and for the period from August 29, 2018 (commencement of operations) to October 31, 2018; and the related notes. In our opinion, the financial statements and financial highlights present fairly, in all material respects, the financial position of each of the Funds as of October 31, 2020, and the results of their operations for the year then ended, the changes in their net assets for each of the two years in the period then ended, and the financial highlights for each of the five years in the period then ended, except for Fidelity Series Emerging Markets Fund; the results of its operations for the period then ended, and the changes in its net assets for each of the two years in the period then ended, and the financial highlights for each of the two years in the period then ended and for the period from August 29, 2018 (commencement of operations) to October 31, 2018, in conformity with accounting principles generally accepted in the United States of America.
Basis for Opinion
These financial statements and financial highlights are the responsibility of the Funds’ management. Our responsibility is to express an opinion on the Funds’ financial statements and financial highlights based on our audits. We are a public accounting firm registered with the Public Company Accounting Oversight Board (United States) (PCAOB) and are required to be independent with respect to the Funds in accordance with the U.S. federal securities laws and the applicable rules and regulations of the Securities and Exchange Commission and the PCAOB.
We conducted our audits in accordance with the standards of the PCAOB. Those standards require that we plan and perform the audit to obtain reasonable assurance about whether the financial statements and financial highlights are free of material misstatement, whether due to error or fraud. The Funds are not required to have, nor were we engaged to perform, an audit of their internal control over financial reporting. As part of our audits we are required to obtain an understanding of internal control over financial reporting but not for the purpose of expressing an opinion on the effectiveness of the Funds’ internal control over financial reporting. Accordingly, we express no such opinion.
Our audits included performing procedures to assess the risks of material misstatement of the financial statements and financial highlights, whether due to error or fraud, and performing procedures that respond to those risks. Such procedures included examining, on a test basis, evidence regarding the amounts and disclosures in the financial statements and financial highlights. Our audits also included evaluating the accounting principles used and significant estimates made by management, as well as evaluating the overall presentation of the financial statements and financial highlights. Our procedures included confirmation of securities owned as of October 31, 2020, by correspondence with the custodian and brokers; when replies were not received from brokers, we performed other auditing procedures. We believe that our audits provide a reasonable basis for our opinion.
/s/ Deloitte & Touche LLP
Boston, Massachusetts
December 15, 2020
We have served as the auditor of one or more of the Fidelity investment companies since 1999.
Report of Independent Registered Public Accounting Firm
To the Board of Trustees of Fidelity Investment Trust and the Shareholders of Fidelity Series International Growth Fund
Opinion on the Financial Statements
We have audited the accompanying statement of assets and liabilities, including the schedule of investments, of Fidelity Series International Growth Fund (one of the funds constituting Fidelity Investment Trust, referred to hereafter as the “Fund”) as of October 31, 2020, the related statement of operations for the year ended October 31, 2020, the statement of changes in net assets for each of the two years in the period ended October 31, 2020, including the related notes, and the financial highlights for each of the five years in the period ended October 31, 2020 (collectively referred to as the “financial statements”). In our opinion, the financial statements present fairly, in all material respects, the financial position of the Fund as of October 31, 2020, the results of its operations for the year then ended, the changes in its net assets for each of the two years in the period ended October 31, 2020 and the financial highlights for each of the five years in the period ended October 31, 2020 in conformity with accounting principles generally accepted in the United States of America.
Basis for Opinion
These financial statements are the responsibility of the Fund’s management. Our responsibility is to express an opinion on the Fund’s financial statements based on our audits. We are a public accounting firm registered with the Public Company Accounting Oversight Board (United States) (PCAOB) and are required to be independent with respect to the Fund in accordance with the U.S. federal securities laws and the applicable rules and regulations of the Securities and Exchange Commission and the PCAOB.
We conducted our audits of these financial statements in accordance with the standards of the PCAOB. Those standards require that we plan and perform the audit to obtain reasonable assurance about whether the financial statements are free of material misstatement, whether due to error or fraud.
Our audits included performing procedures to assess the risks of material misstatement of the financial statements, whether due to error or fraud, and performing procedures that respond to those risks. Such procedures included examining, on a test basis, evidence regarding the amounts and disclosures in the financial statements. Our audits also included evaluating the accounting principles used and significant estimates made by management, as well as evaluating the overall presentation of the financial statements. Our procedures included confirmation of securities owned as of October 31, 2020 by correspondence with the custodian and brokers; when replies were not received from brokers, we performed other auditing procedures. We believe that our audits provide a reasonable basis for our opinion.
/s/ PricewaterhouseCoopers LLP
Boston, Massachusetts
December 15, 2020
We have served as the auditor of one or more investment companies in the Fidelity group of funds since 1932.
Trustees and Officers
The Trustees, Members of the Advisory Board (if any), and officers of the trust and funds, as applicable, are listed below. The Board of Trustees governs each fund and is responsible for protecting the interests of shareholders. The Trustees are experienced executives who meet periodically throughout the year to oversee each fund's activities, review contractual arrangements with companies that provide services to each fund, oversee management of the risks associated with such activities and contractual arrangements, and review each fund's performance. Except for Jonathan Chiel, each of the Trustees oversees 305 funds. Mr. Chiel oversees 176 funds.
The Trustees hold office without limit in time except that (a) any Trustee may resign; (b) any Trustee may be removed by written instrument, signed by at least two-thirds of the number of Trustees prior to such removal; (c) any Trustee who requests to be retired or who has become incapacitated by illness or injury may be retired by written instrument signed by a majority of the other Trustees; and (d) any Trustee may be removed at any special meeting of shareholders by a two-thirds vote of the outstanding voting securities of the trust. Each Trustee who is not an interested person (as defined in the 1940 Act) of the trust and the funds is referred to herein as an Independent Trustee. Each Independent Trustee shall retire not later than the last day of the calendar year in which his or her 75th birthday occurs. The Independent Trustees may waive this mandatory retirement age policy with respect to individual Trustees. Officers and Advisory Board Members hold office without limit in time, except that any officer or Advisory Board Member may resign or may be removed by a vote of a majority of the Trustees at any regular meeting or any special meeting of the Trustees. Except as indicated, each individual has held the office shown or other offices in the same company for the past five years.
Each fund’s Statement of Additional Information (SAI) includes more information about the Trustees. To request a free copy, call Fidelity at 1-800-544-8544.
Experience, Skills, Attributes, and Qualifications of the Trustees. The Governance and Nominating Committee has adopted a statement of policy that describes the experience, qualifications, attributes, and skills that are necessary and desirable for potential Independent Trustee candidates (Statement of Policy). The Board believes that each Trustee satisfied at the time he or she was initially elected or appointed a Trustee, and continues to satisfy, the standards contemplated by the Statement of Policy. The Governance and Nominating Committee also engages professional search firms to help identify potential Independent Trustee candidates who have the experience, qualifications, attributes, and skills consistent with the Statement of Policy. From time to time, additional criteria based on the composition and skills of the current Independent Trustees, as well as experience or skills that may be appropriate in light of future changes to board composition, business conditions, and regulatory or other developments, have also been considered by the professional search firms and the Governance and Nominating Committee. In addition, the Board takes into account the Trustees' commitment and participation in Board and committee meetings, as well as their leadership of standing and ad hoc committees throughout their tenure.
In determining that a particular Trustee was and continues to be qualified to serve as a Trustee, the Board has considered a variety of criteria, none of which, in isolation, was controlling. The Board believes that, collectively, the Trustees have balanced and diverse experience, qualifications, attributes, and skills, which allow the Board to operate effectively in governing each fund and protecting the interests of shareholders. Information about the specific experience, skills, attributes, and qualifications of each Trustee, which in each case led to the Board's conclusion that the Trustee should serve (or continue to serve) as a trustee of the funds, is provided below.
Board Structure and Oversight Function. Robert A. Lawrence is an interested person and currently serves as Acting Chairman. The Trustees have determined that an interested Chairman is appropriate and benefits shareholders because an interested Chairman has a personal and professional stake in the quality and continuity of services provided to the funds. Independent Trustees exercise their informed business judgment to appoint an individual of their choosing to serve as Chairman, regardless of whether the Trustee happens to be independent or a member of management. The Independent Trustees have determined that they can act independently and effectively without having an Independent Trustee serve as Chairman and that a key structural component for assuring that they are in a position to do so is for the Independent Trustees to constitute a substantial majority for the Board. The Independent Trustees also regularly meet in executive session. Ned C. Lautenbach and David M. Thomas serve as Co-Lead Independent Trustees and as such each (i) acts as a liaison between the Independent Trustees and management with respect to matters important to the Independent Trustees and (ii) with management prepares agendas for Board meetings.
Fidelity® funds are overseen by different Boards of Trustees. The funds' Board oversees Fidelity's high income and certain equity funds, and other Boards oversee Fidelity's investment-grade bond, money market, asset allocation, and other equity funds. The asset allocation funds may invest in Fidelity® funds overseen by the funds' Board. The use of separate Boards, each with its own committee structure, allows the Trustees of each group of Fidelity® funds to focus on the unique issues of the funds they oversee, including common research, investment, and operational issues. On occasion, the separate Boards establish joint committees to address issues of overlapping consequences for the Fidelity® funds overseen by each Board.
The Trustees operate using a system of committees to facilitate the timely and efficient consideration of all matters of importance to the Trustees, each fund, and fund shareholders and to facilitate compliance with legal and regulatory requirements and oversight of the funds' activities and associated risks. The Board, acting through its committees, has charged FMR and its affiliates with (i) identifying events or circumstances the occurrence of which could have demonstrably adverse effects on the funds' business and/or reputation; (ii) implementing processes and controls to lessen the possibility that such events or circumstances occur or to mitigate the effects of such events or circumstances if they do occur; and (iii) creating and maintaining a system designed to evaluate continuously business and market conditions in order to facilitate the identification and implementation processes described in (i) and (ii) above. Because the day-to-day operations and activities of the funds are carried out by or through FMR, its affiliates, and other service providers, the funds' exposure to risks is mitigated but not eliminated by the processes overseen by the Trustees. While each of the Board's committees has responsibility for overseeing different aspects of the funds' activities, oversight is exercised primarily through the Operations, Audit, and Compliance Committees. Appropriate personnel, including but not limited to the funds' Chief Compliance Officer (CCO), FMR's internal auditor, the independent accountants, the funds' Treasurer and portfolio management personnel, make periodic reports to the Board's committees, as appropriate, including an annual review of Fidelity's risk management program for the Fidelity® funds. The responsibilities of each standing committee, including their oversight responsibilities, are described further under "Standing Committees of the Trustees."
Interested Trustees*:
Correspondence intended for a Trustee who is an interested person may be sent to Fidelity Investments, 245 Summer Street, Boston, Massachusetts 02210.
Name, Year of Birth; Principal Occupations and Other Relevant Experience+
Jonathan Chiel (1957)
Year of Election or Appointment: 2016
Trustee
Mr. Chiel also serves as Trustee of other Fidelity® funds. Mr. Chiel is Executive Vice President and General Counsel for FMR LLC (diversified financial services company, 2012-present). Previously, Mr. Chiel served as general counsel (2004-2012) and senior vice president and deputy general counsel (2000-2004) for John Hancock Financial Services; a partner with Choate, Hall & Stewart (1996-2000) (law firm); and an Assistant United States Attorney for the United States Attorney’s Office of the District of Massachusetts (1986-95), including Chief of the Criminal Division (1993-1995). Mr. Chiel is a director on the boards of the Boston Bar Foundation and the Maimonides School.
Robert A. Lawrence (1952)
Year of Election or Appointment: 2020
Trustee
Acting Chairman of the Board of Trustees
Mr. Lawrence also serves as Trustee of other funds. Previously, Mr. Lawrence served as a Member of the Advisory Board of certain funds. Prior to his retirement in 2008, Mr. Lawrence served as Vice President of certain Fidelity® funds (2006-2008), Senior Vice President, Head of High Income Division of Fidelity Management & Research Company (investment adviser firm, 2006-2008), and President of Fidelity Strategic Investments (investment adviser firm, 2002-2005).
* Determined to be an “Interested Trustee” by virtue of, among other things, his or her affiliation with the trust or various entities under common control with FMR.
+ The information includes the Trustee's principal occupation during the last five years and other information relating to the experience, attributes, and skills relevant to the Trustee's qualifications to serve as a Trustee, which led to the conclusion that the Trustee should serve as a Trustee for each fund.
Independent Trustees:
Correspondence intended for an Independent Trustee may be sent to Fidelity Investments, P.O. Box 55235, Boston, Massachusetts 02205-5235.
Name, Year of Birth; Principal Occupations and Other Relevant Experience+
Dennis J. Dirks (1948)
Year of Election or Appointment: 2005
Trustee
Mr. Dirks also serves as Trustee of other Fidelity® funds. Prior to his retirement in May 2003, Mr. Dirks served as Chief Operating Officer and as a member of the Board of The Depository Trust & Clearing Corporation (financial markets infrastructure), President, Chief Operating Officer and a member of the Board of The Depository Trust Company (DTC), President and a member of the Board of the National Securities Clearing Corporation (NSCC), Chief Executive Officer and a member of the Board of the Government Securities Clearing Corporation and Chief Executive Officer and a member of the Board of the Mortgage-Backed Securities Clearing Corporation. Mr. Dirks currently serves as a member of the Finance Committee (2016-present) and Board (2017-present) and is Treasurer (2018-present) of the Asolo Repertory Theatre.
Donald F. Donahue (1950)
Year of Election or Appointment: 2018
Trustee
Mr. Donahue also serves as Trustee of other Fidelity® funds. Mr. Donahue serves as President and Chief Executive Officer of Miranda Partners, LLC (risk consulting for the financial services industry, 2012-present). Previously, Mr. Donahue served as Chief Executive Officer (2006-2012), Chief Operating Officer (2003-2006) and Managing Director, Customer Marketing and Development (1999-2003) of The Depository Trust & Clearing Corporation (financial markets infrastructure). Mr. Donahue currently serves as a member (2007-present) and Co-Chairman (2016-present) of the Board of United Way of New York, a member of the Board of NYC Leadership Academy (2012-present) and a member of the Board of Advisors of Ripple Labs, Inc. (financial services, 2015-present). Mr. Donahue previously served as a member of the Advisory Board of certain Fidelity® funds (2015-2018).
Vicki L. Fuller (1957)
Year of Election or Appointment: 2020
Trustee
Ms. Fuller also serves as Trustee of other Fidelity® funds. Previously, Ms. Fuller served as a member of the Advisory Board of certain Fidelity® funds (2018-2020), Chief Investment Officer of the New York State Common Retirement Fund (2012-2018) and held a variety of positions at AllianceBernstein L.P. (global asset management, 1985-2012), including Managing Director (2006-2012) and Senior Vice President and Senior Portfolio Manager (2001-2006). Ms. Fuller currently serves as a member of the Board, Audit Committee and Nominating and Governance Committee of The Williams Companies, Inc. (natural gas infrastructure, 2018-present), as a member of the Board, Audit Committee and Nominating and Governance Committee of two Blackstone business development companies (2020-present) and as a member of the Board of Treliant, LLC (consulting, 2019-present).
Patricia L. Kampling (1959)
Year of Election or Appointment: 2020
Trustee
Ms. Kampling also serves as Trustee of other Fidelity® funds. Prior to her retirement, Ms. Kampling served as Chairman of the Board and Chief Executive Officer (2012-2019), President and Chief Operating Officer (2011-2012) and Executive Vice President and Chief Financial Officer (2010-2011) of Alliant Energy Corporation. Ms. Kampling currently serves as a member of the Board, Compensation Committee and Executive Committee and as Chair of the Audit Committee of Briggs & Stratton Corporation (manufacturing, 2011-present) and as a member of the Board, Audit, Finance and Risk Committee and Safety, Environmental, Technology and Operations Committee of American Water Works Company, Inc. (utilities company, 2019-present). In addition, Ms. Kampling currently serves as a member of the Board of the Nature Conservancy, Wisconsin Chapter (2019-present). Previously, Ms. Kampling served as a Member of the Advisory Board of certain Fidelity® funds (2020), a member of the Board of Interstate Power and Light Company (2012-2019) and Wisconsin Power and Light Company (2012-2019) (each a subsidiary of Alliant Energy Corporation) and as a member of the Board and Workforce Development Committee of the Business Roundtable (2018-2019).
Alan J. Lacy (1953)
Year of Election or Appointment: 2008
Trustee
Mr. Lacy also serves as Trustee of other Fidelity® funds. Previously, Mr. Lacy served as Senior Adviser (2007-2014) of Oak Hill Capital Partners, L.P. (private equity), Chief Executive Officer (2005) and Vice Chairman (2005-2006) of Sears Holdings Corporation (retail), Chief Executive Officer and Chairman of the Board of Sears, Roebuck and Co. (retail, 2000-2005), Chairman (2014-2017) and a member of the Board (2010-2017) of Dave & Buster’s Entertainment, Inc. (restaurant and entertainment complexes) and a member of the Board of Bristol-Myers Squibb Company (global pharmaceuticals, 2008-2020). Mr. Lacy currently serves as a Trustee of the California Chapter of The Nature Conservancy (2015-present) and a member of the Board of the Center for Advanced Study in the Behavioral Sciences at Stanford University (2015-present).
Ned C. Lautenbach (1944)
Year of Election or Appointment: 2000
Trustee
Co-Lead Independent Trustee
Mr. Lautenbach also serves as Trustee of other Fidelity® funds. Mr. Lautenbach currently serves as Chair of the Board of Governors, State University System of Florida (2013-present) and is a member of the Council on Foreign Relations (1994-present). He is also a member and has in the past served as Chairman of the Board of Directors of Artis-Naples (2012-present). Previously, Mr. Lautenbach served as a member and then Lead Director of the Board of Directors of Eaton Corporation (diversified industrial, 1997-2016). He was also a Partner at Clayton, Dubilier & Rice, LLC (private equity investment, 1998-2010); as well as Director of Sony Corporation (2006-2007). In addition, Mr. Lautenbach had a 30-year career with IBM (technology company), during which time he served as Senior Vice President and as a member of the Corporate Executive Committee (1968-1998).
Joseph Mauriello (1944)
Year of Election or Appointment: 2008
Trustee
Mr. Mauriello also serves as Trustee of other Fidelity® funds. Prior to his retirement in January 2006, Mr. Mauriello served in numerous senior management positions including Deputy Chairman and Chief Operating Officer (2004-2005), and Vice Chairman of Financial Services (2002-2004) of KPMG LLP US (professional services, 1965-2005). Mr. Mauriello currently serves as a member of the Independent Directors Council Governing Council (2015-present). Previously, Mr. Mauriello served as a member of the Board of XL Group plc. (global insurance and re-insurance, 2006-2018).
Cornelia M. Small (1944)
Year of Election or Appointment: 2005
Trustee
Ms. Small also serves as Trustee of other Fidelity® funds. Previously, Ms. Small served as Chief Investment Officer, Director of Global Equity Investments and a member of Scudder, Stevens & Clark and Scudder Kemper Investments. Ms. Small previously served as a member of the Board (2009-2019) and Chair of the Investment Committee (2010-2019) of the Teagle Foundation and a member of the Investment Committee of the Berkshire Taconic Community Foundation (2008-2019).
Garnett A. Smith (1947)
Year of Election or Appointment: 2018
Trustee
Mr. Smith also serves as Trustee of other Fidelity® funds. Prior to his retirement, Mr. Smith served as Chairman and Chief Executive Officer (1990-1997) and President (1986-1990) of Inbrand Corp. (manufacturer of personal absorbent products). Prior to his employment with Inbrand Corp., he was employed by a retail fabric chain and North Carolina National Bank (now Bank of America). Mr. Smith previously served as a member of the Advisory Board of certain Fidelity® funds (2012-2013).
David M. Thomas (1949)
Year of Election or Appointment: 2008
Trustee
Co-Lead Independent Trustee
Mr. Thomas also serves as Trustee of other Fidelity® funds. Previously, Mr. Thomas served as Executive Chairman (2005-2006) and Chairman and Chief Executive Officer (2000-2005) of IMS Health, Inc. (pharmaceutical and healthcare information solutions). Mr. Thomas currently serves as Non-Executive Chairman of the Board of Fortune Brands Home and Security (home and security products, 2011-present), and a member of the Board (2004-present) and Presiding Director (2013-present) of Interpublic Group of Companies, Inc. (marketing communication).
Susan Tomasky (1953)
Year of Election or Appointment: 2020
Trustee
Ms. Tomasky also serves as Trustee of other Fidelity® funds. Prior to her retirement, Ms. Tomasky served in various executive officer positions at American Electric Power Company, Inc. (1998-2011), including most recently as President of AEP Transmission (2007-2011). Ms. Tomasky currently serves as a member of the Board and Sustainability Committee and as Chair of the Audit Committee of Marathon Petroleum Corporation (2018-present) and as a member of the Board, Corporate Governance Committee and Organization and Compensation Committee and as Chair of the Audit Committee of Public Service Enterprise Group, Inc. (utilities company, 2012-present). In addition, Ms. Tomasky currently serves as a member of the Board of the Columbus Regional Airport Authority (2007-present), as a member of the Board of the Royal Shakespeare Company – America (2009-present), as a member of the Board of the Columbus Association for the Performing Arts (2011-present) and as a member of the Board of Kenyon College (2016-present). Previously, Ms. Tomasky served as a Member of the Advisory Board of certain Fidelity® funds (2020), a member of the Board (2011-2019) and as Lead Independent Director (2015-2018) of Andeavor Corporation (previously Tesoro Corporation) (independent oil refiner and marketer) and as a member of the Board of Summit Midstream Partners LP (energy, 2012-2018).
Michael E. Wiley (1950)
Year of Election or Appointment: 2020
Trustee
Mr. Wiley also serves as Trustee of other Fidelity® funds. Previously, Mr. Wiley served as a member of the Advisory Board of certain Fidelity® funds (2018-2020), Chairman, President and CEO of Baker Hughes, Inc. (oilfield services, 2000-2004). Mr. Wiley also previously served as a member of the Board of Andeavor Corporation (independent oil refiner and marketer, 2005-2018), a member of the Board of Andeavor Logistics LP (natural resources logistics, 2015-2018) and a member of the Board of High Point Resources (exploration and production, 2005-2020).
+ The information includes the Trustee's principal occupation during the last five years and other information relating to the experience, attributes, and skills relevant to the Trustee's qualifications to serve as a Trustee, which led to the conclusion that the Trustee should serve as a Trustee for each fund.
Advisory Board Members and Officers:
Correspondence intended for a Member of the Advisory Board (if any) may be sent to Fidelity Investments, P.O. Box 55235, Boston, Massachusetts 02205-5235. Correspondence intended for an officer or Peter S. Lynch may be sent to Fidelity Investments, 245 Summer Street, Boston, Massachusetts 02210. Officers appear below in alphabetical order.
Name, Year of Birth; Principal Occupation
Lloyd James Austin, III (1953)
Year of Election or Appointment: 2020
Member of the Advisory Board
General Austin also serves as a Member of the Advisory Board of other Fidelity® funds. Prior to his retirement, General Austin (United States Army, Retired) held a variety of positions within the U.S. Government, including Commander, U.S. Central Command (2013-2016), Vice Chief of Staff, U.S. Army (2012-2013) and Commanding General, U.S. Forces – Iraq, Operation New Dawn (2010-2012). General Austin currently serves as a Partner of Pine Island Capital Partners (private equity, 2020-present) and as President of the Austin Strategy Group LLC (consulting, 2016-present). General Austin serves as a member of the Board of Directors of Nucor Corporation (steel products, 2017-present), as a member of the Board of Directors of Tenet Healthcare Corporation (2018-present) and as a member of the Board of Directors of Raytheon Technologies Corporation (aerospace and defense, 2020-present). In addition, General Austin currently serves as a member of the Board of Trustees of the Carnegie Corporation of New York (2017-present) and as a member of the Board of Trustees of Auburn University (2017-present). Previously, General Austin served as a member of the Board of Directors of United Technologies Corporation (aerospace, defense and building, 2016-2020).
Thomas A. Kennedy (1955)
Year of Election or Appointment: 2020
Member of the Advisory Board
Mr. Kennedy also serves as a Member of the Advisory Board of other Fidelity® funds. Previously, Mr. Kennedy held a variety of positions at Raytheon Company (aerospace and defense, 1983-2020), including Chairman and Chief Executive Officer (2014-2020) and Executive Vice President and Chief Operating Officer (2013-2014). Mr. Kennedy currently serves as Executive Chairman of the Board of Directors of Raytheon Technologies Corporation (aerospace and defense, 2020-present). He is also a member of the Rutgers School of Engineering Industry Advisory Board (2011-present) and a member of the UCLA Engineering Dean’s Executive Board (2016-present).
Peter S. Lynch (1944)
Year of Election or Appointment: 2003
Member of the Advisory Board
Mr. Lynch also serves as a Member of the Advisory Board of other Fidelity® funds. Mr. Lynch is Vice Chairman and a Director of Fidelity Management & Research Company LLC (investment adviser firm). In addition, Mr. Lynch serves as a Trustee of Boston College and as the Chairman of the Inner-City Scholarship Fund. Previously, Mr. Lynch served as Vice Chairman and a Director of FMR Co., Inc. (investment adviser firm) and on the Special Olympics International Board of Directors (1997-2006).
Elizabeth Paige Baumann (1968)
Year of Election or Appointment: 2017
Anti-Money Laundering (AML) Officer
Ms. Baumann also serves as AML Officer of other funds. She is Chief AML Officer (2012-present) and Senior Vice President (2014-present) of FMR LLC (diversified financial services company) and is an employee of Fidelity Investments. Previously, Ms. Baumann served as AML Officer of certain funds (2017-2019), as AML Officer of the funds (2012-2016), and Vice President (2007-2014) and Deputy Anti-Money Laundering Officer (2007-2012) of FMR LLC.
Craig S. Brown (1977)
Year of Election or Appointment: 2019
Assistant Treasurer
Mr. Brown also serves as Assistant Treasurer of other funds. Mr. Brown is an employee of Fidelity Investments (2013-present).
John J. Burke III (1964)
Year of Election or Appointment: 2018
Chief Financial Officer
Mr. Burke also serves as Chief Financial Officer of other funds. Mr. Burke serves as Head of Investment Operations for Fidelity Fund and Investment Operations (2018-present) and is an employee of Fidelity Investments (1998-present). Previously Mr. Burke served as head of Asset Management Investment Operations (2012-2018).
William C. Coffey (1969)
Year of Election or Appointment: 2019
Assistant Secretary
Mr. Coffey also serves as Assistant Secretary of other funds. He is Senior Vice President and Deputy General Counsel of FMR LLC (diversified financial services company, 2010-present), and is an employee of Fidelity Investments. Previously, Mr. Coffey served as Secretary and CLO of certain funds (2018-2019); CLO, Secretary, and Senior Vice President of Fidelity Management & Research Company and FMR Co., Inc. (investment adviser firms, 2018-2019); Secretary of Fidelity SelectCo, LLC and Fidelity Investments Money Management, Inc. (investment adviser firms, 2018-2019); CLO of Fidelity Management & Research (Hong Kong) Limited, FMR Investment Management (UK) Limited, and Fidelity Management & Research (Japan) Limited (investment adviser firms, 2018-2019); and Assistant Secretary of certain funds (2009-2018).
Timothy M. Cohen (1969)
Year of Election or Appointment: 2018
Vice President
Mr. Cohen also serves as Vice President of other funds. Mr. Cohen serves as Co-Head of Equity (2018-present), a Director of Fidelity Management & Research (Japan) Limited (investment adviser firm, 2016-present), and is an employee of Fidelity Investments. Previously, Mr. Cohen served as Executive Vice President of Fidelity SelectCo, LLC (2019), Head of Global Equity Research (2016-2018), Chief Investment Officer - Equity and a Director of Fidelity Management & Research (U.K.) Inc. (investment adviser firm, 2013-2015) and as a Director of Fidelity Management & Research (Hong Kong) Limited (investment adviser firm, 2017).
Jonathan Davis (1968)
Year of Election or Appointment: 2010
Assistant Treasurer
Mr. Davis also serves as Assistant Treasurer of other funds. Mr. Davis serves as Assistant Treasurer of FMR Capital, Inc. (2017-present) and is an employee of Fidelity Investments. Previously, Mr. Davis served as Vice President and Associate General Counsel of FMR LLC (diversified financial services company, 2003-2010).
Laura M. Del Prato (1964)
Year of Election or Appointment: 2018
Assistant Treasurer
Ms. Del Prato also serves as an officer of other funds. Ms. Del Prato is an employee of Fidelity Investments (2017-present). Previously, Ms. Del Prato served as President and Treasurer of The North Carolina Capital Management Trust: Cash Portfolio and Term Portfolio (2018-2020). Prior to joining Fidelity Investments, Ms. Del Prato served as a Managing Director and Treasurer of the JPMorgan Mutual Funds (2014-2017). Prior to JPMorgan, Ms. Del Prato served as a partner at Cohen Fund Audit Services (accounting firm, 2012-2013) and KPMG LLP (accounting firm, 2004-2012).
Colm A. Hogan (1973)
Year of Election or Appointment: 2020
Assistant Treasurer
Mr. Hogan also serves as an officer of other funds. Mr. Hogan serves as Assistant Treasurer of FMR Capital, Inc. (2017-present) and is an employee of Fidelity Investments (2005-present). Previously, Mr. Hogan served as Deputy Treasurer of certain Fidelity® funds (2016-2020) and Assistant Treasurer of certain Fidelity® funds (2016-2018).
Pamela R. Holding (1964)
Year of Election or Appointment: 2018
Vice President
Ms. Holding also serves as Vice President of other funds. Ms. Holding serves as Co-Head of Equity (2018-present) and is an employee of Fidelity Investments (2013-present). Previously, Ms. Holding served as Executive Vice President of Fidelity SelectCo, LLC (2019) and as Chief Investment Officer of Fidelity Institutional Asset Management (2013-2018).
Cynthia Lo Bessette (1969)
Year of Election or Appointment: 2019
Secretary and Chief Legal Officer (CLO)
Ms. Lo Bessette also serves as an officer of other funds. Ms. Lo Bessette serves as CLO, Secretary, and Senior Vice President of Fidelity Management & Research Company LLC (investment adviser firm, 2019-present); and CLO of Fidelity Management & Research (Hong Kong) Limited, FMR Investment Management (UK) Limited, and Fidelity Management & Research (Japan) Limited (investment adviser firms, 2019-present). She is a Senior Vice President and Deputy General Counsel of FMR LLC (diversified financial services company, 2019-present), and is an employee of Fidelity Investments. Previously, Ms. Lo Bessette served as CLO, Secretary, and Senior Vice President of FMR Co., Inc. (investment adviser firm, 2019); Secretary of Fidelity SelectCo, LLC and Fidelity Investments Money Management, Inc. (investment adviser firms, 2019). Prior to joining Fidelity Investments, Ms. Lo Bessette was Executive Vice President, General Counsel (2016-2019) and Senior Vice President, Deputy General Counsel (2015-2016) of OppenheimerFunds (investment management company) and Deputy Chief Legal Officer (2013-2015) of Jennison Associates LLC (investment adviser firm).
Chris Maher (1972)
Year of Election or Appointment: 2020
Deputy Treasurer
Mr. Maher also serves as an officer of other funds. Mr. Maher serves as Assistant Treasurer of FMR Capital, Inc. (2017-present), and is an employee of Fidelity Investments (2008-present). Previously, Mr. Maher served as Assistant Treasurer of certain funds (2013-2020); Vice President of Asset Management Compliance (2013), Vice President of the Program Management Group of FMR (investment adviser firm, 2010-2013), and Vice President of Valuation Oversight (2008-2010).
Jason P. Pogorelec (1975)
Year of Election or Appointment: 2020
Chief Compliance Officer
Mr. Pogorelec also serves as Chief Compliance Officer of other funds. Mr. Pogorelec is a senior Vice President of Asset Management Compliance for Fidelity Investments and is an employee of Fidelity Investments (2006-present). Previously, Mr. Pogorelec served as Vice President, Associate General Counsel for Fidelity Investments (2010-2020) and Assistant Secretary of certain Fidelity funds (2015-2020).
Stacie M. Smith (1974)
Year of Election or Appointment: 2016
President and Treasurer
Ms. Smith also serves as an officer of other funds. Ms. Smith serves as Assistant Treasurer of FMR Capital, Inc. (2017-present), is an employee of Fidelity Investments (2009-present), and has served in other fund officer roles. Prior to joining Fidelity Investments, Ms. Smith served as Senior Audit Manager of Ernst & Young LLP (accounting firm, 1996-2009). Previously, Ms. Smith served as Assistant Treasurer (2013-2019) and Deputy Treasurer (2013-2016) of certain Fidelity® funds.
Marc L. Spector (1972)
Year of Election or Appointment: 2016
Assistant Treasurer
Mr. Spector also serves as an officer of other funds. Mr. Spector serves as Assistant Treasurer of FMR Capital, Inc. (2017-present) and is an employee of Fidelity Investments (2016-present). Prior to joining Fidelity Investments, Mr. Spector served as Director at the Siegfried Group (accounting firm, 2013-2016), and prior to Siegfried Group as audit senior manager at Deloitte & Touche LLP (accounting firm, 2005-2013).
Jim Wegmann (1979)
Year of Election or Appointment: 2019
Assistant Treasurer
Mr. Wegmann also serves as Assistant Treasurer of other funds. Mr. Wegmann is an employee of Fidelity Investments (2011-present).
Shareholder Expense Example
As a shareholder, you incur two types of costs: (1) transaction costs, which may include sales charges (loads) on purchase payments or redemption proceeds, as applicable and (2) ongoing costs, which generally include management fees, distribution and/or service (12b-1) fees and other Fund expenses. This Example is intended to help you understand your ongoing costs (in dollars) of investing in a fund and to compare these costs with the ongoing costs of investing in other mutual funds.
The Example is based on an investment of $1,000 invested at the beginning of the period and held for the entire period (May 1, 2020 to October 31, 2020).
Actual Expenses
The first line of the accompanying table provides information about actual account values and actual expenses. You may use the information in this line, together with the amount you invested, to estimate the expenses that you paid over the period. Simply divide your account value by $1,000.00 (for example, an $8,600 account value divided by $1,000.00 = 8.6), then multiply the result by the number in the first line for a class/Fund under the heading entitled "Expenses Paid During Period" to estimate the expenses you paid on your account during this period. If any fund is a shareholder of any underlying mutual funds or exchange-traded funds (ETFs) (the Underlying Funds), such fund indirectly bears its proportional share of the expenses of the Underlying Funds in addition to the direct expenses incurred presented in the table. These fees and expenses are not included in the annualized expense ratio used to calculate the expense estimate in the table below.
Hypothetical Example for Comparison Purposes
The second line of the accompanying table provides information about hypothetical account values and hypothetical expenses based on the actual expense ratio and an assumed rate of return of 5% per year before expenses, which is not the actual return. The hypothetical account values and expenses may not be used to estimate the actual ending account balance or expenses you paid for the period. You may use this information to compare the ongoing costs of investing in the Fund and other funds. To do so, compare this 5% hypothetical example with the 5% hypothetical examples that appear in the shareholder reports of the other funds. If any fund is a shareholder of any Underlying Funds, such fund indirectly bears its proportional share of the expenses of the Underlying Funds in addition to the direct expenses as presented in the table. These fees and expenses are not included in the annualized expense ratio used to calculate the expense estimate in the table below.
Please note that the expenses shown in the table are meant to highlight your ongoing costs only and do not reflect any transaction costs. Therefore, the second line of the table is useful in comparing ongoing costs only, and will not help you determine the relative total costs of owning different funds.
| | Annualized Expense Ratio-A | Beginning
Account Value
May 1, 2020 | Ending
Account Value
October 31, 2020 | Expenses Paid
During Period-B
May 1, 2020
to October 31, 2020 |
| Fidelity Series Emerging Markets Fund | .01% | | | |
| Actual | | $1,000.00 | $1,248.40 | $.06 |
| Hypothetical-C | | $1,000.00 | $1,025.09 | $.05 |
| Fidelity Series Emerging Markets Opportunities Fund | .01% | | | |
| Actual | | $1,000.00 | $1,264.90 | $.06 |
| Hypothetical-C | | $1,000.00 | $1,025.09 | $.05 |
| Fidelity Series International Growth Fund | .01% | | | |
| Actual | | $1,000.00 | $1,153.00 | $.05 |
| Hypothetical-C | | $1,000.00 | $1,025.09 | $.05 |
| Fidelity Series International Small Cap Fund | .01% | | | |
| Actual | | $1,000.00 | $1,189.00 | $.06 |
| Hypothetical-C | | $1,000.00 | $1,025.09 | $.05 |
| Fidelity Series International Value Fund | .01% | | | |
| Actual | | $1,000.00 | $1,088.40 | $.05 |
| Hypothetical-C | | $1,000.00 | $1,025.09 | $.05 |
A Annualized expense ratio reflects expenses net of applicable fee waivers.
B Expenses are equal to the annualized expense ratio, multiplied by the average account value over the period, multiplied by 184/ 366 (to reflect the one-half year period). The fees and expenses of any Underlying Funds are not included in each annualized expense ratio.
C 5% return per year before expenses
Distributions (Unaudited)
The Board of Trustees of each fund voted to pay to shareholders of record at the opening of business on record date, the following distributions per share derived from capital gains realized from sales of portfolio securities, and dividends derived from net investment income:
| | Pay Date | Record Date | Dividends | Capital Gains |
| Fidelity Series Emerging Markets Fund | 12/14/2020 | 12/11/2020 | $0.157 | $0.000 |
| Fidelity Series Emerging Markets Opportunities Fund | 12/14/2020 | 12/11/2020 | $0.332 | $0.414 |
| Fidelity Series International Growth Fund | 12/14/2020 | 12/11/2020 | $0.241 | $2.647 |
| Fidelity Series International Small Cap Fund | 12/14/2020 | 12/11/2020 | $0.166 | $0.000 |
| Fidelity Series International Value Fund | 12/14/2020 | 12/11/2020 | $0.286 | $0.000 |
|
The funds hereby designate as capital gain dividend the amounts noted below for the taxable year ended October 31, 2020, or, if subsequently determined to be different, the net capital gain of such year.
| Fidelity Series Emerging Markets Opportunities Fund | $503,816,512 |
| Fidelity Series International Growth Fund | $1,719,665,681 |
|
A percentage of the dividends distributed during the fiscal year for the following funds qualify for the dividends–received deduction for corporate shareholders:
| Fidelity Series Emerging Markets Fund | |
| December, 2019 | 3% |
| Fidelity Series International Growth Fund | |
| December, 2019 | 6% |
| Fidelity Series International Small Cap Fund | |
| December, 2019 | 1% |
|
A percentage of the dividends distributed during the fiscal year for the following funds may be taken into account as a dividend for purposes of the maximum rate under section 1(h)(11) of the Internal Revenue Code.
| Fidelity Series Emerging Markets Fund | |
| December, 2019 | 52% |
| Fidelity Series Emerging Markets Opportunities Fund | |
| December, 2019 | 50% |
| Fidelity Series International Growth Fund | |
| December, 2019 | 68% |
| Fidelity Series International Small Cap Fund | |
| December, 2019 | 68% |
| Fidelity Series International Value Fund | |
| December, 2019 | 80% |
|
The funds will notify shareholders in January 2021 of amounts for use in preparing 2020 income tax returns.
Proxy Voting Results
A special meeting of shareholders was held on June 9, 2020. The results of votes taken among shareholders on the proposals before them are reported below. Each vote reported represents one dollar of net asset value held on the record date for the meeting.
PROPOSAL 1
To elect a Board of Trustees.
| | # of
Votes | % of
Votes |
| Dennis J. Dirks |
| Affirmative | 91,643,443,973.030 | 98.167 |
| Withheld | 1,711,119,384.419 | 1.833 |
| TOTAL | 93,354,563,357.449 | 100.000 |
| Donald F. Donahue |
| Affirmative | 91,659,003,496.045 | 98.184 |
| Withheld | 1,695,559,852.789 | 1.816 |
| TOTAL | 93,354,563,357.449 | 100.000 |
| Bettina Doulton |
| Affirmative | 91,774,146,516.145 | 98.307 |
| Withheld | 1,580,416,862.377 | 1.693 |
| TOTAL | 93,354,563,357.449 | 100.000 |
| Vicki L. Fuller |
| Affirmative | 91,845,419,368.993 | 98.383 |
| Withheld | 1,509,143,998.591 | 1.617 |
| TOTAL | 93,354,563,357.449 | 100.00 |
| Patricia L. Kampling |
| Affirmative | 91,723,732,274.457 | 98.253 |
| Withheld | 1,630,831,098.411 | 1.747 |
| TOTAL | 93,354,563,357.449 | 100.000 |
| Alan J. Lacy |
| Affirmative | 91,490,319,407.772 | 98.003 |
| Withheld | 1,864,243,948.299 | 1.997 |
| TOTAL | 93,354,563,357.449 | 100.000 |
| Ned C. Lautenbach |
| Affirmative | 91,285,367,239.075 | 97.784 |
| Withheld | 2,069,196,119.052 | 2.216 |
| TOTAL | 93,354,563,357.449 | 100.000 |
| Robert A. Lawrence |
| Affirmative | 91,556,271,429.466 | 98.074 |
| Withheld | 1,798,291,912.707 | 1.926 |
| TOTAL | 93,354,563,357.449 | 100.000 |
| Joseph Mauriello |
| Affirmative | 91,497,480,147.082 | 98.011 |
| Withheld | 1,857,083,211.045 | 1.989 |
| TOTAL | 93,354,563,357.449 | 100.000 |
| Cornelia M. Small |
| Affirmative | 91,606,808,161.438 | 98.128 |
| Withheld | 1,747,755,220.497 | 1.872 |
| TOTAL | 93,354,563,357.449 | 100.000 |
| Garnett A. Smith |
| Affirmative | 91,505,784,053.038 | 98.020 |
| Withheld | 1,848,779,305.090 | 1.980 |
| TOTAL | 93,354,563,357.449 | 100.000 |
| David M. Thomas |
| Affirmative | 91,536,969,704.881 | 98.053 |
| Withheld | 1,817,593,630.919 | 1.947 |
| TOTAL | 93,354,563,357.449 | 100.000 |
| Susan Tomasky |
| Affirmative | 91,697,125,678.165 | 98.225 |
| Withheld | 1,657,437,703.277 | 1.775 |
| TOTAL | 93,354,563,357.449 | 100.000 |
| Michael E. Wiley |
| Affirmative | 91,506,805,575.815 | 98.021 |
| Withheld | 1,847,757,759.985 | 1.979 |
| TOTAL | 93,354,563,357.449 | 100.000 |
PROPOSAL 2
For Fidelity Series Emerging Markets Opportunities Fund, to convert a fundamental investment policy to a non-fundamental investment policy.
| | # of
Votes | % of
Votes |
| Affirmative | 18,455,368,843.796 | 100.000 |
| Against | 0.000 | 0.000 |
| Abstain | 0.000 | 0.000 |
| Broker Non-Vote | 0.000 | 0.000 |
| TOTAL | 18,455,368,843.796 | 100.000 |
For Fidelity Series International Growth Fund, to convert a fundamental investment policy to a non-fundamental investment policy.
| | # of
Votes | % of
Votes |
| Affirmative | 12,749,883,701.640 | 100.000 |
| Against | 0.000 | 0.000 |
| Abstain | 0.000 | 0.000 |
| Broker Non-Vote | 0.000 | 0.000 |
| TOTAL | 12,749,883,701.640 | 100.000 |
For Fidelity Series International Small Cap Fund, to convert a fundamental investment policy to a non-fundamental investment policy.
| | # of
Votes | % of
Votes |
| Affirmative | 3,050,303,906.892 | 100.000 |
| Against | 0.000 | 0.000 |
| Abstain | 0.000 | 0.000 |
| Broker Non-Vote | 0.000 | 0.000 |
| TOTAL | 3,050,303,906.892 | 100.000 |
For Fidelity Series International Value Fund, to convert a fundamental investment policy to a non-fundamental investment policy.
| | # of
Votes | % of
Votes |
| Affirmative | 11,182,251,682.125 | 100.000 |
| Against | 0.000 | 0.000 |
| Abstain | 0.000 | 0.000 |
| Broker Non-Vote | 0.000 | 0.000 |
| TOTAL | 11,182,251,682.125 | 100.000 |
|
| Proposal 1 reflects trust wide proposal and voting results. |
GSV-S-ANN-1220
1.907943.110
Fidelity® Global Commodity Stock Fund
Annual Report
October 31, 2020
Includes Fidelity and Fidelity Advisor share classes
See the inside front cover for important information about access to your fund’s shareholder reports.
Beginning on January 1, 2021, as permitted by regulations adopted by the Securities and Exchange Commission, paper copies of a fund’s shareholder reports will no longer be sent by mail, unless you specifically request paper copies of the reports from the fund or from your financial intermediary, such as a financial advisor, broker-dealer or bank. Instead, the reports will be made available on a website, and you will be notified by mail each time a report is posted and provided with a website link to access the report.
If you already elected to receive shareholder reports electronically, you will not be affected by this change and you need not take any action. You may elect to receive shareholder reports and other communications from a fund electronically, by contacting your financial intermediary. For Fidelity customers, visit Fidelity's web site or call Fidelity using the contact information listed below.
You may elect to receive all future reports in paper free of charge. If you wish to continue receiving paper copies of your shareholder reports, you may contact your financial intermediary or, if you are a Fidelity customer, visit Fidelity’s website, or call Fidelity at the applicable toll-free number listed below. Your election to receive reports in paper will apply to all funds held with the fund complex/your financial intermediary.
| Account Type | Website | Phone Number |
| Brokerage, Mutual Fund, or Annuity Contracts: | fidelity.com/mailpreferences | 1-800-343-3548 |
| Employer Provided Retirement Accounts: | netbenefits.fidelity.com/preferences (choose 'no' under Required Disclosures to continue to print) | 1-800-343-0860 |
| Advisor Sold Accounts Serviced Through Your Financial Intermediary: | Contact Your Financial Intermediary | Your Financial Intermediary's phone number |
| Advisor Sold Accounts Serviced by Fidelity: | institutional.fidelity.com | 1-877-208-0098 |
Contents
To view a fund's proxy voting guidelines and proxy voting record for the 12-month period ended June 30, visit http://www.fidelity.com/proxyvotingresults or visit the Securities and Exchange Commission's (SEC) web site at http://www.sec.gov.
You may also call 1-800-544-8544 if you’re an individual investing directly with Fidelity, call 1-800-835-5092 if you’re a plan sponsor or participant with Fidelity as your recordkeeper or call 1-877-208-0098 on institutional accounts or if you’re an advisor or invest through one to request a free copy of the proxy voting guidelines.
Standard & Poor's, S&P and S&P 500 are registered service marks of The McGraw-Hill Companies, Inc. and have been licensed for use by Fidelity Distributors Corporation.
Other third-party marks appearing herein are the property of their respective owners.
All other marks appearing herein are registered or unregistered trademarks or service marks of FMR LLC or an affiliated company. © 2020 FMR LLC. All rights reserved.
This report and the financial statements contained herein are submitted for the general information of the shareholders of the Fund. This report is not authorized for distribution to prospective investors in the Fund unless preceded or accompanied by an effective prospectus.
A fund files its complete schedule of portfolio holdings with the SEC for the first and third quarters of each fiscal year on Form N-PORT. Forms N-PORT are available on the SEC’s web site at http://www.sec.gov. A fund's Forms N-PORT may be reviewed and copied at the SEC’s Public Reference Room in Washington, DC. Information regarding the operation of the SEC's Public Reference Room may be obtained by calling 1-800-SEC-0330.
For a complete list of a fund's portfolio holdings, view the most recent holdings listing, semiannual report, or annual report on Fidelity's web site at http://www.fidelity.com, http://www.institutional.fidelity.com, or http://www.401k.com, as applicable.
NOT FDIC INSURED •MAY LOSE VALUE •NO BANK GUARANTEE
Neither the Fund nor Fidelity Distributors Corporation is a bank.
Note to Shareholders:
Early in 2020, the outbreak and spread of a new coronavirus emerged as a public health emergency that had a major influence on financial markets, primarily based on its impact on the global economy and the outlook for corporate earnings. The virus causes a respiratory disease known as COVID-19. On March 11, the World Health Organization declared the COVID-19 outbreak a pandemic, citing sustained risk of further global spread.
In the weeks following, as the crisis worsened, we witnessed an escalating human tragedy with wide-scale social and economic consequences from coronavirus-containment measures. The outbreak of COVID-19 prompted a number of measures to limit the spread, including travel and border restrictions, quarantines, and restrictions on large gatherings. In turn, these resulted in lower consumer activity, diminished demand for a wide range of products and services, disruption in manufacturing and supply chains, and – given the wide variability in outcomes regarding the outbreak – significant market uncertainty and volatility. Amid the turmoil, global governments and central banks took unprecedented action to help support consumers, businesses, and the broader economies, and to limit disruption to financial systems.
The situation continues to unfold, and the extent and duration of its impact on financial markets and the economy remain highly uncertain. Extreme events such as the coronavirus crisis are “exogenous shocks” that can have significant adverse effects on mutual funds and their investments. Although multiple asset classes may be affected by market disruption, the duration and impact may not be the same for all types of assets.
Fidelity is committed to helping you stay informed amid news about COVID-19 and during increased market volatility, and we’re taking extra steps to be responsive to customer needs. We encourage you to visit our websites, where we offer ongoing updates, commentary, and analysis on the markets and our funds.
Performance: The Bottom Line
Average annual total return reflects the change in the value of an investment, assuming reinvestment of distributions from dividend income and capital gains (the profits earned upon the sale of securities that have grown in value, if any) and assuming a constant rate of performance each year. The hypothetical investment and the average annual total returns do not reflect the deduction of taxes that a shareholder would pay on fund distributions or the redemption of fund shares. During periods of reimbursement by Fidelity, a fund’s total return will be greater than it would be had the reimbursement not occurred. How a fund did yesterday is no guarantee of how it will do tomorrow.
Average Annual Total Returns
| For the periods ended October 31, 2020 | Past 1 year | Past 5 years | Past 10 years |
| Class A (incl. 5.75% sales charge) | (13.66)% | 2.17% | (2.79)% |
| Class M (incl. 3.50% sales charge) | (11.91)% | 2.35% | (2.83)% |
| Class C (incl. contingent deferred sales charge) | (10.00)% | 2.62% | (2.94)% |
| Fidelity® Global Commodity Stock Fund | (8.16)% | 3.62% | (1.98)% |
| Class I | (8.11)% | 3.74% | (1.90)% |
| Class Z | (7.99)% | 3.80% | (1.87)% |
Class C shares' contingent deferred sales charges included in the past one year, past five years, and past ten years total return figures are 1%, 0%, and 0%, respectively.
The initial offering of Class Z shares took place on October 2, 2018. Returns prior to October 2, 2018, are those of Class I.
$10,000 Over 10 Years
Let's say hypothetically that $10,000 was invested in Fidelity® Global Commodity Stock Fund, a class of the fund, on October 31, 2010.
The chart shows how the value of your investment would have changed, and also shows how the MSCI ACWI (All Country World Index) Index performed over the same period.
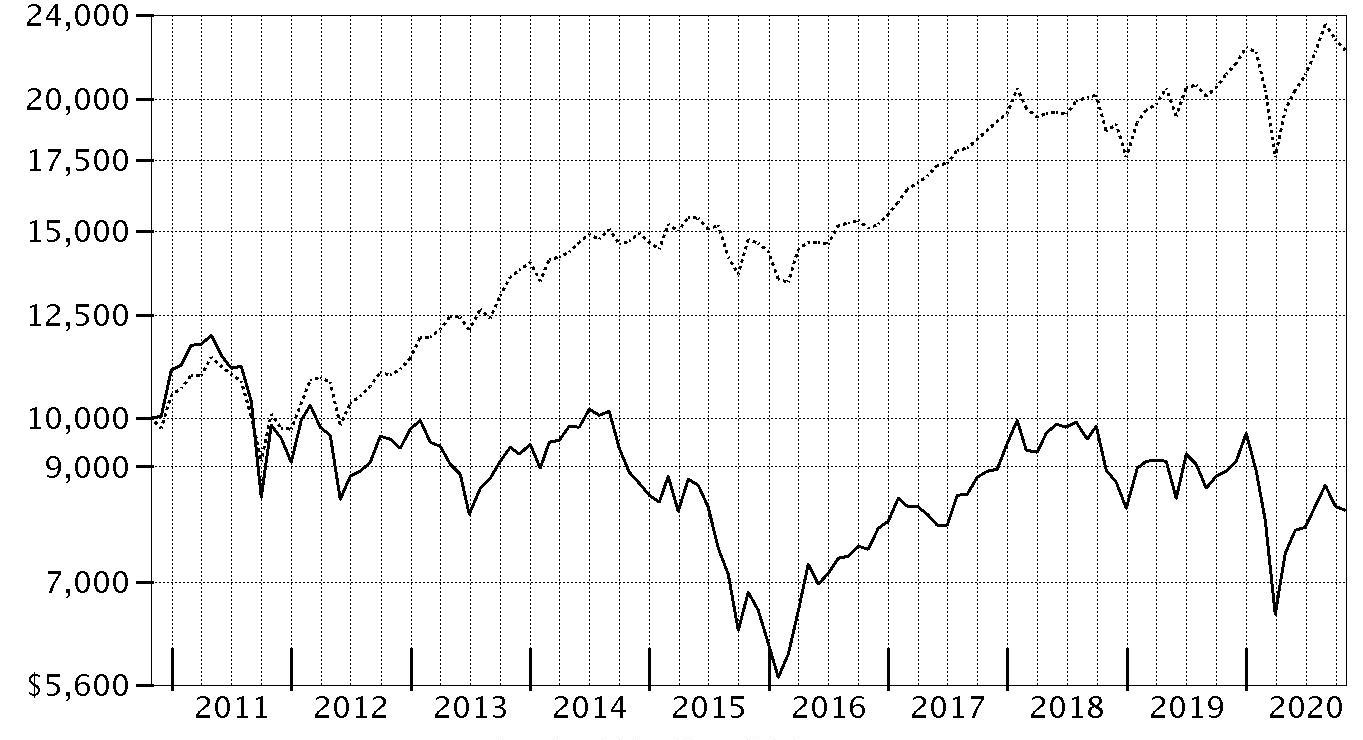
| Period Ending Values |
| $8,187 | Fidelity® Global Commodity Stock Fund |
| $22,217 | MSCI ACWI (All Country World Index) Index |
Management's Discussion of Fund Performance
Market Recap: The MSCI ACWI (All Country World Index) Index gained 5.29% for the year ending October 31, 2020, a volatile period for global equities, marked by a steep but brief decline due to the early-2020 outbreak and spread of the coronavirus, followed by a historic rebound. Declared a pandemic in March, the COVID-19 crisis caused broad contraction in economic activity, along with elevated uncertainty and dislocation in financial markets. A historically rapid and expansive monetary/fiscal-policy response partially offset the economic disruption and fueled a sharp uptrend from March 24 into September. Other supporting factors included resilient corporate earnings and near-term potential for a COVID-19 vaccine breakthrough. Currency fluctuation generally supported global equities for the year. Late in the period, markets digested the inability of the U.S. Congress to reach a deal on additional fiscal stimulus, U.S. election uncertainty and a second wave of COVID-19 cases. By region for the full period, the U.S. (+12%), which represented 57% of the index, on average, led the way, followed by emerging markets (+9%). In contrast, the following regions lagged: U.K. (-22%), Asia-Pacific ex Japan (-8%), Canada (-5%) and Europe ex U.K. (-4%). Among sectors, information technology (+33%), consumer discretionary (+24%) and communication services (+16%) stood out. Conversely, energy (-42%), financials (-18%) and real estate (-15%) trailed the index
Comments from Portfolio Manager Jody Simes: For the fiscal year ending October 31, 2020, the fund’s share classes (excluding sales charges, if applicable) returned roughly -8% to -9%, considerably better than the -14.66% result of the MSCI All Country World Commodity Producers Sector Capped Index. Versus that index, an underweighting in oil, gas & consumable fuels helped the fund’s performance most. An overweighting and favorable stock selection in metals & mining also contributed. Geographically, positioning in Canada, Asia Pacific ex Japan and the U.K. notably helped. Netherlands-based Royal Dutch Shell (-55%), which I sold from the fund, was the fund’s top relative contributor because I underweighted the stock. Overweighting Australia-based iron-ore producer Fortescue Metals Group also lifted the fund’s relative result, with our position here gaining about 124%. First Quantum Minerals is a Canada-based copper producer that gained about 34%, rewarding the fund’s overweighting. Conversely, stock picking in the fertilizers & agricultural chemicals group was the primary disappointment versus the benchmark this period. Within emerging markets, Russia, Brazil and China notably weighed on the fund’s relative performance. Lighter-than-benchmark exposure to index component Corteva made this stock the fund’s largest relative detractor, given its roughly 28% advance. A sizable overweighting in Russia-based mining company Norilsk Nickel also detracted, with our position here returning about -13%. Notable changes in positioning during the period include decreased exposure to energy-related stocks and higher weightings in gold, copper and steel stocks.
The views expressed above reflect those of the portfolio manager(s) only through the end of the period as stated on the cover of this report and do not necessarily represent the views of Fidelity or any other person in the Fidelity organization. Any such views are subject to change at any time based upon market or other conditions and Fidelity disclaims any responsibility to update such views. These views may not be relied on as investment advice and, because investment decisions for a Fidelity fund are based on numerous factors, may not be relied on as an indication of trading intent on behalf of any Fidelity fund.
Investment Summary (Unaudited)
Top Ten Stocks as of October 31, 2020
| | % of fund's net assets |
| Nutrien Ltd. | 5.1 |
| Rio Tinto PLC | 4.9 |
| Exxon Mobil Corp. | 4.9 |
| Archer Daniels Midland Co. | 4.8 |
| Chevron Corp. | 3.9 |
| FMC Corp. | 3.4 |
| Newmont Corp. | 3.4 |
| Fortescue Metals Group Ltd. | 3.2 |
| BHP Billiton Ltd. | 3.2 |
| UPM-Kymmene Corp. | 3.1 |
| | 39.9 |
Top Sectors (% of fund's net assets)
| As of October 31, 2020 |
| | Metals | 49.8% |
| | Agriculture | 30.1% |
| | Energy | 19.5% |
| | Short-Term Investments and Net Other Assets | 0.6% |

Schedule of Investments October 31, 2020
Showing Percentage of Net Assets
| Common Stocks - 99.4% | | | |
| | | Shares | Value |
| Chemicals - 13.2% | | | |
| Fertilizers & Agricultural Chemicals - 13.2% | | | |
| CF Industries Holdings, Inc. | | 184,760 | $5,101,224 |
| Corteva, Inc. | | 110,600 | 3,647,588 |
| FMC Corp. | | 86,600 | 8,897,284 |
| Icl Group Ltd. | | 243,100 | 884,894 |
| Nutrien Ltd. | | 324,783 | 13,202,918 |
| The Mosaic Co. | | 133,661 | 2,472,729 |
| | | | 34,206,637 |
| Construction Materials - 1.9% | | | |
| Construction Materials - 1.9% | | | |
| Martin Marietta Materials, Inc. | | 9,800 | 2,610,230 |
| Summit Materials, Inc. (a) | | 129,200 | 2,285,548 |
| | | | 4,895,778 |
| Containers & Packaging - 1.3% | | | |
| Metal & Glass Containers - 1.3% | | | |
| Crown Holdings, Inc. (a) | | 37,500 | 3,217,500 |
| Food Products - 8.2% | | | |
| Agricultural Products - 8.2% | | | |
| Archer Daniels Midland Co. | | 268,000 | 12,392,320 |
| Bunge Ltd. | | 107,300 | 6,087,129 |
| Darling Ingredients, Inc. (a) | | 66,300 | 2,850,900 |
| | | | 21,330,349 |
| Metals & Mining - 46.6% | | | |
| Aluminum - 0.4% | | | |
| Kaiser Aluminum Corp. | | 16,100 | 1,013,173 |
| Copper - 6.9% | | | |
| Antofagasta PLC | | 165,700 | 2,209,969 |
| ERO Copper Corp. (a) | | 309,800 | 4,057,652 |
| First Quantum Minerals Ltd. | | 540,924 | 6,215,977 |
| Lundin Mining Corp. | | 883,000 | 5,335,247 |
| | | | 17,818,845 |
| Diversified Metals & Mining - 16.5% | | | |
| Anglo American PLC (United Kingdom) | | 172,381 | 4,044,764 |
| BHP Billiton Ltd. | | 342,485 | 8,209,921 |
| BHP Billiton PLC | | 274,080 | 5,309,576 |
| Grupo Mexico SA de CV Series B | | 466,720 | 1,325,690 |
| Ivanhoe Mines Ltd. (a) | | 482,700 | 1,898,482 |
| MMC Norilsk Nickel PJSC | | 16,340 | 3,889,045 |
| MMC Norilsk Nickel PJSC sponsored ADR | | 85,100 | 2,028,784 |
| Nickel Mines Ltd. | | 3,882,805 | 2,441,231 |
| Rio Tinto PLC | | 226,683 | 12,821,514 |
| Teck Resources Ltd. Class B (sub. vtg.) | | 52,900 | 695,248 |
| | | | 42,664,255 |
| Gold - 13.3% | | | |
| Agnico Eagle Mines Ltd. (Canada) | | 41,500 | 3,285,300 |
| AngloGold Ashanti Ltd. | | 28,700 | 661,405 |
| Barrick Gold Corp. (Canada) | | 288,047 | 7,701,144 |
| Franco-Nevada Corp. | | 35,071 | 4,780,112 |
| Kirkland Lake Gold Ltd. | | 30,400 | 1,385,033 |
| Newcrest Mining Ltd. | | 108,853 | 2,257,338 |
| Newmont Corp. | | 138,800 | 8,722,192 |
| Sibanye Stillwater Ltd. | | 213,000 | 628,077 |
| Wheaton Precious Metals Corp. | | 112,400 | 5,158,100 |
| | | | 34,578,701 |
| Precious Metals & Minerals - 0.8% | | | |
| Anglo American Platinum Ltd. | | 7,300 | 483,369 |
| Impala Platinum Holdings Ltd. | | 185,000 | 1,646,560 |
| | | | 2,129,929 |
| Steel - 8.7% | | | |
| ArcelorMittal SA (Netherlands) (a) | | 122,100 | 1,656,958 |
| Commercial Metals Co. | | 131,000 | 2,705,150 |
| Fortescue Metals Group Ltd. | | 682,374 | 8,347,815 |
| JFE Holdings, Inc. | | 118,200 | 830,494 |
| Nucor Corp. | | 26,692 | 1,274,810 |
| POSCO | | 6,934 | 1,277,237 |
| Steel Dynamics, Inc. | | 86,600 | 2,726,168 |
| Vale SA | | 359,600 | 3,794,697 |
| | | | 22,613,329 |
|
| TOTAL METALS & MINING | | | 120,818,232 |
|
| Oil, Gas & Consumable Fuels - 19.5% | | | |
| Integrated Oil & Gas - 15.1% | | | |
| BP PLC | | 1,759,871 | 4,488,876 |
| Chevron Corp. | | 144,800 | 10,063,600 |
| Equinor ASA | | 78,600 | 998,282 |
| Exxon Mobil Corp. | | 387,900 | 12,653,298 |
| Lukoil PJSC sponsored ADR | | 35,900 | 1,833,054 |
| Occidental Petroleum Corp. | | 39,100 | 356,983 |
| Occidental Petroleum Corp. warrants 8/3/27 (a) | | 4,887 | 12,071 |
| Petroleo Brasileiro SA - Petrobras (ON) | | 605,400 | 2,004,653 |
| Total SA | | 218,214 | 6,611,170 |
| | | | 39,021,987 |
| Oil & Gas Exploration & Production - 4.4% | | | |
| Cabot Oil & Gas Corp. | | 131,400 | 2,337,606 |
| ConocoPhillips Co. | | 84,800 | 2,426,976 |
| Diamondback Energy, Inc. | | 16,900 | 438,724 |
| Hess Corp. | | 42,000 | 1,563,240 |
| Lundin Petroleum AB | | 44,300 | 845,585 |
| Magnolia Oil & Gas Corp. Class A (a) | | 145,200 | 630,168 |
| NOVATEK OAO GDR (Reg. S) | | 7,400 | 891,700 |
| Parsley Energy, Inc. Class A | | 65,400 | 654,654 |
| Pioneer Natural Resources Co. | | 22,010 | 1,751,116 |
| | | | 11,539,769 |
|
| TOTAL OIL, GAS & CONSUMABLE FUELS | | | 50,561,756 |
|
| Paper & Forest Products - 8.7% | | | |
| Forest Products - 1.2% | | | |
| Svenska Cellulosa AB (SCA) (B Shares) | | 128,100 | 1,738,298 |
| West Fraser Timber Co. Ltd. | | 26,700 | 1,238,304 |
| | | | 2,976,602 |
| Paper Products - 7.5% | | | |
| Nine Dragons Paper (Holdings) Ltd. | | 878,000 | 1,166,514 |
| Oji Holdings Corp. | | 255,300 | 1,075,941 |
| Stora Enso Oyj (R Shares) | | 388,700 | 5,670,061 |
| Suzano Papel e Celulose SA (a) | | 397,645 | 3,468,509 |
| UPM-Kymmene Corp. | | 286,700 | 8,100,539 |
| | | | 19,481,564 |
|
| TOTAL PAPER & FOREST PRODUCTS | | | 22,458,166 |
|
| TOTAL COMMON STOCKS | | | |
| (Cost $283,271,795) | | | 257,488,418 |
|
| Money Market Funds - 0.2% | | | |
| Fidelity Cash Central Fund 0.10% (b) | | | |
| (Cost $708,106) | | 707,965 | 708,106 |
| TOTAL INVESTMENT IN SECURITIES - 99.6% | | | |
| (Cost $283,979,901) | | | 258,196,524 |
| NET OTHER ASSETS (LIABILITIES) - 0.4% | | | 913,529 |
| NET ASSETS - 100% | | | $259,110,053 |
Legend
(a) Non-income producing
(b) Affiliated fund that is generally available only to investment companies and other accounts managed by Fidelity Investments. The rate quoted is the annualized seven-day yield of the fund at period end. A complete unaudited listing of the fund's holdings as of its most recent quarter end is available upon request. In addition, each Fidelity Central Fund's financial statements, which are not covered by the Fund's Report of Independent Registered Public Accounting Firm, are available on the SEC's website or upon request.
Affiliated Central Funds
Information regarding fiscal year to date income earned by the Fund from investments in Fidelity Central Funds is as follows:
| Fund | Income earned |
| Fidelity Cash Central Fund | $37,866 |
| Fidelity Securities Lending Cash Central Fund | 30,176 |
| Total | $68,042 |
Amounts in the income column in the above table include any capital gain distributions from underlying funds, which are presented in the corresponding line-item in the Statement of Operations, if applicable. Amount for Fidelity Securities Lending Cash Central Fund represents the income earned on investing cash collateral, less rebates paid to borrowers and any lending agent fees associated with the loan, plus any premium payments received for lending certain types of securities.
Investment Valuation
The following is a summary of the inputs used, as of October 31, 2020, involving the Fund's assets and liabilities carried at fair value. The inputs or methodology used for valuing securities may not be an indication of the risk associated with investing in those securities. For more information on valuation inputs, and their aggregation into the levels used below, please refer to the Investment Valuation section in the accompanying Notes to Financial Statements.
| | Valuation Inputs at Reporting Date: |
| Description | Total | Level 1 | Level 2 | Level 3 |
| Investments in Securities: | | | | |
| Common Stocks | $257,488,418 | $196,508,849 | $60,979,569 | $-- |
| Money Market Funds | 708,106 | 708,106 | -- | -- |
| Total Investments in Securities: | $258,196,524 | $197,216,955 | $60,979,569 | $-- |
Other Information
Distribution of investments by country or territory of incorporation, as a percentage of Total Net Assets, is as follows (Unaudited):
| United States of America | 36.6% |
| Canada | 21.3% |
| United Kingdom | 11.1% |
| Australia | 8.2% |
| Finland | 5.3% |
| Brazil | 3.6% |
| Russia | 3.3% |
| Bermuda | 2.8% |
| France | 2.6% |
| South Africa | 1.2% |
| Sweden | 1.0% |
| Others (Individually Less Than 1%) | 3.0% |
| | 100.0% |
See accompanying notes which are an integral part of the financial statements.
Financial Statements
Statement of Assets and Liabilities
| | | October 31, 2020 |
| Assets | | |
Investment in securities, at value — See accompanying schedule:
Unaffiliated issuers (cost $283,271,795) | $257,488,418 | |
| Fidelity Central Funds (cost $708,106) | 708,106 | |
| Total Investment in Securities (cost $283,979,901) | | $258,196,524 |
| Foreign currency held at value (cost $415) | | 415 |
| Receivable for investments sold | | 6,430,863 |
| Receivable for fund shares sold | | 363,904 |
| Dividends receivable | | 181,861 |
| Distributions receivable from Fidelity Central Funds | | 104 |
| Prepaid expenses | | 459 |
| Other receivables | | 15,260 |
| Total assets | | 265,189,390 |
| Liabilities | | |
| Payable for investments purchased | $4,882,976 | |
| Payable for fund shares redeemed | 920,568 | |
| Accrued management fee | 152,436 | |
| Distribution and service plan fees payable | 13,126 | |
| Other affiliated payables | 56,446 | |
| Other payables and accrued expenses | 53,785 | |
| Total liabilities | | 6,079,337 |
| Net Assets | | $259,110,053 |
| Net Assets consist of: | | |
| Paid in capital | | $473,813,880 |
| Total accumulated earnings (loss) | | (214,703,827) |
| Net Assets | | $259,110,053 |
| Net Asset Value and Maximum Offering Price | | |
| Class A: | | |
| Net Asset Value and redemption price per share ($20,452,522 ÷ 1,894,166 shares)(a) | | $10.80 |
| Maximum offering price per share (100/94.25 of $10.80) | | $11.46 |
| Class M: | | |
| Net Asset Value and redemption price per share ($4,378,249 ÷ 406,180 shares)(a) | | $10.78 |
| Maximum offering price per share (100/96.50 of $10.78) | | $11.17 |
| Class C: | | |
| Net Asset Value and offering price per share ($7,871,241 ÷ 736,956 shares)(a) | | $10.68 |
| Global Commodity Stock: | | |
| Net Asset Value, offering price and redemption price per share ($176,717,846 ÷ 16,328,763 shares) | | $10.82 |
| Class I: | | |
| Net Asset Value, offering price and redemption price per share ($33,185,002 ÷ 3,069,521 shares) | | $10.81 |
| Class Z: | | |
| Net Asset Value, offering price and redemption price per share ($16,505,193 ÷ 1,527,422 shares) | | $10.81 |
(a) Redemption price per share is equal to net asset value less any applicable contingent deferred sales charge.
See accompanying notes which are an integral part of the financial statements.
Statement of Operations
| | | Year ended October 31, 2020 |
| Investment Income | | |
| Dividends | | $13,612,524 |
| Income from Fidelity Central Funds (including $30,176 from security lending) | | 68,042 |
| Income before foreign taxes withheld | | 13,680,566 |
| Less foreign taxes withheld | | (733,627) |
| Total income | | 12,946,939 |
| Expenses | | |
| Management fee | $2,327,567 | |
| Transfer agent fees | 628,250 | |
| Distribution and service plan fees | 170,436 | |
| Accounting fees | 176,814 | |
| Custodian fees and expenses | 38,601 | |
| Independent trustees' fees and expenses | 2,135 | |
| Registration fees | 106,093 | |
| Audit | 50,493 | |
| Legal | 1,787 | |
| Miscellaneous | 19,975 | |
| Total expenses before reductions | 3,522,151 | |
| Expense reductions | (56,485) | |
| Total expenses after reductions | | 3,465,666 |
| Net investment income (loss) | | 9,481,273 |
| Realized and Unrealized Gain (Loss) | | |
| Net realized gain (loss) on: | | |
| Investment securities: | | |
| Unaffiliated issuers | (119,268,561) | |
| Fidelity Central Funds | 1,384 | |
| Foreign currency transactions | (394,547) | |
| Total net realized gain (loss) | | (119,661,724) |
| Change in net unrealized appreciation (depreciation) on: | | |
| Investment securities: | | |
| Unaffiliated issuers | 33,944,927 | |
| Fidelity Central Funds | 78 | |
| Assets and liabilities in foreign currencies | 4,903 | |
| Total change in net unrealized appreciation (depreciation) | | 33,949,908 |
| Net gain (loss) | | (85,711,816) |
| Net increase (decrease) in net assets resulting from operations | | $(76,230,543) |
See accompanying notes which are an integral part of the financial statements.
Statement of Changes in Net Assets
| | Year ended October 31, 2020 | Year ended October 31, 2019 |
| Increase (Decrease) in Net Assets | | |
| Operations | | |
| Net investment income (loss) | $9,481,273 | $16,398,628 |
| Net realized gain (loss) | (119,661,724) | (47,504,592) |
| Change in net unrealized appreciation (depreciation) | 33,949,908 | 29,433,210 |
| Net increase (decrease) in net assets resulting from operations | (76,230,543) | (1,672,754) |
| Distributions to shareholders | (14,697,608) | (11,167,623) |
| Share transactions - net increase (decrease) | (156,584,019) | (28,451,076) |
| Total increase (decrease) in net assets | (247,512,170) | (41,291,453) |
| Net Assets | | |
| Beginning of period | 506,622,223 | 547,913,676 |
| End of period | $259,110,053 | $506,622,223 |
See accompanying notes which are an integral part of the financial statements.
Financial Highlights
Fidelity Global Commodity Stock Fund Class A
| Years ended October 31, | 2020 | 2019 | 2018 | 2017 | 2016 |
| Selected Per–Share Data | | | | | |
| Net asset value, beginning of period | $12.14 | $12.42 | $12.56 | $10.73 | $10.05 |
| Income from Investment Operations | | | | | |
| Net investment income (loss)A | .28 | .35 | .21 | .12 | .11 |
| Net realized and unrealized gain (loss) | (1.26) | (.41) | (.22) | 1.86 | .79 |
| Total from investment operations | (.98) | (.06) | (.01) | 1.98 | .90 |
| Distributions from net investment income | (.36) | (.20) | (.09) | (.08) | (.21) |
| Distributions from net realized gain | – | (.02) | (.05) | (.07) | (.01) |
| Total distributions | (.36) | (.22) | (.13)B | (.15) | (.22) |
| Redemption fees added to paid in capitalA | – | – | –C | –C | –C |
| Net asset value, end of period | $10.80 | $12.14 | $12.42 | $12.56 | $10.73 |
| Total ReturnD,E | (8.39)% | (.44)% | (.05)% | 18.53% | 9.29% |
| Ratios to Average Net AssetsF,G | | | | | |
| Expenses before reductions | 1.31% | 1.29% | 1.28% | 1.33% | 1.38% |
| Expenses net of fee waivers, if any | 1.31% | 1.28% | 1.28% | 1.33% | 1.38% |
| Expenses net of all reductions | 1.29% | 1.28% | 1.27% | 1.32% | 1.37% |
| Net investment income (loss) | 2.53% | 2.86% | 1.55% | 1.07% | 1.18% |
| Supplemental Data | | | | | |
| Net assets, end of period (000 omitted) | $20,453 | $25,779 | $27,258 | $29,920 | $34,791 |
| Portfolio turnover rateH | 40% | 55% | 70% | 81% | 85% |
A Calculated based on average shares outstanding during the period.
B Total distributions per share do not sum due to rounding.
C Amount represents less than $.005 per share.
D Total returns would have been lower if certain expenses had not been reduced during the applicable periods shown.
E Total returns do not include the effect of the sales charges.
F Fees and expenses of any underlying mutual funds or exchange-traded funds (ETFs) are not included in the Fund's expense ratio. The Fund indirectly bears its proportionate share of these expenses. For additional expense information related to investments in Fidelity Central Funds, please refer to the "Investments in Fidelity Central Funds" note found in the Notes to Financial Statements section of the most recent Annual or Semi-Annual report.
G Expense ratios reflect operating expenses of the class. Expenses before reductions do not reflect amounts reimbursed, waived, or reduced through arrangements with the investment adviser, brokerage services, or other offset arrangements, if applicable, and do not represent the amount paid by the class during periods when reimbursements, waivers or reductions occur.
H Amount does not include the portfolio activity of any underlying mutual funds or exchange-traded funds (ETFs).
See accompanying notes which are an integral part of the financial statements.
Fidelity Global Commodity Stock Fund Class M
| Years ended October 31, | 2020 | 2019 | 2018 | 2017 | 2016 |
| Selected Per–Share Data | | | | | |
| Net asset value, beginning of period | $12.12 | $12.39 | $12.53 | $10.72 | $10.02 |
| Income from Investment Operations | | | | | |
| Net investment income (loss)A | .25 | .31 | .16 | .09 | .09 |
| Net realized and unrealized gain (loss) | (1.27) | (.40) | (.20) | 1.84 | .79 |
| Total from investment operations | (1.02) | (.09) | (.04) | 1.93 | .88 |
| Distributions from net investment income | (.32) | (.16) | (.06) | (.05) | (.17) |
| Distributions from net realized gain | – | (.02) | (.05) | (.07) | (.01) |
| Total distributions | (.32) | (.18) | (.10)B | (.12) | (.18) |
| Redemption fees added to paid in capitalA | – | – | –C | –C | –C |
| Net asset value, end of period | $10.78 | $12.12 | $12.39 | $12.53 | $10.72 |
| Total ReturnD,E | (8.72)% | (.70)% | (.30)% | 18.09% | 9.08% |
| Ratios to Average Net AssetsF,G | | | | | |
| Expenses before reductions | 1.59% | 1.59% | 1.59% | 1.62% | 1.65% |
| Expenses net of fee waivers, if any | 1.59% | 1.59% | 1.59% | 1.62% | 1.65% |
| Expenses net of all reductions | 1.58% | 1.59% | 1.58% | 1.61% | 1.64% |
| Net investment income (loss) | 2.24% | 2.55% | 1.24% | .78% | .90% |
| Supplemental Data | | | | | |
| Net assets, end of period (000 omitted) | $4,378 | $5,416 | $7,200 | $6,876 | $6,068 |
| Portfolio turnover rateH | 40% | 55% | 70% | 81% | 85% |
A Calculated based on average shares outstanding during the period.
B Total distributions per share do not sum due to rounding.
C Amount represents less than $.005 per share.
D Total returns would have been lower if certain expenses had not been reduced during the applicable periods shown.
E Total returns do not include the effect of the sales charges.
F Fees and expenses of any underlying mutual funds or exchange-traded funds (ETFs) are not included in the Fund's expense ratio. The Fund indirectly bears its proportionate share of these expenses. For additional expense information related to investments in Fidelity Central Funds, please refer to the "Investments in Fidelity Central Funds" note found in the Notes to Financial Statements section of the most recent Annual or Semi-Annual report.
G Expense ratios reflect operating expenses of the class. Expenses before reductions do not reflect amounts reimbursed, waived, or reduced through arrangements with the investment adviser, brokerage services, or other offset arrangements, if applicable, and do not represent the amount paid by the class during periods when reimbursements, waivers or reductions occur.
H Amount does not include the portfolio activity of any underlying mutual funds or exchange-traded funds (ETFs).
See accompanying notes which are an integral part of the financial statements.
Fidelity Global Commodity Stock Fund Class C
| Years ended October 31, | 2020 | 2019 | 2018 | 2017 | 2016 |
| Selected Per–Share Data | | | | | |
| Net asset value, beginning of period | $11.99 | $12.26 | $12.39 | $10.61 | $9.92 |
| Income from Investment Operations | | | | | |
| Net investment income (loss)A | .20 | .26 | .11 | .04 | .04 |
| Net realized and unrealized gain (loss) | (1.26) | (.41) | (.19) | 1.82 | .78 |
| Total from investment operations | (1.06) | (.15) | (.08) | 1.86 | .82 |
| Distributions from net investment income | (.25) | (.11) | – | (.01) | (.12) |
| Distributions from net realized gain | – | (.02) | (.05) | (.07) | (.01) |
| Total distributions | (.25) | (.12)B | (.05) | (.08) | (.13) |
| Redemption fees added to paid in capitalA | – | – | –C | –C | –C |
| Net asset value, end of period | $10.68 | $11.99 | $12.26 | $12.39 | $10.61 |
| Total ReturnD,E | (9.11)% | (1.16)% | (.67)% | 17.59% | 8.46% |
| Ratios to Average Net AssetsF,G | | | | | |
| Expenses before reductions | 2.05% | 2.02% | 2.00% | 2.07% | 2.13% |
| Expenses net of fee waivers, if any | 2.04% | 2.02% | 1.99% | 2.07% | 2.13% |
| Expenses net of all reductions | 2.03% | 2.01% | 1.98% | 2.06% | 2.12% |
| Net investment income (loss) | 1.79% | 2.13% | .84% | .33% | .43% |
| Supplemental Data | | | | | |
| Net assets, end of period (000 omitted) | $7,871 | $11,294 | $20,793 | $14,289 | $12,620 |
| Portfolio turnover rateH | 40% | 55% | 70% | 81% | 85% |
A Calculated based on average shares outstanding during the period.
B Total distributions per share do not sum due to rounding.
C Amount represents less than $.005 per share.
D Total returns would have been lower if certain expenses had not been reduced during the applicable periods shown.
E Total returns do not include the effect of the contingent deferred sales charge.
F Fees and expenses of any underlying mutual funds or exchange-traded funds (ETFs) are not included in the Fund's expense ratio. The Fund indirectly bears its proportionate share of these expenses. For additional expense information related to investments in Fidelity Central Funds, please refer to the "Investments in Fidelity Central Funds" note found in the Notes to Financial Statements section of the most recent Annual or Semi-Annual report.
G Expense ratios reflect operating expenses of the class. Expenses before reductions do not reflect amounts reimbursed, waived, or reduced through arrangements with the investment adviser, brokerage services, or other offset arrangements, if applicable, and do not represent the amount paid by the class during periods when reimbursements, waivers or reductions occur.
H Amount does not include the portfolio activity of any underlying mutual funds or exchange-traded funds (ETFs).
See accompanying notes which are an integral part of the financial statements.
Fidelity Global Commodity Stock Fund
| Years ended October 31, | 2020 | 2019 | 2018 | 2017 | 2016 |
| Selected Per–Share Data | | | | | |
| Net asset value, beginning of period | $12.15 | $12.44 | $12.59 | $10.77 | $10.09 |
| Income from Investment Operations | | | | | |
| Net investment income (loss)A | .31 | .37 | .23 | .15 | .14 |
| Net realized and unrealized gain (loss) | (1.26) | (.41) | (.20) | 1.84 | .79 |
| Total from investment operations | (.95) | (.04) | .03 | 1.99 | .93 |
| Distributions from net investment income | (.38) | (.23) | (.13) | (.11) | (.24) |
| Distributions from net realized gain | – | (.02) | (.05) | (.07) | (.01) |
| Total distributions | (.38) | (.25) | (.18) | (.17)B | (.25) |
| Redemption fees added to paid in capitalA | – | – | –C | –C | –C |
| Net asset value, end of period | $10.82 | $12.15 | $12.44 | $12.59 | $10.77 |
| Total ReturnD | (8.16)% | (.23)% | .23% | 18.65% | 9.62% |
| Ratios to Average Net AssetsE,F | | | | | |
| Expenses before reductions | 1.02% | 1.06% | 1.08% | 1.10% | 1.13% |
| Expenses net of fee waivers, if any | 1.02% | 1.06% | 1.08% | 1.10% | 1.13% |
| Expenses net of all reductions | 1.00% | 1.06% | 1.06% | 1.09% | 1.12% |
| Net investment income (loss) | 2.82% | 3.08% | 1.75% | 1.30% | 1.43% |
| Supplemental Data | | | | | |
| Net assets, end of period (000 omitted) | $176,718 | $257,011 | $369,563 | $264,557 | $228,982 |
| Portfolio turnover rateG | 40% | 55% | 70% | 81% | 85% |
A Calculated based on average shares outstanding during the period.
B Total distributions per share do not sum due to rounding.
C Amount represents less than $.005 per share.
D Total returns would have been lower if certain expenses had not been reduced during the applicable periods shown.
E Fees and expenses of any underlying mutual funds or exchange-traded funds (ETFs) are not included in the Fund's expense ratio. The Fund indirectly bears its proportionate share of these expenses. For additional expense information related to investments in Fidelity Central Funds, please refer to the "Investments in Fidelity Central Funds" note found in the Notes to Financial Statements section of the most recent Annual or Semi-Annual report.
F Expense ratios reflect operating expenses of the class. Expenses before reductions do not reflect amounts reimbursed, waived, or reduced through arrangements with the investment adviser, brokerage services, or other offset arrangements, if applicable, and do not represent the amount paid by the class during periods when reimbursements, waivers or reductions occur.
G Amount does not include the portfolio activity of any underlying mutual funds or exchange-traded funds (ETFs).
See accompanying notes which are an integral part of the financial statements.
Fidelity Global Commodity Stock Fund Class I
| Years ended October 31, | 2020 | 2019 | 2018 | 2017 | 2016 |
| Selected Per–Share Data | | | | | |
| Net asset value, beginning of period | $12.16 | $12.45 | $12.60 | $10.76 | $10.09 |
| Income from Investment Operations | | | | | |
| Net investment income (loss)A | .32 | .39 | .25 | .17 | .16 |
| Net realized and unrealized gain (loss) | (1.26) | (.41) | (.21) | 1.86 | .77 |
| Total from investment operations | (.94) | (.02) | .04 | 2.03 | .93 |
| Distributions from net investment income | (.41) | (.25) | (.14) | (.12) | (.25) |
| Distributions from net realized gain | – | (.02) | (.05) | (.07) | (.01) |
| Total distributions | (.41) | (.27) | (.19) | (.19) | (.26) |
| Redemption fees added to paid in capitalA | – | – | –B | –B | –B |
| Net asset value, end of period | $10.81 | $12.16 | $12.45 | $12.60 | $10.76 |
| Total ReturnC | (8.11)% | (.06)% | .30% | 18.99% | 9.63% |
| Ratios to Average Net AssetsD,E | | | | | |
| Expenses before reductions | .95% | .92% | .93% | .96% | 1.01% |
| Expenses net of fee waivers, if any | .95% | .92% | .93% | .95% | 1.01% |
| Expenses net of all reductions | .93% | .91% | .91% | .94% | 1.00% |
| Net investment income (loss) | 2.88% | 3.23% | 1.90% | 1.45% | 1.55% |
| Supplemental Data | | | | | |
| Net assets, end of period (000 omitted) | $33,185 | $102,633 | $117,981 | $113,655 | $70,068 |
| Portfolio turnover rateF | 40% | 55% | 70% | 81% | 85% |
A Calculated based on average shares outstanding during the period.
B Amount represents less than $.005 per share.
C Total returns would have been lower if certain expenses had not been reduced during the applicable periods shown.
D Fees and expenses of any underlying mutual funds or exchange-traded funds (ETFs) are not included in the Fund's expense ratio. The Fund indirectly bears its proportionate share of these expenses. For additional expense information related to investments in Fidelity Central Funds, please refer to the "Investments in Fidelity Central Funds" note found in the Notes to Financial Statements section of the most recent Annual or Semi-Annual report.
E Expense ratios reflect operating expenses of the class. Expenses before reductions do not reflect amounts reimbursed, waived, or reduced through arrangements with the investment adviser, brokerage services, or other offset arrangements, if applicable, and do not represent the amount paid by the class during periods when reimbursements, waivers or reductions occur.
F Amount does not include the portfolio activity of any underlying mutual funds or exchange-traded funds (ETFs).
See accompanying notes which are an integral part of the financial statements.
Fidelity Global Commodity Stock Fund Class Z
| Years ended October 31, | 2020 | 2019 | 2018 A |
| Selected Per–Share Data | | | |
| Net asset value, beginning of period | $12.16 | $12.46 | $13.84 |
| Income from Investment Operations | | | |
| Net investment income (loss)B | .34 | .39 | (.01) |
| Net realized and unrealized gain (loss) | (1.26) | (.40) | (1.37) |
| Total from investment operations | (.92) | (.01) | (1.38) |
| Distributions from net investment income | (.43) | (.27) | – |
| Distributions from net realized gain | – | (.02) | – |
| Total distributions | (.43) | (.29) | – |
| Net asset value, end of period | $10.81 | $12.16 | $12.46 |
| Total ReturnC,D | (7.99)% | .03% | (9.97)% |
| Ratios to Average Net AssetsE,F | | | |
| Expenses before reductions | .85% | .83% | .89%G |
| Expenses net of fee waivers, if any | .84% | .83% | .89%G |
| Expenses net of all reductions | .83% | .82% | .87%G |
| Net investment income (loss) | 2.99% | 3.32% | (.70)%G |
| Supplemental Data | | | |
| Net assets, end of period (000 omitted) | $16,505 | $104,489 | $5,118 |
| Portfolio turnover rateH | 40% | 55% | 70% |
A For the period October 2, 2018 (commencement of sale of shares) to October 31, 2018.
B Calculated based on average shares outstanding during the period.
C Total returns for periods of less than one year are not annualized.
D Total returns would have been lower if certain expenses had not been reduced during the applicable periods shown.
E Fees and expenses of any underlying mutual funds or exchange-traded funds (ETFs) are not included in the Fund's expense ratio. The Fund indirectly bears its proportionate share of these expenses. For additional expense information related to investments in Fidelity Central Funds, please refer to the "Investments in Fidelity Central Funds" note found in the Notes to Financial Statements section of the most recent Annual or Semi-Annual report.
F Expense ratios reflect operating expenses of the class. Expenses before reductions do not reflect amounts reimbursed, waived, or reduced through arrangements with the investment adviser, brokerage services, or other offset arrangements, if applicable, and do not represent the amount paid by the class during periods when reimbursements, waivers or reductions occur.
G Annualized
H Amount does not include the portfolio activity of any underlying mutual funds or exchange-traded funds (ETFs).
See accompanying notes which are an integral part of the financial statements.
Notes to Financial Statements
For the period ended October 31, 2020
1. Organization.
Fidelity Global Commodity Stock Fund (the Fund) is a non-diversified fund of Fidelity Investment Trust (the Trust) and is authorized to issue an unlimited number of shares. The Trust is registered under the Investment Company Act of 1940, as amended (the 1940 Act), as an open-end management investment company organized as a Massachusetts business trust. The Fund offers Class A, Class M, Class C, Global Commodity Stock, Class I and Class Z shares, each of which has equal rights as to assets and voting privileges. Each class has exclusive voting rights with respect to matters that affect that class. Class C shares will automatically convert to Class A shares after a holding period of ten years from the initial date of purchase, with certain exceptions.
Effective January 1, 2020:
Investment advisers Fidelity Investments Money Management, Inc., FMR Co., Inc., and Fidelity SelectCo, LLC, merged with and into Fidelity Management & Research Company. In connection with the merger transactions, the resulting, merged investment adviser was then redomiciled from Massachusetts to Delaware, changed its corporate structure from a corporation to a limited liability company, and changed its name to "Fidelity Management & Research Company LLC".
Broker-dealer Fidelity Distributors Corporation merged with and into Fidelity Investments Institutional Services Company, Inc. ("FIISC"). FIISC was then redomiciled from Massachusetts to Delaware, changed its corporate structure from a corporation to a limited liability company, and changed its name to "Fidelity Distributors Company LLC".
Fidelity Investments Institutional Operations Company, Inc. converted from a Massachusetts corporation to a Massachusetts LLC, and changed its name to "Fidelity Investments Institutional Operations Company LLC".
2. Investments in Fidelity Central Funds.
The Fund invests in Fidelity Central Funds, which are open-end investment companies generally available only to other investment companies and accounts managed by the investment adviser and its affiliates. The Fund's Schedule of Investments lists each of the Fidelity Central Funds held as of period end, if any, as an investment of the Fund, but does not include the underlying holdings of each Fidelity Central Fund. As an Investing Fund, the Fund indirectly bears its proportionate share of the expenses of the underlying Fidelity Central Funds.
The Money Market Central Funds seek preservation of capital and current income and are managed by the investment adviser. Annualized expenses of the Money Market Central Funds as of their most recent shareholder report date ranged from less than .005% to .01%.
A complete unaudited list of holdings for each Fidelity Central Fund is available upon request or at the Securities and Exchange Commission (the SEC) website at www.sec.gov. In addition, the financial statements of the Fidelity Central Funds, which are not covered by the Fund's Report of Independent Registered Public Accounting Firm, are available on the SEC website or upon request.
3. Significant Accounting Policies.
The Fund is an investment company and applies the accounting and reporting guidance of the Financial Accounting Standards Board (FASB) Accounting Standards Codification Topic 946 Financial Services – Investment Companies. The financial statements have been prepared in conformity with accounting principles generally accepted in the United States of America (GAAP), which require management to make certain estimates and assumptions at the date of the financial statements. Actual results could differ from those estimates. Subsequent events, if any, through the date that the financial statements were issued have been evaluated in the preparation of the financial statements. The following summarizes the significant accounting policies of the Fund:
Investment Valuation. Investments are valued as of 4:00 p.m. Eastern time on the last calendar day of the period. The Board of Trustees (the Board) has delegated the day to day responsibility for the valuation of the Fund's investments to the Fair Value Committee (the Committee) established by the Fund's investment adviser. In accordance with valuation policies and procedures approved by the Board, the Fund attempts to obtain prices from one or more third party pricing vendors or brokers to value its investments. When current market prices, quotations or currency exchange rates are not readily available or reliable, investments will be fair valued in good faith by the Committee, in accordance with procedures adopted by the Board. Factors used in determining fair value vary by investment type and may include market or investment specific events. The frequency with which these procedures are used cannot be predicted and they may be utilized to a significant extent. The Committee oversees the Fund's valuation policies and procedures and reports to the Board on the Committee's activities and fair value determinations. The Board monitors the appropriateness of the procedures used in valuing the Fund's investments and ratifies the fair value determinations of the Committee.
The Fund categorizes the inputs to valuation techniques used to value its investments into a disclosure hierarchy consisting of three levels as shown below:
- Level 1 – quoted prices in active markets for identical investments
- Level 2 – other significant observable inputs (including quoted prices for similar investments, interest rates, prepayment speeds, etc.)
- Level 3 – unobservable inputs (including the Fund's own assumptions based on the best information available)
Valuation techniques used to value the Fund's investments by major category are as follows:
Equity securities, including restricted securities, for which market quotations are readily available, are valued at the last reported sale price or official closing price as reported by a third party pricing vendor on the primary market or exchange on which they are traded and are categorized as Level 1 in the hierarchy. In the event there were no sales during the day or closing prices are not available, securities are valued at the last quoted bid price or may be valued using the last available price and are generally categorized as Level 2 in the hierarchy. For foreign equity securities, when market or security specific events arise, comparisons to the valuation of American Depositary Receipts (ADRs), futures contracts, Exchange-Traded Funds (ETFs) and certain indexes as well as quoted prices for similar securities may be used and would be categorized as Level 2 in the hierarchy. For equity securities, including restricted securities, where observable inputs are limited, assumptions about market activity and risk are used and these securities may be categorized as Level 3 in the hierarchy.
Investments in open-end mutual funds, including the Fidelity Central Funds, are valued at their closing net asset value (NAV) each business day and are categorized as Level 1 in the hierarchy.
Changes in valuation techniques may result in transfers in or out of an assigned level within the disclosure hierarchy. The aggregate value of investments by input level as of October 31, 2020 is included at the end of the Fund's Schedule of Investments.
Foreign Currency. Certain Funds may use foreign currency contracts to facilitate transactions in foreign-denominated securities. Gains and losses from these transactions may arise from changes in the value of the foreign currency or if the counterparties do not perform under the contracts' terms.
Foreign-denominated assets, including investment securities, and liabilities are translated into U.S. dollars at the exchange rates at period end. Purchases and sales of investment securities, income and dividends received, and expenses denominated in foreign currencies are translated into U.S. dollars at the exchange rate in effect on the transaction date.
The effects of exchange rate fluctuations on investments are included with the net realized and unrealized gain (loss) on investment securities. Other foreign currency transactions resulting in realized and unrealized gain (loss) are disclosed separately.
Investment Transactions and Income. For financial reporting purposes, the Fund's investment holdings and NAV include trades executed through the end of the last business day of the period. The NAV per share for processing shareholder transactions is calculated as of the close of business of the New York Stock Exchange (NYSE), normally 4:00 p.m. Eastern time and includes trades executed through the end of the prior business day. Gains and losses on securities sold are determined on the basis of identified cost and include proceeds received from litigation. Dividend income is recorded on the ex-dividend date, except for certain dividends from foreign securities where the ex-dividend date may have passed, which are recorded as soon as the Fund is informed of the ex-dividend date. Non-cash dividends included in dividend income, if any, are recorded at the fair market value of the securities received. Income and capital gain distributions from Fidelity Central Funds, if any, are recorded on the ex-dividend date. Certain distributions received by the Fund represent a return of capital or capital gain. The Fund determines the components of these distributions subsequent to the ex-dividend date, based upon receipt of tax filings or other correspondence relating to the underlying investment. These distributions are recorded as a reduction of cost of investments and/or as a realized gain. Investment income is recorded net of foreign taxes withheld where recovery of such taxes is uncertain.
Class Allocations and Expenses. Investment income, realized and unrealized capital gains and losses, common expenses of the Fund, and certain fund-level expense reductions, if any, are allocated daily on a pro-rata basis to each class based on the relative net assets of each class to the total net assets of the Fund. Each class differs with respect to transfer agent and distribution and service plan fees incurred. Certain expense reductions may also differ by class. For the reporting period, the allocated portion of income and expenses to each class as a percent of its average net assets may vary due to the timing of recording these transactions in relation to fluctuating net assets of the classes. Expenses directly attributable to a fund are charged to that fund. Expenses attributable to more than one fund are allocated among the respective funds on the basis of relative net assets or other appropriate methods. Expense estimates are accrued in the period to which they relate and adjustments are made when actual amounts are known.
Income Tax Information and Distributions to Shareholders. Each year, the Fund intends to qualify as a regulated investment company under Subchapter M of the Internal Revenue Code, including distributing substantially all of its taxable income and realized gains. As a result, no provision for U.S. Federal income taxes is required. As of October 31, 2020, the Fund did not have any unrecognized tax benefits in the financial statements; nor is the Fund aware of any tax positions for which it is reasonably possible that the total amounts of unrecognized tax benefits will significantly change in the next twelve months. The Fund files a U.S. federal tax return, in addition to state and local tax returns as required. The Fund's federal income tax returns are subject to examination by the Internal Revenue Service (IRS) for a period of three fiscal years after they are filed. State and local tax returns may be subject to examination for an additional fiscal year depending on the jurisdiction. Foreign taxes are provided for based on the Fund's understanding of the tax rules and rates that exist in the foreign markets in which it invests.
Distributions are declared and recorded on the ex-dividend date. Income and capital gain distributions are declared separately for each class. Income and capital gain distributions are determined in accordance with income tax regulations, which may differ from GAAP. In addition, the Fund claimed a portion of the payment made to redeeming shareholders as a distribution for income tax purposes.
Capital accounts within the financial statements are adjusted for permanent book-tax differences. These adjustments have no impact on net assets or the results of operations. Capital accounts are not adjusted for temporary book-tax differences which will reverse in a subsequent period.
Book-tax differences are primarily due to foreign currency transactions, passive foreign investment companies (PFIC), capital loss carryforwards and losses deferred due to wash sales.
As of period end, the cost and unrealized appreciation (depreciation) in securities, and derivatives if applicable, for federal income tax purposes were as follows:
| Gross unrealized appreciation | $33,857,653 |
| Gross unrealized depreciation | (64,012,645) |
| Net unrealized appreciation (depreciation) | $(30,154,992) |
| Tax Cost | $288,351,516 |
The tax-based components of distributable earnings as of period end were as follows:
| Undistributed ordinary income | $5,557,398 |
| Capital loss carryforward | $(190,103,840) |
| Net unrealized appreciation (depreciation) on securities and other investments | $(30,157,384) |
Capital loss carryforwards are only available to offset future capital gains of the Fund to the extent provided by regulations and may be limited. The capital loss carryforward information presented below, including any applicable limitation, is estimated as of fiscal period end and is subject to adjustment.
| No expiration | |
| Short-term | $(33,422,798) |
| Long-term | (156,681,042) |
| Total capital loss carryforward | $(190,103,840) |
The tax character of distributions paid was as follows:
| | October 31, 2020 | October 31, 2019 |
| Ordinary Income | $14,697,608 | $ 11,167,623 |
4. Purchases and Sales of Investments.
Purchases and sales of securities, other than short-term securities, are noted in the table below.
| | Purchases ($) | Sales ($) |
| Fidelity Global Commodity Stock Fund | 133,509,095 | 292,565,146 |
5. Fees and Other Transactions with Affiliates.
Management Fee. Fidelity Management & Research Company LLC (the investment adviser) and its affiliates provide the Fund with investment management related services for which the Fund pays a monthly management fee. The management fee is the sum of an individual fund fee rate that is based on an annual rate of .45% of the Fund's average net assets and an annualized group fee rate that averaged .23% during the period. The group fee rate is based upon the monthly average net assets of a group of registered investment companies with which the investment adviser has management contracts. The group fee rate decreases as assets under management increase and increases as assets under management decrease. For the reporting period, the total annual management fee rate was .69% of the Fund's average net assets.
Distribution and Service Plan Fees. In accordance with Rule 12b-1 of the 1940 Act, the Fund has adopted separate Distribution and Service Plans for each class of shares. Certain classes pay Fidelity Distributors Company LLC (FDC), an affiliate of the investment adviser, separate Distribution and Service Fees, each of which is based on an annual percentage of each class' average net assets. In addition, FDC may pay financial intermediaries for selling shares of the Fund and providing shareholder support services. For the period, the Distribution and Service Fee rates, total fees and amounts retained by FDC were as follows:
| | Distribution Fee | Service Fee | Total Fees | Retained by FDC |
| Class A | -% | .25% | $55,162 | $1,038 |
| Class M | .25% | .25% | 23,718 | 63 |
| Class C | .75% | .25% | 91,556 | 11,813 |
| | | | $170,436 | $12,914 |
Sales Load. FDC may receive a front-end sales charge of up to 5.75% for selling Class A shares and 3.50% for selling Class M shares, some of which is paid to financial intermediaries for selling shares of the Fund. Depending on the holding period, FDC may receive contingent deferred sales charges levied on Class A, Class M and Class C redemptions. The deferred sales charges are 1.00% for Class C shares, 1.00% for certain purchases of Class A shares and .25% for certain purchases of Class M shares.
For the period, sales charge amounts retained by FDC were as follows:
| | Retained by FDC |
| Class A | $3,830 |
| Class M | 997 |
| Class C(a) | 742 |
| | $5,569 |
(a) When Class C shares are initially sold, FDC pays commissions from its own resources to financial intermediaries through which the sales are made.
Transfer Agent Fees. Fidelity Investments Institutional Operations Company LLC (FIIOC), an affiliate of the investment adviser, is the transfer, dividend disbursing and shareholder servicing agent for each class of the Fund. FIIOC receives account fees and asset-based fees that vary according to the account size and type of account of the shareholders of the respective classes of the Fund, except for Class Z. FIIOC receives an asset-based fee of Class Z's average net assets. FIIOC pays for typesetting, printing and mailing of shareholder reports, except proxy statements. Effective February 1, 2020, the Board approved to change the fee for Class Z from .046% to .044%.
For the period, transfer agent fees for each class were as follows:
| | Amount | % of Class-Level Average Net Assets |
| Class A | $55,876 | .25 |
| Class M | 13,654 | .29 |
| Class C | 21,730 | .24 |
| Global Commodity Stock | 428,203 | .22 |
| Class I | 89,316 | .15 |
| Class Z | 19,471 | .04 |
| | $628,250 | |
Accounting Fees. Fidelity Service Company, Inc. (FSC), an affiliate of the investment adviser, maintains the Fund's accounting records. The accounting fee is based on the level of average net assets for each month. For the period, the fees were equivalent to the following annual rates:
| | % of Average Net Assets |
| Fidelity Global Commodity Stock Fund | .05 |
Brokerage Commissions. A portion of portfolio transactions were placed with brokerage firms which are affiliates of the investment adviser. Brokerage commissions are included in net realized gain (loss) and change in net unrealized appreciation (depreciation) in the Statement of Operations. The commissions paid to these affiliated firms were as follows:
| | Amount |
| Fidelity Global Commodity Stock Fund | $3,616 |
Interfund Trades. Funds may purchase from or sell securities to other Fidelity Funds under procedures adopted by the Board. The procedures have been designed to ensure these interfund trades are executed in accordance with Rule 17a-7 of the 1940 Act. Interfund trades are included within the respective purchases and sales amounts shown in the Purchases and Sales of Investments note.
Other. During the period, the investment adviser reimbursed the Fund for certain losses in the amount of $41,470.
6. Committed Line of Credit.
Certain Funds participate with other funds managed by the investment adviser or an affiliate in a $4.25 billion credit facility (the "line of credit") to be utilized for temporary or emergency purposes to fund shareholder redemptions or for other short-term liquidity purposes. The participating funds have agreed to pay commitment fees on their pro-rata portion of the line of credit, which are reflected in Miscellaneous expenses on the Statement of Operations, and are as follows:
| | Amount |
| Fidelity Global Commodity Stock Fund | $866 |
During the period, there were no borrowings on this line of credit.
7. Security Lending.
Funds lend portfolio securities from time to time in order to earn additional income. Lending agents are used, including National Financial Services (NFS), an affiliate of the investment adviser. Pursuant to a securities lending agreement, NFS will receive a fee, which is capped at 9.9% of a fund's daily lending revenue, for its services as lending agent. A fund may lend securities to certain qualified borrowers, including NFS. On the settlement date of the loan, a fund receives collateral (in the form of U.S. Treasury obligations, letters of credit and/or cash) against the loaned securities and maintains collateral in an amount not less than 100% of the market value of the loaned securities during the period of the loan. The market value of the loaned securities is determined at the close of business of a fund and any additional required collateral is delivered to a fund on the next business day. A fund or borrower may terminate the loan at any time, and if the borrower defaults on its obligation to return the securities loaned because of insolvency or other reasons, a fund may apply collateral received from the borrower against the obligation. A fund may experience delays and costs in recovering the securities loaned. Any cash collateral received is invested in the Fidelity Securities Lending Cash Central Fund. Any loaned securities are identified as such in the Schedule of Investments, and the value of loaned securities and cash collateral at period end, as applicable, are presented in the Statement of Assets and Liabilities. Security lending income represents the income earned on investing cash collateral, less rebates paid to borrowers and any lending agent fees associated with the loan, plus any premium payments received for lending certain types of securities. Security lending income is presented in the Statement of Operations as a component of income from Fidelity Central Funds. Affiliated security lending activity, if any, was as follows:
| | Total Security Lending Income Fees Paid to NFS | Security Lending Income From Securities Loaned to NFS | Value of Securities Loaned to NFS at Period End |
| Fidelity Global Commodity Stock Fund | $77 | $– | $– |
8. Expense Reductions.
Commissions paid to certain brokers with whom the investment adviser, or its affiliates, places trades on behalf of the Fund include an amount in addition to trade execution, which may be rebated back to the Fund to offset certain expenses. This amount totaled $48,889 for the period.
In addition, during the period the investment adviser or an affiliate reimbursed and/or waived a portion of fund-level operating expenses in the amount of $1,926.
In addition, during the period the investment adviser or an affiliate reimbursed the Fund $5,670 for an operational error which is included in the accompanying Statement of Operations.
9. Distributions to Shareholders.
Distributions to shareholders of each class were as follows:
| | Year ended
October 31, 2020 | Year ended
October 31, 2019 |
| Distributions to shareholders | | |
| Class A | $759,471 | $483,346 |
| Class M | 144,021 | 100,322 |
| Class C | 230,198 | 200,915 |
| Global Commodity Stock | 7,319,626 | 7,706,193 |
| Class I | 3,291,216 | 2,518,989 |
| Class Z | 2,953,076 | 157,858 |
| Total | $14,697,608 | $11,167,623 |
10. Share Transactions.
Share transactions for each class were as follows and may contain automatic conversions between classes or exchanges between affiliated funds:
| | Shares | Shares | Dollars | Dollars |
| | Year ended October 31, 2020 | Year ended October 31, 2019 | Year ended October 31, 2020 | Year ended October 31, 2019 |
| Class A | | | | |
| Shares sold | 425,473 | 585,052 | $4,506,487 | $7,162,948 |
| Reinvestment of distributions | 61,881 | 41,258 | 754,330 | 479,423 |
| Shares redeemed | (715,875) | (698,260) | (7,654,932) | (8,497,822) |
| Net increase (decrease) | (228,521) | (71,950) | $(2,394,115) | $(855,451) |
| Class M | | | | |
| Shares sold | 68,941 | 62,259 | $766,910 | $747,221 |
| Reinvestment of distributions | 11,772 | 8,615 | 143,620 | 100,105 |
| Shares redeemed | (121,509) | (205,121) | (1,308,904) | (2,471,997) |
| Net increase (decrease) | (40,796) | (134,247) | $(398,374) | $(1,624,671) |
| Class C | | | | |
| Shares sold | 125,458 | 211,795 | $1,381,253 | $2,546,657 |
| Reinvestment of distributions | 18,529 | 17,161�� | 224,941 | 198,038 |
| Shares redeemed | (348,931) | (983,587) | (3,612,195) | (11,964,913) |
| Net increase (decrease) | (204,944) | (754,631) | $(2,006,001) | $(9,220,218) |
| Global Commodity Stock | | | | |
| Shares sold | 3,621,215 | 7,295,499 | $39,299,615 | $88,639,134 |
| Reinvestment of distributions | 508,051 | 615,573 | 6,193,144 | 7,140,644 |
| Shares redeemed | (8,945,051) | (16,479,603) | (94,341,181) | (193,789,885) |
| Net increase (decrease) | (4,815,785) | (8,568,531) | $(48,848,422) | $(98,010,107) |
| Class I | | | | |
| Shares sold | 3,932,111 | 1,953,699 | $43,193,618 | $23,249,341 |
| Reinvestment of distributions | 150,783 | 137,668 | 1,835,030 | 1,596,951 |
| Shares redeemed | (9,450,971) | (3,129,828) | (88,002,900) | (37,373,023) |
| Net increase (decrease) | (5,368,077) | (1,038,461) | $(42,974,252) | $(12,526,731) |
| Class Z | | | | |
| Shares sold | 2,534,152 | 9,203,502 | $27,902,181 | $106,244,072 |
| Reinvestment of distributions | 233,079 | 5,496 | 2,831,913 | 63,640 |
| Shares redeemed | (9,832,640) | (1,027,006) | (90,696,949) | (12,521,610) |
| Net increase (decrease) | (7,065,409) | 8,181,992 | $(59,962,855) | $93,786,102 |
11. Other.
The Fund's organizational documents provide former and current trustees and officers with a limited indemnification against liabilities arising in connection with the performance of their duties to the Fund. In the normal course of business, the Fund may also enter into contracts that provide general indemnifications. The Fund's maximum exposure under these arrangements is unknown as this would be dependent on future claims that may be made against the Fund. The risk of material loss from such claims is considered remote.
Mutual funds managed by the investment adviser or its affiliates were the owners of record, in the aggregate, of approximately 23% of the total outstanding shares of the Fund.
12. Coronavirus (COVID-19) Pandemic.
An outbreak of COVID-19 first detected in China during December 2019 has since spread globally and was declared a pandemic by the World Health Organization during March 2020. Developments that disrupt global economies and financial markets, such as the COVID-19 pandemic, may magnify factors that affect the Fund's performance.
Report of Independent Registered Public Accounting Firm
To the Board of Trustees of Fidelity Investment Trust and Shareholders of Fidelity Global Commodity Stock Fund
Opinion on the Financial Statements
We have audited the accompanying statement of assets and liabilities, including the schedule of investments, of Fidelity Global Commodity Stock Fund (one of the funds constituting Fidelity Investment Trust, referred to hereafter as the “Fund”) as of October 31, 2020, the related statement of operations for the year ended October 31, 2020, the statement of changes in net assets for each of the two years in the period ended October 31, 2020, including the related notes, and the financial highlights for each of the periods indicated therein (collectively referred to as the “financial statements”). In our opinion, the financial statements present fairly, in all material respects, the financial position of the Fund as of October 31, 2020, the results of its operations for the year then ended, the changes in its net assets for each of the two years in the period ended October 31, 2020 and the financial highlights for each of the periods indicated therein in conformity with accounting principles generally accepted in the United States of America.
Basis for Opinion
These financial statements are the responsibility of the Fund’s management. Our responsibility is to express an opinion on the Fund’s financial statements based on our audits. We are a public accounting firm registered with the Public Company Accounting Oversight Board (United States) (PCAOB) and are required to be independent with respect to the Fund in accordance with the U.S. federal securities laws and the applicable rules and regulations of the Securities and Exchange Commission and the PCAOB.
We conducted our audits of these financial statements in accordance with the standards of the PCAOB. Those standards require that we plan and perform the audit to obtain reasonable assurance about whether the financial statements are free of material misstatement, whether due to error or fraud.
Our audits included performing procedures to assess the risks of material misstatement of the financial statements, whether due to error or fraud, and performing procedures that respond to those risks. Such procedures included examining, on a test basis, evidence regarding the amounts and disclosures in the financial statements. Our audits also included evaluating the accounting principles used and significant estimates made by management, as well as evaluating the overall presentation of the financial statements. Our procedures included confirmation of securities owned as of October 31, 2020 by correspondence with the custodian and brokers; when replies were not received from brokers, we performed other auditing procedures. We believe that our audits provide a reasonable basis for our opinion.
/s/ PricewaterhouseCoopers LLP
Boston, Massachusetts
December 14, 2020
We have served as the auditor of one or more investment companies in the Fidelity group of funds since 1932.
Trustees and Officers
The Trustees, Members of the Advisory Board (if any), and officers of the trust and fund, as applicable, are listed below. The Board of Trustees governs the fund and is responsible for protecting the interests of shareholders. The Trustees are experienced executives who meet periodically throughout the year to oversee the fund's activities, review contractual arrangements with companies that provide services to the fund, oversee management of the risks associated with such activities and contractual arrangements, and review the fund's performance. Except for Jonathan Chiel, each of the Trustees oversees 305 funds. Mr. Chiel oversees 176 funds.
The Trustees hold office without limit in time except that (a) any Trustee may resign; (b) any Trustee may be removed by written instrument, signed by at least two-thirds of the number of Trustees prior to such removal; (c) any Trustee who requests to be retired or who has become incapacitated by illness or injury may be retired by written instrument signed by a majority of the other Trustees; and (d) any Trustee may be removed at any special meeting of shareholders by a two-thirds vote of the outstanding voting securities of the trust. Each Trustee who is not an interested person (as defined in the 1940 Act) of the trust and the fund is referred to herein as an Independent Trustee. Each Independent Trustee shall retire not later than the last day of the calendar year in which his or her 75th birthday occurs. The Independent Trustees may waive this mandatory retirement age policy with respect to individual Trustees. Officers and Advisory Board Members hold office without limit in time, except that any officer or Advisory Board Member may resign or may be removed by a vote of a majority of the Trustees at any regular meeting or any special meeting of the Trustees. Except as indicated, each individual has held the office shown or other offices in the same company for the past five years.
The fund's Statement of Additional Information (SAI) includes more information about the Trustees. To request a free copy, call Fidelity at 1-800-544-8544 if you’re an individual investing directly with Fidelity, call 1-800-835-5092 if you’re a plan sponsor or participant with Fidelity as your recordkeeper or call 1-877-208-0098 on institutional accounts or if you’re an advisor or invest through one.
Experience, Skills, Attributes, and Qualifications of the Trustees. The Governance and Nominating Committee has adopted a statement of policy that describes the experience, qualifications, attributes, and skills that are necessary and desirable for potential Independent Trustee candidates (Statement of Policy). The Board believes that each Trustee satisfied at the time he or she was initially elected or appointed a Trustee, and continues to satisfy, the standards contemplated by the Statement of Policy. The Governance and Nominating Committee also engages professional search firms to help identify potential Independent Trustee candidates who have the experience, qualifications, attributes, and skills consistent with the Statement of Policy. From time to time, additional criteria based on the composition and skills of the current Independent Trustees, as well as experience or skills that may be appropriate in light of future changes to board composition, business conditions, and regulatory or other developments, have also been considered by the professional search firms and the Governance and Nominating Committee. In addition, the Board takes into account the Trustees' commitment and participation in Board and committee meetings, as well as their leadership of standing and ad hoc committees throughout their tenure.
In determining that a particular Trustee was and continues to be qualified to serve as a Trustee, the Board has considered a variety of criteria, none of which, in isolation, was controlling. The Board believes that, collectively, the Trustees have balanced and diverse experience, qualifications, attributes, and skills, which allow the Board to operate effectively in governing the fund and protecting the interests of shareholders. Information about the specific experience, skills, attributes, and qualifications of each Trustee, which in each case led to the Board's conclusion that the Trustee should serve (or continue to serve) as a trustee of the fund, is provided below.
Board Structure and Oversight Function. Robert A. Lawrence is an interested person and currently serves as Acting Chairman. The Trustees have determined that an interested Chairman is appropriate and benefits shareholders because an interested Chairman has a personal and professional stake in the quality and continuity of services provided to the fund. Independent Trustees exercise their informed business judgment to appoint an individual of their choosing to serve as Chairman, regardless of whether the Trustee happens to be independent or a member of management. The Independent Trustees have determined that they can act independently and effectively without having an Independent Trustee serve as Chairman and that a key structural component for assuring that they are in a position to do so is for the Independent Trustees to constitute a substantial majority for the Board. The Independent Trustees also regularly meet in executive session. Ned C. Lautenbach and David M. Thomas serve as Co-Lead Independent Trustees and as such each (i) acts as a liaison between the Independent Trustees and management with respect to matters important to the Independent Trustees and (ii) with management prepares agendas for Board meetings.
Fidelity® funds are overseen by different Boards of Trustees. The fund's Board oversees Fidelity's high income and certain equity funds, and other Boards oversee Fidelity's investment-grade bond, money market, asset allocation, and other equity funds. The asset allocation funds may invest in Fidelity® funds overseen by the fund's Board. The use of separate Boards, each with its own committee structure, allows the Trustees of each group of Fidelity® funds to focus on the unique issues of the funds they oversee, including common research, investment, and operational issues. On occasion, the separate Boards establish joint committees to address issues of overlapping consequences for the Fidelity® funds overseen by each Board.
The Trustees operate using a system of committees to facilitate the timely and efficient consideration of all matters of importance to the Trustees, the fund, and fund shareholders and to facilitate compliance with legal and regulatory requirements and oversight of the fund's activities and associated risks. The Board, acting through its committees, has charged FMR and its affiliates with (i) identifying events or circumstances the occurrence of which could have demonstrably adverse effects on the fund's business and/or reputation; (ii) implementing processes and controls to lessen the possibility that such events or circumstances occur or to mitigate the effects of such events or circumstances if they do occur; and (iii) creating and maintaining a system designed to evaluate continuously business and market conditions in order to facilitate the identification and implementation processes described in (i) and (ii) above. Because the day-to-day operations and activities of the fund are carried out by or through FMR, its affiliates, and other service providers, the fund's exposure to risks is mitigated but not eliminated by the processes overseen by the Trustees. While each of the Board's committees has responsibility for overseeing different aspects of the fund's activities, oversight is exercised primarily through the Operations, Audit, and Compliance Committees. Appropriate personnel, including but not limited to the fund's Chief Compliance Officer (CCO), FMR's internal auditor, the independent accountants, the fund's Treasurer and portfolio management personnel, make periodic reports to the Board's committees, as appropriate, including an annual review of Fidelity's risk management program for the Fidelity® funds. The responsibilities of each standing committee, including their oversight responsibilities, are described further under "Standing Committees of the Trustees."
Interested Trustees*:
Correspondence intended for a Trustee who is an interested person may be sent to Fidelity Investments, 245 Summer Street, Boston, Massachusetts 02210.
Name, Year of Birth; Principal Occupations and Other Relevant Experience+
Jonathan Chiel (1957)
Year of Election or Appointment: 2016
Trustee
Mr. Chiel also serves as Trustee of other Fidelity® funds. Mr. Chiel is Executive Vice President and General Counsel for FMR LLC (diversified financial services company, 2012-present). Previously, Mr. Chiel served as general counsel (2004-2012) and senior vice president and deputy general counsel (2000-2004) for John Hancock Financial Services; a partner with Choate, Hall & Stewart (1996-2000) (law firm); and an Assistant United States Attorney for the United States Attorney’s Office of the District of Massachusetts (1986-95), including Chief of the Criminal Division (1993-1995). Mr. Chiel is a director on the boards of the Boston Bar Foundation and the Maimonides School.
Robert A. Lawrence (1952)
Year of Election or Appointment: 2020
Trustee
Acting Chairman of the Board of Trustees
Mr. Lawrence also serves as Trustee of other funds. Previously, Mr. Lawrence served as a Member of the Advisory Board of certain funds. Prior to his retirement in 2008, Mr. Lawrence served as Vice President of certain Fidelity® funds (2006-2008), Senior Vice President, Head of High Income Division of Fidelity Management & Research Company (investment adviser firm, 2006-2008), and President of Fidelity Strategic Investments (investment adviser firm, 2002-2005).
* Determined to be an “Interested Trustee” by virtue of, among other things, his or her affiliation with the trust or various entities under common control with FMR.
+ The information includes the Trustee's principal occupation during the last five years and other information relating to the experience, attributes, and skills relevant to the Trustee's qualifications to serve as a Trustee, which led to the conclusion that the Trustee should serve as a Trustee for the fund.
Independent Trustees:
Correspondence intended for an Independent Trustee may be sent to Fidelity Investments, P.O. Box 55235, Boston, Massachusetts 02205-5235.
Name, Year of Birth; Principal Occupations and Other Relevant Experience+
Dennis J. Dirks (1948)
Year of Election or Appointment: 2005
Trustee
Mr. Dirks also serves as Trustee of other Fidelity® funds. Prior to his retirement in May 2003, Mr. Dirks served as Chief Operating Officer and as a member of the Board of The Depository Trust & Clearing Corporation (financial markets infrastructure), President, Chief Operating Officer and a member of the Board of The Depository Trust Company (DTC), President and a member of the Board of the National Securities Clearing Corporation (NSCC), Chief Executive Officer and a member of the Board of the Government Securities Clearing Corporation and Chief Executive Officer and a member of the Board of the Mortgage-Backed Securities Clearing Corporation. Mr. Dirks currently serves as a member of the Finance Committee (2016-present) and Board (2017-present) and is Treasurer (2018-present) of the Asolo Repertory Theatre.
Donald F. Donahue (1950)
Year of Election or Appointment: 2018
Trustee
Mr. Donahue also serves as Trustee of other Fidelity® funds. Mr. Donahue serves as President and Chief Executive Officer of Miranda Partners, LLC (risk consulting for the financial services industry, 2012-present). Previously, Mr. Donahue served as Chief Executive Officer (2006-2012), Chief Operating Officer (2003-2006) and Managing Director, Customer Marketing and Development (1999-2003) of The Depository Trust & Clearing Corporation (financial markets infrastructure). Mr. Donahue currently serves as a member (2007-present) and Co-Chairman (2016-present) of the Board of United Way of New York, a member of the Board of NYC Leadership Academy (2012-present) and a member of the Board of Advisors of Ripple Labs, Inc. (financial services, 2015-present). Mr. Donahue previously served as a member of the Advisory Board of certain Fidelity® funds (2015-2018).
Vicki L. Fuller (1957)
Year of Election or Appointment: 2020
Trustee
Ms. Fuller also serves as Trustee of other Fidelity® funds. Previously, Ms. Fuller served as a member of the Advisory Board of certain Fidelity® funds (2018-2020), Chief Investment Officer of the New York State Common Retirement Fund (2012-2018) and held a variety of positions at AllianceBernstein L.P. (global asset management, 1985-2012), including Managing Director (2006-2012) and Senior Vice President and Senior Portfolio Manager (2001-2006). Ms. Fuller currently serves as a member of the Board, Audit Committee and Nominating and Governance Committee of The Williams Companies, Inc. (natural gas infrastructure, 2018-present), as a member of the Board, Audit Committee and Nominating and Governance Committee of two Blackstone business development companies (2020-present) and as a member of the Board of Treliant, LLC (consulting, 2019-present).
Patricia L. Kampling (1959)
Year of Election or Appointment: 2020
Trustee
Ms. Kampling also serves as Trustee of other Fidelity® funds. Prior to her retirement, Ms. Kampling served as Chairman of the Board and Chief Executive Officer (2012-2019), President and Chief Operating Officer (2011-2012) and Executive Vice President and Chief Financial Officer (2010-2011) of Alliant Energy Corporation. Ms. Kampling currently serves as a member of the Board, Compensation Committee and Executive Committee and as Chair of the Audit Committee of Briggs & Stratton Corporation (manufacturing, 2011-present) and as a member of the Board, Audit, Finance and Risk Committee and Safety, Environmental, Technology and Operations Committee of American Water Works Company, Inc. (utilities company, 2019-present). In addition, Ms. Kampling currently serves as a member of the Board of the Nature Conservancy, Wisconsin Chapter (2019-present). Previously, Ms. Kampling served as a Member of the Advisory Board of certain Fidelity® funds (2020), a member of the Board of Interstate Power and Light Company (2012-2019) and Wisconsin Power and Light Company (2012-2019) (each a subsidiary of Alliant Energy Corporation) and as a member of the Board and Workforce Development Committee of the Business Roundtable (2018-2019).
Alan J. Lacy (1953)
Year of Election or Appointment: 2008
Trustee
Mr. Lacy also serves as Trustee of other Fidelity® funds. Previously, Mr. Lacy served as Senior Adviser (2007-2014) of Oak Hill Capital Partners, L.P. (private equity), Chief Executive Officer (2005) and Vice Chairman (2005-2006) of Sears Holdings Corporation (retail), Chief Executive Officer and Chairman of the Board of Sears, Roebuck and Co. (retail, 2000-2005), Chairman (2014-2017) and a member of the Board (2010-2017) of Dave & Buster’s Entertainment, Inc. (restaurant and entertainment complexes) and a member of the Board of Bristol-Myers Squibb Company (global pharmaceuticals, 2008-2020). Mr. Lacy currently serves as a Trustee of the California Chapter of The Nature Conservancy (2015-present) and a member of the Board of the Center for Advanced Study in the Behavioral Sciences at Stanford University (2015-present).
Ned C. Lautenbach (1944)
Year of Election or Appointment: 2000
Trustee
Co-Lead Independent Trustee
Mr. Lautenbach also serves as Trustee of other Fidelity® funds. Mr. Lautenbach currently serves as Chair of the Board of Governors, State University System of Florida (2013-present) and is a member of the Council on Foreign Relations (1994-present). He is also a member and has in the past served as Chairman of the Board of Directors of Artis-Naples (2012-present). Previously, Mr. Lautenbach served as a member and then Lead Director of the Board of Directors of Eaton Corporation (diversified industrial, 1997-2016). He was also a Partner at Clayton, Dubilier & Rice, LLC (private equity investment, 1998-2010); as well as Director of Sony Corporation (2006-2007). In addition, Mr. Lautenbach had a 30-year career with IBM (technology company), during which time he served as Senior Vice President and as a member of the Corporate Executive Committee (1968-1998).
Joseph Mauriello (1944)
Year of Election or Appointment: 2008
Trustee
Mr. Mauriello also serves as Trustee of other Fidelity® funds. Prior to his retirement in January 2006, Mr. Mauriello served in numerous senior management positions including Deputy Chairman and Chief Operating Officer (2004-2005), and Vice Chairman of Financial Services (2002-2004) of KPMG LLP US (professional services, 1965-2005). Mr. Mauriello currently serves as a member of the Independent Directors Council Governing Council (2015-present). Previously, Mr. Mauriello served as a member of the Board of XL Group plc. (global insurance and re-insurance, 2006-2018).
Cornelia M. Small (1944)
Year of Election or Appointment: 2005
Trustee
Ms. Small also serves as Trustee of other Fidelity® funds. Previously, Ms. Small served as Chief Investment Officer, Director of Global Equity Investments and a member of Scudder, Stevens & Clark and Scudder Kemper Investments. Ms. Small previously served as a member of the Board (2009-2019) and Chair of the Investment Committee (2010-2019) of the Teagle Foundation and a member of the Investment Committee of the Berkshire Taconic Community Foundation (2008-2019).
Garnett A. Smith (1947)
Year of Election or Appointment: 2018
Trustee
Mr. Smith also serves as Trustee of other Fidelity® funds. Prior to his retirement, Mr. Smith served as Chairman and Chief Executive Officer (1990-1997) and President (1986-1990) of Inbrand Corp. (manufacturer of personal absorbent products). Prior to his employment with Inbrand Corp., he was employed by a retail fabric chain and North Carolina National Bank (now Bank of America). Mr. Smith previously served as a member of the Advisory Board of certain Fidelity® funds (2012-2013).
David M. Thomas (1949)
Year of Election or Appointment: 2008
Trustee
Co-Lead Independent Trustee
Mr. Thomas also serves as Trustee of other Fidelity® funds. Previously, Mr. Thomas served as Executive Chairman (2005-2006) and Chairman and Chief Executive Officer (2000-2005) of IMS Health, Inc. (pharmaceutical and healthcare information solutions). Mr. Thomas currently serves as Non-Executive Chairman of the Board of Fortune Brands Home and Security (home and security products, 2011-present), and a member of the Board (2004-present) and Presiding Director (2013-present) of Interpublic Group of Companies, Inc. (marketing communication).
Susan Tomasky (1953)
Year of Election or Appointment: 2020
Trustee
Ms. Tomasky also serves as Trustee of other Fidelity® funds. Prior to her retirement, Ms. Tomasky served in various executive officer positions at American Electric Power Company, Inc. (1998-2011), including most recently as President of AEP Transmission (2007-2011). Ms. Tomasky currently serves as a member of the Board and Sustainability Committee and as Chair of the Audit Committee of Marathon Petroleum Corporation (2018-present) and as a member of the Board, Corporate Governance Committee and Organization and Compensation Committee and as Chair of the Audit Committee of Public Service Enterprise Group, Inc. (utilities company, 2012-present). In addition, Ms. Tomasky currently serves as a member of the Board of the Columbus Regional Airport Authority (2007-present), as a member of the Board of the Royal Shakespeare Company – America (2009-present), as a member of the Board of the Columbus Association for the Performing Arts (2011-present) and as a member of the Board of Kenyon College (2016-present). Previously, Ms. Tomasky served as a Member of the Advisory Board of certain Fidelity® funds (2020), a member of the Board (2011-2019) and as Lead Independent Director (2015-2018) of Andeavor Corporation (previously Tesoro Corporation) (independent oil refiner and marketer) and as a member of the Board of Summit Midstream Partners LP (energy, 2012-2018).
Michael E. Wiley (1950)
Year of Election or Appointment: 2020
Trustee
Mr. Wiley also serves as Trustee of other Fidelity® funds. Previously, Mr. Wiley served as a member of the Advisory Board of certain Fidelity® funds (2018-2020), Chairman, President and CEO of Baker Hughes, Inc. (oilfield services, 2000-2004). Mr. Wiley also previously served as a member of the Board of Andeavor Corporation (independent oil refiner and marketer, 2005-2018), a member of the Board of Andeavor Logistics LP (natural resources logistics, 2015-2018) and a member of the Board of High Point Resources (exploration and production, 2005-2020).
+ The information includes the Trustee's principal occupation during the last five years and other information relating to the experience, attributes, and skills relevant to the Trustee's qualifications to serve as a Trustee, which led to the conclusion that the Trustee should serve as a Trustee for the fund.
Advisory Board Members and Officers:
Correspondence intended for a Member of the Advisory Board (if any) may be sent to Fidelity Investments, P.O. Box 55235, Boston, Massachusetts 02205-5235. Correspondence intended for an officer or Peter S. Lynch may be sent to Fidelity Investments, 245 Summer Street, Boston, Massachusetts 02210. Officers appear below in alphabetical order.
Name, Year of Birth; Principal Occupation
Lloyd James Austin, III (1953)
Year of Election or Appointment: 2020
Member of the Advisory Board
General Austin also serves as a Member of the Advisory Board of other Fidelity® funds. Prior to his retirement, General Austin (United States Army, Retired) held a variety of positions within the U.S. Government, including Commander, U.S. Central Command (2013-2016), Vice Chief of Staff, U.S. Army (2012-2013) and Commanding General, U.S. Forces – Iraq, Operation New Dawn (2010-2012). General Austin currently serves as a Partner of Pine Island Capital Partners (private equity, 2020-present) and as President of the Austin Strategy Group LLC (consulting, 2016-present). General Austin serves as a member of the Board of Directors of Nucor Corporation (steel products, 2017-present), as a member of the Board of Directors of Tenet Healthcare Corporation (2018-present) and as a member of the Board of Directors of Raytheon Technologies Corporation (aerospace and defense, 2020-present). In addition, General Austin currently serves as a member of the Board of Trustees of the Carnegie Corporation of New York (2017-present) and as a member of the Board of Trustees of Auburn University (2017-present). Previously, General Austin served as a member of the Board of Directors of United Technologies Corporation (aerospace, defense and building, 2016-2020).
Thomas A. Kennedy (1955)
Year of Election or Appointment: 2020
Member of the Advisory Board
Mr. Kennedy also serves as a Member of the Advisory Board of other Fidelity® funds. Previously, Mr. Kennedy held a variety of positions at Raytheon Company (aerospace and defense, 1983-2020), including Chairman and Chief Executive Officer (2014-2020) and Executive Vice President and Chief Operating Officer (2013-2014). Mr. Kennedy currently serves as Executive Chairman of the Board of Directors of Raytheon Technologies Corporation (aerospace and defense, 2020-present). He is also a member of the Rutgers School of Engineering Industry Advisory Board (2011-present) and a member of the UCLA Engineering Dean’s Executive Board (2016-present).
Peter S. Lynch (1944)
Year of Election or Appointment: 2003
Member of the Advisory Board
Mr. Lynch also serves as a Member of the Advisory Board of other Fidelity® funds. Mr. Lynch is Vice Chairman and a Director of Fidelity Management & Research Company LLC (investment adviser firm). In addition, Mr. Lynch serves as a Trustee of Boston College and as the Chairman of the Inner-City Scholarship Fund. Previously, Mr. Lynch served as Vice Chairman and a Director of FMR Co., Inc. (investment adviser firm) and on the Special Olympics International Board of Directors (1997-2006).
Elizabeth Paige Baumann (1968)
Year of Election or Appointment: 2017
Anti-Money Laundering (AML) Officer
Ms. Baumann also serves as AML Officer of other funds. She is Chief AML Officer (2012-present) and Senior Vice President (2014-present) of FMR LLC (diversified financial services company) and is an employee of Fidelity Investments. Previously, Ms. Baumann served as AML Officer of certain funds (2017-2019), as AML Officer of the funds (2012-2016), and Vice President (2007-2014) and Deputy Anti-Money Laundering Officer (2007-2012) of FMR LLC.
Craig S. Brown (1977)
Year of Election or Appointment: 2019
Assistant Treasurer
Mr. Brown also serves as Assistant Treasurer of other funds. Mr. Brown is an employee of Fidelity Investments (2013-present).
John J. Burke III (1964)
Year of Election or Appointment: 2018
Chief Financial Officer
Mr. Burke also serves as Chief Financial Officer of other funds. Mr. Burke serves as Head of Investment Operations for Fidelity Fund and Investment Operations (2018-present) and is an employee of Fidelity Investments (1998-present). Previously Mr. Burke served as head of Asset Management Investment Operations (2012-2018).
William C. Coffey (1969)
Year of Election or Appointment: 2019
Assistant Secretary
Mr. Coffey also serves as Assistant Secretary of other funds. He is Senior Vice President and Deputy General Counsel of FMR LLC (diversified financial services company, 2010-present), and is an employee of Fidelity Investments. Previously, Mr. Coffey served as Secretary and CLO of certain funds (2018-2019); CLO, Secretary, and Senior Vice President of Fidelity Management & Research Company and FMR Co., Inc. (investment adviser firms, 2018-2019); Secretary of Fidelity SelectCo, LLC and Fidelity Investments Money Management, Inc. (investment adviser firms, 2018-2019); CLO of Fidelity Management & Research (Hong Kong) Limited, FMR Investment Management (UK) Limited, and Fidelity Management & Research (Japan) Limited (investment adviser firms, 2018-2019); and Assistant Secretary of certain funds (2009-2018).
Timothy M. Cohen (1969)
Year of Election or Appointment: 2018
Vice President
Mr. Cohen also serves as Vice President of other funds. Mr. Cohen serves as Co-Head of Equity (2018-present), a Director of Fidelity Management & Research (Japan) Limited (investment adviser firm, 2016-present), and is an employee of Fidelity Investments. Previously, Mr. Cohen served as Executive Vice President of Fidelity SelectCo, LLC (2019), Head of Global Equity Research (2016-2018), Chief Investment Officer - Equity and a Director of Fidelity Management & Research (U.K.) Inc. (investment adviser firm, 2013-2015) and as a Director of Fidelity Management & Research (Hong Kong) Limited (investment adviser firm, 2017).
Jonathan Davis (1968)
Year of Election or Appointment: 2010
Assistant Treasurer
Mr. Davis also serves as Assistant Treasurer of other funds. Mr. Davis serves as Assistant Treasurer of FMR Capital, Inc. (2017-present) and is an employee of Fidelity Investments. Previously, Mr. Davis served as Vice President and Associate General Counsel of FMR LLC (diversified financial services company, 2003-2010).
Laura M. Del Prato (1964)
Year of Election or Appointment: 2018
Assistant Treasurer
Ms. Del Prato also serves as an officer of other funds. Ms. Del Prato is an employee of Fidelity Investments (2017-present). Previously, Ms. Del Prato served as President and Treasurer of The North Carolina Capital Management Trust: Cash Portfolio and Term Portfolio (2018-2020). Prior to joining Fidelity Investments, Ms. Del Prato served as a Managing Director and Treasurer of the JPMorgan Mutual Funds (2014-2017). Prior to JPMorgan, Ms. Del Prato served as a partner at Cohen Fund Audit Services (accounting firm, 2012-2013) and KPMG LLP (accounting firm, 2004-2012).
Colm A. Hogan (1973)
Year of Election or Appointment: 2020
Assistant Treasurer
Mr. Hogan also serves as an officer of other funds. Mr. Hogan serves as Assistant Treasurer of FMR Capital, Inc. (2017-present) and is an employee of Fidelity Investments (2005-present). Previously, Mr. Hogan served as Deputy Treasurer of certain Fidelity® funds (2016-2020) and Assistant Treasurer of certain Fidelity® funds (2016-2018).
Pamela R. Holding (1964)
Year of Election or Appointment: 2018
Vice President
Ms. Holding also serves as Vice President of other funds. Ms. Holding serves as Co-Head of Equity (2018-present) and is an employee of Fidelity Investments (2013-present). Previously, Ms. Holding served as Executive Vice President of Fidelity SelectCo, LLC (2019) and as Chief Investment Officer of Fidelity Institutional Asset Management (2013-2018).
Cynthia Lo Bessette (1969)
Year of Election or Appointment: 2019
Secretary and Chief Legal Officer (CLO)
Ms. Lo Bessette also serves as an officer of other funds. Ms. Lo Bessette serves as CLO, Secretary, and Senior Vice President of Fidelity Management & Research Company LLC (investment adviser firm, 2019-present); and CLO of Fidelity Management & Research (Hong Kong) Limited, FMR Investment Management (UK) Limited, and Fidelity Management & Research (Japan) Limited (investment adviser firms, 2019-present). She is a Senior Vice President and Deputy General Counsel of FMR LLC (diversified financial services company, 2019-present), and is an employee of Fidelity Investments. Previously, Ms. Lo Bessette served as CLO, Secretary, and Senior Vice President of FMR Co., Inc. (investment adviser firm, 2019); Secretary of Fidelity SelectCo, LLC and Fidelity Investments Money Management, Inc. (investment adviser firms, 2019). Prior to joining Fidelity Investments, Ms. Lo Bessette was Executive Vice President, General Counsel (2016-2019) and Senior Vice President, Deputy General Counsel (2015-2016) of OppenheimerFunds (investment management company) and Deputy Chief Legal Officer (2013-2015) of Jennison Associates LLC (investment adviser firm).
Chris Maher (1972)
Year of Election or Appointment: 2020
Deputy Treasurer
Mr. Maher also serves as an officer of other funds. Mr. Maher serves as Assistant Treasurer of FMR Capital, Inc. (2017-present), and is an employee of Fidelity Investments (2008-present). Previously, Mr. Maher served as Assistant Treasurer of certain funds (2013-2020); Vice President of Asset Management Compliance (2013), Vice President of the Program Management Group of FMR (investment adviser firm, 2010-2013), and Vice President of Valuation Oversight (2008-2010).
Jason P. Pogorelec (1975)
Year of Election or Appointment: 2020
Chief Compliance Officer
Mr. Pogorelec also serves as Chief Compliance Officer of other funds. Mr. Pogorelec is a senior Vice President of Asset Management Compliance for Fidelity Investments and is an employee of Fidelity Investments (2006-present). Previously, Mr. Pogorelec served as Vice President, Associate General Counsel for Fidelity Investments (2010-2020) and Assistant Secretary of certain Fidelity funds (2015-2020).
Stacie M. Smith (1974)
Year of Election or Appointment: 2016
President and Treasurer
Ms. Smith also serves as an officer of other funds. Ms. Smith serves as Assistant Treasurer of FMR Capital, Inc. (2017-present), is an employee of Fidelity Investments (2009-present), and has served in other fund officer roles. Prior to joining Fidelity Investments, Ms. Smith served as Senior Audit Manager of Ernst & Young LLP (accounting firm, 1996-2009). Previously, Ms. Smith served as Assistant Treasurer (2013-2019) and Deputy Treasurer (2013-2016) of certain Fidelity® funds.
Marc L. Spector (1972)
Year of Election or Appointment: 2016
Assistant Treasurer
Mr. Spector also serves as an officer of other funds. Mr. Spector serves as Assistant Treasurer of FMR Capital, Inc. (2017-present) and is an employee of Fidelity Investments (2016-present). Prior to joining Fidelity Investments, Mr. Spector served as Director at the Siegfried Group (accounting firm, 2013-2016), and prior to Siegfried Group as audit senior manager at Deloitte & Touche LLP (accounting firm, 2005-2013).
Jim Wegmann (1979)
Year of Election or Appointment: 2019
Assistant Treasurer
Mr. Wegmann also serves as Assistant Treasurer of other funds. Mr. Wegmann is an employee of Fidelity Investments (2011-present).
Shareholder Expense Example
As a shareholder, you incur two types of costs: (1) transaction costs, which may include sales charges (loads) on purchase payments or redemption proceeds, as applicable and (2) ongoing costs, which generally include management fees, distribution and/or service (12b-1) fees and other Fund expenses. This Example is intended to help you understand your ongoing costs (in dollars) of investing in a fund and to compare these costs with the ongoing costs of investing in other mutual funds.
The Example is based on an investment of $1,000 invested at the beginning of the period and held for the entire period (May 1, 2020 to October 31, 2020).
Actual Expenses
The first line of the accompanying table provides information about actual account values and actual expenses. You may use the information in this line, together with the amount you invested, to estimate the expenses that you paid over the period. Simply divide your account value by $1,000.00 (for example, an $8,600 account value divided by $1,000.00 = 8.6), then multiply the result by the number in the first line for a class/Fund under the heading entitled "Expenses Paid During Period" to estimate the expenses you paid on your account during this period. If any fund is a shareholder of any underlying mutual funds or exchange-traded funds (ETFs) (the Underlying Funds), such fund indirectly bears its proportional share of the expenses of the Underlying Funds in addition to the direct expenses incurred presented in the table. These fees and expenses are not included in the annualized expense ratio used to calculate the expense estimate in the table below.
Hypothetical Example for Comparison Purposes
The second line of the accompanying table provides information about hypothetical account values and hypothetical expenses based on the actual expense ratio and an assumed rate of return of 5% per year before expenses, which is not the actual return. The hypothetical account values and expenses may not be used to estimate the actual ending account balance or expenses you paid for the period. You may use this information to compare the ongoing costs of investing in the Fund and other funds. To do so, compare this 5% hypothetical example with the 5% hypothetical examples that appear in the shareholder reports of the other funds. If any fund is a shareholder of any Underlying Funds, such fund indirectly bears its proportional share of the expenses of the Underlying Funds in addition to the direct expenses as presented in the table. These fees and expenses are not included in the annualized expense ratio used to calculate the expense estimate in the table below.
Please note that the expenses shown in the table are meant to highlight your ongoing costs only and do not reflect any transaction costs. Therefore, the second line of the table is useful in comparing ongoing costs only, and will not help you determine the relative total costs of owning different funds. In addition, if these transactional costs were included, your costs would have been higher.
| | Annualized Expense Ratio-A | Beginning
Account Value
May 1, 2020 | Ending
Account Value
October 31, 2020 | Expenses Paid
During Period-B
May 1, 2020
to October 31, 2020 |
| Fidelity Global Commodity Stock Fund | | | | |
| Class A | 1.29% | | | |
| Actual | | $1,000.00 | $1,097.60 | $6.80 |
| Hypothetical-C | | $1,000.00 | $1,018.65 | $6.55 |
| Class M | 1.57% | | | |
| Actual | | $1,000.00 | $1,095.50 | $8.27 |
| Hypothetical-C | | $1,000.00 | $1,017.24 | $7.96 |
| Class C | 2.03% | | | |
| Actual | | $1,000.00 | $1,093.10 | $10.68 |
| Hypothetical-C | | $1,000.00 | $1,014.93 | $10.28 |
| Global Commodity Stock | .99% | | | |
| Actual | | $1,000.00 | $1,098.50 | $5.22 |
| Hypothetical-C | | $1,000.00 | $1,020.16 | $5.03 |
| Class I | .90% | | | |
| Actual | | $1,000.00 | $1,099.70 | $4.75 |
| Hypothetical-C | | $1,000.00 | $1,020.61 | $4.57 |
| Class Z | .74% | | | |
| Actual | | $1,000.00 | $1,100.80 | $3.91 |
| Hypothetical-C | | $1,000.00 | $1,021.42 | $3.76 |
A Annualized expense ratio reflects expenses net of applicable fee waivers.
B Expenses are equal to the annualized expense ratio, multiplied by the average account value over the period, multiplied by 184/ 366 (to reflect the one-half year period). The fees and expenses of any Underlying Funds are not included in each annualized expense ratio.
C 5% return per year before expenses
Distributions (Unaudited)
Class A designates 34%; Class M designates 38%; Class C designates 48%; Global Commodity Stock designates 32%; Class I designates 30%; and Class Z designates 29% of the dividends distributed during the fiscal year as qualifying for the dividends–received deduction for corporate shareholders.
Class A, Class M, Class C, Global Commodity Stock, Class I, and Class Z designate 100% of the dividends distributed during the fiscal year as amounts which may be taken into account as a dividend for purposes of the maximum rate under section 1(h)(11) of the Internal Revenue Code.
The amounts per share which represent income derived from sources within, and taxes paid to, foreign countries or possessions of the United States are as follows:
| | Pay Date | Income | Taxes |
| Fidelity Global Commodity Stock Fund | | | |
| Class A | 12/9/19 | $0.3833 | $0.0213 |
| Class M | 12/9/19 | $0.3414 | $0.0213 |
| Class C | 12/9/19 | $0.2676 | $0.0213 |
| Global Commodity Stock | 12/9/19 | $0.4013 | $0.0213 |
| Class I | 12/9/19 | $0.4302 | $0.0213 |
| Class Z | 12/9/19 | $0.4462 | $0.0213 |
|
The fund will notify shareholders in January 2021 of amounts for use in preparing 2020 income tax returns.
Proxy Voting Results
A special meeting of shareholders was held on June 9, 2020. The results of votes taken among shareholders on the proposals before them are reported below. Each vote reported represents one dollar of net asset value held on the record date for the meeting.
PROPOSAL 1
To elect a Board of Trustees.
| | # of
Votes | % of
Votes |
| Dennis J. Dirks |
| Affirmative | 91,643,443,973.030 | 98.167 |
| Withheld | 1,711,119,384.419 | 1.833 |
| TOTAL | 93,354,563,357.449 | 100.000 |
| Donald F. Donahue |
| Affirmative | 91,659,003,496.045 | 98.184 |
| Withheld | 1,695,559,852.789 | 1.816 |
| TOTAL | 93,354,563,357.449 | 100.000 |
| Bettina Doulton |
| Affirmative | 91,774,146,516.145 | 98.307 |
| Withheld | 1,580,416,862.377 | 1.693 |
| TOTAL | 93,354,563,357.449 | 100.000 |
| Vicki L. Fuller |
| Affirmative | 91,845,419,368.993 | 98.383 |
| Withheld | 1,509,143,998.591 | 1.617 |
| TOTAL | 93,354,563,357.449 | 100.00 |
| Patricia L. Kampling |
| Affirmative | 91,723,732,274.457 | 98.253 |
| Withheld | 1,630,831,098.411 | 1.747 |
| TOTAL | 93,354,563,357.449 | 100.000 |
| Alan J. Lacy |
| Affirmative | 91,490,319,407.772 | 98.003 |
| Withheld | 1,864,243,948.299 | 1.997 |
| TOTAL | 93,354,563,357.449 | 100.000 |
| Ned C. Lautenbach |
| Affirmative | 91,285,367,239.075 | 97.784 |
| Withheld | 2,069,196,119.052 | 2.216 |
| TOTAL | 93,354,563,357.449 | 100.000 |
| Robert A. Lawrence |
| Affirmative | 91,556,271,429.466 | 98.074 |
| Withheld | 1,798,291,912.707 | 1.926 |
| TOTAL | 93,354,563,357.449 | 100.000 |
| Joseph Mauriello |
| Affirmative | 91,497,480,147.082 | 98.011 |
| Withheld | 1,857,083,211.045 | 1.989 |
| TOTAL | 93,354,563,357.449 | 100.000 |
| Cornelia M. Small |
| Affirmative | 91,606,808,161.438 | 98.128 |
| Withheld | 1,747,755,220.497 | 1.872 |
| TOTAL | 93,354,563,357.449 | 100.000 |
| Garnett A. Smith |
| Affirmative | 91,505,784,053.038 | 98.020 |
| Withheld | 1,848,779,305.090 | 1.980 |
| TOTAL | 93,354,563,357.449 | 100.000 |
| David M. Thomas |
| Affirmative | 91,536,969,704.881 | 98.053 |
| Withheld | 1,817,593,630.919 | 1.947 |
| TOTAL | 93,354,563,357.449 | 100.000 |
| Susan Tomasky |
| Affirmative | 91,697,125,678.165 | 98.225 |
| Withheld | 1,657,437,703.277 | 1.775 |
| TOTAL | 93,354,563,357.449 | 100.000 |
| Michael E. Wiley |
| Affirmative | 91,506,805,575.815 | 98.021 |
| Withheld | 1,847,757,759.985 | 1.979 |
| TOTAL | 93,354,563,357.449 | 100.000 |
PROPOSAL 2
To convert a fundamental investment policy to a non-fundamental investment policy.
| | # of
Votes | % of
Votes |
| Affirmative | 114,665,384.700 | 67.713 |
| Against | 11,806,122.628 | 6.972 |
| Abstain | 11,725,933.176 | 6.925 |
| Broker Non-Vote | 31,142,339.050 | 18.390 |
| TOTAL | 169,339,779.553 | 100.000 |
|
| Proposal 1 reflects trust wide proposal and voting results. |
GCS-ANN-1220
1.879380.111
Fidelity® Total International Equity Fund
Annual Report
October 31, 2020
Includes Fidelity and Fidelity Advisor share classes
See the inside front cover for important information about access to your fund’s shareholder reports.
Beginning on January 1, 2021, as permitted by regulations adopted by the Securities and Exchange Commission, paper copies of a fund’s shareholder reports will no longer be sent by mail, unless you specifically request paper copies of the reports from the fund or from your financial intermediary, such as a financial advisor, broker-dealer or bank. Instead, the reports will be made available on a website, and you will be notified by mail each time a report is posted and provided with a website link to access the report.
If you already elected to receive shareholder reports electronically, you will not be affected by this change and you need not take any action. You may elect to receive shareholder reports and other communications from a fund electronically, by contacting your financial intermediary. For Fidelity customers, visit Fidelity's web site or call Fidelity using the contact information listed below.
You may elect to receive all future reports in paper free of charge. If you wish to continue receiving paper copies of your shareholder reports, you may contact your financial intermediary or, if you are a Fidelity customer, visit Fidelity’s website, or call Fidelity at the applicable toll-free number listed below. Your election to receive reports in paper will apply to all funds held with the fund complex/your financial intermediary.
| Account Type | Website | Phone Number |
| Brokerage, Mutual Fund, or Annuity Contracts: | fidelity.com/mailpreferences | 1-800-343-3548 |
| Employer Provided Retirement Accounts: | netbenefits.fidelity.com/preferences (choose 'no' under Required Disclosures to continue to print) | 1-800-343-0860 |
| Advisor Sold Accounts Serviced Through Your Financial Intermediary: | Contact Your Financial Intermediary | Your Financial Intermediary's phone number |
| Advisor Sold Accounts Serviced by Fidelity: | institutional.fidelity.com | 1-877-208-0098 |
Contents
To view a fund's proxy voting guidelines and proxy voting record for the 12-month period ended June 30, visit http://www.fidelity.com/proxyvotingresults or visit the Securities and Exchange Commission's (SEC) web site at http://www.sec.gov.
You may also call 1-800-544-8544 if you’re an individual investing directly with Fidelity, call 1-800-835-5092 if you’re a plan sponsor or participant with Fidelity as your recordkeeper or call 1-877-208-0098 on institutional accounts or if you’re an advisor or invest through one to request a free copy of the proxy voting guidelines.
Standard & Poor's, S&P and S&P 500 are registered service marks of The McGraw-Hill Companies, Inc. and have been licensed for use by Fidelity Distributors Corporation.
Other third-party marks appearing herein are the property of their respective owners.
All other marks appearing herein are registered or unregistered trademarks or service marks of FMR LLC or an affiliated company. © 2020 FMR LLC. All rights reserved.
This report and the financial statements contained herein are submitted for the general information of the shareholders of the Fund. This report is not authorized for distribution to prospective investors in the Fund unless preceded or accompanied by an effective prospectus.
A fund files its complete schedule of portfolio holdings with the SEC for the first and third quarters of each fiscal year on Form N-PORT. Forms N-PORT are available on the SEC’s web site at http://www.sec.gov. A fund's Forms N-PORT may be reviewed and copied at the SEC’s Public Reference Room in Washington, DC. Information regarding the operation of the SEC's Public Reference Room may be obtained by calling 1-800-SEC-0330.
For a complete list of a fund's portfolio holdings, view the most recent holdings listing, semiannual report, or annual report on Fidelity's web site at http://www.fidelity.com, http://www.institutional.fidelity.com, or http://www.401k.com, as applicable.
NOT FDIC INSURED •MAY LOSE VALUE •NO BANK GUARANTEE
Neither the Fund nor Fidelity Distributors Corporation is a bank.
Note to Shareholders:
Early in 2020, the outbreak and spread of a new coronavirus emerged as a public health emergency that had a major influence on financial markets, primarily based on its impact on the global economy and the outlook for corporate earnings. The virus causes a respiratory disease known as COVID-19. On March 11, the World Health Organization declared the COVID-19 outbreak a pandemic, citing sustained risk of further global spread.
In the weeks following, as the crisis worsened, we witnessed an escalating human tragedy with wide-scale social and economic consequences from coronavirus-containment measures. The outbreak of COVID-19 prompted a number of measures to limit the spread, including travel and border restrictions, quarantines, and restrictions on large gatherings. In turn, these resulted in lower consumer activity, diminished demand for a wide range of products and services, disruption in manufacturing and supply chains, and – given the wide variability in outcomes regarding the outbreak – significant market uncertainty and volatility. Amid the turmoil, global governments and central banks took unprecedented action to help support consumers, businesses, and the broader economies, and to limit disruption to financial systems.
The situation continues to unfold, and the extent and duration of its impact on financial markets and the economy remain highly uncertain. Extreme events such as the coronavirus crisis are “exogenous shocks” that can have significant adverse effects on mutual funds and their investments. Although multiple asset classes may be affected by market disruption, the duration and impact may not be the same for all types of assets.
Fidelity is committed to helping you stay informed amid news about COVID-19 and during increased market volatility, and we’re taking extra steps to be responsive to customer needs. We encourage you to visit our websites, where we offer ongoing updates, commentary, and analysis on the markets and our funds.
Performance: The Bottom Line
Average annual total return reflects the change in the value of an investment, assuming reinvestment of distributions from dividend income and capital gains (the profits earned upon the sale of securities that have grown in value, if any) and assuming a constant rate of performance each year. The hypothetical investment and the average annual total returns do not reflect the deduction of taxes that a shareholder would pay on fund distributions or the redemption of fund shares. During periods of reimbursement by Fidelity, a fund’s total return will be greater than it would be had the reimbursement not occurred. How a fund did yesterday is no guarantee of how it will do tomorrow.
Average Annual Total Returns
| For the periods ended October 31, 2020 | Past 1 year | Past 5 years | Past 10 years |
| Class A (incl. 5.75% sales charge) | (1.69)% | 4.72% | 4.26% |
| Class M (incl. 3.50% sales charge) | 0.49% | 4.99% | 4.26% |
| Class C (incl. contingent deferred sales charge) | 2.62% | 5.19% | 4.10% |
| Fidelity® Total International Equity Fund | 4.65% | 6.25% | 5.19% |
| Class I | 4.50% | 6.26% | 5.15% |
| Class Z | 4.74% | 6.39% | 5.22% |
Class C shares' contingent deferred sales charges included in the past one year, past five years, and life of fund total return figures are 1%, 0%, and 0%, respectively.
The initial offering of Class Z shares took place on February 1, 2017. Returns prior to February 1, 2017, are those of Class I.
$10,000 Over 10 Years
Let's say hypothetically that $10,000 was invested in Fidelity® Total International Equity Fund, a class of the fund, on October 31, 2010.
The chart shows how the value of your investment would have changed, and also shows how the MSCI ACWI (All Country World Index) ex USA Index performed over the same period.
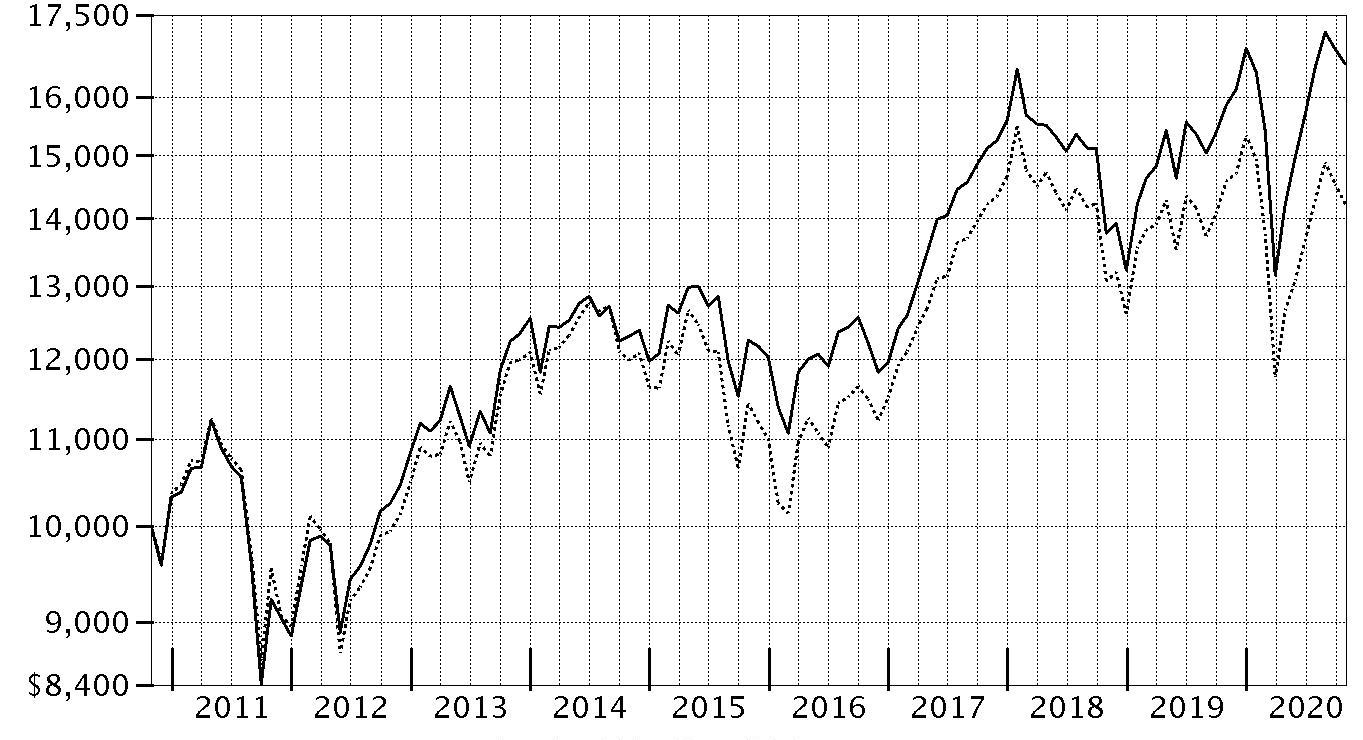
| Period Ending Values |
| $16,587 | Fidelity® Total International Equity Fund |
| $14,220 | MSCI ACWI (All Country World Index) ex USA Index |
Management's Discussion of Fund Performance
Market Recap: The MSCI ACWI (All Country World Index) ex USA Index returned -2.46% for the 12 months ending October 31, 2020, in what was a bumpy ride for non-U.S. equities, marked by a steep but brief decline due to the early-2020 outbreak and spread of the coronavirus, followed by a sharp upturn. Declared a pandemic on March 11, the crisis and containment efforts caused broad contraction in economic activity, elevated volatility and dislocation in financial markets. A historically rapid and expansive monetary- and fiscal-policy response around the world provided a partial offset to the economic disruption. Other supporting factors included resilient corporate earnings and near-term potential for a COVID-19 vaccine breakthrough. This was evident in the index’s 12.28% gain in the final six months of the year. Currency fluctuation generally boosted foreign developed-markets equities for the year, while the reverse was true for emerging-markets stocks. Late in the period, the index was pressured by a second wave of COVID-19 cases in some regions, and stretched valuations and crowded positioning in big tech. For the full year, the U.K. (-22%), Asia Pacific ex Japan (-8%), Canada (-5%) and Europe ex U.K. (-4%) notably lagged. Emerging markets (+9%) and Japan (+1%) outperformed. By sector, energy (-38%), financials and real estate (-20% each) lagged, whereas information technology (+ 25%) and communication services (+15%) topped the index.
Comments from Co-Managers Sam Polyak, Jed Weiss, and Alex Zavratsky: For the fiscal year ending October 31, 2020, the fund's share classes (excluding sales charges, if applicable) gained roughly 4% to 5%, outperforming the -2.46% result of the benchmark MSCI All Country World ex US Index (Net MA). From a regional standpoint, an underweighting and stock picks in emerging markets, along with out-of-benchmark exposure to the U.S., contributed most to the fund's relative result. By sector, the primary contributor to performance versus the benchmark was an overweighting in information technology. Investment choices among industrials and communication services stocks also bolstered performance. The biggest individual relative contributor was an overweight position in Tencent Holdings (+86%), the fund's largest position. Adding further value was our outsized stake in Haier Smart Home, which gained roughly 67% and also was among the portfolio’s largest holdings as of October 31. Another notable relative contributor was an overweighting in Shenzhen Inovance Tec (+171%), and we notably reduced our stake in the stock this period. Conversely, an underweighting and stock picks in Europe ex U.K., specifically Germany, hindered the fund's relative result. By sector, the primary detractor from performance versus the benchmark was an underweighting in consumer discretionary, especially within the retailing industry. An overweighting in financials and an underweighting in communication services hurt as well. Not owning Shopify, a benchmark component that gained 193%, was the biggest individual relative detractor versus the benchmark. Also holding back performance was an underweighting in Meituan, which rose 211% and was no longer held at period end. Further hampering performance was an underweighting in Alibaba Group Holding, which advanced 74% and was among the fund's largest holdings. Notable changes in positioning include increased exposure to China and a lower allocation to U.K. By sector, meaningful changes in positioning include increased exposure to communication services and health care.
The views expressed above reflect those of the portfolio manager(s) only through the end of the period as stated on the cover of this report and do not necessarily represent the views of Fidelity or any other person in the Fidelity organization. Any such views are subject to change at any time based upon market or other conditions and Fidelity disclaims any responsibility to update such views. These views may not be relied on as investment advice and, because investment decisions for a Fidelity fund are based on numerous factors, may not be relied on as an indication of trading intent on behalf of any Fidelity fund.
Investment Summary (Unaudited)
Geographic Diversification (% of fund's net assets)
| As of October 31, 2020 |
| | Japan | 14.5% |
| | Cayman Islands | 8.6% |
| | United States of America* | 7.5% |
| | Germany | 7.0% |
| | Canada | 6.7% |
| | Switzerland | 6.2% |
| | France | 5.5% |
| | United Kingdom | 4.9% |
| | Taiwan | 4.6% |
| | Other | 34.5% |
* Includes Short-Term investments and Net Other Assets (Liabilities).
Percentages are based on country or territory of incorporation and are adjusted for the effect of futures contracts, if applicable.
Asset Allocation as of October 31, 2020
| | % of fund's net assets |
| Stocks | 97.7 |
| Short-Term Investments and Net Other Assets (Liabilities) | 2.3 |
Top Ten Stocks as of October 31, 2020
| | % of fund's net assets |
| Tencent Holdings Ltd. (Cayman Islands, Interactive Media & Services) | 3.4 |
| Alibaba Group Holding Ltd. sponsored ADR (Cayman Islands, Internet & Direct Marketing Retail) | 2.7 |
| Samsung Electronics Co. Ltd. (Korea (South), Technology Hardware, Storage & Peripherals) | 2.4 |
| Nestle SA (Reg. S) (Switzerland, Food Products) | 1.9 |
| Taiwan Semiconductor Manufacturing Co. Ltd. (Taiwan, Semiconductors & Semiconductor Equipment) | 1.7 |
| Haier Smart Home Co. Ltd. (A Shares) (China, Household Durables) | 1.7 |
| Roche Holding AG (participation certificate) (Switzerland, Pharmaceuticals) | 1.6 |
| Canadian Pacific Railway Ltd. (Canada, Road & Rail) | 1.4 |
| ASML Holding NV (Netherlands) (Netherlands, Semiconductors & Semiconductor Equipment) | 1.3 |
| Linde PLC (Germany, Chemicals) | 1.1 |
| | 19.2 |
Top Market Sectors as of October 31, 2020
| | % of fund's net assets |
| Financials | 18.6 |
| Information Technology | 18.1 |
| Industrials | 16.0 |
| Consumer Discretionary | 10.3 |
| Materials | 9.0 |
| Health Care | 8.9 |
| Communication Services | 6.0 |
| Consumer Staples | 5.8 |
| Energy | 2.6 |
| Utilities | 1.3 |
Schedule of Investments October 31, 2020
Showing Percentage of Net Assets
| Common Stocks - 96.3% | | | |
| | | Shares | Value |
| Australia - 1.5% | | | |
| Commonwealth Bank of Australia | | 5,043 | $244,845 |
| CSL Ltd. | | 3,431 | 694,631 |
| Evolution Mining Ltd. | | 23,639 | 92,675 |
| Imdex Ltd. | | 12,596 | 10,670 |
| Kogan.Com Ltd. | | 1,800 | 26,057 |
| Macquarie Group Ltd. | | 2,761 | 246,171 |
|
| TOTAL AUSTRALIA | | | 1,315,049 |
|
| Austria - 0.2% | | | |
| Erste Group Bank AG | | 8,233 | 168,567 |
| Bailiwick of Jersey - 1.1% | | | |
| Experian PLC | | 12,708 | 465,544 |
| Ferguson PLC | | 2,323 | 230,723 |
| Glencore Xstrata PLC | | 96,537 | 194,738 |
| Integrated Diagnostics Holdings PLC (a) | | 7,500 | 26,363 |
|
| TOTAL BAILIWICK OF JERSEY | | | 917,368 |
|
| Belgium - 0.7% | | | |
| Barco NV | | 2,204 | 34,537 |
| KBC Ancora (b) | | 876 | 24,792 |
| KBC Groep NV | | 6,840 | 337,210 |
| UCB SA | | 1,724 | 170,065 |
|
| TOTAL BELGIUM | | | 566,604 |
|
| Bermuda - 0.3% | | | |
| Shangri-La Asia Ltd. | | 278,000 | 218,384 |
| Brazil - 1.0% | | | |
| BM&F BOVESPA SA | | 33,156 | 294,986 |
| Suzano Papel e Celulose SA (b) | | 66,400 | 579,182 |
|
| TOTAL BRAZIL | | | 874,168 |
|
| Canada - 6.7% | | | |
| Alimentation Couche-Tard, Inc. Class B (sub. vtg.) | | 15,898 | 489,601 |
| Canadian National Railway Co. | | 6,985 | 693,886 |
| Canadian Pacific Railway Ltd. | | 3,860 | 1,153,509 |
| Constellation Software, Inc. | | 672 | 705,436 |
| First Quantum Minerals Ltd. | | 23,900 | 274,645 |
| Franco-Nevada Corp. | | 5,734 | 781,533 |
| McCoy Global, Inc. (b) | | 7,000 | 2,680 |
| New Look Vision Group, Inc. | | 1,300 | 29,663 |
| Nutrien Ltd. | | 8,506 | 345,782 |
| Richelieu Hardware Ltd. | | 1,814 | 48,771 |
| Summit Industrial Income REIT | | 2,500 | 25,276 |
| Suncor Energy, Inc. | | 14,294 | 161,254 |
| The Toronto-Dominion Bank | | 17,000 | 750,026 |
| Waste Connection, Inc. (Canada) | | 2,700 | 267,629 |
|
| TOTAL CANADA | | | 5,729,691 |
|
| Cayman Islands - 8.6% | | | |
| Airtac International Group | | 10,000 | 268,447 |
| Alibaba Group Holding Ltd. (b) | | 1,000 | 37,894 |
| Alibaba Group Holding Ltd. sponsored ADR (b) | | 7,451 | 2,270,245 |
| JD.com, Inc. sponsored ADR (b) | | 4,432 | 361,297 |
| Li Ning Co. Ltd. | | 115,500 | 595,937 |
| Sunny Optical Technology Group Co. Ltd. | | 38,600 | 638,313 |
| Tencent Holdings Ltd. | | 38,200 | 2,918,695 |
| Xinyi Solar Holdings Ltd. | | 140,000 | 254,628 |
|
| TOTAL CAYMAN ISLANDS | | | 7,345,456 |
|
| China - 4.5% | | | |
| AVIC Jonhon OptronicTechnology Co. Ltd. | | 38,650 | 320,672 |
| China Life Insurance Co. Ltd. (H Shares) | | 166,000 | 362,200 |
| China Merchants Bank Co. Ltd. (H Shares) | | 125,000 | 649,790 |
| Haier Smart Home Co. Ltd. (A Shares) | | 381,900 | 1,422,617 |
| Hualan Biological Engineer, Inc. (A Shares) | | 29,700 | 227,757 |
| Industrial & Commercial Bank of China Ltd. (H Shares) | | 925,000 | 525,275 |
| Shenzhen Inovance Technology Co. Ltd. (A Shares) | | 34,500 | 332,029 |
| Zhejiang Sanhua Intelligent Controls Co. Ltd. (A Shares) | | 7,334 | 26,907 |
|
| TOTAL CHINA | | | 3,867,247 |
|
| Denmark - 0.8% | | | |
| A.P. Moller - Maersk A/S Series B | | 169 | 270,845 |
| Netcompany Group A/S (a)(b) | | 887 | 73,685 |
| ORSTED A/S (a) | | 1,334 | 211,725 |
| SimCorp A/S | | 487 | 58,056 |
| Spar Nord Bank A/S | | 2,526 | 21,735 |
|
| TOTAL DENMARK | | | 636,046 |
|
| Finland - 0.6% | | | |
| Admicom OYJ | | 230 | 26,787 |
| Kone OYJ (B Shares) | | 3,307 | 263,211 |
| Musti Group OYJ | | 1,000 | 22,909 |
| Sampo Oyj (A Shares) | | 5,250 | 198,107 |
| Tikkurila Oyj | | 1,580 | 25,284 |
|
| TOTAL FINLAND | | | 536,298 |
|
| France - 5.5% | | | |
| ALTEN (b) | | 531 | 42,455 |
| Atos Origin SA (b) | | 2,132 | 145,506 |
| AXA SA | | 23,499 | 377,377 |
| BNP Paribas SA (b) | | 12,502 | 436,005 |
| Capgemini SA | | 1,653 | 190,861 |
| Edenred SA | | 4,520 | 210,779 |
| Laurent-Perrier Group SA | | 259 | 21,296 |
| Lectra | | 700 | 16,093 |
| Legrand SA | | 3,341 | 247,007 |
| LVMH Moet Hennessy Louis Vuitton SE | | 1,300 | 609,372 |
| Natixis SA (b) | | 22,119 | 51,419 |
| Sanofi SA | | 8,588 | 775,440 |
| SR Teleperformance SA | | 1,029 | 308,834 |
| Total SA | | 16,690 | 505,652 |
| Vetoquinol SA | | 600 | 56,602 |
| VINCI SA | | 3,541 | 279,686 |
| Vivendi SA | | 9,562 | 276,071 |
| Worldline SA (a)(b) | | 1,620 | 120,072 |
|
| TOTAL FRANCE | | | 4,670,527 |
|
| Germany - 6.5% | | | |
| Bayer AG | | 5,563 | 261,408 |
| CompuGroup Medical AG | | 873 | 74,781 |
| CTS Eventim AG | | 1,347 | 59,677 |
| Deutsche Borse AG | | 1,713 | 252,074 |
| Deutsche Post AG | | 7,200 | 318,984 |
| Hannover Reuck SE | | 1,749 | 254,011 |
| HeidelbergCement AG | | 3,550 | 203,087 |
| Infineon Technologies AG | | 8,150 | 226,906 |
| Linde PLC | | 4,530 | 992,918 |
| Muenchener Rueckversicherungs-Gesellschaft AG in Muenchen | | 1,122 | 262,393 |
| Nexus AG | | 1,420 | 79,052 |
| Rheinmetall AG | | 1,879 | 137,211 |
| RWE AG | | 6,878 | 254,653 |
| SAP SE | | 6,970 | 743,592 |
| Siemens AG | | 6,377 | 747,896 |
| Vonovia SE | | 10,566 | 674,598 |
|
| TOTAL GERMANY | | | 5,543,241 |
|
| Hong Kong - 2.9% | | | |
| AIA Group Ltd. | | 100,243 | 954,030 |
| China Resources Beer Holdings Co. Ltd. | | 126,000 | 780,948 |
| CNOOC Ltd. sponsored ADR | | 3,618 | 333,290 |
| Hong Kong Exchanges and Clearing Ltd. | | 8,700 | 415,445 |
|
| TOTAL HONG KONG | | | 2,483,713 |
|
| Hungary - 0.6% | | | |
| Richter Gedeon PLC | | 26,900 | 548,712 |
| India - 1.8% | | | |
| Embassy Office Parks (REIT) | | 7,200 | 33,235 |
| Housing Development Finance Corp. Ltd. | | 22,105 | 570,072 |
| Indian Energy Exchange Ltd. (a) | | 5,473 | 14,036 |
| Larsen & Toubro Ltd. | | 30,000 | 373,644 |
| Reliance Industries Ltd. sponsored GDR (a) | | 1,900 | 104,310 |
| Shree Cement Ltd. | | 921 | 267,962 |
| Solar Industries India Ltd. | | 13,900 | 188,221 |
|
| TOTAL INDIA | | | 1,551,480 |
|
| Indonesia - 0.7% | | | |
| PT Bank Mandiri (Persero) Tbk | | 1,301,200 | 506,858 |
| PT Bank Rakyat Indonesia Tbk | | 339,721 | 76,903 |
|
| TOTAL INDONESIA | | | 583,761 |
|
| Ireland - 0.9% | | | |
| CRH PLC | | 10,800 | 377,911 |
| CRH PLC sponsored ADR | | 7,201 | 253,115 |
| FBD Holdings PLC (b) | | 1,972 | 14,239 |
| Ryanair Holdings PLC (b) | | 400 | 5,512 |
| Ryanair Holdings PLC sponsored ADR (b) | | 1,729 | 139,357 |
|
| TOTAL IRELAND | | | 790,134 |
|
| Israel - 0.5% | | | |
| Elbit Systems Ltd. (Israel) | | 2,063 | 233,445 |
| Ituran Location & Control Ltd. | | 2,161 | 30,578 |
| Maytronics Ltd. | | 2,000 | 30,721 |
| Strauss Group Ltd. | | 2,755 | 79,661 |
| Tel Aviv Stock Exchange Ltd. | | 7,200 | 31,230 |
|
| TOTAL ISRAEL | | | 405,635 |
|
| Italy - 1.4% | | | |
| Assicurazioni Generali SpA | | 11,006 | 147,537 |
| Enel SpA | | 70,957 | 564,144 |
| Interpump Group SpA | | 7,143 | 269,539 |
| Mediobanca SpA | | 23,969 | 169,950 |
|
| TOTAL ITALY | | | 1,151,170 |
|
| Japan - 14.5% | | | |
| Ai Holdings Corp. | | 1,100 | 19,341 |
| Aoki Super Co. Ltd. | | 1,000 | 26,193 |
| Artnature, Inc. | | 2,000 | 11,589 |
| Aucnet, Inc. | | 1,300 | 17,283 |
| Azbil Corp. | | 11,600 | 470,766 |
| Broadleaf Co. Ltd. | | 10,200 | 53,354 |
| Central Automotive Products Ltd. | | 1,000 | 19,479 |
| Curves Holdings Co. Ltd. | | 6,600 | 40,550 |
| Daiichikosho Co. Ltd. | | 1,400 | 47,904 |
| Daikokutenbussan Co. Ltd. | | 700 | 38,083 |
| DENSO Corp. | | 5,580 | 260,009 |
| FANUC Corp. | | 3,571 | 754,284 |
| Fujitsu Ltd. | | 1,824 | 215,806 |
| Funai Soken Holdings, Inc. | | 1,250 | 27,039 |
| Goldcrest Co. Ltd. | | 2,960 | 37,821 |
| Hoya Corp. | | 7,991 | 901,840 |
| Ibiden Co. Ltd. | | 3,123 | 127,336 |
| Idemitsu Kosan Co. Ltd. | | 5,680 | 114,872 |
| Itochu Corp. | | 15,664 | 376,226 |
| Kao Corp. | | 2,432 | 173,155 |
| Keyence Corp. | | 2,184 | 991,148 |
| Kobayashi Pharmaceutical Co. Ltd. | | 550 | 53,595 |
| Koshidaka Holdings Co. Ltd. | | 6,200 | 23,193 |
| Kusuri No Aoki Holdings Co. Ltd. | | 500 | 39,913 |
| Lasertec Corp. | | 3,500 | 303,173 |
| Medikit Co. Ltd. | | 1,200 | 35,260 |
| Minebea Mitsumi, Inc. | | 14,283 | 257,970 |
| Miroku Jyoho Service Co., Ltd. | | 1,300 | 26,331 |
| Misumi Group, Inc. | | 18,000 | 534,592 |
| Mitsubishi Estate Co. Ltd. | | 7,671 | 114,420 |
| Mitsubishi UFJ Financial Group, Inc. | | 70,435 | 277,648 |
| Mitsuboshi Belting Ltd. | | 1,500 | 23,482 |
| Mitsui Fudosan Co. Ltd. | | 5,585 | 95,099 |
| Nabtesco Corp. | | 4,400 | 164,376 |
| Nagaileben Co. Ltd. | | 2,900 | 72,566 |
| Nihon Parkerizing Co. Ltd. | | 6,600 | 65,044 |
| NS Tool Co. Ltd. | | 1,200 | 25,757 |
| OBIC Co. Ltd. | | 1,965 | 347,890 |
| Oracle Corp. Japan | | 1,543 | 154,208 |
| ORIX Corp. | | 18,886 | 220,876 |
| OSG Corp. | | 7,900 | 118,350 |
| Paramount Bed Holdings Co. Ltd. | | 1,000 | 38,528 |
| Poletowin Pitcrew Holdings, Inc. | | 1,500 | 13,068 |
| ProNexus, Inc. | | 1,600 | 16,644 |
| Recruit Holdings Co. Ltd. | | 15,018 | 571,445 |
| San-Ai Oil Co. Ltd. | | 3,100 | 31,256 |
| Shin-Etsu Chemical Co. Ltd. | | 2,948 | 393,755 |
| Shinsei Bank Ltd. | | 13,742 | 165,338 |
| SHO-BOND Holdings Co. Ltd. | | 6,980 | 336,913 |
| Shoei Co. Ltd. | | 3,900 | 118,766 |
| SK Kaken Co. Ltd. | | 120 | 45,594 |
| SoftBank Group Corp. | | 5,256 | 342,343 |
| Software Service, Inc. | | 400 | 43,099 |
| Sony Corp. | | 3,976 | 331,465 |
| Sumitomo Mitsui Financial Group, Inc. | | 10,691 | 295,947 |
| Suzuki Motor Corp. | | 5,221 | 224,230 |
| Takeda Pharmaceutical Co. Ltd. | | 3,889 | 120,180 |
| Techno Medica Co. Ltd. | | 500 | 7,735 |
| The Monogatari Corp. | | 210 | 21,460 |
| TKC Corp. | | 300 | 18,591 |
| Tocalo Co. Ltd. | | 2,800 | 27,911 |
| Tokio Marine Holdings, Inc. | | 6,705 | 299,678 |
| Tokyo Electron Ltd. | | 629 | 168,830 |
| Toyota Motor Corp. | | 11,989 | 787,041 |
| USS Co. Ltd. | | 14,100 | 257,897 |
| Welcia Holdings Co. Ltd. | | 900 | 35,272 |
| Workman Co. Ltd. | | 200 | 17,734 |
|
| TOTAL JAPAN | | | 12,408,541 |
|
| Kenya - 0.2% | | | |
| Safaricom Ltd. | | 448,455 | 127,158 |
| Korea (South) - 3.4% | | | |
| BGF Retail Co. Ltd. | | 140 | 14,526 |
| Hyundai Motor Co. | | 2,560 | 373,901 |
| Leeno Industrial, Inc. | | 269 | 28,871 |
| Samsung Electronics Co. Ltd. | | 40,495 | 2,031,041 |
| Shinhan Financial Group Co. Ltd. | | 16,490 | 446,430 |
|
| TOTAL KOREA (SOUTH) | | | 2,894,769 |
|
| Luxembourg - 0.2% | | | |
| ArcelorMittal SA (Netherlands) (b) | | 9,700 | 131,634 |
| Mexico - 2.2% | | | |
| CEMEX S.A.B. de CV sponsored ADR | | 145,400 | 603,410 |
| Grupo Financiero Banorte S.A.B. de CV Series O (b) | | 127,400 | 567,584 |
| Wal-Mart de Mexico SA de CV Series V | | 280,100 | 676,761 |
|
| TOTAL MEXICO | | | 1,847,755 |
|
| Netherlands - 2.2% | | | |
| Aalberts Industries NV | | 3,100 | 104,124 |
| AerCap Holdings NV (b) | | 2,757 | 68,456 |
| ASML Holding NV (Netherlands) | | 2,975 | 1,076,364 |
| Koninklijke Philips Electronics NV | | 4,527 | 209,676 |
| NN Group NV | | 5,844 | 203,778 |
| Yandex NV Series A (b) | | 3,700 | 213,009 |
|
| TOTAL NETHERLANDS | | | 1,875,407 |
|
| New Zealand - 0.1% | | | |
| Auckland International Airport Ltd. | | 16,135 | 74,639 |
| Norway - 0.4% | | | |
| Adevinta ASA Class B (b) | | 6,997 | 108,107 |
| Kongsberg Gruppen ASA | | 1,709 | 27,676 |
| Medistim ASA | | 800 | 17,346 |
| Schibsted ASA (B Shares) | | 4,562 | 163,716 |
| Skandiabanken ASA (a) | | 2,800 | 17,744 |
|
| TOTAL NORWAY | | | 334,589 |
|
| Philippines - 0.0% | | | |
| Jollibee Food Corp. | | 3,571 | 12,485 |
| Portugal - 0.1% | | | |
| Galp Energia SGPS SA Class B | | 9,556 | 77,606 |
| Russia - 0.5% | | | |
| Lukoil PJSC sponsored ADR | | 4,300 | 219,558 |
| Sberbank of Russia sponsored ADR | | 22,400 | 226,240 |
|
| TOTAL RUSSIA | | | 445,798 |
|
| Singapore - 0.2% | | | |
| United Overseas Bank Ltd. | | 13,979 | 194,231 |
| South Africa - 0.6% | | | |
| Clicks Group Ltd. | | 12,323 | 178,233 |
| Impala Platinum Holdings Ltd. | | 39,863 | 354,794 |
|
| TOTAL SOUTH AFRICA | | | 533,027 |
|
| Spain - 1.2% | | | |
| Amadeus IT Holding SA Class A | | 5,610 | 267,816 |
| Banco Santander SA (Spain) | | 156,169 | 312,737 |
| Cellnex Telecom SA (a) | | 5,968 | 383,119 |
| Fluidra SA | | 2,876 | 51,985 |
| Unicaja Banco SA (a) | | 63,941 | 40,697 |
|
| TOTAL SPAIN | | | 1,056,354 |
|
| Sweden - 2.8% | | | |
| Addlife AB | | 7,256 | 109,121 |
| AddTech AB (B Shares) | | 12,000 | 132,833 |
| ASSA ABLOY AB (B Shares) | | 23,433 | 502,227 |
| Atlas Copco AB (A Shares) | | 10,371 | 457,921 |
| Bygghemma Group First AB (b) | | 1,000 | 15,621 |
| Epiroc AB Class A | | 14,764 | 220,670 |
| Ericsson (B Shares) | | 29,915 | 333,986 |
| Investor AB (B Shares) | | 6,220 | 373,547 |
| INVISIO AB | | 1,300 | 23,433 |
| John Mattson Fastighetsforetag (b) | | 1,200 | 20,201 |
| Lagercrantz Group AB (B Shares) | | 15,204 | 93,701 |
| Volvo AB (B Shares) | | 6,800 | 132,318 |
|
| TOTAL SWEDEN | | | 2,415,579 |
|
| Switzerland - 6.2% | | | |
| Nestle SA (Reg. S) | | 14,382 | 1,617,658 |
| Novartis AG | | 8,803 | 685,953 |
| Roche Holding AG (participation certificate) | | 4,236 | 1,361,160 |
| Schindler Holding AG: | | | |
| (participation certificate) | | 1,126 | 287,962 |
| (Reg.) | | 107 | 27,469 |
| Siemens Energy AG (b) | | 4,138 | 90,603 |
| Swiss Life Holding AG | | 354 | 118,984 |
| Tecan Group AG | | 277 | 131,408 |
| Temenos Group AG | | 1,260 | 135,268 |
| UBS Group AG | | 30,036 | 351,121 |
| Zurich Insurance Group Ltd. | | 1,542 | 512,169 |
|
| TOTAL SWITZERLAND | | | 5,319,755 |
|
| Taiwan - 4.6% | | | |
| Addcn Technology Co. Ltd. | | 3,772 | 27,226 |
| ASE Technology Holding Co. Ltd. | | 132,000 | 296,226 |
| ECLAT Textile Co. Ltd. | | 20,000 | 264,602 |
| HIWIN Technologies Corp. | | 50,000 | 435,178 |
| MediaTek, Inc. | | 14,000 | 331,784 |
| Sporton International, Inc. | | 32,000 | 255,025 |
| Taiwan Semiconductor Manufacturing Co. Ltd. | | 97,035 | 1,467,826 |
| Unified-President Enterprises Corp. | | 275,000 | 589,238 |
| Yageo Corp. | | 21,000 | 260,949 |
|
| TOTAL TAIWAN | | | 3,928,054 |
|
| United Kingdom - 4.9% | | | |
| Alliance Pharma PLC | | 35,718 | 34,010 |
| Anglo American PLC (United Kingdom) | | 16,329 | 383,145 |
| AstraZeneca PLC (United Kingdom) | | 2,106 | 211,454 |
| Avon Rubber PLC | | 2,695 | 137,036 |
| Beazley PLC | | 17,511 | 66,695 |
| BHP Billiton PLC | | 41,524 | 804,418 |
| Bodycote PLC | | 3,086 | 26,006 |
| BP PLC | | 136,290 | 347,633 |
| Clarkson PLC | | 800 | 20,832 |
| Dechra Pharmaceuticals PLC | | 4,850 | 219,408 |
| DP Poland PLC (b)(c) | | 52,800 | 4,959 |
| Hilton Food Group PLC | | 1,854 | 27,862 |
| Howden Joinery Group PLC | | 4,647 | 38,337 |
| Imperial Brands PLC | | 7,707 | 122,209 |
| InterContinental Hotel Group PLC ADR | | 2,391 | 122,276 |
| Lloyds Banking Group PLC | | 485,439 | 176,752 |
| London Stock Exchange Group PLC | | 2,762 | 297,738 |
| Prudential PLC | | 206 | 2,519 |
| Rightmove PLC | | 23,693 | 189,691 |
| Royal Dutch Shell PLC Class B sponsored ADR | | 5,473 | 132,173 |
| RSA Insurance Group PLC | | 28,884 | 158,508 |
| Spectris PLC | | 8,577 | 275,121 |
| Spirax-Sarco Engineering PLC | | 1,318 | 192,603 |
| Standard Chartered PLC (United Kingdom) | | 36,242 | 165,175 |
| Standard Life PLC | | 1,383 | 4,022 |
| Ultra Electronics Holdings PLC | | 1,477 | 35,973 |
|
| TOTAL UNITED KINGDOM | | | 4,196,555 |
|
| United States of America - 5.2% | | | |
| Alphabet, Inc. Class A (b) | | 135 | 218,175 |
| Autoliv, Inc. | | 1,675 | 126,965 |
| Black Knight, Inc. (b) | | 2,449 | 215,390 |
| Lam Research Corp. | | 790 | 270,243 |
| Marsh & McLennan Companies, Inc. | | 3,453 | 357,247 |
| MasterCard, Inc. Class A | | 1,502 | 433,537 |
| Moody's Corp. | | 1,365 | 358,859 |
| Morningstar, Inc. | | 235 | 44,739 |
| MSCI, Inc. | | 1,078 | 377,128 |
| NICE Systems Ltd. sponsored ADR (b) | | 1,440 | 328,694 |
| PriceSmart, Inc. | | 1,340 | 92,460 |
| ResMed, Inc. | | 2,365 | 453,938 |
| S&P Global, Inc. | | 1,117 | 360,489 |
| Sherwin-Williams Co. | | 577 | 396,964 |
| Visa, Inc. Class A | | 2,440 | 443,372 |
|
| TOTAL UNITED STATES OF AMERICA | | | 4,478,200 |
|
| TOTAL COMMON STOCKS | | | |
| (Cost $67,099,093) | | | 82,255,387 |
|
| Nonconvertible Preferred Stocks - 1.4% | | | |
| Brazil - 0.9% | | | |
| Itau Unibanco Holding SA | | 119,155 | 487,589 |
| Petroleo Brasileiro SA - Petrobras sponsored ADR | | 38,867 | 257,688 |
|
| TOTAL BRAZIL | | | 745,277 |
|
| Germany - 0.5% | | | |
| Porsche Automobil Holding SE (Germany) | | 6,848 | 366,874 |
| Sartorius AG (non-vtg.) | | 220 | 93,111 |
|
| TOTAL GERMANY | | | 459,985 |
|
| TOTAL NONCONVERTIBLE PREFERRED STOCKS | | | |
| (Cost $1,553,479) | | | 1,205,262 |
|
| Money Market Funds - 1.7% | | | |
| Fidelity Cash Central Fund 0.10% (d) | | | |
| (Cost $1,456,932) | | 1,456,644 | 1,456,935 |
| TOTAL INVESTMENT IN SECURITIES - 99.4% | | | |
| (Cost $70,109,504) | | | 84,917,584 |
| NET OTHER ASSETS (LIABILITIES) - 0.6% | | | 478,047 |
| NET ASSETS - 100% | | | $85,395,631 |
Categorizations in the Schedule of Investments are based on country or territory of incorporation.
Legend
(a) Security exempt from registration under Rule 144A of the Securities Act of 1933. These securities may be resold in transactions exempt from registration, normally to qualified institutional buyers. At the end of the period, the value of these securities amounted to $991,751 or 1.2% of net assets.
(b) Non-income producing
(c) Level 3 security
(d) Affiliated fund that is generally available only to investment companies and other accounts managed by Fidelity Investments. The rate quoted is the annualized seven-day yield of the fund at period end. A complete unaudited listing of the fund's holdings as of its most recent quarter end is available upon request. In addition, each Fidelity Central Fund's financial statements, which are not covered by the Fund's Report of Independent Registered Public Accounting Firm, are available on the SEC's website or upon request.
Affiliated Central Funds
Information regarding fiscal year to date income earned by the Fund from investments in Fidelity Central Funds is as follows:
| Fund | Income earned |
| Fidelity Cash Central Fund | $6,239 |
| Fidelity Securities Lending Cash Central Fund | 562 |
| Total | $6,801 |
Amounts in the income column in the above table include any capital gain distributions from underlying funds, which are presented in the corresponding line-item in the Statement of Operations, if applicable. Amount for Fidelity Securities Lending Cash Central Fund represents the income earned on investing cash collateral, less rebates paid to borrowers and any lending agent fees associated with the loan, plus any premium payments received for lending certain types of securities.
Investment Valuation
The following is a summary of the inputs used, as of October 31, 2020, involving the Fund's assets and liabilities carried at fair value. The inputs or methodology used for valuing securities may not be an indication of the risk associated with investing in those securities. For more information on valuation inputs, and their aggregation into the levels used below, please refer to the Investment Valuation section in the accompanying Notes to Financial Statements.
| | Valuation Inputs at Reporting Date: |
| Description | Total | Level 1 | Level 2 | Level 3 |
| Investments in Securities: | | | | |
| Equities: | | | | |
| Communication Services | $5,074,891 | $1,765,949 | $3,308,942 | $-- |
| Consumer Discretionary | 9,031,886 | 4,425,494 | 4,601,433 | 4,959 |
| Consumer Staples | 5,068,253 | 2,880,036 | 2,188,217 | -- |
| Energy | 2,287,972 | 1,210,953 | 1,077,019 | -- |
| Financials | 15,839,492 | 8,323,657 | 7,515,835 | -- |
| Health Care | 7,660,604 | 2,013,917 | 5,646,687 | -- |
| Industrials | 13,660,911 | 7,864,166 | 5,796,745 | -- |
| Information Technology | 15,038,987 | 5,603,661 | 9,435,326 | -- |
| Materials | 7,766,481 | 4,970,699 | 2,795,782 | -- |
| Real Estate | 1,000,650 | 720,075 | 280,575 | -- |
| Utilities | 1,030,522 | 466,378 | 564,144 | -- |
| Money Market Funds | 1,456,935 | 1,456,935 | -- | -- |
| Total Investments in Securities: | $84,917,584 | $41,701,920 | $43,210,705 | $4,959 |
See accompanying notes which are an integral part of the financial statements.
Financial Statements
Statement of Assets and Liabilities
| | | October 31, 2020 |
| Assets | | |
Investment in securities, at value — See accompanying schedule:
Unaffiliated issuers (cost $68,652,572) | $83,460,649 | |
| Fidelity Central Funds (cost $1,456,932) | 1,456,935 | |
| Total Investment in Securities (cost $70,109,504) | | $84,917,584 |
| Cash | | 52,394 |
| Foreign currency held at value (cost $5,777) | | 5,713 |
| Receivable for investments sold | | 100,114 |
| Receivable for fund shares sold | | 17,146 |
| Dividends receivable | | 457,708 |
| Distributions receivable from Fidelity Central Funds | | 83 |
| Prepaid expenses | | 157 |
| Receivable from investment adviser for expense reductions | | 53,363 |
| Other receivables | | 19,939 |
| Total assets | | 85,624,201 |
| Liabilities | | |
| Payable for investments purchased | $39,881 | |
| Payable for fund shares redeemed | 56,423 | |
| Accrued management fee | 66,762 | |
| Transfer agent fee payable | 12,978 | |
| Distribution and service plan fees payable | 7,506 | |
| Other affiliated payables | 3,834 | |
| Other payables and accrued expenses | 41,186 | |
| Total liabilities | | 228,570 |
| Net Assets | | $85,395,631 |
| Net Assets consist of: | | |
| Paid in capital | | $68,972,894 |
| Total accumulated earnings (loss) | | 16,422,737 |
| Net Assets | | $85,395,631 |
| Net Asset Value and Maximum Offering Price | | |
| Class A: | | |
| Net Asset Value and redemption price per share ($6,091,455 ÷ 634,257 shares)(a) | | $9.60 |
| Maximum offering price per share (100/94.25 of $9.60) | | $10.19 |
| Class M: | | |
| Net Asset Value and redemption price per share ($10,619,832 ÷ 1,100,785 shares)(a) | | $9.65 |
| Maximum offering price per share (100/96.50 of $9.65) | | $10.00 |
| Class C: | | |
| Net Asset Value and offering price per share ($1,827,316 ÷ 191,001 shares)(a) | | $9.57 |
| Total International Equity: | | |
| Net Asset Value, offering price and redemption price per share ($61,361,852 ÷ 6,366,871 shares) | | $9.64 |
| Class I: | | |
| Net Asset Value, offering price and redemption price per share ($2,072,878 ÷ 215,874 shares) | | $9.60 |
| Class Z: | | |
| Net Asset Value, offering price and redemption price per share ($3,422,298 ÷ 355,683 shares) | | $9.62 |
(a) Redemption price per share is equal to net asset value less any applicable contingent deferred sales charge.
See accompanying notes which are an integral part of the financial statements.
Statement of Operations
| | | Year ended October 31, 2020 |
| Investment Income | | |
| Dividends | | $1,977,119 |
| Income from Fidelity Central Funds (including $562 from security lending) | | 6,801 |
| Income before foreign taxes withheld | | 1,983,920 |
| Less foreign taxes withheld | | (199,920) |
| Total income | | 1,784,000 |
| Expenses | | |
| Management fee | | |
| Basic fee | $623,728 | |
| Performance adjustment | 174,223 | |
| Transfer agent fees | 160,576 | |
| Distribution and service plan fees | 90,097 | |
| Accounting fees | 47,395 | |
| Custodian fees and expenses | 57,309 | |
| Independent trustees' fees and expenses | 528 | |
| Registration fees | 77,575 | |
| Audit | 87,177 | |
| Legal | 2,140 | |
| Miscellaneous | 2,614 | |
| Total expenses before reductions | 1,323,362 | |
| Expense reductions | (215,847) | |
| Total expenses after reductions | | 1,107,515 |
| Net investment income (loss) | | 676,485 |
| Realized and Unrealized Gain (Loss) | | |
| Net realized gain (loss) on: | | |
| Investment securities: | | |
| Unaffiliated issuers | 1,876,249 | |
| Fidelity Central Funds | (76) | |
| Foreign currency transactions | (38,196) | |
| Total net realized gain (loss) | | 1,837,977 |
| Change in net unrealized appreciation (depreciation) on: | | |
| Investment securities: | | |
| Unaffiliated issuers (net of decrease in deferred foreign taxes of $8) | 997,837 | |
| Fidelity Central Funds | (10) | |
| Assets and liabilities in foreign currencies | 17,522 | |
| Total change in net unrealized appreciation (depreciation) | | 1,015,349 |
| Net gain (loss) | | 2,853,326 |
| Net increase (decrease) in net assets resulting from operations | | $3,529,811 |
See accompanying notes which are an integral part of the financial statements.
Statement of Changes in Net Assets
| | Year ended October 31, 2020 | Year ended October 31, 2019 |
| Increase (Decrease) in Net Assets | | |
| Operations | | |
| Net investment income (loss) | $676,485 | $1,645,228 |
| Net realized gain (loss) | 1,837,977 | 1,151,971 |
| Change in net unrealized appreciation (depreciation) | 1,015,349 | 10,514,574 |
| Net increase (decrease) in net assets resulting from operations | 3,529,811 | 13,311,773 |
| Distributions to shareholders | (1,600,384) | (764,299) |
| Share transactions - net increase (decrease) | (14,871,566) | (17,112,594) |
| Total increase (decrease) in net assets | (12,942,139) | (4,565,120) |
| Net Assets | | |
| Beginning of period | 98,337,770 | 102,902,890 |
| End of period | $85,395,631 | $98,337,770 |
See accompanying notes which are an integral part of the financial statements.
Financial Highlights
Fidelity Total International Equity Fund Class A
| Years ended October 31, | 2020 | 2019 | 2018 | 2017 | 2016 |
| Selected Per–Share Data | | | | | |
| Net asset value, beginning of period | $9.34 | $8.20 | $9.39 | $7.67 | $7.79 |
| Income from Investment Operations | | | | | |
| Net investment income (loss)A | .05 | .14 | .08 | .09 | .08 |
| Net realized and unrealized gain (loss) | .35 | 1.05 | (.89) | 1.71 | (.14) |
| Total from investment operations | .40 | 1.19 | (.81) | 1.80 | (.06) |
| Distributions from net investment income | (.14) | (.05) | (.15) | (.08) | (.06) |
| Distributions from net realized gain | – | – | (.23) | – | – |
| Total distributions | (.14) | (.05) | (.38) | (.08) | (.06) |
| Redemption fees added to paid in capitalA | – | – | –B | –B | –B |
| Net asset value, end of period | $9.60 | $9.34 | $8.20 | $9.39 | $7.67 |
| Total ReturnC,D | 4.31% | 14.63% | (9.04)% | 23.78% | (.76)% |
| Ratios to Average Net AssetsE,F | | | | | |
| Expenses before reductions | 1.66% | 1.51% | 1.60% | 1.67% | 1.52% |
| Expenses net of fee waivers, if any | 1.39% | 1.45% | 1.45% | 1.45% | 1.45% |
| Expenses net of all reductions | 1.37% | 1.44% | 1.44% | 1.43% | 1.45% |
| Net investment income (loss) | .58% | 1.55% | .90% | 1.02% | 1.10% |
| Supplemental Data | | | | | |
| Net assets, end of period (000 omitted) | $6,091 | $7,249 | $7,526 | $9,292 | $8,576 |
| Portfolio turnover rateG | 37% | 69% | 52% | 66%H | 51% |
A Calculated based on average shares outstanding during the period.
B Amount represents less than $.005 per share.
C Total returns would have been lower if certain expenses had not been reduced during the applicable periods shown.
D Total returns do not include the effect of the sales charges.
E Fees and expenses of any underlying mutual funds or exchange-traded funds (ETFs) are not included in the Fund's expense ratio. The Fund indirectly bears its proportionate share of these expenses. For additional expense information related to investments in Fidelity Central Funds, please refer to the "Investments in Fidelity Central Funds" note found in the Notes to Financial Statements section of the most recent Annual or Semi-Annual report.
F Expense ratios reflect operating expenses of the class. Expenses before reductions do not reflect amounts reimbursed, waived, or reduced through arrangements with the investment adviser, brokerage services, or other offset arrangements, if applicable, and do not represent the amount paid by the class during periods when reimbursements, waivers or reductions occur.
G Amount does not include the portfolio activity of any underlying mutual funds or exchange-traded funds (ETFs).
H Portfolio turnover rate excludes securities received or delivered in-kind.
See accompanying notes which are an integral part of the financial statements.
Fidelity Total International Equity Fund Class M
| Years ended October 31, | 2020 | 2019 | 2018 | 2017 | 2016 |
| Selected Per–Share Data | | | | | |
| Net asset value, beginning of period | $9.38 | $8.22 | $9.42 | $7.70 | $7.81 |
| Income from Investment Operations | | | | | |
| Net investment income (loss)A | .03 | .11 | .06 | .06 | .06 |
| Net realized and unrealized gain (loss) | .36 | 1.07 | (.90) | 1.73 | (.13) |
| Total from investment operations | .39 | 1.18 | (.84) | 1.79 | (.07) |
| Distributions from net investment income | (.12) | (.02) | (.13) | (.07) | (.04) |
| Distributions from net realized gain | – | – | (.23) | – | – |
| Total distributions | (.12) | (.02) | (.36) | (.07) | (.04) |
| Redemption fees added to paid in capitalA | – | – | –B | –B | –B |
| Net asset value, end of period | $9.65 | $9.38 | $8.22 | $9.42 | $7.70 |
| Total ReturnC,D | 4.13% | 14.38% | (9.30)% | 23.41% | (.86)% |
| Ratios to Average Net AssetsE,F | | | | | |
| Expenses before reductions | 1.90% | 1.76% | 1.85% | 1.90% | 1.73% |
| Expenses net of fee waivers, if any | 1.64% | 1.70% | 1.70% | 1.70% | 1.70% |
| Expenses net of all reductions | 1.62% | 1.69% | 1.69% | 1.68% | 1.69% |
| Net investment income (loss) | .33% | 1.30% | .65% | .77% | .85% |
| Supplemental Data | | | | | |
| Net assets, end of period (000 omitted) | $10,620 | $11,733 | $11,882 | $15,894 | $13,893 |
| Portfolio turnover rateG | 37% | 69% | 52% | 66%H | 51% |
A Calculated based on average shares outstanding during the period.
B Amount represents less than $.005 per share.
C Total returns would have been lower if certain expenses had not been reduced during the applicable periods shown.
D Total returns do not include the effect of the sales charges.
E Fees and expenses of any underlying mutual funds or exchange-traded funds (ETFs) are not included in the Fund's expense ratio. The Fund indirectly bears its proportionate share of these expenses. For additional expense information related to investments in Fidelity Central Funds, please refer to the "Investments in Fidelity Central Funds" note found in the Notes to Financial Statements section of the most recent Annual or Semi-Annual report.
F Expense ratios reflect operating expenses of the class. Expenses before reductions do not reflect amounts reimbursed, waived, or reduced through arrangements with the investment adviser, brokerage services, or other offset arrangements, if applicable, and do not represent the amount paid by the class during periods when reimbursements, waivers or reductions occur.
G Amount does not include the portfolio activity of any underlying mutual funds or exchange-traded funds (ETFs).
H Portfolio turnover rate excludes securities received or delivered in-kind.
See accompanying notes which are an integral part of the financial statements.
Fidelity Total International Equity Fund Class C
| Years ended October 31, | 2020 | 2019 | 2018 | 2017 | 2016 |
| Selected Per–Share Data | | | | | |
| Net asset value, beginning of period | $9.30 | $8.17 | $9.37 | $7.66 | $7.77 |
| Income from Investment Operations | | | | | |
| Net investment income (loss)A | (.02) | .07 | .01 | .02 | .03 |
| Net realized and unrealized gain (loss) | .36 | 1.06 | (.89) | 1.71 | (.14) |
| Total from investment operations | .34 | 1.13 | (.88) | 1.73 | (.11) |
| Distributions from net investment income | (.07) | – | (.10) | (.02) | – |
| Distributions from net realized gain | – | – | (.23) | – | – |
| Total distributions | (.07) | – | (.32)B | (.02) | – |
| Redemption fees added to paid in capitalA | – | – | –C | –C | –C |
| Net asset value, end of period | $9.57 | $9.30 | $8.17 | $9.37 | $7.66 |
| Total ReturnD,E | 3.62% | 13.83% | (9.72)% | 22.70% | (1.42)% |
| Ratios to Average Net AssetsF,G | | | | | |
| Expenses before reductions | 2.46% | 2.33% | 2.43% | 2.48% | 2.30% |
| Expenses net of fee waivers, if any | 2.14% | 2.20% | 2.20% | 2.20% | 2.20% |
| Expenses net of all reductions | 2.12% | 2.19% | 2.19% | 2.18% | 2.20% |
| Net investment income (loss) | (.17)% | .80% | .14% | .27% | .35% |
| Supplemental Data | | | | | |
| Net assets, end of period (000 omitted) | $1,827 | $2,203 | $2,705 | $3,211 | $2,713 |
| Portfolio turnover rateH | 37% | 69% | 52% | 66%I | 51% |
A Calculated based on average shares outstanding during the period.
B Total distributions per share do not sum due to rounding.
C Amount represents less than $.005 per share.
D Total returns would have been lower if certain expenses had not been reduced during the applicable periods shown.
E Total returns do not include the effect of the contingent deferred sales charge.
F Fees and expenses of any underlying mutual funds or exchange-traded funds (ETFs) are not included in the Fund's expense ratio. The Fund indirectly bears its proportionate share of these expenses. For additional expense information related to investments in Fidelity Central Funds, please refer to the "Investments in Fidelity Central Funds" note found in the Notes to Financial Statements section of the most recent Annual or Semi-Annual report.
G Expense ratios reflect operating expenses of the class. Expenses before reductions do not reflect amounts reimbursed, waived, or reduced through arrangements with the investment adviser, brokerage services, or other offset arrangements, if applicable, and do not represent the amount paid by the class during periods when reimbursements, waivers or reductions occur.
H Amount does not include the portfolio activity of any underlying mutual funds or exchange-traded funds (ETFs).
I Portfolio turnover rate excludes securities received or delivered in-kind.
See accompanying notes which are an integral part of the financial statements.
Fidelity Total International Equity Fund
| Years ended October 31, | 2020 | 2019 | 2018 | 2017 | 2016 |
| Selected Per–Share Data | | | | | |
| Net asset value, beginning of period | $9.37 | $8.23 | $9.40 | $7.70 | $7.82 |
| Income from Investment Operations | | | | | |
| Net investment income (loss)A | .08 | .16 | .11 | .11 | .11 |
| Net realized and unrealized gain (loss) | .35 | 1.06 | (.90) | 1.70 | (.13) |
| Total from investment operations | .43 | 1.22 | (.79) | 1.81 | (.02) |
| Distributions from net investment income | (.16) | (.08) | (.15) | (.11) | (.10) |
| Distributions from net realized gain | – | – | (.23) | – | – |
| Total distributions | (.16) | (.08) | (.38) | (.11) | (.10) |
| Redemption fees added to paid in capitalA | – | – | –B | –B | –B |
| Net asset value, end of period | $9.64 | $9.37 | $8.23 | $9.40 | $7.70 |
| Total ReturnC | 4.65% | 14.97% | (8.84)% | 23.86% | (.32)% |
| Ratios to Average Net AssetsD,E | | | | | |
| Expenses before reductions | 1.34% | 1.20% | 1.29% | 1.15% | 1.11% |
| Expenses net of fee waivers, if any | 1.14% | 1.20% | 1.20% | 1.14% | 1.11% |
| Expenses net of all reductions | 1.12% | 1.19% | 1.19% | 1.13% | 1.10% |
| Net investment income (loss) | .83% | 1.81% | 1.15% | 1.33% | 1.44% |
| Supplemental Data | | | | | |
| Net assets, end of period (000 omitted) | $61,362 | $70,251 | $71,170 | $82,077 | $280,672 |
| Portfolio turnover rateF | 37% | 69% | 52% | 66%G | 51% |
A Calculated based on average shares outstanding during the period.
B Amount represents less than $.005 per share.
C Total returns would have been lower if certain expenses had not been reduced during the applicable periods shown.
D Fees and expenses of any underlying mutual funds or exchange-traded funds (ETFs) are not included in the Fund's expense ratio. The Fund indirectly bears its proportionate share of these expenses. For additional expense information related to investments in Fidelity Central Funds, please refer to the "Investments in Fidelity Central Funds" note found in the Notes to Financial Statements section of the most recent Annual or Semi-Annual report.
E Expense ratios reflect operating expenses of the class. Expenses before reductions do not reflect amounts reimbursed, waived, or reduced through arrangements with the investment adviser, brokerage services, or other offset arrangements, if applicable, and do not represent the amount paid by the class during periods when reimbursements, waivers or reductions occur.
F Amount does not include the portfolio activity of any underlying mutual funds or exchange-traded funds (ETFs).
G Portfolio turnover rate excludes securities received or delivered in-kind.
See accompanying notes which are an integral part of the financial statements.
Fidelity Total International Equity Fund Class I
| Years ended October 31, | 2020 | 2019 | 2018 | 2017 | 2016 |
| Selected Per–Share Data | | | | | |
| Net asset value, beginning of period | $9.35 | $8.19 | $9.38 | $7.66 | $7.78 |
| Income from Investment Operations | | | | | |
| Net investment income (loss)A | .08 | .16 | .10 | .11 | .10 |
| Net realized and unrealized gain (loss) | .34 | 1.07 | (.89) | 1.71 | (.13) |
| Total from investment operations | .42 | 1.23 | (.79) | 1.82 | (.03) |
| Distributions from net investment income | (.17) | (.07) | (.17) | (.10) | (.09) |
| Distributions from net realized gain | – | – | (.23) | – | – |
| Total distributions | (.17) | (.07) | (.40) | (.10) | (.09) |
| Redemption fees added to paid in capitalA | – | – | –B | –B | –B |
| Net asset value, end of period | $9.60 | $9.35 | $8.19 | $9.38 | $7.66 |
| Total ReturnC | 4.50% | 15.11% | (8.86)% | 24.08% | (.43)% |
| Ratios to Average Net AssetsD,E | | | | | |
| Expenses before reductions | 1.33% | 1.18% | 1.29% | 1.42% | 1.22% |
| Expenses net of fee waivers, if any | 1.14% | 1.18% | 1.20% | 1.20% | 1.20% |
| Expenses net of all reductions | 1.13% | 1.17% | 1.19% | 1.18% | 1.20% |
| Net investment income (loss) | .82% | 1.82% | 1.15% | 1.28% | 1.35% |
| Supplemental Data | | | | | |
| Net assets, end of period (000 omitted) | $2,073 | $3,086 | $9,405 | $6,776 | $2,156 |
| Portfolio turnover rateF | 37% | 69% | 52% | 66%G | 51% |
A Calculated based on average shares outstanding during the period.
B Amount represents less than $.005 per share.
C Total returns would have been lower if certain expenses had not been reduced during the applicable periods shown.
D Fees and expenses of any underlying mutual funds or exchange-traded funds (ETFs) are not included in the Fund's expense ratio. The Fund indirectly bears its proportionate share of these expenses. For additional expense information related to investments in Fidelity Central Funds, please refer to the "Investments in Fidelity Central Funds" note found in the Notes to Financial Statements section of the most recent Annual or Semi-Annual report.
E Expense ratios reflect operating expenses of the class. Expenses before reductions do not reflect amounts reimbursed, waived, or reduced through arrangements with the investment adviser, brokerage services, or other offset arrangements, if applicable, and do not represent the amount paid by the class during periods when reimbursements, waivers or reductions occur.
F Amount does not include the portfolio activity of any underlying mutual funds or exchange-traded funds (ETFs).
G Portfolio turnover rate excludes securities received or delivered in-kind.
See accompanying notes which are an integral part of the financial statements.
Fidelity Total International Equity Fund Class Z
| Years ended October 31, | 2020 | 2019 | 2018 | 2017 A |
| Selected Per–Share Data | | | | |
| Net asset value, beginning of period | $9.36 | $8.22 | $9.39 | $7.73 |
| Income from Investment Operations | | | | |
| Net investment income (loss)B | .09 | .18 | .12 | .08 |
| Net realized and unrealized gain (loss) | .35 | 1.05 | (.89) | 1.58 |
| Total from investment operations | .44 | 1.23 | (.77) | 1.66 |
| Distributions from net investment income | (.18) | (.09) | (.17) | – |
| Distributions from net realized gain | – | – | (.23) | – |
| Total distributions | (.18) | (.09) | (.40) | – |
| Redemption fees added to paid in capitalB | – | – | –C | –C |
| Net asset value, end of period | $9.62 | $9.36 | $8.22 | $9.39 |
| Total ReturnD,E | 4.74% | 15.13% | (8.63)% | 21.47% |
| Ratios to Average Net AssetsF,G | | | | |
| Expenses before reductions | 1.22% | 1.09% | 1.16% | 1.32%H |
| Expenses net of fee waivers, if any | .98% | 1.04% | 1.05% | 1.05%H |
| Expenses net of all reductions | .97% | 1.03% | 1.04% | 1.04%H |
| Net investment income (loss) | .99% | 1.97% | 1.30% | 1.27%H |
| Supplemental Data | | | | |
| Net assets, end of period (000 omitted) | $3,422 | $3,815 | $216 | $246 |
| Portfolio turnover rateI | 37% | 69% | 52% | 66%J |
A For the period February 1, 2017 (commencement of sale of shares) to October 31, 2017.
B Calculated based on average shares outstanding during the period.
C Amount represents less than $.005 per share.
D Total returns for periods of less than one year are not annualized.
E Total returns would have been lower if certain expenses had not been reduced during the applicable periods shown.
F Fees and expenses of any underlying mutual funds or exchange-traded funds (ETFs) are not included in the Fund's expense ratio. The Fund indirectly bears its proportionate share of these expenses. For additional expense information related to investments in Fidelity Central Funds, please refer to the "Investments in Fidelity Central Funds" note found in the Notes to Financial Statements section of the most recent Annual or Semi-Annual report.
G Expense ratios reflect operating expenses of the class. Expenses before reductions do not reflect amounts reimbursed, waived, or reduced through arrangements with the investment adviser, brokerage services, or other offset arrangements, if applicable, and do not represent the amount paid by the class during periods when reimbursements, waivers or reductions occur.
H Annualized
I Amount does not include the portfolio activity of any underlying mutual funds or exchange-traded funds (ETFs).
J Portfolio turnover rate excludes securities received or delivered in-kind.
See accompanying notes which are an integral part of the financial statements.
Notes to Financial Statements
For the period ended October 31, 2020
1. Organization.
Fidelity Total International Equity Fund (the Fund) is a fund of Fidelity Investment Trust (the Trust) and is authorized to issue an unlimited number of shares. The Trust is registered under the Investment Company Act of 1940, as amended (the 1940 Act), as an open-end management investment company organized as a Massachusetts business trust. The Fund offers Class A, Class M, Class C, Total International Equity, Class I and Class Z shares, each of which has equal rights as to assets and voting privileges. Each class has exclusive voting rights with respect to matters that affect that class. Class C shares will automatically convert to Class A shares after a holding period of ten years from the initial date of purchase, with certain exceptions. The Fund's investments in emerging markets can be subject to social, economic, regulatory, and political uncertainties and can be extremely volatile.
Effective January 1, 2020:
Investment advisers Fidelity Investments Money Management, Inc., FMR Co., Inc., and Fidelity SelectCo, LLC, merged with and into Fidelity Management & Research Company. In connection with the merger transactions, the resulting, merged investment adviser was then redomiciled from Massachusetts to Delaware, changed its corporate structure from a corporation to a limited liability company, and changed its name to "Fidelity Management & Research Company LLC".
Broker-dealer Fidelity Distributors Corporation merged with and into Fidelity Investments Institutional Services Company, Inc. ("FIISC"). FIISC was then redomiciled from Massachusetts to Delaware, changed its corporate structure from a corporation to a limited liability company, and changed its name to "Fidelity Distributors Company LLC".
Fidelity Investments Institutional Operations Company, Inc. converted from a Massachusetts corporation to a Massachusetts LLC, and changed its name to "Fidelity Investments Institutional Operations Company LLC".
2. Investments in Fidelity Central Funds.
The Fund invests in Fidelity Central Funds, which are open-end investment companies generally available only to other investment companies and accounts managed by the investment adviser and its affiliates. The Fund's Schedule of Investments lists each of the Fidelity Central Funds held as of period end, if any, as an investment of the Fund, but does not include the underlying holdings of each Fidelity Central Fund. As an Investing Fund, the Fund indirectly bears its proportionate share of the expenses of the underlying Fidelity Central Funds.
The Money Market Central Funds seek preservation of capital and current income and are managed by the investment adviser. Annualized expenses of the Money Market Central Funds as of their most recent shareholder report date ranged from less than .005% to .01%.
A complete unaudited list of holdings for each Fidelity Central Fund is available upon request or at the Securities and Exchange Commission (the SEC) website at www.sec.gov. In addition, the financial statements of the Fidelity Central Funds, which are not covered by the Fund's Report of Independent Registered Public Accounting Firm, are available on the SEC website or upon request.
3. Significant Accounting Policies.
The Fund is an investment company and applies the accounting and reporting guidance of the Financial Accounting Standards Board (FASB) Accounting Standards Codification Topic 946 Financial Services – Investment Companies. The financial statements have been prepared in conformity with accounting principles generally accepted in the United States of America (GAAP), which require management to make certain estimates and assumptions at the date of the financial statements. Actual results could differ from those estimates. Subsequent events, if any, through the date that the financial statements were issued have been evaluated in the preparation of the financial statements. The following summarizes the significant accounting policies of the Fund:
Investment Valuation. Investments are valued as of 4:00 p.m. Eastern time on the last calendar day of the period. The Board of Trustees (the Board) has delegated the day to day responsibility for the valuation of the Fund's investments to the Fair Value Committee (the Committee) established by the Fund's investment adviser. In accordance with valuation policies and procedures approved by the Board, the Fund attempts to obtain prices from one or more third party pricing vendors or brokers to value its investments. When current market prices, quotations or currency exchange rates are not readily available or reliable, investments will be fair valued in good faith by the Committee, in accordance with procedures adopted by the Board. Factors used in determining fair value vary by investment type and may include market or investment specific events. The frequency with which these procedures are used cannot be predicted and they may be utilized to a significant extent. The Committee oversees the Fund's valuation policies and procedures and reports to the Board on the Committee's activities and fair value determinations. The Board monitors the appropriateness of the procedures used in valuing the Fund's investments and ratifies the fair value determinations of the Committee.
The Fund categorizes the inputs to valuation techniques used to value its investments into a disclosure hierarchy consisting of three levels as shown below:
- Level 1 – quoted prices in active markets for identical investments
- Level 2 – other significant observable inputs (including quoted prices for similar investments, interest rates, prepayment speeds, etc.)
- Level 3 – unobservable inputs (including the Fund's own assumptions based on the best information available)
Valuation techniques used to value the Fund's investments by major category are as follows:
Equity securities, including restricted securities, for which market quotations are readily available, are valued at the last reported sale price or official closing price as reported by a third party pricing vendor on the primary market or exchange on which they are traded and are categorized as Level 1 in the hierarchy. In the event there were no sales during the day or closing prices are not available, securities are valued at the last quoted bid price or may be valued using the last available price and are generally categorized as Level 2 in the hierarchy. For foreign equity securities, when market or security specific events arise, comparisons to the valuation of American Depositary Receipts (ADRs), futures contracts, Exchange-Traded Funds (ETFs) and certain indexes as well as quoted prices for similar securities may be used and would be categorized as Level 2 in the hierarchy. For equity securities, including restricted securities, where observable inputs are limited, assumptions about market activity and risk are used and these securities may be categorized as Level 3 in the hierarchy.
Investments in open-end mutual funds, including the Fidelity Central Funds, are valued at their closing net asset value (NAV) each business day and are categorized as Level 1 in the hierarchy.
Changes in valuation techniques may result in transfers in or out of an assigned level within the disclosure hierarchy. The aggregate value of investments by input level as of October 31, 2020 is included at the end of the Fund's Schedule of Investments.
Foreign Currency. Certain Funds may use foreign currency contracts to facilitate transactions in foreign-denominated securities. Gains and losses from these transactions may arise from changes in the value of the foreign currency or if the counterparties do not perform under the contracts' terms.
Foreign-denominated assets, including investment securities, and liabilities are translated into U.S. dollars at the exchange rates at period end. Purchases and sales of investment securities, income and dividends received, and expenses denominated in foreign currencies are translated into U.S. dollars at the exchange rate in effect on the transaction date.
The effects of exchange rate fluctuations on investments are included with the net realized and unrealized gain (loss) on investment securities. Other foreign currency transactions resulting in realized and unrealized gain (loss) are disclosed separately.
Investment Transactions and Income. For financial reporting purposes, the Fund's investment holdings and NAV include trades executed through the end of the last business day of the period. The NAV per share for processing shareholder transactions is calculated as of the close of business of the New York Stock Exchange (NYSE), normally 4:00 p.m. Eastern time and includes trades executed through the end of the prior business day. Gains and losses on securities sold are determined on the basis of identified cost and include proceeds received from litigation. Dividend income is recorded on the ex-dividend date, except for certain dividends from foreign securities where the ex-dividend date may have passed, which are recorded as soon as the Fund is informed of the ex-dividend date. Non-cash dividends included in dividend income, if any, are recorded at the fair market value of the securities received. Income and capital gain distributions from Fidelity Central Funds, if any, are recorded on the ex-dividend date. Certain distributions received by the Fund represent a return of capital or capital gain. The Fund determines the components of these distributions subsequent to the ex-dividend date, based upon receipt of tax filings or other correspondence relating to the underlying investment. These distributions are recorded as a reduction of cost of investments and/or as a realized gain. Investment income is recorded net of foreign taxes withheld where recovery of such taxes is uncertain.
Class Allocations and Expenses. Investment income, realized and unrealized capital gains and losses, common expenses of the Fund, and certain fund-level expense reductions, if any, are allocated daily on a pro-rata basis to each class based on the relative net assets of each class to the total net assets of the Fund. Each class differs with respect to transfer agent and distribution and service plan fees incurred. Certain expense reductions may also differ by class. For the reporting period, the allocated portion of income and expenses to each class as a percent of its average net assets may vary due to the timing of recording these transactions in relation to fluctuating net assets of the classes. Expenses directly attributable to a fund are charged to that fund. Expenses attributable to more than one fund are allocated among the respective funds on the basis of relative net assets or other appropriate methods. Expense estimates are accrued in the period to which they relate and adjustments are made when actual amounts are known.
Income Tax Information and Distributions to Shareholders. Each year, the Fund intends to qualify as a regulated investment company under Subchapter M of the Internal Revenue Code, including distributing substantially all of its taxable income and realized gains. As a result, no provision for U.S. Federal income taxes is required. As of October 31, 2020, the Fund did not have any unrecognized tax benefits in the financial statements; nor is the Fund aware of any tax positions for which it is reasonably possible that the total amounts of unrecognized tax benefits will significantly change in the next twelve months. The Fund files a U.S. federal tax return, in addition to state and local tax returns as required. The Fund's federal income tax returns are subject to examination by the Internal Revenue Service (IRS) for a period of three fiscal years after they are filed. State and local tax returns may be subject to examination for an additional fiscal year depending on the jurisdiction. Foreign taxes are provided for based on the Fund's understanding of the tax rules and rates that exist in the foreign markets in which it invests. The Fund is subject to a tax imposed on capital gains by certain countries in which it invests. An estimated deferred tax liability for net unrealized appreciation on the applicable securities is included in Other payables and accrued expenses on the Statement of Assets & Liabilities.
Distributions are declared and recorded on the ex-dividend date. Income and capital gain distributions are declared separately for each class. Income and capital gain distributions are determined in accordance with income tax regulations, which may differ from GAAP. In addition, the Fund claimed a portion of the payment made to redeeming shareholders as a distribution for income tax purposes.
Capital accounts within the financial statements are adjusted for permanent book-tax differences. These adjustments have no impact on net assets or the results of operations. Capital accounts are not adjusted for temporary book-tax differences which will reverse in a subsequent period.
Book-tax differences are primarily due to foreign currency transactions, certain foreign taxes, passive foreign investment companies (PFIC) and losses deferred due to wash sales.
As of period end, the cost and unrealized appreciation (depreciation) in securities, and derivatives if applicable, for federal income tax purposes were as follows:
| Gross unrealized appreciation | $21,957,484 |
| Gross unrealized depreciation | (7,931,747) |
| Net unrealized appreciation (depreciation) | $14,025,737 |
| Tax Cost | $70,891,847 |
The tax-based components of distributable earnings as of period end were as follows:
| Undistributed ordinary income | $1,145,288 |
| Undistributed long-term capital gain | $1,235,259 |
| Net unrealized appreciation (depreciation) on securities and other investments | $14,042,290 |
The tax character of distributions paid was as follows:
| | October 31, 2020 | October 31, 2019 |
| Ordinary Income | $1,600,384 | $ 764,278 |
| Long-term Capital Gains | – | 21 |
| Total | $1,600,384 | $ 764,299 |
Restricted Securities (including Private Placements). The Fund may invest in securities that are subject to legal or contractual restrictions on resale. These securities generally may be resold in transactions exempt from registration or to the public if the securities are registered. Disposal of these securities may involve time-consuming negotiations and expense, and prompt sale at an acceptable price may be difficult. Information regarding restricted securities is included at the end of the Fund's Schedule of Investments.
4. Purchases and Sales of Investments.
Purchases and sales of securities, other than short-term securities, are noted in the table below.
| | Purchases ($) | Sales ($) |
| Fidelity Total International Equity Fund | 33,375,615 | 49,611,321 |
5. Fees and Other Transactions with Affiliates.
Management Fee. Fidelity Management & Research Company LLC (the investment adviser) and its affiliates provide the Fund with investment management related services for which the Fund pays a monthly management fee. The management fee is the sum of an individual fund fee rate that is based on an annual rate of .45% of the Fund's average net assets and an annualized group fee rate that averaged .23% during the period. The group fee rate is based upon the monthly average net assets of a group of registered investment companies with which the investment adviser has management contracts. The group fee rate decreases as assets under management increase and increases as assets under management decrease. In addition, the management fee is subject to a performance adjustment (up to a maximum of +/- .20% of the Fund's average net assets over a 36 month performance period). The upward or downward adjustment to the management fee is based on the relative investment performance of Total International Equity as compared to its benchmark index, the MSCI All Country World ex USA Index, over the same 36 month performance period. For the reporting period, the total annual management fee rate, including the performance adjustment, was .87% of the Fund's average net assets. The performance adjustment included in the management fee rate may be higher or lower than the maximum performance adjustment rate due to the difference between the average net assets for the reporting and performance periods.
Distribution and Service Plan Fees. In accordance with Rule 12b-1 of the 1940 Act, the Fund has adopted separate Distribution and Service Plans for each class of shares. Certain classes pay Fidelity Distributors Company LLC (FDC), an affiliate of the investment adviser, separate Distribution and Service Fees, each of which is based on an annual percentage of each class' average net assets. In addition, FDC may pay financial intermediaries for selling shares of the Fund and providing shareholder support services. For the period, the Distribution and Service Fee rates, total fees and amounts retained by FDC were as follows:
| | Distribution Fee | Service Fee | Total Fees | Retained by FDC |
| Class A | -% | .25% | $16,415 | $122 |
| Class M | .25% | .25% | 54,620 | 361 |
| Class C | .75% | .25% | 19,062 | 2,965 |
| | | | $90,097 | $3,448 |
Sales Load. FDC may receive a front-end sales charge of up to 5.75% for selling Class A shares and 3.50% for selling Class M shares, some of which is paid to financial intermediaries for selling shares of the Fund. Depending on the holding period, FDC may receive contingent deferred sales charges levied on Class A, Class M and Class C redemptions. The deferred sales charges are 1.00% for Class C shares, 1.00% for certain purchases of Class A shares and .25% for certain purchases of Class M shares.
For the period, sales charge amounts retained by FDC were as follows:
| | Retained by FDC |
| Class A | $1,259 |
| Class M | 537 |
| Class C(a) | 276 |
| | $2,072 |
(a) When Class C shares are initially sold, FDC pays commissions from its own resources to financial intermediaries through which the sales are made.
Transfer Agent Fees. Fidelity Investments Institutional Operations Company LLC (FIIOC), an affiliate of the investment adviser, is the transfer, dividend disbursing and shareholder servicing agent for each class of the Fund. FIIOC receives account fees and asset-based fees that vary according to the account size and type of account of the shareholders of the respective classes of the Fund, except for Class Z. FIIOC receives an asset-based fee of Class Z's average net assets. FIIOC pays for typesetting, printing and mailing of shareholder reports, except proxy statements. Effective February 1, 2020, the Board approved to change the fee for Class Z from .046% to .044%.
For the period, transfer agent fees for each class were as follows:
| | Amount | % of Class-Level Average Net Assets |
| Class A | $15,553 | .24 |
| Class M | 25,074 | .23 |
| Class C | 5,446 | .29 |
| Total International Equity | 108,706 | .17 |
| Class I | 4,253 | .15 |
| Class Z | 1,544 | .04 |
| | $160,576 | |
Accounting Fees. Fidelity Service Company, Inc. (FSC), an affiliate of the investment adviser, maintains the Fund's accounting records. The accounting fee is based on the level of average net assets for each month. For the period, the fees were equivalent to the following annual rates:
| | % of Average Net Assets |
| Fidelity Total International Equity Fund | .05 |
Brokerage Commissions. A portion of portfolio transactions were placed with brokerage firms which are affiliates of the investment adviser. Brokerage commissions are included in net realized gain (loss) and change in net unrealized appreciation (depreciation) in the Statement of Operations. The commissions paid to these affiliated firms were as follows:
| | Amount |
| Fidelity Total International Equity Fund | $168 |
Interfund Trades. Funds may purchase from or sell securities to other Fidelity Funds under procedures adopted by the Board. The procedures have been designed to ensure these interfund trades are executed in accordance with Rule 17a-7 of the 1940 Act. Interfund trades are included within the respective purchases and sales amounts shown in the Purchases and Sales of Investments note.
6. Committed Line of Credit.
Certain Funds participate with other funds managed by the investment adviser or an affiliate in a $4.25 billion credit facility (the "line of credit") to be utilized for temporary or emergency purposes to fund shareholder redemptions or for other short-term liquidity purposes. The participating funds have agreed to pay commitment fees on their pro-rata portion of the line of credit, which are reflected in Miscellaneous expenses on the Statement of Operations, and are as follows:
| | Amount |
| Fidelity Total International Equity Fund | $217 |
During the period, there were no borrowings on this line of credit.
7. Security Lending.
Funds lend portfolio securities from time to time in order to earn additional income. Lending agents are used, including National Financial Services (NFS), an affiliate of the investment adviser. Pursuant to a securities lending agreement, NFS will receive a fee, which is capped at 9.9% of a fund's daily lending revenue, for its services as lending agent. A fund may lend securities to certain qualified borrowers, including NFS. On the settlement date of the loan, a fund receives collateral (in the form of U.S. Treasury obligations, letters of credit and/or cash) against the loaned securities and maintains collateral in an amount not less than 100% of the market value of the loaned securities during the period of the loan. The market value of the loaned securities is determined at the close of business of a fund and any additional required collateral is delivered to a fund on the next business day. A fund or borrower may terminate the loan at any time, and if the borrower defaults on its obligation to return the securities loaned because of insolvency or other reasons, a fund may apply collateral received from the borrower against the obligation. A fund may experience delays and costs in recovering the securities loaned. Any cash collateral received is invested in the Fidelity Securities Lending Cash Central Fund. Any loaned securities are identified as such in the Schedule of Investments, and the value of loaned securities and cash collateral at period end, as applicable, are presented in the Statement of Assets and Liabilities. Security lending income represents the income earned on investing cash collateral, less rebates paid to borrowers and any lending agent fees associated with the loan, plus any premium payments received for lending certain types of securities. Security lending income is presented in the Statement of Operations as a component of income from Fidelity Central Funds. Affiliated security lending activity, if any, was as follows:
| | Total Security Lending Income Fees Paid to NFS | Security Lending Income From Securities Loaned to NFS | Value of Securities Loaned to NFS at Period End |
| Fidelity Total International Equity Fund | $– | $– | $– |
8. Expense Reductions.
The investment adviser contractually agreed to reimburse expenses of each class to the extent annual operating expenses exceeded certain levels of class-level average net assets as noted in the table below. This reimbursement will remain in place through February 28, 2022. Some expenses, for example the compensation of the independent Trustees, and certain miscellaneous expenses such as proxy and shareholder meeting expenses, are excluded from this reimbursement.
The following classes were in reimbursement during the period:
| | Expense Limitations | Reimbursement |
| Class A | 1.45% / 1.35%(a) | $18,023 |
| Class M | 1.70% / 1.60%(a) | 29,327 |
| Class C | 2.20% / 2.10%(a) | 6,159 |
| Total International Equity | 1.20% / 1.10%(a) | 134,001 |
| Class I | 1.20% / 1.10%(a) | 5,053 |
| Class Z | 1.05% / .95%(a) | 8,338 |
| | | $200,901 |
(a) Expense limitation effective February 1, 2020.
Commissions paid to certain brokers with whom the investment adviser, or its affiliates, places trades on behalf of the Fund include an amount in addition to trade execution, which may be rebated back to the Fund to offset certain expenses. This amount totaled $14,541 for the period.
In addition, during the period the investment adviser or an affiliate reimbursed and/or waived a portion of fund-level operating expenses in the amount of $405.
9. Distributions to Shareholders.
Distributions to shareholders of each class were as follows:
| | Year ended
October 31, 2020 | Year ended
October 31, 2019 |
| Distributions to shareholders | | |
| Class A | $106,902 | $46,299 |
| Class M | 141,808 | 27,216 |
| Class C | 15,508 | – |
| Total International Equity | 1,209,290 | 657,302 |
| Class I | 54,292 | 31,377 |
| Class Z | 72,584 | 2,105 |
| Total | $1,600,384 | $764,299 |
10. Share Transactions.
Share transactions for each class were as follows and may contain automatic conversions between classes or exchanges between affiliated funds:
| | Shares | Shares | Dollars | Dollars |
| | Year ended October 31, 2020 | Year ended October 31, 2019 | Year ended October 31, 2020 | Year ended October 31, 2019 |
| Class A | | | | |
| Shares sold | 79,098 | 137,444 | $666,523 | $1,178,771 |
| Reinvestment of distributions | 11,309 | 5,828 | 106,875 | 46,279 |
| Shares redeemed | (232,060) | (285,183) | (2,158,548) | (2,496,834) |
| Net increase (decrease) | (141,653) | (141,911) | $(1,385,150) | $(1,271,784) |
| Class M | | | | |
| Shares sold | 65,659 | 51,083 | $575,207 | $438,752 |
| Reinvestment of distributions | 14,911 | 3,402 | 141,808 | 27,216 |
| Shares redeemed | (230,047) | (249,013) | (2,160,487) | (2,185,232) |
| Net increase (decrease) | (149,477) | (194,528) | $(1,443,472) | $(1,719,264) |
| Class C | | | | |
| Shares sold | 29,466 | 50,549 | $274,362 | $435,371 |
| Reinvestment of distributions | 1,633 | – | 15,483 | – |
| Shares redeemed | (76,912) | (144,648) | (700,199) | (1,245,139) |
| Net increase (decrease) | (45,813) | (94,099) | $(410,354) | $(809,768) |
| Total International Equity | | | | |
| Shares sold | 994,251 | 861,198 | $8,883,804 | $7,437,666 |
| Reinvestment of distributions | 118,078 | 76,720 | 1,117,023 | 609,928 |
| Shares redeemed | (2,239,449) | (2,087,974) | (20,102,869) | (18,014,198) |
| Net increase (decrease) | (1,127,120) | (1,150,056) | $(10,102,042) | $(9,966,604) |
| Class I | | | | |
| Shares sold | 64,423 | 268,632 | $602,048 | $2,311,059 |
| Reinvestment of distributions | 5,372 | 3,542 | 50,662 | 28,087 |
| Shares redeemed | (184,160) | (1,089,632) | (1,684,471) | (9,019,644) |
| Net increase (decrease) | (114,365) | (817,458) | $(1,031,761) | $(6,680,498) |
| Class Z | | | | |
| Shares sold | 99,865 | 439,804 | $885,828 | $3,842,585 |
| Reinvestment of distributions | 7,494 | 257 | 70,665 | 2,035 |
| Shares redeemed | (159,186) | (58,782) | (1,455,280) | (509,296) |
| Net increase (decrease) | (51,827) | 381,279 | $(498,787) | $3,335,324 |
11. Other.
The Fund's organizational documents provide former and current trustees and officers with a limited indemnification against liabilities arising in connection with the performance of their duties to the Fund. In the normal course of business, the Fund may also enter into contracts that provide general indemnifications. The Fund's maximum exposure under these arrangements is unknown as this would be dependent on future claims that may be made against the Fund. The risk of material loss from such claims is considered remote.
12. Coronavirus (COVID-19) Pandemic.
An outbreak of COVID-19 first detected in China during December 2019 has since spread globally and was declared a pandemic by the World Health Organization during March 2020. Developments that disrupt global economies and financial markets, such as the COVID-19 pandemic, may magnify factors that affect the Fund's performance.
Report of Independent Registered Public Accounting Firm
To the Board of Trustees of Fidelity Investment Trust and Shareholders of Fidelity Total International Equity Fund:
Opinion on the Financial Statements and Financial Highlights
We have audited the accompanying statement of assets and liabilities of Fidelity Total International Equity Fund (the "Fund"), a fund of Fidelity Investment Trust, including the schedule of investments, as of October 31, 2020, the related statement of operations for the year then ended, the statement of changes in net assets for each of the two years in the period then ended, the financial highlights for each of the five years in the period then ended, and the related notes. In our opinion, the financial statements and financial highlights present fairly, in all material respects, the financial position of the Fund as of October 31, 2020, and the results of its operations for the year then ended, the changes in its net assets for each of the two years in the period then ended, and the financial highlights for each of the five years in the period then ended in conformity with accounting principles generally accepted in the United States of America.
Basis for Opinion
These financial statements and financial highlights are the responsibility of the Fund's management. Our responsibility is to express an opinion on the Fund's financial statements and financial highlights based on our audits. We are a public accounting firm registered with the Public Company Accounting Oversight Board (United States) (PCAOB) and are required to be independent with respect to the Fund in accordance with the U.S. federal securities laws and the applicable rules and regulations of the Securities and Exchange Commission and the PCAOB.
We conducted our audits in accordance with the standards of the PCAOB. Those standards require that we plan and perform the audit to obtain reasonable assurance about whether the financial statements and financial highlights are free of material misstatement, whether due to error or fraud. The Fund is not required to have, nor were we engaged to perform, an audit of its internal control over financial reporting. As part of our audits we are required to obtain an understanding of internal control over financial reporting but not for the purpose of expressing an opinion on the effectiveness of the Fund’s internal control over financial reporting. Accordingly, we express no such opinion.
Our audits included performing procedures to assess the risks of material misstatement of the financial statements and financial highlights, whether due to error or fraud, and performing procedures that respond to those risks. Such procedures included examining, on a test basis, evidence regarding the amounts and disclosures in the financial statements and financial highlights. Our audits also included evaluating the accounting principles used and significant estimates made by management, as well as evaluating the overall presentation of the financial statements and financial highlights. Our procedures included confirmation of securities owned as of October 31, 2020, by correspondence with the custodian and brokers; when replies were not received from brokers, we performed other auditing procedures. We believe that our audits provide a reasonable basis for our opinion.
/s/ Deloitte & Touche LLP
Boston, Massachusetts
December 14, 2020
We have served as the auditor of one or more of the Fidelity investment companies since 1999.
Trustees and Officers
The Trustees, Members of the Advisory Board (if any), and officers of the trust and fund, as applicable, are listed below. The Board of Trustees governs the fund and is responsible for protecting the interests of shareholders. The Trustees are experienced executives who meet periodically throughout the year to oversee the fund's activities, review contractual arrangements with companies that provide services to the fund, oversee management of the risks associated with such activities and contractual arrangements, and review the fund's performance. Except for Jonathan Chiel, each of the Trustees oversees 305 funds. Mr. Chiel oversees 176 funds.
The Trustees hold office without limit in time except that (a) any Trustee may resign; (b) any Trustee may be removed by written instrument, signed by at least two-thirds of the number of Trustees prior to such removal; (c) any Trustee who requests to be retired or who has become incapacitated by illness or injury may be retired by written instrument signed by a majority of the other Trustees; and (d) any Trustee may be removed at any special meeting of shareholders by a two-thirds vote of the outstanding voting securities of the trust. Each Trustee who is not an interested person (as defined in the 1940 Act) of the trust and the fund is referred to herein as an Independent Trustee. Each Independent Trustee shall retire not later than the last day of the calendar year in which his or her 75th birthday occurs. The Independent Trustees may waive this mandatory retirement age policy with respect to individual Trustees. Officers and Advisory Board Members hold office without limit in time, except that any officer or Advisory Board Member may resign or may be removed by a vote of a majority of the Trustees at any regular meeting or any special meeting of the Trustees. Except as indicated, each individual has held the office shown or other offices in the same company for the past five years.
The fund's Statement of Additional Information (SAI) includes more information about the Trustees. To request a free copy, call Fidelity at 1-800-544-8544 if you’re an individual investing directly with Fidelity, call 1-800-835-5092 if you’re a plan sponsor or participant with Fidelity as your recordkeeper or call 1-877-208-0098 on institutional accounts or if you’re an advisor or invest through one.
Experience, Skills, Attributes, and Qualifications of the Trustees. The Governance and Nominating Committee has adopted a statement of policy that describes the experience, qualifications, attributes, and skills that are necessary and desirable for potential Independent Trustee candidates (Statement of Policy). The Board believes that each Trustee satisfied at the time he or she was initially elected or appointed a Trustee, and continues to satisfy, the standards contemplated by the Statement of Policy. The Governance and Nominating Committee also engages professional search firms to help identify potential Independent Trustee candidates who have the experience, qualifications, attributes, and skills consistent with the Statement of Policy. From time to time, additional criteria based on the composition and skills of the current Independent Trustees, as well as experience or skills that may be appropriate in light of future changes to board composition, business conditions, and regulatory or other developments, have also been considered by the professional search firms and the Governance and Nominating Committee. In addition, the Board takes into account the Trustees' commitment and participation in Board and committee meetings, as well as their leadership of standing and ad hoc committees throughout their tenure.
In determining that a particular Trustee was and continues to be qualified to serve as a Trustee, the Board has considered a variety of criteria, none of which, in isolation, was controlling. The Board believes that, collectively, the Trustees have balanced and diverse experience, qualifications, attributes, and skills, which allow the Board to operate effectively in governing the fund and protecting the interests of shareholders. Information about the specific experience, skills, attributes, and qualifications of each Trustee, which in each case led to the Board's conclusion that the Trustee should serve (or continue to serve) as a trustee of the fund, is provided below.
Board Structure and Oversight Function. Robert A. Lawrence is an interested person and currently serves as Acting Chairman. The Trustees have determined that an interested Chairman is appropriate and benefits shareholders because an interested Chairman has a personal and professional stake in the quality and continuity of services provided to the fund. Independent Trustees exercise their informed business judgment to appoint an individual of their choosing to serve as Chairman, regardless of whether the Trustee happens to be independent or a member of management. The Independent Trustees have determined that they can act independently and effectively without having an Independent Trustee serve as Chairman and that a key structural component for assuring that they are in a position to do so is for the Independent Trustees to constitute a substantial majority for the Board. The Independent Trustees also regularly meet in executive session. Ned C. Lautenbach and David M. Thomas serve as Co-Lead Independent Trustees and as such each (i) acts as a liaison between the Independent Trustees and management with respect to matters important to the Independent Trustees and (ii) with management prepares agendas for Board meetings.
Fidelity® funds are overseen by different Boards of Trustees. The fund's Board oversees Fidelity's high income and certain equity funds, and other Boards oversee Fidelity's investment-grade bond, money market, asset allocation, and other equity funds. The asset allocation funds may invest in Fidelity® funds overseen by the fund's Board. The use of separate Boards, each with its own committee structure, allows the Trustees of each group of Fidelity® funds to focus on the unique issues of the funds they oversee, including common research, investment, and operational issues. On occasion, the separate Boards establish joint committees to address issues of overlapping consequences for the Fidelity® funds overseen by each Board.
The Trustees operate using a system of committees to facilitate the timely and efficient consideration of all matters of importance to the Trustees, the fund, and fund shareholders and to facilitate compliance with legal and regulatory requirements and oversight of the fund's activities and associated risks. The Board, acting through its committees, has charged FMR and its affiliates with (i) identifying events or circumstances the occurrence of which could have demonstrably adverse effects on the fund's business and/or reputation; (ii) implementing processes and controls to lessen the possibility that such events or circumstances occur or to mitigate the effects of such events or circumstances if they do occur; and (iii) creating and maintaining a system designed to evaluate continuously business and market conditions in order to facilitate the identification and implementation processes described in (i) and (ii) above. Because the day-to-day operations and activities of the fund are carried out by or through FMR, its affiliates, and other service providers, the fund's exposure to risks is mitigated but not eliminated by the processes overseen by the Trustees. While each of the Board's committees has responsibility for overseeing different aspects of the fund's activities, oversight is exercised primarily through the Operations, Audit, and Compliance Committees. Appropriate personnel, including but not limited to the fund's Chief Compliance Officer (CCO), FMR's internal auditor, the independent accountants, the fund's Treasurer and portfolio management personnel, make periodic reports to the Board's committees, as appropriate, including an annual review of Fidelity's risk management program for the Fidelity® funds. The responsibilities of each standing committee, including their oversight responsibilities, are described further under "Standing Committees of the Trustees."
Interested Trustees*:
Correspondence intended for a Trustee who is an interested person may be sent to Fidelity Investments, 245 Summer Street, Boston, Massachusetts 02210.
Name, Year of Birth; Principal Occupations and Other Relevant Experience+
Jonathan Chiel (1957)
Year of Election or Appointment: 2016
Trustee
Mr. Chiel also serves as Trustee of other Fidelity® funds. Mr. Chiel is Executive Vice President and General Counsel for FMR LLC (diversified financial services company, 2012-present). Previously, Mr. Chiel served as general counsel (2004-2012) and senior vice president and deputy general counsel (2000-2004) for John Hancock Financial Services; a partner with Choate, Hall & Stewart (1996-2000) (law firm); and an Assistant United States Attorney for the United States Attorney’s Office of the District of Massachusetts (1986-95), including Chief of the Criminal Division (1993-1995). Mr. Chiel is a director on the boards of the Boston Bar Foundation and the Maimonides School.
Robert A. Lawrence (1952)
Year of Election or Appointment: 2020
Trustee
Acting Chairman of the Board of Trustees
Mr. Lawrence also serves as Trustee of other funds. Previously, Mr. Lawrence served as a Member of the Advisory Board of certain funds. Prior to his retirement in 2008, Mr. Lawrence served as Vice President of certain Fidelity® funds (2006-2008), Senior Vice President, Head of High Income Division of Fidelity Management & Research Company (investment adviser firm, 2006-2008), and President of Fidelity Strategic Investments (investment adviser firm, 2002-2005).
* Determined to be an “Interested Trustee” by virtue of, among other things, his or her affiliation with the trust or various entities under common control with FMR.
+ The information includes the Trustee's principal occupation during the last five years and other information relating to the experience, attributes, and skills relevant to the Trustee's qualifications to serve as a Trustee, which led to the conclusion that the Trustee should serve as a Trustee for the fund.
Independent Trustees:
Correspondence intended for an Independent Trustee may be sent to Fidelity Investments, P.O. Box 55235, Boston, Massachusetts 02205-5235.
Name, Year of Birth; Principal Occupations and Other Relevant Experience+
Dennis J. Dirks (1948)
Year of Election or Appointment: 2005
Trustee
Mr. Dirks also serves as Trustee of other Fidelity® funds. Prior to his retirement in May 2003, Mr. Dirks served as Chief Operating Officer and as a member of the Board of The Depository Trust & Clearing Corporation (financial markets infrastructure), President, Chief Operating Officer and a member of the Board of The Depository Trust Company (DTC), President and a member of the Board of the National Securities Clearing Corporation (NSCC), Chief Executive Officer and a member of the Board of the Government Securities Clearing Corporation and Chief Executive Officer and a member of the Board of the Mortgage-Backed Securities Clearing Corporation. Mr. Dirks currently serves as a member of the Finance Committee (2016-present) and Board (2017-present) and is Treasurer (2018-present) of the Asolo Repertory Theatre.
Donald F. Donahue (1950)
Year of Election or Appointment: 2018
Trustee
Mr. Donahue also serves as Trustee of other Fidelity® funds. Mr. Donahue serves as President and Chief Executive Officer of Miranda Partners, LLC (risk consulting for the financial services industry, 2012-present). Previously, Mr. Donahue served as Chief Executive Officer (2006-2012), Chief Operating Officer (2003-2006) and Managing Director, Customer Marketing and Development (1999-2003) of The Depository Trust & Clearing Corporation (financial markets infrastructure). Mr. Donahue currently serves as a member (2007-present) and Co-Chairman (2016-present) of the Board of United Way of New York, a member of the Board of NYC Leadership Academy (2012-present) and a member of the Board of Advisors of Ripple Labs, Inc. (financial services, 2015-present). Mr. Donahue previously served as a member of the Advisory Board of certain Fidelity® funds (2015-2018).
Vicki L. Fuller (1957)
Year of Election or Appointment: 2020
Trustee
Ms. Fuller also serves as Trustee of other Fidelity® funds. Previously, Ms. Fuller served as a member of the Advisory Board of certain Fidelity® funds (2018-2020), Chief Investment Officer of the New York State Common Retirement Fund (2012-2018) and held a variety of positions at AllianceBernstein L.P. (global asset management, 1985-2012), including Managing Director (2006-2012) and Senior Vice President and Senior Portfolio Manager (2001-2006). Ms. Fuller currently serves as a member of the Board, Audit Committee and Nominating and Governance Committee of The Williams Companies, Inc. (natural gas infrastructure, 2018-present), as a member of the Board, Audit Committee and Nominating and Governance Committee of two Blackstone business development companies (2020-present) and as a member of the Board of Treliant, LLC (consulting, 2019-present).
Patricia L. Kampling (1959)
Year of Election or Appointment: 2020
Trustee
Ms. Kampling also serves as Trustee of other Fidelity® funds. Prior to her retirement, Ms. Kampling served as Chairman of the Board and Chief Executive Officer (2012-2019), President and Chief Operating Officer (2011-2012) and Executive Vice President and Chief Financial Officer (2010-2011) of Alliant Energy Corporation. Ms. Kampling currently serves as a member of the Board, Compensation Committee and Executive Committee and as Chair of the Audit Committee of Briggs & Stratton Corporation (manufacturing, 2011-present) and as a member of the Board, Audit, Finance and Risk Committee and Safety, Environmental, Technology and Operations Committee of American Water Works Company, Inc. (utilities company, 2019-present). In addition, Ms. Kampling currently serves as a member of the Board of the Nature Conservancy, Wisconsin Chapter (2019-present). Previously, Ms. Kampling served as a Member of the Advisory Board of certain Fidelity® funds (2020), a member of the Board of Interstate Power and Light Company (2012-2019) and Wisconsin Power and Light Company (2012-2019) (each a subsidiary of Alliant Energy Corporation) and as a member of the Board and Workforce Development Committee of the Business Roundtable (2018-2019).
Alan J. Lacy (1953)
Year of Election or Appointment: 2008
Trustee
Mr. Lacy also serves as Trustee of other Fidelity® funds. Previously, Mr. Lacy served as Senior Adviser (2007-2014) of Oak Hill Capital Partners, L.P. (private equity), Chief Executive Officer (2005) and Vice Chairman (2005-2006) of Sears Holdings Corporation (retail), Chief Executive Officer and Chairman of the Board of Sears, Roebuck and Co. (retail, 2000-2005), Chairman (2014-2017) and a member of the Board (2010-2017) of Dave & Buster’s Entertainment, Inc. (restaurant and entertainment complexes) and a member of the Board of Bristol-Myers Squibb Company (global pharmaceuticals, 2008-2020). Mr. Lacy currently serves as a Trustee of the California Chapter of The Nature Conservancy (2015-present) and a member of the Board of the Center for Advanced Study in the Behavioral Sciences at Stanford University (2015-present).
Ned C. Lautenbach (1944)
Year of Election or Appointment: 2000
Trustee
Co-Lead Independent Trustee
Mr. Lautenbach also serves as Trustee of other Fidelity® funds. Mr. Lautenbach currently serves as Chair of the Board of Governors, State University System of Florida (2013-present) and is a member of the Council on Foreign Relations (1994-present). He is also a member and has in the past served as Chairman of the Board of Directors of Artis-Naples (2012-present). Previously, Mr. Lautenbach served as a member and then Lead Director of the Board of Directors of Eaton Corporation (diversified industrial, 1997-2016). He was also a Partner at Clayton, Dubilier & Rice, LLC (private equity investment, 1998-2010); as well as Director of Sony Corporation (2006-2007). In addition, Mr. Lautenbach had a 30-year career with IBM (technology company), during which time he served as Senior Vice President and as a member of the Corporate Executive Committee (1968-1998).
Joseph Mauriello (1944)
Year of Election or Appointment: 2008
Trustee
Mr. Mauriello also serves as Trustee of other Fidelity® funds. Prior to his retirement in January 2006, Mr. Mauriello served in numerous senior management positions including Deputy Chairman and Chief Operating Officer (2004-2005), and Vice Chairman of Financial Services (2002-2004) of KPMG LLP US (professional services, 1965-2005). Mr. Mauriello currently serves as a member of the Independent Directors Council Governing Council (2015-present). Previously, Mr. Mauriello served as a member of the Board of XL Group plc. (global insurance and re-insurance, 2006-2018).
Cornelia M. Small (1944)
Year of Election or Appointment: 2005
Trustee
Ms. Small also serves as Trustee of other Fidelity® funds. Previously, Ms. Small served as Chief Investment Officer, Director of Global Equity Investments and a member of Scudder, Stevens & Clark and Scudder Kemper Investments. Ms. Small previously served as a member of the Board (2009-2019) and Chair of the Investment Committee (2010-2019) of the Teagle Foundation and a member of the Investment Committee of the Berkshire Taconic Community Foundation (2008-2019).
Garnett A. Smith (1947)
Year of Election or Appointment: 2018
Trustee
Mr. Smith also serves as Trustee of other Fidelity® funds. Prior to his retirement, Mr. Smith served as Chairman and Chief Executive Officer (1990-1997) and President (1986-1990) of Inbrand Corp. (manufacturer of personal absorbent products). Prior to his employment with Inbrand Corp., he was employed by a retail fabric chain and North Carolina National Bank (now Bank of America). Mr. Smith previously served as a member of the Advisory Board of certain Fidelity® funds (2012-2013).
David M. Thomas (1949)
Year of Election or Appointment: 2008
Trustee
Co-Lead Independent Trustee
Mr. Thomas also serves as Trustee of other Fidelity® funds. Previously, Mr. Thomas served as Executive Chairman (2005-2006) and Chairman and Chief Executive Officer (2000-2005) of IMS Health, Inc. (pharmaceutical and healthcare information solutions). Mr. Thomas currently serves as Non-Executive Chairman of the Board of Fortune Brands Home and Security (home and security products, 2011-present), and a member of the Board (2004-present) and Presiding Director (2013-present) of Interpublic Group of Companies, Inc. (marketing communication).
Susan Tomasky (1953)
Year of Election or Appointment: 2020
Trustee
Ms. Tomasky also serves as Trustee of other Fidelity® funds. Prior to her retirement, Ms. Tomasky served in various executive officer positions at American Electric Power Company, Inc. (1998-2011), including most recently as President of AEP Transmission (2007-2011). Ms. Tomasky currently serves as a member of the Board and Sustainability Committee and as Chair of the Audit Committee of Marathon Petroleum Corporation (2018-present) and as a member of the Board, Corporate Governance Committee and Organization and Compensation Committee and as Chair of the Audit Committee of Public Service Enterprise Group, Inc. (utilities company, 2012-present). In addition, Ms. Tomasky currently serves as a member of the Board of the Columbus Regional Airport Authority (2007-present), as a member of the Board of the Royal Shakespeare Company – America (2009-present), as a member of the Board of the Columbus Association for the Performing Arts (2011-present) and as a member of the Board of Kenyon College (2016-present). Previously, Ms. Tomasky served as a Member of the Advisory Board of certain Fidelity® funds (2020), a member of the Board (2011-2019) and as Lead Independent Director (2015-2018) of Andeavor Corporation (previously Tesoro Corporation) (independent oil refiner and marketer) and as a member of the Board of Summit Midstream Partners LP (energy, 2012-2018).
Michael E. Wiley (1950)
Year of Election or Appointment: 2020
Trustee
Mr. Wiley also serves as Trustee of other Fidelity® funds. Previously, Mr. Wiley served as a member of the Advisory Board of certain Fidelity® funds (2018-2020), Chairman, President and CEO of Baker Hughes, Inc. (oilfield services, 2000-2004). Mr. Wiley also previously served as a member of the Board of Andeavor Corporation (independent oil refiner and marketer, 2005-2018), a member of the Board of Andeavor Logistics LP (natural resources logistics, 2015-2018) and a member of the Board of High Point Resources (exploration and production, 2005-2020).
+ The information includes the Trustee's principal occupation during the last five years and other information relating to the experience, attributes, and skills relevant to the Trustee's qualifications to serve as a Trustee, which led to the conclusion that the Trustee should serve as a Trustee for the fund.
Advisory Board Members and Officers:
Correspondence intended for a Member of the Advisory Board (if any) may be sent to Fidelity Investments, P.O. Box 55235, Boston, Massachusetts 02205-5235. Correspondence intended for an officer or Peter S. Lynch may be sent to Fidelity Investments, 245 Summer Street, Boston, Massachusetts 02210. Officers appear below in alphabetical order.
Name, Year of Birth; Principal Occupation
Lloyd James Austin, III (1953)
Year of Election or Appointment: 2020
Member of the Advisory Board
General Austin also serves as a Member of the Advisory Board of other Fidelity® funds. Prior to his retirement, General Austin (United States Army, Retired) held a variety of positions within the U.S. Government, including Commander, U.S. Central Command (2013-2016), Vice Chief of Staff, U.S. Army (2012-2013) and Commanding General, U.S. Forces – Iraq, Operation New Dawn (2010-2012). General Austin currently serves as a Partner of Pine Island Capital Partners (private equity, 2020-present) and as President of the Austin Strategy Group LLC (consulting, 2016-present). General Austin serves as a member of the Board of Directors of Nucor Corporation (steel products, 2017-present), as a member of the Board of Directors of Tenet Healthcare Corporation (2018-present) and as a member of the Board of Directors of Raytheon Technologies Corporation (aerospace and defense, 2020-present). In addition, General Austin currently serves as a member of the Board of Trustees of the Carnegie Corporation of New York (2017-present) and as a member of the Board of Trustees of Auburn University (2017-present). Previously, General Austin served as a member of the Board of Directors of United Technologies Corporation (aerospace, defense and building, 2016-2020).
Thomas A. Kennedy (1955)
Year of Election or Appointment: 2020
Member of the Advisory Board
Mr. Kennedy also serves as a Member of the Advisory Board of other Fidelity® funds. Previously, Mr. Kennedy held a variety of positions at Raytheon Company (aerospace and defense, 1983-2020), including Chairman and Chief Executive Officer (2014-2020) and Executive Vice President and Chief Operating Officer (2013-2014). Mr. Kennedy currently serves as Executive Chairman of the Board of Directors of Raytheon Technologies Corporation (aerospace and defense, 2020-present). He is also a member of the Rutgers School of Engineering Industry Advisory Board (2011-present) and a member of the UCLA Engineering Dean’s Executive Board (2016-present).
Peter S. Lynch (1944)
Year of Election or Appointment: 2003
Member of the Advisory Board
Mr. Lynch also serves as a Member of the Advisory Board of other Fidelity® funds. Mr. Lynch is Vice Chairman and a Director of Fidelity Management & Research Company LLC (investment adviser firm). In addition, Mr. Lynch serves as a Trustee of Boston College and as the Chairman of the Inner-City Scholarship Fund. Previously, Mr. Lynch served as Vice Chairman and a Director of FMR Co., Inc. (investment adviser firm) and on the Special Olympics International Board of Directors (1997-2006).
Elizabeth Paige Baumann (1968)
Year of Election or Appointment: 2017
Anti-Money Laundering (AML) Officer
Ms. Baumann also serves as AML Officer of other funds. She is Chief AML Officer (2012-present) and Senior Vice President (2014-present) of FMR LLC (diversified financial services company) and is an employee of Fidelity Investments. Previously, Ms. Baumann served as AML Officer of certain funds (2017-2019), as AML Officer of the funds (2012-2016), and Vice President (2007-2014) and Deputy Anti-Money Laundering Officer (2007-2012) of FMR LLC.
Craig S. Brown (1977)
Year of Election or Appointment: 2019
Assistant Treasurer
Mr. Brown also serves as Assistant Treasurer of other funds. Mr. Brown is an employee of Fidelity Investments (2013-present).
John J. Burke III (1964)
Year of Election or Appointment: 2018
Chief Financial Officer
Mr. Burke also serves as Chief Financial Officer of other funds. Mr. Burke serves as Head of Investment Operations for Fidelity Fund and Investment Operations (2018-present) and is an employee of Fidelity Investments (1998-present). Previously Mr. Burke served as head of Asset Management Investment Operations (2012-2018).
William C. Coffey (1969)
Year of Election or Appointment: 2019
Assistant Secretary
Mr. Coffey also serves as Assistant Secretary of other funds. He is Senior Vice President and Deputy General Counsel of FMR LLC (diversified financial services company, 2010-present), and is an employee of Fidelity Investments. Previously, Mr. Coffey served as Secretary and CLO of certain funds (2018-2019); CLO, Secretary, and Senior Vice President of Fidelity Management & Research Company and FMR Co., Inc. (investment adviser firms, 2018-2019); Secretary of Fidelity SelectCo, LLC and Fidelity Investments Money Management, Inc. (investment adviser firms, 2018-2019); CLO of Fidelity Management & Research (Hong Kong) Limited, FMR Investment Management (UK) Limited, and Fidelity Management & Research (Japan) Limited (investment adviser firms, 2018-2019); and Assistant Secretary of certain funds (2009-2018).
Timothy M. Cohen (1969)
Year of Election or Appointment: 2018
Vice President
Mr. Cohen also serves as Vice President of other funds. Mr. Cohen serves as Co-Head of Equity (2018-present), a Director of Fidelity Management & Research (Japan) Limited (investment adviser firm, 2016-present), and is an employee of Fidelity Investments. Previously, Mr. Cohen served as Executive Vice President of Fidelity SelectCo, LLC (2019), Head of Global Equity Research (2016-2018), Chief Investment Officer - Equity and a Director of Fidelity Management & Research (U.K.) Inc. (investment adviser firm, 2013-2015) and as a Director of Fidelity Management & Research (Hong Kong) Limited (investment adviser firm, 2017).
Jonathan Davis (1968)
Year of Election or Appointment: 2010
Assistant Treasurer
Mr. Davis also serves as Assistant Treasurer of other funds. Mr. Davis serves as Assistant Treasurer of FMR Capital, Inc. (2017-present) and is an employee of Fidelity Investments. Previously, Mr. Davis served as Vice President and Associate General Counsel of FMR LLC (diversified financial services company, 2003-2010).
Laura M. Del Prato (1964)
Year of Election or Appointment: 2018
Assistant Treasurer
Ms. Del Prato also serves as an officer of other funds. Ms. Del Prato is an employee of Fidelity Investments (2017-present). Previously, Ms. Del Prato served as President and Treasurer of The North Carolina Capital Management Trust: Cash Portfolio and Term Portfolio (2018-2020). Prior to joining Fidelity Investments, Ms. Del Prato served as a Managing Director and Treasurer of the JPMorgan Mutual Funds (2014-2017). Prior to JPMorgan, Ms. Del Prato served as a partner at Cohen Fund Audit Services (accounting firm, 2012-2013) and KPMG LLP (accounting firm, 2004-2012).
Colm A. Hogan (1973)
Year of Election or Appointment: 2020
Assistant Treasurer
Mr. Hogan also serves as an officer of other funds. Mr. Hogan serves as Assistant Treasurer of FMR Capital, Inc. (2017-present) and is an employee of Fidelity Investments (2005-present). Previously, Mr. Hogan served as Deputy Treasurer of certain Fidelity® funds (2016-2020) and Assistant Treasurer of certain Fidelity® funds (2016-2018).
Pamela R. Holding (1964)
Year of Election or Appointment: 2018
Vice President
Ms. Holding also serves as Vice President of other funds. Ms. Holding serves as Co-Head of Equity (2018-present) and is an employee of Fidelity Investments (2013-present). Previously, Ms. Holding served as Executive Vice President of Fidelity SelectCo, LLC (2019) and as Chief Investment Officer of Fidelity Institutional Asset Management (2013-2018).
Cynthia Lo Bessette (1969)
Year of Election or Appointment: 2019
Secretary and Chief Legal Officer (CLO)
Ms. Lo Bessette also serves as an officer of other funds. Ms. Lo Bessette serves as CLO, Secretary, and Senior Vice President of Fidelity Management & Research Company LLC (investment adviser firm, 2019-present); and CLO of Fidelity Management & Research (Hong Kong) Limited, FMR Investment Management (UK) Limited, and Fidelity Management & Research (Japan) Limited (investment adviser firms, 2019-present). She is a Senior Vice President and Deputy General Counsel of FMR LLC (diversified financial services company, 2019-present), and is an employee of Fidelity Investments. Previously, Ms. Lo Bessette served as CLO, Secretary, and Senior Vice President of FMR Co., Inc. (investment adviser firm, 2019); Secretary of Fidelity SelectCo, LLC and Fidelity Investments Money Management, Inc. (investment adviser firms, 2019). Prior to joining Fidelity Investments, Ms. Lo Bessette was Executive Vice President, General Counsel (2016-2019) and Senior Vice President, Deputy General Counsel (2015-2016) of OppenheimerFunds (investment management company) and Deputy Chief Legal Officer (2013-2015) of Jennison Associates LLC (investment adviser firm).
Chris Maher (1972)
Year of Election or Appointment: 2020
Deputy Treasurer
Mr. Maher also serves as an officer of other funds. Mr. Maher serves as Assistant Treasurer of FMR Capital, Inc. (2017-present), and is an employee of Fidelity Investments (2008-present). Previously, Mr. Maher served as Assistant Treasurer of certain funds (2013-2020); Vice President of Asset Management Compliance (2013), Vice President of the Program Management Group of FMR (investment adviser firm, 2010-2013), and Vice President of Valuation Oversight (2008-2010).
Jason P. Pogorelec (1975)
Year of Election or Appointment: 2020
Chief Compliance Officer
Mr. Pogorelec also serves as Chief Compliance Officer of other funds. Mr. Pogorelec is a senior Vice President of Asset Management Compliance for Fidelity Investments and is an employee of Fidelity Investments (2006-present). Previously, Mr. Pogorelec served as Vice President, Associate General Counsel for Fidelity Investments (2010-2020) and Assistant Secretary of certain Fidelity funds (2015-2020).
Stacie M. Smith (1974)
Year of Election or Appointment: 2016
President and Treasurer
Ms. Smith also serves as an officer of other funds. Ms. Smith serves as Assistant Treasurer of FMR Capital, Inc. (2017-present), is an employee of Fidelity Investments (2009-present), and has served in other fund officer roles. Prior to joining Fidelity Investments, Ms. Smith served as Senior Audit Manager of Ernst & Young LLP (accounting firm, 1996-2009). Previously, Ms. Smith served as Assistant Treasurer (2013-2019) and Deputy Treasurer (2013-2016) of certain Fidelity® funds.
Marc L. Spector (1972)
Year of Election or Appointment: 2016
Assistant Treasurer
Mr. Spector also serves as an officer of other funds. Mr. Spector serves as Assistant Treasurer of FMR Capital, Inc. (2017-present) and is an employee of Fidelity Investments (2016-present). Prior to joining Fidelity Investments, Mr. Spector served as Director at the Siegfried Group (accounting firm, 2013-2016), and prior to Siegfried Group as audit senior manager at Deloitte & Touche LLP (accounting firm, 2005-2013).
Jim Wegmann (1979)
Year of Election or Appointment: 2019
Assistant Treasurer
Mr. Wegmann also serves as Assistant Treasurer of other funds. Mr. Wegmann is an employee of Fidelity Investments (2011-present).
Shareholder Expense Example
As a shareholder, you incur two types of costs: (1) transaction costs, which may include sales charges (loads) on purchase payments or redemption proceeds, as applicable and (2) ongoing costs, which generally include management fees, distribution and/or service (12b-1) fees and other Fund expenses. This Example is intended to help you understand your ongoing costs (in dollars) of investing in a fund and to compare these costs with the ongoing costs of investing in other mutual funds.
The Example is based on an investment of $1,000 invested at the beginning of the period and held for the entire period (May 1, 2020 to October 31, 2020).
Actual Expenses
The first line of the accompanying table provides information about actual account values and actual expenses. You may use the information in this line, together with the amount you invested, to estimate the expenses that you paid over the period. Simply divide your account value by $1,000.00 (for example, an $8,600 account value divided by $1,000.00 = 8.6), then multiply the result by the number in the first line for a class/Fund under the heading entitled "Expenses Paid During Period" to estimate the expenses you paid on your account during this period. If any fund is a shareholder of any underlying mutual funds or exchange-traded funds (ETFs) (the Underlying Funds), such fund indirectly bears its proportional share of the expenses of the Underlying Funds in addition to the direct expenses incurred presented in the table. These fees and expenses are not included in the annualized expense ratio used to calculate the expense estimate in the table below.
Hypothetical Example for Comparison Purposes
The second line of the accompanying table provides information about hypothetical account values and hypothetical expenses based on the actual expense ratio and an assumed rate of return of 5% per year before expenses, which is not the actual return. The hypothetical account values and expenses may not be used to estimate the actual ending account balance or expenses you paid for the period. You may use this information to compare the ongoing costs of investing in the Fund and other funds. To do so, compare this 5% hypothetical example with the 5% hypothetical examples that appear in the shareholder reports of the other funds. If any fund is a shareholder of any Underlying Funds, such fund indirectly bears its proportional share of the expenses of the Underlying Funds in addition to the direct expenses as presented in the table. These fees and expenses are not included in the annualized expense ratio used to calculate the expense estimate in the table below.
Please note that the expenses shown in the table are meant to highlight your ongoing costs only and do not reflect any transaction costs. Therefore, the second line of the table is useful in comparing ongoing costs only, and will not help you determine the relative total costs of owning different funds. In addition, if these transactional costs were included, your costs would have been higher.
| | Annualized Expense Ratio-A | Beginning
Account Value
May 1, 2020 | Ending
Account Value
October 31, 2020 | Expenses Paid
During Period-B
May 1, 2020
to October 31, 2020 |
| Fidelity Total International Equity Fund | | | | |
| Class A | 1.37% | | | |
| Actual | | $1,000.00 | $1,163.60 | $7.45 |
| Hypothetical-C | | $1,000.00 | $1,018.25 | $6.95 |
| Class M | 1.62% | | | |
| Actual | | $1,000.00 | $1,162.70 | $8.81 |
| Hypothetical-C | | $1,000.00 | $1,016.99 | $8.21 |
| Class C | 2.11% | | | |
| Actual | | $1,000.00 | $1,160.00 | $11.46 |
| Hypothetical-C | | $1,000.00 | $1,014.53 | $10.68 |
| Total International Equity | 1.11% | | | |
| Actual | | $1,000.00 | $1,165.70 | $6.04 |
| Hypothetical-C | | $1,000.00 | $1,019.56 | $5.63 |
| Class I | 1.13% | | | |
| Actual | | $1,000.00 | $1,165.00 | $6.15 |
| Hypothetical-C | | $1,000.00 | $1,019.46 | $5.74 |
| Class Z | .96% | | | |
| Actual | | $1,000.00 | $1,166.10 | $5.23 |
| Hypothetical-C | | $1,000.00 | $1,020.31 | $4.88 |
A Annualized expense ratio reflects expenses net of applicable fee waivers.
B Expenses are equal to the annualized expense ratio, multiplied by the average account value over the period, multiplied by 184/ 366 (to reflect the one-half year period). The fees and expenses of any Underlying Funds are not included in each annualized expense ratio.
C 5% return per year before expenses
Distributions (Unaudited)
The Board of Trustees of Fidelity Total International Equity Fund voted to pay to shareholders of record at the opening of business on record date, the following distributions per share derived from capital gains realized from sales of portfolio securities and dividends derived from net investment income:
| | Pay Date | Record Date | Dividends | Capital Gains |
| Fidelity Total International Equity Fund | | | | |
| Class A | 12/07/20 | 12/04/20 | $0.060 | $0.196 |
| Class M | 12/07/20 | 12/04/20 | $0.040 | $0.196 |
| Class C | 12/07/20 | 12/04/20 | $0.000 | $0.196 |
| Total International Equity | 12/07/20 | 12/04/20 | $0.081 | $0.196 |
| Class I | 12/07/20 | 12/04/20 | $0.081 | $0.196 |
| Class Z | 12/07/20 | 12/04/20 | $0.081 | $0.196 |
|
The fund hereby designates as a capital gain dividend with respect to the taxable year ended October 31, 2020, $1,235,259, or, if subsequently determined to be different, the net capital gain of such year.
Class A designates 4%; Class M designates 4%; Class C designates 7%; Total International Equity designates 3%; Class I designates 3%; and Class Z designates 3%; of the dividends distributed during the fiscal year as qualifying for the dividends–received deduction for corporate shareholders.
Class A, Class M, Class C, Total International Equity, Class I, and Class Z designate 100% of the dividends distributed during the fiscal year as amounts which may be taken into account as a dividend for purposes of the maximum rate under section 1(h)(11) of the Internal Revenue Code.
The amounts per share which represent income derived from sources within, and taxes paid to, foreign countries or possessions of the United States are as follows:
| | Pay Date | Income | Taxes |
| Fidelity Total International Equity Fund | | | |
| Class A | 12/09/20 | $0.1620 | $0.0220 |
| Class M | 12/09/20 | $0.1380 | $0.0220 |
| Class C | 12/09/20 | $0.0880 | $0.0220 |
| Total International Equity | 12/09/20 | $0.1850 | $0.0220 |
| Class I | 12/09/20 | $0.1900 | $0.0220 |
| Class Z | 12/09/20 | $0.2020 | $0.0220 |
|
The fund will notify shareholders in January 2021 of amounts for use in preparing 2020 income tax returns.
Proxy Voting Results
A special meeting of shareholders was held on June 9, 2020. The results of votes taken among shareholders on the proposal before them are reported below. Each vote reported represents one dollar of net asset value held on the record date for the meeting.
PROPOSAL 1
To elect a Board of Trustees.
| | # of
Votes | % of
Votes |
| Dennis J. Dirks |
| Affirmative | 91,643,443,973.030 | 98.167 |
| Withheld | 1,711,119,384.419 | 1.833 |
| TOTAL | 93,354,563,357.449 | 100.000 |
| Donald F. Donahue |
| Affirmative | 91,659,003,496.045 | 98.184 |
| Withheld | 1,695,559,852.789 | 1.816 |
| TOTAL | 93,354,563,357.449 | 100.000 |
| Bettina Doulton |
| Affirmative | 91,774,146,516.145 | 98.307 |
| Withheld | 1,580,416,862.377 | 1.693 |
| TOTAL | 93,354,563,357.449 | 100.000 |
| Vicki L. Fuller |
| Affirmative | 91,845,419,368.993 | 98.383 |
| Withheld | 1,509,143,998.591 | 1.617 |
| TOTAL | 93,354,563,357.449 | 100.00 |
| Patricia L. Kampling |
| Affirmative | 91,723,732,274.457 | 98.253 |
| Withheld | 1,630,831,098.411 | 1.747 |
| TOTAL | 93,354,563,357.449 | 100.000 |
| Alan J. Lacy |
| Affirmative | 91,490,319,407.772 | 98.003 |
| Withheld | 1,864,243,948.299 | 1.997 |
| TOTAL | 93,354,563,357.449 | 100.000 |
| Ned C. Lautenbach |
| Affirmative | 91,285,367,239.075 | 97.784 |
| Withheld | 2,069,196,119.052 | 2.216 |
| TOTAL | 93,354,563,357.449 | 100.000 |
| Robert A. Lawrence |
| Affirmative | 91,556,271,429.466 | 98.074 |
| Withheld | 1,798,291,912.707 | 1.926 |
| TOTAL | 93,354,563,357.449 | 100.000 |
| Joseph Mauriello |
| Affirmative | 91,497,480,147.082 | 98.011 |
| Withheld | 1,857,083,211.045 | 1.989 |
| TOTAL | 93,354,563,357.449 | 100.000 |
| Cornelia M. Small |
| Affirmative | 91,606,808,161.438 | 98.128 |
| Withheld | 1,747,755,220.497 | 1.872 |
| TOTAL | 93,354,563,357.449 | 100.000 |
| Garnett A. Smith |
| Affirmative | 91,505,784,053.038 | 98.020 |
| Withheld | 1,848,779,305.090 | 1.980 |
| TOTAL | 93,354,563,357.449 | 100.000 |
| David M. Thomas |
| Affirmative | 91,536,969,704.881 | 98.053 |
| Withheld | 1,817,593,630.919 | 1.947 |
| TOTAL | 93,354,563,357.449 | 100.000 |
| Susan Tomasky |
| Affirmative | 91,697,125,678.165 | 98.225 |
| Withheld | 1,657,437,703.277 | 1.775 |
| TOTAL | 93,354,563,357.449 | 100.000 |
| Michael E. Wiley |
| Affirmative | 91,506,805,575.815 | 98.021 |
| Withheld | 1,847,757,759.985 | 1.979 |
| TOTAL | 93,354,563,357.449 | 100.000 |
|
| Proposal 1 reflects trust wide proposal and voting results. |
TIE-ANN-1220
1.912358.110
Fidelity® Emerging Markets Discovery Fund
Fidelity® Total Emerging Markets Fund
Annual Report
October 31, 2020
Includes Fidelity and Fidelity Advisor share classes
See the inside front cover for important information about access to your fund’s shareholder reports.
Beginning on January 1, 2021, as permitted by regulations adopted by the Securities and Exchange Commission, paper copies of a fund’s shareholder reports will no longer be sent by mail, unless you specifically request paper copies of the reports from the fund or from your financial intermediary, such as a financial advisor, broker-dealer or bank. Instead, the reports will be made available on a website, and you will be notified by mail each time a report is posted and provided with a website link to access the report.
If you already elected to receive shareholder reports electronically, you will not be affected by this change and you need not take any action. You may elect to receive shareholder reports and other communications from a fund electronically, by contacting your financial intermediary. For Fidelity customers, visit Fidelity's web site or call Fidelity using the contact information listed below.
You may elect to receive all future reports in paper free of charge. If you wish to continue receiving paper copies of your shareholder reports, you may contact your financial intermediary or, if you are a Fidelity customer, visit Fidelity’s website, or call Fidelity at the applicable toll-free number listed below. Your election to receive reports in paper will apply to all funds held with the fund complex/your financial intermediary.
| Account Type | Website | Phone Number |
| Brokerage, Mutual Fund, or Annuity Contracts: | fidelity.com/mailpreferences | 1-800-343-3548 |
| Employer Provided Retirement Accounts: | netbenefits.fidelity.com/preferences (choose 'no' under Required Disclosures to continue to print) | 1-800-343-0860 |
| Advisor Sold Accounts Serviced Through Your Financial Intermediary: | Contact Your Financial Intermediary | Your Financial Intermediary's phone number |
| Advisor Sold Accounts Serviced by Fidelity: | institutional.fidelity.com | 1-877-208-0098 |
Contents
To view a fund's proxy voting guidelines and proxy voting record for the 12-month period ended June 30, visit http://www.fidelity.com/proxyvotingresults or visit the Securities and Exchange Commission's (SEC) web site at http://www.sec.gov.
You may also call 1-800-544-8544 if you’re an individual investing directly with Fidelity, call 1-800-835-5092 if you’re a plan sponsor or participant with Fidelity as your recordkeeper or call 1-877-208-0098 on institutional accounts or if you’re an advisor or invest through one to request a free copy of the proxy voting guidelines.
Standard & Poor's, S&P and S&P 500 are registered service marks of The McGraw-Hill Companies, Inc. and have been licensed for use by Fidelity Distributors Corporation.
Other third-party marks appearing herein are the property of their respective owners.
All other marks appearing herein are registered or unregistered trademarks or service marks of FMR LLC or an affiliated company. © 2020 FMR LLC. All rights reserved.
This report and the financial statements contained herein are submitted for the general information of the shareholders of the Funds. This report is not authorized for distribution to prospective investors in the Funds unless preceded or accompanied by an effective prospectus.
A fund files its complete schedule of portfolio holdings with the SEC for the first and third quarters of each fiscal year on Form N-PORT. Forms N-PORT are available on the SEC’s web site at http://www.sec.gov. A fund's Forms N-PORT may be reviewed and copied at the SEC’s Public Reference Room in Washington, DC. Information regarding the operation of the SEC's Public Reference Room may be obtained by calling 1-800-SEC-0330.
For a complete list of a fund's portfolio holdings, view the most recent holdings listing, semiannual report, or annual report on Fidelity's web site at http://www.fidelity.com, http://www.institutional.fidelity.com, or http://www.401k.com, as applicable.
NOT FDIC INSURED •MAY LOSE VALUE •NO BANK GUARANTEE
Neither the Funds nor Fidelity Distributors Corporation is a bank.
Note to Shareholders:
Early in 2020, the outbreak and spread of a new coronavirus emerged as a public health emergency that had a major influence on financial markets, primarily based on its impact on the global economy and the outlook for corporate earnings. The virus causes a respiratory disease known as COVID-19. On March 11, the World Health Organization declared the COVID-19 outbreak a pandemic, citing sustained risk of further global spread.
In the weeks following, as the crisis worsened, we witnessed an escalating human tragedy with wide-scale social and economic consequences from coronavirus-containment measures. The outbreak of COVID-19 prompted a number of measures to limit the spread, including travel and border restrictions, quarantines, and restrictions on large gatherings. In turn, these resulted in lower consumer activity, diminished demand for a wide range of products and services, disruption in manufacturing and supply chains, and – given the wide variability in outcomes regarding the outbreak – significant market uncertainty and volatility. Amid the turmoil, global governments and central banks took unprecedented action to help support consumers, businesses, and the broader economy, and to limit disruption to the financial system.
The situation continues to unfold, and the extent and duration of its impact on financial markets and the economy remain highly uncertain. Extreme events such as the coronavirus crisis are “exogenous shocks” that can have significant adverse effects on mutual funds and their investments. Although multiple asset classes may be affected by market disruption, the duration and impact may not be the same for all types of assets.
Fidelity is committed to helping you stay informed amid news about COVID-19 and during increased market volatility, and we’re taking extra steps to be responsive to customer needs. We encourage you to visit our websites, where we offer ongoing updates, commentary, and analysis on the markets and our funds.
Fidelity® Emerging Markets Discovery Fund
Performance: The Bottom Line
Average annual total return reflects the change in the value of an investment, assuming reinvestment of distributions from dividend income and capital gains (the profits earned upon the sale of securities that have grown in value, if any) and assuming a constant rate of performance each year. The hypothetical investment and the average annual total returns do not reflect the deduction of taxes that a shareholder would pay on fund distributions or the redemption of fund shares. During periods of reimbursement by Fidelity, a fund’s total return will be greater than it would be had the reimbursement not occurred. How a fund did yesterday is no guarantee of how it will do tomorrow.
Average Annual Total Returns
| For the periods ended October 31, 2020 | Past 1 year | Past 5 years | Life of fundA |
| Class A (incl. 5.75% sales charge) | (3.15)% | 5.01% | 4.34% |
| Class M (incl. 3.50% sales charge) | (1.10)% | 5.22% | 4.34% |
| Class C (incl. contingent deferred sales charge) | 0.96% | 5.45% | 4.24% |
| Fidelity® Emerging Markets Discovery Fund | 3.07% | 6.57% | 5.31% |
| Class I | 3.07% | 6.57% | 5.33% |
| Class Z | 3.24% | 6.64% | 5.37% |
A From November 1, 2011
Class C shares' contingent deferred sales charges included in the past one year, past five years, and life of fund total return figures are 1%, 0%, and 0%, respectively.
The initial offering of Class Z shares took place on October 2, 2018. Returns prior to October 2, 2018, are those of Class I.
$10,000 Over Life of Fund
Let's say hypothetically that $10,000 was invested in Fidelity® Emerging Markets Discovery Fund, a class of the fund, on November 1, 2011, when the fund started.
The chart shows how the value of your investment would have changed, and also shows how the MSCI Emerging Markets SMID Cap Index performed over the same period.
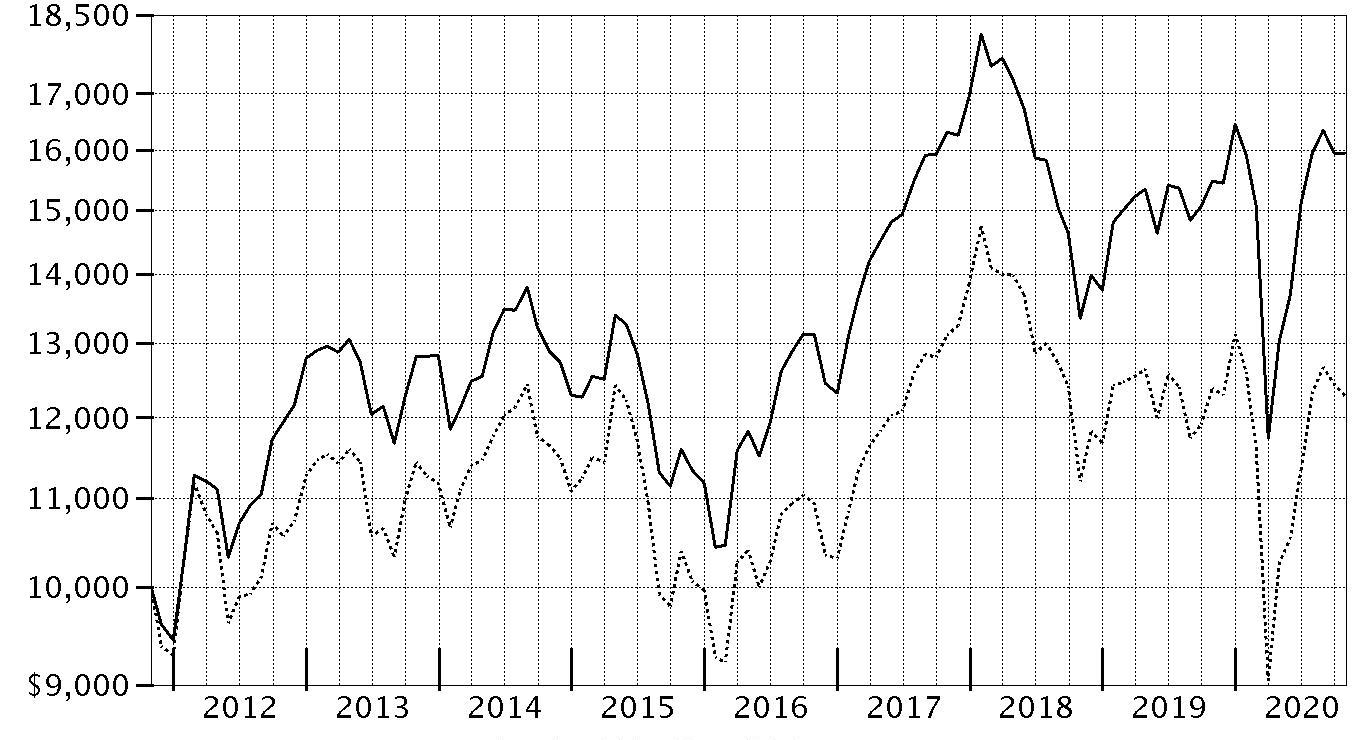
| Period Ending Values |
| $15,940 | Fidelity® Emerging Markets Discovery Fund |
| $12,280 | MSCI Emerging Markets SMID Cap Index |
Fidelity® Emerging Markets Discovery Fund
Management's Discussion of Fund Performance
Market Recap: The MSCI ACWI (All Country World Index) ex USA Index returned -2.46% for the 12 months ending October 31, 2020, in what was a bumpy ride for non-U.S. equities, marked by a steep but brief decline due to the early-2020 outbreak and spread of the coronavirus, followed by a sharp upturn. Declared a pandemic on March 11, the crisis and containment efforts caused broad contraction in economic activity, elevated volatility and dislocation in financial markets. A historically rapid and expansive monetary- and fiscal-policy response around the world provided a partial offset to the economic disruption.Other supporting factors included resilient corporate earnings and near-term potential for a COVID-19 vaccine breakthrough. This was evident as the index advanced 12.28% in the final six months of the period, supported by broad U.S.-dollar weakness. Currency fluctuation generally boosted foreign developed-markets equities for the year, while the reverse was true for emerging-markets stocks. Late in the period, the index was pressured by Congress’s inability to reach a deal on additional fiscal stimulus, as well as concerns about election uncertainty, indications the U.S. economic recovery is stalling, a second wave of COVID-19 cases, and stretched valuations. For the full year, the U.K. (-22%), Asia Pacific ex Japan (-8%), Canada (-5%) and Europe ex U.K. (-4%) lagged the index. Emerging markets (+9%) and Japan (+1%) outperformed. By sector, energy (-38%) fell hard along with oil prices. Financials and real estate (-20% each) also lagged. Conversely, the information technology (+ 25%) and communication services (+15%) sectors topped the index.
Comments from Co-Managers Gregory Lee and Jane Wu: For the fiscal year ending October 31, 2020, the fund's share classes (excluding sales charges, if applicable) gained roughly 2% to 3%, outperforming the -0.80% result of the benchmark MSCI Emerging Markets SMID Index (Net MA). From a regional standpoint, stock picks in Emerging Asia and an underweighting in Latin America, specifically Brazil, contributed most to the fund's relative result. By sector, the primary contributor to performance versus the benchmark was our stock picks in communication services, especially within the media & entertainment industry. Strong picks in the health care sector, primarily driven by the pharmaceuticals, biotechnology & life sciences industry, also bolstered the fund's relative result. Also boosting performance was security selection in information technology and consumer discretionary. Our top individual relative contributor was an out-of-benchmark stake in Samsung SDI (+100%), which was among our biggest holdings. Also boosting performance was our overweighting in Unimicron Technology, which gained about 57%. We reduced our position the past 12 months. Another notable relative contributor was an outsized stake in Silergy (+120%), which was one of the fund's largest holdings. In contrast, stock picks in Emerging Europe and Latin America hurt the fund's relative result. By sector, the primary detractor from performance versus the benchmark was our security selection in industrials. Security selection in materials and financials also hampered the fund's relative performance. The biggest individual relative detractor was lack of exposure to Nio, a benchmark component. It also helped to have an overweight position in Azul (-85%), which was not held at the end of this period. Other notable relative detractors included overweightings in Alpha Bank (-76%) and Grupa Lotos (-71%). Notable changes in positioning include decreased exposure to Brazil and a higher allocation to China. By sector, meaningful changes in positioning include increased exposure to health care and information technology.
The views expressed above reflect those of the portfolio manager(s) only through the end of the period as stated on the cover of this report and do not necessarily represent the views of Fidelity or any other person in the Fidelity organization. Any such views are subject to change at any time based upon market or other conditions and Fidelity disclaims any responsibility to update such views. These views may not be relied on as investment advice and, because investment decisions for a Fidelity fund are based on numerous factors, may not be relied on as an indication of trading intent on behalf of any Fidelity fund.
Note to shareholders: On October 1, 2020, Greg Lee assumed co-management responsibilities for the fund's financials, real estate, and utilities sleeves, joining James Hayes until December 31, at which point James will come off of the sleeves and Greg will assume sole management.
Fidelity® Emerging Markets Discovery Fund
Investment Summary (Unaudited)
Top Five Stocks as of October 31, 2020
| | % of fund's net assets |
| Samsung SDI Co. Ltd. (Korea (South), Electronic Equipment & Components) | 1.7 |
| Silergy Corp. (Cayman Islands, Semiconductors & Semiconductor Equipment) | 1.7 |
| Haier Smart Home Co. Ltd. (A Shares) (China, Household Durables) | 1.7 |
| Sunny Optical Technology Group Co. Ltd. (Cayman Islands, Electronic Equipment & Components) | 1.6 |
| Li Ning Co. Ltd. (Cayman Islands, Textiles, Apparel & Luxury Goods) | 1.5 |
| | 8.2 |
Top Five Market Sectors as of October 31, 2020
| | % of fund's net assets |
| Information Technology | 14.7 |
| Materials | 12.5 |
| Consumer Discretionary | 11.9 |
| Industrials | 11.5 |
| Health Care | 10.0 |
Top Five Countries as of October 31, 2020
| (excluding cash equivalents) | % of fund's net assets |
| Cayman Islands | 18.0 |
| China | 10.9 |
| India | 9.5 |
| Taiwan | 8.5 |
| Korea (South) | 7.8 |
Percentages are adjusted for the effect of futures contracts, if applicable.
Asset Allocation (% of fund's net assets)
| As of October 31, 2020 |
| | Stocks and Equity Futures | 96.9% |
| | Short-Term Investments and Net Other Assets (Liabilities) | 3.1% |

Fidelity® Emerging Markets Discovery Fund
Schedule of Investments October 31, 2020
Showing Percentage of Net Assets
| Common Stocks - 92.4% | | | |
| | | Shares | Value |
| Bangladesh - 0.3% | | | |
| BRAC Bank Ltd. | | 1,323,206 | $647,942 |
| Belgium - 1.0% | | | |
| Titan Cement International Trading SA | | 197,000 | 2,445,788 |
| Bermuda - 1.2% | | | |
| AGTech Holdings Ltd. (a) | | 10,044,000 | 356,285 |
| Alibaba Pictures Group Ltd. (a) | | 1,875,844 | 244,386 |
| Shangri-La Asia Ltd. | | 2,942,000 | 2,311,097 |
|
| TOTAL BERMUDA | | | 2,911,768 |
|
| Brazil - 5.5% | | | |
| Atacadao SA | | 400,900 | 1,289,068 |
| Boa Vista Servicos SA (a) | | 184,900 | 437,280 |
| BTG Pactual Participations Ltd. unit | | 67,500 | 852,874 |
| Equatorial Energia SA | | 354,300 | 1,230,614 |
| LOG Commercial Properties e Participacoes SA | | 285,800 | 1,561,504 |
| Lojas Renner SA | | 169,600 | 1,106,932 |
| LPS Brasil Consultoria de Imoveis SA (a) | | 534,344 | 440,479 |
| Natura & Co. Holding SA | | 248,153 | 1,993,718 |
| QGEP Participacoes SA | | 445,600 | 735,425 |
| Rumo SA (a) | | 769,700 | 2,460,164 |
| Suzano Papel e Celulose SA (a) | | 190,800 | 1,664,277 |
|
| TOTAL BRAZIL | | | 13,772,335 |
|
| British Virgin Islands - 0.3% | | | |
| Dolphin Capital Investors Ltd. (a) | | 7,611,857 | 320,488 |
| Mail.Ru Group Ltd. GDR (Reg. S) (a) | | 17,397 | 456,671 |
|
| TOTAL BRITISH VIRGIN ISLANDS | | | 777,159 |
|
| Cayman Islands - 18.0% | | | |
| Agora, Inc. ADR (a)(b) | | 700 | 26,950 |
| Archosaur Games, Inc. (a)(c) | | 234,000 | 551,156 |
| Bilibili, Inc. ADR (a)(b) | | 38,631 | 1,725,647 |
| China State Construction International Holdings Ltd. | | 2,058,000 | 1,422,880 |
| CStone Pharmaceuticals Co. Ltd. (a)(c) | | 1,159,461 | 1,701,989 |
| Fu Shou Yuan International Group Ltd. | | 1,364,000 | 1,404,027 |
| Haitian International Holdings Ltd. | | 758,000 | 1,877,278 |
| Hua Medicine (a)(c) | | 1,565,337 | 854,096 |
| I-Mab ADR | | 51,505 | 2,120,461 |
| Impro Precision Industries Ltd. (c) | | 4,442,200 | 1,289,255 |
| Innovent Biologics, Inc. (a)(c) | | 448,373 | 3,308,215 |
| Kangji Medical Holdings Ltd. | | 110,500 | 285,711 |
| Kingdee International Software Group Co. Ltd. | | 755,000 | 1,981,845 |
| Li Ning Co. Ltd. | | 712,000 | 3,673,654 |
| Ming Yuan Cloud Group Holdings Ltd. | | 6,800 | 29,033 |
| NetEase, Inc. ADR | | 5,090 | 441,761 |
| Parade Technologies Ltd. | | 46,000 | 1,752,595 |
| Pico Far East Holdings Ltd. | | 5,150,000 | 744,018 |
| Semiconductor Manufacturing International Corp. (a) | | 1,186,370 | 3,499,948 |
| Shimao Property Holdings Ltd. | | 322,000 | 1,135,982 |
| Shimao Services Holdings Ltd. (a)(c) | | 5,278 | 11,301 |
| Silergy Corp. | | 68,170 | 4,193,757 |
| Sunny Optical Technology Group Co. Ltd. | | 239,130 | 3,954,397 |
| TAL Education Group ADR (a) | | 13,532 | 899,337 |
| Uni-President China Holdings Ltd. | | 1,576,000 | 1,362,038 |
| Wise Talent Information Technology Co. Ltd. (a) | | 162,591 | 399,321 |
| Yuzhou Properties Co. | | 3,385,600 | 1,305,765 |
| YY, Inc. ADR | | 6,895 | 630,065 |
| Zai Lab Ltd. (a) | | 30,838 | 2,565,690 |
|
| TOTAL CAYMAN ISLANDS | | | 45,148,172 |
|
| Chile - 0.2% | | | |
| Sociedad Quimica y Minera de Chile SA (PN-B) sponsored ADR (b) | | 15,404 | 570,102 |
| China - 10.9% | | | |
| C&S Paper Co. Ltd. (A Shares) | | 424,900 | 1,287,599 |
| China Communications Services Corp. Ltd. (H Shares) | | 2,362,000 | 1,371,042 |
| China Longyuan Power Grid Corp. Ltd. (H Shares) | | 1,920,200 | 1,312,746 |
| China Machinery Engineering Co. (H Shares) | | 3,450,000 | 663,076 |
| CRRC Corp. Ltd. (H Shares) | | 1,734,000 | 671,009 |
| Haier Smart Home Co. Ltd. (A Shares) | | 1,124,796 | 4,189,983 |
| Hangzhou Tigermed Consulting Co. Ltd. (A Shares) | | 135,181 | 2,513,685 |
| Hualan Biological Engineer, Inc. (A Shares) | | 259,068 | 1,986,682 |
| Pharmaron Beijing Co. Ltd. (H Shares) (c) | | 200,050 | 2,887,532 |
| Shandong Weigao Medical Polymer Co. Ltd. (H Shares) | | 1,057,308 | 2,043,015 |
| Shanghai Kindly Medical Instruments Co. Ltd. (H Shares) | | 222,400 | 1,296,676 |
| Shenzhen YUTO Packaging Technology Co. Ltd. (A Shares) | | 185,000 | 819,928 |
| Sinopec Engineering Group Co. Ltd. (H Shares) | | 3,126,000 | 1,213,707 |
| Tsingtao Brewery Co. Ltd. (H Shares) | | 222,000 | 1,834,131 |
| Venus MedTech Hangzhou, Inc. (H Shares) (a)(c) | | 181,852 | 1,748,735 |
| Zhuzhou CRRC Times Electric Co. Ltd. (H Shares) | | 463,200 | 1,422,014 |
|
| TOTAL CHINA | | | 27,261,560 |
|
| Curacao - 0.6% | | | |
| Emirates NBD ELS (Merrill Lynch International & Co. Bank Warrant Program) warrants 1/3/22 (a)(c) | | 601,567 | 1,555,857 |
| Cyprus - 1.1% | | | |
| Etalon Group PLC GDR (Reg. S) (a) | | 719,700 | 1,162,316 |
| Globaltrans Investment PLC GDR (Reg. S) | | 300,400 | 1,700,264 |
|
| TOTAL CYPRUS | | | 2,862,580 |
|
| Egypt - 1.2% | | | |
| Credit Agricole Egypt | | 345,072 | 568,160 |
| Egyptian Kuwaiti Holding | | 1,456,948 | 1,515,226 |
| Six of October Development & Investment Co. | | 1,315,800 | 1,005,707 |
|
| TOTAL EGYPT | | | 3,089,093 |
|
| Greece - 1.0% | | | |
| Alpha Bank AE (a) | | 1,076,272 | 542,757 |
| Fourlis Holdings SA (a) | | 530,100 | 2,046,618 |
|
| TOTAL GREECE | | | 2,589,375 |
|
| Hong Kong - 1.3% | | | |
| China Resources Beer Holdings Co. Ltd. | | 296,000 | 1,834,608 |
| Far East Horizon Ltd. | | 1,395,584 | 1,369,932 |
|
| TOTAL HONG KONG | | | 3,204,540 |
|
| Hungary - 0.2% | | | |
| OTP Bank PLC (a) | | 17,200 | 535,693 |
| India - 9.5% | | | |
| Adani Ports & Special Economic Zone Ltd. | | 435,245 | 2,098,687 |
| Bharti Infratel Ltd. | | 217,200 | 540,240 |
| CESC Ltd. GDR | | 53,316 | 402,661 |
| Deccan Cements Ltd. | | 222,346 | 940,621 |
| Embassy Office Parks (REIT) | | 81,000 | 373,891 |
| Iifl Finance Ltd. | | 981,547 | 983,181 |
| JK Cement Ltd. | | 102,571 | 2,546,785 |
| JM Financial Ltd. (a) | | 1,229,800 | 1,309,009 |
| Mahanagar Gas Ltd. | | 88,310 | 965,055 |
| Manappuram General Finance & Leasing Ltd. | | 553,799 | 1,153,364 |
| Oberoi Realty Ltd. (a) | | 200,438 | 1,190,413 |
| Petronet LNG Ltd. | | 689,382 | 2,134,756 |
| Power Grid Corp. of India Ltd. | | 768,368 | 1,762,562 |
| Shriram Transport Finance Co. Ltd. | | 215,337 | 2,001,383 |
| Solar Industries India Ltd. | | 98,845 | 1,338,468 |
| Sunteck Realty Ltd. | | 183,300 | 658,198 |
| The Ramco Cements Ltd. | | 125,111 | 1,336,841 |
| Torrent Pharmaceuticals Ltd. | | 61,573 | 2,119,360 |
|
| TOTAL INDIA | | | 23,855,475 |
|
| Indonesia - 1.8% | | | |
| PT ACE Hardware Indonesia Tbk | | 15,328,400 | 1,634,553 |
| PT Ciputra Development Tbk | | 19,209,400 | 1,056,430 |
| PT Pakuwon Jati Tbk (a) | | 20,362,278 | 569,236 |
| PT United Tractors Tbk | | 941,600 | 1,345,256 |
|
| TOTAL INDONESIA | | | 4,605,475 |
|
| Israel - 0.3% | | | |
| Rami Levi Chain Stores Hashikma Marketing 2006 Ltd. | | 13,000 | 849,255 |
| Japan - 0.2% | | | |
| Iriso Electronics Co. Ltd. | | 15,530 | 591,294 |
| Kenya - 0.1% | | | |
| Equity Group Holdings Ltd. | | 986,200 | 307,281 |
| Korea (South) - 7.8% | | | |
| AMOREPACIFIC Group, Inc. | | 17,234 | 665,178 |
| Coway Co. Ltd. | | 29,850 | 1,823,781 |
| Db Insurance Co. Ltd. | | 21,380 | 834,042 |
| DuzonBizon Co. Ltd. | | 12,090 | 1,063,588 |
| Hanon Systems | | 72,370 | 716,058 |
| Hansol Chemical Co. Ltd. | | 13,740 | 1,710,397 |
| Hyundai Fire & Marine Insurance Co. Ltd. | | 49,371 | 1,014,646 |
| Kakao Corp. | | 10,088 | 2,935,116 |
| Kakao Games Corp. | | 500 | 19,971 |
| KB Financial Group, Inc. | | 22,750 | 811,978 |
| Korean Reinsurance Co. | | 110,910 | 725,922 |
| LG Corp. | | 29,140 | 1,741,047 |
| NCSOFT Corp. | | 1,154 | 791,156 |
| Pearl Abyss Corp. (a) | | 2,505 | 444,524 |
| Samsung SDI Co. Ltd. | | 10,995 | 4,321,823 |
|
| TOTAL KOREA (SOUTH) | | | 19,619,227 |
|
| Luxembourg - 1.3% | | | |
| Globant SA (a) | | 18,120 | 3,272,653 |
| Malaysia - 0.7% | | | |
| Scientex Bhd | | 653,200 | 1,869,623 |
| Mexico - 3.5% | | | |
| CEMEX S.A.B. de CV sponsored ADR | | 869,500 | 3,608,425 |
| Fibra Uno Administracion SA de CV | | 970,062 | 734,927 |
| Grupo Aeroportuario del Pacifico S.A.B. de CV Series B | | 194,300 | 1,617,037 |
| Grupo Aeroportuario Norte S.A.B. de CV (a) | | 139,800 | 630,868 |
| Grupo Comercial Chedraui S.A.B. de CV | | 540,900 | 683,919 |
| Macquarie Mexican (REIT) (c) | | 1,191,300 | 1,368,691 |
|
| TOTAL MEXICO | | | 8,643,867 |
|
| Netherlands - 1.9% | | | |
| VEON Ltd. sponsored ADR | | 120,909 | 151,136 |
| X5 Retail Group NV GDR (Reg. S) | | 48,700 | 1,711,318 |
| Yandex NV Series A (a)(b) | | 51,933 | 2,989,783 |
|
| TOTAL NETHERLANDS | | | 4,852,237 |
|
| Pakistan - 0.3% | | | |
| Hub Power Co. Ltd. (a) | | 1,445,000 | 737,473 |
| Panama - 0.5% | | | |
| Copa Holdings SA Class A (b) | | 23,100 | 1,138,368 |
| Peru - 0.7% | | | |
| Compania de Minas Buenaventura SA sponsored ADR | | 135,900 | 1,667,493 |
| Philippines - 1.1% | | | |
| Metro Pacific Investments Corp. | | 12,535,264 | 1,033,932 |
| Metropolitan Bank & Trust Co. | | 698,757 | 585,526 |
| Philippine Seven Corp. | | 438,400 | 1,007,327 |
|
| TOTAL PHILIPPINES | | | 2,626,785 |
|
| Poland - 0.7% | | | |
| CD Projekt RED SA (a) | | 2,730 | 231,305 |
| Grupa Lotos SA | | 82,000 | 577,517 |
| Warsaw Stock Exchange | | 91,600 | 996,155 |
|
| TOTAL POLAND | | | 1,804,977 |
|
| Russia - 0.9% | | | |
| Bank St. Petersburg PJSC | | 580,347 | 317,481 |
| LSR Group OJSC | | 100,064 | 1,145,694 |
| RusHydro PJSC | | 73,565,249 | 668,575 |
|
| TOTAL RUSSIA | | | 2,131,750 |
|
| Singapore - 0.7% | | | |
| Delfi Ltd. | | 1,023,800 | 480,135 |
| First Resources Ltd. | | 1,478,700 | 1,311,739 |
|
| TOTAL SINGAPORE | | | 1,791,874 |
|
| South Africa - 4.6% | | | |
| AngloGold Ashanti Ltd. | | 74,400 | 1,714,582 |
| Bidvest Group Ltd. | | 238,100 | 1,957,892 |
| Cashbuild Ltd. | | 161,600 | 2,186,501 |
| Impala Platinum Holdings Ltd. | | 248,500 | 2,211,731 |
| JSE Ltd. | | 115,000 | 767,322 |
| Mr Price Group Ltd. | | 96,700 | 731,534 |
| Pick 'n Pay Stores Ltd. | | 392,400 | 1,235,767 |
| Transaction Capital Ltd. | | 507,300 | 619,534 |
|
| TOTAL SOUTH AFRICA | | | 11,424,863 |
|
| Sri Lanka - 0.2% | | | |
| Hatton National Bank PLC | | 677,760 | 419,601 |
| Taiwan - 8.5% | | | |
| Cleanaway Co. Ltd. | | 325,000 | 1,789,210 |
| CTCI Corp. | | 953,000 | 1,297,471 |
| eMemory Technology, Inc. | | 55,470 | 1,105,173 |
| International Games Systems Co. Ltd. | | 89,000 | 2,339,404 |
| Largan Precision Co. Ltd. | | 3,020 | 319,323 |
| Nanya Technology Corp. | | 1,504,220 | 3,039,041 |
| PChome Online, Inc. | | 559,000 | 1,875,773 |
| Poya International Co. Ltd. | | 107,000 | 2,303,890 |
| Unimicron Technology Corp. | | 968,450 | 2,308,654 |
| Vanguard International Semiconductor Corp. | | 711,640 | 2,318,321 |
| Win Semiconductors Corp. | | 230,600 | 2,506,785 |
|
| TOTAL TAIWAN | | | 21,203,045 |
|
| Thailand - 0.9% | | | |
| PTT Global Chemical PCL (For. Reg.) | | 276,500 | 354,277 |
| Siam Global House PCL | | 1,962,995 | 1,000,052 |
| Star Petroleum Refining PCL | | 4,856,600 | 825,696 |
|
| TOTAL THAILAND | | | 2,180,025 |
|
| Turkey - 1.3% | | | |
| Aselsan A/S | | 899,000 | 1,797,034 |
| Mavi Jeans Class B (a)(c) | | 329,000 | 1,480,196 |
|
| TOTAL TURKEY | | | 3,277,230 |
|
| United Arab Emirates - 0.4% | | | |
| Aldar Properties PJSC | | 1,308,844 | 976,337 |
| United Kingdom - 1.5% | | | |
| Bank of Georgia Group PLC (a) | | 69,272 | 804,985 |
| Georgia Capital PLC (a) | | 79,800 | 382,509 |
| Mondi PLC | | 140,664 | 2,640,886 |
|
| TOTAL UNITED KINGDOM | | | 3,828,380 |
|
| United States of America - 0.1% | | | |
| DouYu International Holdings Ltd. ADR (a) | | 19,166 | 293,240 |
| Vietnam - 0.1% | | | |
| FTP Corp. | | 163,386 | 363,621 |
| TOTAL COMMON STOCKS | | | |
| (Cost $212,511,885) | | | 231,703,413 |
|
| Nonconvertible Preferred Stocks - 1.9% | | | |
| Brazil - 1.5% | | | |
| Banco ABC Brasil SA | | 504,720 | 1,073,133 |
| Banco ABC Brasil SA (a) | | 4,950 | 10,525 |
| Companhia de Saneamento Basico do Estado de Sao Paulo (SABESP) sponsored ADR | | 70,600 | 521,028 |
| Metalurgica Gerdau SA (PN) | | 1,234,600 | 2,108,607 |
|
| TOTAL BRAZIL | | | 3,713,293 |
|
| Russia - 0.4% | | | |
| Sberbank of Russia | | 390,300 | 951,139 |
| TOTAL NONCONVERTIBLE PREFERRED STOCKS | | | |
| (Cost $5,276,086) | | | 4,664,432 |
| | | Principal Amount | Value |
|
| Government Obligations - 0.3% | | | |
| United States of America - 0.3% | | | |
U.S. Treasury Bills, yield at date of purchase 0.09% to 0.1% 12/17/20 to 12/24/20
(Cost $769,897)(d) | | 770,000 | 769,905 |
| | | Shares | Value |
|
| Money Market Funds - 6.9% | | | |
| Fidelity Cash Central Fund 0.10% (e) | | 13,277,987 | 13,280,643 |
| Fidelity Securities Lending Cash Central Fund 0.11% (e)(f) | | 4,112,133 | 4,112,544 |
| TOTAL MONEY MARKET FUNDS | | | |
| (Cost $17,392,687) | | | 17,393,187 |
| TOTAL INVESTMENT IN SECURITIES - 101.5% | | | |
| (Cost $235,950,555) | | | 254,530,937 |
| NET OTHER ASSETS (LIABILITIES) - (1.5)% | | | (3,776,010) |
| NET ASSETS - 100% | | | $250,754,927 |
| Futures Contracts | | | | | |
| | Number of contracts | Expiration Date | Notional Amount | Value | Unrealized Appreciation/(Depreciation) |
| Purchased | | | | | |
| Equity Index Contracts | | | | | |
| ICE E-mini MSCI Emerging Markets Index Contracts (United States) | 120 | Dec. 2020 | $6,611,400 | $274,984 | $274,984 |
The notional amount of futures purchased as a percentage of Net Assets is 2.6%
For the period, the average monthly notional amount at value for futures contracts in the aggregate was $4,143,720.
Security Type Abbreviations
ELS – Equity-Linked Security
Categorizations in the Schedule of Investments are based on country or territory of incorporation.
Legend
(a) Non-income producing
(b) Security or a portion of the security is on loan at period end.
(c) Security exempt from registration under Rule 144A of the Securities Act of 1933. These securities may be resold in transactions exempt from registration, normally to qualified institutional buyers. At the end of the period, the value of these securities amounted to $16,757,023 or 6.7% of net assets.
(d) Security or a portion of the security was pledged to cover margin requirements for futures contracts. At period end, the value of securities pledged amounted to $769,905.
(e) Affiliated fund that is generally available only to investment companies and other accounts managed by Fidelity Investments. The rate quoted is the annualized seven-day yield of the fund at period end. A complete unaudited listing of the fund's holdings as of its most recent quarter end is available upon request. In addition, each Fidelity Central Fund's financial statements, which are not covered by the Fund's Report of Independent Registered Public Accounting Firm, are available on the SEC's website or upon request.
(f) Investment made with cash collateral received from securities on loan.
Affiliated Central Funds
Information regarding fiscal year to date income earned by the Fund from investments in Fidelity Central Funds is as follows:
| Fund | Income earned |
| Fidelity Cash Central Fund | $60,091 |
| Fidelity Securities Lending Cash Central Fund | 60,668 |
| Total | $120,759 |
Amounts in the income column in the above table include any capital gain distributions from underlying funds, which are presented in the corresponding line-item in the Statement of Operations, if applicable. Amount for Fidelity Securities Lending Cash Central Fund represents the income earned on investing cash collateral, less rebates paid to borrowers and any lending agent fees associated with the loan, plus any premium payments received for lending certain types of securities.
The value, beginning of period, for the Fidelity Cash Central Fund was $9,289,133. Net realized gain (loss) and change in net unrealized appreciation (depreciation) on Fidelity Cash Central Fund is presented in the Statement of Operations, if applicable. Purchases and sales of the Fidelity Cash Central Fund were $135,053,919 and $131,062,082, respectively, during the period.
Investment Valuation
The following is a summary of the inputs used, as of October 31, 2020, involving the Fund's assets and liabilities carried at fair value. The inputs or methodology used for valuing securities may not be an indication of the risk associated with investing in those securities. For more information on valuation inputs, and their aggregation into the levels used below, please refer to the Investment Valuation section in the accompanying Notes to Financial Statements.
| | Valuation Inputs at Reporting Date: |
| Description | Total | Level 1 | Level 2 | Level 3 |
| Investments in Securities: | | | | |
| Equities: | | | | |
| Communication Services | $15,928,900 | $11,197,893 | $4,731,007 | $-- |
| Consumer Discretionary | 29,383,986 | 17,101,524 | 12,282,462 | -- |
| Consumer Staples | 17,545,800 | 11,558,055 | 5,987,745 | -- |
| Energy | 5,618,650 | 1,312,942 | 4,305,708 | -- |
| Financials | 23,175,863 | 9,780,167 | 13,395,696 | -- |
| Health Care | 25,431,847 | 18,526,409 | 6,905,438 | -- |
| Industrials | 28,595,583 | 22,797,957 | 5,797,626 | -- |
| Information Technology | 37,005,086 | 27,164,812 | 9,840,274 | -- |
| Materials | 31,064,057 | 13,579,918 | 17,484,139 | -- |
| Real Estate | 15,017,359 | 11,169,191 | 3,848,168 | -- |
| Utilities | 7,600,714 | 4,470,436 | 3,130,278 | -- |
| Government Obligations | 769,905 | -- | 769,905 | -- |
| Money Market Funds | 17,393,187 | 17,393,187 | -- | -- |
| Total Investments in Securities: | $254,530,937 | $166,052,491 | $88,478,446 | $-- |
| Derivative Instruments: | | | | |
| Assets | | | | |
| Futures Contracts | $274,984 | $274,984 | $-- | $-- |
| Total Assets | $274,984 | $274,984 | $-- | $-- |
| Total Derivative Instruments: | $274,984 | $274,984 | $-- | $-- |
Value of Derivative Instruments
The following table is a summary of the Fund's value of derivative instruments by primary risk exposure as of October 31, 2020. For additional information on derivative instruments, please refer to the Derivative Instruments section in the accompanying Notes to Financial Statements.
| Primary Risk Exposure / Derivative Type | Value |
| | Asset | Liability |
| Equity Risk | | |
| Futures Contracts(a) | $274,984 | $0 |
| Total Equity Risk | 274,984 | 0 |
| Total Value of Derivatives | $274,984 | $0 |
(a) Reflects gross cumulative appreciation (depreciation) on futures contracts as presented in the Schedule of Investments. In the Statement of Assets and Liabilities, the period end daily variation margin is included in receivable or payable for daily variation margin on futures contracts, and the net cumulative appreciation (depreciation) is included in Total accumulated earnings (loss).
See accompanying notes which are an integral part of the financial statements.
Fidelity® Emerging Markets Discovery Fund
Financial Statements
Statement of Assets and Liabilities
| | | October 31, 2020 |
| Assets | | |
Investment in securities, at value (including securities loaned of $3,904,734) — See accompanying schedule:
Unaffiliated issuers (cost $218,557,868) | $237,137,750 | |
| Fidelity Central Funds (cost $17,392,687) | 17,393,187 | |
| Total Investment in Securities (cost $235,950,555) | | $254,530,937 |
| Cash | | 108,521 |
| Foreign currency held at value (cost $49,687) | | 49,874 |
| Receivable for investments sold | | 853,574 |
| Receivable for fund shares sold | | 312,916 |
| Dividends receivable | | 96,196 |
| Distributions receivable from Fidelity Central Funds | | 1,607 |
| Prepaid expenses | | 434 |
| Other receivables | | 136,416 |
| Total assets | | 256,090,475 |
| Liabilities | | |
| Payable for investments purchased | $606,897 | |
| Payable for fund shares redeemed | 189,403 | |
| Accrued management fee | 178,504 | |
| Distribution and service plan fees payable | 8,913 | |
| Payable for daily variation margin on futures contracts | 82,800 | |
| Other affiliated payables | 50,015 | |
| Other payables and accrued expenses | 106,516 | |
| Collateral on securities loaned | 4,112,500 | |
| Total liabilities | | 5,335,548 |
| Net Assets | | $250,754,927 |
| Net Assets consist of: | | |
| Paid in capital | | $253,332,288 |
| Total accumulated earnings (loss) | | (2,577,361) |
| Net Assets | | $250,754,927 |
| Net Asset Value and Maximum Offering Price | | |
| Class A: | | |
| Net Asset Value and redemption price per share ($11,744,773 ÷ 843,016 shares)(a) | | $13.93 |
| Maximum offering price per share (100/94.25 of $13.93) | | $14.78 |
| Class M: | | |
| Net Asset Value and redemption price per share ($4,551,918 ÷ 327,752 shares)(a) | | $13.89 |
| Maximum offering price per share (100/96.50 of $13.89) | | $14.39 |
| Class C: | | |
| Net Asset Value and offering price per share ($5,079,566 ÷ 374,847 shares)(a) | | $13.55 |
| Emerging Markets Discovery: | | |
| Net Asset Value, offering price and redemption price per share ($189,784,085 ÷ 13,534,320 shares) | | $14.02 |
| Class I: | | |
| Net Asset Value, offering price and redemption price per share ($28,033,729 ÷ 1,994,000 shares) | | $14.06 |
| Class Z: | | |
| Net Asset Value, offering price and redemption price per share ($11,560,856 ÷ 823,472 shares) | | $14.04 |
(a) Redemption price per share is equal to net asset value less any applicable contingent deferred sales charge.
See accompanying notes which are an integral part of the financial statements.
Statement of Operations
| | | Year ended October 31, 2020 |
| Investment Income | | |
| Dividends | | $5,293,300 |
| Interest | | 2,201 |
| Income from Fidelity Central Funds (including $60,668 from security lending) | | 120,759 |
| Income before foreign taxes withheld | | 5,416,260 |
| Less foreign taxes withheld | | (528,301) |
| Total income | | 4,887,959 |
| Expenses | | |
| Management fee | $2,221,506 | |
| Transfer agent fees | 499,532 | |
| Distribution and service plan fees | 115,720 | |
| Accounting fees | 138,358 | |
| Custodian fees and expenses | 214,449 | |
| Independent trustees' fees and expenses | 1,563 | |
| Registration fees | 99,528 | |
| Audit | 100,297 | |
| Legal | 446 | |
| Miscellaneous | 9,827 | |
| Total expenses before reductions | 3,401,226 | |
| Expense reductions | (80,024) | |
| Total expenses after reductions | | 3,321,202 |
| Net investment income (loss) | | 1,566,757 |
| Realized and Unrealized Gain (Loss) | | |
| Net realized gain (loss) on: | | |
| Investment securities: | | |
| Unaffiliated issuers (net of foreign taxes of $2,561) | 931,867 | |
| Fidelity Central Funds | 655 | |
| Foreign currency transactions | (99,824) | |
| Futures contracts | 1,689,293 | |
| Total net realized gain (loss) | | 2,521,991 |
| Change in net unrealized appreciation (depreciation) on: | | |
| Investment securities: | | |
| Unaffiliated issuers (net of decrease in deferred foreign taxes of $21,111) | (5,211,952) | |
| Fidelity Central Funds | (147) | |
| Assets and liabilities in foreign currencies | (10,644) | |
| Futures contracts | 283,311 | |
| Total change in net unrealized appreciation (depreciation) | | (4,939,432) |
| Net gain (loss) | | (2,417,441) |
| Net increase (decrease) in net assets resulting from operations | | $(850,684) |
See accompanying notes which are an integral part of the financial statements.
Statement of Changes in Net Assets
| | Year ended October 31, 2020 | Year ended October 31, 2019 |
| Increase (Decrease) in Net Assets | | |
| Operations | | |
| Net investment income (loss) | $1,566,757 | $3,639,313 |
| Net realized gain (loss) | 2,521,991 | (17,662,192) |
| Change in net unrealized appreciation (depreciation) | (4,939,432) | 55,873,369 |
| Net increase (decrease) in net assets resulting from operations | (850,684) | 41,850,490 |
| Distributions to shareholders | (3,213,839) | (4,896,604) |
| Share transactions - net increase (decrease) | (51,843,020) | (9,023,067) |
| Total increase (decrease) in net assets | (55,907,543) | 27,930,819 |
| Net Assets | | |
| Beginning of period | 306,662,470 | 278,731,651 |
| End of period | $250,754,927 | $306,662,470 |
See accompanying notes which are an integral part of the financial statements.
Financial Highlights
Fidelity Emerging Markets Discovery Fund Class A
| Years ended October 31, | 2020 | 2019 | 2018 | 2017 | 2016 |
| Selected Per–Share Data | | | | | |
| Net asset value, beginning of period | $13.66 | $12.01 | $15.03 | $12.27 | $10.92 |
| Income from Investment Operations | | | | | |
| Net investment income (loss)A | .04 | .13 | .18 | .14 | .09 |
| Net realized and unrealized gain (loss) | .34B | 1.71 | (2.89) | 2.74 | 1.30 |
| Total from investment operations | .38 | 1.84 | (2.71) | 2.88 | 1.39 |
| Distributions from net investment income | (.11) | (.18) | (.08) | (.07) | (.05) |
| Distributions from net realized gain | – | (.01) | (.23) | (.06) | – |
| Total distributions | (.11) | (.19) | (.31) | (.13) | (.05) |
| Redemption fees added to paid in capitalA | – | – | –C | .01 | .01 |
| Net asset value, end of period | $13.93 | $13.66 | $12.01 | $15.03 | $12.27 |
| Total ReturnD,E | 2.76% | 15.50% | (18.39)% | 23.89% | 12.93% |
| Ratios to Average Net AssetsF,G | | | | | |
| Expenses before reductions | 1.54% | 1.55% | 1.52% | 1.63% | 1.89% |
| Expenses net of fee waivers, if any | 1.53% | 1.54% | 1.52% | 1.63% | 1.70% |
| Expenses net of all reductions | 1.51% | 1.54% | 1.48% | 1.62% | 1.70% |
| Net investment income (loss) | .33% | .96% | 1.22% | 1.03% | .85% |
| Supplemental Data | | | | | |
| Net assets, end of period (000 omitted) | $11,745 | $15,323 | $14,472 | $16,062 | $5,252 |
| Portfolio turnover rateH | 43% | 80% | 98% | 58% | 60% |
A Calculated based on average shares outstanding during the period.
B The amount shown for a share outstanding does not correspond with the aggregate net gain (loss) on investments for the period due to the timing of sales and repurchases of shares in relation to fluctuating market values of the investments of the Fund.
C Amount represents less than $.005 per share.
D Total returns would have been lower if certain expenses had not been reduced during the applicable periods shown.
E Total returns do not include the effect of the sales charges.
F Fees and expenses of any underlying mutual funds or exchange-traded funds (ETFs) are not included in the Fund's expense ratio. The Fund indirectly bears its proportionate share of these expenses. For additional expense information related to investments in Fidelity Central Funds, please refer to the "Investments in Fidelity Central Funds" note found in the Notes to Financial Statements section of the most recent Annual or Semi-Annual report.
G Expense ratios reflect operating expenses of the class. Expenses before reductions do not reflect amounts reimbursed, waived, or reduced through arrangements with the investment adviser, brokerage services, or other offset arrangements, if applicable, and do not represent the amount paid by the class during periods when reimbursements, waivers or reductions occur.
H Amount does not include the portfolio activity of any underlying mutual funds or exchange-traded funds (ETFs).
See accompanying notes which are an integral part of the financial statements.
Fidelity Emerging Markets Discovery Fund Class M
| Years ended October 31, | 2020 | 2019 | 2018 | 2017 | 2016 |
| Selected Per–Share Data | | | | | |
| Net asset value, beginning of period | $13.62 | $11.94 | $14.94 | $12.20 | $10.86 |
| Income from Investment Operations | | | | | |
| Net investment income (loss)A | –B | .08 | .14 | .10 | .07 |
| Net realized and unrealized gain (loss) | .34C | 1.71 | (2.87) | 2.74 | 1.28 |
| Total from investment operations | .34 | 1.79 | (2.73) | 2.84 | 1.35 |
| Distributions from net investment income | (.07) | (.10) | (.04) | (.04) | (.02) |
| Distributions from net realized gain | – | (.01) | (.23) | (.06) | – |
| Total distributions | (.07) | (.11) | (.27) | (.11)D | (.02) |
| Redemption fees added to paid in capitalA | – | – | –B | .01 | .01 |
| Net asset value, end of period | $13.89 | $13.62 | $11.94 | $14.94 | $12.20 |
| Total ReturnE,F | 2.49% | 15.06% | (18.58)% | 23.63% | 12.58% |
| Ratios to Average Net AssetsG,H | | | | | |
| Expenses before reductions | 1.83% | 1.86% | 1.79% | 1.92% | 2.17% |
| Expenses net of fee waivers, if any | 1.83% | 1.86% | 1.79% | 1.92% | 1.95% |
| Expenses net of all reductions | 1.80% | 1.86% | 1.75% | 1.90% | 1.94% |
| Net investment income (loss) | .03% | .64% | .94% | .74% | .60% |
| Supplemental Data | | | | | |
| Net assets, end of period (000 omitted) | $4,552 | $5,773 | $5,374 | $9,393 | $2,868 |
| Portfolio turnover rateI | 43% | 80% | 98% | 58% | 60% |
A Calculated based on average shares outstanding during the period.
B Amount represents less than $.005 per share.
C The amount shown for a share outstanding does not correspond with the aggregate net gain (loss) on investments for the period due to the timing of sales and repurchases of shares in relation to fluctuating market values of the investments of the Fund.
D Total distributions per share do not sum due to rounding.
E Total returns would have been lower if certain expenses had not been reduced during the applicable periods shown.
F Total returns do not include the effect of the sales charges.
G Fees and expenses of any underlying mutual funds or exchange-traded funds (ETFs) are not included in the Fund's expense ratio. The Fund indirectly bears its proportionate share of these expenses. For additional expense information related to investments in Fidelity Central Funds, please refer to the "Investments in Fidelity Central Funds" note found in the Notes to Financial Statements section of the most recent Annual or Semi-Annual report.
H Expense ratios reflect operating expenses of the class. Expenses before reductions do not reflect amounts reimbursed, waived, or reduced through arrangements with the investment adviser, brokerage services, or other offset arrangements, if applicable, and do not represent the amount paid by the class during periods when reimbursements, waivers or reductions occur.
I Amount does not include the portfolio activity of any underlying mutual funds or exchange-traded funds (ETFs).
See accompanying notes which are an integral part of the financial statements.
Fidelity Emerging Markets Discovery Fund Class C
| Years ended October 31, | 2020 | 2019 | 2018 | 2017 | 2016 |
| Selected Per–Share Data | | | | | |
| Net asset value, beginning of period | $13.29 | $11.66 | $14.64 | $11.97 | $10.69 |
| Income from Investment Operations | | | | | |
| Net investment income (loss)A | (.06) | .02 | .06 | .04 | .01 |
| Net realized and unrealized gain (loss) | .32B | 1.67 | (2.79) | 2.69 | 1.26 |
| Total from investment operations | .26 | 1.69 | (2.73) | 2.73 | 1.27 |
| Distributions from net investment income | – | (.05) | (.02) | (.01) | – |
| Distributions from net realized gain | – | (.01) | (.23) | (.06) | – |
| Total distributions | – | (.06) | (.25) | (.07) | – |
| Redemption fees added to paid in capitalA | – | – | –C | .01 | .01 |
| Net asset value, end of period | $13.55 | $13.29 | $11.66 | $14.64 | $11.97 |
| Total ReturnD,E | 1.96% | 14.54% | (18.97)% | 23.02% | 11.97% |
| Ratios to Average Net AssetsF,G | | | | | |
| Expenses before reductions | 2.32% | 2.36% | 2.28% | 2.38% | 2.63% |
| Expenses net of fee waivers, if any | 2.31% | 2.35% | 2.28% | 2.38% | 2.45% |
| Expenses net of all reductions | 2.29% | 2.35% | 2.24% | 2.37% | 2.44% |
| Net investment income (loss) | (.45)% | .14% | .45% | .28% | .10% |
| Supplemental Data | | | | | |
| Net assets, end of period (000 omitted) | $5,080 | $7,562 | $11,278 | $14,168 | $2,203 |
| Portfolio turnover rateH | 43% | 80% | 98% | 58% | 60% |
A Calculated based on average shares outstanding during the period.
B The amount shown for a share outstanding does not correspond with the aggregate net gain (loss) on investments for the period due to the timing of sales and repurchases of shares in relation to fluctuating market values of the investments of the Fund.
C Amount represents less than $.005 per share.
D Total returns would have been lower if certain expenses had not been reduced during the applicable periods shown.
E Total returns do not include the effect of the contingent deferred sales charge.
F Fees and expenses of any underlying mutual funds or exchange-traded funds (ETFs) are not included in the Fund's expense ratio. The Fund indirectly bears its proportionate share of these expenses. For additional expense information related to investments in Fidelity Central Funds, please refer to the "Investments in Fidelity Central Funds" note found in the Notes to Financial Statements section of the most recent Annual or Semi-Annual report.
G Expense ratios reflect operating expenses of the class. Expenses before reductions do not reflect amounts reimbursed, waived, or reduced through arrangements with the investment adviser, brokerage services, or other offset arrangements, if applicable, and do not represent the amount paid by the class during periods when reimbursements, waivers or reductions occur.
H Amount does not include the portfolio activity of any underlying mutual funds or exchange-traded funds (ETFs).
See accompanying notes which are an integral part of the financial statements.
Fidelity Emerging Markets Discovery Fund
| Years ended October 31, | 2020 | 2019 | 2018 | 2017 | 2016 |
| Selected Per–Share Data | | | | | |
| Net asset value, beginning of period | $13.75 | $12.10 | $15.12 | $12.33 | $10.98 |
| Income from Investment Operations | | | | | |
| Net investment income (loss)A | .08 | .16 | .23 | .18 | .12 |
| Net realized and unrealized gain (loss) | .34B | 1.72 | (2.91) | 2.76 | 1.31 |
| Total from investment operations | .42 | 1.88 | (2.68) | 2.94 | 1.43 |
| Distributions from net investment income | (.15) | (.22) | (.11) | (.09) | (.09) |
| Distributions from net realized gain | – | (.01) | (.23) | (.06) | – |
| Total distributions | (.15) | (.23) | (.34) | (.16)C | (.09) |
| Redemption fees added to paid in capitalA | – | – | –D | .01 | .01 |
| Net asset value, end of period | $14.02 | $13.75 | $12.10 | $15.12 | $12.33 |
| Total ReturnE | 3.07% | 15.78% | (18.11)% | 24.30% | 13.19% |
| Ratios to Average Net AssetsF,G | | | | | |
| Expenses before reductions | 1.23% | 1.25% | 1.22% | 1.35% | 1.55% |
| Expenses net of fee waivers, if any | 1.23% | 1.25% | 1.22% | 1.35% | 1.45% |
| Expenses net of all reductions | 1.20% | 1.25% | 1.18% | 1.34% | 1.44% |
| Net investment income (loss) | .63% | 1.25% | 1.51% | 1.31% | 1.10% |
| Supplemental Data | | | | | |
| Net assets, end of period (000 omitted) | $189,784 | $208,657 | $188,690 | $248,124 | $67,178 |
| Portfolio turnover rateH | 43% | 80% | 98% | 58% | 60% |
A Calculated based on average shares outstanding during the period.
B The amount shown for a share outstanding does not correspond with the aggregate net gain (loss) on investments for the period due to the timing of sales and repurchases of shares in relation to fluctuating market values of the investments of the Fund.
C Total distributions per share do not sum due to rounding.
D Amount represents less than $.005 per share.
E Total returns would have been lower if certain expenses had not been reduced during the applicable periods shown.
F Fees and expenses of any underlying mutual funds or exchange-traded funds (ETFs) are not included in the Fund's expense ratio. The Fund indirectly bears its proportionate share of these expenses. For additional expense information related to investments in Fidelity Central Funds, please refer to the "Investments in Fidelity Central Funds" note found in the Notes to Financial Statements section of the most recent Annual or Semi-Annual report.
G Expense ratios reflect operating expenses of the class. Expenses before reductions do not reflect amounts reimbursed, waived, or reduced through arrangements with the investment adviser, brokerage services, or other offset arrangements, if applicable, and do not represent the amount paid by the class during periods when reimbursements, waivers or reductions occur.
H Amount does not include the portfolio activity of any underlying mutual funds or exchange-traded funds (ETFs).
See accompanying notes which are an integral part of the financial statements.
Fidelity Emerging Markets Discovery Fund Class I
| Years ended October 31, | 2020 | 2019 | 2018 | 2017 | 2016 |
| Selected Per–Share Data | | | | | |
| Net asset value, beginning of period | $13.79 | $12.13 | $15.15 | $12.37 | $11.02 |
| Income from Investment Operations | | | | | |
| Net investment income (loss)A | .08 | .17 | .23 | .19 | .13 |
| Net realized and unrealized gain (loss) | .34B | 1.72 | (2.90) | 2.75 | 1.30 |
| Total from investment operations | .42 | 1.89 | (2.67) | 2.94 | 1.43 |
| Distributions from net investment income | (.15) | (.22) | (.12) | (.10) | (.09) |
| Distributions from net realized gain | – | (.01) | (.23) | (.06) | – |
| Total distributions | (.15) | (.23) | (.35) | (.17)C | (.09) |
| Redemption fees added to paid in capitalA | – | – | –D | .01 | .01 |
| Net asset value, end of period | $14.06 | $13.79 | $12.13 | $15.15 | $12.37 |
| Total ReturnE | 3.07% | 15.78% | (18.06)% | 24.25% | 13.16% |
| Ratios to Average Net AssetsF,G | | | | | |
| Expenses before reductions | 1.24% | 1.25% | 1.22% | 1.32% | 1.59% |
| Expenses net of fee waivers, if any | 1.23% | 1.24% | 1.22% | 1.32% | 1.45% |
| Expenses net of all reductions | 1.21% | 1.24% | 1.18% | 1.30% | 1.44% |
| Net investment income (loss) | .63% | 1.26% | 1.51% | 1.34% | 1.10% |
| Supplemental Data | | | | | |
| Net assets, end of period (000 omitted) | $28,034 | $51,081 | $57,506 | $97,170 | $8,337 |
| Portfolio turnover rateH | 43% | 80% | 98% | 58% | 60% |
A Calculated based on average shares outstanding during the period.
B The amount shown for a share outstanding does not correspond with the aggregate net gain (loss) on investments for the period due to the timing of sales and repurchases of shares in relation to fluctuating market values of the investments of the Fund.
C Total distributions per share do not sum due to rounding.
D Amount represents less than $.005 per share.
E Total returns would have been lower if certain expenses had not been reduced during the applicable periods shown.
F Fees and expenses of any underlying mutual funds or exchange-traded funds (ETFs) are not included in the Fund's expense ratio. The Fund indirectly bears its proportionate share of these expenses. For additional expense information related to investments in Fidelity Central Funds, please refer to the "Investments in Fidelity Central Funds" note found in the Notes to Financial Statements section of the most recent Annual or Semi-Annual report.
G Expense ratios reflect operating expenses of the class. Expenses before reductions do not reflect amounts reimbursed, waived, or reduced through arrangements with the investment adviser, brokerage services, or other offset arrangements, if applicable, and do not represent the amount paid by the class during periods when reimbursements, waivers or reductions occur.
H Amount does not include the portfolio activity of any underlying mutual funds or exchange-traded funds (ETFs).
See accompanying notes which are an integral part of the financial statements.
Fidelity Emerging Markets Discovery Fund Class Z
| Years ended October 31, | 2020 | 2019 | 2018 A |
| Selected Per–Share Data | | | |
| Net asset value, beginning of period | $13.77 | $12.13 | $13.19 |
| Income from Investment Operations | | | |
| Net investment income (loss)B | .10 | .18 | –C |
| Net realized and unrealized gain (loss) | .35D | 1.72 | (1.06) |
| Total from investment operations | .45 | 1.90 | (1.06) |
| Distributions from net investment income | (.18) | (.26) | – |
| Distributions from net realized gain | – | (.01) | – |
| Total distributions | (.18) | (.26)E | – |
| Redemption fees added to paid in capitalB | – | – | – |
| Net asset value, end of period | $14.04 | $13.77 | $12.13 |
| Total ReturnF,G | 3.24% | 15.97% | (8.04)% |
| Ratios to Average Net AssetsH,I | | | |
| Expenses before reductions | 1.09% | 1.10% | 1.17%J |
| Expenses net of fee waivers, if any | 1.08% | 1.10% | 1.02%J |
| Expenses net of all reductions | 1.06% | 1.10% | .98%J |
| Net investment income (loss) | .78% | 1.40% | (.12)%J |
| Supplemental Data | | | |
| Net assets, end of period (000 omitted) | $11,561 | $18,267 | $1,412 |
| Portfolio turnover rateK | 43% | 80% | 98% |
A For the period October 2, 2018 (commencement of sale of shares) to October 31, 2018.
B Calculated based on average shares outstanding during the period.
C Amount represents less than $.005 per share.
D The amount shown for a share outstanding does not correspond with the aggregate net gain (loss) on investments for the period due to the timing of sales and repurchases of shares in relation to fluctuating market values of the investments of the Fund.
E Total distributions per share do not sum due to rounding.
F Total returns for periods of less than one year are not annualized.
G Total returns would have been lower if certain expenses had not been reduced during the applicable periods shown.
H Fees and expenses of any underlying mutual funds or exchange-traded funds (ETFs) are not included in the Fund's expense ratio. The Fund indirectly bears its proportionate share of these expenses. For additional expense information related to investments in Fidelity Central Funds, please refer to the "Investments in Fidelity Central Funds" note found in the Notes to Financial Statements section of the most recent Annual or Semi-Annual report.
I Expense ratios reflect operating expenses of the class. Expenses before reductions do not reflect amounts reimbursed, waived, or reduced through arrangements with the investment adviser, brokerage services, or other offset arrangements, if applicable, and do not represent the amount paid by the class during periods when reimbursements, waivers or reductions occur.
J Annualized
K Amount does not include the portfolio activity of any underlying mutual funds or exchange-traded funds (ETFs).
See accompanying notes which are an integral part of the financial statements.
Notes to Financial Statements
For the period ended October 31, 2020
1. Organization.
Fidelity Emerging Markets Discovery Fund (the Fund) is a fund of Fidelity Investment Trust (the Trust) and is authorized to issue an unlimited number of shares. The Trust is registered under the Investment Company Act of 1940, as amended (the 1940 Act), as an open-end management investment company organized as a Massachusetts business trust. The Fund offers Class A, Class M, Class C, Emerging Markets Discovery, Class I and Class Z shares, each of which has equal rights as to assets and voting privileges. Each class has exclusive voting rights with respect to matters that affect that class. Class C shares will automatically convert to Class A shares after a holding period of ten years from the initial date of purchase, with certain exceptions. The Fund's investments in emerging markets can be subject to social, economic, regulatory, and political uncertainties and can be extremely volatile.
Effective January 1, 2020:
Investment advisers Fidelity Investments Money Management, Inc., FMR Co., Inc., and Fidelity SelectCo, LLC, merged with and into Fidelity Management & Research Company. In connection with the merger transactions, the resulting, merged investment adviser was then redomiciled from Massachusetts to Delaware, changed its corporate structure from a corporation to a limited liability company, and changed its name to "Fidelity Management & Research Company LLC".
Broker-dealer Fidelity Distributors Corporation merged with and into Fidelity Investments Institutional Services Company, Inc. ("FIISC"). FIISC was then redomiciled from Massachusetts to Delaware, changed its corporate structure from a corporation to a limited liability company, and changed its name to "Fidelity Distributors Company LLC".
Fidelity Investments Institutional Operations Company, Inc. converted from a Massachusetts corporation to a Massachusetts LLC, and changed its name to "Fidelity Investments Institutional Operations Company LLC".
2. Investments in Fidelity Central Funds.
The Fund invests in Fidelity Central Funds, which are open-end investment companies generally available only to other investment companies and accounts managed by the investment adviser and its affiliates. The Fund's Schedule of Investments lists each of the Fidelity Central Funds held as of period end, if any, as an investment of the Fund, but does not include the underlying holdings of each Fidelity Central Fund. As an Investing Fund, the Fund indirectly bears its proportionate share of the expenses of the underlying Fidelity Central Funds.
The Money Market Central Funds seek preservation of capital and current income and are managed by the investment adviser. Annualized expenses of the Money Market Central Funds as of their most recent shareholder report date ranged from less than .005% to .01%.
A complete unaudited list of holdings for each Fidelity Central Fund is available upon request or at the Securities and Exchange Commission (the SEC) website at www.sec.gov. In addition, the financial statements of the Fidelity Central Funds, which are not covered by the Fund's Report of Independent Registered Public Accounting Firm, are available on the SEC website or upon request.
3. Significant Accounting Policies.
The Fund is an investment company and applies the accounting and reporting guidance of the Financial Accounting Standards Board (FASB) Accounting Standards Codification Topic 946 Financial Services – Investment Companies. The financial statements have been prepared in conformity with accounting principles generally accepted in the United States of America (GAAP), which require management to make certain estimates and assumptions at the date of the financial statements. Actual results could differ from those estimates. Subsequent events, if any, through the date that the financial statements were issued have been evaluated in the preparation of the financial statements. The following summarizes the significant accounting policies of the Fund:
Investment Valuation. Investments are valued as of 4:00 p.m. Eastern time on the last calendar day of the period. The Board of Trustees (the Board) has delegated the day to day responsibility for the valuation of the Fund's investments to the Fair Value Committee (the Committee) established by the Fund's investment adviser. In accordance with valuation policies and procedures approved by the Board, the Fund attempts to obtain prices from one or more third party pricing vendors or brokers to value its investments. When current market prices, quotations or currency exchange rates are not readily available or reliable, investments will be fair valued in good faith by the Committee, in accordance with procedures adopted by the Board. Factors used in determining fair value vary by investment type and may include market or investment specific events, changes in interest rates and credit quality. The frequency with which these procedures are used cannot be predicted and they may be utilized to a significant extent. The Committee oversees the Fund's valuation policies and procedures and reports to the Board on the Committee's activities and fair value determinations. The Board monitors the appropriateness of the procedures used in valuing the Fund's investments and ratifies the fair value determinations of the Committee.
The Fund categorizes the inputs to valuation techniques used to value its investments into a disclosure hierarchy consisting of three levels as shown below:
- Level 1 – quoted prices in active markets for identical investments
- Level 2 – other significant observable inputs (including quoted prices for similar investments, interest rates, prepayment speeds, etc.)
- Level 3 – unobservable inputs (including the Fund's own assumptions based on the best information available)
Valuation techniques used to value the Fund's investments by major category are as follows:
Equity securities, including restricted securities, for which market quotations are readily available, are valued at the last reported sale price or official closing price as reported by a third party pricing vendor on the primary market or exchange on which they are traded and are categorized as Level 1 in the hierarchy. In the event there were no sales during the day or closing prices are not available, securities are valued at the last quoted bid price or may be valued using the last available price and are generally categorized as Level 2 in the hierarchy. For foreign equity securities, when market or security specific events arise, comparisons to the valuation of American Depositary Receipts (ADRs), futures contracts, Exchange-Traded Funds (ETFs) and certain indexes as well as quoted prices for similar securities may be used and would be categorized as Level 2 in the hierarchy. For equity securities, including restricted securities, where observable inputs are limited, assumptions about market activity and risk are used and these securities may be categorized as Level 3 in the hierarchy.
Debt securities, including restricted securities, are valued based on evaluated prices received from third party pricing vendors or from brokers who make markets in such securities. U.S. government and government agency obligations are valued by pricing vendors who utilize matrix pricing which considers yield or price of bonds of comparable quality, coupon, maturity and type or by broker-supplied prices. When independent prices are unavailable or unreliable, debt securities may be valued utilizing pricing methodologies which consider similar factors that would be used by third party pricing vendors. Debt securities are generally categorized as Level 2 in the hierarchy but may be Level 3 depending on the circumstances.
Futures contracts are valued at the settlement price established each day by the board of trade or exchange on which they are traded and are categorized as Level 1 in the hierarchy. Investments in open-end mutual funds, including the Fidelity Central Funds, are valued at their closing net asset value (NAV) each business day and are categorized as Level 1 in the hierarchy.
Changes in valuation techniques may result in transfers in or out of an assigned level within the disclosure hierarchy. The aggregate value of investments by input level as of October 31, 2020 is included at the end of the Fund's Schedule of Investments.
Foreign Currency. Certain Funds may use foreign currency contracts to facilitate transactions in foreign-denominated securities. Gains and losses from these transactions may arise from changes in the value of the foreign currency or if the counterparties do not perform under the contracts' terms.
Foreign-denominated assets, including investment securities, and liabilities are translated into U.S. dollars at the exchange rates at period end. Purchases and sales of investment securities, income and dividends received, and expenses denominated in foreign currencies are translated into U.S. dollars at the exchange rate in effect on the transaction date.
The effects of exchange rate fluctuations on investments are included with the net realized and unrealized gain (loss) on investment securities. Other foreign currency transactions resulting in realized and unrealized gain (loss) are disclosed separately.
Investment Transactions and Income. For financial reporting purposes, the Fund's investment holdings and NAV include trades executed through the end of the last business day of the period. The NAV per share for processing shareholder transactions is calculated as of the close of business of the New York Stock Exchange (NYSE), normally 4:00 p.m. Eastern time and includes trades executed through the end of the prior business day. Gains and losses on securities sold are determined on the basis of identified cost and include proceeds received from litigation. Dividend income is recorded on the ex-dividend date, except for certain dividends from foreign securities where the ex-dividend date may have passed, which are recorded as soon as the Fund is informed of the ex-dividend date. Non-cash dividends included in dividend income, if any, are recorded at the fair market value of the securities received. Income and capital gain distributions from Fidelity Central Funds, if any, are recorded on the ex-dividend date. Certain distributions received by the Fund represent a return of capital or capital gain. The Fund determines the components of these distributions subsequent to the ex-dividend date, based upon receipt of tax filings or other correspondence relating to the underlying investment. These distributions are recorded as a reduction of cost of investments and/or as a realized gain. Interest income is accrued as earned and includes coupon interest and amortization of premium and accretion of discount on debt securities as applicable. Investment income is recorded net of foreign taxes withheld where recovery of such taxes is uncertain.
Class Allocations and Expenses. Investment income, realized and unrealized capital gains and losses, common expenses of the Fund, and certain fund-level expense reductions, if any, are allocated daily on a pro-rata basis to each class based on the relative net assets of each class to the total net assets of the Fund. Each class differs with respect to transfer agent and distribution and service plan fees incurred. Certain expense reductions may also differ by class. For the reporting period, the allocated portion of income and expenses to each class as a percent of its average net assets may vary due to the timing of recording these transactions in relation to fluctuating net assets of the classes. Expenses directly attributable to a fund are charged to that fund. Expenses attributable to more than one fund are allocated among the respective funds on the basis of relative net assets or other appropriate methods. Expense estimates are accrued in the period to which they relate and adjustments are made when actual amounts are known.
Income Tax Information and Distributions to Shareholders. Each year, the Fund intends to qualify as a regulated investment company under Subchapter M of the Internal Revenue Code, including distributing substantially all of its taxable income and realized gains. As a result, no provision for U.S. Federal income taxes is required. As of October 31, 2020, the Fund did not have any unrecognized tax benefits in the financial statements; nor is the Fund aware of any tax positions for which it is reasonably possible that the total amounts of unrecognized tax benefits will significantly change in the next twelve months. The Fund files a U.S. federal tax return, in addition to state and local tax returns as required. The Fund's federal income tax returns are subject to examination by the Internal Revenue Service (IRS) for a period of three fiscal years after they are filed. State and local tax returns may be subject to examination for an additional fiscal year depending on the jurisdiction. Foreign taxes are provided for based on the Fund's understanding of the tax rules and rates that exist in the foreign markets in which it invests. The Fund is subject to a tax imposed on capital gains by certain countries in which it invests. An estimated deferred tax liability for net unrealized appreciation on the applicable securities is included in Other payables and accrued expenses on the Statement of Assets & Liabilities.
Distributions are declared and recorded on the ex-dividend date. Income and capital gain distributions are declared separately for each class. Income and capital gain distributions are determined in accordance with income tax regulations, which may differ from GAAP. In addition, the Fund claimed a portion of the payment made to redeeming shareholders as a distribution for income tax purposes.
Capital accounts within the financial statements are adjusted for permanent book-tax differences. These adjustments have no impact on net assets or the results of operations. Capital accounts are not adjusted for temporary book-tax differences which will reverse in a subsequent period.
Book-tax differences are primarily due to futures contracts, foreign currency transactions, certain foreign taxes, passive foreign investment companies (PFIC), market discount, capital loss carryforwards and losses deferred due to wash sales.
As of period end, the cost and unrealized appreciation (depreciation) in securities, and derivatives if applicable, for federal income tax purposes were as follows:
| Gross unrealized appreciation | $54,559,567 |
| Gross unrealized depreciation | (37,837,927) |
| Net unrealized appreciation (depreciation) | $16,721,640 |
| Tax Cost | $237,809,297 |
The tax-based components of distributable earnings as of period end were as follows:
| Undistributed ordinary income | $1,460,353 |
| Capital loss carryforward | $(20,729,586) |
| Net unrealized appreciation (depreciation) on securities and other investments | $16,704,409 |
Capital loss carryforwards are only available to offset future capital gains of the Fund to the extent provided by regulations and may be limited. The capital loss carryforward information presented below, including any applicable limitation, is estimated as of fiscal period end and is subject to adjustment.
| No expiration | |
| Short-term | $(17,817,856) |
| Long-term | (2,911,731) |
| Total capital loss carryforward | $(20,729,586) |
The tax character of distributions paid was as follows:
| | October 31, 2020 | October 31, 2019 |
| Ordinary Income | $3,213,839 | $ 4,896,604 |
Restricted Securities (including Private Placements). The Fund may invest in securities that are subject to legal or contractual restrictions on resale. These securities generally may be resold in transactions exempt from registration or to the public if the securities are registered. Disposal of these securities may involve time-consuming negotiations and expense, and prompt sale at an acceptable price may be difficult. Information regarding restricted securities is included at the end of the Fund's Schedule of Investments.
4. Derivative Instruments.
Risk Exposures and the Use of Derivative Instruments. The Fund's investment objective allows the Fund to enter into various types of derivative contracts, including futures contracts. Derivatives are investments whose value is primarily derived from underlying assets, indices or reference rates and may be transacted on an exchange or over-the-counter (OTC). Derivatives may involve a future commitment to buy or sell a specified asset based on specified terms, to exchange future cash flows at periodic intervals based on a notional principal amount, or for one party to make one or more payments upon the occurrence of specified events in exchange for periodic payments from the other party.
The Fund used derivatives to increase returns and to manage exposure to certain risks as defined below. The success of any strategy involving derivatives depends on analysis of numerous economic factors, and if the strategies for investment do not work as intended, the Fund may not achieve its objectives.
The Fund's use of derivatives increased or decreased its exposure to the following risk:
| Equity Risk | Equity risk relates to the fluctuations in the value of financial instruments as a result of changes in market prices (other than those arising from interest rate risk or foreign exchange risk), whether caused by factors specific to an individual investment, its issuer, or all factors affecting all instruments traded in a market or market segment.
|
The Fund is also exposed to additional risks from investing in derivatives, such as liquidity risk and counterparty credit risk. Liquidity risk is the risk that the Fund will be unable to close out the derivative in the open market in a timely manner. Counterparty credit risk is the risk that the counterparty will not be able to fulfill its obligation to the Fund. Counterparty credit risk related to exchange-traded futures contracts may be mitigated by the protection provided by the exchange on which they trade.
Investing in derivatives may involve greater risks than investing in the underlying assets directly and, to varying degrees, may involve risk of loss in excess of any initial investment and collateral received and amounts recognized in the Statement of Assets and Liabilities. In addition, there may be the risk that the change in value of the derivative contract does not correspond to the change in value of the underlying instrument.
Futures Contracts. A futures contract is an agreement between two parties to buy or sell a specified underlying instrument for a fixed price at a specified future date. The Fund used futures contracts to manage its exposure to the stock market.
Upon entering into a futures contract, a fund is required to deposit either cash or securities (initial margin) with a clearing broker in an amount equal to a certain percentage of the face value of the contract. Futures contracts are marked-to-market daily and subsequent daily payments (variation margin) are made or received by a fund depending on the daily fluctuations in the value of the futures contracts and are recorded as unrealized appreciation or (depreciation). This receivable and/or payable, if any, is included in daily variation margin on futures contracts in the Statement of Assets and Liabilities. Realized gain or (loss) is recorded upon the expiration or closing of a futures contract. The net realized gain (loss) and change in net unrealized appreciation (depreciation) on futures contracts during the period is presented in the Statement of Operations.
Any open futures contracts at period end are presented in the Schedule of Investments under the caption "Futures Contracts". The notional amount at value reflects each contract's exposure to the underlying instrument or index at period end. Securities deposited to meet initial margin requirements are identified in the Schedule of Investments.
5. Purchases and Sales of Investments.
Purchases and sales of securities, other than short-term securities and U.S. government securities, are noted in the table below.
| | Purchases ($) | Sales ($) |
| Fidelity Emerging Markets Discovery Fund | 108,865,695 | 163,321,593 |
6. Fees and Other Transactions with Affiliates.
Management Fee. Fidelity Management & Research Company LLC (the investment adviser) and its affiliates provide the Fund with investment management related services for which the Fund pays a monthly management fee. The management fee is the sum of an individual fund fee rate that is based on an annual rate of .60% of the Fund's average net assets and an annualized group fee rate that averaged .23% during the period. The group fee rate is based upon the monthly average net assets of a group of registered investment companies with which the investment adviser has management contracts. The group fee rate decreases as assets under management increase and increases as assets under management decrease. For the reporting period, the total annual management fee rate was .83% of the Fund's average net assets.
Distribution and Service Plan Fees. In accordance with Rule 12b-1 of the 1940 Act, the Fund has adopted separate Distribution and Service Plans for each class of shares. Certain classes pay Fidelity Distributors Company LLC (FDC), an affiliate of the investment adviser, separate Distribution and Service Fees, each of which is based on an annual percentage of each class' average net assets. In addition, FDC may pay financial intermediaries for selling shares of the Fund and providing shareholder support services. For the period, the Distribution and Service Fee rates, total fees and amounts retained by FDC were as follows:
| | Distribution Fee | Service Fee | Total Fees | Retained by FDC |
| Class A | -% | .25% | $31,782 | $314 |
| Class M | .25% | .25% | 24,970 | 56 |
| Class C | .75% | .25% | 58,968 | 3,753 |
| | | | $115,720 | $4,123 |
Sales Load. FDC may receive a front-end sales charge of up to 5.75% for selling Class A shares and 3.50% for selling Class M shares, some of which is paid to financial intermediaries for selling shares of the Fund. Depending on the holding period, FDC may receive contingent deferred sales charges levied on Class A, Class M and Class C redemptions. The deferred sales charges are 1.00% for Class C shares, 1.00% for certain purchases of Class A shares and .25% for certain purchases of Class M shares.
For the period, sales charge amounts retained by FDC were as follows:
| | Retained by FDC |
| Class A | $4,593 |
| Class M | 632 |
| Class C(a) | 1,421 |
| | $6,646 |
(a) When Class C shares are initially sold, FDC pays commissions from its own resources to financial intermediaries through which the sales are made.
Transfer Agent Fees. Fidelity Investments Institutional Operations Company LLC (FIIOC), an affiliate of the investment adviser, is the transfer, dividend disbursing and shareholder servicing agent for each class of the Fund. FIIOC receives account fees and asset-based fees that vary according to the account size and type of account of the shareholders of the respective classes of the Fund, except for Class Z. FIIOC receives an asset-based fee of Class Z's average net assets. FIIOC pays for typesetting, printing and mailing of shareholder reports, except proxy statements. Effective February 1, 2020, the Board approved to change the fee for Class Z from .046% to .044%.
For the period, transfer agent fees for each class were as follows:
| | Amount | % of Class-Level Average Net Assets |
| Class A | $30,522 | .24 |
| Class M | 14,141 | .28 |
| Class C | 15,840 | .27 |
| Emerging Markets Discovery | 361,376 | .19 |
| Class I | 71,625 | .19 |
| Class Z | 6,028 | .04 |
| | $499,532 | |
Accounting Fees. Fidelity Service Company, Inc. (FSC), an affiliate of the investment adviser, maintains the Fund's accounting records. The accounting fee is based on the level of average net assets for each month. For the period, the fees were equivalent to the following annual rates:
| | % of Average Net Assets |
| Fidelity Emerging Markets Discovery Fund | .05 |
Brokerage Commissions. A portion of portfolio transactions were placed with brokerage firms which are affiliates of the investment adviser. Brokerage commissions are included in net realized gain (loss) and change in net unrealized appreciation (depreciation) in the Statement of Operations. The commissions paid to these affiliated firms were as follows:
| | Amount |
| Fidelity Emerging Markets Discovery Fund | $1,149 |
Interfund Trades. Funds may purchase from or sell securities to other Fidelity Funds under procedures adopted by the Board. The procedures have been designed to ensure these interfund trades are executed in accordance with Rule 17a-7 of the 1940 Act. Interfund trades are included within the respective purchases and sales amounts shown in the Purchases and Sales of Investments note.
7. Committed Line of Credit.
Certain Funds participate with other funds managed by the investment adviser or an affiliate in a $4.25 billion credit facility (the "line of credit") to be utilized for temporary or emergency purposes to fund shareholder redemptions or for other short-term liquidity purposes. The participating funds have agreed to pay commitment fees on their pro-rata portion of the line of credit, which are reflected in Miscellaneous expenses on the Statement of Operations, and are as follows:
| | Amount |
| Fidelity Emerging Markets Discovery Fund | $642 |
During the period, there were no borrowings on this line of credit.
8. Security Lending.
Funds lend portfolio securities from time to time in order to earn additional income. Lending agents are used, including National Financial Services (NFS), an affiliate of the investment adviser. Pursuant to a securities lending agreement, NFS will receive a fee, which is capped at 9.9% of a fund's daily lending revenue, for its services as lending agent. A fund may lend securities to certain qualified borrowers, including NFS. On the settlement date of the loan, a fund receives collateral (in the form of U.S. Treasury obligations, letters of credit and/or cash) against the loaned securities and maintains collateral in an amount not less than 100% of the market value of the loaned securities during the period of the loan. The market value of the loaned securities is determined at the close of business of a fund and any additional required collateral is delivered to a fund on the next business day. A fund or borrower may terminate the loan at any time, and if the borrower defaults on its obligation to return the securities loaned because of insolvency or other reasons, a fund may apply collateral received from the borrower against the obligation. A fund may experience delays and costs in recovering the securities loaned. Any cash collateral received is invested in the Fidelity Securities Lending Cash Central Fund. Any loaned securities are identified as such in the Schedule of Investments, and the value of loaned securities and cash collateral at period end, as applicable, are presented in the Statement of Assets and Liabilities. Security lending income represents the income earned on investing cash collateral, less rebates paid to borrowers and any lending agent fees associated with the loan, plus any premium payments received for lending certain types of securities. Security lending income is presented in the Statement of Operations as a component of income from Fidelity Central Funds. Affiliated security lending activity, if any, was as follows:
| | Total Security Lending Income Fees Paid to NFS | Security Lending Income From Securities Loaned to NFS | Value of Securities Loaned to NFS at Period End |
| Fidelity Emerging Markets Discovery Fund | $2,422 | $– | $– |
9. Expense Reductions.
Commissions paid to certain brokers with whom the investment adviser, or its affiliates, places trades on behalf of the Fund include an amount in addition to trade execution, which may be rebated back to the Fund to offset certain expenses. This amount totaled $68,786 for the period.
In addition, during the period the investment adviser or an affiliate reimbursed and/or waived a portion of fund-level operating expenses in the amount of $1,243.
In addition, during the period the investment adviser or an affiliate reimbursed the Fund $9,995 for an operational error which is included in the accompanying Statement of Operations.
10. Distributions to Shareholders.
Distributions to shareholders of each class were as follows:
| | Year ended
October 31, 2020 | Year ended
October 31, 2019 |
| Distributions to shareholders | | |
| Class A | $109,418 | $223,445 |
| Class M | 28,760 | 47,798 |
| Class C | – | 53,825 |
| Emerging Markets Discovery | 2,286,445 | 3,515,165 |
| Class I | 568,373 | 985,108 |
| Class Z | 220,843 | 71,263 |
| Total | $3,213,839 | $4,896,604 |
11. Share Transactions.
Share transactions for each class were as follows and may contain automatic conversions between classes or exchanges between affiliated funds:
| | Shares | Shares | Dollars | Dollars |
| | Year ended October 31, 2020 | Year ended October 31, 2019 | Year ended October 31, 2020 | Year ended October 31, 2019 |
| Class A | | | | |
| Shares sold | 100,861 | 168,686 | $1,333,872 | $2,185,595 |
| Reinvestment of distributions | 7,832 | 18,309 | 109,418 | 222,825 |
| Shares redeemed | (387,536) | (269,605) | (5,092,423) | (3,507,713) |
| Net increase (decrease) | (278,843) | (82,610) | $(3,649,133) | $(1,099,293) |
| Class M | | | | |
| Shares sold | 30,127 | 70,918 | $401,793 | $922,527 |
| Reinvestment of distributions | 2,060 | 3,931 | 28,760 | 47,798 |
| Shares redeemed | (128,357) | (101,078) | (1,670,594) | (1,330,432) |
| Net increase (decrease) | (96,170) | (26,229) | $(1,240,041) | $(360,107) |
| Class C | | | | |
| Shares sold | 44,610 | 76,141 | $595,319 | $953,265 |
| Reinvestment of distributions | – | 4,495 | – | 53,580 |
| Shares redeemed | (238,890) | (478,619) | (3,020,268) | (6,094,438) |
| Net increase (decrease) | (194,280) | (397,983) | $(2,424,949) | $(5,087,593) |
| Emerging Markets Discovery | | | | |
| Shares sold | 4,566,310 | 6,459,351 | $58,369,087 | $84,534,133 |
| Reinvestment of distributions | 147,141 | 267,714 | 2,064,387 | 3,268,785 |
| Shares redeemed | (6,355,720) | (7,145,375) | (80,633,963) | (92,623,842) |
| Net increase (decrease) | (1,642,269) | (418,310) | $(20,200,489) | $(4,820,924) |
| Class I | | | | |
| Shares sold | 723,524 | 1,400,912 | $9,806,827 | $18,473,846 |
| Reinvestment of distributions | 40,170 | 79,303 | 564,792 | 971,460 |
| Shares redeemed | (2,475,011) | (2,517,006) | (28,386,429) | (32,749,170) |
| Net increase (decrease) | (1,711,317) | (1,036,791) | $(18,014,810) | $(13,303,864) |
| Class Z | | | | |
| Shares sold | 212,001 | 1,476,128 | $2,854,966 | $19,208,206 |
| Reinvestment of distributions | 15,246 | 5,593 | 213,748 | 68,346 |
| Shares redeemed | (730,527) | (271,402) | (9,382,312) | (3,627,838) |
| Net increase (decrease) | (503,280) | 1,210,319 | $(6,313,598) | $15,648,714 |
12. Other.
The Fund's organizational documents provide former and current trustees and officers with a limited indemnification against liabilities arising in connection with the performance of their duties to the Fund. In the normal course of business, the Fund may also enter into contracts that provide general indemnifications. The Fund's maximum exposure under these arrangements is unknown as this would be dependent on future claims that may be made against the Fund. The risk of material loss from such claims is considered remote.
Mutual funds managed by the investment adviser or its affiliates were the owners of record, in the aggregate, of approximately 22% of the total outstanding shares of the Fund.
13. Coronavirus (COVID-19) Pandemic.
An outbreak of COVID-19 first detected in China during December 2019 has since spread globally and was declared a pandemic by the World Health Organization during March 2020. Developments that disrupt global economies and financial markets, such as the COVID-19 pandemic, may magnify factors that affect the Fund's performance.
Fidelity® Total Emerging Markets Fund
Performance: The Bottom Line
Average annual total return reflects the change in the value of an investment, assuming reinvestment of distributions from dividend income and capital gains (the profits earned upon the sale of securities that have grown in value, if any) and assuming a constant rate of performance each year. The hypothetical investment and the average annual total returns do not reflect the deduction of taxes that a shareholder would pay on fund distributions or the redemption of fund shares. During periods of reimbursement by Fidelity, a fund’s total return will be greater than it would be had the reimbursement not occurred. How a fund did yesterday is no guarantee of how it will do tomorrow.
Average Annual Total Returns
| For the periods ended October 31, 2020 | Past 1 year | Past 5 years | Life of fundA |
| Class A (incl. 5.75% sales charge) | 2.30% | 6.57% | 4.56% |
| Class M (incl. 3.50% sales charge) | 4.37% | 6.74% | 4.54% |
| Class C (incl. contingent deferred sales charge) | 6.83% | 7.07% | 4.47% |
| Fidelity® Total Emerging Markets Fund | 8.79% | 8.12% | 5.52% |
| Class I | 8.85% | 8.16% | 5.53% |
| Class Z | 9.03% | 8.21% | 5.56% |
A From November 1, 2011
Class C shares' contingent deferred sales charges included in the past one year, past five years, and life of fund total return figures are 1%, 0%, and 0%, respectively.
The initial offering of Class Z shares took place on October 2, 2018. Returns prior to October 2, 2018, are those of Class I.
$10,000 Over Life of Fund
Let's say hypothetically that $10,000 was invested in Fidelity® Total Emerging Markets Fund, a class of the fund, on November 1, 2011, when the fund started.
The chart shows how the value of your investment would have changed, and also shows how the MSCI Emerging Markets Index performed over the same period.
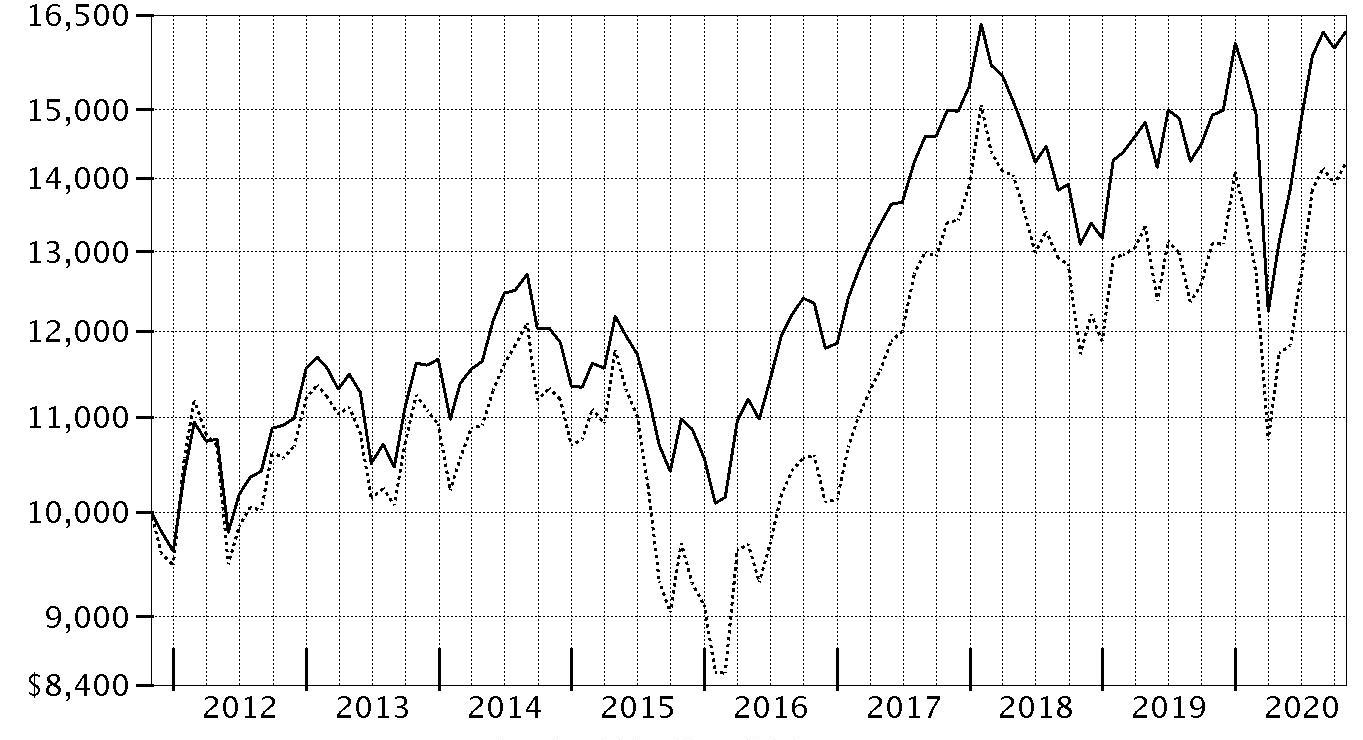
| Period Ending Values |
| $16,220 | Fidelity® Total Emerging Markets Fund |
| $14,199 | MSCI Emerging Markets Index |
Fidelity® Total Emerging Markets Fund
Management's Discussion of Fund Performance
Market Recap: For the 12 months ending October 31, 2020, the Fidelity Total Emerging Markets Composite IndexSM – consisting of 60% equities and 40% debt – gained 5.98%. Separately, emerging-markets (EM) equities advanced 8.27%, as measured by the MSCI Emerging Markets Index, and EM debt rose 1.97%, according to the J.P. Morgan Emerging Markets Bond Index Global. Both asset classes overcame coronavirus-related headwinds and currency fluctuation, which generally dampened returns for EM securities the past 12 months. After the Composite index rose 17.09% in 2019, the early-2020 outbreak and spread of the coronavirus and the respiratory disease it causes, COVID-19, hampered global economic growth and weighed heavily on both categories. By mid-March, EM stocks and debt reflected the impact of a diminished outlook for corporate earnings, a steep drop in global trade, widening budget deficits, lower commodity prices and reduced tourism. However, the index rebounded in April amid improved coronavirus trends, plans for reopening some economies, progress on potential treatments, and rapid and expansive global monetary/fiscal-policy responses. The abundant provision of liquidity from central banks and sustained progress on economic reopening underpinned a continued rally in riskier asset prices for much of the rest of the period. By October 31, most major economies were in early-cycle recovery, with China somewhat ahead of the rest of the world, due largely to its faster reopening.
Comments from Co-Managers Timothy Gill, James Hayes and Jane Wu: For the fiscal year ending October 31, 2020, the fund's share classes (excluding sales charges, if applicable) gained about 8% to 9%, outpacing the Fidelity Total Emerging Markets Composite Index℠. Versus the Composite index, the fund benefited from security selection in the EM equity subportfolio, as well as asset allocation, including an overweighting in EM equities and an underweighting in EM debt. Among equities, choices in communications services and consumer discretionary boosted our relative result. An overweighting in the latter sector was another positive. Conversely, stock picking in financials and industrials hurt. Geographically, choices in China and Taiwan helped most, whereas picks in India and positioning in Taiwan and Brazil detracted. The fund’s largest individual stock contributors were an out-of-index position in MercadoLibre and an overweighting in Tencent Holdings. In contrast, overweightings in Banco do Brasil and Axis Bank hurt most. Security selection within the EM debt subportfolio modestly detracted, due largely to overweightings in Lebanon and El Salvador, both of which underperformed. Lastly, a cash position of about 6%, on average, was helpful.
The views expressed above reflect those of the portfolio manager(s) only through the end of the period as stated on the cover of this report and do not necessarily represent the views of Fidelity or any other person in the Fidelity organization. Any such views are subject to change at any time based upon market or other conditions and Fidelity disclaims any responsibility to update such views. These views may not be relied on as investment advice and, because investment decisions for a Fidelity fund are based on numerous factors, may not be relied on as an indication of trading intent on behalf of any Fidelity fund.
Notes to shareholders: On January 1, 2020, John Carlson retired from the firm, leaving Timothy Gill and Jonathan Kelly as co-managers of the fund's emerging-markets debt sleeve. On June 8, 2020, Di Chen assumed co-management responsibilities for the fund's consumer discretionary sleeve, joining Sam Polyak. On September 18, 2020, Nader Nazmi assumed co-management responsibilities for the fund and the fund's emerging-markets debt sleeve, succeeding Jonathan Kelly. On October 1, 2020, Will Pruett, Guillermo de Las Casas and Greg Lee assumed co-management responsibilities for the fund's financials, real estate and utilities sleeves, respectively, until December 31, at which point James Hayes will come off the sleeves.
Fidelity® Total Emerging Markets Fund
Investment Summary (Unaudited)
Top Five Stocks as of October 31, 2020
| | % of fund's net assets |
| Alibaba Group Holding Ltd. sponsored ADR (Cayman Islands, Internet & Direct Marketing Retail) | 7.0 |
| Tencent Holdings Ltd. (Cayman Islands, Interactive Media & Services) | 6.3 |
| Taiwan Semiconductor Manufacturing Co. Ltd. (Taiwan, Semiconductors & Semiconductor Equipment) | 4.6 |
| Samsung Electronics Co. Ltd. (Korea (South), Technology Hardware, Storage & Peripherals) | 3.5 |
| JD.com, Inc. sponsored ADR (Cayman Islands, Internet & Direct Marketing Retail) | 1.3 |
| | 22.7 |
Top Five Market Sectors as of October 31, 2020
| | % of fund's net assets |
| Consumer Discretionary | 16.5 |
| Financials | 14.1 |
| Information Technology | 13.5 |
| Communication Services | 10.5 |
| Energy | 9.1 |
Top Five Countries as of October 31, 2020
| (excluding cash equivalents) | % of fund's net assets |
| Cayman Islands | 22.9 |
| Korea (South) | 9.2 |
| China | 8.1 |
| India | 7.5 |
| Taiwan | 5.6 |
Percentages are adjusted for the effect of futures contracts, if applicable.
Asset Allocation (% of fund's net assets)
| As of October 31, 2020 |
| | Stocks and Equity Futures | 73.8% |
| | Bonds | 23.0% |
| | Other Investments | 0.1% |
| | Short-Term Investments and Net Other Assets (Liabilities) | 3.1% |

Fidelity® Total Emerging Markets Fund
Schedule of Investments October 31, 2020
Showing Percentage of Net Assets
| Common Stocks - 71.0% | | | |
| | | Shares | Value |
| Belgium - 0.2% | | | |
| Titan Cement International Trading SA | | 106,700 | $1,324,699 |
| Bermuda - 0.7% | | | |
| AGTech Holdings Ltd. (a) | | 836,000 | 29,655 |
| China Gas Holdings Ltd. | | 241,144 | 738,751 |
| Credicorp Ltd. (United States) | | 13,185 | 1,512,056 |
| GP Investments Ltd. Class A (depositary receipt) (a) | | 22,922 | 14,781 |
| Haier Electronics Group Co. Ltd. | | 156,000 | 591,603 |
| Kunlun Energy Co. Ltd. | | 862,040 | 555,975 |
| Marvell Technology Group Ltd. | | 10,400 | 390,104 |
| Shangri-La Asia Ltd. | | 388,000 | 304,795 |
|
| TOTAL BERMUDA | | | 4,137,720 |
|
| Brazil - 2.7% | | | |
| Atacadao SA | | 534,800 | 1,719,614 |
| B2W Companhia Global do Varejo (a) | | 90,600 | 1,188,010 |
| Banco do Brasil SA | | 506,884 | 2,632,498 |
| BM&F BOVESPA SA | | 82,100 | 730,436 |
| BTG Pactual Participations Ltd. unit | | 51,500 | 650,711 |
| Centrais Eletricas Brasileiras SA (Electrobras) | | 75,150 | 406,793 |
| Companhia de Saneamento Basico do Estado de Sao Paulo (SABESP) | | 11,240 | 83,253 |
| Companhia de Saneamento de Minas Gerais | | 21,746 | 162,206 |
| Equatorial Energia SA | | 149,100 | 517,879 |
| LOG Commercial Properties e Participacoes SA | | 36,600 | 199,969 |
| MRV Engenharia e Participacoes SA | | 122,800 | 360,613 |
| Natura & Co. Holding SA | | 264,718 | 2,126,805 |
| Petrobras Distribuidora SA | | 84,200 | 281,452 |
| Rumo SA (a) | | 382,500 | 1,222,571 |
| Suzano Papel e Celulose SA (a) | | 209,800 | 1,830,007 |
| Terna Participacoes SA unit | | 3,300 | 16,190 |
| Vale SA sponsored ADR (b) | | 116,868 | 1,235,295 |
|
| TOTAL BRAZIL | | | 15,364,302 |
|
| British Virgin Islands - 0.1% | | | |
| Mail.Ru Group Ltd. GDR (Reg. S) (a) | | 16,100 | 422,625 |
| Cayman Islands - 22.5% | | | |
| 51job, Inc. sponsored ADR (a) | | 9,100 | 637,910 |
| Agora, Inc. ADR (a) | | 1,000 | 38,500 |
| Akeso, Inc. (c) | | 188,000 | 589,281 |
| Alibaba Group Holding Ltd. sponsored ADR (a) | | 129,349 | 39,411,333 |
| Ant International Co. Ltd. Class C (a)(d)(e) | | 288,435 | 2,344,976 |
| Archosaur Games, Inc. (a)(c) | | 40,000 | 94,215 |
| Bilibili, Inc. ADR (a) | | 85,900 | 3,837,153 |
| Chailease Holding Co. Ltd. | | 230,989 | 1,118,249 |
| China Resources Land Ltd. | | 298,510 | 1,214,833 |
| China State Construction International Holdings Ltd. | | 952,000 | 658,203 |
| Haitian International Holdings Ltd. | | 307,000 | 760,322 |
| Hansoh Pharmaceutical Group Co. Ltd. (a)(c) | | 321,700 | 1,433,697 |
| Hua Medicine (a)(c) | | 373,037 | 203,540 |
| Innovent Biologics, Inc. (a)(c) | | 101,422 | 748,318 |
| iQIYI, Inc. ADR (a) | | 13,100 | 323,570 |
| JD.com, Inc. sponsored ADR (a) | | 88,100 | 7,181,912 |
| Kangji Medical Holdings Ltd. | | 190,500 | 492,560 |
| KE Holdings, Inc. ADR (a) | | 11,200 | 781,200 |
| Kingdee International Software Group Co. Ltd. | | 235,000 | 616,866 |
| LexinFintech Holdings Ltd. ADR (a) | | 12,700 | 104,648 |
| Li Ning Co. Ltd. | | 815,000 | 4,205,095 |
| Longfor Properties Co. Ltd. (c) | | 54,000 | 294,989 |
| Meituan Class B (a) | | 140,600 | 5,226,820 |
| Ming Yuan Cloud Group Holdings Ltd. | | 11,200 | 47,819 |
| NetEase, Inc. ADR | | 10,000 | 867,900 |
| New Oriental Education & Technology Group, Inc. sponsored ADR (a) | | 25,636 | 4,111,502 |
| PagSeguro Digital Ltd. (a) | | 37,168 | 1,360,720 |
| Phoenix Tree Holdings Ltd. ADR | | 8,600 | 16,082 |
| Pinduoduo, Inc. ADR (a) | | 28,900 | 2,600,422 |
| Semiconductor Manufacturing International Corp. (a) | | 242,000 | 713,932 |
| Shenzhou International Group Holdings Ltd. | | 146,500 | 2,530,326 |
| Shimao Property Holdings Ltd. | | 166,800 | 588,453 |
| Shimao Services Holdings Ltd. (a)(c) | | 2,635 | 5,642 |
| StoneCo Ltd. Class A (a) | | 12,600 | 662,004 |
| Sunny Optical Technology Group Co. Ltd. | | 71,300 | 1,179,060 |
| TAL Education Group ADR (a) | | 8,769 | 582,788 |
| Tencent Holdings Ltd. | | 465,850 | 35,593,574 |
| Uni-President China Holdings Ltd. | | 1,307,600 | 1,130,077 |
| Wise Talent Information Technology Co. Ltd. (a) | | 124,468 | 305,691 |
| Wuxi Biologics (Cayman), Inc. (a)(c) | | 25,500 | 712,454 |
| YY, Inc. ADR | | 11,000 | 1,005,180 |
| Zai Lab Ltd. (a) | | 14,364 | 1,195,070 |
|
| TOTAL CAYMAN ISLANDS | | | 127,526,886 |
|
| Chile - 0.3% | | | |
| Sociedad Quimica y Minera de Chile SA (PN-B) sponsored ADR | | 25,500 | 943,755 |
| Vina Concha y Toro SA | | 567,835 | 906,127 |
|
| TOTAL CHILE | | | 1,849,882 |
|
| China - 8.1% | | | |
| Bafang Electric Suzhou Co. Ltd. (A Shares) | | 30,045 | 828,393 |
| BBMG Corp. (H Shares) | | 2,230,000 | 419,968 |
| BYD Co. Ltd. (A Shares) | | 73,200 | 1,748,466 |
| China Communications Construction Co. Ltd. (H Shares) | | 785,000 | 410,094 |
| China Communications Services Corp. Ltd. (H Shares) | | 1,178,000 | 683,779 |
| China Life Insurance Co. Ltd. (H Shares) | | 1,537,934 | 3,355,657 |
| China Longyuan Power Grid Corp. Ltd. (H Shares) | | 2,338,060 | 1,598,416 |
| China Merchants Bank Co. Ltd. (H Shares) | | 352,000 | 1,829,810 |
| China Petroleum & Chemical Corp. (H Shares) | | 3,184,000 | 1,243,260 |
| China Tower Corp. Ltd. (H Shares) (c) | | 2,164,000 | 337,754 |
| Chongqing Changan Automobile Co. Ltd. (A Shares) (a) | | 578,800 | 1,433,935 |
| CRRC Corp. Ltd. (H Shares) | | 1,800,000 | 696,550 |
| Glodon Co. Ltd. (A Shares) | | 40,697 | 433,778 |
| Great Wall Motor Co. Ltd. (H Shares) | | 1,347,000 | 2,178,830 |
| Guangzhou Automobile Group Co. Ltd. (H Shares) | | 1,480,000 | 1,517,704 |
| Haier Smart Home Co. Ltd. (A Shares) | | 305,060 | 1,136,380 |
| Hangzhou Tigermed Consulting Co. Ltd. (H Shares) (a)(c) | | 78,500 | 1,260,658 |
| Industrial & Commercial Bank of China Ltd. (H Shares) | | 5,097,660 | 2,894,780 |
| Jiangsu Hengrui Medicine Co. Ltd. (A Shares) | | 31,804 | 423,484 |
| Midea Group Co. Ltd. (A Shares) | | 111,700 | 1,305,022 |
| NARI Technology Co. Ltd. (A Shares) | | 101,209 | 314,869 |
| Pharmaron Beijing Co. Ltd. (H Shares) (c) | | 98,552 | 1,422,505 |
| PICC Property & Casualty Co. Ltd. (H Shares) | | 1,766,270 | 1,193,841 |
| Ping An Bank Co. Ltd. (A Shares) | | 406,468 | 1,079,873 |
| Ping An Insurance Group Co. of China Ltd. (H Shares) | | 682,000 | 7,051,657 |
| Shenzhen Mindray Bio-Medical Electronics Co. Ltd. (A Shares) | | 36,244 | 2,100,371 |
| Shenzhen New Industries Biomedical Engineering Co. Ltd. | | 20,900 | 534,306 |
| Sinopec Engineering Group Co. Ltd. (H Shares) | | 509,000 | 197,625 |
| TravelSky Technology Ltd. (H Shares) | | 228,000 | 478,793 |
| Tsingtao Brewery Co. Ltd. (H Shares) | | 378,000 | 3,122,980 |
| Venus MedTech Hangzhou, Inc. (H Shares) (a)(c) | | 46,433 | 446,511 |
| WuXi AppTec Co. Ltd. (H Shares) (c) | | 95,411 | 1,519,930 |
| Zhuzhou CRRC Times Electric Co. Ltd. (H Shares) | | 225,900 | 693,508 |
|
| TOTAL CHINA | | | 45,893,487 |
|
| Egypt - 0.0% | | | |
| Six of October Development & Investment Co. | | 309,395 | 236,480 |
| France - 0.1% | | | |
| Ubisoft Entertainment SA (a) | | 7,100 | 626,295 |
| Germany - 0.3% | | | |
| Delivery Hero AG (a)(c) | | 12,100 | 1,392,034 |
| Hong Kong - 1.5% | | | |
| AIA Group Ltd. | | 66,600 | 633,844 |
| China Overseas Land and Investment Ltd. | | 593,540 | 1,485,286 |
| China Resources Beer Holdings Co. Ltd. | | 544,666 | 3,375,840 |
| China Unicom Ltd. | | 1,492,300 | 919,839 |
| CNOOC Ltd. | | 1,520,000 | 1,390,733 |
| Far East Horizon Ltd. | | 949,780 | 932,322 |
|
| TOTAL HONG KONG | | | 8,737,864 |
|
| Hungary - 0.2% | | | |
| OTP Bank PLC (a) | | 28,340 | 882,648 |
| India - 7.5% | | | |
| Adani Ports & Special Economic Zone Ltd. | | 238,366 | 1,149,365 |
| Axis Bank Ltd. (a) | | 698,719 | 4,604,056 |
| Axis Bank Ltd. GDR (Reg. S) (a) | | 4,600 | 149,500 |
| Bharti Infratel Ltd. | | 84,000 | 208,933 |
| DLF Ltd. | | 262,532 | 556,835 |
| Federal Bank Ltd.(a) | | 582,006 | 392,917 |
| HDFC Bank Ltd. | | 22,200 | 352,428 |
| HDFC Bank Ltd. sponsored ADR (a) | | 16,000 | 919,040 |
| Housing Development Finance Corp. Ltd. | | 21,150 | 545,443 |
| ICICI Bank Ltd. (a) | | 69,592 | 363,884 |
| ICICI Bank Ltd. sponsored ADR (a) | | 639,501 | 6,746,736 |
| Indraprastha Gas Ltd. | | 159,793 | 862,502 |
| ITC Ltd. | | 555,413 | 1,233,831 |
| JK Cement Ltd. | | 71,074 | 1,764,730 |
| JM Financial Ltd. (a) | | 501,020 | 533,290 |
| Larsen & Toubro Ltd. | | 110,369 | 1,374,623 |
| LIC Housing Finance Ltd. | | 141,990 | 538,439 |
| Mahanagar Gas Ltd. | | 30,548 | 333,830 |
| Manappuram General Finance & Leasing Ltd. | | 465,340 | 969,136 |
| Maruti Suzuki India Ltd. | | 12,500 | 1,167,079 |
| Mindspace Business Parks (a)(c) | | 26,400 | 108,537 |
| Mindspace Business Parks | | 58,400 | 215,013 |
| NTPC Ltd. | | 437,231 | 513,569 |
| Oberoi Realty Ltd. (a) | | 136,793 | 812,422 |
| Petronet LNG Ltd. | | 162,606 | 503,530 |
| Phoenix Mills Ltd. (a) | | 33,552 | 259,708 |
| Power Grid Corp. of India Ltd. | | 635,545 | 1,457,879 |
| Reliance Industries Ltd. | | 233,413 | 6,432,914 |
| Shree Cement Ltd. | | 5,351 | 1,556,855 |
| Shriram Transport Finance Co. Ltd. | | 207,435 | 1,927,940 |
| State Bank of India (a) | | 775,375 | 1,963,780 |
| Sunteck Realty Ltd. | | 17,400 | 62,480 |
| Tata Consultancy Services Ltd. | | 21,500 | 770,271 |
| Torrent Pharmaceuticals Ltd. | | 32,371 | 1,114,219 |
|
| TOTAL INDIA | | | 42,465,714 |
|
| Indonesia - 0.6% | | | |
| PT Bank Mandiri (Persero) Tbk | | 5,046,000 | 1,965,573 |
| PT Bank Rakyat Indonesia Tbk | | 4,844,900 | 1,096,750 |
| PT United Tractors Tbk | | 230,400 | 329,171 |
|
| TOTAL INDONESIA | | | 3,391,494 |
|
| Japan - 1.0% | | | |
| Capcom Co. Ltd. | | 14,700 | 803,966 |
| Freee KK (a) | | 13,500 | 1,056,360 |
| JTOWER, Inc. | | 4,100 | 287,078 |
| Keyence Corp. | | 1,200 | 544,587 |
| Money Forward, Inc. (a) | | 12,900 | 1,167,057 |
| Murata Manufacturing Co. Ltd. | | 6,900 | 483,888 |
| Rakus Co. Ltd. | | 48,600 | 955,072 |
| Square Enix Holdings Co. Ltd. | | 10,600 | 615,890 |
|
| TOTAL JAPAN | | | 5,913,898 |
|
| Kazakhstan - 0.0% | | | |
| JSC Halyk Bank of Kazakhstan GDR unit | | 21,000 | 209,580 |
| Korea (South) - 8.5% | | | |
| AMOREPACIFIC Group, Inc. | | 22,989 | 887,303 |
| Coway Co. Ltd. | | 15,110 | 923,194 |
| DuzonBizon Co. Ltd. | | 4,610 | 405,553 |
| Hanon Systems | | 57,870 | 572,589 |
| Hyundai Fire & Marine Insurance Co. Ltd. | | 54,284 | 1,115,616 |
| Hyundai Mobis | | 3,506 | 700,934 |
| Hyundai Motor Co. | | 2,620 | 382,664 |
| Kakao Corp. | | 6,260 | 1,821,355 |
| KB Financial Group, Inc. | | 75,828 | 2,706,402 |
| Korea Electric Power Corp. (a) | | 32,987 | 580,594 |
| Korea Electric Power Corp. sponsored ADR (a) | | 3,220 | 27,821 |
| LG Chemical Ltd. | | 1,813 | 986,426 |
| LG Corp. | | 19,002 | 1,135,325 |
| NAVER Corp. | | 2,867 | 731,973 |
| NCSOFT Corp. | | 1,881 | 1,289,570 |
| Netmarble Corp. (a)(c) | | 2,060 | 213,544 |
| POSCO | | 14,322 | 2,638,100 |
| S-Oil Corp. | | 8,950 | 431,273 |
| Samsung Biologics Co. Ltd. (a)(c) | | 2,985 | 1,799,869 |
| Samsung Electronics Co. Ltd. | | 397,928 | 19,958,217 |
| Samsung Fire & Marine Insurance Co. Ltd. | | 8,510 | 1,342,615 |
| Samsung SDI Co. Ltd. | | 6,057 | 2,380,837 |
| Shinhan Financial Group Co. Ltd. | | 52,323 | 1,416,528 |
| SK Hynix, Inc. | | 51,542 | 3,648,515 |
|
| TOTAL KOREA (SOUTH) | | | 48,096,817 |
|
| Luxembourg - 0.1% | | | |
| Adecoagro SA (a) | | 46,500 | 225,060 |
| Globant SA (a) | | 1,300 | 234,793 |
|
| TOTAL LUXEMBOURG | | | 459,853 |
|
| Mexico - 1.5% | | | |
| America Movil S.A.B. de CV Series L sponsored ADR | | 45,900 | 547,128 |
| CEMEX S.A.B. de CV sponsored ADR | | 603,400 | 2,504,110 |
| Corporacion Inmobiliaria Vesta S.A.B. de CV | | 104,000 | 167,094 |
| Fibra Uno Administracion SA de CV | | 363,500 | 275,390 |
| Grupo Aeroportuario del Pacifico S.A.B. de CV Series B | | 85,100 | 708,234 |
| Grupo Aeroportuario Norte S.A.B. de CV (a) | | 67,400 | 304,152 |
| Grupo Financiero Banorte S.A.B. de CV Series O (a) | | 308,729 | 1,375,428 |
| Macquarie Mexican (REIT) (c) | | 724,570 | 832,462 |
| Wal-Mart de Mexico SA de CV Series V | | 816,900 | 1,973,747 |
|
| TOTAL MEXICO | | | 8,687,745 |
|
| Multi-National - 0.1% | | | |
| HKT Trust/HKT Ltd. unit | | 595,000 | 769,029 |
| Netherlands - 1.5% | | | |
| Adyen BV (a)(c) | | 600 | 1,008,446 |
| ASML Holding NV (Netherlands) | | 1,200 | 434,164 |
| NXP Semiconductors NV | | 3,800 | 513,456 |
| X5 Retail Group NV GDR (Reg. S) | | 47,500 | 1,669,150 |
| Yandex NV Series A (a) | | 80,039 | 4,607,845 |
|
| TOTAL NETHERLANDS | | | 8,233,061 |
|
| Nigeria - 0.0% | | | |
| Guaranty Trust Bank PLC GDR (Reg. S) (a) | | 48,740 | 126,724 |
| Pakistan - 0.1% | | | |
| Habib Bank Ltd. | | 406,000 | 329,742 |
| Panama - 0.1% | | | |
| Copa Holdings SA Class A | | 12,249 | 603,631 |
| Peru - 0.3% | | | |
| Compania de Minas Buenaventura SA sponsored ADR | | 115,800 | 1,420,866 |
| Philippines - 0.4% | | | |
| Ayala Land, Inc. | | 1,462,500 | 992,543 |
| Metropolitan Bank & Trust Co. | | 1,494,147 | 1,252,026 |
| Robinsons Land Corp. | | 851,960 | 263,024 |
|
| TOTAL PHILIPPINES | | | 2,507,593 |
|
| Poland - 0.1% | | | |
| Powszechny Zaklad Ubezpieczen SA (a) | | 146,300 | 798,282 |
| Russia - 2.0% | | | |
| LSR Group OJSC | | 6,455 | 73,907 |
| Lukoil PJSC sponsored ADR | | 48,600 | 2,481,516 |
| MMC Norilsk Nickel PJSC sponsored ADR | | 103,100 | 2,457,904 |
| NOVATEK OAO GDR (Reg. S) | | 8,300 | 1,000,150 |
| Sberbank of Russia | | 709,830 | 1,799,034 |
| Sberbank of Russia sponsored ADR | | 299,304 | 3,022,970 |
| Tatneft PAO | | 101,000 | 521,885 |
| Unipro PJSC | | 4,539,700 | 147,716 |
|
| TOTAL RUSSIA | | | 11,505,082 |
|
| Singapore - 0.2% | | | |
| First Resources Ltd. | | 1,383,200 | 1,227,022 |
| South Africa - 1.6% | | | |
| Absa Group Ltd. | | 343,610 | 1,847,072 |
| AngloGold Ashanti Ltd. | | 86,500 | 1,993,432 |
| Bidvest Group Ltd. | | 69,956 | 575,247 |
| Impala Platinum Holdings Ltd. | | 296,000 | 2,634,496 |
| Naspers Ltd. Class N | | 5,200 | 1,015,183 |
| Pick 'n Pay Stores Ltd. | | 334,200 | 1,052,480 |
|
| TOTAL SOUTH AFRICA | | | 9,117,910 |
|
| Spain - 0.1% | | | |
| Amadeus IT Holding SA Class A | | 14,500 | 692,216 |
| Switzerland - 0.1% | | | |
| Dufry AG (a) | | 11,788 | 446,092 |
| Taiwan - 5.6% | | | |
| Formosa Plastics Corp. | | 210,000 | 580,621 |
| Largan Precision Co. Ltd. | | 6,403 | 677,027 |
| MediaTek, Inc. | | 94,000 | 2,227,691 |
| Taiwan Semiconductor Manufacturing Co. Ltd. | | 1,737,000 | 26,275,193 |
| Unified-President Enterprises Corp. | | 1,029,000 | 2,204,820 |
|
| TOTAL TAIWAN | | | 31,965,352 |
|
| Thailand - 0.3% | | | |
| Kasikornbank PCL (For. Reg.) | | 134,500 | 324,065 |
| PTT Global Chemical PCL (For. Reg.) | | 830,300 | 1,063,856 |
|
| TOTAL THAILAND | | | 1,387,921 |
|
| Turkey - 0.3% | | | |
| Aselsan A/S | | 434,000 | 867,534 |
| Turkiye Garanti Bankasi A/S (a) | | 717,989 | 565,514 |
|
| TOTAL TURKEY | | | 1,433,048 |
|
| United Arab Emirates - 0.0% | | | |
| Emaar Properties PJSC (a) | | 192,225 | 139,728 |
| United Kingdom - 0.5% | | | |
| Mondi PLC | | 125,027 | 2,347,310 |
| Network International Holdings PLC (a)(c) | | 113,600 | 327,303 |
|
| TOTAL UNITED KINGDOM | | | 2,674,613 |
|
| United States of America - 1.8% | | | |
| Activision Blizzard, Inc. | | 21,300 | 1,613,049 |
| Arco Platform Ltd. Class A (a) | | 8,000 | 272,640 |
| DouYu International Holdings Ltd. ADR (a) | | 31,600 | 483,480 |
| MercadoLibre, Inc. (a) | | 3,400 | 4,127,770 |
| Micron Technology, Inc. (a) | | 65,300 | 3,287,202 |
| ON Semiconductor Corp. (a) | | 15,500 | 388,895 |
|
| TOTAL UNITED STATES OF AMERICA | | | 10,173,036 |
|
| TOTAL COMMON STOCKS | | | |
| (Cost $303,568,483) | | | 403,170,971 |
|
| Preferred Stocks - 2.4% | | | |
| Convertible Preferred Stocks - 0.0% | | | |
| Hong Kong - 0.0% | | | |
| Antengene Corp. Series C1 (d)(e) | | 52,151 | 147,373 |
| Nonconvertible Preferred Stocks - 2.4% | | | |
| Brazil - 1.7% | | | |
| Ambev SA sponsored ADR | | 469,500 | 1,004,730 |
| Companhia de Saneamento Basico do Estado de Sao Paulo (SABESP) sponsored ADR | | 40,160 | 296,381 |
| Companhia Paranaense de Energia-Copel: | | | |
| (PN-B) | | 1,415 | 15,230 |
| (PN-B) sponsored ADR | | 29,354 | 317,023 |
| Itau Unibanco Holding SA sponsored ADR | | 783,582 | 3,204,850 |
| Metalurgica Gerdau SA (PN) | | 730,470 | 1,247,589 |
| Petroleo Brasileiro SA - Petrobras: | | | |
| (PN) sponsored ADR (non-vtg.) | | 208,606 | 1,378,886 |
| sponsored ADR | | 245,300 | 1,626,339 |
| Telefonica Brasil SA | | 35,663 | 264,398 |
| | | | 9,355,426 |
| Cayman Islands - 0.0% | | | |
| Chailease Holding Co. Ltd. (a) | | 18,242 | 62,169 |
| Korea (South) - 0.7% | | | |
| Hyundai Motor Co. Series 2 | | 23,149 | 1,636,648 |
| Samsung Electronics Co. Ltd. | | 51,038 | 2,265,440 |
| | | | 3,902,088 |
| Russia - 0.0% | | | |
| Tatneft PAO | | 17,300 | 86,518 |
|
| TOTAL NONCONVERTIBLE PREFERRED STOCKS | | | 13,406,201 |
|
| TOTAL PREFERRED STOCKS | | | |
| (Cost $15,446,630) | | | 13,553,574 |
| | | Principal Amount(f) | Value |
|
| Nonconvertible Bonds - 10.0% | | | |
| Azerbaijan - 0.2% | | | |
| Southern Gas Corridor CJSC 6.875% 3/24/26 (c) | | 1,250,000 | 1,423,828 |
| Bahrain - 0.4% | | | |
| The Oil and Gas Holding Co. 7.5% 10/25/27 (c) | | 2,005,000 | 2,111,202 |
| Bermuda - 0.2% | | | |
| GeoPark Ltd. 5.5% 1/17/27 (c) | | 700,000 | 609,656 |
| Tengizchevroil Finance Co. International Ltd. 3.25% 8/15/30 (c) | | 350,000 | 355,359 |
|
| TOTAL BERMUDA | | | 965,015 |
|
| British Virgin Islands - 0.4% | | | |
| 1MDB Global Investments Ltd. 4.4% 3/9/23 | | 2,000,000 | 1,990,000 |
| Sinopec Group Overseas Development Ltd. 2.7% 5/13/30 (c) | | 350,000 | 363,344 |
|
| TOTAL BRITISH VIRGIN ISLANDS | | | 2,353,344 |
|
| Canada - 0.2% | | | |
| First Quantum Minerals Ltd.: | | | |
| 7.25% 4/1/23 (c) | | 200,000 | 201,063 |
| 7.5% 4/1/25 (c) | | 825,000 | 825,206 |
|
| TOTAL CANADA | | | 1,026,269 |
|
| Cayman Islands - 0.4% | | | |
| DP World Crescent Ltd. 3.875% 7/18/29 (Reg. S) | | 700,000 | 728,875 |
| GEMS MENASA Cayman Ltd. 7.125% 7/31/26 (c) | | 690,000 | 683,316 |
| Meituan 2.125% 10/28/25 (c) | | 240,000 | 240,792 |
| Mumtalakat Sukuk Holding Co. 5.625% 2/27/24 (Reg. S) | | 400,000 | 420,125 |
| QNB Finance Ltd. 2.75% 2/12/27 (Reg. S) | | 395,000 | 412,158 |
|
| TOTAL CAYMAN ISLANDS | | | 2,485,266 |
|
| Chile - 0.4% | | | |
| Corporacion Nacional del Cobre de Chile (Codelco): | | | |
| 3.7% 1/30/50 (c) | | 300,000 | 312,656 |
| 3.75% 1/15/31 (c) | | 300,000 | 331,500 |
| 4.25% 7/17/42 (c) | | 500,000 | 558,125 |
| 4.5% 8/1/47 (c) | | 250,000 | 294,297 |
| Empresa de Transporte de Pasajeros Metro SA 3.65% 5/7/30 (c) | | 350,000 | 380,800 |
| Empresa Nacional de Petroleo 4.5% 9/14/47 (c) | | 440,000 | 468,050 |
|
| TOTAL CHILE | | | 2,345,428 |
|
| Colombia - 0.1% | | | |
| Oleoducto Central SA 4% 7/14/27 (c) | | 350,000 | 364,945 |
| Dominican Republic - 0.1% | | | |
| Banco de Reservas de La Republica Dominicana 7% 2/1/23 (c) | | 650,000 | 665,438 |
| Georgia - 1.0% | | | |
| Georgian Oil & Gas Corp. 6.75% 4/26/21 (c) | | 3,125,000 | 3,093,750 |
| JSC Georgian Railway 7.75% 7/11/22 (c) | | 2,650,000 | 2,754,344 |
|
| TOTAL GEORGIA | | | 5,848,094 |
|
| Hong Kong - 0.1% | | | |
| Lenovo Group Ltd. 3.421% 11/2/30 (c) | | 295,000 | 298,012 |
| Indonesia - 0.6% | | | |
| Hutama Karya Persero PT 3.75% 5/11/30 (c) | | 600,000 | 648,000 |
| Indonesia Asahan Aluminium Tbk PT: | | | |
| 4.75% 5/15/25 (c) | | 200,000 | 217,250 |
| 5.45% 5/15/30 (c) | | 400,000 | 454,000 |
| PT Adaro Indonesia 4.25% 10/31/24 (c) | | 550,000 | 543,641 |
| PT Pertamina Persero: | | | |
| 3.1% 1/21/30 (Reg. S) | | 500,000 | 513,750 |
| 3.65% 7/30/29 (c) | | 375,000 | 403,711 |
| 4.15% 2/25/60 (c) | | 365,000 | 357,696 |
| 4.175% 1/21/50 (c) | | 250,000 | 248,438 |
|
| TOTAL INDONESIA | | | 3,386,486 |
|
| Kazakhstan - 0.2% | | | |
| KazMunaiGaz National Co.: | | | |
| 3.5% 4/14/33 (c) | | 200,000 | 206,220 |
| 5.375% 4/24/30 (c) | | 250,000 | 298,125 |
| 5.75% 4/19/47 (c) | | 450,000 | 559,350 |
|
| TOTAL KAZAKHSTAN | | | 1,063,695 |
|
| Malaysia - 0.1% | | | |
| Petronas Capital Ltd.: | | | |
| 3.5% 4/21/30 (c) | | 250,000 | 278,385 |
| 4.55% 4/21/50 (c) | | 200,000 | 249,533 |
| 4.8% 4/21/60 (c) | | 250,000 | 337,109 |
|
| TOTAL MALAYSIA | | | 865,027 |
|
| Mexico - 2.1% | | | |
| Braskem Idesa SAPI 7.45% 11/15/29 (c) | | 875,000 | 827,330 |
| Mexico City Airport Trust: | | | |
| 3.875% 4/30/28 (c) | | 300,000 | 267,938 |
| 5.5% 7/31/47 (c) | | 400,000 | 342,233 |
| Pemex Project Funding Master Trust 6.625% 6/15/35 | | 1,675,000 | 1,379,463 |
| Petroleos Mexicanos: | | | |
| 3 month U.S. LIBOR + 3.650% 3.9003% 3/11/22 (g)(h) | | 350,000 | 345,100 |
| 3.5% 1/30/23 | | 905,000 | 882,375 |
| 4.5% 1/23/26 | | 400,000 | 352,720 |
| 4.625% 9/21/23 | | 500,000 | 493,906 |
| 4.875% 1/24/22 | | 460,000 | 462,588 |
| 4.875% 1/18/24 | | 535,000 | 522,652 |
| 5.5% 2/24/25 (Reg. S) | EUR | 460,000 | 548,965 |
| 6.49% 1/23/27 | | 890,000 | 827,923 |
| 6.5% 6/2/41 | | 1,170,000 | 903,825 |
| 6.75% 9/21/47 | | 360,000 | 278,820 |
| 6.875% 10/16/25 (c) | | 330,000 | 323,730 |
| 6.95% 1/28/60 | | 1,750,000 | 1,368,500 |
| 7.69% 1/23/50 | | 2,044,000 | 1,696,418 |
|
| TOTAL MEXICO | | | 11,824,486 |
|
| Netherlands - 0.6% | | | |
| Kazakhstan Temir Zholy Finance BV 6.95% 7/10/42 (c) | | 250,000 | 342,109 |
| Petrobras Global Finance BV: | | | |
| 5.093% 1/15/30 | | 1,520,000 | 1,591,790 |
| 6.9% 3/19/49 | | 930,000 | 1,052,425 |
| Prosus NV 4.027% 8/3/50 (c) | | 350,000 | 363,125 |
|
| TOTAL NETHERLANDS | | | 3,349,449 |
|
| Panama - 0.1% | | | |
| Cable Onda SA 4.5% 1/30/30 (c) | | 380,000 | 402,444 |
| Paraguay - 0.1% | | | |
| Telefonica Celular del Paraguay SA 5.875% 4/15/27 (c) | | 700,000 | 739,156 |
| Peru - 0.1% | | | |
| Camposol SA 6% 2/3/27 (c) | | 500,000 | 526,719 |
| Saudi Arabia - 0.8% | | | |
| Saudi Arabian Oil Co.: | | | |
| 3.5% 4/16/29 (c) | | 450,000 | 493,875 |
| 4.25% 4/16/39 (c) | | 3,355,000 | 3,795,344 |
|
| TOTAL SAUDI ARABIA | | | 4,289,219 |
|
| Singapore - 0.2% | | | |
| Indika Energy Capital III Pte. Ltd. 5.875% 11/9/24 (c) | | 500,000 | 468,906 |
| Medco Bell Pte Ltd. 6.375% 1/30/27 (c) | | 835,000 | 732,713 |
|
| TOTAL SINGAPORE | | | 1,201,619 |
|
| South Africa - 0.6% | | | |
| Eskom Holdings SOC Ltd.: | | | |
| 5.75% 1/26/21 (Reg. S) | | 1,600,000 | 1,568,500 |
| 6.75% 8/6/23 (c) | | 2,050,000 | 1,938,531 |
|
| TOTAL SOUTH AFRICA | | | 3,507,031 |
|
| Thailand - 0.1% | | | |
| PTT Treasury Center Co. Ltd. 3.7% 7/16/70 (c) | | 350,000 | 331,953 |
| United Arab Emirates - 0.2% | | | |
| Abu Dhabi National Energy Co. PJSC 4% 10/3/49 (c) | | 315,000 | 365,892 |
| DP World Ltd.: | | | |
| 2.375% 9/25/26 (Reg. S) | EUR | 305,000 | 356,550 |
| 4.7% 9/30/49 (c) | | 450,000 | 457,172 |
|
| TOTAL UNITED ARAB EMIRATES | | | 1,179,614 |
|
| United Kingdom - 0.4% | | | |
| Antofagasta PLC 2.375% 10/14/30 (c) | | 200,000 | 197,313 |
| Biz Finance PLC 9.625% 4/27/22 (c) | | 1,500,000 | 1,534,219 |
| Tullow Oil PLC 7% 3/1/25 (c) | | 840,000 | 433,388 |
|
| TOTAL UNITED KINGDOM | | | 2,164,920 |
|
| United States of America - 0.2% | | | |
| Citgo Holding, Inc. 9.25% 8/1/24 (c) | | 750,000 | 630,000 |
| Kosmos Energy Ltd. 7.125% 4/4/26 (c) | | 775,000 | 665,531 |
|
| TOTAL UNITED STATES OF AMERICA | | | 1,295,531 |
|
| Venezuela - 0.1% | | | |
| Petroleos de Venezuela SA: | | | |
| 6% 5/16/24 (c)(i) | | 5,700,000 | 159,600 |
| 6% 11/15/26 (Reg. S) (i) | | 6,800,000 | 193,800 |
|
| TOTAL VENEZUELA | | | 353,400 |
|
| TOTAL NONCONVERTIBLE BONDS | | | |
| (Cost $57,946,111) | | | 56,367,590 |
|
| Government Obligations - 13.1% | | | |
| Angola - 0.2% | | | |
| Angola Republic: | | | |
| 8.25% 5/9/28 (c) | | 625,000 | 489,844 |
| 9.5% 11/12/25 (c) | | 730,000 | 623,238 |
|
| TOTAL ANGOLA | | | 1,113,082 |
|
| Argentina - 0.6% | | | |
| Argentine Republic: | | | |
| 0.125% 7/9/30 (j) | | 3,025,365 | 1,096,695 |
| 0.125% 7/9/35 (j) | | 4,317,734 | 1,414,058 |
| 0.125% 1/9/38 (j) | | 1,261,834 | 467,667 |
| 1% 7/9/29 | | 498,666 | 204,453 |
|
| TOTAL ARGENTINA | | | 3,182,873 |
|
| Barbados - 0.1% | | | |
| Barbados Government 6.5% 10/1/29 (c) | | 855,000 | 813,586 |
| Benin - 0.1% | | | |
| Republic of Benin 5.75% 3/26/26 (c) | EUR | 750,000 | 834,454 |
| Brazil - 0.2% | | | |
| Brazilian Federative Republic: | | | |
| 3.875% 6/12/30 | | 350,000 | 354,375 |
| 4.75% 1/14/50 | | 600,000 | 588,750 |
|
| TOTAL BRAZIL | | | 943,125 |
|
| Cameroon - 0.4% | | | |
| Cameroon Republic 9.5% 11/19/25 (c) | | 2,425,000 | 2,532,609 |
| Colombia - 0.6% | | | |
| Colombian Republic: | | | |
| 3% 1/30/30 | | 640,000 | 653,400 |
| 3.125% 4/15/31 | | 300,000 | 307,800 |
| 3.875% 4/25/27 | | 350,000 | 377,475 |
| 5% 6/15/45 | | 805,000 | 934,303 |
| 7.375% 9/18/37 | | 650,000 | 913,859 |
|
| TOTAL COLOMBIA | | | 3,186,837 |
|
| Costa Rica - 0.1% | | | |
| Costa Rican Republic 5.625% 4/30/43 (c) | | 450,000 | 324,563 |
| Dominican Republic - 0.2% | | | |
| Dominican Republic: | | | |
| 5.875% 1/30/60 (c) | | 680,000 | 652,588 |
| 6.5% 2/15/48 (Reg. S) | | 200,000 | 205,813 |
| 6.85% 1/27/45 (c) | | 350,000 | 375,594 |
|
| TOTAL DOMINICAN REPUBLIC | | | 1,233,995 |
|
| Ecuador - 0.3% | | | |
| Ecuador Republic: | | | |
| 0% 7/31/30 (c) | | 157,171 | 70,776 |
| 0.5% 7/31/30 (c)(j) | | 890,630 | 587,816 |
| 0.5% 7/31/35 (c)(j) | | 1,290,256 | 709,641 |
| 0.5% 7/31/40 (c)(j) | | 543,050 | 268,979 |
|
| TOTAL ECUADOR | | | 1,637,212 |
|
| Egypt - 0.6% | | | |
| Arab Republic of Egypt: | | | |
| , yield at date of purchase 13.4499% to 13.6304% 11/3/20 to 2/16/21 | EGP | 12,250,000 | 763,586 |
| 5.875% 6/11/25 (c) | | 400,000 | 410,375 |
| 6.375% 4/11/31 (Reg. S) | EUR | 335,000 | 372,966 |
| 7.5% 1/31/27 (c) | | 150,000 | 158,672 |
| 7.903% 2/21/48 (c) | | 725,000 | 687,617 |
| 8.5% 1/31/47 (c) | | 1,160,000 | 1,151,300 |
|
| TOTAL EGYPT | | | 3,544,516 |
|
| El Salvador - 0.2% | | | |
| El Salvador Republic: | | | |
| 7.1246% 1/20/50 (c) | | 770,000 | 580,628 |
| 7.625% 2/1/41 (c) | | 725,000 | 559,383 |
| 7.75% 1/24/23 (c) | | 230,000 | 209,300 |
|
| TOTAL EL SALVADOR | | | 1,349,311 |
|
| Gabon - 0.3% | | | |
| Gabonese Republic 6.375% 12/12/24 (c) | | 1,796,722 | 1,709,132 |
| Ghana - 0.4% | | | |
| Ghana Republic: | | | |
| 7.875% 8/7/23 (c) | | 225,000 | 238,078 |
| 8.125% 1/18/26 (c) | | 1,745,000 | 1,752,089 |
| 10.75% 10/14/30 (c) | | 400,000 | 489,250 |
|
| TOTAL GHANA | | | 2,479,417 |
|
| Guatemala - 0.1% | | | |
| Guatemalan Republic 6.125% 6/1/50 (c) | | 350,000 | 431,922 |
| Honduras - 0.1% | | | |
| Republic of Honduras: | | | |
| 5.625% 6/24/30 (c) | | 300,000 | 331,031 |
| 6.25% 1/19/27 | | 200,000 | 223,625 |
|
| TOTAL HONDURAS | | | 554,656 |
|
| Indonesia - 0.9% | | | |
| Indonesian Republic: | | | |
| 3.4% 9/18/29 | | 270,000 | 295,481 |
| 3.5% 1/11/28 | | 415,000 | 453,128 |
| 3.5% 2/14/50 | | 680,000 | 715,700 |
| 3.85% 10/15/30 | | 655,000 | 746,700 |
| 4.1% 4/24/28 | | 300,000 | 339,938 |
| 4.2% 10/15/50 | | 900,000 | 1,039,500 |
| 4.45% 4/15/70 | | 455,000 | 537,184 |
| 6.625% 2/17/37 (c) | | 300,000 | 418,688 |
| 8.5% 10/12/35 (c) | | 500,000 | 799,688 |
|
| TOTAL INDONESIA | | | 5,346,007 |
|
| Israel - 0.2% | | | |
| Israeli State: | | | |
| 2.75% 7/3/30 | | 300,000 | 327,900 |
| 4.5% 4/3/20 | | 590,000 | 769,655 |
|
| TOTAL ISRAEL | | | 1,097,555 |
|
| Ivory Coast - 0.4% | | | |
| Ivory Coast: | | | |
| 5.875% 10/17/31 (c) | EUR | 1,385,000 | 1,578,259 |
| 6.375% 3/3/28 (c) | | 705,000 | 738,708 |
|
| TOTAL IVORY COAST | | | 2,316,967 |
|
| Jamaica - 0.1% | | | |
| Jamaican Government 8% 3/15/39 | | 400,000 | 530,625 |
| Jordan - 0.1% | | | |
| Jordanian Kingdom: | | | |
| 4.95% 7/7/25 (c) | | 200,000 | 203,000 |
| 7.375% 10/10/47 (c) | | 425,000 | 438,148 |
|
| TOTAL JORDAN | | | 641,148 |
|
| Kenya - 0.1% | | | |
| Republic of Kenya 6.875% 6/24/24 (c) | | 830,000 | 876,169 |
| Lebanon - 0.2% | | | |
| Lebanese Republic: | | | |
| 5.8% 12/31/49 (i) | | 1,165,000 | 186,764 |
| 6.375% 12/31/49 (i) | | 7,090,000 | 1,136,616 |
|
| TOTAL LEBANON | | | 1,323,380 |
|
| Mexico - 0.4% | | | |
| United Mexican States: | | | |
| 3.25% 4/16/30 | | 400,000 | 414,000 |
| 3.75% 1/11/28 | | 350,000 | 378,875 |
| 4.35% 1/15/47 | | 850,000 | 894,359 |
| 4.75% 3/8/44 | | 450,000 | 497,813 |
|
| TOTAL MEXICO | | | 2,185,047 |
|
| Mongolia - 0.1% | | | |
| Mongolia Government: | | | |
| 5.125% 12/5/22 (c) | | 300,000 | 307,594 |
| 5.125% 4/7/26 (c) | | 200,000 | 206,750 |
|
| TOTAL MONGOLIA | | | 514,344 |
|
| Morocco - 0.0% | | | |
| Moroccan Kingdom 1.375% 3/30/26 (c) | EUR | 175,000 | 201,967 |
| Nigeria - 0.7% | | | |
| Republic of Nigeria: | | | |
| 5.625% 6/27/22 | | 380,000 | 385,463 |
| 6.375% 7/12/23 (c) | | 800,000 | 830,500 |
| 6.5% 11/28/27 (c) | | 1,105,000 | 1,069,088 |
| 6.75% 1/28/21 (c) | | 300,000 | 301,875 |
| 7.143% 2/23/30 (c) | | 850,000 | 821,047 |
| 7.625% 11/21/25 (c) | | 630,000 | 661,303 |
|
| TOTAL NIGERIA | | | 4,069,276 |
|
| Oman - 0.2% | | | |
| Sultanate of Oman 6.5% 3/8/47 (c) | | 1,120,000 | 905,800 |
| Pakistan - 0.1% | | | |
| Islamic Republic of Pakistan 6.875% 12/5/27 (c) | | 440,000 | 427,488 |
| Panama - 0.1% | | | |
| Panamanian Republic: | | | |
| 2.252% 9/29/32 | | 200,000 | 203,400 |
| 3.16% 1/23/30 | | 360,000 | 392,513 |
| 3.87% 7/23/60 | | 200,000 | 225,063 |
|
| TOTAL PANAMA | | | 820,976 |
|
| Paraguay - 0.4% | | | |
| Republic of Paraguay: | | | |
| 4.625% 1/25/23 (c) | | 500,000 | 529,688 |
| 4.7% 3/27/27 (c) | | 400,000 | 451,875 |
| 4.95% 4/28/31 (c) | | 590,000 | 688,124 |
| 5.4% 3/30/50 (c) | | 380,000 | 460,869 |
|
| TOTAL PARAGUAY | | | 2,130,556 |
|
| Philippines - 0.1% | | | |
| Philippine Republic 2.457% 5/5/30 | | 350,000 | 374,063 |
| Qatar - 0.7% | | | |
| State of Qatar: | | | |
| 3.75% 4/16/30 (c) | | 625,000 | 726,172 |
| 4.4% 4/16/50 (c) | | 1,730,000 | 2,197,100 |
| 4.625% 6/2/46 (c) | | 300,000 | 392,531 |
| 4.817% 3/14/49 (c) | | 655,000 | 873,811 |
|
| TOTAL QATAR | | | 4,189,614 |
|
| Romania - 0.2% | | | |
| Romanian Republic: | | | |
| 3% 2/14/31 (c) | | 155,000 | 160,183 |
| 3.624% 5/26/30 (c) | EUR | 350,000 | 467,243 |
| 4.625% 4/3/49 | EUR | 310,000 | 447,015 |
|
| TOTAL ROMANIA | | | 1,074,441 |
|
| Russia - 0.6% | | | |
| Ministry of Finance of the Russian Federation: | | | |
| 4.25% 6/23/27(Reg. S) | | 400,000 | 450,125 |
| 4.375% 3/21/29(Reg. S) | | 400,000 | 458,125 |
| 5.1% 3/28/35 (c) | | 600,000 | 727,875 |
| 5.1% 3/28/35(Reg. S) | | 400,000 | 485,250 |
| 5.25% 6/23/47(Reg. S) | | 800,000 | 1,050,000 |
| 5.625% 4/4/42 (c) | | 400,000 | 525,250 |
|
| TOTAL RUSSIA | | | 3,696,625 |
|
| Rwanda - 0.7% | | | |
| Rwanda Republic 6.625% 5/2/23 (c) | | 3,575,000 | 3,725,820 |
| Sri Lanka - 0.1% | | | |
| Democratic Socialist Republic of Sri Lanka 6.2% 5/11/27 (c) | | 850,000 | 456,875 |
| Turkey - 0.9% | | | |
| Turkish Republic: | | | |
| 4.25% 3/13/25 | | 520,000 | 474,338 |
| 4.875% 4/16/43 | | 1,005,000 | 734,906 |
| 5.25% 3/13/30 | | 1,040,000 | 907,400 |
| 5.75% 5/11/47 | | 3,190,000 | 2,480,225 |
| 6.375% 10/14/25 | | 290,000 | 282,750 |
|
| TOTAL TURKEY | | | 4,879,619 |
|
| Ukraine - 0.5% | | | |
| Ukraine Government: | | | |
| 0% 5/31/40 (c)(g)(i) | | 575,000 | 496,477 |
| 6.75% 6/20/26 (c) | EUR | 360,000 | 411,282 |
| 7.75% 9/1/22 (c) | | 200,000 | 209,300 |
| 7.75% 9/1/23 (c) | | 850,000 | 882,725 |
| 7.75% 9/1/24 (c) | | 830,000 | 857,234 |
|
| TOTAL UKRAINE | | | 2,857,018 |
|
| United Arab Emirates - 0.1% | | | |
| Emirate of Abu Dhabi: | | | |
| 1.7% 3/2/31 (c) | | 350,000 | 343,875 |
| 3.125% 4/16/30 (c) | | 300,000 | 333,750 |
|
| TOTAL UNITED ARAB EMIRATES | | | 677,625 |
|
| United States of America - 0.1% | | | |
| U.S. Treasury Bills, yield at date of purchase 0.1% to 0.11% 12/10/20 to 12/24/20 (k) | | 330,000 | 329,959 |
| Uruguay - 0.4% | | | |
| Uruguay Republic: | | | |
| 4.375% 1/23/31 | | 350,000 | 422,734 |
| 5.1% 6/18/50 | | 1,205,000 | 1,607,169 |
|
| TOTAL URUGUAY | | | 2,029,903 |
|
| Uzbekistan - 0.1% | | | |
| Republic of Uzbekistan 4.75% 2/20/24 (c) | | 300,000 | 314,156 |
| Venezuela - 0.1% | | | |
| Venezuelan Republic 9.25% 9/15/27 (i) | | 6,200,000 | 542,500 |
| TOTAL GOVERNMENT OBLIGATIONS | | | |
| (Cost $78,571,642) | | | 74,406,813 |
|
| Preferred Securities - 0.1% | | | |
| Georgia - 0.1% | | | |
Georgia Bank Joint Stock Co. 11.125% (Reg. S)
(Cost $760,155)(g)(l) | | 700,000 | 731,403 |
| | | Shares | Value |
|
| Money Market Funds - 3.2% | | | |
| Fidelity Cash Central Fund 0.10% (m) | | 17,291,630 | 17,295,088 |
| Fidelity Securities Lending Cash Central Fund 0.11% (m)(n) | | 879,912 | 880,000 |
| TOTAL MONEY MARKET FUNDS | | | |
| (Cost $18,174,791) | | | 18,175,088 |
| TOTAL INVESTMENT IN SECURITIES - 99.8% | | | |
| (Cost $474,467,812) | | | 566,405,439 |
| NET OTHER ASSETS (LIABILITIES) - 0.2% | | | 1,238,960 |
| NET ASSETS - 100% | | | $567,644,399 |
| Futures Contracts | | | | | |
| | Number of contracts | Expiration Date | Notional Amount | Value | Unrealized Appreciation/(Depreciation) |
| Purchased | | | | | |
| Equity Index Contracts | | | | | |
| ICE E-mini MSCI Emerging Markets Index Contracts (United States) | 37 | Dec. 2020 | $2,038,515 | $45,887 | $45,887 |
The notional amount of futures purchased as a percentage of Net Assets is 0.4%
Currency Abbreviations
EGP – Egyptian pound
EUR – European Monetary Unit
Categorizations in the Schedule of Investments are based on country or territory of incorporation.
Legend
(a) Non-income producing
(b) Security or a portion of the security is on loan at period end.
(c) Security exempt from registration under Rule 144A of the Securities Act of 1933. These securities may be resold in transactions exempt from registration, normally to qualified institutional buyers. At the end of the period, the value of these securities amounted to $96,238,803 or 17.0% of net assets.
(d) Restricted securities (including private placements) - Investment in securities not registered under the Securities Act of 1933 (excluding 144A issues). At the end of the period, the value of restricted securities (excluding 144A issues) amounted to $2,492,349 or 0.4% of net assets.
(e) Level 3 security
(f) Amount is stated in United States dollars unless otherwise noted.
(g) Coupon rates for floating and adjustable rate securities reflect the rates in effect at period end.
(h) Coupon is indexed to a floating interest rate which may be multiplied by a specified factor and/or subject to caps or floors.
(i) Non-income producing - Security is in default.
(j) Security initially issued at one coupon which converts to a higher coupon at a specified date. The rate shown is the rate at period end.
(k) Security or a portion of the security was pledged to cover margin requirements for futures contracts. At period end, the value of securities pledged amounted to $269,967.
(l) Security is perpetual in nature with no stated maturity date.
(m) Affiliated fund that is generally available only to investment companies and other accounts managed by Fidelity Investments. The rate quoted is the annualized seven-day yield of the fund at period end. A complete unaudited listing of the fund's holdings as of its most recent quarter end is available upon request. In addition, each Fidelity Central Fund's financial statements, which are not covered by the Fund's Report of Independent Registered Public Accounting Firm, are available on the SEC's website or upon request.
(n) Investment made with cash collateral received from securities on loan.
Additional information on each restricted holding is as follows:
| Security | Acquisition Date | Acquisition Cost |
| Ant International Co. Ltd. Class C | 5/16/18 | $1,618,120 |
| Antengene Corp. Series C1 | 7/11/20 | $147,373 |
Affiliated Central Funds
Information regarding fiscal year to date income earned by the Fund from investments in Fidelity Central Funds is as follows:
| Fund | Income earned |
| Fidelity Cash Central Fund | $183,236 |
| Fidelity Securities Lending Cash Central Fund | 8,222 |
| Total | $191,458 |
Amounts in the income column in the above table include any capital gain distributions from underlying funds, which are presented in the corresponding line-item in the Statement of Operations, if applicable. Amount for Fidelity Securities Lending Cash Central Fund represents the income earned on investing cash collateral, less rebates paid to borrowers and any lending agent fees associated with the loan, plus any premium payments received for lending certain types of securities.
Investment Valuation
The following is a summary of the inputs used, as of October 31, 2020, involving the Fund's assets and liabilities carried at fair value. The inputs or methodology used for valuing securities may not be an indication of the risk associated with investing in those securities. For more information on valuation inputs, and their aggregation into the levels used below, please refer to the Investment Valuation section in the accompanying Notes to Financial Statements.
| | Valuation Inputs at Reporting Date: |
| Description | Total | Level 1 | Level 2 | Level 3 |
| Investments in Securities: | | | | |
| Equities: | | | | |
| Communication Services | $58,303,956 | $16,105,312 | $42,198,644 | $-- |
| Consumer Discretionary | 91,362,228 | 78,511,741 | 12,850,487 | -- |
| Consumer Staples | 23,859,586 | 19,458,950 | 4,400,636 | -- |
| Energy | 17,426,175 | 7,095,294 | 10,330,881 | -- |
| Financials | 73,530,316 | 29,112,535 | 42,072,805 | 2,344,976 |
| Health Care | 16,144,146 | 9,531,964 | 6,464,809 | 147,373 |
| Industrials | 13,280,620 | 8,444,113 | 4,836,507 | -- |
| Information Technology | 75,653,414 | 13,152,104 | 62,501,310 | -- |
| Materials | 28,950,019 | 13,964,814 | 14,985,205 | -- |
| Real Estate | 9,582,077 | 6,311,515 | 3,270,562 | -- |
| Utilities | 8,632,008 | 4,883,634 | 3,748,374 | -- |
| Corporate Bonds | 56,367,590 | -- | 56,367,590 | -- |
| Government Obligations | 74,406,813 | -- | 74,406,813 | -- |
| Preferred Securities | 731,403 | -- | 731,403 | -- |
| Money Market Funds | 18,175,088 | 18,175,088 | -- | -- |
| Total Investments in Securities: | $566,405,439 | $224,747,064 | $339,166,026 | $2,492,349 |
| Derivative Instruments: | | | | |
| Assets | | | | |
| Futures Contracts | $45,887 | $45,887 | $-- | $-- |
| Total Assets | $45,887 | $45,887 | $-- | $-- |
| Total Derivative Instruments: | $45,887 | $45,887 | $-- | $-- |
Value of Derivative Instruments
The following table is a summary of the Fund's value of derivative instruments by primary risk exposure as of October 31, 2020. For additional information on derivative instruments, please refer to the Derivative Instruments section in the accompanying Notes to Financial Statements.
| Primary Risk Exposure / Derivative Type | Value |
| | Asset | Liability |
| Equity Risk | | |
| Futures Contracts(a) | $45,887 | $0 |
| Total Equity Risk | 45,887 | 0 |
| Total Value of Derivatives | $45,887 | $0 |
(a) Reflects gross cumulative appreciation (depreciation) on futures contracts as presented in the Schedule of Investments. In the Statement of Assets and Liabilities, the period end daily variation margin is included in receivable or payable for daily variation margin on futures contracts, and the net cumulative appreciation (depreciation) is included in Total accumulated earnings (loss).
See accompanying notes which are an integral part of the financial statements.
Fidelity® Total Emerging Markets Fund
Financial Statements
Statement of Assets and Liabilities
| | | October 31, 2020 |
| Assets | | |
Investment in securities, at value (including securities loaned of $845,600) — See accompanying schedule:
Unaffiliated issuers (cost $456,293,021) | $548,230,351 | |
| Fidelity Central Funds (cost $18,174,791) | 18,175,088 | |
| Total Investment in Securities (cost $474,467,812) | | $566,405,439 |
| Foreign currency held at value (cost $977,860) | | 974,625 |
| Receivable for investments sold | | 1,684,054 |
| Receivable for fund shares sold | | 453,057 |
| Dividends receivable | | 536,266 |
| Interest receivable | | 1,756,027 |
| Distributions receivable from Fidelity Central Funds | | 1,522 |
| Prepaid expenses | | 979 |
| Other receivables | | 137,930 |
| Total assets | | 571,949,899 |
| Liabilities | | |
| Payable to custodian bank | $69,112 | |
| Payable for investments purchased | 2,043,858 | |
| Payable for fund shares redeemed | 628,780 | |
| Accrued management fee | 374,141 | |
| Distribution and service plan fees payable | 35,900 | |
| Payable for daily variation margin on futures contracts | 25,530 | |
| Other affiliated payables | 108,807 | |
| Other payables and accrued expenses | 139,372 | |
| Collateral on securities loaned | 880,000 | |
| Total liabilities | | 4,305,500 |
| Net Assets | | $567,644,399 |
| Net Assets consist of: | | |
| Paid in capital | | $531,596,658 |
| Total accumulated earnings (loss) | | 36,047,741 |
| Net Assets | | $567,644,399 |
| Net Asset Value and Maximum Offering Price | | |
| Class A: | | |
| Net Asset Value and redemption price per share ($37,021,602 ÷ 2,731,290 shares)(a) | | $13.55 |
| Maximum offering price per share (100/94.25 of $13.55) | | $14.38 |
| Class M: | | |
| Net Asset Value and redemption price per share ($7,884,629 ÷ 583,017 shares)(a) | | $13.52 |
| Maximum offering price per share (100/96.50 of $13.52) | | $14.01 |
| Class C: | | |
| Net Asset Value and offering price per share ($28,883,770 ÷ 2,154,566 shares)(a) | | $13.41 |
| Total Emerging Markets: | | |
| Net Asset Value, offering price and redemption price per share ($205,008,883 ÷ 15,086,827 shares) | | $13.59 |
| Class I: | | |
| Net Asset Value, offering price and redemption price per share ($232,450,376 ÷ 17,127,221 shares) | | $13.57 |
| Class Z: | | |
| Net Asset Value, offering price and redemption price per share ($56,395,139 ÷ 4,162,641 shares) | | $13.55 |
(a) Redemption price per share is equal to net asset value less any applicable contingent deferred sales charge.
See accompanying notes which are an integral part of the financial statements.
Statement of Operations
| | | Year ended October 31, 2020 |
| Investment Income | | |
| Dividends | | $9,483,809 |
| Interest | | 9,374,709 |
| Income from Fidelity Central Funds (including $8,222 from security lending) | | 191,458 |
| Income before foreign taxes withheld | | 19,049,976 |
| Less foreign taxes withheld | | (1,276,840) |
| Total income | | 17,773,136 |
| Expenses | | |
| Management fee | $4,867,961 | |
| Transfer agent fees | 1,117,102 | |
| Distribution and service plan fees | 450,459 | |
| Accounting fees | 309,910 | |
| Custodian fees and expenses | 359,778 | |
| Independent trustees' fees and expenses | 3,678 | |
| Registration fees | 105,769 | |
| Audit | 114,452 | |
| Legal | 2,989 | |
| Interest | 815 | |
| Miscellaneous | 34,833 | |
| Total expenses before reductions | 7,367,746 | |
| Expense reductions | (127,439) | |
| Total expenses after reductions | | 7,240,307 |
| Net investment income (loss) | | 10,532,829 |
| Realized and Unrealized Gain (Loss) | | |
| Net realized gain (loss) on: | | |
| Investment securities: | | |
| Unaffiliated issuers (net of foreign taxes of $6,676) | (10,528,259) | |
| Fidelity Central Funds | 1,118 | |
| Foreign currency transactions | (305,907) | |
| Futures contracts | 151,150 | |
| Total net realized gain (loss) | | (10,681,898) |
| Change in net unrealized appreciation (depreciation) on: | | |
| Investment securities: | | |
| Unaffiliated issuers | 28,797,343 | |
| Fidelity Central Funds | (344) | |
| Assets and liabilities in foreign currencies | (5,547) | |
| Futures contracts | (32,730) | |
| Total change in net unrealized appreciation (depreciation) | | 28,758,722 |
| Net gain (loss) | | 18,076,824 |
| Net increase (decrease) in net assets resulting from operations | | $28,609,653 |
See accompanying notes which are an integral part of the financial statements.
Statement of Changes in Net Assets
| | Year ended October 31, 2020 | Year ended October 31, 2019 |
| Increase (Decrease) in Net Assets | | |
| Operations | | |
| Net investment income (loss) | $10,532,829 | $22,017,399 |
| Net realized gain (loss) | (10,681,898) | (20,239,544) |
| Change in net unrealized appreciation (depreciation) | 28,758,722 | 79,631,040 |
| Net increase (decrease) in net assets resulting from operations | 28,609,653 | 81,408,895 |
| Distributions to shareholders | (20,131,978) | (14,178,054) |
| Share transactions - net increase (decrease) | (158,347,267) | 36,607,938 |
| Total increase (decrease) in net assets | (149,869,592) | 103,838,779 |
| Net Assets | | |
| Beginning of period | 717,513,991 | 613,675,212 |
| End of period | $567,644,399 | $717,513,991 |
See accompanying notes which are an integral part of the financial statements.
Financial Highlights
Fidelity Total Emerging Markets Fund Class A
| Years ended October 31, | 2020 | 2019 | 2018 | 2017 | 2016 |
| Selected Per–Share Data | | | | | |
| Net asset value, beginning of period | $12.80 | $11.53 | $13.56 | $11.33 | $10.35 |
| Income from Investment Operations | | | | | |
| Net investment income (loss)A | .19 | .37B | .25 | .24 | .26 |
| Net realized and unrealized gain (loss) | .89 | 1.14 | (1.94) | 2.11 | .96 |
| Total from investment operations | 1.08 | 1.51 | (1.69) | 2.35 | 1.22 |
| Distributions from net investment income | (.33) | (.24) | (.16) | (.12) | (.24) |
| Distributions from net realized gain | – | – | (.19) | (.01) | – |
| Total distributions | (.33) | (.24) | (.34)C | (.13) | (.24) |
| Redemption fees added to paid in capitalA | – | – | –D | .01 | –D |
| Net asset value, end of period | $13.55 | $12.80 | $11.53 | $13.56 | $11.33 |
| Total ReturnE,F | 8.54% | 13.38% | (12.77)% | 21.13% | 12.13% |
| Ratios to Average Net AssetsG,H | | | | | |
| Expenses before reductions | 1.40% | 1.39% | 1.40% | 1.47% | 1.87% |
| Expenses net of fee waivers, if any | 1.39% | 1.39% | 1.40% | 1.47% | 1.65% |
| Expenses net of all reductions | 1.37% | 1.39% | 1.37% | 1.46% | 1.64% |
| Net investment income (loss) | 1.49% | 3.02%B | 1.92% | 1.97% | 2.47% |
| Supplemental Data | | | | | |
| Net assets, end of period (000 omitted) | $37,022 | $39,958 | $34,617 | $42,213 | $15,206 |
| Portfolio turnover rateI | 58% | 75% | 94% | 59% | 57% |
A Calculated based on average shares outstanding during the period.
B Net investment income per share reflects one or more large, non-recurring dividend which amounted to $.08 per share. Excluding such non-recurring dividend, the ratio of net investment income (loss) to average net assets would have been 2.37%.
C Total distributions per share do not sum due to rounding.
D Amount represents less than $.005 per share.
E Total returns would have been lower if certain expenses had not been reduced during the applicable periods shown.
F Total returns do not include the effect of the sales charges.
G Fees and expenses of any underlying mutual funds or exchange-traded funds (ETFs) are not included in the Fund's expense ratio. The Fund indirectly bears its proportionate share of these expenses. For additional expense information related to investments in Fidelity Central Funds, please refer to the "Investments in Fidelity Central Funds" note found in the Notes to Financial Statements section of the most recent Annual or Semi-Annual report.
H Expense ratios reflect operating expenses of the class. Expenses before reductions do not reflect amounts reimbursed, waived, or reduced through arrangements with the investment adviser, brokerage services, or other offset arrangements, if applicable, and do not represent the amount paid by the class during periods when reimbursements, waivers or reductions occur.
I Amount does not include the portfolio activity of any underlying mutual funds or exchange-traded funds (ETFs).
See accompanying notes which are an integral part of the financial statements.
Fidelity Total Emerging Markets Fund Class M
| Years ended October 31, | 2020 | 2019 | 2018 | 2017 | 2016 |
| Selected Per–Share Data | | | | | |
| Net asset value, beginning of period | $12.78 | $11.51 | $13.55 | $11.33 | $10.33 |
| Income from Investment Operations | | | | | |
| Net investment income (loss)A | .15 | .33B | .21 | .20 | .23 |
| Net realized and unrealized gain (loss) | .88 | 1.15 | (1.93) | 2.11 | .97 |
| Total from investment operations | 1.03 | 1.48 | (1.72) | 2.31 | 1.20 |
| Distributions from net investment income | (.29) | (.21) | (.13) | (.09) | (.20) |
| Distributions from net realized gain | – | – | (.19) | (.01) | – |
| Total distributions | (.29) | (.21) | (.32) | (.10) | (.20) |
| Redemption fees added to paid in capitalA | – | – | –C | .01 | –C |
| Net asset value, end of period | $13.52 | $12.78 | $11.51 | $13.55 | $11.33 |
| Total ReturnD,E | 8.16% | 13.05% | (13.03)% | 20.66% | 11.92% |
| Ratios to Average Net AssetsF,G | | | | | |
| Expenses before reductions | 1.71% | 1.72% | 1.74% | 1.82% | 2.22% |
| Expenses net of fee waivers, if any | 1.71% | 1.71% | 1.74% | 1.82% | 1.90% |
| Expenses net of all reductions | 1.69% | 1.71% | 1.71% | 1.81% | 1.90% |
| Net investment income (loss) | 1.17% | 2.69%B | 1.58% | 1.62% | 2.22% |
| Supplemental Data | | | | | |
| Net assets, end of period (000 omitted) | $7,885 | $8,841 | $8,519 | $8,751 | $3,019 |
| Portfolio turnover rateH | 58% | 75% | 94% | 59% | 57% |
A Calculated based on average shares outstanding during the period.
B Net investment income per share reflects one or more large, non-recurring dividend which amounted to $.08 per share. Excluding such non-recurring dividend, the ratio of net investment income (loss) to average net assets would have been 2.04%.
C Amount represents less than $.005 per share.
D Total returns would have been lower if certain expenses had not been reduced during the applicable periods shown.
E Total returns do not include the effect of the sales charges.
F Fees and expenses of any underlying mutual funds or exchange-traded funds (ETFs) are not included in the Fund's expense ratio. The Fund indirectly bears its proportionate share of these expenses. For additional expense information related to investments in Fidelity Central Funds, please refer to the "Investments in Fidelity Central Funds" note found in the Notes to Financial Statements section of the most recent Annual or Semi-Annual report.
G Expense ratios reflect operating expenses of the class. Expenses before reductions do not reflect amounts reimbursed, waived, or reduced through arrangements with the investment adviser, brokerage services, or other offset arrangements, if applicable, and do not represent the amount paid by the class during periods when reimbursements, waivers or reductions occur.
H Amount does not include the portfolio activity of any underlying mutual funds or exchange-traded funds (ETFs).
See accompanying notes which are an integral part of the financial statements.
Fidelity Total Emerging Markets Fund Class C
| Years ended October 31, | 2020 | 2019 | 2018 | 2017 | 2016 |
| Selected Per–Share Data | | | | | |
| Net asset value, beginning of period | $12.66 | $11.40 | $13.45 | $11.25 | $10.25 |
| Income from Investment Operations | | | | | |
| Net investment income (loss)A | .09 | .28B | .15 | .15 | .18 |
| Net realized and unrealized gain (loss) | .89 | 1.13 | (1.92) | 2.11 | .97 |
| Total from investment operations | .98 | 1.41 | (1.77) | 2.26 | 1.15 |
| Distributions from net investment income | (.23) | (.15) | (.09) | (.06) | (.15) |
| Distributions from net realized gain | – | – | (.19) | (.01) | – |
| Total distributions | (.23) | (.15) | (.28) | (.07) | (.15) |
| Redemption fees added to paid in capitalA | – | – | –C | .01 | –C |
| Net asset value, end of period | $13.41 | $12.66 | $11.40 | $13.45 | $11.25 |
| Total ReturnD,E | 7.83% | 12.54% | (13.45)% | 20.29% | 11.36% |
| Ratios to Average Net AssetsF,G | | | | | |
| Expenses before reductions | 2.14% | 2.14% | 2.14% | 2.21% | 2.62% |
| Expenses net of fee waivers, if any | 2.14% | 2.14% | 2.14% | 2.21% | 2.40% |
| Expenses net of all reductions | 2.12% | 2.13% | 2.12% | 2.20% | 2.39% |
| Net investment income (loss) | .74% | 2.27%B | 1.18% | 1.23% | 1.72% |
| Supplemental Data | | | | | |
| Net assets, end of period (000 omitted) | $28,884 | $35,545 | $37,191 | $34,869 | $10,710 |
| Portfolio turnover rateH | 58% | 75% | 94% | 59% | 57% |
A Calculated based on average shares outstanding during the period.
B Net investment income per share reflects one or more large, non-recurring dividend which amounted to $.08 per share. Excluding such non-recurring dividend, the ratio of net investment income (loss) to average net assets would have been 1.62%.
C Amount represents less than $.005 per share.
D Total returns would have been lower if certain expenses had not been reduced during the applicable periods shown.
E Total returns do not include the effect of the contingent deferred sales charge.
F Fees and expenses of any underlying mutual funds or exchange-traded funds (ETFs) are not included in the Fund's expense ratio. The Fund indirectly bears its proportionate share of these expenses. For additional expense information related to investments in Fidelity Central Funds, please refer to the "Investments in Fidelity Central Funds" note found in the Notes to Financial Statements section of the most recent Annual or Semi-Annual report.
G Expense ratios reflect operating expenses of the class. Expenses before reductions do not reflect amounts reimbursed, waived, or reduced through arrangements with the investment adviser, brokerage services, or other offset arrangements, if applicable, and do not represent the amount paid by the class during periods when reimbursements, waivers or reductions occur.
H Amount does not include the portfolio activity of any underlying mutual funds or exchange-traded funds (ETFs).
See accompanying notes which are an integral part of the financial statements.
Fidelity Total Emerging Markets Fund
| Years ended October 31, | 2020 | 2019 | 2018 | 2017 | 2016 |
| Selected Per–Share Data | | | | | |
| Net asset value, beginning of period | $12.84 | $11.56 | $13.58 | $11.34 | $10.38 |
| Income from Investment Operations | | | | | |
| Net investment income (loss)A | .22 | .40B | .29 | .27 | .28 |
| Net realized and unrealized gain (loss) | .90 | 1.16 | (1.95) | 2.10 | .97 |
| Total from investment operations | 1.12 | 1.56 | (1.66) | 2.37 | 1.25 |
| Distributions from net investment income | (.37) | (.28) | (.17) | (.14) | (.29) |
| Distributions from net realized gain | – | – | (.19) | (.01) | – |
| Total distributions | (.37) | (.28) | (.36) | (.14)C | (.29) |
| Redemption fees added to paid in capitalA | – | – | –D | .01 | –D |
| Net asset value, end of period | $13.59 | $12.84 | $11.56 | $13.58 | $11.34 |
| Total ReturnE | 8.79% | 13.80% | (12.56)% | 21.37% | 12.44% |
| Ratios to Average Net AssetsF,G | | | | | |
| Expenses before reductions | 1.16% | 1.14% | 1.13% | 1.26% | 1.62% |
| Expenses net of fee waivers, if any | 1.15% | 1.14% | 1.13% | 1.26% | 1.40% |
| Expenses net of all reductions | 1.14% | 1.14% | 1.11% | 1.24% | 1.39% |
| Net investment income (loss) | 1.73% | 3.27%B | 2.19% | 2.18% | 2.72% |
| Supplemental Data | | | | | |
| Net assets, end of period (000 omitted) | $205,009 | $199,708 | $190,025 | $272,002 | $104,332 |
| Portfolio turnover rateH | 58% | 75% | 94% | 59% | 57% |
A Calculated based on average shares outstanding during the period.
B Net investment income per share reflects one or more large, non-recurring dividend which amounted to $.08 per share. Excluding such non-recurring dividend, the ratio of net investment income (loss) to average net assets would have been 2.62%.
C Total distributions per share do not sum due to rounding.
D Amount represents less than $.005 per share.
E Total returns would have been lower if certain expenses had not been reduced during the applicable periods shown.
F Fees and expenses of any underlying mutual funds or exchange-traded funds (ETFs) are not included in the Fund's expense ratio. The Fund indirectly bears its proportionate share of these expenses. For additional expense information related to investments in Fidelity Central Funds, please refer to the "Investments in Fidelity Central Funds" note found in the Notes to Financial Statements section of the most recent Annual or Semi-Annual report.
G Expense ratios reflect operating expenses of the class. Expenses before reductions do not reflect amounts reimbursed, waived, or reduced through arrangements with the investment adviser, brokerage services, or other offset arrangements, if applicable, and do not represent the amount paid by the class during periods when reimbursements, waivers or reductions occur.
H Amount does not include the portfolio activity of any underlying mutual funds or exchange-traded funds (ETFs).
See accompanying notes which are an integral part of the financial statements.
Fidelity Total Emerging Markets Fund Class I
| Years ended October 31, | 2020 | 2019 | 2018 | 2017 | 2016 |
| Selected Per–Share Data | | | | | |
| Net asset value, beginning of period | $12.82 | $11.55 | $13.58 | $11.33 | $10.37 |
| Income from Investment Operations | | | | | |
| Net investment income (loss)A | .22 | .41B | .29 | .28 | .29 |
| Net realized and unrealized gain (loss) | .90 | 1.14 | (1.95) | 2.11 | .96 |
| Total from investment operations | 1.12 | 1.55 | (1.66) | 2.39 | 1.25 |
| Distributions from net investment income | (.37) | (.28) | (.19) | (.14) | (.29) |
| Distributions from net realized gain | – | – | (.19) | (.01) | – |
| Total distributions | (.37) | (.28) | (.37)C | (.15) | (.29) |
| Redemption fees added to paid in capitalA | – | – | –D | .01 | –D |
| Net asset value, end of period | $13.57 | $12.82 | $11.55 | $13.58 | $11.33 |
| Total ReturnE | 8.85% | 13.77% | (12.56)% | 21.51% | 12.48% |
| Ratios to Average Net AssetsF,G | | | | | |
| Expenses before reductions | 1.11% | 1.11% | 1.12% | 1.19% | 1.54% |
| Expenses net of fee waivers, if any | 1.10% | 1.10% | 1.12% | 1.19% | 1.40% |
| Expenses net of all reductions | 1.09% | 1.10% | 1.10% | 1.17% | 1.39% |
| Net investment income (loss) | 1.78% | 3.30%B | 2.20% | 2.25% | 2.72% |
| Supplemental Data | | | | | |
| Net assets, end of period (000 omitted) | $232,450 | $372,286 | $341,720 | $371,617 | $21,099 |
| Portfolio turnover rateH | 58% | 75% | 94% | 59% | 57% |
A Calculated based on average shares outstanding during the period.
B Net investment income per share reflects one or more large, non-recurring dividend which amounted to $.08 per share. Excluding such non-recurring dividend, the ratio of net investment income (loss) to average net assets would have been 2.65%.
C Total distributions per share do not sum due to rounding.
D Amount represents less than $.005 per share.
E Total returns would have been lower if certain expenses had not been reduced during the applicable periods shown.
F Fees and expenses of any underlying mutual funds or exchange-traded funds (ETFs) are not included in the Fund's expense ratio. The Fund indirectly bears its proportionate share of these expenses. For additional expense information related to investments in Fidelity Central Funds, please refer to the "Investments in Fidelity Central Funds" note found in the Notes to Financial Statements section of the most recent Annual or Semi-Annual report.
G Expense ratios reflect operating expenses of the class. Expenses before reductions do not reflect amounts reimbursed, waived, or reduced through arrangements with the investment adviser, brokerage services, or other offset arrangements, if applicable, and do not represent the amount paid by the class during periods when reimbursements, waivers or reductions occur.
H Amount does not include the portfolio activity of any underlying mutual funds or exchange-traded funds (ETFs).
See accompanying notes which are an integral part of the financial statements.
Fidelity Total Emerging Markets Fund Class Z
| Years ended October 31, | 2020 | 2019 | 2018 A |
| Selected Per–Share Data | | | |
| Net asset value, beginning of period | $12.80 | $11.55 | $12.17 |
| Income from Investment Operations | | | |
| Net investment income (loss)B | .24 | .43C | .01 |
| Net realized and unrealized gain (loss) | .90 | 1.13 | (.63) |
| Total from investment operations | 1.14 | 1.56 | (.62) |
| Distributions from net investment income | (.39) | (.31) | – |
| Distributions from net realized gain | – | – | – |
| Total distributions | (.39) | (.31) | – |
| Redemption fees added to paid in capitalB | – | – | – |
| Net asset value, end of period | $13.55 | $12.80 | $11.55 |
| Total ReturnD,E | 9.03% | 13.85% | (5.09)% |
| Ratios to Average Net AssetsF,G | | | |
| Expenses before reductions | .98% | .98% | 1.07%H |
| Expenses net of fee waivers, if any | .98% | .97% | 1.04%H |
| Expenses net of all reductions | .96% | .97% | 1.02%H |
| Net investment income (loss) | 1.91% | 3.43%C | 1.51%H |
| Supplemental Data | | | |
| Net assets, end of period (000 omitted) | $56,395 | $61,175 | $1,603 |
| Portfolio turnover rateI | 58% | 75% | 94% |
A For the period October 2, 2018 (commencement of sale of shares) to October 31, 2018.
B Calculated based on average shares outstanding during the period.
C Net investment income per share reflects one or more large, non-recurring dividend which amounted to $.08 per share. Excluding such non-recurring dividend, the ratio of net investment income (loss) to average net assets would have been 2.79%.
D Total returns for periods of less than one year are not annualized.
E Total returns would have been lower if certain expenses had not been reduced during the applicable periods shown.
F Fees and expenses of any underlying mutual funds or exchange-traded funds (ETFs) are not included in the Fund's expense ratio. The Fund indirectly bears its proportionate share of these expenses. For additional expense information related to investments in Fidelity Central Funds, please refer to the "Investments in Fidelity Central Funds" note found in the Notes to Financial Statements section of the most recent Annual or Semi-Annual report.
G Expense ratios reflect operating expenses of the class. Expenses before reductions do not reflect amounts reimbursed, waived, or reduced through arrangements with the investment adviser, brokerage services, or other offset arrangements, if applicable, and do not represent the amount paid by the class during periods when reimbursements, waivers or reductions occur.
H Annualized
I Amount does not include the portfolio activity of any underlying mutual funds or exchange-traded funds (ETFs).
See accompanying notes which are an integral part of the financial statements.
Notes to Financial Statements
For the period ended October 31, 2020
1. Organization.
Fidelity Total Emerging Markets Fund (the Fund) is a fund of Fidelity Investment Trust (the Trust) and is authorized to issue an unlimited number of shares. The Trust is registered under the Investment Company Act of 1940, as amended (the 1940 Act), as an open-end management investment company organized as a Massachusetts business trust. The Fund offers Class A, Class M, Class C, Total Emerging Markets, Class I and Class Z shares, each of which has equal rights as to assets and voting privileges. Each class has exclusive voting rights with respect to matters that affect that class. Class C shares will automatically convert to Class A shares after a holding period of ten years from the initial date of purchase, with certain exceptions. The Fund's investments in emerging markets can be subject to social, economic, regulatory, and political uncertainties and can be extremely volatile.
Effective January 1, 2020:
Investment advisers Fidelity Investments Money Management, Inc., FMR Co., Inc., and Fidelity SelectCo, LLC, merged with and into Fidelity Management & Research Company. In connection with the merger transactions, the resulting, merged investment adviser was then redomiciled from Massachusetts to Delaware, changed its corporate structure from a corporation to a limited liability company, and changed its name to "Fidelity Management & Research Company LLC".
Broker-dealer Fidelity Distributors Corporation merged with and into Fidelity Investments Institutional Services Company, Inc. ("FIISC"). FIISC was then redomiciled from Massachusetts to Delaware, changed its corporate structure from a corporation to a limited liability company, and changed its name to "Fidelity Distributors Company LLC".
Fidelity Investments Institutional Operations Company, Inc. converted from a Massachusetts corporation to a Massachusetts LLC, and changed its name to "Fidelity Investments Institutional Operations Company LLC".
2. Investments in Fidelity Central Funds.
The Fund invests in Fidelity Central Funds, which are open-end investment companies generally available only to other investment companies and accounts managed by the investment adviser and its affiliates. The Fund's Schedule of Investments lists each of the Fidelity Central Funds held as of period end, if any, as an investment of the Fund, but does not include the underlying holdings of each Fidelity Central Fund. As an Investing Fund, the Fund indirectly bears its proportionate share of the expenses of the underlying Fidelity Central Funds.
The Money Market Central Funds seek preservation of capital and current income and are managed by the investment adviser. Annualized expenses of the Money Market Central Funds as of their most recent shareholder report date ranged from less than .005% to .01%.
A complete unaudited list of holdings for each Fidelity Central Fund is available upon request or at the Securities and Exchange Commission (the SEC) website at www.sec.gov. In addition, the financial statements of the Fidelity Central Funds, which are not covered by the Fund's Report of Independent Registered Public Accounting Firm, are available on the SEC website or upon request.
3. Significant Accounting Policies.
The Fund is an investment company and applies the accounting and reporting guidance of the Financial Accounting Standards Board (FASB) Accounting Standards Codification Topic 946 Financial Services – Investment Companies. The financial statements have been prepared in conformity with accounting principles generally accepted in the United States of America (GAAP), which require management to make certain estimates and assumptions at the date of the financial statements. Actual results could differ from those estimates. Subsequent events, if any, through the date that the financial statements were issued have been evaluated in the preparation of the financial statements. The following summarizes the significant accounting policies of the Fund:
Investment Valuation. Investments are valued as of 4:00 p.m. Eastern time on the last calendar day of the period. The Board of Trustees (the Board) has delegated the day to day responsibility for the valuation of the Fund's investments to the Fair Value Committee (the Committee) established by the Fund's investment adviser. In accordance with valuation policies and procedures approved by the Board, the Fund attempts to obtain prices from one or more third party pricing vendors or brokers to value its investments. When current market prices, quotations or currency exchange rates are not readily available or reliable, investments will be fair valued in good faith by the Committee, in accordance with procedures adopted by the Board. Factors used in determining fair value vary by investment type and may include market or investment specific events, changes in interest rates and credit quality. The frequency with which these procedures are used cannot be predicted and they may be utilized to a significant extent. The Committee oversees the Fund's valuation policies and procedures and reports to the Board on the Committee's activities and fair value determinations. The Board monitors the appropriateness of the procedures used in valuing the Fund's investments and ratifies the fair value determinations of the Committee.
The Fund categorizes the inputs to valuation techniques used to value its investments into a disclosure hierarchy consisting of three levels as shown below:
- Level 1 – quoted prices in active markets for identical investments
- Level 2 – other significant observable inputs (including quoted prices for similar investments, interest rates, prepayment speeds, etc.)
- Level 3 – unobservable inputs (including the Fund's own assumptions based on the best information available)
Valuation techniques used to value the Fund's investments by major category are as follows:
Equity securities, including restricted securities, for which market quotations are readily available, are valued at the last reported sale price or official closing price as reported by a third party pricing vendor on the primary market or exchange on which they are traded and are categorized as Level 1 in the hierarchy. In the event there were no sales during the day or closing prices are not available, securities are valued at the last quoted bid price or may be valued using the last available price and are generally categorized as Level 2 in the hierarchy. For foreign equity securities, when market or security specific events arise, comparisons to the valuation of American Depositary Receipts (ADRs), futures contracts, Exchange-Traded Funds (ETFs) and certain indexes as well as quoted prices for similar securities may be used and would be categorized as Level 2 in the hierarchy. For equity securities, including restricted securities, where observable inputs are limited, assumptions about market activity and risk are used and these securities may be categorized as Level 3 in the hierarchy.
Debt securities, including restricted securities, are valued based on evaluated prices received from third party pricing vendors or from brokers who make markets in such securities. Corporate bonds, foreign government and government agency obligations, preferred securities and U.S. government and government agency obligations are valued by pricing vendors who utilize matrix pricing which considers yield or price of bonds of comparable quality, coupon, maturity and type or by broker-supplied prices. When independent prices are unavailable or unreliable, debt securities may be valued utilizing pricing methodologies which consider similar factors that would be used by third party pricing vendors. Debt securities are generally categorized as Level 2 in the hierarchy but may be Level 3 depending on the circumstances.
Futures contracts are valued at the settlement price established each day by the board of trade or exchange on which they are traded and are categorized as Level 1 in the hierarchy. Investments in open-end mutual funds, including the Fidelity Central Funds, are valued at their closing net asset value (NAV) each business day and are categorized as Level 1 in the hierarchy.
Changes in valuation techniques may result in transfers in or out of an assigned level within the disclosure hierarchy. The aggregate value of investments by input level as of October 31, 2020 is included at the end of the Fund's Schedule of Investments.
Foreign Currency. Certain Funds may use foreign currency contracts to facilitate transactions in foreign-denominated securities. Gains and losses from these transactions may arise from changes in the value of the foreign currency or if the counterparties do not perform under the contracts' terms.
Foreign-denominated assets, including investment securities, and liabilities are translated into U.S. dollars at the exchange rates at period end. Purchases and sales of investment securities, income and dividends received, and expenses denominated in foreign currencies are translated into U.S. dollars at the exchange rate in effect on the transaction date.
The effects of exchange rate fluctuations on investments are included with the net realized and unrealized gain (loss) on investment securities. Other foreign currency transactions resulting in realized and unrealized gain (loss) are disclosed separately.
Investment Transactions and Income. For financial reporting purposes, the Fund's investment holdings and NAV include trades executed through the end of the last business day of the period. The NAV per share for processing shareholder transactions is calculated as of the close of business of the New York Stock Exchange (NYSE), normally 4:00 p.m. Eastern time and includes trades executed through the end of the prior business day. Gains and losses on securities sold are determined on the basis of identified cost and include proceeds received from litigation. Dividend income is recorded on the ex-dividend date, except for certain dividends from foreign securities where the ex-dividend date may have passed, which are recorded as soon as the Fund is informed of the ex-dividend date. Non-cash dividends included in dividend income, if any, are recorded at the fair market value of the securities received. Income and capital gain distributions from Fidelity Central Funds, if any, are recorded on the ex-dividend date. Certain distributions received by the Fund represent a return of capital or capital gain. The Fund determines the components of these distributions subsequent to the ex-dividend date, based upon receipt of tax filings or other correspondence relating to the underlying investment. These distributions are recorded as a reduction of cost of investments and/or as a realized gain. Interest income is accrued as earned and includes coupon interest and amortization of premium and accretion of discount on debt securities as applicable. Investment income is recorded net of foreign taxes withheld where recovery of such taxes is uncertain. Debt obligations may be placed on non-accrual status and related interest income may be reduced by ceasing current accruals and writing off interest receivables when the collection of all or a portion of interest has become doubtful based on consistently applied procedures. A debt obligation is removed from non-accrual status when the issuer resumes interest payments or when collectability of interest is reasonably assured.
Class Allocations and Expenses. Investment income, realized and unrealized capital gains and losses, common expenses of the Fund, and certain fund-level expense reductions, if any, are allocated daily on a pro-rata basis to each class based on the relative net assets of each class to the total net assets of the Fund. Each class differs with respect to transfer agent and distribution and service plan fees incurred. Certain expense reductions may also differ by class. For the reporting period, the allocated portion of income and expenses to each class as a percent of its average net assets may vary due to the timing of recording these transactions in relation to fluctuating net assets of the classes. Expenses directly attributable to a fund are charged to that fund. Expenses attributable to more than one fund are allocated among the respective funds on the basis of relative net assets or other appropriate methods. Expense estimates are accrued in the period to which they relate and adjustments are made when actual amounts are known.
Income Tax Information and Distributions to Shareholders. Each year, the Fund intends to qualify as a regulated investment company under Subchapter M of the Internal Revenue Code, including distributing substantially all of its taxable income and realized gains. As a result, no provision for U.S. Federal income taxes is required. As of October 31, 2020, the Fund did not have any unrecognized tax benefits in the financial statements; nor is the Fund aware of any tax positions for which it is reasonably possible that the total amounts of unrecognized tax benefits will significantly change in the next twelve months. The Fund files a U.S. federal tax return, in addition to state and local tax returns as required. The Fund's federal income tax returns are subject to examination by the Internal Revenue Service (IRS) for a period of three fiscal years after they are filed. State and local tax returns may be subject to examination for an additional fiscal year depending on the jurisdiction. Foreign taxes are provided for based on the Fund's understanding of the tax rules and rates that exist in the foreign markets in which it invests. The Fund is subject to a tax imposed on capital gains by certain countries in which it invests.
Distributions are declared and recorded on the ex-dividend date. Income and capital gain distributions are declared separately for each class. Income and capital gain distributions are determined in accordance with income tax regulations, which may differ from GAAP. In addition, the Fund claimed a portion of the payment made to redeeming shareholders as a distribution for income tax purposes.
Capital accounts within the financial statements are adjusted for permanent book-tax differences. These adjustments have no impact on net assets or the results of operations. Capital accounts are not adjusted for temporary book-tax differences which will reverse in a subsequent period.
Book-tax differences are primarily due to futures contracts, foreign currency transactions, certain foreign taxes, passive foreign investment companies (PFIC), market discount, capital loss carryforwards and losses deferred due to wash sales.
As of period end, the cost and unrealized appreciation (depreciation) in securities, and derivatives if applicable, for federal income tax purposes were as follows:
| Gross unrealized appreciation | $138,936,727 |
| Gross unrealized depreciation | (51,606,511) |
| Net unrealized appreciation (depreciation) | $87,330,216 |
| Tax Cost | $479,075,223 |
The tax-based components of distributable earnings as of period end were as follows:
| Undistributed ordinary income | $6,293,871 |
| Capital loss carryforward | $(57,554,177) |
| Net unrealized appreciation (depreciation) on securities and other investments | $87,308,047 |
Capital loss carryforwards are only available to offset future capital gains of the Fund to the extent provided by regulations and may be limited. The capital loss carryforward information presented below, including any applicable limitation, is estimated as of fiscal period end and is subject to adjustment.
| No expiration | |
| Short-term | $(47,423,169) |
| Long-term | (10,131,007) |
| Total capital loss carryforward | (57,554,177) |
The tax character of distributions paid was as follows:
| | October 31, 2020 | October 31, 2019 |
| Ordinary Income | $20,131,978 | $ 14,178,054 |
Restricted Securities (including Private Placements). The Fund may invest in securities that are subject to legal or contractual restrictions on resale. These securities generally may be resold in transactions exempt from registration or to the public if the securities are registered. Disposal of these securities may involve time-consuming negotiations and expense, and prompt sale at an acceptable price may be difficult. Information regarding restricted securities is included at the end of the Fund's Schedule of Investments.
4. Derivative Instruments.
Risk Exposures and the Use of Derivative Instruments. The Fund's investment objective allows the Fund to enter into various types of derivative contracts, including futures contracts. Derivatives are investments whose value is primarily derived from underlying assets, indices or reference rates and may be transacted on an exchange or over-the-counter (OTC). Derivatives may involve a future commitment to buy or sell a specified asset based on specified terms, to exchange future cash flows at periodic intervals based on a notional principal amount, or for one party to make one or more payments upon the occurrence of specified events in exchange for periodic payments from the other party.
The Fund used derivatives to increase returns and to manage exposure to certain risks as defined below. The success of any strategy involving derivatives depends on analysis of numerous economic factors, and if the strategies for investment do not work as intended, the Fund may not achieve its objectives.
The Fund's use of derivatives increased or decreased its exposure to the following risk:
| Equity Risk | Equity risk relates to the fluctuations in the value of financial instruments as a result of changes in market prices (other than those arising from interest rate risk or foreign exchange risk), whether caused by factors specific to an individual investment, its issuer, or all factors affecting all instruments traded in a market or market segment.
|
The Fund is also exposed to additional risks from investing in derivatives, such as liquidity risk and counterparty credit risk. Liquidity risk is the risk that the Fund will be unable to close out the derivative in the open market in a timely manner. Counterparty credit risk is the risk that the counterparty will not be able to fulfill its obligation to the Fund. Counterparty credit risk related to exchange-traded futures contracts may be mitigated by the protection provided by the exchange on which they trade.
Investing in derivatives may involve greater risks than investing in the underlying assets directly and, to varying degrees, may involve risk of loss in excess of any initial investment and collateral received and amounts recognized in the Statement of Assets and Liabilities. In addition, there may be the risk that the change in value of the derivative contract does not correspond to the change in value of the underlying instrument.
Futures Contracts. A futures contract is an agreement between two parties to buy or sell a specified underlying instrument for a fixed price at a specified future date. The Fund used futures contracts to manage its exposure to the stock market.
Upon entering into a futures contract, a fund is required to deposit either cash or securities (initial margin) with a clearing broker in an amount equal to a certain percentage of the face value of the contract. Futures contracts are marked-to-market daily and subsequent daily payments (variation margin are made or received by a fund depending on the daily fluctuations in the value of the futures contracts and are recorded as unrealized appreciation or (depreciation). This receivable and/or payable, if any, is included in daily variation margin on futures contracts in the Statement of Assets and Liabilities. Realized gain or (loss) is recorded upon the expiration or closing of a futures contract. The net realized gain (loss) and change in net unrealized appreciation (depreciation) on futures contracts during the period is presented in the Statement of Operations.
Any open futures contracts at period end are presented in the Schedule of Investments under the caption "Futures Contracts". The notional amount at value reflects each contract's exposure to the underlying instrument or index at period end and is representative of volume of activity during the period. Securities deposited to meet initial margin requirements are identified in the Schedule of Investments.
5. Purchases and Sales of Investments.
Purchases and sales of securities, other than short-term securities and U.S. government securities, are noted in the table below.
| | Purchases ($) | Sales ($) |
| Fidelity Total Emerging Markets Fund | 339,688,067 | 475,315,443 |
6. Fees and Other Transactions with Affiliates.
Management Fee. Fidelity Management & Research Company LLC (the investment adviser) and its affiliates provide the Fund with investment management related services for which the Fund pays a monthly management fee. The management fee is the sum of an individual fund fee rate that is based on an annual rate of .55% of the Fund's average net assets and an annualized group fee rate that averaged .23% during the period. The group fee rate is based upon the monthly average net assets of a group of registered investment companies with which the investment adviser has management contracts. The group fee rate decreases as assets under management increase and increases as assets under management decrease. For the reporting period, the total annual management fee rate was .78% of the Fund's average net assets.
Distribution and Service Plan Fees. In accordance with Rule 12b-1 of the 1940 Act, the Fund has adopted separate Distribution and Service Plans for each class of shares. Certain classes pay Fidelity Distributors Company LLC (FDC), an affiliate of the investment adviser, separate Distribution and Service Fees, each of which is based on an annual percentage of each class' average net assets. In addition, FDC may pay financial intermediaries for selling shares of the Fund and providing shareholder support services. For the period, the Distribution and Service Fee rates, total fees and amounts retained by FDC were as follows:
| | Distribution Fee | Service Fee | Total Fees | Retained by FDC |
| Class A | -% | .25% | $90,964 | $2,415 |
| Class M | .25% | .25% | 40,414 | 122 |
| Class C | .75% | .25% | 319,081 | 25,846 |
| | | | $450,459 | $28,383 |
Sales Load. FDC may receive a front-end sales charge of up to 5.75% for selling Class A shares and 3.50% for selling Class M shares, some of which is paid to financial intermediaries for selling shares of the Fund. Depending on the holding period, FDC may receive contingent deferred sales charges levied on Class A, Class M and Class C redemptions. The deferred sales charges are 1.00% for Class C shares, 1.00% for certain purchases of Class A shares and .25% for certain purchases of Class M shares.
For the period, sales charge amounts retained by FDC were as follows:
| | Retained by FDC |
| Class A | $18,183 |
| Class M | 1,721 |
| Class C(a) | 2,529 |
| | $22,433 |
(a) When Class C shares are initially sold, FDC pays commissions from its own resources to financial intermediaries through which the sales are made.
Transfer Agent Fees. Fidelity Investments Institutional Operations Company LLC (FIIOC), an affiliate of the investment adviser, is the transfer, dividend disbursing and shareholder servicing agent for each class of the Fund. FIIOC receives account fees and asset-based fees that vary according to the account size and type of account of the shareholders of the respective classes of the Fund, except for Class Z. FIIOC receives an asset-based fee of Class Z's average net assets. FIIOC pays for typesetting, printing and mailing of shareholder reports, except proxy statements. Effective February 1, 2020, the Board approved to change the fee for and Class Z from .046% to .044%.
For the period, transfer agent fees for each class were as follows:
| | Amount | % of Class-Level Average Net Assets |
| Class A | $76,604 | .21 |
| Class M | 22,104 | .27 |
| Class C | 64,992 | .20 |
| Total Emerging Markets | 430,990 | .22 |
| Class I | 495,806 | .17 |
| Class Z | 26,606 | .04 |
| | $1,117,102 | |
Accounting Fees. Fidelity Service Company, Inc. (FSC), an affiliate of the investment adviser, maintains the Fund's accounting records. The accounting fee is based on the level of average net assets for each month. For the period, the fees were equivalent to the following annual rates:
| | % of Average Net Assets |
| Fidelity Total Emerging Markets Fund | .05 |
Brokerage Commissions. A portion of portfolio transactions were placed with brokerage firms which are affiliates of the investment adviser. Brokerage commissions are included in net realized gain (loss) and change in net unrealized appreciation (depreciation) in the Statement of Operations. The commissions paid to these affiliated firms were as follows:
| | Amount |
| Fidelity Total Emerging Markets Fund | $2,703 |
Interfund Lending Program. Pursuant to an Exemptive Order issued by the SEC, the Fund, along with other registered investment companies having management contracts with Fidelity Management & Research Company LLC (FMR), or other affiliated entities of FMR, may participate in an interfund lending program. This program provides an alternative credit facility allowing the Fund to borrow from, or lend money to, other participating affiliated funds. At period end, there were no interfund loans outstanding. Activity in this program during the period for which loans were outstanding was as follows:
| | Borrower or Lender | Average Loan Balance | Weighted Average Interest Rate | Interest Expense |
| Fidelity Total Emerging Markets Fund | Borrower | $16,514,667 | .30% | $815 |
Interfund Trades. Funds may purchase from or sell securities to other Fidelity Funds under procedures adopted by the Board. The procedures have been designed to ensure these interfund trades are executed in accordance with Rule 17a-7 of the 1940 Act. Interfund trades are included within the respective purchases and sales amounts shown in the Purchases and Sales of Investments note.
7. Committed Line of Credit.
Certain Funds participate with other funds managed by the investment adviser or an affiliate in a $4.25 billion credit facility (the "line of credit") to be utilized for temporary or emergency purposes to fund shareholder redemptions or for other short-term liquidity purposes. The participating funds have agreed to pay commitment fees on their pro-rata portion of the line of credit, which are reflected in Miscellaneous expenses on the Statement of Operations, and are as follows:
| | Amount |
| Fidelity Total Emerging Markets Fund | $1,504 |
During the period, there were no borrowings on this line of credit.
8. Security Lending.
Funds lend portfolio securities from time to time in order to earn additional income. Lending agents are used, including National Financial Services (NFS), an affiliate of the investment adviser. Pursuant to a securities lending agreement, NFS will receive a fee, which is capped at 9.9% of a fund's daily lending revenue, for its services as lending agent. A fund may lend securities to certain qualified borrowers, including NFS. On the settlement date of the loan, a fund receives collateral (in the form of U.S. Treasury obligations, letters of credit and/or cash) against the loaned securities and maintains collateral in an amount not less than 100% of the market value of the loaned securities during the period of the loan. The market value of the loaned securities is determined at the close of business of a fund and any additional required collateral is delivered to a fund on the next business day. A fund or borrower may terminate the loan at any time, and if the borrower defaults on its obligation to return the securities loaned because of insolvency or other reasons, a fund may apply collateral received from the borrower against the obligation. A fund may experience delays and costs in recovering the securities loaned. Any cash collateral received is invested in the Fidelity Securities Lending Cash Central Fund. Any loaned securities are identified as such in the Schedule of Investments, and the value of loaned securities and cash collateral at period end, as applicable, are presented in the Statement of Assets and Liabilities. Security lending income represents the income earned on investing cash collateral, less rebates paid to borrowers and any lending agent fees associated with the loan, plus any premium payments received for lending certain types of securities. Security lending income is presented in the Statement of Operations as a component of income from Fidelity Central Funds. Affiliated security lending activity, if any, was as follows:
| | Total Security Lending Income Fees Paid to NFS | Security Lending Income From Securities Loaned to NFS | Value of Securities Loaned to NFS at Period End |
| Fidelity Total Emerging Markets Fund | $879 | $– | $– |
9. Expense Reductions.
Commissions paid to certain brokers with whom the investment adviser, or its affiliates, places trades on behalf of the Fund include an amount in addition to trade execution, which may be rebated back to the Fund to offset certain expenses. This amount totaled $113,217 for the period.
In addition, during the period the investment adviser or an affiliate reimbursed and/or waived a portion of fund-level operating expenses in the amount of $2,978.
In addition, during the period the investment adviser or an affiliate reimbursed the Fund $11,244 for an operational error which is included in the accompanying Statement of Operations.
10. Distributions to Shareholders.
Distributions to shareholders of each class were as follows:
| | Year ended
October 31, 2020 | Year ended
October 31, 2019 |
| Distributions to shareholders | | |
| Class A | $968,671 | $714,243 |
| Class M | 200,302 | 150,122 |
| Class C | 654,398 | 488,821 |
| Total Emerging Markets | 5,659,796 | 4,522,488 |
| Class I | 10,669,748 | 8,203,674 |
| Class Z | 1,979,063 | 98,706 |
| Total | $20,131,978 | $14,178,054 |
11. Share Transactions.
Share transactions for each class were as follows and may contain automatic conversions between classes or exchanges between affiliated funds:
| | Shares | Shares | Dollars | Dollars |
| | Year ended October 31, 2020 | Year ended October 31, 2019 | Year ended October 31, 2020 | Year ended October 31, 2019 |
| Class A | | | | |
| Shares sold | 621,407 | 870,630 | $7,737,045 | $10,684,591 |
| Reinvestment of distributions | 73,696 | 62,554 | 964,680 | 711,236 |
| Shares redeemed | (1,084,978) | (814,970) | (13,266,526) | (9,912,774) |
| Net increase (decrease) | (389,875) | 118,214 | $(4,564,801) | $1,483,053 |
| Class M | | | | |
| Shares sold | 63,854 | 115,630 | $805,331 | $1,417,602 |
| Reinvestment of distributions | 15,285 | 13,182 | 200,228 | 150,011 |
| Shares redeemed | (188,136) | (177,172) | (2,283,247) | (2,146,741) |
| Net increase (decrease) | (108,997) | (48,360) | $(1,277,688) | $(579,128) |
| Class C | | | | |
| Shares sold | 199,246 | 408,329 | $2,511,029 | $4,955,307 |
| Reinvestment of distributions | 50,031 | 43,111 | 651,898 | 488,019 |
| Shares redeemed | (901,456) | (907,103) | (10,916,602) | (11,027,167) |
| Net increase (decrease) | (652,179) | (455,663) | $(7,753,675) | $(5,583,841) |
| Total Emerging Markets | | | | |
| Shares sold | 6,499,346 | 5,906,657 | $77,633,536 | $73,141,302 |
| Reinvestment of distributions | 403,626 | 380,480 | 5,287,504 | 4,329,863 |
| Shares redeemed | (7,375,256) | (7,159,495) | (88,118,251) | (87,489,558) |
| Net increase (decrease) | (472,284) | (872,358) | $(5,197,211) | $(10,018,393) |
| Class I | | | | |
| Shares sold | 5,537,778 | 14,032,906 | $68,620,259 | $171,476,090 |
| Reinvestment of distributions | 800,008 | 691,717 | 10,456,099 | 7,857,900 |
| Shares redeemed | (18,251,819) | (15,271,905) | (213,415,616) | (184,876,207) |
| Net increase (decrease) | (11,914,033) | (547,282) | $(134,339,258) | $(5,542,217) |
| Class Z | | | | |
| Shares sold | 2,587,196 | 5,339,852 | $32,277,104 | $65,470,267 |
| Reinvestment of distributions | 92,127 | 7,811 | 1,201,333 | 88,498 |
| Shares redeemed | (3,296,206) | (706,986) | (38,693,071) | (8,710,301) |
| Net increase (decrease) | (616,883) | 4,640,677 | $(5,214,634) | $56,848,464 |
12. Other.
The Fund's organizational documents provide former and current trustees and officers with a limited indemnification against liabilities arising in connection with the performance of their duties to the Fund. In the normal course of business, the Fund may also enter into contracts that provide general indemnifications. The Fund's maximum exposure under these arrangements is unknown as this would be dependent on future claims that may be made against the Fund. The risk of material loss from such claims is considered remote.
13. Coronavirus (COVID-19) Pandemic.
An outbreak of COVID-19 first detected in China during December 2019 has since spread globally and was declared a pandemic by the World Health Organization during March 2020. Developments that disrupt global economies and financial markets, such as the COVID-19 pandemic, may magnify factors that affect the Fund's performance.
Report of Independent Registered Public Accounting Firm
To the Board of Trustees of Fidelity Investment Trust and the Shareholders of Fidelity Emerging Markets Discovery Fund and Fidelity Total Emerging Markets Fund
Opinions on the Financial Statements
We have audited the accompanying statements of assets and liabilities, including the schedules of investments, of Fidelity Emerging Markets Discovery Fund and Fidelity Total Emerging Markets Fund (two of the funds constituting Fidelity Investment Trust, hereafter collectively referred to as the “Funds”) as of October 31, 2020, the related statements of operations for the year ended October 31, 2020, the statements of changes in net assets for each of the two years in the period ended October 31, 2020, including the related notes, and the financial highlights for each of the periods indicated therein (collectively referred to as the “financial statements”). In our opinion, the financial statements present fairly, in all material respects, the financial position of each of the Funds as of October 31, 2020, the results of each of their operations for the year then ended, the changes in each of their net assets for each of the two years in the period ended October 31, 2020 and each of the financial highlights for each of the periods indicated therein in conformity with accounting principles generally accepted in the United States of America.
Basis for Opinions
These financial statements are the responsibility of the Funds' management. Our responsibility is to express an opinion on the Funds' financial statements based on our audits. We are a public accounting firm registered with the Public Company Accounting Oversight Board (United States) (PCAOB) and are required to be independent with respect to the Funds in accordance with the U.S. federal securities laws and the applicable rules and regulations of the Securities and Exchange Commission and the PCAOB.
We conducted our audits of these financial statements in accordance with the standards of the PCAOB. Those standards require that we plan and perform the audit to obtain reasonable assurance about whether the financial statements are free of material misstatement, whether due to error or fraud.
Our audits included performing procedures to assess the risks of material misstatement of the financial statements, whether due to error or fraud, and performing procedures that respond to those risks. Such procedures included examining, on a test basis, evidence regarding the amounts and disclosures in the financial statements. Our audits also included evaluating the accounting principles used and significant estimates made by management, as well as evaluating the overall presentation of the financial statements. Our procedures included confirmation of securities owned as of October 31, 2020 by correspondence with the custodian, issuers of privately offered securities and brokers; when replies were not received from brokers, we performed other auditing procedures. We believe that our audits provide a reasonable basis for our opinions.
/s/ PricewaterhouseCoopers LLP
Boston, Massachusetts
December 14, 2020
We have served as the auditor of one or more investment companies in the Fidelity group of funds since 1932.
Trustees and Officers
The Trustees, Members of the Advisory Board (if any), and officers of the trust and funds, as applicable, are listed below. The Board of Trustees governs each fund and is responsible for protecting the interests of shareholders. The Trustees are experienced executives who meet periodically throughout the year to oversee each fund's activities, review contractual arrangements with companies that provide services to each fund, oversee management of the risks associated with such activities and contractual arrangements, and review each fund's performance. Except for Jonathan Chiel, each of the Trustees oversees 305 funds. Mr. Chiel oversees 176 funds.
The Trustees hold office without limit in time except that (a) any Trustee may resign; (b) any Trustee may be removed by written instrument, signed by at least two-thirds of the number of Trustees prior to such removal; (c) any Trustee who requests to be retired or who has become incapacitated by illness or injury may be retired by written instrument signed by a majority of the other Trustees; and (d) any Trustee may be removed at any special meeting of shareholders by a two-thirds vote of the outstanding voting securities of the trust. Each Trustee who is not an interested person (as defined in the 1940 Act) of the trust and the funds is referred to herein as an Independent Trustee. Each Independent Trustee shall retire not later than the last day of the calendar year in which his or her 75th birthday occurs. The Independent Trustees may waive this mandatory retirement age policy with respect to individual Trustees. Officers and Advisory Board Members hold office without limit in time, except that any officer or Advisory Board Member may resign or may be removed by a vote of a majority of the Trustees at any regular meeting or any special meeting of the Trustees. Except as indicated, each individual has held the office shown or other offices in the same company for the past five years.
Each fund's Statement of Additional Information (SAI) includes more information about the Trustees. To request a free copy, call Fidelity at 1-800-544-8544 if you’re an individual investing directly with Fidelity, call 1-800-835-5092 if you’re a plan sponsor or participant with Fidelity as your recordkeeper or call 1-877-208-0098 on institutional accounts or if you’re an advisor or invest through one.
Experience, Skills, Attributes, and Qualifications of the Trustees. The Governance and Nominating Committee has adopted a statement of policy that describes the experience, qualifications, attributes, and skills that are necessary and desirable for potential Independent Trustee candidates (Statement of Policy). The Board believes that each Trustee satisfied at the time he or she was initially elected or appointed a Trustee, and continues to satisfy, the standards contemplated by the Statement of Policy. The Governance and Nominating Committee also engages professional search firms to help identify potential Independent Trustee candidates who have the experience, qualifications, attributes, and skills consistent with the Statement of Policy. From time to time, additional criteria based on the composition and skills of the current Independent Trustees, as well as experience or skills that may be appropriate in light of future changes to board composition, business conditions, and regulatory or other developments, have also been considered by the professional search firms and the Governance and Nominating Committee. In addition, the Board takes into account the Trustees' commitment and participation in Board and committee meetings, as well as their leadership of standing and ad hoc committees throughout their tenure.
In determining that a particular Trustee was and continues to be qualified to serve as a Trustee, the Board has considered a variety of criteria, none of which, in isolation, was controlling. The Board believes that, collectively, the Trustees have balanced and diverse experience, qualifications, attributes, and skills, which allow the Board to operate effectively in governing each fund and protecting the interests of shareholders. Information about the specific experience, skills, attributes, and qualifications of each Trustee, which in each case led to the Board's conclusion that the Trustee should serve (or continue to serve) as a trustee of the funds, is provided below.
Board Structure and Oversight Function. Robert A. Lawrence is an interested person and currently serves as Acting Chairman. The Trustees have determined that an interested Chairman is appropriate and benefits shareholders because an interested Chairman has a personal and professional stake in the quality and continuity of services provided to the funds. Independent Trustees exercise their informed business judgment to appoint an individual of their choosing to serve as Chairman, regardless of whether the Trustee happens to be independent or a member of management. The Independent Trustees have determined that they can act independently and effectively without having an Independent Trustee serve as Chairman and that a key structural component for assuring that they are in a position to do so is for the Independent Trustees to constitute a substantial majority for the Board. The Independent Trustees also regularly meet in executive session. Ned C. Lautenbach and David M. Thomas serve as Co-Lead Independent Trustees and as such each (i) acts as a liaison between the Independent Trustees and management with respect to matters important to the Independent Trustees and (ii) with management prepares agendas for Board meetings.
Fidelity® funds are overseen by different Boards of Trustees. The funds' Board oversees Fidelity's high income and certain equity funds, and other Boards oversee Fidelity's investment-grade bond, money market, asset allocation, and other equity funds. The asset allocation funds may invest in Fidelity® funds overseen by the funds' Board. The use of separate Boards, each with its own committee structure, allows the Trustees of each group of Fidelity® funds to focus on the unique issues of the funds they oversee, including common research, investment, and operational issues. On occasion, the separate Boards establish joint committees to address issues of overlapping consequences for the Fidelity® funds overseen by each Board.
The Trustees operate using a system of committees to facilitate the timely and efficient consideration of all matters of importance to the Trustees, each fund, and fund shareholders and to facilitate compliance with legal and regulatory requirements and oversight of the funds' activities and associated risks. The Board, acting through its committees, has charged FMR and its affiliates with (i) identifying events or circumstances the occurrence of which could have demonstrably adverse effects on the funds' business and/or reputation; (ii) implementing processes and controls to lessen the possibility that such events or circumstances occur or to mitigate the effects of such events or circumstances if they do occur; and (iii) creating and maintaining a system designed to evaluate continuously business and market conditions in order to facilitate the identification and implementation processes described in (i) and (ii) above. Because the day-to-day operations and activities of the funds are carried out by or through FMR, its affiliates, and other service providers, the funds' exposure to risks is mitigated but not eliminated by the processes overseen by the Trustees. While each of the Board's committees has responsibility for overseeing different aspects of the funds' activities, oversight is exercised primarily through the Operations, Audit, and Compliance Committees. Appropriate personnel, including but not limited to the funds' Chief Compliance Officer (CCO), FMR's internal auditor, the independent accountants, the funds' Treasurer and portfolio management personnel, make periodic reports to the Board's committees, as appropriate, including an annual review of Fidelity's risk management program for the Fidelity® funds. The responsibilities of each standing committee, including their oversight responsibilities, are described further under "Standing Committees of the Trustees."
Interested Trustees*:
Correspondence intended for a Trustee who is an interested person may be sent to Fidelity Investments, 245 Summer Street, Boston, Massachusetts 02210.
Name, Year of Birth; Principal Occupations and Other Relevant Experience+
Jonathan Chiel (1957)
Year of Election or Appointment: 2016
Trustee
Mr. Chiel also serves as Trustee of other Fidelity® funds. Mr. Chiel is Executive Vice President and General Counsel for FMR LLC (diversified financial services company, 2012-present). Previously, Mr. Chiel served as general counsel (2004-2012) and senior vice president and deputy general counsel (2000-2004) for John Hancock Financial Services; a partner with Choate, Hall & Stewart (1996-2000) (law firm); and an Assistant United States Attorney for the United States Attorney’s Office of the District of Massachusetts (1986-95), including Chief of the Criminal Division (1993-1995). Mr. Chiel is a director on the boards of the Boston Bar Foundation and the Maimonides School.
Robert A. Lawrence (1952)
Year of Election or Appointment: 2020
Trustee
Acting Chairman of the Board of Trustees
Mr. Lawrence also serves as Trustee of other funds. Previously, Mr. Lawrence served as a Member of the Advisory Board of certain funds. Prior to his retirement in 2008, Mr. Lawrence served as Vice President of certain Fidelity® funds (2006-2008), Senior Vice President, Head of High Income Division of Fidelity Management & Research Company (investment adviser firm, 2006-2008), and President of Fidelity Strategic Investments (investment adviser firm, 2002-2005).
* Determined to be an “Interested Trustee” by virtue of, among other things, his or her affiliation with the trust or various entities under common control with FMR.
+ The information includes the Trustee's principal occupation during the last five years and other information relating to the experience, attributes, and skills relevant to the Trustee's qualifications to serve as a Trustee, which led to the conclusion that the Trustee should serve as a Trustee for each fund.
Independent Trustees:
Correspondence intended for an Independent Trustee may be sent to Fidelity Investments, P.O. Box 55235, Boston, Massachusetts 02205-5235.
Name, Year of Birth; Principal Occupations and Other Relevant Experience+
Dennis J. Dirks (1948)
Year of Election or Appointment: 2005
Trustee
Mr. Dirks also serves as Trustee of other Fidelity® funds. Prior to his retirement in May 2003, Mr. Dirks served as Chief Operating Officer and as a member of the Board of The Depository Trust & Clearing Corporation (financial markets infrastructure), President, Chief Operating Officer and a member of the Board of The Depository Trust Company (DTC), President and a member of the Board of the National Securities Clearing Corporation (NSCC), Chief Executive Officer and a member of the Board of the Government Securities Clearing Corporation and Chief Executive Officer and a member of the Board of the Mortgage-Backed Securities Clearing Corporation. Mr. Dirks currently serves as a member of the Finance Committee (2016-present) and Board (2017-present) and is Treasurer (2018-present) of the Asolo Repertory Theatre.
Donald F. Donahue (1950)
Year of Election or Appointment: 2018
Trustee
Mr. Donahue also serves as Trustee of other Fidelity® funds. Mr. Donahue serves as President and Chief Executive Officer of Miranda Partners, LLC (risk consulting for the financial services industry, 2012-present). Previously, Mr. Donahue served as Chief Executive Officer (2006-2012), Chief Operating Officer (2003-2006) and Managing Director, Customer Marketing and Development (1999-2003) of The Depository Trust & Clearing Corporation (financial markets infrastructure). Mr. Donahue currently serves as a member (2007-present) and Co-Chairman (2016-present) of the Board of United Way of New York, a member of the Board of NYC Leadership Academy (2012-present) and a member of the Board of Advisors of Ripple Labs, Inc. (financial services, 2015-present). Mr. Donahue previously served as a member of the Advisory Board of certain Fidelity® funds (2015-2018).
Vicki L. Fuller (1957)
Year of Election or Appointment: 2020
Trustee
Ms. Fuller also serves as Trustee of other Fidelity® funds. Previously, Ms. Fuller served as a member of the Advisory Board of certain Fidelity® funds (2018-2020), Chief Investment Officer of the New York State Common Retirement Fund (2012-2018) and held a variety of positions at AllianceBernstein L.P. (global asset management, 1985-2012), including Managing Director (2006-2012) and Senior Vice President and Senior Portfolio Manager (2001-2006). Ms. Fuller currently serves as a member of the Board, Audit Committee and Nominating and Governance Committee of The Williams Companies, Inc. (natural gas infrastructure, 2018-present), as a member of the Board, Audit Committee and Nominating and Governance Committee of two Blackstone business development companies (2020-present) and as a member of the Board of Treliant, LLC (consulting, 2019-present).
Patricia L. Kampling (1959)
Year of Election or Appointment: 2020
Trustee
Ms. Kampling also serves as Trustee of other Fidelity® funds. Prior to her retirement, Ms. Kampling served as Chairman of the Board and Chief Executive Officer (2012-2019), President and Chief Operating Officer (2011-2012) and Executive Vice President and Chief Financial Officer (2010-2011) of Alliant Energy Corporation. Ms. Kampling currently serves as a member of the Board, Compensation Committee and Executive Committee and as Chair of the Audit Committee of Briggs & Stratton Corporation (manufacturing, 2011-present) and as a member of the Board, Audit, Finance and Risk Committee and Safety, Environmental, Technology and Operations Committee of American Water Works Company, Inc. (utilities company, 2019-present). In addition, Ms. Kampling currently serves as a member of the Board of the Nature Conservancy, Wisconsin Chapter (2019-present). Previously, Ms. Kampling served as a Member of the Advisory Board of certain Fidelity® funds (2020), a member of the Board of Interstate Power and Light Company (2012-2019) and Wisconsin Power and Light Company (2012-2019) (each a subsidiary of Alliant Energy Corporation) and as a member of the Board and Workforce Development Committee of the Business Roundtable (2018-2019).
Alan J. Lacy (1953)
Year of Election or Appointment: 2008
Trustee
Mr. Lacy also serves as Trustee of other Fidelity® funds. Previously, Mr. Lacy served as Senior Adviser (2007-2014) of Oak Hill Capital Partners, L.P. (private equity), Chief Executive Officer (2005) and Vice Chairman (2005-2006) of Sears Holdings Corporation (retail), Chief Executive Officer and Chairman of the Board of Sears, Roebuck and Co. (retail, 2000-2005), Chairman (2014-2017) and a member of the Board (2010-2017) of Dave & Buster’s Entertainment, Inc. (restaurant and entertainment complexes) and a member of the Board of Bristol-Myers Squibb Company (global pharmaceuticals, 2008-2020). Mr. Lacy currently serves as a Trustee of the California Chapter of The Nature Conservancy (2015-present) and a member of the Board of the Center for Advanced Study in the Behavioral Sciences at Stanford University (2015-present).
Ned C. Lautenbach (1944)
Year of Election or Appointment: 2000
Trustee
Co-Lead Independent Trustee
Mr. Lautenbach also serves as Trustee of other Fidelity® funds. Mr. Lautenbach currently serves as Chair of the Board of Governors, State University System of Florida (2013-present) and is a member of the Council on Foreign Relations (1994-present). He is also a member and has in the past served as Chairman of the Board of Directors of Artis-Naples (2012-present). Previously, Mr. Lautenbach served as a member and then Lead Director of the Board of Directors of Eaton Corporation (diversified industrial, 1997-2016). He was also a Partner at Clayton, Dubilier & Rice, LLC (private equity investment, 1998-2010); as well as Director of Sony Corporation (2006-2007). In addition, Mr. Lautenbach had a 30-year career with IBM (technology company), during which time he served as Senior Vice President and as a member of the Corporate Executive Committee (1968-1998).
Joseph Mauriello (1944)
Year of Election or Appointment: 2008
Trustee
Mr. Mauriello also serves as Trustee of other Fidelity® funds. Prior to his retirement in January 2006, Mr. Mauriello served in numerous senior management positions including Deputy Chairman and Chief Operating Officer (2004-2005), and Vice Chairman of Financial Services (2002-2004) of KPMG LLP US (professional services, 1965-2005). Mr. Mauriello currently serves as a member of the Independent Directors Council Governing Council (2015-present). Previously, Mr. Mauriello served as a member of the Board of XL Group plc. (global insurance and re-insurance, 2006-2018).
Cornelia M. Small (1944)
Year of Election or Appointment: 2005
Trustee
Ms. Small also serves as Trustee of other Fidelity® funds. Previously, Ms. Small served as Chief Investment Officer, Director of Global Equity Investments and a member of Scudder, Stevens & Clark and Scudder Kemper Investments. Ms. Small previously served as a member of the Board (2009-2019) and Chair of the Investment Committee (2010-2019) of the Teagle Foundation and a member of the Investment Committee of the Berkshire Taconic Community Foundation (2008-2019).
Garnett A. Smith (1947)
Year of Election or Appointment: 2018
Trustee
Mr. Smith also serves as Trustee of other Fidelity® funds. Prior to his retirement, Mr. Smith served as Chairman and Chief Executive Officer (1990-1997) and President (1986-1990) of Inbrand Corp. (manufacturer of personal absorbent products). Prior to his employment with Inbrand Corp., he was employed by a retail fabric chain and North Carolina National Bank (now Bank of America). Mr. Smith previously served as a member of the Advisory Board of certain Fidelity® funds (2012-2013).
David M. Thomas (1949)
Year of Election or Appointment: 2008
Trustee
Co-Lead Independent Trustee
Mr. Thomas also serves as Trustee of other Fidelity® funds. Previously, Mr. Thomas served as Executive Chairman (2005-2006) and Chairman and Chief Executive Officer (2000-2005) of IMS Health, Inc. (pharmaceutical and healthcare information solutions). Mr. Thomas currently serves as Non-Executive Chairman of the Board of Fortune Brands Home and Security (home and security products, 2011-present), and a member of the Board (2004-present) and Presiding Director (2013-present) of Interpublic Group of Companies, Inc. (marketing communication).
Susan Tomasky (1953)
Year of Election or Appointment: 2020
Trustee
Ms. Tomasky also serves as Trustee of other Fidelity® funds. Prior to her retirement, Ms. Tomasky served in various executive officer positions at American Electric Power Company, Inc. (1998-2011), including most recently as President of AEP Transmission (2007-2011). Ms. Tomasky currently serves as a member of the Board and Sustainability Committee and as Chair of the Audit Committee of Marathon Petroleum Corporation (2018-present) and as a member of the Board, Corporate Governance Committee and Organization and Compensation Committee and as Chair of the Audit Committee of Public Service Enterprise Group, Inc. (utilities company, 2012-present). In addition, Ms. Tomasky currently serves as a member of the Board of the Columbus Regional Airport Authority (2007-present), as a member of the Board of the Royal Shakespeare Company – America (2009-present), as a member of the Board of the Columbus Association for the Performing Arts (2011-present) and as a member of the Board of Kenyon College (2016-present). Previously, Ms. Tomasky served as a Member of the Advisory Board of certain Fidelity® funds (2020), a member of the Board (2011-2019) and as Lead Independent Director (2015-2018) of Andeavor Corporation (previously Tesoro Corporation) (independent oil refiner and marketer) and as a member of the Board of Summit Midstream Partners LP (energy, 2012-2018).
Michael E. Wiley (1950)
Year of Election or Appointment: 2020
Trustee
Mr. Wiley also serves as Trustee of other Fidelity® funds. Previously, Mr. Wiley served as a member of the Advisory Board of certain Fidelity® funds (2018-2020), Chairman, President and CEO of Baker Hughes, Inc. (oilfield services, 2000-2004). Mr. Wiley also previously served as a member of the Board of Andeavor Corporation (independent oil refiner and marketer, 2005-2018), a member of the Board of Andeavor Logistics LP (natural resources logistics, 2015-2018) and a member of the Board of High Point Resources (exploration and production, 2005-2020).
+ The information includes the Trustee's principal occupation during the last five years and other information relating to the experience, attributes, and skills relevant to the Trustee's qualifications to serve as a Trustee, which led to the conclusion that the Trustee should serve as a Trustee for each fund.
Advisory Board Members and Officers:
Correspondence intended for a Member of the Advisory Board (if any) may be sent to Fidelity Investments, P.O. Box 55235, Boston, Massachusetts 02205-5235. Correspondence intended for an officer or Peter S. Lynch may be sent to Fidelity Investments, 245 Summer Street, Boston, Massachusetts 02210. Officers appear below in alphabetical order.
Name, Year of Birth; Principal Occupation
Lloyd James Austin, III (1953)
Year of Election or Appointment: 2020
Member of the Advisory Board
General Austin also serves as a Member of the Advisory Board of other Fidelity® funds. Prior to his retirement, General Austin (United States Army, Retired) held a variety of positions within the U.S. Government, including Commander, U.S. Central Command (2013-2016), Vice Chief of Staff, U.S. Army (2012-2013) and Commanding General, U.S. Forces – Iraq, Operation New Dawn (2010-2012). General Austin currently serves as a Partner of Pine Island Capital Partners (private equity, 2020-present) and as President of the Austin Strategy Group LLC (consulting, 2016-present). General Austin serves as a member of the Board of Directors of Nucor Corporation (steel products, 2017-present), as a member of the Board of Directors of Tenet Healthcare Corporation (2018-present) and as a member of the Board of Directors of Raytheon Technologies Corporation (aerospace and defense, 2020-present). In addition, General Austin currently serves as a member of the Board of Trustees of the Carnegie Corporation of New York (2017-present) and as a member of the Board of Trustees of Auburn University (2017-present). Previously, General Austin served as a member of the Board of Directors of United Technologies Corporation (aerospace, defense and building, 2016-2020).
Thomas A. Kennedy (1955)
Year of Election or Appointment: 2020
Member of the Advisory Board
Mr. Kennedy also serves as a Member of the Advisory Board of other Fidelity® funds. Previously, Mr. Kennedy held a variety of positions at Raytheon Company (aerospace and defense, 1983-2020), including Chairman and Chief Executive Officer (2014-2020) and Executive Vice President and Chief Operating Officer (2013-2014). Mr. Kennedy currently serves as Executive Chairman of the Board of Directors of Raytheon Technologies Corporation (aerospace and defense, 2020-present). He is also a member of the Rutgers School of Engineering Industry Advisory Board (2011-present) and a member of the UCLA Engineering Dean’s Executive Board (2016-present).
Peter S. Lynch (1944)
Year of Election or Appointment: 2003
Member of the Advisory Board
Mr. Lynch also serves as a Member of the Advisory Board of other Fidelity® funds. Mr. Lynch is Vice Chairman and a Director of Fidelity Management & Research Company LLC (investment adviser firm). In addition, Mr. Lynch serves as a Trustee of Boston College and as the Chairman of the Inner-City Scholarship Fund. Previously, Mr. Lynch served as Vice Chairman and a Director of FMR Co., Inc. (investment adviser firm) and on the Special Olympics International Board of Directors (1997-2006).
Elizabeth Paige Baumann (1968)
Year of Election or Appointment: 2017
Anti-Money Laundering (AML) Officer
Ms. Baumann also serves as AML Officer of other funds. She is Chief AML Officer (2012-present) and Senior Vice President (2014-present) of FMR LLC (diversified financial services company) and is an employee of Fidelity Investments. Previously, Ms. Baumann served as AML Officer of certain funds (2017-2019), as AML Officer of the funds (2012-2016), and Vice President (2007-2014) and Deputy Anti-Money Laundering Officer (2007-2012) of FMR LLC.
Craig S. Brown (1977)
Year of Election or Appointment: 2019
Assistant Treasurer
Mr. Brown also serves as Assistant Treasurer of other funds. Mr. Brown is an employee of Fidelity Investments (2013-present).
John J. Burke III (1964)
Year of Election or Appointment: 2018
Chief Financial Officer
Mr. Burke also serves as Chief Financial Officer of other funds. Mr. Burke serves as Head of Investment Operations for Fidelity Fund and Investment Operations (2018-present) and is an employee of Fidelity Investments (1998-present). Previously Mr. Burke served as head of Asset Management Investment Operations (2012-2018).
William C. Coffey (1969)
Year of Election or Appointment: 2019
Assistant Secretary
Mr. Coffey also serves as Assistant Secretary of other funds. He is Senior Vice President and Deputy General Counsel of FMR LLC (diversified financial services company, 2010-present), and is an employee of Fidelity Investments. Previously, Mr. Coffey served as Secretary and CLO of certain funds (2018-2019); CLO, Secretary, and Senior Vice President of Fidelity Management & Research Company and FMR Co., Inc. (investment adviser firms, 2018-2019); Secretary of Fidelity SelectCo, LLC and Fidelity Investments Money Management, Inc. (investment adviser firms, 2018-2019); CLO of Fidelity Management & Research (Hong Kong) Limited, FMR Investment Management (UK) Limited, and Fidelity Management & Research (Japan) Limited (investment adviser firms, 2018-2019); and Assistant Secretary of certain funds (2009-2018).
Timothy M. Cohen (1969)
Year of Election or Appointment: 2018
Vice President
Mr. Cohen also serves as Vice President of other funds. Mr. Cohen serves as Co-Head of Equity (2018-present), a Director of Fidelity Management & Research (Japan) Limited (investment adviser firm, 2016-present), and is an employee of Fidelity Investments. Previously, Mr. Cohen served as Executive Vice President of Fidelity SelectCo, LLC (2019), Head of Global Equity Research (2016-2018), Chief Investment Officer - Equity and a Director of Fidelity Management & Research (U.K.) Inc. (investment adviser firm, 2013-2015) and as a Director of Fidelity Management & Research (Hong Kong) Limited (investment adviser firm, 2017).
Jonathan Davis (1968)
Year of Election or Appointment: 2010
Assistant Treasurer
Mr. Davis also serves as Assistant Treasurer of other funds. Mr. Davis serves as Assistant Treasurer of FMR Capital, Inc. (2017-present) and is an employee of Fidelity Investments. Previously, Mr. Davis served as Vice President and Associate General Counsel of FMR LLC (diversified financial services company, 2003-2010).
Laura M. Del Prato (1964)
Year of Election or Appointment: 2018
Assistant Treasurer
Ms. Del Prato also serves as an officer of other funds. Ms. Del Prato is an employee of Fidelity Investments (2017-present). Previously, Ms. Del Prato served as President and Treasurer of The North Carolina Capital Management Trust: Cash Portfolio and Term Portfolio (2018-2020). Prior to joining Fidelity Investments, Ms. Del Prato served as a Managing Director and Treasurer of the JPMorgan Mutual Funds (2014-2017). Prior to JPMorgan, Ms. Del Prato served as a partner at Cohen Fund Audit Services (accounting firm, 2012-2013) and KPMG LLP (accounting firm, 2004-2012).
Colm A. Hogan (1973)
Year of Election or Appointment: 2020
Assistant Treasurer
Mr. Hogan also serves as an officer of other funds. Mr. Hogan serves as Assistant Treasurer of FMR Capital, Inc. (2017-present) and is an employee of Fidelity Investments (2005-present). Previously, Mr. Hogan served as Deputy Treasurer of certain Fidelity® funds (2016-2020) and Assistant Treasurer of certain Fidelity® funds (2016-2018).
Pamela R. Holding (1964)
Year of Election or Appointment: 2018
Vice President
Ms. Holding also serves as Vice President of other funds. Ms. Holding serves as Co-Head of Equity (2018-present) and is an employee of Fidelity Investments (2013-present). Previously, Ms. Holding served as Executive Vice President of Fidelity SelectCo, LLC (2019) and as Chief Investment Officer of Fidelity Institutional Asset Management (2013-2018).
Cynthia Lo Bessette (1969)
Year of Election or Appointment: 2019
Secretary and Chief Legal Officer (CLO)
Ms. Lo Bessette also serves as an officer of other funds. Ms. Lo Bessette serves as CLO, Secretary, and Senior Vice President of Fidelity Management & Research Company LLC (investment adviser firm, 2019-present); and CLO of Fidelity Management & Research (Hong Kong) Limited, FMR Investment Management (UK) Limited, and Fidelity Management & Research (Japan) Limited (investment adviser firms, 2019-present). She is a Senior Vice President and Deputy General Counsel of FMR LLC (diversified financial services company, 2019-present), and is an employee of Fidelity Investments. Previously, Ms. Lo Bessette served as CLO, Secretary, and Senior Vice President of FMR Co., Inc. (investment adviser firm, 2019); Secretary of Fidelity SelectCo, LLC and Fidelity Investments Money Management, Inc. (investment adviser firms, 2019). Prior to joining Fidelity Investments, Ms. Lo Bessette was Executive Vice President, General Counsel (2016-2019) and Senior Vice President, Deputy General Counsel (2015-2016) of OppenheimerFunds (investment management company) and Deputy Chief Legal Officer (2013-2015) of Jennison Associates LLC (investment adviser firm).
Chris Maher (1972)
Year of Election or Appointment: 2020
Deputy Treasurer
Mr. Maher also serves as an officer of other funds. Mr. Maher serves as Assistant Treasurer of FMR Capital, Inc. (2017-present), and is an employee of Fidelity Investments (2008-present). Previously, Mr. Maher served as Assistant Treasurer of certain funds (2013-2020); Vice President of Asset Management Compliance (2013), Vice President of the Program Management Group of FMR (investment adviser firm, 2010-2013), and Vice President of Valuation Oversight (2008-2010).
Jason P. Pogorelec (1975)
Year of Election or Appointment: 2020
Chief Compliance Officer
Mr. Pogorelec also serves as Chief Compliance Officer of other funds. Mr. Pogorelec is a senior Vice President of Asset Management Compliance for Fidelity Investments and is an employee of Fidelity Investments (2006-present). Previously, Mr. Pogorelec served as Vice President, Associate General Counsel for Fidelity Investments (2010-2020) and Assistant Secretary of certain Fidelity funds (2015-2020).
Stacie M. Smith (1974)
Year of Election or Appointment: 2016
President and Treasurer
Ms. Smith also serves as an officer of other funds. Ms. Smith serves as Assistant Treasurer of FMR Capital, Inc. (2017-present), is an employee of Fidelity Investments (2009-present), and has served in other fund officer roles. Prior to joining Fidelity Investments, Ms. Smith served as Senior Audit Manager of Ernst & Young LLP (accounting firm, 1996-2009). Previously, Ms. Smith served as Assistant Treasurer (2013-2019) and Deputy Treasurer (2013-2016) of certain Fidelity® funds.
Marc L. Spector (1972)
Year of Election or Appointment: 2016
Assistant Treasurer
Mr. Spector also serves as an officer of other funds. Mr. Spector serves as Assistant Treasurer of FMR Capital, Inc. (2017-present) and is an employee of Fidelity Investments (2016-present). Prior to joining Fidelity Investments, Mr. Spector served as Director at the Siegfried Group (accounting firm, 2013-2016), and prior to Siegfried Group as audit senior manager at Deloitte & Touche LLP (accounting firm, 2005-2013).
Jim Wegmann (1979)
Year of Election or Appointment: 2019
Assistant Treasurer
Mr. Wegmann also serves as Assistant Treasurer of other funds. Mr. Wegmann is an employee of Fidelity Investments (2011-present).
Shareholder Expense Example
As a shareholder, you incur two types of costs: (1) transaction costs, which may include sales charges (loads) on purchase payments or redemption proceeds, as applicable and (2) ongoing costs, which generally include management fees, distribution and/or service (12b-1) fees and other Fund expenses. This Example is intended to help you understand your ongoing costs (in dollars) of investing in a fund and to compare these costs with the ongoing costs of investing in other mutual funds.
The Example is based on an investment of $1,000 invested at the beginning of the period and held for the entire period (May 1, 2020 to October 31, 2020).
Actual Expenses
The first line of the accompanying table provides information about actual account values and actual expenses. You may use the information in this line, together with the amount you invested, to estimate the expenses that you paid over the period. Simply divide your account value by $1,000.00 (for example, an $8,600 account value divided by $1,000.00 = 8.6), then multiply the result by the number in the first line for a class/Fund under the heading entitled "Expenses Paid During Period" to estimate the expenses you paid on your account during this period. If any fund is a shareholder of any underlying mutual funds or exchange-traded funds (ETFs) (the Underlying Funds), such fund indirectly bears its proportional share of the expenses of the Underlying Funds in addition to the direct expenses incurred presented in the table. These fees and expenses are not included in the annualized expense ratio used to calculate the expense estimate in the table below.
Hypothetical Example for Comparison Purposes
The second line of the accompanying table provides information about hypothetical account values and hypothetical expenses based on the actual expense ratio and an assumed rate of return of 5% per year before expenses, which is not the actual return. The hypothetical account values and expenses may not be used to estimate the actual ending account balance or expenses you paid for the period. You may use this information to compare the ongoing costs of investing in the Fund and other funds. To do so, compare this 5% hypothetical example with the 5% hypothetical examples that appear in the shareholder reports of the other funds. If any fund is a shareholder of any Underlying Funds, such fund indirectly bears its proportional share of the expenses of the Underlying Funds in addition to the direct expenses as presented in the table. These fees and expenses are not included in the annualized expense ratio used to calculate the expense estimate in the table below.
Please note that the expenses shown in the table are meant to highlight your ongoing costs only and do not reflect any transaction costs. Therefore, the second line of the table is useful in comparing ongoing costs only, and will not help you determine the relative total costs of owning different funds. In addition, if these transactional costs were included, your costs would have been higher.
| | Annualized Expense Ratio-A | Beginning
Account Value
May 1, 2020 | Ending
Account Value
October 31, 2020 | Expenses Paid
During Period-B
May 1, 2020
to October 31, 2020 |
| Fidelity Emerging Markets Discovery Fund | | | | |
| Class A | 1.51% | | | |
| Actual | | $1,000.00 | $1,220.90 | $8.43 |
| Hypothetical-C | | $1,000.00 | $1,017.55 | $7.66 |
| Class M | 1.80% | | | |
| Actual | | $1,000.00 | $1,219.50 | $10.04 |
| Hypothetical-C | | $1,000.00 | $1,016.09 | $9.12 |
| Class C | 2.27% | | | |
| Actual | | $1,000.00 | $1,216.30 | $12.65 |
| Hypothetical-C | | $1,000.00 | $1,013.72 | $11.49 |
| Emerging Markets Discovery | 1.20% | | | |
| Actual | | $1,000.00 | $1,223.40 | $6.71 |
| Hypothetical-C | | $1,000.00 | $1,019.10 | $6.09 |
| Class I | 1.19% | | | |
| Actual | | $1,000.00 | $1,223.70 | $6.65 |
| Hypothetical-C | | $1,000.00 | $1,019.15 | $6.04 |
| Class Z | 1.05% | | | |
| Actual | | $1,000.00 | $1,224.10 | $5.87 |
| Hypothetical-C | | $1,000.00 | $1,019.86 | $5.33 |
| Fidelity Total Emerging Markets Fund | | | | |
| Class A | 1.39% | | | |
| Actual | | $1,000.00 | $1,264.90 | $7.91 |
| Hypothetical-C | | $1,000.00 | $1,018.15 | $7.05 |
| Class M | 1.70% | | | |
| Actual | | $1,000.00 | $1,230.20 | $9.53 |
| Hypothetical-C | | $1,000.00 | $1,016.59 | $8.62 |
| Class C | 2.13% | | | |
| Actual | | $1,000.00 | $1,229.10 | $11.93 |
| Hypothetical-C | | $1,000.00 | $1,014.43 | $10.79 |
| Total Emerging Markets | 1.15% | | | |
| Actual | | $1,000.00 | $1,234.30 | $6.46 |
| Hypothetical-C | | $1,000.00 | $1,019.36 | $5.84 |
| Class I | 1.09% | | | |
| Actual | | $1,000.00 | $1,234.80 | $6.12 |
| Hypothetical-C | | $1,000.00 | $1,019.66 | $5.53 |
| Class Z | .97% | | | |
| Actual | | $1,000.00 | $1,235.20 | $5.45 |
| Hypothetical-C | | $1,000.00 | $1,020.26 | $4.93 |
A Annualized expense ratio reflects expenses net of applicable fee waivers.
B Expenses are equal to the annualized expense ratio, multiplied by the average account value over the period, multiplied by 184/ 366 (to reflect the one-half year period). The fees and expenses of any Underlying Funds are not included in each annualized expense ratio.
C 5% return per year before expenses
Distributions (Unaudited)
A percentage of the dividends distributed during the fiscal year for the following funds may be taken into account as a dividend for purposes of the maximum rate under section 1(h)(11) of the Internal Revenue Code:
| | Class A | Class M | Class C | Retail Class | Class I | Class Z |
| Fidelity Emerging Markets Discovery Fund | | | | | | |
| December 13, 2019 | 100% | 100% | - | 100% | 100% | 100% |
| Fidelity Total Emerging Markets Fund | | | | | | |
| December 13, 2019 | 46% | 52% | 63% | 42% | 42% | 40% |
|
The amounts per share which represent income derived from sources within, and taxes paid to, foreign countries or possessions of the United States are as follows:
| | Pay Date | Income | Taxes |
| Fidelity Emerging Markets Discovery Fund | | | |
| Class A | 12/16/19 | $0.1404 | $0.0334 |
| Class M | 12/16/19 | $0.1024 | $0.0334 |
| Class C | 12/16/19 | $0.0000 | $0.0000 |
| Emerging Markets Discovery | 12/16/19 | $0.1854 | $0.0334 |
| Class I | 12/16/19 | $0.1864 | $0.0334 |
| Class Z | 12/16/19 | $0.2094 | $0.0334 |
| Fidelity Total Emerging Markets Fund | | | |
| Class A | 12/16/19 | $0.3561 | $0.0241 |
| Class M | 12/16/19 | $0.3171 | $0.0241 |
| Class C | 12/16/19 | $0.2581 | $0.0241 |
| Total Emerging Markets | 12/16/19 | $0.3891 | $0.0241 |
| Class I | 12/16/19 | $0.3951 | $0.0241 |
| Class Z | 12/16/19 | $0.4141 | $0.0241 |
|
The funds will notify shareholders in January 2021 of amounts for use in preparing 2020 income tax returns.
Proxy Voting Results
A special meeting of shareholders was held on June 9, 2020. The results of votes taken among shareholders on the proposals before them are reported below. Each vote reported represents one dollar of net asset value held on the record date for the meeting.
PROPOSAL 1
To elect a Board of Trustees.
| | # of
Votes | % of
Votes |
| Dennis J. Dirks |
| Affirmative | 91,643,443,973.030 | 98.167 |
| Withheld | 1,711,119,384.419 | 1.833 |
| TOTAL | 93,354,563,357.449 | 100.000 |
| Donald F. Donahue |
| Affirmative | 91,659,003,496.045 | 98.184 |
| Withheld | 1,695,559,852.789 | 1.816 |
| TOTAL | 93,354,563,357.449 | 100.000 |
| Bettina Doulton |
| Affirmative | 91,774,146,516.145 | 98.307 |
| Withheld | 1,580,416,862.377 | 1.693 |
| TOTAL | 93,354,563,357.449 | 100.000 |
| Vicki L. Fuller |
| Affirmative | 91,845,419,368.993 | 98.383 |
| Withheld | 1,509,143,998.591 | 1.617 |
| TOTAL | 93,354,563,357.449 | 100.00 |
| Patricia L. Kampling |
| Affirmative | 91,723,732,274.457 | 98.253 |
| Withheld | 1,630,831,098.411 | 1.747 |
| TOTAL | 93,354,563,357.449 | 100.000 |
| Alan J. Lacy |
| Affirmative | 91,490,319,407.772 | 98.003 |
| Withheld | 1,864,243,948.299 | 1.997 |
| TOTAL | 93,354,563,357.449 | 100.000 |
| Ned C. Lautenbach |
| Affirmative | 91,285,367,239.075 | 97.784 |
| Withheld | 2,069,196,119.052 | 2.216 |
| TOTAL | 93,354,563,357.449 | 100.000 |
| Robert A. Lawrence |
| Affirmative | 91,556,271,429.466 | 98.074 |
| Withheld | 1,798,291,912.707 | 1.926 |
| TOTAL | 93,354,563,357.449 | 100.000 |
| Joseph Mauriello |
| Affirmative | 91,497,480,147.082 | 98.011 |
| Withheld | 1,857,083,211.045 | 1.989 |
| TOTAL | 93,354,563,357.449 | 100.000 |
| Cornelia M. Small |
| Affirmative | 91,606,808,161.438 | 98.128 |
| Withheld | 1,747,755,220.497 | 1.872 |
| TOTAL | 93,354,563,357.449 | 100.000 |
| Garnett A. Smith |
| Affirmative | 91,505,784,053.038 | 98.020 |
| Withheld | 1,848,779,305.090 | 1.980 |
| TOTAL | 93,354,563,357.449 | 100.000 |
| David M. Thomas |
| Affirmative | 91,536,969,704.881 | 98.053 |
| Withheld | 1,817,593,630.919 | 1.947 |
| TOTAL | 93,354,563,357.449 | 100.000 |
| Susan Tomasky |
| Affirmative | 91,697,125,678.165 | 98.225 |
| Withheld | 1,657,437,703.277 | 1.775 |
| TOTAL | 93,354,563,357.449 | 100.000 |
| Michael E. Wiley |
| Affirmative | 91,506,805,575.815 | 98.021 |
| Withheld | 1,847,757,759.985 | 1.979 |
| TOTAL | 93,354,563,357.449 | 100.000 |
PROPOSAL 2
For Fidelity Emerging Markets Discovery Fund, to convert a fundamental investment policy to a non-fundamental investment policy.
| | # of
Votes | % of
Votes |
| Affirmative | 94,656,308.119 | 62.760 |
| Against | 20,895,199.421 | 13.854 |
| Abstain | 8,884,365.050 | 5.891 |
| Broker Non-Vote | 26,386,512.873 | 17.495 |
| TOTAL | 150,822,385.463 | 100.000 |
For Fidelity Total Emerging Markets Fund, to convert a fundamental investment policy to a non-fundamental investment policy.
| | # of
Votes | % of
Votes |
| Affirmative | 141,096,887.525 | 35.053 |
| Against | 61,496,144.359 | 15.278 |
| Abstain | 19,669,815.375 | 4.887 |
| Broker Non-Vote | 180,256,282.740 | 44.782 |
| TOTAL | 402,519,129.999 | 100.000 |
| Proposal 1 reflects trust wide proposal and voting results. |
| Proposal 2 was not approved by shareholders. |
EMD-TEK-ANN-1220
1.931237.108
Fidelity® Global Equity Income Fund
Annual Report
October 31, 2020
See the inside front cover for important information about access to your fund’s shareholder reports.
Beginning on January 1, 2021, as permitted by regulations adopted by the Securities and Exchange Commission, paper copies of a fund’s shareholder reports will no longer be sent by mail, unless you specifically request paper copies of the reports from the fund or from your financial intermediary, such as a financial advisor, broker-dealer or bank. Instead, the reports will be made available on a website, and you will be notified by mail each time a report is posted and provided with a website link to access the report.
If you already elected to receive shareholder reports electronically, you will not be affected by this change and you need not take any action. You may elect to receive shareholder reports and other communications from a fund electronically, by contacting your financial intermediary. For Fidelity customers, visit Fidelity's web site or call Fidelity using the contact information listed below.
You may elect to receive all future reports in paper free of charge. If you wish to continue receiving paper copies of your shareholder reports, you may contact your financial intermediary or, if you are a Fidelity customer, visit Fidelity’s website, or call Fidelity at the applicable toll-free number listed below. Your election to receive reports in paper will apply to all funds held with the fund complex/your financial intermediary.
| Account Type | Website | Phone Number |
| Brokerage, Mutual Fund, or Annuity Contracts: | fidelity.com/mailpreferences | 1-800-343-3548 |
| Employer Provided Retirement Accounts: | netbenefits.fidelity.com/preferences (choose 'no' under Required Disclosures to continue to print) | 1-800-343-0860 |
| Advisor Sold Accounts Serviced Through Your Financial Intermediary: | Contact Your Financial Intermediary | Your Financial Intermediary's phone number |
| Advisor Sold Accounts Serviced by Fidelity: | institutional.fidelity.com | 1-877-208-0098 |
Contents
To view a fund's proxy voting guidelines and proxy voting record for the 12-month period ended June 30, visit http://www.fidelity.com/proxyvotingresults or visit the Securities and Exchange Commission's (SEC) web site at http://www.sec.gov.
You may also call 1-800-544-8544 to request a free copy of the proxy voting guidelines.
Standard & Poor's, S&P and S&P 500 are registered service marks of The McGraw-Hill Companies, Inc. and have been licensed for use by Fidelity Distributors Corporation.
Other third-party marks appearing herein are the property of their respective owners.
All other marks appearing herein are registered or unregistered trademarks or service marks of FMR LLC or an affiliated company. © 2020 FMR LLC. All rights reserved.
This report and the financial statements contained herein are submitted for the general information of the shareholders of the Fund. This report is not authorized for distribution to prospective investors in the Fund unless preceded or accompanied by an effective prospectus.
A fund files its complete schedule of portfolio holdings with the SEC for the first and third quarters of each fiscal year on Form N-PORT. Forms N-PORT are available on the SEC’s web site at http://www.sec.gov. A fund's Forms N-PORT may be reviewed and copied at the SEC’s Public Reference Room in Washington, DC. Information regarding the operation of the SEC's Public Reference Room may be obtained by calling 1-800-SEC-0330.
For a complete list of a fund's portfolio holdings, view the most recent holdings listing, semiannual report, or annual report on Fidelity's web site at http://www.fidelity.com, http://www.institutional.fidelity.com, or http://www.401k.com, as applicable.
NOT FDIC INSURED •MAY LOSE VALUE •NO BANK GUARANTEE
Neither the Fund nor Fidelity Distributors Corporation is a bank.
Note to Shareholders:
Early in 2020, the outbreak and spread of a new coronavirus emerged as a public health emergency that had a major influence on financial markets, primarily based on its impact on the global economy and the outlook for corporate earnings. The virus causes a respiratory disease known as COVID-19. On March 11, the World Health Organization declared the COVID-19 outbreak a pandemic, citing sustained risk of further global spread.
In the weeks following, as the crisis worsened, we witnessed an escalating human tragedy with wide-scale social and economic consequences from coronavirus-containment measures. The outbreak of COVID-19 prompted a number of measures to limit the spread, including travel and border restrictions, quarantines, and restrictions on large gatherings. In turn, these resulted in lower consumer activity, diminished demand for a wide range of products and services, disruption in manufacturing and supply chains, and – given the wide variability in outcomes regarding the outbreak – significant market uncertainty and volatility. Amid the turmoil, global governments and central banks took unprecedented action to help support consumers, businesses, and the broader economies, and to limit disruption to financial systems.
The situation continues to unfold, and the extent and duration of its impact on financial markets and the economy remain highly uncertain. Extreme events such as the coronavirus crisis are “exogenous shocks” that can have significant adverse effects on mutual funds and their investments. Although multiple asset classes may be affected by market disruption, the duration and impact may not be the same for all types of assets.
Fidelity is committed to helping you stay informed amid news about COVID-19 and during increased market volatility, and we’re taking extra steps to be responsive to customer needs. We encourage you to visit our websites, where we offer ongoing updates, commentary, and analysis on the markets and our funds.
Performance: The Bottom Line
Average annual total return reflects the change in the value of an investment, assuming reinvestment of distributions from dividend income and capital gains (the profits earned upon the sale of securities that have grown in value, if any) and assuming a constant rate of performance each year. The hypothetical investment and the average annual total returns do not reflect the deduction of taxes that a shareholder would pay on fund distributions or the redemption of fund shares. During periods of reimbursement by Fidelity, a fund’s total return will be greater than it would be had the reimbursement not occurred. How a fund did yesterday is no guarantee of how it will do tomorrow.
Average Annual Total Returns
| For the periods ended October 31, 2020 | Past 1 year | Past 5 years | Life of fundA |
| Fidelity® Global Equity Income Fund | 4.44% | 7.43% | 8.72% |
A From May 2, 2012
$10,000 Over Life of Fund
Let's say hypothetically that $10,000 was invested in Fidelity® Global Equity Income Fund on May 2, 2012, when the fund started.
The chart shows how the value of your investment would have changed, and also shows how the MSCI ACWI (All Country World Index) Index performed over the same period.
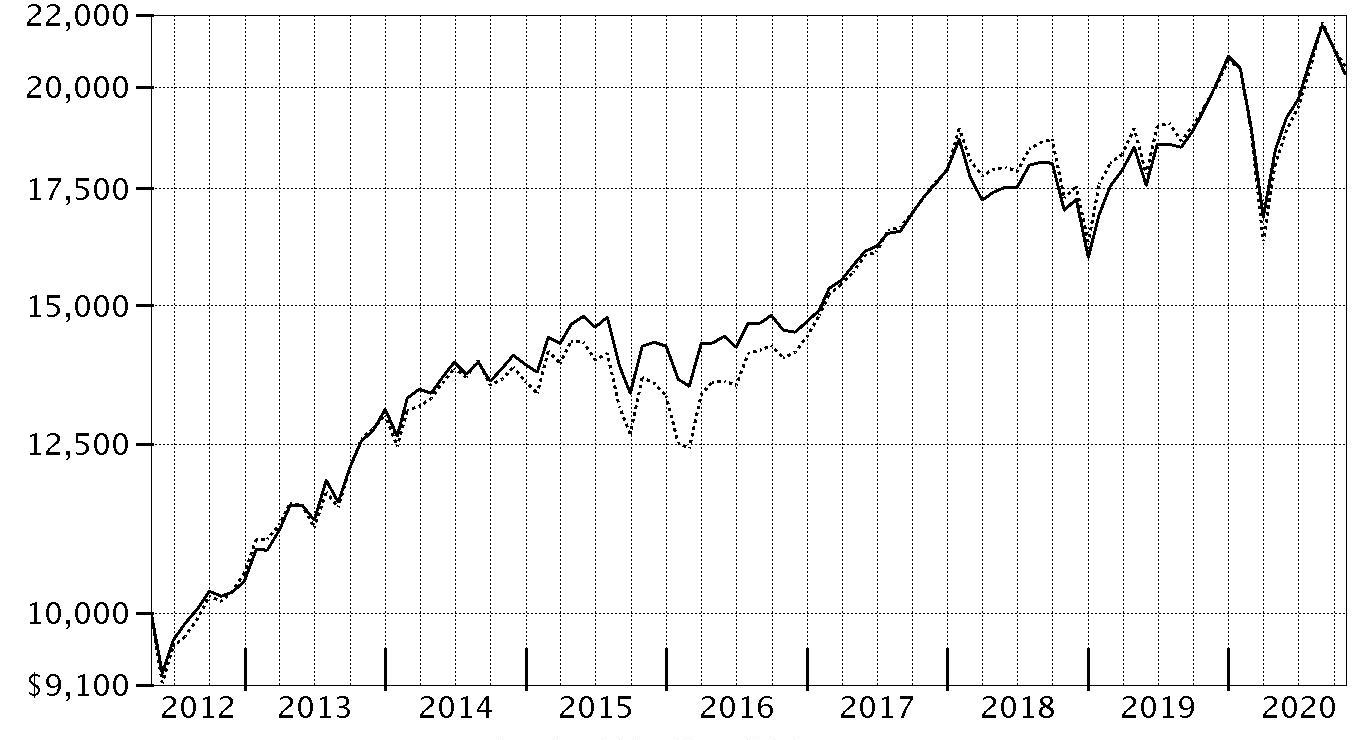
| Period Ending Values |
| $20,352 | Fidelity® Global Equity Income Fund |
| $20,576 | MSCI ACWI (All Country World Index) Index |
Management's Discussion of Fund Performance
Market Recap: The MSCI ACWI (All Country World Index) Index gained 5.29% for the year ending October 31, 2020, a volatile period for global equities, marked by a steep but brief decline due to the early-2020 outbreak and spread of the coronavirus, followed by a historic rebound. Declared a pandemic in March, the COVID-19 crisis caused broad contraction in economic activity, along with elevated uncertainty and dislocation in financial markets. A historically rapid and expansive monetary/fiscal-policy response partially offset the economic disruption and fueled a sharp uptrend from March 24 into September. Other supporting factors included resilient corporate earnings and near-term potential for a COVID-19 vaccine breakthrough. Currency fluctuation generally supported global equities for the year. Late in the period, markets digested the inability of the U.S. Congress to reach a deal on additional fiscal stimulus, U.S. election uncertainty and a second wave of COVID-19 cases. By region for the full period, the U.S. (+12%), which represented 57% of the index, on average, led the way, followed by emerging markets (+9%). In contrast, the following regions lagged: U.K. (-22%), Asia-Pacific ex Japan (-8%), Canada (-5%) and Europe ex U.K. (-4%). Among sectors, information technology (+33%), consumer discretionary (+24%) and communication services (+16%) stood out. Conversely, energy (-42%), financials (-18%) and real estate (-15%) trailed the index.
Comments from Portfolio Manager Ramona Persaud: For the fiscal year ending October 31, 2020, the fund gained 4.44%, underperforming the 5.29% result of the benchmark MSCI All Country World Index (Net MA). From a regional standpoint, stock picks in the U.S. and an overweighting in the U.K. hindered the fund's relative result. By sector, the primary detractor from performance versus the benchmark were stock picks and underweighting in consumer discretionary. Stock picking and an underweighting in the communication services sector, especially within the media & entertainment industry, also hampered performance. Also detracting from performance was an overweighting in energy. Not owning Amazon.com, a benchmark component that gained 71%, was the largest individual relative detractor. Another notable relative detractor was an outsized stake in Wells Fargo (-57%). Another notable relative detractor was our outsized stake in Compass Group (-42%), a position we established this period. Conversely, stock picks in the U.K. and Europe ex U.K. contributed most to the fund's relative result. By sector, the primary contributor to performance versus the benchmark was our stock picks in consumer staples. Strong picks in the industrials sector, especially within the transportation industry, also boosted the fund's relative result. Also bolstering the fund's relative performance was security selection in energy. The biggest individual relative contributor was an overweight position in Apple (+77%). Apple was among our biggest holdings. Also bolstering performance was our overweighting in Microsoft, which gained roughly 44%. Microsoft was among the fund's largest holdings. Another top relative contributor was an out-of-benchmark stake in B&M European Value Retail (+39%). This was among the biggest holdings at period end.
The views expressed above reflect those of the portfolio manager(s) only through the end of the period as stated on the cover of this report and do not necessarily represent the views of Fidelity or any other person in the Fidelity organization. Any such views are subject to change at any time based upon market or other conditions and Fidelity disclaims any responsibility to update such views. These views may not be relied on as investment advice and, because investment decisions for a Fidelity fund are based on numerous factors, may not be relied on as an indication of trading intent on behalf of any Fidelity fund.
Investment Summary (Unaudited)
Geographic Diversification (% of fund's net assets)
| As of October 31, 2020 |
| | United States of America* | 53.8% |
| | United Kingdom | 7.0% |
| | Japan | 6.5% |
| | Switzerland | 4.7% |
| | Canada | 2.9% |
| | France | 2.9% |
| | India | 2.6% |
| | Taiwan | 2.3% |
| | Germany | 2.2% |
| | Other | 15.1% |

* Includes Short-Term investments and Net Other Assets (Liabilities).
Percentages are based on country or territory of incorporation and are adjusted for the effect of futures contracts, if applicable.
Asset Allocation as of October 31, 2020
| | % of fund's net assets |
| Stocks | 98.6 |
| Short-Term Investments and Net Other Assets (Liabilities) | 1.4 |
Top Ten Stocks as of October 31, 2020
| | % of fund's net assets |
| Apple, Inc. (United States of America, Technology Hardware, Storage & Peripherals) | 5.8 |
| Microsoft Corp. (United States of America, Software) | 4.8 |
| Taiwan Semiconductor Manufacturing Co. Ltd. (Taiwan, Semiconductors & Semiconductor Equipment) | 1.9 |
| Hoya Corp. (Japan, Health Care Equipment & Supplies) | 1.8 |
| B&M European Value Retail SA (Luxembourg, Multiline Retail) | 1.7 |
| Lowe's Companies, Inc. (United States of America, Specialty Retail) | 1.7 |
| Roche Holding AG (participation certificate) (Switzerland, Pharmaceuticals) | 1.7 |
| American Tower Corp. (United States of America, Equity Real Estate Investment Trusts (REITs)) | 1.5 |
| Samsung Electronics Co. Ltd. (Korea (South), Technology Hardware, Storage & Peripherals) | 1.5 |
| Amgen, Inc. (United States of America, Biotechnology) | 1.5 |
| | 23.9 |
Top Market Sectors as of October 31, 2020
| | % of fund's net assets |
| Information Technology | 23.2 |
| Health Care | 15.6 |
| Consumer Staples | 11.7 |
| Financials | 11.0 |
| Industrials | 10.2 |
| Consumer Discretionary | 10.1 |
| Communication Services | 6.1 |
| Energy | 3.5 |
| Utilities | 3.0 |
| Materials | 2.5 |
Schedule of Investments October 31, 2020
Showing Percentage of Net Assets
| Common Stocks - 98.6% | | | |
| | | Shares | Value |
| Australia - 0.6% | | | |
| Ansell Ltd. | | 13,280 | $375,520 |
| Bailiwick of Guernsey - 0.2% | | | |
| Amdocs Ltd. | | 2,680 | 151,098 |
| Bailiwick of Jersey - 0.4% | | | |
| Clarivate Analytics PLC (a) | | 8,700 | 241,425 |
| Belgium - 0.3% | | | |
| KBC Groep NV | | 3,998 | 197,100 |
| Bermuda - 0.6% | | | |
| Hiscox Ltd. (a) | | 9,479 | 101,237 |
| IHS Markit Ltd. | | 4,057 | 328,090 |
|
| TOTAL BERMUDA | | | 429,327 |
|
| Brazil - 0.3% | | | |
| Equatorial Energia SA | | 40,480 | 140,602 |
| Suzano Papel e Celulose SA (a) | | 9,500 | 82,865 |
|
| TOTAL BRAZIL | | | 223,467 |
|
| Canada - 2.9% | | | |
| Alimentation Couche-Tard, Inc. Class B (sub. vtg.) | | 14,111 | 434,568 |
| Constellation Software, Inc. | | 698 | 732,730 |
| Imperial Oil Ltd. | | 16,944 | 225,360 |
| Open Text Corp. | | 9,000 | 330,669 |
| Suncor Energy, Inc. | | 11,200 | 126,350 |
| Waste Connection, Inc. (Canada) | | 1,133 | 112,305 |
|
| TOTAL CANADA | | | 1,961,982 |
|
| Cayman Islands - 1.3% | | | |
| HKBN Ltd. | | 96,000 | 165,438 |
| SITC International Holdings Co. Ltd. | | 447,994 | 691,133 |
|
| TOTAL CAYMAN ISLANDS | | | 856,571 |
|
| China - 0.7% | | | |
| Kweichow Moutai Co. Ltd. (A Shares) | | 1,515 | 378,943 |
| Qingdao Port International Co. Ltd. (H Shares) (b) | | 159,000 | 90,242 |
|
| TOTAL CHINA | | | 469,185 |
|
| Denmark - 0.7% | | | |
| A.P. Moller - Maersk A/S Series B | | 100 | 160,263 |
| DSV Panalpina A/S | | 1,700 | 275,266 |
|
| TOTAL DENMARK | | | 435,529 |
|
| France - 2.9% | | | |
| Capgemini SA | | 2,502 | 288,889 |
| Elior SA (b) | | 26,483 | 99,809 |
| LVMH Moet Hennessy Louis Vuitton SE | | 866 | 405,935 |
| Sanofi SA | | 5,906 | 533,273 |
| SR Teleperformance SA | | 1,078 | 323,540 |
| VINCI SA | | 3,701 | 292,324 |
|
| TOTAL FRANCE | | | 1,943,770 |
|
| Germany - 2.2% | | | |
| Deutsche Post AG | | 9,100 | 403,160 |
| Hannover Reuck SE | | 1,030 | 149,589 |
| Linde PLC | | 1,638 | 359,029 |
| SAP SE | | 2,816 | 300,424 |
| Siemens AG | | 2,100 | 246,289 |
|
| TOTAL GERMANY | | | 1,458,491 |
|
| Hong Kong - 0.8% | | | |
| AIA Group Ltd. | | 53,820 | 512,214 |
| India - 2.6% | | | |
| HDFC Asset Management Co. Ltd. (b) | | 3,200 | 96,532 |
| HDFC Bank Ltd. sponsored ADR (a) | | 3,078 | 176,800 |
| Petronet LNG Ltd. | | 81,600 | 252,684 |
| Redington India Ltd. | | 113,600 | 197,754 |
| Reliance Industries Ltd. | | 1,828 | 28,959 |
| Reliance Industries Ltd. | | 27,428 | 755,922 |
| Tech Mahindra Ltd. | | 17,300 | 189,360 |
|
| TOTAL INDIA | | | 1,698,011 |
|
| Ireland - 1.6% | | | |
| Accenture PLC Class A | | 3,160 | 685,436 |
| Linde PLC | | 1,600 | 352,544 |
|
| TOTAL IRELAND | | | 1,037,980 |
|
| Italy - 1.0% | | | |
| Recordati SpA | | 6,200 | 321,255 |
| Reply SpA | | 3,300 | 354,741 |
|
| TOTAL ITALY | | | 675,996 |
|
| Japan - 6.5% | | | |
| Arata Corp. | | 2,700 | 131,213 |
| Astellas Pharma, Inc. | | 18,600 | 255,061 |
| Aucnet, Inc. | | 6,140 | 81,627 |
| Daiichikosho Co. Ltd. | | 11,037 | 377,653 |
| Daiwa Industries Ltd. | | 15,000 | 134,689 |
| Hoya Corp. | | 10,901 | 1,230,253 |
| Inaba Denki Sangyo Co. Ltd. | | 12,506 | 301,063 |
| Jm Holdings Co. Ltd. | | 16,453 | 374,244 |
| Kenedix, Inc. | | 21,000 | 108,824 |
| Minebea Mitsumi, Inc. | | 10,937 | 197,537 |
| Sony Corp. | | 10,699 | 891,938 |
| Tsuruha Holdings, Inc. | | 1,811 | 253,585 |
|
| TOTAL JAPAN | | | 4,337,687 |
|
| Kenya - 0.5% | | | |
| Safaricom Ltd. | | 1,225,183 | 347,398 |
| Korea (South) - 1.5% | | | |
| Samsung Electronics Co. Ltd. | | 19,939 | 1,000,047 |
| Luxembourg - 1.7% | | | |
| B&M European Value Retail SA | | 185,274 | 1,163,629 |
| Multi-National - 0.4% | | | |
| HKT Trust/HKT Ltd. unit | | 194,153 | 250,940 |
| Netherlands - 1.2% | | | |
| Koninklijke Philips Electronics NV | | 4,999 | 231,538 |
| NXP Semiconductors NV | | 3,985 | 538,453 |
|
| TOTAL NETHERLANDS | | | 769,991 |
|
| New Zealand - 0.1% | | | |
| Auckland International Airport Ltd. | | 16,700 | 77,252 |
| Poland - 0.4% | | | |
| CD Projekt RED SA (a) | | 3,400 | 288,072 |
| Sweden - 0.8% | | | |
| Ericsson (B Shares) | | 34,600 | 386,292 |
| Indutrade AB (a) | | 3,146 | 159,591 |
|
| TOTAL SWEDEN | | | 545,883 |
|
| Switzerland - 4.7% | | | |
| Barry Callebaut AG | | 53 | 109,416 |
| Chubb Ltd. | | 3,403 | 442,084 |
| Nestle SA (Reg. S) | | 7,174 | 806,917 |
| Roche Holding AG (participation certificate) | | 3,453 | 1,109,558 |
| Siemens Energy AG (a) | | 1,050 | 22,990 |
| Sika AG | | 2,190 | 539,051 |
| Swiss Re Ltd. | | 1,620 | 116,145 |
|
| TOTAL SWITZERLAND | | | 3,146,161 |
|
| Taiwan - 2.3% | | | |
| Poya International Co. Ltd. | | 11,000 | 236,849 |
| Taiwan Semiconductor Manufacturing Co. Ltd. | | 83,840 | 1,268,228 |
|
| TOTAL TAIWAN | | | 1,505,077 |
|
| United Kingdom - 7.0% | | | |
| AstraZeneca PLC (United Kingdom) | | 5,218 | 523,916 |
| BP PLC | | 86,182 | 219,823 |
| Compass Group PLC | | 43,242 | 591,886 |
| Cranswick PLC | | 7,806 | 325,426 |
| Diageo PLC | | 7,972 | 257,638 |
| Hilton Food Group PLC | | 55,974 | 841,166 |
| Informa PLC(a) | | 38,600 | 209,026 |
| John David Group PLC | | 24,500 | 235,255 |
| London Stock Exchange Group PLC | | 3,862 | 416,316 |
| Reckitt Benckiser Group PLC | | 4,430 | 390,232 |
| RELX PLC (London Stock Exchange) | | 23,799 | 470,953 |
| St. James's Place Capital PLC | | 11,208 | 130,564 |
| WH Smith PLC | | 4,900 | 63,289 |
|
| TOTAL UNITED KINGDOM | | | 4,675,490 |
|
| United States of America - 52.4% | | | |
| AbbVie, Inc. | | 6,436 | 547,704 |
| Activision Blizzard, Inc. | | 3,300 | 249,909 |
| Ameren Corp. | | 6,328 | 513,327 |
| American Tower Corp. | | 4,457 | 1,023,550 |
| AMETEK, Inc. | | 4,197 | 412,145 |
| Amgen, Inc. | | 4,595 | 996,839 |
| Apple, Inc. | | 35,616 | 3,877,159 |
| AstraZeneca PLC sponsored ADR | | 15,382 | 771,561 |
| Bank of America Corp. | | 24,727 | 586,030 |
| Becton, Dickinson & Co. | | 1,124 | 259,790 |
| BJ's Wholesale Club Holdings, Inc. (a) | | 7,100 | 271,859 |
| BlackRock, Inc. Class A | | 400 | 239,684 |
| Bristol-Myers Squibb Co. | | 15,250 | 891,363 |
| Capital One Financial Corp. | | 7,351 | 537,211 |
| Charter Communications, Inc. Class A (a) | | 573 | 345,989 |
| Chevron Corp. | | 6,024 | 418,668 |
| Cisco Systems, Inc. | | 10,400 | 373,360 |
| Citigroup, Inc. | | 11,313 | 468,584 |
| Columbia Sportswear Co. | | 2,000 | 149,180 |
| ConocoPhillips Co. | | 8,197 | 234,598 |
| Costco Wholesale Corp. | | 1,200 | 429,144 |
| Crown Holdings, Inc. (a) | | 2,100 | 180,180 |
| Danaher Corp. | | 2,498 | 573,391 |
| Dollar Tree, Inc. (a) | | 2,400 | 216,768 |
| Dunkin' Brands Group, Inc. | | 2,300 | 229,333 |
| Eli Lilly & Co. | | 5,879 | 766,974 |
| Equifax, Inc. | | 1,080 | 147,528 |
| Estee Lauder Companies, Inc. Class A | | 1,200 | 263,592 |
| Fidelity National Information Services, Inc. | | 2,100 | 261,639 |
| Fortive Corp. | | 3,551 | 218,742 |
| General Dynamics Corp. | | 1,782 | 234,030 |
| General Electric Co. | | 38,533 | 285,915 |
| JPMorgan Chase & Co. | | 7,649 | 749,908 |
| Kroger Co. | | 12,403 | 399,501 |
| Lennar Corp. Class A | | 3,800 | 266,874 |
| Lowe's Companies, Inc. | | 7,268 | 1,149,071 |
| M&T Bank Corp. | | 2,822 | 292,303 |
| Marsh & McLennan Companies, Inc. | | 2,033 | 210,334 |
| McCormick & Co., Inc. (non-vtg.) | | 569 | 102,710 |
| Microsoft Corp. | | 15,707 | 3,180,196 |
| MSCI, Inc. | | 1,151 | 402,666 |
| NextEra Energy, Inc. | | 7,872 | 576,309 |
| Northrop Grumman Corp. | | 899 | 260,548 |
| NRG Energy, Inc. | | 6,803 | 215,111 |
| PepsiCo, Inc. | | 4,411 | 587,942 |
| PG&E Corp. (a) | | 6,800 | 65,008 |
| Phillips 66 Co. | | 1,743 | 81,328 |
| Qualcomm, Inc. | | 3,837 | 473,332 |
| Raymond James Financial, Inc. | | 2,200 | 168,168 |
| Roper Technologies, Inc. | | 939 | 348,688 |
| Royalty Pharma PLC | | 1,200 | 44,040 |
| S&P Global, Inc. | | 1,406 | 453,758 |
| Stanley Black & Decker, Inc. | | 900 | 149,580 |
| Starbucks Corp. | | 5,900 | 513,064 |
| Sysco Corp. | | 5,300 | 293,143 |
| T-Mobile U.S., Inc. | | 6,147 | 673,527 |
| Tapestry, Inc. | | 7,078 | 157,344 |
| The Coca-Cola Co. | | 9,200 | 442,152 |
| The Travelers Companies, Inc. | | 3,761 | 453,990 |
| The Walt Disney Co. | | 4,666 | 565,753 |
| TJX Companies, Inc. | | 4,900 | 248,920 |
| United Parcel Service, Inc. Class B | | 1,600 | 251,376 |
| UnitedHealth Group, Inc. | | 2,815 | 858,969 |
| Valero Energy Corp. | | 1,735 | 66,988 |
| Verizon Communications, Inc. | | 10,054 | 572,977 |
| Visa, Inc. Class A | | 4,326 | 786,077 |
| Vistra Corp. | | 16,647 | 289,158 |
| Vontier Corp. (a) | | 1,420 | 40,811 |
| Walmart, Inc. | | 5,196 | 720,945 |
| Watsco, Inc. | | 500 | 112,070 |
| WEC Energy Group, Inc. | | 2,178 | 218,998 |
| Wells Fargo & Co. | | 19,438 | 416,945 |
| WestRock Co. | | 3,400 | 127,670 |
|
| TOTAL UNITED STATES OF AMERICA | | | 34,963,998 |
|
| TOTAL COMMON STOCKS | | | |
| (Cost $48,585,246) | | | 65,739,291 |
|
| Money Market Funds - 1.4% | | | |
| Fidelity Cash Central Fund 0.10% (c) | | | |
| (Cost $943,940) | | 943,756 | 943,944 |
| TOTAL INVESTMENT IN SECURITIES - 100.0% | | | |
| (Cost $49,529,186) | | | 66,683,235 |
| NET OTHER ASSETS (LIABILITIES) - 0.0% | | | 32,092 |
| NET ASSETS - 100% | | | $66,715,327 |
Categorizations in the Schedule of Investments are based on country or territory of incorporation.
Legend
(a) Non-income producing
(b) Security exempt from registration under Rule 144A of the Securities Act of 1933. These securities may be resold in transactions exempt from registration, normally to qualified institutional buyers. At the end of the period, the value of these securities amounted to $286,583 or 0.4% of net assets.
(c) Affiliated fund that is generally available only to investment companies and other accounts managed by Fidelity Investments. The rate quoted is the annualized seven-day yield of the fund at period end. A complete unaudited listing of the fund's holdings as of its most recent quarter end is available upon request. In addition, each Fidelity Central Fund's financial statements, which are not covered by the Fund's Report of Independent Registered Public Accounting Firm, are available on the SEC's website or upon request.
Affiliated Central Funds
Information regarding fiscal year to date income earned by the Fund from investments in Fidelity Central Funds is as follows:
| Fund | Income earned |
| Fidelity Cash Central Fund | $34,211 |
| Fidelity Securities Lending Cash Central Fund | 723 |
| Total | $34,934 |
Amounts in the income column in the above table include any capital gain distributions from underlying funds, which are presented in the corresponding line-item in the Statement of Operations, if applicable. Amount for Fidelity Securities Lending Cash Central Fund represents the income earned on investing cash collateral, less rebates paid to borrowers and any lending agent fees associated with the loan, plus any premium payments received for lending certain types of securities.
Investment Valuation
The following is a summary of the inputs used, as of October 31, 2020, involving the Fund's assets and liabilities carried at fair value. The inputs or methodology used for valuing securities may not be an indication of the risk associated with investing in those securities. For more information on valuation inputs, and their aggregation into the levels used below, please refer to the Investment Valuation section in the accompanying Notes to Financial Statements.
| | Valuation Inputs at Reporting Date: |
| Description | Total | Level 1 | Level 2 | Level 3 |
| Investments in Securities: | | | | |
| Equities: | | | | |
| Communication Services | $4,046,682 | $3,669,029 | $377,653 | $-- |
| Consumer Discretionary | 6,831,984 | 4,729,385 | 2,102,599 | -- |
| Consumer Staples | 7,683,123 | 5,221,564 | 2,461,559 | -- |
| Energy | 2,410,680 | 1,153,292 | 1,257,388 | -- |
| Financials | 7,318,162 | 6,293,100 | 1,025,062 | -- |
| Health Care | 10,291,005 | 6,031,886 | 4,259,119 | -- |
| Industrials | 6,948,734 | 5,785,606 | 1,163,128 | -- |
| Information Technology | 15,416,695 | 12,074,590 | 3,342,105 | -- |
| Materials | 1,641,339 | 1,641,339 | -- | -- |
| Real Estate | 1,132,374 | 1,023,550 | 108,824 | -- |
| Utilities | 2,018,513 | 2,018,513 | -- | -- |
| Money Market Funds | 943,944 | 943,944 | -- | -- |
| Total Investments in Securities: | $66,683,235 | $50,585,798 | $16,097,437 | $-- |
See accompanying notes which are an integral part of the financial statements.
Financial Statements
Statement of Assets and Liabilities
| | | October 31, 2020 |
| Assets | | |
Investment in securities, at value — See accompanying schedule:
Unaffiliated issuers (cost $48,585,246) | $65,739,291 | |
| Fidelity Central Funds (cost $943,940) | 943,944 | |
| Total Investment in Securities (cost $49,529,186) | | $66,683,235 |
| Foreign currency held at value (cost $9,291) | | 9,347 |
| Receivable for investments sold | | 13,731 |
| Receivable for fund shares sold | | 54,166 |
| Dividends receivable | | 200,462 |
| Distributions receivable from Fidelity Central Funds | | 94 |
| Prepaid expenses | | 120 |
| Other receivables | | 1,319 |
| Total assets | | 66,962,474 |
| Liabilities | | |
| Payable for fund shares redeemed | $127,492 | |
| Accrued management fee | 39,941 | |
| Other affiliated payables | 13,275 | |
| Other payables and accrued expenses | 66,439 | |
| Total liabilities | | 247,147 |
| Net Assets | | $66,715,327 |
| Net Assets consist of: | | |
| Paid in capital | | $48,135,316 |
| Total accumulated earnings (loss) | | 18,580,011 |
| Net Assets | | $66,715,327 |
| Net Asset Value, offering price and redemption price per share ($66,715,327 ÷ 4,411,185 shares) | | $15.12 |
See accompanying notes which are an integral part of the financial statements.
Statement of Operations
| | | Year ended October 31, 2020 |
| Investment Income | | |
| Dividends | | $1,526,511 |
| Income from Fidelity Central Funds (including $723 from security lending) | | 34,934 |
| Income before foreign taxes withheld | | 1,561,445 |
| Less foreign taxes withheld | | (69,475) |
| Total income | | 1,491,970 |
| Expenses | | |
| Management fee | $470,066 | |
| Transfer agent fees | 120,602 | |
| Accounting fees | 35,721 | |
| Custodian fees and expenses | 15,470 | |
| Independent trustees' fees and expenses | 392 | |
| Registration fees | 29,883 | |
| Audit | 78,771 | |
| Legal | 1,739 | |
| Miscellaneous | 1,337 | |
| Total expenses before reductions | 753,981 | |
| Expense reductions | (5,659) | |
| Total expenses after reductions | | 748,322 |
| Net investment income (loss) | | 743,648 |
| Realized and Unrealized Gain (Loss) | | |
| Net realized gain (loss) on: | | |
| Investment securities: | | |
| Unaffiliated issuers (net of foreign taxes of $5,906) | 2,076,225 | |
| Fidelity Central Funds | 38 | |
| Foreign currency transactions | 2,197 | |
| Total net realized gain (loss) | | 2,078,460 |
| Change in net unrealized appreciation (depreciation) on: | | |
| Investment securities: | | |
| Unaffiliated issuers (net of increase in deferred foreign taxes of $32,453) | (506,676) | |
| Assets and liabilities in foreign currencies | 6,817 | |
| Total change in net unrealized appreciation (depreciation) | | (499,859) |
| Net gain (loss) | | 1,578,601 |
| Net increase (decrease) in net assets resulting from operations | | $2,322,249 |
See accompanying notes which are an integral part of the financial statements.
Statement of Changes in Net Assets
| | Year ended October 31, 2020 | Year ended October 31, 2019 |
| Increase (Decrease) in Net Assets | | |
| Operations | | |
| Net investment income (loss) | $743,648 | $1,158,624 |
| Net realized gain (loss) | 2,078,460 | 775,043 |
| Change in net unrealized appreciation (depreciation) | (499,859) | 7,035,757 |
| Net increase (decrease) in net assets resulting from operations | 2,322,249 | 8,969,424 |
| Distributions to shareholders | (733,837) | (3,744,013) |
| Share transactions | | |
| Proceeds from sales of shares | 16,488,430 | 9,211,621 |
| Reinvestment of distributions | 686,957 | 3,534,334 |
| Cost of shares redeemed | (19,812,602) | (18,738,835) |
| Net increase (decrease) in net assets resulting from share transactions | (2,637,215) | (5,992,880) |
| Total increase (decrease) in net assets | (1,048,803) | (767,469) |
| Net Assets | | |
| Beginning of period | 67,764,130 | 68,531,599 |
| End of period | $66,715,327 | $67,764,130 |
| Other Information | | |
| Shares | | |
| Sold | 1,103,367 | 679,429 |
| Issued in reinvestment of distributions | 48,116 | 274,729 |
| Redeemed | (1,368,143) | (1,389,982) |
| Net increase (decrease) | (216,660) | (435,824) |
See accompanying notes which are an integral part of the financial statements.
Financial Highlights
Fidelity Global Equity Income Fund
| | | | | | |
| Years ended October 31, | 2020 | 2019 | 2018 | 2017 | 2016 |
| Selected Per–Share Data | | | | | |
| Net asset value, beginning of period | $14.64 | $13.53 | $14.21 | $12.06 | $12.12 |
| Income from Investment Operations | | | | | |
| Net investment income (loss)A | .16 | .23 | .25 | .17 | .15 |
| Net realized and unrealized gain (loss) | .48 | 1.63 | (.50) | 2.15 | .11 |
| Total from investment operations | .64 | 1.86 | (.25) | 2.32 | .26 |
| Distributions from net investment income | (.15) | (.24) | (.25) | (.17) | (.15) |
| Distributions from net realized gain | (.01) | (.51) | (.18) | – | (.16) |
| Total distributions | (.16) | (.75) | (.43) | (.17) | (.32)B |
| Redemption fees added to paid in capitalA | – | – | –C | –C | –C |
| Net asset value, end of period | $15.12 | $14.64 | $13.53 | $14.21 | $12.06 |
| Total ReturnD | 4.44% | 14.60% | (1.88)% | 19.31% | 2.13% |
| Ratios to Average Net AssetsE,F | | | | | |
| Expenses before reductions | 1.09% | 1.09% | 1.06% | 1.13% | 1.18% |
| Expenses net of fee waivers, if any | 1.09% | 1.09% | 1.06% | 1.13% | 1.18% |
| Expenses net of all reductions | 1.09% | 1.08% | 1.05% | 1.13% | 1.18% |
| Net investment income (loss) | 1.08% | 1.72% | 1.75% | 1.29% | 1.24% |
| Supplemental Data | | | | | |
| Net assets, end of period (000 omitted) | $66,715 | $67,764 | $68,532 | $81,007 | $71,675 |
| Portfolio turnover rateG | 48% | 20%H | 34% | 37% | 40% |
A Calculated based on average shares outstanding during the period.
B Total distributions per share do not sum due to rounding.
C Amount represents less than $.005 per share.
D Total returns would have been lower if certain expenses had not been reduced during the applicable periods shown.
E Fees and expenses of any underlying mutual funds or exchange-traded funds (ETFs) are not included in the Fund's expense ratio. The Fund indirectly bears its proportionate share of these expenses. For additional expense information related to investments in Fidelity Central Funds, please refer to the "Investments in Fidelity Central Funds" note found in the Notes to Financial Statements section of the most recent Annual or Semi-Annual report.
F Expense ratios reflect operating expenses of the class. Expenses before reductions do not reflect amounts reimbursed, waived, or reduced through arrangements with the investment advisor, brokerage services, or other offset arrangements, if applicable, and do not represent the amount paid by the class during periods when reimbursements, waivers or reductions occur.
G Amount does not include the portfolio activity of any underlying mutual funds or exchange-traded funds (ETFs).
H Portfolio turnover rate excludes securities received or delivered in-kind.
See accompanying notes which are an integral part of the financial statements.
Notes to Financial Statements
For the period ended October 31, 2020
1. Organization.
Fidelity Global Equity Income Fund (the Fund) is a fund of Fidelity Investment Trust (the Trust) and is authorized to issue an unlimited number of shares. Share transactions on the Statement of Changes in Net Assets may contain exchanges between affiliated funds. The Trust is registered under the Investment Company Act of 1940, as amended (the 1940 Act), as an open-end management investment company organized as a Massachusetts business trust.
Effective January 1, 2020:
Investment advisers Fidelity Investments Money Management, Inc., FMR Co., Inc., and Fidelity SelectCo, LLC, merged with and into Fidelity Management & Research Company. In connection with the merger transactions, the resulting, merged investment adviser was then redomiciled from Massachusetts to Delaware, changed its corporate structure from a corporation to a limited liability company, and changed its name to "Fidelity Management & Research Company LLC".
Fidelity Investments Institutional Operations Company, Inc. converted from a Massachusetts corporation to a Massachusetts LLC, and changed its name to "Fidelity Investments Institutional Operations Company LLC".
2. Investments in Fidelity Central Funds.
The Fund invests in Fidelity Central Funds, which are open-end investment companies generally available only to other investment companies and accounts managed by the investment adviser and its affiliates. The Fund's Schedule of Investments lists each of the Fidelity Central Funds held as of period end, if any, as an investment of the Fund, but does not include the underlying holdings of each Fidelity Central Fund. As an Investing Fund, the Fund indirectly bears its proportionate share of the expenses of the underlying Fidelity Central Funds.
The Money Market Central Funds seek preservation of capital and current income and are managed by the investment adviser. Annualized expenses of the Money Market Central Funds as of their most recent shareholder report date ranged from less than .005% to .01%.
A complete unaudited list of holdings for each Fidelity Central Fund is available upon request or at the Securities and Exchange Commission (the SEC) website at www.sec.gov. In addition, the financial statements of the Fidelity Central Funds, which are not covered by the Fund's Report of Independent Registered Public Accounting Firm, are available on the SEC website or upon request.
3. Significant Accounting Policies.
The Fund is an investment company and applies the accounting and reporting guidance of the Financial Accounting Standards Board (FASB) Accounting Standards Codification Topic 946 Financial Services – Investment Companies. The financial statements have been prepared in conformity with accounting principles generally accepted in the United States of America (GAAP), which require management to make certain estimates and assumptions at the date of the financial statements. Actual results could differ from those estimates. Subsequent events, if any, through the date that the financial statements were issued have been evaluated in the preparation of the financial statements. The following summarizes the significant accounting policies of the Fund:
Investment Valuation. Investments are valued as of 4:00 p.m. Eastern time on the last calendar day of the period. The Board of Trustees (the Board) has delegated the day to day responsibility for the valuation of the Fund's investments to the Fair Value Committee (the Committee) established by the Fund's investment adviser. In accordance with valuation policies and procedures approved by the Board, the Fund attempts to obtain prices from one or more third party pricing vendors or brokers to value its investments. When current market prices, quotations or currency exchange rates are not readily available or reliable, investments will be fair valued in good faith by the Committee, in accordance with procedures adopted by the Board. Factors used in determining fair value vary by investment type and may include market or investment specific events. The frequency with which these procedures are used cannot be predicted and they may be utilized to a significant extent. The Committee oversees the Fund's valuation policies and procedures and reports to the Board on the Committee's activities and fair value determinations. The Board monitors the appropriateness of the procedures used in valuing the Fund's investments and ratifies the fair value determinations of the Committee.
The Fund categorizes the inputs to valuation techniques used to value its investments into a disclosure hierarchy consisting of three levels as shown below:
- Level 1 – quoted prices in active markets for identical investments
- Level 2 – other significant observable inputs (including quoted prices for similar investments, interest rates, prepayment speeds, etc.)
- Level 3 – unobservable inputs (including the Fund's own assumptions based on the best information available)
Valuation techniques used to value the Fund's investments by major category are as follows:
Equity securities, including restricted securities, for which market quotations are readily available, are valued at the last reported sale price or official closing price as reported by a third party pricing vendor on the primary market or exchange on which they are traded and are categorized as Level 1 in the hierarchy. In the event there were no sales during the day or closing prices are not available, securities are valued at the last quoted bid price or may be valued using the last available price and are generally categorized as Level 2 in the hierarchy. For foreign equity securities, when market or security specific events arise, comparisons to the valuation of American Depositary Receipts (ADRs), futures contracts, Exchange-Traded Funds (ETFs) and certain indexes as well as quoted prices for similar securities may be used and would be categorized as Level 2 in the hierarchy. For equity securities, including restricted securities, where observable inputs are limited, assumptions about market activity and risk are used and these securities may be categorized as Level 3 in the hierarchy.
Investments in open-end mutual funds, including Fidelity Central Funds, are valued at their closing net asset value (NAV) each business day and are categorized as Level 1 in the hierarchy
Changes in valuation techniques may result in transfers in or out of an assigned level within the disclosure hierarchy. The aggregate value of investments by input level as of October 31, 2020 is included at the end of the Fund's Schedule of Investments.
Foreign Currency. Certain Funds may use foreign currency contracts to facilitate transactions in foreign-denominated securities. Gains and losses from these transactions may arise from changes in the value of the foreign currency or if the counterparties do not perform under the contracts' terms.
Foreign-denominated assets, including investment securities, and liabilities are translated into U.S. dollars at the exchange rates at period end. Purchases and sales of investment securities, income and dividends received, and expenses denominated in foreign currencies are translated into U.S. dollars at the exchange rate in effect on the transaction date.
The effects of exchange rate fluctuations on investments are included with the net realized and unrealized gain (loss) on investment securities. Other foreign currency transactions resulting in realized and unrealized gain (loss) are disclosed separately.
Investment Transactions and Income. For financial reporting purposes, the Fund's investment holdings and NAV include trades executed through the end of the last business day of the period. The NAV per share for processing shareholder transactions is calculated as of the close of business of the New York Stock Exchange (NYSE), normally 4:00 p.m. Eastern time and includes trades executed through the end of the prior business day. Gains and losses on securities sold are determined on the basis of identified cost. Dividend income is recorded on the ex-dividend date, except for certain dividends from foreign securities where the ex-dividend date may have passed, which are recorded as soon as the Fund is informed of the ex-dividend date. Non-cash dividends included in dividend income, if any, are recorded at the fair market value of the securities received. Income and capital gain distributions from Fidelity Central Funds, if any, are recorded on the ex-dividend date. Certain distributions received by the Fund represent a return of capital or capital gain. The Fund determines the components of these distributions subsequent to the ex-dividend date, based upon receipt of tax filings or other correspondence relating to the underlying investment. These distributions are recorded as a reduction of cost of investments and/or as a realized gain. Investment income is recorded net of foreign taxes withheld where recovery of such taxes is uncertain.
Expenses. Expenses directly attributable to a fund are charged to that fund. Expenses attributable to more than one fund are allocated among the respective funds on the basis of relative net assets or other appropriate methods. Expense estimates are accrued in the period to which they relate and adjustments are made when actual amounts are known.
Income Tax Information and Distributions to Shareholders. Each year, the Fund intends to qualify as a regulated investment company under Subchapter M of the Internal Revenue Code, including distributing substantially all of its taxable income and realized gains. As a result, no provision for U.S. Federal income taxes is required. As of October 31, 2020, the Fund did not have any unrecognized tax benefits in the financial statements; nor is the Fund aware of any tax positions for which it is reasonably possible that the total amounts of unrecognized tax benefits will significantly change in the next twelve months. The Fund files a U.S. federal tax return, in addition to state and local tax returns as required. The Fund's federal income tax returns are subject to examination by the Internal Revenue Service (IRS) for a period of three fiscal years after they are filed. State and local tax returns may be subject to examination for an additional fiscal year depending on the jurisdiction. Foreign taxes are provided for based on the Fund's understanding of the tax rules and rates that exist in the foreign markets in which it invests. The Fund is subject to a tax imposed on capital gains by certain countries in which it invests. An estimated deferred tax liability for net unrealized appreciation on the applicable securities is included in Other payables and accrued expenses on the Statement of Assets & Liabilities.
Distributions are declared and recorded on the ex-dividend date. Income and capital gain distributions are determined in accordance with income tax regulations, which may differ from GAAP. In addition, the Fund claimed a portion of the payment made to redeeming shareholders as a distribution for income tax purposes.
Capital accounts within the financial statements are adjusted for permanent book-tax differences. These adjustments have no impact on net assets or the results of operations. Capital accounts are not adjusted for temporary book-tax differences which will reverse in a subsequent period.
Book-tax differences are primarily due to foreign currency transactions, passive foreign investment companies (PFIC), certain foreign taxes and losses deferred due to wash sales.
As of period end, the cost and unrealized appreciation (depreciation) in securities, and derivatives if applicable, for federal income tax purposes were as follows:
| Gross unrealized appreciation | $20,764,835 |
| Gross unrealized depreciation | (3,875,842) |
| Net unrealized appreciation (depreciation) | $16,888,993 |
| Tax Cost | $49,794,242 |
The tax-based components of distributable earnings as of period end were as follows:
| Undistributed ordinary income | $64,698 |
| Undistributed long-term capital gain | $1,674,771 |
| Net unrealized appreciation (depreciation) on securities and other investments | $16,895,020 |
The tax character of distributions paid was as follows:
| | October 31, 2020 | October 31, 2019 |
| Ordinary Income | $705,575 | $ 1,194,063 |
| Long-term Capital Gains | 28,262 | 2,549,950 |
| Total | $733,837 | $ 3,744,013 |
Restricted Securities (including Private Placements). The Fund may invest in securities that are subject to legal or contractual restrictions on resale. These securities generally may be resold in transactions exempt from registration or to the public if the securities are registered. Disposal of these securities may involve time-consuming negotiations and expense, and prompt sale at an acceptable price may be difficult. Information regarding restricted securities is included at the end of the Fund's Schedule of Investments.
4. Purchases and Sales of Investments.
Purchases and sales of securities, other than short-term securities are noted in the table below.
| | Purchases ($) | Sales ($) |
| Fidelity Global Equity Income Fund | 31,390,255 | 31,833,485 |
5. Fees and Other Transactions with Affiliates.
Management Fee. Fidelity Management & Research Company LLC (the investment adviser) and its affiliates provide the Fund with investment management related services for which the Fund pays a monthly management fee. The management fee is the sum of an individual fund fee rate that is based on an annual rate of .45% of the Fund's average net assets and an annualized group fee rate that averaged 0.23% during the period. The group fee rate is based upon the monthly average net assets of a group of registered investment companies with which the investment adviser has management contracts. The group fee rate decreases as assets under management increase and increases as assets under management decrease. For the reporting period, the total annual management fee rate was .68% of the Fund's average net assets.
Transfer Agent Fees. Fidelity Investments Institutional Operations Company LLC (FIIOC), an affiliate of the investment adviser, is the Fund's transfer, dividend disbursing and shareholder servicing agent. FIIOC receives account fees and asset-based fees that vary according to account size and type of account. FIIOC pays for typesetting, printing and mailing of shareholder reports, except proxy statements. For the period, the transfer agent fees were equivalent to an annual rate of .18% of average net assets.
Accounting Fees. Fidelity Service Company, Inc. (FSC), an affiliate of the investment adviser, maintains the Fund's accounting records. The accounting fee is based on the level of average net assets for each month. For the period, the fees were equivalent to the following annual rates:
| | % of Average Net Assets |
| Fidelity Global Equity Income Fund | .05 |
Brokerage Commissions. A portion of portfolio transactions were placed with brokerage firms which are affiliates of the investment adviser. Brokerage commissions are included in net realized gain (loss) and change in net unrealized appreciation (depreciation) in the Statement of Operations. The commissions paid to these affiliated firms were as follows:
| | Amount |
| Fidelity Global Equity Income Fund | $386 |
Interfund Trades. Funds may purchase from or sell securities to other Fidelity Funds under procedures adopted by the Board. The procedures have been designed to ensure these interfund trades are executed in accordance with Rule 17a-7 of the 1940 Act. Interfund trades are included within the respective purchases and sales amounts shown in the Purchases and Sales of Investments note.
Prior Fiscal Year Affiliated Redemptions In-Kind. During the prior period, 209,612 shares of the Fund were redeemed in-kind for investments and cash with a value of $2,873,785. The Fund had a net realized gain of $757,012 on investments delivered through in-kind redemptions. The amount of the in-kind redemptions is included in share transactions in the accompanying Statement of Changes in Net Assets. The Fund recognized no gain or loss for federal income tax purposes.
6. Committed Line of Credit.
Certain Funds participate with other funds managed by the investment adviser or an affiliate in a $4.25 billion credit facility (the "line of credit") to be utilized for temporary or emergency purposes to fund shareholder redemptions or for other short-term liquidity purposes. The participating funds have agreed to pay commitment fees on their pro-rata portion of the line of credit, which are reflected in Miscellaneous expenses on the Statement of Operations, and are as follows:
| | Amount |
| Fidelity Global Equity Income Fund | $162 |
During the period, there were no borrowings on this line of credit.
7. Security Lending.
Funds lend portfolio securities from time to time in order to earn additional income. Lending agents are used, including National Financial Services (NFS), an affiliate of the investment adviser. Pursuant to a securities lending agreement, NFS will receive a fee, which is capped at 9.9% of a fund's daily lending revenue, for its services as lending agent. A fund may lend securities to certain qualified borrowers, including NFS. On the settlement date of the loan, a fund receives collateral (in the form of U.S. Treasury obligations, letters of credit and/or cash) against the loaned securities and maintains collateral in an amount not less than 100% of the market value of the loaned securities during the period of the loan. The market value of the loaned securities is determined at the close of business of a fund and any additional required collateral is delivered to a fund on the next business day. A fund or borrower may terminate the loan at any time, and if the borrower defaults on its obligation to return the securities loaned because of insolvency or other reasons, a fund may apply collateral received from the borrower against the obligation. A fund may experience delays and costs in recovering the securities loaned. Any cash collateral received is invested in the Fidelity Securities Lending Cash Central Fund. Any loaned securities are identified as such in the Schedule of Investments, and the value of loaned securities and cash collateral at period end, as applicable, are presented in the Statement of Assets and Liabilities. Security lending income represents the income earned on investing cash collateral, less rebates paid to borrowers and any lending agent fees associated with the loan, plus any premium payments received for lending certain types of securities. Security lending income is presented in the Statement of Operations as a component of income from Fidelity Central Funds. Affiliated security lending activity, if any, was as follows:
| | Total Security Lending Income Fees Paid to NFS | Security Lending Income From Securities Loaned to NFS | Value of Securities Loaned to NFS at Period End |
| Fidelity Global Equity Income Fund | $18 | $– | $– |
8. Expense Reductions.
Commissions paid to certain brokers with whom the investment adviser, or its affiliates, places trades on behalf of the Fund include an amount in addition to trade execution, which may be rebated back to the Fund to offset certain expenses. This amount totaled $5,233 for the period. In addition, through arrangements with the Fund's custodian, credits realized as a result of certain uninvested cash balances were used to reduce the Fund's expenses by $135.
In addition, during the period the investment adviser or an affiliate reimbursed and/or waived a portion of operating expenses in the amount of $291.
9. Other.
The Fund's organizational documents provide former and current trustees and officers with a limited indemnification against liabilities arising in connection with the performance of their duties to the Fund. In the normal course of business, the Fund may also enter into contracts that provide general indemnifications. The Fund's maximum exposure under these arrangements is unknown as this would be dependent on future claims that may be made against the Fund. The risk of material loss from such claims is considered remote.
10. Coronavirus (COVID-19) Pandemic.
An outbreak of COVID-19 first detected in China during December 2019 has since spread globally and was declared a pandemic by the World Health Organization during March 2020. Developments that disrupt global economies and financial markets, such as the COVID-19 pandemic, may magnify factors that affect the Fund's performance.
Report of Independent Registered Public Accounting Firm
To the Board of Trustees of Fidelity Investment Trust and Shareholders of Fidelity Global Equity Income Fund:
Opinion on the Financial Statements and Financial Highlights
We have audited the accompanying statement of assets and liabilities of Fidelity Global Equity Income Fund (the "Fund"), a fund of Fidelity Investment Trust, including the schedule of investments, as of October 31, 2020, the related statement of operations for the year then ended, the statement of changes in net assets for each of the two years in the period then ended, the financial highlights for each of the five years in the period then ended, and the related notes. In our opinion, the financial statements and financial highlights present fairly, in all material respects, the financial position of the Fund as of October 31, 2020, and the results of its operations for the year then ended, the changes in its net assets for each of the two years in the period then ended, and the financial highlights for each of the five years in the period then ended in conformity with accounting principles generally accepted in the United States of America.
Basis for Opinion
These financial statements and financial highlights are the responsibility of the Fund's management. Our responsibility is to express an opinion on the Fund's financial statements and financial highlights based on our audits. We are a public accounting firm registered with the Public Company Accounting Oversight Board (United States) (PCAOB) and are required to be independent with respect to the Fund in accordance with the U.S. federal securities laws and the applicable rules and regulations of the Securities and Exchange Commission and the PCAOB.
We conducted our audits in accordance with the standards of the PCAOB. Those standards require that we plan and perform the audit to obtain reasonable assurance about whether the financial statements and financial highlights are free of material misstatement, whether due to error or fraud. The Fund is not required to have, nor were we engaged to perform, an audit of its internal control over financial reporting. As part of our audits we are required to obtain an understanding of internal control over financial reporting but not for the purpose of expressing an opinion on the effectiveness of the Fund’s internal control over financial reporting. Accordingly, we express no such opinion.
Our audits included performing procedures to assess the risks of material misstatement of the financial statements and financial highlights, whether due to error or fraud, and performing procedures that respond to those risks. Such procedures included examining, on a test basis, evidence regarding the amounts and disclosures in the financial statements and financial highlights. Our audits also included evaluating the accounting principles used and significant estimates made by management, as well as evaluating the overall presentation of the financial statements and financial highlights. Our procedures included confirmation of securities owned as of October 31, 2020, by correspondence with the custodian and brokers; when replies were not received from brokers, we performed other auditing procedures. We believe that our audits provide a reasonable basis for our opinion.
/s/ Deloitte & Touche LLP
Boston, Massachusetts
December 14, 2020
We have served as the auditor of one or more of the Fidelity investment companies since 1999.
Trustees and Officers
The Trustees, Members of the Advisory Board (if any), and officers of the trust and fund, as applicable, are listed below. The Board of Trustees governs the fund and is responsible for protecting the interests of shareholders. The Trustees are experienced executives who meet periodically throughout the year to oversee the fund's activities, review contractual arrangements with companies that provide services to the fund, oversee management of the risks associated with such activities and contractual arrangements, and review the fund's performance. Except for Jonathan Chiel, each of the Trustees oversees 305 funds. Mr. Chiel oversees 176 funds.
The Trustees hold office without limit in time except that (a) any Trustee may resign; (b) any Trustee may be removed by written instrument, signed by at least two-thirds of the number of Trustees prior to such removal; (c) any Trustee who requests to be retired or who has become incapacitated by illness or injury may be retired by written instrument signed by a majority of the other Trustees; and (d) any Trustee may be removed at any special meeting of shareholders by a two-thirds vote of the outstanding voting securities of the trust. Each Trustee who is not an interested person (as defined in the 1940 Act) of the trust and the fund is referred to herein as an Independent Trustee. Each Independent Trustee shall retire not later than the last day of the calendar year in which his or her 75th birthday occurs. The Independent Trustees may waive this mandatory retirement age policy with respect to individual Trustees. Officers and Advisory Board Members hold office without limit in time, except that any officer or Advisory Board Member may resign or may be removed by a vote of a majority of the Trustees at any regular meeting or any special meeting of the Trustees. Except as indicated, each individual has held the office shown or other offices in the same company for the past five years.
The fund’s Statement of Additional Information (SAI) includes more information about the Trustees. To request a free copy, call Fidelity at 1-800-544-8544.
Experience, Skills, Attributes, and Qualifications of the Trustees. The Governance and Nominating Committee has adopted a statement of policy that describes the experience, qualifications, attributes, and skills that are necessary and desirable for potential Independent Trustee candidates (Statement of Policy). The Board believes that each Trustee satisfied at the time he or she was initially elected or appointed a Trustee, and continues to satisfy, the standards contemplated by the Statement of Policy. The Governance and Nominating Committee also engages professional search firms to help identify potential Independent Trustee candidates who have the experience, qualifications, attributes, and skills consistent with the Statement of Policy. From time to time, additional criteria based on the composition and skills of the current Independent Trustees, as well as experience or skills that may be appropriate in light of future changes to board composition, business conditions, and regulatory or other developments, have also been considered by the professional search firms and the Governance and Nominating Committee. In addition, the Board takes into account the Trustees' commitment and participation in Board and committee meetings, as well as their leadership of standing and ad hoc committees throughout their tenure.
In determining that a particular Trustee was and continues to be qualified to serve as a Trustee, the Board has considered a variety of criteria, none of which, in isolation, was controlling. The Board believes that, collectively, the Trustees have balanced and diverse experience, qualifications, attributes, and skills, which allow the Board to operate effectively in governing the fund and protecting the interests of shareholders. Information about the specific experience, skills, attributes, and qualifications of each Trustee, which in each case led to the Board's conclusion that the Trustee should serve (or continue to serve) as a trustee of the fund, is provided below.
Board Structure and Oversight Function. Robert A. Lawrence is an interested person and currently serves as Acting Chairman. The Trustees have determined that an interested Chairman is appropriate and benefits shareholders because an interested Chairman has a personal and professional stake in the quality and continuity of services provided to the fund. Independent Trustees exercise their informed business judgment to appoint an individual of their choosing to serve as Chairman, regardless of whether the Trustee happens to be independent or a member of management. The Independent Trustees have determined that they can act independently and effectively without having an Independent Trustee serve as Chairman and that a key structural component for assuring that they are in a position to do so is for the Independent Trustees to constitute a substantial majority for the Board. The Independent Trustees also regularly meet in executive session. Ned C. Lautenbach and David M. Thomas serve as Co-Lead Independent Trustees and as such each (i) acts as a liaison between the Independent Trustees and management with respect to matters important to the Independent Trustees and (ii) with management prepares agendas for Board meetings.
Fidelity® funds are overseen by different Boards of Trustees. The fund's Board oversees Fidelity's high income and certain equity funds, and other Boards oversee Fidelity's investment-grade bond, money market, asset allocation, and other equity funds. The asset allocation funds may invest in Fidelity® funds overseen by the fund's Board. The use of separate Boards, each with its own committee structure, allows the Trustees of each group of Fidelity® funds to focus on the unique issues of the funds they oversee, including common research, investment, and operational issues. On occasion, the separate Boards establish joint committees to address issues of overlapping consequences for the Fidelity® funds overseen by each Board.
The Trustees operate using a system of committees to facilitate the timely and efficient consideration of all matters of importance to the Trustees, the fund, and fund shareholders and to facilitate compliance with legal and regulatory requirements and oversight of the fund's activities and associated risks. The Board, acting through its committees, has charged FMR and its affiliates with (i) identifying events or circumstances the occurrence of which could have demonstrably adverse effects on the fund's business and/or reputation; (ii) implementing processes and controls to lessen the possibility that such events or circumstances occur or to mitigate the effects of such events or circumstances if they do occur; and (iii) creating and maintaining a system designed to evaluate continuously business and market conditions in order to facilitate the identification and implementation processes described in (i) and (ii) above. Because the day-to-day operations and activities of the fund are carried out by or through FMR, its affiliates, and other service providers, the fund's exposure to risks is mitigated but not eliminated by the processes overseen by the Trustees. While each of the Board's committees has responsibility for overseeing different aspects of the fund's activities, oversight is exercised primarily through the Operations, Audit, and Compliance Committees. Appropriate personnel, including but not limited to the fund's Chief Compliance Officer (CCO), FMR's internal auditor, the independent accountants, the fund's Treasurer and portfolio management personnel, make periodic reports to the Board's committees, as appropriate, including an annual review of Fidelity's risk management program for the Fidelity® funds. The responsibilities of each standing committee, including their oversight responsibilities, are described further under "Standing Committees of the Trustees."
Interested Trustees*:
Correspondence intended for a Trustee who is an interested person may be sent to Fidelity Investments, 245 Summer Street, Boston, Massachusetts 02210.
Name, Year of Birth; Principal Occupations and Other Relevant Experience+
Jonathan Chiel (1957)
Year of Election or Appointment: 2016
Trustee
Mr. Chiel also serves as Trustee of other Fidelity® funds. Mr. Chiel is Executive Vice President and General Counsel for FMR LLC (diversified financial services company, 2012-present). Previously, Mr. Chiel served as general counsel (2004-2012) and senior vice president and deputy general counsel (2000-2004) for John Hancock Financial Services; a partner with Choate, Hall & Stewart (1996-2000) (law firm); and an Assistant United States Attorney for the United States Attorney’s Office of the District of Massachusetts (1986-95), including Chief of the Criminal Division (1993-1995). Mr. Chiel is a director on the boards of the Boston Bar Foundation and the Maimonides School.
Robert A. Lawrence (1952)
Year of Election or Appointment: 2020
Trustee
Acting Chairman of the Board of Trustees
Mr. Lawrence also serves as Trustee of other funds. Previously, Mr. Lawrence served as a Member of the Advisory Board of certain funds. Prior to his retirement in 2008, Mr. Lawrence served as Vice President of certain Fidelity® funds (2006-2008), Senior Vice President, Head of High Income Division of Fidelity Management & Research Company (investment adviser firm, 2006-2008), and President of Fidelity Strategic Investments (investment adviser firm, 2002-2005).
* Determined to be an “Interested Trustee” by virtue of, among other things, his or her affiliation with the trusts or various entities under common control with FMR.
+ The information includes the Trustee's principal occupation during the last five years and other information relating to the experience, attributes, and skills relevant to the Trustee's qualifications to serve as a Trustee, which led to the conclusion that the Trustee should serve as a Trustee for the fund.
Independent Trustees:
Correspondence intended for an Independent Trustee may be sent to Fidelity Investments, P.O. Box 55235, Boston, Massachusetts 02205-5235.
Name, Year of Birth; Principal Occupations and Other Relevant Experience+
Dennis J. Dirks (1948)
Year of Election or Appointment: 2005
Trustee
Mr. Dirks also serves as Trustee of other Fidelity® funds. Prior to his retirement in May 2003, Mr. Dirks served as Chief Operating Officer and as a member of the Board of The Depository Trust & Clearing Corporation (financial markets infrastructure), President, Chief Operating Officer and a member of the Board of The Depository Trust Company (DTC), President and a member of the Board of the National Securities Clearing Corporation (NSCC), Chief Executive Officer and a member of the Board of the Government Securities Clearing Corporation and Chief Executive Officer and a member of the Board of the Mortgage-Backed Securities Clearing Corporation. Mr. Dirks currently serves as a member of the Finance Committee (2016-present) and Board (2017-present) and is Treasurer (2018-present) of the Asolo Repertory Theatre.
Donald F. Donahue (1950)
Year of Election or Appointment: 2018
Trustee
Mr. Donahue also serves as Trustee of other Fidelity® funds. Mr. Donahue serves as President and Chief Executive Officer of Miranda Partners, LLC (risk consulting for the financial services industry, 2012-present). Previously, Mr. Donahue served as Chief Executive Officer (2006-2012), Chief Operating Officer (2003-2006) and Managing Director, Customer Marketing and Development (1999-2003) of The Depository Trust & Clearing Corporation (financial markets infrastructure). Mr. Donahue currently serves as a member (2007-present) and Co-Chairman (2016-present) of the Board of United Way of New York, a member of the Board of NYC Leadership Academy (2012-present) and a member of the Board of Advisors of Ripple Labs, Inc. (financial services, 2015-present). Mr. Donahue previously served as a member of the Advisory Board of certain Fidelity® funds (2015-2018).
Vicki L. Fuller (1957)
Year of Election or Appointment: 2020
Trustee
Ms. Fuller also serves as Trustee of other Fidelity® funds. Previously, Ms. Fuller served as a member of the Advisory Board of certain Fidelity® funds (2018-2020), Chief Investment Officer of the New York State Common Retirement Fund (2012-2018) and held a variety of positions at AllianceBernstein L.P. (global asset management, 1985-2012), including Managing Director (2006-2012) and Senior Vice President and Senior Portfolio Manager (2001-2006). Ms. Fuller currently serves as a member of the Board, Audit Committee and Nominating and Governance Committee of The Williams Companies, Inc. (natural gas infrastructure, 2018-present), as a member of the Board, Audit Committee and Nominating and Governance Committee of two Blackstone business development companies (2020-present) and as a member of the Board of Treliant, LLC (consulting, 2019-present).
Patricia L. Kampling (1959)
Year of Election or Appointment: 2020
Trustee
Ms. Kampling also serves as Trustee of other Fidelity® funds. Prior to her retirement, Ms. Kampling served as Chairman of the Board and Chief Executive Officer (2012-2019), President and Chief Operating Officer (2011-2012) and Executive Vice President and Chief Financial Officer (2010-2011) of Alliant Energy Corporation. Ms. Kampling currently serves as a member of the Board, Compensation Committee and Executive Committee and as Chair of the Audit Committee of Briggs & Stratton Corporation (manufacturing, 2011-present) and as a member of the Board, Audit, Finance and Risk Committee and Safety, Environmental, Technology and Operations Committee of American Water Works Company, Inc. (utilities company, 2019-present). In addition, Ms. Kampling currently serves as a member of the Board of the Nature Conservancy, Wisconsin Chapter (2019-present). Previously, Ms. Kampling served as a Member of the Advisory Board of certain Fidelity® funds (2020), a member of the Board of Interstate Power and Light Company (2012-2019) and Wisconsin Power and Light Company (2012-2019) (each a subsidiary of Alliant Energy Corporation) and as a member of the Board and Workforce Development Committee of the Business Roundtable (2018-2019).
Alan J. Lacy (1953)
Year of Election or Appointment: 2008
Trustee
Mr. Lacy also serves as Trustee of other Fidelity® funds. Previously, Mr. Lacy served as Senior Adviser (2007-2014) of Oak Hill Capital Partners, L.P. (private equity), Chief Executive Officer (2005) and Vice Chairman (2005-2006) of Sears Holdings Corporation (retail), Chief Executive Officer and Chairman of the Board of Sears, Roebuck and Co. (retail, 2000-2005), Chairman (2014-2017) and a member of the Board (2010-2017) of Dave & Buster’s Entertainment, Inc. (restaurant and entertainment complexes) and a member of the Board of Bristol-Myers Squibb Company (global pharmaceuticals, 2008-2020). Mr. Lacy currently serves as a Trustee of the California Chapter of The Nature Conservancy (2015-present) and a member of the Board of the Center for Advanced Study in the Behavioral Sciences at Stanford University (2015-present).
Ned C. Lautenbach (1944)
Year of Election or Appointment: 2000
Trustee
Co-Lead Independent Trustee
Mr. Lautenbach also serves as Trustee of other Fidelity® funds. Mr. Lautenbach currently serves as Chair of the Board of Governors, State University System of Florida (2013-present) and is a member of the Council on Foreign Relations (1994-present). He is also a member and has in the past served as Chairman of the Board of Directors of Artis-Naples (2012-present). Previously, Mr. Lautenbach served as a member and then Lead Director of the Board of Directors of Eaton Corporation (diversified industrial, 1997-2016). He was also a Partner at Clayton, Dubilier & Rice, LLC (private equity investment, 1998-2010); as well as Director of Sony Corporation (2006-2007). In addition, Mr. Lautenbach had a 30-year career with IBM (technology company), during which time he served as Senior Vice President and as a member of the Corporate Executive Committee (1968-1998).
Joseph Mauriello (1944)
Year of Election or Appointment: 2008
Trustee
Mr. Mauriello also serves as Trustee of other Fidelity® funds. Prior to his retirement in January 2006, Mr. Mauriello served in numerous senior management positions including Deputy Chairman and Chief Operating Officer (2004-2005), and Vice Chairman of Financial Services (2002-2004) of KPMG LLP US (professional services, 1965-2005). Mr. Mauriello currently serves as a member of the Independent Directors Council Governing Council (2015-present). Previously, Mr. Mauriello served as a member of the Board of XL Group plc. (global insurance and re-insurance, 2006-2018).
Cornelia M. Small (1944)
Year of Election or Appointment: 2005
Trustee
Ms. Small also serves as Trustee of other Fidelity® funds. Previously, Ms. Small served as Chief Investment Officer, Director of Global Equity Investments and a member of Scudder, Stevens & Clark and Scudder Kemper Investments. Ms. Small previously served as a member of the Board (2009-2019) and Chair of the Investment Committee (2010-2019) of the Teagle Foundation and a member of the Investment Committee of the Berkshire Taconic Community Foundation (2008-2019).
Garnett A. Smith (1947)
Year of Election or Appointment: 2018
Trustee
Mr. Smith also serves as Trustee of other Fidelity® funds. Prior to his retirement, Mr. Smith served as Chairman and Chief Executive Officer (1990-1997) and President (1986-1990) of Inbrand Corp. (manufacturer of personal absorbent products). Prior to his employment with Inbrand Corp., he was employed by a retail fabric chain and North Carolina National Bank (now Bank of America). Mr. Smith previously served as a member of the Advisory Board of certain Fidelity® funds (2012-2013).
David M. Thomas (1949)
Year of Election or Appointment: 2008
Trustee
Co-Lead Independent Trustee
Mr. Thomas also serves as Trustee of other Fidelity® funds. Previously, Mr. Thomas served as Executive Chairman (2005-2006) and Chairman and Chief Executive Officer (2000-2005) of IMS Health, Inc. (pharmaceutical and healthcare information solutions). Mr. Thomas currently serves as Non-Executive Chairman of the Board of Fortune Brands Home and Security (home and security products, 2011-present), and a member of the Board (2004-present) and Presiding Director (2013-present) of Interpublic Group of Companies, Inc. (marketing communication).
Susan Tomasky (1953)
Year of Election or Appointment: 2020
Trustee
Ms. Tomasky also serves as Trustee of other Fidelity® funds. Prior to her retirement, Ms. Tomasky served in various executive officer positions at American Electric Power Company, Inc. (1998-2011), including most recently as President of AEP Transmission (2007-2011). Ms. Tomasky currently serves as a member of the Board and Sustainability Committee and as Chair of the Audit Committee of Marathon Petroleum Corporation (2018-present) and as a member of the Board, Corporate Governance Committee and Organization and Compensation Committee and as Chair of the Audit Committee of Public Service Enterprise Group, Inc. (utilities company, 2012-present). In addition, Ms. Tomasky currently serves as a member of the Board of the Columbus Regional Airport Authority (2007-present), as a member of the Board of the Royal Shakespeare Company – America (2009-present), as a member of the Board of the Columbus Association for the Performing Arts (2011-present) and as a member of the Board of Kenyon College (2016-present). Previously, Ms. Tomasky served as a Member of the Advisory Board of certain Fidelity® funds (2020), a member of the Board (2011-2019) and as Lead Independent Director (2015-2018) of Andeavor Corporation (previously Tesoro Corporation) (independent oil refiner and marketer) and as a member of the Board of Summit Midstream Partners LP (energy, 2012-2018).
Michael E. Wiley (1950)
Year of Election or Appointment: 2020
Trustee
Mr. Wiley also serves as Trustee of other Fidelity® funds. Previously, Mr. Wiley served as a member of the Advisory Board of certain Fidelity® funds (2018-2020), Chairman, President and CEO of Baker Hughes, Inc. (oilfield services, 2000-2004). Mr. Wiley also previously served as a member of the Board of Andeavor Corporation (independent oil refiner and marketer, 2005-2018), a member of the Board of Andeavor Logistics LP (natural resources logistics, 2015-2018) and a member of the Board of High Point Resources (exploration and production, 2005-2020).
+ The information includes the Trustee's principal occupation during the last five years and other information relating to the experience, attributes, and skills relevant to the Trustee's qualifications to serve as a Trustee, which led to the conclusion that the Trustee should serve as a Trustee for the fund.
Advisory Board Members and Officers:
Correspondence intended for a Member of the Advisory Board (if any) may be sent to Fidelity Investments, P.O. Box 55235, Boston, Massachusetts 02205-5235. Correspondence intended for an officer or Peter S. Lynch may be sent to Fidelity Investments, 245 Summer Street, Boston, Massachusetts 02210. Officers appear below in alphabetical order.
Name, Year of Birth; Principal Occupation
Lloyd James Austin, III (1953)
Year of Election or Appointment: 2020
Member of the Advisory Board
General Austin also serves as a Member of the Advisory Board of other Fidelity® funds. Prior to his retirement, General Austin (United States Army, Retired) held a variety of positions within the U.S. Government, including Commander, U.S. Central Command (2013-2016), Vice Chief of Staff, U.S. Army (2012-2013) and Commanding General, U.S. Forces – Iraq, Operation New Dawn (2010-2012). General Austin currently serves as a Partner of Pine Island Capital Partners (private equity, 2020-present) and as President of the Austin Strategy Group LLC (consulting, 2016-present). General Austin serves as a member of the Board of Directors of Nucor Corporation (steel products, 2017-present), as a member of the Board of Directors of Tenet Healthcare Corporation (2018-present) and as a member of the Board of Directors of Raytheon Technologies Corporation (aerospace and defense, 2020-present). In addition, General Austin currently serves as a member of the Board of Trustees of the Carnegie Corporation of New York (2017-present) and as a member of the Board of Trustees of Auburn University (2017-present). Previously, General Austin served as a member of the Board of Directors of United Technologies Corporation (aerospace, defense and building, 2016-2020).
Thomas A. Kennedy (1955)
Year of Election or Appointment: 2020
Member of the Advisory Board
Mr. Kennedy also serves as a Member of the Advisory Board of other Fidelity® funds. Previously, Mr. Kennedy held a variety of positions at Raytheon Company (aerospace and defense, 1983-2020), including Chairman and Chief Executive Officer (2014-2020) and Executive Vice President and Chief Operating Officer (2013-2014). Mr. Kennedy currently serves as Executive Chairman of the Board of Directors of Raytheon Technologies Corporation (aerospace and defense, 2020-present). He is also a member of the Rutgers School of Engineering Industry Advisory Board (2011-present) and a member of the UCLA Engineering Dean’s Executive Board (2016-present).
Peter S. Lynch (1944)
Year of Election or Appointment: 2003
Member of the Advisory Board
Mr. Lynch also serves as a Member of the Advisory Board of other Fidelity® funds. Mr. Lynch is Vice Chairman and a Director of Fidelity Management & Research Company LLC (investment adviser firm). In addition, Mr. Lynch serves as a Trustee of Boston College and as the Chairman of the Inner-City Scholarship Fund. Previously, Mr. Lynch served as Vice Chairman and a Director of FMR Co., Inc. (investment adviser firm) and on the Special Olympics International Board of Directors (1997-2006).
Elizabeth Paige Baumann (1968)
Year of Election or Appointment: 2017
Anti-Money Laundering (AML) Officer
Ms. Baumann also serves as AML Officer of other funds. She is Chief AML Officer (2012-present) and Senior Vice President (2014-present) of FMR LLC (diversified financial services company) and is an employee of Fidelity Investments. Previously, Ms. Baumann served as AML Officer of certain funds (2017-2019), as AML Officer of the funds (2012-2016), and Vice President (2007-2014) and Deputy Anti-Money Laundering Officer (2007-2012) of FMR LLC.
Craig S. Brown (1977)
Year of Election or Appointment: 2019
Assistant Treasurer
Mr. Brown also serves as Assistant Treasurer of other funds. Mr. Brown is an employee of Fidelity Investments (2013-present).
John J. Burke III (1964)
Year of Election or Appointment: 2018
Chief Financial Officer
Mr. Burke also serves as Chief Financial Officer of other funds. Mr. Burke serves as Head of Investment Operations for Fidelity Fund and Investment Operations (2018-present) and is an employee of Fidelity Investments (1998-present). Previously Mr. Burke served as head of Asset Management Investment Operations (2012-2018).
William C. Coffey (1969)
Year of Election or Appointment: 2019
Assistant Secretary
Mr. Coffey also serves as Assistant Secretary of other funds. He is Senior Vice President and Deputy General Counsel of FMR LLC (diversified financial services company, 2010-present), and is an employee of Fidelity Investments. Previously, Mr. Coffey served as Secretary and CLO of certain funds (2018-2019); CLO, Secretary, and Senior Vice President of Fidelity Management & Research Company and FMR Co., Inc. (investment adviser firms, 2018-2019); Secretary of Fidelity SelectCo, LLC and Fidelity Investments Money Management, Inc. (investment adviser firms, 2018-2019); CLO of Fidelity Management & Research (Hong Kong) Limited, FMR Investment Management (UK) Limited, and Fidelity Management & Research (Japan) Limited (investment adviser firms, 2018-2019); and Assistant Secretary of certain funds (2009-2018).
Timothy M. Cohen (1969)
Year of Election or Appointment: 2018
Vice President
Mr. Cohen also serves as Vice President of other funds. Mr. Cohen serves as Co-Head of Equity (2018-present), a Director of Fidelity Management & Research (Japan) Limited (investment adviser firm, 2016-present), and is an employee of Fidelity Investments. Previously, Mr. Cohen served as Executive Vice President of Fidelity SelectCo, LLC (2019), Head of Global Equity Research (2016-2018), Chief Investment Officer - Equity and a Director of Fidelity Management & Research (U.K.) Inc. (investment adviser firm, 2013-2015) and as a Director of Fidelity Management & Research (Hong Kong) Limited (investment adviser firm, 2017).
Jonathan Davis (1968)
Year of Election or Appointment: 2010
Assistant Treasurer
Mr. Davis also serves as Assistant Treasurer of other funds. Mr. Davis serves as Assistant Treasurer of FMR Capital, Inc. (2017-present) and is an employee of Fidelity Investments. Previously, Mr. Davis served as Vice President and Associate General Counsel of FMR LLC (diversified financial services company, 2003-2010).
Laura M. Del Prato (1964)
Year of Election or Appointment: 2018
Assistant Treasurer
Ms. Del Prato also serves as an officer of other funds. Ms. Del Prato is an employee of Fidelity Investments (2017-present). Previously, Ms. Del Prato served as President and Treasurer of The North Carolina Capital Management Trust: Cash Portfolio and Term Portfolio (2018-2020). Prior to joining Fidelity Investments, Ms. Del Prato served as a Managing Director and Treasurer of the JPMorgan Mutual Funds (2014-2017). Prior to JPMorgan, Ms. Del Prato served as a partner at Cohen Fund Audit Services (accounting firm, 2012-2013) and KPMG LLP (accounting firm, 2004-2012).
Colm A. Hogan (1973)
Year of Election or Appointment: 2020
Assistant Treasurer
Mr. Hogan also serves as an officer of other funds. Mr. Hogan serves as Assistant Treasurer of FMR Capital, Inc. (2017-present) and is an employee of Fidelity Investments (2005-present). Previously, Mr. Hogan served as Deputy Treasurer of certain Fidelity® funds (2016-2020) and Assistant Treasurer of certain Fidelity® funds (2016-2018).
Pamela R. Holding (1964)
Year of Election or Appointment: 2018
Vice President
Ms. Holding also serves as Vice President of other funds. Ms. Holding serves as Co-Head of Equity (2018-present) and is an employee of Fidelity Investments (2013-present). Previously, Ms. Holding served as Executive Vice President of Fidelity SelectCo, LLC (2019) and as Chief Investment Officer of Fidelity Institutional Asset Management (2013-2018).
Cynthia Lo Bessette (1969)
Year of Election or Appointment: 2019
Secretary and Chief Legal Officer (CLO)
Ms. Lo Bessette also serves as an officer of other funds. Ms. Lo Bessette serves as CLO, Secretary, and Senior Vice President of Fidelity Management & Research Company LLC (investment adviser firm, 2019-present); and CLO of Fidelity Management & Research (Hong Kong) Limited, FMR Investment Management (UK) Limited, and Fidelity Management & Research (Japan) Limited (investment adviser firms, 2019-present). She is a Senior Vice President and Deputy General Counsel of FMR LLC (diversified financial services company, 2019-present), and is an employee of Fidelity Investments. Previously, Ms. Lo Bessette served as CLO, Secretary, and Senior Vice President of FMR Co., Inc. (investment adviser firm, 2019); Secretary of Fidelity SelectCo, LLC and Fidelity Investments Money Management, Inc. (investment adviser firms, 2019). Prior to joining Fidelity Investments, Ms. Lo Bessette was Executive Vice President, General Counsel (2016-2019) and Senior Vice President, Deputy General Counsel (2015-2016) of OppenheimerFunds (investment management company) and Deputy Chief Legal Officer (2013-2015) of Jennison Associates LLC (investment adviser firm).
Chris Maher (1972)
Year of Election or Appointment: 2020
Deputy Treasurer
Mr. Maher also serves as an officer of other funds. Mr. Maher serves as Assistant Treasurer of FMR Capital, Inc. (2017-present), and is an employee of Fidelity Investments (2008-present). Previously, Mr. Maher served as Assistant Treasurer of certain funds (2013-2020); Vice President of Asset Management Compliance (2013), Vice President of the Program Management Group of FMR (investment adviser firm, 2010-2013), and Vice President of Valuation Oversight (2008-2010).
Jason P. Pogorelec (1975)
Year of Election or Appointment: 2020
Chief Compliance Officer
Mr. Pogorelec also serves as Chief Compliance Officer of other funds. Mr. Pogorelec is a senior Vice President of Asset Management Compliance for Fidelity Investments and is an employee of Fidelity Investments (2006-present). Previously, Mr. Pogorelec served as Vice President, Associate General Counsel for Fidelity Investments (2010-2020) and Assistant Secretary of certain Fidelity funds (2015-2020).
Stacie M. Smith (1974)
Year of Election or Appointment: 2016
President and Treasurer
Ms. Smith also serves as an officer of other funds. Ms. Smith serves as Assistant Treasurer of FMR Capital, Inc. (2017-present), is an employee of Fidelity Investments (2009-present), and has served in other fund officer roles. Prior to joining Fidelity Investments, Ms. Smith served as Senior Audit Manager of Ernst & Young LLP (accounting firm, 1996-2009). Previously, Ms. Smith served as Assistant Treasurer (2013-2019) and Deputy Treasurer (2013-2016) of certain Fidelity® funds.
Marc L. Spector (1972)
Year of Election or Appointment: 2016
Assistant Treasurer
Mr. Spector also serves as an officer of other funds. Mr. Spector serves as Assistant Treasurer of FMR Capital, Inc. (2017-present) and is an employee of Fidelity Investments (2016-present). Prior to joining Fidelity Investments, Mr. Spector served as Director at the Siegfried Group (accounting firm, 2013-2016), and prior to Siegfried Group as audit senior manager at Deloitte & Touche LLP (accounting firm, 2005-2013).
Jim Wegmann (1979)
Year of Election or Appointment: 2019
Assistant Treasurer
Mr. Wegmann also serves as Assistant Treasurer of other funds. Mr. Wegmann is an employee of Fidelity Investments (2011-present).
Shareholder Expense Example
As a shareholder, you incur two types of costs: (1) transaction costs, which may include sales charges (loads) on purchase payments or redemption proceeds, as applicable and (2) ongoing costs, which generally include management fees, distribution and/or service (12b-1) fees and other Fund expenses. This Example is intended to help you understand your ongoing costs (in dollars) of investing in a fund and to compare these costs with the ongoing costs of investing in other mutual funds.
The Example is based on an investment of $1,000 invested at the beginning of the period and held for the entire period (May 1, 2020 to October 31, 2020).
Actual Expenses
The first line of the accompanying table provides information about actual account values and actual expenses. You may use the information in this line, together with the amount you invested, to estimate the expenses that you paid over the period. Simply divide your account value by $1,000.00 (for example, an $8,600 account value divided by $1,000.00 = 8.6), then multiply the result by the number in the first line for a class/Fund under the heading entitled "Expenses Paid During Period" to estimate the expenses you paid on your account during this period. If any fund is a shareholder of any underlying mutual funds or exchange-traded funds (ETFs) (the Underlying Funds), such fund indirectly bears its proportional share of the expenses of the Underlying Funds in addition to the direct expenses incurred presented in the table. These fees and expenses are not included in the annualized expense ratio used to calculate the expense estimate in the table below.
Hypothetical Example for Comparison Purposes
The second line of the accompanying table provides information about hypothetical account values and hypothetical expenses based on the actual expense ratio and an assumed rate of return of 5% per year before expenses, which is not the actual return. The hypothetical account values and expenses may not be used to estimate the actual ending account balance or expenses you paid for the period. You may use this information to compare the ongoing costs of investing in the Fund and other funds. To do so, compare this 5% hypothetical example with the 5% hypothetical examples that appear in the shareholder reports of the other funds. If any fund is a shareholder of any Underlying Funds, such fund indirectly bears its proportional share of the expenses of the Underlying Funds in addition to the direct expenses as presented in the table. These fees and expenses are not included in the annualized expense ratio used to calculate the expense estimate in the table below.
Please note that the expenses shown in the table are meant to highlight your ongoing costs only and do not reflect any transaction costs. Therefore, the second line of the table is useful in comparing ongoing costs only, and will not help you determine the relative total costs of owning different funds.
| | Annualized Expense Ratio-A | Beginning
Account Value
May 1, 2020 | Ending
Account Value
October 31, 2020 | Expenses Paid
During Period-B
May 1, 2020
to October 31, 2020 |
| Fidelity Global Equity Income Fund | 1.10% | | | |
| Actual | | $1,000.00 | $1,105.50 | $5.82 |
| Hypothetical-C | | $1,000.00 | $1,019.61 | $5.58 |
A Annualized expense ratio reflects expenses net of applicable fee waivers.
B Expenses are equal to the annualized expense ratio, multiplied by the average account value over the period, multiplied by 184/ 366 (to reflect the one-half year period). The fees and expenses of any Underlying Funds are not included in each annualized expense ratio.
C 5% return per year before expenses
Distributions (Unaudited)
The Board of Trustees of Fidelity Global Equity Income Fund voted to pay on December 14, 2020, to shareholders of record at the opening of business on December 11, 2020, a distribution of $0.378 per share derived from capital gains realized from sales of portfolio securities and a dividend of $0.044 per share from net investment income.
The fund hereby designates as a capital gain dividend with respect to the taxable year ended October 31, 2020, $2,329,206, or, if subsequently determined to be different, the net capital gain of such year.
A total of 0.66% of the dividends distributed during the fiscal year was derived from interest on U.S. Government securities which is generally exempt from state income tax.
The fund designates 83%, 100%, 100%, and 100% of the dividends distributed in December, April, July, and October, respectively during the fiscal year as qualifying for the dividends–received deduction for corporate shareholders.
The fund designates 100% of the dividends distributed during the fiscal year as amounts which may be taken into account as a dividend for the purposes of the maximum rate under section 1(h)(11) of the Internal Revenue Code.
The fund will notify shareholders in January 2021 of amounts for use in preparing 2020 income tax returns.
Proxy Voting Results
A special meeting of shareholders was held on June 9, 2020. The results of votes taken among shareholders on the proposals before them are reported below. Each vote reported represents one dollar of net asset value held on the record date for the meeting.
PROPOSAL 1
To elect a Board of Trustees.
| | # of
Votes | % of
Votes |
| Dennis J. Dirks |
| Affirmative | 91,643,443,973.030 | 98.167 |
| Withheld | 1,711,119,384.419 | 1.833 |
| TOTAL | 93,354,563,357.449 | 100.000 |
| Donald F. Donahue |
| Affirmative | 91,659,003,496.045 | 98.184 |
| Withheld | 1,695,559,852.789 | 1.816 |
| TOTAL | 93,354,563,357.449 | 100.000 |
| Bettina Doulton |
| Affirmative | 91,774,146,516.145 | 98.307 |
| Withheld | 1,580,416,862.377 | 1.693 |
| TOTAL | 93,354,563,357.449 | 100.000 |
| Vicki L. Fuller |
| Affirmative | 91,845,419,368.993 | 98.383 |
| Withheld | 1,509,143,998.591 | 1.617 |
| TOTAL | 93,354,563,357.449 | 100.00 |
| Patricia L. Kampling |
| Affirmative | 91,723,732,274.457 | 98.253 |
| Withheld | 1,630,831,098.411 | 1.747 |
| TOTAL | 93,354,563,357.449 | 100.000 |
| Alan J. Lacy |
| Affirmative | 91,490,319,407.772 | 98.003 |
| Withheld | 1,864,243,948.299 | 1.997 |
| TOTAL | 93,354,563,357.449 | 100.000 |
| Ned C. Lautenbach |
| Affirmative | 91,285,367,239.075 | 97.784 |
| Withheld | 2,069,196,119.052 | 2.216 |
| TOTAL | 93,354,563,357.449 | 100.000 |
| Robert A. Lawrence |
| Affirmative | 91,556,271,429.466 | 98.074 |
| Withheld | 1,798,291,912.707 | 1.926 |
| TOTAL | 93,354,563,357.449 | 100.000 |
| Joseph Mauriello |
| Affirmative | 91,497,480,147.082 | 98.011 |
| Withheld | 1,857,083,211.045 | 1.989 |
| TOTAL | 93,354,563,357.449 | 100.000 |
| Cornelia M. Small |
| Affirmative | 91,606,808,161.438 | 98.128 |
| Withheld | 1,747,755,220.497 | 1.872 |
| TOTAL | 93,354,563,357.449 | 100.000 |
| Garnett A. Smith |
| Affirmative | 91,505,784,053.038 | 98.020 |
| Withheld | 1,848,779,305.090 | 1.980 |
| TOTAL | 93,354,563,357.449 | 100.000 |
| David M. Thomas |
| Affirmative | 91,536,969,704.881 | 98.053 |
| Withheld | 1,817,593,630.919 | 1.947 |
| TOTAL | 93,354,563,357.449 | 100.000 |
| Susan Tomasky |
| Affirmative | 91,697,125,678.165 | 98.225 |
| Withheld | 1,657,437,703.277 | 1.775 |
| TOTAL | 93,354,563,357.449 | 100.000 |
| Michael E. Wiley |
| Affirmative | 91,506,805,575.815 | 98.021 |
| Withheld | 1,847,757,759.985 | 1.979 |
| TOTAL | 93,354,563,357.449 | 100.000 |
PROPOSAL 2
To convert a fundamental investment policy to a non-fundamental investment policy.
| | # of
Votes | % of
Votes |
| Affirmative | 23,566,036.925 | 72.684 |
| Against | 5,988,682.557 | 18.471 |
| Abstain | 1,950,844.228 | 6.017 |
| Broker Non-Vote | 916,968.800 | 2.828 |
| TOTAL | 32,422,532.510 | 100.000 |
|
| Proposal 1 reflects trust wide proposal and voting results. |
GED-ANN-1220
1.938162.108
Fidelity Flex® Funds
Fidelity Flex® International Fund
Annual Report
October 31, 2020
See the inside front cover for important information about access to your fund’s shareholder reports.
Beginning on January 1, 2021, as permitted by regulations adopted by the Securities and Exchange Commission, paper copies of a fund’s shareholder reports will no longer be sent by mail, unless you specifically request paper copies of the reports from the fund or from your financial intermediary, such as a financial advisor, broker-dealer or bank. Instead, the reports will be made available on a website, and you will be notified by mail each time a report is posted and provided with a website link to access the report.
If you already elected to receive shareholder reports electronically, you will not be affected by this change and you need not take any action. You may elect to receive shareholder reports and other communications from a fund electronically, by contacting your financial intermediary. For Fidelity customers, visit Fidelity's web site or call Fidelity using the contact information listed below.
You may elect to receive all future reports in paper free of charge. If you wish to continue receiving paper copies of your shareholder reports, you may contact your financial intermediary or, if you are a Fidelity customer, visit Fidelity’s website, or call Fidelity at the applicable toll-free number listed below. Your election to receive reports in paper will apply to all funds held with the fund complex/your financial intermediary.
| Account Type | Website | Phone Number |
| Brokerage, Mutual Fund, or Annuity Contracts: | fidelity.com/mailpreferences | 1-800-343-3548 |
| Employer Provided Retirement Accounts: | netbenefits.fidelity.com/preferences (choose 'no' under Required Disclosures to continue to print) | 1-800-343-0860 |
| Advisor Sold Accounts Serviced Through Your Financial Intermediary: | Contact Your Financial Intermediary | Your Financial Intermediary's phone number |
| Advisor Sold Accounts Serviced by Fidelity: | institutional.fidelity.com | 1-877-208-0098 |
Contents
To view a fund's proxy voting guidelines and proxy voting record for the 12-month period ended June 30, visit http://www.fidelity.com/proxyvotingresults or visit the Securities and Exchange Commission's (SEC) web site at http://www.sec.gov.
You may also call 1-800-544-3455 (for managed account clients) or 1-800-835-5092 (for retirement plan participants) to request a free copy of the proxy voting guidelines.
The funds or securities referred to herein are not sponsored, endorsed, or promoted by MSCI, and MSCI bears no liability with respect to any such funds or securities or any index on which such funds or securities are based. The prospectus contains a more detailed description of the limited relationship MSCI has with Fidelity and any related funds.
Standard & Poor's, S&P and S&P 500 are registered service marks of The McGraw-Hill Companies, Inc. and have been licensed for use by Fidelity Distributors Corporation.
Other third-party marks appearing herein are the property of their respective owners.
All other marks appearing herein are registered or unregistered trademarks or service marks of FMR LLC or an affiliated company. © 2020 FMR LLC. All rights reserved.
This report and the financial statements contained herein are submitted for the general information of the shareholders of the Fund. This report is not authorized for distribution to prospective investors in the Fund unless preceded or accompanied by an effective prospectus.
A fund files its complete schedule of portfolio holdings with the SEC for the first and third quarters of each fiscal year on Form N-PORT. Forms N-PORT are available on the SEC’s web site at http://www.sec.gov. A fund's Forms N-PORT may be reviewed and copied at the SEC’s Public Reference Room in Washington, DC. Information regarding the operation of the SEC's Public Reference Room may be obtained by calling 1-800-SEC-0330.
For a complete list of a fund's portfolio holdings, view the most recent holdings listing, semiannual report, or annual report on Fidelity's web site at http://www.fidelity.com, http://www.institutional.fidelity.com, or http://www.401k.com, as applicable.
NOT FDIC INSURED •MAY LOSE VALUE •NO BANK GUARANTEE
Neither the Fund nor Fidelity Distributors Corporation is a bank.
Note to Shareholders:
Early in 2020, the outbreak and spread of a new coronavirus emerged as a public health emergency that had a major influence on financial markets, primarily based on its impact on the global economy and the outlook for corporate earnings. The virus causes a respiratory disease known as COVID-19. On March 11, the World Health Organization declared the COVID-19 outbreak a pandemic, citing sustained risk of further global spread.
In the weeks following, as the crisis worsened, we witnessed an escalating human tragedy with wide-scale social and economic consequences from coronavirus-containment measures. The outbreak of COVID-19 prompted a number of measures to limit the spread, including travel and border restrictions, quarantines, and restrictions on large gatherings. In turn, these resulted in lower consumer activity, diminished demand for a wide range of products and services, disruption in manufacturing and supply chains, and – given the wide variability in outcomes regarding the outbreak – significant market uncertainty and volatility. Amid the turmoil, global governments and central banks took unprecedented action to help support consumers, businesses, and the broader economies, and to limit disruption to financial systems.
The situation continues to unfold, and the extent and duration of its impact on financial markets and the economy remain highly uncertain. Extreme events such as the coronavirus crisis are “exogenous shocks” that can have significant adverse effects on mutual funds and their investments. Although multiple asset classes may be affected by market disruption, the duration and impact may not be the same for all types of assets.
Fidelity is committed to helping you stay informed amid news about COVID-19 and during increased market volatility, and we’re taking extra steps to be responsive to customer needs. We encourage you to visit our websites, where we offer ongoing updates, commentary, and analysis on the markets and our funds.
Performance: The Bottom Line
Average annual total return reflects the change in the value of an investment, assuming reinvestment of distributions from dividend income and capital gains (the profits earned upon the sale of securities that have grown in value, if any) and assuming a constant rate of performance each year. The hypothetical investment and the average annual total returns do not reflect the deduction of taxes that a shareholder would pay on fund distributions or the redemption of fund shares. During periods of reimbursement by Fidelity, a fund’s total return will be greater than it would be had the reimbursement not occurred. How a fund did yesterday is no guarantee of how it will do tomorrow.
Average Annual Total Returns
| For the periods ended October 31, 2020 | Past 1 year | Life of fundA |
| Fidelity Flex® International Fund | 4.64% | 8.33% |
A From March 7, 2017
$10,000 Over Life of Fund
Let's say hypothetically that $10,000 was invested in Fidelity Flex® International Fund on March 7, 2017, when the fund started.
The chart shows how the value of your investment would have changed, and also shows how the MSCI ACWI (All Country World Index) ex USA Index performed over the same period.

| Period Ending Values |
| $13,398 | Fidelity Flex® International Fund |
| $11,731 | MSCI ACWI (All Country World Index) ex USA Index |
Management's Discussion of Fund Performance
Market Recap: The MSCI ACWI (All Country World Index) ex USA Index returned -2.46% for the 12 months ending October 31, 2020, in what was a bumpy ride for non-U.S. equities, marked by a steep but brief decline due to the early-2020 outbreak and spread of the coronavirus, followed by a sharp upturn. Declared a pandemic on March 11, the crisis and containment efforts caused broad contraction in economic activity, elevated volatility and dislocation in financial markets. A historically rapid and expansive monetary- and fiscal-policy response around the world provided a partial offset to the economic disruption. Other supporting factors included resilient corporate earnings and near-term potential for a COVID-19 vaccine breakthrough. This was evident in the index’s 12.28% gain in the final six months of the year. Currency fluctuation generally boosted foreign developed-markets equities for the year, while the reverse was true for emerging-markets stocks. Late in the period, the index was pressured by a second wave of COVID-19 cases in some regions, and stretched valuations and crowded positioning in big tech. For the full year, the U.K. (-22%), Asia Pacific ex Japan (-8%), Canada (-5%) and Europe ex U.K. (-4%) notably lagged. Emerging markets (+9%) and Japan (+1%) outperformed. By sector, energy (-38%), financials and real estate (-20% each) lagged, whereas information technology (+ 25%) and communication services (+15%) topped the index.
Comments from Co-Managers Sam Polyak, Jed Weiss, and Alex Zavratsky: For the fiscal year ending October 31, 2020, the fund gained 4.64%, outperforming the -2.46% result of the benchmark MSCI ACWI (All Country World Index) ex USA Index. From a regional standpoint, an underweighting and stock picks in emerging markets, along with out-of-benchmark security selection in the U.S., contributed most to the fund's relative result. By sector, the primary contributor to performance versus the benchmark was an overweighting in information technology. Security selection in industrials and communication services also lifted the fund's relative return the past 12 months. The biggest individual relative contributor was an overweight position in Haier Smart Home (+66%), which was among the portfolio’s biggest positions at period end. Also bolstering performance was our overweighting in Tencent Holdings, which gained 86%. The company was the fund's largest holding. Another notable relative contributor was an outsized stake in Shenzhen Inovance Tec (+170%). This period we reduced our exposure to the company. Conversely, stock picks in Europe ex U.K. hindered the fund's relative result. By sector, the primary detractor from performance versus the benchmark was an underweighting in consumer discretionary, especially within the retailing industry. Also hurting the fund's relative result was an overweighting in financials and an underweighting in communication services. Not owning Shopify, a benchmark component that gained 193%, was the biggest individual relative detractor versus the benchmark. Also hampering performance was our lighter-than-benchmark stake in Meituan, which gained 211% and was not held at period end. Another notable relative detractor was an overweighting in BP (-57%). Notable changes in positioning include increased exposure to China and a lower allocation to United Kingdom. By sector, meaningful changes in positioning include increased exposure to communication services and health care.
The views expressed above reflect those of the portfolio manager(s) only through the end of the period as stated on the cover of this report and do not necessarily represent the views of Fidelity or any other person in the Fidelity organization. Any such views are subject to change at any time based upon market or other conditions and Fidelity disclaims any responsibility to update such views. These views may not be relied on as investment advice and, because investment decisions for a Fidelity fund are based on numerous factors, may not be relied on as an indication of trading intent on behalf of any Fidelity fund.
Investment Summary (Unaudited)
Geographic Diversification (% of fund's net assets)
| As of October 31, 2020 |
| | Japan | 14.3% |
| | Cayman Islands | 8.8% |
| | United States of America* | 7.8% |
| | Germany | 7.0% |
| | Canada | 6.8% |
| | Switzerland | 6.1% |
| | France | 5.6% |
| | United Kingdom | 4.9% |
| | Taiwan | 4.7% |
| | Other | 34.0% |

* Includes Short-Term investments and Net Other Assets (Liabilities).
Percentages are based on country or territory of incorporation and are adjusted for the effect of futures contracts, if applicable.
Asset Allocation as of October 31, 2020
| | % of fund's net assets |
| Stocks | 97.6 |
| Short-Term Investments and Net Other Assets (Liabilities) | 2.4 |
Top Ten Stocks as of October 31, 2020
| | % of fund's net assets |
| Tencent Holdings Ltd. (Cayman Islands, Interactive Media & Services) | 3.5 |
| Alibaba Group Holding Ltd. sponsored ADR (Cayman Islands, Internet & Direct Marketing Retail) | 2.8 |
| Samsung Electronics Co. Ltd. (Korea (South), Technology Hardware, Storage & Peripherals) | 2.4 |
| Nestle SA (Reg. S) (Switzerland, Food Products) | 1.9 |
| Taiwan Semiconductor Manufacturing Co. Ltd. (Taiwan, Semiconductors & Semiconductor Equipment) | 1.8 |
| Roche Holding AG (participation certificate) (Switzerland, Pharmaceuticals) | 1.6 |
| Haier Smart Home Co. Ltd. (A Shares) (China, Household Durables) | 1.6 |
| Canadian Pacific Railway Ltd. (Canada, Road & Rail) | 1.5 |
| ASML Holding NV (Netherlands) (Netherlands, Semiconductors & Semiconductor Equipment) | 1.3 |
| Keyence Corp. (Japan, Electronic Equipment & Components) | 1.2 |
| | 19.6 |
Top Market Sectors as of October 31, 2020
| | % of fund's net assets |
| Information Technology | 18.1 |
| Financials | 17.8 |
| Industrials | 15.9 |
| Consumer Discretionary | 10.6 |
| Health Care | 9.1 |
| Materials | 8.7 |
| Consumer Staples | 6.2 |
| Communication Services | 6.2 |
| Energy | 2.8 |
| Real Estate | 1.1 |
Schedule of Investments October 31, 2020
Showing Percentage of Net Assets
| Common Stocks - 96.1% | | | |
| | | Shares | Value |
| Australia - 1.5% | | | |
| Commonwealth Bank of Australia | | 5,706 | $277,035 |
| CSL Ltd. | | 4,094 | 828,860 |
| Evolution Mining Ltd. | | 27,303 | 107,040 |
| Imdex Ltd. | | 14,088 | 11,934 |
| Kogan.Com Ltd. | | 1,989 | 28,793 |
| Macquarie Group Ltd. | | 3,128 | 278,892 |
|
| TOTAL AUSTRALIA | | | 1,532,554 |
|
| Austria - 0.2% | | | |
| Erste Group Bank AG | | 9,296 | 190,331 |
| Bailiwick of Jersey - 1.1% | | | |
| Experian PLC | | 15,163 | 555,480 |
| Ferguson PLC | | 2,642 | 262,406 |
| Glencore Xstrata PLC | | 108,991 | 219,861 |
| Integrated Diagnostics Holdings PLC (a) | | 8,388 | 29,484 |
|
| TOTAL BAILIWICK OF JERSEY | | | 1,067,231 |
|
| Belgium - 0.7% | | | |
| Barco NV | | 2,912 | 45,632 |
| KBC Ancora (b) | | 1,226 | 34,697 |
| KBC Groep NV | | 7,694 | 379,311 |
| UCB SA | | 2,057 | 202,915 |
|
| TOTAL BELGIUM | | | 662,555 |
|
| Bermuda - 0.3% | | | |
| Shangri-La Asia Ltd. | | 360,533 | 283,218 |
| Brazil - 1.0% | | | |
| BM&F BOVESPA SA | | 39,964 | 355,556 |
| Suzano Papel e Celulose SA (b) | | 80,514 | 702,294 |
|
| TOTAL BRAZIL | | | 1,057,850 |
|
| Canada - 6.8% | | | |
| Alimentation Couche-Tard, Inc. Class B (sub. vtg.) | | 23,826 | 733,754 |
| Canadian National Railway Co. | | 8,332 | 827,697 |
| Canadian Pacific Railway Ltd. | | 4,920 | 1,470,276 |
| Constellation Software, Inc. | | 801 | 840,855 |
| First Quantum Minerals Ltd. | | 28,149 | 323,472 |
| Franco-Nevada Corp. | | 5,379 | 733,148 |
| McCoy Global, Inc. (b) | | 50 | 19 |
| New Look Vision Group, Inc. | | 1,454 | 33,177 |
| Nutrien Ltd. | | 10,143 | 412,328 |
| Richelieu Hardware Ltd. | | 2,013 | 54,121 |
| Summit Industrial Income REIT | | 2,796 | 28,269 |
| Suncor Energy, Inc. | | 17,051 | 192,356 |
| The Toronto-Dominion Bank | | 20,280 | 894,737 |
| Waste Connection, Inc. (Canada) | | 3,155 | 312,729 |
|
| TOTAL CANADA | | | 6,856,938 |
|
| Cayman Islands - 8.8% | | | |
| Airtac International Group | | 11,955 | 320,928 |
| Alibaba Group Holding Ltd.(b) | | 1,200 | 45,473 |
| Alibaba Group Holding Ltd. sponsored ADR (b) | | 9,025 | 2,749,827 |
| JD.com, Inc. sponsored ADR (b) | | 5,362 | 437,110 |
| Li Ning Co. Ltd. | | 135,706 | 700,192 |
| Sunny Optical Technology Group Co. Ltd. | | 46,801 | 773,929 |
| Tencent Holdings Ltd. | | 46,249 | 3,533,681 |
| Xinyi Solar Holdings Ltd. | | 168,940 | 307,263 |
|
| TOTAL CAYMAN ISLANDS | | | 8,868,403 |
|
| China - 4.5% | | | |
| AVIC Jonhon OptronicTechnology Co. Ltd. | | 42,549 | 353,021 |
| China Life Insurance Co. Ltd. (H Shares) | | 200,507 | 437,491 |
| China Merchants Bank Co. Ltd. (H Shares) | | 151,651 | 788,331 |
| Haier Smart Home Co. Ltd. (A Shares) | | 425,414 | 1,584,712 |
| Hualan Biological Engineer, Inc. (A Shares) | | 36,018 | 276,207 |
| Industrial & Commercial Bank of China Ltd. (H Shares) | | 1,121,806 | 637,034 |
| Shenzhen Inovance Technology Co. Ltd. (A Shares) | | 41,872 | 402,977 |
| Zhejiang Sanhua Intelligent Controls Co. Ltd. (A Shares) | | 8,526 | 31,281 |
|
| TOTAL CHINA | | | 4,511,054 |
|
| Denmark - 0.6% | | | |
| A.P. Moller - Maersk A/S Series B | | 132 | 211,548 |
| Netcompany Group A/S (a)(b) | | 1,143 | 94,952 |
| ORSTED A/S (a) | | 1,505 | 238,865 |
| SimCorp A/S | | 545 | 64,970 |
| Spar Nord Bank A/S | | 3,448 | 29,668 |
|
| TOTAL DENMARK | | | 640,003 |
|
| Finland - 0.6% | | | |
| Admicom OYJ | | 300 | 34,940 |
| Kone OYJ (B Shares) | | 3,946 | 314,071 |
| Musti Group OYJ | | 1,000 | 22,909 |
| Sampo Oyj (A Shares) | | 5,930 | 223,767 |
| Tikkurila Oyj | | 3,673 | 58,776 |
|
| TOTAL FINLAND | | | 654,463 |
|
| France - 5.6% | | | |
| ALTEN (b) | | 686 | 54,848 |
| Atos Origin SA (b) | | 2,797 | 190,891 |
| AXA SA | | 26,624 | 427,563 |
| BNP Paribas SA (b) | | 14,169 | 494,141 |
| Capgemini SA | | 2,179 | 251,595 |
| Edenred SA | | 5,559 | 259,231 |
| Laurent-Perrier Group SA | | 290 | 23,845 |
| Lectra | | 774 | 17,794 |
| Legrand SA | | 3,986 | 294,693 |
| LVMH Moet Hennessy Louis Vuitton SE | | 1,551 | 727,028 |
| Natixis SA (b) | | 25,023 | 58,170 |
| Sanofi SA | | 11,001 | 993,318 |
| SR Teleperformance SA | | 1,075 | 322,640 |
| Total SA | | 21,947 | 664,922 |
| Vetoquinol SA | | 671 | 63,300 |
| VINCI SA | | 3,847 | 303,856 |
| Vivendi SA | | 12,494 | 360,723 |
| Worldline SA (a)(b) | | 2,171 | 160,911 |
|
| TOTAL FRANCE | | | 5,669,469 |
|
| Germany - 6.4% | | | |
| Bayer AG | | 7,316 | 343,783 |
| CompuGroup Medical AG | | 1,209 | 103,563 |
| CTS Eventim AG | | 1,502 | 66,544 |
| Deutsche Borse AG | | 2,044 | 300,782 |
| Deutsche Post AG | | 8,047 | 356,509 |
| Hannover Reuck SE | | 1,982 | 287,850 |
| HeidelbergCement AG | | 4,061 | 232,320 |
| Infineon Technologies AG | | 10,717 | 298,374 |
| Linde PLC | | 5,315 | 1,164,980 |
| Muenchener Rueckversicherungs-Gesellschaft AG in Muenchen | | 1,266 | 296,069 |
| Nexus AG | | 419 | 23,326 |
| Rheinmetall AG | | 1,997 | 145,828 |
| RWE AG | | 7,818 | 289,455 |
| SAP SE | | 8,211 | 875,988 |
| Siemens AG | | 6,917 | 811,228 |
| Vonovia SE | | 13,404 | 855,793 |
|
| TOTAL GERMANY | | | 6,452,392 |
|
| Hong Kong - 2.9% | | | |
| AIA Group Ltd. | | 118,190 | 1,124,835 |
| China Resources Beer Holdings Co. Ltd. | | 154,317 | 956,457 |
| CNOOC Ltd. sponsored ADR | | 4,365 | 402,104 |
| Hong Kong Exchanges and Clearing Ltd. | | 10,380 | 495,669 |
|
| TOTAL HONG KONG | | | 2,979,065 |
|
| Hungary - 0.7% | | | |
| Richter Gedeon PLC | | 32,656 | 666,124 |
| India - 1.9% | | | |
| Embassy Office Parks (REIT) | | 8,000 | 36,928 |
| Housing Development Finance Corp. Ltd. | | 26,707 | 688,754 |
| Indian Energy Exchange Ltd. (a) | | 6,121 | 15,698 |
| Larsen & Toubro Ltd. | | 36,426 | 453,678 |
| Reliance Industries Ltd. sponsored GDR (a) | | 1,956 | 107,384 |
| Shree Cement Ltd. | | 1,138 | 331,097 |
| Solar Industries India Ltd. (b) | | 19,530 | 264,457 |
|
| TOTAL INDIA | | | 1,897,996 |
|
| Indonesia - 0.7% | | | |
| PT Bank Mandiri (Persero) Tbk | | 1,577,795 | 614,600 |
| PT Bank Rakyat Indonesia Tbk | | 396,315 | 89,715 |
|
| TOTAL INDONESIA | | | 704,315 |
|
| Ireland - 0.9% | | | |
| CRH PLC | | 12,236 | 428,159 |
| CRH PLC sponsored ADR | | 8,577 | 301,482 |
| FBD Holdings PLC (b) | | 500 | 3,610 |
| Ryanair Holdings PLC (b) | | 400 | 5,512 |
| Ryanair Holdings PLC sponsored ADR (b) | | 1,924 | 155,074 |
|
| TOTAL IRELAND | | | 893,837 |
|
| Israel - 0.4% | | | |
| Elbit Systems Ltd. (Israel) | | 2,437 | 275,766 |
| Ituran Location & Control Ltd. | | 2,066 | 29,234 |
| Maytronics Ltd. | | 2,237 | 34,361 |
| Strauss Group Ltd. | | 3,066 | 88,654 |
| Tel Aviv Stock Exchange Ltd. | | 4,900 | 21,254 |
|
| TOTAL ISRAEL | | | 449,269 |
|
| Italy - 1.3% | | | |
| Assicurazioni Generali SpA | | 12,377 | 165,915 |
| Enel SpA | | 80,382 | 639,078 |
| Interpump Group SpA | | 8,303 | 313,311 |
| Mediobanca SpA | | 27,040 | 191,724 |
|
| TOTAL ITALY | | | 1,310,028 |
|
| Japan - 14.3% | | | |
| Ai Holdings Corp. | | 1,230 | 21,626 |
| Aoki Super Co. Ltd. | | 1,118 | 29,284 |
| Artnature, Inc. | | 2,200 | 12,748 |
| Aucnet, Inc. | | 1,454 | 19,330 |
| Azbil Corp. | | 14,636 | 593,977 |
| Broadleaf Co. Ltd. | | 11,407 | 59,667 |
| Central Automotive Products Ltd. | | 500 | 9,739 |
| Century21 Real Estate Japan Ltd. | | 300 | 3,018 |
| Curves Holdings Co. Ltd. | | 5,400 | 33,178 |
| Daiichikosho Co. Ltd. | | 1,700 | 58,169 |
| Daikokutenbussan Co. Ltd. | | 800 | 43,523 |
| DENSO Corp. | | 6,141 | 286,150 |
| FANUC Corp. | | 4,152 | 877,006 |
| Fujitsu Ltd. | | 2,007 | 237,457 |
| Funai Soken Holdings, Inc. | | 1,500 | 32,447 |
| Goldcrest Co. Ltd. | | 3,310 | 42,293 |
| Hoya Corp. | | 9,247 | 1,043,588 |
| Ibiden Co. Ltd. | | 4,231 | 172,513 |
| Idemitsu Kosan Co. Ltd. | | 7,512 | 151,922 |
| Itochu Corp. | | 16,971 | 407,618 |
| Iwatsuka Confectionary Co. Ltd. | | 100 | 3,500 |
| Kao Corp. | | 2,676 | 190,528 |
| Keyence Corp. | | 2,606 | 1,182,661 |
| Kobayashi Pharmaceutical Co. Ltd. | | 615 | 59,929 |
| Koshidaka Holdings Co. Ltd. | | 5,100 | 19,078 |
| Kusuri No Aoki Holdings Co. Ltd. | | 600 | 47,896 |
| Lasertec Corp. | | 4,250 | 368,138 |
| Medikit Co. Ltd. | | 1,342 | 39,432 |
| Minebea Mitsumi, Inc. | | 15,585 | 281,486 |
| Miroku Jyoho Service Co., Ltd. | | 1,454 | 29,450 |
| Misumi Group, Inc. | | 21,297 | 632,512 |
| Mitsubishi Estate Co. Ltd. | | 10,152 | 151,426 |
| Mitsubishi UFJ Financial Group, Inc. | | 79,803 | 314,576 |
| Mitsuboshi Belting Ltd. | | 1,677 | 26,253 |
| Mitsui Fudosan Co. Ltd. | | 7,421 | 126,362 |
| Nabtesco Corp. | | 5,300 | 197,999 |
| Nagaileben Co. Ltd. | | 3,243 | 81,149 |
| Nihon Parkerizing Co. Ltd. | | 7,800 | 76,870 |
| NS Tool Co. Ltd. | | 1,342 | 28,805 |
| OBIC Co. Ltd. | | 2,260 | 400,117 |
| Oracle Corp. Japan | | 1,704 | 170,298 |
| ORIX Corp. | | 21,398 | 250,255 |
| OSG Corp. | | 10,400 | 155,803 |
| Paramount Bed Holdings Co. Ltd. | | 1,600 | 61,645 |
| Poletowin Pitcrew Holdings, Inc. | | 1,500 | 13,068 |
| ProNexus, Inc. | | 2,187 | 22,751 |
| Recruit Holdings Co. Ltd. | | 17,384 | 661,473 |
| San-Ai Oil Co. Ltd. | | 3,900 | 39,322 |
| Shin-Etsu Chemical Co. Ltd. | | 3,340 | 446,113 |
| Shinsei Bank Ltd. | | 15,482 | 186,272 |
| SHO-BOND Holdings Co. Ltd. | | 8,118 | 391,842 |
| Shoei Co. Ltd. | | 3,100 | 94,404 |
| SK Kaken Co. Ltd. | | 140 | 53,193 |
| SoftBank Group Corp. | | 6,725 | 438,025 |
| Software Service, Inc. | | 500 | 53,873 |
| Sony Corp. | | 5,068 | 422,501 |
| Sumitomo Mitsui Financial Group, Inc. | | 12,112 | 335,283 |
| Suzuki Motor Corp. | | 6,856 | 294,449 |
| Takeda Pharmaceutical Co. Ltd. | | 4,294 | 132,696 |
| The Monogatari Corp. | | 263 | 26,876 |
| TKC Corp. | | 600 | 37,182 |
| Tocalo Co. Ltd. | | 2,858 | 28,489 |
| Tokio Marine Holdings, Inc. | | 7,596 | 339,501 |
| Tokyo Electron Ltd. | | 688 | 184,667 |
| Toyota Motor Corp. | | 13,178 | 865,095 |
| USS Co. Ltd. | | 18,200 | 332,889 |
| Welcia Holdings Co. Ltd. | | 1,342 | 52,595 |
| Workman Co. Ltd. | | 300 | 26,601 |
| Yamato Kogyo Co. Ltd. | | 400 | 9,606 |
|
| TOTAL JAPAN | | | 14,520,187 |
|
| Kenya - 0.2% | | | |
| Safaricom Ltd. | | 546,547 | 154,972 |
| Korea (South) - 3.5% | | | |
| BGF Retail Co. Ltd. | | 733 | 76,056 |
| Hyundai Motor Co. | | 3,109 | 454,085 |
| Leeno Industrial, Inc. | | 339 | 36,384 |
| Samsung Electronics Co. Ltd. | | 48,766 | 2,445,876 |
| Shinhan Financial Group Co. Ltd. | | 19,989 | 541,157 |
|
| TOTAL KOREA (SOUTH) | | | 3,553,558 |
|
| Luxembourg - 0.1% | | | |
| ArcelorMittal SA (Netherlands) (b) | | 10,893 | 147,823 |
| Mexico - 1.9% | | | |
| CEMEX S.A.B. de CV sponsored ADR | | 134,241 | 557,100 |
| Grupo Financiero Banorte S.A.B. de CV Series O (b) | | 117,333 | 522,734 |
| Wal-Mart de Mexico SA de CV Series V | | 339,630 | 820,594 |
|
| TOTAL MEXICO | | | 1,900,428 |
|
| Netherlands - 2.2% | | | |
| Aalberts Industries NV | | 2,842 | 95,459 |
| AerCap Holdings NV (b) | | 2,951 | 73,273 |
| ASML Holding NV (Netherlands) | | 3,585 | 1,297,064 |
| Koninklijke Philips Electronics NV | | 5,953 | 275,724 |
| NN Group NV | | 6,658 | 232,162 |
| Yandex NV Series A (b) | | 4,348 | 250,314 |
|
| TOTAL NETHERLANDS | | | 2,223,996 |
|
| New Zealand - 0.1% | | | |
| Auckland International Airport Ltd. | | 19,251 | 89,053 |
| Norway - 0.4% | | | |
| Adevinta ASA Class B (b) | | 8,425 | 130,170 |
| Kongsberg Gruppen ASA | | 2,014 | 32,615 |
| Medistim ASA | | 895 | 19,406 |
| Schibsted ASA (B Shares) | | 5,443 | 195,333 |
| Skandiabanken ASA (a) | | 4,252 | 26,946 |
|
| TOTAL NORWAY | | | 404,470 |
|
| Philippines - 0.0% | | | |
| Jollibee Food Corp. | | 5,226 | 18,272 |
| Portugal - 0.1% | | | |
| Galp Energia SGPS SA Class B | | 12,496 | 101,482 |
| Russia - 0.5% | | | |
| Lukoil PJSC sponsored ADR | | 4,989 | 254,738 |
| Sberbank of Russia sponsored ADR | | 26,123 | 263,842 |
|
| TOTAL RUSSIA | | | 518,580 |
|
| Singapore - 0.2% | | | |
| United Overseas Bank Ltd. | | 15,670 | 217,726 |
| South Africa - 0.6% | | | |
| Clicks Group Ltd. | | 14,987 | 216,763 |
| Impala Platinum Holdings Ltd. | | 46,574 | 414,524 |
|
| TOTAL SOUTH AFRICA | | | 631,287 |
|
| Spain - 1.2% | | | |
| Amadeus IT Holding SA Class A | | 6,694 | 319,565 |
| Banco Santander SA (Spain) | | 176,851 | 354,154 |
| Cellnex Telecom SA (a) | | 7,472 | 479,669 |
| Fluidra SA | | 3,216 | 58,130 |
| Unicaja Banco SA (a) | | 71,359 | 45,419 |
|
| TOTAL SPAIN | | | 1,256,937 |
|
| Sweden - 2.8% | | | |
| Addlife AB | | 8,115 | 122,039 |
| AddTech AB (B Shares) | | 13,421 | 148,562 |
| ASSA ABLOY AB (B Shares) | | 27,959 | 599,230 |
| Atlas Copco AB (A Shares) | | 12,374 | 546,362 |
| Bygghemma Group First AB (b) | | 1,000 | 15,621 |
| Epiroc AB Class A | | 17,615 | 263,283 |
| Ericsson (B Shares) | | 39,338 | 439,190 |
| Investor AB (B Shares) | | 7,048 | 423,273 |
| INVISIO AB | | 1,476 | 26,606 |
| John Mattson Fastighetsforetag (b) | | 1,342 | 22,592 |
| Lagercrantz Group AB (B Shares) | | 17,004 | 104,794 |
| Volvo AB (B Shares) | | 7,502 | 145,978 |
|
| TOTAL SWEDEN | | | 2,857,530 |
|
| Switzerland - 6.1% | | | |
| Nestle SA (Reg. S) | | 17,040 | 1,916,624 |
| Novartis AG | | 10,487 | 817,174 |
| Roche Holding AG (participation certificate) | | 5,117 | 1,644,253 |
| Schindler Holding AG: | | | |
| (participation certificate) | | 1,363 | 348,572 |
| (Reg.) | | 139 | 35,684 |
| Siemens Energy AG (b) | | 4,483 | 98,157 |
| Swiss Life Holding AG | | 405 | 136,126 |
| Tecan Group AG | | 310 | 147,064 |
| Temenos Group AG | | 1,000 | 107,356 |
| UBS Group AG | | 33,902 | 396,314 |
| Zurich Insurance Group Ltd. | | 1,747 | 580,258 |
|
| TOTAL SWITZERLAND | | | 6,227,582 |
|
| Taiwan - 4.7% | | | |
| Addcn Technology Co. Ltd. | | 4,218 | 30,446 |
| ASE Technology Holding Co. Ltd. | | 157,000 | 352,329 |
| ECLAT Textile Co. Ltd. | | 24,321 | 321,769 |
| HIWIN Technologies Corp. | | 60,896 | 530,012 |
| MediaTek, Inc. | | 16,321 | 386,789 |
| Sporton International, Inc. | | 39,246 | 312,772 |
| Taiwan Semiconductor Manufacturing Co. Ltd. | | 117,929 | 1,783,884 |
| Unified-President Enterprises Corp. | | 333,355 | 714,274 |
| Yageo Corp. | | 25,516 | 317,066 |
|
| TOTAL TAIWAN | | | 4,749,341 |
|
| United Kingdom - 4.9% | | | |
| Alliance Pharma PLC | | 39,948 | 38,038 |
| Anglo American PLC (United Kingdom) | | 18,522 | 434,602 |
| AstraZeneca PLC (United Kingdom) | | 2,769 | 278,023 |
| Avon Rubber PLC | | 3,415 | 173,647 |
| Beazley PLC | | 17,110 | 65,168 |
| BHP Billiton PLC | | 47,046 | 911,392 |
| Bodycote PLC | | 3,419 | 28,813 |
| BP PLC | | 179,220 | 457,134 |
| Clarkson PLC | | 959 | 24,972 |
| Dechra Pharmaceuticals PLC | | 5,554 | 251,257 |
| DP Poland PLC (b)(c) | | 36,259 | 3,406 |
| Hilton Food Group PLC | | 368 | 5,530 |
| Howden Joinery Group PLC | | 5,158 | 42,552 |
| Imperial Brands PLC | | 10,164 | 161,170 |
| InterContinental Hotel Group PLC ADR | | 3,117 | 159,403 |
| Lloyds Banking Group PLC | | 546,629 | 199,032 |
| London Stock Exchange Group PLC | | 3,236 | 348,834 |
| Prudential PLC | | 1,409 | 17,233 |
| Rightmove PLC | | 27,602 | 220,987 |
| Royal Dutch Shell PLC Class B sponsored ADR | | 6,046 | 146,011 |
| RSA Insurance Group PLC | | 32,515 | 178,434 |
| Spectris PLC | | 10,080 | 323,332 |
| Spirax-Sarco Engineering PLC | | 1,474 | 215,399 |
| Standard Chartered PLC (United Kingdom) | | 40,809 | 185,990 |
| Standard Life PLC | | 1,343 | 3,906 |
| Ultra Electronics Holdings PLC | | 1,652 | 40,235 |
|
| TOTAL UNITED KINGDOM | | | 4,914,500 |
|
| United States of America - 5.4% | | | |
| Alphabet, Inc. Class A (b) | | 161 | 260,194 |
| Autoliv, Inc. | | 2,010 | 152,358 |
| Black Knight, Inc. (b) | | 2,922 | 256,990 |
| Lam Research Corp. | | 890 | 304,451 |
| Marsh & McLennan Companies, Inc. | | 4,120 | 426,255 |
| MasterCard, Inc. Class A | | 2,125 | 613,360 |
| Moody's Corp. | | 1,629 | 428,264 |
| Morningstar, Inc. | | 263 | 50,070 |
| MSCI, Inc. | | 1,286 | 449,894 |
| NICE Systems Ltd. sponsored ADR (b) | | 1,715 | 391,466 |
| PriceSmart, Inc. | | 1,639 | 113,091 |
| ResMed, Inc. | | 2,800 | 537,432 |
| S&P Global, Inc. | | 1,333 | 430,199 |
| Sherwin-Williams Co. | | 689 | 474,018 |
| Visa, Inc. Class A | | 3,419 | 621,266 |
|
| TOTAL UNITED STATES OF AMERICA | | | 5,509,308 |
|
| TOTAL COMMON STOCKS | | | |
| (Cost $88,440,695) | | | 97,344,127 |
|
| Nonconvertible Preferred Stocks - 1.5% | | | |
| Brazil - 0.9% | | | |
| Itau Unibanco Holding SA | | 144,461 | 591,142 |
| Petroleo Brasileiro SA - Petrobras sponsored ADR | | 47,161 | 312,677 |
|
| TOTAL BRAZIL | | | 903,819 |
|
| Germany - 0.6% | | | |
| Porsche Automobil Holding SE (Germany) | | 9,065 | 485,647 |
| Sartorius AG (non-vtg.) | | 246 | 104,116 |
|
| TOTAL GERMANY | | | 589,763 |
|
| TOTAL NONCONVERTIBLE PREFERRED STOCKS | | | |
| (Cost $1,906,959) | | | 1,493,582 |
|
| Money Market Funds - 2.0% | | | |
| Fidelity Cash Central Fund 0.10% (d) | | | |
| (Cost $2,079,432) | | 2,079,022 | 2,079,438 |
| TOTAL INVESTMENT IN SECURITIES - 99.6% | | | |
| (Cost $92,427,086) | | | 100,917,147 |
| NET OTHER ASSETS (LIABILITIES) - 0.4% | | | 405,652 |
| NET ASSETS - 100% | | | $101,322,799 |
Categorizations in the Schedule of Investments are based on country or territory of incorporation.
Legend
(a) Security exempt from registration under Rule 144A of the Securities Act of 1933. These securities may be resold in transactions exempt from registration, normally to qualified institutional buyers. At the end of the period, the value of these securities amounted to $1,199,328 or 1.2% of net assets.
(b) Non-income producing
(c) Level 3 security
(d) Affiliated fund that is generally available only to investment companies and other accounts managed by Fidelity Investments. The rate quoted is the annualized seven-day yield of the fund at period end. A complete unaudited listing of the fund's holdings as of its most recent quarter end is available upon request. In addition, each Fidelity Central Fund's financial statements, which are not covered by the Fund's Report of Independent Registered Public Accounting Firm, are available on the SEC's website or upon request.
Affiliated Central Funds
Information regarding fiscal year to date income earned by the Fund from investments in Fidelity Central Funds is as follows:
| Fund | Income earned |
| Fidelity Cash Central Fund | $11,391 |
| Fidelity Securities Lending Cash Central Fund | 512 |
| Total | $11,903 |
Amounts in the income column in the above table include any capital gain distributions from underlying funds, which are presented in the corresponding line-item in the Statement of Operations, if applicable. Amount for Fidelity Securities Lending Cash Central Fund represents the income earned on investing cash collateral, less rebates paid to borrowers and any lending agent fees associated with the loan, plus any premium payments received for lending certain types of securities.
Investment Valuation
The following is a summary of the inputs used, as of October 31, 2020, involving the Fund's assets and liabilities carried at fair value. The inputs or methodology used for valuing securities may not be an indication of the risk associated with investing in those securities. For more information on valuation inputs, and their aggregation into the levels used below, please refer to the Investment Valuation section in the accompanying Notes to Financial Statements.
| | Valuation Inputs at Reporting Date: |
| Description | Total | Level 1 | Level 2 | Level 3 |
| Investments in Securities: | | | | |
| Equities: | | | | |
| Communication Services | $6,179,227 | $2,149,352 | $4,029,875 | $-- |
| Consumer Discretionary | 10,687,651 | 5,395,592 | 5,288,653 | 3,406 |
| Consumer Staples | 6,266,815 | 3,617,369 | 2,649,446 | -- |
| Energy | 2,830,071 | 1,415,289 | 1,414,782 | -- |
| Financials | 18,343,618 | 9,573,579 | 8,770,039 | -- |
| Health Care | 9,177,789 | 2,308,064 | 6,869,725 | -- |
| Industrials | 15,875,459 | 9,215,954 | 6,659,505 | -- |
| Information Technology | 18,226,411 | 6,873,480 | 11,352,931 | -- |
| Materials | 8,816,589 | 5,542,343 | 3,274,246 | -- |
| Real Estate | 1,266,681 | 906,654 | 360,027 | -- |
| Utilities | 1,167,398 | 528,320 | 639,078 | -- |
| Money Market Funds | 2,079,438 | 2,079,438 | -- | -- |
| Total Investments in Securities: | $100,917,147 | $49,605,434 | $51,308,307 | $3,406 |
See accompanying notes which are an integral part of the financial statements.
Financial Statements
Statement of Assets and Liabilities
| | | October 31, 2020 |
| Assets | | |
Investment in securities, at value — See accompanying schedule:
Unaffiliated issuers (cost $90,347,654) | $98,837,709 | |
| Fidelity Central Funds (cost $2,079,432) | 2,079,438 | |
| Total Investment in Securities (cost $92,427,086) | | $100,917,147 |
| Cash | | 51,425 |
| Foreign currency held at value (cost $1,571) | | 1,566 |
| Receivable for investments sold | | 102,799 |
| Receivable for fund shares sold | | 68,558 |
| Dividends receivable | | 252,861 |
| Distributions receivable from Fidelity Central Funds | | 247 |
| Other receivables | | 1,305 |
| Total assets | | 101,395,908 |
| Liabilities | | |
| Payable for investments purchased | $44,735 | |
| Payable for fund shares redeemed | 28,374 | |
| Total liabilities | | 73,109 |
| Net Assets | | $101,322,799 |
| Net Assets consist of: | | |
| Paid in capital | | $98,361,693 |
| Total accumulated earnings (loss) | | 2,961,106 |
| Net Assets | | $101,322,799 |
| Net Asset Value, offering price and redemption price per share ($101,322,799 ÷ 7,970,459 shares) | | $12.71 |
See accompanying notes which are an integral part of the financial statements.
Statement of Operations
| | | Year ended October 31, 2020 |
| Investment Income | | |
| Dividends | | $1,776,332 |
| Non-Cash dividends | | 87,331 |
| Income from Fidelity Central Funds (including $512 from security lending) | | 11,903 |
| Income before foreign taxes withheld | | 1,875,566 |
| Less foreign taxes withheld | | (185,075) |
| Total income | | 1,690,491 |
| Expenses | | |
| Independent trustees' fees and expenses | $457 | |
| Proxy | 1,228 | |
| Commitment fees | 192 | |
| Total expenses before reductions | 1,877 | |
| Expense reductions | (245) | |
| Total expenses after reductions | | 1,632 |
| Net investment income (loss) | | 1,688,859 |
| Realized and Unrealized Gain (Loss) | | |
| Net realized gain (loss) on: | | |
| Investment securities: | | |
| Unaffiliated issuers | (2,023,729) | |
| Fidelity Central Funds | (127) | |
| Foreign currency transactions | (22,212) | |
| Total net realized gain (loss) | | (2,046,068) |
| Change in net unrealized appreciation (depreciation) on: | | |
| Investment securities: | | |
| Unaffiliated issuers (net of increase in deferred foreign taxes of $1,349) | 3,651,140 | |
| Fidelity Central Funds | (1) | |
| Assets and liabilities in foreign currencies | 5,027 | |
| Total change in net unrealized appreciation (depreciation) | | 3,656,166 |
| Net gain (loss) | | 1,610,098 |
| Net increase (decrease) in net assets resulting from operations | | $3,298,957 |
See accompanying notes which are an integral part of the financial statements.
Statement of Changes in Net Assets
| | Year ended October 31, 2020 | Year ended October 31, 2019 |
| Increase (Decrease) in Net Assets | | |
| Operations | | |
| Net investment income (loss) | $1,688,859 | $1,336,189 |
| Net realized gain (loss) | (2,046,068) | (2,451,508) |
| Change in net unrealized appreciation (depreciation) | 3,656,166 | 7,857,984 |
| Net increase (decrease) in net assets resulting from operations | 3,298,957 | 6,742,665 |
| Distributions to shareholders | (1,400,835) | (958,596) |
| Share transactions | | |
| Proceeds from sales of shares | 54,680,643 | 42,380,730 |
| Reinvestment of distributions | 1,400,835 | 958,596 |
| Cost of shares redeemed | (27,154,153) | (25,018,062) |
| Net increase (decrease) in net assets resulting from share transactions | 28,927,325 | 18,321,264 |
| Total increase (decrease) in net assets | 30,825,447 | 24,105,333 |
| Net Assets | | |
| Beginning of period | 70,497,352 | 46,392,019 |
| End of period | $101,322,799 | $70,497,352 |
| Other Information | | |
| Shares | | |
| Sold | 4,418,298 | 3,597,071 |
| Issued in reinvestment of distributions | 112,246 | 92,439 |
| Redeemed | (2,265,293) | (2,240,142) |
| Net increase (decrease) | 2,265,251 | 1,449,368 |
See accompanying notes which are an integral part of the financial statements.
Financial Highlights
Fidelity Flex International Fund
| | | | | |
| Years ended October 31, | 2020 | 2019 | 2018 | 2017 A |
| Selected Per–Share Data | | | | |
| Net asset value, beginning of period | $12.36 | $10.90 | $11.95 | $10.00 |
| Income from Investment Operations | | | | |
| Net investment income (loss)B | .24 | .35C | .30 | .16 |
| Net realized and unrealized gain (loss) | .33 | 1.39 | (1.24) | 1.79 |
| Total from investment operations | .57 | 1.74 | (.94) | 1.95 |
| Distributions from net investment income | (.22) | (.28) | (.07) | – |
| Distributions from net realized gain | – | – | (.03) | – |
| Total distributions | (.22) | (.28) | (.11)D | – |
| Net asset value, end of period | $12.71 | $12.36 | $10.90 | $11.95 |
| Total ReturnE,F | 4.64% | 16.45% | (7.98)% | 19.50% |
| Ratios to Average Net AssetsG,H | | | | |
| Expenses before reductionsI | -% | -% | -% | - %J |
| Expenses net of fee waivers, if anyI | -% | -% | -% | - %J |
| Expenses net of all reductionsI | -% | -% | -% | - %J |
| Net investment income (loss) | 1.98% | 3.01%C | 2.53% | 2.24%J |
| Supplemental Data | | | | |
| Net assets, end of period (000 omitted) | $101,323 | $70,497 | $46,392 | $14,611 |
| Portfolio turnover rateK | 38% | 89% | 69% | 35%J |
A For the period March 7, 2017 (commencement of operations) to October 31, 2017.
B Calculated based on average shares outstanding during the period.
C Net investment income per share reflects one or more large, non-recurring dividend which amounted to $.04 per share. Excluding such non-recurring dividend, the ratio of net investment income (loss) to average net assets would have been 2.65%.
D Total distributions per share do not sum due to rounding.
E Total returns for periods of less than one year are not annualized.
F Total returns would have been lower if certain expenses had not been reduced during the applicable periods shown.
G Fees and expenses of any underlying mutual funds or exchange-traded funds (ETFs) are not included in the Fund's expense ratio. The Fund indirectly bears its proportionate share of these expenses. For additional expense information related to investments in Fidelity Central Funds, please refer to the "Investments in Fidelity Central Funds" note found in the Notes to Financial Statements section of the most recent Annual or Semi-Annual report.
H Expense ratios reflect operating expenses of the class. Expenses before reductions do not reflect amounts reimbursed, waived, or reduced through arrangements with the investment advisor, brokerage services, or other offset arrangements, if applicable, and do not represent the amount paid by the class during periods when reimbursements, waivers or reductions occur.
I Amount represents less than .005%.
J Annualized
K Amount does not include the portfolio activity of any underlying mutual funds or exchange-traded funds (ETFs).
See accompanying notes which are an integral part of the financial statements.
Notes to Financial Statements
For the period ended October 31, 2020
1. Organization.
Fidelity Flex International Fund (the Fund) is a fund of Fidelity Investment Trust (the Trust) and is authorized to issue an unlimited number of shares. Share transactions on the Statement of Changes in Net Assets may contain exchanges between affiliated funds. The Trust is registered under the Investment Company Act of 1940, as amended (the 1940 Act), as an open-end management investment company organized as a Massachusetts business trust. The Fund is available only to certain fee-based accounts and advisory programs offered by Fidelity. The Fund's investments in emerging markets can be subject to social, economic, regulatory, and political uncertainties and can be extremely volatile.
Effective January 1, 2020:
Investment advisers Fidelity Investments Money Management, Inc., FMR Co., Inc., and Fidelity SelectCo, LLC, merged with and into Fidelity Management & Research Company. In connection with the merger transactions, the resulting, merged investment adviser was then redomiciled from Massachusetts to Delaware, changed its corporate structure from a corporation to a limited liability company, and changed its name to "Fidelity Management & Research Company LLC".
2. Investments in Fidelity Central Funds.
The Fund invests in Fidelity Central Funds, which are open-end investment companies generally available only to other investment companies and accounts managed by the investment adviser and its affiliates. The Fund's Schedule of Investments lists each of the Fidelity Central Funds held as of period end, if any, as an investment of the Fund, but does not include the underlying holdings of each Fidelity Central Fund. As an Investing Fund, the Fund indirectly bears its proportionate share of the expenses of the underlying Fidelity Central Funds.
The Money Market Central Funds seek preservation of capital and current income and are managed by the investment adviser. Annualized expenses of the Money Market Central Funds as of their most recent shareholder report date ranged from less than .005% to .01%.
A complete unaudited list of holdings for each Fidelity Central Fund is available upon request or at the Securities and Exchange Commission (the SEC) website at www.sec.gov. In addition, the financial statements of the Fidelity Central Funds, which are not covered by the Fund's Report of Independent Registered Public Accounting Firm, are available on the SEC website or upon request.
3. Significant Accounting Policies.
The Fund is an investment company and applies the accounting and reporting guidance of the Financial Accounting Standards Board (FASB) Accounting Standards Codification Topic 946 Financial Services – Investment Companies. The financial statements have been prepared in conformity with accounting principles generally accepted in the United States of America (GAAP), which require management to make certain estimates and assumptions at the date of the financial statements. Actual results could differ from those estimates. Subsequent events, if any, through the date that the financial statements were issued have been evaluated in the preparation of the financial statements. The following summarizes the significant accounting policies of the Fund:
Investment Valuation. Investments are valued as of 4:00 p.m. Eastern time on the last calendar day of the period. The Board of Trustees (the Board) has delegated the day to day responsibility for the valuation of the Fund's investments to the Fair Value Committee (the Committee) established by the Fund's investment adviser. In accordance with valuation policies and procedures approved by the Board, the Fund attempts to obtain prices from one or more third party pricing vendors or brokers to value its investments. When current market prices, quotations or currency exchange rates are not readily available or reliable, investments will be fair valued in good faith by the Committee, in accordance with procedures adopted by the Board. Factors used in determining fair value vary by investment type and may include market or investment specific events. The frequency with which these procedures are used cannot be predicted and they may be utilized to a significant extent. The Committee oversees the Fund's valuation policies and procedures and reports to the Board on the Committee's activities and fair value determinations. The Board monitors the appropriateness of the procedures used in valuing the Fund's investments and ratifies the fair value determinations of the Committee.
The Fund categorizes the inputs to valuation techniques used to value its investments into a disclosure hierarchy consisting of three levels as shown below:
- Level 1 – quoted prices in active markets for identical investments
- Level 2 – other significant observable inputs (including quoted prices for similar investments, interest rates, prepayment speeds, etc.)
- Level 3 – unobservable inputs (including the Fund's own assumptions based on the best information available)
Valuation techniques used to value the Fund's investments by major category are as follows:
Equity securities, including restricted securities, for which market quotations are readily available, are valued at the last reported sale price or official closing price as reported by a third party pricing vendor on the primary market or exchange on which they are traded and are categorized as Level 1 in the hierarchy. In the event there were no sales during the day or closing prices are not available, securities are valued at the last quoted bid price or may be valued using the last available price and are generally categorized as Level 2 in the hierarchy. For foreign equity securities, when market or security specific events arise, comparisons to the valuation of American Depositary Receipts (ADRs), futures contracts, Exchange-Traded Funds (ETFs) and certain indexes as well as quoted prices for similar securities may be used and would be categorized as Level 2 in the hierarchy. For equity securities, including restricted securities, where observable inputs are limited, assumptions about market activity and risk are used and these securities may be categorized as Level 3 in the hierarchy.
Investments in open-end mutual funds, including the Fidelity Central Funds, are valued at their closing net asset value (NAV) each business day and are categorized as Level 1 in the hierarchy.
Changes in valuation techniques may result in transfers in or out of an assigned level within the disclosure hierarchy. The aggregate value of investments by input level as of October 31, 2020 is included at the end of the Fund's Schedule of Investments.
Foreign Currency. Certain Funds may use foreign currency contracts to facilitate transactions in foreign-denominated securities. Gains and losses from these transactions may arise from changes in the value of the foreign currency or if the counterparties do not perform under the contracts' terms.
Foreign-denominated assets, including investment securities, and liabilities are translated into U.S. dollars at the exchange rates at period end. Purchases and sales of investment securities, income and dividends received, and expenses denominated in foreign currencies are translated into U.S. dollars at the exchange rate in effect on the transaction date.
The effects of exchange rate fluctuations on investments are included with the net realized and unrealized gain (loss) on investment securities. Other foreign currency transactions resulting in realized and unrealized gain (loss) are disclosed separately.
Investment Transactions and Income. For financial reporting purposes, the Fund's investment holdings and NAV include trades executed through the end of the last business day of the period. The NAV per share for processing shareholder transactions is calculated as of the close of business of the New York Stock Exchange (NYSE), normally 4:00 p.m. Eastern time and includes trades executed through the end of the prior business day. Gains and losses on securities sold are determined on the basis of identified cost. Dividend income is recorded on the ex-dividend date, except for certain dividends from foreign securities where the ex-dividend date may have passed, which are recorded as soon as the Fund is informed of the ex-dividend date. Non-cash dividends included in dividend income, if any, are recorded at the fair market value of the securities received. Income and capital gain distributions from Fidelity Central Funds, if any, are recorded on the ex-dividend date. Certain distributions received by the Fund represent a return of capital or capital gain. The Fund determines the components of these distributions subsequent to the ex-dividend date, based upon receipt of tax filings or other correspondence relating to the underlying investment. These distributions are recorded as a reduction of cost of investments and/or as a realized gain. Investment income is recorded net of foreign taxes withheld where recovery of such taxes is uncertain.
Expenses. Expenses directly attributable to a fund are charged to that fund. Expenses attributable to more than one fund are allocated among the respective funds on the basis of relative net assets or other appropriate methods. Expense estimates are accrued in the period to which they relate and adjustments are made when actual amounts are known.
Income Tax Information and Distributions to Shareholders. Each year, the Fund intends to qualify as a regulated investment company under Subchapter M of the Internal Revenue Code, including distributing substantially all of its taxable income and realized gains. As a result, no provision for U.S. Federal income taxes is required. As of October 31, 2020, the Fund did not have any unrecognized tax benefits in the financial statements; nor is the Fund aware of any tax positions for which it is reasonably possible that the total amounts of unrecognized tax benefits will significantly change in the next twelve months. The Fund files a U.S. federal tax return, in addition to state and local tax returns as required. The Fund's federal income tax returns are subject to examination by the Internal Revenue Service (IRS) for a period of three fiscal years after they are filed. State and local tax returns may be subject to examination for an additional fiscal year depending on the jurisdiction. Foreign taxes are provided for based on the Fund's understanding of the tax rules and rates that exist in the foreign markets in which it invests. The Fund is subject to a tax imposed on capital gains by certain countries in which it invests.
Distributions are declared and recorded on the ex-dividend date. Income and capital gain distributions are determined in accordance with income tax regulations, which may differ from GAAP. In addition, the Fund claimed a portion of the payment made to redeeming shareholders as a distribution for income tax purposes.
Capital accounts within the financial statements are adjusted for permanent book-tax differences. These adjustments have no impact on net assets or the results of operations. Capital accounts are not adjusted for temporary book-tax differences which will reverse in a subsequent period.
Book-tax differences are primarily due to foreign currency transactions, certain foreign taxes, passive foreign investment companies (PFIC), capital loss carryforwards and losses deferred due to wash sales.
As of period end, the cost and unrealized appreciation (depreciation) in securities, and derivatives if applicable, for federal income tax purposes were as follows:
| Gross unrealized appreciation | $16,521,611 |
| Gross unrealized depreciation | (8,965,201) |
| Net unrealized appreciation (depreciation) | $7,556,410 |
| Tax Cost | $93,360,737 |
The tax-based components of distributable earnings as of period end were as follows:
| Undistributed ordinary income | $1,385,082 |
| Capital loss carryforward | $(5,985,388) |
| Net unrealized appreciation (depreciation) on securities and other investments | $7,561,413 |
Capital loss carryforwards are only available to offset future capital gains of the Fund to the extent provided by regulations and may be limited. The capital loss carryforward information presented below, including any applicable limitation, is estimated as of fiscal period end and is subject to adjustment.
| No expiration | |
| Short-term | $(4,995,229) |
| Long-term | (990,159) |
| Total capital loss carryforward | $(5,985,388) |
The tax character of distributions paid was as follows:
| | October 31, 2020 | October 31, 2019 |
| Ordinary Income | $1,400,835 | $ 958,596 |
Restricted Securities (including Private Placements). The Fund may invest in securities that are subject to legal or contractual restrictions on resale. These securities generally may be resold in transactions exempt from registration or to the public if the securities are registered. Disposal of these securities may involve time-consuming negotiations and expense, and prompt sale at an acceptable price may be difficult. Information regarding restricted securities is included at the end of the Fund's Schedule of Investments.
4. Purchases and Sales of Investments.
Purchases and sales of securities, other than short-term securities are noted in the table below.
| | Purchases ($) | Sales ($) |
| Fidelity Flex International Fund | 58,995,489 | 31,223,170 |
5. Fees and Other Transactions with Affiliates.
Management Fee. Fidelity Management & Research Company LLC (the investment adviser) and its affiliates provide the Fund with investment management related services and the Fund does not pay any fees for these services. Under the management contract, the investment adviser or an affiliate pays all other expenses of the Fund, excluding fees and expenses of the independent Trustees, and certain miscellaneous expenses such as proxy and shareholder meeting expenses.
Brokerage Commissions. A portion of portfolio transactions were placed with brokerage firms which are affiliates of the investment adviser. Brokerage commissions are included in net realized gain (loss) and change in net unrealized appreciation (depreciation) in the Statement of Operations. The commissions paid to these affiliated firms were as follows:
| | Amount |
| Fidelity Flex International Fund | $161 |
Interfund Trades. Funds may purchase from or sell securities to other Fidelity Funds under procedures adopted by the Board. The procedures have been designed to ensure these interfund trades are executed in accordance with Rule 17a-7 of the 1940 Act. Interfund trades are included within the respective purchases and sales amounts shown in the Purchases and Sales of Investments note.
6. Committed Line of Credit.
Certain Funds participate with other funds managed by the investment adviser or an affiliate in a $4.25 billion credit facility (the "line of credit") to be utilized for temporary or emergency purposes to fund shareholder redemptions or for other short-term liquidity purposes. The participating funds have agreed to pay commitment fees on their pro-rata portion of the line of credit, which are reflected in Commitment fees on the Statement of Operations, and are as follows:
| | Amount |
| Fidelity Flex International Fund | $192 |
During the period, there were no borrowings on this line of credit.
7. Security Lending.
Funds lend portfolio securities through a lending agent from time to time in order to earn additional income. A fund may lend securities to certain qualified borrowers, including NFS. On the settlement date of the loan, a fund receives collateral (in the form of U.S. Treasury obligations, letters of credit and/or cash) against the loaned securities and maintains collateral in an amount not less than 100% of the market value of the loaned securities during the period of the loan. The market value of the loaned securities is determined at the close of business of a fund and any additional required collateral is delivered to a fund on the next business day. The Fund or borrower may terminate the loan at any time, and if the borrower defaults on its obligation to return the securities loaned because of insolvency or other reasons, a fund may apply collateral received from the borrower against the obligation. A fund may experience delays and costs in recovering the securities loaned. Any cash collateral received is invested in the Fidelity Securities Lending Cash Central Fund. Any loaned securities are identified as such in the Schedule of Investments, and the value of loaned securities and cash collateral at period end, as applicable, are presented in the Statement of Assets and Liabilities. Security lending income represents the income earned on investing cash collateral, less rebates paid to borrowers and any lending agent fees associated with the loan, plus any premium payments received for lending certain types of securities. Security lending income is presented in the Statement of Operations as a component of income from Fidelity Central Funds.
| | Security Lending Income From Securities Loaned to NFS | Value of Securities Loaned to NFS at Period End |
| Fidelity Flex International Fund | $– | $– |
8. Expense Reductions.
Through arrangements with the Fund's custodian, credits realized as a result of certain uninvested cash balances were used to reduce the Fund's expenses by $245.
9. Other.
The Fund's organizational documents provide former and current trustees and officers with a limited indemnification against liabilities arising in connection with the performance of their duties to the Fund. In the normal course of business, the Fund may also enter into contracts that provide general indemnifications. The Fund's maximum exposure under these arrangements is unknown as this would be dependent on future claims that may be made against the Fund. The risk of material loss from such claims is considered remote.
10. Coronavirus (COVID-19) Pandemic.
An outbreak of COVID-19 first detected in China during December 2019 has since spread globally and was declared a pandemic by the World Health Organization during March 2020. Developments that disrupt global economies and financial markets, such as the COVID-19 pandemic, may magnify factors that affect the Fund's performance.
Report of Independent Registered Public Accounting Firm
To the Board of Trustees of Fidelity Investment Trust and Shareholders of Fidelity Flex International Fund:
Opinion on the Financial Statements and Financial Highlights
We have audited the accompanying statement of assets and liabilities of Fidelity Flex International Fund (the "Fund"), a fund of Fidelity Investment Trust, including the schedule of investments, as of October 31, 2020, the related statement of operations for the year then ended, the statement of changes in net assets for each of the two years in the period then ended, the financial highlights for each of the three years in the period then ended and for the period from March 7, 2017 (commencement of operations) through October 31, 2017, and the related notes. In our opinion, the financial statements and financial highlights present fairly, in all material respects, the financial position of the Fund as of October 31, 2020, and the results of its operations for the year then ended, the changes in its net assets for each of the two years in the period then ended, and the financial highlights for each of the three years in the period then ended and for the period from March 7, 2017 (commencement of operations) through October 31, 2017 in conformity with accounting principles generally accepted in the United States of America.
Basis for Opinion
These financial statements and financial highlights are the responsibility of the Fund's management. Our responsibility is to express an opinion on the Fund's financial statements and financial highlights based on our audits. We are a public accounting firm registered with the Public Company Accounting Oversight Board (United States) (PCAOB) and are required to be independent with respect to the Fund in accordance with the U.S. federal securities laws and the applicable rules and regulations of the Securities and Exchange Commission and the PCAOB.
We conducted our audits in accordance with the standards of the PCAOB. Those standards require that we plan and perform the audit to obtain reasonable assurance about whether the financial statements and financial highlights are free of material misstatement, whether due to error or fraud. The Fund is not required to have, nor were we engaged to perform, an audit of its internal control over financial reporting. As part of our audits we are required to obtain an understanding of internal control over financial reporting but not for the purpose of expressing an opinion on the effectiveness of the Fund’s internal control over financial reporting. Accordingly, we express no such opinion.
Our audits included performing procedures to assess the risks of material misstatement of the financial statements and financial highlights, whether due to error or fraud, and performing procedures that respond to those risks. Such procedures included examining, on a test basis, evidence regarding the amounts and disclosures in the financial statements and financial highlights. Our audits also included evaluating the accounting principles used and significant estimates made by management, as well as evaluating the overall presentation of the financial statements and financial highlights. Our procedures included confirmation of securities owned as of October 31, 2020, by correspondence with the custodian and brokers; when replies were not received from brokers, we performed other auditing procedures. We believe that our audits provide a reasonable basis for our opinion.
/s/ Deloitte & Touche LLP
Boston, Massachusetts
December 15, 2020
We have served as the auditor of one or more of the Fidelity investment companies since 1999.
Trustees and Officers
The Trustees, Members of the Advisory Board (if any), and officers of the trust and fund, as applicable, are listed below. The Board of Trustees governs the fund and is responsible for protecting the interests of shareholders. The Trustees are experienced executives who meet periodically throughout the year to oversee the fund's activities, review contractual arrangements with companies that provide services to the fund, oversee management of the risks associated with such activities and contractual arrangements, and review the fund's performance. Except for Jonathan Chiel, each of the Trustees oversees 305 funds. Mr. Chiel oversees 176 funds.
The Trustees hold office without limit in time except that (a) any Trustee may resign; (b) any Trustee may be removed by written instrument, signed by at least two-thirds of the number of Trustees prior to such removal; (c) any Trustee who requests to be retired or who has become incapacitated by illness or injury may be retired by written instrument signed by a majority of the other Trustees; and (d) any Trustee may be removed at any special meeting of shareholders by a two-thirds vote of the outstanding voting securities of the trust. Each Trustee who is not an interested person (as defined in the 1940 Act) of the trust and the fund is referred to herein as an Independent Trustee. Each Independent Trustee shall retire not later than the last day of the calendar year in which his or her 75th birthday occurs. The Independent Trustees may waive this mandatory retirement age policy with respect to individual Trustees. Officers and Advisory Board Members hold office without limit in time, except that any officer or Advisory Board Member may resign or may be removed by a vote of a majority of the Trustees at any regular meeting or any special meeting of the Trustees. Except as indicated, each individual has held the office shown or other offices in the same company for the past five years.
The fund’s Statement of Additional Information (SAI) includes more information about the Trustees. To request a free copy, call Fidelity at 1-800-544-3455 (for managed account clients) or 1-800-835-5092 (for retirement plan participants).
Experience, Skills, Attributes, and Qualifications of the Trustees. The Governance and Nominating Committee has adopted a statement of policy that describes the experience, qualifications, attributes, and skills that are necessary and desirable for potential Independent Trustee candidates (Statement of Policy). The Board believes that each Trustee satisfied at the time he or she was initially elected or appointed a Trustee, and continues to satisfy, the standards contemplated by the Statement of Policy. The Governance and Nominating Committee also engages professional search firms to help identify potential Independent Trustee candidates who have the experience, qualifications, attributes, and skills consistent with the Statement of Policy. From time to time, additional criteria based on the composition and skills of the current Independent Trustees, as well as experience or skills that may be appropriate in light of future changes to board composition, business conditions, and regulatory or other developments, have also been considered by the professional search firms and the Governance and Nominating Committee. In addition, the Board takes into account the Trustees' commitment and participation in Board and committee meetings, as well as their leadership of standing and ad hoc committees throughout their tenure.
In determining that a particular Trustee was and continues to be qualified to serve as a Trustee, the Board has considered a variety of criteria, none of which, in isolation, was controlling. The Board believes that, collectively, the Trustees have balanced and diverse experience, qualifications, attributes, and skills, which allow the Board to operate effectively in governing the fund and protecting the interests of shareholders. Information about the specific experience, skills, attributes, and qualifications of each Trustee, which in each case led to the Board's conclusion that the Trustee should serve (or continue to serve) as a trustee of the fund, is provided below.
Board Structure and Oversight Function. Robert A. Lawrence is an interested person and currently serves as Acting Chairman. The Trustees have determined that an interested Chairman is appropriate and benefits shareholders because an interested Chairman has a personal and professional stake in the quality and continuity of services provided to the fund. Independent Trustees exercise their informed business judgment to appoint an individual of their choosing to serve as Chairman, regardless of whether the Trustee happens to be independent or a member of management. The Independent Trustees have determined that they can act independently and effectively without having an Independent Trustee serve as Chairman and that a key structural component for assuring that they are in a position to do so is for the Independent Trustees to constitute a substantial majority for the Board. The Independent Trustees also regularly meet in executive session. Ned C. Lautenbach and David M. Thomas serve as Co-Lead Independent Trustees and as such each (i) acts as a liaison between the Independent Trustees and management with respect to matters important to the Independent Trustees and (ii) with management prepares agendas for Board meetings.
Fidelity® funds are overseen by different Boards of Trustees. The fund's Board oversees Fidelity's high income and certain equity funds, and other Boards oversee Fidelity's investment-grade bond, money market, asset allocation, and other equity funds. The asset allocation funds may invest in Fidelity® funds overseen by the fund's Board. The use of separate Boards, each with its own committee structure, allows the Trustees of each group of Fidelity® funds to focus on the unique issues of the funds they oversee, including common research, investment, and operational issues. On occasion, the separate Boards establish joint committees to address issues of overlapping consequences for the Fidelity® funds overseen by each Board.
The Trustees operate using a system of committees to facilitate the timely and efficient consideration of all matters of importance to the Trustees, the fund, and fund shareholders and to facilitate compliance with legal and regulatory requirements and oversight of the fund's activities and associated risks. The Board, acting through its committees, has charged FMR and its affiliates with (i) identifying events or circumstances the occurrence of which could have demonstrably adverse effects on the fund's business and/or reputation; (ii) implementing processes and controls to lessen the possibility that such events or circumstances occur or to mitigate the effects of such events or circumstances if they do occur; and (iii) creating and maintaining a system designed to evaluate continuously business and market conditions in order to facilitate the identification and implementation processes described in (i) and (ii) above. Because the day-to-day operations and activities of the fund are carried out by or through FMR, its affiliates, and other service providers, the fund's exposure to risks is mitigated but not eliminated by the processes overseen by the Trustees. While each of the Board's committees has responsibility for overseeing different aspects of the fund's activities, oversight is exercised primarily through the Operations, Audit, and Compliance Committees. Appropriate personnel, including but not limited to the fund's Chief Compliance Officer (CCO), FMR's internal auditor, the independent accountants, the fund's Treasurer and portfolio management personnel, make periodic reports to the Board's committees, as appropriate, including an annual review of Fidelity's risk management program for the Fidelity® funds. The responsibilities of each standing committee, including their oversight responsibilities, are described further under "Standing Committees of the Trustees."
Interested Trustees*:
Correspondence intended for a Trustee who is an interested person may be sent to Fidelity Investments, 245 Summer Street, Boston, Massachusetts 02210.
Name, Year of Birth; Principal Occupations and Other Relevant Experience+
Jonathan Chiel (1957)
Year of Election or Appointment: 2016
Trustee
Mr. Chiel also serves as Trustee of other Fidelity® funds. Mr. Chiel is Executive Vice President and General Counsel for FMR LLC (diversified financial services company, 2012-present). Previously, Mr. Chiel served as general counsel (2004-2012) and senior vice president and deputy general counsel (2000-2004) for John Hancock Financial Services; a partner with Choate, Hall & Stewart (1996-2000) (law firm); and an Assistant United States Attorney for the United States Attorney’s Office of the District of Massachusetts (1986-95), including Chief of the Criminal Division (1993-1995). Mr. Chiel is a director on the boards of the Boston Bar Foundation and the Maimonides School.
Robert A. Lawrence (1952)
Year of Election or Appointment: 2020
Trustee
Acting Chairman of the Board of Trustees
Mr. Lawrence also serves as Trustee of other funds. Previously, Mr. Lawrence served as a Member of the Advisory Board of certain funds. Prior to his retirement in 2008, Mr. Lawrence served as Vice President of certain Fidelity® funds (2006-2008), Senior Vice President, Head of High Income Division of Fidelity Management & Research Company (investment adviser firm, 2006-2008), and President of Fidelity Strategic Investments (investment adviser firm, 2002-2005).
* Determined to be an “Interested Trustee” by virtue of, among other things, his or her affiliation with the trust or various entities under common control with FMR.
+ The information includes the Trustee's principal occupation during the last five years and other information relating to the experience, attributes, and skills relevant to the Trustee's qualifications to serve as a Trustee, which led to the conclusion that the Trustee should serve as a Trustee for the fund.
Independent Trustees:
Correspondence intended for an Independent Trustee may be sent to Fidelity Investments, P.O. Box 55235, Boston, Massachusetts 02205-5235.
Name, Year of Birth; Principal Occupations and Other Relevant Experience+
Dennis J. Dirks (1948)
Year of Election or Appointment: 2005
Trustee
Mr. Dirks also serves as Trustee of other Fidelity® funds. Prior to his retirement in May 2003, Mr. Dirks served as Chief Operating Officer and as a member of the Board of The Depository Trust & Clearing Corporation (financial markets infrastructure), President, Chief Operating Officer and a member of the Board of The Depository Trust Company (DTC), President and a member of the Board of the National Securities Clearing Corporation (NSCC), Chief Executive Officer and a member of the Board of the Government Securities Clearing Corporation and Chief Executive Officer and a member of the Board of the Mortgage-Backed Securities Clearing Corporation. Mr. Dirks currently serves as a member of the Finance Committee (2016-present) and Board (2017-present) and is Treasurer (2018-present) of the Asolo Repertory Theatre.
Donald F. Donahue (1950)
Year of Election or Appointment: 2018
Trustee
Mr. Donahue also serves as Trustee of other Fidelity® funds. Mr. Donahue serves as President and Chief Executive Officer of Miranda Partners, LLC (risk consulting for the financial services industry, 2012-present). Previously, Mr. Donahue served as Chief Executive Officer (2006-2012), Chief Operating Officer (2003-2006) and Managing Director, Customer Marketing and Development (1999-2003) of The Depository Trust & Clearing Corporation (financial markets infrastructure). Mr. Donahue currently serves as a member (2007-present) and Co-Chairman (2016-present) of the Board of United Way of New York, a member of the Board of NYC Leadership Academy (2012-present) and a member of the Board of Advisors of Ripple Labs, Inc. (financial services, 2015-present). Mr. Donahue previously served as a member of the Advisory Board of certain Fidelity® funds (2015-2018).
Vicki L. Fuller (1957)
Year of Election or Appointment: 2020
Trustee
Ms. Fuller also serves as Trustee of other Fidelity® funds. Previously, Ms. Fuller served as a member of the Advisory Board of certain Fidelity® funds (2018-2020), Chief Investment Officer of the New York State Common Retirement Fund (2012-2018) and held a variety of positions at AllianceBernstein L.P. (global asset management, 1985-2012), including Managing Director (2006-2012) and Senior Vice President and Senior Portfolio Manager (2001-2006). Ms. Fuller currently serves as a member of the Board, Audit Committee and Nominating and Governance Committee of The Williams Companies, Inc. (natural gas infrastructure, 2018-present), as a member of the Board, Audit Committee and Nominating and Governance Committee of two Blackstone business development companies (2020-present) and as a member of the Board of Treliant, LLC (consulting, 2019-present).
Patricia L. Kampling (1959)
Year of Election or Appointment: 2020
Trustee
Ms. Kampling also serves as Trustee of other Fidelity® funds. Prior to her retirement, Ms. Kampling served as Chairman of the Board and Chief Executive Officer (2012-2019), President and Chief Operating Officer (2011-2012) and Executive Vice President and Chief Financial Officer (2010-2011) of Alliant Energy Corporation. Ms. Kampling currently serves as a member of the Board, Compensation Committee and Executive Committee and as Chair of the Audit Committee of Briggs & Stratton Corporation (manufacturing, 2011-present) and as a member of the Board, Audit, Finance and Risk Committee and Safety, Environmental, Technology and Operations Committee of American Water Works Company, Inc. (utilities company, 2019-present). In addition, Ms. Kampling currently serves as a member of the Board of the Nature Conservancy, Wisconsin Chapter (2019-present). Previously, Ms. Kampling served as a Member of the Advisory Board of certain Fidelity® funds (2020), a member of the Board of Interstate Power and Light Company (2012-2019) and Wisconsin Power and Light Company (2012-2019) (each a subsidiary of Alliant Energy Corporation) and as a member of the Board and Workforce Development Committee of the Business Roundtable (2018-2019).
Alan J. Lacy (1953)
Year of Election or Appointment: 2008
Trustee
Mr. Lacy also serves as Trustee of other Fidelity® funds. Previously, Mr. Lacy served as Senior Adviser (2007-2014) of Oak Hill Capital Partners, L.P. (private equity), Chief Executive Officer (2005) and Vice Chairman (2005-2006) of Sears Holdings Corporation (retail), Chief Executive Officer and Chairman of the Board of Sears, Roebuck and Co. (retail, 2000-2005), Chairman (2014-2017) and a member of the Board (2010-2017) of Dave & Buster’s Entertainment, Inc. (restaurant and entertainment complexes) and a member of the Board of Bristol-Myers Squibb Company (global pharmaceuticals, 2008-2020). Mr. Lacy currently serves as a Trustee of the California Chapter of The Nature Conservancy (2015-present) and a member of the Board of the Center for Advanced Study in the Behavioral Sciences at Stanford University (2015-present).
Ned C. Lautenbach (1944)
Year of Election or Appointment: 2000
Trustee
Co-Lead Independent Trustee
Mr. Lautenbach also serves as Trustee of other Fidelity® funds. Mr. Lautenbach currently serves as Chair of the Board of Governors, State University System of Florida (2013-present) and is a member of the Council on Foreign Relations (1994-present). He is also a member and has in the past served as Chairman of the Board of Directors of Artis-Naples (2012-present). Previously, Mr. Lautenbach served as a member and then Lead Director of the Board of Directors of Eaton Corporation (diversified industrial, 1997-2016). He was also a Partner at Clayton, Dubilier & Rice, LLC (private equity investment, 1998-2010); as well as Director of Sony Corporation (2006-2007). In addition, Mr. Lautenbach had a 30-year career with IBM (technology company), during which time he served as Senior Vice President and as a member of the Corporate Executive Committee (1968-1998).
Joseph Mauriello (1944)
Year of Election or Appointment: 2008
Trustee
Mr. Mauriello also serves as Trustee of other Fidelity® funds. Prior to his retirement in January 2006, Mr. Mauriello served in numerous senior management positions including Deputy Chairman and Chief Operating Officer (2004-2005), and Vice Chairman of Financial Services (2002-2004) of KPMG LLP US (professional services, 1965-2005). Mr. Mauriello currently serves as a member of the Independent Directors Council Governing Council (2015-present). Previously, Mr. Mauriello served as a member of the Board of XL Group plc. (global insurance and re-insurance, 2006-2018).
Cornelia M. Small (1944)
Year of Election or Appointment: 2005
Trustee
Ms. Small also serves as Trustee of other Fidelity® funds. Previously, Ms. Small served as Chief Investment Officer, Director of Global Equity Investments and a member of Scudder, Stevens & Clark and Scudder Kemper Investments. Ms. Small previously served as a member of the Board (2009-2019) and Chair of the Investment Committee (2010-2019) of the Teagle Foundation and a member of the Investment Committee of the Berkshire Taconic Community Foundation (2008-2019).
Garnett A. Smith (1947)
Year of Election or Appointment: 2018
Trustee
Mr. Smith also serves as Trustee of other Fidelity® funds. Prior to his retirement, Mr. Smith served as Chairman and Chief Executive Officer (1990-1997) and President (1986-1990) of Inbrand Corp. (manufacturer of personal absorbent products). Prior to his employment with Inbrand Corp., he was employed by a retail fabric chain and North Carolina National Bank (now Bank of America). Mr. Smith previously served as a member of the Advisory Board of certain Fidelity® funds (2012-2013).
David M. Thomas (1949)
Year of Election or Appointment: 2008
Trustee
Co-Lead Independent Trustee
Mr. Thomas also serves as Trustee of other Fidelity® funds. Previously, Mr. Thomas served as Executive Chairman (2005-2006) and Chairman and Chief Executive Officer (2000-2005) of IMS Health, Inc. (pharmaceutical and healthcare information solutions). Mr. Thomas currently serves as Non-Executive Chairman of the Board of Fortune Brands Home and Security (home and security products, 2011-present), and a member of the Board (2004-present) and Presiding Director (2013-present) of Interpublic Group of Companies, Inc. (marketing communication).
Susan Tomasky (1953)
Year of Election or Appointment: 2020
Trustee
Ms. Tomasky also serves as Trustee of other Fidelity® funds. Prior to her retirement, Ms. Tomasky served in various executive officer positions at American Electric Power Company, Inc. (1998-2011), including most recently as President of AEP Transmission (2007-2011). Ms. Tomasky currently serves as a member of the Board and Sustainability Committee and as Chair of the Audit Committee of Marathon Petroleum Corporation (2018-present) and as a member of the Board, Corporate Governance Committee and Organization and Compensation Committee and as Chair of the Audit Committee of Public Service Enterprise Group, Inc. (utilities company, 2012-present). In addition, Ms. Tomasky currently serves as a member of the Board of the Columbus Regional Airport Authority (2007-present), as a member of the Board of the Royal Shakespeare Company – America (2009-present), as a member of the Board of the Columbus Association for the Performing Arts (2011-present) and as a member of the Board of Kenyon College (2016-present). Previously, Ms. Tomasky served as a Member of the Advisory Board of certain Fidelity® funds (2020), a member of the Board (2011-2019) and as Lead Independent Director (2015-2018) of Andeavor Corporation (previously Tesoro Corporation) (independent oil refiner and marketer) and as a member of the Board of Summit Midstream Partners LP (energy, 2012-2018).
Michael E. Wiley (1950)
Year of Election or Appointment: 2020
Trustee
Mr. Wiley also serves as Trustee of other Fidelity® funds. Previously, Mr. Wiley served as a member of the Advisory Board of certain Fidelity® funds (2018-2020), Chairman, President and CEO of Baker Hughes, Inc. (oilfield services, 2000-2004). Mr. Wiley also previously served as a member of the Board of Andeavor Corporation (independent oil refiner and marketer, 2005-2018), a member of the Board of Andeavor Logistics LP (natural resources logistics, 2015-2018) and a member of the Board of High Point Resources (exploration and production, 2005-2020).
+ The information includes the Trustee's principal occupation during the last five years and other information relating to the experience, attributes, and skills relevant to the Trustee's qualifications to serve as a Trustee, which led to the conclusion that the Trustee should serve as a Trustee for the fund.
Advisory Board Members and Officers:
Correspondence intended for a Member of the Advisory Board (if any) may be sent to Fidelity Investments, P.O. Box 55235, Boston, Massachusetts 02205-5235. Correspondence intended for an officer or Peter S. Lynch may be sent to Fidelity Investments, 245 Summer Street, Boston, Massachusetts 02210. Officers appear below in alphabetical order.
Name, Year of Birth; Principal Occupation
Lloyd James Austin, III (1953)
Year of Election or Appointment: 2020
Member of the Advisory Board
General Austin also serves as a Member of the Advisory Board of other Fidelity® funds. Prior to his retirement, General Austin (United States Army, Retired) held a variety of positions within the U.S. Government, including Commander, U.S. Central Command (2013-2016), Vice Chief of Staff, U.S. Army (2012-2013) and Commanding General, U.S. Forces – Iraq, Operation New Dawn (2010-2012). General Austin currently serves as a Partner of Pine Island Capital Partners (private equity, 2020-present) and as President of the Austin Strategy Group LLC (consulting, 2016-present). General Austin serves as a member of the Board of Directors of Nucor Corporation (steel products, 2017-present), as a member of the Board of Directors of Tenet Healthcare Corporation (2018-present) and as a member of the Board of Directors of Raytheon Technologies Corporation (aerospace and defense, 2020-present). In addition, General Austin currently serves as a member of the Board of Trustees of the Carnegie Corporation of New York (2017-present) and as a member of the Board of Trustees of Auburn University (2017-present). Previously, General Austin served as a member of the Board of Directors of United Technologies Corporation (aerospace, defense and building, 2016-2020).
Thomas A. Kennedy (1955)
Year of Election or Appointment: 2020
Member of the Advisory Board
Mr. Kennedy also serves as a Member of the Advisory Board of other Fidelity® funds. Previously, Mr. Kennedy held a variety of positions at Raytheon Company (aerospace and defense, 1983-2020), including Chairman and Chief Executive Officer (2014-2020) and Executive Vice President and Chief Operating Officer (2013-2014). Mr. Kennedy currently serves as Executive Chairman of the Board of Directors of Raytheon Technologies Corporation (aerospace and defense, 2020-present). He is also a member of the Rutgers School of Engineering Industry Advisory Board (2011-present) and a member of the UCLA Engineering Dean’s Executive Board (2016-present).
Peter S. Lynch (1944)
Year of Election or Appointment: 2003
Member of the Advisory Board
Mr. Lynch also serves as a Member of the Advisory Board of other Fidelity® funds. Mr. Lynch is Vice Chairman and a Director of Fidelity Management & Research Company LLC (investment adviser firm). In addition, Mr. Lynch serves as a Trustee of Boston College and as the Chairman of the Inner-City Scholarship Fund. Previously, Mr. Lynch served as Vice Chairman and a Director of FMR Co., Inc. (investment adviser firm) and on the Special Olympics International Board of Directors (1997-2006).
Elizabeth Paige Baumann (1968)
Year of Election or Appointment: 2017
Anti-Money Laundering (AML) Officer
Ms. Baumann also serves as AML Officer of other funds. She is Chief AML Officer (2012-present) and Senior Vice President (2014-present) of FMR LLC (diversified financial services company) and is an employee of Fidelity Investments. Previously, Ms. Baumann served as AML Officer of certain funds (2017-2019), as AML Officer of the funds (2012-2016), and Vice President (2007-2014) and Deputy Anti-Money Laundering Officer (2007-2012) of FMR LLC.
Craig S. Brown (1977)
Year of Election or Appointment: 2019
Assistant Treasurer
Mr. Brown also serves as Assistant Treasurer of other funds. Mr. Brown is an employee of Fidelity Investments (2013-present).
John J. Burke III (1964)
Year of Election or Appointment: 2018
Chief Financial Officer
Mr. Burke also serves as Chief Financial Officer of other funds. Mr. Burke serves as Head of Investment Operations for Fidelity Fund and Investment Operations (2018-present) and is an employee of Fidelity Investments (1998-present). Previously Mr. Burke served as head of Asset Management Investment Operations (2012-2018).
William C. Coffey (1969)
Year of Election or Appointment: 2019
Assistant Secretary
Mr. Coffey also serves as Assistant Secretary of other funds. He is Senior Vice President and Deputy General Counsel of FMR LLC (diversified financial services company, 2010-present), and is an employee of Fidelity Investments. Previously, Mr. Coffey served as Secretary and CLO of certain funds (2018-2019); CLO, Secretary, and Senior Vice President of Fidelity Management & Research Company and FMR Co., Inc. (investment adviser firms, 2018-2019); Secretary of Fidelity SelectCo, LLC and Fidelity Investments Money Management, Inc. (investment adviser firms, 2018-2019); CLO of Fidelity Management & Research (Hong Kong) Limited, FMR Investment Management (UK) Limited, and Fidelity Management & Research (Japan) Limited (investment adviser firms, 2018-2019); and Assistant Secretary of certain funds (2009-2018).
Timothy M. Cohen (1969)
Year of Election or Appointment: 2018
Vice President
Mr. Cohen also serves as Vice President of other funds. Mr. Cohen serves as Co-Head of Equity (2018-present), a Director of Fidelity Management & Research (Japan) Limited (investment adviser firm, 2016-present), and is an employee of Fidelity Investments. Previously, Mr. Cohen served as Executive Vice President of Fidelity SelectCo, LLC (2019), Head of Global Equity Research (2016-2018), Chief Investment Officer - Equity and a Director of Fidelity Management & Research (U.K.) Inc. (investment adviser firm, 2013-2015) and as a Director of Fidelity Management & Research (Hong Kong) Limited (investment adviser firm, 2017).
Jonathan Davis (1968)
Year of Election or Appointment: 2010
Assistant Treasurer
Mr. Davis also serves as Assistant Treasurer of other funds. Mr. Davis serves as Assistant Treasurer of FMR Capital, Inc. (2017-present) and is an employee of Fidelity Investments. Previously, Mr. Davis served as Vice President and Associate General Counsel of FMR LLC (diversified financial services company, 2003-2010).
Laura M. Del Prato (1964)
Year of Election or Appointment: 2018
Assistant Treasurer
Ms. Del Prato also serves as an officer of other funds. Ms. Del Prato is an employee of Fidelity Investments (2017-present). Previously, Ms. Del Prato served as President and Treasurer of The North Carolina Capital Management Trust: Cash Portfolio and Term Portfolio (2018-2020). Prior to joining Fidelity Investments, Ms. Del Prato served as a Managing Director and Treasurer of the JPMorgan Mutual Funds (2014-2017). Prior to JPMorgan, Ms. Del Prato served as a partner at Cohen Fund Audit Services (accounting firm, 2012-2013) and KPMG LLP (accounting firm, 2004-2012).
Colm A. Hogan (1973)
Year of Election or Appointment: 2020
Assistant Treasurer
Mr. Hogan also serves as an officer of other funds. Mr. Hogan serves as Assistant Treasurer of FMR Capital, Inc. (2017-present) and is an employee of Fidelity Investments (2005-present). Previously, Mr. Hogan served as Deputy Treasurer of certain Fidelity® funds (2016-2020) and Assistant Treasurer of certain Fidelity® funds (2016-2018).
Pamela R. Holding (1964)
Year of Election or Appointment: 2018
Vice President
Ms. Holding also serves as Vice President of other funds. Ms. Holding serves as Co-Head of Equity (2018-present) and is an employee of Fidelity Investments (2013-present). Previously, Ms. Holding served as Executive Vice President of Fidelity SelectCo, LLC (2019) and as Chief Investment Officer of Fidelity Institutional Asset Management (2013-2018).
Cynthia Lo Bessette (1969)
Year of Election or Appointment: 2019
Secretary and Chief Legal Officer (CLO)
Ms. Lo Bessette also serves as an officer of other funds. Ms. Lo Bessette serves as CLO, Secretary, and Senior Vice President of Fidelity Management & Research Company LLC (investment adviser firm, 2019-present); and CLO of Fidelity Management & Research (Hong Kong) Limited, FMR Investment Management (UK) Limited, and Fidelity Management & Research (Japan) Limited (investment adviser firms, 2019-present). She is a Senior Vice President and Deputy General Counsel of FMR LLC (diversified financial services company, 2019-present), and is an employee of Fidelity Investments. Previously, Ms. Lo Bessette served as CLO, Secretary, and Senior Vice President of FMR Co., Inc. (investment adviser firm, 2019); Secretary of Fidelity SelectCo, LLC and Fidelity Investments Money Management, Inc. (investment adviser firms, 2019). Prior to joining Fidelity Investments, Ms. Lo Bessette was Executive Vice President, General Counsel (2016-2019) and Senior Vice President, Deputy General Counsel (2015-2016) of OppenheimerFunds (investment management company) and Deputy Chief Legal Officer (2013-2015) of Jennison Associates LLC (investment adviser firm).
Chris Maher (1972)
Year of Election or Appointment: 2020
Deputy Treasurer
Mr. Maher also serves as an officer of other funds. Mr. Maher serves as Assistant Treasurer of FMR Capital, Inc. (2017-present), and is an employee of Fidelity Investments (2008-present). Previously, Mr. Maher served as Assistant Treasurer of certain funds (2013-2020); Vice President of Asset Management Compliance (2013), Vice President of the Program Management Group of FMR (investment adviser firm, 2010-2013), and Vice President of Valuation Oversight (2008-2010).
Jason P. Pogorelec (1975)
Year of Election or Appointment: 2020
Chief Compliance Officer
Mr. Pogorelec also serves as Chief Compliance Officer of other funds. Mr. Pogorelec is a senior Vice President of Asset Management Compliance for Fidelity Investments and is an employee of Fidelity Investments (2006-present). Previously, Mr. Pogorelec served as Vice President, Associate General Counsel for Fidelity Investments (2010-2020) and Assistant Secretary of certain Fidelity funds (2015-2020).
Stacie M. Smith (1974)
Year of Election or Appointment: 2016
President and Treasurer
Ms. Smith also serves as an officer of other funds. Ms. Smith serves as Assistant Treasurer of FMR Capital, Inc. (2017-present), is an employee of Fidelity Investments (2009-present), and has served in other fund officer roles. Prior to joining Fidelity Investments, Ms. Smith served as Senior Audit Manager of Ernst & Young LLP (accounting firm, 1996-2009). Previously, Ms. Smith served as Assistant Treasurer (2013-2019) and Deputy Treasurer (2013-2016) of certain Fidelity® funds.
Marc L. Spector (1972)
Year of Election or Appointment: 2016
Assistant Treasurer
Mr. Spector also serves as an officer of other funds. Mr. Spector serves as Assistant Treasurer of FMR Capital, Inc. (2017-present) and is an employee of Fidelity Investments (2016-present). Prior to joining Fidelity Investments, Mr. Spector served as Director at the Siegfried Group (accounting firm, 2013-2016), and prior to Siegfried Group as audit senior manager at Deloitte & Touche LLP (accounting firm, 2005-2013).
Jim Wegmann (1979)
Year of Election or Appointment: 2019
Assistant Treasurer
Mr. Wegmann also serves as Assistant Treasurer of other funds. Mr. Wegmann is an employee of Fidelity Investments (2011-present).
Shareholder Expense Example
As a shareholder, you incur two types of costs: (1) transaction costs, which may include sales charges (loads) on purchase payments or redemption proceeds, as applicable and (2) ongoing costs, which generally include management fees, distribution and/or service (12b-1) fees and other Fund expenses. This Example is intended to help you understand your ongoing costs (in dollars) of investing in a fund and to compare these costs with the ongoing costs of investing in other mutual funds.
The Example is based on an investment of $1,000 invested at the beginning of the period and held for the entire period (May 1, 2020 to October 31, 2020).
Actual Expenses
The first line of the accompanying table provides information about actual account values and actual expenses. You may use the information in this line, together with the amount you invested, to estimate the expenses that you paid over the period. Simply divide your account value by $1,000.00 (for example, an $8,600 account value divided by $1,000.00 = 8.6), then multiply the result by the number in the first line for a class/Fund under the heading entitled "Expenses Paid During Period" to estimate the expenses you paid on your account during this period. If any fund is a shareholder of any underlying mutual funds or exchange-traded funds (ETFs) (the Underlying Funds), such fund indirectly bears its proportional share of the expenses of the Underlying Funds in addition to the direct expenses incurred presented in the table. These fees and expenses are not included in the annualized expense ratio used to calculate the expense estimate in the table below.
Hypothetical Example for Comparison Purposes
The second line of the accompanying table provides information about hypothetical account values and hypothetical expenses based on the actual expense ratio and an assumed rate of return of 5% per year before expenses, which is not the actual return. The hypothetical account values and expenses may not be used to estimate the actual ending account balance or expenses you paid for the period. You may use this information to compare the ongoing costs of investing in the Fund and other funds. To do so, compare this 5% hypothetical example with the 5% hypothetical examples that appear in the shareholder reports of the other funds. If any fund is a shareholder of any Underlying Funds, such fund indirectly bears its proportional share of the expenses of the Underlying Funds in addition to the direct expenses as presented in the table. These fees and expenses are not included in the annualized expense ratio used to calculate the expense estimate in the table below.
Please note that the expenses shown in the table are meant to highlight your ongoing costs only and do not reflect any transaction costs. Therefore, the second line of the table is useful in comparing ongoing costs only, and will not help you determine the relative total costs of owning different funds.
| | Annualized Expense Ratio-A | Beginning
Account Value
May 1, 2020 | Ending
Account Value
October 31, 2020 | Expenses Paid
During Period-B
May 1, 2020
to October 31, 2020 |
| Fidelity Flex International Fund | - %-C | | | |
| Actual | | $1,000.00 | $1,167.10 | $--D |
| Hypothetical-E | | $1,000.00 | $1,025.14 | $--D |
A Annualized expense ratio reflects expenses net of applicable fee waivers.
B Expenses are equal to the annualized expense ratio, multiplied by the average account value over the period, multiplied by 184/ 366 (to reflect the one-half year period). The fees and expenses of any Underlying Funds are not included in each annualized expense ratio.
C Amount represents less than .005%.
D Amount represents less than $.005.
E 5% return per year before expenses
Distributions (Unaudited)
The fund designates 2% of the dividends distributed during the fiscal year as qualifying for the dividends–received deduction for corporate shareholders.
The fund designates 76% of the dividends distributed during the fiscal year as amounts which may be taken into account as a dividend for the purposes of the maximum rate under section 1(h)(11) of the Internal Revenue Code.
The amounts per share which represent income derived from sources within, and taxes paid to, foreign countries or possessions of the United States are $0.2173 and $0.0161 for the dividend paid December 09, 2019.
The fund will notify shareholders in January 2021 of amounts for use in preparing 2020 income tax returns.
Proxy Voting Results
A special meeting of shareholders was held on June 9, 2020. The results of votes taken among shareholders on the proposal before them are reported below. Each vote reported represents one dollar of net asset value held on the record date for the meeting.
PROPOSAL 1
To elect a Board of Trustees.
| | # of
Votes | % of
Votes |
| Dennis J. Dirks |
| Affirmative | 91,643,443,973.030 | 98.167 |
| Withheld | 1,711,119,384.419 | 1.833 |
| TOTAL | 93,354,563,357.449 | 100.000 |
| Donald F. Donahue |
| Affirmative | 91,659,003,496.045 | 98.184 |
| Withheld | 1,695,559,852.789 | 1.816 |
| TOTAL | 93,354,563,357.449 | 100.000 |
| Bettina Doulton |
| Affirmative | 91,774,146,516.145 | 98.307 |
| Withheld | 1,580,416,862.377 | 1.693 |
| TOTAL | 93,354,563,357.449 | 100.000 |
| Vicki L. Fuller |
| Affirmative | 91,845,419,368.993 | 98.383 |
| Withheld | 1,509,143,998.591 | 1.617 |
| TOTAL | 93,354,563,357.449 | 100.00 |
| Patricia L. Kampling |
| Affirmative | 91,723,732,274.457 | 98.253 |
| Withheld | 1,630,831,098.411 | 1.747 |
| TOTAL | 93,354,563,357.449 | 100.000 |
| Alan J. Lacy |
| Affirmative | 91,490,319,407.772 | 98.003 |
| Withheld | 1,864,243,948.299 | 1.997 |
| TOTAL | 93,354,563,357.449 | 100.000 |
| Ned C. Lautenbach |
| Affirmative | 91,285,367,239.075 | 97.784 |
| Withheld | 2,069,196,119.052 | 2.216 |
| TOTAL | 93,354,563,357.449 | 100.000 |
| Robert A. Lawrence |
| Affirmative | 91,556,271,429.466 | 98.074 |
| Withheld | 1,798,291,912.707 | 1.926 |
| TOTAL | 93,354,563,357.449 | 100.000 |
| Joseph Mauriello |
| Affirmative | 91,497,480,147.082 | 98.011 |
| Withheld | 1,857,083,211.045 | 1.989 |
| TOTAL | 93,354,563,357.449 | 100.000 |
| Cornelia M. Small |
| Affirmative | 91,606,808,161.438 | 98.128 |
| Withheld | 1,747,755,220.497 | 1.872 |
| TOTAL | 93,354,563,357.449 | 100.000 |
| Garnett A. Smith |
| Affirmative | 91,505,784,053.038 | 98.020 |
| Withheld | 1,848,779,305.090 | 1.980 |
| TOTAL | 93,354,563,357.449 | 100.000 |
| David M. Thomas |
| Affirmative | 91,536,969,704.881 | 98.053 |
| Withheld | 1,817,593,630.919 | 1.947 |
| TOTAL | 93,354,563,357.449 | 100.000 |
| Susan Tomasky |
| Affirmative | 91,697,125,678.165 | 98.225 |
| Withheld | 1,657,437,703.277 | 1.775 |
| TOTAL | 93,354,563,357.449 | 100.000 |
| Michael E. Wiley |
| Affirmative | 91,506,805,575.815 | 98.021 |
| Withheld | 1,847,757,759.985 | 1.979 |
| TOTAL | 93,354,563,357.449 | 100.000 |
|
| Proposal 1 reflects trust wide proposal and voting results. |
ZNL-ANN-1220
1.9881587.103
Fidelity® Diversified International K6 Fund
Annual Report
October 31, 2020
See the inside front cover for important information about access to your fund’s shareholder reports.
Beginning on January 1, 2021, as permitted by regulations adopted by the Securities and Exchange Commission, paper copies of a fund’s shareholder reports will no longer be sent by mail, unless you specifically request paper copies of the reports from the fund or from your financial intermediary, such as a financial advisor, broker-dealer or bank. Instead, the reports will be made available on a website, and you will be notified by mail each time a report is posted and provided with a website link to access the report.
If you already elected to receive shareholder reports electronically, you will not be affected by this change and you need not take any action. You may elect to receive shareholder reports and other communications from a fund electronically, by contacting your financial intermediary. For Fidelity customers, visit Fidelity's web site or call Fidelity using the contact information listed below.
You may elect to receive all future reports in paper free of charge. If you wish to continue receiving paper copies of your shareholder reports, you may contact your financial intermediary or, if you are a Fidelity customer, visit Fidelity’s website, or call Fidelity at the applicable toll-free number listed below. Your election to receive reports in paper will apply to all funds held with the fund complex/your financial intermediary.
| Account Type | Website | Phone Number |
| Brokerage, Mutual Fund, or Annuity Contracts: | fidelity.com/mailpreferences | 1-800-343-3548 |
| Employer Provided Retirement Accounts: | netbenefits.fidelity.com/preferences (choose 'no' under Required Disclosures to continue to print) | 1-800-343-0860 |
| Advisor Sold Accounts Serviced Through Your Financial Intermediary: | Contact Your Financial Intermediary | Your Financial Intermediary's phone number |
| Advisor Sold Accounts Serviced by Fidelity: | institutional.fidelity.com | 1-877-208-0098 |
Contents
To view a fund's proxy voting guidelines and proxy voting record for the 12-month period ended June 30, visit http://www.fidelity.com/proxyvotingresults or visit the Securities and Exchange Commission's (SEC) web site at http://www.sec.gov.
You may also call 1-800-835-5092 to request a free copy of the proxy voting guidelines.
Standard & Poor's, S&P and S&P 500 are registered service marks of The McGraw-Hill Companies, Inc. and have been licensed for use by Fidelity Distributors Corporation.
Other third-party marks appearing herein are the property of their respective owners.
All other marks appearing herein are registered or unregistered trademarks or service marks of FMR LLC or an affiliated company. © 2020 FMR LLC. All rights reserved.
This report and the financial statements contained herein are submitted for the general information of the shareholders of the Fund. This report is not authorized for distribution to prospective investors in the Fund unless preceded or accompanied by an effective prospectus.
A fund files its complete schedule of portfolio holdings with the SEC for the first and third quarters of each fiscal year on Form N-PORT. Forms N-PORT are available on the SEC’s web site at http://www.sec.gov. A fund's Forms N-PORT may be reviewed and copied at the SEC’s Public Reference Room in Washington, DC. Information regarding the operation of the SEC's Public Reference Room may be obtained by calling 1-800-SEC-0330.
For a complete list of a fund's portfolio holdings, view the most recent holdings listing, semiannual report, or annual report on Fidelity's web site at http://www.fidelity.com, http://www.institutional.fidelity.com, or http://www.401k.com, as applicable.
NOT FDIC INSURED •MAY LOSE VALUE •NO BANK GUARANTEE
Neither the Fund nor Fidelity Distributors Corporation is a bank.
Note to Shareholders:
Early in 2020, the outbreak and spread of a new coronavirus emerged as a public health emergency that had a major influence on financial markets, primarily based on its impact on the global economy and the outlook for corporate earnings. The virus causes a respiratory disease known as COVID-19. On March 11, the World Health Organization declared the COVID-19 outbreak a pandemic, citing sustained risk of further global spread.
In the weeks following, as the crisis worsened, we witnessed an escalating human tragedy with wide-scale social and economic consequences from coronavirus-containment measures. The outbreak of COVID-19 prompted a number of measures to limit the spread, including travel and border restrictions, quarantines, and restrictions on large gatherings. In turn, these resulted in lower consumer activity, diminished demand for a wide range of products and services, disruption in manufacturing and supply chains, and – given the wide variability in outcomes regarding the outbreak – significant market uncertainty and volatility. Amid the turmoil, the global governments and central banks took unprecedented action to help support consumers, businesses, and the broader economies, and to limit disruption to financial systems.
The situation continues to unfold, and the extent and duration of its impact on financial markets and the economy remain highly uncertain. Extreme events such as the coronavirus crisis are “exogenous shocks” that can have significant adverse effects on mutual funds and their investments. Although multiple asset classes may be affected by market disruption, the duration and impact may not be the same for all types of assets.
Fidelity is committed to helping you stay informed amid news about COVID-19 and during increased market volatility, and we’re taking extra steps to be responsive to customer needs. We encourage you to visit our websites, where we offer ongoing updates, commentary, and analysis on the markets and our funds.
Performance: The Bottom Line
Average annual total return reflects the change in the value of an investment, assuming reinvestment of distributions from dividend income and capital gains (the profits earned upon the sale of securities that have grown in value, if any) and assuming a constant rate of performance each year. The hypothetical investment and the average annual total returns do not reflect the deduction of taxes that a shareholder would pay on fund distributions or the redemption of fund shares. During periods of reimbursement by Fidelity, a fund’s total return will be greater than it would be had the reimbursement not occurred. How a fund did yesterday is no guarantee of how it will do tomorrow.
Average Annual Total Returns
| For the periods ended October 31, 2020 | Past 1 year | Life of fundA |
| Fidelity® Diversified International K6 Fund | 9.70% | 6.31% |
A From May 25, 2017
$10,000 Over Life of Fund
Let's say hypothetically that $10,000 was invested in Fidelity® Diversified International K6 Fund on May 25, 2017, when the fund started.
The chart shows how the value of your investment would have changed, and also shows how the MSCI EAFE Index performed over the same period.
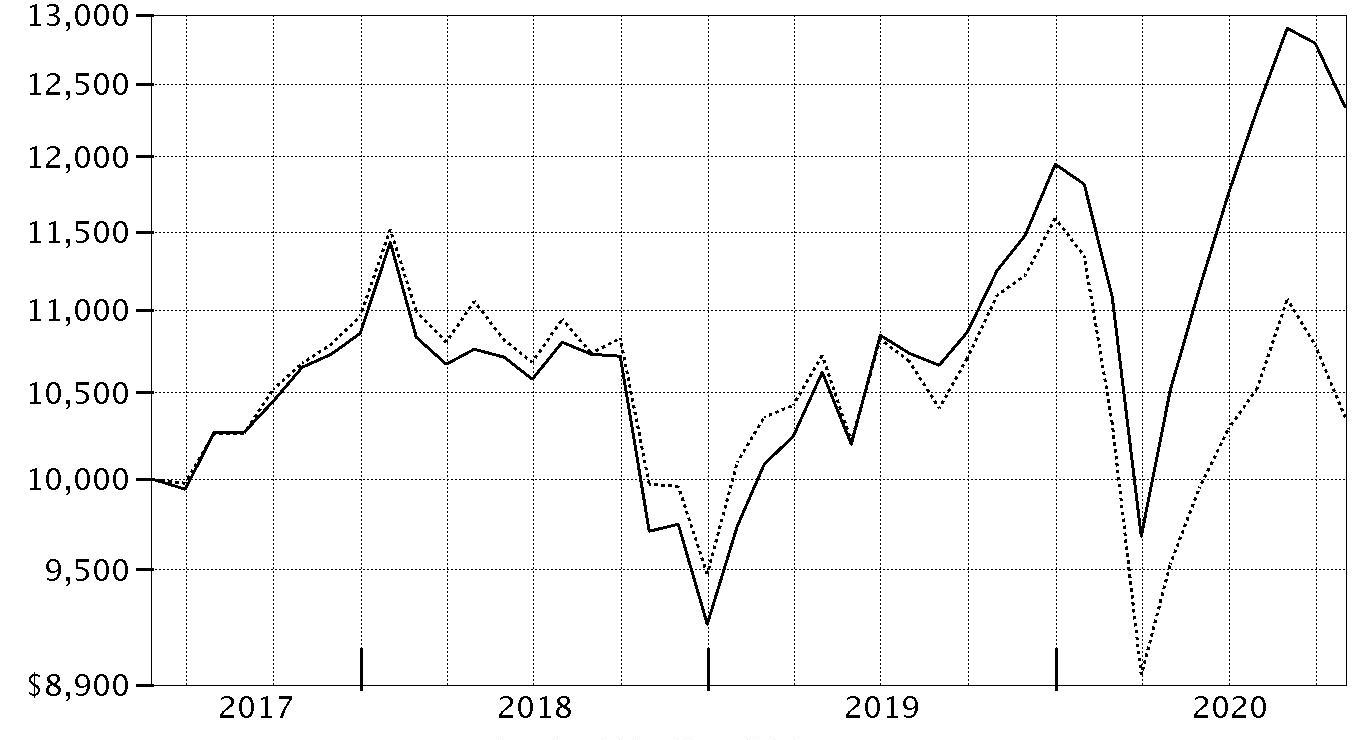
| Period Ending Values |
| $12,343 | Fidelity® Diversified International K6 Fund |
| $10,353 | MSCI EAFE Index |
Management's Discussion of Fund Performance
Market Recap: The MSCI ACWI (All Country World Index) ex USA Index returned -2.46% for the 12 months ending October 31, 2020, in what was a bumpy ride for non-U.S. equities, marked by a steep but brief decline due to the early-2020 outbreak and spread of the coronavirus, followed by a sharp upturn. Declared a pandemic on March 11, the crisis and containment efforts caused broad contraction in economic activity, elevated volatility and dislocation in financial markets. A historically rapid and expansive monetary- and fiscal-policy response around the world provided a partial offset to the economic disruption. Other supporting factors included resilient corporate earnings and near-term potential for a COVID-19 vaccine breakthrough. This was evident in the index’s 12.28% gain in the final six months of the year. Currency fluctuation generally boosted foreign developed-markets equities for the year, while the reverse was true for emerging-markets stocks. Late in the period, the index was pressured by a second wave of COVID-19 cases in some regions, and stretched valuations and crowded positioning in big tech. For the full year, the U.K. (-22%), Asia Pacific ex Japan (-8%), Canada (-5%) and Europe ex U.K. (-4%) notably lagged. Emerging markets (+9%) and Japan (+1%) outperformed. By sector, energy (-38%), financials and real estate (-20% each) lagged, whereas information technology (+ 25%) and communication services (+15%) topped the index.
Comments from Portfolio Manager Bill Bower: For the fiscal year ending October 31, 2020, the fund gained 9.70%, outperforming the -6.69% result of the benchmark MSCI EAFE Index (Net MA). From a regional standpoint, stock picks in Europe ex U.K. and an overweighting and security selection in emerging markets, specifically China, contributed most to the fund's relative result. Versus the benchmark, security selection was the primary contributor, especially within the industrials sector. Strong picks in consumer discretionary also boosted the fund's relative result. Also bolstering the fund's relative result were stock picks in communication services, especially within the media & entertainment industry. Not owning Royal Dutch Shell, a benchmark component that returned -55%, was the largest individual relative contributor versus the benchmark. The fund's non-benchmark stake in Tencent Holdings gained approximately 86%. Another top relative contributor was an out-of-benchmark stake in Alibaba Group Holding (+72%). Conversely, an underweighting in Japan hindered the fund's relative result. By sector, the primary detractor from performance versus the benchmark was an underweighting in utilities. An underweighting in the consumer staples sector, especially within the household & personal products industry, also hindered the fund's relative performance. Also hampering the fund's relative result was an underweighting in materials. The fund's biggest individual relative detractor was an underweighting in Nestle, which gained 8% the past year. The company was still among the largest holdings at period end. Also hampering performance was our lighter-than-benchmark stake in SoftBank Group, which gained 69%. SoftBank was not held at period end. The fund's non-benchmark stake in Axis Bank, a position not held at period end, returned -57%. Notable changes in positioning include increased exposure to Switzerland and a lower allocation to Netherlands. By sector, meaningful changes in positioning include increased exposure to communication services and a lower allocation to financials.
The views expressed above reflect those of the portfolio manager(s) only through the end of the period as stated on the cover of this report and do not necessarily represent the views of Fidelity or any other person in the Fidelity organization. Any such views are subject to change at any time based upon market or other conditions and Fidelity disclaims any responsibility to update such views. These views may not be relied on as investment advice and, because investment decisions for a Fidelity fund are based on numerous factors, may not be relied on as an indication of trading intent on behalf of any Fidelity fund.
Investment Summary (Unaudited)
Geographic Diversification (% of fund's net assets)
| As of October 31, 2020 |
| | Japan | 19.3% |
| | United States of America* | 9.4% |
| | Germany | 8.8% |
| | Switzerland | 8.8% |
| | United Kingdom | 7.4% |
| | France | 7.2% |
| | Netherlands | 5.9% |
| | Cayman Islands | 4.7% |
| | India | 3.6% |
| | Other | 24.9% |

* Includes Short-Term investments and Net Other Assets (Liabilities).
Percentages are based on country or territory of incorporation and are adjusted for the effect of futures contracts, if applicable.
Asset Allocation as of October 31, 2020
| | % of fund's net assets |
| Stocks | 95.5 |
| Short-Term Investments and Net Other Assets (Liabilities) | 4.5 |
Top Ten Stocks as of October 31, 2020
| | % of fund's net assets |
| Nestle SA (Reg. S) (Switzerland, Food Products) | 2.8 |
| Roche Holding AG (participation certificate) (Switzerland, Pharmaceuticals) | 2.5 |
| ASML Holding NV (Netherlands, Semiconductors & Semiconductor Equipment) | 2.4 |
| Hoya Corp. (Japan, Health Care Equipment & Supplies) | 1.9 |
| Keyence Corp. (Japan, Electronic Equipment & Components) | 1.8 |
| SAP SE (Germany, Software) | 1.7 |
| Reliance Industries Ltd. (India, Oil, Gas & Consumable Fuels) | 1.7 |
| Sony Corp. (Japan, Household Durables) | 1.6 |
| AIA Group Ltd. (Hong Kong, Insurance) | 1.6 |
| London Stock Exchange Group PLC (United Kingdom, Capital Markets) | 1.5 |
| | 19.5 |
Top Market Sectors as of October 31, 2020
| | % of fund's net assets |
| Information Technology | 16.9 |
| Industrials | 15.4 |
| Health Care | 14.3 |
| Financials | 11.8 |
| Consumer Discretionary | 11.4 |
| Consumer Staples | 8.6 |
| Materials | 5.7 |
| Communication Services | 5.6 |
| Utilities | 2.7 |
| Energy | 1.8 |
Schedule of Investments October 31, 2020
Showing Percentage of Net Assets
| Common Stocks - 95.4% | | | |
| | | Shares | Value |
| Australia - 0.8% | | | |
| Aristocrat Leisure Ltd. | | 395,616 | $7,966,413 |
| CSL Ltd. | | 82,080 | 16,617,699 |
|
| TOTAL AUSTRALIA | | | 24,584,112 |
|
| Bailiwick of Jersey - 1.2% | | | |
| Experian PLC | | 576,869 | 21,132,960 |
| Ferguson PLC | | 166,342 | 16,521,249 |
|
| TOTAL BAILIWICK OF JERSEY | | | 37,654,209 |
|
| Belgium - 0.9% | | | |
| KBC Groep NV | | 349,032 | 17,207,150 |
| UCB SA | | 125,456 | 12,375,714 |
|
| TOTAL BELGIUM | | | 29,582,864 |
|
| Bermuda - 1.5% | | | |
| Credicorp Ltd. (United States) | | 53,993 | 6,191,917 |
| Hiscox Ltd. (a) | | 653,694 | 6,981,519 |
| IHS Markit Ltd. | | 223,604 | 18,082,855 |
| Marvell Technology Group Ltd. | | 423,479 | 15,884,697 |
|
| TOTAL BERMUDA | | | 47,140,988 |
|
| Canada - 2.2% | | | |
| Alimentation Couche-Tard, Inc. Class B (sub. vtg.) | | 669,635 | 20,622,325 |
| Constellation Software, Inc. | | 14,345 | 15,058,751 |
| Fairfax India Holdings Corp. (a)(b) | | 486,160 | 3,719,124 |
| Franco-Nevada Corp. | | 93,556 | 12,751,508 |
| Wheaton Precious Metals Corp. | | 336,237 | 15,430,106 |
|
| TOTAL CANADA | | | 67,581,814 |
|
| Cayman Islands - 4.7% | | | |
| Alibaba Group Holding Ltd. sponsored ADR (a) | | 147,339 | 44,892,720 |
| Anta Sports Products Ltd. | | 1,041,078 | 11,454,880 |
| JD.com, Inc. Class A | | 212,467 | 8,666,214 |
| KE Holdings, Inc. ADR (a) | | 140,600 | 9,806,850 |
| Li Ning Co. Ltd. | | 650,500 | 3,356,337 |
| New Oriental Education & Technology Group, Inc. sponsored ADR (a) | | 82,579 | 13,244,020 |
| Tencent Holdings Ltd. | | 604,525 | 46,189,128 |
| Zai Lab Ltd. ADR (a) | | 87,315 | 7,164,196 |
|
| TOTAL CAYMAN ISLANDS | | | 144,774,345 |
|
| China - 0.7% | | | |
| Kweichow Moutai Co. Ltd. (A Shares) | | 92,753 | 23,200,038 |
| Denmark - 2.6% | | | |
| DSV Panalpina A/S | | 216,919 | 35,123,774 |
| GN Store Nord A/S | | 82,130 | 5,906,627 |
| ORSTED A/S (b) | | 195,096 | 30,964,470 |
| Vestas Wind Systems A/S | | 54,176 | 9,294,652 |
|
| TOTAL DENMARK | | | 81,289,523 |
|
| France - 7.2% | | | |
| Amundi SA (b) | | 214,978 | 14,096,063 |
| Capgemini SA | | 179,419 | 20,716,328 |
| Dassault Systemes SA | | 61,999 | 10,581,956 |
| Legrand SA | | 235,560 | 17,415,418 |
| LVMH Moet Hennessy Louis Vuitton SE | | 97,734 | 45,812,584 |
| Pernod Ricard SA | | 130,724 | 21,071,082 |
| Sanofi SA | | 472,939 | 42,703,268 |
| Sartorius Stedim Biotech | | 19,243 | 7,297,139 |
| SR Teleperformance SA | | 105,478 | 31,657,144 |
| Worldline SA (a)(b) | | 168,019 | 12,453,287 |
|
| TOTAL FRANCE | | | 223,804,269 |
|
| Germany - 8.8% | | | |
| adidas AG | | 113,264 | 33,637,794 |
| Allianz SE | | 142,664 | 25,099,167 |
| Deutsche Borse AG | | 144,940 | 21,328,432 |
| Deutsche Post AG | | 635,173 | 28,140,251 |
| Hannover Reuck SE | | 111,559 | 16,201,920 |
| Linde PLC | | 157,764 | 34,579,838 |
| RWE AG | | 501,681 | 18,574,349 |
| SAP SE | | 486,598 | 51,912,534 |
| Symrise AG | | 168,720 | 20,799,498 |
| Vonovia SE | | 370,115 | 23,630,404 |
|
| TOTAL GERMANY | | | 273,904,187 |
|
| Hong Kong - 2.1% | | | |
| AIA Group Ltd. | | 5,257,892 | 50,040,286 |
| Techtronic Industries Co. Ltd. | | 1,033,091 | 13,778,989 |
|
| TOTAL HONG KONG | | | 63,819,275 |
|
| India - 3.6% | | | |
| HDFC Bank Ltd. | | 1,433,881 | 22,763,072 |
| Housing Development Finance Corp. Ltd. | | 635,178 | 16,380,771 |
| Kotak Mahindra Bank Ltd. (a) | | 890,792 | 18,479,196 |
| Reliance Industries Ltd. | | 122,713 | 1,944,032 |
| Reliance Industries Ltd. | | 1,840,695 | 50,729,960 |
|
| TOTAL INDIA | | | 110,297,031 |
|
| Indonesia - 0.7% | | | |
| PT Bank Central Asia Tbk | | 6,810,276 | 13,400,279 |
| PT Bank Rakyat Indonesia Tbk | | 38,588,944 | 8,735,456 |
|
| TOTAL INDONESIA | | | 22,135,735 |
|
| Ireland - 1.9% | | | |
| Aon PLC | | 74,737 | 13,752,355 |
| DCC PLC (United Kingdom) | | 19,926 | 1,296,902 |
| Kerry Group PLC Class A | | 109,205 | 13,061,961 |
| Kingspan Group PLC (Ireland) | | 190,016 | 16,564,465 |
| Ryanair Holdings PLC (a) | | 112,000 | 1,543,280 |
| Ryanair Holdings PLC sponsored ADR (a) | | 145,351 | 11,715,291 |
|
| TOTAL IRELAND | | | 57,934,254 |
|
| Italy - 1.6% | | | |
| Enel SpA | | 1,986,286 | 15,791,977 |
| FinecoBank SpA | | 747,728 | 10,232,387 |
| GVS SpA (b) | | 257,673 | 3,631,196 |
| Recordati SpA | | 292,743 | 15,168,560 |
| Reply SpA | | 40,100 | 4,310,638 |
|
| TOTAL ITALY | | | 49,134,758 |
|
| Japan - 19.3% | | | |
| Astellas Pharma, Inc. | | 364,457 | 4,997,777 |
| Bandai Namco Holdings, Inc. | | 203,379 | 15,199,487 |
| Daikin Industries Ltd. | | 165,699 | 31,007,794 |
| Fast Retailing Co. Ltd. | | 15,367 | 10,719,126 |
| Hoya Corp. | | 523,411 | 59,070,563 |
| Iriso Electronics Co. Ltd. | | 46,226 | 1,760,022 |
| Itochu Corp. | | 1,027,013 | 24,667,333 |
| Kao Corp. | | 326,583 | 23,252,289 |
| Keyence Corp. | | 122,944 | 55,794,753 |
| KH Neochem Co. Ltd. | | 152,696 | 3,573,140 |
| Minebea Mitsumi, Inc. | | 1,597,541 | 28,853,762 |
| Misumi Group, Inc. | | 336,854 | 10,004,420 |
| Murata Manufacturing Co. Ltd. | | 172,552 | 12,100,841 |
| Nabtesco Corp. | | 133,555 | 4,989,380 |
| Nexon Co. Ltd. | | 181,858 | 5,068,548 |
| Nintendo Co. Ltd. | | 16,920 | 9,148,454 |
| Nitori Holdings Co. Ltd. | | 129,896 | 26,700,991 |
| NOF Corp. | | 85,700 | 3,220,806 |
| Oracle Corp. Japan | | 63,409 | 6,337,101 |
| ORIX Corp. | | 957,039 | 11,192,798 |
| PALTAC Corp. | | 47,400 | 2,650,020 |
| Park24 Co. Ltd. | | 36,700 | 495,738 |
| Persol Holdings Co., Ltd. | | 638,644 | 9,673,031 |
| Recruit Holdings Co. Ltd. | | 572,476 | 21,783,099 |
| Relo Group, Inc. | | 126,700 | 3,040,645 |
| Shin-Etsu Chemical Co. Ltd. | | 242,960 | 32,451,401 |
| Shiseido Co. Ltd. | | 103,154 | 6,385,957 |
| SMC Corp. | | 58,575 | 31,156,374 |
| Sony Corp. | | 602,459 | 50,224,887 |
| Tokyo Electron Ltd. | | 98,627 | 26,472,559 |
| Tsuruha Holdings, Inc. | | 192,822 | 26,999,908 |
| Welcia Holdings Co. Ltd. | | 475,904 | 18,651,310 |
| Z Holdings Corp. | | 3,083,482 | 21,501,305 |
|
| TOTAL JAPAN | | | 599,145,619 |
|
| Korea (South) - 1.8% | | | |
| LG Chemical Ltd. | | 21,082 | 11,470,399 |
| Samsung Electronics Co. Ltd. | | 517,546 | 25,957,699 |
| SK Hynix, Inc. | | 248,335 | 17,578,946 |
|
| TOTAL KOREA (SOUTH) | | | 55,007,044 |
|
| Luxembourg - 1.3% | | | |
| B&M European Value Retail SA | | 4,462,065 | 28,024,374 |
| Eurofins Scientific SA (a) | | 10,165 | 8,095,281 |
| Globant SA (a) | | 25,685 | 4,638,968 |
|
| TOTAL LUXEMBOURG | | | 40,758,623 |
|
| Netherlands - 5.9% | | | |
| Adyen BV (a)(b) | | 4,825 | 8,109,590 |
| ASML Holding NV | | 210,907 | 76,181,717 |
| IMCD NV | | 22,300 | 2,583,145 |
| JDE Peet's BV | | 254,700 | 9,077,072 |
| Koninklijke Philips Electronics NV | | 617,147 | 28,584,259 |
| NXP Semiconductors NV | | 229,257 | 30,977,206 |
| Wolters Kluwer NV | | 334,381 | 27,097,015 |
|
| TOTAL NETHERLANDS | | | 182,610,004 |
|
| New Zealand - 0.4% | | | |
| Ryman Healthcare Group Ltd. | | 1,216,563 | 11,258,171 |
| Norway - 1.2% | | | |
| Adevinta ASA Class B (a) | | 753,573 | 11,643,039 |
| NEL ASA (a) | | 1,935,653 | 3,665,852 |
| Schibsted ASA (A Shares) | | 533,762 | 21,760,531 |
|
| TOTAL NORWAY | | | 37,069,422 |
|
| Spain - 1.7% | | | |
| Cellnex Telecom SA (b) | | 514,629 | 33,036,870 |
| Iberdrola SA | | 1,669,551 | 19,687,481 |
|
| TOTAL SPAIN | | | 52,724,351 |
|
| Sweden - 1.2% | | | |
| Hexagon AB (B Shares) | | 237,604 | 17,366,902 |
| Indutrade AB (a) | | 316,974 | 16,079,527 |
| Svenska Handelsbanken AB (A Shares) (a) | | 581,413 | 4,711,007 |
|
| TOTAL SWEDEN | | | 38,157,436 |
|
| Switzerland - 8.8% | | | |
| Dufry AG (a)(c) | | 222,900 | 8,435,171 |
| Idorsia Ltd. (a) | | 59,475 | 1,559,277 |
| Lonza Group AG | | 49,189 | 29,804,117 |
| Nestle SA (Reg. S) | | 778,060 | 87,514,583 |
| Roche Holding AG (participation certificate) | | 242,324 | 77,866,343 |
| Sika AG | | 171,803 | 42,287,951 |
| Sonova Holding AG Class B | | 52,306 | 12,406,952 |
| Straumann Holding AG | | 3,027 | 3,155,910 |
| Swiss Re Ltd. | | 135,348 | 9,703,667 |
|
| TOTAL SWITZERLAND | | | 272,733,971 |
|
| Taiwan - 1.1% | | | |
| Taiwan Semiconductor Manufacturing Co. Ltd. sponsored ADR | | 397,461 | 33,335,054 |
| United Kingdom - 7.4% | | | |
| AstraZeneca PLC (United Kingdom) | | 434,623 | 43,638,541 |
| Beazley PLC | | 1,292,231 | 4,921,811 |
| Big Yellow Group PLC | | 507,804 | 7,236,461 |
| Compass Group PLC | | 452,231 | 6,190,024 |
| John David Group PLC | | 524,138 | 5,032,902 |
| London Stock Exchange Group PLC | | 440,702 | 47,506,760 |
| Ocado Group PLC (a) | | 519,057 | 15,304,697 |
| Prudential PLC | | 1,342,758 | 16,422,606 |
| Reckitt Benckiser Group PLC | | 197,759 | 17,420,301 |
| RELX PLC (Euronext N.V.) | | 1,318,435 | 26,111,438 |
| Rentokil Initial PLC (a) | | 2,666,183 | 18,168,251 |
| S4 Capital PLC (a) | | 593,700 | 3,076,553 |
| Smith & Nephew PLC | | 741,893 | 12,882,334 |
| THG Holdings Ltd. | | 828,339 | 7,078,255 |
|
| TOTAL UNITED KINGDOM | | | 230,990,934 |
|
| United States of America - 4.8% | | | |
| Alphabet, Inc. Class C (a) | | 10,673 | 17,301,040 |
| Danaher Corp. | | 48,084 | 11,037,201 |
| IQVIA Holdings, Inc. (a) | | 109,328 | 16,835,419 |
| Marsh & McLennan Companies, Inc. | | 143,555 | 14,852,200 |
| MasterCard, Inc. Class A | | 75,671 | 21,841,677 |
| Microsoft Corp. | | 78,475 | 15,888,833 |
| NICE Systems Ltd. sponsored ADR (a) | | 63,662 | 14,531,488 |
| Regeneron Pharmaceuticals, Inc. (a) | | 22,621 | 12,295,871 |
| Visa, Inc. Class A | | 126,254 | 22,941,614 |
|
| TOTAL UNITED STATES OF AMERICA | | | 147,525,343 |
|
| TOTAL COMMON STOCKS | | | |
| (Cost $2,288,404,339) | | | 2,958,153,374 |
|
| Convertible Preferred Stocks - 0.1% | | | |
| United States of America - 0.1% | | | |
| Rivian Automotive, Inc. Series E (d)(e) | | | |
| (Cost $4,731,436) | | 305,451 | 4,731,436 |
|
| Money Market Funds - 4.5% | | | |
| Fidelity Cash Central Fund 0.10% (f) | | 131,444,787 | 131,471,076 |
| Fidelity Securities Lending Cash Central Fund 0.11% (f)(g) | | 7,525,732 | 7,526,485 |
| TOTAL MONEY MARKET FUNDS | | | |
| (Cost $138,996,939) | | | 138,997,561 |
| TOTAL INVESTMENT IN SECURITIES - 100.0% | | | |
| (Cost $2,432,132,714) | | | 3,101,882,371 |
| NET OTHER ASSETS (LIABILITIES) - 0.0% | | | 411,320 |
| NET ASSETS - 100% | | | $3,102,293,691 |
Categorizations in the Schedule of Investments are based on country or territory of incorporation.
Legend
(a) Non-income producing
(b) Security exempt from registration under Rule 144A of the Securities Act of 1933. These securities may be resold in transactions exempt from registration, normally to qualified institutional buyers. At the end of the period, the value of these securities amounted to $106,010,600 or 3.4% of net assets.
(c) Security or a portion of the security is on loan at period end.
(d) Restricted securities (including private placements) - Investment in securities not registered under the Securities Act of 1933 (excluding 144A issues). At the end of the period, the value of restricted securities (excluding 144A issues) amounted to $4,731,436 or 0.1% of net assets.
(e) Level 3 security
(f) Affiliated fund that is generally available only to investment companies and other accounts managed by Fidelity Investments. The rate quoted is the annualized seven-day yield of the fund at period end. A complete unaudited listing of the fund's holdings as of its most recent quarter end is available upon request. In addition, each Fidelity Central Fund's financial statements, which are not covered by the Fund's Report of Independent Registered Public Accounting Firm, are available on the SEC's website or upon request.
(g) Investment made with cash collateral received from securities on loan.
Additional information on each restricted holding is as follows:
| Security | Acquisition Date | Acquisition Cost |
| Rivian Automotive, Inc. Series E | 7/10/20 | $4,731,436 |
Affiliated Central Funds
Information regarding fiscal year to date income earned by the Fund from investments in Fidelity Central Funds is as follows:
| Fund | Income earned |
| Fidelity Cash Central Fund | $678,543 |
| Fidelity Securities Lending Cash Central Fund | 139,465 |
| Total | $818,008 |
Amounts in the income column in the above table include any capital gain distributions from underlying funds, which are presented in the corresponding line-item in the Statement of Operations, if applicable. Amount for Fidelity Securities Lending Cash Central Fund represents the income earned on investing cash collateral, less rebates paid to borrowers and any lending agent fees associated with the loan, plus any premium payments received for lending certain types of securities.
Investment Valuation
The following is a summary of the inputs used, as of October 31, 2020, involving the Fund's assets and liabilities carried at fair value. The inputs or methodology used for valuing securities may not be an indication of the risk associated with investing in those securities. For more information on valuation inputs, and their aggregation into the levels used below, please refer to the Investment Valuation section in the accompanying Notes to Financial Statements.
| | Valuation Inputs at Reporting Date: |
| Description | Total | Level 1 | Level 2 | Level 3 |
| Investments in Securities: | | | | |
| Equities: | | | | |
| Communication Services | $168,725,468 | $86,818,033 | $81,907,435 | $-- |
| Consumer Discretionary | 349,322,332 | 170,461,150 | 174,129,746 | 4,731,436 |
| Consumer Staples | 267,256,826 | 63,832,440 | 203,424,386 | -- |
| Energy | 52,673,992 | -- | 52,673,992 | -- |
| Financials | 373,919,943 | 164,287,712 | 209,632,231 | -- |
| Health Care | 444,352,415 | 116,929,343 | 327,423,072 | -- |
| Industrials | 478,603,389 | 267,480,317 | 211,123,072 | -- |
| Information Technology | 522,733,161 | 316,709,116 | 206,024,045 | -- |
| Materials | 176,564,647 | 125,848,901 | 50,715,746 | -- |
| Real Estate | 43,714,360 | 40,673,715 | 3,040,645 | -- |
| Utilities | 85,018,277 | 69,226,300 | 15,791,977 | -- |
| Money Market Funds | 138,997,561 | 138,997,561 | -- | -- |
| Total Investments in Securities: | $3,101,882,371 | $1,561,264,588 | $1,535,886,347 | $4,731,436 |
See accompanying notes which are an integral part of the financial statements.
Financial Statements
Statement of Assets and Liabilities
| | | October 31, 2020 |
| Assets | | |
Investment in securities, at value (including securities loaned of $7,272,784) — See accompanying schedule:
Unaffiliated issuers (cost $2,293,135,775) | $2,962,884,810 | |
| Fidelity Central Funds (cost $138,996,939) | 138,997,561 | |
| Total Investment in Securities (cost $2,432,132,714) | | $3,101,882,371 |
| Foreign currency held at value (cost $2,816,285) | | 2,809,862 |
| Receivable for investments sold | | 8,402,341 |
| Receivable for fund shares sold | | 2,846,726 |
| Dividends receivable | | 6,676,276 |
| Distributions receivable from Fidelity Central Funds | | 16,984 |
| Other receivables | | 121,757 |
| Total assets | | 3,122,756,317 |
| Liabilities | | |
| Payable for investments purchased | $5,996,809 | |
| Payable for fund shares redeemed | 2,573,424 | |
| Accrued management fee | 1,662,865 | |
| Other payables and accrued expenses | 2,703,050 | |
| Collateral on securities loaned | 7,526,478 | |
| Total liabilities | | 20,462,626 |
| Net Assets | | $3,102,293,691 |
| Net Assets consist of: | | |
| Paid in capital | | $2,731,456,980 |
| Total accumulated earnings (loss) | | 370,836,711 |
| Net Assets | | $3,102,293,691 |
| Net Asset Value, offering price and redemption price per share ($3,102,293,691 ÷ 259,426,339 shares) | | $11.96 |
See accompanying notes which are an integral part of the financial statements.
Statement of Operations
| | | Year ended October 31, 2020 |
| Investment Income | | |
| Dividends | | $40,126,584 |
| Income from Fidelity Central Funds (including $139,465 from security lending) | | 818,008 |
| Total income | | 40,944,592 |
| Expenses | | |
| Management fee | $18,581,786 | |
| Independent trustees' fees and expenses | 17,371 | |
| Miscellaneous | 43,682 | |
| Total expenses before reductions | 18,642,839 | |
| Expense reductions | (320,365) | |
| Total expenses after reductions | | 18,322,474 |
| Net investment income (loss) | | 22,622,118 |
| Realized and Unrealized Gain (Loss) | | |
| Net realized gain (loss) on: | | |
| Investment securities: | | |
| Unaffiliated issuers (net of foreign taxes of $15,590) | (40,714,491) | |
| Fidelity Central Funds | 5,389 | |
| Foreign currency transactions | (209,778) | |
| Total net realized gain (loss) | | (40,918,880) |
| Change in net unrealized appreciation (depreciation) on: | | |
| Investment securities: | | |
| Unaffiliated issuers (net of increase in deferred foreign taxes of $384,721) | 312,405,400 | |
| Assets and liabilities in foreign currencies | 251,668 | |
| Total change in net unrealized appreciation (depreciation) | | 312,657,068 |
| Net gain (loss) | | 271,738,188 |
| Net increase (decrease) in net assets resulting from operations | | $294,360,306 |
See accompanying notes which are an integral part of the financial statements.
Statement of Changes in Net Assets
| | Year ended October 31, 2020 | Year ended October 31, 2019 |
| Increase (Decrease) in Net Assets | | |
| Operations | | |
| Net investment income (loss) | $22,622,118 | $41,701,884 |
| Net realized gain (loss) | (40,918,880) | (181,577,336) |
| Change in net unrealized appreciation (depreciation) | 312,657,068 | 544,458,131 |
| Net increase (decrease) in net assets resulting from operations | 294,360,306 | 404,582,679 |
| Distributions to shareholders | (49,306,224) | (29,912,287) |
| Share transactions | | |
| Proceeds from sales of shares | 880,189,889 | 1,058,110,530 |
| Reinvestment of distributions | 49,306,223 | 29,912,287 |
| Cost of shares redeemed | (1,049,644,657) | (692,659,826) |
| Net increase (decrease) in net assets resulting from share transactions | (120,148,545) | 395,362,991 |
| Total increase (decrease) in net assets | 124,905,537 | 770,033,383 |
| Net Assets | | |
| Beginning of period | 2,977,388,154 | 2,207,354,771 |
| End of period | $3,102,293,691 | $2,977,388,154 |
| Other Information | | |
| Shares | | |
| Sold | 77,942,373 | 106,470,262 |
| Issued in reinvestment of distributions | 4,402,341 | 3,226,784 |
| Redeemed | (91,540,941) | (68,929,558) |
| Net increase (decrease) | (9,196,227) | 40,767,488 |
See accompanying notes which are an integral part of the financial statements.
Financial Highlights
Fidelity Diversified International K6 Fund
| | | | | |
| Years ended October 31, | 2020 | 2019 | 2018 | 2017 A |
| Selected Per–Share Data | | | | |
| Net asset value, beginning of period | $11.08 | $9.69 | $10.65 | $10.00 |
| Income from Investment Operations | | | | |
| Net investment income (loss)B | .08 | .16 | .18 | .03C |
| Net realized and unrealized gain (loss) | .98 | 1.36 | (1.12) | .62 |
| Total from investment operations | 1.06 | 1.52 | (.94) | .65 |
| Distributions from net investment income | (.15) | (.13) | (.02) | – |
| Distributions from net realized gain | (.03) | – | (.01) | – |
| Total distributions | (.18) | (.13) | (.02)D | – |
| Net asset value, end of period | $11.96 | $11.08 | $9.69 | $10.65 |
| Total ReturnE,F | 9.70% | 15.89% | (8.83)% | 6.50% |
| Ratios to Average Net AssetsG,H | | | | |
| Expenses before reductions | .60% | .60% | .60% | .60%I |
| Expenses net of fee waivers, if any | .60% | .60% | .60% | .60%I |
| Expenses net of all reductions | .59% | .59% | .58% | .60%I |
| Net investment income (loss) | .73% | 1.59% | 1.67% | .64%C,I |
| Supplemental Data | | | | |
| Net assets, end of period (000 omitted) | $3,102,294 | $2,977,388 | $2,207,355 | $296,146 |
| Portfolio turnover rateJ | 34% | 48%K | 48%K | 27%K,L |
A For the period May 25, 2017 (commencement of operations) to October 31, 2017.
B Calculated based on average shares outstanding during the period.
C Net investment income per share reflects one or more large, non-recurring dividend(s) which amounted to $.01 per share. Excluding such non-recurring dividend(s), the ratio of net investment income (loss) to average net assets would have been .58%.
D Total distributions per share do not sum due to rounding.
E Total returns for periods of less than one year are not annualized.
F Total returns would have been lower if certain expenses had not been reduced during the applicable periods shown.
G Fees and expenses of any underlying mutual funds or exchange-traded funds (ETFs) are not included in the Fund's expense ratio. The Fund indirectly bears its proportionate share of these expenses. For additional expense information related to investments in Fidelity Central Funds, please refer to the "Investments in Fidelity Central Funds" note found in the Notes to Financial Statements section of the most recent Annual or Semi-Annual report.
H Expense ratios reflect operating expenses of the class. Expenses before reductions do not reflect amounts reimbursed, waived, or reduced through arrangements with the investment advisor, brokerage services, or other offset arrangements, if applicable, and do not represent the amount paid by the class during periods when reimbursements, waivers or reductions occur.
I Annualized
J Amount does not include the portfolio activity of any underlying mutual funds or exchange-traded funds (ETFs).
K Portfolio turnover rate excludes securities received or delivered in-kind.
L Amount not annualized.
See accompanying notes which are an integral part of the financial statements.
Notes to Financial Statements
For the period ended October 31, 2020
1. Organization.
Fidelity Diversified International K6 Fund (the Fund) is a fund of Fidelity Investment Trust (the Trust) and is authorized to issue an unlimited number of shares. Share transactions on the Statement of Changes in Net Assets may contain exchanges between affiliated funds. The Trust is registered under the Investment Company Act of 1940, as amended (the 1940 Act), as an open-end management investment company organized as a Massachusetts business trust. Shares generally are available only to employer-sponsored retirement plans that are recordkept by Fidelity, or to certain employer-sponsored retirement plans that are not recordkept by Fidelity. The Fund's investments in emerging markets can be subject to social, economic, regulatory, and political uncertainties and can be extremely volatile.
Effective January 1, 2020:
Investment advisers Fidelity Investments Money Management, Inc., FMR Co., Inc., and Fidelity SelectCo, LLC, merged with and into Fidelity Management & Research Company. In connection with the merger transactions, the resulting, merged investment adviser was then redomiciled from Massachusetts to Delaware, changed its corporate structure from a corporation to a limited liability company, and changed its name to "Fidelity Management & Research Company LLC".
2. Investments in Fidelity Central Funds.
The Fund invests in Fidelity Central Funds, which are open-end investment companies generally available only to other investment companies and accounts managed by the investment adviser and its affiliates. The Fund's Schedule of Investments lists each of the Fidelity Central Funds held as of period end, if any, as an investment of the Fund, but does not include the underlying holdings of each Fidelity Central Fund. As an Investing Fund, the Fund indirectly bears its proportionate share of the expenses of the underlying Fidelity Central Funds.
The Money Market Central Funds seek preservation of capital and current income and are managed by the investment adviser. Annualized expenses of the Money Market Central Funds as of their most recent shareholder report date ranged from less than .005% to .01%.
A complete unaudited list of holdings for each Fidelity Central Fund is available upon request or at the Securities and Exchange Commission (the SEC) website at www.sec.gov. In addition, the financial statements of the Fidelity Central Funds, which are not covered by the Fund's Report of Independent Registered Public Accounting Firm, are available on the SEC website or upon request.
3. Significant Accounting Policies.
The Fund is an investment company and applies the accounting and reporting guidance of the Financial Accounting Standards Board (FASB) Accounting Standards Codification Topic 946 Financial Services – Investment Companies. The financial statements have been prepared in conformity with accounting principles generally accepted in the United States of America (GAAP), which require management to make certain estimates and assumptions at the date of the financial statements. Actual results could differ from those estimates. Subsequent events, if any, through the date that the financial statements were issued have been evaluated in the preparation of the financial statements. The following summarizes the significant accounting policies of the Fund:
Investment Valuation. Investments are valued as of 4:00 p.m. Eastern time on the last calendar day of the period. The Board of Trustees (the Board) has delegated the day to day responsibility for the valuation of the Fund's investments to the Fair Value Committee (the Committee) established by the Fund's investment adviser. In accordance with valuation policies and procedures approved by the Board, the Fund attempts to obtain prices from one or more third party pricing vendors or brokers to value its investments. When current market prices, quotations or currency exchange rates are not readily available or reliable, investments will be fair valued in good faith by the Committee, in accordance with procedures adopted by the Board. Factors used in determining fair value vary by investment type and may include market or investment specific events. The frequency with which these procedures are used cannot be predicted and they may be utilized to a significant extent. The Committee oversees the Fund's valuation policies and procedures and reports to the Board on the Committee's activities and fair value determinations. The Board monitors the appropriateness of the procedures used in valuing the Fund's investments and ratifies the fair value determinations of the Committee.
The Fund categorizes the inputs to valuation techniques used to value its investments into a disclosure hierarchy consisting of three levels as shown below:
- Level 1 – quoted prices in active markets for identical investments
- Level 2 – other significant observable inputs (including quoted prices for similar investments, interest rates, prepayment speeds, etc.)
- Level 3 – unobservable inputs (including the Fund's own assumptions based on the best information available)
Valuation techniques used to value the Fund's investments by major category are as follows:
Equity securities, including restricted securities, for which market quotations are readily available, are valued at the last reported sale price or official closing price as reported by a third party pricing vendor on the primary market or exchange on which they are traded and are categorized as Level 1 in the hierarchy. In the event there were no sales during the day or closing prices are not available, securities are valued at the last quoted bid price or may be valued using the last available price and are generally categorized as Level 2 in the hierarchy. For foreign equity securities, when market or security specific events arise, comparisons to the valuation of American Depositary Receipts (ADRs), futures contracts, Exchange-Traded Funds (ETFs) and certain indexes as well as quoted prices for similar securities may be used and would be categorized as Level 2 in the hierarchy. For equity securities, including restricted securities, where observable inputs are limited, assumptions about market activity and risk are used and these securities may be categorized as Level 3 in the hierarchy.
Investments in open-end mutual funds, including the Fidelity Central Funds, are valued at their closing net asset value (NAV) each business day and are categorized as Level 1 in the hierarchy.
Changes in valuation techniques may result in transfers in or out of an assigned level within the disclosure hierarchy. The aggregate value of investments by input level as of October 31, 2020 is included at the end of the Fund's Schedule of Investments.
Foreign Currency. Certain Funds may use foreign currency contracts to facilitate transactions in foreign-denominated securities. Gains and losses from these transactions may arise from changes in the value of the foreign currency or if the counterparties do not perform under the contracts' terms.
Foreign-denominated assets, including investment securities, and liabilities are translated into U.S. dollars at the exchange rates at period end. Purchases and sales of investment securities, income and dividends received, and expenses denominated in foreign currencies are translated into U.S. dollars at the exchange rate in effect on the transaction date.
The effects of exchange rate fluctuations on investments are included with the net realized and unrealized gain (loss) on investment securities. Other foreign currency transactions resulting in realized and unrealized gain (loss) are disclosed separately.
Investment Transactions and Income. For financial reporting purposes, the Fund's investment holdings and NAV include trades executed through the end of the last business day of the period. The NAV per share for processing shareholder transactions is calculated as of the close of business of the New York Stock Exchange (NYSE), normally 4:00 p.m. Eastern time and includes trades executed through the end of the prior business day. Gains and losses on securities sold are determined on the basis of identified cost. Dividend income is recorded on the ex-dividend date, except for certain dividends from foreign securities where the ex-dividend date may have passed, which are recorded as soon as the Fund is informed of the ex-dividend date. Non-cash dividends included in dividend income, if any, are recorded at the fair market value of the securities received. Income and capital gain distributions from Fidelity Central Funds, if any, are recorded on the ex-dividend date. Certain distributions received by the Fund represent a return of capital or capital gain. The Fund determines the components of these distributions subsequent to the ex-dividend date, based upon receipt of tax filings or other correspondence relating to the underlying investment. These distributions are recorded as a reduction of cost of investments and/or as a realized gain. Investment income is recorded net of foreign taxes withheld where recovery of such taxes is uncertain.
Expenses. Expenses directly attributable to a fund are charged to that fund. Expenses attributable to more than one fund are allocated among the respective funds on the basis of relative net assets or other appropriate methods. Expense estimates are accrued in the period to which they relate and adjustments are made when actual amounts are known.
Income Tax Information and Distributions to Shareholders. Each year, the Fund intends to qualify as a regulated investment company under Subchapter M of the Internal Revenue Code, including distributing substantially all of its taxable income and realized gains. As a result, no provision for U.S. Federal income taxes is required. As of October 31, 2020, the Fund did not have any unrecognized tax benefits in the financial statements; nor is the Fund aware of any tax positions for which it is reasonably possible that the total amounts of unrecognized tax benefits will significantly change in the next twelve months. The Fund files a U.S. federal tax return, in addition to state and local tax returns as required. The Fund's federal income tax returns are subject to examination by the Internal Revenue Service (IRS) for a period of three fiscal years after they are filed. State and local tax returns may be subject to examination for an additional fiscal year depending on the jurisdiction. Foreign taxes are provided for based on the Fund's understanding of the tax rules and rates that exist in the foreign markets in which it invests. The Fund is subject to a tax imposed on capital gains by certain countries in which it invests. An estimated deferred tax liability for net unrealized appreciation on the applicable securities is included in Other payables and accrued expenses on the Statement of Assets & Liabilities.
Distributions are declared and recorded on the ex-dividend date. Income and capital gain distributions are determined in accordance with income tax regulations, which may differ from GAAP.
Capital accounts within the financial statements are adjusted for permanent book-tax differences. These adjustments have no impact on net assets or the results of operations. Capital accounts are not adjusted for temporary book-tax differences which will reverse in a subsequent period.
Book-tax differences are primarily due to foreign currency transactions, certain foreign taxes, passive foreign investment companies (PFIC), capital loss carryforwards and losses deferred due to wash sales.
As of period end, the cost and unrealized appreciation (depreciation) in securities, and derivatives if applicable, for federal income tax purposes were as follows:
| Gross unrealized appreciation | $746,701,728 |
| Gross unrealized depreciation | (83,819,657) |
| Net unrealized appreciation (depreciation) | $662,882,071 |
| Tax Cost | $2,439,000,300 |
The tax-based components of distributable earnings as of period end were as follows:
| Undistributed ordinary income | $20,303,504 |
| Capital loss carryforward | $(309,865,857) |
| Net unrealized appreciation (depreciation) on securities and other investments | $663,102,115 |
Capital loss carryforwards are only available to offset future capital gains of the Fund to the extent provided by regulations and may be limited. The capital loss carryforward information presented below, including any applicable limitation, is estimated as of fiscal period end and is subject to adjustment.
| No expiration | |
| Short-term | $(223,481,577) |
| Long-term | (86,384,280) |
| Total capital loss carryforward | $(309,865,857) |
The tax character of distributions paid was as follows:
| | October 31, 2020 | October 31, 2019 |
| Ordinary Income | $49,306,223 | $ 29,912,287 |
Restricted Securities (including Private Placements). The Fund may invest in securities that are subject to legal or contractual restrictions on resale. These securities generally may be resold in transactions exempt from registration or to the public if the securities are registered. Disposal of these securities may involve time-consuming negotiations and expense, and prompt sale at an acceptable price may be difficult. Information regarding restricted securities is included at the end of the Fund's Schedule of Investments.
4. Purchases and Sales of Investments.
Purchases and sales of securities, other than short-term securities, are noted in the table below.
| | Purchases ($) | Sales ($) |
| Fidelity Diversified International K6 Fund | 1,008,802,613 | 1,181,952,925 |
Prior Fiscal Year Unaffiliated Redemptions In-Kind. During the prior period, 4,284,142 shares of the Fund were redeemed in-kind for investments and cash with a value of $45,883,165. The Fund had a net realized gain of $10,175,810 on investments delivered through in-kind redemptions. The amount of the in-kind redemptions is included in share transactions in the accompanying Statement of Changes in Net Assets. The Fund recognized no gain or loss for federal income tax purposes.
Prior Fiscal Year Unaffiliated Exchanges In-Kind. During the prior period, the Fund received investments and cash valued at $399,785,189 in exchange for 41,129,995 shares of the Fund. The amount of in-kind exchanges is included in share transactions in the accompanying Statement of Changes in Net Assets.
5. Fees and Other Transactions with Affiliates.
Management Fee. Fidelity Management & Research Company LLC (the investment adviser) and its affiliates provide the Fund with investment management related services for which the Fund pays a monthly management fee that is based on an annual rate of .60% of average net assets. Under the management contract, the investment adviser or an affiliate pays all other expenses of the Fund, excluding fees and expenses of the independent Trustees, and certain miscellaneous expenses such as proxy and shareholder meeting expenses.
Brokerage Commissions. A portion of portfolio transactions were placed with brokerage firms which are affiliates of the investment adviser. Brokerage commissions are included in net realized gain (loss) and change in net unrealized appreciation (depreciation) in the Statement of Operations. The commissions paid to these affiliated firms were as follows:
| | Amount |
| Fidelity Diversified International K6 Fund | $3,074 |
Interfund Trades. Funds may purchase from or sell securities to other Fidelity Funds under procedures adopted by the Board. The procedures have been designed to ensure these interfund trades are executed in accordance with Rule 17a-7 of the 1940 Act. Interfund trades are included within the respective purchases and sales amounts shown in the Purchases and Sales of Investments note.
6. Committed Line of Credit.
Certain Funds participate with other funds managed by the investment adviser or an affiliate in a $4.25 billion credit facility (the "line of credit") to be utilized for temporary or emergency purposes to fund shareholder redemptions or for other short-term liquidity purposes. The participating funds have agreed to pay commitment fees on their pro-rata portion of the line of credit, which are reflected in Miscellaneous expenses on the Statement of Operations, and are as follows:
| | Amount |
| Fidelity Diversified International K6 Fund | $7,181 |
During the period, there were no borrowings on this line of credit.
7. Security Lending.
Funds lend portfolio securities from time to time in order to earn additional income. Lending agents are used, including National Financial Services (NFS), an affiliate of the investment adviser. Pursuant to a securities lending agreement, NFS will receive a fee, which is capped at 9.9% of a fund's daily lending revenue, for its services as lending agent. A fund may lend securities to certain qualified borrowers, including NFS. On the settlement date of the loan, a fund receives collateral (in the form of U.S. Treasury obligations, letters of credit and/or cash) against the loaned securities and maintains collateral in an amount not less than 100% of the market value of the loaned securities during the period of the loan. The market value of the loaned securities is determined at the close of business of a fund and any additional required collateral is delivered to a fund on the next business day. A fund or borrower may terminate the loan at any time, and if the borrower defaults on its obligation to return the securities loaned because of insolvency or other reasons, a fund may apply collateral received from the borrower against the obligation. A fund may experience delays and costs in recovering the securities loaned. Any cash collateral received is invested in the Fidelity Securities Lending Cash Central Fund. Any loaned securities are identified as such in the Schedule of Investments, and the value of loaned securities and cash collateral at period end, as applicable, are presented in the Statement of Assets and Liabilities. Security lending income represents the income earned on investing cash collateral, less rebates paid to borrowers and any lending agent fees associated with the loan, plus any premium payments received for lending certain types of securities. Security lending income is presented in the Statement of Operations as a component of income from Fidelity Central Funds. Affiliated security lending activity, if any, was as follows:
| | Total Security Lending Income Fees Paid to NFS | Security Lending Income From Securities Loaned to NFS | Value of Securities Loaned to NFS at Period End |
| Fidelity Diversified International K6 Fund | $7,356 | $– | $– |
8. Expense Reductions.
Commissions paid to certain brokers with whom the investment adviser, or its affiliates, places trades on behalf of the Fund include an amount in addition to trade execution, which may be rebated back to the Fund to offset certain expenses. This amount totaled $319,431 for the period. In addition, through arrangements with the Fund's custodian, credits realized as a result of certain uninvested cash balances were used to reduce the Fund's expenses by $934.
9. Other.
The Fund's organizational documents provide former and current trustees and officers with a limited indemnification against liabilities arising in connection with the performance of their duties to the Fund. In the normal course of business, the Fund may also enter into contracts that provide general indemnifications. The Fund's maximum exposure under these arrangements is unknown as this would be dependent on future claims that may be made against the Fund. The risk of material loss from such claims is considered remote.
10. Coronavirus (COVID-19) Pandemic.
An outbreak of COVID-19 first detected in China during December 2019 has since spread globally and was declared a pandemic by the World Health Organization during March 2020. Developments that disrupt global economies and financial markets, such as the COVID-19 pandemic, may magnify factors that affect the Fund's performance.
Report of Independent Registered Public Accounting Firm
To the Board of Trustees of Fidelity Investment Trust and Shareholders of Fidelity Diversified International K6 Fund:
Opinion on the Financial Statements and Financial Highlights
We have audited the accompanying statement of assets and liabilities of Fidelity Diversified International K6 Fund (the "Fund"), a fund of Fidelity Investment Trust, including the schedule of investments, as of October 31, 2020, the related statement of operations for the year then ended, the statement of changes in net assets for each of the two years in the period then ended, the financial highlights for each of the three years in the period then ended and for the period from May 25, 2017 (commencement of operations) through October 31, 2017, and the related notes. In our opinion, the financial statements and financial highlights present fairly, in all material respects, the financial position of the Fund as of October 31, 2020, and the results of its operations for the year then ended, the changes in its net assets for each of the two years in the period then ended, and the financial highlights for each of the three years in the period then ended and for the period from May 25, 2017 (commencement of operations) through October 31, 2017 in conformity with accounting principles generally accepted in the United States of America.
Basis for Opinion
These financial statements and financial highlights are the responsibility of the Fund's management. Our responsibility is to express an opinion on the Fund's financial statements and financial highlights based on our audits. We are a public accounting firm registered with the Public Company Accounting Oversight Board (United States) (PCAOB) and are required to be independent with respect to the Fund in accordance with the U.S. federal securities laws and the applicable rules and regulations of the Securities and Exchange Commission and the PCAOB.
We conducted our audits in accordance with the standards of the PCAOB. Those standards require that we plan and perform the audit to obtain reasonable assurance about whether the financial statements and financial highlights are free of material misstatement, whether due to error or fraud. The Fund is not required to have, nor were we engaged to perform, an audit of its internal control over financial reporting. As part of our audits we are required to obtain an understanding of internal control over financial reporting but not for the purpose of expressing an opinion on the effectiveness of the Fund’s internal control over financial reporting. Accordingly, we express no such opinion.
Our audits included performing procedures to assess the risks of material misstatement of the financial statements and financial highlights, whether due to error or fraud, and performing procedures that respond to those risks. Such procedures included examining, on a test basis, evidence regarding the amounts and disclosures in the financial statements and financial highlights. Our audits also included evaluating the accounting principles used and significant estimates made by management, as well as evaluating the overall presentation of the financial statements and financial highlights. Our procedures included confirmation of securities owned as of October 31, 2020, by correspondence with the custodian and brokers; when replies were not received from brokers, we performed other auditing procedures. We believe that our audits provide a reasonable basis for our opinion.
/s/ Deloitte & Touche LLP
Boston, Massachusetts
December 14, 2020
We have served as the auditor of one or more of the Fidelity investment companies since 1999.
Trustees and Officers
The Trustees, Members of the Advisory Board (if any), and officers of the trust and fund, as applicable, are listed below. The Board of Trustees governs the fund and is responsible for protecting the interests of shareholders. The Trustees are experienced executives who meet periodically throughout the year to oversee the fund's activities, review contractual arrangements with companies that provide services to the fund, oversee management of the risks associated with such activities and contractual arrangements, and review the fund's performance. Except for Jonathan Chiel, each of the Trustees oversees 305 funds. Mr. Chiel oversees 176 funds.
The Trustees hold office without limit in time except that (a) any Trustee may resign; (b) any Trustee may be removed by written instrument, signed by at least two-thirds of the number of Trustees prior to such removal; (c) any Trustee who requests to be retired or who has become incapacitated by illness or injury may be retired by written instrument signed by a majority of the other Trustees; and (d) any Trustee may be removed at any special meeting of shareholders by a two-thirds vote of the outstanding voting securities of the trust. Each Trustee who is not an interested person (as defined in the 1940 Act) of the trust and the fund is referred to herein as an Independent Trustee. Each Independent Trustee shall retire not later than the last day of the calendar year in which his or her 75th birthday occurs. The Independent Trustees may waive this mandatory retirement age policy with respect to individual Trustees. Officers and Advisory Board Members hold office without limit in time, except that any officer or Advisory Board Member may resign or may be removed by a vote of a majority of the Trustees at any regular meeting or any special meeting of the Trustees. Except as indicated, each individual has held the office shown or other offices in the same company for the past five years.
The fund’s Statement of Additional Information (SAI) includes more information about the Trustees. To request a free copy, call Fidelity at 1-800-835-5092.
Experience, Skills, Attributes, and Qualifications of the Trustees. The Governance and Nominating Committee has adopted a statement of policy that describes the experience, qualifications, attributes, and skills that are necessary and desirable for potential Independent Trustee candidates (Statement of Policy). The Board believes that each Trustee satisfied at the time he or she was initially elected or appointed a Trustee, and continues to satisfy, the standards contemplated by the Statement of Policy. The Governance and Nominating Committee also engages professional search firms to help identify potential Independent Trustee candidates who have the experience, qualifications, attributes, and skills consistent with the Statement of Policy. From time to time, additional criteria based on the composition and skills of the current Independent Trustees, as well as experience or skills that may be appropriate in light of future changes to board composition, business conditions, and regulatory or other developments, have also been considered by the professional search firms and the Governance and Nominating Committee. In addition, the Board takes into account the Trustees' commitment and participation in Board and committee meetings, as well as their leadership of standing and ad hoc committees throughout their tenure.
In determining that a particular Trustee was and continues to be qualified to serve as a Trustee, the Board has considered a variety of criteria, none of which, in isolation, was controlling. The Board believes that, collectively, the Trustees have balanced and diverse experience, qualifications, attributes, and skills, which allow the Board to operate effectively in governing the fund and protecting the interests of shareholders. Information about the specific experience, skills, attributes, and qualifications of each Trustee, which in each case led to the Board's conclusion that the Trustee should serve (or continue to serve) as a trustee of the fund, is provided below.
Board Structure and Oversight Function. Robert A. Lawrence is an interested person and currently serves as Acting Chairman. The Trustees have determined that an interested Chairman is appropriate and benefits shareholders because an interested Chairman has a personal and professional stake in the quality and continuity of services provided to the fund. Independent Trustees exercise their informed business judgment to appoint an individual of their choosing to serve as Chairman, regardless of whether the Trustee happens to be independent or a member of management. The Independent Trustees have determined that they can act independently and effectively without having an Independent Trustee serve as Chairman and that a key structural component for assuring that they are in a position to do so is for the Independent Trustees to constitute a substantial majority for the Board. The Independent Trustees also regularly meet in executive session. Ned C. Lautenbach and David M. Thomas serve as Co-Lead Independent Trustees and as such each (i) acts as a liaison between the Independent Trustees and management with respect to matters important to the Independent Trustees and (ii) with management prepares agendas for Board meetings.
Fidelity® funds are overseen by different Boards of Trustees. The fund's Board oversees Fidelity's high income and certain equity funds, and other Boards oversee Fidelity's investment-grade bond, money market, asset allocation, and other equity funds. The asset allocation funds may invest in Fidelity® funds overseen by the fund's Board. The use of separate Boards, each with its own committee structure, allows the Trustees of each group of Fidelity® funds to focus on the unique issues of the funds they oversee, including common research, investment, and operational issues. On occasion, the separate Boards establish joint committees to address issues of overlapping consequences for the Fidelity® funds overseen by each Board.
The Trustees operate using a system of committees to facilitate the timely and efficient consideration of all matters of importance to the Trustees, the fund, and fund shareholders and to facilitate compliance with legal and regulatory requirements and oversight of the fund's activities and associated risks. The Board, acting through its committees, has charged FMR and its affiliates with (i) identifying events or circumstances the occurrence of which could have demonstrably adverse effects on the fund's business and/or reputation; (ii) implementing processes and controls to lessen the possibility that such events or circumstances occur or to mitigate the effects of such events or circumstances if they do occur; and (iii) creating and maintaining a system designed to evaluate continuously business and market conditions in order to facilitate the identification and implementation processes described in (i) and (ii) above. Because the day-to-day operations and activities of the fund are carried out by or through FMR, its affiliates, and other service providers, the fund's exposure to risks is mitigated but not eliminated by the processes overseen by the Trustees. While each of the Board's committees has responsibility for overseeing different aspects of the fund's activities, oversight is exercised primarily through the Operations, Audit, and Compliance Committees. Appropriate personnel, including but not limited to the fund's Chief Compliance Officer (CCO), FMR's internal auditor, the independent accountants, the fund's Treasurer and portfolio management personnel, make periodic reports to the Board's committees, as appropriate, including an annual review of Fidelity's risk management program for the Fidelity® funds. The responsibilities of each standing committee, including their oversight responsibilities, are described further under "Standing Committees of the Trustees."
Interested Trustees*:
Correspondence intended for a Trustee who is an interested person may be sent to Fidelity Investments, 245 Summer Street, Boston, Massachusetts 02210.
Name, Year of Birth; Principal Occupations and Other Relevant Experience+
Jonathan Chiel (1957)
Year of Election or Appointment: 2016
Trustee
Mr. Chiel also serves as Trustee of other Fidelity® funds. Mr. Chiel is Executive Vice President and General Counsel for FMR LLC (diversified financial services company, 2012-present). Previously, Mr. Chiel served as general counsel (2004-2012) and senior vice president and deputy general counsel (2000-2004) for John Hancock Financial Services; a partner with Choate, Hall & Stewart (1996-2000) (law firm); and an Assistant United States Attorney for the United States Attorney’s Office of the District of Massachusetts (1986-95), including Chief of the Criminal Division (1993-1995). Mr. Chiel is a director on the boards of the Boston Bar Foundation and the Maimonides School.
Robert A. Lawrence (1952)
Year of Election or Appointment: 2020
Trustee
Acting Chairman of the Board of Trustees
Mr. Lawrence also serves as Trustee of other funds. Previously, Mr. Lawrence served as a Member of the Advisory Board of certain funds. Prior to his retirement in 2008, Mr. Lawrence served as Vice President of certain Fidelity® funds (2006-2008), Senior Vice President, Head of High Income Division of Fidelity Management & Research Company (investment adviser firm, 2006-2008), and President of Fidelity Strategic Investments (investment adviser firm, 2002-2005).
* Determined to be an “Interested Trustee” by virtue of, among other things, his or her affiliation with the trust or various entities under common control with FMR.
+ The information includes the Trustee's principal occupation during the last five years and other information relating to the experience, attributes, and skills relevant to the Trustee's qualifications to serve as a Trustee, which led to the conclusion that the Trustee should serve as a Trustee for the fund.
Independent Trustees:
Correspondence intended for an Independent Trustee may be sent to Fidelity Investments, P.O. Box 55235, Boston, Massachusetts 02205-5235.
Name, Year of Birth; Principal Occupations and Other Relevant Experience+
Dennis J. Dirks (1948)
Year of Election or Appointment: 2005
Trustee
Mr. Dirks also serves as Trustee of other Fidelity® funds. Prior to his retirement in May 2003, Mr. Dirks served as Chief Operating Officer and as a member of the Board of The Depository Trust & Clearing Corporation (financial markets infrastructure), President, Chief Operating Officer and a member of the Board of The Depository Trust Company (DTC), President and a member of the Board of the National Securities Clearing Corporation (NSCC), Chief Executive Officer and a member of the Board of the Government Securities Clearing Corporation and Chief Executive Officer and a member of the Board of the Mortgage-Backed Securities Clearing Corporation. Mr. Dirks currently serves as a member of the Finance Committee (2016-present) and Board (2017-present) and is Treasurer (2018-present) of the Asolo Repertory Theatre.
Donald F. Donahue (1950)
Year of Election or Appointment: 2018
Trustee
Mr. Donahue also serves as Trustee of other Fidelity® funds. Mr. Donahue serves as President and Chief Executive Officer of Miranda Partners, LLC (risk consulting for the financial services industry, 2012-present). Previously, Mr. Donahue served as Chief Executive Officer (2006-2012), Chief Operating Officer (2003-2006) and Managing Director, Customer Marketing and Development (1999-2003) of The Depository Trust & Clearing Corporation (financial markets infrastructure). Mr. Donahue currently serves as a member (2007-present) and Co-Chairman (2016-present) of the Board of United Way of New York, a member of the Board of NYC Leadership Academy (2012-present) and a member of the Board of Advisors of Ripple Labs, Inc. (financial services, 2015-present). Mr. Donahue previously served as a member of the Advisory Board of certain Fidelity® funds (2015-2018).
Vicki L. Fuller (1957)
Year of Election or Appointment: 2020
Trustee
Ms. Fuller also serves as Trustee of other Fidelity® funds. Previously, Ms. Fuller served as a member of the Advisory Board of certain Fidelity® funds (2018-2020), Chief Investment Officer of the New York State Common Retirement Fund (2012-2018) and held a variety of positions at AllianceBernstein L.P. (global asset management, 1985-2012), including Managing Director (2006-2012) and Senior Vice President and Senior Portfolio Manager (2001-2006). Ms. Fuller currently serves as a member of the Board, Audit Committee and Nominating and Governance Committee of The Williams Companies, Inc. (natural gas infrastructure, 2018-present), as a member of the Board, Audit Committee and Nominating and Governance Committee of two Blackstone business development companies (2020-present) and as a member of the Board of Treliant, LLC (consulting, 2019-present).
Patricia L. Kampling (1959)
Year of Election or Appointment: 2020
Trustee
Ms. Kampling also serves as Trustee of other Fidelity® funds. Prior to her retirement, Ms. Kampling served as Chairman of the Board and Chief Executive Officer (2012-2019), President and Chief Operating Officer (2011-2012) and Executive Vice President and Chief Financial Officer (2010-2011) of Alliant Energy Corporation. Ms. Kampling currently serves as a member of the Board, Compensation Committee and Executive Committee and as Chair of the Audit Committee of Briggs & Stratton Corporation (manufacturing, 2011-present) and as a member of the Board, Audit, Finance and Risk Committee and Safety, Environmental, Technology and Operations Committee of American Water Works Company, Inc. (utilities company, 2019-present). In addition, Ms. Kampling currently serves as a member of the Board of the Nature Conservancy, Wisconsin Chapter (2019-present). Previously, Ms. Kampling served as a Member of the Advisory Board of certain Fidelity® funds (2020), a member of the Board of Interstate Power and Light Company (2012-2019) and Wisconsin Power and Light Company (2012-2019) (each a subsidiary of Alliant Energy Corporation) and as a member of the Board and Workforce Development Committee of the Business Roundtable (2018-2019).
Alan J. Lacy (1953)
Year of Election or Appointment: 2008
Trustee
Mr. Lacy also serves as Trustee of other Fidelity® funds. Previously, Mr. Lacy served as Senior Adviser (2007-2014) of Oak Hill Capital Partners, L.P. (private equity), Chief Executive Officer (2005) and Vice Chairman (2005-2006) of Sears Holdings Corporation (retail), Chief Executive Officer and Chairman of the Board of Sears, Roebuck and Co. (retail, 2000-2005), Chairman (2014-2017) and a member of the Board (2010-2017) of Dave & Buster’s Entertainment, Inc. (restaurant and entertainment complexes) and a member of the Board of Bristol-Myers Squibb Company (global pharmaceuticals, 2008-2020). Mr. Lacy currently serves as a Trustee of the California Chapter of The Nature Conservancy (2015-present) and a member of the Board of the Center for Advanced Study in the Behavioral Sciences at Stanford University (2015-present).
Ned C. Lautenbach (1944)
Year of Election or Appointment: 2000
Trustee
Co-Lead Independent Trustee
Mr. Lautenbach also serves as Trustee of other Fidelity® funds. Mr. Lautenbach currently serves as Chair of the Board of Governors, State University System of Florida (2013-present) and is a member of the Council on Foreign Relations (1994-present). He is also a member and has in the past served as Chairman of the Board of Directors of Artis-Naples (2012-present). Previously, Mr. Lautenbach served as a member and then Lead Director of the Board of Directors of Eaton Corporation (diversified industrial, 1997-2016). He was also a Partner at Clayton, Dubilier & Rice, LLC (private equity investment, 1998-2010); as well as Director of Sony Corporation (2006-2007). In addition, Mr. Lautenbach had a 30-year career with IBM (technology company), during which time he served as Senior Vice President and as a member of the Corporate Executive Committee (1968-1998).
Joseph Mauriello (1944)
Year of Election or Appointment: 2008
Trustee
Mr. Mauriello also serves as Trustee of other Fidelity® funds. Prior to his retirement in January 2006, Mr. Mauriello served in numerous senior management positions including Deputy Chairman and Chief Operating Officer (2004-2005), and Vice Chairman of Financial Services (2002-2004) of KPMG LLP US (professional services, 1965-2005). Mr. Mauriello currently serves as a member of the Independent Directors Council Governing Council (2015-present). Previously, Mr. Mauriello served as a member of the Board of XL Group plc. (global insurance and re-insurance, 2006-2018).
Cornelia M. Small (1944)
Year of Election or Appointment: 2005
Trustee
Ms. Small also serves as Trustee of other Fidelity® funds. Previously, Ms. Small served as Chief Investment Officer, Director of Global Equity Investments and a member of Scudder, Stevens & Clark and Scudder Kemper Investments. Ms. Small previously served as a member of the Board (2009-2019) and Chair of the Investment Committee (2010-2019) of the Teagle Foundation and a member of the Investment Committee of the Berkshire Taconic Community Foundation (2008-2019).
Garnett A. Smith (1947)
Year of Election or Appointment: 2018
Trustee
Mr. Smith also serves as Trustee of other Fidelity® funds. Prior to his retirement, Mr. Smith served as Chairman and Chief Executive Officer (1990-1997) and President (1986-1990) of Inbrand Corp. (manufacturer of personal absorbent products). Prior to his employment with Inbrand Corp., he was employed by a retail fabric chain and North Carolina National Bank (now Bank of America). Mr. Smith previously served as a member of the Advisory Board of certain Fidelity® funds (2012-2013).
David M. Thomas (1949)
Year of Election or Appointment: 2008
Trustee
Co-Lead Independent Trustee
Mr. Thomas also serves as Trustee of other Fidelity® funds. Previously, Mr. Thomas served as Executive Chairman (2005-2006) and Chairman and Chief Executive Officer (2000-2005) of IMS Health, Inc. (pharmaceutical and healthcare information solutions). Mr. Thomas currently serves as Non-Executive Chairman of the Board of Fortune Brands Home and Security (home and security products, 2011-present), and a member of the Board (2004-present) and Presiding Director (2013-present) of Interpublic Group of Companies, Inc. (marketing communication).
Susan Tomasky (1953)
Year of Election or Appointment: 2020
Trustee
Ms. Tomasky also serves as Trustee of other Fidelity® funds. Prior to her retirement, Ms. Tomasky served in various executive officer positions at American Electric Power Company, Inc. (1998-2011), including most recently as President of AEP Transmission (2007-2011). Ms. Tomasky currently serves as a member of the Board and Sustainability Committee and as Chair of the Audit Committee of Marathon Petroleum Corporation (2018-present) and as a member of the Board, Corporate Governance Committee and Organization and Compensation Committee and as Chair of the Audit Committee of Public Service Enterprise Group, Inc. (utilities company, 2012-present). In addition, Ms. Tomasky currently serves as a member of the Board of the Columbus Regional Airport Authority (2007-present), as a member of the Board of the Royal Shakespeare Company – America (2009-present), as a member of the Board of the Columbus Association for the Performing Arts (2011-present) and as a member of the Board of Kenyon College (2016-present). Previously, Ms. Tomasky served as a Member of the Advisory Board of certain Fidelity® funds (2020), a member of the Board (2011-2019) and as Lead Independent Director (2015-2018) of Andeavor Corporation (previously Tesoro Corporation) (independent oil refiner and marketer) and as a member of the Board of Summit Midstream Partners LP (energy, 2012-2018).
Michael E. Wiley (1950)
Year of Election or Appointment: 2020
Trustee
Mr. Wiley also serves as Trustee of other Fidelity® funds. Previously, Mr. Wiley served as a member of the Advisory Board of certain Fidelity® funds (2018-2020), Chairman, President and CEO of Baker Hughes, Inc. (oilfield services, 2000-2004). Mr. Wiley also previously served as a member of the Board of Andeavor Corporation (independent oil refiner and marketer, 2005-2018), a member of the Board of Andeavor Logistics LP (natural resources logistics, 2015-2018) and a member of the Board of High Point Resources (exploration and production, 2005-2020).
+ The information includes the Trustee's principal occupation during the last five years and other information relating to the experience, attributes, and skills relevant to the Trustee's qualifications to serve as a Trustee, which led to the conclusion that the Trustee should serve as a Trustee for the fund.
Advisory Board Members and Officers:
Correspondence intended for a Member of the Advisory Board (if any) may be sent to Fidelity Investments, P.O. Box 55235, Boston, Massachusetts 02205-5235. Correspondence intended for an officer or Peter S. Lynch may be sent to Fidelity Investments, 245 Summer Street, Boston, Massachusetts 02210. Officers appear below in alphabetical order.
Name, Year of Birth; Principal Occupation
Lloyd James Austin, III (1953)
Year of Election or Appointment: 2020
Member of the Advisory Board
General Austin also serves as a Member of the Advisory Board of other Fidelity® funds. Prior to his retirement, General Austin (United States Army, Retired) held a variety of positions within the U.S. Government, including Commander, U.S. Central Command (2013-2016), Vice Chief of Staff, U.S. Army (2012-2013) and Commanding General, U.S. Forces – Iraq, Operation New Dawn (2010-2012). General Austin currently serves as a Partner of Pine Island Capital Partners (private equity, 2020-present) and as President of the Austin Strategy Group LLC (consulting, 2016-present). General Austin serves as a member of the Board of Directors of Nucor Corporation (steel products, 2017-present), as a member of the Board of Directors of Tenet Healthcare Corporation (2018-present) and as a member of the Board of Directors of Raytheon Technologies Corporation (aerospace and defense, 2020-present). In addition, General Austin currently serves as a member of the Board of Trustees of the Carnegie Corporation of New York (2017-present) and as a member of the Board of Trustees of Auburn University (2017-present). Previously, General Austin served as a member of the Board of Directors of United Technologies Corporation (aerospace, defense and building, 2016-2020).
Thomas A. Kennedy (1955)
Year of Election or Appointment: 2020
Member of the Advisory Board
Mr. Kennedy also serves as a Member of the Advisory Board of other Fidelity® funds. Previously, Mr. Kennedy held a variety of positions at Raytheon Company (aerospace and defense, 1983-2020), including Chairman and Chief Executive Officer (2014-2020) and Executive Vice President and Chief Operating Officer (2013-2014). Mr. Kennedy currently serves as Executive Chairman of the Board of Directors of Raytheon Technologies Corporation (aerospace and defense, 2020-present). He is also a member of the Rutgers School of Engineering Industry Advisory Board (2011-present) and a member of the UCLA Engineering Dean’s Executive Board (2016-present).
Peter S. Lynch (1944)
Year of Election or Appointment: 2003
Member of the Advisory Board
Mr. Lynch also serves as a Member of the Advisory Board of other Fidelity® funds. Mr. Lynch is Vice Chairman and a Director of Fidelity Management & Research Company LLC (investment adviser firm). In addition, Mr. Lynch serves as a Trustee of Boston College and as the Chairman of the Inner-City Scholarship Fund. Previously, Mr. Lynch served as Vice Chairman and a Director of FMR Co., Inc. (investment adviser firm) and on the Special Olympics International Board of Directors (1997-2006).
Elizabeth Paige Baumann (1968)
Year of Election or Appointment: 2017
Anti-Money Laundering (AML) Officer
Ms. Baumann also serves as AML Officer of other funds. She is Chief AML Officer (2012-present) and Senior Vice President (2014-present) of FMR LLC (diversified financial services company) and is an employee of Fidelity Investments. Previously, Ms. Baumann served as AML Officer of certain funds (2017-2019), as AML Officer of the funds (2012-2016), and Vice President (2007-2014) and Deputy Anti-Money Laundering Officer (2007-2012) of FMR LLC.
Craig S. Brown (1977)
Year of Election or Appointment: 2019
Assistant Treasurer
Mr. Brown also serves as Assistant Treasurer of other funds. Mr. Brown is an employee of Fidelity Investments (2013-present).
John J. Burke III (1964)
Year of Election or Appointment: 2018
Chief Financial Officer
Mr. Burke also serves as Chief Financial Officer of other funds. Mr. Burke serves as Head of Investment Operations for Fidelity Fund and Investment Operations (2018-present) and is an employee of Fidelity Investments (1998-present). Previously Mr. Burke served as head of Asset Management Investment Operations (2012-2018).
William C. Coffey (1969)
Year of Election or Appointment: 2019
Assistant Secretary
Mr. Coffey also serves as Assistant Secretary of other funds. He is Senior Vice President and Deputy General Counsel of FMR LLC (diversified financial services company, 2010-present), and is an employee of Fidelity Investments. Previously, Mr. Coffey served as Secretary and CLO of certain funds (2018-2019); CLO, Secretary, and Senior Vice President of Fidelity Management & Research Company and FMR Co., Inc. (investment adviser firms, 2018-2019); Secretary of Fidelity SelectCo, LLC and Fidelity Investments Money Management, Inc. (investment adviser firms, 2018-2019); CLO of Fidelity Management & Research (Hong Kong) Limited, FMR Investment Management (UK) Limited, and Fidelity Management & Research (Japan) Limited (investment adviser firms, 2018-2019); and Assistant Secretary of certain funds (2009-2018).
Timothy M. Cohen (1969)
Year of Election or Appointment: 2018
Vice President
Mr. Cohen also serves as Vice President of other funds. Mr. Cohen serves as Co-Head of Equity (2018-present), a Director of Fidelity Management & Research (Japan) Limited (investment adviser firm, 2016-present), and is an employee of Fidelity Investments. Previously, Mr. Cohen served as Executive Vice President of Fidelity SelectCo, LLC (2019), Head of Global Equity Research (2016-2018), Chief Investment Officer - Equity and a Director of Fidelity Management & Research (U.K.) Inc. (investment adviser firm, 2013-2015) and as a Director of Fidelity Management & Research (Hong Kong) Limited (investment adviser firm, 2017).
Jonathan Davis (1968)
Year of Election or Appointment: 2010
Assistant Treasurer
Mr. Davis also serves as Assistant Treasurer of other funds. Mr. Davis serves as Assistant Treasurer of FMR Capital, Inc. (2017-present) and is an employee of Fidelity Investments. Previously, Mr. Davis served as Vice President and Associate General Counsel of FMR LLC (diversified financial services company, 2003-2010).
Laura M. Del Prato (1964)
Year of Election or Appointment: 2018
Assistant Treasurer
Ms. Del Prato also serves as an officer of other funds. Ms. Del Prato is an employee of Fidelity Investments (2017-present). Previously, Ms. Del Prato served as President and Treasurer of The North Carolina Capital Management Trust: Cash Portfolio and Term Portfolio (2018-2020). Prior to joining Fidelity Investments, Ms. Del Prato served as a Managing Director and Treasurer of the JPMorgan Mutual Funds (2014-2017). Prior to JPMorgan, Ms. Del Prato served as a partner at Cohen Fund Audit Services (accounting firm, 2012-2013) and KPMG LLP (accounting firm, 2004-2012).
Colm A. Hogan (1973)
Year of Election or Appointment: 2020
Assistant Treasurer
Mr. Hogan also serves as an officer of other funds. Mr. Hogan serves as Assistant Treasurer of FMR Capital, Inc. (2017-present) and is an employee of Fidelity Investments (2005-present). Previously, Mr. Hogan served as Deputy Treasurer of certain Fidelity® funds (2016-2020) and Assistant Treasurer of certain Fidelity® funds (2016-2018).
Pamela R. Holding (1964)
Year of Election or Appointment: 2018
Vice President
Ms. Holding also serves as Vice President of other funds. Ms. Holding serves as Co-Head of Equity (2018-present) and is an employee of Fidelity Investments (2013-present). Previously, Ms. Holding served as Executive Vice President of Fidelity SelectCo, LLC (2019) and as Chief Investment Officer of Fidelity Institutional Asset Management (2013-2018).
Cynthia Lo Bessette (1969)
Year of Election or Appointment: 2019
Secretary and Chief Legal Officer (CLO)
Ms. Lo Bessette also serves as an officer of other funds. Ms. Lo Bessette serves as CLO, Secretary, and Senior Vice President of Fidelity Management & Research Company LLC (investment adviser firm, 2019-present); and CLO of Fidelity Management & Research (Hong Kong) Limited, FMR Investment Management (UK) Limited, and Fidelity Management & Research (Japan) Limited (investment adviser firms, 2019-present). She is a Senior Vice President and Deputy General Counsel of FMR LLC (diversified financial services company, 2019-present), and is an employee of Fidelity Investments. Previously, Ms. Lo Bessette served as CLO, Secretary, and Senior Vice President of FMR Co., Inc. (investment adviser firm, 2019); Secretary of Fidelity SelectCo, LLC and Fidelity Investments Money Management, Inc. (investment adviser firms, 2019). Prior to joining Fidelity Investments, Ms. Lo Bessette was Executive Vice President, General Counsel (2016-2019) and Senior Vice President, Deputy General Counsel (2015-2016) of OppenheimerFunds (investment management company) and Deputy Chief Legal Officer (2013-2015) of Jennison Associates LLC (investment adviser firm).
Chris Maher (1972)
Year of Election or Appointment: 2020
Deputy Treasurer
Mr. Maher also serves as an officer of other funds. Mr. Maher serves as Assistant Treasurer of FMR Capital, Inc. (2017-present), and is an employee of Fidelity Investments (2008-present). Previously, Mr. Maher served as Assistant Treasurer of certain funds (2013-2020); Vice President of Asset Management Compliance (2013), Vice President of the Program Management Group of FMR (investment adviser firm, 2010-2013), and Vice President of Valuation Oversight (2008-2010).
Jason P. Pogorelec (1975)
Year of Election or Appointment: 2020
Chief Compliance Officer
Mr. Pogorelec also serves as Chief Compliance Officer of other funds. Mr. Pogorelec is a senior Vice President of Asset Management Compliance for Fidelity Investments and is an employee of Fidelity Investments (2006-present). Previously, Mr. Pogorelec served as Vice President, Associate General Counsel for Fidelity Investments (2010-2020) and Assistant Secretary of certain Fidelity funds (2015-2020).
Stacie M. Smith (1974)
Year of Election or Appointment: 2016
President and Treasurer
Ms. Smith also serves as an officer of other funds. Ms. Smith serves as Assistant Treasurer of FMR Capital, Inc. (2017-present), is an employee of Fidelity Investments (2009-present), and has served in other fund officer roles. Prior to joining Fidelity Investments, Ms. Smith served as Senior Audit Manager of Ernst & Young LLP (accounting firm, 1996-2009). Previously, Ms. Smith served as Assistant Treasurer (2013-2019) and Deputy Treasurer (2013-2016) of certain Fidelity® funds.
Marc L. Spector (1972)
Year of Election or Appointment: 2016
Assistant Treasurer
Mr. Spector also serves as an officer of other funds. Mr. Spector serves as Assistant Treasurer of FMR Capital, Inc. (2017-present) and is an employee of Fidelity Investments (2016-present). Prior to joining Fidelity Investments, Mr. Spector served as Director at the Siegfried Group (accounting firm, 2013-2016), and prior to Siegfried Group as audit senior manager at Deloitte & Touche LLP (accounting firm, 2005-2013).
Jim Wegmann (1979)
Year of Election or Appointment: 2019
Assistant Treasurer
Mr. Wegmann also serves as Assistant Treasurer of other funds. Mr. Wegmann is an employee of Fidelity Investments (2011-present).
Shareholder Expense Example
As a shareholder, you incur two types of costs: (1) transaction costs, which may include sales charges (loads) on purchase payments or redemption proceeds, as applicable and (2) ongoing costs, which generally include management fees, distribution and/or service (12b-1) fees and other Fund expenses. This Example is intended to help you understand your ongoing costs (in dollars) of investing in a fund and to compare these costs with the ongoing costs of investing in other mutual funds.
The Example is based on an investment of $1,000 invested at the beginning of the period and held for the entire period (May 1, 2020 to October 31, 2020).
Actual Expenses
The first line of the accompanying table provides information about actual account values and actual expenses. You may use the information in this line, together with the amount you invested, to estimate the expenses that you paid over the period. Simply divide your account value by $1,000.00 (for example, an $8,600 account value divided by $1,000.00 = 8.6), then multiply the result by the number in the first line for a class/Fund under the heading entitled "Expenses Paid During Period" to estimate the expenses you paid on your account during this period. If any fund is a shareholder of any underlying mutual funds or exchange-traded funds (ETFs) (the Underlying Funds), such fund indirectly bears its proportional share of the expenses of the Underlying Funds in addition to the direct expenses incurred presented in the table. These fees and expenses are not included in the annualized expense ratio used to calculate the expense estimate in the table below.
Hypothetical Example for Comparison Purposes
The second line of the accompanying table provides information about hypothetical account values and hypothetical expenses based on the actual expense ratio and an assumed rate of return of 5% per year before expenses, which is not the actual return. The hypothetical account values and expenses may not be used to estimate the actual ending account balance or expenses you paid for the period. You may use this information to compare the ongoing costs of investing in the Fund and other funds. To do so, compare this 5% hypothetical example with the 5% hypothetical examples that appear in the shareholder reports of the other funds. If any fund is a shareholder of any Underlying Funds, such fund indirectly bears its proportional share of the expenses of the Underlying Funds in addition to the direct expenses as presented in the table. These fees and expenses are not included in the annualized expense ratio used to calculate the expense estimate in the table below.
Please note that the expenses shown in the table are meant to highlight your ongoing costs only and do not reflect any transaction costs. Therefore, the second line of the table is useful in comparing ongoing costs only, and will not help you determine the relative total costs of owning different funds.
| | Annualized Expense Ratio-A | Beginning
Account Value
May 1, 2020 | Ending
Account Value
October 31, 2020 | Expenses Paid
During Period-B
May 1, 2020
to October 31, 2020 |
| Fidelity Diversified International K6 Fund | .60% | | | |
| Actual | | $1,000.00 | $1,173.70 | $3.28 |
| Hypothetical-C | | $1,000.00 | $1,022.12 | $3.05 |
A Annualized expense ratio reflects expenses net of applicable fee waivers.
B Expenses are equal to the annualized expense ratio, multiplied by the average account value over the period, multiplied by 184/ 366 (to reflect the one-half year period). The fees and expenses of any Underlying Funds are not included in each annualized expense ratio.
C 5% return per year before expenses
Distributions (Unaudited)
The fund designates 4% of the dividend distributed during the fiscal year as qualifying for the dividends–received deduction for corporate shareholders.
The fund designates 100% of the dividend distributed during the fiscal year as amounts which may be taken into account as a dividend for the purposes of the maximum rate under section 1(h)(11) of the Internal Revenue Code.
The amounts per share which represent income derived from sources within, and taxes paid to, foreign countries or possessions of the United States are $0.1883 and $0.0156 for the dividend paid December 9, 2019.
The fund will notify shareholders in January 2021 of amounts for use in preparing 2020 income tax returns.
Proxy Voting Results
A special meeting of shareholders was held on June 9, 2020. The results of votes taken among shareholders on the proposal before them are reported below. Each vote reported represents one dollar of net asset value held on the record date for the meeting.
PROPOSAL 1
To elect a Board of Trustees.
| | # of
Votes | % of
Votes |
| Dennis J. Dirks |
| Affirmative | 91,643,443,973.030 | 98.167 |
| Withheld | 1,711,119,384.419 | 1.833 |
| TOTAL | 93,354,563,357.449 | 100.000 |
| Donald F. Donahue |
| Affirmative | 91,659,003,496.045 | 98.184 |
| Withheld | 1,695,559,852.789 | 1.816 |
| TOTAL | 93,354,563,357.449 | 100.000 |
| Bettina Doulton |
| Affirmative | 91,774,146,516.145 | 98.307 |
| Withheld | 1,580,416,862.377 | 1.693 |
| TOTAL | 93,354,563,357.449 | 100.000 |
| Vicki L. Fuller |
| Affirmative | 91,845,419,368.993 | 98.383 |
| Withheld | 1,509,143,998.591 | 1.617 |
| TOTAL | 93,354,563,357.449 | 100.00 |
| Patricia L. Kampling |
| Affirmative | 91,723,732,274.457 | 98.253 |
| Withheld | 1,630,831,098.411 | 1.747 |
| TOTAL | 93,354,563,357.449 | 100.000 |
| Alan J. Lacy |
| Affirmative | 91,490,319,407.772 | 98.003 |
| Withheld | 1,864,243,948.299 | 1.997 |
| TOTAL | 93,354,563,357.449 | 100.000 |
| Ned C. Lautenbach |
| Affirmative | 91,285,367,239.075 | 97.784 |
| Withheld | 2,069,196,119.052 | 2.216 |
| TOTAL | 93,354,563,357.449 | 100.000 |
| Robert A. Lawrence |
| Affirmative | 91,556,271,429.466 | 98.074 |
| Withheld | 1,798,291,912.707 | 1.926 |
| TOTAL | 93,354,563,357.449 | 100.000 |
| Joseph Mauriello |
| Affirmative | 91,497,480,147.082 | 98.011 |
| Withheld | 1,857,083,211.045 | 1.989 |
| TOTAL | 93,354,563,357.449 | 100.000 |
| Cornelia M. Small |
| Affirmative | 91,606,808,161.438 | 98.128 |
| Withheld | 1,747,755,220.497 | 1.872 |
| TOTAL | 93,354,563,357.449 | 100.000 |
| Garnett A. Smith |
| Affirmative | 91,505,784,053.038 | 98.020 |
| Withheld | 1,848,779,305.090 | 1.980 |
| TOTAL | 93,354,563,357.449 | 100.000 |
| David M. Thomas |
| Affirmative | 91,536,969,704.881 | 98.053 |
| Withheld | 1,817,593,630.919 | 1.947 |
| TOTAL | 93,354,563,357.449 | 100.000 |
| Susan Tomasky |
| Affirmative | 91,697,125,678.165 | 98.225 |
| Withheld | 1,657,437,703.277 | 1.775 |
| TOTAL | 93,354,563,357.449 | 100.000 |
| Michael E. Wiley |
| Affirmative | 91,506,805,575.815 | 98.021 |
| Withheld | 1,847,757,759.985 | 1.979 |
| TOTAL | 93,354,563,357.449 | 100.000 |
|
| Proposal 1 reflects trust wide proposal and voting results. |
DIFK6-ANN-1220
1.9883987.103
Fidelity® International Capital Appreciation K6 Fund
Annual Report
October 31, 2020
See the inside front cover for important information about access to your fund’s shareholder reports.
Beginning on January 1, 2021, as permitted by regulations adopted by the Securities and Exchange Commission, paper copies of a fund’s shareholder reports will no longer be sent by mail, unless you specifically request paper copies of the reports from the fund or from your financial intermediary, such as a financial advisor, broker-dealer or bank. Instead, the reports will be made available on a website, and you will be notified by mail each time a report is posted and provided with a website link to access the report.
If you already elected to receive shareholder reports electronically, you will not be affected by this change and you need not take any action. You may elect to receive shareholder reports and other communications from a fund electronically, by contacting your financial intermediary. For Fidelity customers, visit Fidelity's web site or call Fidelity using the contact information listed below.
You may elect to receive all future reports in paper free of charge. If you wish to continue receiving paper copies of your shareholder reports, you may contact your financial intermediary or, if you are a Fidelity customer, visit Fidelity’s website, or call Fidelity at the applicable toll-free number listed below. Your election to receive reports in paper will apply to all funds held with the fund complex/your financial intermediary.
| Account Type | Website | Phone Number |
| Brokerage, Mutual Fund, or Annuity Contracts: | fidelity.com/mailpreferences | 1-800-343-3548 |
| Employer Provided Retirement Accounts: | netbenefits.fidelity.com/preferences (choose 'no' under Required Disclosures to continue to print) | 1-800-343-0860 |
| Advisor Sold Accounts Serviced Through Your Financial Intermediary: | Contact Your Financial Intermediary | Your Financial Intermediary's phone number |
| Advisor Sold Accounts Serviced by Fidelity: | institutional.fidelity.com | 1-877-208-0098 |
Contents
To view a fund's proxy voting guidelines and proxy voting record for the 12-month period ended June 30, visit http://www.fidelity.com/proxyvotingresults or visit the Securities and Exchange Commission's (SEC) web site at http://www.sec.gov.
You may also call 1-800-835-5092 to request a free copy of the proxy voting guidelines.
Standard & Poor's, S&P and S&P 500 are registered service marks of The McGraw-Hill Companies, Inc. and have been licensed for use by Fidelity Distributors Corporation.
Other third-party marks appearing herein are the property of their respective owners.
All other marks appearing herein are registered or unregistered trademarks or service marks of FMR LLC or an affiliated company. © 2020 FMR LLC. All rights reserved.
This report and the financial statements contained herein are submitted for the general information of the shareholders of the Fund. This report is not authorized for distribution to prospective investors in the Fund unless preceded or accompanied by an effective prospectus.
A fund files its complete schedule of portfolio holdings with the SEC for the first and third quarters of each fiscal year on Form N-PORT. Forms N-PORT are available on the SEC’s web site at http://www.sec.gov. A fund's Forms N-PORT may be reviewed and copied at the SEC’s Public Reference Room in Washington, DC. Information regarding the operation of the SEC's Public Reference Room may be obtained by calling 1-800-SEC-0330.
For a complete list of a fund's portfolio holdings, view the most recent holdings listing, semiannual report, or annual report on Fidelity's web site at http://www.fidelity.com, http://www.institutional.fidelity.com, or http://www.401k.com, as applicable.
NOT FDIC INSURED •MAY LOSE VALUE •NO BANK GUARANTEE
Neither the Fund nor Fidelity Distributors Corporation is a bank.
Note to Shareholders:
Early in 2020, the outbreak and spread of a new coronavirus emerged as a public health emergency that had a major influence on financial markets, primarily based on its impact on the global economy and the outlook for corporate earnings. The virus causes a respiratory disease known as COVID-19. On March 11, the World Health Organization declared the COVID-19 outbreak a pandemic, citing sustained risk of further global spread.
In the weeks following, as the crisis worsened, we witnessed an escalating human tragedy with wide-scale social and economic consequences from coronavirus-containment measures. The outbreak of COVID-19 prompted a number of measures to limit the spread, including travel and border restrictions, quarantines, and restrictions on large gatherings. In turn, these resulted in lower consumer activity, diminished demand for a wide range of products and services, disruption in manufacturing and supply chains, and – given the wide variability in outcomes regarding the outbreak – significant market uncertainty and volatility. Amid the turmoil, global governments and central banks took unprecedented action to help support consumers, businesses, and the broader economies, and to limit disruption to financial systems.
The situation continues to unfold, and the extent and duration of its impact on financial markets and the economy remain highly uncertain. Extreme events such as the coronavirus crisis are “exogenous shocks” that can have significant adverse effects on mutual funds and their investments. Although multiple asset classes may be affected by market disruption, the duration and impact may not be the same for all types of assets.
Fidelity is committed to helping you stay informed amid news about COVID-19 and during increased market volatility, and we’re taking extra steps to be responsive to customer needs. We encourage you to visit our websites, where we offer ongoing updates, commentary, and analysis on the markets and our funds.
Performance: The Bottom Line
Average annual total return reflects the change in the value of an investment, assuming reinvestment of distributions from dividend income and capital gains (the profits earned upon the sale of securities that have grown in value, if any) and assuming a constant rate of performance each year. The hypothetical investment and the average annual total returns do not reflect the deduction of taxes that a shareholder would pay on fund distributions or the redemption of fund shares. During periods of reimbursement by Fidelity, a fund’s total return will be greater than it would be had the reimbursement not occurred. How a fund did yesterday is no guarantee of how it will do tomorrow.
Average Annual Total Returns
| For the periods ended October 31, 2020 | Past 1 year | Life of fundA |
| Fidelity® International Capital Appreciation K6 Fund | 13.82% | 10.89% |
A From May 25, 2017
$10,000 Over Life of Fund
Let's say hypothetically that $10,000 was invested in Fidelity® International Capital Appreciation K6 Fund on May 25, 2017, when the fund started.
The chart shows how the value of your investment would have changed, and also shows how the MSCI ACWI (All Country World Index) ex USA Index performed over the same period.
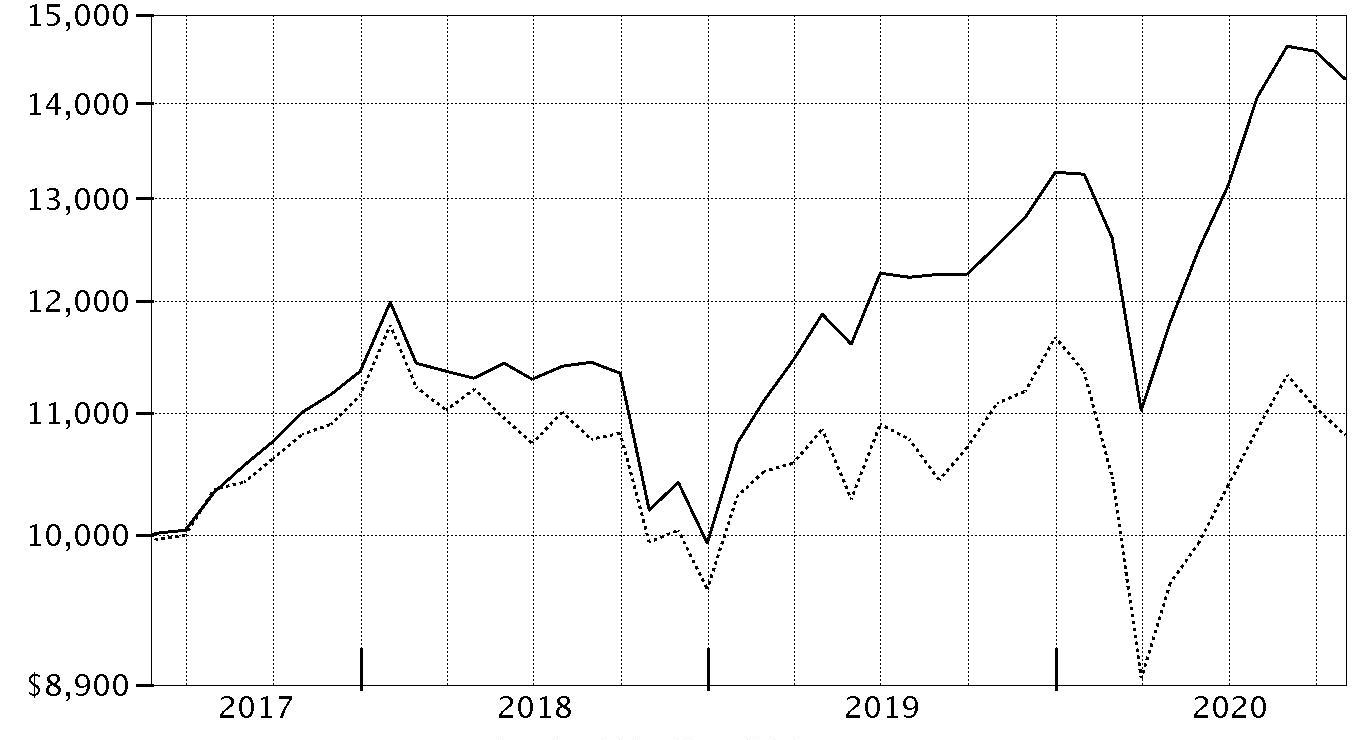
| Period Ending Values |
| $14,267 | Fidelity® International Capital Appreciation K6 Fund |
| $10,814 | MSCI ACWI (All Country World Index) ex USA Index |
Management's Discussion of Fund Performance
Market Recap: The MSCI ACWI (All Country World Index) ex USA Index returned -2.46% for the 12 months ending October 31, 2020, in what was a bumpy ride for non-U.S. equities, marked by a steep but brief decline due to the early-2020 outbreak and spread of the coronavirus, followed by a sharp upturn. Declared a pandemic on March 11, the crisis and containment efforts caused broad contraction in economic activity, elevated volatility and dislocation in financial markets. A historically rapid and expansive monetary- and fiscal-policy response around the world provided a partial offset to the economic disruption. Other supporting factors included resilient corporate earnings and near-term potential for a COVID-19 vaccine breakthrough. This was evident in the index’s 12.28% gain in the final six months of the year. Currency fluctuation generally boosted foreign developed-markets equities for the year, while the reverse was true for emerging-markets stocks. Late in the period, the index was pressured by a second wave of COVID-19 cases in some regions, and stretched valuations and crowded positioning in big tech. For the full year, the U.K. (-22%), Asia Pacific ex Japan (-8%), Canada (-5%) and Europe ex U.K. (-4%) notably lagged. Emerging markets (+9%) and Japan (+1%) outperformed. By sector, energy (-38%), financials and real estate (-20% each) lagged, whereas information technology (+ 25%) and communication services (+15%) topped the index.
Comments from Portfolio Manager Sammy Simnegar: For the fiscal year ending October 31, 2020, the fund gained 13.82%, outperforming the -2.46% result of the benchmark MSCI All Country World ex US Index (Net MA). From a regional standpoint, security selection in Europe ex U.K. and out-of-benchmark exposure to the U.S. contributed to the fund's relative result. By sector, the top contributor to performance versus the benchmark was security selection in industrials. An overweighting in information technology and picks among consumer discretionary stocks also helped. Our non-benchmark stake in MercadoLibre was the portfolio's biggest individual relative contributor, driven by a 146% gain. Also bolstering performance was our outsized stake in Wuliangye Yibin, which advanced 68% and was not held at period end. Another notable relative contributor was our overweighting in Orsted (+90%), a position we established this period. In contrast, an underweighting in emerging markets – especially South Korea – along with an overweighting in Europe ex U.K., primarily driven by France, hindered the fund's relative result. By sector, the largest detractor from performance versus the benchmark was an overweighting in industrials. Weak picks in information technology also hampered the portfolio's relative performance. Further pressuring the fund's relative result was an underweighting in health care. The biggest individual relative detractor was our outsized stake in Capitec Bank Holdings, which returned -62%. This is a position that was sold the past year. Also hampering performance was our overweighting in MTU Aero Engines, which returned roughly -63% and was not held at period end. Also hurting performance was our outsized stake in Aristocrat Leisure, which returned approximately -58% and also was not held as of October 31. Notable changes in positioning include a higher allocation to United States and China. By sector, meaningful changes in positioning include a lower allocation to consumer staples and financials.
The views expressed above reflect those of the portfolio manager(s) only through the end of the period as stated on the cover of this report and do not necessarily represent the views of Fidelity or any other person in the Fidelity organization. Any such views are subject to change at any time based upon market or other conditions and Fidelity disclaims any responsibility to update such views. These views may not be relied on as investment advice and, because investment decisions for a Fidelity fund are based on numerous factors, may not be relied on as an indication of trading intent on behalf of any Fidelity fund.
Investment Summary (Unaudited)
Geographic Diversification (% of fund's net assets)
| As of October 31, 2020 |
| | United States of America* | 13.6% |
| | Cayman Islands | 12.6% |
| | Japan | 10.8% |
| | France | 8.0% |
| | Switzerland | 6.9% |
| | Germany | 6.0% |
| | Netherlands | 4.8% |
| | Korea (South) | 4.7% |
| | United Kingdom | 4.7% |
| | Other | 27.9% |

* Includes Short-Term investments and Net Other Assets (Liabilities).
Percentages are based on country or territory of incorporation and are adjusted for the effect of futures contracts, if applicable.
Asset Allocation as of October 31, 2020
| | % of fund's net assets |
| Stocks | 99.6 |
| Short-Term Investments and Net Other Assets (Liabilities) | 0.4 |
Top Ten Stocks as of October 31, 2020
| | % of fund's net assets |
| Alibaba Group Holding Ltd. sponsored ADR (Cayman Islands, Internet & Direct Marketing Retail) | 3.5 |
| Tencent Holdings Ltd. (Cayman Islands, Interactive Media & Services) | 2.9 |
| Taiwan Semiconductor Manufacturing Co. Ltd. (Taiwan, Semiconductors & Semiconductor Equipment) | 2.5 |
| Nestle SA (Reg. S) (Switzerland, Food Products) | 2.3 |
| Samsung Electronics Co. Ltd. (Korea (South), Technology Hardware, Storage & Peripherals) | 2.0 |
| ASML Holding NV (Netherlands) (Netherlands, Semiconductors & Semiconductor Equipment) | 1.5 |
| Meituan Class B (Cayman Islands, Internet & Direct Marketing Retail) | 1.5 |
| LVMH Moet Hennessy Louis Vuitton SE (France, Textiles, Apparel & Luxury Goods) | 1.4 |
| Reliance Industries Ltd. (India, Oil, Gas & Consumable Fuels) | 1.4 |
| AstraZeneca PLC (United Kingdom) (United Kingdom, Pharmaceuticals) | 1.4 |
| | 20.4 |
Top Market Sectors as of October 31, 2020
| | % of fund's net assets |
| Information Technology | 21.1 |
| Consumer Discretionary | 17.5 |
| Industrials | 15.2 |
| Communication Services | 11.3 |
| Health Care | 8.0 |
| Financials | 6.2 |
| Consumer Staples | 6.0 |
| Utilities | 5.6 |
| Materials | 5.6 |
| Real Estate | 1.7 |
Schedule of Investments October 31, 2020
Showing Percentage of Net Assets
| Common Stocks - 99.6% | | | |
| | | Shares | Value |
| Bailiwick of Jersey - 1.7% | | | |
| Experian PLC | | 182,779 | $6,695,907 |
| Ferguson PLC | | 64,000 | 6,356,542 |
|
| TOTAL BAILIWICK OF JERSEY | | | 13,052,449 |
|
| Bermuda - 0.8% | | | |
| IHS Markit Ltd. | | 74,800 | 6,049,076 |
| Canada - 4.5% | | | |
| Canadian National Railway Co. | | 80,939 | 8,040,439 |
| Canadian Pacific Railway Ltd. | | 24,276 | 7,254,557 |
| Constellation Software, Inc. | | 6,169 | 6,475,945 |
| Thomson Reuters Corp. | | 83,000 | 6,452,856 |
| Waste Connection, Inc. (Canada) | | 59,900 | 5,937,397 |
|
| TOTAL CANADA | | | 34,161,194 |
|
| Cayman Islands - 12.6% | | | |
| Alibaba Group Holding Ltd. sponsored ADR (a) | | 87,667 | 26,711,258 |
| JD.com, Inc. sponsored ADR (a) | | 109,000 | 8,885,680 |
| Meituan Class B (a) | | 302,100 | 11,230,599 |
| NetEase, Inc. ADR | | 80,100 | 6,951,879 |
| New Oriental Education & Technology Group, Inc. sponsored ADR (a) | | 43,924 | 7,044,531 |
| Sea Ltd. ADR (a) | | 38,000 | 5,992,600 |
| Shenzhou International Group Holdings Ltd. | | 382,600 | 6,608,209 |
| Tencent Holdings Ltd. | | 294,500 | 22,501,465 |
|
| TOTAL CAYMAN ISLANDS | | | 95,926,221 |
|
| China - 0.8% | | | |
| Kweichow Moutai Co. Ltd. (A Shares) | | 25,500 | 6,378,241 |
| Denmark - 3.1% | | | |
| DSV Panalpina A/S | | 45,700 | 7,399,797 |
| Novo Nordisk A/S Series B | | 143,700 | 9,163,125 |
| ORSTED A/S (b) | | 45,100 | 7,158,002 |
|
| TOTAL DENMARK | | | 23,720,924 |
|
| France - 8.0% | | | |
| Air Liquide SA | | 56,670 | 8,283,090 |
| Dassault Systemes SA | | 38,526 | 6,575,597 |
| Hermes International SCA | | 7,391 | 6,877,735 |
| Kering SA | | 11,470 | 6,926,401 |
| L'Oreal SA | | 25,929 | 8,379,877 |
| LVMH Moet Hennessy Louis Vuitton SE | | 23,063 | 10,810,727 |
| SR Teleperformance SA | | 21,241 | 6,375,068 |
| Worldline SA (a)(b) | | 86,700 | 6,426,059 |
|
| TOTAL FRANCE | | | 60,654,554 |
|
| Germany - 6.0% | | | |
| Delivery Hero AG (a)(b) | | 58,400 | 6,718,577 |
| Deutsche Borse AG | | 38,800 | 5,709,557 |
| Infineon Technologies AG | | 253,700 | 7,063,308 |
| Merck KGaA | | 43,900 | 6,500,942 |
| RWE AG | | 182,300 | 6,749,516 |
| Symrise AG | | 47,408 | 5,844,373 |
| Vonovia SE | | 113,400 | 7,240,149 |
|
| TOTAL GERMANY | | | 45,826,422 |
|
| Hong Kong - 2.2% | | | |
| AIA Group Ltd. | | 994,600 | 9,465,784 |
| Techtronic Industries Co. Ltd. | | 533,000 | 7,108,958 |
|
| TOTAL HONG KONG | | | 16,574,742 |
|
| India - 2.3% | | | |
| HDFC Bank Ltd. | | 422,014 | 6,699,534 |
| Reliance Industries Ltd. | | 382,300 | 10,536,272 |
|
| TOTAL INDIA | | | 17,235,806 |
|
| Indonesia - 0.9% | | | |
| PT Bank Central Asia Tbk | | 3,371,300 | 6,633,558 |
| Ireland - 1.7% | | | |
| Flutter Entertainment PLC (Ireland) | | 42,100 | 7,332,700 |
| Linde PLC | | 27,100 | 5,971,214 |
|
| TOTAL IRELAND | | | 13,303,914 |
|
| Italy - 1.1% | | | |
| Enel SpA | | 1,040,700 | 8,274,091 |
| Japan - 10.8% | | | |
| Daikin Industries Ltd. | | 40,100 | 7,504,044 |
| Hoya Corp. | | 66,900 | 7,550,129 |
| Keyence Corp. | | 18,764 | 8,515,525 |
| Nitori Holdings Co. Ltd. | | 31,350 | 6,444,202 |
| Olympus Corp. | | 343,000 | 6,566,420 |
| Recruit Holdings Co. Ltd. | | 193,900 | 7,378,026 |
| SMC Corp. | | 12,300 | 6,542,440 |
| Sony Corp. | | 123,000 | 10,254,077 |
| Tokyo Electron Ltd. | | 28,400 | 7,622,869 |
| Unicharm Corp. | | 145,300 | 6,723,162 |
| Z Holdings Corp. | | 966,600 | 6,740,160 |
|
| TOTAL JAPAN | | | 81,841,054 |
|
| Korea (South) - 4.7% | | | |
| LG Chemical Ltd. | | 12,677 | 6,897,365 |
| NAVER Corp. | | 26,980 | 6,888,253 |
| Samsung Electronics Co. Ltd. | | 309,350 | 15,515,556 |
| Samsung SDI Co. Ltd. | | 17,110 | 6,725,462 |
|
| TOTAL KOREA (SOUTH) | | | 36,026,636 |
|
| Luxembourg - 0.8% | | | |
| Spotify Technology SA (a) | | 25,200 | 6,045,228 |
| Netherlands - 4.8% | | | |
| ASML Holding NV (Netherlands) | | 31,920 | 11,548,755 |
| Ferrari NV | | 34,900 | 6,224,979 |
| Takeaway.com Holding BV (a)(b) | | 54,800 | 6,096,356 |
| Wolters Kluwer NV | | 78,800 | 6,385,664 |
| Yandex NV Series A (a)(c) | | 115,300 | 6,637,821 |
|
| TOTAL NETHERLANDS | | | 36,893,575 |
|
| Portugal - 0.8% | | | |
| Energias de Portugal SA | | 1,271,699 | 6,267,948 |
| Spain - 2.0% | | | |
| Cellnex Telecom SA (b) | | 110,506 | 7,093,989 |
| Iberdrola SA | | 699,899 | 8,253,266 |
|
| TOTAL SPAIN | | | 15,347,255 |
|
| Sweden - 2.7% | | | |
| Atlas Copco AB (A Shares) | | 163,300 | 7,210,349 |
| Hexagon AB (B Shares) | | 95,059 | 6,948,033 |
| Swedish Match Co. AB | | 88,000 | 6,631,844 |
|
| TOTAL SWEDEN | | | 20,790,226 |
|
| Switzerland - 6.9% | | | |
| Alcon, Inc. (Switzerland) (a) | | 110,270 | 6,265,409 |
| Givaudan SA | | 1,620 | 6,600,491 |
| Lonza Group AG | | 12,632 | 7,653,858 |
| Nestle SA (Reg. S) | | 156,590 | 17,612,920 |
| Partners Group Holding AG | | 7,138 | 6,434,670 |
| Sika AG | | 32,330 | 7,957,774 |
|
| TOTAL SWITZERLAND | | | 52,525,122 |
|
| Taiwan - 2.5% | | | |
| Taiwan Semiconductor Manufacturing Co. Ltd. | | 1,255,000 | 18,984,092 |
| United Kingdom - 4.7% | | | |
| Ashtead Group PLC | | 179,600 | 6,514,810 |
| AstraZeneca PLC (United Kingdom) | | 103,600 | 10,402,010 |
| Atlassian Corp. PLC (a) | | 32,100 | 6,151,002 |
| Aveva Group PLC | | 98,500 | 5,474,330 |
| London Stock Exchange Group PLC | | 64,147 | 6,914,913 |
|
| TOTAL UNITED KINGDOM | | | 35,457,065 |
|
| United States of America - 13.2% | | | |
| Adobe, Inc. (a) | | 13,100 | 5,857,010 |
| Alphabet, Inc. Class A (a) | | 3,700 | 5,979,607 |
| American Tower Corp. | | 25,400 | 5,833,110 |
| Autodesk, Inc. (a) | | 24,900 | 5,864,946 |
| Charter Communications, Inc. Class A (a) | | 9,800 | 5,917,436 |
| MasterCard, Inc. Class A | | 20,309 | 5,861,990 |
| MercadoLibre, Inc. (a) | | 5,000 | 6,070,250 |
| Microsoft Corp. | | 28,400 | 5,750,148 |
| Netflix, Inc. (a) | | 12,000 | 5,708,880 |
| NextEra Energy, Inc. | | 81,320 | 5,953,437 |
| NICE Systems Ltd. sponsored ADR (a) | | 30,155 | 6,883,180 |
| NVIDIA Corp. | | 10,900 | 5,464,824 |
| Roper Technologies, Inc. | | 16,400 | 6,089,976 |
| S&P Global, Inc. | | 17,200 | 5,550,956 |
| SolarEdge Technologies, Inc. (a) | | 21,300 | 5,488,797 |
| Thermo Fisher Scientific, Inc. | | 12,700 | 6,008,624 |
| Visa, Inc. Class A | | 33,181 | 6,029,320 |
|
| TOTAL UNITED STATES OF AMERICA | | | 100,312,491 |
|
| TOTAL COMMON STOCKS | | | |
| (Cost $611,856,022) | | | 758,281,884 |
|
| Money Market Funds - 2.0% | | | |
| Fidelity Cash Central Fund 0.10% (d) | | 14,001,031 | 14,003,831 |
| Fidelity Securities Lending Cash Central Fund 0.11% (d)(e) | | 1,018,123 | 1,018,225 |
| TOTAL MONEY MARKET FUNDS | | | |
| (Cost $15,022,056) | | | 15,022,056 |
| TOTAL INVESTMENT IN SECURITIES - 101.6% | | | |
| (Cost $626,878,078) | | | 773,303,940 |
| NET OTHER ASSETS (LIABILITIES) - (1.6)% | | | (12,343,986) |
| NET ASSETS - 100% | | | $760,959,954 |
Categorizations in the Schedule of Investments are based on country or territory of incorporation.
Legend
(a) Non-income producing
(b) Security exempt from registration under Rule 144A of the Securities Act of 1933. These securities may be resold in transactions exempt from registration, normally to qualified institutional buyers. At the end of the period, the value of these securities amounted to $33,492,983 or 4.4% of net assets.
(c) Security or a portion of the security is on loan at period end.
(d) Affiliated fund that is generally available only to investment companies and other accounts managed by Fidelity Investments. The rate quoted is the annualized seven-day yield of the fund at period end. A complete unaudited listing of the fund's holdings as of its most recent quarter end is available upon request. In addition, each Fidelity Central Fund's financial statements, which are not covered by the Fund's Report of Independent Registered Public Accounting Firm, are available on the SEC's website or upon request.
(e) Investment made with cash collateral received from securities on loan.
Affiliated Central Funds
Information regarding fiscal year to date income earned by the Fund from investments in Fidelity Central Funds is as follows:
| Fund | Income earned |
| Fidelity Cash Central Fund | $55,128 |
| Fidelity Securities Lending Cash Central Fund | 19,022 |
| Total | $74,150 |
Amounts in the income column in the above table include any capital gain distributions from underlying funds, which are presented in the corresponding line-item in the Statement of Operations, if applicable. Amount for Fidelity Securities Lending Cash Central Fund represents the income earned on investing cash collateral, less rebates paid to borrowers and any lending agent fees associated with the loan, plus any premium payments received for lending certain types of securities.
Investment Valuation
The following is a summary of the inputs used, as of October 31, 2020, involving the Fund's assets and liabilities carried at fair value. The inputs or methodology used for valuing securities may not be an indication of the risk associated with investing in those securities. For more information on valuation inputs, and their aggregation into the levels used below, please refer to the Investment Valuation section in the accompanying Notes to Financial Statements.
| | Valuation Inputs at Reporting Date: |
| Description | Total | Level 1 | Level 2 | Level 3 |
| Investments in Securities: | | | | |
| Equities: | | | | |
| Communication Services | $86,457,318 | $50,327,440 | $36,129,878 | $-- |
| Consumer Discretionary | 134,236,281 | 106,727,275 | 27,509,006 | -- |
| Consumer Staples | 45,726,044 | 6,631,844 | 39,094,200 | -- |
| Energy | 10,536,272 | -- | 10,536,272 | -- |
| Financials | 47,408,972 | 17,695,183 | 29,713,789 | -- |
| Health Care | 60,110,517 | 18,774,975 | 41,335,542 | -- |
| Industrials | 115,295,906 | 80,818,947 | 34,476,959 | -- |
| Information Technology | 161,226,748 | 85,251,181 | 75,975,567 | -- |
| Materials | 41,554,307 | 34,656,942 | 6,897,365 | -- |
| Real Estate | 13,073,259 | 13,073,259 | -- | -- |
| Utilities | 42,656,260 | 34,382,169 | 8,274,091 | -- |
| Money Market Funds | 15,022,056 | 15,022,056 | -- | -- |
| Total Investments in Securities: | $773,303,940 | $463,361,271 | $309,942,669 | $-- |
See accompanying notes which are an integral part of the financial statements.
Financial Statements
Statement of Assets and Liabilities
| | | October 31, 2020 |
| Assets | | |
Investment in securities, at value (including securities loaned of $972,933) — See accompanying schedule:
Unaffiliated issuers (cost $611,856,022) | $758,281,884 | |
| Fidelity Central Funds (cost $15,022,056) | 15,022,056 | |
| Total Investment in Securities (cost $626,878,078) | | $773,303,940 |
| Cash | | 2 |
| Foreign currency held at value (cost $575,088) | | 575,129 |
| Receivable for investments sold | | 5,587,656 |
| Receivable for fund shares sold | | 1,251,317 |
| Dividends receivable | | 950,092 |
| Distributions receivable from Fidelity Central Funds | | 1,503 |
| Other receivables | | 83,188 |
| Total assets | | 781,752,827 |
| Liabilities | | |
| Payable for investments purchased | $18,577,650 | |
| Payable for fund shares redeemed | 553,974 | |
| Accrued management fee | 429,150 | |
| Other payables and accrued expenses | 213,874 | |
| Collateral on securities loaned | 1,018,225 | |
| Total liabilities | | 20,792,873 |
| Net Assets | | $760,959,954 |
| Net Assets consist of: | | |
| Paid in capital | | $627,721,681 |
| Total accumulated earnings (loss) | | 133,238,273 |
| Net Assets | | $760,959,954 |
| Net Asset Value, offering price and redemption price per share ($760,959,954 ÷ 54,395,326 shares) | | $13.99 |
See accompanying notes which are an integral part of the financial statements.
Statement of Operations
| | | Year ended October 31, 2020 |
| Investment Income | | |
| Dividends | | $8,879,953 |
| Income from Fidelity Central Funds (including $19,022 from security lending) | | 74,150 |
| Income before foreign taxes withheld | | 8,954,103 |
| Less foreign taxes withheld | | (939,070) |
| Total income | | 8,015,033 |
| Expenses | | |
| Management fee | $4,218,397 | |
| Independent trustees' fees and expenses | 3,508 | |
| Interest | 378 | |
| Miscellaneous | 11,142 | |
| Total expenses before reductions | 4,233,425 | |
| Expense reductions | (249,038) | |
| Total expenses after reductions | | 3,984,387 |
| Net investment income (loss) | | 4,030,646 |
| Realized and Unrealized Gain (Loss) | | |
| Net realized gain (loss) on: | | |
| Investment securities: | | |
| Unaffiliated issuers | (1,537,514) | |
| Fidelity Central Funds | 2,567 | |
| Foreign currency transactions | (133,143) | |
| Total net realized gain (loss) | | (1,668,090) |
| Change in net unrealized appreciation (depreciation) on: | | |
| Investment securities: | | |
| Unaffiliated issuers (net of increase in deferred foreign taxes of $147,482) | 77,763,069 | |
| Assets and liabilities in foreign currencies | 29,659 | |
| Total change in net unrealized appreciation (depreciation) | | 77,792,728 |
| Net gain (loss) | | 76,124,638 |
| Net increase (decrease) in net assets resulting from operations | | $80,155,284 |
See accompanying notes which are an integral part of the financial statements.
Statement of Changes in Net Assets
| | Year ended October 31, 2020 | Year ended October 31, 2019 |
| Increase (Decrease) in Net Assets | | |
| Operations | | |
| Net investment income (loss) | $4,030,646 | $4,987,231 |
| Net realized gain (loss) | (1,668,090) | (470,723) |
| Change in net unrealized appreciation (depreciation) | 77,792,728 | 81,046,964 |
| Net increase (decrease) in net assets resulting from operations | 80,155,284 | 85,563,472 |
| Distributions to shareholders | (5,098,696) | (2,841,028) |
| Share transactions | | |
| Proceeds from sales of shares | 369,557,628 | 176,361,634 |
| Reinvestment of distributions | 5,098,696 | 2,841,028 |
| Cost of shares redeemed | (213,105,501) | (98,535,277) |
| Net increase (decrease) in net assets resulting from share transactions | 161,550,823 | 80,667,385 |
| Total increase (decrease) in net assets | 236,607,411 | 163,389,829 |
| Net Assets | | |
| Beginning of period | 524,352,543 | 360,962,714 |
| End of period | $760,959,954 | $524,352,543 |
| Other Information | | |
| Shares | | |
| Sold | 28,359,441 | 15,318,074 |
| Issued in reinvestment of distributions | 398,647 | 283,819 |
| Redeemed | (16,664,986) | (8,785,472) |
| Net increase (decrease) | 12,093,102 | 6,816,421 |
See accompanying notes which are an integral part of the financial statements.
Financial Highlights
Fidelity International Capital Appreciation K6 Fund
| | | | | |
| Years ended October 31, | 2020 | 2019 | 2018 | 2017 A |
| Selected Per–Share Data | | | | |
| Net asset value, beginning of period | $12.40 | $10.17 | $11.01 | $10.00 |
| Income from Investment Operations | | | | |
| Net investment income (loss)B | .08 | .13C | .11 | .02 |
| Net realized and unrealized gain (loss) | 1.62 | 2.18 | (.92) | .99 |
| Total from investment operations | 1.70 | 2.31 | (.81) | 1.01 |
| Distributions from net investment income | (.11) | (.08) | (.02) | – |
| Distributions from net realized gain | – | – | (.01) | – |
| Total distributions | (.11) | (.08) | (.03) | – |
| Net asset value, end of period | $13.99 | $12.40 | $10.17 | $11.01 |
| Total ReturnD,E | 13.82% | 22.90% | (7.36)% | 10.10% |
| Ratios to Average Net AssetsF,G | | | | |
| Expenses before reductions | .65% | .65% | .65% | .65%H |
| Expenses net of fee waivers, if any | .65% | .65% | .65% | .65%H |
| Expenses net of all reductions | .61% | .63% | .58% | .65%H |
| Net investment income (loss) | .62% | 1.16%C | .99% | .51%H |
| Supplemental Data | | | | |
| Net assets, end of period (000 omitted) | $760,960 | $524,353 | $360,963 | $175,404 |
| Portfolio turnover rateI | 138% | 144%J | 158%J | 81%J,K |
A For the period May 25, 2017 (commencement of operations) to October 31, 2017.
B Calculated based on average shares outstanding during the period.
C Net investment income per share reflects one or more large, non-recurring dividend(s) which amounted to $.05 per share. Such dividends are not annualized in the ratio of net investment income (loss) to average net assets. Excluding such non-recurring dividend(s) the ratio of net investment income (loss) to average net assets would have been .75%.
D Total returns for periods of less than one year are not annualized.
E Total returns would have been lower if certain expenses had not been reduced during the applicable periods shown.
F Fees and expenses of any underlying mutual funds or exchange-traded funds (ETFs) are not included in the Fund's expense ratio. The Fund indirectly bears its proportionate share of these expenses. For additional expense information related to investments in Fidelity Central Funds, please refer to the "Investments in Fidelity Central Funds" note found in the Notes to Financial Statements section of the most recent Annual or Semi-Annual report.
G Expense ratios reflect operating expenses of the class. Expenses before reductions do not reflect amounts reimbursed, waived, or reduced through arrangements with the investment advisor, brokerage services, or other offset arrangements, if applicable, and do not represent the amount paid by the class during periods when reimbursements, waivers or reductions occur.
H Annualized
I Amount does not include the portfolio activity of any underlying mutual funds or exchange-traded funds (ETFs).
J Portfolio turnover rate excludes securities received or delivered in-kind.
K Amount not annualized.
See accompanying notes which are an integral part of the financial statements.
Notes to Financial Statements
For the period ended October 31, 2020
1. Organization.
Fidelity International Capital Appreciation K6 Fund (the Fund) is a fund of Fidelity Investment Trust (the Trust) and is authorized to issue an unlimited number of shares. Share transactions on the Statement of Changes in Net Assets may contain exchanges between affiliated funds. The Trust is registered under the Investment Company Act of 1940, as amended (the 1940 Act), as an open-end management investment company organized as a Massachusetts business trust. Shares generally are available only to employer-sponsored retirement plans that are recordkept by Fidelity, or to certain employer-sponsored retirement plans that are not recordkept by Fidelity. The Fund's investments in emerging markets can be subject to social, economic, regulatory, and political uncertainties and can be extremely volatile.
Effective January 1, 2020:
Investment advisers Fidelity Investments Money Management, Inc., FMR Co., Inc., and Fidelity SelectCo, LLC, merged with and into Fidelity Management & Research Company. In connection with the merger transactions, the resulting, merged investment adviser was then redomiciled from Massachusetts to Delaware, changed its corporate structure from a corporation to a limited liability company, and changed its name to "Fidelity Management & Research Company LLC".
2. Investments in Fidelity Central Funds.
The Fund invests in Fidelity Central Funds, which are open-end investment companies generally available only to other investment companies and accounts managed by the investment adviser and its affiliates. The Fund's Schedule of Investments lists each of the Fidelity Central Funds held as of period end, if any, as an investment of the Fund, but does not include the underlying holdings of each Fidelity Central Fund. As an Investing Fund, the Fund indirectly bears its proportionate share of the expenses of the underlying Fidelity Central Funds.
The Money Market Central Funds seek preservation of capital and current income and are managed by the investment adviser. Annualized expenses of the Money Market Central Funds as of their most recent shareholder report date ranged from less than .005% to .01%.
A complete unaudited list of holdings for each Fidelity Central Fund is available upon request or at the Securities and Exchange Commission (the SEC) website at www.sec.gov. In addition, the financial statements of the Fidelity Central Funds, which are not covered by the Fund's Report of Independent Registered Public Accounting Firm, are available on the SEC website or upon request.
3. Significant Accounting Policies.
The Fund is an investment company and applies the accounting and reporting guidance of the Financial Accounting Standards Board (FASB) Accounting Standards Codification Topic 946 Financial Services – Investment Companies. The financial statements have been prepared in conformity with accounting principles generally accepted in the United States of America (GAAP), which require management to make certain estimates and assumptions at the date of the financial statements. Actual results could differ from those estimates. Subsequent events, if any, through the date that the financial statements were issued have been evaluated in the preparation of the financial statements. The following summarizes the significant accounting policies of the Fund:
Investment Valuation. Investments are valued as of 4:00 p.m. Eastern time on the last calendar day of the period. The Board of Trustees (the Board) has delegated the day to day responsibility for the valuation of the Fund's investments to the Fair Value Committee (the Committee) established by the Fund's investment adviser. In accordance with valuation policies and procedures approved by the Board, the Fund attempts to obtain prices from one or more third party pricing vendors or brokers to value its investments. When current market prices, quotations or currency exchange rates are not readily available or reliable, investments will be fair valued in good faith by the Committee, in accordance with procedures adopted by the Board. Factors used in determining fair value vary by investment type and may include market or investment specific events. The frequency with which these procedures are used cannot be predicted and they may be utilized to a significant extent. The Committee oversees the Fund's valuation policies and procedures and reports to the Board on the Committee's activities and fair value determinations. The Board monitors the appropriateness of the procedures used in valuing the Fund's investments and ratifies the fair value determinations of the Committee.
The Fund categorizes the inputs to valuation techniques used to value its investments into a disclosure hierarchy consisting of three levels as shown below:
- Level 1 – quoted prices in active markets for identical investments
- Level 2 – other significant observable inputs (including quoted prices for similar investments, interest rates, prepayment speeds, etc.)
- Level 3 – unobservable inputs (including the Fund's own assumptions based on the best information available)
Valuation techniques used to value the Fund's investments by major category are as follows:
Equity securities, including restricted securities, for which market quotations are readily available, are valued at the last reported sale price or official closing price as reported by a third party pricing vendor on the primary market or exchange on which they are traded and are categorized as Level 1 in the hierarchy. In the event there were no sales during the day or closing prices are not available, securities are valued at the last quoted bid price or may be valued using the last available price and are generally categorized as Level 2 in the hierarchy. For foreign equity securities, when market or security specific events arise, comparisons to the valuation of American Depositary Receipts (ADRs), futures contracts, Exchange-Traded Funds (ETFs) and certain indexes as well as quoted prices for similar securities may be used and would be categorized as Level 2 in the hierarchy. For equity securities, including restricted securities, where observable inputs are limited, assumptions about market activity and risk are used and these securities may be categorized as Level 3 in the hierarchy.
Investments in open-end mutual funds, including the Fidelity Central Funds, are valued at their closing net asset value (NAV) each business day and are categorized as Level 1 in the hierarchy.
Changes in valuation techniques may result in transfers in or out of an assigned level within the disclosure hierarchy. The aggregate value of investments by input level as of October 31, 2020 is included at the end of the Fund's Schedule of Investments.
Foreign Currency. Certain Funds may use foreign currency contracts to facilitate transactions in foreign-denominated securities. Gains and losses from these transactions may arise from changes in the value of the foreign currency or if the counterparties do not perform under the contracts' terms.
Foreign-denominated assets, including investment securities, and liabilities are translated into U.S. dollars at the exchange rates at period end. Purchases and sales of investment securities, income and dividends received, and expenses denominated in foreign currencies are translated into U.S. dollars at the exchange rate in effect on the transaction date.
The effects of exchange rate fluctuations on investments are included with the net realized and unrealized gain (loss) on investment securities. Other foreign currency transactions resulting in realized and unrealized gain (loss) are disclosed separately.
Investment Transactions and Income. For financial reporting purposes, the Fund's investment holdings and NAV include trades executed through the end of the last business day of the period. The NAV per share for processing shareholder transactions is calculated as of the close of business of the New York Stock Exchange (NYSE), normally 4:00 p.m. Eastern time and includes trades executed through the end of the prior business day. Gains and losses on securities sold are determined on the basis of identified cost. Dividend income is recorded on the ex-dividend date, except for certain dividends from foreign securities where the ex-dividend date may have passed, which are recorded as soon as the Fund is informed of the ex-dividend date. Non-cash dividends included in dividend income, if any, are recorded at the fair market value of the securities received. Income and capital gain distributions from Fidelity Central Funds, if any, are recorded on the ex-dividend date. Investment income is recorded net of foreign taxes withheld where recovery of such taxes is uncertain.
Expenses. Expenses directly attributable to a fund are charged to that fund. Expenses attributable to more than one fund are allocated among the respective funds on the basis of relative net assets or other appropriate methods. Expense estimates are accrued in the period to which they relate and adjustments are made when actual amounts are known.
Income Tax Information and Distributions to Shareholders. Each year, the Fund intends to qualify as a regulated investment company under Subchapter M of the Internal Revenue Code, including distributing substantially all of its taxable income and realized gains. As a result, no provision for U.S. Federal income taxes is required. As of October 31, 2020, the Fund did not have any unrecognized tax benefits in the financial statements; nor is the Fund aware of any tax positions for which it is reasonably possible that the total amounts of unrecognized tax benefits will significantly change in the next twelve months. The Fund files a U.S. federal tax return, in addition to state and local tax returns as required. The Fund's federal income tax returns are subject to examination by the Internal Revenue Service (IRS) for a period of three fiscal years after they are filed. State and local tax returns may be subject to examination for an additional fiscal year depending on the jurisdiction. Foreign taxes are provided for based on the Fund's understanding of the tax rules and rates that exist in the foreign markets in which it invests. The Fund is subject to a tax imposed on capital gains by certain countries in which it invests. An estimated deferred tax liability for net unrealized appreciation on the applicable securities is included in Other payables and accrued expenses on the Statement of Assets & Liabilities.
Distributions are declared and recorded on the ex-dividend date. Income and capital gain distributions are determined in accordance with income tax regulations, which may differ from GAAP.
Capital accounts within the financial statements are adjusted for permanent book-tax differences. These adjustments have no impact on net assets or the results of operations. Capital accounts are not adjusted for temporary book-tax differences which will reverse in a subsequent period.
Book-tax differences are primarily due to foreign currency transactions, certain foreign taxes,capital loss carryforwards and losses deferred due to wash sales.
As of period end, the cost and unrealized appreciation (depreciation) in securities, and derivatives if applicable, for federal income tax purposes were as follows:
| Gross unrealized appreciation | $153,369,416 |
| Gross unrealized depreciation | (9,027,925) |
| Net unrealized appreciation (depreciation) | $144,341,491 |
| Tax Cost | $628,962,449 |
The tax-based components of distributable earnings as of period end were as follows:
| Undistributed ordinary income | $3,566,153 |
| Capital loss carryforward | $(14,493,932) |
| Net unrealized appreciation (depreciation) on securities and other investments | $144,379,925 |
Capital loss carryforwards are only available to offset future capital gains of the Fund to the extent provided by regulations and may be limited. The capital loss carryforward information presented below, including any applicable limitation, is estimated as of fiscal period end and is subject to adjustment.
| No expiration | |
| Short-term | $(14,493,932) |
The tax character of distributions paid was as follows:
| | October 31, 2020 | October 31, 2019 |
| Ordinary Income | $5,098,696 | $ 2,841,028 |
Restricted Securities (including Private Placements). The Fund may invest in securities that are subject to legal or contractual restrictions on resale. These securities generally may be resold in transactions exempt from registration or to the public if the securities are registered. Disposal of these securities may involve time-consuming negotiations and expense, and prompt sale at an acceptable price may be difficult. Information regarding restricted securities is included at the end of the Fund's Schedule of Investments.
4. Purchases and Sales of Investments.
Purchases and sales of securities, other than short-term securities, are noted in the table below.
| | Purchases ($) | Sales ($) |
| Fidelity International Capital Appreciation K6 Fund | 1,050,339,350 | 879,612,138 |
Prior Fiscal Year Unaffiliated Exchanges In-Kind. During the prior period, the Fund received investments and cash valued at $9,668,871 in exchange for 873,449 shares of the Fund. The amount of in-kind exchanges is included in share transactions in the accompanying Statement of Changes in Net Assets.
5. Fees and Other Transactions with Affiliates.
Management Fee. Fidelity Management & Research Company LLC (the investment adviser) and its affiliates provide the Fund with investment management related services for which the Fund pays a monthly management fee that is based on an annual rate of .65% of average net assets. Under the management contract, the investment adviser or an affiliate pays all other expenses of the Fund, excluding fees and expenses of the independent Trustees, and certain miscellaneous expenses such as proxy and shareholder meeting expenses.
Brokerage Commissions. A portion of portfolio transactions were placed with brokerage firms which are affiliates of the investment adviser. Brokerage commissions are included in net realized gain (loss) and change in net unrealized appreciation (depreciation) in the Statement of Operations. The commissions paid to these affiliated firms were as follows:
| | Amount |
| Fidelity International Capital Appreciation K6 Fund | $4,589 |
Interfund Lending Program. Pursuant to an Exemptive Order issued by the SEC, the Fund, along with other registered investment companies having management contracts with Fidelity Management & Research Company LLC (FMR), or other affiliated entities of FMR, may participate in an interfund lending program. This program provides an alternative credit facility allowing the Fund to borrow from, or lend money to, other participating affiliated funds. At period end, there were no interfund loans outstanding. Activity in this program during the period for which loans were outstanding was as follows:
| | Borrower or Lender | Average Loan Balance | Weighted Average Interest Rate | Interest Expense |
| Fidelity International Capital Appreciation K6 Fund | Borrower | $4,249,500 | .53% | $378 |
Interfund Trades. Funds may purchase from or sell securities to other Fidelity Funds under procedures adopted by the Board. The procedures have been designed to ensure these interfund trades are executed in accordance with Rule 17a-7 of the 1940 Act. Interfund trades are included within the respective purchases and sales amounts shown in the Purchases and Sales of Investments note.
6. Committed Line of Credit.
Certain Funds participate with other funds managed by the investment adviser or an affiliate in a $4.25 billion credit facility (the "line of credit") to be utilized for temporary or emergency purposes to fund shareholder redemptions or for other short-term liquidity purposes. The participating funds have agreed to pay commitment fees on their pro-rata portion of the line of credit, which are reflected in Miscellaneous expenses on the Statement of Operations, and are as follows:
| | Amount |
| Fidelity International Capital Appreciation K6 Fund | $1,462 |
During the period, there were no borrowings on this line of credit.
7. Security Lending.
Funds lend portfolio securities from time to time in order to earn additional income. Lending agents are used, including National Financial Services (NFS), an affiliate of the investment adviser. Pursuant to a securities lending agreement, NFS will receive a fee, which is capped at 9.9% of a fund's daily lending revenue, for its services as lending agent. A fund may lend securities to certain qualified borrowers, including NFS. On the settlement date of the loan, a fund receives collateral (in the form of U.S. Treasury obligations, letters of credit and/or cash) against the loaned securities and maintains collateral in an amount not less than 100% of the market value of the loaned securities during the period of the loan. The market value of the loaned securities is determined at the close of business of a fund and any additional required collateral is delivered to a fund on the next business day. A fund or borrower may terminate the loan at any time, and if the borrower defaults on its obligation to return the securities loaned because of insolvency or other reasons, a fund may apply collateral received from the borrower against the obligation. A fund may experience delays and costs in recovering the securities loaned. Any cash collateral received is invested in the Fidelity Securities Lending Cash Central Fund. Any loaned securities are identified as such in the Schedule of Investments, and the value of loaned securities and cash collateral at period end, as applicable, are presented in the Statement of Assets and Liabilities. Security lending income represents the income earned on investing cash collateral, less rebates paid to borrowers and any lending agent fees associated with the loan, plus any premium payments received for lending certain types of securities. Security lending income is presented in the Statement of Operations as a component of income from Fidelity Central Funds. Affiliated security lending activity, if any, was as follows:
| | Total Security Lending Income Fees Paid to NFS | Security Lending Income From Securities Loaned to NFS | Value of Securities Loaned to NFS at Period End |
| Fidelity International Capital Appreciation K6 Fund | $28 | $– | $– |
8. Expense Reductions.
Commissions paid to certain brokers with whom the investment adviser, or its affiliates, places trades on behalf of the Fund include an amount in addition to trade execution, which may be rebated back to the Fund to offset certain expenses. This amount totaled $249,024 for the period. In addition, through arrangements with the Fund's custodian, credits realized as a result of certain uninvested cash balances were used to reduce the Fund's expenses by $14.
9. Other.
The Fund's organizational documents provide former and current trustees and officers with a limited indemnification against liabilities arising in connection with the performance of their duties to the Fund. In the normal course of business, the Fund may also enter into contracts that provide general indemnifications. The Fund's maximum exposure under these arrangements is unknown as this would be dependent on future claims that may be made against the Fund. The risk of material loss from such claims is considered remote.
10. Coronavirus (COVID-19) Pandemic.
An outbreak of COVID-19 first detected in China during December 2019 has since spread globally and was declared a pandemic by the World Health Organization during March 2020. Developments that disrupt global economies and financial markets, such as the COVID-19 pandemic, may magnify factors that affect the Fund's performance.
Report of Independent Registered Public Accounting Firm
To the Board of Trustees of Fidelity Investment Trust and Shareholders of Fidelity International Capital Appreciation K6 Fund:
Opinion on the Financial Statements and Financial Highlights
We have audited the accompanying statement of assets and liabilities of Fidelity International Capital Appreciation K6 Fund (the "Fund"), a fund of Fidelity Investment Trust, including the schedule of investments, as of October 31, 2020, the related statement of operations for the year then ended, the statement of changes in net assets for each of the two years in the period then ended, the financial highlights for each of the three years in the period then ended and for the period from May 25, 2017 (commencement of operations) through October 31 2017, and the related notes. In our opinion, the financial statements and financial highlights present fairly, in all material respects, the financial position of the Fund as of October 31, 2020, and the results of its operations for the year then ended, the changes in its net assets for each of the two years in the period then ended, and the financial highlights for each of the three years in the period then ended and for the period from May 25, 2017 (commencement of operations) through October 31 2017 in conformity with accounting principles generally accepted in the United States of America.
Basis for Opinion
These financial statements and financial highlights are the responsibility of the Fund's management. Our responsibility is to express an opinion on the Fund's financial statements and financial highlights based on our audits. We are a public accounting firm registered with the Public Company Accounting Oversight Board (United States) (PCAOB) and are required to be independent with respect to the Fund in accordance with the U.S. federal securities laws and the applicable rules and regulations of the Securities and Exchange Commission and the PCAOB.
We conducted our audits in accordance with the standards of the PCAOB. Those standards require that we plan and perform the audit to obtain reasonable assurance about whether the financial statements and financial highlights are free of material misstatement, whether due to error or fraud. The Fund is not required to have, nor were we engaged to perform, an audit of its internal control over financial reporting. As part of our audits we are required to obtain an understanding of internal control over financial reporting but not for the purpose of expressing an opinion on the effectiveness of the Fund’s internal control over financial reporting. Accordingly, we express no such opinion.
Our audits included performing procedures to assess the risks of material misstatement of the financial statements and financial highlights, whether due to error or fraud, and performing procedures that respond to those risks. Such procedures included examining, on a test basis, evidence regarding the amounts and disclosures in the financial statements and financial highlights. Our audits also included evaluating the accounting principles used and significant estimates made by management, as well as evaluating the overall presentation of the financial statements and financial highlights. Our procedures included confirmation of securities owned as of October 31, 2020, by correspondence with the custodian and brokers; when replies were not received from brokers, we performed other auditing procedures. We believe that our audits provide a reasonable basis for our opinion.
/s/ Deloitte & Touche LLP
Boston, Massachusetts
December 14, 2020
We have served as the auditor of one or more of the Fidelity investment companies since 1999.
Trustees and Officers
The Trustees, Members of the Advisory Board (if any), and officers of the trust and fund, as applicable, are listed below. The Board of Trustees governs the fund and is responsible for protecting the interests of shareholders. The Trustees are experienced executives who meet periodically throughout the year to oversee the fund's activities, review contractual arrangements with companies that provide services to the fund, oversee management of the risks associated with such activities and contractual arrangements, and review the fund's performance. Except for Jonathan Chiel, each of the Trustees oversees 305 funds. Mr. Chiel oversees 176 funds.
The Trustees hold office without limit in time except that (a) any Trustee may resign; (b) any Trustee may be removed by written instrument, signed by at least two-thirds of the number of Trustees prior to such removal; (c) any Trustee who requests to be retired or who has become incapacitated by illness or injury may be retired by written instrument signed by a majority of the other Trustees; and (d) any Trustee may be removed at any special meeting of shareholders by a two-thirds vote of the outstanding voting securities of the trust. Each Trustee who is not an interested person (as defined in the 1940 Act) of the trust and the fund is referred to herein as an Independent Trustee. Each Independent Trustee shall retire not later than the last day of the calendar year in which his or her 75th birthday occurs. The Independent Trustees may waive this mandatory retirement age policy with respect to individual Trustees. Officers and Advisory Board Members hold office without limit in time, except that any officer or Advisory Board Member may resign or may be removed by a vote of a majority of the Trustees at any regular meeting or any special meeting of the Trustees. Except as indicated, each individual has held the office shown or other offices in the same company for the past five years.
The fund’s Statement of Additional Information (SAI) includes more information about the Trustees. To request a free copy, call Fidelity at 1-800-835-5092.
Experience, Skills, Attributes, and Qualifications of the Trustees. The Governance and Nominating Committee has adopted a statement of policy that describes the experience, qualifications, attributes, and skills that are necessary and desirable for potential Independent Trustee candidates (Statement of Policy). The Board believes that each Trustee satisfied at the time he or she was initially elected or appointed a Trustee, and continues to satisfy, the standards contemplated by the Statement of Policy. The Governance and Nominating Committee also engages professional search firms to help identify potential Independent Trustee candidates who have the experience, qualifications, attributes, and skills consistent with the Statement of Policy. From time to time, additional criteria based on the composition and skills of the current Independent Trustees, as well as experience or skills that may be appropriate in light of future changes to board composition, business conditions, and regulatory or other developments, have also been considered by the professional search firms and the Governance and Nominating Committee. In addition, the Board takes into account the Trustees' commitment and participation in Board and committee meetings, as well as their leadership of standing and ad hoc committees throughout their tenure.
In determining that a particular Trustee was and continues to be qualified to serve as a Trustee, the Board has considered a variety of criteria, none of which, in isolation, was controlling. The Board believes that, collectively, the Trustees have balanced and diverse experience, qualifications, attributes, and skills, which allow the Board to operate effectively in governing the fund and protecting the interests of shareholders. Information about the specific experience, skills, attributes, and qualifications of each Trustee, which in each case led to the Board's conclusion that the Trustee should serve (or continue to serve) as a trustee of the fund, is provided below.
Board Structure and Oversight Function. Robert A. Lawrence is an interested person and currently serves as Acting Chairman. The Trustees have determined that an interested Chairman is appropriate and benefits shareholders because an interested Chairman has a personal and professional stake in the quality and continuity of services provided to the fund. Independent Trustees exercise their informed business judgment to appoint an individual of their choosing to serve as Chairman, regardless of whether the Trustee happens to be independent or a member of management. The Independent Trustees have determined that they can act independently and effectively without having an Independent Trustee serve as Chairman and that a key structural component for assuring that they are in a position to do so is for the Independent Trustees to constitute a substantial majority for the Board. The Independent Trustees also regularly meet in executive session. Ned C. Lautenbach and David M. Thomas serve as Co-Lead Independent Trustees and as such each (i) acts as a liaison between the Independent Trustees and management with respect to matters important to the Independent Trustees and (ii) with management prepares agendas for Board meetings.
Fidelity® funds are overseen by different Boards of Trustees. The fund's Board oversees Fidelity's high income and certain equity funds, and other Boards oversee Fidelity's investment-grade bond, money market, asset allocation, and other equity funds. The asset allocation funds may invest in Fidelity® funds overseen by the fund's Board. The use of separate Boards, each with its own committee structure, allows the Trustees of each group of Fidelity® funds to focus on the unique issues of the funds they oversee, including common research, investment, and operational issues. On occasion, the separate Boards establish joint committees to address issues of overlapping consequences for the Fidelity® funds overseen by each Board.
The Trustees operate using a system of committees to facilitate the timely and efficient consideration of all matters of importance to the Trustees, the fund, and fund shareholders and to facilitate compliance with legal and regulatory requirements and oversight of the fund's activities and associated risks. The Board, acting through its committees, has charged FMR and its affiliates with (i) identifying events or circumstances the occurrence of which could have demonstrably adverse effects on the fund's business and/or reputation; (ii) implementing processes and controls to lessen the possibility that such events or circumstances occur or to mitigate the effects of such events or circumstances if they do occur; and (iii) creating and maintaining a system designed to evaluate continuously business and market conditions in order to facilitate the identification and implementation processes described in (i) and (ii) above. Because the day-to-day operations and activities of the fund are carried out by or through FMR, its affiliates, and other service providers, the fund's exposure to risks is mitigated but not eliminated by the processes overseen by the Trustees. While each of the Board's committees has responsibility for overseeing different aspects of the fund's activities, oversight is exercised primarily through the Operations, Audit, and Compliance Committees. Appropriate personnel, including but not limited to the fund's Chief Compliance Officer (CCO), FMR's internal auditor, the independent accountants, the fund's Treasurer and portfolio management personnel, make periodic reports to the Board's committees, as appropriate, including an annual review of Fidelity's risk management program for the Fidelity® funds. The responsibilities of each standing committee, including their oversight responsibilities, are described further under "Standing Committees of the Trustees."
Interested Trustees*:
Correspondence intended for a Trustee who is an interested person may be sent to Fidelity Investments, 245 Summer Street, Boston, Massachusetts 02210.
Name, Year of Birth; Principal Occupations and Other Relevant Experience+
Jonathan Chiel (1957)
Year of Election or Appointment: 2016
Trustee
Mr. Chiel also serves as Trustee of other Fidelity® funds. Mr. Chiel is Executive Vice President and General Counsel for FMR LLC (diversified financial services company, 2012-present). Previously, Mr. Chiel served as general counsel (2004-2012) and senior vice president and deputy general counsel (2000-2004) for John Hancock Financial Services; a partner with Choate, Hall & Stewart (1996-2000) (law firm); and an Assistant United States Attorney for the United States Attorney’s Office of the District of Massachusetts (1986-95), including Chief of the Criminal Division (1993-1995). Mr. Chiel is a director on the boards of the Boston Bar Foundation and the Maimonides School.
Robert A. Lawrence (1952)
Year of Election or Appointment: 2020
Trustee
Acting Chairman of the Board of Trustees
Mr. Lawrence also serves as Trustee of other funds. Previously, Mr. Lawrence served as a Member of the Advisory Board of certain funds. Prior to his retirement in 2008, Mr. Lawrence served as Vice President of certain Fidelity® funds (2006-2008), Senior Vice President, Head of High Income Division of Fidelity Management & Research Company (investment adviser firm, 2006-2008), and President of Fidelity Strategic Investments (investment adviser firm, 2002-2005).
* Determined to be an “Interested Trustee” by virtue of, among other things, his or her affiliation with the trust or various entities under common control with FMR.
+ The information includes the Trustee's principal occupation during the last five years and other information relating to the experience, attributes, and skills relevant to the Trustee's qualifications to serve as a Trustee, which led to the conclusion that the Trustee should serve as a Trustee for the fund.
Independent Trustees:
Correspondence intended for an Independent Trustee may be sent to Fidelity Investments, P.O. Box 55235, Boston, Massachusetts 02205-5235.
Name, Year of Birth; Principal Occupations and Other Relevant Experience+
Dennis J. Dirks (1948)
Year of Election or Appointment: 2005
Trustee
Mr. Dirks also serves as Trustee of other Fidelity® funds. Prior to his retirement in May 2003, Mr. Dirks served as Chief Operating Officer and as a member of the Board of The Depository Trust & Clearing Corporation (financial markets infrastructure), President, Chief Operating Officer and a member of the Board of The Depository Trust Company (DTC), President and a member of the Board of the National Securities Clearing Corporation (NSCC), Chief Executive Officer and a member of the Board of the Government Securities Clearing Corporation and Chief Executive Officer and a member of the Board of the Mortgage-Backed Securities Clearing Corporation. Mr. Dirks currently serves as a member of the Finance Committee (2016-present) and Board (2017-present) and is Treasurer (2018-present) of the Asolo Repertory Theatre.
Donald F. Donahue (1950)
Year of Election or Appointment: 2018
Trustee
Mr. Donahue also serves as Trustee of other Fidelity® funds. Mr. Donahue serves as President and Chief Executive Officer of Miranda Partners, LLC (risk consulting for the financial services industry, 2012-present). Previously, Mr. Donahue served as Chief Executive Officer (2006-2012), Chief Operating Officer (2003-2006) and Managing Director, Customer Marketing and Development (1999-2003) of The Depository Trust & Clearing Corporation (financial markets infrastructure). Mr. Donahue currently serves as a member (2007-present) and Co-Chairman (2016-present) of the Board of United Way of New York, a member of the Board of NYC Leadership Academy (2012-present) and a member of the Board of Advisors of Ripple Labs, Inc. (financial services, 2015-present). Mr. Donahue previously served as a member of the Advisory Board of certain Fidelity® funds (2015-2018).
Vicki L. Fuller (1957)
Year of Election or Appointment: 2020
Trustee
Ms. Fuller also serves as Trustee of other Fidelity® funds. Previously, Ms. Fuller served as a member of the Advisory Board of certain Fidelity® funds (2018-2020), Chief Investment Officer of the New York State Common Retirement Fund (2012-2018) and held a variety of positions at AllianceBernstein L.P. (global asset management, 1985-2012), including Managing Director (2006-2012) and Senior Vice President and Senior Portfolio Manager (2001-2006). Ms. Fuller currently serves as a member of the Board, Audit Committee and Nominating and Governance Committee of The Williams Companies, Inc. (natural gas infrastructure, 2018-present), as a member of the Board, Audit Committee and Nominating and Governance Committee of two Blackstone business development companies (2020-present) and as a member of the Board of Treliant, LLC (consulting, 2019-present).
Patricia L. Kampling (1959)
Year of Election or Appointment: 2020
Trustee
Ms. Kampling also serves as Trustee of other Fidelity® funds. Prior to her retirement, Ms. Kampling served as Chairman of the Board and Chief Executive Officer (2012-2019), President and Chief Operating Officer (2011-2012) and Executive Vice President and Chief Financial Officer (2010-2011) of Alliant Energy Corporation. Ms. Kampling currently serves as a member of the Board, Compensation Committee and Executive Committee and as Chair of the Audit Committee of Briggs & Stratton Corporation (manufacturing, 2011-present) and as a member of the Board, Audit, Finance and Risk Committee and Safety, Environmental, Technology and Operations Committee of American Water Works Company, Inc. (utilities company, 2019-present). In addition, Ms. Kampling currently serves as a member of the Board of the Nature Conservancy, Wisconsin Chapter (2019-present). Previously, Ms. Kampling served as a Member of the Advisory Board of certain Fidelity® funds (2020), a member of the Board of Interstate Power and Light Company (2012-2019) and Wisconsin Power and Light Company (2012-2019) (each a subsidiary of Alliant Energy Corporation) and as a member of the Board and Workforce Development Committee of the Business Roundtable (2018-2019).
Alan J. Lacy (1953)
Year of Election or Appointment: 2008
Trustee
Mr. Lacy also serves as Trustee of other Fidelity® funds. Previously, Mr. Lacy served as Senior Adviser (2007-2014) of Oak Hill Capital Partners, L.P. (private equity), Chief Executive Officer (2005) and Vice Chairman (2005-2006) of Sears Holdings Corporation (retail), Chief Executive Officer and Chairman of the Board of Sears, Roebuck and Co. (retail, 2000-2005), Chairman (2014-2017) and a member of the Board (2010-2017) of Dave & Buster’s Entertainment, Inc. (restaurant and entertainment complexes) and a member of the Board of Bristol-Myers Squibb Company (global pharmaceuticals, 2008-2020). Mr. Lacy currently serves as a Trustee of the California Chapter of The Nature Conservancy (2015-present) and a member of the Board of the Center for Advanced Study in the Behavioral Sciences at Stanford University (2015-present).
Ned C. Lautenbach (1944)
Year of Election or Appointment: 2000
Trustee
Co-Lead Independent Trustee
Mr. Lautenbach also serves as Trustee of other Fidelity® funds. Mr. Lautenbach currently serves as Chair of the Board of Governors, State University System of Florida (2013-present) and is a member of the Council on Foreign Relations (1994-present). He is also a member and has in the past served as Chairman of the Board of Directors of Artis-Naples (2012-present). Previously, Mr. Lautenbach served as a member and then Lead Director of the Board of Directors of Eaton Corporation (diversified industrial, 1997-2016). He was also a Partner at Clayton, Dubilier & Rice, LLC (private equity investment, 1998-2010); as well as Director of Sony Corporation (2006-2007). In addition, Mr. Lautenbach had a 30-year career with IBM (technology company), during which time he served as Senior Vice President and as a member of the Corporate Executive Committee (1968-1998).
Joseph Mauriello (1944)
Year of Election or Appointment: 2008
Trustee
Mr. Mauriello also serves as Trustee of other Fidelity® funds. Prior to his retirement in January 2006, Mr. Mauriello served in numerous senior management positions including Deputy Chairman and Chief Operating Officer (2004-2005), and Vice Chairman of Financial Services (2002-2004) of KPMG LLP US (professional services, 1965-2005). Mr. Mauriello currently serves as a member of the Independent Directors Council Governing Council (2015-present). Previously, Mr. Mauriello served as a member of the Board of XL Group plc. (global insurance and re-insurance, 2006-2018).
Cornelia M. Small (1944)
Year of Election or Appointment: 2005
Trustee
Ms. Small also serves as Trustee of other Fidelity® funds. Previously, Ms. Small served as Chief Investment Officer, Director of Global Equity Investments and a member of Scudder, Stevens & Clark and Scudder Kemper Investments. Ms. Small previously served as a member of the Board (2009-2019) and Chair of the Investment Committee (2010-2019) of the Teagle Foundation and a member of the Investment Committee of the Berkshire Taconic Community Foundation (2008-2019).
Garnett A. Smith (1947)
Year of Election or Appointment: 2018
Trustee
Mr. Smith also serves as Trustee of other Fidelity® funds. Prior to his retirement, Mr. Smith served as Chairman and Chief Executive Officer (1990-1997) and President (1986-1990) of Inbrand Corp. (manufacturer of personal absorbent products). Prior to his employment with Inbrand Corp., he was employed by a retail fabric chain and North Carolina National Bank (now Bank of America). Mr. Smith previously served as a member of the Advisory Board of certain Fidelity® funds (2012-2013).
David M. Thomas (1949)
Year of Election or Appointment: 2008
Trustee
Co-Lead Independent Trustee
Mr. Thomas also serves as Trustee of other Fidelity® funds. Previously, Mr. Thomas served as Executive Chairman (2005-2006) and Chairman and Chief Executive Officer (2000-2005) of IMS Health, Inc. (pharmaceutical and healthcare information solutions). Mr. Thomas currently serves as Non-Executive Chairman of the Board of Fortune Brands Home and Security (home and security products, 2011-present), and a member of the Board (2004-present) and Presiding Director (2013-present) of Interpublic Group of Companies, Inc. (marketing communication).
Susan Tomasky (1953)
Year of Election or Appointment: 2020
Trustee
Ms. Tomasky also serves as Trustee of other Fidelity® funds. Prior to her retirement, Ms. Tomasky served in various executive officer positions at American Electric Power Company, Inc. (1998-2011), including most recently as President of AEP Transmission (2007-2011). Ms. Tomasky currently serves as a member of the Board and Sustainability Committee and as Chair of the Audit Committee of Marathon Petroleum Corporation (2018-present) and as a member of the Board, Corporate Governance Committee and Organization and Compensation Committee and as Chair of the Audit Committee of Public Service Enterprise Group, Inc. (utilities company, 2012-present). In addition, Ms. Tomasky currently serves as a member of the Board of the Columbus Regional Airport Authority (2007-present), as a member of the Board of the Royal Shakespeare Company – America (2009-present), as a member of the Board of the Columbus Association for the Performing Arts (2011-present) and as a member of the Board of Kenyon College (2016-present). Previously, Ms. Tomasky served as a Member of the Advisory Board of certain Fidelity® funds (2020), a member of the Board (2011-2019) and as Lead Independent Director (2015-2018) of Andeavor Corporation (previously Tesoro Corporation) (independent oil refiner and marketer) and as a member of the Board of Summit Midstream Partners LP (energy, 2012-2018).
Michael E. Wiley (1950)
Year of Election or Appointment: 2020
Trustee
Mr. Wiley also serves as Trustee of other Fidelity® funds. Previously, Mr. Wiley served as a member of the Advisory Board of certain Fidelity® funds (2018-2020), Chairman, President and CEO of Baker Hughes, Inc. (oilfield services, 2000-2004). Mr. Wiley also previously served as a member of the Board of Andeavor Corporation (independent oil refiner and marketer, 2005-2018), a member of the Board of Andeavor Logistics LP (natural resources logistics, 2015-2018) and a member of the Board of High Point Resources (exploration and production, 2005-2020).
+ The information includes the Trustee's principal occupation during the last five years and other information relating to the experience, attributes, and skills relevant to the Trustee's qualifications to serve as a Trustee, which led to the conclusion that the Trustee should serve as a Trustee for the fund.
Advisory Board Members and Officers:
Correspondence intended for a Member of the Advisory Board (if any) may be sent to Fidelity Investments, P.O. Box 55235, Boston, Massachusetts 02205-5235. Correspondence intended for an officer or Peter S. Lynch may be sent to Fidelity Investments, 245 Summer Street, Boston, Massachusetts 02210. Officers appear below in alphabetical order.
Name, Year of Birth; Principal Occupation
Lloyd James Austin, III (1953)
Year of Election or Appointment: 2020
Member of the Advisory Board
General Austin also serves as a Member of the Advisory Board of other Fidelity® funds. Prior to his retirement, General Austin (United States Army, Retired) held a variety of positions within the U.S. Government, including Commander, U.S. Central Command (2013-2016), Vice Chief of Staff, U.S. Army (2012-2013) and Commanding General, U.S. Forces – Iraq, Operation New Dawn (2010-2012). General Austin currently serves as a Partner of Pine Island Capital Partners (private equity, 2020-present) and as President of the Austin Strategy Group LLC (consulting, 2016-present). General Austin serves as a member of the Board of Directors of Nucor Corporation (steel products, 2017-present), as a member of the Board of Directors of Tenet Healthcare Corporation (2018-present) and as a member of the Board of Directors of Raytheon Technologies Corporation (aerospace and defense, 2020-present). In addition, General Austin currently serves as a member of the Board of Trustees of the Carnegie Corporation of New York (2017-present) and as a member of the Board of Trustees of Auburn University (2017-present). Previously, General Austin served as a member of the Board of Directors of United Technologies Corporation (aerospace, defense and building, 2016-2020).
Thomas A. Kennedy (1955)
Year of Election or Appointment: 2020
Member of the Advisory Board
Mr. Kennedy also serves as a Member of the Advisory Board of other Fidelity® funds. Previously, Mr. Kennedy held a variety of positions at Raytheon Company (aerospace and defense, 1983-2020), including Chairman and Chief Executive Officer (2014-2020) and Executive Vice President and Chief Operating Officer (2013-2014). Mr. Kennedy currently serves as Executive Chairman of the Board of Directors of Raytheon Technologies Corporation (aerospace and defense, 2020-present). He is also a member of the Rutgers School of Engineering Industry Advisory Board (2011-present) and a member of the UCLA Engineering Dean’s Executive Board (2016-present).
Peter S. Lynch (1944)
Year of Election or Appointment: 2003
Member of the Advisory Board
Mr. Lynch also serves as a Member of the Advisory Board of other Fidelity® funds. Mr. Lynch is Vice Chairman and a Director of Fidelity Management & Research Company LLC (investment adviser firm). In addition, Mr. Lynch serves as a Trustee of Boston College and as the Chairman of the Inner-City Scholarship Fund. Previously, Mr. Lynch served as Vice Chairman and a Director of FMR Co., Inc. (investment adviser firm) and on the Special Olympics International Board of Directors (1997-2006).
Elizabeth Paige Baumann (1968)
Year of Election or Appointment: 2017
Anti-Money Laundering (AML) Officer
Ms. Baumann also serves as AML Officer of other funds. She is Chief AML Officer (2012-present) and Senior Vice President (2014-present) of FMR LLC (diversified financial services company) and is an employee of Fidelity Investments. Previously, Ms. Baumann served as AML Officer of certain funds (2017-2019), as AML Officer of the funds (2012-2016), and Vice President (2007-2014) and Deputy Anti-Money Laundering Officer (2007-2012) of FMR LLC.
Craig S. Brown (1977)
Year of Election or Appointment: 2019
Assistant Treasurer
Mr. Brown also serves as Assistant Treasurer of other funds. Mr. Brown is an employee of Fidelity Investments (2013-present).
John J. Burke III (1964)
Year of Election or Appointment: 2018
Chief Financial Officer
Mr. Burke also serves as Chief Financial Officer of other funds. Mr. Burke serves as Head of Investment Operations for Fidelity Fund and Investment Operations (2018-present) and is an employee of Fidelity Investments (1998-present). Previously Mr. Burke served as head of Asset Management Investment Operations (2012-2018).
William C. Coffey (1969)
Year of Election or Appointment: 2019
Assistant Secretary
Mr. Coffey also serves as Assistant Secretary of other funds. He is Senior Vice President and Deputy General Counsel of FMR LLC (diversified financial services company, 2010-present), and is an employee of Fidelity Investments. Previously, Mr. Coffey served as Secretary and CLO of certain funds (2018-2019); CLO, Secretary, and Senior Vice President of Fidelity Management & Research Company and FMR Co., Inc. (investment adviser firms, 2018-2019); Secretary of Fidelity SelectCo, LLC and Fidelity Investments Money Management, Inc. (investment adviser firms, 2018-2019); CLO of Fidelity Management & Research (Hong Kong) Limited, FMR Investment Management (UK) Limited, and Fidelity Management & Research (Japan) Limited (investment adviser firms, 2018-2019); and Assistant Secretary of certain funds (2009-2018).
Timothy M. Cohen (1969)
Year of Election or Appointment: 2018
Vice President
Mr. Cohen also serves as Vice President of other funds. Mr. Cohen serves as Co-Head of Equity (2018-present), a Director of Fidelity Management & Research (Japan) Limited (investment adviser firm, 2016-present), and is an employee of Fidelity Investments. Previously, Mr. Cohen served as Executive Vice President of Fidelity SelectCo, LLC (2019), Head of Global Equity Research (2016-2018), Chief Investment Officer - Equity and a Director of Fidelity Management & Research (U.K.) Inc. (investment adviser firm, 2013-2015) and as a Director of Fidelity Management & Research (Hong Kong) Limited (investment adviser firm, 2017).
Jonathan Davis (1968)
Year of Election or Appointment: 2010
Assistant Treasurer
Mr. Davis also serves as Assistant Treasurer of other funds. Mr. Davis serves as Assistant Treasurer of FMR Capital, Inc. (2017-present) and is an employee of Fidelity Investments. Previously, Mr. Davis served as Vice President and Associate General Counsel of FMR LLC (diversified financial services company, 2003-2010).
Laura M. Del Prato (1964)
Year of Election or Appointment: 2018
Assistant Treasurer
Ms. Del Prato also serves as an officer of other funds. Ms. Del Prato is an employee of Fidelity Investments (2017-present). Previously, Ms. Del Prato served as President and Treasurer of The North Carolina Capital Management Trust: Cash Portfolio and Term Portfolio (2018-2020). Prior to joining Fidelity Investments, Ms. Del Prato served as a Managing Director and Treasurer of the JPMorgan Mutual Funds (2014-2017). Prior to JPMorgan, Ms. Del Prato served as a partner at Cohen Fund Audit Services (accounting firm, 2012-2013) and KPMG LLP (accounting firm, 2004-2012).
Colm A. Hogan (1973)
Year of Election or Appointment: 2020
Assistant Treasurer
Mr. Hogan also serves as an officer of other funds. Mr. Hogan serves as Assistant Treasurer of FMR Capital, Inc. (2017-present) and is an employee of Fidelity Investments (2005-present). Previously, Mr. Hogan served as Deputy Treasurer of certain Fidelity® funds (2016-2020) and Assistant Treasurer of certain Fidelity® funds (2016-2018).
Pamela R. Holding (1964)
Year of Election or Appointment: 2018
Vice President
Ms. Holding also serves as Vice President of other funds. Ms. Holding serves as Co-Head of Equity (2018-present) and is an employee of Fidelity Investments (2013-present). Previously, Ms. Holding served as Executive Vice President of Fidelity SelectCo, LLC (2019) and as Chief Investment Officer of Fidelity Institutional Asset Management (2013-2018).
Cynthia Lo Bessette (1969)
Year of Election or Appointment: 2019
Secretary and Chief Legal Officer (CLO)
Ms. Lo Bessette also serves as an officer of other funds. Ms. Lo Bessette serves as CLO, Secretary, and Senior Vice President of Fidelity Management & Research Company LLC (investment adviser firm, 2019-present); and CLO of Fidelity Management & Research (Hong Kong) Limited, FMR Investment Management (UK) Limited, and Fidelity Management & Research (Japan) Limited (investment adviser firms, 2019-present). She is a Senior Vice President and Deputy General Counsel of FMR LLC (diversified financial services company, 2019-present), and is an employee of Fidelity Investments. Previously, Ms. Lo Bessette served as CLO, Secretary, and Senior Vice President of FMR Co., Inc. (investment adviser firm, 2019); Secretary of Fidelity SelectCo, LLC and Fidelity Investments Money Management, Inc. (investment adviser firms, 2019). Prior to joining Fidelity Investments, Ms. Lo Bessette was Executive Vice President, General Counsel (2016-2019) and Senior Vice President, Deputy General Counsel (2015-2016) of OppenheimerFunds (investment management company) and Deputy Chief Legal Officer (2013-2015) of Jennison Associates LLC (investment adviser firm).
Chris Maher (1972)
Year of Election or Appointment: 2020
Deputy Treasurer
Mr. Maher also serves as an officer of other funds. Mr. Maher serves as Assistant Treasurer of FMR Capital, Inc. (2017-present), and is an employee of Fidelity Investments (2008-present). Previously, Mr. Maher served as Assistant Treasurer of certain funds (2013-2020); Vice President of Asset Management Compliance (2013), Vice President of the Program Management Group of FMR (investment adviser firm, 2010-2013), and Vice President of Valuation Oversight (2008-2010).
Jason P. Pogorelec (1975)
Year of Election or Appointment: 2020
Chief Compliance Officer
Mr. Pogorelec also serves as Chief Compliance Officer of other funds. Mr. Pogorelec is a senior Vice President of Asset Management Compliance for Fidelity Investments and is an employee of Fidelity Investments (2006-present). Previously, Mr. Pogorelec served as Vice President, Associate General Counsel for Fidelity Investments (2010-2020) and Assistant Secretary of certain Fidelity funds (2015-2020).
Stacie M. Smith (1974)
Year of Election or Appointment: 2016
President and Treasurer
Ms. Smith also serves as an officer of other funds. Ms. Smith serves as Assistant Treasurer of FMR Capital, Inc. (2017-present), is an employee of Fidelity Investments (2009-present), and has served in other fund officer roles. Prior to joining Fidelity Investments, Ms. Smith served as Senior Audit Manager of Ernst & Young LLP (accounting firm, 1996-2009). Previously, Ms. Smith served as Assistant Treasurer (2013-2019) and Deputy Treasurer (2013-2016) of certain Fidelity® funds.
Marc L. Spector (1972)
Year of Election or Appointment: 2016
Assistant Treasurer
Mr. Spector also serves as an officer of other funds. Mr. Spector serves as Assistant Treasurer of FMR Capital, Inc. (2017-present) and is an employee of Fidelity Investments (2016-present). Prior to joining Fidelity Investments, Mr. Spector served as Director at the Siegfried Group (accounting firm, 2013-2016), and prior to Siegfried Group as audit senior manager at Deloitte & Touche LLP (accounting firm, 2005-2013).
Jim Wegmann (1979)
Year of Election or Appointment: 2019
Assistant Treasurer
Mr. Wegmann also serves as Assistant Treasurer of other funds. Mr. Wegmann is an employee of Fidelity Investments (2011-present).
Shareholder Expense Example
As a shareholder, you incur two types of costs: (1) transaction costs, which may include sales charges (loads) on purchase payments or redemption proceeds, as applicable and (2) ongoing costs, which generally include management fees, distribution and/or service (12b-1) fees and other Fund expenses. This Example is intended to help you understand your ongoing costs (in dollars) of investing in a fund and to compare these costs with the ongoing costs of investing in other mutual funds.
The Example is based on an investment of $1,000 invested at the beginning of the period and held for the entire period (May 1, 2020 to October 31, 2020).
Actual Expenses
The first line of the accompanying table provides information about actual account values and actual expenses. You may use the information in this line, together with the amount you invested, to estimate the expenses that you paid over the period. Simply divide your account value by $1,000.00 (for example, an $8,600 account value divided by $1,000.00 = 8.6), then multiply the result by the number in the first line for a class/Fund under the heading entitled "Expenses Paid During Period" to estimate the expenses you paid on your account during this period. If any fund is a shareholder of any underlying mutual funds or exchange-traded funds (ETFs) (the Underlying Funds), such fund indirectly bears its proportional share of the expenses of the Underlying Funds in addition to the direct expenses incurred presented in the table. These fees and expenses are not included in the annualized expense ratio used to calculate the expense estimate in the table below.
Hypothetical Example for Comparison Purposes
The second line of the accompanying table provides information about hypothetical account values and hypothetical expenses based on the actual expense ratio and an assumed rate of return of 5% per year before expenses, which is not the actual return. The hypothetical account values and expenses may not be used to estimate the actual ending account balance or expenses you paid for the period. You may use this information to compare the ongoing costs of investing in the Fund and other funds. To do so, compare this 5% hypothetical example with the 5% hypothetical examples that appear in the shareholder reports of the other funds. If any fund is a shareholder of any Underlying Funds, such fund indirectly bears its proportional share of the expenses of the Underlying Funds in addition to the direct expenses as presented in the table. These fees and expenses are not included in the annualized expense ratio used to calculate the expense estimate in the table below.
Please note that the expenses shown in the table are meant to highlight your ongoing costs only and do not reflect any transaction costs. Therefore, the second line of the table is useful in comparing ongoing costs only, and will not help you determine the relative total costs of owning different funds.
| | Annualized Expense Ratio-A | Beginning
Account Value
May 1, 2020 | Ending
Account Value
October 31, 2020 | Expenses Paid
During Period-B
May 1, 2020
to October 31, 2020 |
| Fidelity International Capital Appreciation K6 Fund | .65% | | | |
| Actual | | $1,000.00 | $1,208.10 | $3.61 |
| Hypothetical-C | | $1,000.00 | $1,021.87 | $3.30 |
A Annualized expense ratio reflects expenses net of applicable fee waivers.
B Expenses are equal to the annualized expense ratio, multiplied by the average account value over the period, multiplied by 184/ 366 (to reflect the one-half year period). The fees and expenses of any Underlying Funds are not included in each annualized expense ratio.
C 5% return per year before expenses
Distributions (Unaudited)
The fund designates 8% of the dividends distributed during the fiscal year as qualifying for the dividends–received deduction for corporate shareholders.
The fund designates 100% of the dividends distributed during the fiscal year as amounts which may be taken into account as a dividend for the purposes of the maximum rate under section 1(h)(11) of the Internal Revenue Code.
The amounts per share which represent income derived from sources within, and taxes paid to, foreign countries or possessions of the United States are $0.1252 and $0.0122 for the dividend paid December 16, 2019.
The fund will notify shareholders in January 2021 of amounts for use in preparing 2020 income tax returns.
Proxy Voting Results
A special meeting of shareholders was held on June 9, 2020. The results of votes taken among shareholders on the proposal before them are reported below. Each vote reported represents one dollar of net asset value held on the record date for the meeting.
PROPOSAL 1
To elect a Board of Trustees.
| | # of
Votes | % of
Votes |
| Dennis J. Dirks |
| Affirmative | 91,643,443,973.030 | 98.167 |
| Withheld | 1,711,119,384.419 | 1.833 |
| TOTAL | 93,354,563,357.449 | 100.000 |
| Donald F. Donahue |
| Affirmative | 91,659,003,496.045 | 98.184 |
| Withheld | 1,695,559,852.789 | 1.816 |
| TOTAL | 93,354,563,357.449 | 100.000 |
| Bettina Doulton |
| Affirmative | 91,774,146,516.145 | 98.307 |
| Withheld | 1,580,416,862.377 | 1.693 |
| TOTAL | 93,354,563,357.449 | 100.000 |
| Vicki L. Fuller |
| Affirmative | 91,845,419,368.993 | 98.383 |
| Withheld | 1,509,143,998.591 | 1.617 |
| TOTAL | 93,354,563,357.449 | 100.00 |
| Patricia L. Kampling |
| Affirmative | 91,723,732,274.457 | 98.253 |
| Withheld | 1,630,831,098.411 | 1.747 |
| TOTAL | 93,354,563,357.449 | 100.000 |
| Alan J. Lacy |
| Affirmative | 91,490,319,407.772 | 98.003 |
| Withheld | 1,864,243,948.299 | 1.997 |
| TOTAL | 93,354,563,357.449 | 100.000 |
| Ned C. Lautenbach |
| Affirmative | 91,285,367,239.075 | 97.784 |
| Withheld | 2,069,196,119.052 | 2.216 |
| TOTAL | 93,354,563,357.449 | 100.000 |
| Robert A. Lawrence |
| Affirmative | 91,556,271,429.466 | 98.074 |
| Withheld | 1,798,291,912.707 | 1.926 |
| TOTAL | 93,354,563,357.449 | 100.000 |
| Joseph Mauriello |
| Affirmative | 91,497,480,147.082 | 98.011 |
| Withheld | 1,857,083,211.045 | 1.989 |
| TOTAL | 93,354,563,357.449 | 100.000 |
| Cornelia M. Small |
| Affirmative | 91,606,808,161.438 | 98.128 |
| Withheld | 1,747,755,220.497 | 1.872 |
| TOTAL | 93,354,563,357.449 | 100.000 |
| Garnett A. Smith |
| Affirmative | 91,505,784,053.038 | 98.020 |
| Withheld | 1,848,779,305.090 | 1.980 |
| TOTAL | 93,354,563,357.449 | 100.000 |
| David M. Thomas |
| Affirmative | 91,536,969,704.881 | 98.053 |
| Withheld | 1,817,593,630.919 | 1.947 |
| TOTAL | 93,354,563,357.449 | 100.000 |
| Susan Tomasky |
| Affirmative | 91,697,125,678.165 | 98.225 |
| Withheld | 1,657,437,703.277 | 1.775 |
| TOTAL | 93,354,563,357.449 | 100.000 |
| Michael E. Wiley |
| Affirmative | 91,506,805,575.815 | 98.021 |
| Withheld | 1,847,757,759.985 | 1.979 |
| TOTAL | 93,354,563,357.449 | 100.000 |
|
| Proposal 1 reflects trust wide proposal and voting results. |
IVFK6-ANN-1220
1.9883991.103
Fidelity® Series Canada Fund
Annual Report
October 31, 2020
See the inside front cover for important information about access to your fund’s shareholder reports.
Beginning on January 1, 2021, as permitted by regulations adopted by the Securities and Exchange Commission, paper copies of a fund’s shareholder reports will no longer be sent by mail, unless you specifically request paper copies of the reports from the fund or from your financial intermediary, such as a financial advisor, broker-dealer or bank. Instead, the reports will be made available on a website, and you will be notified by mail each time a report is posted and provided with a website link to access the report.
If you already elected to receive shareholder reports electronically, you will not be affected by this change and you need not take any action. You may elect to receive shareholder reports and other communications from a fund electronically, by contacting your financial intermediary. For Fidelity customers, visit Fidelity's web site or call Fidelity using the contact information listed below.
You may elect to receive all future reports in paper free of charge. If you wish to continue receiving paper copies of your shareholder reports, you may contact your financial intermediary or, if you are a Fidelity customer, visit Fidelity’s website, or call Fidelity at the applicable toll-free number listed below. Your election to receive reports in paper will apply to all funds held with the fund complex/your financial intermediary.
| Account Type | Website | Phone Number |
| Brokerage, Mutual Fund, or Annuity Contracts: | fidelity.com/mailpreferences | 1-800-343-3548 |
| Employer Provided Retirement Accounts: | netbenefits.fidelity.com/preferences (choose 'no' under Required Disclosures to continue to print) | 1-800-343-0860 |
| Advisor Sold Accounts Serviced Through Your Financial Intermediary: | Contact Your Financial Intermediary | Your Financial Intermediary's phone number |
| Advisor Sold Accounts Serviced by Fidelity: | institutional.fidelity.com | 1-877-208-0098 |
Contents
To view a fund's proxy voting guidelines and proxy voting record for the 12-month period ended June 30, visit http://www.fidelity.com/proxyvotingresults or visit the Securities and Exchange Commission's (SEC) web site at http://www.sec.gov.
You may also call 1-800-544-8544 to request a free copy of the proxy voting guidelines.
Standard & Poor's, S&P and S&P 500 are registered service marks of The McGraw-Hill Companies, Inc. and have been licensed for use by Fidelity Distributors Corporation.
Other third-party marks appearing herein are the property of their respective owners.
All other marks appearing herein are registered or unregistered trademarks or service marks of FMR LLC or an affiliated company. © 2020 FMR LLC. All rights reserved.
This report and the financial statements contained herein are submitted for the general information of the shareholders of the Fund. This report is not authorized for distribution to prospective investors in the Fund unless preceded or accompanied by an effective prospectus.
A fund files its complete schedule of portfolio holdings with the SEC for the first and third quarters of each fiscal year on Form N-PORT. Forms N-PORT are available on the SEC’s web site at http://www.sec.gov. A fund's Forms N-PORT may be reviewed and copied at the SEC’s Public Reference Room in Washington, DC. Information regarding the operation of the SEC's Public Reference Room may be obtained by calling 1-800-SEC-0330.
For a complete list of a fund's portfolio holdings, view the most recent holdings listing, semiannual report, or annual report on Fidelity's web site at http://www.fidelity.com, http://www.institutional.fidelity.com, or http://www.401k.com, as applicable.
NOT FDIC INSURED •MAY LOSE VALUE •NO BANK GUARANTEE
Neither the Fund nor Fidelity Distributors Corporation is a bank.
Note to Shareholders:
Early in 2020, the outbreak and spread of a new coronavirus emerged as a public health emergency that had a major influence on financial markets, primarily based on its impact on the global economy and the outlook for corporate earnings. The virus causes a respiratory disease known as COVID-19. On March 11, the World Health Organization declared the COVID-19 outbreak a pandemic, citing sustained risk of further global spread.
In the weeks following, as the crisis worsened, we witnessed an escalating human tragedy with wide-scale social and economic consequences from coronavirus-containment measures. The outbreak of COVID-19 prompted a number of measures to limit the spread, including travel and border restrictions, quarantines, and restrictions on large gatherings. In turn, these resulted in lower consumer activity, diminished demand for a wide range of products and services, disruption in manufacturing and supply chains, and – given the wide variability in outcomes regarding the outbreak – significant market uncertainty and volatility. Amid the turmoil, global governments and central banks took unprecedented action to help support consumers, businesses, and the broader economies, and to limit disruption to financial systems.
The situation continues to unfold, and the extent and duration of its impact on financial markets and the economy remain highly uncertain. Extreme events such as the coronavirus crisis are “exogenous shocks” that can have significant adverse effects on mutual funds and their investments. Although multiple asset classes may be affected by market disruption, the duration and impact may not be the same for all types of assets.
Fidelity is committed to helping you stay informed amid news about COVID-19 and during increased market volatility, and we’re taking extra steps to be responsive to customer needs. We encourage you to visit our websites, where we offer ongoing updates, commentary, and analysis on the markets and our funds.
Performance: The Bottom Line
Average annual total return reflects the change in the value of an investment, assuming reinvestment of distributions from dividend income and capital gains (the profits earned upon the sale of securities that have grown in value, if any) and assuming a constant rate of performance each year. The hypothetical investment and the average annual total returns do not reflect the deduction of taxes that a shareholder would pay on fund distributions or the redemption of fund shares. During periods of reimbursement by Fidelity, a fund’s total return will be greater than it would be had the reimbursement not occurred. How a fund did yesterday is no guarantee of how it will do tomorrow.
Average Annual Total Returns
| For the periods ended October 31, 2020 | Past 1 year | Life of fundA |
| Fidelity® Series Canada Fund | (8.22)% | 1.06% |
A From August 15, 2017
$10,000 Over Life of Fund
Let's say hypothetically that $10,000 was invested in Fidelity® Series Canada Fund on August 15, 2017, when the fund started.
The chart shows how the value of your investment would have changed, and also shows how the MSCI Canada Index performed over the same period.

| Period Ending Values |
| $10,346 | Fidelity® Series Canada Fund |
| $10,553 | MSCI Canada Index |
Management's Discussion of Fund Performance
Market Recap: The MSCI ACWI (All Country World Index) ex USA Index returned -2.46% for the 12 months ending October 31, 2020, in what was a bumpy ride for non-U.S. equities, marked by a steep but brief decline due to the early-2020 outbreak and spread of the coronavirus, followed by a sharp upturn. Declared a pandemic on March 11, the crisis and containment efforts caused broad contraction in economic activity, elevated volatility and dislocation in financial markets. A historically rapid and expansive monetary- and fiscal-policy response around the world provided a partial offset to the economic disruption. Other supporting factors included resilient corporate earnings and near-term potential for a COVID-19 vaccine breakthrough. This was evident in the index’s 12.28% gain in the final six months of the year. Currency fluctuation generally boosted foreign developed-markets equities for the year, while the reverse was true for emerging-markets stocks. Late in the period, the index was pressured by a second wave of COVID-19 cases in some regions, and stretched valuations and crowded positioning in big tech. For the full year, the U.K. (-22%), Asia Pacific ex Japan (-8%), Canada (-5%) and Europe ex U.K. (-4%) notably lagged. Emerging markets (+9%) and Japan (+1%) outperformed. By sector, energy (-38%), financials and real estate (-20% each) lagged, whereas information technology (+ 25%) and communication services (+15%) topped the index.
Comments from Portfolio Manager Ryan Oldham: For the fiscal year ending October 31, 2020, the fund returned -8.22%, trailing the -5.74% result of the benchmark MSCI Canada Index (Net MA). By sector, security selection and underweighting in information technology, primarily within the software & services industry, detracted notably from the fund’s relative result. Stock selection in energy and financials also hurt on a relative basis. Largely avoiding benchmark heavyweight Shopify (+193%), a stake we established late in the period, detracted more than any other individual position. Avoiding benchmark component Barrick Gold (+55%) and maintaining an outsized stake in Suncor Energy (-61%) hurt the relative return as well. We increased the fund’s Suncor position by period end. Conversely, positioning in industrials and health care, as well as an average overweighting in the consumer discretionary sector, contributed on a relative basis. Looking at individual stocks, overweighting Wheaton Precious Metals (+65%) and Canadian Pacific Railway (+33%) added considerable value, and we increased the fund’s stake in each of these holdings by October 31.
The views expressed above reflect those of the portfolio manager(s) only through the end of the period as stated on the cover of this report and do not necessarily represent the views of Fidelity or any other person in the Fidelity organization. Any such views are subject to change at any time based upon market or other conditions and Fidelity disclaims any responsibility to update such views. These views may not be relied on as investment advice and, because investment decisions for a Fidelity fund are based on numerous factors, may not be relied on as an indication of trading intent on behalf of any Fidelity fund.
Investment Summary (Unaudited)
Geographic Diversification (% of fund's net assets)
| As of October 31, 2020 |
| | Canada | 98.8% |
| | United States of America* | 1.2% |

* Includes Short-Term investments and Net Other Assets (Liabilities).
Percentages are based on country or territory of incorporation and are adjusted for the effect of futures contracts, if applicable.
Asset Allocation as of October 31, 2020
| | % of fund's net assets |
| Stocks | 98.6 |
| Bonds | 0.2 |
| Short-Term Investments and Net Other Assets (Liabilities) | 1.2 |
Top Ten Stocks as of October 31, 2020
| | % of fund's net assets |
| The Toronto-Dominion Bank (Banks) | 9.6 |
| Canadian Pacific Railway Ltd. (Road & Rail) | 7.3 |
| Alimentation Couche-Tard, Inc. Class B (sub. vtg.) (Food & Staples Retailing) | 5.2 |
| Royal Bank of Canada (Banks) | 5.1 |
| Wheaton Precious Metals Corp. (Metals & Mining) | 4.7 |
| Bank of Montreal (Banks) | 4.3 |
| Sun Life Financial, Inc. (Insurance) | 4.1 |
| Brookfield Asset Management, Inc. (Canada) Class A (Capital Markets) | 3.9 |
| Enbridge, Inc. (Oil, Gas & Consumable Fuels) | 3.8 |
| Franco-Nevada Corp. (Metals & Mining) | 3.6 |
| | 51.6 |
Top Market Sectors as of October 31, 2020
| | % of fund's net assets |
| Financials | 32.4 |
| Industrials | 13.9 |
| Materials | 13.7 |
| Energy | 11.0 |
| Information Technology | 9.1 |
| Consumer Staples | 7.8 |
| Consumer Discretionary | 5.0 |
| Communication Services | 4.9 |
| Real Estate | 0.5 |
| Health Care | 0.5 |
Market Sectors may include more than one industry category.
The Fund may invest up to 35% of its total assets in any industry that represents more than 20% of the Canadian market. As of October 31, 2020, the Fund did not have more than 25% of its total assets invested in any one industry.
Schedule of Investments October 31, 2020
Showing Percentage of Net Assets
| Common Stocks - 98.6% | | | |
| | | Shares | Value |
| COMMUNICATION SERVICES - 4.7% | | | |
| Diversified Telecommunication Services - 2.6% | | | |
| TELUS Corp. | | 5,826,900 | $99,629,800 |
| Wireless Telecommunication Services - 2.1% | | | |
| Rogers Communications, Inc. Class B (non-vtg.) | | 2,048,000 | 83,192,794 |
|
| TOTAL COMMUNICATION SERVICES | | | 182,822,594 |
|
| CONSUMER DISCRETIONARY - 5.0% | | | |
| Hotels, Restaurants & Leisure - 2.0% | | | |
| Restaurant Brands International, Inc. | | 1,458,600 | 75,792,898 |
| Multiline Retail - 2.2% | | | |
| Dollarama, Inc. | | 2,465,600 | 84,907,099 |
| Specialty Retail - 0.0% | | | |
| Diversified Royalty Corp. | | 612,700 | 813,990 |
| Textiles, Apparel & Luxury Goods - 0.8% | | | |
| Canada Goose Holdings, Inc. (a)(b) | | 436,883 | 13,624,926 |
| Gildan Activewear, Inc. | | 895,300 | 18,547,084 |
| | | | 32,172,010 |
|
| TOTAL CONSUMER DISCRETIONARY | | | 193,685,997 |
|
| CONSUMER STAPLES - 7.8% | | | |
| Beverages - 0.1% | | | |
| Guru Beverages rights (a)(c) | | 1,241,400 | 5,078,158 |
| Food & Staples Retailing - 7.5% | | | |
| Alimentation Couche-Tard, Inc. Class B (sub. vtg.) | | 6,614,100 | 203,690,252 |
| George Weston Ltd. | | 877,100 | 61,508,259 |
| North West Co., Inc. | | 1,170,200 | 28,853,164 |
| | | | 294,051,675 |
| Personal Products - 0.2% | | | |
| Jamieson Wellness, Inc. | | 214,400 | 6,202,039 |
|
| TOTAL CONSUMER STAPLES | | | 305,331,872 |
|
| ENERGY - 11.0% | | | |
| Energy Equipment & Services - 0.2% | | | |
| Computer Modelling Group Ltd. | | 2,492,800 | 8,850,067 |
| Oil, Gas & Consumable Fuels - 10.8% | | | |
| Canadian Natural Resources Ltd. | | 6,973,600 | 110,966,239 |
| Enbridge, Inc. | | 5,363,000 | 147,771,320 |
| Parkland Corp. | | 1,145,600 | 27,980,053 |
| PrairieSky Royalty Ltd. | | 9,720,100 | 59,606,107 |
| Suncor Energy, Inc. | | 6,826,600 | 77,012,533 |
| | | | 423,336,252 |
|
| TOTAL ENERGY | | | 432,186,319 |
|
| FINANCIALS - 32.4% | | | |
| Banks - 21.1% | | | |
| Bank of Montreal (b) | | 2,837,700 | 168,967,005 |
| Bank of Nova Scotia | | 2,003,300 | 83,226,492 |
| Royal Bank of Canada | | 2,840,300 | 198,605,680 |
| The Toronto-Dominion Bank | | 8,474,130 | 373,871,772 |
| | | | 824,670,949 |
| Capital Markets - 3.9% | | | |
| Brookfield Asset Management, Inc. (Canada) Class A | | 5,104,500 | 151,682,921 |
| Insurance - 7.4% | | | |
| Fairfax Financial Holdings Ltd. (sub. vtg.) | | 185,800 | 48,843,798 |
| Intact Financial Corp. | | 765,400 | 79,062,034 |
| Sun Life Financial, Inc. | | 4,070,300 | 161,950,464 |
| | | | 289,856,296 |
|
| TOTAL FINANCIALS | | | 1,266,210,166 |
|
| HEALTH CARE - 0.5% | | | |
| Health Care Providers & Services - 0.5% | | | |
| Andlauer Healthcare Group, Inc. | | 555,700 | 17,768,386 |
| INDUSTRIALS - 13.9% | | | |
| Commercial Services & Supplies - 1.5% | | | |
| GFL Environmental, Inc. | | 3,127,314 | 59,856,785 |
| Professional Services - 2.1% | | | |
| Thomson Reuters Corp. | | 1,071,000 | 83,265,166 |
| Road & Rail - 10.3% | | | |
| Canadian National Railway Co. | | 1,190,200 | 118,233,859 |
| Canadian Pacific Railway Ltd. | | 948,165 | 283,346,403 |
| | | | 401,580,262 |
|
| TOTAL INDUSTRIALS | | | 544,702,213 |
|
| INFORMATION TECHNOLOGY - 9.1% | | | |
| IT Services - 4.6% | | | |
| CGI Group, Inc. Class A (sub. vtg.) (a) | | 1,290,300 | 80,063,875 |
| Shopify, Inc. Class A (a) | | 111,200 | 102,513,830 |
| | | | 182,577,705 |
| Software - 4.5% | | | |
| Absolute Software Corp. | | 434,300 | 4,898,904 |
| Constellation Software, Inc. | | 71,200 | 74,742,632 |
| Dye & Durham Ltd. (a) | | 657,800 | 10,862,118 |
| Dye & Durham Ltd. | | 550,500 | 8,181,265 |
| Open Text Corp. | | 2,075,500 | 76,255,892 |
| | | | 174,940,811 |
|
| TOTAL INFORMATION TECHNOLOGY | | | 357,518,516 |
|
| MATERIALS - 13.7% | | | |
| Chemicals - 2.7% | | | |
| Nutrien Ltd. | | 2,611,978 | 106,180,837 |
| Containers & Packaging - 1.4% | | | |
| CCL Industries, Inc. Class B | | 1,423,100 | 54,262,163 |
| Metals & Mining - 9.5% | | | |
| Agnico Eagle Mines Ltd. (Canada) | | 292,000 | 23,115,845 |
| Franco-Nevada Corp. | | 1,036,666 | 141,295,638 |
| Lundin Mining Corp. | | 3,425,100 | 20,695,080 |
| OceanaGold Corp. (a) | | 3,319,500 | 4,335,307 |
| Wheaton Precious Metals Corp. | | 3,987,700 | 182,997,807 |
| | | | 372,439,677 |
| Paper & Forest Products - 0.1% | | | |
| Western Forest Products, Inc. | | 6,196,300 | 3,999,713 |
|
| TOTAL MATERIALS | | | 536,882,390 |
|
| REAL ESTATE - 0.5% | | | |
| Equity Real Estate Investment Trusts (REITs) - 0.4% | | | |
| Allied Properties (REIT) | | 694,600 | 16,844,949 |
| Real Estate Management & Development - 0.1% | | | |
| Colliers International Group, Inc. | | 46,300 | 3,279,192 |
| Information Services Corp. | | 81,800 | 1,150,591 |
| | | | 4,429,783 |
|
| TOTAL REAL ESTATE | | | 21,274,732 |
|
| TOTAL COMMON STOCKS | | | |
| (Cost $4,052,514,130) | | | 3,858,383,185 |
| | | Principal Amount | Value |
|
| Convertible Bonds - 0.2% | | | |
| COMMUNICATION SERVICES - 0.2% | | | |
| Entertainment - 0.2% | | | |
Cineplex, Inc. 5.75% 9/30/25
(Cost $10,094,179)(d) | CAD | 15,840,000 | 10,114,154 |
| | | Shares | Value |
|
| Money Market Funds - 5.2% | | | |
| Fidelity Cash Central Fund 0.10% (e) | | 15,254,895 | 15,257,946 |
| Fidelity Securities Lending Cash Central Fund 0.11% (e)(f) | | 186,774,478 | 186,793,155 |
| TOTAL MONEY MARKET FUNDS | | | |
| (Cost $202,051,101) | | | 202,051,101 |
| TOTAL INVESTMENT IN SECURITIES - 104.0% | | | |
| (Cost $4,264,659,410) | | | 4,070,548,440 |
| NET OTHER ASSETS (LIABILITIES) - (4.0)% | | | (156,131,736) |
| NET ASSETS - 100% | | | $3,914,416,704 |
Currency Abbreviations
CAD – Canadian dollar
Legend
(a) Non-income producing
(b) Security or a portion of the security is on loan at period end.
(c) Restricted securities (including private placements) - Investment in securities not registered under the Securities Act of 1933 (excluding 144A issues). At the end of the period, the value of restricted securities (excluding 144A issues) amounted to $5,078,158 or 0.1% of net assets.
(d) Security exempt from registration under Rule 144A of the Securities Act of 1933. These securities may be resold in transactions exempt from registration, normally to qualified institutional buyers. At the end of the period, the value of these securities amounted to $10,114,154 or 0.3% of net assets.
(e) Affiliated fund that is generally available only to investment companies and other accounts managed by Fidelity Investments. The rate quoted is the annualized seven-day yield of the fund at period end. A complete unaudited listing of the fund's holdings as of its most recent quarter end is available upon request. In addition, each Fidelity Central Fund's financial statements, which are not covered by the Fund's Report of Independent Registered Public Accounting Firm, are available on the SEC's website or upon request.
(f) Investment made with cash collateral received from securities on loan.
Additional information on each restricted holding is as follows:
| Security | Acquisition Date | Acquisition Cost |
| Guru Beverages rights | 9/25/20 | $5,054,258 |
Affiliated Central Funds
Information regarding fiscal year to date income earned by the Fund from investments in Fidelity Central Funds is as follows:
| Fund | Income earned |
| Fidelity Cash Central Fund | $281,519 |
| Fidelity Securities Lending Cash Central Fund | 468,633 |
| Total | $750,152 |
Amounts in the income column in the above table include any capital gain distributions from underlying funds, which are presented in the corresponding line-item in the Statement of Operations, if applicable. Amount for Fidelity Securities Lending Cash Central Fund represents the income earned on investing cash collateral, less rebates paid to borrowers and any lending agent fees associated with the loan, plus any premium payments received for lending certain types of securities.
Investment Valuation
The following is a summary of the inputs used, as of October 31, 2020, involving the Fund's assets and liabilities carried at fair value. The inputs or methodology used for valuing securities may not be an indication of the risk associated with investing in those securities. For more information on valuation inputs, and their aggregation into the levels used below, please refer to the Investment Valuation section in the accompanying Notes to Financial Statements.
| | Valuation Inputs at Reporting Date: |
| Description | Total | Level 1 | Level 2 | Level 3 |
| Investments in Securities: | | | | |
| Equities: | | | | |
| Communication Services | $182,822,594 | $182,822,594 | $-- | $-- |
| Consumer Discretionary | 193,685,997 | 193,685,997 | -- | -- |
| Consumer Staples | 305,331,872 | 300,253,714 | 5,078,158 | -- |
| Energy | 432,186,319 | 432,186,319 | -- | -- |
| Financials | 1,266,210,166 | 1,266,210,166 | -- | -- |
| Health Care | 17,768,386 | 17,768,386 | -- | -- |
| Industrials | 544,702,213 | 544,702,213 | -- | -- |
| Information Technology | 357,518,516 | 349,337,251 | 8,181,265 | -- |
| Materials | 536,882,390 | 536,882,390 | -- | -- |
| Real Estate | 21,274,732 | 21,274,732 | -- | -- |
| Corporate Bonds | 10,114,154 | -- | 10,114,154 | -- |
| Money Market Funds | 202,051,101 | 202,051,101 | -- | -- |
| Total Investments in Securities: | $4,070,548,440 | $4,047,174,863 | $23,373,577 | $-- |
See accompanying notes which are an integral part of the financial statements.
Financial Statements
Statement of Assets and Liabilities
| | | October 31, 2020 |
| Assets | | |
Investment in securities, at value (including securities loaned of $174,021,108) — See accompanying schedule:
Unaffiliated issuers (cost $4,062,608,309) | $3,868,497,339 | |
| Fidelity Central Funds (cost $202,051,101) | 202,051,101 | |
| Total Investment in Securities (cost $4,264,659,410) | | $4,070,548,440 |
| Foreign currency held at value (cost $249,762) | | 249,762 |
| Receivable for investments sold | | 69 |
| Receivable for fund shares sold | | 24,292,705 |
| Dividends receivable | | 8,464,110 |
| Interest receivable | | 59,935 |
| Distributions receivable from Fidelity Central Funds | | 69,257 |
| Other receivables | | 3,906 |
| Total assets | | 4,103,688,184 |
| Liabilities | | |
| Payable for investments purchased | $406,837 | |
| Payable for fund shares redeemed | 2,053,901 | |
| Other payables and accrued expenses | 19,358 | |
| Collateral on securities loaned | 186,791,384 | |
| Total liabilities | | 189,271,480 |
| Net Assets | | $3,914,416,704 |
| Net Assets consist of: | | |
| Paid in capital | | $4,100,380,887 |
| Total accumulated earnings (loss) | | (185,964,183) |
| Net Assets | | $3,914,416,704 |
| Net Asset Value, offering price and redemption price per share ($3,914,416,704 ÷ 400,455,548 shares) | | $9.77 |
See accompanying notes which are an integral part of the financial statements.
Statement of Operations
| | | Year ended October 31, 2020 |
| Investment Income | | |
| Dividends | | $101,721,520 |
| Interest | | 34,672 |
| Income from Fidelity Central Funds (including $468,633 from security lending) | | 750,152 |
| Income before foreign taxes withheld | | 102,506,344 |
| Less foreign taxes withheld | | (15,530,459) |
| Total income | | 86,975,885 |
| Expenses | | |
| Custodian fees and expenses | $39,038 | |
| Independent trustees' fees and expenses | 16,652 | |
| Miscellaneous | 7,033 | |
| Total expenses before reductions | 62,723 | |
| Expense reductions | (49) | |
| Total expenses after reductions | | 62,674 |
| Net investment income (loss) | | 86,913,211 |
| Realized and Unrealized Gain (Loss) | | |
| Net realized gain (loss) on: | | |
| Investment securities: | | |
| Unaffiliated issuers | (54,379,121) | |
| Fidelity Central Funds | 3,960 | |
| Foreign currency transactions | (964,506) | |
| Total net realized gain (loss) | | (55,339,667) |
| Change in net unrealized appreciation (depreciation) on: | | |
| Investment securities: | | |
| Unaffiliated issuers | (267,462,391) | |
| Fidelity Central Funds | (860) | |
| Assets and liabilities in foreign currencies | (6,538) | |
| Total change in net unrealized appreciation (depreciation) | | (267,469,789) |
| Net gain (loss) | | (322,809,456) |
| Net increase (decrease) in net assets resulting from operations | | $(235,896,245) |
See accompanying notes which are an integral part of the financial statements.
Statement of Changes in Net Assets
| | Year ended October 31, 2020 | Year ended October 31, 2019 |
| Increase (Decrease) in Net Assets | | |
| Operations | | |
| Net investment income (loss) | $86,913,211 | $41,988,284 |
| Net realized gain (loss) | (55,339,667) | (6,690,586) |
| Change in net unrealized appreciation (depreciation) | (267,469,789) | 133,899,488 |
| Net increase (decrease) in net assets resulting from operations | (235,896,245) | 169,197,186 |
| Distributions to shareholders | (44,416,051) | (33,015,477) |
| Share transactions | | |
| Proceeds from sales of shares | 2,526,093,509 | 499,980,643 |
| Reinvestment of distributions | 44,268,692 | 33,015,477 |
| Cost of shares redeemed | (292,042,287) | (138,267,378) |
| Net increase (decrease) in net assets resulting from share transactions | 2,278,319,914 | 394,728,742 |
| Total increase (decrease) in net assets | 1,998,007,618 | 530,910,451 |
| Net Assets | | |
| Beginning of period | 1,916,409,086 | 1,385,498,635 |
| End of period | $3,914,416,704 | $1,916,409,086 |
| Other Information | | |
| Shares | | |
| Sold | 248,580,533 | 47,300,568 |
| Issued in reinvestment of distributions | 4,017,123 | 3,482,645 |
| Redeemed | (28,144,989) | (13,464,835) |
| Net increase (decrease) | 224,452,667 | 37,318,378 |
See accompanying notes which are an integral part of the financial statements.
Financial Highlights
Fidelity Series Canada Fund
| | | | | |
| Years ended October 31, | 2020 | 2019 | 2018 | 2017 A |
| Selected Per–Share Data | | | | |
| Net asset value, beginning of period | $10.89 | $9.99 | $10.66 | $10.00 |
| Income from Investment Operations | | | | |
| Net investment income (loss)B | .27 | .27 | .26 | .06 |
| Net realized and unrealized gain (loss) | (1.14) | .86 | (.81) | .60 |
| Total from investment operations | (.87) | 1.13 | (.55) | .66 |
| Distributions from net investment income | (.25) | (.23) | (.10) | – |
| Distributions from net realized gain | – | – | (.02) | – |
| Total distributions | (.25) | (.23) | (.12) | – |
| Net asset value, end of period | $9.77 | $10.89 | $9.99 | $10.66 |
| Total ReturnC,D | (8.22)% | 11.62% | (5.26)% | 6.60% |
| Ratios to Average Net AssetsE,F | | | | |
| Expenses before reductionsG | -% | -% | -% | - %H |
| Expenses net of fee waivers, if anyG | -% | -% | -% | - %H |
| Expenses net of all reductionsG | -% | -% | -% | - %H |
| Net investment income (loss) | 2.70% | 2.63% | 2.42% | 2.62%H |
| Supplemental Data | | | | |
| Net assets, end of period (000 omitted) | $3,914,417 | $1,916,409 | $1,385,499 | $1,476,967 |
| Portfolio turnover rateI | 14% | 12%J | 36% | 3%K |
A For the period August 15, 2017 (commencement of operations) to October 31, 2017.
B Calculated based on average shares outstanding during the period.
C Total returns for periods of less than one year are not annualized.
D Total returns would have been lower if certain expenses had not been reduced during the applicable periods shown.
E Fees and expenses of any underlying mutual funds or exchange-traded funds (ETFs) are not included in the Fund's expense ratio. The Fund indirectly bears its proportionate share of these expenses. For additional expense information related to investments in Fidelity Central Funds, please refer to the "Investments in Fidelity Central Funds" note found in the Notes to Financial Statements section of the most recent Annual or Semi-Annual report.
F Expense ratios reflect operating expenses of the class. Expenses before reductions do not reflect amounts reimbursed, waived, or reduced through arrangements with the investment advisor, brokerage services, or other offset arrangements, if applicable, and do not represent the amount paid by the class during periods when reimbursements, waivers or reductions occur.
G Amount represents less than .005%.
H Annualized
I Amount does not include the portfolio activity of any underlying mutual funds or exchange-traded funds (ETFs).
J Portfolio turnover rate excludes securities received or delivered in-kind.
K Amount not annualized.
See accompanying notes which are an integral part of the financial statements.
Notes to Financial Statements
For the period ended October 31, 2020
1. Organization.
Fidelity Series Canada Fund (the Fund) is a fund of Fidelity Investment Trust (the Trust) and is authorized to issue an unlimited number of shares. Shares are offered only to certain other Fidelity funds and Fidelity managed 529 plans. The Trust is registered under the Investment Company Act of 1940, as amended (the 1940 Act), as an open-end management investment company organized as a Massachusetts business trust.
Effective January 1, 2020:
Investment advisers Fidelity Investments Money Management, Inc., FMR Co., Inc., and Fidelity SelectCo, LLC, merged with and into Fidelity Management & Research Company. In connection with the merger transactions, the resulting, merged investment adviser was then redomiciled from Massachusetts to Delaware, changed its corporate structure from a corporation to a limited liability company, and changed its name to "Fidelity Management & Research Company LLC".
2. Investments in Fidelity Central Funds.
The Fund invests in Fidelity Central Funds, which are open-end investment companies generally available only to other investment companies and accounts managed by the investment adviser and its affiliates. The Fund's Schedule of Investments lists each of the Fidelity Central Funds held as of period end, if any, as an investment of the Fund, but does not include the underlying holdings of each Fidelity Central Fund. As an Investing Fund, the Fund indirectly bears its proportionate share of the expenses of the underlying Fidelity Central Funds.
The Money Market Central Funds seek preservation of capital and current income and are managed by the investment adviser. Annualized expenses of the Money Market Central Funds as of their most recent shareholder report date ranged from less than .005% to .01%.
A complete unaudited list of holdings for each Fidelity Central Fund is available upon request or at the Securities and Exchange Commission (the SEC) website at www.sec.gov. In addition, the financial statements of the Fidelity Central Funds, which are not covered by the Fund's Report of Independent Registered Public Accounting Firm, are available on the SEC website or upon request.
3. Significant Accounting Policies.
The Fund is an investment company and applies the accounting and reporting guidance of the Financial Accounting Standards Board (FASB) Accounting Standards Codification Topic 946 Financial Services – Investment Companies. The financial statements have been prepared in conformity with accounting principles generally accepted in the United States of America (GAAP), which require management to make certain estimates and assumptions at the date of the financial statements. Actual results could differ from those estimates. Subsequent events, if any, through the date that the financial statements were issued have been evaluated in the preparation of the financial statements. The following summarizes the significant accounting policies of the Fund:
Investment Valuation. Investments are valued as of 4:00 p.m. Eastern time on the last calendar day of the period. The Board of Trustees (the Board) has delegated the day to day responsibility for the valuation of the Fund's investments to the Fair Value Committee (the Committee) established by the Fund's investment adviser. In accordance with valuation policies and procedures approved by the Board, the Fund attempts to obtain prices from one or more third party pricing vendors or brokers to value its investments. When current market prices, quotations or currency exchange rates are not readily available or reliable, investments will be fair valued in good faith by the Committee, in accordance with procedures adopted by the Board. Factors used in determining fair value vary by investment type and may include market or investment specific events, changes in interest rates and credit quality. The frequency with which these procedures are used cannot be predicted and they may be utilized to a significant extent. The Committee oversees the Fund's valuation policies and procedures and reports to the Board on the Committee's activities and fair value determinations. The Board monitors the appropriateness of the procedures used in valuing the Fund's investments and ratifies the fair value determinations of the Committee.
The Fund categorizes the inputs to valuation techniques used to value its investments into a disclosure hierarchy consisting of three levels as shown below:
- Level 1 – quoted prices in active markets for identical investments
- Level 2 – other significant observable inputs (including quoted prices for similar investments, interest rates, prepayment speeds, etc.)
- Level 3 – unobservable inputs (including the Fund's own assumptions based on the best information available)
Valuation techniques used to value the Fund's investments by major category are as follows:
Equity securities, including restricted securities, for which market quotations are readily available, are valued at the last reported sale price or official closing price as reported by a third party pricing vendor on the primary market or exchange on which they are traded and are categorized as Level 1 in the hierarchy. In the event there were no sales during the day or closing prices are not available, securities are valued at the last quoted bid price or may be valued using the last available price and are generally categorized as Level 2 in the hierarchy. For foreign equity securities, when market or security specific events arise, comparisons to the valuation of American Depositary Receipts (ADRs), futures contracts, Exchange-Traded Funds (ETFs) and certain indexes as well as quoted prices for similar securities may be used and would be categorized as Level 2 in the hierarchy. For equity securities, including restricted securities, where observable inputs are limited, assumptions about market activity and risk are used and these securities may be categorized as Level 3 in the hierarchy.
Debt securities, including restricted securities, are valued based on evaluated prices received from third party pricing vendors or from brokers who make markets in such securities. Corporate bonds are valued by pricing vendors who utilize matrix pricing which considers yield or price of bonds of comparable quality, coupon, maturity and type or by broker-supplied prices. When independent prices are unavailable or unreliable, debt securities may be valued utilizing pricing methodologies which consider similar factors that would be used by third party pricing vendors. Debt securities are generally categorized as Level 2 in the hierarchy but may be Level 3 depending on the circumstances.
Investments in open-end mutual funds, including the Fidelity Central Funds, are valued at their closing net asset value (NAV) each business day and are categorized as Level 1 in the hierarchy.
Changes in valuation techniques may result in transfers in or out of an assigned level within the disclosure hierarchy. The aggregate value of investments by input level as of October 31, 2020 is included at the end of the Fund's Schedule of Investments.
Foreign Currency. Certain Funds may use foreign currency contracts to facilitate transactions in foreign-denominated securities. Gains and losses from these transactions may arise from changes in the value of the foreign currency or if the counterparties do not perform under the contracts' terms.
Foreign-denominated assets, including investment securities, and liabilities are translated into U.S. dollars at the exchange rates at period end. Purchases and sales of investment securities, income and dividends received, and expenses denominated in foreign currencies are translated into U.S. dollars at the exchange rate in effect on the transaction date.
The effects of exchange rate fluctuations on investments are included with the net realized and unrealized gain (loss) on investment securities. Other foreign currency transactions resulting in realized and unrealized gain (loss) are disclosed separately.
Investment Transactions and Income. For financial reporting purposes, the Fund's investment holdings and NAV include trades executed through the end of the last business day of the period. The NAV per share for processing shareholder transactions is calculated as of the close of business of the New York Stock Exchange (NYSE), normally 4:00 p.m. Eastern time and includes trades executed through the end of the prior business day. Gains and losses on securities sold are determined on the basis of identified cost. Dividend income is recorded on the ex-dividend date, except for certain dividends from foreign securities where the ex-dividend date may have passed, which are recorded as soon as the Fund is informed of the ex-dividend date. Non-cash dividends included in dividend income, if any, are recorded at the fair market value of the securities received. Income and capital gain distributions from Fidelity Central Funds, if any, are recorded on the ex-dividend date. Certain distributions received by the Fund represent a return of capital or capital gain. The Fund determines the components of these distributions subsequent to the ex-dividend date, based upon receipt of tax filings or other correspondence relating to the underlying investment. These distributions are recorded as a reduction of cost of investments and/or as a realized gain. Interest income is accrued as earned and includes coupon interest and amortization of premium and accretion of discount on debt securities as applicable. Investment income is recorded net of foreign taxes withheld where recovery of such taxes is uncertain.
Expenses. Expenses directly attributable to a fund are charged to that fund. Expenses attributable to more than one fund are allocated among the respective funds on the basis of relative net assets or other appropriate methods. Expense estimates are accrued in the period to which they relate and adjustments are made when actual amounts are known.
Income Tax Information and Distributions to Shareholders. Each year, the Fund intends to qualify as a regulated investment company under Subchapter M of the Internal Revenue Code, including distributing substantially all of its taxable income and realized gains. As a result, no provision for U.S. Federal income taxes is required. As of October 31, 2020, the Fund did not have any unrecognized tax benefits in the financial statements; nor is the Fund aware of any tax positions for which it is reasonably possible that the total amounts of unrecognized tax benefits will significantly change in the next twelve months. The Fund files a U.S. federal tax return, in addition to state and local tax returns as required. The Fund's federal income tax returns are subject to examination by the Internal Revenue Service (IRS) for a period of three fiscal years after they are filed. State and local tax returns may be subject to examination for an additional fiscal year depending on the jurisdiction. Foreign taxes are provided for based on the Fund's understanding of the tax rules and rates that exist in the foreign markets in which it invests.
Distributions are declared and recorded on the ex-dividend date. Income and capital gain distributions are determined in accordance with income tax regulations, which may differ from GAAP.
Capital accounts within the financial statements are adjusted for permanent book-tax differences. These adjustments have no impact on net assets or the results of operations. Capital accounts are not adjusted for temporary book-tax differences which will reverse in a subsequent period.
Book-tax differences are primarily due to foreign currency transactions, passive foreign investment companies (PFIC), capital loss carryforwards and losses deferred due to wash sales.
As of period end, the cost and unrealized appreciation (depreciation) in securities, and derivatives if applicable, for federal income tax purposes were as follows:
| Gross unrealized appreciation | $393,945,169 |
| Gross unrealized depreciation | (600,064,613) |
| Net unrealized appreciation (depreciation) | $(206,119,444) |
| Tax Cost | $4,276,667,884 |
The tax-based components of distributable earnings as of period end were as follows:
| Undistributed ordinary income | $76,263,862 |
| Capital loss carryforward | $(56,078,326) |
| Net unrealized appreciation (depreciation) on securities and other investments | $(206,149,717) |
Capital loss carryforwards are only available to offset future capital gains of the Fund to the extent provided by regulations and may be limited. The capital loss carryforward information presented below, including any applicable limitation, is estimated as of fiscal period end and is subject to adjustment.
| No expiration | |
| Short-term | $(14,574,722) |
| Long-term | (41,503,604) |
| Total capital loss carryforward | $(56,078,326) |
The tax character of distributions paid was as follows:
| | October 31, 2020 | October 31, 2019 |
| Ordinary Income | $44,416,051 | $ 33,015,477 |
Restricted Securities (including Private Placements). The Fund may invest in securities that are subject to legal or contractual restrictions on resale. These securities generally may be resold in transactions exempt from registration or to the public if the securities are registered. Disposal of these securities may involve time-consuming negotiations and expense, and prompt sale at an acceptable price may be difficult. Information regarding restricted securities is included at the end of the Fund's Schedule of Investments.
4. Purchases and Sales of Investments.
Purchases and sales of securities, other than short-term securities, are noted in the table below.
| | Purchases ($) | Sales ($) |
| Fidelity Series Canada Fund | 2,744,994,964 | 449,470,189 |
5. Fees and Other Transactions with Affiliates.
Management Fee. Fidelity Management & Research Company LLC (the investment adviser) and its affiliates provide the Fund with investment management related services for which the Fund does not pay a management fee. Under the management contract, the investment adviser or an affiliate pays all ordinary operating expenses of the Fund, except custody fees, fees and expenses of the independent Trustees, and certain miscellaneous expenses such as proxy and shareholder meeting expenses.
Brokerage Commissions. A portion of portfolio transactions were placed with brokerage firms which are affiliates of the investment adviser. Brokerage commissions are included in net realized gain (loss) and change in net unrealized appreciation (depreciation) in the Statement of Operations. The commissions paid to these affiliated firms were as follows:
| | Amount |
| Fidelity Series Canada Fund | $192 |
Interfund Trades. Funds may purchase from or sell securities to other Fidelity Funds under procedures adopted by the Board. The procedures have been designed to ensure these interfund trades are executed in accordance with Rule 17a-7 of the 1940 Act. Interfund trades are included within the respective purchases and sales amounts shown in the Purchases and Sales of Investments note.
Prior Fiscal Year Affiliated Exchanges In-Kind. During the prior period, the Fund received investments and cash valued at $69,285,091 in exchange for 6,362,267 shares of the Fund. The amount of in-kind exchanges is included in share transactions in the accompanying Statement of Changes in Net Assets.
6. Committed Line of Credit.
Certain Funds participate with other funds managed by the investment adviser or an affiliate in a $4.25 billion credit facility (the "line of credit") to be utilized for temporary or emergency purposes to fund shareholder redemptions or for other short-term liquidity purposes. The participating funds have agreed to pay commitment fees on their pro-rata portion of the line of credit, which are reflected in Miscellaneous expenses on the Statement of Operations, and are as follows:
| | Amount |
| Fidelity Series Canada Fund | $6,968 |
During the period, there were no borrowings on this line of credit.
7. Security Lending.
Funds lend portfolio securities from time to time in order to earn additional income. Lending agents are used, including National Financial Services (NFS), an affiliate of the investment adviser. Pursuant to a securities lending agreement, NFS will receive a fee, which is capped at 9.9% of a fund's daily lending revenue, for its services as lending agent. A fund may lend securities to certain qualified borrowers, including NFS. On the settlement date of the loan, a fund receives collateral (in the form of U.S. Treasury obligations, letters of credit and/or cash) against the loaned securities and maintains collateral in an amount not less than 100% of the market value of the loaned securities during the period of the loan. The market value of the loaned securities is determined at the close of business of a fund and any additional required collateral is delivered to a fund on the next business day. A fund or borrower may terminate the loan at any time, and if the borrower defaults on its obligation to return the securities loaned because of insolvency or other reasons, a fund may apply collateral received from the borrower against the obligation. A fund may experience delays and costs in recovering the securities loaned. Any cash collateral received is invested in the Fidelity Securities Lending Cash Central Fund. Any loaned securities are identified as such in the Schedule of Investments, and the value of loaned securities and cash collateral at period end, as applicable, are presented in the Statement of Assets and Liabilities. Security lending income represents the income earned on investing cash collateral, less rebates paid to borrowers and any lending agent fees associated with the loan, plus any premium payments received for lending certain types of securities. Security lending income is presented in the Statement of Operations as a component of income from Fidelity Central Funds. Affiliated security lending activity, if any, was as follows:
| | Total Security Lending Income Fees Paid to NFS | Security Lending Income From Securities Loaned to NFS | Value of Securities Loaned to NFS at Period End |
| Fidelity Series Canada Fund | $63 | $– | $– |
8. Expense Reductions.
Through arrangements with the Fund's custodian, credits realized as a result of certain uninvested cash balances were used to reduce the Fund's expenses by $49.
9. Other.
The Fund's organizational documents provide former and current trustees and officers with a limited indemnification against liabilities arising in connection with the performance of their duties to the Fund. In the normal course of business, the Fund may also enter into contracts that provide general indemnifications. The Fund's maximum exposure under these arrangements is unknown as this would be dependent on future claims that may be made against the Fund. The risk of material loss from such claims is considered remote.
At the end of the period, mutual funds and accounts managed by the investment adviser or its affiliates were the owners of record of all of the outstanding shares of the Fund.
10. Coronavirus (COVID-19) Pandemic.
An outbreak of COVID-19 first detected in China during December 2019 has since spread globally and was declared a pandemic by the World Health Organization during March 2020. Developments that disrupt global economies and financial markets, such as the COVID-19 pandemic, may magnify factors that affect the Fund's performance.
Report of Independent Registered Public Accounting Firm
To the Board of Trustees of Fidelity Investment Trust and Shareholders of Fidelity Series Canada Fund
Opinion on the Financial Statements
We have audited the accompanying statement of assets and liabilities, including the schedule of investments, of Fidelity Series Canada Fund (one of the funds constituting Fidelity Investment Trust, referred to hereafter as the “Fund”) as of October 31, 2020, the related statement of operations for the year ended October 31, 2020, the statement of changes in net assets for each of the two years in the period ended October 31, 2020, including the related notes, and the financial highlights for each of the three years in the period ended October 31, 2020 and for the period August 15, 2017 (commencement of operations) through October 31, 2017 (collectively referred to as the “financial statements”). In our opinion, the financial statements present fairly, in all material respects, the financial position of the Fund as of October 31, 2020, the results of its operations for the year then ended, the changes in its net assets for each of the two years in the period ended October 31, 2020 and the financial highlights for each of the three years in the period ended October 31, 2020 and for the period August 15, 2017 (commencement of operations) through October 31, 2017 in conformity with accounting principles generally accepted in the United States of America.
Basis for Opinion
These financial statements are the responsibility of the Fund’s management. Our responsibility is to express an opinion on the Fund’s financial statements based on our audits. We are a public accounting firm registered with the Public Company Accounting Oversight Board (United States) (PCAOB) and are required to be independent with respect to the Fund in accordance with the U.S. federal securities laws and the applicable rules and regulations of the Securities and Exchange Commission and the PCAOB.
We conducted our audits of these financial statements in accordance with the standards of the PCAOB. Those standards require that we plan and perform the audit to obtain reasonable assurance about whether the financial statements are free of material misstatement, whether due to error or fraud.
Our audits included performing procedures to assess the risks of material misstatement of the financial statements, whether due to error or fraud, and performing procedures that respond to those risks. Such procedures included examining, on a test basis, evidence regarding the amounts and disclosures in the financial statements. Our audits also included evaluating the accounting principles used and significant estimates made by management, as well as evaluating the overall presentation of the financial statements. Our procedures included confirmation of securities owned as of October 31, 2020 by correspondence with the custodian and brokers; when replies were not received from brokers, we performed other auditing procedures. We believe that our audits provide a reasonable basis for our opinion.
/s/ PricewaterhouseCoopers LLP
Boston, Massachusetts
December 15, 2020
We have served as the auditor of one or more investment companies in the Fidelity group of funds since 1932.
Trustees and Officers
The Trustees, Members of the Advisory Board (if any), and officers of the trust and fund, as applicable, are listed below. The Board of Trustees governs the fund and is responsible for protecting the interests of shareholders. The Trustees are experienced executives who meet periodically throughout the year to oversee the fund's activities, review contractual arrangements with companies that provide services to the fund, oversee management of the risks associated with such activities and contractual arrangements, and review the fund's performance. Except for Jonathan Chiel, each of the Trustees oversees 305 funds. Mr. Chiel oversees 176 funds.
The Trustees hold office without limit in time except that (a) any Trustee may resign; (b) any Trustee may be removed by written instrument, signed by at least two-thirds of the number of Trustees prior to such removal; (c) any Trustee who requests to be retired or who has become incapacitated by illness or injury may be retired by written instrument signed by a majority of the other Trustees; and (d) any Trustee may be removed at any special meeting of shareholders by a two-thirds vote of the outstanding voting securities of the trust. Each Trustee who is not an interested person (as defined in the 1940 Act) of the trust and the fund is referred to herein as an Independent Trustee. Each Independent Trustee shall retire not later than the last day of the calendar year in which his or her 75th birthday occurs. The Independent Trustees may waive this mandatory retirement age policy with respect to individual Trustees. Officers and Advisory Board Members hold office without limit in time, except that any officer or Advisory Board Member may resign or may be removed by a vote of a majority of the Trustees at any regular meeting or any special meeting of the Trustees. Except as indicated, each individual has held the office shown or other offices in the same company for the past five years.
The fund’s Statement of Additional Information (SAI) includes more information about the Trustees. To request a free copy, call Fidelity at 1-800-544-8544.
Experience, Skills, Attributes, and Qualifications of the Trustees. The Governance and Nominating Committee has adopted a statement of policy that describes the experience, qualifications, attributes, and skills that are necessary and desirable for potential Independent Trustee candidates (Statement of Policy). The Board believes that each Trustee satisfied at the time he or she was initially elected or appointed a Trustee, and continues to satisfy, the standards contemplated by the Statement of Policy. The Governance and Nominating Committee also engages professional search firms to help identify potential Independent Trustee candidates who have the experience, qualifications, attributes, and skills consistent with the Statement of Policy. From time to time, additional criteria based on the composition and skills of the current Independent Trustees, as well as experience or skills that may be appropriate in light of future changes to board composition, business conditions, and regulatory or other developments, have also been considered by the professional search firms and the Governance and Nominating Committee. In addition, the Board takes into account the Trustees' commitment and participation in Board and committee meetings, as well as their leadership of standing and ad hoc committees throughout their tenure.
In determining that a particular Trustee was and continues to be qualified to serve as a Trustee, the Board has considered a variety of criteria, none of which, in isolation, was controlling. The Board believes that, collectively, the Trustees have balanced and diverse experience, qualifications, attributes, and skills, which allow the Board to operate effectively in governing the fund and protecting the interests of shareholders. Information about the specific experience, skills, attributes, and qualifications of each Trustee, which in each case led to the Board's conclusion that the Trustee should serve (or continue to serve) as a trustee of the fund, is provided below.
Board Structure and Oversight Function. Robert A. Lawrence is an interested person and currently serves as Acting Chairman. The Trustees have determined that an interested Chairman is appropriate and benefits shareholders because an interested Chairman has a personal and professional stake in the quality and continuity of services provided to the fund. Independent Trustees exercise their informed business judgment to appoint an individual of their choosing to serve as Chairman, regardless of whether the Trustee happens to be independent or a member of management. The Independent Trustees have determined that they can act independently and effectively without having an Independent Trustee serve as Chairman and that a key structural component for assuring that they are in a position to do so is for the Independent Trustees to constitute a substantial majority for the Board. The Independent Trustees also regularly meet in executive session. Ned C. Lautenbach and David M. Thomas serve as Co-Lead Independent Trustees and as such each (i) acts as a liaison between the Independent Trustees and management with respect to matters important to the Independent Trustees and (ii) with management prepares agendas for Board meetings.
Fidelity® funds are overseen by different Boards of Trustees. The fund's Board oversees Fidelity's high income and certain equity funds, and other Boards oversee Fidelity's investment-grade bond, money market, asset allocation, and other equity funds. The asset allocation funds may invest in Fidelity® funds overseen by the fund's Board. The use of separate Boards, each with its own committee structure, allows the Trustees of each group of Fidelity® funds to focus on the unique issues of the funds they oversee, including common research, investment, and operational issues. On occasion, the separate Boards establish joint committees to address issues of overlapping consequences for the Fidelity® funds overseen by each Board.
The Trustees operate using a system of committees to facilitate the timely and efficient consideration of all matters of importance to the Trustees, the fund, and fund shareholders and to facilitate compliance with legal and regulatory requirements and oversight of the fund's activities and associated risks. The Board, acting through its committees, has charged FMR and its affiliates with (i) identifying events or circumstances the occurrence of which could have demonstrably adverse effects on the fund's business and/or reputation; (ii) implementing processes and controls to lessen the possibility that such events or circumstances occur or to mitigate the effects of such events or circumstances if they do occur; and (iii) creating and maintaining a system designed to evaluate continuously business and market conditions in order to facilitate the identification and implementation processes described in (i) and (ii) above. Because the day-to-day operations and activities of the fund are carried out by or through FMR, its affiliates, and other service providers, the fund's exposure to risks is mitigated but not eliminated by the processes overseen by the Trustees. While each of the Board's committees has responsibility for overseeing different aspects of the fund's activities, oversight is exercised primarily through the Operations, Audit, and Compliance Committees. Appropriate personnel, including but not limited to the fund's Chief Compliance Officer (CCO), FMR's internal auditor, the independent accountants, the fund's Treasurer and portfolio management personnel, make periodic reports to the Board's committees, as appropriate, including an annual review of Fidelity's risk management program for the Fidelity® funds. The responsibilities of each standing committee, including their oversight responsibilities, are described further under "Standing Committees of the Trustees."
Interested Trustees*:
Correspondence intended for a Trustee who is an interested person may be sent to Fidelity Investments, 245 Summer Street, Boston, Massachusetts 02210.
Name, Year of Birth; Principal Occupations and Other Relevant Experience+
Jonathan Chiel (1957)
Year of Election or Appointment: 2016
Trustee
Mr. Chiel also serves as Trustee of other Fidelity® funds. Mr. Chiel is Executive Vice President and General Counsel for FMR LLC (diversified financial services company, 2012-present). Previously, Mr. Chiel served as general counsel (2004-2012) and senior vice president and deputy general counsel (2000-2004) for John Hancock Financial Services; a partner with Choate, Hall & Stewart (1996-2000) (law firm); and an Assistant United States Attorney for the United States Attorney’s Office of the District of Massachusetts (1986-95), including Chief of the Criminal Division (1993-1995). Mr. Chiel is a director on the boards of the Boston Bar Foundation and the Maimonides School.
Robert A. Lawrence (1952)
Year of Election or Appointment: 2020
Trustee
Acting Chairman of the Board of Trustees
Mr. Lawrence also serves as Trustee of other funds. Previously, Mr. Lawrence served as a Member of the Advisory Board of certain funds. Prior to his retirement in 2008, Mr. Lawrence served as Vice President of certain Fidelity® funds (2006-2008), Senior Vice President, Head of High Income Division of Fidelity Management & Research Company (investment adviser firm, 2006-2008), and President of Fidelity Strategic Investments (investment adviser firm, 2002-2005).
* Determined to be an “Interested Trustee” by virtue of, among other things, his or her affiliation with the trust or various entities under common control with FMR.
+ The information includes the Trustee's principal occupation during the last five years and other information relating to the experience, attributes, and skills relevant to the Trustee's qualifications to serve as a Trustee, which led to the conclusion that the Trustee should serve as a Trustee for the fund.
Independent Trustees:
Correspondence intended for an Independent Trustee may be sent to Fidelity Investments, P.O. Box 55235, Boston, Massachusetts 02205-5235.
Name, Year of Birth; Principal Occupations and Other Relevant Experience+
Dennis J. Dirks (1948)
Year of Election or Appointment: 2005
Trustee
Mr. Dirks also serves as Trustee of other Fidelity® funds. Prior to his retirement in May 2003, Mr. Dirks served as Chief Operating Officer and as a member of the Board of The Depository Trust & Clearing Corporation (financial markets infrastructure), President, Chief Operating Officer and a member of the Board of The Depository Trust Company (DTC), President and a member of the Board of the National Securities Clearing Corporation (NSCC), Chief Executive Officer and a member of the Board of the Government Securities Clearing Corporation and Chief Executive Officer and a member of the Board of the Mortgage-Backed Securities Clearing Corporation. Mr. Dirks currently serves as a member of the Finance Committee (2016-present) and Board (2017-present) and is Treasurer (2018-present) of the Asolo Repertory Theatre.
Donald F. Donahue (1950)
Year of Election or Appointment: 2018
Trustee
Mr. Donahue also serves as Trustee of other Fidelity® funds. Mr. Donahue serves as President and Chief Executive Officer of Miranda Partners, LLC (risk consulting for the financial services industry, 2012-present). Previously, Mr. Donahue served as Chief Executive Officer (2006-2012), Chief Operating Officer (2003-2006) and Managing Director, Customer Marketing and Development (1999-2003) of The Depository Trust & Clearing Corporation (financial markets infrastructure). Mr. Donahue currently serves as a member (2007-present) and Co-Chairman (2016-present) of the Board of United Way of New York, a member of the Board of NYC Leadership Academy (2012-present) and a member of the Board of Advisors of Ripple Labs, Inc. (financial services, 2015-present). Mr. Donahue previously served as a member of the Advisory Board of certain Fidelity® funds (2015-2018).
Vicki L. Fuller (1957)
Year of Election or Appointment: 2020
Trustee
Ms. Fuller also serves as Trustee of other Fidelity® funds. Previously, Ms. Fuller served as a member of the Advisory Board of certain Fidelity® funds (2018-2020), Chief Investment Officer of the New York State Common Retirement Fund (2012-2018) and held a variety of positions at AllianceBernstein L.P. (global asset management, 1985-2012), including Managing Director (2006-2012) and Senior Vice President and Senior Portfolio Manager (2001-2006). Ms. Fuller currently serves as a member of the Board, Audit Committee and Nominating and Governance Committee of The Williams Companies, Inc. (natural gas infrastructure, 2018-present), as a member of the Board, Audit Committee and Nominating and Governance Committee of two Blackstone business development companies (2020-present) and as a member of the Board of Treliant, LLC (consulting, 2019-present).
Patricia L. Kampling (1959)
Year of Election or Appointment: 2020
Trustee
Ms. Kampling also serves as Trustee of other Fidelity® funds. Prior to her retirement, Ms. Kampling served as Chairman of the Board and Chief Executive Officer (2012-2019), President and Chief Operating Officer (2011-2012) and Executive Vice President and Chief Financial Officer (2010-2011) of Alliant Energy Corporation. Ms. Kampling currently serves as a member of the Board, Compensation Committee and Executive Committee and as Chair of the Audit Committee of Briggs & Stratton Corporation (manufacturing, 2011-present) and as a member of the Board, Audit, Finance and Risk Committee and Safety, Environmental, Technology and Operations Committee of American Water Works Company, Inc. (utilities company, 2019-present). In addition, Ms. Kampling currently serves as a member of the Board of the Nature Conservancy, Wisconsin Chapter (2019-present). Previously, Ms. Kampling served as a Member of the Advisory Board of certain Fidelity® funds (2020), a member of the Board of Interstate Power and Light Company (2012-2019) and Wisconsin Power and Light Company (2012-2019) (each a subsidiary of Alliant Energy Corporation) and as a member of the Board and Workforce Development Committee of the Business Roundtable (2018-2019).
Alan J. Lacy (1953)
Year of Election or Appointment: 2008
Trustee
Mr. Lacy also serves as Trustee of other Fidelity® funds. Previously, Mr. Lacy served as Senior Adviser (2007-2014) of Oak Hill Capital Partners, L.P. (private equity), Chief Executive Officer (2005) and Vice Chairman (2005-2006) of Sears Holdings Corporation (retail), Chief Executive Officer and Chairman of the Board of Sears, Roebuck and Co. (retail, 2000-2005), Chairman (2014-2017) and a member of the Board (2010-2017) of Dave & Buster’s Entertainment, Inc. (restaurant and entertainment complexes) and a member of the Board of Bristol-Myers Squibb Company (global pharmaceuticals, 2008-2020). Mr. Lacy currently serves as a Trustee of the California Chapter of The Nature Conservancy (2015-present) and a member of the Board of the Center for Advanced Study in the Behavioral Sciences at Stanford University (2015-present).
Ned C. Lautenbach (1944)
Year of Election or Appointment: 2000
Trustee
Co-Lead Independent Trustee
Mr. Lautenbach also serves as Trustee of other Fidelity® funds. Mr. Lautenbach currently serves as Chair of the Board of Governors, State University System of Florida (2013-present) and is a member of the Council on Foreign Relations (1994-present). He is also a member and has in the past served as Chairman of the Board of Directors of Artis-Naples (2012-present). Previously, Mr. Lautenbach served as a member and then Lead Director of the Board of Directors of Eaton Corporation (diversified industrial, 1997-2016). He was also a Partner at Clayton, Dubilier & Rice, LLC (private equity investment, 1998-2010); as well as Director of Sony Corporation (2006-2007). In addition, Mr. Lautenbach had a 30-year career with IBM (technology company), during which time he served as Senior Vice President and as a member of the Corporate Executive Committee (1968-1998).
Joseph Mauriello (1944)
Year of Election or Appointment: 2008
Trustee
Mr. Mauriello also serves as Trustee of other Fidelity® funds. Prior to his retirement in January 2006, Mr. Mauriello served in numerous senior management positions including Deputy Chairman and Chief Operating Officer (2004-2005), and Vice Chairman of Financial Services (2002-2004) of KPMG LLP US (professional services, 1965-2005). Mr. Mauriello currently serves as a member of the Independent Directors Council Governing Council (2015-present). Previously, Mr. Mauriello served as a member of the Board of XL Group plc. (global insurance and re-insurance, 2006-2018).
Cornelia M. Small (1944)
Year of Election or Appointment: 2005
Trustee
Ms. Small also serves as Trustee of other Fidelity® funds. Previously, Ms. Small served as Chief Investment Officer, Director of Global Equity Investments and a member of Scudder, Stevens & Clark and Scudder Kemper Investments. Ms. Small previously served as a member of the Board (2009-2019) and Chair of the Investment Committee (2010-2019) of the Teagle Foundation and a member of the Investment Committee of the Berkshire Taconic Community Foundation (2008-2019).
Garnett A. Smith (1947)
Year of Election or Appointment: 2018
Trustee
Mr. Smith also serves as Trustee of other Fidelity® funds. Prior to his retirement, Mr. Smith served as Chairman and Chief Executive Officer (1990-1997) and President (1986-1990) of Inbrand Corp. (manufacturer of personal absorbent products). Prior to his employment with Inbrand Corp., he was employed by a retail fabric chain and North Carolina National Bank (now Bank of America). Mr. Smith previously served as a member of the Advisory Board of certain Fidelity® funds (2012-2013).
David M. Thomas (1949)
Year of Election or Appointment: 2008
Trustee
Co-Lead Independent Trustee
Mr. Thomas also serves as Trustee of other Fidelity® funds. Previously, Mr. Thomas served as Executive Chairman (2005-2006) and Chairman and Chief Executive Officer (2000-2005) of IMS Health, Inc. (pharmaceutical and healthcare information solutions). Mr. Thomas currently serves as Non-Executive Chairman of the Board of Fortune Brands Home and Security (home and security products, 2011-present), and a member of the Board (2004-present) and Presiding Director (2013-present) of Interpublic Group of Companies, Inc. (marketing communication).
Susan Tomasky (1953)
Year of Election or Appointment: 2020
Trustee
Ms. Tomasky also serves as Trustee of other Fidelity® funds. Prior to her retirement, Ms. Tomasky served in various executive officer positions at American Electric Power Company, Inc. (1998-2011), including most recently as President of AEP Transmission (2007-2011). Ms. Tomasky currently serves as a member of the Board and Sustainability Committee and as Chair of the Audit Committee of Marathon Petroleum Corporation (2018-present) and as a member of the Board, Corporate Governance Committee and Organization and Compensation Committee and as Chair of the Audit Committee of Public Service Enterprise Group, Inc. (utilities company, 2012-present). In addition, Ms. Tomasky currently serves as a member of the Board of the Columbus Regional Airport Authority (2007-present), as a member of the Board of the Royal Shakespeare Company – America (2009-present), as a member of the Board of the Columbus Association for the Performing Arts (2011-present) and as a member of the Board of Kenyon College (2016-present). Previously, Ms. Tomasky served as a Member of the Advisory Board of certain Fidelity® funds (2020), a member of the Board (2011-2019) and as Lead Independent Director (2015-2018) of Andeavor Corporation (previously Tesoro Corporation) (independent oil refiner and marketer) and as a member of the Board of Summit Midstream Partners LP (energy, 2012-2018).
Michael E. Wiley (1950)
Year of Election or Appointment: 2020
Trustee
Mr. Wiley also serves as Trustee of other Fidelity® funds. Previously, Mr. Wiley served as a member of the Advisory Board of certain Fidelity® funds (2018-2020), Chairman, President and CEO of Baker Hughes, Inc. (oilfield services, 2000-2004). Mr. Wiley also previously served as a member of the Board of Andeavor Corporation (independent oil refiner and marketer, 2005-2018), a member of the Board of Andeavor Logistics LP (natural resources logistics, 2015-2018) and a member of the Board of High Point Resources (exploration and production, 2005-2020).
+ The information includes the Trustee's principal occupation during the last five years and other information relating to the experience, attributes, and skills relevant to the Trustee's qualifications to serve as a Trustee, which led to the conclusion that the Trustee should serve as a Trustee for the fund.
Advisory Board Members and Officers:
Correspondence intended for a Member of the Advisory Board (if any) may be sent to Fidelity Investments, P.O. Box 55235, Boston, Massachusetts 02205-5235. Correspondence intended for an officer or Peter S. Lynch may be sent to Fidelity Investments, 245 Summer Street, Boston, Massachusetts 02210. Officers appear below in alphabetical order.
Name, Year of Birth; Principal Occupation
Lloyd James Austin, III (1953)
Year of Election or Appointment: 2020
Member of the Advisory Board
General Austin also serves as a Member of the Advisory Board of other Fidelity® funds. Prior to his retirement, General Austin (United States Army, Retired) held a variety of positions within the U.S. Government, including Commander, U.S. Central Command (2013-2016), Vice Chief of Staff, U.S. Army (2012-2013) and Commanding General, U.S. Forces – Iraq, Operation New Dawn (2010-2012). General Austin currently serves as a Partner of Pine Island Capital Partners (private equity, 2020-present) and as President of the Austin Strategy Group LLC (consulting, 2016-present). General Austin serves as a member of the Board of Directors of Nucor Corporation (steel products, 2017-present), as a member of the Board of Directors of Tenet Healthcare Corporation (2018-present) and as a member of the Board of Directors of Raytheon Technologies Corporation (aerospace and defense, 2020-present). In addition, General Austin currently serves as a member of the Board of Trustees of the Carnegie Corporation of New York (2017-present) and as a member of the Board of Trustees of Auburn University (2017-present). Previously, General Austin served as a member of the Board of Directors of United Technologies Corporation (aerospace, defense and building, 2016-2020).
Thomas A. Kennedy (1955)
Year of Election or Appointment: 2020
Member of the Advisory Board
Mr. Kennedy also serves as a Member of the Advisory Board of other Fidelity® funds. Previously, Mr. Kennedy held a variety of positions at Raytheon Company (aerospace and defense, 1983-2020), including Chairman and Chief Executive Officer (2014-2020) and Executive Vice President and Chief Operating Officer (2013-2014). Mr. Kennedy currently serves as Executive Chairman of the Board of Directors of Raytheon Technologies Corporation (aerospace and defense, 2020-present). He is also a member of the Rutgers School of Engineering Industry Advisory Board (2011-present) and a member of the UCLA Engineering Dean’s Executive Board (2016-present).
Peter S. Lynch (1944)
Year of Election or Appointment: 2003
Member of the Advisory Board
Mr. Lynch also serves as a Member of the Advisory Board of other Fidelity® funds. Mr. Lynch is Vice Chairman and a Director of Fidelity Management & Research Company LLC (investment adviser firm). In addition, Mr. Lynch serves as a Trustee of Boston College and as the Chairman of the Inner-City Scholarship Fund. Previously, Mr. Lynch served as Vice Chairman and a Director of FMR Co., Inc. (investment adviser firm) and on the Special Olympics International Board of Directors (1997-2006).
Elizabeth Paige Baumann (1968)
Year of Election or Appointment: 2017
Anti-Money Laundering (AML) Officer
Ms. Baumann also serves as AML Officer of other funds. She is Chief AML Officer (2012-present) and Senior Vice President (2014-present) of FMR LLC (diversified financial services company) and is an employee of Fidelity Investments. Previously, Ms. Baumann served as AML Officer of certain funds (2017-2019), as AML Officer of the funds (2012-2016), and Vice President (2007-2014) and Deputy Anti-Money Laundering Officer (2007-2012) of FMR LLC.
Craig S. Brown (1977)
Year of Election or Appointment: 2019
Assistant Treasurer
Mr. Brown also serves as Assistant Treasurer of other funds. Mr. Brown is an employee of Fidelity Investments (2013-present).
John J. Burke III (1964)
Year of Election or Appointment: 2018
Chief Financial Officer
Mr. Burke also serves as Chief Financial Officer of other funds. Mr. Burke serves as Head of Investment Operations for Fidelity Fund and Investment Operations (2018-present) and is an employee of Fidelity Investments (1998-present). Previously Mr. Burke served as head of Asset Management Investment Operations (2012-2018).
William C. Coffey (1969)
Year of Election or Appointment: 2019
Assistant Secretary
Mr. Coffey also serves as Assistant Secretary of other funds. He is Senior Vice President and Deputy General Counsel of FMR LLC (diversified financial services company, 2010-present), and is an employee of Fidelity Investments. Previously, Mr. Coffey served as Secretary and CLO of certain funds (2018-2019); CLO, Secretary, and Senior Vice President of Fidelity Management & Research Company and FMR Co., Inc. (investment adviser firms, 2018-2019); Secretary of Fidelity SelectCo, LLC and Fidelity Investments Money Management, Inc. (investment adviser firms, 2018-2019); CLO of Fidelity Management & Research (Hong Kong) Limited, FMR Investment Management (UK) Limited, and Fidelity Management & Research (Japan) Limited (investment adviser firms, 2018-2019); and Assistant Secretary of certain funds (2009-2018).
Timothy M. Cohen (1969)
Year of Election or Appointment: 2018
Vice President
Mr. Cohen also serves as Vice President of other funds. Mr. Cohen serves as Co-Head of Equity (2018-present), a Director of Fidelity Management & Research (Japan) Limited (investment adviser firm, 2016-present), and is an employee of Fidelity Investments. Previously, Mr. Cohen served as Executive Vice President of Fidelity SelectCo, LLC (2019), Head of Global Equity Research (2016-2018), Chief Investment Officer - Equity and a Director of Fidelity Management & Research (U.K.) Inc. (investment adviser firm, 2013-2015) and as a Director of Fidelity Management & Research (Hong Kong) Limited (investment adviser firm, 2017).
Jonathan Davis (1968)
Year of Election or Appointment: 2010
Assistant Treasurer
Mr. Davis also serves as Assistant Treasurer of other funds. Mr. Davis serves as Assistant Treasurer of FMR Capital, Inc. (2017-present) and is an employee of Fidelity Investments. Previously, Mr. Davis served as Vice President and Associate General Counsel of FMR LLC (diversified financial services company, 2003-2010).
Laura M. Del Prato (1964)
Year of Election or Appointment: 2018
Assistant Treasurer
Ms. Del Prato also serves as an officer of other funds. Ms. Del Prato is an employee of Fidelity Investments (2017-present). Previously, Ms. Del Prato served as President and Treasurer of The North Carolina Capital Management Trust: Cash Portfolio and Term Portfolio (2018-2020). Prior to joining Fidelity Investments, Ms. Del Prato served as a Managing Director and Treasurer of the JPMorgan Mutual Funds (2014-2017). Prior to JPMorgan, Ms. Del Prato served as a partner at Cohen Fund Audit Services (accounting firm, 2012-2013) and KPMG LLP (accounting firm, 2004-2012).
Colm A. Hogan (1973)
Year of Election or Appointment: 2020
Assistant Treasurer
Mr. Hogan also serves as an officer of other funds. Mr. Hogan serves as Assistant Treasurer of FMR Capital, Inc. (2017-present) and is an employee of Fidelity Investments (2005-present). Previously, Mr. Hogan served as Deputy Treasurer of certain Fidelity® funds (2016-2020) and Assistant Treasurer of certain Fidelity® funds (2016-2018).
Pamela R. Holding (1964)
Year of Election or Appointment: 2018
Vice President
Ms. Holding also serves as Vice President of other funds. Ms. Holding serves as Co-Head of Equity (2018-present) and is an employee of Fidelity Investments (2013-present). Previously, Ms. Holding served as Executive Vice President of Fidelity SelectCo, LLC (2019) and as Chief Investment Officer of Fidelity Institutional Asset Management (2013-2018).
Cynthia Lo Bessette (1969)
Year of Election or Appointment: 2019
Secretary and Chief Legal Officer (CLO)
Ms. Lo Bessette also serves as an officer of other funds. Ms. Lo Bessette serves as CLO, Secretary, and Senior Vice President of Fidelity Management & Research Company LLC (investment adviser firm, 2019-present); and CLO of Fidelity Management & Research (Hong Kong) Limited, FMR Investment Management (UK) Limited, and Fidelity Management & Research (Japan) Limited (investment adviser firms, 2019-present). She is a Senior Vice President and Deputy General Counsel of FMR LLC (diversified financial services company, 2019-present), and is an employee of Fidelity Investments. Previously, Ms. Lo Bessette served as CLO, Secretary, and Senior Vice President of FMR Co., Inc. (investment adviser firm, 2019); Secretary of Fidelity SelectCo, LLC and Fidelity Investments Money Management, Inc. (investment adviser firms, 2019). Prior to joining Fidelity Investments, Ms. Lo Bessette was Executive Vice President, General Counsel (2016-2019) and Senior Vice President, Deputy General Counsel (2015-2016) of OppenheimerFunds (investment management company) and Deputy Chief Legal Officer (2013-2015) of Jennison Associates LLC (investment adviser firm).
Chris Maher (1972)
Year of Election or Appointment: 2020
Deputy Treasurer
Mr. Maher also serves as an officer of other funds. Mr. Maher serves as Assistant Treasurer of FMR Capital, Inc. (2017-present), and is an employee of Fidelity Investments (2008-present). Previously, Mr. Maher served as Assistant Treasurer of certain funds (2013-2020); Vice President of Asset Management Compliance (2013), Vice President of the Program Management Group of FMR (investment adviser firm, 2010-2013), and Vice President of Valuation Oversight (2008-2010).
Jason P. Pogorelec (1975)
Year of Election or Appointment: 2020
Chief Compliance Officer
Mr. Pogorelec also serves as Chief Compliance Officer of other funds. Mr. Pogorelec is a senior Vice President of Asset Management Compliance for Fidelity Investments and is an employee of Fidelity Investments (2006-present). Previously, Mr. Pogorelec served as Vice President, Associate General Counsel for Fidelity Investments (2010-2020) and Assistant Secretary of certain Fidelity funds (2015-2020).
Stacie M. Smith (1974)
Year of Election or Appointment: 2016
President and Treasurer
Ms. Smith also serves as an officer of other funds. Ms. Smith serves as Assistant Treasurer of FMR Capital, Inc. (2017-present), is an employee of Fidelity Investments (2009-present), and has served in other fund officer roles. Prior to joining Fidelity Investments, Ms. Smith served as Senior Audit Manager of Ernst & Young LLP (accounting firm, 1996-2009). Previously, Ms. Smith served as Assistant Treasurer (2013-2019) and Deputy Treasurer (2013-2016) of certain Fidelity® funds.
Marc L. Spector (1972)
Year of Election or Appointment: 2016
Assistant Treasurer
Mr. Spector also serves as an officer of other funds. Mr. Spector serves as Assistant Treasurer of FMR Capital, Inc. (2017-present) and is an employee of Fidelity Investments (2016-present). Prior to joining Fidelity Investments, Mr. Spector served as Director at the Siegfried Group (accounting firm, 2013-2016), and prior to Siegfried Group as audit senior manager at Deloitte & Touche LLP (accounting firm, 2005-2013).
Jim Wegmann (1979)
Year of Election or Appointment: 2019
Assistant Treasurer
Mr. Wegmann also serves as Assistant Treasurer of other funds. Mr. Wegmann is an employee of Fidelity Investments (2011-present).
Shareholder Expense Example
As a shareholder, you incur two types of costs: (1) transaction costs, which may include sales charges (loads) on purchase payments or redemption proceeds, as applicable and (2) ongoing costs, which generally include management fees, distribution and/or service (12b-1) fees and other Fund expenses. This Example is intended to help you understand your ongoing costs (in dollars) of investing in a fund and to compare these costs with the ongoing costs of investing in other mutual funds.
The Example is based on an investment of $1,000 invested at the beginning of the period and held for the entire period (May 1, 2020 to October 31, 2020).
Actual Expenses
The first line of the accompanying table provides information about actual account values and actual expenses. You may use the information in this line, together with the amount you invested, to estimate the expenses that you paid over the period. Simply divide your account value by $1,000.00 (for example, an $8,600 account value divided by $1,000.00 = 8.6), then multiply the result by the number in the first line for a class/Fund under the heading entitled "Expenses Paid During Period" to estimate the expenses you paid on your account during this period. If any fund is a shareholder of any underlying mutual funds or exchange-traded funds (ETFs) (the Underlying Funds), such fund indirectly bears its proportional share of the expenses of the Underlying Funds in addition to the direct expenses incurred presented in the table. These fees and expenses are not included in the annualized expense ratio used to calculate the expense estimate in the table below.
Hypothetical Example for Comparison Purposes
The second line of the accompanying table provides information about hypothetical account values and hypothetical expenses based on the actual expense ratio and an assumed rate of return of 5% per year before expenses, which is not the actual return. The hypothetical account values and expenses may not be used to estimate the actual ending account balance or expenses you paid for the period. You may use this information to compare the ongoing costs of investing in the Fund and other funds. To do so, compare this 5% hypothetical example with the 5% hypothetical examples that appear in the shareholder reports of the other funds. If any fund is a shareholder of any Underlying Funds, such fund indirectly bears its proportional share of the expenses of the Underlying Funds in addition to the direct expenses as presented in the table. These fees and expenses are not included in the annualized expense ratio used to calculate the expense estimate in the table below.
Please note that the expenses shown in the table are meant to highlight your ongoing costs only and do not reflect any transaction costs. Therefore, the second line of the table is useful in comparing ongoing costs only, and will not help you determine the relative total costs of owning different funds.
| | Annualized Expense Ratio-A | Beginning
Account Value
May 1, 2020 | Ending
Account Value
October 31, 2020 | Expenses Paid
During Period-B
May 1, 2020
to October 31, 2020 |
| Fidelity Series Canada Fund | - %-C | | | |
| Actual | | $1,000.00 | $1,086.80 | $--D |
| Hypothetical-E | | $1,000.00 | $1,025.14 | $--D |
A Annualized expense ratio reflects expenses net of applicable fee waivers.
B Expenses are equal to the annualized expense ratio, multiplied by the average account value over the period, multiplied by 184/ 366 (to reflect the one-half year period). The fees and expenses of any Underlying Funds are not included in each annualized expense ratio.
C Amount represents less than .005%.
D Amount represents less than $.005.
E 5% return per year before expenses
Distributions (Unaudited)
The fund designates 58% of the dividend distributed during the fiscal year as amounts which may be taken into account as a dividend for the purposes of the maximum rate under section 1(h)(11) of the Internal Revenue Code.
The fund will notify shareholders in January 2021 of amounts for use in preparing 2020 income tax returns.
Proxy Voting Results
A special meeting of shareholders was held on June 9, 2020. The results of votes taken among shareholders on the proposals before them are reported below. Each vote reported represents one dollar of net asset value held on the record date for the meeting.
PROPOSAL 1
To elect a Board of Trustees.
| | # of
Votes | % of
Votes |
| Dennis J. Dirks |
| Affirmative | 91,643,443,973.030 | 98.167 |
| Withheld | 1,711,119,384.419 | 1.833 |
| TOTAL | 93,354,563,357.449 | 100.000 |
| Donald F. Donahue |
| Affirmative | 91,659,003,496.045 | 98.184 |
| Withheld | 1,695,559,852.789 | 1.816 |
| TOTAL | 93,354,563,357.449 | 100.000 |
| Bettina Doulton |
| Affirmative | 91,774,146,516.145 | 98.307 |
| Withheld | 1,580,416,862.377 | 1.693 |
| TOTAL | 93,354,563,357.449 | 100.000 |
| Vicki L. Fuller |
| Affirmative | 91,845,419,368.993 | 98.383 |
| Withheld | 1,509,143,998.591 | 1.617 |
| TOTAL | 93,354,563,357.449 | 100.00 |
| Patricia L. Kampling |
| Affirmative | 91,723,732,274.457 | 98.253 |
| Withheld | 1,630,831,098.411 | 1.747 |
| TOTAL | 93,354,563,357.449 | 100.000 |
| Alan J. Lacy |
| Affirmative | 91,490,319,407.772 | 98.003 |
| Withheld | 1,864,243,948.299 | 1.997 |
| TOTAL | 93,354,563,357.449 | 100.000 |
| Ned C. Lautenbach |
| Affirmative | 91,285,367,239.075 | 97.784 |
| Withheld | 2,069,196,119.052 | 2.216 |
| TOTAL | 93,354,563,357.449 | 100.000 |
| Robert A. Lawrence |
| Affirmative | 91,556,271,429.466 | 98.074 |
| Withheld | 1,798,291,912.707 | 1.926 |
| TOTAL | 93,354,563,357.449 | 100.000 |
| Joseph Mauriello |
| Affirmative | 91,497,480,147.082 | 98.011 |
| Withheld | 1,857,083,211.045 | 1.989 |
| TOTAL | 93,354,563,357.449 | 100.000 |
| Cornelia M. Small |
| Affirmative | 91,606,808,161.438 | 98.128 |
| Withheld | 1,747,755,220.497 | 1.872 |
| TOTAL | 93,354,563,357.449 | 100.000 |
| Garnett A. Smith |
| Affirmative | 91,505,784,053.038 | 98.020 |
| Withheld | 1,848,779,305.090 | 1.980 |
| TOTAL | 93,354,563,357.449 | 100.000 |
| David M. Thomas |
| Affirmative | 91,536,969,704.881 | 98.053 |
| Withheld | 1,817,593,630.919 | 1.947 |
| TOTAL | 93,354,563,357.449 | 100.000 |
| Susan Tomasky |
| Affirmative | 91,697,125,678.165 | 98.225 |
| Withheld | 1,657,437,703.277 | 1.775 |
| TOTAL | 93,354,563,357.449 | 100.000 |
| Michael E. Wiley |
| Affirmative | 91,506,805,575.815 | 98.021 |
| Withheld | 1,847,757,759.985 | 1.979 |
| TOTAL | 93,354,563,357.449 | 100.000 |
PROPOSAL 2
To convert a fundamental investment policy to a non-fundamental investment policy.
| | # of
Votes | % of
Votes |
| Affirmative | 3,040,325,261.113 | 100.000 |
| Against | 0.000 | 0.000 |
| Abstain | 0.000 | 0.000 |
| Broker Non-Vote | 0.000 | 0.000 |
| TOTAL | 3,040,325,261.113 | 100.000 |
|
| Proposal 1 reflects trust wide proposal and voting results. |
SAD-ANN-1220
1.9883882.103
Fidelity® SAI International SMA Completion Fund
Offered exclusively to certain clients of the Adviser or its affiliates - not available for sale to the general public. Fidelity SAI is a product name of Fidelity® funds dedicated to certain programs affiliated with Strategic Advisers LLC.
Annual Report
October 31, 2020
See the inside front cover for important information about access to your fund’s shareholder reports.
Beginning on January 1, 2021, as permitted by regulations adopted by the Securities and Exchange Commission, paper copies of a fund’s shareholder reports will no longer be sent by mail, unless you specifically request paper copies of the reports from the fund or from your financial intermediary, such as a financial advisor, broker-dealer or bank. Instead, the reports will be made available on a website, and you will be notified by mail each time a report is posted and provided with a website link to access the report.
If you already elected to receive shareholder reports electronically, you will not be affected by this change and you need not take any action. You may elect to receive shareholder reports and other communications from a fund electronically, by contacting your financial intermediary. For Fidelity customers, visit Fidelity's web site or call Fidelity using the contact information listed below.
You may elect to receive all future reports in paper free of charge. If you wish to continue receiving paper copies of your shareholder reports, you may contact your financial intermediary or, if you are a Fidelity customer, visit Fidelity’s website, or call Fidelity at the applicable toll-free number listed below. Your election to receive reports in paper will apply to all funds held with the fund complex/your financial intermediary.
| Account Type | Website | Phone Number |
| Brokerage, Mutual Fund, or Annuity Contracts: | fidelity.com/mailpreferences | 1-800-343-3548 |
| Employer Provided Retirement Accounts: | netbenefits.fidelity.com/preferences (choose 'no' under Required Disclosures to continue to print) | 1-800-343-0860 |
| Advisor Sold Accounts Serviced Through Your Financial Intermediary: | Contact Your Financial Intermediary | Your Financial Intermediary's phone number |
| Advisor Sold Accounts Serviced by Fidelity: | institutional.fidelity.com | 1-877-208-0098 |
Contents
To view a fund's proxy voting guidelines and proxy voting record for the 12-month period ended June 30, visit http://www.fidelity.com/proxyvotingresults or visit the Securities and Exchange Commission's (SEC) web site at http://www.sec.gov.
You may also call 1-800-544-3455 to request a free copy of the proxy voting guidelines.
Standard & Poor's, S&P and S&P 500 are registered service marks of The McGraw-Hill Companies, Inc. and have been licensed for use by Fidelity Distributors Corporation.
Other third-party marks appearing herein are the property of their respective owners.
All other marks appearing herein are registered or unregistered trademarks or service marks of FMR LLC or an affiliated company. © 2020 FMR LLC. All rights reserved.
This report and the financial statements contained herein are submitted for the general information of the shareholders of the Fund. This report is not authorized for distribution to prospective investors in the Fund unless preceded or accompanied by an effective prospectus.
A fund files its complete schedule of portfolio holdings with the SEC for the first and third quarters of each fiscal year on Form N-PORT. Forms N-PORT are available on the SEC’s web site at http://www.sec.gov. A fund's Forms N-PORT may be reviewed and copied at the SEC’s Public Reference Room in Washington, DC. Information regarding the operation of the SEC's Public Reference Room may be obtained by calling 1-800-SEC-0330.
For a complete list of a fund's portfolio holdings, view the most recent holdings listing, semiannual report, or annual report on Fidelity's web site at http://www.fidelity.com, http://www.institutional.fidelity.com, or http://www.401k.com, as applicable.
NOT FDIC INSURED •MAY LOSE VALUE •NO BANK GUARANTEE
Neither the Fund nor Fidelity Distributors Corporation is a bank.
Note to Shareholders:
Early in 2020, the outbreak and spread of a new coronavirus emerged as a public health emergency that had a major influence on financial markets, primarily based on its impact on the global economy and the outlook for corporate earnings. The virus causes a respiratory disease known as COVID-19. On March 11, the World Health Organization declared the COVID-19 outbreak a pandemic, citing sustained risk of further global spread.
In the weeks following, as the crisis worsened, we witnessed an escalating human tragedy with wide-scale social and economic consequences from coronavirus-containment measures. The outbreak of COVID-19 prompted a number of measures to limit the spread, including travel and border restrictions, quarantines, and restrictions on large gatherings. In turn, these resulted in lower consumer activity, diminished demand for a wide range of products and services, disruption in manufacturing and supply chains, and – given the wide variability in outcomes regarding the outbreak – significant market uncertainty and volatility. Amid the turmoil, global governments and central banks took unprecedented action to help support consumers, businesses, and the broader economies, and to limit disruption to financial systems.
The situation continues to unfold, and the extent and duration of its impact on financial markets and the economy remain highly uncertain. Extreme events such as the coronavirus crisis are “exogenous shocks” that can have significant adverse effects on mutual funds and their investments. Although multiple asset classes may be affected by market disruption, the duration and impact may not be the same for all types of assets.
Fidelity is committed to helping you stay informed amid news about COVID-19 and during increased market volatility, and we’re taking extra steps to be responsive to customer needs. We encourage you to visit our websites, where we offer ongoing updates, commentary, and analysis on the markets and our funds.
Performance: The Bottom Line
Average annual total return reflects the change in the value of an investment, assuming reinvestment of distributions from dividend income and capital gains (the profits earned upon the sale of securities that have grown in value, if any) and assuming a constant rate of performance each year. The hypothetical investment and the average annual total returns do not reflect the deduction of taxes that a shareholder would pay on fund distributions or the redemption of fund shares. During periods of reimbursement by Fidelity, a fund’s total return will be greater than it would be had the reimbursement not occurred. How a fund did yesterday is no guarantee of how it will do tomorrow.
Average Annual Total Returns
| For the periods ended October 31, 2020 | Past 1 year | Life of fundA |
| Fidelity® SAI International SMA Completion Fund | 18.57% | 14.88% |
A From April 11, 2019
$10,000 Over Life of Fund
Let's say hypothetically that $10,000 was invested in Fidelity® SAI International SMA Completion Fund on April 11, 2019, when the fund started.
The chart shows how the value of your investment would have changed, and also shows how the MSCI EAFE Index performed over the same period.
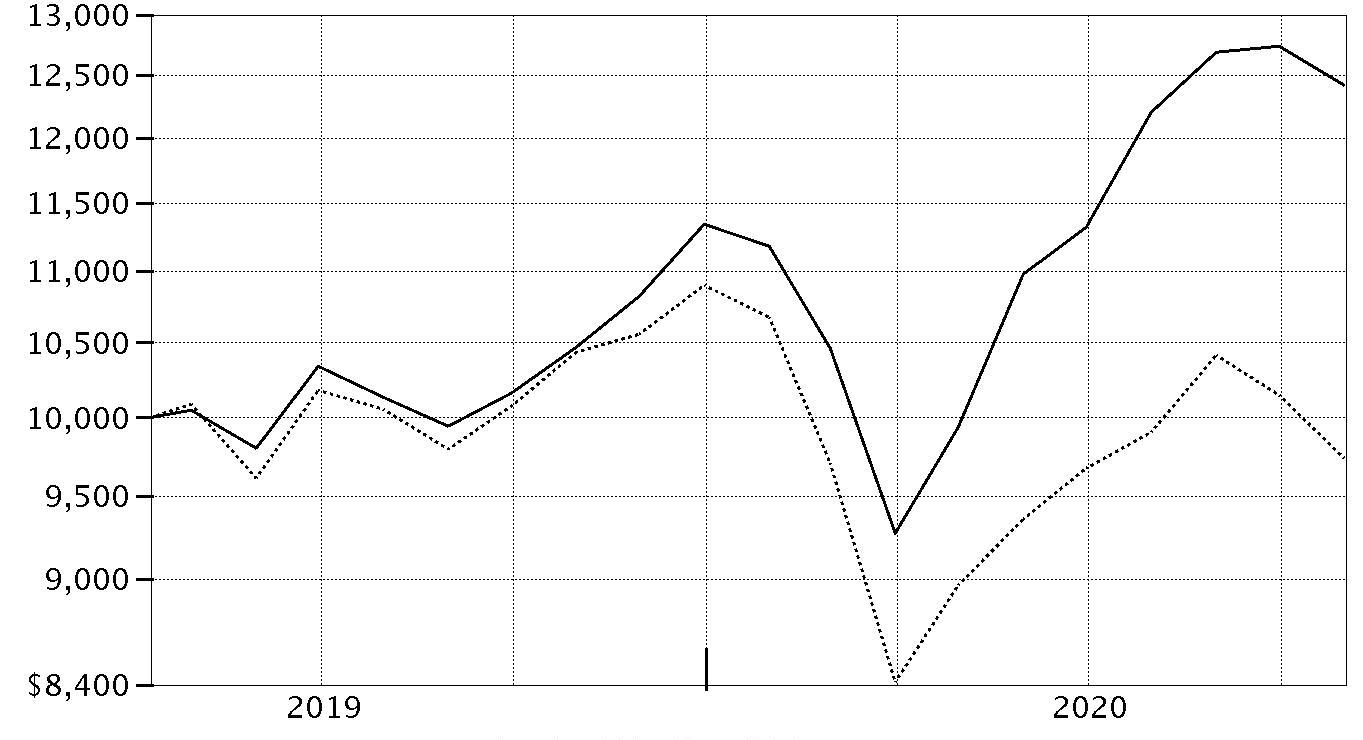
| Period Ending Values |
| $12,415 | Fidelity® SAI International SMA Completion Fund |
| $9,739 | MSCI EAFE Index |
Management's Discussion of Fund Performance
Market Recap: The MSCI ACWI (All Country World Index) ex USA Index returned -2.46% for the 12 months ending October 31, 2020, in what was a bumpy ride for non-U.S. equities, marked by a steep but brief decline due to the early-2020 outbreak and spread of the coronavirus, followed by a sharp upturn. Declared a pandemic on March 11, the crisis and containment efforts caused broad contraction in economic activity, elevated volatility and dislocation in financial markets. A historically rapid and expansive monetary- and fiscal-policy response around the world provided a partial offset to the economic disruption. Other supporting factors included resilient corporate earnings and near-term potential for a COVID-19 vaccine breakthrough. This was evident in the index’s 12.28% gain in the final six months of the year. Currency fluctuation generally boosted foreign developed-markets equities for the year, while the reverse was true for emerging-markets stocks. Late in the period, the index was pressured by a second wave of COVID-19 cases in some regions, and stretched valuations and crowded positioning in big tech. For the full year, the U.K. (-22%), Asia Pacific ex Japan (-8%), Canada (-5%) and Europe ex U.K. (-4%) notably lagged. Emerging markets (+9%) and Japan (+1%) outperformed. By sector, energy (-38%), financials and real estate (-20% each) lagged, whereas information technology (+ 25%) and communication services (+15%) topped the index.
Comments from Co-Managers Bill Bower and Tim Gannon: For the fiscal year ending October 31, 2020, the fund gained 18.57%, outperforming the -6.69% result of the benchmark MSCI EAFE Index (Net MA). From a regional standpoint, security selection in Europe ex U.K. and Japan contributed to the fund's relative result. By sector, the top contributor to performance versus the benchmark were stock picks in industrials. Strong picks in the consumer staples sector, primarily driven by the food & staples retailing industry, also lifted the fund's relative result. Also lifting the fund's relative result was security selection in communication services. The biggest individual relative contributor was an overweight position in Kingspan Group (+65%). Kingspan was among our biggest holdings. Also helping performance was our outsized stake in Keyence, which gained approximately 43%. We increased our stake the past year and it was our largest holding at period end. Another notable relative contributor was an overweighting in Orsted (+82%), which was one of our largest holdings as of October 31. By sector, the largest detractor from performance versus the benchmark was an underweighting in health care. An overweighting in the financials sector, primarily within the insurance industry, also hurt the fund's relative result. Also hampering the fund's relative result was an underweighting in materials. Our non-benchmark stake in Capitec Bank Holdings was the fund's biggest individual relative detractor, due to its roughly -48% result. Positions in Capitec Bank Holdings were sold the past 12 months. Another key detractor was our out-of-benchmark position in Hiscox (-44%), a position not held at period end. Avoiding ASML Holding, a benchmark component that gained 40%, also hurt performance. Notable changes in positioning include increased exposure to Germany and a lower allocation to India. By sector, meaningful changes in positioning include increased exposure to communication services and a lower allocation to financials.
The views expressed above reflect those of the portfolio manager(s) only through the end of the period as stated on the cover of this report and do not necessarily represent the views of Fidelity or any other person in the Fidelity organization. Any such views are subject to change at any time based upon market or other conditions and Fidelity disclaims any responsibility to update such views. These views may not be relied on as investment advice and, because investment decisions for a Fidelity fund are based on numerous factors, may not be relied on as an indication of trading intent on behalf of any Fidelity fund.
Investment Summary (Unaudited)
Geographic Diversification (% of fund's net assets)
| As of October 31, 2020 |
| | Japan | 30.7% |
| | Germany | 10.4% |
| | France | 9.8% |
| | India | 7.4% |
| | Ireland | 6.8% |
| | Canada | 5.0% |
| | Norway | 4.8% |
| | Denmark | 4.5% |
| | Spain | 3.1% |
| | Other* | 17.5% |
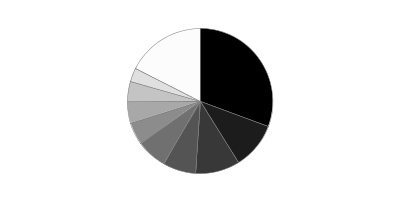
* Includes Short-Term investments and Net Other Assets (Liabilities).
Percentages are based on country or territory of incorporation and are adjusted for the effect of futures contracts, if applicable.
Asset Allocation as of October 31, 2020
| | % of fund's net assets |
| Stocks | 97.0 |
| Short-Term Investments and Net Other Assets (Liabilities) | 3.0 |
Top Ten Stocks as of October 31, 2020
| | % of fund's net assets |
| Keyence Corp. (Japan, Electronic Equipment & Components) | 6.5 |
| SR Teleperformance SA (France, Professional Services) | 5.2 |
| Kingspan Group PLC (Ireland) (Ireland, Building Products) | 5.2 |
| Schibsted ASA (A Shares) (Norway, Media) | 4.8 |
| Minebea Mitsumi, Inc. (Japan, Machinery) | 4.7 |
| ORSTED A/S (Denmark, Electric Utilities) | 4.5 |
| Nitori Holdings Co. Ltd. (Japan, Specialty Retail) | 4.2 |
| Infosys Ltd. sponsored ADR (India, IT Services) | 4.1 |
| Hannover Reuck SE (Germany, Insurance) | 3.4 |
| Tsuruha Holdings, Inc. (Japan, Food & Staples Retailing) | 3.3 |
| | 45.9 |
Top Market Sectors as of October 31, 2020
| | % of fund's net assets |
| Industrials | 27.0 |
| Financials | 16.7 |
| Information Technology | 15.0 |
| Consumer Staples | 11.1 |
| Communication Services | 9.0 |
| Consumer Discretionary | 7.1 |
| Utilities | 4.5 |
| Real Estate | 2.9 |
| Health Care | 2.8 |
| Materials | 0.9 |
Schedule of Investments October 31, 2020
Showing Percentage of Net Assets
| Common Stocks - 97.0% | | | |
| | | Shares | Value |
| Australia - 2.3% | | | |
| Magellan Financial Group Ltd. | | 185,620 | $7,194,360 |
| Belgium - 1.4% | | | |
| UCB SA | | 44,844 | 4,423,675 |
| Canada - 5.0% | | | |
| Alimentation Couche-Tard, Inc. Class B (sub. vtg.) | | 325,740 | 10,031,609 |
| Constellation Software, Inc. | | 5,598 | 5,876,534 |
|
| TOTAL CANADA | | | 15,908,143 |
|
| Denmark - 4.5% | | | |
| ORSTED A/S (a) | | 90,288 | 14,329,971 |
| France - 9.8% | | | |
| Amundi SA (a) | | 95,641 | 6,271,161 |
| Capgemini SA | | 27,212 | 3,141,990 |
| Edenred SA | | 112,286 | 5,236,187 |
| SR Teleperformance SA | | 55,656 | 16,704,052 |
|
| TOTAL FRANCE | | | 31,353,390 |
|
| Germany - 10.4% | | | |
| Allianz SE | | 53,480 | 9,408,845 |
| Hannover Reuck SE | | 75,582 | 10,976,914 |
| Scout24 AG (a) | | 43,380 | 3,493,632 |
| Vonovia SE | | 146,898 | 9,378,866 |
|
| TOTAL GERMANY | | | 33,258,257 |
|
| India - 7.4% | | | |
| HDFC Bank Ltd. sponsored ADR (b) | | 182,100 | 10,459,824 |
| Infosys Ltd. sponsored ADR | | 910,541 | 12,993,420 |
|
| TOTAL INDIA | | | 23,453,244 |
|
| Indonesia - 2.7% | | | |
| PT Bank Central Asia Tbk | | 2,654,906 | 5,223,941 |
| PT Bank Rakyat Indonesia Tbk | | 15,498,884 | 3,508,513 |
|
| TOTAL INDONESIA | | | 8,732,454 |
|
| Ireland - 6.8% | | | |
| Kerry Group PLC Class A | | 41,669 | 4,984,011 |
| Kingspan Group PLC (Ireland) | | 190,303 | 16,589,484 |
|
| TOTAL IRELAND | | | 21,573,495 |
|
| Italy - 1.4% | | | |
| Recordati SpA | | 84,771 | 4,392,433 |
| Japan - 30.7% | | | |
| Itochu Corp. | | 401,137 | 9,634,717 |
| Keyence Corp. | | 45,501 | 20,649,378 |
| Minebea Mitsumi, Inc. | | 828,891 | 14,970,898 |
| Misumi Group, Inc. | | 172,723 | 5,129,799 |
| Nabtesco Corp. | | 125,913 | 4,703,889 |
| Nitori Holdings Co. Ltd. | | 64,741 | 13,307,945 |
| Recruit Holdings Co. Ltd. | | 241,063 | 9,172,610 |
| Tsuruha Holdings, Inc. | | 75,949 | 10,634,762 |
| Welcia Holdings Co. Ltd. | | 243,346 | 9,537,053 |
|
| TOTAL JAPAN | | | 97,741,051 |
|
| Luxembourg - 2.9% | | | |
| B&M European Value Retail SA | | 1,473,770 | 9,256,136 |
| Norway - 4.8% | | | |
| Schibsted ASA (A Shares) | | 373,169 | 15,213,439 |
| Spain - 3.1% | | | |
| Cellnex Telecom SA (a) | | 153,710 | 9,867,491 |
| Sweden - 2.9% | | | |
| Indutrade AB (b) | | 182,331 | 9,249,327 |
| Switzerland - 0.9% | | | |
| Sika AG | | 11,633 | 2,863,371 |
| TOTAL COMMON STOCKS | | | |
| (Cost $251,028,693) | | | 308,810,237 |
|
| Money Market Funds - 3.3% | | | |
| Fidelity Cash Central Fund 0.10% (c) | | | |
| (Cost $10,400,222) | | 10,398,143 | 10,400,222 |
| TOTAL INVESTMENT IN SECURITIES - 100.3% | | | |
| (Cost $261,428,915) | | | 319,210,459 |
| NET OTHER ASSETS (LIABILITIES) - (0.3)% | | | (848,616) |
| NET ASSETS - 100% | | | $318,361,843 |
Categorizations in the Schedule of Investments are based on country or territory of incorporation.
Legend
(a) Security exempt from registration under Rule 144A of the Securities Act of 1933. These securities may be resold in transactions exempt from registration, normally to qualified institutional buyers. At the end of the period, the value of these securities amounted to $33,962,255 or 10.7% of net assets.
(b) Non-income producing
(c) Affiliated fund that is generally available only to investment companies and other accounts managed by Fidelity Investments. The rate quoted is the annualized seven-day yield of the fund at period end. A complete unaudited listing of the fund's holdings as of its most recent quarter end is available upon request. In addition, each Fidelity Central Fund's financial statements, which are not covered by the Fund's Report of Independent Registered Public Accounting Firm, are available on the SEC's website or upon request.
Affiliated Central Funds
Information regarding fiscal year to date income earned by the Fund from investments in Fidelity Central Funds is as follows:
| Fund | Income earned |
| Fidelity Cash Central Fund | $26,648 |
| Total | $26,648 |
Amounts in the income column in the above table include any capital gain distributions from underlying funds, which are presented in the corresponding line-item in the Statement of Operations, if applicable.
Investment Valuation
The following is a summary of the inputs used, as of October 31, 2020, involving the Fund's assets and liabilities carried at fair value. The inputs or methodology used for valuing securities may not be an indication of the risk associated with investing in those securities. For more information on valuation inputs, and their aggregation into the levels used below, please refer to the Investment Valuation section in the accompanying Notes to Financial Statements.
| | Valuation Inputs at Reporting Date: |
| Description | Total | Level 1 | Level 2 | Level 3 |
| Investments in Securities: | | | | |
| Equities: | | | | |
| Communication Services | $28,574,562 | $28,574,562 | $-- | $-- |
| Consumer Discretionary | 22,564,081 | 9,256,136 | 13,307,945 | -- |
| Consumer Staples | 35,187,435 | 15,015,620 | 20,171,815 | -- |
| Financials | 53,043,558 | 37,116,744 | 15,926,814 | -- |
| Health Care | 8,816,108 | 8,816,108 | -- | -- |
| Industrials | 86,154,776 | 42,542,863 | 43,611,913 | -- |
| Information Technology | 47,897,509 | 27,248,131 | 20,649,378 | -- |
| Materials | 2,863,371 | 2,863,371 | -- | -- |
| Real Estate | 9,378,866 | 9,378,866 | -- | -- |
| Utilities | 14,329,971 | 14,329,971 | -- | -- |
| Money Market Funds | 10,400,222 | 10,400,222 | -- | -- |
| Total Investments in Securities: | $319,210,459 | $205,542,594 | $113,667,865 | $-- |
See accompanying notes which are an integral part of the financial statements.
Financial Statements
Statement of Assets and Liabilities
| | | October 31, 2020 |
| Assets | | |
Investment in securities, at value — See accompanying schedule:
Unaffiliated issuers (cost $251,028,693) | $308,810,237 | |
| Fidelity Central Funds (cost $10,400,222) | 10,400,222 | |
| Total Investment in Securities (cost $261,428,915) | | $319,210,459 |
| Receivable for fund shares sold | | 966,055 |
| Dividends receivable | | 642,878 |
| Distributions receivable from Fidelity Central Funds | | 800 |
| Other receivables | | 11,088 |
| Total assets | | 320,831,280 |
| Liabilities | | |
| Payable for investments purchased | $2,416,763 | |
| Payable for fund shares redeemed | 52,674 | |
| Total liabilities | | 2,469,437 |
| Net Assets | | $318,361,843 |
| Net Assets consist of: | | |
| Paid in capital | | $261,145,155 |
| Total accumulated earnings (loss) | | 57,216,688 |
| Net Assets | | $318,361,843 |
| Net Asset Value, offering price and redemption price per share ($318,361,843 ÷ 25,709,350 shares) | | $12.38 |
See accompanying notes which are an integral part of the financial statements.
Statement of Operations
| | | Year ended October 31, 2020 |
| Investment Income | | |
| Dividends | | $2,727,388 |
| Special dividends | | 336,358 |
| Income from Fidelity Central Funds | | 26,648 |
| Income before foreign taxes withheld | | 3,090,394 |
| Less foreign taxes withheld | | (355,769) |
| Total income | | 2,734,625 |
| Expenses | | |
| Independent trustees' fees and expenses | $850 | |
| Proxy | 1,997 | |
| Commitment fees | 286 | |
| Total expenses | | 3,133 |
| Net investment income (loss) | | 2,731,492 |
| Realized and Unrealized Gain (Loss) | | |
| Net realized gain (loss) on: | | |
| Investment securities: | | |
| Unaffiliated issuers | (2,906,480) | |
| Fidelity Central Funds | (626) | |
| Foreign currency transactions | 39,768 | |
| Total net realized gain (loss) | | (2,867,338) |
| Change in net unrealized appreciation (depreciation) on: | | |
| Investment securities: | | |
| Unaffiliated issuers | 56,119,517 | |
| Assets and liabilities in foreign currencies | 9,079 | |
| Total change in net unrealized appreciation (depreciation) | | 56,128,596 |
| Net gain (loss) | | 53,261,258 |
| Net increase (decrease) in net assets resulting from operations | | $55,992,750 |
See accompanying notes which are an integral part of the financial statements.
Statement of Changes in Net Assets
| | Year ended October 31, 2020 | For the period
April 11, 2019 (commencement of operations) to October 31, 2019 |
| Increase (Decrease) in Net Assets | | |
| Operations | | |
| Net investment income (loss)�� | $2,731,492 | $115,056 |
| Net realized gain (loss) | (2,867,338) | (259,549) |
| Change in net unrealized appreciation (depreciation) | 56,128,596 | 1,662,675 |
| Net increase (decrease) in net assets resulting from operations | 55,992,750 | 1,518,182 |
| Distributions to shareholders | (161,972) | – |
| Share transactions | | |
| Proceeds from sales of shares | 253,879,930 | 46,327,763 |
| Reinvestment of distributions | 81,661 | – |
| Cost of shares redeemed | (38,266,771) | (1,009,700) |
| Net increase (decrease) in net assets resulting from share transactions | 215,694,820 | 45,318,063 |
| Total increase (decrease) in net assets | 271,525,598 | 46,836,245 |
| Net Assets | | |
| Beginning of period | 46,836,245 | – |
| End of period | $318,361,843 | $46,836,245 |
| Other Information | | |
| Shares | | |
| Sold | 24,908,068 | 4,575,369 |
| Issued in reinvestment of distributions | 7,357 | – |
| Redeemed | (3,680,692) | (100,752) |
| Net increase (decrease) | 21,234,733 | 4,474,617 |
See accompanying notes which are an integral part of the financial statements.
Financial Highlights
Fidelity SAI International SMA Completion Fund
| | | |
| Years ended October 31, | 2020 | 2019 A |
| Selected Per–Share Data | | |
| Net asset value, beginning of period | $10.47 | $10.00 |
| Income from Investment Operations | | |
| Net investment income (loss)B | .17C | .08 |
| Net realized and unrealized gain (loss) | 1.77 | .39 |
| Total from investment operations | 1.94 | .47 |
| Distributions from net investment income | (.03) | – |
| Total distributions | (.03) | – |
| Net asset value, end of period | $12.38 | $10.47 |
| Total ReturnD | 18.57% | 4.70% |
| Ratios to Average Net AssetsE,F | | |
| Expenses before reductionsG | -% | - %H |
| Expenses net of fee waivers, if anyG | -% | - %H |
| Expenses net of all reductionsG | -% | - %H |
| Net investment income (loss) | 1.45%C | 1.41%H |
| Supplemental Data | | |
| Net assets, end of period (000 omitted) | $318,362 | $46,836 |
| Portfolio turnover rateI | 17% | 24%H |
A For the period April 11, 2019 (commencement of operations) to October 31, 2019.
B Calculated based on average shares outstanding during the period.
C Net investment income per share reflects one or more large, non-recurring dividend(s) which amounted to $.02 per share. Excluding such non-recurring dividend(s), the ratio of net investment income (loss) to average net assets would have been 1.28%.
D Total returns for periods of less than one year are not annualized.
E Fees and expenses of any underlying mutual funds or exchange-traded funds (ETFs) are not included in the Fund's expense ratio. The Fund indirectly bears its proportionate share of these expenses. For additional expense information related to investments in Fidelity Central Funds, please refer to the "Investments in Fidelity Central Funds" note found in the Notes to Financial Statements section of the most recent Annual or Semi-Annual report.
F Expense ratios reflect operating expenses of the class. Expenses before reductions do not reflect amounts reimbursed, waived, or reduced through arrangements with the investment advisor, brokerage services, or other offset arrangements, if applicable, and do not represent the amount paid by the class during periods when reimbursements, waivers or reductions occur.
G Amount represents less than .005%.
H Annualized
I Amount does not include the portfolio activity of any underlying mutual funds or exchange-traded funds (ETFs).
See accompanying notes which are an integral part of the financial statements.
Notes to Financial Statements
For the period ended October 31, 2020
1. Organization.
Fidelity SAI International SMA Completion Fund (the Fund) is a non-diversified fund of Fidelity Investment Trust (the Trust) and is authorized to issue an unlimited number of shares. Shares are offered exclusively to certain clients of Fidelity Management & Research Company LLC (FMR) or its affiliates. The Trust is registered under the Investment Company Act of 1940, as amended (the 1940 Act), as an open-end management investment company organized as a Massachusetts business trust. The Fund's investments in emerging markets can be subject to social, economic, regulatory, and political uncertainties and can be extremely volatile.
Effective January 1, 2020:
Investment advisers Fidelity Investments Money Management, Inc., FMR Co., Inc., and Fidelity SelectCo, LLC, merged with and into Fidelity Management & Research Company. In connection with the merger transactions, the resulting, merged investment adviser was then redomiciled from Massachusetts to Delaware, changed its corporate structure from a corporation to a limited liability company, and changed its name to "Fidelity Management & Research Company LLC".
2. Investments in Fidelity Central Funds.
The Fund invests in Fidelity Central Funds, which are open-end investment companies generally available only to other investment companies and accounts managed by the investment adviser and its affiliates. The Fund's Schedule of Investments lists each of the Fidelity Central Funds held as of period end, if any, as an investment of the Fund, but does not include the underlying holdings of each Fidelity Central Fund. As an Investing Fund, the Fund indirectly bears its proportionate share of the expenses of the underlying Fidelity Central Funds.
The Money Market Central Funds seek preservation of capital and current income and are managed by the investment adviser. Annualized expenses of the Money Market Central Funds as of their most recent shareholder report date ranged from less than .005% to .01%.
A complete unaudited list of holdings for each Fidelity Central Fund is available upon request or at the Securities and Exchange Commission (the SEC) website at www.sec.gov. In addition, the financial statements of the Fidelity Central Funds, which are not covered by the Fund's Report of Independent Registered Public Accounting Firm, are available on the SEC website or upon request.
3. Significant Accounting Policies.
The Fund is an investment company and applies the accounting and reporting guidance of the Financial Accounting Standards Board (FASB) Accounting Standards Codification Topic 946 Financial Services – Investment Companies. The financial statements have been prepared in conformity with accounting principles generally accepted in the United States of America (GAAP), which require management to make certain estimates and assumptions at the date of the financial statements. Actual results could differ from those estimates. Subsequent events, if any, through the date that the financial statements were issued have been evaluated in the preparation of the financial statements. The following summarizes the significant accounting policies of the Fund:
Investment Valuation. Investments are valued as of 4:00 p.m. Eastern time on the last calendar day of the period. The Board of Trustees (the Board) has delegated the day to day responsibility for the valuation of the Fund's investments to the Fair Value Committee (the Committee) established by the Fund's investment adviser. In accordance with valuation policies and procedures approved by the Board, the Fund attempts to obtain prices from one or more third party pricing vendors or brokers to value its investments. When current market prices, quotations or currency exchange rates are not readily available or reliable, investments will be fair valued in good faith by the Committee, in accordance with procedures adopted by the Board. Factors used in determining fair value vary by investment type and may include market or investment specific events. The frequency with which these procedures are used cannot be predicted and they may be utilized to a significant extent. The Committee oversees the Fund's valuation policies and procedures and reports to the Board on the Committee's activities and fair value determinations. The Board monitors the appropriateness of the procedures used in valuing the Fund's investments and ratifies the fair value determinations of the Committee.
The Fund categorizes the inputs to valuation techniques used to value its investments into a disclosure hierarchy consisting of three levels as shown below:
- Level 1 – quoted prices in active markets for identical investments
- Level 2 – other significant observable inputs (including quoted prices for similar investments, interest rates, prepayment speeds, etc.)
- Level 3 – unobservable inputs (including the Fund's own assumptions based on the best information available)
Valuation techniques used to value the Fund's investments by major category are as follows:
Equity securities, including restricted securities, for which market quotations are readily available, are valued at the last reported sale price or official closing price as reported by a third party pricing vendor on the primary market or exchange on which they are traded and are categorized as Level 1 in the hierarchy. In the event there were no sales during the day or closing prices are not available, securities are valued at the last quoted bid price or may be valued using the last available price and are generally categorized as Level 2 in the hierarchy. For foreign equity securities, when market or security specific events arise, comparisons to the valuation of American Depositary Receipts (ADRs), futures contracts, Exchange-Traded Funds (ETFs) and certain indexes as well as quoted prices for similar securities may be used and would be categorized as Level 2 in the hierarchy. For equity securities, including restricted securities, where observable inputs are limited, assumptions about market activity and risk are used and these securities may be categorized as Level 3 in the hierarchy.
Investments in open-end mutual funds, including the Fidelity Central Funds, are valued at their closing net asset value (NAV) each business day and are categorized as Level 1 in the hierarchy.
Changes in valuation techniques may result in transfers in or out of an assigned level within the disclosure hierarchy. The aggregate value of investments by input level as of October 31, 2020 is included at the end of the Fund's Schedule of Investments.
Foreign Currency. Certain Funds may use foreign currency contracts to facilitate transactions in foreign-denominated securities. Gains and losses from these transactions may arise from changes in the value of the foreign currency or if the counterparties do not perform under the contracts' terms.
Foreign-denominated assets, including investment securities, and liabilities are translated into U.S. dollars at the exchange rates at period end. Purchases and sales of investment securities, income and dividends received, and expenses denominated in foreign currencies are translated into U.S. dollars at the exchange rate in effect on the transaction date.
The effects of exchange rate fluctuations on investments are included with the net realized and unrealized gain (loss) on investment securities. Other foreign currency transactions resulting in realized and unrealized gain (loss) are disclosed separately.
Investment Transactions and Income. For financial reporting purposes, the Fund's investment holdings and NAV include trades executed through the end of the last business day of the period. The NAV per share for processing shareholder transactions is calculated as of the close of business of the New York Stock Exchange (NYSE), normally 4:00 p.m. Eastern time and includes trades executed through the end of the prior business day. Gains and losses on securities sold are determined on the basis of identified cost. Dividend income is recorded on the ex-dividend date, except for certain dividends from foreign securities where the ex-dividend date may have passed, which are recorded as soon as the Fund is informed of the ex-dividend date. Non-cash dividends included in dividend income, if any, are recorded at the fair market value of the securities received. Income and capital gain distributions from Fidelity Central Funds, if any, are recorded on the ex-dividend date. Large, non-recurring dividends recognized by the Fund are presented separately on the Statement of Operations as "Special Dividends" and the impact of these dividends is presented in the Financial Highlights. Investment income is recorded net of foreign taxes withheld where recovery of such taxes is uncertain.
Expenses. Expenses directly attributable to a fund are charged to that fund. Expenses attributable to more than one fund are allocated among the respective funds on the basis of relative net assets or other appropriate methods. Expense estimates are accrued in the period to which they relate and adjustments are made when actual amounts are known.
Income Tax Information and Distributions to Shareholders. Each year, the Fund intends to qualify as a regulated investment company under Subchapter M of the Internal Revenue Code, including distributing substantially all of its taxable income and realized gains. As a result, no provision for U.S. Federal income taxes is required. As of October 31, 2020, the Fund did not have any unrecognized tax benefits in the financial statements; nor is the Fund aware of any tax positions for which it is reasonably possible that the total amounts of unrecognized tax benefits will significantly change in the next twelve months. The Fund files a U.S. federal tax return, in addition to state and local tax returns as required. The Fund's federal income tax returns are subject to examination by the Internal Revenue Service (IRS) for a period of three fiscal years after they are filed. State and local tax returns may be subject to examination for an additional fiscal year depending on the jurisdiction. Foreign taxes are provided for based on the Fund's understanding of the tax rules and rates that exist in the foreign markets in which it invests.
Distributions are declared and recorded on the ex-dividend date. Income and capital gain distributions are determined in accordance with income tax regulations, which may differ from GAAP. In addition, the Fund claimed a portion of the payment made to redeeming shareholders as a distribution for income tax purposes.
Capital accounts within the financial statements are adjusted for permanent book-tax differences. These adjustments have no impact on net assets or the results of operations. Capital accounts are not adjusted for temporary book-tax differences which will reverse in a subsequent period.
Book-tax differences are primarily due to foreign currency transactions, capital loss carryforwards and losses deferred due to wash sales.
As of period end, the cost and unrealized appreciation (depreciation) in securities, and derivatives if applicable, for federal income tax purposes were as follows:
| Gross unrealized appreciation | $65,146,036 |
| Gross unrealized depreciation | (7,565,871) |
| Net unrealized appreciation (depreciation) | $57,580,165 |
| Tax Cost | $261,630,294 |
The tax-based components of distributable earnings as of period end were as follows:
| Undistributed ordinary income | $2,581,341 |
| Capital loss carryforward | $(2,954,545) |
| Net unrealized appreciation (depreciation) on securities and other investments | $57,589,892 |
Capital loss carryforwards are only available to offset future capital gains of the Fund to the extent provided by regulations and may be limited. The capital loss carryforward information presented below, including any applicable limitation, is estimated as of fiscal period end and is subject to adjustment.
| No expiration | |
| Short-term | $(2,874,207) |
| Long-term | (80,338) |
| Total capital loss carryforward | $(2,954,545) |
The tax character of distributions paid was as follows:
| | October 31, 2020 | October 31, 2019(a) |
| Ordinary Income | $161,972 | $ - |
(a) For the period April 11, 2019 (commencement of operations) to October 31, 2019.
Restricted Securities (including Private Placements). The Fund may invest in securities that are subject to legal or contractual restrictions on resale. These securities generally may be resold in transactions exempt from registration or to the public if the securities are registered. Disposal of these securities may involve time-consuming negotiations and expense, and prompt sale at an acceptable price may be difficult. Information regarding restricted securities is included at the end of the Fund's Schedule of Investments.
4. Purchases and Sales of Investments.
Purchases and sales of securities, other than short-term securities, are noted in the table below.
| | Purchases ($) | Sales ($) |
| Fidelity SAI International SMA Completion Fund | 240,364,328 | 30,246,531 |
5. Fees and Other Transactions with Affiliates.
Management Fee. Fidelity Management & Research Company LLC (the investment adviser) and its affiliates provide the Fund with investment management related services and the Fund does not pay any fees for these services. Under the management contract, the investment adviser or an affiliate pays all other expenses of the Fund, excluding fees and expenses of the independent Trustees, and certain miscellaneous expenses such as proxy and shareholder meeting expenses.
Brokerage Commissions. A portion of portfolio transactions were placed with brokerage firms which are affiliates of the investment adviser. Brokerage commissions are included in net realized gain (loss) and change in net unrealized appreciation (depreciation) in the Statement of Operations. The commissions paid to these affiliated firms were as follows:
| | Amount |
| Fidelity SAI International SMA Completion Fund | $879 |
Interfund Trades. Funds may purchase from or sell securities to other Fidelity Funds under procedures adopted by the Board. The procedures have been designed to ensure these interfund trades are executed in accordance with Rule 17a-7 of the 1940 Act. Interfund trades are included within the respective purchases and sales amounts shown in the Purchases and Sales of Investments note.
6. Committed Line of Credit.
Certain Funds participate with other funds managed by the investment adviser or an affiliate in a $4.25 billion credit facility (the "line of credit") to be utilized for temporary or emergency purposes to fund shareholder redemptions or for other short-term liquidity purposes. The participating funds have agreed to pay commitment fees on their pro-rata portion of the line of credit, which are reflected in Commitment fees on the Statement of Operations, and are as follows:
| | Amount |
| Fidelity SAI International SMA Completion Fund | $286 |
During the period, there were no borrowings on this line of credit.
7. Other.
The Fund's organizational documents provide former and current trustees and officers with a limited indemnification against liabilities arising in connection with the performance of their duties to the Fund. In the normal course of business, the Fund may also enter into contracts that provide general indemnifications. The Fund's maximum exposure under these arrangements is unknown as this would be dependent on future claims that may be made against the Fund. The risk of material loss from such claims is considered remote.
8. Coronavirus (COVID-19) Pandemic.
An outbreak of COVID-19 first detected in China during December 2019 has since spread globally and was declared a pandemic by the World Health Organization during March 2020. Developments that disrupt global economies and financial markets, such as the COVID-19 pandemic, may magnify factors that affect the Fund's performance.
Report of Independent Registered Public Accounting Firm
To the Board of Trustees of Fidelity Investment Trust and Shareholders of Fidelity SAI International SMA Completion Fund:
Opinion on the Financial Statements and Financial Highlights
We have audited the accompanying statement of assets and liabilities of Fidelity SAI International SMA Completion Fund (the "Fund"), a fund of Fidelity Investment Trust, including the schedule of investments, as of October 31, 2020, the related statement of operations for the year then ended, the statement of changes in net assets and the financial highlights for the year then ended and for the period from April 11, 2019 (commencement of operations) through October 31, 2019, and the related notes. In our opinion, the financial statements and financial highlights present fairly, in all material respects, the financial position of the Fund as of October 31, 2020, the results of its operations for the year then ended, and the changes in its net assets and the financial highlights for the year then ended and for the period from April 11, 2019 (commencement of operations) through October 31, 2019 in conformity with accounting principles generally accepted in the United States of America.
Basis for Opinion
These financial statements and financial highlights are the responsibility of the Fund's management. Our responsibility is to express an opinion on the Fund's financial statements and financial highlights based on our audits. We are a public accounting firm registered with the Public Company Accounting Oversight Board (United States) (PCAOB) and are required to be independent with respect to the Fund in accordance with the U.S. federal securities laws and the applicable rules and regulations of the Securities and Exchange Commission and the PCAOB.
We conducted our audits in accordance with the standards of the PCAOB. Those standards require that we plan and perform the audit to obtain reasonable assurance about whether the financial statements and financial highlights are free of material misstatement, whether due to error or fraud. The Fund is not required to have, nor were we engaged to perform, an audit of its internal control over financial reporting. As part of our audits we are required to obtain an understanding of internal control over financial reporting but not for the purpose of expressing an opinion on the effectiveness of the Fund’s internal control over financial reporting. Accordingly, we express no such opinion.
Our audits included performing procedures to assess the risks of material misstatement of the financial statements and financial highlights, whether due to error or fraud, and performing procedures that respond to those risks. Such procedures included examining, on a test basis, evidence regarding the amounts and disclosures in the financial statements and financial highlights. Our audits also included evaluating the accounting principles used and significant estimates made by management, as well as evaluating the overall presentation of the financial statements and financial highlights. Our procedures included confirmation of securities owned as of October 31, 2020, by correspondence with the custodian and brokers; when replies were not received from brokers, we performed other auditing procedures. We believe that our audits provide a reasonable basis for our opinion.
/s/ Deloitte & Touche LLP
Boston, Massachusetts
December 15, 2020
We have served as the auditor of one or more of the Fidelity investment companies since 1999.
Trustees and Officers
The Trustees, Members of the Advisory Board (if any), and officers of the trust and fund, as applicable, are listed below. The Board of Trustees governs the fund and is responsible for protecting the interests of shareholders. The Trustees are experienced executives who meet periodically throughout the year to oversee the fund's activities, review contractual arrangements with companies that provide services to the fund, oversee management of the risks associated with such activities and contractual arrangements, and review the fund's performance. Except for Jonathan Chiel, each of the Trustees oversees 305 funds. Mr. Chiel oversees 176 funds.
The Trustees hold office without limit in time except that (a) any Trustee may resign; (b) any Trustee may be removed by written instrument, signed by at least two-thirds of the number of Trustees prior to such removal; (c) any Trustee who requests to be retired or who has become incapacitated by illness or injury may be retired by written instrument signed by a majority of the other Trustees; and (d) any Trustee may be removed at any special meeting of shareholders by a two-thirds vote of the outstanding voting securities of the trust. Each Trustee who is not an interested person (as defined in the 1940 Act) of the trust and the fund is referred to herein as an Independent Trustee. Each Independent Trustee shall retire not later than the last day of the calendar year in which his or her 75th birthday occurs. The Independent Trustees may waive this mandatory retirement age policy with respect to individual Trustees. Officers and Advisory Board Members hold office without limit in time, except that any officer or Advisory Board Member may resign or may be removed by a vote of a majority of the Trustees at any regular meeting or any special meeting of the Trustees. Except as indicated, each individual has held the office shown or other offices in the same company for the past five years.
The fund’s Statement of Additional Information (SAI) includes more information about the Trustees. To request a free copy, call Fidelity at 1-800-544-3455.
Experience, Skills, Attributes, and Qualifications of the Trustees. The Governance and Nominating Committee has adopted a statement of policy that describes the experience, qualifications, attributes, and skills that are necessary and desirable for potential Independent Trustee candidates (Statement of Policy). The Board believes that each Trustee satisfied at the time he or she was initially elected or appointed a Trustee, and continues to satisfy, the standards contemplated by the Statement of Policy. The Governance and Nominating Committee also engages professional search firms to help identify potential Independent Trustee candidates who have the experience, qualifications, attributes, and skills consistent with the Statement of Policy. From time to time, additional criteria based on the composition and skills of the current Independent Trustees, as well as experience or skills that may be appropriate in light of future changes to board composition, business conditions, and regulatory or other developments, have also been considered by the professional search firms and the Governance and Nominating Committee. In addition, the Board takes into account the Trustees' commitment and participation in Board and committee meetings, as well as their leadership of standing and ad hoc committees throughout their tenure.
In determining that a particular Trustee was and continues to be qualified to serve as a Trustee, the Board has considered a variety of criteria, none of which, in isolation, was controlling. The Board believes that, collectively, the Trustees have balanced and diverse experience, qualifications, attributes, and skills, which allow the Board to operate effectively in governing the fund and protecting the interests of shareholders. Information about the specific experience, skills, attributes, and qualifications of each Trustee, which in each case led to the Board's conclusion that the Trustee should serve (or continue to serve) as a trustee of the fund, is provided below.
Board Structure and Oversight Function. Robert A. Lawrence is an interested person and currently serves as Acting Chairman. The Trustees have determined that an interested Chairman is appropriate and benefits shareholders because an interested Chairman has a personal and professional stake in the quality and continuity of services provided to the fund. Independent Trustees exercise their informed business judgment to appoint an individual of their choosing to serve as Chairman, regardless of whether the Trustee happens to be independent or a member of management. The Independent Trustees have determined that they can act independently and effectively without having an Independent Trustee serve as Chairman and that a key structural component for assuring that they are in a position to do so is for the Independent Trustees to constitute a substantial majority for the Board. The Independent Trustees also regularly meet in executive session. Ned C. Lautenbach and David M. Thomas serve as Co-Lead Independent Trustees and as such each (i) acts as a liaison between the Independent Trustees and management with respect to matters important to the Independent Trustees and (ii) with management prepares agendas for Board meetings.
Fidelity® funds are overseen by different Boards of Trustees. The fund's Board oversees Fidelity's high income and certain equity funds, and other Boards oversee Fidelity's investment-grade bond, money market, asset allocation, and other equity funds. The asset allocation funds may invest in Fidelity® funds overseen by the fund's Board. The use of separate Boards, each with its own committee structure, allows the Trustees of each group of Fidelity® funds to focus on the unique issues of the funds they oversee, including common research, investment, and operational issues. On occasion, the separate Boards establish joint committees to address issues of overlapping consequences for the Fidelity® funds overseen by each Board.
The Trustees operate using a system of committees to facilitate the timely and efficient consideration of all matters of importance to the Trustees, the fund, and fund shareholders and to facilitate compliance with legal and regulatory requirements and oversight of the fund's activities and associated risks. The Board, acting through its committees, has charged FMR and its affiliates with (i) identifying events or circumstances the occurrence of which could have demonstrably adverse effects on the fund's business and/or reputation; (ii) implementing processes and controls to lessen the possibility that such events or circumstances occur or to mitigate the effects of such events or circumstances if they do occur; and (iii) creating and maintaining a system designed to evaluate continuously business and market conditions in order to facilitate the identification and implementation processes described in (i) and (ii) above. Because the day-to-day operations and activities of the fund are carried out by or through FMR, its affiliates, and other service providers, the fund's exposure to risks is mitigated but not eliminated by the processes overseen by the Trustees. While each of the Board's committees has responsibility for overseeing different aspects of the fund's activities, oversight is exercised primarily through the Operations, Audit, and Compliance Committees. Appropriate personnel, including but not limited to the fund's Chief Compliance Officer (CCO), FMR's internal auditor, the independent accountants, the fund's Treasurer and portfolio management personnel, make periodic reports to the Board's committees, as appropriate, including an annual review of Fidelity's risk management program for the Fidelity® funds. The responsibilities of each standing committee, including their oversight responsibilities, are described further under "Standing Committees of the Trustees."
Interested Trustees*:
Correspondence intended for a Trustee who is an interested person may be sent to Fidelity Investments, 245 Summer Street, Boston, Massachusetts 02210.
Name, Year of Birth; Principal Occupations and Other Relevant Experience+
Jonathan Chiel (1957)
Year of Election or Appointment: 2016
Trustee
Mr. Chiel also serves as Trustee of other Fidelity® funds. Mr. Chiel is Executive Vice President and General Counsel for FMR LLC (diversified financial services company, 2012-present). Previously, Mr. Chiel served as general counsel (2004-2012) and senior vice president and deputy general counsel (2000-2004) for John Hancock Financial Services; a partner with Choate, Hall & Stewart (1996-2000) (law firm); and an Assistant United States Attorney for the United States Attorney’s Office of the District of Massachusetts (1986-95), including Chief of the Criminal Division (1993-1995). Mr. Chiel is a director on the boards of the Boston Bar Foundation and the Maimonides School.
Robert A. Lawrence (1952)
Year of Election or Appointment: 2020
Trustee
Acting Chairman of the Board of Trustees
Mr. Lawrence also serves as Trustee of other funds. Previously, Mr. Lawrence served as a Member of the Advisory Board of certain funds. Prior to his retirement in 2008, Mr. Lawrence served as Vice President of certain Fidelity® funds (2006-2008), Senior Vice President, Head of High Income Division of Fidelity Management & Research Company (investment adviser firm, 2006-2008), and President of Fidelity Strategic Investments (investment adviser firm, 2002-2005).
* Determined to be an “Interested Trustee” by virtue of, among other things, his or her affiliation with the trust or various entities under common control with FMR.
+ The information includes the Trustee's principal occupation during the last five years and other information relating to the experience, attributes, and skills relevant to the Trustee's qualifications to serve as a Trustee, which led to the conclusion that the Trustee should serve as a Trustee for the fund.
Independent Trustees:
Correspondence intended for an Independent Trustee may be sent to Fidelity Investments, P.O. Box 55235, Boston, Massachusetts 02205-5235.
Name, Year of Birth; Principal Occupations and Other Relevant Experience+
Dennis J. Dirks (1948)
Year of Election or Appointment: 2005
Trustee
Mr. Dirks also serves as Trustee of other Fidelity® funds. Prior to his retirement in May 2003, Mr. Dirks served as Chief Operating Officer and as a member of the Board of The Depository Trust & Clearing Corporation (financial markets infrastructure), President, Chief Operating Officer and a member of the Board of The Depository Trust Company (DTC), President and a member of the Board of the National Securities Clearing Corporation (NSCC), Chief Executive Officer and a member of the Board of the Government Securities Clearing Corporation and Chief Executive Officer and a member of the Board of the Mortgage-Backed Securities Clearing Corporation. Mr. Dirks currently serves as a member of the Finance Committee (2016-present) and Board (2017-present) and is Treasurer (2018-present) of the Asolo Repertory Theatre.
Donald F. Donahue (1950)
Year of Election or Appointment: 2018
Trustee
Mr. Donahue also serves as Trustee of other Fidelity® funds. Mr. Donahue serves as President and Chief Executive Officer of Miranda Partners, LLC (risk consulting for the financial services industry, 2012-present). Previously, Mr. Donahue served as Chief Executive Officer (2006-2012), Chief Operating Officer (2003-2006) and Managing Director, Customer Marketing and Development (1999-2003) of The Depository Trust & Clearing Corporation (financial markets infrastructure). Mr. Donahue currently serves as a member (2007-present) and Co-Chairman (2016-present) of the Board of United Way of New York, a member of the Board of NYC Leadership Academy (2012-present) and a member of the Board of Advisors of Ripple Labs, Inc. (financial services, 2015-present). Mr. Donahue previously served as a member of the Advisory Board of certain Fidelity® funds (2015-2018).
Vicki L. Fuller (1957)
Year of Election or Appointment: 2020
Trustee
Ms. Fuller also serves as Trustee of other Fidelity® funds. Previously, Ms. Fuller served as a member of the Advisory Board of certain Fidelity® funds (2018-2020), Chief Investment Officer of the New York State Common Retirement Fund (2012-2018) and held a variety of positions at AllianceBernstein L.P. (global asset management, 1985-2012), including Managing Director (2006-2012) and Senior Vice President and Senior Portfolio Manager (2001-2006). Ms. Fuller currently serves as a member of the Board, Audit Committee and Nominating and Governance Committee of The Williams Companies, Inc. (natural gas infrastructure, 2018-present), as a member of the Board, Audit Committee and Nominating and Governance Committee of two Blackstone business development companies (2020-present) and as a member of the Board of Treliant, LLC (consulting, 2019-present).
Patricia L. Kampling (1959)
Year of Election or Appointment: 2020
Trustee
Ms. Kampling also serves as Trustee of other Fidelity® funds. Prior to her retirement, Ms. Kampling served as Chairman of the Board and Chief Executive Officer (2012-2019), President and Chief Operating Officer (2011-2012) and Executive Vice President and Chief Financial Officer (2010-2011) of Alliant Energy Corporation. Ms. Kampling currently serves as a member of the Board, Compensation Committee and Executive Committee and as Chair of the Audit Committee of Briggs & Stratton Corporation (manufacturing, 2011-present) and as a member of the Board, Audit, Finance and Risk Committee and Safety, Environmental, Technology and Operations Committee of American Water Works Company, Inc. (utilities company, 2019-present). In addition, Ms. Kampling currently serves as a member of the Board of the Nature Conservancy, Wisconsin Chapter (2019-present). Previously, Ms. Kampling served as a Member of the Advisory Board of certain Fidelity® funds (2020), a member of the Board of Interstate Power and Light Company (2012-2019) and Wisconsin Power and Light Company (2012-2019) (each a subsidiary of Alliant Energy Corporation) and as a member of the Board and Workforce Development Committee of the Business Roundtable (2018-2019).
Alan J. Lacy (1953)
Year of Election or Appointment: 2008
Trustee
Mr. Lacy also serves as Trustee of other Fidelity® funds. Previously, Mr. Lacy served as Senior Adviser (2007-2014) of Oak Hill Capital Partners, L.P. (private equity), Chief Executive Officer (2005) and Vice Chairman (2005-2006) of Sears Holdings Corporation (retail), Chief Executive Officer and Chairman of the Board of Sears, Roebuck and Co. (retail, 2000-2005), Chairman (2014-2017) and a member of the Board (2010-2017) of Dave & Buster’s Entertainment, Inc. (restaurant and entertainment complexes) and a member of the Board of Bristol-Myers Squibb Company (global pharmaceuticals, 2008-2020). Mr. Lacy currently serves as a Trustee of the California Chapter of The Nature Conservancy (2015-present) and a member of the Board of the Center for Advanced Study in the Behavioral Sciences at Stanford University (2015-present).
Ned C. Lautenbach (1944)
Year of Election or Appointment: 2000
Trustee
Co-Lead Independent Trustee
Mr. Lautenbach also serves as Trustee of other Fidelity® funds. Mr. Lautenbach currently serves as Chair of the Board of Governors, State University System of Florida (2013-present) and is a member of the Council on Foreign Relations (1994-present). He is also a member and has in the past served as Chairman of the Board of Directors of Artis-Naples (2012-present). Previously, Mr. Lautenbach served as a member and then Lead Director of the Board of Directors of Eaton Corporation (diversified industrial, 1997-2016). He was also a Partner at Clayton, Dubilier & Rice, LLC (private equity investment, 1998-2010); as well as Director of Sony Corporation (2006-2007). In addition, Mr. Lautenbach had a 30-year career with IBM (technology company), during which time he served as Senior Vice President and as a member of the Corporate Executive Committee (1968-1998).
Joseph Mauriello (1944)
Year of Election or Appointment: 2008
Trustee
Mr. Mauriello also serves as Trustee of other Fidelity® funds. Prior to his retirement in January 2006, Mr. Mauriello served in numerous senior management positions including Deputy Chairman and Chief Operating Officer (2004-2005), and Vice Chairman of Financial Services (2002-2004) of KPMG LLP US (professional services, 1965-2005). Mr. Mauriello currently serves as a member of the Independent Directors Council Governing Council (2015-present). Previously, Mr. Mauriello served as a member of the Board of XL Group plc. (global insurance and re-insurance, 2006-2018).
Cornelia M. Small (1944)
Year of Election or Appointment: 2005
Trustee
Ms. Small also serves as Trustee of other Fidelity® funds. Previously, Ms. Small served as Chief Investment Officer, Director of Global Equity Investments and a member of Scudder, Stevens & Clark and Scudder Kemper Investments. Ms. Small previously served as a member of the Board (2009-2019) and Chair of the Investment Committee (2010-2019) of the Teagle Foundation and a member of the Investment Committee of the Berkshire Taconic Community Foundation (2008-2019).
Garnett A. Smith (1947)
Year of Election or Appointment: 2018
Trustee
Mr. Smith also serves as Trustee of other Fidelity® funds. Prior to his retirement, Mr. Smith served as Chairman and Chief Executive Officer (1990-1997) and President (1986-1990) of Inbrand Corp. (manufacturer of personal absorbent products). Prior to his employment with Inbrand Corp., he was employed by a retail fabric chain and North Carolina National Bank (now Bank of America). Mr. Smith previously served as a member of the Advisory Board of certain Fidelity® funds (2012-2013).
David M. Thomas (1949)
Year of Election or Appointment: 2008
Trustee
Co-Lead Independent Trustee
Mr. Thomas also serves as Trustee of other Fidelity® funds. Previously, Mr. Thomas served as Executive Chairman (2005-2006) and Chairman and Chief Executive Officer (2000-2005) of IMS Health, Inc. (pharmaceutical and healthcare information solutions). Mr. Thomas currently serves as Non-Executive Chairman of the Board of Fortune Brands Home and Security (home and security products, 2011-present), and a member of the Board (2004-present) and Presiding Director (2013-present) of Interpublic Group of Companies, Inc. (marketing communication).
Susan Tomasky (1953)
Year of Election or Appointment: 2020
Trustee
Ms. Tomasky also serves as Trustee of other Fidelity® funds. Prior to her retirement, Ms. Tomasky served in various executive officer positions at American Electric Power Company, Inc. (1998-2011), including most recently as President of AEP Transmission (2007-2011). Ms. Tomasky currently serves as a member of the Board and Sustainability Committee and as Chair of the Audit Committee of Marathon Petroleum Corporation (2018-present) and as a member of the Board, Corporate Governance Committee and Organization and Compensation Committee and as Chair of the Audit Committee of Public Service Enterprise Group, Inc. (utilities company, 2012-present). In addition, Ms. Tomasky currently serves as a member of the Board of the Columbus Regional Airport Authority (2007-present), as a member of the Board of the Royal Shakespeare Company – America (2009-present), as a member of the Board of the Columbus Association for the Performing Arts (2011-present) and as a member of the Board of Kenyon College (2016-present). Previously, Ms. Tomasky served as a Member of the Advisory Board of certain Fidelity® funds (2020), a member of the Board (2011-2019) and as Lead Independent Director (2015-2018) of Andeavor Corporation (previously Tesoro Corporation) (independent oil refiner and marketer) and as a member of the Board of Summit Midstream Partners LP (energy, 2012-2018).
Michael E. Wiley (1950)
Year of Election or Appointment: 2020
Trustee
Mr. Wiley also serves as Trustee of other Fidelity® funds. Previously, Mr. Wiley served as a member of the Advisory Board of certain Fidelity® funds (2018-2020), Chairman, President and CEO of Baker Hughes, Inc. (oilfield services, 2000-2004). Mr. Wiley also previously served as a member of the Board of Andeavor Corporation (independent oil refiner and marketer, 2005-2018), a member of the Board of Andeavor Logistics LP (natural resources logistics, 2015-2018) and a member of the Board of High Point Resources (exploration and production, 2005-2020).
+ The information includes the Trustee's principal occupation during the last five years and other information relating to the experience, attributes, and skills relevant to the Trustee's qualifications to serve as a Trustee, which led to the conclusion that the Trustee should serve as a Trustee for the fund.
Advisory Board Members and Officers:
Correspondence intended for a Member of the Advisory Board (if any) may be sent to Fidelity Investments, P.O. Box 55235, Boston, Massachusetts 02205-5235. Correspondence intended for an officer or Peter S. Lynch may be sent to Fidelity Investments, 245 Summer Street, Boston, Massachusetts 02210. Officers appear below in alphabetical order.
Name, Year of Birth; Principal Occupation
Lloyd James Austin, III (1953)
Year of Election or Appointment: 2020
Member of the Advisory Board
General Austin also serves as a Member of the Advisory Board of other Fidelity® funds. Prior to his retirement, General Austin (United States Army, Retired) held a variety of positions within the U.S. Government, including Commander, U.S. Central Command (2013-2016), Vice Chief of Staff, U.S. Army (2012-2013) and Commanding General, U.S. Forces – Iraq, Operation New Dawn (2010-2012). General Austin currently serves as a Partner of Pine Island Capital Partners (private equity, 2020-present) and as President of the Austin Strategy Group LLC (consulting, 2016-present). General Austin serves as a member of the Board of Directors of Nucor Corporation (steel products, 2017-present), as a member of the Board of Directors of Tenet Healthcare Corporation (2018-present) and as a member of the Board of Directors of Raytheon Technologies Corporation (aerospace and defense, 2020-present). In addition, General Austin currently serves as a member of the Board of Trustees of the Carnegie Corporation of New York (2017-present) and as a member of the Board of Trustees of Auburn University (2017-present). Previously, General Austin served as a member of the Board of Directors of United Technologies Corporation (aerospace, defense and building, 2016-2020).
Thomas A. Kennedy (1955)
Year of Election or Appointment: 2020
Member of the Advisory Board
Mr. Kennedy also serves as a Member of the Advisory Board of other Fidelity® funds. Previously, Mr. Kennedy held a variety of positions at Raytheon Company (aerospace and defense, 1983-2020), including Chairman and Chief Executive Officer (2014-2020) and Executive Vice President and Chief Operating Officer (2013-2014). Mr. Kennedy currently serves as Executive Chairman of the Board of Directors of Raytheon Technologies Corporation (aerospace and defense, 2020-present). He is also a member of the Rutgers School of Engineering Industry Advisory Board (2011-present) and a member of the UCLA Engineering Dean’s Executive Board (2016-present).
Peter S. Lynch (1944)
Year of Election or Appointment: 2003
Member of the Advisory Board
Mr. Lynch also serves as a Member of the Advisory Board of other Fidelity® funds. Mr. Lynch is Vice Chairman and a Director of Fidelity Management & Research Company LLC (investment adviser firm). In addition, Mr. Lynch serves as a Trustee of Boston College and as the Chairman of the Inner-City Scholarship Fund. Previously, Mr. Lynch served as Vice Chairman and a Director of FMR Co., Inc. (investment adviser firm) and on the Special Olympics International Board of Directors (1997-2006).
Elizabeth Paige Baumann (1968)
Year of Election or Appointment: 2017
Anti-Money Laundering (AML) Officer
Ms. Baumann also serves as AML Officer of other funds. She is Chief AML Officer (2012-present) and Senior Vice President (2014-present) of FMR LLC (diversified financial services company) and is an employee of Fidelity Investments. Previously, Ms. Baumann served as AML Officer of certain funds (2017-2019), as AML Officer of the funds (2012-2016), and Vice President (2007-2014) and Deputy Anti-Money Laundering Officer (2007-2012) of FMR LLC.
Craig S. Brown (1977)
Year of Election or Appointment: 2019
Assistant Treasurer
Mr. Brown also serves as Assistant Treasurer of other funds. Mr. Brown is an employee of Fidelity Investments (2013-present).
John J. Burke III (1964)
Year of Election or Appointment: 2018
Chief Financial Officer
Mr. Burke also serves as Chief Financial Officer of other funds. Mr. Burke serves as Head of Investment Operations for Fidelity Fund and Investment Operations (2018-present) and is an employee of Fidelity Investments (1998-present). Previously Mr. Burke served as head of Asset Management Investment Operations (2012-2018).
William C. Coffey (1969)
Year of Election or Appointment: 2019
Assistant Secretary
Mr. Coffey also serves as Assistant Secretary of other funds. He is Senior Vice President and Deputy General Counsel of FMR LLC (diversified financial services company, 2010-present), and is an employee of Fidelity Investments. Previously, Mr. Coffey served as Secretary and CLO of certain funds (2018-2019); CLO, Secretary, and Senior Vice President of Fidelity Management & Research Company and FMR Co., Inc. (investment adviser firms, 2018-2019); Secretary of Fidelity SelectCo, LLC and Fidelity Investments Money Management, Inc. (investment adviser firms, 2018-2019); CLO of Fidelity Management & Research (Hong Kong) Limited, FMR Investment Management (UK) Limited, and Fidelity Management & Research (Japan) Limited (investment adviser firms, 2018-2019); and Assistant Secretary of certain funds (2009-2018).
Timothy M. Cohen (1969)
Year of Election or Appointment: 2018
Vice President
Mr. Cohen also serves as Vice President of other funds. Mr. Cohen serves as Co-Head of Equity (2018-present), a Director of Fidelity Management & Research (Japan) Limited (investment adviser firm, 2016-present), and is an employee of Fidelity Investments. Previously, Mr. Cohen served as Executive Vice President of Fidelity SelectCo, LLC (2019), Head of Global Equity Research (2016-2018), Chief Investment Officer - Equity and a Director of Fidelity Management & Research (U.K.) Inc. (investment adviser firm, 2013-2015) and as a Director of Fidelity Management & Research (Hong Kong) Limited (investment adviser firm, 2017).
Jonathan Davis (1968)
Year of Election or Appointment: 2010
Assistant Treasurer
Mr. Davis also serves as Assistant Treasurer of other funds. Mr. Davis serves as Assistant Treasurer of FMR Capital, Inc. (2017-present) and is an employee of Fidelity Investments. Previously, Mr. Davis served as Vice President and Associate General Counsel of FMR LLC (diversified financial services company, 2003-2010).
Laura M. Del Prato (1964)
Year of Election or Appointment: 2018
Assistant Treasurer
Ms. Del Prato also serves as an officer of other funds. Ms. Del Prato is an employee of Fidelity Investments (2017-present). Previously, Ms. Del Prato served as President and Treasurer of The North Carolina Capital Management Trust: Cash Portfolio and Term Portfolio (2018-2020). Prior to joining Fidelity Investments, Ms. Del Prato served as a Managing Director and Treasurer of the JPMorgan Mutual Funds (2014-2017). Prior to JPMorgan, Ms. Del Prato served as a partner at Cohen Fund Audit Services (accounting firm, 2012-2013) and KPMG LLP (accounting firm, 2004-2012).
Colm A. Hogan (1973)
Year of Election or Appointment: 2020
Assistant Treasurer
Mr. Hogan also serves as an officer of other funds. Mr. Hogan serves as Assistant Treasurer of FMR Capital, Inc. (2017-present) and is an employee of Fidelity Investments (2005-present). Previously, Mr. Hogan served as Deputy Treasurer of certain Fidelity® funds (2016-2020) and Assistant Treasurer of certain Fidelity® funds (2016-2018).
Pamela R. Holding (1964)
Year of Election or Appointment: 2018
Vice President
Ms. Holding also serves as Vice President of other funds. Ms. Holding serves as Co-Head of Equity (2018-present) and is an employee of Fidelity Investments (2013-present). Previously, Ms. Holding served as Executive Vice President of Fidelity SelectCo, LLC (2019) and as Chief Investment Officer of Fidelity Institutional Asset Management (2013-2018).
Cynthia Lo Bessette (1969)
Year of Election or Appointment: 2019
Secretary and Chief Legal Officer (CLO)
Ms. Lo Bessette also serves as an officer of other funds. Ms. Lo Bessette serves as CLO, Secretary, and Senior Vice President of Fidelity Management & Research Company LLC (investment adviser firm, 2019-present); and CLO of Fidelity Management & Research (Hong Kong) Limited, FMR Investment Management (UK) Limited, and Fidelity Management & Research (Japan) Limited (investment adviser firms, 2019-present). She is a Senior Vice President and Deputy General Counsel of FMR LLC (diversified financial services company, 2019-present), and is an employee of Fidelity Investments. Previously, Ms. Lo Bessette served as CLO, Secretary, and Senior Vice President of FMR Co., Inc. (investment adviser firm, 2019); Secretary of Fidelity SelectCo, LLC and Fidelity Investments Money Management, Inc. (investment adviser firms, 2019). Prior to joining Fidelity Investments, Ms. Lo Bessette was Executive Vice President, General Counsel (2016-2019) and Senior Vice President, Deputy General Counsel (2015-2016) of OppenheimerFunds (investment management company) and Deputy Chief Legal Officer (2013-2015) of Jennison Associates LLC (investment adviser firm).
Chris Maher (1972)
Year of Election or Appointment: 2020
Deputy Treasurer
Mr. Maher also serves as an officer of other funds. Mr. Maher serves as Assistant Treasurer of FMR Capital, Inc. (2017-present), and is an employee of Fidelity Investments (2008-present). Previously, Mr. Maher served as Assistant Treasurer of certain funds (2013-2020); Vice President of Asset Management Compliance (2013), Vice President of the Program Management Group of FMR (investment adviser firm, 2010-2013), and Vice President of Valuation Oversight (2008-2010).
Jason P. Pogorelec (1975)
Year of Election or Appointment: 2020
Chief Compliance Officer
Mr. Pogorelec also serves as Chief Compliance Officer of other funds. Mr. Pogorelec is a senior Vice President of Asset Management Compliance for Fidelity Investments and is an employee of Fidelity Investments (2006-present). Previously, Mr. Pogorelec served as Vice President, Associate General Counsel for Fidelity Investments (2010-2020) and Assistant Secretary of certain Fidelity funds (2015-2020).
Stacie M. Smith (1974)
Year of Election or Appointment: 2016
President and Treasurer
Ms. Smith also serves as an officer of other funds. Ms. Smith serves as Assistant Treasurer of FMR Capital, Inc. (2017-present), is an employee of Fidelity Investments (2009-present), and has served in other fund officer roles. Prior to joining Fidelity Investments, Ms. Smith served as Senior Audit Manager of Ernst & Young LLP (accounting firm, 1996-2009). Previously, Ms. Smith served as Assistant Treasurer (2013-2019) and Deputy Treasurer (2013-2016) of certain Fidelity® funds.
Marc L. Spector (1972)
Year of Election or Appointment: 2016
Assistant Treasurer
Mr. Spector also serves as an officer of other funds. Mr. Spector serves as Assistant Treasurer of FMR Capital, Inc. (2017-present) and is an employee of Fidelity Investments (2016-present). Prior to joining Fidelity Investments, Mr. Spector served as Director at the Siegfried Group (accounting firm, 2013-2016), and prior to Siegfried Group as audit senior manager at Deloitte & Touche LLP (accounting firm, 2005-2013).
Jim Wegmann (1979)
Year of Election or Appointment: 2019
Assistant Treasurer
Mr. Wegmann also serves as Assistant Treasurer of other funds. Mr. Wegmann is an employee of Fidelity Investments (2011-present).
Shareholder Expense Example
As a shareholder, you incur two types of costs: (1) transaction costs, which may include sales charges (loads) on purchase payments or redemption proceeds, as applicable and (2) ongoing costs, which generally include management fees, distribution and/or service (12b-1) fees and other Fund expenses. This Example is intended to help you understand your ongoing costs (in dollars) of investing in a fund and to compare these costs with the ongoing costs of investing in other mutual funds.
The Example is based on an investment of $1,000 invested at the beginning of the period and held for the entire period (May 1, 2020 to October 31, 2020).
Actual Expenses
The first line of the accompanying table provides information about actual account values and actual expenses. You may use the information in this line, together with the amount you invested, to estimate the expenses that you paid over the period. Simply divide your account value by $1,000.00 (for example, an $8,600 account value divided by $1,000.00 = 8.6), then multiply the result by the number in the first line for a class/Fund under the heading entitled "Expenses Paid During Period" to estimate the expenses you paid on your account during this period. If any fund is a shareholder of any underlying mutual funds or exchange-traded funds (ETFs) (the Underlying Funds), such fund indirectly bears its proportional share of the expenses of the Underlying Funds in addition to the direct expenses incurred presented in the table. These fees and expenses are not included in the annualized expense ratio used to calculate the expense estimate in the table below.
Hypothetical Example for Comparison Purposes
The second line of the accompanying table provides information about hypothetical account values and hypothetical expenses based on the actual expense ratio and an assumed rate of return of 5% per year before expenses, which is not the actual return. The hypothetical account values and expenses may not be used to estimate the actual ending account balance or expenses you paid for the period. You may use this information to compare the ongoing costs of investing in the Fund and other funds. To do so, compare this 5% hypothetical example with the 5% hypothetical examples that appear in the shareholder reports of the other funds. If any fund is a shareholder of any Underlying Funds, such fund indirectly bears its proportional share of the expenses of the Underlying Funds in addition to the direct expenses as presented in the table. These fees and expenses are not included in the annualized expense ratio used to calculate the expense estimate in the table below.
Please note that the expenses shown in the table are meant to highlight your ongoing costs only and do not reflect any transaction costs. Therefore, the second line of the table is useful in comparing ongoing costs only, and will not help you determine the relative total costs of owning different funds.
| | Annualized Expense Ratio-A | Beginning
Account Value
May 1, 2020 | Ending
Account Value
October 31, 2020 | Expenses Paid
During Period-B
May 1, 2020
to October 31, 2020 |
| Fidelity SAI International SMA Completion Fund | - %-C | | | |
| Actual | | $1,000.00 | $1,249.20 | $--D |
| Hypothetical-E | | $1,000.00 | $1,025.14 | $--D |
A Annualized expense ratio reflects expenses net of applicable fee waivers.
B Expenses are equal to the annualized expense ratio, multiplied by the average account value over the period, multiplied by 184/ 366 (to reflect the one-half year period). The fees and expenses of any Underlying Funds are not included in each annualized expense ratio.
C Amount represents less than .005%.
D Amount represents less than $.005.
E 5% return per year before expenses
Distributions (Unaudited)
The fund designates 88% of the dividend distributed during the fiscal year as amounts which may be taken into account as a dividend for the purposes of the maximum rate under section 1(h)(11) of the Internal Revenue Code.
The amounts per share which represent income derived from sources within, and taxes paid to, foreign countries or possessions of the United States are $0.0216 and $0.0021 for the dividend paid December 16, 2019.
The fund will notify shareholders in January 2021 of amounts for use in preparing 2020 income tax returns.
Proxy Voting Results
A special meeting of shareholders was held on June 9, 2020. The results of votes taken among shareholders on the proposal before them are reported below. Each vote reported represents one dollar of net asset value held on the record date for the meeting.
PROPOSAL 1
To elect a Board of Trustees.
| | # of
Votes | % of
Votes |
| Dennis J. Dirks |
| Affirmative | 91,643,443,973.030 | 98.167 |
| Withheld | 1,711,119,384.419 | 1.833 |
| TOTAL | 93,354,563,357.449 | 100.000 |
| Donald F. Donahue |
| Affirmative | 91,659,003,496.045 | 98.184 |
| Withheld | 1,695,559,852.789 | 1.816 |
| TOTAL | 93,354,563,357.449 | 100.000 |
| Bettina Doulton |
| Affirmative | 91,774,146,516.145 | 98.307 |
| Withheld | 1,580,416,862.377 | 1.693 |
| TOTAL | 93,354,563,357.449 | 100.000 |
| Vicki L. Fuller |
| Affirmative | 91,845,419,368.993 | 98.383 |
| Withheld | 1,509,143,998.591 | 1.617 |
| TOTAL | 93,354,563,357.449 | 100.00 |
| Patricia L. Kampling |
| Affirmative | 91,723,732,274.457 | 98.253 |
| Withheld | 1,630,831,098.411 | 1.747 |
| TOTAL | 93,354,563,357.449 | 100.000 |
| Alan J. Lacy |
| Affirmative | 91,490,319,407.772 | 98.003 |
| Withheld | 1,864,243,948.299 | 1.997 |
| TOTAL | 93,354,563,357.449 | 100.000 |
| Ned C. Lautenbach |
| Affirmative | 91,285,367,239.075 | 97.784 |
| Withheld | 2,069,196,119.052 | 2.216 |
| TOTAL | 93,354,563,357.449 | 100.000 |
| Robert A. Lawrence |
| Affirmative | 91,556,271,429.466 | 98.074 |
| Withheld | 1,798,291,912.707 | 1.926 |
| TOTAL | 93,354,563,357.449 | 100.000 |
| Joseph Mauriello |
| Affirmative | 91,497,480,147.082 | 98.011 |
| Withheld | 1,857,083,211.045 | 1.989 |
| TOTAL | 93,354,563,357.449 | 100.000 |
| Cornelia M. Small |
| Affirmative | 91,606,808,161.438 | 98.128 |
| Withheld | 1,747,755,220.497 | 1.872 |
| TOTAL | 93,354,563,357.449 | 100.000 |
| Garnett A. Smith |
| Affirmative | 91,505,784,053.038 | 98.020 |
| Withheld | 1,848,779,305.090 | 1.980 |
| TOTAL | 93,354,563,357.449 | 100.000 |
| David M. Thomas |
| Affirmative | 91,536,969,704.881 | 98.053 |
| Withheld | 1,817,593,630.919 | 1.947 |
| TOTAL | 93,354,563,357.449 | 100.000 |
| Susan Tomasky |
| Affirmative | 91,697,125,678.165 | 98.225 |
| Withheld | 1,657,437,703.277 | 1.775 |
| TOTAL | 93,354,563,357.449 | 100.000 |
| Michael E. Wiley |
| Affirmative | 91,506,805,575.815 | 98.021 |
| Withheld | 1,847,757,759.985 | 1.979 |
| TOTAL | 93,354,563,357.449 | 100.000 |
|
| Proposal 1 reflects trust wide proposal and voting results. |
ISM-ANN-1220
1.9893098.101
Fidelity® International Discovery K6 Fund
Annual Report
October 31, 2020
See the inside front cover for important information about access to your fund’s shareholder reports.
Beginning on January 1, 2021, as permitted by regulations adopted by the Securities and Exchange Commission, paper copies of a fund’s shareholder reports will no longer be sent by mail, unless you specifically request paper copies of the reports from the fund or from your financial intermediary, such as a financial advisor, broker-dealer or bank. Instead, the reports will be made available on a website, and you will be notified by mail each time a report is posted and provided with a website link to access the report.
If you already elected to receive shareholder reports electronically, you will not be affected by this change and you need not take any action. You may elect to receive shareholder reports and other communications from a fund electronically, by contacting your financial intermediary. For Fidelity customers, visit Fidelity's web site or call Fidelity using the contact information listed below.
You may elect to receive all future reports in paper free of charge. If you wish to continue receiving paper copies of your shareholder reports, you may contact your financial intermediary or, if you are a Fidelity customer, visit Fidelity’s website, or call Fidelity at the applicable toll-free number listed below. Your election to receive reports in paper will apply to all funds held with the fund complex/your financial intermediary.
| Account Type | Website | Phone Number |
| Brokerage, Mutual Fund, or Annuity Contracts: | fidelity.com/mailpreferences | 1-800-343-3548 |
| Employer Provided Retirement Accounts: | netbenefits.fidelity.com/preferences (choose 'no' under Required Disclosures to continue to print) | 1-800-343-0860 |
| Advisor Sold Accounts Serviced Through Your Financial Intermediary: | Contact Your Financial Intermediary | Your Financial Intermediary's phone number |
| Advisor Sold Accounts Serviced by Fidelity: | institutional.fidelity.com | 1-877-208-0098 |
Contents
To view a fund's proxy voting guidelines and proxy voting record for the 12-month period ended June 30, visit http://www.fidelity.com/proxyvotingresults or visit the Securities and Exchange Commission's (SEC) web site at http://www.sec.gov.
You may also call 1-800-835-5092 to request a free copy of the proxy voting guidelines.
Standard & Poor's, S&P and S&P 500 are registered service marks of The McGraw-Hill Companies, Inc. and have been licensed for use by Fidelity Distributors Corporation.
Other third-party marks appearing herein are the property of their respective owners.
All other marks appearing herein are registered or unregistered trademarks or service marks of FMR LLC or an affiliated company. © 2020 FMR LLC. All rights reserved.
This report and the financial statements contained herein are submitted for the general information of the shareholders of the Fund. This report is not authorized for distribution to prospective investors in the Fund unless preceded or accompanied by an effective prospectus.
A fund files its complete schedule of portfolio holdings with the SEC for the first and third quarters of each fiscal year on Form N-PORT. Forms N-PORT are available on the SEC’s web site at http://www.sec.gov. A fund's Forms N-PORT may be reviewed and copied at the SEC’s Public Reference Room in Washington, DC. Information regarding the operation of the SEC's Public Reference Room may be obtained by calling 1-800-SEC-0330.
For a complete list of a fund's portfolio holdings, view the most recent holdings listing, semiannual report, or annual report on Fidelity's web site at http://www.fidelity.com, http://www.institutional.fidelity.com, or http://www.401k.com, as applicable.
NOT FDIC INSURED •MAY LOSE VALUE •NO BANK GUARANTEE
Neither the Fund nor Fidelity Distributors Corporation is a bank.
Note to Shareholders:
Early in 2020, the outbreak and spread of a new coronavirus emerged as a public health emergency that had a major influence on financial markets, primarily based on its impact on the global economy and the outlook for corporate earnings. The virus causes a respiratory disease known as COVID-19. On March 11, the World Health Organization declared the COVID-19 outbreak a pandemic, citing sustained risk of further global spread.
In the weeks following, as the crisis worsened, we witnessed an escalating human tragedy with wide-scale social and economic consequences from coronavirus-containment measures. The outbreak of COVID-19 prompted a number of measures to limit the spread, including travel and border restrictions, quarantines, and restrictions on large gatherings. In turn, these resulted in lower consumer activity, diminished demand for a wide range of products and services, disruption in manufacturing and supply chains, and – given the wide variability in outcomes regarding the outbreak – significant market uncertainty and volatility. Amid the turmoil, global governments and central banks took unprecedented action to help support consumers, businesses, and the broader economies, and to limit disruption to financial systems.
The situation continues to unfold, and the extent and duration of its impact on financial markets and the economy remain highly uncertain. Extreme events such as the coronavirus crisis are “exogenous shocks” that can have significant adverse effects on mutual funds and their investments. Although multiple asset classes may be affected by market disruption, the duration and impact may not be the same for all types of assets.
Fidelity is committed to helping you stay informed amid news about COVID-19 and during increased market volatility, and we’re taking extra steps to be responsive to customer needs. We encourage you to visit our websites, where we offer ongoing updates, commentary, and analysis on the markets and our funds.
Performance: The Bottom Line
Average annual total return reflects the change in the value of an investment, assuming reinvestment of distributions from dividend income and capital gains (the profits earned upon the sale of securities that have grown in value, if any) and assuming a constant rate of performance each year. The hypothetical investment and the average annual total returns do not reflect the deduction of taxes that a shareholder would pay on fund distributions or the redemption of fund shares. During periods of reimbursement by Fidelity, a fund’s total return will be greater than it would be had the reimbursement not occurred. How a fund did yesterday is no guarantee of how it will do tomorrow.
Average Annual Total Returns
| For the periods ended October 31, 2020 | Past 1 year | Life of fundA |
| Fidelity® International Discovery K6 Fund | 8.51% | 9.79% |
A From June 13, 2019
$10,000 Over Life of Fund
Let's say hypothetically that $10,000 was invested in Fidelity® International Discovery K6 Fund on June 13, 2019, when the fund started.
The chart shows how the value of your investment would have changed, and also shows how the MSCI EAFE Index performed over the same period.
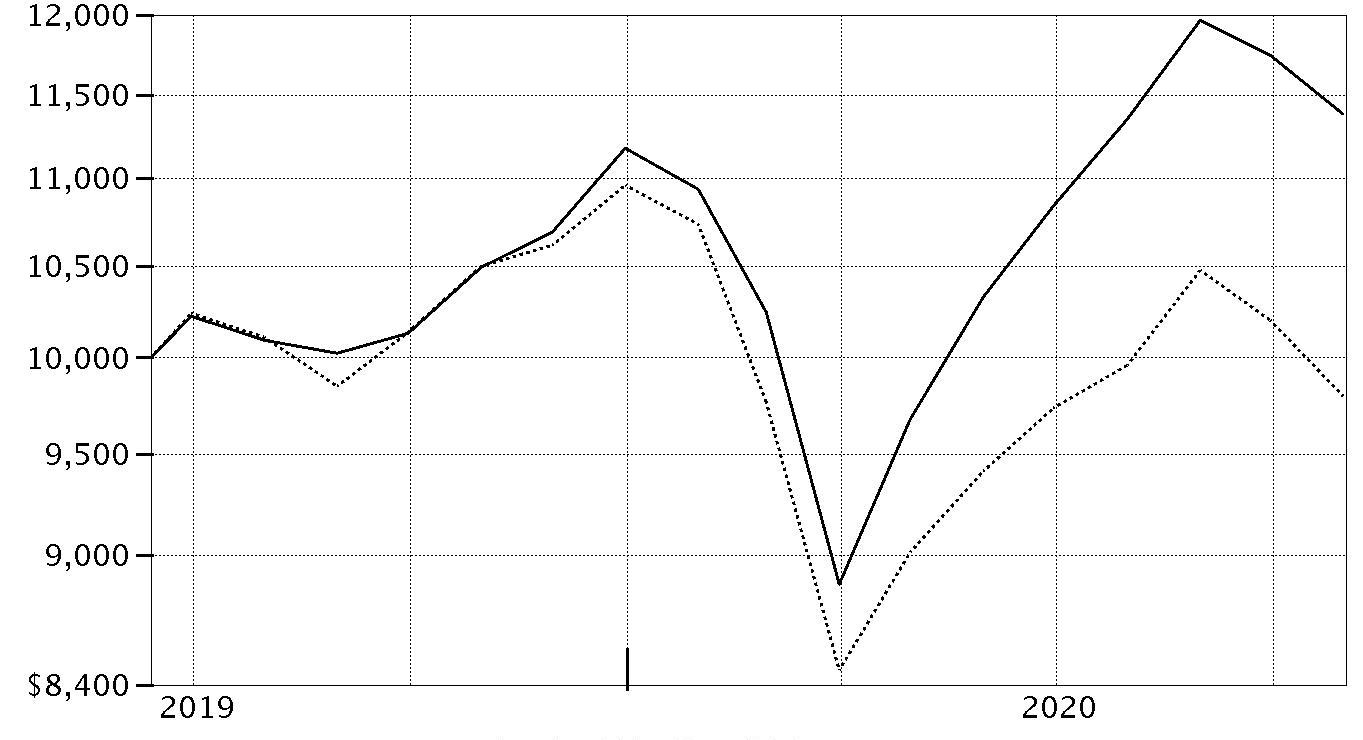
| Period Ending Values |
| $11,383 | Fidelity® International Discovery K6 Fund |
| $9,795 | MSCI EAFE Index |
Management's Discussion of Fund Performance
Market Recap: The MSCI ACWI (All Country World Index) ex USA Index returned -2.46% for the 12 months ending October 31, 2020, in what was a bumpy ride for non-U.S. equities, marked by a steep but brief decline due to the early-2020 outbreak and spread of the coronavirus, followed by a sharp upturn. Declared a pandemic on March 11, the crisis and containment efforts caused broad contraction in economic activity, elevated volatility and dislocation in financial markets. A historically rapid and expansive monetary- and fiscal-policy response around the world provided a partial offset to the economic disruption. Other supporting factors included resilient corporate earnings and near-term potential for a COVID-19 vaccine breakthrough. This was evident in the index’s 12.28% gain in the final six months of the year. Currency fluctuation generally boosted foreign developed-markets equities for the year, while the reverse was true for emerging-markets stocks. Late in the period, the index was pressured by a second wave of COVID-19 cases in some regions, and stretched valuations and crowded positioning in big tech. For the full year, the U.K. (-22%), Asia Pacific ex Japan (-8%), Canada (-5%) and Europe ex U.K. (-4%) notably lagged. Emerging markets (+9%) and Japan (+1%) outperformed. By sector, energy (-38%), financials and real estate (-20% each) lagged, whereas information technology (+ 25%) and communication services (+15%) topped the index.
Comments from Portfolio Manager William Kennedy: For the fiscal year ending October 31, 2020, the fund gained 8.51%, outperforming the -6.69% result of the benchmark MSCI EAFE Index. From a geographic standpoint, stock picks in Europe ex U.K., China and Japan contributed most to the fund's relative result. By sector, the primary contributors versus the benchmark were positioning in information technology as well as stock selection in communication services, health care, industrials and consumer discretionary. Our top individual relative contributor was an out-of-benchmark stake in China-based media company Tencent Holdings (+86%), a top-10 holding on October 31. Another key relative contributor was U.K.-listed integrated oil and gas company Royal Dutch Shell (-55%), a benchmark component that we avoided. Also adding value was our outsized stake in Japan-based semiconductor equipment company Lasertec (+110%), which was not held at period end. Conversely, an underweighting in materials and stock picks in Canada nicked relative performance. The fund's largest individual relative detractors were U.K.-based integrated oil and gas company BP (-54%), which we eliminated from the portfolio before period end, and a non-benchmark stake in Canada-based oil sands company Suncor Energy (-61%).
The views expressed above reflect those of the portfolio manager(s) only through the end of the period as stated on the cover of this report and do not necessarily represent the views of Fidelity or any other person in the Fidelity organization. Any such views are subject to change at any time based upon market or other conditions and Fidelity disclaims any responsibility to update such views. These views may not be relied on as investment advice and, because investment decisions for a Fidelity fund are based on numerous factors, may not be relied on as an indication of trading intent on behalf of any Fidelity fund.
Investment Summary (Unaudited)
Geographic Diversification (% of fund's net assets)
| As of October 31, 2020 |
| | Japan | 15.5% |
| | Switzerland | 11.3% |
| | United Kingdom | 11.1% |
| | Germany | 9.8% |
| | France | 6.3% |
| | Cayman Islands | 5.2% |
| | Sweden | 4.7% |
| | United States of America* | 4.2% |
| | India | 4.0% |
| | Other | 27.9% |
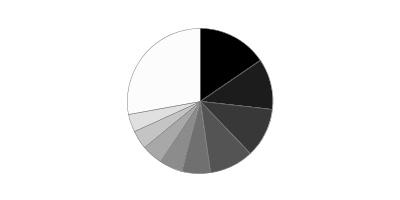
* Includes Short-Term investments and Net Other Assets (Liabilities).
Percentages are based on country or territory of incorporation and are adjusted for the effect of futures contracts, if applicable.
Asset Allocation as of October 31, 2020
| | % of fund's net assets |
| Stocks | 97.3 |
| Short-Term Investments and Net Other Assets (Liabilities) | 2.7 |
Top Ten Stocks as of October 31, 2020
| | % of fund's net assets |
| Nestle SA (Reg. S) (Switzerland, Food Products) | 3.7 |
| Roche Holding AG (participation certificate) (Switzerland, Pharmaceuticals) | 2.8 |
| AstraZeneca PLC (United Kingdom) (United Kingdom, Pharmaceuticals) | 1.8 |
| Tencent Holdings Ltd. (Cayman Islands, Interactive Media & Services) | 1.8 |
| HDFC Bank Ltd. sponsored ADR (India, Banks) | 1.7 |
| ASML Holding NV (Netherlands) (Netherlands, Semiconductors & Semiconductor Equipment) | 1.6 |
| AIA Group Ltd. (Hong Kong, Insurance) | 1.5 |
| Hoya Corp. (Japan, Health Care Equipment & Supplies) | 1.4 |
| Housing Development Finance Corp. Ltd. (India, Thrifts & Mortgage Finance) | 1.3 |
| Keyence Corp. (Japan, Electronic Equipment & Components) | 1.3 |
| | 18.9 |
Top Market Sectors as of October 31, 2020
| | % of fund's net assets |
| Financials | 16.3 |
| Industrials | 15.4 |
| Health Care | 15.1 |
| Information Technology | 12.9 |
| Consumer Discretionary | 12.2 |
| Consumer Staples | 8.2 |
| Communication Services | 8.1 |
| Materials | 3.5 |
| Real Estate | 3.1 |
| Utilities | 1.3 |
Schedule of Investments October 31, 2020
Showing Percentage of Net Assets
| Common Stocks - 96.4% | | | |
| | | Shares | Value |
| Australia - 1.2% | | | |
| Bapcor Ltd. | | 99,748 | $537,620 |
| Inghams Group Ltd. | | 112,628 | 226,628 |
| National Storage (REIT) unit | | 409,080 | 519,177 |
| Rio Tinto Ltd. | | 38 | 2,472 |
|
| TOTAL AUSTRALIA | | | 1,285,897 |
|
| Austria - 0.8% | | | |
| Erste Group Bank AG | | 19,231 | 393,746 |
| Wienerberger AG | | 17,570 | 443,226 |
|
| TOTAL AUSTRIA | | | 836,972 |
|
| Bailiwick of Jersey - 0.7% | | | |
| Experian PLC | | 18,689 | 684,651 |
| Belgium - 1.4% | | | |
| KBC Groep NV | | 18,226 | 898,535 |
| UCB SA | | 5,829 | 575,007 |
|
| TOTAL BELGIUM | | | 1,473,542 |
|
| Canada - 1.4% | | | |
| Alimentation Couche-Tard, Inc. Class B (sub. vtg.) | | 13,518 | 416,305 |
| Constellation Software, Inc. | | 782 | 820,909 |
| Suncor Energy, Inc. | | 18,069 | 203,841 |
|
| TOTAL CANADA | | | 1,441,055 |
|
| Cayman Islands - 5.2% | | | |
| Akeso, Inc. (a) | | 53,000 | 166,127 |
| Alibaba Group Holding Ltd.(b) | | 30,156 | 1,142,728 |
| Bilibili, Inc. ADR (b) | | 5,381 | 240,369 |
| Hansoh Pharmaceutical Group Co. Ltd. (a)(b) | | 91,094 | 405,972 |
| JD.com, Inc. Class A | | 13,565 | 553,296 |
| Kangji Medical Holdings Ltd. | | 35,000 | 90,497 |
| New Oriental Education & Technology Group, Inc. sponsored ADR (b) | | 2,620 | 420,196 |
| Sino Biopharmaceutical Ltd. | | 187,531 | 189,164 |
| Tencent Holdings Ltd. | | 24,490 | 1,871,174 |
| Zai Lab Ltd. (b) | | 4,046 | 336,623 |
|
| TOTAL CAYMAN ISLANDS | | | 5,416,146 |
|
| China - 1.1% | | | |
| AVIC Jonhon OptronicTechnology Co. Ltd. | | 49,821 | 413,355 |
| Kweichow Moutai Co. Ltd. (A Shares) | | 1,114 | 278,642 |
| Venus MedTech Hangzhou, Inc. (H Shares) (a)(b) | | 11,802 | 113,491 |
| WuXi AppTec Co. Ltd. (H Shares) (a) | | 21,175 | 337,325 |
|
| TOTAL CHINA | | | 1,142,813 |
|
| Denmark - 2.8% | | | |
| DSV Panalpina A/S | | 4,513 | 730,750 |
| Netcompany Group A/S (a)(b) | | 2,644 | 219,644 |
| ORSTED A/S (a) | | 6,272 | 995,454 |
| Vestas Wind Systems A/S | | 5,371 | 921,470 |
|
| TOTAL DENMARK | | | 2,867,318 |
|
| Finland - 0.1% | | | |
| Musti Group OYJ | | 6,432 | 147,349 |
| France - 6.3% | | | |
| AXA SA | | 41,810 | 671,439 |
| BNP Paribas SA (b) | | 16,064 | 560,228 |
| Capgemini SA | | 7,397 | 854,083 |
| LVMH Moet Hennessy Louis Vuitton SE | | 2,789 | 1,307,337 |
| Sanofi SA | | 13,973 | 1,261,670 |
| SR Teleperformance SA | | 2,686 | 806,150 |
| VINCI SA | | 9,130 | 721,134 |
| Worldline SA (a)(b) | | 4,543 | 336,720 |
|
| TOTAL FRANCE | | | 6,518,761 |
|
| Germany - 9.0% | | | |
| adidas AG | | 2,886 | 857,101 |
| Akasol AG (a)(b) | | 2,851 | 154,549 |
| Allianz SE | | 6,755 | 1,188,421 |
| Deutsche Borse AG | | 1,695 | 249,425 |
| Deutsche Post AG | | 29,082 | 1,288,428 |
| Exasol AG | | 9,658 | 184,470 |
| Instone Real Estate Group BV (a)(b) | | 11,205 | 231,766 |
| Linde PLC | | 2,692 | 590,052 |
| Morphosys AG (b) | | 41 | 4,181 |
| Nexus AG | | 5,058 | 281,580 |
| Rheinmetall AG | | 3,372 | 246,235 |
| RWE AG | | 7,929 | 293,565 |
| SAP SE | | 10,293 | 1,098,105 |
| Shop Apotheke Europe NV (a)(b) | | 2,590 | 429,542 |
| Siemens AG | | 11,423 | 1,339,692 |
| Talanx AG | | 82 | 2,414 |
| Vonovia SE | | 13,991 | 893,271 |
|
| TOTAL GERMANY | | | 9,332,797 |
|
| Hong Kong - 2.2% | | | |
| AIA Group Ltd. | | 161,393 | 1,536,006 |
| Techtronic Industries Co. Ltd. | | 54,089 | 721,419 |
|
| TOTAL HONG KONG | | | 2,257,425 |
|
| Hungary - 0.7% | | | |
| OTP Bank PLC (b) | | 14,854 | 462,627 |
| Richter Gedeon PLC | | 10,516 | 214,507 |
|
| TOTAL HUNGARY | | | 677,134 |
|
| India - 4.0% | | | |
| Avenue Supermarts Ltd. (a)(b) | | 6,110 | 183,625 |
| HDFC Bank Ltd. sponsored ADR (b) | | 29,466 | 1,692,527 |
| Housing Development Finance Corp. Ltd. | | 52,592 | 1,356,309 |
| Reliance Industries Ltd. | | 1,000 | 15,842 |
| Reliance Industries Ltd. | | 15,000 | 413,403 |
| Reliance Industries Ltd. sponsored GDR (a) | | 4,435 | 243,482 |
| Sunteck Realty Ltd. | | 30,791 | 110,565 |
| TCNS Clothing Co. Ltd. (a)(b) | | 24,417 | 122,038 |
|
| TOTAL INDIA | | | 4,137,791 |
|
| Indonesia - 0.4% | | | |
| PT Bank Central Asia Tbk | | 104,814 | 206,238 |
| PT Bank Rakyat Indonesia Tbk | | 746,614 | 169,013 |
|
| TOTAL INDONESIA | | | 375,251 |
|
| Ireland - 1.7% | | | |
| Cairn Homes PLC | | 298,747 | 273,130 |
| CRH PLC | | 21,405 | 748,999 |
| Dalata Hotel Group PLC | | 80,162 | 225,933 |
| DCC PLC (United Kingdom) | | 253 | 16,467 |
| Kerry Group PLC Class A | | 3,395 | 406,074 |
| Ryanair Holdings PLC (b) | | 3,200 | 44,094 |
|
| TOTAL IRELAND | | | 1,714,697 |
|
| Israel - 0.1% | | | |
| Maytronics Ltd. | | 4,566 | 70,135 |
| Italy - 0.8% | | | |
| GVS SpA (a) | | 7,054 | 99,407 |
| Recordati SpA | | 9,260 | 479,809 |
| Reply SpA | | 2,573 | 276,590 |
|
| TOTAL ITALY | | | 855,806 |
|
| Japan - 15.5% | | | |
| Astellas Pharma, Inc. | | 37,942 | 520,296 |
| Daiichi Sankyo Kabushiki Kaisha | | 29,256 | 772,173 |
| FANUC Corp. | | 5,577 | 1,178,001 |
| GMO Payment Gateway, Inc. | | 2,645 | 324,088 |
| Hoya Corp. | | 13,157 | 1,484,859 |
| IT Holdings Corp. | | 13,137 | 251,247 |
| Kao Corp. | | 5,536 | 394,156 |
| Kenedix, Inc. | | 54,518 | 282,517 |
| Keyence Corp. | | 2,960 | 1,343,315 |
| Lifenet Insurance Co. (b) | | 13,682 | 201,487 |
| Minebea Mitsumi, Inc. | | 37,980 | 685,970 |
| Misumi Group, Inc. | | 11,763 | 349,356 |
| Mitsubishi UFJ Financial Group, Inc. | | 71,520 | 281,925 |
| Nintendo Co. Ltd. | | 1,458 | 788,324 |
| Oracle Corp. Japan | | 4,638 | 463,522 |
| ORIX Corp. | | 77,491 | 906,276 |
| Persol Holdings Co., Ltd. | | 17,628 | 266,997 |
| Recruit Holdings Co. Ltd. | | 14,487 | 551,240 |
| Relo Group, Inc. | | 30,043 | 720,995 |
| Shiseido Co. Ltd. | | 4,115 | 254,747 |
| SMC Corp. | | 909 | 483,502 |
| SoftBank Group Corp. | | 11,543 | 751,840 |
| Sony Corp. | | 15,178 | 1,265,336 |
| THK Co. Ltd. | | 11,662 | 309,567 |
| Z Holdings Corp. | | 109,550 | 763,899 |
| Zozo, Inc. | | 17,259 | 437,825 |
|
| TOTAL JAPAN | | | 16,033,460 |
|
| Korea (South) - 1.0% | | | |
| Samsung Electronics Co. Ltd. | | 20,547 | 1,030,542 |
| Luxembourg - 1.0% | | | |
| B&M European Value Retail SA | | 39,090 | 245,508 |
| Eurofins Scientific SA (b) | | 982 | 782,053 |
|
| TOTAL LUXEMBOURG | | | 1,027,561 |
|
| Malta - 0.2% | | | |
| Kambi Group PLC (b) | | 6,672 | 216,692 |
| Netherlands - 3.5% | | | |
| Airbus Group NV | | 5,847 | 427,802 |
| ASML Holding NV (Netherlands) | | 4,676 | 1,691,791 |
| IMCD NV | | 1,837 | 212,791 |
| JDE Peet's BV | | 7,301 | 260,195 |
| NXP Semiconductors NV | | 5,963 | 805,721 |
| RHI Magnesita NV | | 5,387 | 178,659 |
|
| TOTAL NETHERLANDS | | | 3,576,959 |
|
| New Zealand - 1.1% | | | |
| EBOS Group Ltd. | | 30,931 | 526,490 |
| Ryman Healthcare Group Ltd. | | 69,545 | 643,575 |
|
| TOTAL NEW ZEALAND | | | 1,170,065 |
|
| Norway - 1.4% | | | |
| Adevinta ASA Class B (b) | | 21,964 | 339,354 |
| Equinor ASA | | 28,474 | 361,642 |
| Schibsted ASA (A Shares) | | 17,213 | 701,744 |
|
| TOTAL NORWAY | | | 1,402,740 |
|
| Poland - 0.6% | | | |
| Allegro.eu SA (a)(b) | | 11,100 | 225,584 |
| CD Projekt RED SA (b) | | 4,277 | 362,377 |
|
| TOTAL POLAND | | | 587,961 |
|
| South Africa - 0.5% | | | |
| Naspers Ltd. Class N | | 2,535 | 494,902 |
| Spain - 1.9% | | | |
| Amadeus IT Holding SA Class A | | 8,698 | 415,234 |
| Cellnex Telecom SA (a) | | 19,193 | 1,232,104 |
| Euskaltel, S.A. (a) | | 31,792 | 302,507 |
|
| TOTAL SPAIN | | | 1,949,845 |
|
| Sweden - 4.7% | | | |
| ASSA ABLOY AB (B Shares) | | 22,231 | 476,465 |
| EQT AB | | 13,648 | 260,049 |
| Ericsson (B Shares) | | 98,534 | 1,100,084 |
| Indutrade AB (b) | | 19,542 | 991,331 |
| Nibe Industrier AB (B Shares) | | 10,581 | 255,179 |
| Readly International AB | | 17,852 | 112,347 |
| Securitas AB (B Shares) | | 38,739 | 548,321 |
| Stillfront Group AB (b) | | 5,572 | 653,732 |
| Svenska Handelsbanken AB (A Shares) (b) | | 52,887 | 428,527 |
|
| TOTAL SWEDEN | | | 4,826,035 |
|
| Switzerland - 11.3% | | | |
| Dufry AG (b) | | 2,000 | 75,686 |
| Lonza Group AG | | 1,746 | 1,057,919 |
| Nestle SA (Reg. S) | | 33,365 | 3,752,826 |
| Partners Group Holding AG | | 937 | 844,674 |
| Roche Holding AG (participation certificate) | | 8,800 | 2,827,718 |
| Schindler Holding AG (participation certificate) | | 1,723 | 440,639 |
| Siemens Energy AG (b) | | 5,717 | 125,176 |
| Sika AG | | 4,293 | 1,056,688 |
| Swiss Re Ltd. | | 13,422 | 962,280 |
| Zur Rose Group AG (b) | | 1,765 | 491,802 |
|
| TOTAL SWITZERLAND | | | 11,635,408 |
|
| Taiwan - 1.0% | | | |
| MediaTek, Inc. | | 17,982 | 426,152 |
| Taiwan Semiconductor Manufacturing Co. Ltd. | | 42,978 | 650,118 |
|
| TOTAL TAIWAN | | | 1,076,270 |
|
| Thailand - 0.2% | | | |
| Thai Beverage PCL | | 586,708 | 249,508 |
| United Kingdom - 11.1% | | | |
| Anglo American PLC (United Kingdom) | | 25,077 | 588,409 |
| AstraZeneca PLC (United Kingdom) | | 18,841 | 1,891,740 |
| Beazley PLC | | 73,935 | 281,601 |
| Big Yellow Group PLC | | 29,404 | 419,022 |
| Compass Group PLC | | 28,869 | 395,152 |
| Cranswick PLC | | 5,930 | 247,217 |
| Dechra Pharmaceuticals PLC | | 11,853 | 536,216 |
| Diageo PLC | | 19,950 | 644,742 |
| HomeServe PLC | | 31,681 | 453,522 |
| John David Group PLC | | 64,338 | 617,789 |
| JTC PLC (a) | | 51,856 | 361,425 |
| Keywords Studios PLC | | 862 | 23,630 |
| Lloyds Banking Group PLC | | 792,412 | 288,523 |
| London Stock Exchange Group PLC | | 10,139 | 1,092,963 |
| M&G PLC | | 384,898 | 731,249 |
| Ocado Group PLC (b) | | 18,799 | 554,299 |
| Prudential PLC | | 66,449 | 812,705 |
| Reckitt Benckiser Group PLC | | 7,535 | 663,747 |
| Rotork PLC | | 62,786 | 228,563 |
| THG Holdings Ltd. | | 21,942 | 187,497 |
| Vistry Group PLC | | 21,207 | 149,731 |
| Zegona Communications PLC | | 196,308 | 282,292 |
|
| TOTAL UNITED KINGDOM | | | 11,452,034 |
|
| United States of America - 1.5% | | | |
| MasterCard, Inc. Class A | | 1,137 | 328,184 |
| MercadoLibre, Inc. (b) | | 727 | 882,614 |
| Visa, Inc. Class A | | 1,698 | 308,544 |
|
| TOTAL UNITED STATES OF AMERICA | | | 1,519,342 |
|
| TOTAL COMMON STOCKS | | | |
| (Cost $90,823,352) | | | 99,484,864 |
|
| Preferred Stocks - 0.9% | | | |
| Convertible Preferred Stocks - 0.1% | | | |
| Hong Kong - 0.1% | | | |
| Antengene Corp. Series C1 (c)(d) | | 45,369 | 128,208 |
| Nonconvertible Preferred Stocks - 0.8% | | | |
| Germany - 0.8% | | | |
| Volkswagen AG | | 5,285 | 770,012 |
| TOTAL PREFERRED STOCKS | | | |
| (Cost $1,038,302) | | | 898,220 |
|
| Money Market Funds - 2.5% | | | |
| Fidelity Cash Central Fund 0.10% (e) | | | |
| (Cost $2,542,177) | | 2,541,668 | 2,542,177 |
| TOTAL INVESTMENT IN SECURITIES - 99.8% | | | |
| (Cost $94,403,831) | | | 102,925,261 |
| NET OTHER ASSETS (LIABILITIES) - 0.2% | | | 247,860 |
| NET ASSETS - 100% | | | $103,173,121 |
Categorizations in the Schedule of Investments are based on country or territory of incorporation.
Legend
(a) Security exempt from registration under Rule 144A of the Securities Act of 1933. These securities may be resold in transactions exempt from registration, normally to qualified institutional buyers. At the end of the period, the value of these securities amounted to $6,160,762 or 6.0% of net assets.
(b) Non-income producing
(c) Restricted securities (including private placements) - Investment in securities not registered under the Securities Act of 1933 (excluding 144A issues). At the end of the period, the value of restricted securities (excluding 144A issues) amounted to $128,208 or 0.1% of net assets.
(d) Level 3 security
(e) Affiliated fund that is generally available only to investment companies and other accounts managed by Fidelity Investments. The rate quoted is the annualized seven-day yield of the fund at period end. A complete unaudited listing of the fund's holdings as of its most recent quarter end is available upon request. In addition, each Fidelity Central Fund's financial statements, which are not covered by the Fund's Report of Independent Registered Public Accounting Firm, are available on the SEC's website or upon request.
Additional information on each restricted holding is as follows:
| Security | Acquisition Date | Acquisition Cost |
| Antengene Corp. Series C1 | 7/11/20 | $128,208 |
Affiliated Central Funds
Information regarding fiscal year to date income earned by the Fund from investments in Fidelity Central Funds is as follows:
| Fund | Income earned |
| Fidelity Cash Central Fund | $11,600 |
| Fidelity Securities Lending Cash Central Fund | 10,305 |
| Total | $21,905 |
Amounts in the income column in the above table include any capital gain distributions from underlying funds, which are presented in the corresponding line-item in the Statement of Operations, if applicable. Amount for Fidelity Securities Lending Cash Central Fund represents the income earned on investing cash collateral, less rebates paid to borrowers and any lending agent fees associated with the loan, plus any premium payments received for lending certain types of securities.
Investment Valuation
The following is a summary of the inputs used, as of October 31, 2020, involving the Fund's assets and liabilities carried at fair value. The inputs or methodology used for valuing securities may not be an indication of the risk associated with investing in those securities. For more information on valuation inputs, and their aggregation into the levels used below, please refer to the Investment Valuation section in the accompanying Notes to Financial Statements.
| | Valuation Inputs at Reporting Date: |
| Description | Total | Level 1 | Level 2 | Level 3 |
| Investments in Securities: | | | | |
| Equities: | | | | |
| Communication Services | $8,402,063 | $4,226,826 | $4,175,237 | $-- |
| Consumer Discretionary | 12,605,032 | 6,348,798 | 6,256,234 | -- |
| Consumer Staples | 8,470,214 | 1,821,593 | 6,648,621 | -- |
| Energy | 1,238,210 | 808,965 | 429,245 | -- |
| Financials | 16,479,187 | 7,967,548 | 8,511,639 | -- |
| Health Care | 15,726,607 | 4,521,462 | 11,076,937 | 128,208 |
| Industrials | 16,020,886 | 8,920,637 | 7,100,249 | -- |
| Information Technology | 13,366,048 | 4,999,881 | 8,366,167 | -- |
| Materials | 3,608,505 | 2,857,034 | 751,471 | -- |
| Real Estate | 3,177,313 | 1,544,059 | 1,633,254 | -- |
| Utilities | 1,289,019 | 1,289,019 | -- | -- |
| Money Market Funds | 2,542,177 | 2,542,177 | -- | -- |
| Total Investments in Securities: | $102,925,261 | $47,847,999 | $54,949,054 | $128,208 |
See accompanying notes which are an integral part of the financial statements.
Financial Statements
Statement of Assets and Liabilities
| | | October 31, 2020 |
| Assets | | |
Investment in securities, at value — See accompanying schedule:
Unaffiliated issuers (cost $91,861,654) | $100,383,084 | |
| Fidelity Central Funds (cost $2,542,177) | 2,542,177 | |
| Total Investment in Securities (cost $94,403,831) | | $102,925,261 |
| Cash | | 36,160 |
| Foreign currency held at value (cost $8,902) | | 8,902 |
| Receivable for investments sold | | 51,841 |
| Receivable for fund shares sold | | 190,519 |
| Dividends receivable | | 136,024 |
| Distributions receivable from Fidelity Central Funds | | 594 |
| Other receivables | | 119 |
| Total assets | | 103,349,420 |
| Liabilities | | |
| Payable for investments purchased | $18,948 | |
| Payable for fund shares redeemed | 26,057 | |
| Accrued management fee | 52,720 | |
| Other payables and accrued expenses | 78,574 | |
| Total liabilities | | 176,299 |
| Net Assets | | $103,173,121 |
| Net Assets consist of: | | |
| Paid in capital | | $95,078,756 |
| Total accumulated earnings (loss) | | 8,094,365 |
| Net Assets | | $103,173,121 |
| Net Asset Value, offering price and redemption price per share ($103,173,121 ÷ 9,134,737 shares) | | $11.29 |
See accompanying notes which are an integral part of the financial statements.
Statement of Operations
| | | Year ended October 31, 2020 |
| Investment Income | | |
| Dividends | | $1,197,083 |
| Non-Cash dividends | | 124,909 |
| Income from Fidelity Central Funds (including $10,305 from security lending) | | 21,905 |
| Total income | | 1,343,897 |
| Expenses | | |
| Management fee | $458,728 | |
| Independent trustees' fees and expenses | 396 | |
| Miscellaneous | 714 | |
| Total expenses before reductions | 459,838 | |
| Expense reductions | (3,410) | |
| Total expenses after reductions | | 456,428 |
| Net investment income (loss) | | 887,469 |
| Realized and Unrealized Gain (Loss) | | |
| Net realized gain (loss) on: | | |
| Investment securities: | | |
| Unaffiliated issuers (net of foreign taxes of $719) | (1,054,076) | |
| Fidelity Central Funds | 418 | |
| Foreign currency transactions | (21,446) | |
| Total net realized gain (loss) | | (1,075,104) |
| Change in net unrealized appreciation (depreciation) on: | | |
| Investment securities: | | |
| Unaffiliated issuers (net of increase in deferred foreign taxes of $78,573) | 5,300,309 | |
| Assets and liabilities in foreign currencies | 3,531 | |
| Total change in net unrealized appreciation (depreciation) | | 5,303,840 |
| Net gain (loss) | | 4,228,736 |
| Net increase (decrease) in net assets resulting from operations | | $5,116,205 |
See accompanying notes which are an integral part of the financial statements.
Statement of Changes in Net Assets
| | Year ended October 31, 2020 | For the period
June 13, 2019 (commencement of operations) to October 31, 2019 |
| Increase (Decrease) in Net Assets | | |
| Operations | | |
| Net investment income (loss) | $887,469 | $188,042 |
| Net realized gain (loss) | (1,075,104) | 166,642 |
| Change in net unrealized appreciation (depreciation) | 5,303,840 | 3,143,139 |
| Net increase (decrease) in net assets resulting from operations | 5,116,205 | 3,497,823 |
| Distributions to shareholders | (520,387) | – |
| Share transactions | | |
| Proceeds from sales of shares | 51,382,624 | 60,677,270 |
| Reinvestment of distributions | 520,387 | – |
| Cost of shares redeemed | (14,746,418) | (2,754,383) |
| Net increase (decrease) in net assets resulting from share transactions | 37,156,593 | 57,922,887 |
| Total increase (decrease) in net assets | 41,752,411 | 61,420,710 |
| Net Assets | | |
| Beginning of period | 61,420,710 | – |
| End of period | $103,173,121 | $61,420,710 |
| Other Information | | |
| Shares | | |
| Sold | 4,646,585 | 6,124,649 |
| Issued in reinvestment of distributions | 47,918 | – |
| Redeemed | (1,412,960) | (271,455) |
| Net increase (decrease) | 3,281,543 | 5,853,194 |
See accompanying notes which are an integral part of the financial statements.
Financial Highlights
Fidelity International Discovery K6 Fund
| | | |
| Years ended October 31, | 2020 | 2019 A |
| Selected Per–Share Data | | |
| Net asset value, beginning of period | $10.49 | $10.00 |
| Income from Investment Operations | | |
| Net investment income (loss)B | .12 | .06C |
| Net realized and unrealized gain (loss) | .77 | .43 |
| Total from investment operations | .89 | .49 |
| Distributions from net investment income | (.04) | – |
| Distributions from net realized gain | (.05) | – |
| Total distributions | (.09) | – |
| Net asset value, end of period | $11.29 | $10.49 |
| Total ReturnD,E | 8.51% | 4.90% |
| Ratios to Average Net AssetsF,G | | |
| Expenses before reductions | .60% | .60%H |
| Expenses net of fee waivers, if any | .60% | .60%H |
| Expenses net of all reductions | .60% | .60%H |
| Net investment income (loss) | 1.16% | 1.67%C,H |
| Supplemental Data | | |
| Net assets, end of period (000 omitted) | $103,173 | $61,421 |
| Portfolio turnover rateI | 42%J | 59%J,K |
A For the period June 13, 2019 (commencement of operations) to October 31, 2019.
B Calculated based on average shares outstanding during the period.
C Net investment income per share reflects one or more large, non-recurring dividend(s) which amounted to $.05 per share. Such dividends are not annualized in the ratio of net investment income (loss) to average net assets. Excluding such non-recurring dividend(s) the ratio of net investment income (loss) to average net assets would have been .43%.
D Total returns for periods of less than one year are not annualized.
E Total returns would have been lower if certain expenses had not been reduced during the applicable periods shown.
F Fees and expenses of any underlying mutual funds or exchange-traded funds (ETFs) are not included in the Fund's expense ratio. The Fund indirectly bears its proportionate share of these expenses. For additional expense information related to investments in Fidelity Central Funds, please refer to the "Investments in Fidelity Central Funds" note found in the Notes to Financial Statements section of the most recent Annual or Semi-Annual report.
G Expense ratios reflect operating expenses of the class. Expenses before reductions do not reflect amounts reimbursed, waived, or reduced through arrangements with the investment advisor, brokerage services, or other offset arrangements, if applicable, and do not represent the amount paid by the class during periods when reimbursements, waivers or reductions occur.
H Annualized
I Amount does not include the portfolio activity of any underlying mutual funds or exchange-traded funds (ETFs).
J Portfolio turnover rate excludes securities received or delivered in-kind.
K Amount not annualized.
See accompanying notes which are an integral part of the financial statements.
Notes to Financial Statements
For the period ended October 31, 2020
1. Organization.
Fidelity International Discovery K6 Fund (the Fund) is a fund of Fidelity Investment Trust (the Trust) and is authorized to issue an unlimited number of shares. Share transactions on the Statement of Changes in Net Assets may contain exchanges between affiliated funds. The Trust is registered under the Investment Company Act of 1940, as amended (the 1940 Act), as an open-end management investment company organized as a Massachusetts business trust. Shares generally are available only to employer-sponsored retirement plans that are recordkept by Fidelity, or to certain employer-sponsored retirement plans that are not recordkept by Fidelity.
Effective January 1, 2020:
Investment advisers Fidelity Investments Money Management, Inc., FMR Co., Inc., and Fidelity SelectCo, LLC, merged with and into Fidelity Management & Research Company. In connection with the merger transactions, the resulting, merged investment adviser was then redomiciled from Massachusetts to Delaware, changed its corporate structure from a corporation to a limited liability company, and changed its name to "Fidelity Management & Research Company LLC".
2. Investments in Fidelity Central Funds.
The Fund invests in Fidelity Central Funds, which are open-end investment companies generally available only to other investment companies and accounts managed by the investment adviser and its affiliates. The Fund's Schedule of Investments lists each of the Fidelity Central Funds held as of period end, if any, as an investment of the Fund, but does not include the underlying holdings of each Fidelity Central Fund. As an Investing Fund, the Fund indirectly bears its proportionate share of the expenses of the underlying Fidelity Central Funds.
The Money Market Central Funds seek preservation of capital and current income and are managed by the investment adviser. Annualized expenses of the Money Market Central Funds as of their most recent shareholder report date ranged from less than .005% to .01%.
A complete unaudited list of holdings for each Fidelity Central Fund is available upon request or at the Securities and Exchange Commission (the SEC) website at www.sec.gov. In addition, the financial statements of the Fidelity Central Funds, which are not covered by the Fund's Report of Independent Registered Public Accounting Firm, are available on the SEC website or upon request.
3. Significant Accounting Policies.
The Fund is an investment company and applies the accounting and reporting guidance of the Financial Accounting Standards Board (FASB) Accounting Standards Codification Topic 946 Financial Services – Investment Companies. The financial statements have been prepared in conformity with accounting principles generally accepted in the United States of America (GAAP), which require management to make certain estimates and assumptions at the date of the financial statements. Actual results could differ from those estimates. Subsequent events, if any, through the date that the financial statements were issued have been evaluated in the preparation of the financial statements. The following summarizes the significant accounting policies of the Fund:
Investment Valuation. Investments are valued as of 4:00 p.m. Eastern time on the last calendar day of the period. The Board of Trustees (the Board) has delegated the day to day responsibility for the valuation of the Fund's investments to the Fair Value Committee (the Committee) established by the Fund's investment adviser. In accordance with valuation policies and procedures approved by the Board, the Fund attempts to obtain prices from one or more third party pricing vendors or brokers to value its investments. When current market prices, quotations or currency exchange rates are not readily available or reliable, investments will be fair valued in good faith by the Committee, in accordance with procedures adopted by the Board. Factors used in determining fair value vary by investment type and may include market or investment specific events. The frequency with which these procedures are used cannot be predicted and they may be utilized to a significant extent. The Committee oversees the Fund's valuation policies and procedures and reports to the Board on the Committee's activities and fair value determinations. The Board monitors the appropriateness of the procedures used in valuing the Fund's investments and ratifies the fair value determinations of the Committee.
The Fund categorizes the inputs to valuation techniques used to value its investments into a disclosure hierarchy consisting of three levels as shown below:
- Level 1 – quoted prices in active markets for identical investments
- Level 2 – other significant observable inputs (including quoted prices for similar investments, interest rates, prepayment speeds, etc.)
- Level 3 – unobservable inputs (including the Fund's own assumptions based on the best information available)
Valuation techniques used to value the Fund's investments by major category are as follows:
Equity securities, including restricted securities, for which market quotations are readily available, are valued at the last reported sale price or official closing price as reported by a third party pricing vendor on the primary market or exchange on which they are traded and are categorized as Level 1 in the hierarchy. In the event there were no sales during the day or closing prices are not available, securities are valued at the last quoted bid price or may be valued using the last available price and are generally categorized as Level 2 in the hierarchy. For foreign equity securities, when market or security specific events arise, comparisons to the valuation of American Depositary Receipts (ADRs), futures contracts, Exchange-Traded Funds (ETFs) and certain indexes as well as quoted prices for similar securities may be used and would be categorized as Level 2 in the hierarchy. For equity securities, including restricted securities, where observable inputs are limited, assumptions about market activity and risk are used and these securities may be categorized as Level 3 in the hierarchy.
Investments in open-end mutual funds, including the Fidelity Central Funds, are valued at their closing net asset value (NAV) each business day and are categorized as Level 1 in the hierarchy.
Changes in valuation techniques may result in transfers in or out of an assigned level within the disclosure hierarchy. The aggregate value of investments by input level as of October 31, 2020 is included at the end of the Fund's Schedule of Investments.
Foreign Currency. Certain Funds may use foreign currency contracts to facilitate transactions in foreign-denominated securities. Gains and losses from these transactions may arise from changes in the value of the foreign currency or if the counterparties do not perform under the contracts' terms.
Foreign-denominated assets, including investment securities, and liabilities are translated into U.S. dollars at the exchange rates at period end. Purchases and sales of investment securities, income and dividends received, and expenses denominated in foreign currencies are translated into U.S. dollars at the exchange rate in effect on the transaction date.
The effects of exchange rate fluctuations on investments are included with the net realized and unrealized gain (loss) on investment securities. Other foreign currency transactions resulting in realized and unrealized gain (loss) are disclosed separately.
Investment Transactions and Income. For financial reporting purposes, the Fund's investment holdings and NAV include trades executed through the end of the last business day of the period. The NAV per share for processing shareholder transactions is calculated as of the close of business of the New York Stock Exchange (NYSE), normally 4:00 p.m. Eastern time and includes trades executed through the end of the prior business day. Gains and losses on securities sold are determined on the basis of identified cost. Dividend income is recorded on the ex-dividend date, except for certain dividends from foreign securities where the ex-dividend date may have passed, which are recorded as soon as the Fund is informed of the ex-dividend date. Non-cash dividends included in dividend income, if any, are recorded at the fair market value of the securities received. Income and capital gain distributions from Fidelity Central Funds, if any, are recorded on the ex-dividend date. Certain distributions received by the Fund represent a return of capital or capital gain. The Fund determines the components of these distributions subsequent to the ex-dividend date, based upon receipt of tax filings or other correspondence relating to the underlying investment. These distributions are recorded as a reduction of cost of investments and/or as a realized gain. Investment income is recorded net of foreign taxes withheld where recovery of such taxes is uncertain.
Expenses. Expenses directly attributable to a fund are charged to that fund. Expenses attributable to more than one fund are allocated among the respective funds on the basis of relative net assets or other appropriate methods. Expense estimates are accrued in the period to which they relate and adjustments are made when actual amounts are known.
Income Tax Information and Distributions to Shareholders. Each year, the Fund intends to qualify as a regulated investment company under Subchapter M of the Internal Revenue Code, including distributing substantially all of its taxable income and realized gains. As a result, no provision for U.S. Federal income taxes is required. As of October 31, 2020, the Fund did not have any unrecognized tax benefits in the financial statements; nor is the Fund aware of any tax positions for which it is reasonably possible that the total amounts of unrecognized tax benefits will significantly change in the next twelve months. The Fund files a U.S. federal tax return, in addition to state and local tax returns as required. The Fund's federal income tax returns are subject to examination by the Internal Revenue Service (IRS) for a period of three fiscal years after they are filed. State and local tax returns may be subject to examination for an additional fiscal year depending on the jurisdiction. Foreign taxes are provided for based on the Fund's understanding of the tax rules and rates that exist in the foreign markets in which it invests. The Fund is subject to a tax imposed on capital gains by certain countries in which it invests. An estimated deferred tax liability for net unrealized appreciation on the applicable securities is included in Other payables and accrued expenses on the Statement of Assets & Liabilities.
Distributions are declared and recorded on the ex-dividend date. Income and capital gain distributions are determined in accordance with income tax regulations, which may differ from GAAP.
Capital accounts within the financial statements are adjusted for permanent book-tax differences. These adjustments have no impact on net assets or the results of operations. Capital accounts are not adjusted for temporary book-tax differences which will reverse in a subsequent period.
Book-tax differences are primarily due to foreign currency transactions, certain foreign taxes, passive foreign investment companies (PFIC), capital loss carryforwards and losses deferred due to wash sales.
As of period end, the cost and unrealized appreciation (depreciation) in securities, and derivatives if applicable, for federal income tax purposes were as follows:
| Gross unrealized appreciation | $13,983,830 |
| Gross unrealized depreciation | (5,722,684) |
| Net unrealized appreciation (depreciation) | $8,261,146 |
| Tax Cost | $94,664,115 |
The tax-based components of distributable earnings as of period end were as follows:
| Undistributed ordinary income | $757,362 |
| Capital loss carryforward | $(849,692) |
| Net unrealized appreciation (depreciation) on securities and other investments | $8,265,268 |
Capital loss carryforwards are only available to offset future capital gains of the Fund to the extent provided by regulations and may be limited. The capital loss carryforward information presented below, including any applicable limitation, is estimated as of fiscal period end and is subject to adjustment.
| No expiration | |
| Short-term | $(804,696) |
| Long-term | (44,996) |
| Total capital loss carryforward | $(849,692) |
The tax character of distributions paid was as follows:
| | October 31, 2020 | October 31, 2019 |
| Ordinary Income | $520,387 | $ - |
Restricted Securities (including Private Placements). The Fund may invest in securities that are subject to legal or contractual restrictions on resale. These securities generally may be resold in transactions exempt from registration or to the public if the securities are registered. Disposal of these securities may involve time-consuming negotiations and expense, and prompt sale at an acceptable price may be difficult. Information regarding restricted securities is included at the end of the Fund's Schedule of Investments.
4. Purchases and Sales of Investments.
Purchases and sales of securities, other than short-term securities and in-kind transactions, are noted in the table below.
| | Purchases ($) | Sales ($) |
| Fidelity International Discovery K6 Fund | 49,529,296 | 30,323,818 |
Unaffiliated Exchanges In-Kind. During the period, the Fund received investments, including cash, valued at $17,620,976 in exchange for 1,597,329 shares of the Fund. The amount of in-kind exchanges is included in share transactions in the accompanying Statement of Changes in Net Assets.
Prior Fiscal Year Unaffiliated Exchanges In-Kind. During the prior period, the Fund received investments and cash valued at $4,739,220 in exchange for 471,564 shares of the Fund. The amount of in-kind exchanges is included in share transactions in the accompanying Statement of Changes in Net Assets.
5. Fees and Other Transactions with Affiliates.
Management Fee. Fidelity Management & Research Company LLC (the investment adviser) and its affiliates provide the Fund with investment management related services for which the Fund pays a monthly management fee that is based on an annual rate of .60% of average net assets. Under the management contract, the investment adviser or an affiliate pays all other expenses of the Fund, excluding fees and expenses of the independent Trustees, and certain miscellaneous expenses such as proxy and shareholder meeting expenses.
Brokerage Commissions. A portion of portfolio transactions were placed with brokerage firms which are affiliates of the investment adviser. Brokerage commissions are included in net realized gain (loss) and change in net unrealized appreciation (depreciation) in the Statement of Operations. The commissions paid to these affiliated firms were as follows:
| | Amount |
| Fidelity International Discovery K6 Fund | $75 |
Interfund Trades. Funds may purchase from or sell securities to other Fidelity Funds under procedures adopted by the Board. The procedures have been designed to ensure these interfund trades are executed in accordance with Rule 17a-7 of the 1940 Act. Interfund trades are included within the respective purchases and sales amounts shown in the Purchases and Sales of Investments note.
Prior Fiscal Year Affiliated Exchanges In-Kind. During the prior period, the Fund received investments and cash valued at $50,887,151 in exchange for 5,160,969 shares of the Fund. The amount of in-kind exchanges is included in share transactions in the accompanying Statement of Changes in Net Assets.
6. Committed Line of Credit.
Certain Funds participate with other funds managed by the investment adviser or an affiliate in a $4.25 billion credit facility (the "line of credit") to be utilized for temporary or emergency purposes to fund shareholder redemptions or for other short-term liquidity purposes. The participating funds have agreed to pay commitment fees on their pro-rata portion of the line of credit, which are reflected in Miscellaneous expenses on the Statement of Operations, and are as follows:
| | Amount |
| Fidelity International Discovery K6 Fund | $94 |
During the period, there were no borrowings on this line of credit.
7. Security Lending.
Funds lend portfolio securities from time to time in order to earn additional income. Lending agents are used, including National Financial Services (NFS), an affiliate of the investment adviser. Pursuant to a securities lending agreement, NFS will receive a fee, which is capped at 9.9% of a fund's daily lending revenue, for its services as lending agent. A fund may lend securities to certain qualified borrowers, including NFS. On the settlement date of the loan, a fund receives collateral (in the form of U.S. Treasury obligations, letters of credit and/or cash) against the loaned securities and maintains collateral in an amount not less than 100% of the market value of the loaned securities during the period of the loan. The market value of the loaned securities is determined at the close of business of a fund and any additional required collateral is delivered to a fund on the next business day. A fund or borrower may terminate the loan at any time, and if the borrower defaults on its obligation to return the securities loaned because of insolvency or other reasons, a fund may apply collateral received from the borrower against the obligation. A fund may experience delays and costs in recovering the securities loaned. Any cash collateral received is invested in the Fidelity Securities Lending Cash Central Fund. Any loaned securities are identified as such in the Schedule of Investments, and the value of loaned securities and cash collateral at period end, as applicable, are presented in the Statement of Assets and Liabilities. Security lending income represents the income earned on investing cash collateral, less rebates paid to borrowers and any lending agent fees associated with the loan, plus any premium payments received for lending certain types of securities. Security lending income is presented in the Statement of Operations as a component of income from Fidelity Central Funds. Affiliated security lending activity, if any, was as follows:
| | Total Security Lending Income Fees Paid to NFS | Security Lending Income From Securities Loaned to NFS | Value of Securities Loaned to NFS at Period End |
| Fidelity International Discovery K6 Fund | $26 | $– | $– |
8. Expense Reductions.
Commissions paid to certain brokers with whom the investment adviser, or its affiliates, places trades on behalf of the Fund include an amount in addition to trade execution, which may be rebated back to the Fund to offset certain expenses. This amount totaled $3,358 for the period. In addition, through arrangements with the Fund's custodian, credits realized as a result of certain uninvested cash balances were used to reduce the Fund's expenses by $52.
9. Other.
The Fund's organizational documents provide former and current trustees and officers with a limited indemnification against liabilities arising in connection with the performance of their duties to the Fund. In the normal course of business, the Fund may also enter into contracts that provide general indemnifications. The Fund's maximum exposure under these arrangements is unknown as this would be dependent on future claims that may be made against the Fund. The risk of material loss from such claims is considered remote.
10. Coronavirus (COVID-19) Pandemic.
An outbreak of COVID-19 first detected in China during December 2019 has since spread globally and was declared a pandemic by the World Health Organization during March 2020. Developments that disrupt global economies and financial markets, such as the COVID-19 pandemic, may magnify factors that affect the Fund's performance.
Report of Independent Registered Public Accounting Firm
To the Board of Trustees of Fidelity Investment Trust and Shareholders of Fidelity International Discovery K6 Fund:
Opinion on the Financial Statements and Financial Highlights
We have audited the accompanying statement of assets and liabilities of Fidelity International Discovery K6 Fund (the "Fund"), a fund of Fidelity Investment Trust, including the schedule of investments, as of October 31, 2020, the related statement of operations for the year then ended, the statement of changes in net assets and the financial highlights for the year then ended and for the period from June 13, 2019 (commencement of operations) through October 31, 2019, and the related notes. In our opinion, the financial statements and financial highlights present fairly, in all material respects, the financial position of the Fund as of October 31, 2020, the results of its operations for the year then ended, and the changes in its net assets and the financial highlights for the year then ended and for the period from June 13, 2019 (commencement of operations) through October 31, 2019 in conformity with accounting principles generally accepted in the United States of America.
Basis for Opinion
These financial statements and financial highlights are the responsibility of the Fund's management. Our responsibility is to express an opinion on the Fund's financial statements and financial highlights based on our audits. We are a public accounting firm registered with the Public Company Accounting Oversight Board (United States) (PCAOB) and are required to be independent with respect to the Fund in accordance with the U.S. federal securities laws and the applicable rules and regulations of the Securities and Exchange Commission and the PCAOB.
We conducted our audits in accordance with the standards of the PCAOB. Those standards require that we plan and perform the audit to obtain reasonable assurance about whether the financial statements and financial highlights are free of material misstatement, whether due to error or fraud. The Fund is not required to have, nor were we engaged to perform, an audit of its internal control over financial reporting. As part of our audits we are required to obtain an understanding of internal control over financial reporting but not for the purpose of expressing an opinion on the effectiveness of the Fund’s internal control over financial reporting. Accordingly, we express no such opinion.
Our audits included performing procedures to assess the risks of material misstatement of the financial statements and financial highlights, whether due to error or fraud, and performing procedures that respond to those risks. Such procedures included examining, on a test basis, evidence regarding the amounts and disclosures in the financial statements and financial highlights. Our audits also included evaluating the accounting principles used and significant estimates made by management, as well as evaluating the overall presentation of the financial statements and financial highlights. Our procedures included confirmation of securities owned as of October 31, 2020, by correspondence with the custodian and brokers; when replies were not received from brokers, we performed other auditing procedures. We believe that our audits provide a reasonable basis for our opinion.
/s/ Deloitte & Touche LLP
Boston, Massachusetts
December 15, 2020
We have served as the auditor of one or more of the Fidelity investment companies since 1999.
Trustees and Officers
The Trustees, Members of the Advisory Board (if any), and officers of the trust and fund, as applicable, are listed below. The Board of Trustees governs the fund and is responsible for protecting the interests of shareholders. The Trustees are experienced executives who meet periodically throughout the year to oversee the fund's activities, review contractual arrangements with companies that provide services to the fund, oversee management of the risks associated with such activities and contractual arrangements, and review the fund's performance. Except for Jonathan Chiel, each of the Trustees oversees 305 funds. Mr. Chiel oversees 176 funds.
The Trustees hold office without limit in time except that (a) any Trustee may resign; (b) any Trustee may be removed by written instrument, signed by at least two-thirds of the number of Trustees prior to such removal; (c) any Trustee who requests to be retired or who has become incapacitated by illness or injury may be retired by written instrument signed by a majority of the other Trustees; and (d) any Trustee may be removed at any special meeting of shareholders by a two-thirds vote of the outstanding voting securities of the trust. Each Trustee who is not an interested person (as defined in the 1940 Act) of the trust and the fund is referred to herein as an Independent Trustee. Each Independent Trustee shall retire not later than the last day of the calendar year in which his or her 75th birthday occurs. The Independent Trustees may waive this mandatory retirement age policy with respect to individual Trustees. Officers and Advisory Board Members hold office without limit in time, except that any officer or Advisory Board Member may resign or may be removed by a vote of a majority of the Trustees at any regular meeting or any special meeting of the Trustees. Except as indicated, each individual has held the office shown or other offices in the same company for the past five years.
The fund’s Statement of Additional Information (SAI) includes more information about the Trustees. To request a free copy, call Fidelity at 1-800-835-5092.
Experience, Skills, Attributes, and Qualifications of the Trustees. The Governance and Nominating Committee has adopted a statement of policy that describes the experience, qualifications, attributes, and skills that are necessary and desirable for potential Independent Trustee candidates (Statement of Policy). The Board believes that each Trustee satisfied at the time he or she was initially elected or appointed a Trustee, and continues to satisfy, the standards contemplated by the Statement of Policy. The Governance and Nominating Committee also engages professional search firms to help identify potential Independent Trustee candidates who have the experience, qualifications, attributes, and skills consistent with the Statement of Policy. From time to time, additional criteria based on the composition and skills of the current Independent Trustees, as well as experience or skills that may be appropriate in light of future changes to board composition, business conditions, and regulatory or other developments, have also been considered by the professional search firms and the Governance and Nominating Committee. In addition, the Board takes into account the Trustees' commitment and participation in Board and committee meetings, as well as their leadership of standing and ad hoc committees throughout their tenure.
In determining that a particular Trustee was and continues to be qualified to serve as a Trustee, the Board has considered a variety of criteria, none of which, in isolation, was controlling. The Board believes that, collectively, the Trustees have balanced and diverse experience, qualifications, attributes, and skills, which allow the Board to operate effectively in governing the fund and protecting the interests of shareholders. Information about the specific experience, skills, attributes, and qualifications of each Trustee, which in each case led to the Board's conclusion that the Trustee should serve (or continue to serve) as a trustee of the fund, is provided below.
Board Structure and Oversight Function. Robert A. Lawrence is an interested person and currently serves as Acting Chairman. The Trustees have determined that an interested Chairman is appropriate and benefits shareholders because an interested Chairman has a personal and professional stake in the quality and continuity of services provided to the fund. Independent Trustees exercise their informed business judgment to appoint an individual of their choosing to serve as Chairman, regardless of whether the Trustee happens to be independent or a member of management. The Independent Trustees have determined that they can act independently and effectively without having an Independent Trustee serve as Chairman and that a key structural component for assuring that they are in a position to do so is for the Independent Trustees to constitute a substantial majority for the Board. The Independent Trustees also regularly meet in executive session. Ned C. Lautenbach and David M. Thomas serve as Co-Lead Independent Trustees and as such each (i) acts as a liaison between the Independent Trustees and management with respect to matters important to the Independent Trustees and (ii) with management prepares agendas for Board meetings.
Fidelity® funds are overseen by different Boards of Trustees. The fund's Board oversees Fidelity's high income and certain equity funds, and other Boards oversee Fidelity's investment-grade bond, money market, asset allocation, and other equity funds. The asset allocation funds may invest in Fidelity® funds overseen by the fund's Board. The use of separate Boards, each with its own committee structure, allows the Trustees of each group of Fidelity® funds to focus on the unique issues of the funds they oversee, including common research, investment, and operational issues. On occasion, the separate Boards establish joint committees to address issues of overlapping consequences for the Fidelity® funds overseen by each Board.
The Trustees operate using a system of committees to facilitate the timely and efficient consideration of all matters of importance to the Trustees, the fund, and fund shareholders and to facilitate compliance with legal and regulatory requirements and oversight of the fund's activities and associated risks. The Board, acting through its committees, has charged FMR and its affiliates with (i) identifying events or circumstances the occurrence of which could have demonstrably adverse effects on the fund's business and/or reputation; (ii) implementing processes and controls to lessen the possibility that such events or circumstances occur or to mitigate the effects of such events or circumstances if they do occur; and (iii) creating and maintaining a system designed to evaluate continuously business and market conditions in order to facilitate the identification and implementation processes described in (i) and (ii) above. Because the day-to-day operations and activities of the fund are carried out by or through FMR, its affiliates, and other service providers, the fund's exposure to risks is mitigated but not eliminated by the processes overseen by the Trustees. While each of the Board's committees has responsibility for overseeing different aspects of the fund's activities, oversight is exercised primarily through the Operations, Audit, and Compliance Committees. Appropriate personnel, including but not limited to the fund's Chief Compliance Officer (CCO), FMR's internal auditor, the independent accountants, the fund's Treasurer and portfolio management personnel, make periodic reports to the Board's committees, as appropriate, including an annual review of Fidelity's risk management program for the Fidelity® funds. The responsibilities of each standing committee, including their oversight responsibilities, are described further under "Standing Committees of the Trustees."
Interested Trustees*:
Correspondence intended for a Trustee who is an interested person may be sent to Fidelity Investments, 245 Summer Street, Boston, Massachusetts 02210.
Name, Year of Birth; Principal Occupations and Other Relevant Experience+
Jonathan Chiel (1957)
Year of Election or Appointment: 2016
Trustee
Mr. Chiel also serves as Trustee of other Fidelity® funds. Mr. Chiel is Executive Vice President and General Counsel for FMR LLC (diversified financial services company, 2012-present). Previously, Mr. Chiel served as general counsel (2004-2012) and senior vice president and deputy general counsel (2000-2004) for John Hancock Financial Services; a partner with Choate, Hall & Stewart (1996-2000) (law firm); and an Assistant United States Attorney for the United States Attorney’s Office of the District of Massachusetts (1986-95), including Chief of the Criminal Division (1993-1995). Mr. Chiel is a director on the boards of the Boston Bar Foundation and the Maimonides School.
Robert A. Lawrence (1952)
Year of Election or Appointment: 2020
Trustee
Acting Chairman of the Board of Trustees
Mr. Lawrence also serves as Trustee of other funds. Previously, Mr. Lawrence served as a Member of the Advisory Board of certain funds. Prior to his retirement in 2008, Mr. Lawrence served as Vice President of certain Fidelity® funds (2006-2008), Senior Vice President, Head of High Income Division of Fidelity Management & Research Company (investment adviser firm, 2006-2008), and President of Fidelity Strategic Investments (investment adviser firm, 2002-2005).
* Determined to be an “Interested Trustee” by virtue of, among other things, his or her affiliation with the trust or various entities under common control with FMR.
+ The information includes the Trustee's principal occupation during the last five years and other information relating to the experience, attributes, and skills relevant to the Trustee's qualifications to serve as a Trustee, which led to the conclusion that the Trustee should serve as a Trustee for the fund.
Independent Trustees:
Correspondence intended for an Independent Trustee may be sent to Fidelity Investments, P.O. Box 55235, Boston, Massachusetts 02205-5235.
Name, Year of Birth; Principal Occupations and Other Relevant Experience+
Dennis J. Dirks (1948)
Year of Election or Appointment: 2005
Trustee
Mr. Dirks also serves as Trustee of other Fidelity® funds. Prior to his retirement in May 2003, Mr. Dirks served as Chief Operating Officer and as a member of the Board of The Depository Trust & Clearing Corporation (financial markets infrastructure), President, Chief Operating Officer and a member of the Board of The Depository Trust Company (DTC), President and a member of the Board of the National Securities Clearing Corporation (NSCC), Chief Executive Officer and a member of the Board of the Government Securities Clearing Corporation and Chief Executive Officer and a member of the Board of the Mortgage-Backed Securities Clearing Corporation. Mr. Dirks currently serves as a member of the Finance Committee (2016-present) and Board (2017-present) and is Treasurer (2018-present) of the Asolo Repertory Theatre.
Donald F. Donahue (1950)
Year of Election or Appointment: 2018
Trustee
Mr. Donahue also serves as Trustee of other Fidelity® funds. Mr. Donahue serves as President and Chief Executive Officer of Miranda Partners, LLC (risk consulting for the financial services industry, 2012-present). Previously, Mr. Donahue served as Chief Executive Officer (2006-2012), Chief Operating Officer (2003-2006) and Managing Director, Customer Marketing and Development (1999-2003) of The Depository Trust & Clearing Corporation (financial markets infrastructure). Mr. Donahue currently serves as a member (2007-present) and Co-Chairman (2016-present) of the Board of United Way of New York, a member of the Board of NYC Leadership Academy (2012-present) and a member of the Board of Advisors of Ripple Labs, Inc. (financial services, 2015-present). Mr. Donahue previously served as a member of the Advisory Board of certain Fidelity® funds (2015-2018).
Vicki L. Fuller (1957)
Year of Election or Appointment: 2020
Trustee
Ms. Fuller also serves as Trustee of other Fidelity® funds. Previously, Ms. Fuller served as a member of the Advisory Board of certain Fidelity® funds (2018-2020), Chief Investment Officer of the New York State Common Retirement Fund (2012-2018) and held a variety of positions at AllianceBernstein L.P. (global asset management, 1985-2012), including Managing Director (2006-2012) and Senior Vice President and Senior Portfolio Manager (2001-2006). Ms. Fuller currently serves as a member of the Board, Audit Committee and Nominating and Governance Committee of The Williams Companies, Inc. (natural gas infrastructure, 2018-present), as a member of the Board, Audit Committee and Nominating and Governance Committee of two Blackstone business development companies (2020-present) and as a member of the Board of Treliant, LLC (consulting, 2019-present).
Patricia L. Kampling (1959)
Year of Election or Appointment: 2020
Trustee
Ms. Kampling also serves as Trustee of other Fidelity® funds. Prior to her retirement, Ms. Kampling served as Chairman of the Board and Chief Executive Officer (2012-2019), President and Chief Operating Officer (2011-2012) and Executive Vice President and Chief Financial Officer (2010-2011) of Alliant Energy Corporation. Ms. Kampling currently serves as a member of the Board, Compensation Committee and Executive Committee and as Chair of the Audit Committee of Briggs & Stratton Corporation (manufacturing, 2011-present) and as a member of the Board, Audit, Finance and Risk Committee and Safety, Environmental, Technology and Operations Committee of American Water Works Company, Inc. (utilities company, 2019-present). In addition, Ms. Kampling currently serves as a member of the Board of the Nature Conservancy, Wisconsin Chapter (2019-present). Previously, Ms. Kampling served as a Member of the Advisory Board of certain Fidelity® funds (2020), a member of the Board of Interstate Power and Light Company (2012-2019) and Wisconsin Power and Light Company (2012-2019) (each a subsidiary of Alliant Energy Corporation) and as a member of the Board and Workforce Development Committee of the Business Roundtable (2018-2019).
Alan J. Lacy (1953)
Year of Election or Appointment: 2008
Trustee
Mr. Lacy also serves as Trustee of other Fidelity® funds. Previously, Mr. Lacy served as Senior Adviser (2007-2014) of Oak Hill Capital Partners, L.P. (private equity), Chief Executive Officer (2005) and Vice Chairman (2005-2006) of Sears Holdings Corporation (retail), Chief Executive Officer and Chairman of the Board of Sears, Roebuck and Co. (retail, 2000-2005), Chairman (2014-2017) and a member of the Board (2010-2017) of Dave & Buster’s Entertainment, Inc. (restaurant and entertainment complexes) and a member of the Board of Bristol-Myers Squibb Company (global pharmaceuticals, 2008-2020). Mr. Lacy currently serves as a Trustee of the California Chapter of The Nature Conservancy (2015-present) and a member of the Board of the Center for Advanced Study in the Behavioral Sciences at Stanford University (2015-present).
Ned C. Lautenbach (1944)
Year of Election or Appointment: 2000
Trustee
Co-Lead Independent Trustee
Mr. Lautenbach also serves as Trustee of other Fidelity® funds. Mr. Lautenbach currently serves as Chair of the Board of Governors, State University System of Florida (2013-present) and is a member of the Council on Foreign Relations (1994-present). He is also a member and has in the past served as Chairman of the Board of Directors of Artis-Naples (2012-present). Previously, Mr. Lautenbach served as a member and then Lead Director of the Board of Directors of Eaton Corporation (diversified industrial, 1997-2016). He was also a Partner at Clayton, Dubilier & Rice, LLC (private equity investment, 1998-2010); as well as Director of Sony Corporation (2006-2007). In addition, Mr. Lautenbach had a 30-year career with IBM (technology company), during which time he served as Senior Vice President and as a member of the Corporate Executive Committee (1968-1998).
Joseph Mauriello (1944)
Year of Election or Appointment: 2008
Trustee
Mr. Mauriello also serves as Trustee of other Fidelity® funds. Prior to his retirement in January 2006, Mr. Mauriello served in numerous senior management positions including Deputy Chairman and Chief Operating Officer (2004-2005), and Vice Chairman of Financial Services (2002-2004) of KPMG LLP US (professional services, 1965-2005). Mr. Mauriello currently serves as a member of the Independent Directors Council Governing Council (2015-present). Previously, Mr. Mauriello served as a member of the Board of XL Group plc. (global insurance and re-insurance, 2006-2018).
Cornelia M. Small (1944)
Year of Election or Appointment: 2005
Trustee
Ms. Small also serves as Trustee of other Fidelity® funds. Previously, Ms. Small served as Chief Investment Officer, Director of Global Equity Investments and a member of Scudder, Stevens & Clark and Scudder Kemper Investments. Ms. Small previously served as a member of the Board (2009-2019) and Chair of the Investment Committee (2010-2019) of the Teagle Foundation and a member of the Investment Committee of the Berkshire Taconic Community Foundation (2008-2019).
Garnett A. Smith (1947)
Year of Election or Appointment: 2018
Trustee
Mr. Smith also serves as Trustee of other Fidelity® funds. Prior to his retirement, Mr. Smith served as Chairman and Chief Executive Officer (1990-1997) and President (1986-1990) of Inbrand Corp. (manufacturer of personal absorbent products). Prior to his employment with Inbrand Corp., he was employed by a retail fabric chain and North Carolina National Bank (now Bank of America). Mr. Smith previously served as a member of the Advisory Board of certain Fidelity® funds (2012-2013).
David M. Thomas (1949)
Year of Election or Appointment: 2008
Trustee
Co-Lead Independent Trustee
Mr. Thomas also serves as Trustee of other Fidelity® funds. Previously, Mr. Thomas served as Executive Chairman (2005-2006) and Chairman and Chief Executive Officer (2000-2005) of IMS Health, Inc. (pharmaceutical and healthcare information solutions). Mr. Thomas currently serves as Non-Executive Chairman of the Board of Fortune Brands Home and Security (home and security products, 2011-present), and a member of the Board (2004-present) and Presiding Director (2013-present) of Interpublic Group of Companies, Inc. (marketing communication).
Susan Tomasky (1953)
Year of Election or Appointment: 2020
Trustee
Ms. Tomasky also serves as Trustee of other Fidelity® funds. Prior to her retirement, Ms. Tomasky served in various executive officer positions at American Electric Power Company, Inc. (1998-2011), including most recently as President of AEP Transmission (2007-2011). Ms. Tomasky currently serves as a member of the Board and Sustainability Committee and as Chair of the Audit Committee of Marathon Petroleum Corporation (2018-present) and as a member of the Board, Corporate Governance Committee and Organization and Compensation Committee and as Chair of the Audit Committee of Public Service Enterprise Group, Inc. (utilities company, 2012-present). In addition, Ms. Tomasky currently serves as a member of the Board of the Columbus Regional Airport Authority (2007-present), as a member of the Board of the Royal Shakespeare Company – America (2009-present), as a member of the Board of the Columbus Association for the Performing Arts (2011-present) and as a member of the Board of Kenyon College (2016-present). Previously, Ms. Tomasky served as a Member of the Advisory Board of certain Fidelity® funds (2020), a member of the Board (2011-2019) and as Lead Independent Director (2015-2018) of Andeavor Corporation (previously Tesoro Corporation) (independent oil refiner and marketer) and as a member of the Board of Summit Midstream Partners LP (energy, 2012-2018).
Michael E. Wiley (1950)
Year of Election or Appointment: 2020
Trustee
Mr. Wiley also serves as Trustee of other Fidelity® funds. Previously, Mr. Wiley served as a member of the Advisory Board of certain Fidelity® funds (2018-2020), Chairman, President and CEO of Baker Hughes, Inc. (oilfield services, 2000-2004). Mr. Wiley also previously served as a member of the Board of Andeavor Corporation (independent oil refiner and marketer, 2005-2018), a member of the Board of Andeavor Logistics LP (natural resources logistics, 2015-2018) and a member of the Board of High Point Resources (exploration and production, 2005-2020).
+ The information includes the Trustee's principal occupation during the last five years and other information relating to the experience, attributes, and skills relevant to the Trustee's qualifications to serve as a Trustee, which led to the conclusion that the Trustee should serve as a Trustee for the fund.
Advisory Board Members and Officers:
Correspondence intended for a Member of the Advisory Board (if any) may be sent to Fidelity Investments, P.O. Box 55235, Boston, Massachusetts 02205-5235. Correspondence intended for an officer or Peter S. Lynch may be sent to Fidelity Investments, 245 Summer Street, Boston, Massachusetts 02210. Officers appear below in alphabetical order.
Name, Year of Birth; Principal Occupation
Lloyd James Austin, III (1953)
Year of Election or Appointment: 2020
Member of the Advisory Board
General Austin also serves as a Member of the Advisory Board of other Fidelity® funds. Prior to his retirement, General Austin (United States Army, Retired) held a variety of positions within the U.S. Government, including Commander, U.S. Central Command (2013-2016), Vice Chief of Staff, U.S. Army (2012-2013) and Commanding General, U.S. Forces – Iraq, Operation New Dawn (2010-2012). General Austin currently serves as a Partner of Pine Island Capital Partners (private equity, 2020-present) and as President of the Austin Strategy Group LLC (consulting, 2016-present). General Austin serves as a member of the Board of Directors of Nucor Corporation (steel products, 2017-present), as a member of the Board of Directors of Tenet Healthcare Corporation (2018-present) and as a member of the Board of Directors of Raytheon Technologies Corporation (aerospace and defense, 2020-present). In addition, General Austin currently serves as a member of the Board of Trustees of the Carnegie Corporation of New York (2017-present) and as a member of the Board of Trustees of Auburn University (2017-present). Previously, General Austin served as a member of the Board of Directors of United Technologies Corporation (aerospace, defense and building, 2016-2020).
Thomas A. Kennedy (1955)
Year of Election or Appointment: 2020
Member of the Advisory Board
Mr. Kennedy also serves as a Member of the Advisory Board of other Fidelity® funds. Previously, Mr. Kennedy held a variety of positions at Raytheon Company (aerospace and defense, 1983-2020), including Chairman and Chief Executive Officer (2014-2020) and Executive Vice President and Chief Operating Officer (2013-2014). Mr. Kennedy currently serves as Executive Chairman of the Board of Directors of Raytheon Technologies Corporation (aerospace and defense, 2020-present). He is also a member of the Rutgers School of Engineering Industry Advisory Board (2011-present) and a member of the UCLA Engineering Dean’s Executive Board (2016-present).
Peter S. Lynch (1944)
Year of Election or Appointment: 2003
Member of the Advisory Board
Mr. Lynch also serves as a Member of the Advisory Board of other Fidelity® funds. Mr. Lynch is Vice Chairman and a Director of Fidelity Management & Research Company LLC (investment adviser firm). In addition, Mr. Lynch serves as a Trustee of Boston College and as the Chairman of the Inner-City Scholarship Fund. Previously, Mr. Lynch served as Vice Chairman and a Director of FMR Co., Inc. (investment adviser firm) and on the Special Olympics International Board of Directors (1997-2006).
Elizabeth Paige Baumann (1968)
Year of Election or Appointment: 2017
Anti-Money Laundering (AML) Officer
Ms. Baumann also serves as AML Officer of other funds. She is Chief AML Officer (2012-present) and Senior Vice President (2014-present) of FMR LLC (diversified financial services company) and is an employee of Fidelity Investments. Previously, Ms. Baumann served as AML Officer of certain funds (2017-2019), as AML Officer of the funds (2012-2016), and Vice President (2007-2014) and Deputy Anti-Money Laundering Officer (2007-2012) of FMR LLC.
Craig S. Brown (1977)
Year of Election or Appointment: 2019
Assistant Treasurer
Mr. Brown also serves as Assistant Treasurer of other funds. Mr. Brown is an employee of Fidelity Investments (2013-present).
John J. Burke III (1964)
Year of Election or Appointment: 2018
Chief Financial Officer
Mr. Burke also serves as Chief Financial Officer of other funds. Mr. Burke serves as Head of Investment Operations for Fidelity Fund and Investment Operations (2018-present) and is an employee of Fidelity Investments (1998-present). Previously Mr. Burke served as head of Asset Management Investment Operations (2012-2018).
William C. Coffey (1969)
Year of Election or Appointment: 2019
Assistant Secretary
Mr. Coffey also serves as Assistant Secretary of other funds. He is Senior Vice President and Deputy General Counsel of FMR LLC (diversified financial services company, 2010-present), and is an employee of Fidelity Investments. Previously, Mr. Coffey served as Secretary and CLO of certain funds (2018-2019); CLO, Secretary, and Senior Vice President of Fidelity Management & Research Company and FMR Co., Inc. (investment adviser firms, 2018-2019); Secretary of Fidelity SelectCo, LLC and Fidelity Investments Money Management, Inc. (investment adviser firms, 2018-2019); CLO of Fidelity Management & Research (Hong Kong) Limited, FMR Investment Management (UK) Limited, and Fidelity Management & Research (Japan) Limited (investment adviser firms, 2018-2019); and Assistant Secretary of certain funds (2009-2018).
Timothy M. Cohen (1969)
Year of Election or Appointment: 2018
Vice President
Mr. Cohen also serves as Vice President of other funds. Mr. Cohen serves as Co-Head of Equity (2018-present), a Director of Fidelity Management & Research (Japan) Limited (investment adviser firm, 2016-present), and is an employee of Fidelity Investments. Previously, Mr. Cohen served as Executive Vice President of Fidelity SelectCo, LLC (2019), Head of Global Equity Research (2016-2018), Chief Investment Officer - Equity and a Director of Fidelity Management & Research (U.K.) Inc. (investment adviser firm, 2013-2015) and as a Director of Fidelity Management & Research (Hong Kong) Limited (investment adviser firm, 2017).
Jonathan Davis (1968)
Year of Election or Appointment: 2010
Assistant Treasurer
Mr. Davis also serves as Assistant Treasurer of other funds. Mr. Davis serves as Assistant Treasurer of FMR Capital, Inc. (2017-present) and is an employee of Fidelity Investments. Previously, Mr. Davis served as Vice President and Associate General Counsel of FMR LLC (diversified financial services company, 2003-2010).
Laura M. Del Prato (1964)
Year of Election or Appointment: 2018
Assistant Treasurer
Ms. Del Prato also serves as an officer of other funds. Ms. Del Prato is an employee of Fidelity Investments (2017-present). Previously, Ms. Del Prato served as President and Treasurer of The North Carolina Capital Management Trust: Cash Portfolio and Term Portfolio (2018-2020). Prior to joining Fidelity Investments, Ms. Del Prato served as a Managing Director and Treasurer of the JPMorgan Mutual Funds (2014-2017). Prior to JPMorgan, Ms. Del Prato served as a partner at Cohen Fund Audit Services (accounting firm, 2012-2013) and KPMG LLP (accounting firm, 2004-2012).
Colm A. Hogan (1973)
Year of Election or Appointment: 2020
Assistant Treasurer
Mr. Hogan also serves as an officer of other funds. Mr. Hogan serves as Assistant Treasurer of FMR Capital, Inc. (2017-present) and is an employee of Fidelity Investments (2005-present). Previously, Mr. Hogan served as Deputy Treasurer of certain Fidelity® funds (2016-2020) and Assistant Treasurer of certain Fidelity® funds (2016-2018).
Pamela R. Holding (1964)
Year of Election or Appointment: 2018
Vice President
Ms. Holding also serves as Vice President of other funds. Ms. Holding serves as Co-Head of Equity (2018-present) and is an employee of Fidelity Investments (2013-present). Previously, Ms. Holding served as Executive Vice President of Fidelity SelectCo, LLC (2019) and as Chief Investment Officer of Fidelity Institutional Asset Management (2013-2018).
Cynthia Lo Bessette (1969)
Year of Election or Appointment: 2019
Secretary and Chief Legal Officer (CLO)
Ms. Lo Bessette also serves as an officer of other funds. Ms. Lo Bessette serves as CLO, Secretary, and Senior Vice President of Fidelity Management & Research Company LLC (investment adviser firm, 2019-present); and CLO of Fidelity Management & Research (Hong Kong) Limited, FMR Investment Management (UK) Limited, and Fidelity Management & Research (Japan) Limited (investment adviser firms, 2019-present). She is a Senior Vice President and Deputy General Counsel of FMR LLC (diversified financial services company, 2019-present), and is an employee of Fidelity Investments. Previously, Ms. Lo Bessette served as CLO, Secretary, and Senior Vice President of FMR Co., Inc. (investment adviser firm, 2019); Secretary of Fidelity SelectCo, LLC and Fidelity Investments Money Management, Inc. (investment adviser firms, 2019). Prior to joining Fidelity Investments, Ms. Lo Bessette was Executive Vice President, General Counsel (2016-2019) and Senior Vice President, Deputy General Counsel (2015-2016) of OppenheimerFunds (investment management company) and Deputy Chief Legal Officer (2013-2015) of Jennison Associates LLC (investment adviser firm).
Chris Maher (1972)
Year of Election or Appointment: 2020
Deputy Treasurer
Mr. Maher also serves as an officer of other funds. Mr. Maher serves as Assistant Treasurer of FMR Capital, Inc. (2017-present), and is an employee of Fidelity Investments (2008-present). Previously, Mr. Maher served as Assistant Treasurer of certain funds (2013-2020); Vice President of Asset Management Compliance (2013), Vice President of the Program Management Group of FMR (investment adviser firm, 2010-2013), and Vice President of Valuation Oversight (2008-2010).
Jason P. Pogorelec (1975)
Year of Election or Appointment: 2020
Chief Compliance Officer
Mr. Pogorelec also serves as Chief Compliance Officer of other funds. Mr. Pogorelec is a senior Vice President of Asset Management Compliance for Fidelity Investments and is an employee of Fidelity Investments (2006-present). Previously, Mr. Pogorelec served as Vice President, Associate General Counsel for Fidelity Investments (2010-2020) and Assistant Secretary of certain Fidelity funds (2015-2020).
Stacie M. Smith (1974)
Year of Election or Appointment: 2016
President and Treasurer
Ms. Smith also serves as an officer of other funds. Ms. Smith serves as Assistant Treasurer of FMR Capital, Inc. (2017-present), is an employee of Fidelity Investments (2009-present), and has served in other fund officer roles. Prior to joining Fidelity Investments, Ms. Smith served as Senior Audit Manager of Ernst & Young LLP (accounting firm, 1996-2009). Previously, Ms. Smith served as Assistant Treasurer (2013-2019) and Deputy Treasurer (2013-2016) of certain Fidelity® funds.
Marc L. Spector (1972)
Year of Election or Appointment: 2016
Assistant Treasurer
Mr. Spector also serves as an officer of other funds. Mr. Spector serves as Assistant Treasurer of FMR Capital, Inc. (2017-present) and is an employee of Fidelity Investments (2016-present). Prior to joining Fidelity Investments, Mr. Spector served as Director at the Siegfried Group (accounting firm, 2013-2016), and prior to Siegfried Group as audit senior manager at Deloitte & Touche LLP (accounting firm, 2005-2013).
Jim Wegmann (1979)
Year of Election or Appointment: 2019
Assistant Treasurer
Mr. Wegmann also serves as Assistant Treasurer of other funds. Mr. Wegmann is an employee of Fidelity Investments (2011-present).
Shareholder Expense Example
As a shareholder, you incur two types of costs: (1) transaction costs, which may include sales charges (loads) on purchase payments or redemption proceeds, as applicable and (2) ongoing costs, which generally include management fees, distribution and/or service (12b-1) fees and other Fund expenses. This Example is intended to help you understand your ongoing costs (in dollars) of investing in a fund and to compare these costs with the ongoing costs of investing in other mutual funds.
The Example is based on an investment of $1,000 invested at the beginning of the period and held for the entire period (May 1, 2020 to October 31, 2020).
Actual Expenses
The first line of the accompanying table provides information about actual account values and actual expenses. You may use the information in this line, together with the amount you invested, to estimate the expenses that you paid over the period. Simply divide your account value by $1,000.00 (for example, an $8,600 account value divided by $1,000.00 = 8.6), then multiply the result by the number in the first line for a class/Fund under the heading entitled "Expenses Paid During Period" to estimate the expenses you paid on your account during this period. If any fund is a shareholder of any underlying mutual funds or exchange-traded funds (ETFs) (the Underlying Funds), such fund indirectly bears its proportional share of the expenses of the Underlying Funds in addition to the direct expenses incurred presented in the table. These fees and expenses are not included in the annualized expense ratio used to calculate the expense estimate in the table below.
Hypothetical Example for Comparison Purposes
The second line of the accompanying table provides information about hypothetical account values and hypothetical expenses based on the actual expense ratio and an assumed rate of return of 5% per year before expenses, which is not the actual return. The hypothetical account values and expenses may not be used to estimate the actual ending account balance or expenses you paid for the period. You may use this information to compare the ongoing costs of investing in the Fund and other funds. To do so, compare this 5% hypothetical example with the 5% hypothetical examples that appear in the shareholder reports of the other funds. If any fund is a shareholder of any Underlying Funds, such fund indirectly bears its proportional share of the expenses of the Underlying Funds in addition to the direct expenses as presented in the table. These fees and expenses are not included in the annualized expense ratio used to calculate the expense estimate in the table below.
Please note that the expenses shown in the table are meant to highlight your ongoing costs only and do not reflect any transaction costs. Therefore, the second line of the table is useful in comparing ongoing costs only, and will not help you determine the relative total costs of owning different funds.
| | Annualized Expense Ratio-A | Beginning
Account Value
May 1, 2020 | Ending
Account Value
October 31, 2020 | Expenses Paid
During Period-B
May 1, 2020
to October 31, 2020 |
| Fidelity International Discovery K6 Fund | .60% | | | |
| Actual | | $1,000.00 | $1,176.00 | $3.28 |
| Hypothetical-C | | $1,000.00 | $1,022.12 | $3.05 |
A Annualized expense ratio reflects expenses net of applicable fee waivers.
B Expenses are equal to the annualized expense ratio, multiplied by the average account value over the period, multiplied by 184/ 366 (to reflect the one-half year period). The fees and expenses of any Underlying Funds are not included in each annualized expense ratio.
C 5% return per year before expenses
Distributions (Unaudited)
The fund designates 13% of the dividends distributed during the fiscal year as amounts which may be taken into account as a dividend for the purposes of the maximum rate under section 1(h)(11) of the Internal Revenue Code.
The amounts per share which represent income derived from sources within, and taxes paid to, foreign countries or possessions of the United States are $0.0408 and $0.0018 for the dividend paid December 16, 2019.
The fund will notify shareholders in January 2021 of amounts for use in preparing 2020 income tax returns.
Proxy Voting Results
A special meeting of shareholders was held on June 9, 2020. The results of votes taken among shareholders on the proposal before them are reported below. Each vote reported represents one dollar of net asset value held on the record date for the meeting.
PROPOSAL 1
To elect a Board of Trustees.
| | # of
Votes | % of
Votes |
| Dennis J. Dirks |
| Affirmative | 91,643,443,973.030 | 98.167 |
| Withheld | 1,711,119,384.419 | 1.833 |
| TOTAL | 93,354,563,357.449 | 100.000 |
| Donald F. Donahue |
| Affirmative | 91,659,003,496.045 | 98.184 |
| Withheld | 1,695,559,852.789 | 1.816 |
| TOTAL | 93,354,563,357.449 | 100.000 |
| Bettina Doulton |
| Affirmative | 91,774,146,516.145 | 98.307 |
| Withheld | 1,580,416,862.377 | 1.693 |
| TOTAL | 93,354,563,357.449 | 100.000 |
| Vicki L. Fuller |
| Affirmative | 91,845,419,368.993 | 98.383 |
| Withheld | 1,509,143,998.591 | 1.617 |
| TOTAL | 93,354,563,357.449 | 100.00 |
| Patricia L. Kampling |
| Affirmative | 91,723,732,274.457 | 98.253 |
| Withheld | 1,630,831,098.411 | 1.747 |
| TOTAL | 93,354,563,357.449 | 100.000 |
| Alan J. Lacy |
| Affirmative | 91,490,319,407.772 | 98.003 |
| Withheld | 1,864,243,948.299 | 1.997 |
| TOTAL | 93,354,563,357.449 | 100.000 |
| Ned C. Lautenbach |
| Affirmative | 91,285,367,239.075 | 97.784 |
| Withheld | 2,069,196,119.052 | 2.216 |
| TOTAL | 93,354,563,357.449 | 100.000 |
| Robert A. Lawrence |
| Affirmative | 91,556,271,429.466 | 98.074 |
| Withheld | 1,798,291,912.707 | 1.926 |
| TOTAL | 93,354,563,357.449 | 100.000 |
| Joseph Mauriello |
| Affirmative | 91,497,480,147.082 | 98.011 |
| Withheld | 1,857,083,211.045 | 1.989 |
| TOTAL | 93,354,563,357.449 | 100.000 |
| Cornelia M. Small |
| Affirmative | 91,606,808,161.438 | 98.128 |
| Withheld | 1,747,755,220.497 | 1.872 |
| TOTAL | 93,354,563,357.449 | 100.000 |
| Garnett A. Smith |
| Affirmative | 91,505,784,053.038 | 98.020 |
| Withheld | 1,848,779,305.090 | 1.980 |
| TOTAL | 93,354,563,357.449 | 100.000 |
| David M. Thomas |
| Affirmative | 91,536,969,704.881 | 98.053 |
| Withheld | 1,817,593,630.919 | 1.947 |
| TOTAL | 93,354,563,357.449 | 100.000 |
| Susan Tomasky |
| Affirmative | 91,697,125,678.165 | 98.225 |
| Withheld | 1,657,437,703.277 | 1.775 |
| TOTAL | 93,354,563,357.449 | 100.000 |
| Michael E. Wiley |
| Affirmative | 91,506,805,575.815 | 98.021 |
| Withheld | 1,847,757,759.985 | 1.979 |
| TOTAL | 93,354,563,357.449 | 100.000 |
|
| Proposal 1 reflects trust wide proposal and voting results. |
IGI-K6-ANN-1220
1.9893917.101
Fidelity® Series Overseas Fund
Annual Report
October 31, 2020
See the inside front cover for important information about access to your fund’s shareholder reports.
Beginning on January 1, 2021, as permitted by regulations adopted by the Securities and Exchange Commission, paper copies of a fund’s shareholder reports will no longer be sent by mail, unless you specifically request paper copies of the reports from the fund or from your financial intermediary, such as a financial advisor, broker-dealer or bank. Instead, the reports will be made available on a website, and you will be notified by mail each time a report is posted and provided with a website link to access the report.
If you already elected to receive shareholder reports electronically, you will not be affected by this change and you need not take any action. You may elect to receive shareholder reports and other communications from a fund electronically, by contacting your financial intermediary. For Fidelity customers, visit Fidelity's web site or call Fidelity using the contact information listed below.
You may elect to receive all future reports in paper free of charge. If you wish to continue receiving paper copies of your shareholder reports, you may contact your financial intermediary or, if you are a Fidelity customer, visit Fidelity’s website, or call Fidelity at the applicable toll-free number listed below. Your election to receive reports in paper will apply to all funds held with the fund complex/your financial intermediary.
| Account Type | Website | Phone Number |
| Brokerage, Mutual Fund, or Annuity Contracts: | fidelity.com/mailpreferences | 1-800-343-3548 |
| Employer Provided Retirement Accounts: | netbenefits.fidelity.com/preferences (choose 'no' under Required Disclosures to continue to print) | 1-800-343-0860 |
| Advisor Sold Accounts Serviced Through Your Financial Intermediary: | Contact Your Financial Intermediary | Your Financial Intermediary's phone number |
| Advisor Sold Accounts Serviced by Fidelity: | institutional.fidelity.com | 1-877-208-0098 |
Contents
To view a fund's proxy voting guidelines and proxy voting record for the 12-month period ended June 30, visit http://www.fidelity.com/proxyvotingresults or visit the Securities and Exchange Commission's (SEC) web site at http://www.sec.gov.
You may also call 1-800-544-8544 to request a free copy of the proxy voting guidelines.
Standard & Poor's, S&P and S&P 500 are registered service marks of The McGraw-Hill Companies, Inc. and have been licensed for use by Fidelity Distributors Corporation.
Other third-party marks appearing herein are the property of their respective owners.
All other marks appearing herein are registered or unregistered trademarks or service marks of FMR LLC or an affiliated company. © 2020 FMR LLC. All rights reserved.
This report and the financial statements contained herein are submitted for the general information of the shareholders of the Fund. This report is not authorized for distribution to prospective investors in the Fund unless preceded or accompanied by an effective prospectus.
A fund files its complete schedule of portfolio holdings with the SEC for the first and third quarters of each fiscal year on Form N-PORT. Forms N-PORT are available on the SEC’s web site at http://www.sec.gov. A fund's Forms N-PORT may be reviewed and copied at the SEC’s Public Reference Room in Washington, DC. Information regarding the operation of the SEC's Public Reference Room may be obtained by calling 1-800-SEC-0330.
For a complete list of a fund's portfolio holdings, view the most recent holdings listing, semiannual report, or annual report on Fidelity's web site at http://www.fidelity.com, http://www.institutional.fidelity.com, or http://www.401k.com, as applicable.
NOT FDIC INSURED •MAY LOSE VALUE •NO BANK GUARANTEE
Neither the Fund nor Fidelity Distributors Corporation is a bank.
Note to Shareholders:
Early in 2020, the outbreak and spread of a new coronavirus emerged as a public health emergency that had a major influence on financial markets, primarily based on its impact on the global economy and the outlook for corporate earnings. The virus causes a respiratory disease known as COVID-19. On March 11, the World Health Organization declared the COVID-19 outbreak a pandemic, citing sustained risk of further global spread.
In the weeks following, as the crisis worsened, we witnessed an escalating human tragedy with wide-scale social and economic consequences from coronavirus-containment measures. The outbreak of COVID-19 prompted a number of measures to limit the spread, including travel and border restrictions, quarantines, and restrictions on large gatherings. In turn, these resulted in lower consumer activity, diminished demand for a wide range of products and services, disruption in manufacturing and supply chains, and – given the wide variability in outcomes regarding the outbreak – significant market uncertainty and volatility. Amid the turmoil, global governments and central banks took unprecedented action – to help support consumers, businesses, and the broader economies, and to limit disruption to financial systems.
The situation continues to unfold, and the extent and duration of its impact on financial markets and the economy remain highly uncertain. Extreme events such as the coronavirus crisis are “exogenous shocks” that can have significant adverse effects on mutual funds and their investments. Although multiple asset classes may be affected by market disruption, the duration and impact may not be the same for all types of assets.
Fidelity is committed to helping you stay informed amid news about COVID-19 and during increased market volatility, and we’re taking extra steps to be responsive to customer needs. We encourage you to visit our websites, where we offer ongoing updates, commentary, and analysis on the markets and our funds.
Performance: The Bottom Line
Average annual total return reflects the change in the value of an investment, assuming reinvestment of distributions from dividend income and capital gains (the profits earned upon the sale of securities that have grown in value, if any) and assuming a constant rate of performance each year. The hypothetical investment and the average annual total returns do not reflect the deduction of taxes that a shareholder would pay on fund distributions or the redemption of fund shares. During periods of reimbursement by Fidelity, a fund’s total return will be greater than it would be had the reimbursement not occurred. How a fund did yesterday is no guarantee of how it will do tomorrow.
Average Annual Total Returns
| For the periods ended October 31, 2020 | Past 1 year | Life of fundA |
| Fidelity® Series Overseas Fund | 4.51% | 4.80% |
A From June 21, 2019
$10,000 Over Life of Fund
Let's say hypothetically that $10,000 was invested in Fidelity® Series Overseas Fund on June 21, 2019, when the fund started.
The chart shows how the value of your investment would have changed, and also shows how the MSCI EAFE Index performed over the same period.

| Period Ending Values |
| $10,660 | Fidelity® Series Overseas Fund |
| $9,630 | MSCI EAFE Index |
Management's Discussion of Fund Performance
Market Recap: The MSCI ACWI (All Country World Index) ex USA Index returned -2.46% for the 12 months ending October 31, 2020, in what was a bumpy ride for non-U.S. equities, marked by a steep but brief decline due to the early-2020 outbreak and spread of the coronavirus, followed by a sharp upturn. Declared a pandemic on March 11, the crisis and containment efforts caused broad contraction in economic activity, elevated volatility and dislocation in financial markets. A historically rapid and expansive monetary- and fiscal-policy response around the world provided a partial offset to the economic disruption.Other supporting factors included resilient corporate earnings and near-term potential for a COVID-19 vaccine breakthrough. This was evident in the index’s 12.28% gain in the final six months of the year. Currency fluctuation generally boosted foreign developed-markets equities for the year, while the reverse was true for emerging-markets stocks. Late in the period, the index was pressured by a second wave of COVID-19 cases in some regions, and stretched valuations and crowded positioning in big tech. For the full year, the U.K. (-22%), Asia Pacific ex Japan (-8%), Canada (-5%) and Europe ex U.K. (-4%) notably lagged. Emerging markets (+9%) and Japan (+1%) outperformed. By sector, energy (-38%), financials and real estate (-20% each) lagged, whereas information technology (+ 25%) and communication services (+15%) topped the index.
Comments from Portfolio Manager Vincent Montemaggiore: For the fiscal year ending October 31, 2020, the fund gained 4.51%, outperforming the -6.69% result of the benchmark MSCI EAFE Index (Net MA). From a regional standpoint, an overweighting and stock picks in Europe and security selection in Japan contributed most to the fund's relative result. By sector, the primary contributor to performance versus the benchmark was our stock picks in industrials. Strong picks in the financials sector, especially within the banks industry, also lifted the fund's relative result. Also bolstering the fund's relative result was an overweighting in information technology. Not owning Royal Dutch Shell, a benchmark component that returned -55%, was the largest individual relative contributor versus the benchmark. Also helping performance was our overweighting in DSV Panalpina, which gained 67%. DSV Panalpina was among the largest holdings as of October 31. The fund's non-benchmark stake in Indutrade gained 65%. Conversely, an underweighting in Japan and Asia Pacific ex Japan, specifically New Zealand, hindered the fund's relative result. By sector, the primary detractors from performance versus the benchmark were underweightings in materials and utilities. Stock selection in information technology also hindered relative performance. The biggest individual relative detractor was an overweight position in Compass Group (-49%), and we increased our position in this company. Our second-largest relative detractor this period was avoiding SoftBank Group, a benchmark component that gained 69%. Another notable relative detractor was an out-of-benchmark stake in IRB Brasil Resseguros (-53%). This was a position that was not held at the end of the period. Notable changes in positioning include increased exposure to Switzerland and Sweden. By sector, meaningful changes in positioning include increased exposure to information technology and a lower allocation to consumer staples.
The views expressed above reflect those of the portfolio manager(s) only through the end of the period as stated on the cover of this report and do not necessarily represent the views of Fidelity or any other person in the Fidelity organization. Any such views are subject to change at any time based upon market or other conditions and Fidelity disclaims any responsibility to update such views. These views may not be relied on as investment advice and, because investment decisions for a Fidelity fund are based on numerous factors, may not be relied on as an indication of trading intent on behalf of any Fidelity fund.
Investment Summary (Unaudited)
Geographic Diversification (% of fund's net assets)
| As of October 31, 2020 |
| | Japan | 15.8% |
| | Switzerland | 12.4% |
| | France | 11.6% |
| | United Kingdom | 9.0% |
| | Netherlands | 8.1% |
| | United States of America* | 8.1% |
| | Germany | 5.8% |
| | Sweden | 5.5% |
| | Spain | 2.5% |
| | Other | 21.2% |

* Includes Short-Term investments and Net Other Assets (Liabilities).
Percentages are based on country or territory of incorporation and are adjusted for the effect of futures contracts, if applicable.
Asset Allocation as of October 31, 2020
| | % of fund's net assets |
| Stocks | 98.7 |
| Short-Term Investments and Net Other Assets (Liabilities) | 1.3 |
Top Ten Stocks as of October 31, 2020
| | % of fund's net assets |
| Nestle SA (Reg. S) (Switzerland, Food Products) | 3.3 |
| Roche Holding AG (participation certificate) (Switzerland, Pharmaceuticals) | 2.6 |
| LVMH Moet Hennessy Louis Vuitton SE (France, Textiles, Apparel & Luxury Goods) | 2.0 |
| ASML Holding NV (Netherlands) (Netherlands, Semiconductors & Semiconductor Equipment) | 2.0 |
| AIA Group Ltd. (Hong Kong, Insurance) | 1.8 |
| Iberdrola SA (Spain, Electric Utilities) | 1.6 |
| Hoya Corp. (Japan, Health Care Equipment & Supplies) | 1.6 |
| Lonza Group AG (Switzerland, Life Sciences Tools & Services) | 1.5 |
| DSV Panalpina A/S (Denmark, Air Freight & Logistics) | 1.5 |
| Sika AG (Switzerland, Chemicals) | 1.5 |
| | 19.4 |
Top Market Sectors as of October 31, 2020
| | % of fund's net assets |
| Industrials | 18.5 |
| Information Technology | 18.5 |
| Financials | 16.9 |
| Health Care | 14.6 |
| Consumer Staples | 10.3 |
| Consumer Discretionary | 10.2 |
| Materials | 3.5 |
| Communication Services | 2.0 |
| Utilities | 1.6 |
| Real Estate | 1.6 |
Schedule of Investments October 31, 2020
Showing Percentage of Net Assets
| Common Stocks - 98.7% | | | |
| | | Shares | Value |
| Austria - 0.3% | | | |
| Erste Group Bank AG | | 1,747,607 | $35,781,461 |
| Bailiwick of Jersey - 1.1% | | | |
| Experian PLC | | 2,827,511 | 103,582,751 |
| Sanne Group PLC | | 2,423,071 | 19,022,876 |
|
| TOTAL BAILIWICK OF JERSEY | | | 122,605,627 |
|
| Belgium - 0.7% | | | |
| KBC Groep NV | | 1,673,265 | 82,491,352 |
| Bermuda - 2.3% | | | |
| Credicorp Ltd. (United States) | | 381,575 | 43,759,021 |
| Genpact Ltd. | | 1,733,200 | 59,570,084 |
| Hiscox Ltd. (a) | | 4,720,472 | 50,415,122 |
| IHS Markit Ltd. | | 1,397,300 | 112,999,651 |
|
| TOTAL BERMUDA | | | 266,743,878 |
|
| Canada - 1.0% | | | |
| Constellation Software, Inc. | | 114,970 | 120,690,454 |
| Cayman Islands - 0.9% | | | |
| Alibaba Group Holding Ltd. sponsored ADR (a) | | 344,300 | 104,904,767 |
| China - 0.5% | | | |
| Gree Electric Appliances, Inc. of Zhuhai (A Shares) | | 5,885,000 | 51,651,726 |
| Denmark - 1.5% | | | |
| DSV Panalpina A/S | | 1,075,231 | 174,102,642 |
| Finland - 0.7% | | | |
| Nordea Bank ABP (Stockholm Stock Exchange) | | 10,438,900 | 78,346,747 |
| France - 11.6% | | | |
| ALTEN (a) | | 810,000 | 64,762,110 |
| Amundi SA (b) | | 452,691 | 29,682,856 |
| BNP Paribas SA (a) | | 1,827,300 | 63,726,687 |
| Capgemini SA | | 1,040,562 | 120,146,827 |
| Dassault Systemes SA | | 511,200 | 87,251,338 |
| Edenred SA | | 2,178,227 | 101,576,357 |
| Kering SA | | 184,959 | 111,691,380 |
| Legrand SA | | 1,392,200 | 102,928,105 |
| LVMH Moet Hennessy Louis Vuitton SE | | 500,639 | 234,673,360 |
| Pernod Ricard SA | | 709,800 | 114,410,929 |
| Sanofi SA | | 1,700,100 | 153,507,803 |
| SR Teleperformance SA | | 517,828 | 155,415,875 |
|
| TOTAL FRANCE | | | 1,339,773,627 |
|
| Germany - 5.8% | | | |
| adidas AG | | 456,932 | 135,702,292 |
| Allianz SE | | 674,800 | 118,718,933 |
| Deutsche Borse AG | | 706,102 | 103,905,400 |
| Hannover Reuck SE | | 663,616 | 96,378,182 |
| SAP SE | | 782,376 | 83,467,505 |
| Vonovia SE | | 1,972,335 | 125,925,923 |
|
| TOTAL GERMANY | | | 664,098,235 |
|
| Hong Kong - 1.8% | | | |
| AIA Group Ltd. | | 21,182,188 | 201,594,619 |
| India - 1.6% | | | |
| HDFC Bank Ltd. | | 4,515,300 | 71,681,053 |
| Reliance Industries Ltd. | | 278,686 | 4,414,973 |
| Reliance Industries Ltd. | | 4,102,400 | 113,063,048 |
|
| TOTAL INDIA | | | 189,159,074 |
|
| Indonesia - 0.3% | | | |
| PT Bank Rakyat Indonesia Tbk | | 164,453,151 | 37,227,587 |
| Ireland - 1.7% | | | |
| DCC PLC (United Kingdom) | | 472,230 | 30,735,524 |
| Kerry Group PLC Class A | | 791,897 | 94,718,447 |
| Linde PLC | | 334,200 | 73,637,628 |
|
| TOTAL IRELAND | | | 199,091,599 |
|
| Italy - 2.0% | | | |
| FinecoBank SpA | | 6,449,585 | 88,260,232 |
| GVS SpA (b) | | 926,300 | 13,053,665 |
| Recordati SpA | | 2,443,939 | 126,633,379 |
|
| TOTAL ITALY | | | 227,947,276 |
|
| Japan - 15.8% | | | |
| A/S One Corp. | | 118,000 | 17,053,277 |
| Astellas Pharma, Inc. | | 4,987,800 | 68,397,405 |
| Curves Holdings Co. Ltd. | | 786,300 | 4,831,022 |
| Daikin Industries Ltd. | | 603,000 | 112,841,355 |
| Hoya Corp. | | 1,625,107 | 183,404,600 |
| IT Holdings Corp. | | 2,100,900 | 40,180,013 |
| Kao Corp. | | 1,411,568 | 100,501,822 |
| Keyence Corp. | | 321,994 | 146,128,121 |
| Nexon Co. Ltd. | | 3,165,300 | 88,219,796 |
| Nitori Holdings Co. Ltd. | | 459,134 | 94,378,061 |
| Olympus Corp. | | 3,719,192 | 71,200,516 |
| Oracle Corp. Japan | | 315,207 | 31,501,817 |
| Otsuka Corp. | | 671,906 | 30,875,202 |
| Persol Holdings Co., Ltd. | | 4,005,453 | 60,667,399 |
| Recruit Holdings Co. Ltd. | | 3,027,646 | 115,203,978 |
| Relo Group, Inc. | | 2,403,628 | 57,684,130 |
| SMC Corp. | | 228,321 | 121,445,232 |
| Sony Corp. | | 1,986,500 | 165,607,515 |
| Suzuki Motor Corp. | | 1,675,145 | 71,943,629 |
| Tokyo Electron Ltd. | | 506,700 | 136,003,789 |
| Tsuruha Holdings, Inc. | | 754,032 | 105,583,360 |
|
| TOTAL JAPAN | | | 1,823,652,039 |
|
| Korea (South) - 1.3% | | | |
| LG Chemical Ltd. | | 133,096 | 72,415,530 |
| Samsung Electronics Co. Ltd. | | 1,466,800 | 73,567,861 |
|
| TOTAL KOREA (SOUTH) | | | 145,983,391 |
|
| Mexico - 0.2% | | | |
| Grupo Financiero Banorte S.A.B. de CV Series O (a) | | 6,394,572 | 28,488,653 |
| Netherlands - 8.1% | | | |
| ASM International NV (Netherlands) | | 358,000 | 51,200,809 |
| ASML Holding NV (Netherlands) | | 638,328 | 230,949,054 |
| BE Semiconductor Industries NV | | 1,068,300 | 43,161,145 |
| Euronext NV (b) | | 629,000 | 65,601,182 |
| IMCD NV | | 1,246,751 | 144,418,759 |
| JDE Peet's BV | | 2,994,900 | 106,733,114 |
| Koninklijke Philips Electronics NV | | 3,352,723 | 155,287,319 |
| Wolters Kluwer NV | | 1,679,551 | 136,104,677 |
|
| TOTAL NETHERLANDS | | | 933,456,059 |
|
| Norway - 1.2% | | | |
| Adevinta ASA Class B (a) | | 2,619,798 | 40,477,047 |
| Equinor ASA | | 400 | 5,080 |
| Schibsted ASA (A Shares) | | 2,268,489 | 92,482,276 |
|
| TOTAL NORWAY | | | 132,964,403 |
|
| South Africa - 1.0% | | | |
| Naspers Ltd. Class N | | 584,205 | 114,052,918 |
| Spain - 2.5% | | | |
| Amadeus IT Holding SA Class A | | 2,080,770 | 99,333,886 |
| Iberdrola SA | | 15,829,125 | 186,658,327 |
|
| TOTAL SPAIN | | | 285,992,213 |
|
| Sweden - 5.5% | | | |
| AddTech AB (B Shares) | | 5,473,164 | 60,584,673 |
| ASSA ABLOY AB (B Shares) | | 4,365,748 | 93,568,760 |
| Atlas Copco AB (A Shares) | | 2,403,900 | 106,141,813 |
| Hexagon AB (B Shares) | | 1,823,988 | 133,318,551 |
| Indutrade AB (a) | | 2,637,425 | 133,791,878 |
| Swedish Match Co. AB | | 1,403,300 | 105,755,302 |
|
| TOTAL SWEDEN | | | 633,160,977 |
|
| Switzerland - 12.4% | | | |
| Alcon, Inc. (a) | | 1,266,176 | 71,969,444 |
| Julius Baer Group Ltd. | | 2,335,952 | 104,295,627 |
| Lonza Group AG | | 290,205 | 175,838,171 |
| Nestle SA (Reg. S) | | 3,362,951 | 378,257,782 |
| Roche Holding AG (participation certificate) | | 921,192 | 296,008,039 |
| Sika AG | | 682,071 | 167,886,389 |
| Sonova Holding AG Class B | | 441,503 | 104,724,252 |
| Zurich Insurance Group Ltd. | | 374,080 | 124,249,052 |
|
| TOTAL SWITZERLAND | | | 1,423,228,756 |
|
| Taiwan - 1.1% | | | |
| Taiwan Semiconductor Manufacturing Co. Ltd. | | 8,038,684 | 121,599,295 |
| United Kingdom - 9.0% | | | |
| Beazley PLC | | 11,397,956 | 43,412,193 |
| Compass Group PLC | | 7,067,687 | 96,740,715 |
| Cranswick PLC | | 596,884 | 24,883,610 |
| Dechra Pharmaceuticals PLC | | 1,518,563 | 68,698,059 |
| Diageo PLC | | 4,963,647 | 160,414,547 |
| Diploma PLC | | 1,561,431 | 45,028,282 |
| London Stock Exchange Group PLC | | 1,534,154 | 165,378,615 |
| Mondi PLC | | 4,042,260 | 76,613,621 |
| Prudential PLC | | 4,076,870 | 49,862,171 |
| RELX PLC (London Stock Exchange) | | 5,784,555 | 114,469,185 |
| Rentokil Initial PLC (a) | | 17,194,222 | 117,167,103 |
| Smith & Nephew PLC | | 4,098,700 | 71,170,400 |
| Ultra Electronics Holdings PLC | | 38,745 | 943,650 |
| Victrex PLC | | 229,246 | 5,479,432 |
|
| TOTAL UNITED KINGDOM | | | 1,040,261,583 |
|
| United States of America - 6.8% | | | |
| Ares Management Corp. | | 1,542,000 | 65,226,600 |
| Aspen Technology, Inc. (a) | | 77,801 | 8,543,328 |
| Becton, Dickinson & Co. | | 306,421 | 70,823,086 |
| Black Knight, Inc. (a) | | 799,500 | 70,316,025 |
| Boston Scientific Corp. (a) | | 1,758,646 | 60,268,798 |
| Fidelity National Information Services, Inc. | | 455,100 | 56,700,909 |
| Global Payments, Inc. | | 537,527 | 84,789,509 |
| Intercontinental Exchange, Inc. | | 763,300 | 72,055,520 |
| Marsh & McLennan Companies, Inc. | | 999,728 | 103,431,859 |
| NICE Systems Ltd. sponsored ADR (a) | | 440,708 | 100,596,008 |
| Roper Technologies, Inc. | | 226,236 | 84,010,476 |
|
| TOTAL UNITED STATES OF AMERICA | | | 776,762,118 |
|
| TOTAL COMMON STOCKS | | | |
| (Cost $10,394,572,236) | | | 11,355,813,076 |
|
| Money Market Funds - 0.5% | | | |
| Fidelity Cash Central Fund 0.10% (c) | | | |
| (Cost $60,601,341) | | 60,589,223 | 60,601,341 |
| TOTAL INVESTMENT IN SECURITIES - 99.2% | | | |
| (Cost $10,455,173,577) | | | 11,416,414,417 |
| NET OTHER ASSETS (LIABILITIES) - 0.8% | | | 91,961,816 |
| NET ASSETS - 100% | | | $11,508,376,233 |
Categorizations in the Schedule of Investments are based on country or territory of incorporation.
Legend
(a) Non-income producing
(b) Security exempt from registration under Rule 144A of the Securities Act of 1933. These securities may be resold in transactions exempt from registration, normally to qualified institutional buyers. At the end of the period, the value of these securities amounted to $108,337,703 or 0.9% of net assets.
(c) Affiliated fund that is generally available only to investment companies and other accounts managed by Fidelity Investments. The rate quoted is the annualized seven-day yield of the fund at period end. A complete unaudited listing of the fund's holdings as of its most recent quarter end is available upon request. In addition, each Fidelity Central Fund's financial statements, which are not covered by the Fund's Report of Independent Registered Public Accounting Firm, are available on the SEC's website or upon request.
Affiliated Central Funds
Information regarding fiscal year to date income earned by the Fund from investments in Fidelity Central Funds is as follows:
| Fund | Income earned |
| Fidelity Cash Central Fund | $1,605,333 |
| Fidelity Securities Lending Cash Central Fund | 907,844 |
| Total | $2,513,177 |
Amounts in the income column in the above table include any capital gain distributions from underlying funds, which are presented in the corresponding line-item in the Statement of Operations, if applicable. Amount for Fidelity Securities Lending Cash Central Fund represents the income earned on investing cash collateral, less rebates paid to borrowers and any lending agent fees associated with the loan, plus any premium payments received for lending certain types of securities.
Investment Valuation
The following is a summary of the inputs used, as of October 31, 2020, involving the Fund's assets and liabilities carried at fair value. The inputs or methodology used for valuing securities may not be an indication of the risk associated with investing in those securities. For more information on valuation inputs, and their aggregation into the levels used below, please refer to the Investment Valuation section in the accompanying Notes to Financial Statements.
| | Valuation Inputs at Reporting Date: |
| Description | Total | Level 1 | Level 2 | Level 3 |
| Investments in Securities: | | | | |
| Equities: | | | | |
| Communication Services | $221,179,119 | $132,959,323 | $88,219,796 | $-- |
| Consumer Discretionary | 1,186,177,385 | 352,298,439 | 833,878,946 | -- |
| Consumer Staples | 1,191,258,913 | 446,501,402 | 744,757,511 | -- |
| Energy | 117,483,101 | 5,080 | 117,478,021 | -- |
| Financials | 1,942,993,600 | 1,150,927,069 | 792,066,531 | -- |
| Health Care | 1,708,038,213 | 516,170,683 | 1,191,867,530 | -- |
| Industrials | 2,126,151,768 | 1,518,842,293 | 607,309,475 | -- |
| Information Technology | 2,096,229,997 | 1,201,957,340 | 894,272,657 | -- |
| Materials | 396,032,600 | 323,617,070 | 72,415,530 | -- |
| Real Estate | 183,610,053 | 125,925,923 | 57,684,130 | -- |
| Utilities | 186,658,327 | 186,658,327 | -- | -- |
| Money Market Funds | 60,601,341 | 60,601,341 | -- | -- |
| Total Investments in Securities: | $11,416,414,417 | $6,016,464,290 | $5,399,950,127 | $-- |
See accompanying notes which are an integral part of the financial statements.
Financial Statements
Statement of Assets and Liabilities
| | | October 31, 2020 |
| Assets | | |
Investment in securities, at value — See accompanying schedule:
Unaffiliated issuers (cost $10,394,572,236) | $11,355,813,076 | |
| Fidelity Central Funds (cost $60,601,341) | 60,601,341 | |
| Total Investment in Securities (cost $10,455,173,577) | | $11,416,414,417 |
| Foreign currency held at value (cost $3,560,033) | | 3,560,044 |
| Receivable for investments sold | | 59,119,200 |
| Receivable for fund shares sold | | 94,887,770 |
| Dividends receivable | | 15,960,389 |
| Distributions receivable from Fidelity Central Funds | | 1,881 |
| Total assets | | 11,589,943,701 |
| Liabilities | | |
| Payable for investments purchased | $64,772,967 | |
| Payable for fund shares redeemed | 6,071,614 | |
| Other payables and accrued expenses | 10,722,887 | |
| Total liabilities | | 81,567,468 |
| Net Assets | | $11,508,376,233 |
| Net Assets consist of: | | |
| Paid in capital | | $10,796,565,189 |
| Total accumulated earnings (loss) | | 711,811,044 |
| Net Assets | | $11,508,376,233 |
| Net Asset Value, offering price and redemption price per share ($11,508,376,233 ÷ 1,084,150,314 shares) | | $10.62 |
See accompanying notes which are an integral part of the financial statements.
Statement of Operations
| | | Year ended October 31, 2020 |
| Investment Income | | |
| Dividends | | $160,396,639 |
| Income from Fidelity Central Funds (including $907,844 from security lending) | | 2,513,177 |
| Income before foreign taxes withheld | | 162,909,816 |
| Less foreign taxes withheld | | (19,091,555) |
| Total income | | 143,818,261 |
| Expenses | | |
| Custodian fees and expenses | $753,519 | |
| Independent trustees' fees and expenses | 54,907 | |
| Interest | 8,968 | |
| Miscellaneous | 14,073 | |
| Total expenses | | 831,467 |
| Net investment income (loss) | | 142,986,794 |
| Realized and Unrealized Gain (Loss) | | |
| Net realized gain (loss) on: | | |
| Investment securities: | | |
| Unaffiliated issuers (net of foreign taxes of $32,056) | (346,982,974) | |
| Fidelity Central Funds | 36,934 | |
| Foreign currency transactions | 2,442,989 | |
| Futures contracts | (12,360,920) | |
| Total net realized gain (loss) | | (356,863,971) |
| Change in net unrealized appreciation (depreciation) on: | | |
| Investment securities: | | |
| Unaffiliated issuers (net of increase in deferred foreign taxes of $10,361,072) | 771,945,076 | |
| Fidelity Central Funds | 547 | |
| Assets and liabilities in foreign currencies | 192,578 | |
| Total change in net unrealized appreciation (depreciation) | | 772,138,201 |
| Net gain (loss) | | 415,274,230 |
| Net increase (decrease) in net assets resulting from operations | | $558,261,024 |
See accompanying notes which are an integral part of the financial statements.
Statement of Changes in Net Assets
| | Year ended October 31, 2020 | For the period
June 21, 2019 (commencement of operations) to October 31, 2019 |
| Increase (Decrease) in Net Assets | | |
| Operations | | |
| Net investment income (loss) | $142,986,794 | $19,029,120 |
| Net realized gain (loss) | (356,863,971) | (14,667,411) |
| Change in net unrealized appreciation (depreciation) | 772,138,201 | 179,214,461 |
| Net increase (decrease) in net assets resulting from operations | 558,261,024 | 183,576,170 |
| Distributions to shareholders | (30,070,456) | – |
| Share transactions | | |
| Proceeds from sales of shares | 7,066,900,589 | 6,044,906,528 |
| Reinvestment of distributions | 30,070,456 | – |
| Cost of shares redeemed | (2,343,591,546) | (1,676,532) |
| Net increase (decrease) in net assets resulting from share transactions | 4,753,379,499 | 6,043,229,996 |
| Total increase (decrease) in net assets | 5,281,570,067 | 6,226,806,166 |
| Net Assets | | |
| Beginning of period | 6,226,806,166 | – |
| End of period | $11,508,376,233 | $6,226,806,166 |
| Other Information | | |
| Shares | | |
| Sold | 695,966,665 | 610,767,928 |
| Issued in reinvestment of distributions | 2,847,581 | – |
| Redeemed | (225,265,842) | (166,018) |
| Net increase (decrease) | 473,548,404 | 610,601,910 |
See accompanying notes which are an integral part of the financial statements.
Financial Highlights
Fidelity Series Overseas Fund
| | | |
| Years ended October 31, | 2020 | 2019 A |
| Selected Per–Share Data | | |
| Net asset value, beginning of period | $10.20 | $10.00 |
| Income from Investment Operations | | |
| Net investment income (loss)B | .14 | .06C |
| Net realized and unrealized gain (loss) | .32 | .14 |
| Total from investment operations | .46 | .20 |
| Distributions from net investment income | (.04) | – |
| Total distributions | (.04) | – |
| Net asset value, end of period | $10.62 | $10.20 |
| Total ReturnD | 4.51% | 2.00% |
| Ratios to Average Net AssetsE,F | | |
| Expenses before reductions | .01% | .01%G |
| Expenses net of fee waivers, if any | .01% | .01%G |
| Expenses net of all reductions | .01% | .01%G |
| Net investment income (loss) | 1.35% | 1.69%C,G |
| Supplemental Data | | |
| Net assets, end of period (000 omitted) | $11,508,376 | $6,226,806 |
| Portfolio turnover rateH | 50% | 12%I,J |
A For the period June 21, 2019 (commencement of operations) to October 31, 2019.
B Calculated based on average shares outstanding during the period.
C Net investment income per share reflects one or more large, non-recurring dividend which amounted to $.03 per share. Excluding such non-recurring dividend, the ratio of net investment income (loss) to average net assets would have been .98%.
D Total returns for periods of less than one year are not annualized.
E Fees and expenses of any underlying mutual funds or exchange-traded funds (ETFs) are not included in the Fund's expense ratio. The Fund indirectly bears its proportionate share of these expenses. For additional expense information related to investments in Fidelity Central Funds, please refer to the "Investments in Fidelity Central Funds" note found in the Notes to Financial Statements section of the most recent Annual or Semi-Annual report.
F Expense ratios reflect operating expenses of the class. Expenses before reductions do not reflect amounts reimbursed, waived, or reduced through arrangements with the investment advisor, brokerage services, or other offset arrangements, if applicable, and do not represent the amount paid by the class during periods when reimbursements, waivers or reductions occur.
G Annualized
H Amount does not include the portfolio activity of any underlying mutual funds or exchange-traded funds (ETFs).
I Portfolio turnover rate excludes securities received or delivered in-kind.
J Amount not annualized.
See accompanying notes which are an integral part of the financial statements.
Notes to Financial Statements
For the period ended October 31, 2020
1. Organization.
Fidelity Series Overseas Fund (the Fund) is a fund of Fidelity Investment Trust (the Trust) and is authorized to issue an unlimited number of shares. Shares are offered only to certain other Fidelity funds and Fidelity managed 529 plans. The Trust is registered under the Investment Company Act of 1940, as amended (the 1940 Act), as an open-end management investment company organized as a Massachusetts business trust.
Effective January 1, 2020:
Investment advisers Fidelity Investments Money Management, Inc., FMR Co., Inc., and Fidelity SelectCo, LLC, merged with and into Fidelity Management & Research Company. In connection with the merger transactions, the resulting, merged investment adviser was then redomiciled from Massachusetts to Delaware, changed its corporate structure from a corporation to a limited liability company, and changed its name to "Fidelity Management & Research Company LLC".
2. Investments in Fidelity Central Funds.
The Fund invests in Fidelity Central Funds, which are open-end investment companies generally available only to other investment companies and accounts managed by the investment adviser and its affiliates. The Fund's Schedule of Investments lists each of the Fidelity Central Funds held as of period end, if any, as an investment of the Fund, but does not include the underlying holdings of each Fidelity Central Fund. As an Investing Fund, the Fund indirectly bears its proportionate share of the expenses of the underlying Fidelity Central Funds.
The Money Market Central Funds seek preservation of capital and current income and are managed by the investment adviser. Annualized expenses of the Money Market Central Funds as of their most recent shareholder report date ranged from less than .005% to .01%.
A complete unaudited list of holdings for each Fidelity Central Fund is available upon request or at the Securities and Exchange Commission (the SEC) website at www.sec.gov. In addition, the financial statements of the Fidelity Central Funds, which are not covered by the Fund's Report of Independent Registered Public Accounting Firm, are available on the SEC website or upon request.
3. Significant Accounting Policies.
The Fund is an investment company and applies the accounting and reporting guidance of the Financial Accounting Standards Board (FASB) Accounting Standards Codification Topic 946 Financial Services – Investment Companies. The financial statements have been prepared in conformity with accounting principles generally accepted in the United States of America (GAAP), which require management to make certain estimates and assumptions at the date of the financial statements. Actual results could differ from those estimates. Subsequent events, if any, through the date that the financial statements were issued have been evaluated in the preparation of the financial statements. The following summarizes the significant accounting policies of the Fund:
Investment Valuation. Investments are valued as of 4:00 p.m. Eastern time on the last calendar day of the period. The Board of Trustees (the Board) has delegated the day to day responsibility for the valuation of the Fund's investments to the Fair Value Committee (the Committee) established by the Fund's investment adviser. In accordance with valuation policies and procedures approved by the Board, the Fund attempts to obtain prices from one or more third party pricing vendors or brokers to value its investments. When current market prices, quotations or currency exchange rates are not readily available or reliable, investments will be fair valued in good faith by the Committee, in accordance with procedures adopted by the Board. Factors used in determining fair value vary by investment type and may include market or investment specific events. The frequency with which these procedures are used cannot be predicted and they may be utilized to a significant extent. The Committee oversees the Fund's valuation policies and procedures and reports to the Board on the Committee's activities and fair value determinations. The Board monitors the appropriateness of the procedures used in valuing the Fund's investments and ratifies the fair value determinations of the Committee.
The Fund categorizes the inputs to valuation techniques used to value its investments into a disclosure hierarchy consisting of three levels as shown below:
- Level 1 – quoted prices in active markets for identical investments
- Level 2 – other significant observable inputs (including quoted prices for similar investments, interest rates, prepayment speeds, etc.)
- Level 3 – unobservable inputs (including the Fund's own assumptions based on the best information available)
Valuation techniques used to value the Fund's investments by major category are as follows:
Equity securities, including restricted securities, for which market quotations are readily available, are valued at the last reported sale price or official closing price as reported by a third party pricing vendor on the primary market or exchange on which they are traded and are categorized as Level 1 in the hierarchy. In the event there were no sales during the day or closing prices are not available, securities are valued at the last quoted bid price or may be valued using the last available price and are generally categorized as Level 2 in the hierarchy. For foreign equity securities, when market or security specific events arise, comparisons to the valuation of American Depositary Receipts (ADRs), futures contracts, Exchange-Traded Funds (ETFs) and certain indexes as well as quoted prices for similar securities may be used and would be categorized as Level 2 in the hierarchy. For equity securities, including restricted securities, where observable inputs are limited, assumptions about market activity and risk are used and these securities may be categorized as Level 3 in the hierarchy.
Investments in open-end mutual funds, including the Fidelity Central Funds, are valued at their closing net asset value (NAV) each business day and are categorized as Level 1 in the hierarchy.
Changes in valuation techniques may result in transfers in or out of an assigned level within the disclosure hierarchy. The aggregate value of investments by input level as of October 31, 2020 is included at the end of the Fund's Schedule of Investments.
Foreign Currency. Certain Funds may use foreign currency contracts to facilitate transactions in foreign-denominated securities. Gains and losses from these transactions may arise from changes in the value of the foreign currency or if the counterparties do not perform under the contracts' terms.
Foreign-denominated assets, including investment securities, and liabilities are translated into U.S. dollars at the exchange rates at period end. Purchases and sales of investment securities, income and dividends received, and expenses denominated in foreign currencies are translated into U.S. dollars at the exchange rate in effect on the transaction date.
The effects of exchange rate fluctuations on investments are included with the net realized and unrealized gain (loss) on investment securities. Other foreign currency transactions resulting in realized and unrealized gain (loss) are disclosed separately.
Investment Transactions and Income. For financial reporting purposes, the Fund's investment holdings and NAV include trades executed through the end of the last business day of the period. The NAV per share for processing shareholder transactions is calculated as of the close of business of the New York Stock Exchange (NYSE), normally 4:00 p.m. Eastern time and includes trades executed through the end of the prior business day. Gains and losses on securities sold are determined on the basis of identified cost. Dividend income is recorded on the ex-dividend date, except for certain dividends from foreign securities where the ex-dividend date may have passed, which are recorded as soon as the Fund is informed of the ex-dividend date. Non-cash dividends included in dividend income, if any, are recorded at the fair market value of the securities received. Income and capital gain distributions from Fidelity Central Funds, if any, are recorded on the ex-dividend date. Investment income is recorded net of foreign taxes withheld where recovery of such taxes is uncertain.
Expenses. Expenses directly attributable to a fund are charged to that fund. Expenses attributable to more than one fund are allocated among the respective funds on the basis of relative net assets or other appropriate methods. Expense estimates are accrued in the period to which they relate and adjustments are made when actual amounts are known.
Income Tax Information and Distributions to Shareholders. Each year, the Fund intends to qualify as a regulated investment company under Subchapter M of the Internal Revenue Code, including distributing substantially all of its taxable income and realized gains. As a result, no provision for U.S. Federal income taxes is required. As of October 31, 2020, the Fund did not have any unrecognized tax benefits in the financial statements; nor is the Fund aware of any tax positions for which it is reasonably possible that the total amounts of unrecognized tax benefits will significantly change in the next twelve months. The Fund files a U.S. federal tax return, in addition to state and local tax returns as required. The Fund's federal income tax returns are subject to examination by the Internal Revenue Service (IRS) for a period of three fiscal years after they are filed. State and local tax returns may be subject to examination for an additional fiscal year depending on the jurisdiction. Foreign taxes are provided for based on the Fund's understanding of the tax rules and rates that exist in the foreign markets in which it invests. The Fund is subject to a tax imposed on capital gains by certain countries in which it invests. An estimated deferred tax liability for net unrealized appreciation on the applicable securities is included in Other payables and accrued expenses on the Statement of Assets & Liabilities.
Distributions are declared and recorded on the ex-dividend date. Income and capital gain distributions are determined in accordance with income tax regulations, which may differ from GAAP.
Capital accounts within the financial statements are adjusted for permanent book-tax differences. These adjustments have no impact on net assets or the results of operations. Capital accounts are not adjusted for temporary book-tax differences which will reverse in a subsequent period.
Book-tax differences are primarily due to foreign currency transactions, futures transactions, certain foreign taxes, passive foreign investment companies (PFIC), capital loss carryforwards and losses deferred due to wash sales.
As of period end, the cost and unrealized appreciation (depreciation) in securities, and derivatives if applicable, for federal income tax purposes were as follows:
| Gross unrealized appreciation | $1,514,211,205 |
| Gross unrealized depreciation | (588,976,352) |
| Net unrealized appreciation (depreciation) | $925,234,853 |
| Tax Cost | $10,491,179,564 |
The tax-based components of distributable earnings as of period end were as follows:
| Undistributed ordinary income | $131,623,880 |
| Capital loss carryforward | $(335,163,692) |
| Net unrealized appreciation (depreciation) on securities and other investments | $925,711,928 |
Capital loss carryforwards are only available to offset future capital gains of the Fund to the extent provided by regulations and may be limited. The capital loss carryforward information presented below, including any applicable limitation, is estimated as of fiscal period end and is subject to adjustment.
| No expiration | |
| Short-term | $(335,163,692) |
The tax character of distributions paid was as follows:
| | October 31, 2020 | October 31, 2019 |
| Ordinary Income | $30,070,456 | $ - |
Restricted Securities (including Private Placements). The Fund may invest in securities that are subject to legal or contractual restrictions on resale. These securities generally may be resold in transactions exempt from registration or to the public if the securities are registered. Disposal of these securities may involve time-consuming negotiations and expense, and prompt sale at an acceptable price may be difficult. Information regarding restricted securities is included at the end of the Fund's Schedule of Investments.
4. Derivative Instruments.
Risk Exposures and the Use of Derivative Instruments. The Fund's investment objective allows the Fund to enter into various types of derivative contracts, including futures contracts. Derivatives are investments whose value is primarily derived from underlying assets, indices or reference rates and may be transacted on an exchange or over-the-counter (OTC). Derivatives may involve a future commitment to buy or sell a specified asset based on specified terms, to exchange future cash flows at periodic intervals based on a notional principal amount, or for one party to make one or more payments upon the occurrence of specified events in exchange for periodic payments from the other party.
The Fund used derivatives to increase returns and to manage exposure to certain risks as defined below. The success of any strategy involving derivatives depends on analysis of numerous economic factors, and if the strategies for investment do not work as intended, the Fund may not achieve its objectives.
The Fund's use of derivatives increased or decreased its exposure to the following risk:
| Equity Risk | Equity risk relates to the fluctuations in the value of financial instruments as a result of changes in market prices (other than those arising from interest rate risk or foreign exchange risk), whether caused by factors specific to an individual investment, its issuer, or all factors affecting all instruments traded in a market or market segment.
|
The Fund is also exposed to additional risks from investing in derivatives, such as liquidity risk and counterparty credit risk. Liquidity risk is the risk that the Fund will be unable to close out the derivative in the open market in a timely manner. Counterparty credit risk is the risk that the counterparty will not be able to fulfill its obligation to the Fund. Counterparty credit risk related to exchange-traded futures contracts may be mitigated by the protection provided by the exchange on which they trade.
Investing in derivatives may involve greater risks than investing in the underlying assets directly and, to varying degrees, may involve risk of loss in excess of any initial investment and collateral received and amounts recognized in the Statement of Assets and Liabilities. In addition, there may be the risk that the change in value of the derivative contract does not correspond to the change in value of the underlying instrument.
Futures Contracts. A futures contract is an agreement between two parties to buy or sell a specified underlying instrument for a fixed price at a specified future date. The Fund used futures contracts to manage its exposure to the stock market.
Upon entering into a futures contract, a fund is required to deposit either cash or securities (initial margin) with a clearing broker in an amount equal to a certain percentage of the face value of the contract. Futures contracts are marked-to-market daily and subsequent daily payments (variation margin) are made or received by a fund depending on the daily fluctuations in the value of the futures contracts and are recorded as unrealized appreciation or (depreciation). This receivable and/or payable, if any, is included in daily variation margin on futures contracts in the Statement of Assets and Liabilities. Realized gain or (loss) is recorded upon the expiration or closing of a futures contract. The net realized gain (loss) and change in net unrealized appreciation (depreciation) on futures contracts during the period is presented in the Statement of Operations.
Any open futures contracts at period end are presented in the Schedule of Investments under the caption "Futures Contracts". The notional amount at value reflects each contract's exposure to the underlying instrument or index at period end.
5. Purchases and Sales of Investments.
Purchases and sales of securities, other than short-term securities, are noted in the table below.
| | Purchases ($) | Sales ($) |
| Fidelity Series Overseas Fund | 9,924,526,047 | 5,057,197,586 |
6. Fees and Other Transactions with Affiliates.
Management Fee. Fidelity Management & Research Company LLC (the investment adviser) and its affiliates provide the Fund with investment management related services for which the Fund does not pay a management fee. Under the management contract, the investment adviser or an affiliate pays all ordinary operating expenses of the Fund, except custody fees, fees and expenses of the independent Trustees, and certain miscellaneous expenses such as proxy and shareholder meeting expenses.
Brokerage Commissions. A portion of portfolio transactions were placed with brokerage firms which are affiliates of the investment adviser. Brokerage commissions are included in net realized gain (loss) and change in net unrealized appreciation (depreciation) in the Statement of Operations. The commissions paid to these affiliated firms were as follows:
| | Amount |
| Fidelity Series Overseas Fund | $17,663 |
Prior Fiscal Year Affiliated Exchanges In-Kind. During the prior period, the Fund received investments and cash valued at $731,768,541 in exchange for 73,470,737 shares of the Fund. The amount of in-kind exchanges is included in share transactions in the accompanying Statement of Changes in Net Assets.
Interfund Lending Program. Pursuant to an Exemptive Order issued by the SEC, the Fund, along with other registered investment companies having management contracts with Fidelity Management & Research Company LLC (FMR), or other affiliated entities of FMR, may participate in an interfund lending program. This program provides an alternative credit facility allowing the Fund to borrow from, or lend money to, other participating affiliated funds. At period end, there were no interfund loans outstanding. Activity in this program during the period for which loans were outstanding was as follows:
| | Borrower or Lender | Average Loan Balance | Weighted Average Interest Rate | Interest Expense |
| Fidelity Series Overseas Fund | Borrower | $21,278,804 | .33% | $8,968 |
Interfund Trades. Funds may purchase from or sell securities to other Fidelity Funds under procedures adopted by the Board. The procedures have been designed to ensure these interfund trades are executed in accordance with Rule 17a-7 of the 1940 Act. Interfund trades are included within the respective purchases and sales amounts shown in the Purchases and Sales of Investments note.
7. Committed Line of Credit.
Certain Funds participate with other funds managed by the investment adviser or an affiliate in a $4.25 billion credit facility (the "line of credit") to be utilized for temporary or emergency purposes to fund shareholder redemptions or for other short-term liquidity purposes. The participating funds have agreed to pay commitment fees on their pro-rata portion of the line of credit, which are reflected in Miscellaneous expenses on the Statement of Operations, and are as follows:
| | Amount |
| Fidelity Series Overseas Fund | $14,008 |
During the period, there were no borrowings on this line of credit.
8. Security Lending.
Funds lend portfolio securities from time to time in order to earn additional income. Lending agents are used, including National Financial Services (NFS), an affiliate of the investment adviser. Pursuant to a securities lending agreement, NFS will receive a fee, which is capped at 9.9% of a fund's daily lending revenue, for its services as lending agent. A fund may lend securities to certain qualified borrowers, including NFS. On the settlement date of the loan, a fund receives collateral (in the form of U.S. Treasury obligations, letters of credit and/or cash) against the loaned securities and maintains collateral in an amount not less than 100% of the market value of the loaned securities during the period of the loan. The market value of the loaned securities is determined at the close of business of a fund and any additional required collateral is delivered to a fund on the next business day. A fund or borrower may terminate the loan at any time, and if the borrower defaults on its obligation to return the securities loaned because of insolvency or other reasons, a fund may apply collateral received from the borrower against the obligation. A fund may experience delays and costs in recovering the securities loaned. Any cash collateral received is invested in the Fidelity Securities Lending Cash Central Fund. Any loaned securities are identified as such in the Schedule of Investments, and the value of loaned securities and cash collateral at period end, as applicable, are presented in the Statement of Assets and Liabilities. Security lending income represents the income earned on investing cash collateral, less rebates paid to borrowers and any lending agent fees associated with the loan, plus any premium payments received for lending certain types of securities. Security lending income is presented in the Statement of Operations as a component of income from Fidelity Central Funds. Affiliated security lending activity, if any, was as follows:
| | Total Security Lending Income Fees Paid to NFS | Security Lending Income From Securities Loaned to NFS | Value of Securities Loaned to NFS at Period End |
| Fidelity Series Overseas Fund | $3,062 | $– | $– |
9. Other.
The Fund's organizational documents provide former and current trustees and officers with a limited indemnification against liabilities arising in connection with the performance of their duties to the Fund. In the normal course of business, the Fund may also enter into contracts that provide general indemnifications. The Fund's maximum exposure under these arrangements is unknown as this would be dependent on future claims that may be made against the Fund. The risk of material loss from such claims is considered remote.
At the end of the period, mutual funds and accounts managed by the investment adviser or its affiliates were the owners of record of all of the outstanding shares of the Fund.
10. Coronavirus (COVID-19) Pandemic.
An outbreak of COVID-19 first detected in China during December 2019 has since spread globally and was declared a pandemic by the World Health Organization during March 2020. Developments that disrupt global economies and financial markets, such as the COVID-19 pandemic, may magnify factors that affect the Fund's performance.
Report of Independent Registered Public Accounting Firm
To the Board of Trustees of Fidelity Investment Trust and Shareholders of Fidelity Series Overseas Fund:
Opinion on the Financial Statements and Financial Highlights
We have audited the accompanying statement of assets and liabilities of Fidelity Series Overseas Fund (the "Fund"), a fund of Fidelity Investment Trust, including the schedule of investments, as of October 31, 2020, the related statement of operations for the year then ended, the statement of changes in net assets and the financial highlights for the year then ended and for the period from June 21, 2019 (commencement of operations) through October 31, 2019, and the related notes. In our opinion, the financial statements and financial highlights present fairly, in all material respects, the financial position of the Fund as of October 31, 2020, the results of its operations for the year then ended, and the changes in its net assets and the financial highlights for the year then ended and for the period from June 21, 2019 (commencement of operations) through October 31, 2019 in conformity with accounting principles generally accepted in the United States of America.
Basis for Opinion
These financial statements and financial highlights are the responsibility of the Fund's management. Our responsibility is to express an opinion on the Fund's financial statements and financial highlights based on our audits. We are a public accounting firm registered with the Public Company Accounting Oversight Board (United States) (PCAOB) and are required to be independent with respect to the Fund in accordance with the U.S. federal securities laws and the applicable rules and regulations of the Securities and Exchange Commission and the PCAOB.
We conducted our audits in accordance with the standards of the PCAOB. Those standards require that we plan and perform the audit to obtain reasonable assurance about whether the financial statements and financial highlights are free of material misstatement, whether due to error or fraud. The Fund is not required to have, nor were we engaged to perform, an audit of its internal control over financial reporting. As part of our audits we are required to obtain an understanding of internal control over financial reporting but not for the purpose of expressing an opinion on the effectiveness of the Fund’s internal control over financial reporting. Accordingly, we express no such opinion.
Our audits included performing procedures to assess the risks of material misstatement of the financial statements and financial highlights, whether due to error or fraud, and performing procedures that respond to those risks. Such procedures included examining, on a test basis, evidence regarding the amounts and disclosures in the financial statements and financial highlights. Our audits also included evaluating the accounting principles used and significant estimates made by management, as well as evaluating the overall presentation of the financial statements and financial highlights. Our procedures included confirmation of securities owned as of October 31, 2020, by correspondence with the custodian and brokers; when replies were not received from brokers, we performed other auditing procedures. We believe that our audits provide a reasonable basis for our opinion.
/s/ Deloitte & Touche LLP
Boston, Massachusetts
December 16, 2020
We have served as the auditor of one or more of the Fidelity investment companies since 1999.
Trustees and Officers
The Trustees, Members of the Advisory Board (if any), and officers of the trust and fund, as applicable, are listed below. The Board of Trustees governs the fund and is responsible for protecting the interests of shareholders. The Trustees are experienced executives who meet periodically throughout the year to oversee the fund's activities, review contractual arrangements with companies that provide services to the fund, oversee management of the risks associated with such activities and contractual arrangements, and review the fund's performance. Except for Jonathan Chiel, each of the trustees oversees 305 funds. Mr. Chiel oversees 176 funds.
The Trustees hold office without limit in time except that (a) any Trustee may resign; (b) any Trustee may be removed by written instrument, signed by at least two-thirds of the number of Trustees prior to such removal; (c) any Trustee who requests to be retired or who has become incapacitated by illness or injury may be retired by written instrument signed by a majority of the other Trustees; and (d) any Trustee may be removed at any special meeting of shareholders by a two-thirds vote of the outstanding voting securities of the trust. Each Trustee who is not an interested person (as defined in the 1940 Act) of the trust and the fund is referred to herein as an Independent Trustee. Each Independent Trustee shall retire not later than the last day of the calendar year in which his or her 75th birthday occurs. The Independent Trustees may waive this mandatory retirement age policy with respect to individual Trustees. Officers and Advisory Board Members hold office without limit in time, except that any officer or Advisory Board Member may resign or may be removed by a vote of a majority of the Trustees at any regular meeting or any special meeting of the Trustees. Except as indicated, each individual has held the office shown or other offices in the same company for the past five years.
The fund’s Statement of Additional Information (SAI) includes more information about the Trustees. To request a free copy, call Fidelity at 1-800-544-8544.
Experience, Skills, Attributes, and Qualifications of the Trustees. The Governance and Nominating Committee has adopted a statement of policy that describes the experience, qualifications, attributes, and skills that are necessary and desirable for potential Independent Trustee candidates (Statement of Policy). The Board believes that each Trustee satisfied at the time he or she was initially elected or appointed a Trustee, and continues to satisfy, the standards contemplated by the Statement of Policy. The Governance and Nominating Committee also engages professional search firms to help identify potential Independent Trustee candidates who have the experience, qualifications, attributes, and skills consistent with the Statement of Policy. From time to time, additional criteria based on the composition and skills of the current Independent Trustees, as well as experience or skills that may be appropriate in light of future changes to board composition, business conditions, and regulatory or other developments, have also been considered by the professional search firms and the Governance and Nominating Committee. In addition, the Board takes into account the Trustees' commitment and participation in Board and committee meetings, as well as their leadership of standing and ad hoc committees throughout their tenure.
In determining that a particular Trustee was and continues to be qualified to serve as a Trustee, the Board has considered a variety of criteria, none of which, in isolation, was controlling. The Board believes that, collectively, the Trustees have balanced and diverse experience, qualifications, attributes, and skills, which allow the Board to operate effectively in governing the fund and protecting the interests of shareholders. Information about the specific experience, skills, attributes, and qualifications of each Trustee, which in each case led to the Board's conclusion that the Trustee should serve (or continue to serve) as a trustee of the fund, is provided below.
Board Structure and Oversight Function. Robert A. Lawrence is an interested person and currently serves as Acting Chairman. The Trustees have determined that an interested Chairman is appropriate and benefits shareholders because an interested Chairman has a personal and professional stake in the quality and continuity of services provided to the fund. Independent Trustees exercise their informed business judgment to appoint an individual of their choosing to serve as Chairman, regardless of whether the Trustee happens to be independent or a member of management. The Independent Trustees have determined that they can act independently and effectively without having an Independent Trustee serve as Chairman and that a key structural component for assuring that they are in a position to do so is for the Independent Trustees to constitute a substantial majority for the Board. The Independent Trustees also regularly meet in executive session. Ned C. Lautenbach and David M. Thomas serve as Co-Lead Independent Trustees and as such each (i) acts as a liaison between the Independent Trustees and management with respect to matters important to the Independent Trustees and (ii) with management prepares agendas for Board meetings.
Fidelity® funds are overseen by different Boards of Trustees. The fund's Board oversees Fidelity's high income and certain equity funds, and other Boards oversee Fidelity's investment-grade bond, money market, asset allocation, and other equity funds. The asset allocation funds may invest in Fidelity® funds overseen by the fund's Board. The use of separate Boards, each with its own committee structure, allows the Trustees of each group of Fidelity® funds to focus on the unique issues of the funds they oversee, including common research, investment, and operational issues. On occasion, the separate Boards establish joint committees to address issues of overlapping consequences for the Fidelity® funds overseen by each Board.
The Trustees operate using a system of committees to facilitate the timely and efficient consideration of all matters of importance to the Trustees, the fund, and fund shareholders and to facilitate compliance with legal and regulatory requirements and oversight of the fund's activities and associated risks. The Board, acting through its committees, has charged FMR and its affiliates with (i) identifying events or circumstances the occurrence of which could have demonstrably adverse effects on the fund's business and/or reputation; (ii) implementing processes and controls to lessen the possibility that such events or circumstances occur or to mitigate the effects of such events or circumstances if they do occur; and (iii) creating and maintaining a system designed to evaluate continuously business and market conditions in order to facilitate the identification and implementation processes described in (i) and (ii) above. Because the day-to-day operations and activities of the fund are carried out by or through FMR, its affiliates, and other service providers, the fund's exposure to risks is mitigated but not eliminated by the processes overseen by the Trustees. While each of the Board's committees has responsibility for overseeing different aspects of the fund's activities, oversight is exercised primarily through the Operations, Audit, and Compliance Committees. Appropriate personnel, including but not limited to the fund's Chief Compliance Officer (CCO), FMR's internal auditor, the independent accountants, the fund's Treasurer and portfolio management personnel, make periodic reports to the Board's committees, as appropriate, including an annual review of Fidelity's risk management program for the Fidelity® funds. The responsibilities of each standing committee, including their oversight responsibilities, are described further under "Standing Committees of the Trustees."
Interested Trustees*:
Correspondence intended for a Trustee who is an interested person may be sent to Fidelity Investments, 245 Summer Street, Boston, Massachusetts 02210.
Name, Year of Birth; Principal Occupations and Other Relevant Experience+
Jonathan Chiel (1957)
Year of Election or Appointment: 2016
Trustee
Mr. Chiel also serves as Trustee of other Fidelity® funds. Mr. Chiel is Executive Vice President and General Counsel for FMR LLC (diversified financial services company, 2012-present). Previously, Mr. Chiel served as general counsel (2004-2012) and senior vice president and deputy general counsel (2000-2004) for John Hancock Financial Services; a partner with Choate, Hall & Stewart (1996-2000) (law firm); and an Assistant United States Attorney for the United States Attorney’s Office of the District of Massachusetts (1986-95), including Chief of the Criminal Division (1993-1995). Mr. Chiel is a director on the boards of the Boston Bar Foundation and the Maimonides School.
Robert A. Lawrence (1952)
Year of Election or Appointment: 2020
Trustee
Acting Chairman of the Board of Trustees
Mr. Lawrence also serves as Trustee of other funds. Previously, Mr. Lawrence served as a Member of the Advisory Board of certain funds. Prior to his retirement in 2008, Mr. Lawrence served as Vice President of certain Fidelity® funds (2006-2008), Senior Vice President, Head of High Income Division of Fidelity Management & Research Company (investment adviser firm, 2006-2008), and President of Fidelity Strategic Investments (investment adviser firm, 2002-2005).
* Determined to be an “Interested Trustee” by virtue of, among other things, his or her affiliation with the trust or various entities under common control with FMR.
+ The information includes the Trustee's principal occupation during the last five years and other information relating to the experience, attributes, and skills relevant to the Trustee's qualifications to serve as a Trustee, which led to the conclusion that the Trustee should serve as a Trustee for the fund.
Independent Trustees:
Correspondence intended for an Independent Trustee may be sent to Fidelity Investments, P.O. Box 55235, Boston, Massachusetts 02205-5235.
Name, Year of Birth; Principal Occupations and Other Relevant Experience+
Dennis J. Dirks (1948)
Year of Election or Appointment: 2005
Trustee
Mr. Dirks also serves as Trustee of other Fidelity® funds. Prior to his retirement in May 2003, Mr. Dirks served as Chief Operating Officer and as a member of the Board of The Depository Trust & Clearing Corporation (financial markets infrastructure), President, Chief Operating Officer and a member of the Board of The Depository Trust Company (DTC), President and a member of the Board of the National Securities Clearing Corporation (NSCC), Chief Executive Officer and a member of the Board of the Government Securities Clearing Corporation and Chief Executive Officer and a member of the Board of the Mortgage-Backed Securities Clearing Corporation. Mr. Dirks currently serves as a member of the Finance Committee (2016-present) and Board (2017-present) and is Treasurer (2018-present) of the Asolo Repertory Theatre.
Donald F. Donahue (1950)
Year of Election or Appointment: 2018
Trustee
Mr. Donahue also serves as Trustee of other Fidelity® funds. Mr. Donahue serves as President and Chief Executive Officer of Miranda Partners, LLC (risk consulting for the financial services industry, 2012-present). Previously, Mr. Donahue served as Chief Executive Officer (2006-2012), Chief Operating Officer (2003-2006) and Managing Director, Customer Marketing and Development (1999-2003) of The Depository Trust & Clearing Corporation (financial markets infrastructure). Mr. Donahue currently serves as a member (2007-present) and Co-Chairman (2016-present) of the Board of United Way of New York, a member of the Board of NYC Leadership Academy (2012-present) and a member of the Board of Advisors of Ripple Labs, Inc. (financial services, 2015-present). Mr. Donahue previously served as a member of the Advisory Board of certain Fidelity® funds (2015-2018).
Vicki L. Fuller (1957)
Year of Election or Appointment: 2020
Trustee
Ms. Fuller also serves as Trustee of other Fidelity® funds. Previously, Ms. Fuller served as a member of the Advisory Board of certain Fidelity® funds (2018-2020), Chief Investment Officer of the New York State Common Retirement Fund (2012-2018) and held a variety of positions at AllianceBernstein L.P. (global asset management, 1985-2012), including Managing Director (2006-2012) and Senior Vice President and Senior Portfolio Manager (2001-2006). Ms. Fuller currently serves as a member of the Board, Audit Committee and Nominating and Governance Committee of The Williams Companies, Inc. (natural gas infrastructure, 2018-present), as a member of the Board, Audit Committee and Nominating and Governance Committee of two Blackstone business development companies (2020-present) and as a member of the Board of Treliant, LLC (consulting, 2019-present).
Patricia L. Kampling (1959)
Year of Election or Appointment: 2020
Trustee
Ms. Kampling also serves as Trustee of other Fidelity® funds. Prior to her retirement, Ms. Kampling served as Chairman of the Board and Chief Executive Officer (2012-2019), President and Chief Operating Officer (2011-2012) and Executive Vice President and Chief Financial Officer (2010-2011) of Alliant Energy Corporation. Ms. Kampling currently serves as a member of the Board, Compensation Committee and Executive Committee and as Chair of the Audit Committee of Briggs & Stratton Corporation (manufacturing, 2011-present) and as a member of the Board, Audit, Finance and Risk Committee and Safety, Environmental, Technology and Operations Committee of American Water Works Company, Inc. (utilities company, 2019-present). In addition, Ms. Kampling currently serves as a member of the Board of the Nature Conservancy, Wisconsin Chapter (2019-present). Previously, Ms. Kampling served as a Member of the Advisory Board of certain Fidelity® funds (2020), a member of the Board of Interstate Power and Light Company (2012-2019) and Wisconsin Power and Light Company (2012-2019) (each a subsidiary of Alliant Energy Corporation) and as a member of the Board and Workforce Development Committee of the Business Roundtable (2018-2019).
Alan J. Lacy (1953)
Year of Election or Appointment: 2008
Trustee
Mr. Lacy also serves as Trustee of other Fidelity® funds. Previously, Mr. Lacy served as Senior Adviser (2007-2014) of Oak Hill Capital Partners, L.P. (private equity), Chief Executive Officer (2005) and Vice Chairman (2005-2006) of Sears Holdings Corporation (retail), Chief Executive Officer and Chairman of the Board of Sears, Roebuck and Co. (retail, 2000-2005), Chairman (2014-2017) and a member of the Board (2010-2017) of Dave & Buster’s Entertainment, Inc. (restaurant and entertainment complexes) and a member of the Board of Bristol-Myers Squibb Company (global pharmaceuticals, 2008-2020). Mr. Lacy currently serves as a Trustee of the California Chapter of The Nature Conservancy (2015-present) and a member of the Board of the Center for Advanced Study in the Behavioral Sciences at Stanford University (2015-present).
Ned C. Lautenbach (1944)
Year of Election or Appointment: 2000
Trustee
Co-Lead Independent Trustee
Mr. Lautenbach also serves as Trustee of other Fidelity® funds. Mr. Lautenbach currently serves as Chair of the Board of Governors, State University System of Florida (2013-present) and is a member of the Council on Foreign Relations (1994-present). He is also a member and has in the past served as Chairman of the Board of Directors of Artis-Naples (2012-present). Previously, Mr. Lautenbach served as a member and then Lead Director of the Board of Directors of Eaton Corporation (diversified industrial, 1997-2016). He was also a Partner at Clayton, Dubilier & Rice, LLC (private equity investment, 1998-2010); as well as Director of Sony Corporation (2006-2007). In addition, Mr. Lautenbach had a 30-year career with IBM (technology company), during which time he served as Senior Vice President and as a member of the Corporate Executive Committee (1968-1998).
Joseph Mauriello (1944)
Year of Election or Appointment: 2008
Trustee
Mr. Mauriello also serves as Trustee of other Fidelity® funds. Prior to his retirement in January 2006, Mr. Mauriello served in numerous senior management positions including Deputy Chairman and Chief Operating Officer (2004-2005), and Vice Chairman of Financial Services (2002-2004) of KPMG LLP US (professional services, 1965-2005). Mr. Mauriello currently serves as a member of the Independent Directors Council Governing Council (2015-present). Previously, Mr. Mauriello served as a member of the Board of XL Group plc. (global insurance and re-insurance, 2006-2018).
Cornelia M. Small (1944)
Year of Election or Appointment: 2005
Trustee
Ms. Small also serves as Trustee of other Fidelity® funds. Previously, Ms. Small served as Chief Investment Officer, Director of Global Equity Investments and a member of Scudder, Stevens & Clark and Scudder Kemper Investments. Ms. Small previously served as a member of the Board (2009-2019) and Chair of the Investment Committee (2010-2019) of the Teagle Foundation and a member of the Investment Committee of the Berkshire Taconic Community Foundation (2008-2019).
Garnett A. Smith (1947)
Year of Election or Appointment: 2018
Trustee
Mr. Smith also serves as Trustee of other Fidelity® funds. Prior to his retirement, Mr. Smith served as Chairman and Chief Executive Officer (1990-1997) and President (1986-1990) of Inbrand Corp. (manufacturer of personal absorbent products). Prior to his employment with Inbrand Corp., he was employed by a retail fabric chain and North Carolina National Bank (now Bank of America). Mr. Smith previously served as a member of the Advisory Board of certain Fidelity® funds (2012-2013).
David M. Thomas (1949)
Year of Election or Appointment: 2008
Trustee
Co-Lead Independent Trustee
Mr. Thomas also serves as Trustee of other Fidelity® funds. Previously, Mr. Thomas served as Executive Chairman (2005-2006) and Chairman and Chief Executive Officer (2000-2005) of IMS Health, Inc. (pharmaceutical and healthcare information solutions). Mr. Thomas currently serves as Non-Executive Chairman of the Board of Fortune Brands Home and Security (home and security products, 2011-present), and a member of the Board (2004-present) and Presiding Director (2013-present) of Interpublic Group of Companies, Inc. (marketing communication).
Susan Tomasky (1953)
Year of Election or Appointment: 2020
Trustee
Ms. Tomasky also serves as Trustee of other Fidelity® funds. Prior to her retirement, Ms. Tomasky served in various executive officer positions at American Electric Power Company, Inc. (1998-2011), including most recently as President of AEP Transmission (2007-2011). Ms. Tomasky currently serves as a member of the Board and Sustainability Committee and as Chair of the Audit Committee of Marathon Petroleum Corporation (2018-present) and as a member of the Board, Corporate Governance Committee and Organization and Compensation Committee and as Chair of the Audit Committee of Public Service Enterprise Group, Inc. (utilities company, 2012-present). In addition, Ms. Tomasky currently serves as a member of the Board of the Columbus Regional Airport Authority (2007-present), as a member of the Board of the Royal Shakespeare Company – America (2009-present), as a member of the Board of the Columbus Association for the Performing Arts (2011-present) and as a member of the Board of Kenyon College (2016-present). Previously, Ms. Tomasky served as a Member of the Advisory Board of certain Fidelity® funds (2020), a member of the Board (2011-2019) and as Lead Independent Director (2015-2018) of Andeavor Corporation (previously Tesoro Corporation) (independent oil refiner and marketer) and as a member of the Board of Summit Midstream Partners LP (energy, 2012-2018).
Michael E. Wiley (1950)
Year of Election or Appointment: 2020
Trustee
Mr. Wiley also serves as Trustee of other Fidelity® funds. Previously, Mr. Wiley served as a member of the Advisory Board of certain Fidelity® funds (2018-2020), Chairman, President and CEO of Baker Hughes, Inc. (oilfield services, 2000-2004). Mr. Wiley also previously served as a member of the Board of Andeavor Corporation (independent oil refiner and marketer, 2005-2018), a member of the Board of Andeavor Logistics LP (natural resources logistics, 2015-2018) and a member of the Board of High Point Resources (exploration and production, 2005-2020).
+ The information includes the Trustee's principal occupation during the last five years and other information relating to the experience, attributes, and skills relevant to the Trustee's qualifications to serve as a Trustee, which led to the conclusion that the Trustee should serve as a Trustee for the fund.
Advisory Board Members and Officers:
Correspondence intended for a Member of the Advisory Board (if any) may be sent to Fidelity Investments, P.O. Box 55235, Boston, Massachusetts 02205-5235. Correspondence intended for an officer or Peter S. Lynch may be sent to Fidelity Investments, 245 Summer Street, Boston, Massachusetts 02210. Officers appear below in alphabetical order.
Name, Year of Birth; Principal Occupation
Lloyd James Austin, III (1953)
Year of Election or Appointment: 2020
Member of the Advisory Board
General Austin also serves as a Member of the Advisory Board of other Fidelity® funds. Prior to his retirement, General Austin (United States Army, Retired) held a variety of positions within the U.S. Government, including Commander, U.S. Central Command (2013-2016), Vice Chief of Staff, U.S. Army (2012-2013) and Commanding General, U.S. Forces – Iraq, Operation New Dawn (2010-2012). General Austin currently serves as a Partner of Pine Island Capital Partners (private equity, 2020-present) and as President of the Austin Strategy Group LLC (consulting, 2016-present). General Austin serves as a member of the Board of Directors of Nucor Corporation (steel products, 2017-present), as a member of the Board of Directors of Tenet Healthcare Corporation (2018-present) and as a member of the Board of Directors of Raytheon Technologies Corporation (aerospace and defense, 2020-present). In addition, General Austin currently serves as a member of the Board of Trustees of the Carnegie Corporation of New York (2017-present) and as a member of the Board of Trustees of Auburn University (2017-present). Previously, General Austin served as a member of the Board of Directors of United Technologies Corporation (aerospace, defense and building, 2016-2020).
Thomas A. Kennedy (1955)
Year of Election or Appointment: 2020
Member of the Advisory Board
Mr. Kennedy also serves as a Member of the Advisory Board of other Fidelity® funds. Previously, Mr. Kennedy held a variety of positions at Raytheon Company (aerospace and defense, 1983-2020), including Chairman and Chief Executive Officer (2014-2020) and Executive Vice President and Chief Operating Officer (2013-2014). Mr. Kennedy currently serves as Executive Chairman of the Board of Directors of Raytheon Technologies Corporation (aerospace and defense, 2020-present). He is also a member of the Rutgers School of Engineering Industry Advisory Board (2011-present) and a member of the UCLA Engineering Dean’s Executive Board (2016-present).
Peter S. Lynch (1944)
Year of Election or Appointment: 2003
Member of the Advisory Board
Mr. Lynch also serves as a Member of the Advisory Board of other Fidelity® funds. Mr. Lynch is Vice Chairman and a Director of Fidelity Management & Research Company LLC (investment adviser firm). In addition, Mr. Lynch serves as a Trustee of Boston College and as the Chairman of the Inner-City Scholarship Fund. Previously, Mr. Lynch served as Vice Chairman and a Director of FMR Co., Inc. (investment adviser firm) and on the Special Olympics International Board of Directors (1997-2006).
Elizabeth Paige Baumann (1968)
Year of Election or Appointment: 2017
Anti-Money Laundering (AML) Officer
Ms. Baumann also serves as AML Officer of other funds. She is Chief AML Officer (2012-present) and Senior Vice President (2014-present) of FMR LLC (diversified financial services company) and is an employee of Fidelity Investments. Previously, Ms. Baumann served as AML Officer of certain funds (2017-2019), as AML Officer of the funds (2012-2016), and Vice President (2007-2014) and Deputy Anti-Money Laundering Officer (2007-2012) of FMR LLC.
Craig S. Brown (1977)
Year of Election or Appointment: 2019
Assistant Treasurer
Mr. Brown also serves as Assistant Treasurer of other funds. Mr. Brown is an employee of Fidelity Investments (2013-present).
John J. Burke III (1964)
Year of Election or Appointment: 2018
Chief Financial Officer
Mr. Burke also serves as Chief Financial Officer of other funds. Mr. Burke serves as Head of Investment Operations for Fidelity Fund and Investment Operations (2018-present) and is an employee of Fidelity Investments (1998-present). Previously Mr. Burke served as head of Asset Management Investment Operations (2012-2018).
William C. Coffey (1969)
Year of Election or Appointment: 2019
Assistant Secretary
Mr. Coffey also serves as Assistant Secretary of other funds. He is Senior Vice President and Deputy General Counsel of FMR LLC (diversified financial services company, 2010-present), and is an employee of Fidelity Investments. Previously, Mr. Coffey served as Secretary and CLO of certain funds (2018-2019); CLO, Secretary, and Senior Vice President of Fidelity Management & Research Company and FMR Co., Inc. (investment adviser firms, 2018-2019); Secretary of Fidelity SelectCo, LLC and Fidelity Investments Money Management, Inc. (investment adviser firms, 2018-2019); CLO of Fidelity Management & Research (Hong Kong) Limited, FMR Investment Management (UK) Limited, and Fidelity Management & Research (Japan) Limited (investment adviser firms, 2018-2019); and Assistant Secretary of certain funds (2009-2018).
Timothy M. Cohen (1969)
Year of Election or Appointment: 2018
Vice President
Mr. Cohen also serves as Vice President of other funds. Mr. Cohen serves as Co-Head of Equity (2018-present), a Director of Fidelity Management & Research (Japan) Limited (investment adviser firm, 2016-present), and is an employee of Fidelity Investments. Previously, Mr. Cohen served as Executive Vice President of Fidelity SelectCo, LLC (2019), Head of Global Equity Research (2016-2018), Chief Investment Officer - Equity and a Director of Fidelity Management & Research (U.K.) Inc. (investment adviser firm, 2013-2015) and as a Director of Fidelity Management & Research (Hong Kong) Limited (investment adviser firm, 2017).
Jonathan Davis (1968)
Year of Election or Appointment: 2010
Assistant Treasurer
Mr. Davis also serves as Assistant Treasurer of other funds. Mr. Davis serves as Assistant Treasurer of FMR Capital, Inc. (2017-present) and is an employee of Fidelity Investments. Previously, Mr. Davis served as Vice President and Associate General Counsel of FMR LLC (diversified financial services company, 2003-2010).
Laura M. Del Prato (1964)
Year of Election or Appointment: 2018
Assistant Treasurer
Ms. Del Prato also serves as an officer of other funds. Ms. Del Prato is an employee of Fidelity Investments (2017-present). Previously, Ms. Del Prato served as President and Treasurer of The North Carolina Capital Management Trust: Cash Portfolio and Term Portfolio (2018-2020). Prior to joining Fidelity Investments, Ms. Del Prato served as a Managing Director and Treasurer of the JPMorgan Mutual Funds (2014-2017). Prior to JPMorgan, Ms. Del Prato served as a partner at Cohen Fund Audit Services (accounting firm, 2012-2013) and KPMG LLP (accounting firm, 2004-2012).
Colm A. Hogan (1973)
Year of Election or Appointment: 2020
Assistant Treasurer
Mr. Hogan also serves as an officer of other funds. Mr. Hogan serves as Assistant Treasurer of FMR Capital, Inc. (2017-present) and is an employee of Fidelity Investments (2005-present). Previously, Mr. Hogan served as Deputy Treasurer of certain Fidelity® funds (2016-2020) and Assistant Treasurer of certain Fidelity® funds (2016-2018).
Pamela R. Holding (1964)
Year of Election or Appointment: 2018
Vice President
Ms. Holding also serves as Vice President of other funds. Ms. Holding serves as Co-Head of Equity (2018-present) and is an employee of Fidelity Investments (2013-present). Previously, Ms. Holding served as Executive Vice President of Fidelity SelectCo, LLC (2019) and as Chief Investment Officer of Fidelity Institutional Asset Management (2013-2018).
Cynthia Lo Bessette (1969)
Year of Election or Appointment: 2019
Secretary and Chief Legal Officer (CLO)
Ms. Lo Bessette also serves as an officer of other funds. Ms. Lo Bessette serves as CLO, Secretary, and Senior Vice President of Fidelity Management & Research Company LLC (investment adviser firm, 2019-present); and CLO of Fidelity Management & Research (Hong Kong) Limited, FMR Investment Management (UK) Limited, and Fidelity Management & Research (Japan) Limited (investment adviser firms, 2019-present). She is a Senior Vice President and Deputy General Counsel of FMR LLC (diversified financial services company, 2019-present), and is an employee of Fidelity Investments. Previously, Ms. Lo Bessette served as CLO, Secretary, and Senior Vice President of FMR Co., Inc. (investment adviser firm, 2019); Secretary of Fidelity SelectCo, LLC and Fidelity Investments Money Management, Inc. (investment adviser firms, 2019). Prior to joining Fidelity Investments, Ms. Lo Bessette was Executive Vice President, General Counsel (2016-2019) and Senior Vice President, Deputy General Counsel (2015-2016) of OppenheimerFunds (investment management company) and Deputy Chief Legal Officer (2013-2015) of Jennison Associates LLC (investment adviser firm).
Chris Maher (1972)
Year of Election or Appointment: 2020
Deputy Treasurer
Mr. Maher also serves as an officer of other funds. Mr. Maher serves as Assistant Treasurer of FMR Capital, Inc. (2017-present), and is an employee of Fidelity Investments (2008-present). Previously, Mr. Maher served as Assistant Treasurer of certain funds (2013-2020); Vice President of Asset Management Compliance (2013), Vice President of the Program Management Group of FMR (investment adviser firm, 2010-2013), and Vice President of Valuation Oversight (2008-2010).
Jason P. Pogorelec (1975)
Year of Election or Appointment: 2020
Chief Compliance Officer
Mr. Pogorelec also serves as Chief Compliance Officer of other funds. Mr. Pogorelec is a senior Vice President of Asset Management Compliance for Fidelity Investments and is an employee of Fidelity Investments (2006-present). Previously, Mr. Pogorelec served as Vice President, Associate General Counsel for Fidelity Investments (2010-2020) and Assistant Secretary of certain Fidelity funds (2015-2020).
Stacie M. Smith (1974)
Year of Election or Appointment: 2016
President and Treasurer
Ms. Smith also serves as an officer of other funds. Ms. Smith serves as Assistant Treasurer of FMR Capital, Inc. (2017-present), is an employee of Fidelity Investments (2009-present), and has served in other fund officer roles. Prior to joining Fidelity Investments, Ms. Smith served as Senior Audit Manager of Ernst & Young LLP (accounting firm, 1996-2009). Previously, Ms. Smith served as Assistant Treasurer (2013-2019) and Deputy Treasurer (2013-2016) of certain Fidelity® funds.
Marc L. Spector (1972)
Year of Election or Appointment: 2016
Assistant Treasurer
Mr. Spector also serves as an officer of other funds. Mr. Spector serves as Assistant Treasurer of FMR Capital, Inc. (2017-present) and is an employee of Fidelity Investments (2016-present). Prior to joining Fidelity Investments, Mr. Spector served as Director at the Siegfried Group (accounting firm, 2013-2016), and prior to Siegfried Group as audit senior manager at Deloitte & Touche LLP (accounting firm, 2005-2013).
Jim Wegmann (1979)
Year of Election or Appointment: 2019
Assistant Treasurer
Mr. Wegmann also serves as Assistant Treasurer of other funds. Mr. Wegmann is an employee of Fidelity Investments (2011-present).
Shareholder Expense Example
As a shareholder, you incur two types of costs: (1) transaction costs, which may include sales charges (loads) on purchase payments or redemption proceeds, as applicable and (2) ongoing costs, which generally include management fees, distribution and/or service (12b-1) fees and other Fund expenses. This Example is intended to help you understand your ongoing costs (in dollars) of investing in a fund and to compare these costs with the ongoing costs of investing in other mutual funds.
The Example is based on an investment of $1,000 invested at the beginning of the period and held for the entire period (May 1, 2020 to October 31, 2020).
Actual Expenses
The first line of the accompanying table provides information about actual account values and actual expenses. You may use the information in this line, together with the amount you invested, to estimate the expenses that you paid over the period. Simply divide your account value by $1,000.00 (for example, an $8,600 account value divided by $1,000.00 = 8.6), then multiply the result by the number in the first line for a class/Fund under the heading entitled "Expenses Paid During Period" to estimate the expenses you paid on your account during this period. If any fund is a shareholder of any underlying mutual funds or exchange-traded funds (ETFs) (the Underlying Funds), such fund indirectly bears its proportional share of the expenses of the Underlying Funds in addition to the direct expenses incurred presented in the table. These fees and expenses are not included in the annualized expense ratio used to calculate the expense estimate in the table below.
Hypothetical Example for Comparison Purposes
The second line of the accompanying table provides information about hypothetical account values and hypothetical expenses based on the actual expense ratio and an assumed rate of return of 5% per year before expenses, which is not the actual return. The hypothetical account values and expenses may not be used to estimate the actual ending account balance or expenses you paid for the period. You may use this information to compare the ongoing costs of investing in the Fund and other funds. To do so, compare this 5% hypothetical example with the 5% hypothetical examples that appear in the shareholder reports of the other funds. If any fund is a shareholder of any Underlying Funds, such fund indirectly bears its proportional share of the expenses of the Underlying Funds in addition to the direct expenses as presented in the table. These fees and expenses are not included in the annualized expense ratio used to calculate the expense estimate in the table below.
Please note that the expenses shown in the table are meant to highlight your ongoing costs only and do not reflect any transaction costs. Therefore, the second line of the table is useful in comparing ongoing costs only, and will not help you determine the relative total costs of owning different funds.
| | Annualized Expense Ratio-A | Beginning
Account Value
May 1, 2020 | Ending
Account Value
October 31, 2020 | Expenses Paid
During Period-B
May 1, 2020
to October 31, 2020 |
| Fidelity Series Overseas Fund | .01% | | | |
| Actual | | $1,000.00 | $1,137.00 | $.05 |
| Hypothetical-C | | $1,000.00 | $1,025.09 | $.05 |
A Annualized expense ratio reflects expenses net of applicable fee waivers.
B Expenses are equal to the annualized expense ratio, multiplied by the average account value over the period, multiplied by 184/ 366 (to reflect the one-half year period). The fees and expenses of any Underlying Funds are not included in each annualized expense ratio.
C 5% return per year before expenses
Distributions (Unaudited)
The fund designates 3% of the dividend distributed during the fiscal year as qualifying for the dividends–received deduction for corporate shareholders.
The fund designates 29% of the dividend distributed in December during the fiscal year as amounts which may be taken into account as a dividend for the purposes of the maximum rate under section 1(h)(11) of the Internal Revenue Code.
The fund will notify shareholders in January 2021 of amounts for use in preparing 2020 income tax returns.
Proxy Voting Results
A special meeting of shareholders was held on June 9, 2020. The results of votes taken among shareholders on the proposal before them are reported below. Each vote reported represents one dollar of net asset value held on the record date for the meeting.
PROPOSAL 1
To elect a Board of Trustees.
| | # of
Votes | % of
Votes |
| Dennis J. Dirks |
| Affirmative | 91,643,443,973.030 | 98.167 |
| Withheld | 1,711,119,384.419 | 1.833 |
| TOTAL | 93,354,563,357.449 | 100.000 |
| Donald F. Donahue |
| Affirmative | 91,659,003,496.045 | 98.184 |
| Withheld | 1,695,559,852.789 | 1.816 |
| TOTAL | 93,354,563,357.449 | 100.000 |
| Bettina Doulton |
| Affirmative | 91,774,146,516.145 | 98.307 |
| Withheld | 1,580,416,862.377 | 1.693 |
| TOTAL | 93,354,563,357.449 | 100.000 |
| Vicki L. Fuller |
| Affirmative | 91,845,419,368.993 | 98.383 |
| Withheld | 1,509,143,998.591 | 1.617 |
| TOTAL | 93,354,563,357.449 | 100.00 |
| Patricia L. Kampling |
| Affirmative | 91,723,732,274.457 | 98.253 |
| Withheld | 1,630,831,098.411 | 1.747 |
| TOTAL | 93,354,563,357.449 | 100.000 |
| Alan J. Lacy |
| Affirmative | 91,490,319,407.772 | 98.003 |
| Withheld | 1,864,243,948.299 | 1.997 |
| TOTAL | 93,354,563,357.449 | 100.000 |
| Ned C. Lautenbach |
| Affirmative | 91,285,367,239.075 | 97.784 |
| Withheld | 2,069,196,119.052 | 2.216 |
| TOTAL | 93,354,563,357.449 | 100.000 |
| Robert A. Lawrence |
| Affirmative | 91,556,271,429.466 | 98.074 |
| Withheld | 1,798,291,912.707 | 1.926 |
| TOTAL | 93,354,563,357.449 | 100.000 |
| Joseph Mauriello |
| Affirmative | 91,497,480,147.082 | 98.011 |
| Withheld | 1,857,083,211.045 | 1.989 |
| TOTAL | 93,354,563,357.449 | 100.000 |
| Cornelia M. Small |
| Affirmative | 91,606,808,161.438 | 98.128 |
| Withheld | 1,747,755,220.497 | 1.872 |
| TOTAL | 93,354,563,357.449 | 100.000 |
| Garnett A. Smith |
| Affirmative | 91,505,784,053.038 | 98.020 |
| Withheld | 1,848,779,305.090 | 1.980 |
| TOTAL | 93,354,563,357.449 | 100.000 |
| David M. Thomas |
| Affirmative | 91,536,969,704.881 | 98.053 |
| Withheld | 1,817,593,630.919 | 1.947 |
| TOTAL | 93,354,563,357.449 | 100.000 |
| Susan Tomasky |
| Affirmative | 91,697,125,678.165 | 98.225 |
| Withheld | 1,657,437,703.277 | 1.775 |
| TOTAL | 93,354,563,357.449 | 100.000 |
| Michael E. Wiley |
| Affirmative | 91,506,805,575.815 | 98.021 |
| Withheld | 1,847,757,759.985 | 1.979 |
| TOTAL | 93,354,563,357.449 | 100.000 |
|
| Proposal 1 reflects trust wide proposal and voting results. |
SOV-ANN-1220
1.9894003.101
Fidelity® Infrastructure Fund
Annual Report
October 31, 2020
See the inside front cover for important information about access to your fund’s shareholder reports.
Beginning on January 1, 2021, as permitted by regulations adopted by the Securities and Exchange Commission, paper copies of a fund’s shareholder reports will no longer be sent by mail, unless you specifically request paper copies of the reports from the fund or from your financial intermediary, such as a financial advisor, broker-dealer or bank. Instead, the reports will be made available on a website, and you will be notified by mail each time a report is posted and provided with a website link to access the report.
If you already elected to receive shareholder reports electronically, you will not be affected by this change and you need not take any action. You may elect to receive shareholder reports and other communications from a fund electronically, by contacting your financial intermediary. For Fidelity customers, visit Fidelity's web site or call Fidelity using the contact information listed below.
You may elect to receive all future reports in paper free of charge. If you wish to continue receiving paper copies of your shareholder reports, you may contact your financial intermediary or, if you are a Fidelity customer, visit Fidelity’s website, or call Fidelity at the applicable toll-free number listed below. Your election to receive reports in paper will apply to all funds held with the fund complex/your financial intermediary.
| Account Type | Website | Phone Number |
| Brokerage, Mutual Fund, or Annuity Contracts: | fidelity.com/mailpreferences | 1-800-343-3548 |
| Employer Provided Retirement Accounts: | netbenefits.fidelity.com/preferences (choose 'no' under Required Disclosures to continue to print) | 1-800-343-0860 |
| Advisor Sold Accounts Serviced Through Your Financial Intermediary: | Contact Your Financial Intermediary | Your Financial Intermediary's phone number |
| Advisor Sold Accounts Serviced by Fidelity: | institutional.fidelity.com | 1-877-208-0098 |
Contents
To view a fund's proxy voting guidelines and proxy voting record for the 12-month period ended June 30, visit http://www.fidelity.com/proxyvotingresults or visit the Securities and Exchange Commission's (SEC) web site at http://www.sec.gov.
You may also call 1-800-544-8544 to request a free copy of the proxy voting guidelines.
Standard & Poor's, S&P and S&P 500 are registered service marks of The McGraw-Hill Companies, Inc. and have been licensed for use by Fidelity Distributors Corporation.
Other third-party marks appearing herein are the property of their respective owners.
All other marks appearing herein are registered or unregistered trademarks or service marks of FMR LLC or an affiliated company. © 2020 FMR LLC. All rights reserved.
This report and the financial statements contained herein are submitted for the general information of the shareholders of the Fund. This report is not authorized for distribution to prospective investors in the Fund unless preceded or accompanied by an effective prospectus.
A fund files its complete schedule of portfolio holdings with the SEC for the first and third quarters of each fiscal year on Form N-PORT. Forms N-PORT are available on the SEC’s web site at http://www.sec.gov. A fund's Forms N-PORT may be reviewed and copied at the SEC’s Public Reference Room in Washington, DC. Information regarding the operation of the SEC's Public Reference Room may be obtained by calling 1-800-SEC-0330.
For a complete list of a fund's portfolio holdings, view the most recent holdings listing, semiannual report, or annual report on Fidelity's web site at http://www.fidelity.com, http://www.institutional.fidelity.com, or http://www.401k.com, as applicable.
NOT FDIC INSURED •MAY LOSE VALUE •NO BANK GUARANTEE
Neither the Fund nor Fidelity Distributors Corporation is a bank.
Note to Shareholders:
Early in 2020, the outbreak and spread of a new coronavirus emerged as a public health emergency that had a major influence on financial markets, primarily based on its impact on the global economy and the outlook for corporate earnings. The virus causes a respiratory disease known as COVID-19. On March 11, the World Health Organization declared the COVID-19 outbreak a pandemic, citing sustained risk of further global spread.
In the weeks following, as the crisis worsened, we witnessed an escalating human tragedy with wide-scale social and economic consequences from coronavirus-containment measures. The outbreak of COVID-19 prompted a number of measures to limit the spread, including travel and border restrictions, quarantines, and restrictions on large gatherings. In turn, these resulted in lower consumer activity, diminished demand for a wide range of products and services, disruption in manufacturing and supply chains, and – given the wide variability in outcomes regarding the outbreak – significant market uncertainty and volatility. Amid the turmoil, global governments and central banks took unprecedented action to help support consumers, businesses, and the broader economies, and to limit disruption to financial systems.
The situation continues to unfold, and the extent and duration of its impact on financial markets and the economy remain highly uncertain. Extreme events such as the coronavirus crisis are “exogenous shocks” that can have significant adverse effects on mutual funds and their investments. Although multiple asset classes may be affected by market disruption, the duration and impact may not be the same for all types of assets.
Fidelity is committed to helping you stay informed amid news about COVID-19 and during increased market volatility, and we’re taking extra steps to be responsive to customer needs. We encourage you to visit our websites, where we offer ongoing updates, commentary, and analysis on the markets and our funds.
Performance: The Bottom Line
Average annual total return reflects the change in the value of an investment, assuming reinvestment of distributions from dividend income and capital gains (the profits earned upon the sale of securities that have grown in value, if any) and assuming a constant rate of performance each year. The hypothetical investment and the average annual total returns do not reflect the deduction of taxes that a shareholder would pay on fund distributions or the redemption of fund shares. During periods of reimbursement by Fidelity, a fund’s total return will be greater than it would be had the reimbursement not occurred. How a fund did yesterday is no guarantee of how it will do tomorrow.
Average annual total returns for Fidelity® Infrastructure Fund will be reported once the fund is a year old.
$10,000 Over Life of Fund
Let's say hypothetically that $10,000 was invested in Fidelity® Infrastructure Fund on November 5, 2019, when the fund started.
The chart shows how the value of your investment would have changed, and also shows how the MSCI ACWI (All Country World Index) Index performed over the same period.
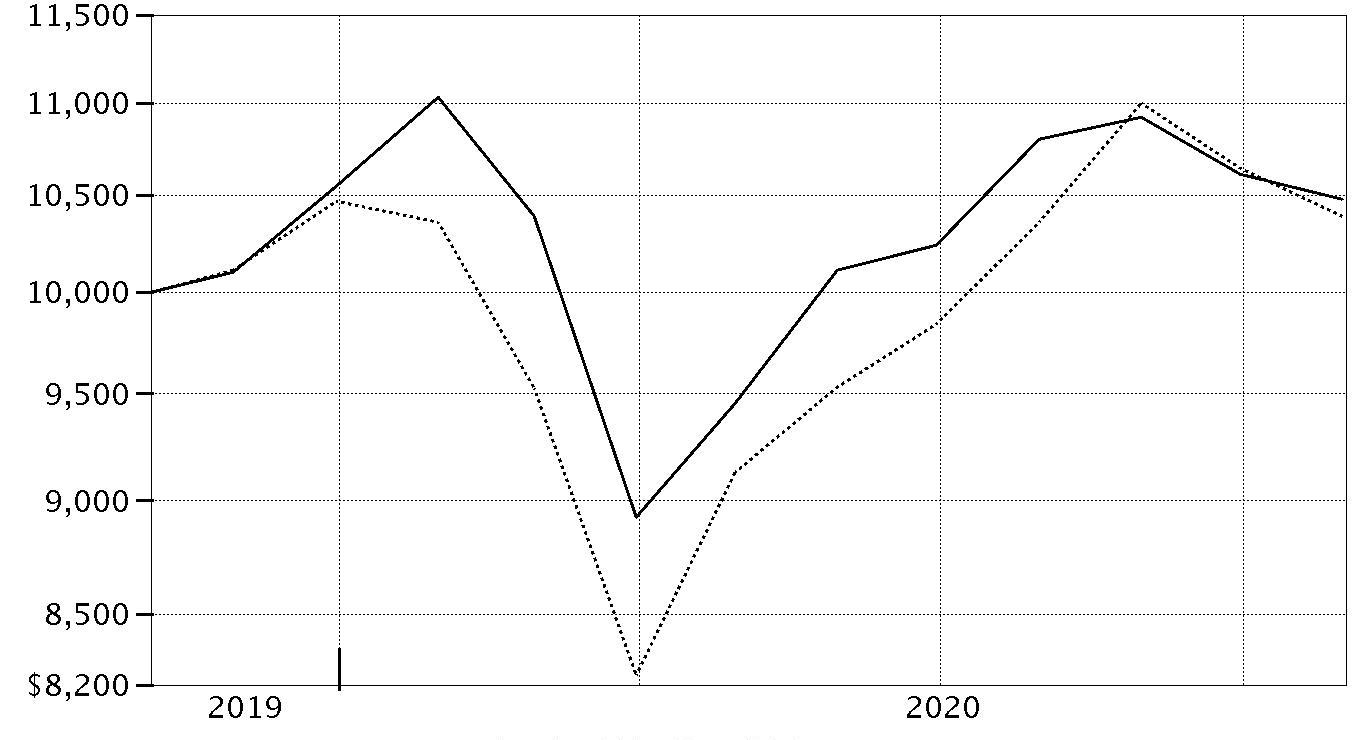
| Period Ending Values |
| $10,479 | Fidelity® Infrastructure Fund |
| $10,388 | MSCI ACWI (All Country World Index) Index |
Management's Discussion of Fund Performance
Market Recap: The MSCI ACWI (All Country World Index) ex USA Index returned -2.46% for the 12 months ending October 31, 2020, in what was a bumpy ride for non-U.S. equities, marked by a steep but brief decline due to the early-2020 outbreak and spread of the coronavirus, followed by a sharp upturn. Declared a pandemic on March 11, the crisis and containment efforts caused broad contraction in economic activity, elevated volatility and dislocation in financial markets. A historically rapid and expansive monetary- and fiscal-policy response around the world provided a partial offset to the economic disruption. Other supporting factors included resilient corporate earnings and near-term potential for a COVID-19 vaccine breakthrough. This was evident in the index’s 12.28% gain in the final six months of the year. Currency fluctuation generally boosted foreign developed-markets equities for the year, while the reverse was true for emerging-markets stocks. Late in the period, the index was pressured by a second wave of COVID-19 cases in some regions, and stretched valuations and crowded positioning in big tech. For the full year, the U.K. (-22%), Asia Pacific ex Japan (-8%), Canada (-5%) and Europe ex U.K. (-4%) notably lagged. Emerging markets (+9%) and Japan (+1%) outperformed. By sector, energy (-38%), financials and real estate (-20% each) lagged, whereas information technology (+ 25%) and communication services (+15%) topped the index.
Comments from Portfolio Manager Pranay Kirpalani: From its inception on November 5, 2019, through October 31, 2020, the fund advanced 4.79%. This result surpassed the broad-market MSCI ACWI (+3.88%) as well as the more narrowly focused S&P Global Infrastructure Index (-15.97%). A combination of strong stock and market selection contributed to the fund’s wide outperformance of the infrastructure benchmark for the slightly abbreviated fiscal period. Choices in real estate and utilities added the most value, while stock picking and an average underweighting in the weak-performing energy sector also contributed. On an individual basis, a non-benchmark position in Cellnex Telecom (+63%), a wireless telecom infrastructure company based in Spain, contributed more value than any other individual position. An outsized stake in Danish multinational power company Orsted, which gained roughly 90% for the fund, also helped. Conversely, stock picks in pockets of industrials detracted modestly from the fund’s relative performance. The fund's largest individual relative detractor was our overweighted stake in Grupo Aeroport Pacific (-45% for the fund), an airport based in Mexico. I sold Grupo Aeroport Pacific by period end to buy shares of its competitor, Grupo Aeroportuario Centro Norte. Also holding back performance was a non-benchmark position in Rumo (-45%), a railroad operator in Brazil.
The views expressed above reflect those of the portfolio manager(s) only through the end of the period as stated on the cover of this report and do not necessarily represent the views of Fidelity or any other person in the Fidelity organization. Any such views are subject to change at any time based upon market or other conditions and Fidelity disclaims any responsibility to update such views. These views may not be relied on as investment advice and, because investment decisions for a Fidelity fund are based on numerous factors, may not be relied on as an indication of trading intent on behalf of any Fidelity fund.
Investment Summary (Unaudited)
Top Five Stocks as of October 31, 2020
| | % of fund's net assets |
| Aena Sme SA | 6.9 |
| NextEra Energy, Inc. | 6.9 |
| Iberdrola SA | 5.1 |
| Dominion Energy, Inc. | 4.8 |
| Enel SpA | 4.4 |
| | 28.1 |
Top Five Market Sectors as of October 31, 2020
| | % of fund's net assets |
| Utilities | 38.5 |
| Industrials | 26.9 |
| Real Estate | 14.0 |
| Energy | 8.8 |
| Communication Services | 4.7 |
Asset Allocation (% of fund's net assets)
| As of October 31, 2020* |
| | Stocks | 93.9% |
| | Short-Term Investments and Net Other Assets (Liabilities) | 6.1% |

* Foreign investments – 54.6%
Schedule of Investments October 31, 2020
Showing Percentage of Net Assets
| Common Stocks - 93.1% | | | |
| | | Shares | Value |
| COMMUNICATION SERVICES - 4.7% | | | |
| Diversified Telecommunication Services - 4.7% | | | |
| Cellnex Telecom SA (a) | | 8,580 | $550,797 |
| Infrastrutture Wireless Italiane SpA (a) | | 4,982 | 53,845 |
| | | | 604,642 |
| ENERGY - 8.8% | | | |
| Oil, Gas & Consumable Fuels - 8.8% | | | |
| Cheniere Energy Partners LP | | 6,337 | 228,449 |
| Cheniere Energy, Inc. (b) | | 6,500 | 311,155 |
| Enterprise Products Partners LP | | 10,474 | 173,554 |
| The Williams Companies, Inc. | | 21,500 | 412,585 |
| | | | 1,125,743 |
| INDUSTRIALS - 26.9% | | | |
| Commercial Services & Supplies - 2.6% | | | |
| GFL Environmental, Inc. | | 9,300 | 178,002 |
| Waste Connection, Inc. (United States) | | 1,534 | 152,357 |
| | | | 330,359 |
| Construction & Engineering - 3.1% | | | |
| Ferrovial SA | | 9,466 | 204,782 |
| VINCI SA | | 2,397 | 189,327 |
| | | | 394,109 |
| Road & Rail - 1.5% | | | |
| Rumo SA (b) | | 61,087 | 195,250 |
| Transportation Infrastructure - 19.7% | | | |
| Aena Sme SA (a)(b) | | 6,532 | 879,426 |
| Aeroports de Paris SA | | 2,500 | 244,285 |
| Auckland International Airport Ltd. | | 102,700 | 475,078 |
| Flughafen Zuerich AG (b) | | 1,540 | 207,584 |
| Grupo Aeroportuario Norte S.A.B. de CV ADR (b) | | 7,400 | 267,732 |
| Sydney Airport unit | | 113,773 | 436,215 |
| | | | 2,510,320 |
|
| TOTAL INDUSTRIALS | | | 3,430,038 |
|
| INFORMATION TECHNOLOGY - 1.0% | | | |
| IT Services - 1.0% | | | |
| GDS Holdings Ltd. ADR (b) | | 1,500 | 126,060 |
| REAL ESTATE - 14.0% | | | |
| Equity Real Estate Investment Trusts (REITs) - 14.0% | | | |
| American Tower Corp. | | 905 | 207,833 |
| CoreSite Realty Corp. | | 1,914 | 228,455 |
| Crown Castle International Corp. | | 1,296 | 202,435 |
| Digital Realty Trust, Inc. | | 2,084 | 300,721 |
| Equinix, Inc. | | 280 | 204,747 |
| Prologis (REIT), Inc. | | 2,735 | 271,312 |
| SBA Communications Corp. Class A | | 617 | 179,158 |
| Warehouses de Pauw | | 5,534 | 185,105 |
| | | | 1,779,766 |
| UTILITIES - 37.7% | | | |
| Electric Utilities - 22.1% | | | |
| Enel SpA | | 70,979 | 564,319 |
| Energias de Portugal SA | | 43,370 | 213,762 |
| Equatorial Energia SA | | 6,092 | 21,160 |
| Iberdrola SA | | 54,919 | 647,609 |
| NextEra Energy, Inc. | | 11,968 | 876,177 |
| ORSTED A/S (a) | | 1,803 | 286,161 |
| Scottish & Southern Energy PLC | | 12,728 | 206,939 |
| | | | 2,816,127 |
| Independent Power and Renewable Electricity Producers - 7.0% | | | |
| Atlantica Sustainable Infrastructure PLC | | 7,245 | 213,655 |
| Clearway Energy, Inc. Class C | | 5,900 | 166,144 |
| NextEra Energy Partners LP | | 4,517 | 283,668 |
| The AES Corp. | | 11,921 | 232,460 |
| | | | 895,927 |
| Multi-Utilities - 8.6% | | | |
| Ameren Corp. | | 1,572 | 127,521 |
| Dominion Energy, Inc. | | 7,540 | 605,764 |
| RWE AG | | 9,768 | 361,653 |
| | | | 1,094,938 |
|
| TOTAL UTILITIES | | | 4,806,992 |
|
| TOTAL COMMON STOCKS | | | |
| (Cost $11,381,568) | | | 11,873,241 |
|
| Nonconvertible Preferred Stocks - 0.8% | | | |
| UTILITIES - 0.8% | | | |
| Water Utilities - 0.8% | | | |
| Companhia de Saneamento Basico do Estado de Sao Paulo (SABESP) sponsored ADR | | | |
| (Cost $170,415) | | 13,928 | 102,789 |
|
| Money Market Funds - 5.4% | | | |
| Fidelity Cash Central Fund 0.10% (c) | | | |
| (Cost $690,924) | | 690,786 | 690,924 |
| TOTAL INVESTMENT IN SECURITIES - 99.3% | | | |
| (Cost $12,242,907) | | | 12,666,954 |
| NET OTHER ASSETS (LIABILITIES) - 0.7% | | | 95,058 |
| NET ASSETS - 100% | | | $12,762,012 |
Legend
(a) Security exempt from registration under Rule 144A of the Securities Act of 1933. These securities may be resold in transactions exempt from registration, normally to qualified institutional buyers. At the end of the period, the value of these securities amounted to $1,770,229 or 13.9% of net assets.
(b) Non-income producing
(c) Affiliated fund that is generally available only to investment companies and other accounts managed by Fidelity Investments. The rate quoted is the annualized seven-day yield of the fund at period end. A complete unaudited listing of the fund's holdings as of its most recent quarter end is available upon request. In addition, each Fidelity Central Fund’s financial statements, which are not covered by the Fund’s Report of Independent Registered Public Accounting Firm, are available on the SEC’s website or upon request.
Affiliated Central Funds
Information regarding fiscal year to date income earned by the Fund from investments in Fidelity Central Funds is as follows:
| Fund | Income earned |
| Fidelity Cash Central Fund | $1,547 |
| Total | $1,547 |
Amounts in the income column in the above table include any capital gain distributions from underlying funds, which are presented in the corresponding line-item in the Statement of Operations, if applicable.
The value, beginning of period, for the Fidelity Cash Central Fund was $0. Net realized gain (loss) and change in net unrealized appreciation (depreciation) on Fidelity Cash Central Fund is presented in the Statement of Operations, if applicable. Purchases and sales of the Fidelity Cash Central Fund were $10,714,705 and $10,023,819, respectively, during the period.
Investment Valuation
The following is a summary of the inputs used, as of October 31, 2020, involving the Fund's assets and liabilities carried at fair value. The inputs or methodology used for valuing securities may not be an indication of the risk associated with investing in those securities. For more information on valuation inputs, and their aggregation into the levels used below, please refer to the Investment Valuation section in the accompanying Notes to Financial Statements.
| | Valuation Inputs at Reporting Date: |
| Description | Total | Level 1 | Level 2 | Level 3 |
| Investments in Securities: | | | | |
| Equities: | | | | |
| Communication Services | $604,642 | $604,642 | $-- | $-- |
| Energy | 1,125,743 | 1,125,743 | -- | -- |
| Industrials | 3,430,038 | 2,329,418 | 1,100,620 | -- |
| Information Technology | 126,060 | 126,060 | -- | -- |
| Real Estate | 1,779,766 | 1,779,766 | -- | -- |
| Utilities | 4,909,781 | 4,345,462 | 564,319 | -- |
| Money Market Funds | 690,924 | 690,924 | -- | -- |
| Total Investments in Securities: | $12,666,954 | $11,002,015 | $1,664,939 | $-- |
Other Information
Distribution of investments by country or territory of incorporation, as a percentage of Total Net Assets, is as follows (Unaudited):
| United States of America | 45.4% |
| Spain | 17.9% |
| Italy | 4.8% |
| New Zealand | 3.7% |
| Australia | 3.4% |
| France | 3.4% |
| United Kingdom | 3.3% |
| Germany | 2.8% |
| Canada | 2.6% |
| Brazil | 2.5% |
| Denmark | 2.2% |
| Mexico | 2.1% |
| Portugal | 1.7% |
| Switzerland | 1.7% |
| Belgium | 1.5% |
| Cayman Islands | 1.0% |
| | 100.0% |
See accompanying notes which are an integral part of the financial statements.
Financial Statements
Statement of Assets and Liabilities
| | | October 31, 2020 |
| Assets | | |
Investment in securities, at value — See accompanying schedule:
Unaffiliated issuers (cost $11,551,983) | $11,976,030 | |
| Fidelity Central Funds (cost $690,924) | 690,924 | |
| Total Investment in Securities (cost $12,242,907) | | $12,666,954 |
| Receivable for investments sold | | 62,662 |
| Receivable for fund shares sold | | 70,147 |
| Dividends receivable | | 10,300 |
| Distributions receivable from Fidelity Central Funds | | 55 |
| Prepaid expenses | | 19 |
| Receivable from investment adviser for expense reductions | | 18,996 |
| Other receivables | | 363 |
| Total assets | | 12,829,496 |
| Liabilities | | |
| Payable for fund shares redeemed | $21,950 | |
| Accrued management fee | 7,328 | |
| Audit fee payable | 34,200 | |
| Other affiliated payables | 3,145 | |
| Other payables and accrued expenses | 861 | |
| Total liabilities | | 67,484 |
| Net Assets | | $12,762,012 |
| Net Assets consist of: | | |
| Paid in capital | | $13,148,494 |
| Total accumulated earnings (loss) | | (386,482) |
| Net Assets | | $12,762,012 |
| Net Asset Value, offering price and redemption price per share ($12,762,012 ÷ 1,222,843 shares) | | $10.44 |
See accompanying notes which are an integral part of the financial statements.
Statement of Operations
| | | For the period
November 5, 2019 (commencement of operations) to
October 31, 2020 |
| Investment Income | | |
| Dividends | | $231,678 |
| Non-Cash dividends | | 22,047 |
| Income from Fidelity Central Funds | | 1,547 |
| Income before foreign taxes withheld | | 255,272 |
| Less foreign taxes withheld | | (17,295) |
| Total income | | 237,977 |
| Expenses | | |
| Management fee | $60,724 | |
| Transfer agent fees | 23,750 | |
| Accounting fees and expenses | 3,467 | |
| Custodian fees and expenses | 18,148 | |
| Independent trustees' fees and expenses | 42 | |
| Registration fees | 45,899 | |
| Audit | 48,741 | |
| Legal | 6 | |
| Miscellaneous | 362 | |
| Total expenses before reductions | 201,139 | |
| Expense reductions | (112,802) | |
| Total expenses after reductions | | 88,337 |
| Net investment income (loss) | | 149,640 |
| Realized and Unrealized Gain (Loss) | | |
| Net realized gain (loss) on: | | |
| Investment securities: | | |
| Unaffiliated issuers | (920,244) | |
| Fidelity Central Funds | 38 | |
| Foreign currency transactions | (648) | |
| Total net realized gain (loss) | | (920,854) |
| Change in net unrealized appreciation (depreciation) on: | | |
| Investment securities: | | |
| Unaffiliated issuers | 424,047 | |
| Assets and liabilities in foreign currencies | 139 | |
| Total change in net unrealized appreciation (depreciation) | | 424,186 |
| Net gain (loss) | | (496,668) |
| Net increase (decrease) in net assets resulting from operations | | $(347,028) |
See accompanying notes which are an integral part of the financial statements.
Statement of Changes in Net Assets
| | For the period
November 5, 2019 (commencement of operations) to
October 31, 2020 |
| Increase (Decrease) in Net Assets | |
| Operations | |
| Net investment income (loss) | $149,640 |
| Net realized gain (loss) | (920,854) |
| Change in net unrealized appreciation (depreciation) | 424,186 |
| Net increase (decrease) in net assets resulting from operations | (347,028) |
| Distributions to shareholders | (9,940) |
| Share transactions | |
| Proceeds from sales of shares | 20,982,960 |
| Reinvestment of distributions | 9,617 |
| Cost of shares redeemed | (7,873,597) |
| Net increase (decrease) in net assets resulting from share transactions | 13,118,980 |
| Total increase (decrease) in net assets | 12,762,012 |
| Net Assets | |
| Beginning of period | – |
| End of period | $12,762,012 |
| Other Information | |
| Shares | |
| Sold | 2,024,005 |
| Issued in reinvestment of distributions | 941 |
| Redeemed | (802,103) |
| Net increase (decrease) | 1,222,843 |
See accompanying notes which are an integral part of the financial statements.
Financial Highlights
Fidelity Infrastructure Fund
| Year ended October 31, | 2020 A |
| Selected Per–Share Data | |
| Net asset value, beginning of period | $10.00 |
| Income from Investment Operations | |
| Net investment income (loss)B | .17 |
| Net realized and unrealized gain (loss) | .31C |
| Total from investment operations | .48 |
| Distributions from net investment income | (.04) |
| Total distributions | (.04) |
| Net asset value, end of period | $10.44 |
| Total ReturnD,E | 4.79% |
| Ratios to Average Net AssetsF,G | |
| Expenses before reductions | 2.24%H |
| Expenses net of fee waivers, if any | 1.00%H |
| Expenses net of all reductions | .98%H |
| Net investment income (loss) | 1.67%H |
| Supplemental Data | |
| Net assets, end of period (000 omitted) | $12,762 |
| Portfolio turnover rateI | 50%H |
A For the period November 5, 2019 (commencement of operations) to October 31, 2020.
B Calculated based on average shares outstanding during the period.
C The amount shown for a share outstanding does not correspond with the aggregate net gain (loss) on investments for the period due to the timing of sales and repurchases of shares in relation to fluctuating market values of the investments of the Fund.
D Total returns for periods of less than one year are not annualized.
E Total returns would have been lower if certain expenses had not been reduced during the applicable periods shown.
F Fees and expenses of any underlying mutual funds or exchange-traded funds (ETFs) are not included in the Fund's expense ratio. The Fund indirectly bears its proportionate share of these expenses. For additional expense information related to investments in Fidelity Central Funds, please refer to the "Investments in Fidelity Central Funds" note found in the Notes to Financial Statements section of the most recent Annual or Semi-Annual report.
G Expense ratios reflect operating expenses of the class. Expenses before reductions do not reflect amounts reimbursed, waived, or reduced through arrangements with the investment advisor, brokerage services, or other offset arrangements, if applicable, and do not represent the amount paid by the class during periods when reimbursements, waivers or reductions occur.
H Annualized
I Amount does not include the portfolio activity of any underlying mutual funds or exchange-traded funds (ETFs).
See accompanying notes which are an integral part of the financial statements.
Notes to Financial Statements
For the period ended October 31, 2020
1. Organization.
Fidelity Infrastructure Fund (the Fund) is a non-diversified fund of Fidelity Investment Trust (the Trust) and is authorized to issue an unlimited number of shares. Share transactions on the Statement of Changes in Net Assets may contain exchanges between affiliated funds. The Trust is registered under the Investment Company Act of 1940, as amended (the 1940 Act), as an open-end management investment company organized as a Massachusetts business trust.
Effective January 1, 2020:
Investment advisers Fidelity Investments Money Management, Inc., FMR Co., Inc., and Fidelity SelectCo, LLC, merged with and into Fidelity Management & Research Company. In connection with the merger transactions, the resulting, merged investment adviser was then redomiciled from Massachusetts to Delaware, changed its corporate structure from a corporation to a limited liability company, and changed its name to "Fidelity Management & Research Company LLC".
Fidelity Investments Institutional Operations Company, Inc. converted from a Massachusetts corporation to a Massachusetts LLC, and changed its name to "Fidelity Investments Institutional Operations Company LLC".
2. Investments in Fidelity Central Funds.
The Fund invests in Fidelity Central Funds, which are open-end investment companies generally available only to other investment companies and accounts managed by the investment adviser and its affiliates. The Fund's Schedule of Investments lists each of the Fidelity Central Funds held as of period end, if any, as an investment of the Fund, but does not include the underlying holdings of each Fidelity Central Fund. As an Investing Fund, the Fund indirectly bears its proportionate share of the expenses of the underlying Fidelity Central Funds.
The Money Market Central Funds seek preservation of capital and current income and are managed by the investment adviser. Annualized expenses of the Money Market Central Funds as of their most recent shareholder report date ranged from less than .005% to .01%.
A complete unaudited list of holdings for each Fidelity Central Fund is available upon request or at the Securities and Exchange Commission (the SEC) website at www.sec.gov. In addition, the financial statements of the Fidelity Central Funds, which are not covered by the Fund's Report of Independent Registered Public Accounting Firm, are available on the SEC website or upon request.
3. Significant Accounting Policies.
The Fund is an investment company and applies the accounting and reporting guidance of the Financial Accounting Standards Board (FASB) Accounting Standards Codification Topic 946 Financial Services – Investment Companies. The financial statements have been prepared in conformity with accounting principles generally accepted in the United States of America (GAAP), which require management to make certain estimates and assumptions at the date of the financial statements. Actual results could differ from those estimates. Subsequent events, if any, through the date that the financial statements were issued have been evaluated in the preparation of the financial statements. The following summarizes the significant accounting policies of the Fund:
Investment Valuation. Investments are valued as of 4:00 p.m. Eastern time on the last calendar day of the period. The Board of Trustees (the Board) has delegated the day to day responsibility for the valuation of the Fund's investments to the Fair Value Committee (the Committee) established by the Fund's investment adviser. In accordance with valuation policies and procedures approved by the Board, the Fund attempts to obtain prices from one or more third party pricing vendors or brokers to value its investments. When current market prices, quotations or currency exchange rates are not readily available or reliable, investments will be fair valued in good faith by the Committee, in accordance with procedures adopted by the Board. Factors used in determining fair value vary by investment type and may include market or investment specific events. The frequency with which these procedures are used cannot be predicted and they may be utilized to a significant extent. The Committee oversees the Fund's valuation policies and procedures and reports to the Board on the Committee's activities and fair value determinations. The Board monitors the appropriateness of the procedures used in valuing the Fund's investments and ratifies the fair value determinations of the Committee.
The Fund categorizes the inputs to valuation techniques used to value its investments into a disclosure hierarchy consisting of three levels as shown below:
- Level 1 – quoted prices in active markets for identical investments
- Level 2 – other significant observable inputs (including quoted prices for similar investments, interest rates, prepayment speeds, etc.)
- Level 3 – unobservable inputs (including the Fund's own assumptions based on the best information available)
Valuation techniques used to value the Fund's investments by major category are as follows:
Equity securities, including restricted securities, for which market quotations are readily available, are valued at the last reported sale price or official closing price as reported by a third party pricing vendor on the primary market or exchange on which they are traded and are categorized as Level 1 in the hierarchy. In the event there were no sales during the day or closing prices are not available, securities are valued at the last quoted bid price or may be valued using the last available price and are generally categorized as Level 2 in the hierarchy. For foreign equity securities, when market or security specific events arise, comparisons to the valuation of American Depositary Receipts (ADRs), futures contracts, Exchange-Traded Funds (ETFs) and certain indexes as well as quoted prices for similar securities may be used and would be categorized as Level 2 in the hierarchy. For equity securities, including restricted securities, where observable inputs are limited, assumptions about market activity and risk are used and these securities may be categorized as Level 3 in the hierarchy.
Investments in open-end mutual funds, including the Fidelity Central Funds, are valued at their closing net asset value (NAV) each business day and are categorized as Level 1 in the hierarchy.
Changes in valuation techniques may result in transfers in or out of an assigned level within the disclosure hierarchy. The aggregate value of investments by input level as of October 31, 2020 is included at the end of the Fund' Schedule of Investments.
Foreign Currency. Certain Funds may use foreign currency contracts to facilitate transactions in foreign-denominated securities. Gains and losses from these transactions may arise from changes in the value of the foreign currency or if the counterparties do not perform under the contracts' terms.
Foreign-denominated assets, including investment securities, and liabilities are translated into U.S. dollars at the exchange rates at period end. Purchases and sales of investment securities, income and dividends received, and expenses denominated in foreign currencies are translated into U.S. dollars at the exchange rate in effect on the transaction date.
The effects of exchange rate fluctuations on investments are included with the net realized and unrealized gain (loss) on investment securities. Other foreign currency transactions resulting in realized and unrealized gain (loss) are disclosed separately.
Investment Transactions and Income. For financial reporting purposes, the Fund's investment holdings and NAV include trades executed through the end of the last business day of the period. The NAV per share for processing shareholder transactions is calculated as of the close of business of the New York Stock Exchange (NYSE), normally 4:00 p.m. Eastern time and includes trades executed through the end of the prior business day. Gains and losses on securities sold are determined on the basis of identified cost. Dividend income is recorded on the ex-dividend date, except for certain dividends from foreign securities where the ex-dividend date may have passed, which are recorded as soon as the Fund is informed of the ex-dividend date. Non-cash dividends included in dividend income, if any, are recorded at the fair market value of the securities received. Income and capital gain distributions from Fidelity Central Funds, if any, are recorded on the ex-dividend date. Certain distributions received by the Fund represent a return of capital or capital gain. The Fund determines the components of these distributions subsequent to the ex-dividend date, based upon receipt of tax filings or other correspondence relating to the underlying investment. These distributions are recorded as a reduction of cost of investments and/or as a realized gain. Investment income is recorded net of foreign taxes withheld where recovery of such taxes is uncertain.
Expenses. Expenses directly attributable to a fund are charged to that fund. Expenses attributable to more than one fund are allocated among the respective funds on the basis of relative net assets or other appropriate methods. Expense estimates are accrued in the period to which they relate and adjustments are made when actual amounts are known.
Income Tax Information and Distributions to Shareholders. Each year, the Fund intends to qualify as a regulated investment company under Subchapter M of the Internal Revenue Code, including distributing substantially all of its taxable income and realized gains. As a result, no provision for U.S. Federal income taxes is required. As of October 31, 2020, the Fund did not have any unrecognized tax benefits in the financial statements; nor is the Fund aware of any tax positions for which it is reasonably possible that the total amounts of unrecognized tax benefits will significantly change in the next twelve months. The Fund files a U.S. federal tax return, in addition to state and local tax returns as required. The Fund's federal income tax returns are subject to examination by the Internal Revenue Service (IRS) for a period of three fiscal years after they are filed. State and local tax returns may be subject to examination for an additional fiscal year depending on the jurisdiction. Foreign taxes are provided for based on the Fund's understanding of the tax rules and rates that exist in the foreign markets in which it invests.
Distributions are declared and recorded on the ex-dividend date. Income and capital gain distributions are determined in accordance with income tax regulations, which may differ from GAAP. In addition, the Fund claimed a portion of the payment made to redeeming shareholders as a distribution for income tax purposes.
Capital accounts within the financial statements are adjusted for permanent book-tax differences. These adjustments have no impact on net assets or the results of operations. Capital accounts are not adjusted for temporary book-tax differences which will reverse in a subsequent period.
Book-tax differences are primarily due to foreign currency transactions, partnerships, capital loss carryforwards and losses deferred due to wash sales.
As of period end, the cost and unrealized appreciation (depreciation) in securities, and derivatives if applicable, for federal income tax purposes were as follows:
| Gross unrealized appreciation | $1,050,504 |
| Gross unrealized depreciation | (720,854) |
| Net unrealized appreciation (depreciation) | $329,650 |
| Tax Cost | $12,337,304 |
The tax-based components of distributable earnings as of period end were as follows:
| Undistributed ordinary income | $111,806 |
| Capital loss carryforward | $(828,078) |
| Net unrealized appreciation (depreciation) on securities and other investments | $329,789 |
Capital loss carryforwards are only available to offset future capital gains of the Fund to the extent provided by regulations and may be limited. The capital loss carryforward information presented below, including any applicable limitation, is estimated as of fiscal period end and is subject to adjustment.
| No expiration | |
| Short-term | $(828,078) |
The tax character of distributions paid was as follows:
| | October 31, 2020(a) |
| Ordinary Income | $9,940 |
(a) For the period November 5, 2019 (commencement of operations) to October 31, 2020.
Restricted Securities (including Private Placements). The Fund may invest in securities that are subject to legal or contractual restrictions on resale. These securities generally may be resold in transactions exempt from registration or to the public if the securities are registered. Disposal of these securities may involve time-consuming negotiations and expense, and prompt sale at an acceptable price may be difficult. Information regarding restricted securities is included at the end of the Fund's Schedule of Investments.
4. Purchases and Sales of Investments.
Purchases and sales of securities, other than short-term securities, are noted in the table below.
| | Purchases ($) | Sales ($) |
| Fidelity Infrastructure Fund | 16,952,771 | 4,431,974 |
5. Fees and Other Transactions with Affiliates.
Management Fee. Fidelity Management & Research Company LLC (the investment adviser) and its affiliates provide the Fund with investment management related services for which the Fund pays a monthly management fee. The management fee is the sum of an individual fund fee rate that is based on an annual rate of .45% of the Fund's average net assets and an annualized group fee rate that averaged .23% during the period. The group fee rate is based upon the monthly average net assets of a group of registered investment companies with which the investment adviser has management contracts. The group fee rate decreases as assets under management increase and increases as assets under management decrease. For the reporting period, the total annualized management fee rate was .68% of the Fund's average net assets.
Transfer Agent Fees. Fidelity Investments Institutional Operations Company LLC (FIIOC), an affiliate of the investment adviser, is the Fund's transfer, dividend disbursing and shareholder servicing agent. FIIOC receives account fees and asset-based fees that vary according to account size and type of account. FIIOC pays for typesetting, printing and mailing of shareholder reports, except proxy statements. For the period, the transfer agent fees were equivalent to an annualized rate of .26% of average net assets.
Accounting Fees. Fidelity Service Company, Inc. (FSC), an affiliate of the investment adviser, maintains the Fund's accounting records. The accounting fee is based on the level of average net assets for each month. For the period, the fees were equivalent to the following annualized rates:
| | % of Average Net Assets |
| Fidelity Infrastructure Fund | .04 |
Brokerage Commissions. A portion of portfolio transactions were placed with brokerage firms which are affiliates of the investment adviser. Brokerage commissions are included in net realized gain (loss) and change in net unrealized appreciation (depreciation) in the Statement of Operations. The commissions paid to these affiliated firms were as follows:
| | Amount |
| Fidelity Infrastructure Fund | $94 |
Interfund Trades. Funds may purchase from or sell securities to other Fidelity Funds under procedures adopted by the Board. The procedures have been designed to ensure these interfund trades are executed in accordance with Rule 17a-7 of the 1940 Act. Interfund trades are included within the respective purchases and sales amounts shown in the Purchases and Sales of Investments note.
6. Committed Line of Credit.
Certain Funds participate with other funds managed by the investment adviser or an affiliate in a $4.25 billion credit facility (the "line of credit") to be utilized for temporary or emergency purposes to fund shareholder redemptions or for other short-term liquidity purposes. The participating funds have agreed to pay commitment fees on their pro-rata portion of the line of credit, which are reflected in Miscellaneous expenses on the Statement of Operations, and are as follows:
| | Amount |
| Fidelity Infrastructure Fund | $13 |
During the period, there were no borrowings on this line of credit.
7. Expense Reductions.
The investment adviser contractually agreed to reimburse the Fund to the extent annual operating expenses exceeded 1.00% of average net assets. This reimbursement will remain in place through February 28, 2022. Some expenses, for example the compensation of the independent Trustees, and certain miscellaneous expenses such as proxy and shareholder meeting expenses, are excluded from this reimbursement. During the period this reimbursement reduced the Fund's expenses by $111,251.
Commissions paid to certain brokers with whom the investment adviser, or its affiliates, places trades on behalf of the Fund include an amount in addition to trade execution, which may be rebated back to the Fund to offset certain expenses. This amount totaled $1,512 for the period. In addition, through arrangements with the Fund's custodian, credits realized as a result of certain uninvested cash balances were used to reduce the Fund's expenses by $28.
In addition, during the period the investment adviser or an affiliate reimbursed and/or waived a portion of operating expenses in the amount of $11.
8. Other.
The Fund's organizational documents provide former and current trustees and officers with a limited indemnification against liabilities arising in connection with the performance of their duties to the Fund. In the normal course of business, the Fund may also enter into contracts that provide general indemnifications. The Fund's maximum exposure under these arrangements is unknown as this would be dependent on future claims that may be made against the Fund. The risk of material loss from such claims is considered remote.
9. Coronavirus (COVID-19) Pandemic.
An outbreak of COVID-19 first detected in China during December 2019 has since spread globally and was declared a pandemic by the World Health Organization during March 2020. Developments that disrupt global economies and financial markets, such as the COVID-19 pandemic, may magnify factors that affect the Fund's performance.
Report of Independent Registered Public Accounting Firm
To the Board of Trustees of Fidelity Investment Trust and Shareholders of Fidelity Infrastructure Fund
Opinion on the Financial Statements
We have audited the accompanying statement of assets and liabilities, including the schedule of investments, of Fidelity Infrastructure Fund (one of the funds constituting Fidelity Investment Trust, referred to hereafter as the “Fund”) as of October 31, 2020, and the related statements of operations and changes in net assets, including the related notes, and the financial highlights for the period November 5, 2019 (commencement of operations) through October 31, 2020 (collectively referred to as the “financial statements”). In our opinion, the financial statements present fairly, in all material respects, the financial position of the Fund as of October 31, 2020, and the results of its operations, changes in its net assets, and the financial highlights for the period November 5, 2019 (commencement of operations) through October 31, 2020 in conformity with accounting principles generally accepted in the United States of America.
Basis for Opinion
These financial statements are the responsibility of the Fund’s management. Our responsibility is to express an opinion on the Fund’s financial statements based on our audit. We are a public accounting firm registered with the Public Company Accounting Oversight Board (United States) (PCAOB) and are required to be independent with respect to the Fund in accordance with the U.S. federal securities laws and the applicable rules and regulations of the Securities and Exchange Commission and the PCAOB.
We conducted our audit of these financial statements in accordance with the standards of the PCAOB. Those standards require that we plan and perform the audit to obtain reasonable assurance about whether the financial statements are free of material misstatement, whether due to error or fraud.
Our audit included performing procedures to assess the risks of material misstatement of the financial statements, whether due to error or fraud, and performing procedures that respond to those risks. Such procedures included examining, on a test basis, evidence regarding the amounts and disclosures in the financial statements. Our audit also included evaluating the accounting principles used and significant estimates made by management, as well as evaluating the overall presentation of the financial statements. Our procedures included confirmation of securities owned as of October 31, 2020 by correspondence with the custodian. We believe that our audit provides a reasonable basis for our opinion.
/s/ PricewaterhouseCoopers LLP
Boston, Massachusetts
December 15, 2020
We have served as the auditor of one or more investment companies in the Fidelity group of funds since 1932.
Trustees and Officers
The Trustees, Members of the Advisory Board (if any), and officers of the trust and fund, as applicable, are listed below. The Board of Trustees governs the fund and is responsible for protecting the interests of shareholders. The Trustees are experienced executives who meet periodically throughout the year to oversee the fund's activities, review contractual arrangements with companies that provide services to the fund, oversee management of the risks associated with such activities and contractual arrangements, and review the fund's performance. Except for Jonathan Chiel, each of the Trustees oversees 305 funds. Mr. Chiel oversees 176 funds.
The Trustees hold office without limit in time except that (a) any Trustee may resign; (b) any Trustee may be removed by written instrument, signed by at least two-thirds of the number of Trustees prior to such removal; (c) any Trustee who requests to be retired or who has become incapacitated by illness or injury may be retired by written instrument signed by a majority of the other Trustees; and (d) any Trustee may be removed at any special meeting of shareholders by a two-thirds vote of the outstanding voting securities of the trust. Each Trustee who is not an interested person (as defined in the 1940 Act) of the trust and the fund is referred to herein as an Independent Trustee. Each Independent Trustee shall retire not later than the last day of the calendar year in which his or her 75th birthday occurs. The Independent Trustees may waive this mandatory retirement age policy with respect to individual Trustees. Officers and Advisory Board Members hold office without limit in time, except that any officer or Advisory Board Member may resign or may be removed by a vote of a majority of the Trustees at any regular meeting or any special meeting of the Trustees. Except as indicated, each individual has held the office shown or other offices in the same company for the past five years.
The fund’s Statement of Additional Information (SAI) includes more information about the Trustees. To request a free copy, call Fidelity at 1-800-544-8544.
Experience, Skills, Attributes, and Qualifications of the Trustees. The Governance and Nominating Committee has adopted a statement of policy that describes the experience, qualifications, attributes, and skills that are necessary and desirable for potential Independent Trustee candidates (Statement of Policy). The Board believes that each Trustee satisfied at the time he or she was initially elected or appointed a Trustee, and continues to satisfy, the standards contemplated by the Statement of Policy. The Governance and Nominating Committee also engages professional search firms to help identify potential Independent Trustee candidates who have the experience, qualifications, attributes, and skills consistent with the Statement of Policy. From time to time, additional criteria based on the composition and skills of the current Independent Trustees, as well as experience or skills that may be appropriate in light of future changes to board composition, business conditions, and regulatory or other developments, have also been considered by the professional search firms and the Governance and Nominating Committee. In addition, the Board takes into account the Trustees' commitment and participation in Board and committee meetings, as well as their leadership of standing and ad hoc committees throughout their tenure.
In determining that a particular Trustee was and continues to be qualified to serve as a Trustee, the Board has considered a variety of criteria, none of which, in isolation, was controlling. The Board believes that, collectively, the Trustees have balanced and diverse experience, qualifications, attributes, and skills, which allow the Board to operate effectively in governing the fund and protecting the interests of shareholders. Information about the specific experience, skills, attributes, and qualifications of each Trustee, which in each case led to the Board's conclusion that the Trustee should serve (or continue to serve) as a trustee of the fund, is provided below.
Board Structure and Oversight Function. Robert A. Lawrence is an interested person and currently serves as Acting Chairman. The Trustees have determined that an interested Chairman is appropriate and benefits shareholders because an interested Chairman has a personal and professional stake in the quality and continuity of services provided to the fund. Independent Trustees exercise their informed business judgment to appoint an individual of their choosing to serve as Chairman, regardless of whether the Trustee happens to be independent or a member of management. The Independent Trustees have determined that they can act independently and effectively without having an Independent Trustee serve as Chairman and that a key structural component for assuring that they are in a position to do so is for the Independent Trustees to constitute a substantial majority for the Board. The Independent Trustees also regularly meet in executive session. Ned C. Lautenbach and David M. Thomas serve as Co-Lead Independent Trustees and as such each (i) acts as a liaison between the Independent Trustees and management with respect to matters important to the Independent Trustees and (ii) with management prepares agendas for Board meetings.
Fidelity® funds are overseen by different Boards of Trustees. The fund's Board oversees Fidelity's high income and certain equity funds, and other Boards oversee Fidelity's investment-grade bond, money market, asset allocation, and other equity funds. The asset allocation funds may invest in Fidelity® funds overseen by the fund's Board. The use of separate Boards, each with its own committee structure, allows the Trustees of each group of Fidelity® funds to focus on the unique issues of the funds they oversee, including common research, investment, and operational issues. On occasion, the separate Boards establish joint committees to address issues of overlapping consequences for the Fidelity® funds overseen by each Board.
The Trustees operate using a system of committees to facilitate the timely and efficient consideration of all matters of importance to the Trustees, the fund, and fund shareholders and to facilitate compliance with legal and regulatory requirements and oversight of the fund's activities and associated risks. The Board, acting through its committees, has charged FMR and its affiliates with (i) identifying events or circumstances the occurrence of which could have demonstrably adverse effects on the fund's business and/or reputation; (ii) implementing processes and controls to lessen the possibility that such events or circumstances occur or to mitigate the effects of such events or circumstances if they do occur; and (iii) creating and maintaining a system designed to evaluate continuously business and market conditions in order to facilitate the identification and implementation processes described in (i) and (ii) above. Because the day-to-day operations and activities of the fund are carried out by or through FMR, its affiliates, and other service providers, the fund's exposure to risks is mitigated but not eliminated by the processes overseen by the Trustees. While each of the Board's committees has responsibility for overseeing different aspects of the fund's activities, oversight is exercised primarily through the Operations, Audit, and Compliance Committees. Appropriate personnel, including but not limited to the fund's Chief Compliance Officer (CCO), FMR's internal auditor, the independent accountants, the fund's Treasurer and portfolio management personnel, make periodic reports to the Board's committees, as appropriate, including an annual review of Fidelity's risk management program for the Fidelity® funds. The responsibilities of each standing committee, including their oversight responsibilities, are described further under "Standing Committees of the Trustees."
Interested Trustees*:
Correspondence intended for a Trustee who is an interested person may be sent to Fidelity Investments, 245 Summer Street, Boston, Massachusetts 02210.
Name, Year of Birth; Principal Occupations and Other Relevant Experience+
Jonathan Chiel (1957)
Year of Election or Appointment: 2016
Trustee
Mr. Chiel also serves as Trustee of other Fidelity® funds. Mr. Chiel is Executive Vice President and General Counsel for FMR LLC (diversified financial services company, 2012-present). Previously, Mr. Chiel served as general counsel (2004-2012) and senior vice president and deputy general counsel (2000-2004) for John Hancock Financial Services; a partner with Choate, Hall & Stewart (1996-2000) (law firm); and an Assistant United States Attorney for the United States Attorney’s Office of the District of Massachusetts (1986-95), including Chief of the Criminal Division (1993-1995). Mr. Chiel is a director on the boards of the Boston Bar Foundation and the Maimonides School.
Robert A. Lawrence (1952)
Year of Election or Appointment: 2020
Trustee
Acting Chairman of the Board of Trustees
Mr. Lawrence also serves as Trustee of other funds. Previously, Mr. Lawrence served as a Member of the Advisory Board of certain funds. Prior to his retirement in 2008, Mr. Lawrence served as Vice President of certain Fidelity® funds (2006-2008), Senior Vice President, Head of High Income Division of Fidelity Management & Research Company (investment adviser firm, 2006-2008), and President of Fidelity Strategic Investments (investment adviser firm, 2002-2005).
* Determined to be an “Interested Trustee” by virtue of, among other things, his or her affiliation with the trust or various entities under common control with FMR.
+ The information includes the Trustee's principal occupation during the last five years and other information relating to the experience, attributes, and skills relevant to the Trustee's qualifications to serve as a Trustee, which led to the conclusion that the Trustee should serve as a Trustee for the fund.
Independent Trustees:
Correspondence intended for an Independent Trustee may be sent to Fidelity Investments, P.O. Box 55235, Boston, Massachusetts 02205-5235.
Name, Year of Birth; Principal Occupations and Other Relevant Experience+
Dennis J. Dirks (1948)
Year of Election or Appointment: 2005
Trustee
Mr. Dirks also serves as Trustee of other Fidelity® funds. Prior to his retirement in May 2003, Mr. Dirks served as Chief Operating Officer and as a member of the Board of The Depository Trust & Clearing Corporation (financial markets infrastructure), President, Chief Operating Officer and a member of the Board of The Depository Trust Company (DTC), President and a member of the Board of the National Securities Clearing Corporation (NSCC), Chief Executive Officer and a member of the Board of the Government Securities Clearing Corporation and Chief Executive Officer and a member of the Board of the Mortgage-Backed Securities Clearing Corporation. Mr. Dirks currently serves as a member of the Finance Committee (2016-present) and Board (2017-present) and is Treasurer (2018-present) of the Asolo Repertory Theatre.
Donald F. Donahue (1950)
Year of Election or Appointment: 2018
Trustee
Mr. Donahue also serves as Trustee of other Fidelity® funds. Mr. Donahue serves as President and Chief Executive Officer of Miranda Partners, LLC (risk consulting for the financial services industry, 2012-present). Previously, Mr. Donahue served as Chief Executive Officer (2006-2012), Chief Operating Officer (2003-2006) and Managing Director, Customer Marketing and Development (1999-2003) of The Depository Trust & Clearing Corporation (financial markets infrastructure). Mr. Donahue currently serves as a member (2007-present) and Co-Chairman (2016-present) of the Board of United Way of New York, a member of the Board of NYC Leadership Academy (2012-present) and a member of the Board of Advisors of Ripple Labs, Inc. (financial services, 2015-present). Mr. Donahue previously served as a member of the Advisory Board of certain Fidelity® funds (2015-2018).
Vicki L. Fuller (1957)
Year of Election or Appointment: 2020
Trustee
Ms. Fuller also serves as Trustee of other Fidelity® funds. Previously, Ms. Fuller served as a member of the Advisory Board of certain Fidelity® funds (2018-2020), Chief Investment Officer of the New York State Common Retirement Fund (2012-2018) and held a variety of positions at AllianceBernstein L.P. (global asset management, 1985-2012), including Managing Director (2006-2012) and Senior Vice President and Senior Portfolio Manager (2001-2006). Ms. Fuller currently serves as a member of the Board, Audit Committee and Nominating and Governance Committee of The Williams Companies, Inc. (natural gas infrastructure, 2018-present), as a member of the Board, Audit Committee and Nominating and Governance Committee of two Blackstone business development companies (2020-present) and as a member of the Board of Treliant, LLC (consulting, 2019-present).
Patricia L. Kampling (1959)
Year of Election or Appointment: 2020
Trustee
Ms. Kampling also serves as Trustee of other Fidelity® funds. Prior to her retirement, Ms. Kampling served as Chairman of the Board and Chief Executive Officer (2012-2019), President and Chief Operating Officer (2011-2012) and Executive Vice President and Chief Financial Officer (2010-2011) of Alliant Energy Corporation. Ms. Kampling currently serves as a member of the Board, Compensation Committee and Executive Committee and as Chair of the Audit Committee of Briggs & Stratton Corporation (manufacturing, 2011-present) and as a member of the Board, Audit, Finance and Risk Committee and Safety, Environmental, Technology and Operations Committee of American Water Works Company, Inc. (utilities company, 2019-present). In addition, Ms. Kampling currently serves as a member of the Board of the Nature Conservancy, Wisconsin Chapter (2019-present). Previously, Ms. Kampling served as a Member of the Advisory Board of certain Fidelity® funds (2020), a member of the Board of Interstate Power and Light Company (2012-2019) and Wisconsin Power and Light Company (2012-2019) (each a subsidiary of Alliant Energy Corporation) and as a member of the Board and Workforce Development Committee of the Business Roundtable (2018-2019).
Alan J. Lacy (1953)
Year of Election or Appointment: 2008
Trustee
Mr. Lacy also serves as Trustee of other Fidelity® funds. Previously, Mr. Lacy served as Senior Adviser (2007-2014) of Oak Hill Capital Partners, L.P. (private equity), Chief Executive Officer (2005) and Vice Chairman (2005-2006) of Sears Holdings Corporation (retail), Chief Executive Officer and Chairman of the Board of Sears, Roebuck and Co. (retail, 2000-2005), Chairman (2014-2017) and a member of the Board (2010-2017) of Dave & Buster’s Entertainment, Inc. (restaurant and entertainment complexes) and a member of the Board of Bristol-Myers Squibb Company (global pharmaceuticals, 2008-2020). Mr. Lacy currently serves as a Trustee of the California Chapter of The Nature Conservancy (2015-present) and a member of the Board of the Center for Advanced Study in the Behavioral Sciences at Stanford University (2015-present).
Ned C. Lautenbach (1944)
Year of Election or Appointment: 2000
Trustee
Co-Lead Independent Trustee
Mr. Lautenbach also serves as Trustee of other Fidelity® funds. Mr. Lautenbach currently serves as Chair of the Board of Governors, State University System of Florida (2013-present) and is a member of the Council on Foreign Relations (1994-present). He is also a member and has in the past served as Chairman of the Board of Directors of Artis-Naples (2012-present). Previously, Mr. Lautenbach served as a member and then Lead Director of the Board of Directors of Eaton Corporation (diversified industrial, 1997-2016). He was also a Partner at Clayton, Dubilier & Rice, LLC (private equity investment, 1998-2010); as well as Director of Sony Corporation (2006-2007). In addition, Mr. Lautenbach had a 30-year career with IBM (technology company), during which time he served as Senior Vice President and as a member of the Corporate Executive Committee (1968-1998).
Joseph Mauriello (1944)
Year of Election or Appointment: 2008
Trustee
Mr. Mauriello also serves as Trustee of other Fidelity® funds. Prior to his retirement in January 2006, Mr. Mauriello served in numerous senior management positions including Deputy Chairman and Chief Operating Officer (2004-2005), and Vice Chairman of Financial Services (2002-2004) of KPMG LLP US (professional services, 1965-2005). Mr. Mauriello currently serves as a member of the Independent Directors Council Governing Council (2015-present). Previously, Mr. Mauriello served as a member of the Board of XL Group plc. (global insurance and re-insurance, 2006-2018).
Cornelia M. Small (1944)
Year of Election or Appointment: 2005
Trustee
Ms. Small also serves as Trustee of other Fidelity® funds. Previously, Ms. Small served as Chief Investment Officer, Director of Global Equity Investments and a member of Scudder, Stevens & Clark and Scudder Kemper Investments. Ms. Small previously served as a member of the Board (2009-2019) and Chair of the Investment Committee (2010-2019) of the Teagle Foundation and a member of the Investment Committee of the Berkshire Taconic Community Foundation (2008-2019).
Garnett A. Smith (1947)
Year of Election or Appointment: 2018
Trustee
Mr. Smith also serves as Trustee of other Fidelity® funds. Prior to his retirement, Mr. Smith served as Chairman and Chief Executive Officer (1990-1997) and President (1986-1990) of Inbrand Corp. (manufacturer of personal absorbent products). Prior to his employment with Inbrand Corp., he was employed by a retail fabric chain and North Carolina National Bank (now Bank of America). Mr. Smith previously served as a member of the Advisory Board of certain Fidelity® funds (2012-2013).
David M. Thomas (1949)
Year of Election or Appointment: 2008
Trustee
Co-Lead Independent Trustee
Mr. Thomas also serves as Trustee of other Fidelity® funds. Previously, Mr. Thomas served as Executive Chairman (2005-2006) and Chairman and Chief Executive Officer (2000-2005) of IMS Health, Inc. (pharmaceutical and healthcare information solutions). Mr. Thomas currently serves as Non-Executive Chairman of the Board of Fortune Brands Home and Security (home and security products, 2011-present), and a member of the Board (2004-present) and Presiding Director (2013-present) of Interpublic Group of Companies, Inc. (marketing communication).
Susan Tomasky (1953)
Year of Election or Appointment: 2020
Trustee
Ms. Tomasky also serves as Trustee of other Fidelity® funds. Prior to her retirement, Ms. Tomasky served in various executive officer positions at American Electric Power Company, Inc. (1998-2011), including most recently as President of AEP Transmission (2007-2011). Ms. Tomasky currently serves as a member of the Board and Sustainability Committee and as Chair of the Audit Committee of Marathon Petroleum Corporation (2018-present) and as a member of the Board, Corporate Governance Committee and Organization and Compensation Committee and as Chair of the Audit Committee of Public Service Enterprise Group, Inc. (utilities company, 2012-present). In addition, Ms. Tomasky currently serves as a member of the Board of the Columbus Regional Airport Authority (2007-present), as a member of the Board of the Royal Shakespeare Company – America (2009-present), as a member of the Board of the Columbus Association for the Performing Arts (2011-present) and as a member of the Board of Kenyon College (2016-present). Previously, Ms. Tomasky served as a Member of the Advisory Board of certain Fidelity® funds (2020), a member of the Board (2011-2019) and as Lead Independent Director (2015-2018) of Andeavor Corporation (previously Tesoro Corporation) (independent oil refiner and marketer) and as a member of the Board of Summit Midstream Partners LP (energy, 2012-2018).
Michael E. Wiley (1950)
Year of Election or Appointment: 2020
Trustee
Mr. Wiley also serves as Trustee of other Fidelity® funds. Previously, Mr. Wiley served as a member of the Advisory Board of certain Fidelity® funds (2018-2020), Chairman, President and CEO of Baker Hughes, Inc. (oilfield services, 2000-2004). Mr. Wiley also previously served as a member of the Board of Andeavor Corporation (independent oil refiner and marketer, 2005-2018), a member of the Board of Andeavor Logistics LP (natural resources logistics, 2015-2018) and a member of the Board of High Point Resources (exploration and production, 2005-2020).
+ The information includes the Trustee's principal occupation during the last five years and other information relating to the experience, attributes, and skills relevant to the Trustee's qualifications to serve as a Trustee, which led to the conclusion that the Trustee should serve as a Trustee for the fund.
Advisory Board Members and Officers:
Correspondence intended for a Member of the Advisory Board (if any) may be sent to Fidelity Investments, P.O. Box 55235, Boston, Massachusetts 02205-5235. Correspondence intended for an officer or Peter S. Lynch may be sent to Fidelity Investments, 245 Summer Street, Boston, Massachusetts 02210. Officers appear below in alphabetical order.
Name, Year of Birth; Principal Occupation
Lloyd James Austin, III (1953)
Year of Election or Appointment: 2020
Member of the Advisory Board
General Austin also serves as a Member of the Advisory Board of other Fidelity® funds. Prior to his retirement, General Austin (United States Army, Retired) held a variety of positions within the U.S. Government, including Commander, U.S. Central Command (2013-2016), Vice Chief of Staff, U.S. Army (2012-2013) and Commanding General, U.S. Forces – Iraq, Operation New Dawn (2010-2012). General Austin currently serves as a Partner of Pine Island Capital Partners (private equity, 2020-present) and as President of the Austin Strategy Group LLC (consulting, 2016-present). General Austin serves as a member of the Board of Directors of Nucor Corporation (steel products, 2017-present), as a member of the Board of Directors of Tenet Healthcare Corporation (2018-present) and as a member of the Board of Directors of Raytheon Technologies Corporation (aerospace and defense, 2020-present). In addition, General Austin currently serves as a member of the Board of Trustees of the Carnegie Corporation of New York (2017-present) and as a member of the Board of Trustees of Auburn University (2017-present). Previously, General Austin served as a member of the Board of Directors of United Technologies Corporation (aerospace, defense and building, 2016-2020).
Thomas A. Kennedy (1955)
Year of Election or Appointment: 2020
Member of the Advisory Board
Mr. Kennedy also serves as a Member of the Advisory Board of other Fidelity® funds. Previously, Mr. Kennedy held a variety of positions at Raytheon Company (aerospace and defense, 1983-2020), including Chairman and Chief Executive Officer (2014-2020) and Executive Vice President and Chief Operating Officer (2013-2014). Mr. Kennedy currently serves as Executive Chairman of the Board of Directors of Raytheon Technologies Corporation (aerospace and defense, 2020-present). He is also a member of the Rutgers School of Engineering Industry Advisory Board (2011-present) and a member of the UCLA Engineering Dean’s Executive Board (2016-present).
Peter S. Lynch (1944)
Year of Election or Appointment: 2003
Member of the Advisory Board
Mr. Lynch also serves as a Member of the Advisory Board of other Fidelity® funds. Mr. Lynch is Vice Chairman and a Director of Fidelity Management & Research Company LLC (investment adviser firm). In addition, Mr. Lynch serves as a Trustee of Boston College and as the Chairman of the Inner-City Scholarship Fund. Previously, Mr. Lynch served as Vice Chairman and a Director of FMR Co., Inc. (investment adviser firm) and on the Special Olympics International Board of Directors (1997-2006).
Elizabeth Paige Baumann (1968)
Year of Election or Appointment: 2017
Anti-Money Laundering (AML) Officer
Ms. Baumann also serves as AML Officer of other funds. She is Chief AML Officer (2012-present) and Senior Vice President (2014-present) of FMR LLC (diversified financial services company) and is an employee of Fidelity Investments. Previously, Ms. Baumann served as AML Officer of certain funds (2017-2019), as AML Officer of the funds (2012-2016), and Vice President (2007-2014) and Deputy Anti-Money Laundering Officer (2007-2012) of FMR LLC.
Craig S. Brown (1977)
Year of Election or Appointment: 2019
Assistant Treasurer
Mr. Brown also serves as Assistant Treasurer of other funds. Mr. Brown is an employee of Fidelity Investments (2013-present).
John J. Burke III (1964)
Year of Election or Appointment: 2018
Chief Financial Officer
Mr. Burke also serves as Chief Financial Officer of other funds. Mr. Burke serves as Head of Investment Operations for Fidelity Fund and Investment Operations (2018-present) and is an employee of Fidelity Investments (1998-present). Previously Mr. Burke served as head of Asset Management Investment Operations (2012-2018).
William C. Coffey (1969)
Year of Election or Appointment: 2019
Assistant Secretary
Mr. Coffey also serves as Assistant Secretary of other funds. He is Senior Vice President and Deputy General Counsel of FMR LLC (diversified financial services company, 2010-present), and is an employee of Fidelity Investments. Previously, Mr. Coffey served as Secretary and CLO of certain funds (2018-2019); CLO, Secretary, and Senior Vice President of Fidelity Management & Research Company and FMR Co., Inc. (investment adviser firms, 2018-2019); Secretary of Fidelity SelectCo, LLC and Fidelity Investments Money Management, Inc. (investment adviser firms, 2018-2019); CLO of Fidelity Management & Research (Hong Kong) Limited, FMR Investment Management (UK) Limited, and Fidelity Management & Research (Japan) Limited (investment adviser firms, 2018-2019); and Assistant Secretary of certain funds (2009-2018).
Timothy M. Cohen (1969)
Year of Election or Appointment: 2018
Vice President
Mr. Cohen also serves as Vice President of other funds. Mr. Cohen serves as Co-Head of Equity (2018-present), a Director of Fidelity Management & Research (Japan) Limited (investment adviser firm, 2016-present), and is an employee of Fidelity Investments. Previously, Mr. Cohen served as Executive Vice President of Fidelity SelectCo, LLC (2019), Head of Global Equity Research (2016-2018), Chief Investment Officer - Equity and a Director of Fidelity Management & Research (U.K.) Inc. (investment adviser firm, 2013-2015) and as a Director of Fidelity Management & Research (Hong Kong) Limited (investment adviser firm, 2017).
Jonathan Davis (1968)
Year of Election or Appointment: 2010
Assistant Treasurer
Mr. Davis also serves as Assistant Treasurer of other funds. Mr. Davis serves as Assistant Treasurer of FMR Capital, Inc. (2017-present) and is an employee of Fidelity Investments. Previously, Mr. Davis served as Vice President and Associate General Counsel of FMR LLC (diversified financial services company, 2003-2010).
Laura M. Del Prato (1964)
Year of Election or Appointment: 2018
Assistant Treasurer
Ms. Del Prato also serves as an officer of other funds. Ms. Del Prato is an employee of Fidelity Investments (2017-present). Previously, Ms. Del Prato served as President and Treasurer of The North Carolina Capital Management Trust: Cash Portfolio and Term Portfolio (2018-2020). Prior to joining Fidelity Investments, Ms. Del Prato served as a Managing Director and Treasurer of the JPMorgan Mutual Funds (2014-2017). Prior to JPMorgan, Ms. Del Prato served as a partner at Cohen Fund Audit Services (accounting firm, 2012-2013) and KPMG LLP (accounting firm, 2004-2012).
Colm A. Hogan (1973)
Year of Election or Appointment: 2020
Assistant Treasurer
Mr. Hogan also serves as an officer of other funds. Mr. Hogan serves as Assistant Treasurer of FMR Capital, Inc. (2017-present) and is an employee of Fidelity Investments (2005-present). Previously, Mr. Hogan served as Deputy Treasurer of certain Fidelity® funds (2016-2020) and Assistant Treasurer of certain Fidelity® funds (2016-2018).
Pamela R. Holding (1964)
Year of Election or Appointment: 2018
Vice President
Ms. Holding also serves as Vice President of other funds. Ms. Holding serves as Co-Head of Equity (2018-present) and is an employee of Fidelity Investments (2013-present). Previously, Ms. Holding served as Executive Vice President of Fidelity SelectCo, LLC (2019) and as Chief Investment Officer of Fidelity Institutional Asset Management (2013-2018).
Cynthia Lo Bessette (1969)
Year of Election or Appointment: 2019
Secretary and Chief Legal Officer (CLO)
Ms. Lo Bessette also serves as an officer of other funds. Ms. Lo Bessette serves as CLO, Secretary, and Senior Vice President of Fidelity Management & Research Company LLC (investment adviser firm, 2019-present); and CLO of Fidelity Management & Research (Hong Kong) Limited, FMR Investment Management (UK) Limited, and Fidelity Management & Research (Japan) Limited (investment adviser firms, 2019-present). She is a Senior Vice President and Deputy General Counsel of FMR LLC (diversified financial services company, 2019-present), and is an employee of Fidelity Investments. Previously, Ms. Lo Bessette served as CLO, Secretary, and Senior Vice President of FMR Co., Inc. (investment adviser firm, 2019); Secretary of Fidelity SelectCo, LLC and Fidelity Investments Money Management, Inc. (investment adviser firms, 2019). Prior to joining Fidelity Investments, Ms. Lo Bessette was Executive Vice President, General Counsel (2016-2019) and Senior Vice President, Deputy General Counsel (2015-2016) of OppenheimerFunds (investment management company) and Deputy Chief Legal Officer (2013-2015) of Jennison Associates LLC (investment adviser firm).
Chris Maher (1972)
Year of Election or Appointment: 2020
Deputy Treasurer
Mr. Maher also serves as an officer of other funds. Mr. Maher serves as Assistant Treasurer of FMR Capital, Inc. (2017-present), and is an employee of Fidelity Investments (2008-present). Previously, Mr. Maher served as Assistant Treasurer of certain funds (2013-2020); Vice President of Asset Management Compliance (2013), Vice President of the Program Management Group of FMR (investment adviser firm, 2010-2013), and Vice President of Valuation Oversight (2008-2010).
Jason P. Pogorelec (1975)
Year of Election or Appointment: 2020
Chief Compliance Officer
Mr. Pogorelec also serves as Chief Compliance Officer of other funds. Mr. Pogorelec is a senior Vice President of Asset Management Compliance for Fidelity Investments and is an employee of Fidelity Investments (2006-present). Previously, Mr. Pogorelec served as Vice President, Associate General Counsel for Fidelity Investments (2010-2020) and Assistant Secretary of certain Fidelity funds (2015-2020).
Stacie M. Smith (1974)
Year of Election or Appointment: 2016
President and Treasurer
Ms. Smith also serves as an officer of other funds. Ms. Smith serves as Assistant Treasurer of FMR Capital, Inc. (2017-present), is an employee of Fidelity Investments (2009-present), and has served in other fund officer roles. Prior to joining Fidelity Investments, Ms. Smith served as Senior Audit Manager of Ernst & Young LLP (accounting firm, 1996-2009). Previously, Ms. Smith served as Assistant Treasurer (2013-2019) and Deputy Treasurer (2013-2016) of certain Fidelity® funds.
Marc L. Spector (1972)
Year of Election or Appointment: 2016
Assistant Treasurer
Mr. Spector also serves as an officer of other funds. Mr. Spector serves as Assistant Treasurer of FMR Capital, Inc. (2017-present) and is an employee of Fidelity Investments (2016-present). Prior to joining Fidelity Investments, Mr. Spector served as Director at the Siegfried Group (accounting firm, 2013-2016), and prior to Siegfried Group as audit senior manager at Deloitte & Touche LLP (accounting firm, 2005-2013).
Jim Wegmann (1979)
Year of Election or Appointment: 2019
Assistant Treasurer
Mr. Wegmann also serves as Assistant Treasurer of other funds. Mr. Wegmann is an employee of Fidelity Investments (2011-present).
Shareholder Expense Example
As a shareholder, you incur two types of costs: (1) transaction costs, which may include sales charges (loads) on purchase payments or redemption proceeds, as applicable and (2) ongoing costs, which generally include management fees, distribution and/or service (12b-1) fees and other Fund expenses. This Example is intended to help you understand your ongoing costs (in dollars) of investing in a fund and to compare these costs with the ongoing costs of investing in other mutual funds.
The Example is based on an investment of $1,000 invested at the beginning of the period and held for the entire period (May 1, 2020 to October 31, 2020).
Actual Expenses
The first line of the accompanying table provides information about actual account values and actual expenses. You may use the information in this line, together with the amount you invested, to estimate the expenses that you paid over the period. Simply divide your account value by $1,000.00 (for example, an $8,600 account value divided by $1,000.00 = 8.6), then multiply the result by the number in the first line for a class/Fund under the heading entitled "Expenses Paid During Period" to estimate the expenses you paid on your account during this period. If any fund is a shareholder of any underlying mutual funds or exchange-traded funds (ETFs) (the Underlying Funds), such fund indirectly bears its proportional share of the expenses of the Underlying Funds in addition to the direct expenses incurred presented in the table. These fees and expenses are not included in the annualized expense ratio used to calculate the expense estimate in the table below.
Hypothetical Example for Comparison Purposes
The second line of the accompanying table provides information about hypothetical account values and hypothetical expenses based on the actual expense ratio and an assumed rate of return of 5% per year before expenses, which is not the actual return. The hypothetical account values and expenses may not be used to estimate the actual ending account balance or expenses you paid for the period. You may use this information to compare the ongoing costs of investing in the Fund and other funds. To do so, compare this 5% hypothetical example with the 5% hypothetical examples that appear in the shareholder reports of the other funds. If any fund is a shareholder of any Underlying Funds, such fund indirectly bears its proportional share of the expenses of the Underlying Funds in addition to the direct expenses as presented in the table. These fees and expenses are not included in the annualized expense ratio used to calculate the expense estimate in the table below.
Please note that the expenses shown in the table are meant to highlight your ongoing costs only and do not reflect any transaction costs. Therefore, the second line of the table is useful in comparing ongoing costs only, and will not help you determine the relative total costs of owning different funds.
| | Annualized Expense Ratio-A | Beginning
Account Value
May 1, 2020 | Ending
Account Value
October 31, 2020 | Expenses Paid
During Period-B
May 1, 2020
to October 31, 2020 |
| Fidelity Infrastructure Fund | 1.00% | | | |
| Actual | | $1,000.00 | $1,108.30 | $5.30 |
| Hypothetical-C | | $1,000.00 | $1,020.11 | $5.08 |
A Annualized expense ratio reflects expenses net of applicable fee waivers.
B Expenses are equal to the annualized expense ratio, multiplied by the average account value over the period, multiplied by 184/ 366 (to reflect the one-half year period). The fees and expenses of any Underlying Funds are not included in each annualized expense ratio.
C 5% return per year before expenses
Distributions (Unaudited)
The fund designates 20% of the dividend distributed during the fiscal year as qualifying for the dividends–received deduction for corporate shareholders.
The fund designates 89% of the dividend distributed in December during the fiscal year as amounts which may be taken into account as a dividend for the purposes of the maximum rate under section 1(h)(11) of the Internal Revenue Code.
The fund designates 12% of the dividend distributed during the fiscal year as a section 199A dividend.
The fund will notify shareholders in January 2021 of amounts for use in preparing 2020 income tax returns.
Proxy Voting Results
A special meeting of shareholders was held on June 9, 2020. The results of votes taken among shareholders on the proposal before them are reported below. Each vote reported represents one dollar of net asset value held on the record date for the meeting.
PROPOSAL 1
To elect a Board of Trustees.
| | # of
Votes | % of
Votes |
| Dennis J. Dirks |
| Affirmative | 91,643,443,973.030 | 98.167 |
| Withheld | 1,711,119,384.419 | 1.833 |
| TOTAL | 93,354,563,357.449 | 100.000 |
| Donald F. Donahue |
| Affirmative | 91,659,003,496.045 | 98.184 |
| Withheld | 1,695,559,852.789 | 1.816 |
| TOTAL | 93,354,563,357.449 | 100.000 |
| Bettina Doulton |
| Affirmative | 91,774,146,516.145 | 98.307 |
| Withheld | 1,580,416,862.377 | 1.693 |
| TOTAL | 93,354,563,357.449 | 100.000 |
| Vicki L. Fuller |
| Affirmative | 91,845,419,368.993 | 98.383 |
| Withheld | 1,509,143,998.591 | 1.617 |
| TOTAL | 93,354,563,357.449 | 100.00 |
| Patricia L. Kampling |
| Affirmative | 91,723,732,274.457 | 98.253 |
| Withheld | 1,630,831,098.411 | 1.747 |
| TOTAL | 93,354,563,357.449 | 100.000 |
| Alan J. Lacy |
| Affirmative | 91,490,319,407.772 | 98.003 |
| Withheld | 1,864,243,948.299 | 1.997 |
| TOTAL | 93,354,563,357.449 | 100.000 |
| Ned C. Lautenbach |
| Affirmative | 91,285,367,239.075 | 97.784 |
| Withheld | 2,069,196,119.052 | 2.216 |
| TOTAL | 93,354,563,357.449 | 100.000 |
| Robert A. Lawrence |
| Affirmative | 91,556,271,429.466 | 98.074 |
| Withheld | 1,798,291,912.707 | 1.926 |
| TOTAL | 93,354,563,357.449 | 100.000 |
| Joseph Mauriello |
| Affirmative | 91,497,480,147.082 | 98.011 |
| Withheld | 1,857,083,211.045 | 1.989 |
| TOTAL | 93,354,563,357.449 | 100.000 |
| Cornelia M. Small |
| Affirmative | 91,606,808,161.438 | 98.128 |
| Withheld | 1,747,755,220.497 | 1.872 |
| TOTAL | 93,354,563,357.449 | 100.000 |
| Garnett A. Smith |
| Affirmative | 91,505,784,053.038 | 98.020 |
| Withheld | 1,848,779,305.090 | 1.980 |
| TOTAL | 93,354,563,357.449 | 100.000 |
| David M. Thomas |
| Affirmative | 91,536,969,704.881 | 98.053 |
| Withheld | 1,817,593,630.919 | 1.947 |
| TOTAL | 93,354,563,357.449 | 100.000 |
| Susan Tomasky |
| Affirmative | 91,697,125,678.165 | 98.225 |
| Withheld | 1,657,437,703.277 | 1.775 |
| TOTAL | 93,354,563,357.449 | 100.000 |
| Michael E. Wiley |
| Affirmative | 91,506,805,575.815 | 98.021 |
| Withheld | 1,847,757,759.985 | 1.979 |
| TOTAL | 93,354,563,357.449 | 100.000 |
|
| Proposal 1 reflects trust wide proposal and voting results. |
ISF-ANN-1220
1.9896235.100
Fidelity® Enduring Opportunities Fund
Annual Report
October 31, 2020
See the inside front cover for important information about access to your fund’s shareholder reports.
Beginning on January 1, 2021, as permitted by regulations adopted by the Securities and Exchange Commission, paper copies of a fund’s shareholder reports will no longer be sent by mail, unless you specifically request paper copies of the reports from the fund or from your financial intermediary, such as a financial advisor, broker-dealer or bank. Instead, the reports will be made available on a website, and you will be notified by mail each time a report is posted and provided with a website link to access the report.
If you already elected to receive shareholder reports electronically, you will not be affected by this change and you need not take any action. You may elect to receive shareholder reports and other communications from a fund electronically, by contacting your financial intermediary. For Fidelity customers, visit Fidelity's web site or call Fidelity using the contact information listed below.
You may elect to receive all future reports in paper free of charge. If you wish to continue receiving paper copies of your shareholder reports, you may contact your financial intermediary or, if you are a Fidelity customer, visit Fidelity’s website, or call Fidelity at the applicable toll-free number listed below. Your election to receive reports in paper will apply to all funds held with the fund complex/your financial intermediary.
| Account Type | Website | Phone Number |
| Brokerage, Mutual Fund, or Annuity Contracts: | fidelity.com/mailpreferences | 1-800-343-3548 |
| Employer Provided Retirement Accounts: | netbenefits.fidelity.com/preferences (choose 'no' under Required Disclosures to continue to print) | 1-800-343-0860 |
| Advisor Sold Accounts Serviced Through Your Financial Intermediary: | Contact Your Financial Intermediary | Your Financial Intermediary's phone number |
| Advisor Sold Accounts Serviced by Fidelity: | institutional.fidelity.com | 1-877-208-0098 |
Contents
To view a fund's proxy voting guidelines and proxy voting record for the 12-month period ended June 30, visit http://www.fidelity.com/proxyvotingresults or visit the Securities and Exchange Commission's (SEC) web site at http://www.sec.gov.
You may also call 1-800-544-8544 to request a free copy of the proxy voting guidelines.
Standard & Poor's, S&P and S&P 500 are registered service marks of The McGraw-Hill Companies, Inc. and have been licensed for use by Fidelity Distributors Corporation.
Other third-party marks appearing herein are the property of their respective owners.
All other marks appearing herein are registered or unregistered trademarks or service marks of FMR LLC or an affiliated company. © 2020 FMR LLC. All rights reserved.
This report and the financial statements contained herein are submitted for the general information of the shareholders of the Fund. This report is not authorized for distribution to prospective investors in the Fund unless preceded or accompanied by an effective prospectus.
A fund files its complete schedule of portfolio holdings with the SEC for the first and third quarters of each fiscal year on Form N-PORT. Forms N-PORT are available on the SEC’s web site at http://www.sec.gov. A fund's Forms N-PORT may be reviewed and copied at the SEC’s Public Reference Room in Washington, DC. Information regarding the operation of the SEC's Public Reference Room may be obtained by calling 1-800-SEC-0330.
For a complete list of a fund's portfolio holdings, view the most recent holdings listing, semiannual report, or annual report on Fidelity's web site at http://www.fidelity.com, http://www.institutional.fidelity.com, or http://www.401k.com, as applicable.
NOT FDIC INSURED •MAY LOSE VALUE •NO BANK GUARANTEE
Neither the Fund nor Fidelity Distributors Corporation is a bank.
Note to Shareholders:
Early in 2020, the outbreak and spread of a new coronavirus emerged as a public health emergency that had a major influence on financial markets, primarily based on its impact on the global economy and the outlook for corporate earnings. The virus causes a respiratory disease known as COVID-19. On March 11, the World Health Organization declared the COVID-19 outbreak a pandemic, citing sustained risk of further global spread.
In the weeks following, as the crisis worsened, we witnessed an escalating human tragedy with wide-scale social and economic consequences from coronavirus-containment measures. The outbreak of COVID-19 prompted a number of measures to limit the spread, including travel and border restrictions, quarantines, and restrictions on large gatherings. In turn, these resulted in lower consumer activity, diminished demand for a wide range of products and services, disruption in manufacturing and supply chains, and – given the wide variability in outcomes regarding the outbreak – significant market uncertainty and volatility. Amid the turmoil, global governments and central banks took unprecedented action to help support consumers, businesses, and the broader economies, and to limit disruption to financial systems.
The situation continues to unfold, and the extent and duration of its impact on financial markets and the economy remain highly uncertain. Extreme events such as the coronavirus crisis are “exogenous shocks” that can have significant adverse effects on mutual funds and their investments. Although multiple asset classes may be affected by market disruption, the duration and impact may not be the same for all types of assets.
Fidelity is committed to helping you stay informed amid news about COVID-19 and during increased market volatility, and we’re taking extra steps to be responsive to customer needs. We encourage you to visit our websites, where we offer ongoing updates, commentary, and analysis on the markets and our funds.
Performance: The Bottom Line
Average annual total return reflects the change in the value of an investment, assuming reinvestment of distributions from dividend income and capital gains (the profits earned upon the sale of securities that have grown in value, if any) and assuming a constant rate of performance each year. The hypothetical investment and the average annual total returns do not reflect the deduction of taxes that a shareholder would pay on fund distributions or the redemption of fund shares. During periods of reimbursement by Fidelity, a fund’s total return will be greater than it would be had the reimbursement not occurred. How a fund did yesterday is no guarantee of how it will do tomorrow.
Average annual total returns for Fidelity® Enduring Opportunities Fund will be reported once the fund is a year old.
$10,000 Over Life of Fund
Let's say hypothetically that $10,000 was invested in Fidelity® Enduring Opportunities Fund on November 5, 2019, when the fund started.
The chart shows how the value of your investment would have changed, and also shows how the MSCI ACWI (All Country World Index) Index performed over the same period.

| Period Ending Values |
| $11,922 | Fidelity® Enduring Opportunities Fund |
| $10,388 | MSCI ACWI (All Country World Index) Index |
Management's Discussion of Fund Performance
Market Recap: The MSCI ACWI (All Country World Index) Index gained 5.29% for the year ending October 31, 2020, a volatile period for global equities, marked by a steep but brief decline due to the early-2020 outbreak and spread of the coronavirus, followed by a historic rebound. Declared a pandemic in March, the COVID-19 crisis caused broad contraction in economic activity, along with elevated uncertainty and dislocation in financial markets. A historically rapid and expansive monetary/fiscal-policy response partially offset the economic disruption and fueled a sharp uptrend from March 24 into September. Other supporting factors included resilient corporate earnings and near-term potential for a COVID-19 vaccine breakthrough. Currency fluctuation generally supported global equities for the year. Late in the period, markets digested the inability of the U.S. Congress to reach a deal on additional fiscal stimulus, U.S. election uncertainty and a second wave of COVID-19 cases. By region for the full period, the U.S. (+12%), which represented 57% of the index, on average, led the way, followed by emerging markets (+9%). In contrast, the following regions lagged: U.K. (-22%), Asia-Pacific ex Japan (-8%), Canada (-5%) and Europe ex U.K. (-4%). Among sectors, information technology (+33%), consumer discretionary (+24%) and communication services (+16%) stood out. Conversely, energy (-42%), financials (-18%) and real estate (-15%) trailed the index.
Comments from Co-Portfolio Manager Michael Kim: From inception on November 5, 2019, through October 31, 2020, the fund gained 19.22%, topping the 3.88% return of the benchmark, the MSCI ACWI (All Country World Index) over this time frame. We believe the fund benefited from the work of Fidelity analysts, who sought to identify companies with longer-term growth prospects, a strong management team and protective moats, such as network and scale effects. Quantitative analysis also helped to bring discipline to our investment process. Positioning in all major global regions added value for the period. By country, picks in the U.S., the U.K., China and Japan helped the most. Conversely, non-benchmark exposure to several emerging-markets exchange-traded funds (ETFs) detracted, as did modest positions in Peru and the Philippines. By sector, picks in industrials, financials, health care, real estate and communication services added meaningful value, although overweightings in industrials and health care detracted slightly. In information technology, overweighting software & services helped notably. Within this segment, a position in Coupa Software (+101%), a provider of business spend-management software, added more value than any other fund position. Conversely, not owning several tech names included in the benchmark, such as Apple (+71%) and Nvidia (+142%), detracted from our relative result. It also hurt not to own shares of automaker Tesla, a benchmark component that gained 494% this period. By period end, we added exposure to the technology and health care sectors, and reduced the fund’s holdings in consumer staples, financials and real estate.
The views expressed above reflect those of the portfolio manager(s) only through the end of the period as stated on the cover of this report and do not necessarily represent the views of Fidelity or any other person in the Fidelity organization. Any such views are subject to change at any time based upon market or other conditions and Fidelity disclaims any responsibility to update such views. These views may not be relied on as investment advice and, because investment decisions for a Fidelity fund are based on numerous factors, may not be relied on as an indication of trading intent on behalf of any Fidelity fund.
Note to shareholders: On July 1, 2020, Niamh Brodie-Machura assumed co-management responsibilities for the fund. Markus Eichacker came off of the fund. On November 1, 2020, Tom Codrington assumed co-management responsibilities for the fund, succeeding Risteard Hogan.
Investment Summary (Unaudited)
Top Five Stocks as of October 31, 2020
| | % of fund's net assets |
| Microsoft Corp. | 3.0 |
| Amazon.com, Inc. | 2.7 |
| Facebook, Inc. Class A | 1.5 |
| Alibaba Group Holding Ltd. sponsored ADR | 1.3 |
| Alphabet, Inc. Class C | 1.1 |
| | 9.6 |
Top Five Market Sectors as of October 31, 2020
| | % of fund's net assets |
| Information Technology | 20.4 |
| Consumer Discretionary | 17.2 |
| Industrials | 17.1 |
| Financials | 11.0 |
| Communication Services | 8.9 |
Asset Allocation (% of fund's net assets)
| As of October 31, 2020* |
| | Stocks | 98.6% |
| | Short-Term Investments and Net Other Assets (Liabilities) | 1.4% |

* Foreign investments - 45.3%
Schedule of Investments October 31, 2020
Showing Percentage of Net Assets
| Common Stocks - 98.3% | | | |
| | | Shares | Value |
| COMMUNICATION SERVICES - 8.9% | | | |
| Entertainment - 2.1% | | | |
| Activision Blizzard, Inc. | | 473 | $35,820 |
| CD Projekt RED SA (a) | | 148 | 12,540 |
| Netflix, Inc. (a) | | 141 | 67,079 |
| Sea Ltd. ADR (a) | | 128 | 20,186 |
| The Walt Disney Co. | | 573 | 69,476 |
| | | | 205,101 |
| Interactive Media & Services - 5.6% | | | |
| Adevinta ASA Class B (a) | | 1,052 | 16,254 |
| Alphabet, Inc.: | | | |
| Class A (a) | | 65 | 105,047 |
| Class C (a) | | 66 | 106,987 |
| Facebook, Inc. Class A (a) | | 584 | 153,656 |
| Kakao Corp. | | 58 | 16,875 |
| Rightmove PLC | | 2,367 | 18,951 |
| Tencent Holdings Ltd. | | 1,347 | 102,918 |
| Yandex NV Series A (a) | | 327 | 18,825 |
| Z Holdings Corp. | | 3,118 | 21,742 |
| | | | 561,255 |
| Media - 1.2% | | | |
| Cable One, Inc. | | 18 | 31,173 |
| Charter Communications, Inc. Class A (a) | | 80 | 48,306 |
| Schibsted ASA (A Shares) | | 489 | 19,936 |
| The New York Times Co. Class A | | 636 | 25,224 |
| | | | 124,639 |
|
| TOTAL COMMUNICATION SERVICES | | | 890,995 |
|
| CONSUMER DISCRETIONARY - 17.2% | | | |
| Auto Components - 0.6% | | | |
| Aptiv PLC | | 389 | 37,535 |
| DENSO Corp. | | 526 | 24,510 |
| | | | 62,045 |
| Automobiles - 0.9% | | | |
| Ferrari NV | | 114 | 20,334 |
| Maruti Suzuki India Ltd. | | 236 | 22,034 |
| Toyota Motor Corp. | | 677 | 44,443 |
| | | | 86,811 |
| Diversified Consumer Services - 0.7% | | | |
| Arco Platform Ltd. Class A (a) | | 324 | 11,042 |
| Grand Canyon Education, Inc. (a) | | 322 | 25,235 |
| New Oriental Education & Technology Group, Inc. sponsored ADR (a) | | 134 | 21,491 |
| TAL Education Group ADR (a) | | 284 | 18,875 |
| | | | 76,643 |
| Hotels, Restaurants & Leisure - 2.2% | | | |
| Compass Group PLC | | 1,527 | 20,901 |
| Hilton Worldwide Holdings, Inc. | | 430 | 37,758 |
| Jollibee Food Corp. | | 4,997 | 17,471 |
| Marriott International, Inc. Class A | | 382 | 35,480 |
| Oriental Land Co. Ltd. | | 163 | 22,816 |
| Starbucks Corp. | | 550 | 47,828 |
| Yum! Brands, Inc. | | 385 | 35,932 |
| | | | 218,186 |
| Household Durables - 0.6% | | | |
| Maytronics Ltd. | | 1,468 | 22,549 |
| NVR, Inc. (a) | | 9 | 35,578 |
| | | | 58,127 |
| Internet & Direct Marketing Retail - 5.9% | | | |
| Alibaba Group Holding Ltd. sponsored ADR (a) | | 417 | 127,056 |
| Amazon.com, Inc. (a) | | 90 | 273,254 |
| Delivery Hero AG (a)(b) | | 208 | 23,929 |
| Meituan Class B (a) | | 1,257 | 46,729 |
| MercadoLibre, Inc. (a) | | 22 | 26,709 |
| Naspers Ltd. Class N | | 165 | 32,213 |
| Ocado Group PLC (a) | | 844 | 24,886 |
| The Booking Holdings, Inc. (a) | | 25 | 40,563 |
| | | | 595,339 |
| Leisure Products - 0.2% | | | |
| Callaway Golf Co. | | 1,620 | 25,094 |
| Multiline Retail - 0.2% | | | |
| B&M European Value Retail SA | | 3,631 | 22,805 |
| Specialty Retail - 4.2% | | | |
| Carvana Co. Class A (a) | | 175 | 32,436 |
| Fast Retailing Co. Ltd. | | 48 | 33,482 |
| Five Below, Inc. (a) | | 273 | 36,402 |
| Floor & Decor Holdings, Inc. Class A (a) | | 434 | 31,682 |
| Inditex SA | | 817 | 20,163 |
| John David Group PLC | | 2,118 | 20,338 |
| Lowe's Companies, Inc. | | 347 | 54,861 |
| Nitori Holdings Co. Ltd. | | 107 | 21,995 |
| The Home Depot, Inc. | | 313 | 83,480 |
| TJX Companies, Inc. | | 730 | 37,084 |
| Ulta Beauty, Inc. (a) | | 133 | 27,500 |
| Workman Co. Ltd. | | 224 | 19,862 |
| | | | 419,285 |
| Textiles, Apparel & Luxury Goods - 1.7% | | | |
| Hermes International SCA | | 27 | 25,125 |
| LVMH Moet Hennessy Louis Vuitton SE | | 93 | 43,594 |
| Moncler SpA | | 510 | 20,409 |
| NIKE, Inc. Class B | | 472 | 56,678 |
| Shenzhou International Group Holdings Ltd. | | 1,387 | 23,956 |
| | | | 169,762 |
|
| TOTAL CONSUMER DISCRETIONARY | | | 1,734,097 |
|
| CONSUMER STAPLES - 6.6% | | | |
| Beverages - 1.4% | | | |
| Ambev SA | | 7,201 | 15,286 |
| China Resources Beer Holdings Co. Ltd. | | 2,657 | 16,468 |
| Davide Campari Milano NV | | 2,311 | 24,127 |
| Fever-Tree Drinks PLC | | 606 | 15,819 |
| Kweichow Moutai Co. Ltd. (A Shares) | | 70 | 17,509 |
| Monster Beverage Corp. (a) | | 445 | 34,074 |
| Pernod Ricard SA | | 149 | 24,017 |
| | | | 147,300 |
| Food & Staples Retailing - 2.4% | | | |
| Alimentation Couche-Tard, Inc. Class B (sub. vtg.) | | 700 | 21,557 |
| Avenue Supermarts Ltd. (a)(b) | | 563 | 16,920 |
| Casey's General Stores, Inc. | | 174 | 29,331 |
| Clicks Group Ltd. | | 1,039 | 15,027 |
| Costco Wholesale Corp. | | 169 | 60,438 |
| Wal-Mart de Mexico SA de CV Series V | | 7,340 | 17,734 |
| Walmart, Inc. | | 479 | 66,461 |
| Welcia Holdings Co. Ltd. | | 410 | 16,068 |
| | | | 243,536 |
| Food Products - 1.6% | | | |
| Barry Callebaut AG | | 8 | 16,516 |
| Cranswick PLC | | 412 | 17,176 |
| Foshan Haitian Flavouring & Food Co. Ltd. (A Shares) | | 720 | 17,252 |
| Kerry Group PLC Class A | | 183 | 21,889 |
| Lamb Weston Holdings, Inc. | | 522 | 33,121 |
| McCormick & Co., Inc. (non-vtg.) | | 193 | 34,838 |
| Vietnam Dairy Products Corp. | | 3,624 | 16,932 |
| | | | 157,724 |
| Household Products - 0.3% | | | |
| Unicharm Corp. | | 579 | 26,791 |
| Personal Products - 0.9% | | | |
| Estee Lauder Companies, Inc. Class A | | 185 | 40,637 |
| Kao Corp. | | 337 | 23,994 |
| Shiseido Co. Ltd. | | 441 | 27,301 |
| | | | 91,932 |
|
| TOTAL CONSUMER STAPLES | | | 667,283 |
|
| ENERGY - 1.1% | | | |
| Oil, Gas & Consumable Fuels - 1.1% | | | |
| Cheniere Energy, Inc. (a) | | 605 | 28,961 |
| Hess Corp. | | 728 | 27,096 |
| Parkland Corp. | | 658 | 16,071 |
| PrairieSky Royalty Ltd. | | 2,486 | 15,245 |
| Reliance Industries Ltd. | | 968 | 26,678 |
| | | | 114,051 |
| FINANCIALS - 11.0% | | | |
| Banks - 3.8% | | | |
| Bank of America Corp. | | 2,661 | 63,066 |
| Close Brothers Group PLC | | 1,299 | 18,124 |
| Credicorp Ltd. (United States) | | 84 | 9,633 |
| FinecoBank SpA | | 1,294 | 17,708 |
| First Republic Bank | | 275 | 34,689 |
| HDFC Bank Ltd. | | 917 | 14,558 |
| JPMorgan Chase & Co. | | 869 | 85,197 |
| KBC Groep NV | | 355 | 17,501 |
| Kotak Mahindra Bank Ltd. (a) | | 899 | 18,649 |
| M&T Bank Corp. | | 310 | 32,110 |
| PNC Financial Services Group, Inc. | | 321 | 35,913 |
| PT Bank Central Asia Tbk | | 9,008 | 17,725 |
| Skandiabanken ASA (b) | | 2,939 | 18,625 |
| | | | 383,498 |
| Capital Markets - 4.7% | | | |
| Amundi SA (b) | | 250 | 16,392 |
| Avanza Bank Holding AB | | 1,277 | 24,253 |
| Bolsa Mexicana de Valores S.A.B. de CV | | 7,501 | 15,248 |
| Brookfield Asset Management, Inc. (Canada) Class A | | 842 | 25,020 |
| Charles Schwab Corp. | | 1,070 | 43,988 |
| CME Group, Inc. | | 241 | 36,324 |
| HDFC Asset Management Co. Ltd. (b) | | 502 | 15,143 |
| HUB24 Ltd. | | 2,568 | 41,493 |
| Moody's Corp. | | 155 | 40,750 |
| Morningstar, Inc. | | 199 | 37,886 |
| Netwealth Group Ltd. | | 2,169 | 26,344 |
| Partners Group Holding AG | | 20 | 18,029 |
| Raymond James Financial, Inc. | | 435 | 33,251 |
| S&P Global, Inc. | | 140 | 45,182 |
| St. James's Place Capital PLC | | 1,671 | 19,466 |
| Value Partners Group Ltd. | | 40,318 | 17,578 |
| VZ Holding AG | | 198 | 16,605 |
| | | | 472,952 |
| Consumer Finance - 0.2% | | | |
| Bajaj Finance Ltd. | | 477 | 21,152 |
| Insurance - 2.1% | | | |
| Arthur J. Gallagher & Co. | | 297 | 30,802 |
| Assurant, Inc. | | 259 | 32,212 |
| Chubb Ltd. | | 324 | 42,091 |
| FBD Holdings PLC (a) | | 887 | 6,405 |
| Hannover Reuck SE | | 111 | 16,121 |
| HDFC Standard Life Insurance Co. Ltd. (a)(b) | | 2,139 | 16,913 |
| Lifenet Insurance Co. (a) | | 1,186 | 17,466 |
| Qualitas Controladora S.A.B. de CV | | 4,106 | 16,398 |
| RenaissanceRe Holdings Ltd. | | 167 | 27,007 |
| | | | 205,415 |
| Thrifts & Mortgage Finance - 0.2% | | | |
| Housing Development Finance Corp. Ltd. | | 932 | 24,036 |
|
| TOTAL FINANCIALS | | | 1,107,053 |
|
| HEALTH CARE - 7.0% | | | |
| Biotechnology - 0.4% | | | |
| Abcam PLC | | 1,080 | 20,609 |
| Xencor, Inc. (a) | | 400 | 15,352 |
| | | | 35,961 |
| Health Care Equipment & Supplies - 3.7% | | | |
| Boston Scientific Corp. (a) | | 1,017 | 34,853 |
| Danaher Corp. | | 260 | 59,680 |
| Fisher & Paykel Healthcare Corp. | | 985 | 22,787 |
| Genmark Diagnostics, Inc. (a) | | 3,129 | 38,236 |
| Hoya Corp. | | 252 | 28,440 |
| Intuitive Surgical, Inc. (a) | | 66 | 44,027 |
| Masimo Corp. (a) | | 149 | 33,349 |
| ResMed, Inc. | | 198 | 38,004 |
| Shenzhen Mindray Bio-Medical Electronics Co. Ltd. (A Shares) | | 300 | 17,385 |
| Straumann Holding AG | | 20 | 20,852 |
| The Cooper Companies, Inc. | | 106 | 33,819 |
| | | | 371,432 |
| Health Care Providers & Services - 1.1% | | | |
| Ryman Healthcare Group Ltd. | | 2,487 | 23,015 |
| UnitedHealth Group, Inc. | | 283 | 86,355 |
| | | | 109,370 |
| Life Sciences Tools & Services - 1.7% | | | |
| 10X Genomics, Inc. (a) | | 302 | 41,344 |
| Lonza Group AG | | 55 | 33,325 |
| Mettler-Toledo International, Inc. (a) | | 44 | 43,908 |
| Sartorius Stedim Biotech | | 70 | 26,545 |
| Wuxi Biologics (Cayman), Inc. (a)(b) | | 1,006 | 28,107 |
| | | | 173,229 |
| Pharmaceuticals - 0.1% | | | |
| Jiangsu Hengrui Medicine Co. Ltd. (A Shares) | | 1,160 | 15,446 |
|
| TOTAL HEALTH CARE | | | 705,438 |
|
| INDUSTRIALS - 17.1% | | | |
| Aerospace & Defense - 1.2% | | | |
| Axon Enterprise, Inc. (a) | | 371 | 36,692 |
| INVISIO AB | | 1,079 | 19,450 |
| Northrop Grumman Corp. | | 125 | 36,228 |
| Teledyne Technologies, Inc. (a) | | 89 | 27,514 |
| | | | 119,884 |
| Air Freight & Logistics - 1.5% | | | |
| C.H. Robinson Worldwide, Inc. | | 389 | 34,399 |
| Deutsche Post AG | | 702 | 31,101 |
| DSV Panalpina A/S | | 203 | 32,870 |
| Expeditors International of Washington, Inc. | | 399 | 35,260 |
| ZTO Express, Inc. sponsored ADR | | 521 | 15,099 |
| | | | 148,729 |
| Airlines - 0.2% | | | |
| Ryanair Holdings PLC sponsored ADR (a) | | 223 | 17,974 |
| Building Products - 1.5% | | | |
| Allegion PLC | | 287 | 28,270 |
| Armstrong World Industries, Inc. | | 365 | 21,864 |
| ASSA ABLOY AB (B Shares) | | 1,106 | 23,704 |
| Belimo Holding AG (Reg.) | | 2 | 14,875 |
| Kingspan Group PLC (Ireland) | | 347 | 30,249 |
| Trex Co., Inc. (a) | | 391 | 27,190 |
| | | | 146,152 |
| Commercial Services & Supplies - 1.1% | | | |
| Cintas Corp. | | 115 | 36,173 |
| Copart, Inc. (a) | | 367 | 40,502 |
| Prosegur Compania de Seguridad SA (Reg.) | | 7,048 | 16,121 |
| Waste Connection, Inc. (Canada) | | 172 | 17,049 |
| | | | 109,845 |
| Construction & Engineering - 0.2% | | | |
| Sweco AB (B Shares) | | 372 | 18,745 |
| Electrical Equipment - 1.7% | | | |
| AMETEK, Inc. | | 329 | 32,308 |
| Generac Holdings, Inc. (a) | | 182 | 38,247 |
| Nidec Corp. | | 358 | 36,159 |
| Somfy SA | | 188 | 26,187 |
| Vestas Wind Systems A/S | | 231 | 39,631 |
| | | | 172,532 |
| Industrial Conglomerates - 0.9% | | | |
| Honeywell International, Inc. | | 299 | 49,320 |
| Roper Technologies, Inc. | | 100 | 37,134 |
| | | | 86,454 |
| Machinery - 3.3% | | | |
| Atlas Copco AB (A Shares) | | 506 | 22,342 |
| ESCO Technologies, Inc. | | 334 | 27,952 |
| Fortive Corp. | | 446 | 27,474 |
| Haitian International Holdings Ltd. | | 6,554 | 16,232 |
| IDEX Corp. | | 195 | 33,226 |
| Kone OYJ (B Shares) | | 287 | 22,843 |
| Metawater Co. Ltd. | | 864 | 20,256 |
| Minebea Mitsumi, Inc. | | 1,114 | 20,120 |
| Miura Co. Ltd. | | 475 | 22,379 |
| Rational AG | | 29 | 21,734 |
| Schindler Holding AG (participation certificate) | | 72 | 18,413 |
| Shenzhen Inovance Technology Co. Ltd. (A Shares) | | 2,051 | 19,739 |
| SMC Corp. | | 40 | 21,276 |
| Spirax-Sarco Engineering PLC | | 164 | 23,966 |
| Zhejiang Sanhua Intelligent Controls Co. Ltd. (A Shares) | | 4,321 | 15,853 |
| | | | 333,805 |
| Marine - 0.2% | | | |
| SITC International Holdings Co. Ltd. | | 14,000 | 21,598 |
| Professional Services - 3.5% | | | |
| BayCurrent Consulting, Inc. | | 182 | 23,549 |
| Centre Testing International Group Co. Ltd. (A Shares) | | 5,000 | 20,185 |
| CoStar Group, Inc. (a) | | 44 | 36,239 |
| Equifax, Inc. | | 210 | 28,686 |
| Experian PLC | | 680 | 24,911 |
| Exponent, Inc. | | 440 | 30,620 |
| Funai Soken Holdings, Inc. | | 798 | 17,262 |
| Headhunter Group PLC ADR | | 1,345 | 30,854 |
| IHS Markit Ltd. | | 454 | 36,715 |
| Recruit Holdings Co. Ltd. | | 822 | 31,278 |
| Sporton International, Inc. | | 1,824 | 14,536 |
| TriNet Group, Inc. (a) | | 438 | 30,187 |
| Verisk Analytics, Inc. | | 181 | 32,213 |
| | | | 357,235 |
| Road & Rail - 0.3% | | | |
| Old Dominion Freight Lines, Inc. | | 184 | 35,028 |
| Trading Companies & Distributors - 1.5% | | | |
| AddTech AB (B Shares) | | 1,488 | 16,471 |
| Ashtead Group PLC | | 590 | 21,402 |
| IMCD NV | | 177 | 20,503 |
| Indutrade AB (a) | | 465 | 23,589 |
| MonotaRO Co. Ltd. | | 582 | 32,191 |
| SiteOne Landscape Supply, Inc. (a) | | 307 | 36,683 |
| | | | 150,839 |
|
| TOTAL INDUSTRIALS | | | 1,718,820 |
|
| INFORMATION TECHNOLOGY - 20.4% | | | |
| Electronic Equipment & Components - 2.3% | | | |
| Amphenol Corp. Class A | | 345 | 38,930 |
| CDW Corp. | | 273 | 33,470 |
| Cognex Corp. | | 597 | 39,342 |
| Keyence Corp. | | 79 | 35,852 |
| Lagercrantz Group AB (B Shares) | | 3,399 | 20,948 |
| Murata Manufacturing Co. Ltd. | | 443 | 31,067 |
| Renishaw PLC | | 375 | 27,181 |
| Vontier Corp. (a) | | 172 | 4,943 |
| | | | 231,733 |
| IT Services - 3.6% | | | |
| Adyen BV (a)(b) | | 14 | 23,530 |
| Afterpay Ltd. (a) | | 411 | 27,985 |
| Amadeus IT Holding SA Class A | | 418 | 19,955 |
| Black Knight, Inc.(a) | | 444 | 39,050 |
| Capgemini SA | | 221 | 25,517 |
| Econocom Group SA (a) | | 8,279 | 18,204 |
| Edenred SA | | 432 | 20,145 |
| FDM Group Holdings PLC | | 1,241 | 16,077 |
| GMO Internet, Inc. | | 656 | 17,497 |
| Kainos Group PLC | | 1,092 | 17,457 |
| Keywords Studios PLC | | 745 | 20,423 |
| Maximus, Inc. | | 370 | 25,005 |
| Reply SpA | | 272 | 29,239 |
| Shopify, Inc. (a) | | 28 | 25,912 |
| Softcat PLC | | 1,122 | 16,352 |
| StoneCo Ltd. Class A (a) | | 367 | 19,282 |
| | | | 361,630 |
| Semiconductors & Semiconductor Equipment - 3.2% | | | |
| ASML Holding NV (Netherlands) | | 129 | 46,673 |
| Disco Corp. | | 90 | 24,292 |
| Entegris, Inc. | | 530 | 39,628 |
| Lam Research Corp. | | 121 | 41,392 |
| Silicon Laboratories, Inc. (a) | | 110 | 11,271 |
| Taiwan Semiconductor Manufacturing Co. Ltd. | | 5,816 | 87,977 |
| Tokyo Electron Ltd. | | 109 | 29,257 |
| Universal Display Corp. | | 195 | 38,670 |
| | | | 319,160 |
| Software - 11.3% | | | |
| Adobe, Inc. (a) | | 154 | 68,853 |
| Altium Ltd. | | 860 | 22,573 |
| ANSYS, Inc. (a) | | 129 | 39,264 |
| Atlassian Corp. PLC (a) | | 108 | 20,695 |
| ATOSS Software AG | | 143 | 19,985 |
| Cadence Design Systems, Inc. (a) | | 325 | 35,545 |
| Ceridian HCM Holding, Inc. (a) | | 346 | 29,832 |
| Constellation Software, Inc. | | 19 | 19,945 |
| Coupa Software, Inc. (a) | | 107 | 28,644 |
| CyberArk Software Ltd. (a) | | 178 | 17,649 |
| Dassault Systemes SA | | 131 | 22,359 |
| Digital Turbine, Inc. (a) | | 1,269 | 36,370 |
| Intuit, Inc. | | 145 | 45,629 |
| Manhattan Associates, Inc. (a) | | 291 | 24,881 |
| Microsoft Corp. | | 1,511 | 305,932 |
| Ming Yuan Cloud Group Holdings Ltd. | | 4,225 | 18,039 |
| Money Forward, Inc. (a) | | 373 | 33,745 |
| Nemetschek Se | | 288 | 20,830 |
| Netcompany Group A/S (a)(b) | | 210 | 17,445 |
| Paycom Software, Inc. (a) | | 116 | 42,234 |
| PROS Holdings, Inc. (a) | | 816 | 22,987 |
| Salesforce.com, Inc. (a) | | 306 | 71,075 |
| SAP SE | | 311 | 33,179 |
| SimCorp A/S | | 152 | 18,120 |
| Synopsys, Inc. (a) | | 162 | 34,645 |
| Temenos Group AG | | 167 | 17,928 |
| Workday, Inc. Class A (a) | | 189 | 39,713 |
| Xero Ltd. (a) | | 347 | 26,920 |
| | | | 1,135,016 |
|
| TOTAL INFORMATION TECHNOLOGY | | | 2,047,539 |
|
| MATERIALS - 3.6% | | | |
| Chemicals - 3.3% | | | |
| Air Products & Chemicals, Inc. | | 158 | 43,646 |
| Asian Paints Ltd. | | 568 | 16,841 |
| Ecolab, Inc. | | 201 | 36,902 |
| Givaudan SA | | 6 | 24,446 |
| LG Chemical Ltd. | | 49 | 26,660 |
| Linde PLC | | 225 | 49,577 |
| Quaker Chemical Corp. | | 185 | 35,296 |
| Sherwin-Williams Co. | | 66 | 45,407 |
| Sika AG | | 124 | 30,522 |
| Symrise AG | | 198 | 24,409 |
| | | | 333,706 |
| Construction Materials - 0.3% | | | |
| James Hardie Industries PLC CDI | | 989 | 24,013 |
|
| TOTAL MATERIALS | | | 357,719 |
|
| REAL ESTATE - 4.3% | | | |
| Equity Real Estate Investment Trusts (REITs) - 3.3% | | | |
| American Tower Corp. | | 214 | 49,145 |
| ARGAN SA | | 169 | 15,904 |
| Big Yellow Group PLC | | 1,154 | 16,445 |
| Equinix, Inc. | | 55 | 40,218 |
| Equity Lifestyle Properties, Inc. | | 490 | 29,003 |
| Extra Space Storage, Inc. | | 332 | 38,495 |
| Irish Residential Properties REIT PLC | | 11,315 | 18,054 |
| National Storage (REIT) unit | | 15,304 | 19,423 |
| Prologis (REIT), Inc. | | 402 | 39,878 |
| Safestore Holdings PLC | | 1,584 | 16,488 |
| Sun Communities, Inc. | | 200 | 27,526 |
| Warehouses de Pauw | | 763 | 25,521 |
| | | | 336,100 |
| Real Estate Management & Development - 1.0% | | | |
| Amasten Fastighets AB (a) | | 20,332 | 16,588 |
| Ayala Land, Inc. | | 28,182 | 19,126 |
| Longfor Properties Co. Ltd. (b) | | 3,371 | 18,415 |
| Oberoi Realty Ltd. (a) | | 2,720 | 16,154 |
| Vonovia SE | | 399 | 25,475 |
| | | | 95,758 |
|
| TOTAL REAL ESTATE | | | 431,858 |
|
| UTILITIES - 1.1% | | | |
| Electric Utilities - 0.7% | | | |
| Equatorial Energia SA | | 3,581 | 12,438 |
| NextEra Energy, Inc. | | 816 | 59,739 |
| | | | 72,177 |
| Water Utilities - 0.4% | | | |
| American Water Works Co., Inc. | | 252 | 37,929 |
|
| TOTAL UTILITIES | | | 110,106 |
|
| TOTAL COMMON STOCKS | | | |
| (Cost $8,541,638) | | | 9,884,959 |
|
| Nonconvertible Preferred Stocks - 0.3% | | | |
| HEALTH CARE - 0.3% | | | |
| Health Care Equipment & Supplies - 0.3% | | | |
| Sartorius AG (non-vtg.) | | | |
| (Cost $17,595) | | 74 | 31,319 |
|
| Money Market Funds - 1.7% | | | |
| Fidelity Cash Central Fund 0.10% (c) | | | |
| (Cost $165,944) | | 165,911 | 165,944 |
| TOTAL INVESTMENT IN SECURITIES - 100.3% | | | |
| (Cost $8,725,177) | | | 10,082,222 |
| NET OTHER ASSETS (LIABILITIES) - (0.3)% | | | (27,577) |
| NET ASSETS - 100% | | | $10,054,645 |
Legend
(a) Non-income producing
(b) Security exempt from registration under Rule 144A of the Securities Act of 1933. These securities may be resold in transactions exempt from registration, normally to qualified institutional buyers. At the end of the period, the value of these securities amounted to $195,419 or 1.9% of net assets.
(c) Affiliated fund that is generally available only to investment companies and other accounts managed by Fidelity Investments. The rate quoted is the annualized seven-day yield of the fund at period end. A complete unaudited listing of the fund's holdings as of its most recent quarter end is available upon request. In addition, each Fidelity Central Fund's financial statements, which are not covered by the Fund's Report of Independent Registered Public Accounting Firm, are available on the SEC's website or upon request.
Affiliated Central Funds
Information regarding fiscal year to date income earned by the Fund from investments in Fidelity Central Funds is as follows:
| Fund | Income earned |
| Fidelity Cash Central Fund | $1,222 |
| Total | $1,222 |
Amounts in the income column in the above table include any capital gain distributions from underlying funds, which are presented in the corresponding line-item in the Statement of Operations, if applicable.
Investment Valuation
The following is a summary of the inputs used, as of October 31, 2020, involving the Fund's assets and liabilities carried at fair value. The inputs or methodology used for valuing securities may not be an indication of the risk associated with investing in those securities. For more information on valuation inputs, and their aggregation into the levels used below, please refer to the Investment Valuation section in the accompanying Notes to Financial Statements.
| | Valuation Inputs at Reporting Date: |
| Description | Total | Level 1 | Level 2 | Level 3 |
| Investments in Securities: | | | | |
| Equities: | | | | |
| Communication Services | $890,995 | $749,460 | $141,535 | $-- |
| Consumer Discretionary | 1,734,097 | 1,430,776 | 303,321 | -- |
| Consumer Staples | 667,283 | 489,489 | 177,794 | -- |
| Energy | 114,051 | 87,373 | 26,678 | -- |
| Financials | 1,107,053 | 893,574 | 213,479 | -- |
| Health Care | 736,757 | 596,359 | 140,398 | -- |
| Industrials | 1,718,820 | 1,350,327 | 368,493 | -- |
| Information Technology | 2,047,539 | 1,606,992 | 440,547 | -- |
| Materials | 357,719 | 290,205 | 67,514 | -- |
| Real Estate | 431,858 | 377,155 | 54,703 | -- |
| Utilities | 110,106 | 110,106 | -- | -- |
| Money Market Funds | 165,944 | 165,944 | -- | -- |
| Total Investments in Securities: | $10,082,222 | $8,147,760 | $1,934,462 | $-- |
Other Information
Distribution of investments by country or territory of incorporation, as a percentage of Total Net Assets, is as follows (Unaudited):
| United States of America | 54.7% |
| Japan | 7.0% |
| Cayman Islands | 5.3% |
| United Kingdom | 3.8% |
| Switzerland | 2.6% |
| France | 2.4% |
| Germany | 2.2% |
| India | 2.1% |
| Ireland | 2.1% |
| Sweden | 1.8% |
| Australia | 1.4% |
| Netherlands | 1.3% |
| China | 1.3% |
| Canada | 1.2% |
| Denmark | 1.1% |
| Taiwan | 1.0% |
| Others (Individually Less Than 1%) | 8.7% |
| | 100.0% |
See accompanying notes which are an integral part of the financial statements.
Financial Statements
Statement of Assets and Liabilities
| | | October 31, 2020 |
| Assets | | |
Investment in securities, at value — See accompanying schedule:
Unaffiliated issuers (cost $8,559,233) | $9,916,278 | |
| Fidelity Central Funds (cost $165,944) | 165,944 | |
| Total Investment in Securities (cost $8,725,177) | | $10,082,222 |
| Receivable for fund shares sold | | 14,609 |
| Dividends receivable | | 5,664 |
| Distributions receivable from Fidelity Central Funds | | 16 |
| Prepaid expenses | | 13 |
| Receivable from investment adviser for expense reductions | | 18,637 |
| Other receivables | | 203 |
| Total assets | | 10,121,364 |
| Liabilities | | |
| Payable for fund shares redeemed | $18,442 | |
| Accrued management fee | 5,765 | |
| Other affiliated payables | 2,016 | |
| Other payables and accrued expenses | 40,496 | |
| Total liabilities | | 66,719 |
| Net Assets | | $10,054,645 |
| Net Assets consist of: | | |
| Paid in capital | | $8,761,967 |
| Total accumulated earnings (loss) | | 1,292,678 |
| Net Assets | | $10,054,645 |
| Net Asset Value, offering price and redemption price per share ($10,054,645 ÷ 844,445 shares) | | $11.91 |
See accompanying notes which are an integral part of the financial statements.
Statement of Operations
| | | For the period
November 5, 2019 (commencement of operations) to
October 31, 2020 |
| Investment Income | | |
| Dividends | | $69,091 |
| Income from Fidelity Central Funds | | 1,222 |
| Income before foreign taxes withheld | | 70,313 |
| Less foreign taxes withheld | | (4,326) |
| Total income | | 65,987 |
| Expenses | | |
| Management fee | $45,002 | |
| Transfer agent fees | 12,989 | |
| Accounting fees and expenses | 2,569 | |
| Custodian fees and expenses | 25,972 | |
| Independent trustees' fees and expenses | 30 | |
| Registration fees | 46,457 | |
| Audit | 41,183 | |
| Legal | 6 | |
| Miscellaneous | 200 | |
| Total expenses before reductions | 174,408 | |
| Expense reductions | (101,977) | |
| Total expenses after reductions | | 72,431 |
| Net investment income (loss) | | (6,444) |
| Realized and Unrealized Gain (Loss) | | |
| Net realized gain (loss) on: | | |
| Investment securities: | | |
| Unaffiliated issuers (net of foreign taxes of $909) | (47,435) | |
| Fidelity Central Funds | (13) | |
| Foreign currency transactions | 301 | |
| Total net realized gain (loss) | | (47,147) |
| Change in net unrealized appreciation (depreciation) on: | | |
| Investment securities: | | |
| Unaffiliated issuers (net of increase in deferred foreign taxes of $9,526) | 1,347,519 | |
| Assets and liabilities in foreign currencies | 5 | |
| Total change in net unrealized appreciation (depreciation) | | 1,347,524 |
| Net gain (loss) | | 1,300,377 |
| Net increase (decrease) in net assets resulting from operations | | $1,293,933 |
See accompanying notes which are an integral part of the financial statements.
Statement of Changes in Net Assets
| | For the period
November 5, 2019 (commencement of operations) to
October 31, 2020 |
| Increase (Decrease) in Net Assets | |
| Operations | |
| Net investment income (loss) | $(6,444) |
| Net realized gain (loss) | (47,147) |
| Change in net unrealized appreciation (depreciation) | 1,347,524 |
| Net increase (decrease) in net assets resulting from operations | 1,293,933 |
| Distributions to shareholders | (1,356) |
| Distributions to shareholders from tax return of capital | (2,732) |
| Total distributions | (4,088) |
| Share transactions | |
| Proceeds from sales of shares | 10,792,557 |
| Reinvestment of distributions | 3,945 |
| Cost of shares redeemed | (2,031,702) |
| Net increase (decrease) in net assets resulting from share transactions | 8,764,800 |
| Total increase (decrease) in net assets | 10,054,645 |
| Net Assets | |
| Beginning of period | – |
| End of period | $10,054,645 |
| Other Information | |
| Shares | |
| Sold | 1,035,277 |
| Issued in reinvestment of distributions | 381 |
| Redeemed | (191,213) |
| Net increase (decrease) | 844,445 |
See accompanying notes which are an integral part of the financial statements.
Financial Highlights
Fidelity Enduring Opportunities Fund
| | |
| Years ended October 31, | 2020 A |
| Selected Per–Share Data | |
| Net asset value, beginning of period | $10.00 |
| Income from Investment Operations | |
| Net investment income (loss)B | (.01) |
| Net realized and unrealized gain (loss) | 1.93 |
| Total from investment operations | 1.92 |
| Distributions from net investment income | –C |
| Tax Return of capital | (.01) |
| Total distributions | (.01) |
| Net asset value, end of period | $11.91 |
| Total ReturnD,E | 19.22% |
| Ratios to Average Net AssetsF,G | |
| Expenses before reductions | 2.63%H |
| Expenses net of fee waivers, if any | 1.10%H |
| Expenses net of all reductions | 1.09%H |
| Net investment income (loss) | (.10)%H |
| Supplemental Data | |
| Net assets, end of period (000 omitted) | $10,055 |
| Portfolio turnover rateI | 17%H |
A For the period November 5, 2019 (commencement of operations) to October 31, 2020.
B Calculated based on average shares outstanding during the period.
C Amount represents less than $.005 per share.
D Total returns for periods of less than one year are not annualized.
E Total returns would have been lower if certain expenses had not been reduced during the applicable periods shown.
F Fees and expenses of any underlying mutual funds or exchange-traded funds (ETFs) are not included in the Fund's expense ratio. The Fund indirectly bears its proportionate share of these expenses. For additional expense information related to investments in Fidelity Central Funds, please refer to the "Investments in Fidelity Central Funds" note found in the Notes to Financial Statements section of the most recent Annual or Semi-Annual report.
G Expense ratios reflect operating expenses of the class. Expenses before reductions do not reflect amounts reimbursed, waived, or reduced through arrangements with the investment advisor, brokerage services, or other offset arrangements, if applicable, and do not represent the amount paid by the class during periods when reimbursements, waivers or reductions occur.
H Annualized
I Amount does not include the portfolio activity of any underlying mutual funds or exchange-traded funds (ETFs).
See accompanying notes which are an integral part of the financial statements.
Notes to Financial Statements
For the period ended October 31, 2020
1. Organization.
Fidelity Enduring Opportunities Fund (the Fund) is a fund of Fidelity Investment Trust (the Trust) and is authorized to issue an unlimited number of shares. Share transactions on the Statement of Changes in Net Assets may contain exchanges between affiliated funds. The Trust is registered under the Investment Company Act of 1940, as amended (the 1940 Act), as an open-end management investment company organized as a Massachusetts business trust. The Fund's investments in emerging markets can be subject to social, economic, regulatory, and political uncertainties and can be extremely volatile.
Effective January 1, 2020:
Investment advisers Fidelity Investments Money Management, Inc., FMR Co., Inc., and Fidelity SelectCo, LLC, merged with and into Fidelity Management & Research Company. In connection with the merger transactions, the resulting, merged investment adviser was then redomiciled from Massachusetts to Delaware, changed its corporate structure from a corporation to a limited liability company, and changed its name to "Fidelity Management & Research Company LLC".
Fidelity Investments Institutional Operations Company, Inc. converted from a Massachusetts corporation to a Massachusetts LLC, and changed its name to "Fidelity Investments Institutional Operations Company LLC".
2. Investments in Fidelity Central Funds.
The Fund invests in Fidelity Central Funds, which are open-end investment companies generally available only to other investment companies and accounts managed by the investment adviser and its affiliates. The Fund's Schedule of Investments lists each of the Fidelity Central Funds held as of period end, if any, as an investment of the Fund, but does not include the underlying holdings of each Fidelity Central Fund. As an Investing Fund, the Fund indirectly bears its proportionate share of the expenses of the underlying Fidelity Central Funds.
The Money Market Central Funds seek preservation of capital and current income and are managed by the investment adviser. Annualized expenses of the Money Market Central Funds as of their most recent shareholder report date ranged from less than .005% to .01%.
A complete unaudited list of holdings for each Fidelity Central Fund is available upon request or at the Securities and Exchange Commission (the SEC) website at www.sec.gov. In addition, the financial statements of the Fidelity Central Funds, which are not covered by the Fund's Report of Independent Registered Public Accounting Firm, are available on the SEC website or upon request.
3. Significant Accounting Policies.
The Fund is an investment company and applies the accounting and reporting guidance of the Financial Accounting Standards Board (FASB) Accounting Standards Codification Topic 946 Financial Services – Investment Companies. The financial statements have been prepared in conformity with accounting principles generally accepted in the United States of America (GAAP), which require management to make certain estimates and assumptions at the date of the financial statements. Actual results could differ from those estimates. Subsequent events, if any, through the date that the financial statements were issued have been evaluated in the preparation of the financial statements. The following summarizes the significant accounting policies of the Fund:
Investment Valuation. Investments are valued as of 4:00 p.m. Eastern time on the last calendar day of the period. The Board of Trustees (the Board) has delegated the day to day responsibility for the valuation of the Fund's investments to the Fair Value Committee (the Committee) established by the Fund's investment adviser. In accordance with valuation policies and procedures approved by the Board, the Fund attempts to obtain prices from one or more third party pricing vendors or brokers to value its investments. When current market prices, quotations or currency exchange rates are not readily available or reliable, investments will be fair valued in good faith by the Committee, in accordance with procedures adopted by the Board. Factors used in determining fair value vary by investment type and may include market or investment specific events. The frequency with which these procedures are used cannot be predicted and they may be utilized to a significant extent. The Committee oversees the Fund's valuation policies and procedures and reports to the Board on the Committee's activities and fair value determinations. The Board monitors the appropriateness of the procedures used in valuing the Fund's investments and ratifies the fair value determinations of the Committee.
The Fund categorizes the inputs to valuation techniques used to value its investments into a disclosure hierarchy consisting of three levels as shown below:
- Level 1 – quoted prices in active markets for identical investments
- Level 2 – other significant observable inputs (including quoted prices for similar investments, interest rates, prepayment speeds, etc.)
- Level 3 – unobservable inputs (including the Fund's own assumptions based on the best information available)
Valuation techniques used to value the Fund's investments by major category are as follows:
Equity securities, including restricted securities, for which market quotations are readily available, are valued at the last reported sale price or official closing price as reported by a third party pricing vendor on the primary market or exchange on which they are traded and are categorized as Level 1 in the hierarchy. In the event there were no sales during the day or closing prices are not available, securities are valued at the last quoted bid price or may be valued using the last available price and are generally categorized as Level 2 in the hierarchy. For foreign equity securities, when market or security specific events arise, comparisons to the valuation of American Depositary Receipts (ADRs), futures contracts, Exchange-Traded Funds (ETFs) and certain indexes as well as quoted prices for similar securities may be used and would be categorized as Level 2 in the hierarchy. For equity securities, including restricted securities, where observable inputs are limited, assumptions about market activity and risk are used and these securities may be categorized as Level 3 in the hierarchy.
Investments in open-end mutual funds, including the Fidelity Central Funds, are valued at their closing net asset value (NAV) each business day and are categorized as Level 1 in the hierarchy.
Changes in valuation techniques may result in transfers in or out of an assigned level within the disclosure hierarchy. The aggregate value of investments by input level as of October 31, 2020 is included at the end of the Fund's Schedule of Investments.
Foreign Currency. Certain Funds may use foreign currency contracts to facilitate transactions in foreign-denominated securities. Gains and losses from these transactions may arise from changes in the value of the foreign currency or if the counterparties do not perform under the contracts' terms.
Foreign-denominated assets, including investment securities, and liabilities are translated into U.S. dollars at the exchange rates at period end. Purchases and sales of investment securities, income and dividends received, and expenses denominated in foreign currencies are translated into U.S. dollars at the exchange rate in effect on the transaction date.
The effects of exchange rate fluctuations on investments are included with the net realized and unrealized gain (loss) on investment securities. Other foreign currency transactions resulting in realized and unrealized gain (loss) are disclosed separately.
Investment Transactions and Income. For financial reporting purposes, the Fund's investment holdings and NAV include trades executed through the end of the last business day of the period. The NAV per share for processing shareholder transactions is calculated as of the close of business of the New York Stock Exchange (NYSE), normally 4:00 p.m. Eastern time and includes trades executed through the end of the prior business day. Gains and losses on securities sold are determined on the basis of identified cost. Dividend income is recorded on the ex-dividend date, except for certain dividends from foreign securities where the ex-dividend date may have passed, which are recorded as soon as the Fund is informed of the ex-dividend date. Non-cash dividends included in dividend income, if any, are recorded at the fair market value of the securities received. Income and capital gain distributions from Fidelity Central Funds, if any, are recorded on the ex-dividend date. Certain distributions received by the Fund represent a return of capital or capital gain. The Fund determines the components of these distributions subsequent to the ex-dividend date, based upon receipt of tax filings or other correspondence relating to the underlying investment. These distributions are recorded as a reduction of cost of investments and/or as a realized gain. Investment income is recorded net of foreign taxes withheld where recovery of such taxes is uncertain.
Expenses. Expenses directly attributable to a fund are charged to that fund. Expenses attributable to more than one fund are allocated among the respective funds on the basis of relative net assets or other appropriate methods. Expense estimates are accrued in the period to which they relate and adjustments are made when actual amounts are known.
Income Tax Information and Distributions to Shareholders. Each year, the Fund intends to qualify as a regulated investment company under Subchapter M of the Internal Revenue Code, including distributing substantially all of its taxable income and realized gains. As a result, no provision for U.S. Federal income taxes is required. As of October 31, 2020, the Fund did not have any unrecognized tax benefits in the financial statements; nor is the Fund aware of any tax positions for which it is reasonably possible that the total amounts of unrecognized tax benefits will significantly change in the next twelve months. The Fund files a U.S. federal tax return, in addition to state and local tax returns as required. The Fund's federal income tax returns are subject to examination by the Internal Revenue Service (IRS) for a period of three fiscal years after they are filed. State and local tax returns may be subject to examination for an additional fiscal year depending on the jurisdiction. Foreign taxes are provided for based on the Fund's understanding of the tax rules and rates that exist in the foreign markets in which it invests. The Fund is subject to a tax imposed on capital gains by certain countries in which it invests. An estimated deferred tax liability for net unrealized appreciation on the applicable securities is included in Other payables and accrued expenses on the Statement of Assets & Liabilities.
Distributions are declared and recorded on the ex-dividend date. Income and capital gain distributions are determined in accordance with income tax regulations, which may differ from GAAP.
Capital accounts within the financial statements are adjusted for permanent book-tax differences. These adjustments have no impact on net assets or the results of operations. Capital accounts are not adjusted for temporary book-tax differences which will reverse in a subsequent period.
Book-tax differences are primarily due to foreign currency transactions, certain foreign taxes, passive foreign investment companies (PFIC), partnerships, tax return of capital distribution, capital loss carryforwards and losses deferred due to wash sales and excise tax regulations.
For the period ended October 31, 2020, the Fund's distributions exceeded the aggregate amount of taxable income and net realized gains resulting in a return of capital for tax purposes. This was due to reductions in taxable income available for distribution after certain distributions had been made.
As of period end, the cost and unrealized appreciation (depreciation) in securities, and derivatives if applicable, for federal income tax purposes were as follows:
| Gross unrealized appreciation | $1,727,481 |
| Gross unrealized depreciation | (380,469) |
| Net unrealized appreciation (depreciation) | $1,347,012 |
| Tax Cost | $8,735,210 |
The tax-based components of distributable earnings as of period end were as follows:
| Capital loss carryforward | $(37,661) |
| Net unrealized appreciation (depreciation) on securities and other investments | $1,347,017 |
Capital loss carryforwards are only available to offset future capital gains of the Fund to the extent provided by regulations and may be limited. The capital loss carryforward information presented below, including any applicable limitation, is estimated as of fiscal period end and is subject to adjustment.
| No expiration | |
| Short-term | $(37,661) |
The Fund intends to elect to defer to its next fiscal year $7,152 of ordinary losses recognized during the period January 1, 2020 to October 31, 2020.
The tax character of distributions paid was as follows:
| | October 31, 2020(a) |
| Ordinary Income | $1,356 |
| Tax Return of Capital | 2,732 |
| Total | $4,088 |
(a) For the period November 5, 2019 (commencement of operations) to October 31, 2020.
Restricted Securities (including Private Placements). The Fund may invest in securities that are subject to legal or contractual restrictions on resale. These securities generally may be resold in transactions exempt from registration or to the public if the securities are registered. Disposal of these securities may involve time-consuming negotiations and expense, and prompt sale at an acceptable price may be difficult. Information regarding restricted securities is included at the end of the Fund's Schedule of Investments.
4. Purchases and Sales of Investments.
Purchases and sales of securities, other than short-term securities are noted in the table below.
| | Purchases ($) | Sales ($) |
| Fidelity Enduring Opportunities Fund | 9,759,859 | 1,153,909 |
5. Fees and Other Transactions with Affiliates.
Management Fee. Fidelity Management & Research Company LLC (the investment adviser) and its affiliates provide the Fund with investment management related services for which the Fund pays a monthly management fee. The management fee is the sum of an individual fund fee rate that is based on an annual rate of .45% of the Fund's average net assets and an annualized group fee rate that averaged .23% during the period. The group fee rate is based upon the monthly average net assets of a group of registered investment companies with which the investment adviser has management contracts. The group fee rate decreases as assets under management increase and increases as assets under management decrease. In addition, the management fee is subject to a performance adjustment (up to a maximum of +/- .20% of the Fund's average net assets over a 36 month performance period). The upward or downward adjustment to the management fee is based on the Fund's relative investment performance as compared to its benchmark index, the MSCI ACWI (All Country World Index) Index, over the same 36 month performance period. The Fund's performance adjustment will not take effect until November 1, 2020. Subsequent months will be added until the performance period includes 36 months. For the reporting period, the total annualized management fee rate was .68% of the Fund's average net assets.
Transfer Agent Fees. Fidelity Investments Institutional Operations Company LLC (FIIOC), an affiliate of the investment adviser, is the Fund's transfer, dividend disbursing and shareholder servicing agent. FIIOC receives account fees and asset-based fees that vary according to account size and type of account. FIIOC pays for typesetting, printing and mailing of shareholder reports, except proxy statements. For the period, the transfer agent fees were equivalent to an annualized rate of .20% of average net assets.
Accounting Fees. Fidelity Service Company, Inc. (FSC), an affiliate of the investment adviser, maintains the Fund's accounting records. The accounting fee is based on the level of average net assets for each month. For the period, the fees were equivalent to the following annualized rates:
| | % of Average Net Assets |
| Fidelity Enduring Opportunities Fund | .04 |
Brokerage Commissions. A portion of portfolio transactions were placed with brokerage firms which are affiliates of the investment adviser. Brokerage commissions are included in net realized gain (loss) and change in net unrealized appreciation (depreciation) in the Statement of Operations. The commissions paid to these affiliated firms were as follows:
| | Amount |
| Fidelity Enduring Opportunities Fund | $34 |
Interfund Trades. Funds may purchase from or sell securities to other Fidelity Funds under procedures adopted by the Board. The procedures have been designed to ensure these interfund trades are executed in accordance with Rule 17a-7 of the 1940 Act.
6. Committed Line of Credit.
Certain Funds participate with other funds managed by the investment adviser or an affiliate in a $4.25 billion credit facility (the "line of credit") to be utilized for temporary or emergency purposes to fund shareholder redemptions or for other short-term liquidity purposes. The participating funds have agreed to pay commitment fees on their pro-rata portion of the line of credit, which are reflected in Miscellaneous expenses on the Statement of Operations, and are as follows:
| | Amount |
| Fidelity Enduring Opportunities Fund | $9 |
During the period, there were no borrowings on this line of credit.
7. Expense Reductions.
The investment adviser contractually agreed to reimburse the Fund to the extent annual operating expenses exceeded 1.10% of average net assets. This reimbursement will remain in place through February 28, 2022. Some expenses, for example the compensation of the independent Trustees, and certain miscellaneous expenses such as proxy and shareholder meeting expenses, are excluded from this reimbursement. During the period this reimbursement reduced the Fund's expenses by $101,352.
Commissions paid to certain brokers with whom the investment adviser, or its affiliates, places trades on behalf of the Fund include an amount in addition to trade execution, which may be rebated back to the Fund to offset certain expenses. This amount totaled $550 for the period. In addition, through arrangements with the Fund's custodian and transfer agent, credits realized as a result of certain uninvested cash balances were used to reduce the Fund's expenses by $58.
In addition, during the period the investment adviser or an affiliate reimbursed and/or waived a portion of operating expenses in the amount of $17.
8. Other.
The Fund's organizational documents provide former and current trustees and officers with a limited indemnification against liabilities arising in connection with the performance of their duties to the Fund. In the normal course of business, the Fund may also enter into contracts that provide general indemnifications. The Fund's maximum exposure under these arrangements is unknown as this would be dependent on future claims that may be made against the Fund. The risk of material loss from such claims is considered remote.
At the end of the period, the investment adviser or its affiliates were the owners of record of 36% of the total outstanding shares of the Fund.
9. Coronavirus (COVID-19) Pandemic.
An outbreak of COVID-19 first detected in China during December 2019 has since spread globally and was declared a pandemic by the World Health Organization during March 2020. Developments that disrupt global economies and financial markets, such as the COVID-19 pandemic, may magnify factors that affect the Fund's performance.
Report of Independent Registered Public Accounting Firm
To the Board of Trustees of Fidelity Investment Trust and Shareholders of Fidelity Enduring Opportunities Fund
Opinion on the Financial Statements
We have audited the accompanying statement of assets and liabilities, including the schedule of investments, of Fidelity Enduring Opportunities Fund (one of the funds constituting Fidelity Investment Trust, referred to hereafter as the “Fund”) as of October 31, 2020, and the related statements of operations and changes in net assets, including the related notes, and the financial highlights for the period November 5, 2019 (commencement of operations) through October 31, 2020 (collectively referred to as the “financial statements”). In our opinion, the financial statements present fairly, in all material respects, the financial position of the Fund as of October 31, 2020, and the results of its operations, changes in its net assets, and the financial highlights for the period November 5, 2019 (commencement of operations) through October 31, 2020 in conformity with accounting principles generally accepted in the United States of America.
Basis for Opinion
These financial statements are the responsibility of the Fund’s management. Our responsibility is to express an opinion on the Fund’s financial statements based on our audit. We are a public accounting firm registered with the Public Company Accounting Oversight Board (United States) (PCAOB) and are required to be independent with respect to the Fund in accordance with the U.S. federal securities laws and the applicable rules and regulations of the Securities and Exchange Commission and the PCAOB.
We conducted our audit of these financial statements in accordance with the standards of the PCAOB. Those standards require that we plan and perform the audit to obtain reasonable assurance about whether the financial statements are free of material misstatement, whether due to error or fraud.
Our audit included performing procedures to assess the risks of material misstatement of the financial statements, whether due to error or fraud, and performing procedures that respond to those risks. Such procedures included examining, on a test basis, evidence regarding the amounts and disclosures in the financial statements. Our audit also included evaluating the accounting principles used and significant estimates made by management, as well as evaluating the overall presentation of the financial statements. Our procedures included confirmation of securities owned as of October 31, 2020 by correspondence with the custodian. We believe that our audit provides a reasonable basis for our opinion.
/s/ PricewaterhouseCoopers LLP
Boston, Massachusetts
December 15, 2020
We have served as the auditor of one or more investment companies in the Fidelity group of funds since 1932.
Trustees and Officers
The Trustees, Members of the Advisory Board (if any), and officers of the trust and fund, as applicable, are listed below. The Board of Trustees governs the fund and is responsible for protecting the interests of shareholders. The Trustees are experienced executives who meet periodically throughout the year to oversee the fund's activities, review contractual arrangements with companies that provide services to the fund, oversee management of the risks associated with such activities and contractual arrangements, and review the fund's performance. Except for Jonathan Chiel, each of the Trustees oversees 305 funds. Mr. Chiel oversees 176.
The Trustees hold office without limit in time except that (a) any Trustee may resign; (b) any Trustee may be removed by written instrument, signed by at least two-thirds of the number of Trustees prior to such removal; (c) any Trustee who requests to be retired or who has become incapacitated by illness or injury may be retired by written instrument signed by a majority of the other Trustees; and (d) any Trustee may be removed at any special meeting of shareholders by a two-thirds vote of the outstanding voting securities of the trust. Each Trustee who is not an interested person (as defined in the 1940 Act) of the trust and the fund is referred to herein as an Independent Trustee. Each Independent Trustee shall retire not later than the last day of the calendar year in which his or her 75th birthday occurs. The Independent Trustees may waive this mandatory retirement age policy with respect to individual Trustees. Officers and Advisory Board Members hold office without limit in time, except that any officer or Advisory Board Member may resign or may be removed by a vote of a majority of the Trustees at any regular meeting or any special meeting of the Trustees. Except as indicated, each individual has held the office shown or other offices in the same company for the past five years.
The fund’s Statement of Additional Information (SAI) includes more information about the Trustees. To request a free copy, call Fidelity at 1-800-544-8544.
Experience, Skills, Attributes, and Qualifications of the Trustees. The Governance and Nominating Committee has adopted a statement of policy that describes the experience, qualifications, attributes, and skills that are necessary and desirable for potential Independent Trustee candidates (Statement of Policy). The Board believes that each Trustee satisfied at the time he or she was initially elected or appointed a Trustee, and continues to satisfy, the standards contemplated by the Statement of Policy. The Governance and Nominating Committee also engages professional search firms to help identify potential Independent Trustee candidates who have the experience, qualifications, attributes, and skills consistent with the Statement of Policy. From time to time, additional criteria based on the composition and skills of the current Independent Trustees, as well as experience or skills that may be appropriate in light of future changes to board composition, business conditions, and regulatory or other developments, have also been considered by the professional search firms and the Governance and Nominating Committee. In addition, the Board takes into account the Trustees' commitment and participation in Board and committee meetings, as well as their leadership of standing and ad hoc committees throughout their tenure.
In determining that a particular Trustee was and continues to be qualified to serve as a Trustee, the Board has considered a variety of criteria, none of which, in isolation, was controlling. The Board believes that, collectively, the Trustees have balanced and diverse experience, qualifications, attributes, and skills, which allow the Board to operate effectively in governing the fund and protecting the interests of shareholders. Information about the specific experience, skills, attributes, and qualifications of each Trustee, which in each case led to the Board's conclusion that the Trustee should serve (or continue to serve) as a trustee of the fund, is provided below.
Board Structure and Oversight Function. Robert A. Lawrence is an interested person and currently serves as Acting Chairman. The Trustees have determined that an interested Chairman is appropriate and benefits shareholders because an interested Chairman has a personal and professional stake in the quality and continuity of services provided to the fund. Independent Trustees exercise their informed business judgment to appoint an individual of their choosing to serve as Chairman, regardless of whether the Trustee happens to be independent or a member of management. The Independent Trustees have determined that they can act independently and effectively without having an Independent Trustee serve as Chairman and that a key structural component for assuring that they are in a position to do so is for the Independent Trustees to constitute a substantial majority for the Board. The Independent Trustees also regularly meet in executive session. Ned C. Lautenbach and David M. Thomas serve as Co-Lead Independent Trustees and as such each (i) acts as a liaison between the Independent Trustees and management with respect to matters important to the Independent Trustees and (ii) with management prepares agendas for Board meetings.
Fidelity® funds are overseen by different Boards of Trustees. The fund's Board oversees Fidelity's high income and certain equity funds, and other Boards oversee Fidelity's investment-grade bond, money market, asset allocation, and other equity funds. The asset allocation funds may invest in Fidelity® funds overseen by the fund's Board. The use of separate Boards, each with its own committee structure, allows the Trustees of each group of Fidelity® funds to focus on the unique issues of the funds they oversee, including common research, investment, and operational issues. On occasion, the separate Boards establish joint committees to address issues of overlapping consequences for the Fidelity® funds overseen by each Board.
The Trustees operate using a system of committees to facilitate the timely and efficient consideration of all matters of importance to the Trustees, the fund, and fund shareholders and to facilitate compliance with legal and regulatory requirements and oversight of the fund's activities and associated risks. The Board, acting through its committees, has charged FMR and its affiliates with (i) identifying events or circumstances the occurrence of which could have demonstrably adverse effects on the fund's business and/or reputation; (ii) implementing processes and controls to lessen the possibility that such events or circumstances occur or to mitigate the effects of such events or circumstances if they do occur; and (iii) creating and maintaining a system designed to evaluate continuously business and market conditions in order to facilitate the identification and implementation processes described in (i) and (ii) above. Because the day-to-day operations and activities of the fund are carried out by or through FMR, its affiliates, and other service providers, the fund's exposure to risks is mitigated but not eliminated by the processes overseen by the Trustees. While each of the Board's committees has responsibility for overseeing different aspects of the fund's activities, oversight is exercised primarily through the Operations, Audit, and Compliance Committees. Appropriate personnel, including but not limited to the fund's Chief Compliance Officer (CCO), FMR's internal auditor, the independent accountants, the fund's Treasurer and portfolio management personnel, make periodic reports to the Board's committees, as appropriate, including an annual review of Fidelity's risk management program for the Fidelity® funds. The responsibilities of each standing committee, including their oversight responsibilities, are described further under "Standing Committees of the Trustees."
Interested Trustees*:
Correspondence intended for a Trustee who is an interested person may be sent to Fidelity Investments, 245 Summer Street, Boston, Massachusetts 02210.
Name, Year of Birth; Principal Occupations and Other Relevant Experience+
Jonathan Chiel (1957)
Year of Election or Appointment: 2016
Trustee
Mr. Chiel also serves as Trustee of other Fidelity® funds. Mr. Chiel is Executive Vice President and General Counsel for FMR LLC (diversified financial services company, 2012-present). Previously, Mr. Chiel served as general counsel (2004-2012) and senior vice president and deputy general counsel (2000-2004) for John Hancock Financial Services; a partner with Choate, Hall & Stewart (1996-2000) (law firm); and an Assistant United States Attorney for the United States Attorney’s Office of the District of Massachusetts (1986-95), including Chief of the Criminal Division (1993-1995). Mr. Chiel is a director on the boards of the Boston Bar Foundation and the Maimonides School.
Robert A. Lawrence (1952)
Year of Election or Appointment: 2020
Trustee
Acting Chairman of the Board of Trustees
Mr. Lawrence also serves as Trustee of other funds. Previously, Mr. Lawrence served as a Member of the Advisory Board of certain funds. Prior to his retirement in 2008, Mr. Lawrence served as Vice President of certain Fidelity® funds (2006-2008), Senior Vice President, Head of High Income Division of Fidelity Management & Research Company (investment adviser firm, 2006-2008), and President of Fidelity Strategic Investments (investment adviser firm, 2002-2005).
* Determined to be an “Interested Trustee” by virtue of, among other things, his or her affiliation with the trust or various entities under common control with FMR.
+ The information includes the Trustee's principal occupation during the last five years and other information relating to the experience, attributes, and skills relevant to the Trustee's qualifications to serve as a Trustee, which led to the conclusion that the Trustee should serve as a Trustee for the fund.
Independent Trustees:
Correspondence intended for an Independent Trustee may be sent to Fidelity Investments, P.O. Box 55235, Boston, Massachusetts 02205-5235.
Name, Year of Birth; Principal Occupations and Other Relevant Experience+
Dennis J. Dirks (1948)
Year of Election or Appointment: 2005
Trustee
Mr. Dirks also serves as Trustee of other Fidelity® funds. Prior to his retirement in May 2003, Mr. Dirks served as Chief Operating Officer and as a member of the Board of The Depository Trust & Clearing Corporation (financial markets infrastructure), President, Chief Operating Officer and a member of the Board of The Depository Trust Company (DTC), President and a member of the Board of the National Securities Clearing Corporation (NSCC), Chief Executive Officer and a member of the Board of the Government Securities Clearing Corporation and Chief Executive Officer and a member of the Board of the Mortgage-Backed Securities Clearing Corporation. Mr. Dirks currently serves as a member of the Finance Committee (2016-present) and Board (2017-present) and is Treasurer (2018-present) of the Asolo Repertory Theatre.
Donald F. Donahue (1950)
Year of Election or Appointment: 2018
Trustee
Mr. Donahue also serves as Trustee of other Fidelity® funds. Mr. Donahue serves as President and Chief Executive Officer of Miranda Partners, LLC (risk consulting for the financial services industry, 2012-present). Previously, Mr. Donahue served as Chief Executive Officer (2006-2012), Chief Operating Officer (2003-2006) and Managing Director, Customer Marketing and Development (1999-2003) of The Depository Trust & Clearing Corporation (financial markets infrastructure). Mr. Donahue currently serves as a member (2007-present) and Co-Chairman (2016-present) of the Board of United Way of New York, a member of the Board of NYC Leadership Academy (2012-present) and a member of the Board of Advisors of Ripple Labs, Inc. (financial services, 2015-present). Mr. Donahue previously served as a member of the Advisory Board of certain Fidelity® funds (2015-2018).
Vicki L. Fuller (1957)
Year of Election or Appointment: 2020
Trustee
Ms. Fuller also serves as Trustee of other Fidelity® funds. Previously, Ms. Fuller served as a member of the Advisory Board of certain Fidelity® funds (2018-2020), Chief Investment Officer of the New York State Common Retirement Fund (2012-2018) and held a variety of positions at AllianceBernstein L.P. (global asset management, 1985-2012), including Managing Director (2006-2012) and Senior Vice President and Senior Portfolio Manager (2001-2006). Ms. Fuller currently serves as a member of the Board, Audit Committee and Nominating and Governance Committee of The Williams Companies, Inc. (natural gas infrastructure, 2018-present), as a member of the Board, Audit Committee and Nominating and Governance Committee of two Blackstone business development companies (2020-present) and as a member of the Board of Treliant, LLC (consulting, 2019-present).
Patricia L. Kampling (1959)
Year of Election or Appointment: 2020
Trustee
Ms. Kampling also serves as Trustee of other Fidelity® funds. Prior to her retirement, Ms. Kampling served as Chairman of the Board and Chief Executive Officer (2012-2019), President and Chief Operating Officer (2011-2012) and Executive Vice President and Chief Financial Officer (2010-2011) of Alliant Energy Corporation. Ms. Kampling currently serves as a member of the Board, Compensation Committee and Executive Committee and as Chair of the Audit Committee of Briggs & Stratton Corporation (manufacturing, 2011-present) and as a member of the Board, Audit, Finance and Risk Committee and Safety, Environmental, Technology and Operations Committee of American Water Works Company, Inc. (utilities company, 2019-present). In addition, Ms. Kampling currently serves as a member of the Board of the Nature Conservancy, Wisconsin Chapter (2019-present). Previously, Ms. Kampling served as a Member of the Advisory Board of certain Fidelity® funds (2020), a member of the Board of Interstate Power and Light Company (2012-2019) and Wisconsin Power and Light Company (2012-2019) (each a subsidiary of Alliant Energy Corporation) and as a member of the Board and Workforce Development Committee of the Business Roundtable (2018-2019).
Alan J. Lacy (1953)
Year of Election or Appointment: 2008
Trustee
Mr. Lacy also serves as Trustee of other Fidelity® funds. Previously, Mr. Lacy served as Senior Adviser (2007-2014) of Oak Hill Capital Partners, L.P. (private equity), Chief Executive Officer (2005) and Vice Chairman (2005-2006) of Sears Holdings Corporation (retail), Chief Executive Officer and Chairman of the Board of Sears, Roebuck and Co. (retail, 2000-2005), Chairman (2014-2017) and a member of the Board (2010-2017) of Dave & Buster’s Entertainment, Inc. (restaurant and entertainment complexes) and a member of the Board of Bristol-Myers Squibb Company (global pharmaceuticals, 2008-2020). Mr. Lacy currently serves as a Trustee of the California Chapter of The Nature Conservancy (2015-present) and a member of the Board of the Center for Advanced Study in the Behavioral Sciences at Stanford University (2015-present).
Ned C. Lautenbach (1944)
Year of Election or Appointment: 2000
Trustee
Co-Lead Independent Trustee
Mr. Lautenbach also serves as Trustee of other Fidelity® funds. Mr. Lautenbach currently serves as Chair of the Board of Governors, State University System of Florida (2013-present) and is a member of the Council on Foreign Relations (1994-present). He is also a member and has in the past served as Chairman of the Board of Directors of Artis-Naples (2012-present). Previously, Mr. Lautenbach served as a member and then Lead Director of the Board of Directors of Eaton Corporation (diversified industrial, 1997-2016). He was also a Partner at Clayton, Dubilier & Rice, LLC (private equity investment, 1998-2010); as well as Director of Sony Corporation (2006-2007). In addition, Mr. Lautenbach had a 30-year career with IBM (technology company), during which time he served as Senior Vice President and as a member of the Corporate Executive Committee (1968-1998).
Joseph Mauriello (1944)
Year of Election or Appointment: 2008
Trustee
Mr. Mauriello also serves as Trustee of other Fidelity® funds. Prior to his retirement in January 2006, Mr. Mauriello served in numerous senior management positions including Deputy Chairman and Chief Operating Officer (2004-2005), and Vice Chairman of Financial Services (2002-2004) of KPMG LLP US (professional services, 1965-2005). Mr. Mauriello currently serves as a member of the Independent Directors Council Governing Council (2015-present). Previously, Mr. Mauriello served as a member of the Board of XL Group plc. (global insurance and re-insurance, 2006-2018).
Cornelia M. Small (1944)
Year of Election or Appointment: 2005
Trustee
Ms. Small also serves as Trustee of other Fidelity® funds. Previously, Ms. Small served as Chief Investment Officer, Director of Global Equity Investments and a member of Scudder, Stevens & Clark and Scudder Kemper Investments. Ms. Small previously served as a member of the Board (2009-2019) and Chair of the Investment Committee (2010-2019) of the Teagle Foundation and a member of the Investment Committee of the Berkshire Taconic Community Foundation (2008-2019).
Garnett A. Smith (1947)
Year of Election or Appointment: 2018
Trustee
Mr. Smith also serves as Trustee of other Fidelity® funds. Prior to his retirement, Mr. Smith served as Chairman and Chief Executive Officer (1990-1997) and President (1986-1990) of Inbrand Corp. (manufacturer of personal absorbent products). Prior to his employment with Inbrand Corp., he was employed by a retail fabric chain and North Carolina National Bank (now Bank of America). Mr. Smith previously served as a member of the Advisory Board of certain Fidelity® funds (2012-2013).
David M. Thomas (1949)
Year of Election or Appointment: 2008
Trustee
Co-Lead Independent Trustee
Mr. Thomas also serves as Trustee of other Fidelity® funds. Previously, Mr. Thomas served as Executive Chairman (2005-2006) and Chairman and Chief Executive Officer (2000-2005) of IMS Health, Inc. (pharmaceutical and healthcare information solutions). Mr. Thomas currently serves as Non-Executive Chairman of the Board of Fortune Brands Home and Security (home and security products, 2011-present), and a member of the Board (2004-present) and Presiding Director (2013-present) of Interpublic Group of Companies, Inc. (marketing communication).
Susan Tomasky (1953)
Year of Election or Appointment: 2020
Trustee
Ms. Tomasky also serves as Trustee of other Fidelity® funds. Prior to her retirement, Ms. Tomasky served in various executive officer positions at American Electric Power Company, Inc. (1998-2011), including most recently as President of AEP Transmission (2007-2011). Ms. Tomasky currently serves as a member of the Board and Sustainability Committee and as Chair of the Audit Committee of Marathon Petroleum Corporation (2018-present) and as a member of the Board, Corporate Governance Committee and Organization and Compensation Committee and as Chair of the Audit Committee of Public Service Enterprise Group, Inc. (utilities company, 2012-present). In addition, Ms. Tomasky currently serves as a member of the Board of the Columbus Regional Airport Authority (2007-present), as a member of the Board of the Royal Shakespeare Company – America (2009-present), as a member of the Board of the Columbus Association for the Performing Arts (2011-present) and as a member of the Board of Kenyon College (2016-present). Previously, Ms. Tomasky served as a Member of the Advisory Board of certain Fidelity® funds (2020), a member of the Board (2011-2019) and as Lead Independent Director (2015-2018) of Andeavor Corporation (previously Tesoro Corporation) (independent oil refiner and marketer) and as a member of the Board of Summit Midstream Partners LP (energy, 2012-2018).
Michael E. Wiley (1950)
Year of Election or Appointment: 2020
Trustee
Mr. Wiley also serves as Trustee of other Fidelity® funds. Previously, Mr. Wiley served as a member of the Advisory Board of certain Fidelity® funds (2018-2020), Chairman, President and CEO of Baker Hughes, Inc. (oilfield services, 2000-2004). Mr. Wiley also previously served as a member of the Board of Andeavor Corporation (independent oil refiner and marketer, 2005-2018), a member of the Board of Andeavor Logistics LP (natural resources logistics, 2015-2018) and a member of the Board of High Point Resources (exploration and production, 2005-2020).
+ The information includes the Trustee's principal occupation during the last five years and other information relating to the experience, attributes, and skills relevant to the Trustee's qualifications to serve as a Trustee, which led to the conclusion that the Trustee should serve as a Trustee for the fund.
Advisory Board Members and Officers:
Correspondence intended for a Member of the Advisory Board (if any) may be sent to Fidelity Investments, P.O. Box 55235, Boston, Massachusetts 02205-5235. Correspondence intended for an officer or Peter S. Lynch may be sent to Fidelity Investments, 245 Summer Street, Boston, Massachusetts 02210. Officers appear below in alphabetical order.
Name, Year of Birth; Principal Occupation
Lloyd James Austin, III (1953)
Year of Election or Appointment: 2020
Member of the Advisory Board
General Austin also serves as a Member of the Advisory Board of other Fidelity® funds. Prior to his retirement, General Austin (United States Army, Retired) held a variety of positions within the U.S. Government, including Commander, U.S. Central Command (2013-2016), Vice Chief of Staff, U.S. Army (2012-2013) and Commanding General, U.S. Forces – Iraq, Operation New Dawn (2010-2012). General Austin currently serves as a Partner of Pine Island Capital Partners (private equity, 2020-present) and as President of the Austin Strategy Group LLC (consulting, 2016-present). General Austin serves as a member of the Board of Directors of Nucor Corporation (steel products, 2017-present), as a member of the Board of Directors of Tenet Healthcare Corporation (2018-present) and as a member of the Board of Directors of Raytheon Technologies Corporation (aerospace and defense, 2020-present). In addition, General Austin currently serves as a member of the Board of Trustees of the Carnegie Corporation of New York (2017-present) and as a member of the Board of Trustees of Auburn University (2017-present). Previously, General Austin served as a member of the Board of Directors of United Technologies Corporation (aerospace, defense and building, 2016-2020).
Thomas A. Kennedy (1955)
Year of Election or Appointment: 2020
Member of the Advisory Board
Mr. Kennedy also serves as a Member of the Advisory Board of other Fidelity® funds. Previously, Mr. Kennedy held a variety of positions at Raytheon Company (aerospace and defense, 1983-2020), including Chairman and Chief Executive Officer (2014-2020) and Executive Vice President and Chief Operating Officer (2013-2014). Mr. Kennedy currently serves as Executive Chairman of the Board of Directors of Raytheon Technologies Corporation (aerospace and defense, 2020-present). He is also a member of the Rutgers School of Engineering Industry Advisory Board (2011-present) and a member of the UCLA Engineering Dean’s Executive Board (2016-present).
Peter S. Lynch (1944)
Year of Election or Appointment: 2003
Member of the Advisory Board
Mr. Lynch also serves as a Member of the Advisory Board of other Fidelity® funds. Mr. Lynch is Vice Chairman and a Director of Fidelity Management & Research Company LLC (investment adviser firm). In addition, Mr. Lynch serves as a Trustee of Boston College and as the Chairman of the Inner-City Scholarship Fund. Previously, Mr. Lynch served as Vice Chairman and a Director of FMR Co., Inc. (investment adviser firm) and on the Special Olympics International Board of Directors (1997-2006).
Elizabeth Paige Baumann (1968)
Year of Election or Appointment: 2017
Anti-Money Laundering (AML) Officer
Ms. Baumann also serves as AML Officer of other funds. She is Chief AML Officer (2012-present) and Senior Vice President (2014-present) of FMR LLC (diversified financial services company) and is an employee of Fidelity Investments. Previously, Ms. Baumann served as AML Officer of certain funds (2017-2019), as AML Officer of the funds (2012-2016), and Vice President (2007-2014) and Deputy Anti-Money Laundering Officer (2007-2012) of FMR LLC.
Craig S. Brown (1977)
Year of Election or Appointment: 2019
Assistant Treasurer
Mr. Brown also serves as Assistant Treasurer of other funds. Mr. Brown is an employee of Fidelity Investments (2013-present).
John J. Burke III (1964)
Year of Election or Appointment: 2018
Chief Financial Officer
Mr. Burke also serves as Chief Financial Officer of other funds. Mr. Burke serves as Head of Investment Operations for Fidelity Fund and Investment Operations (2018-present) and is an employee of Fidelity Investments (1998-present). Previously Mr. Burke served as head of Asset Management Investment Operations (2012-2018).
William C. Coffey (1969)
Year of Election or Appointment: 2019
Assistant Secretary
Mr. Coffey also serves as Assistant Secretary of other funds. He is Senior Vice President and Deputy General Counsel of FMR LLC (diversified financial services company, 2010-present), and is an employee of Fidelity Investments. Previously, Mr. Coffey served as Secretary and CLO of certain funds (2018-2019); CLO, Secretary, and Senior Vice President of Fidelity Management & Research Company and FMR Co., Inc. (investment adviser firms, 2018-2019); Secretary of Fidelity SelectCo, LLC and Fidelity Investments Money Management, Inc. (investment adviser firms, 2018-2019); CLO of Fidelity Management & Research (Hong Kong) Limited, FMR Investment Management (UK) Limited, and Fidelity Management & Research (Japan) Limited (investment adviser firms, 2018-2019); and Assistant Secretary of certain funds (2009-2018).
Timothy M. Cohen (1969)
Year of Election or Appointment: 2018
Vice President
Mr. Cohen also serves as Vice President of other funds. Mr. Cohen serves as Co-Head of Equity (2018-present), a Director of Fidelity Management & Research (Japan) Limited (investment adviser firm, 2016-present), and is an employee of Fidelity Investments. Previously, Mr. Cohen served as Executive Vice President of Fidelity SelectCo, LLC (2019), Head of Global Equity Research (2016-2018), Chief Investment Officer - Equity and a Director of Fidelity Management & Research (U.K.) Inc. (investment adviser firm, 2013-2015) and as a Director of Fidelity Management & Research (Hong Kong) Limited (investment adviser firm, 2017).
Jonathan Davis (1968)
Year of Election or Appointment: 2010
Assistant Treasurer
Mr. Davis also serves as Assistant Treasurer of other funds. Mr. Davis serves as Assistant Treasurer of FMR Capital, Inc. (2017-present) and is an employee of Fidelity Investments. Previously, Mr. Davis served as Vice President and Associate General Counsel of FMR LLC (diversified financial services company, 2003-2010).
Laura M. Del Prato (1964)
Year of Election or Appointment: 2018
Assistant Treasurer
Ms. Del Prato also serves as an officer of other funds. Ms. Del Prato is an employee of Fidelity Investments (2017-present). Previously, Ms. Del Prato served as President and Treasurer of The North Carolina Capital Management Trust: Cash Portfolio and Term Portfolio (2018-2020). Prior to joining Fidelity Investments, Ms. Del Prato served as a Managing Director and Treasurer of the JPMorgan Mutual Funds (2014-2017). Prior to JPMorgan, Ms. Del Prato served as a partner at Cohen Fund Audit Services (accounting firm, 2012-2013) and KPMG LLP (accounting firm, 2004-2012).
Colm A. Hogan (1973)
Year of Election or Appointment: 2020
Assistant Treasurer
Mr. Hogan also serves as an officer of other funds. Mr. Hogan serves as Assistant Treasurer of FMR Capital, Inc. (2017-present) and is an employee of Fidelity Investments (2005-present). Previously, Mr. Hogan served as Deputy Treasurer of certain Fidelity® funds (2016-2020) and Assistant Treasurer of certain Fidelity® funds (2016-2018).
Pamela R. Holding (1964)
Year of Election or Appointment: 2018
Vice President
Ms. Holding also serves as Vice President of other funds. Ms. Holding serves as Co-Head of Equity (2018-present) and is an employee of Fidelity Investments (2013-present). Previously, Ms. Holding served as Executive Vice President of Fidelity SelectCo, LLC (2019) and as Chief Investment Officer of Fidelity Institutional Asset Management (2013-2018).
Cynthia Lo Bessette (1969)
Year of Election or Appointment: 2019
Secretary and Chief Legal Officer (CLO)
Ms. Lo Bessette also serves as an officer of other funds. Ms. Lo Bessette serves as CLO, Secretary, and Senior Vice President of Fidelity Management & Research Company LLC (investment adviser firm, 2019-present); and CLO of Fidelity Management & Research (Hong Kong) Limited, FMR Investment Management (UK) Limited, and Fidelity Management & Research (Japan) Limited (investment adviser firms, 2019-present). She is a Senior Vice President and Deputy General Counsel of FMR LLC (diversified financial services company, 2019-present), and is an employee of Fidelity Investments. Previously, Ms. Lo Bessette served as CLO, Secretary, and Senior Vice President of FMR Co., Inc. (investment adviser firm, 2019); Secretary of Fidelity SelectCo, LLC and Fidelity Investments Money Management, Inc. (investment adviser firms, 2019). Prior to joining Fidelity Investments, Ms. Lo Bessette was Executive Vice President, General Counsel (2016-2019) and Senior Vice President, Deputy General Counsel (2015-2016) of OppenheimerFunds (investment management company) and Deputy Chief Legal Officer (2013-2015) of Jennison Associates LLC (investment adviser firm).
Chris Maher (1972)
Year of Election or Appointment: 2020
Deputy Treasurer
Mr. Maher also serves as an officer of other funds. Mr. Maher serves as Assistant Treasurer of FMR Capital, Inc. (2017-present), and is an employee of Fidelity Investments (2008-present). Previously, Mr. Maher served as Assistant Treasurer of certain funds (2013-2020); Vice President of Asset Management Compliance (2013), Vice President of the Program Management Group of FMR (investment adviser firm, 2010-2013), and Vice President of Valuation Oversight (2008-2010).
Jason P. Pogorelec (1975)
Year of Election or Appointment: 2020
Chief Compliance Officer
Mr. Pogorelec also serves as Chief Compliance Officer of other funds. Mr. Pogorelec is a senior Vice President of Asset Management Compliance for Fidelity Investments and is an employee of Fidelity Investments (2006-present). Previously, Mr. Pogorelec served as Vice President, Associate General Counsel for Fidelity Investments (2010-2020) and Assistant Secretary of certain Fidelity funds (2015-2020).
Stacie M. Smith (1974)
Year of Election or Appointment: 2016
President and Treasurer
Ms. Smith also serves as an officer of other funds. Ms. Smith serves as Assistant Treasurer of FMR Capital, Inc. (2017-present), is an employee of Fidelity Investments (2009-present), and has served in other fund officer roles. Prior to joining Fidelity Investments, Ms. Smith served as Senior Audit Manager of Ernst & Young LLP (accounting firm, 1996-2009). Previously, Ms. Smith served as Assistant Treasurer (2013-2019) and Deputy Treasurer (2013-2016) of certain Fidelity® funds.
Marc L. Spector (1972)
Year of Election or Appointment: 2016
Assistant Treasurer
Mr. Spector also serves as an officer of other funds. Mr. Spector serves as Assistant Treasurer of FMR Capital, Inc. (2017-present) and is an employee of Fidelity Investments (2016-present). Prior to joining Fidelity Investments, Mr. Spector served as Director at the Siegfried Group (accounting firm, 2013-2016), and prior to Siegfried Group as audit senior manager at Deloitte & Touche LLP (accounting firm, 2005-2013).
Jim Wegmann (1979)
Year of Election or Appointment: 2019
Assistant Treasurer
Mr. Wegmann also serves as Assistant Treasurer of other funds. Mr. Wegmann is an employee of Fidelity Investments (2011-present).
Shareholder Expense Example
As a shareholder, you incur two types of costs: (1) transaction costs, which may include sales charges (loads) on purchase payments or redemption proceeds, as applicable and (2) ongoing costs, which generally include management fees, distribution and/or service (12b-1) fees and other Fund expenses. This Example is intended to help you understand your ongoing costs (in dollars) of investing in a fund and to compare these costs with the ongoing costs of investing in other mutual funds.
The Example is based on an investment of $1,000 invested at the beginning of the period and held for the entire period (May 1, 2020 to October 31, 2020).
Actual Expenses
The first line of the accompanying table provides information about actual account values and actual expenses. You may use the information in this line, together with the amount you invested, to estimate the expenses that you paid over the period. Simply divide your account value by $1,000.00 (for example, an $8,600 account value divided by $1,000.00 = 8.6), then multiply the result by the number in the first line for a class/Fund under the heading entitled "Expenses Paid During Period" to estimate the expenses you paid on your account during this period. If any fund is a shareholder of any underlying mutual funds or exchange-traded funds (ETFs) (the Underlying Funds), such fund indirectly bears its proportional share of the expenses of the Underlying Funds in addition to the direct expenses incurred presented in the table. These fees and expenses are not included in the annualized expense ratio used to calculate the expense estimate in the table below.
Hypothetical Example for Comparison Purposes
The second line of the accompanying table provides information about hypothetical account values and hypothetical expenses based on the actual expense ratio and an assumed rate of return of 5% per year before expenses, which is not the actual return. The hypothetical account values and expenses may not be used to estimate the actual ending account balance or expenses you paid for the period. You may use this information to compare the ongoing costs of investing in the Fund and other funds. To do so, compare this 5% hypothetical example with the 5% hypothetical examples that appear in the shareholder reports of the other funds. If any fund is a shareholder of any Underlying Funds, such fund indirectly bears its proportional share of the expenses of the Underlying Funds in addition to the direct expenses as presented in the table. These fees and expenses are not included in the annualized expense ratio used to calculate the expense estimate in the table below.
Please note that the expenses shown in the table are meant to highlight your ongoing costs only and do not reflect any transaction costs. Therefore, the second line of the table is useful in comparing ongoing costs only, and will not help you determine the relative total costs of owning different funds.
| | Annualized Expense Ratio-A | Beginning
Account Value
May 1, 2020 | Ending
Account Value
October 31, 2020 | Expenses Paid
During Period-B
May 1, 2020
to October 31, 2020 |
| Fidelity Enduring Opportunities Fund | 1.09% | | | |
| Actual | | $1,000.00 | $1,229.10 | $6.11 |
| Hypothetical-C | | $1,000.00 | $1,019.66 | $5.53 |
A Annualized expense ratio reflects expenses net of applicable fee waivers.
B Expenses are equal to the annualized expense ratio, multiplied by the average account value over the period, multiplied by 184/ 366 (to reflect the one-half year period). The fees and expenses of any Underlying Funds are not included in each annualized expense ratio.
C 5% return per year before expenses
Distributions (Unaudited)
The fund designates 100% of the dividend distributed during the fiscal year as qualifying for the dividends–received deduction for corporate shareholders.
The fund designates 100% of the dividend distributed during the fiscal year as amounts which may be taken into account as a dividend for purposes of the maximum rate under section 1(h)(11) of the Internal Revenue Code.
The fund will notify shareholders in January 2021 of amounts for use in preparing 2020 income tax returns.
Proxy Voting Results
A special meeting of shareholders was held on June 9, 2020. The results of votes taken among shareholders on the proposal before them are reported below. Each vote reported represents one dollar of net asset value held on the record date for the meeting.
PROPOSAL 1
To elect a Board of Trustees.
| | # of
Votes | % of
Votes |
| Dennis J. Dirks |
| Affirmative | 91,643,443,973.030 | 98.167 |
| Withheld | 1,711,119,384.419 | 1.833 |
| TOTAL | 93,354,563,357.449 | 100.000 |
| Donald F. Donahue |
| Affirmative | 91,659,003,496.045 | 98.184 |
| Withheld | 1,695,559,852.789 | 1.816 |
| TOTAL | 93,354,563,357.449 | 100.000 |
| Bettina Doulton |
| Affirmative | 91,774,146,516.145 | 98.307 |
| Withheld | 1,580,416,862.377 | 1.693 |
| TOTAL | 93,354,563,357.449 | 100.000 |
| Vicki L. Fuller |
| Affirmative | 91,845,419,368.993 | 98.383 |
| Withheld | 1,509,143,998.591 | 1.617 |
| TOTAL | 93,354,563,357.449 | 100.00 |
| Patricia L. Kampling |
| Affirmative | 91,723,732,274.457 | 98.253 |
| Withheld | 1,630,831,098.411 | 1.747 |
| TOTAL | 93,354,563,357.449 | 100.000 |
| Alan J. Lacy |
| Affirmative | 91,490,319,407.772 | 98.003 |
| Withheld | 1,864,243,948.299 | 1.997 |
| TOTAL | 93,354,563,357.449 | 100.000 |
| Ned C. Lautenbach |
| Affirmative | 91,285,367,239.075 | 97.784 |
| Withheld | 2,069,196,119.052 | 2.216 |
| TOTAL | 93,354,563,357.449 | 100.000 |
| Robert A. Lawrence |
| Affirmative | 91,556,271,429.466 | 98.074 |
| Withheld | 1,798,291,912.707 | 1.926 |
| TOTAL | 93,354,563,357.449 | 100.000 |
| Joseph Mauriello |
| Affirmative | 91,497,480,147.082 | 98.011 |
| Withheld | 1,857,083,211.045 | 1.989 |
| TOTAL | 93,354,563,357.449 | 100.000 |
| Cornelia M. Small |
| Affirmative | 91,606,808,161.438 | 98.128 |
| Withheld | 1,747,755,220.497 | 1.872 |
| TOTAL | 93,354,563,357.449 | 100.000 |
| Garnett A. Smith |
| Affirmative | 91,505,784,053.038 | 98.020 |
| Withheld | 1,848,779,305.090 | 1.980 |
| TOTAL | 93,354,563,357.449 | 100.000 |
| David M. Thomas |
| Affirmative | 91,536,969,704.881 | 98.053 |
| Withheld | 1,817,593,630.919 | 1.947 |
| TOTAL | 93,354,563,357.449 | 100.000 |
| Susan Tomasky |
| Affirmative | 91,697,125,678.165 | 98.225 |
| Withheld | 1,657,437,703.277 | 1.775 |
| TOTAL | 93,354,563,357.449 | 100.000 |
| Michael E. Wiley |
| Affirmative | 91,506,805,575.815 | 98.021 |
| Withheld | 1,847,757,759.985 | 1.979 |
| TOTAL | 93,354,563,357.449 | 100.000 |
|
| Proposal 1 reflects trust wide proposal and voting results. |
IDF-ANN-1220
1.9896221.100
Item 2.
Code of Ethics
As of the end of the period, October 31, 2020, Fidelity Investment Trust (the trust) has adopted a code of ethics, as defined in Item 2 of Form N-CSR, that applies to its President and Treasurer and its Chief Financial Officer. A copy of the code of ethics is filed as an exhibit to this Form N-CSR.
Item 3.
Audit Committee Financial Expert
The Board of Trustees of the trust has determined that Joseph Mauriello is an audit committee financial expert, as defined in Item 3 of Form N-CSR. Mr. Mauriello is independent for purposes of Item 3 of Form N-CSR.
Item 4.
Principal Accountant Fees and Services
Fees and Services
The following table presents fees billed by Deloitte & Touche LLP, the member firms of Deloitte Touche Tohmatsu, and their respective affiliates (collectively, “Deloitte Entities”) in each of the last two fiscal years for services rendered to Fidelity Diversified International Fund, Fidelity Diversified International K6 Fund, Fidelity Emerging Europe, Middle East, Africa (EMEA) Fund, Fidelity Flex International Fund, Fidelity Global Equity Income Fund, Fidelity International Capital Appreciation Fund, Fidelity International Capital Appreciation K6 Fund, Fidelity International Discovery K6 Fund, Fidelity International Small Cap Fund, Fidelity International Small Cap Opportunities Fund, Fidelity International Value Fund, Fidelity SAI International SMA Completion Fund, Fidelity Series Emerging Markets Fund, Fidelity Series Emerging Markets Opportunities Fund, Fidelity Series International Small Cap Fund, Fidelity Series International Value Fund, Fidelity Series Overseas Fund, Fidelity Total International Equity Fund and Fidelity Worldwide Fund (the “Fund(s)”):
Services Billed by Deloitte Entities
October 31, 2020 FeesA
| | | | |
| Audit Fees | Audit-Related Fees | Tax Fees | All Other Fees |
Fidelity Diversified International Fund | $58,600 | $- | $11,400 | $1,200 |
Fidelity Diversified International K6 Fund | $56,600 | $- | $11,100 | $1,200 |
Fidelity Emerging Europe, Middle East, Africa (EMEA) Fund | $47,000 | $- | $9,700 | $1,100 |
Fidelity Flex International Fund | $50,100 | $- | $10,400 | $1,200 |
Fidelity Global Equity Income Fund | $47,100 | $- | $9,700 | $1,100 |
Fidelity International Capital Appreciation Fund | $52,200 | $- | $11,100 | $1,200 |
Fidelity International Capital Appreciation K6 Fund | $52,200 | $- | $11,300 | $1,200 |
Fidelity International Discovery K6 Fund | $49,000 | $- | $10,900 | $1,100 |
Fidelity International Small Cap Fund | $55,100 | $- | $11,100 | $1,300 |
Fidelity International Small Cap Opportunities Fund | $49,500 | $- | $8,800 | $1,200 |
Fidelity International Value Fund | $47,600 | $- | $8,800 | $1,100 |
Fidelity SAI International SMA Completion Fund | $45,700 | $- | $11,300 | $1,100 |
Fidelity Series Emerging Markets Fund | $44,000 | $- | $11,200 | $1,100 |
Fidelity Series Emerging Markets Opportunities Fund | $42,400 | $- | $11,400 | $1,100 |
Fidelity Series International Small Cap Fund | $41,700 | $- | $8,800 | $1,000 |
Fidelity Series International Value Fund | $41,500 | $- | $8,800 | $1,000 |
Fidelity Series Overseas Fund | $47,200 | $- | $9,000 | $1,000 |
Fidelity Total International Equity Fund | $51,600 | $- | $10,600 | $1,200 |
Fidelity Worldwide Fund | $49,200 | $- | $9,100 | $1,200 |
| | | | |
| Audit Fees | Audit-Related Fees | Tax Fees | All Other Fees |
Fidelity Diversified International Fund | $103,000 | $100 | $7,400 | $1,400 |
Fidelity Diversified International K6 Fund | $149,000 | $100 | $7,100 | $1,400 |
Fidelity Emerging Europe, Middle East, Africa (EMEA) Fund | $51,000 | $100 | $6,200 | $1,300 |
Fidelity Flex International Fund | $54,000 | $100 | $6,900 | $1,400 |
Fidelity Global Equity Income Fund | $47,000 | $100 | $6,300 | $1,200 |
Fidelity International Capital Appreciation Fund | $64,000 | $100 | $7,100 | $1,400 |
Fidelity International Capital Appreciation K6 Fund | $69,000 | $100 | $7,300 | $1,400 |
Fidelity International Discovery K6 Fund | $43,000 | $- | $6,900 | $300 |
Fidelity International Small Cap Fund | $59,000 | $100 | $7,100 | $1,500 |
Fidelity International Small Cap Opportunities Fund | $52,000 | $100 | $6,000 | $1,400 |
Fidelity International Value Fund | $51,000 | $100 | $6,000 | $1,300 |
Fidelity SAI International SMA Completion Fund | $43,000 | $- | $7,100 | $500 |
Fidelity Series Emerging Markets Fund | $68,000 | $100 | $7,100 | $1,200 |
Fidelity Series Emerging Markets Opportunities Fund | $46,000 | $100 | $7,400 | $1,200 |
Fidelity Series International Small Cap Fund | $45,000 | $100 | $6,000 | $1,200 |
Fidelity Series International Value Fund | $44,000 | $100 | $6,000 | $1,200 |
Fidelity Series Overseas Fund | $41,000 | $- | $6,000 | $300 |
Fidelity Total International Equity Fund | $56,000 | $100 | $6,900 | $1,500 |
Fidelity Worldwide Fund | $52,000 | $100 | $6,300 | $1,300 |
A Amounts may reflect rounding.
B Fidelity SAI International SMA Completion Fund commenced operations on April 11, 2019, Fidelity International Discovery K6 Fund commenced operations on June 13, 2019 and Fidelity Series Overseas Fund commenced operations on June 21, 2019.
The following table presents fees billed by PricewaterhouseCoopers LLP (“PwC”) in each of the last two fiscal years for services rendered to Fidelity Canada Fund, Fidelity China Region Fund, Fidelity Emerging Asia Fund, Emerging Markets Discovery Fund, Fidelity Emerging Markets Fund, Fidelity Enduring Opportunities Fund, Fidelity Europe Fund, Fidelity Global Commodity Stock Fund, Fidelity Infrastructure Fund, Fidelity International Discovery Fund, Fidelity International Growth Fund, Fidelity Japan Fund, Fidelity Japan Smaller Companies Fund, Fidelity Latin America Fund, Fidelity Nordic Fund, Fidelity Overseas Fund, Fidelity Pacific Basin Fund, Fidelity Series Canada Fund, Fidelity Series International Growth Fund and Fidelity Total Emerging Markets Fund (the “Fund(s)”):
Services Billed by PwC
October 31, 2020 FeesA,B
| | | | |
| Audit Fees | Audit-Related Fees | Tax Fees | All Other Fees |
Fidelity Canada Fund | $52,000 | $4,600 | $10,600 | $1,900 |
Fidelity China Region Fund | $59,500 | $5,500 | $10,600 | $2,200 |
Fidelity Emerging Asia Fund | $55,800 | $4,900 | $10,600 | $2,000 |
Fidelity Emerging Markets Discovery Fund | $45,700 | $4,400 | $10,600 | $1,800 |
Fidelity Emerging Markets Fund | $66,100 | $5,700 | $10,900 | $2,300 |
Fidelity Enduring Opportunities Fund | $24,400 | $2,300 | $6,300 | $900 |
Fidelity Europe Fund | $55,400 | $5,200 | $10,600 | $2,100 |
Fidelity Global Commodity Stock Fund | $35,700 | $3,300 | $5,800 | $1,300 |
Fidelity Infrastructure Fund | $31,600 | $2,800 | $7,200 | $1,100 |
Fidelity International Discovery Fund | $90,400 | $5,700 | $13,100 | $2,300 |
Fidelity International Growth Fund | $47,300 | $4,500 | $10,600 | $1,800 |
Fidelity Japan Fund | $54,200 | $5,000 | $10,600 | $2,000 |
Fidelity Japan Smaller Companies Fund | $42,800 | $4,200 | $10,600 | $1,700 |
Fidelity Latin America Fund | $53,200 | $5,000 | $10,600 | $2,000 |
Fidelity Nordic Fund | $42,300 | $4,200 | $10,600 | $1,700 |
Fidelity Overseas Fund | $58,700 | $5,200 | $13,100 | $2,100 |
Fidelity Pacific Basin Fund | $51,900 | $5,000 | $12,300 | $2,000 |
Fidelity Series Canada Fund | $44,100 | $4,200 | $10,700 | $1,700 |
Fidelity Series International Growth Fund | $38,400 | $3,800 | $9,900 | $1,500 |
Fidelity Total Emerging Markets Fund | $52,500 | $4,900 | $9,800 | $2,000 |
| | | | |
| Audit Fees | Audit-Related Fees | Tax Fees | All Other Fees |
Fidelity Canada Fund | $63,000 | $4,600 | $5,300 | $2,100 |
Fidelity China Region Fund | $75,000 | $5,500 | $5,300 | $2,500 |
Fidelity Emerging Asia Fund | $59,000 | $4,900 | $5,300 | $2,200 |
Fidelity Emerging Markets Discovery Fund | $60,000 | $4,400 | $5,300 | $2,000 |
|
|
|
|
|
|
|
|
|
|
|
|
|
|
|
Fidelity Emerging Markets Fund | $68,000 | $5,700 | $5,500 | $2,600 |
Fidelity Enduring Opportunities Fund | $- | $- | $- | $- |
Fidelity Europe Fund | $70,000 | $5,200 | $5,300 | $2,300 |
Fidelity Global Commodity Stock Fund | $48,000 | $3,300 | $2,900 | $1,500 |
Fidelity Infrastructure Fund | $- | $- | $- | $- |
Fidelity International Discovery Fund | $79,000 | $5,700 | $5,500 | $2,600 |
Fidelity International Growth Fund | $55,000 | $4,600 | $5,300 | $2,100 |
Fidelity Japan Fund | $69,000 | $5,000 | $5,300 | $2,300 |
Fidelity Japan Smaller Companies Fund | $50,000 | $4,200 | $5,300 | $1,900 |
Fidelity Latin America Fund | $68,000 | $5,000 | $5,300 | $2,300 |
Fidelity Nordic Fund | $50,000 | $4,200 | $6,100 | $1,900 |
Fidelity Overseas Fund | $63,000 | $5,200 | $5,500 | $2,300 |
Fidelity Pacific Basin Fund | $61,000 | $5,000 | $5,500 | $2,300 |
Fidelity Series Canada Fund | $50,000 | $4,100 | $5,300 | $1,800 |
Fidelity Series International Growth Fund | $45,000 | $3,800 | $5,300 | $1,700 |
Fidelity Total Emerging Markets Fund | $67,000 | $4,900 | $4,400 | $2,200 |
A Amounts may reflect rounding.
B Fidelity Enduring Opportunities Fund and Fidelity Infrastructure Fund commenced operations on November 5, 2019.
The following table(s) present(s) fees billed by Deloitte Entities and PwC that were required to be approved by the Audit Committee for services that relate directly to the operations and financial reporting of the Fund(s) and that are rendered on behalf of Fidelity Management & Research Company LLC ("FMR") and entities controlling, controlled by, or under common control with FMR (not including any sub-adviser whose role is primarily portfolio management and is subcontracted with or overseen by another investment adviser) that provide ongoing services to the Fund(s) (“Fund Service Providers”):
Services Billed by Deloitte Entities
| | |
| October 31, 2020A | October 31, 2019A,B |
Audit-Related Fees | $- | $290,000 |
Tax Fees | $- | $5,000 |
All Other Fees | $- | $- |
A Amounts may reflect rounding.
B May include amounts billed prior to the Fidelity SAI International SMA Completion Fund, Fidelity International Discovery K6 Fund and Fidelity Series Overseas Funds’ commencement of operations.
Services Billed by PwC
| | |
| October 31, 2020A,B | October 31, 2019A,B |
Audit-Related Fees | $9,030,200 | $7,890,000 |
Tax Fees | $30,000 | $10,000 |
All Other Fees | $- | $- |
A Amounts may reflect rounding.
B Fidelity Enduring Opportunities Fund and Fidelity Infrastructure Funds’ commencement of operations.
“Audit-Related Fees” represent fees billed for assurance and related services that are reasonably related to the performance of the fund audit or the review of the fund's financial statements and that are not reported under Audit Fees.
“Tax Fees” represent fees billed for tax compliance, tax advice or tax planning that relate directly to the operations and financial reporting of the fund.
“All Other Fees” represent fees billed for services provided to the fund or Fund Service Provider, a significant portion of which are assurance related, that relate directly to the operations and financial reporting of the fund, excluding those services that are reported under Audit Fees, Audit-Related Fees or Tax Fees.
Assurance services must be performed by an independent public accountant.
* * *
The aggregate non-audit fees billed by Deloitte Entities and PwC for services rendered to the Fund(s), FMR (not including any sub-adviser whose role is primarily portfolio management and is subcontracted with or overseen by another investment adviser), and any Fund Service Provider for each of the last two fiscal years of the Fund(s) are as follows:
| | |
Billed By | October 31, 2020A,B | October 31, 2019A,B,C |
Deloitte Entities | $717,700 | $725,000 |
PwC | $14,433,400 | $12,760,000 |
A Amounts may reflect rounding.
B May include amounts billed prior to the Fidelity Enduring Opportunities Fund and Fidelity Infrastructure Fund’s commencement of operations.
C May include amounts billed prior to the Fidelity SAI International SMA Completion Fund, Fidelity International Discovery K6 Fund and Fidelity Series Overseas Funds’ commencement of operations.
The trust's Audit Committee has considered non-audit services that were not pre-approved that were provided by Deloitte Entities and PwC to Fund Service Providers to be compatible with maintaining the independence of Deloitte Entities and PwC in its(their) audit of the Fund(s), taking into account representations from Deloitte Entities and PwC, in accordance with Public Company Accounting Oversight Board rules, regarding its independence from the Fund(s) and its(their) related entities and FMR’s review of the appropriateness and permissibility under applicable law of such non-audit services prior to their provision to the Fund(s) Service Providers.
Audit Committee Pre-Approval Policies and Procedures
The trust’s Audit Committee must pre-approve all audit and non-audit services provided by a fund’s independent registered public accounting firm relating to the operations or financial reporting of the fund. Prior to the commencement of any audit or non-audit services to a fund, the Audit Committee reviews the services to determine whether they are appropriate and permissible under applicable law.
The Audit Committee has adopted policies and procedures to, among other purposes, provide a framework for the Committee’s consideration of non-audit services by the audit firms that audit the Fidelity funds. The policies and procedures require that any non-audit service provided by a fund audit firm to a Fidelity fund and any non-audit service provided by a fund auditor to a Fund Service Provider that relates directly to the operations and financial reporting of a Fidelity fund (“Covered Service”) are subject to approval by the Audit Committee before such service is provided.
All Covered Services must be approved in advance of provision of the service either: (i) by formal resolution of the Audit Committee, or (ii) by oral or written approval of the service by the Chair of the Audit Committee (or if the Chair is unavailable, such other member of the Audit Committee as may be designated by the Chair to act in the Chair’s absence). The approval contemplated by (ii) above is permitted where the Treasurer determines that action on such an engagement is necessary before the next meeting of the Audit Committee.
Non-audit services provided by a fund audit firm to a Fund Service Provider that do not relate directly to the operations and financial reporting of a Fidelity fund are reported to the Audit Committee periodically.
Non-Audit Services Approved Pursuant to Rule 2-01(c)(7)(i)(C) and (ii) of Regulation S-X (“De Minimis Exception”)
There were no non-audit services approved or required to be approved by the Audit Committee pursuant to the De Minimis Exception during the Fund’s(s’) last two fiscal years relating to services provided to (i) the Fund(s) or (ii) any Fund Service Provider that relate directly to the operations and financial reporting of the Fund(s).
Item 5.
Audit Committee of Listed Registrants
Not applicable.
Item 6.
Investments
(a)
Not applicable.
(b)
Not applicable.
Item 7.
Disclosure of Proxy Voting Policies and Procedures for Closed-End Management Investment Companies
Not applicable.
Item 8.
Portfolio Managers of Closed-End Management Investment Companies
Not applicable.
Item 9.
Purchase of Equity Securities by Closed-End Management Investment Company and Affiliated Purchasers
Not applicable.
Item 10.
Submission of Matters to a Vote of Security Holders
There were no material changes to the procedures by which shareholders may recommend nominees to the trust’s Board of Trustees.
Item 11.
Controls and Procedures
(a)(i) The President and Treasurer and the Chief Financial Officer have concluded that the trust’s disclosure controls and procedures (as defined in Rule 30a-3(c) under the Investment Company Act) provide reasonable assurances that material information relating to the trust is made known to them by the appropriate persons, based on their evaluation of these controls and procedures as of a date within 90 days of the filing date of this report.
(a)(ii) There was no change in the trust’s internal control over financial reporting (as defined in Rule 30a-3(d) under the Investment Company Act) that occurred during the period covered by this report that has materially affected, or is reasonably likely to materially affect, the trust’s internal control over financial reporting.
Item 12.
Disclosure of Securities Lending Activities for Closed-End Management
Investment Companies
Not applicable.
Item 13.
Exhibits
SIGNATURES
Pursuant to the requirements of the Securities Exchange Act of 1934 and the Investment Company Act of 1940, the registrant has duly caused this report to be signed on its behalf by the undersigned, thereunto duly authorized.
Fidelity Investment Trust
| |
By: | /s/Stacie M. Smith |
| Stacie M. Smith |
| President and Treasurer |
|
|
Date: | December 18, 2020 |
Pursuant to the requirements of the Securities Exchange Act of 1934 and the Investment Company Act of 1940, this report has been signed below by the following persons on behalf of the registrant and in the capacities and on the dates indicated.
| |
By: | /s/Stacie M. Smith |
| Stacie M. Smith |
| President and Treasurer |
|
|
Date: | December 18, 2020 |
| |
By: | /s/John J. Burke III |
| John J. Burke III |
| Chief Financial Officer |
|
|
Date: | December 18, 2020 |