UNITED STATES
SECURITIES AND EXCHANGE COMMISSION
Washington, D.C. 20549
FORM N-CSR
CERTIFIED SHAREHOLDER REPORT OF REGISTERED
MANAGEMENT INVESTMENT COMPANIES
Investment Company Act file number 811-4008
Fidelity Investment Trust
(Exact name of registrant as specified in charter)
245 Summer St., Boston, Massachusetts 02210
(Address of principal executive offices) (Zip code)
William C. Coffey, Secretary
245 Summer St.
Boston, Massachusetts 02210
(Name and address of agent for service)
Registrant's telephone number, including area code:
617-563-7000
| |
Date of fiscal year end: | October 31 |
| |
Date of reporting period: | October 31, 2018 |
This report on Form N-CSR relates solely to the Registrant’s Fidelity Diversified International K6 Fund, Fidelity Emerging Europe, Middle East, Africa (EMEA) Fund, Fidelity Emerging Markets Discovery Fund, Fidelity Flex International Fund, Fidelity Global Commodity Stock Fund, Fidelity Global Equity Income Fund, Fidelity International Capital Appreciation K6 Fund, Fidelity International Discovery Fund, Fidelity International Growth Fund, Fidelity International Small Cap Fund, Fidelity International Small Cap Opportunities Fund, Fidelity International Value Fund, Fidelity Series Canada Fund, Fidelity Series Emerging Markets Fund, Fidelity Series Emerging Markets Opportunities Fund, Fidelity Series International Growth Fund, Fidelity Series International Small Cap Fund, Fidelity Series International Value Fund, Fidelity Total Emerging Markets Fund and Fidelity Total International Equity Fund (each, a “Fund” and collectively, the “Funds”).
Item 1.
Reports to Stockholders
Fidelity Advisor® International Small Cap Fund - Class A, Class M, Class C, Class I and Class Z
Annual Report October 31, 2018 Class A, Class M, Class C, Class I and Class Z are classes of Fidelity® International Small Cap Fund |
 |
Contents
To view a fund's proxy voting guidelines and proxy voting record for the 12-month period ended June 30, visit http://www.fidelity.com/proxyvotingresults or visit the Securities and Exchange Commission's (SEC) web site at http://www.sec.gov.
You may also call 1-877-208-0098 to request a free copy of the proxy voting guidelines.
Standard & Poor's, S&P and S&P 500 are registered service marks of The McGraw-Hill Companies, Inc. and have been licensed for use by Fidelity Distributors Corporation.
Other third-party marks appearing herein are the property of their respective owners.
All other marks appearing herein are registered or unregistered trademarks or service marks of FMR LLC or an affiliated company. © 2018 FMR LLC. All rights reserved.
This report and the financial statements contained herein are submitted for the general information of the shareholders of the Fund. This report is not authorized for distribution to prospective investors in the Fund unless preceded or accompanied by an effective prospectus.
A fund files its complete schedule of portfolio holdings with the SEC for the first and third quarters of each fiscal year on Form N-Q. Forms N-Q are available on the SEC’s web site at http://www.sec.gov. A fund's Forms N-Q may be reviewed and copied at the SEC’s Public Reference Room in Washington, DC. Information regarding the operation of the SEC's Public Reference Room may be obtained by calling 1-800-SEC-0330.
For a complete list of a fund's portfolio holdings, view the most recent holdings listing, semiannual report, or annual report on Fidelity's web site at http://www.fidelity.com, http://www.institutional.fidelity.com, or http://www.401k.com, as applicable.
NOT FDIC INSURED •MAY LOSE VALUE •NO BANK GUARANTEE
Neither the Fund nor Fidelity Distributors Corporation is a bank.
Performance: The Bottom Line
Average annual total return reflects the change in the value of an investment, assuming reinvestment of distributions from dividend income and capital gains (the profits earned upon the sale of securities that have grown in value, if any) and assuming a constant rate of performance each year. The hypothetical investment and the average annual total returns do not reflect the deduction of taxes that a shareholder would pay on fund distributions or the redemption of fund shares. During periods of reimbursement by Fidelity, a fund’s total return will be greater than it would be had the reimbursement not occurred. How a fund did yesterday is no guarantee of how it will do tomorrow.
Average Annual Total Returns
| For the periods ended October 31, 2018 | Past 1 year | Past 5 years | Past 10 years |
| Class A (incl. 5.75% sales charge) | (14.07)% | 4.02% | 11.49% |
| Class M (incl. 3.50% sales charge) | (12.28)% | 4.23% | 11.45% |
| Class C (incl. contingent deferred sales charge) | (10.39)% | 4.47% | 11.31% |
| Class I | (8.58)% | 5.61% | 12.52% |
| Class Z | (8.55)% | 5.62% | 12.52% |
Prior to April 1, 2014, the fund compared its performance to a different benchmark. The fund's historical performance may not represent its current investment policies.
Class C shares' contingent deferred sales charges included in the past one year, past five years and past ten years total return figures are 1%, 0% and 0%, respectively.
The initial offering of Class Z shares took place on October 2, 2018. Returns prior to October 2, 2018, are those of Class I.
$10,000 Over 10 Years
Let's say hypothetically that $10,000 was invested in Fidelity Advisor® International Small Cap Fund - Class A on October 31, 2008, and the current 5.75% sales charge was paid.
The chart shows how the value of your investment would have changed, and also shows how the MSCI ACWI (All Country World Index) ex USA Small Cap Index performed over the same period.
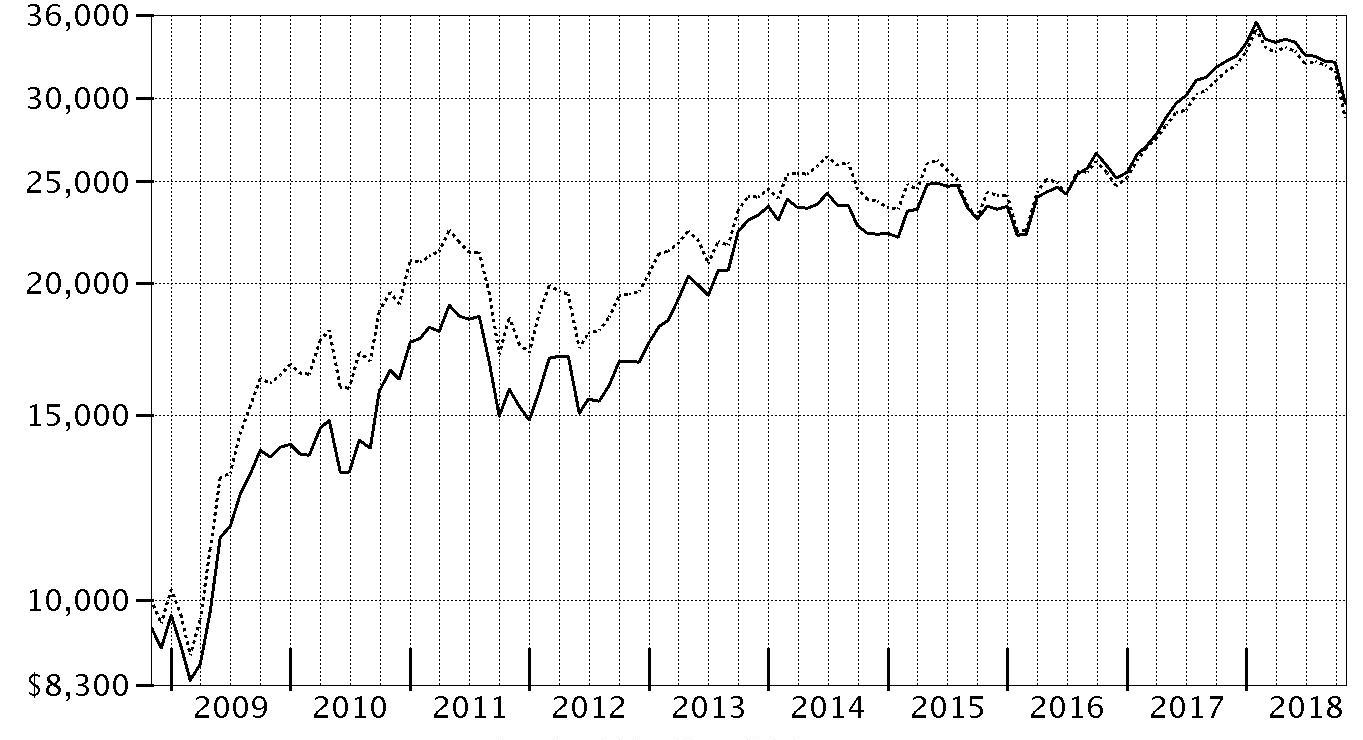
| Period Ending Values |
| $29,673 | Fidelity Advisor® International Small Cap Fund - Class A |
| $28,744 | MSCI ACWI (All Country World Index) ex USA Small Cap Index |
Management's Discussion of Fund Performance
Market Recap: International equities returned -8.08% for the 12 months ending October 31, 2018, according to the MSCI ACWI (All Country World Index) ex USA Index. A modestly positive first half of the period gave way to a confluence of overwhelmingly negative factors – including escalating trade tension, a surging U.S. dollar, tepid economic growth in Europe, global central bank tightening, concerns about Italy’s budget stalemate with the EU, and weakness in China’s stock market – that yielded a -11% second-half return. The index lost 8% in October alone, its largest monthly drop in more than six years. Among sectors, new-media-infused communications services (-15%) was hit the hardest, while economically sensitive consumer discretionary (-13%), information technology (-12%), financials (-10%), industrials (-9%) and materials (-7%) stocks also fared poorly. Even the more defensive real estate (-9%), utilities (-6%) and consumer staples (-5%) sectors weren’t spared this period. Conversely, elevated crude-oil prices fueled a positive return for energy (+7%), the top-performing sector, followed by the relatively stable-growing health care segment (+2%). Regionally, emerging markets (-12%) fared the worst, hampered by the impact of foreign exchange and concerns about economic weakness in China, India and South Korea. Sluggish growth also pressured shares in continental Europe (-9%). Stocks in Japan (-3%) and the U.K. (-4%) held up better, followed by Canada (-5%) and Asia-Pacific ex Japan (-6%).
Comments from Portfolio Manager Samuel Chamovitz: For the year, the fund’s share classes (excluding sales charges, if applicable) returned in the range of roughly -8.5% to -9.5%, ahead of the -9.62% return of the benchmark MSCI ACWI (All Country World Index) ex USA Small Cap Index. Versus the benchmark, stock selection in industrials aided fund performance, while picks in financials and information technology helped to a lesser extent. A cash position also was beneficial in a declining market. Geographically, positioning in emerging markets bolstered relative performance, along with stock picking in Japan and non-benchmark exposure to the United States. At the stock level, an out-of-benchmark position in Luxfer Holdings was the fund’s top relative contributor. This U.K.-based firm designs, manufactures and supplies high-performance materials, components and high-pressure gas-containment devices. Positioning in Yageo, a Taiwan-based maker of passive electrical components, also added value. I exited this position. A non-index stake in LivaNova, a London-based maker of medical devices, helped as well. Conversely, positioning in the real estate sector detracted, as did stock choices in consumer discretionary. Regionally, picks in the U.K. detracted, along with stock selection in Australia and Canada. A non-index position in U.K.-based enterprise software provider Micro Focus International was the fund’s biggest relative detractor. An out-of-benchmark stake in U.K.-based McColl’s Retail Group further detracted.
The views expressed above reflect those of the portfolio manager(s) only through the end of the period as stated on the cover of this report and do not necessarily represent the views of Fidelity or any other person in the Fidelity organization. Any such views are subject to change at any time based upon market or other conditions and Fidelity disclaims any responsibility to update such views. These views may not be relied on as investment advice and, because investment decisions for a Fidelity fund are based on numerous factors, may not be relied on as an indication of trading intent on behalf of any Fidelity fund.
Investment Summary (Unaudited)
Geographic Diversification (% of fund's net assets)
| As of October 31, 2018 |
| | Japan | 22.2% |
| | United Kingdom | 17.2% |
| | Canada | 5.7% |
| | Australia | 5.1% |
| | Taiwan | 4.0% |
| | United States of America* | 3.9% |
| | Cayman Islands | 3.7% |
| | France | 3.2% |
| | Finland | 2.9% |
| | Other | 32.1% |
* Includes Short-Term investments and Net Other Assets (Liabilities).
Percentages are based on country or territory of incorporation and are adjusted for the effect of futures contracts, if applicable.
Asset Allocation as of October 31, 2018
| | % of fund's net assets |
| Stocks | 96.1 |
| Short-Term Investments and Net Other Assets (Liabilities) | 3.9 |
Top Ten Stocks as of October 31, 2018
| | % of fund's net assets |
| S Foods, Inc. (Japan, Food Products) | 1.3 |
| LivaNova PLC (United Kingdom, Health Care Equipment & Supplies) | 1.1 |
| Inghams Group Ltd. (Australia, Food Products) | 1.1 |
| John Wood Group PLC (United Kingdom, Energy Equipment & Services) | 1.0 |
| Ship Healthcare Holdings, Inc. (Japan, Health Care Providers & Services) | 1.0 |
| JSR Corp. (Japan, Chemicals) | 1.0 |
| Luxfer Holdings PLC sponsored (United Kingdom, Machinery) | 1.0 |
| Cineworld Group PLC (United Kingdom, Entertainment) | 1.0 |
| Micro Focus International PLC (United Kingdom, Software) | 0.9 |
| PALTAC Corp. (Japan, Distributors) | 0.9 |
| | 10.3 |
Top Market Sectors as of October 31, 2018
| | % of fund's net assets |
| Industrials | 19.4 |
| Consumer Discretionary | 14.5 |
| Financials | 13.5 |
| Consumer Staples | 10.3 |
| Materials | 9.6 |
| Information Technology | 8.1 |
| Health Care | 7.6 |
| Real Estate | 5.9 |
| Energy | 3.8 |
| Communication Services | 2.6 |
Schedule of Investments October 31, 2018
Showing Percentage of Net Assets
| Common Stocks - 95.7% | | | |
| | | Shares | Value |
| Australia - 5.1% | | | |
| Aub Group Ltd. | | 897,658 | $8,562,563 |
| Austal Ltd. | | 944,082 | 1,196,707 |
| Challenger Ltd. | | 746,361 | 5,422,775 |
| GUD Holdings Ltd. | | 1,651,154 | 14,428,726 |
| Hansen Technologies Ltd. | | 3,299,442 | 8,084,289 |
| Imdex Ltd. (a) | | 11,388,898 | 9,274,805 |
| Inghams Group Ltd. (b) | | 7,861,299 | 21,711,218 |
| Nanosonics Ltd. (a) | | 4,278,690 | 9,089,863 |
| Pact Group Holdings Ltd. (c) | | 3,120,432 | 7,711,971 |
| Reckon Ltd. | | 5,193,683 | 2,666,482 |
| Servcorp Ltd. | | 3,379,081 | 8,399,066 |
| SomnoMed Ltd. (a)(b) | | 2,687,331 | 3,006,793 |
|
| TOTAL AUSTRALIA | | | 99,555,258 |
|
| Austria - 2.4% | | | |
| Andritz AG | | 192,432 | 9,973,763 |
| IMMOFINANZ Immobilien Anlagen AG | | 608,174 | 14,507,145 |
| Mayr-Melnhof Karton AG | | 76,300 | 9,661,890 |
| Wienerberger AG | | 594,700 | 13,687,287 |
|
| TOTAL AUSTRIA | | | 47,830,085 |
|
| Belgium - 0.6% | | | |
| Barco NV | | 104,983 | 11,962,245 |
| Bermuda - 1.7% | | | |
| China Resource Gas Group Ltd. | | 2,916,000 | 11,155,389 |
| Hiscox Ltd. | | 660,225 | 13,738,685 |
| Petra Diamonds Ltd. (a)(b) | | 16,078,352 | 8,043,798 |
|
| TOTAL BERMUDA | | | 32,937,872 |
|
| Brazil - 1.8% | | | |
| Estacio Participacoes SA | | 2,667,500 | 16,579,141 |
| Sul America SA unit | | 2,657,900 | 17,712,191 |
|
| TOTAL BRAZIL | | | 34,291,332 |
|
| Canada - 5.7% | | | |
| Dorel Industries, Inc. Class B (sub. vtg.) | | 426,803 | 6,976,946 |
| Genesis Land Development Corp. (d) | | 2,266,422 | 5,698,551 |
| Lassonde Industries, Inc. Class A (sub. vtg.) | | 89,669 | 15,815,447 |
| McCoy Global, Inc. (a) | | 1,334,670 | 1,165,916 |
| North West Co., Inc. | | 780,500 | 17,015,724 |
| Open Text Corp. | | 346,496 | 11,696,823 |
| Pinnacle Renewable Holds, Inc. | | 1,114,525 | 12,258,971 |
| Total Energy Services, Inc. | | 622,200 | 4,504,209 |
| TransForce, Inc. | | 421,800 | 14,037,037 |
| Western Forest Products, Inc. | | 9,524,900 | 12,734,114 |
| Whitecap Resources, Inc. | | 2,222,553 | 10,872,605 |
|
| TOTAL CANADA | | | 112,776,343 |
|
| Cayman Islands - 3.7% | | | |
| AMVIG Holdings Ltd. | | 28,280,000 | 7,068,242 |
| Best Pacific International Holdings Ltd. (b) | | 17,964,000 | 4,581,514 |
| China High Precision Automation Group Ltd. (a)(e) | | 712,000 | 1 |
| China Metal Recycling (Holdings) Ltd. (a)(e) | | 436,800 | 1 |
| Haitian International Holdings Ltd. | | 4,404,000 | 8,592,404 |
| Pico Far East Holdings Ltd. | | 24,510,000 | 8,282,570 |
| Precision Tsugami China Corp. Ltd. | | 7,854,000 | 7,160,987 |
| SITC International Holdings Co. Ltd. | | 20,744,000 | 15,236,700 |
| Value Partners Group Ltd. | | 14,410,000 | 10,694,559 |
| Xingda International Holdings Ltd. | | 41,759,909 | 11,236,160 |
|
| TOTAL CAYMAN ISLANDS | | | 72,853,138 |
|
| China - 1.1% | | | |
| Qingdao Port International Co. Ltd. (a)(c) | | 19,928,000 | 11,689,542 |
| Weifu High-Technology Group Co. Ltd. (B Shares) | | 5,679,604 | 9,893,380 |
|
| TOTAL CHINA | | | 21,582,922 |
|
| Denmark - 1.6% | | | |
| Jyske Bank A/S (Reg.) | | 193,403 | 7,907,123 |
| Scandinavian Tobacco Group A/S (c) | | 860,128 | 13,051,632 |
| Spar Nord Bank A/S | | 1,293,600 | 10,722,883 |
|
| TOTAL DENMARK | | | 31,681,638 |
|
| Finland - 2.9% | | | |
| Ahlstrom-Munksjo Oyj | | 602,100 | 9,383,887 |
| Asiakastieto Group Oyj (c) | | 487,423 | 16,010,310 |
| Cramo Oyj (B Shares) | | 445,510 | 8,487,488 |
| Kojamo OYJ | | 854,600 | 8,807,493 |
| Olvi PLC (A Shares) | | 341,938 | 11,463,964 |
| Tikkurila Oyj (b) | | 239,619 | 3,262,282 |
|
| TOTAL FINLAND | | | 57,415,424 |
|
| France - 3.2% | | | |
| Altarea SCA | | 61,330 | 13,490,185 |
| Maisons du Monde SA (c) | | 364,707 | 9,145,710 |
| Rexel SA | | 680,700 | 8,689,112 |
| The Vicat Group | | 215,956 | 11,618,622 |
| Thermador Groupe SA | | 152,666 | 8,230,856 |
| Wendel SA | | 94,535 | 12,270,803 |
|
| TOTAL FRANCE | | | 63,445,288 |
|
| Germany - 1.0% | | | |
| Bertrandt AG | | 155,600 | 12,883,169 |
| SHW Group | | 270,539 | 6,787,336 |
|
| TOTAL GERMANY | | | 19,670,505 |
|
| Greece - 0.8% | | | |
| Mytilineos Holdings SA | | 1,748,116 | 15,463,828 |
| Hong Kong - 2.5% | | | |
| Dah Sing Banking Group Ltd. | | 8,122,800 | 15,433,626 |
| Far East Horizon Ltd. | | 8,745,000 | 8,475,188 |
| Magnificent Hotel Investment Ltd. | | 266,270,000 | 6,213,685 |
| Sino Land Ltd. | | 8,169,251 | 12,813,368 |
| Techtronic Industries Co. Ltd. | | 1,221,000 | 5,714,229 |
|
| TOTAL HONG KONG | | | 48,650,096 |
|
| India - 0.7% | | | |
| Torrent Pharmaceuticals Ltd. | | 593,358 | 13,378,634 |
| Indonesia - 0.6% | | | |
| PT ACE Hardware Indonesia Tbk | | 80,626,400 | 7,265,790 |
| PT Media Nusantara Citra Tbk | | 75,080,400 | 3,852,176 |
|
| TOTAL INDONESIA | | | 11,117,966 |
|
| Ireland - 1.7% | | | |
| Irish Residential Properties REIT PLC | | 6,909,400 | 11,128,475 |
| Mincon Group PLC | | 7,189,744 | 9,772,156 |
| Origin Enterprises PLC | | 920,300 | 5,910,282 |
| United Drug PLC (United Kingdom) | | 907,549 | 7,331,384 |
|
| TOTAL IRELAND | | | 34,142,297 |
|
| Italy - 1.2% | | | |
| Banca Generali SpA | | 533,000 | 10,281,053 |
| Banco di Desio e della Brianza SpA | | 2,376,445 | 4,871,942 |
| Recordati SpA | | 260,900 | 8,841,611 |
|
| TOTAL ITALY | | | 23,994,606 |
|
| Japan - 22.2% | | | |
| A/S One Corp. | | 168,900 | 12,004,945 |
| Aeon Delight Co. Ltd. | | 404,000 | 13,534,098 |
| Arata Corp. | | 387,700 | 17,592,272 |
| Arc Land Sakamoto Co. Ltd. | | 831,800 | 10,947,162 |
| Aucnet, Inc. | | 832,900 | 8,732,403 |
| Broadleaf Co. Ltd. | | 727,800 | 4,205,482 |
| Central Automotive Products Ltd. | | 339,100 | 4,613,094 |
| Daiwa Industries Ltd. | | 1,053,600 | 11,120,996 |
| Dexerials Corp. | | 1,321,000 | 11,367,847 |
| Funai Soken Holdings, Inc. | | 297,180 | 6,302,581 |
| GMO Internet, Inc. | | 708,900 | 10,127,592 |
| Iida Group Holdings Co. Ltd. | | 631,951 | 11,503,765 |
| Isuzu Motors Ltd. | | 1,062,000 | 13,923,403 |
| Japan Meat Co. Ltd. | | 657,800 | 11,921,842 |
| JSR Corp. | | 1,355,200 | 20,249,632 |
| Kirindo Holdings Co. Ltd. (d) | | 647,909 | 9,066,764 |
| Kotobuki Spirits Co. Ltd. | | 45,300 | 1,734,355 |
| Meitec Corp. | | 211,400 | 8,861,807 |
| Mitani Shoji Co. Ltd. | | 285,700 | 13,622,245 |
| Morinaga & Co. Ltd. | | 321,600 | 12,925,564 |
| Nihon Parkerizing Co. Ltd. | | 1,155,200 | 13,954,337 |
| Nitori Holdings Co. Ltd. | | 32,600 | 4,257,199 |
| Otsuka Corp. | | 205,500 | 6,829,663 |
| PALTAC Corp. | | 351,100 | 17,922,949 |
| Paramount Bed Holdings Co. Ltd. | | 413,500 | 17,425,378 |
| Renesas Electronics Corp. (a) | | 2,014,500 | 10,676,395 |
| Ricoh Leasing Co. Ltd. | | 179,300 | 5,887,415 |
| S Foods, Inc. | | 609,600 | 24,608,746 |
| San-Ai Oil Co. Ltd. | | 1,062,000 | 11,473,195 |
| Shinsei Bank Ltd. | | 1,002,800 | 15,275,649 |
| Ship Healthcare Holdings, Inc. | | 559,900 | 20,270,231 |
| Taiheiyo Cement Corp. | | 338,400 | 9,957,991 |
| TKC Corp. | | 259,000 | 9,870,164 |
| Toshiba Plant Systems & Services Corp. | | 711,800 | 14,559,617 |
| Tsuruha Holdings, Inc. | | 86,700 | 9,036,132 |
| VT Holdings Co. Ltd. | | 1,655,600 | 6,896,194 |
| Welcia Holdings Co. Ltd. | | 161,100 | 8,223,831 |
| Yamada Consulting Group Co. Ltd. | | 682,680 | 15,736,701 |
|
| TOTAL JAPAN | | | 437,219,636 |
|
| Korea (South) - 1.0% | | | |
| Hyundai Fire & Marine Insurance Co. Ltd. | | 350,666 | 12,846,484 |
| NS Shopping Co. Ltd. | | 738,049 | 6,985,915 |
|
| TOTAL KOREA (SOUTH) | | | 19,832,399 |
|
| Luxembourg - 0.2% | | | |
| Shurgard Self Storage Europe SARL | | 146,177 | 4,103,587 |
| Mexico - 0.9% | | | |
| Credito Real S.A.B. de CV | | 6,947,800 | 7,948,845 |
| Genomma Lab Internacional SA de CV (a) | | 13,512,000 | 8,680,620 |
|
| TOTAL MEXICO | | | 16,629,465 |
|
| Netherlands - 2.8% | | | |
| Amsterdam Commodities NV | | 443,955 | 9,312,701 |
| Arcadis NV | | 756,989 | 10,245,973 |
| Basic-Fit NV (a)(c) | | 279,800 | 8,065,499 |
| BinckBank NV | | 1,316,280 | 6,380,986 |
| Philips Lighting NV (c) | | 498,400 | 12,306,378 |
| RHI Magnesita NV | | 186,510 | 9,337,274 |
|
| TOTAL NETHERLANDS | | | 55,648,811 |
|
| New Zealand - 1.0% | | | |
| Air New Zealand Ltd. | | 5,215,371 | 9,529,213 |
| EBOS Group Ltd. | | 757,465 | 10,300,874 |
|
| TOTAL NEW ZEALAND | | | 19,830,087 |
|
| Norway - 0.7% | | | |
| ABG Sundal Collier ASA | | 9,702,926 | 5,812,686 |
| Skandiabanken ASA (c) | | 736,574 | 7,339,702 |
|
| TOTAL NORWAY | | | 13,152,388 |
|
| Philippines - 0.3% | | | |
| Century Pacific Food, Inc. | | 25,480,600 | 6,370,508 |
| Romania - 0.6% | | | |
| Banca Transilvania SA | | 22,226,361 | 12,523,110 |
| Singapore - 1.8% | | | |
| Boustead Singapore Ltd. | | 10,252,969 | 5,773,610 |
| Hour Glass Ltd. | | 8,713,000 | 3,994,336 |
| Mapletree Industrial (REIT) | | 8,724,394 | 11,652,261 |
| Wing Tai Holdings Ltd. | | 9,229,100 | 12,859,375 |
|
| TOTAL SINGAPORE | | | 34,279,582 |
|
| South Africa - 0.4% | | | |
| Clicks Group Ltd. | | 677,618 | 8,635,295 |
| Sweden - 1.9% | | | |
| AddTech AB (B Shares) | | 433,819 | 8,864,913 |
| Coor Service Management Holding AB (c) | | 780,600 | 5,501,899 |
| Dustin Group AB (b)(c) | | 1,416,345 | 11,360,291 |
| Dustin Group AB rights 11/7/18 (a)(b) | | 1,316,245 | 206,258 |
| Granges AB | | 1,060,021 | 11,212,802 |
|
| TOTAL SWEDEN | | | 37,146,163 |
|
| Switzerland - 0.7% | | | |
| Vontobel Holdings AG | | 208,799 | 12,957,293 |
| Taiwan - 4.0% | | | |
| King's Town Bank | | 10,376,000 | 9,903,290 |
| Lumax International Corp. Ltd. | | 4,466,600 | 8,973,451 |
| Makalot Industrial Co. Ltd. | | 2,855,540 | 15,310,465 |
| Sporton International, Inc. | | 2,646,740 | 9,831,078 |
| Test Research, Inc. | | 6,278,000 | 8,688,887 |
| Tripod Technology Corp. | | 4,665,000 | 11,255,487 |
| United Microelectronics Corp. | | 22,544,000 | 8,586,248 |
| Yung Chi Paint & Varnish Manufacturing Co. Ltd. | | 2,243,000 | 5,361,089 |
|
| TOTAL TAIWAN | | | 77,909,995 |
|
| Thailand - 1.5% | | | |
| Delta Electronics PCL (For. Reg.) | | 2,484,400 | 5,169,590 |
| Star Petroleum Refining PCL | | 36,584,100 | 15,555,965 |
| TISCO Financial Group PCL | | 3,832,700 | 9,102,085 |
|
| TOTAL THAILAND | | | 29,827,640 |
|
| Turkey - 0.2% | | | |
| Aygaz A/S | | 2,129,000 | 4,631,573 |
| United Kingdom - 17.2% | | | |
| AEW UK REIT PLC (b) | | 4,299,768 | 5,237,653 |
| Alliance Pharma PLC | | 10,916,365 | 9,320,803 |
| Bond International Software PLC (a)(e) | | 899,666 | 12 |
| Cineworld Group PLC | | 5,226,980 | 19,682,597 |
| Close Brothers Group PLC | | 481,823 | 9,065,550 |
| Countrywide PLC (a) | | 61,771,375 | 8,274,607 |
| Diploma PLC | | 593,351 | 9,973,239 |
| Elementis PLC | | 4,973,225 | 13,031,391 |
| Essentra PLC | | 1,892,691 | 9,241,488 |
| Indivior PLC (a) | | 1,927,100 | 4,639,473 |
| Informa PLC | | 1,097,924 | 10,014,423 |
| ITE Group PLC | | 12,845,930 | 9,359,211 |
| James Fisher and Sons PLC | | 284,500 | 6,160,195 |
| John Wood Group PLC | | 2,235,500 | 20,407,666 |
| Knights Group Holdings PLC (a)(d) | | 3,797,900 | 9,077,384 |
| LivaNova PLC (a) | | 196,600 | 22,017,234 |
| Luxfer Holdings PLC sponsored | | 860,709 | 19,865,164 |
| McColl's Retail Group PLC (d) | | 7,053,881 | 11,518,286 |
| Mears Group PLC | | 2,897,612 | 13,148,233 |
| Melrose Industries PLC | | 4,272,270 | 9,209,665 |
| Micro Focus International PLC | | 1,195,040 | 18,525,769 |
| Moneysupermarket.com Group PLC | | 3,472,579 | 13,018,562 |
| PayPoint PLC | | 806,811 | 8,157,313 |
| Sabre Insurance Group PLC (c) | | 2,916,015 | 9,839,941 |
| Spectris PLC | | 417,791 | 11,449,399 |
| Ten Entertainment Group PLC (d) | | 3,787,019 | 11,133,306 |
| The Weir Group PLC | | 621,638 | 12,602,002 |
| Topps Tiles PLC | | 6,514,169 | 5,237,312 |
| Tullett Prebon PLC | | 3,629,226 | 13,452,742 |
| Ultra Electronics Holdings PLC | | 373,197 | 6,859,553 |
| Volution Group PLC | | 3,956,300 | 8,748,511 |
|
| TOTAL UNITED KINGDOM | | | 338,268,684 |
|
| TOTAL COMMON STOCKS | | | |
| (Cost $1,897,164,960) | | | 1,881,715,693 |
|
| Nonconvertible Preferred Stocks - 0.4% | | | |
| Brazil - 0.4% | | | |
| Banco ABC Brasil SA | | | |
| (Cost $8,133,217) | | 2,035,858 | 8,845,848 |
|
| Money Market Funds - 4.1% | | | |
| Fidelity Cash Central Fund, 2.23% (f) | | 63,608,475 | 63,621,197 |
| Fidelity Securities Lending Cash Central Fund 2.23% (f)(g) | | 17,020,322 | 17,022,024 |
| TOTAL MONEY MARKET FUNDS | | | |
| (Cost $80,634,414) | | | 80,643,221 |
| TOTAL INVESTMENT IN SECURITIES - 100.2% | | | |
| (Cost $1,985,932,591) | | | 1,971,204,762 |
| NET OTHER ASSETS (LIABILITIES) - (0.2)% | | | (3,926,534) |
| NET ASSETS - 100% | | | $1,967,278,228 |
Categorizations in the Schedule of Investments are based on country or territory of incorporation.
Legend
(a) Non-income producing
(b) Security or a portion of the security is on loan at period end.
(c) Security exempt from registration under Rule 144A of the Securities Act of 1933. These securities may be resold in transactions exempt from registration, normally to qualified institutional buyers. At the end of the period, the value of these securities amounted to $112,022,875 or 5.7% of net assets.
(d) Affiliated company
(e) Level 3 security
(f) Affiliated fund that is generally available only to investment companies and other accounts managed by Fidelity Investments. The rate quoted is the annualized seven-day yield of the fund at period end. A complete unaudited listing of the fund's holdings as of its most recent quarter end is available upon request. In addition, each Fidelity Central Fund's financial statements, which are not covered by the Fund's Report of Independent Registered Public Accounting Firm, are available on the SEC's website or upon request.
(g) Investment made with cash collateral received from securities on loan.
Affiliated Central Funds
Information regarding fiscal year to date income earned by the Fund from investments in Fidelity Central Funds is as follows:
| Fund | Income earned |
| Fidelity Cash Central Fund | $1,601,702 |
| Fidelity Securities Lending Cash Central Fund | 387,206 |
| Total | $1,988,908 |
Amounts in the income column in the above table include any capital gain distributions from underlying funds, which are presented in the corresponding line-item in the Statement of Operations if applicable.
Other Affiliated Issuers
An affiliated company is a company in which the Fund has ownership of at least 5% of the voting securities. Fiscal year to date transactions with companies which are or were affiliates are as follows:
| Affiliate | Value, beginning of period | Purchases | Sales Proceeds | Dividend Income | Realized Gain (loss) | Change in Unrealized appreciation (depreciation) | Value, end of period |
| Genesis Land Development Corp. | $6,005,072 | $672,245 | $-- | $697,316 | $-- | $(978,766) | $5,698,551 |
| Kirindo Holdings Co. Ltd. | 8,403,137 | 433,323 | -- | 184,989 | -- | 230,304 | 9,066,764 |
| Knights Group Holdings PLC | -- | 7,376,799 | -- | -- | -- | 1,700,585 | 9,077,384 |
| McColl's Retail Group PLC | 14,243,650 | 8,050,485 | -- | 712,123 | -- | (10,775,849) | 11,518,286 |
| Ten Entertainment Group PLC | 10,172,260 | 863,195 | -- | 496,457 | -- | 97,851 | 11,133,306 |
| Total | $38,824,119 | $17,396,047 | $-- | $2,090,885 | $-- | $(9,725,875) | $46,494,291 |
Investment Valuation
The following is a summary of the inputs used, as of October 31, 2018, involving the Fund's assets and liabilities carried at fair value. The inputs or methodology used for valuing securities may not be an indication of the risk associated with investing in those securities. For more information on valuation inputs, and their aggregation into the levels used below, please refer to the Investment Valuation section in the accompanying Notes to Financial Statements.
| | Valuation Inputs at Reporting Date: |
| Description | Total | Level 1 | Level 2 | Level 3 |
| Investments in Securities: | | | | |
| Equities: | | | | |
| Communication Services | $51,190,977 | $51,190,977 | $-- | $-- |
| Consumer Discretionary | 279,600,386 | 265,676,983 | 13,923,403 | -- |
| Consumer Staples | 198,322,291 | 198,322,291 | -- | -- |
| Energy | 76,238,527 | 76,238,527 | -- | -- |
| Financials | 273,275,017 | 257,999,368 | 15,275,649 | -- |
| Health Care | 146,307,843 | 146,307,843 | -- | -- |
| Industrials | 384,606,116 | 384,606,116 | -- | -- |
| Information Technology | 163,468,753 | 136,356,723 | 27,112,017 | 13 |
| Materials | 184,792,903 | 174,834,911 | 9,957,991 | 1 |
| Real Estate | 116,971,766 | 116,971,766 | -- | -- |
| Utilities | 15,786,962 | 15,786,962 | -- | -- |
| Money Market Funds | 80,643,221 | 80,643,221 | -- | -- |
| Total Investments in Securities: | $1,971,204,762 | $1,904,935,688 | $66,269,060 | $14 |
The following is a summary of transfers between Level 1 and Level 2 for the period ended October 31, 2018. Transfers are assumed to have occurred at the beginning of the period, and are primarily attributable to the valuation techniques used for foreign equity securities, as discussed in the accompanying Notes to Financial Statements:
| Transfers | Total |
| Level 1 to Level 2 | $19,940,948 |
| Level 2 to Level 1 | $326,046,864 |
See accompanying notes which are an integral part of the financial statements.
Financial Statements
Statement of Assets and Liabilities
| | | October 31, 2018 |
| Assets | | |
Investment in securities, at value (including securities loaned of $16,054,694) — See accompanying schedule:
Unaffiliated issuers (cost $1,858,794,155) | $1,844,067,250 | |
| Fidelity Central Funds (cost $80,634,414) | 80,643,221 | |
| Other affiliated issuers (cost $46,504,022) | 46,494,291 | |
| Total Investment in Securities (cost $1,985,932,591) | | $1,971,204,762 |
| Foreign currency held at value (cost $455,970) | | 455,547 |
| Receivable for investments sold | | 3,395,293 |
| Receivable for fund shares sold | | 9,716,162 |
| Dividends receivable | | 6,167,155 |
| Distributions receivable from Fidelity Central Funds | | 204,510 |
| Prepaid expenses | | 4,247 |
| Other receivables | | 70,119 |
| Total assets | | 1,991,217,795 |
| Liabilities | | |
| Payable for investments purchased | $1,921,485 | |
| Payable for fund shares redeemed | 2,591,383 | |
| Accrued management fee | 1,633,348 | |
| Distribution and service plan fees payable | 61,100 | |
| Other affiliated payables | 410,731 | |
| Other payables and accrued expenses | 297,248 | |
| Collateral on securities loaned | 17,024,272 | |
| Total liabilities | | 23,939,567 |
| Net Assets | | $1,967,278,228 |
| Net Assets consist of: | | |
| Paid in capital | | $1,904,983,681 |
| Total distributable earnings (loss) | | 62,294,547 |
| Net Assets | | $1,967,278,228 |
| Net Asset Value and Maximum Offering Price | | |
| Class A: | | |
| Net Asset Value and redemption price per share ($80,395,428 ÷ 3,118,459 shares) | | $25.78 |
| Maximum offering price per share (100/94.25 of $25.78) | | $27.35 |
| Class M: | | |
| Net Asset Value and redemption price per share ($16,362,392 ÷ 638,668 shares) | | $25.62 |
| Maximum offering price per share (100/96.50 of $25.62) | | $26.55 |
| Class C: | | |
| Net Asset Value and offering price per share ($41,917,911 ÷ 1,692,433 shares)(a) | | $24.77 |
| International Small Cap: | | |
| Net Asset Value, offering price and redemption price per share ($1,256,192,753 ÷ 47,788,306 shares) | | $26.29 |
| Class I: | | |
| Net Asset Value, offering price and redemption price per share ($564,988,327 ÷ 21,359,197 shares) | | $26.45 |
| Class Z: | | |
| Net Asset Value, offering price and redemption price per share ($7,421,417 ÷ 280,503 shares) | | $26.46 |
(a) Redemption price per share is equal to net asset value less any applicable contingent deferred sales charge.
See accompanying notes which are an integral part of the financial statements.
Statement of Operations
| | | Year ended October 31, 2018 |
| Investment Income | | |
| Dividends (including $2,090,885 earned from other affiliated issuers) | | $62,918,743 |
| Income from Fidelity Central Funds | | 1,988,908 |
| Income before foreign taxes withheld | | 64,907,651 |
| Less foreign taxes withheld | | (5,717,603) |
| Total income | | 59,190,048 |
| Expenses | | |
| Management fee | | |
| Basic fee | $17,682,860 | |
| Performance adjustment | 1,960,527 | |
| Transfer agent fees | 3,833,626 | |
| Distribution and service plan fees | 729,435 | |
| Accounting and security lending fees | 928,047 | |
| Custodian fees and expenses | 603,520 | |
| Independent trustees' fees and expenses | 10,371 | |
| Registration fees | 192,729 | |
| Audit | 103,621 | |
| Legal | 4,880 | |
| Miscellaneous | 12,544 | |
| Total expenses before reductions | 26,062,160 | |
| Expense reductions | (245,370) | |
| Total expenses after reductions | | 25,816,790 |
| Net investment income (loss) | | 33,373,258 |
| Realized and Unrealized Gain (Loss) | | |
| Net realized gain (loss) on: | | |
| Investment securities: | | |
| Unaffiliated issuers | 77,660,559 | |
| Fidelity Central Funds | (2,374) | |
| Foreign currency transactions | (891,151) | |
| Total net realized gain (loss) | | 76,767,034 |
| Change in net unrealized appreciation (depreciation) on: | | |
| Investment securities: | | |
| Unaffiliated issuers (net of increase in deferred foreign taxes of $37,498) | (312,871,323) | |
| Fidelity Central Funds | 20 | |
| Other affiliated issuers | (9,725,875) | |
| Assets and liabilities in foreign currencies | (27,619) | |
| Total change in net unrealized appreciation (depreciation) | | (322,624,797) |
| Net gain (loss) | | (245,857,763) |
| Net increase (decrease) in net assets resulting from operations | | $(212,484,505) |
See accompanying notes which are an integral part of the financial statements.
Statement of Changes in Net Assets
| | Year ended October 31, 2018 | Year ended October 31, 2017 |
| Increase (Decrease) in Net Assets | | |
| Operations | | |
| Net investment income (loss) | $33,373,258 | $18,356,208 |
| Net realized gain (loss) | 76,767,034 | 41,195,813 |
| Change in net unrealized appreciation (depreciation) | (322,624,797) | 258,657,737 |
| Net increase (decrease) in net assets resulting from operations | (212,484,505) | 318,209,758 |
| Distributions to shareholders | (61,553,254) | – |
| Distributions to shareholders from net investment income | – | (14,393,212) |
| Distributions to shareholders from net realized gain | – | (12,478,859) |
| Total distributions | (61,553,254) | (26,872,071) |
| Share transactions - net increase (decrease) | 477,734,571 | 480,792,049 |
| Redemption fees | 48,167 | 258,237 |
| Total increase (decrease) in net assets | 203,744,979 | 772,387,973 |
| Net Assets | | |
| Beginning of period | 1,763,533,249 | 991,145,276 |
| End of period | $1,967,278,228 | $1,763,533,249 |
| Other Information | | |
| Undistributed net investment income end of period | | $16,549,081 |
See accompanying notes which are an integral part of the financial statements.
Financial Highlights
Fidelity International Small Cap Fund Class A
| Years ended October 31, | 2018 | 2017 | 2016 | 2015 | 2014 |
| Selected Per–Share Data | | | | | |
| Net asset value, beginning of period | $29.24 | $23.81 | $22.69 | $24.98 | $26.34 |
| Income from Investment Operations | | | | | |
| Net investment income (loss)A | .38 | .29 | .34 | .27 | .17 |
| Net realized and unrealized gain (loss) | (2.87) | 5.70 | 1.64 | 1.05 | (.89) |
| Total from investment operations | (2.49) | 5.99 | 1.98 | 1.32 | (.72) |
| Distributions from net investment income | (.23) | (.28) | (.25) | (.16) | (.05) |
| Distributions from net realized gain | (.74) | (.29) | (.62) | (3.45) | (.60) |
| Total distributions | (.97) | (.57) | (.87) | (3.61) | (.65) |
| Redemption fees added to paid in capitalA | –B | .01 | .01 | –B | .01 |
| Net asset value, end of period | $25.78 | $29.24 | $23.81 | $22.69 | $24.98 |
| Total ReturnC,D | (8.83)% | 25.83% | 9.11% | 6.21% | (2.79)% |
| Ratios to Average Net AssetsE,F | | | | | |
| Expenses before reductions | 1.49% | 1.55% | 1.61% | 1.59% | 1.50% |
| Expenses net of fee waivers, if any | 1.49% | 1.55% | 1.61% | 1.58% | 1.50% |
| Expenses net of all reductions | 1.48% | 1.55% | 1.61% | 1.58% | 1.50% |
| Net investment income (loss) | 1.33% | 1.11% | 1.50% | 1.18% | .65% |
| Supplemental Data | | | | | |
| Net assets, end of period (000 omitted) | $80,395 | $63,459 | $36,480 | $28,238 | $24,572 |
| Portfolio turnover rateG | 25% | 22% | 29% | 36% | 102% |
A Calculated based on average shares outstanding during the period.
B Amount represents less than $.005 per share.
C Total returns would have been lower if certain expenses had not been reduced during the applicable periods shown.
D Total returns do not include the effect of the sales charges.
E Fees and expenses of any underlying Fidelity Central Funds are not included in the Fund's expense ratio. The Fund indirectly bears its proportionate share of the expenses of any underlying Fidelity Central Funds.
F Expense ratios reflect operating expenses of the class. Expenses before reductions do not reflect amounts reimbursed by the investment adviser or reductions from brokerage service arrangements or reductions from other expense offset arrangements and do not represent the amount paid by the class during periods when reimbursements or reductions occur. Expenses net of fee waivers reflect expenses after reimbursement by the investment adviser but prior to reductions from brokerage service arrangements or other expense offset arrangements. Expenses net of all reductions represent the net expenses paid by the class.
G Amount does not include the portfolio activity of any underlying Fidelity Central Funds.
See accompanying notes which are an integral part of the financial statements.
Fidelity International Small Cap Fund Class M
| Years ended October 31, | 2018 | 2017 | 2016 | 2015 | 2014 |
| Selected Per–Share Data | | | | | |
| Net asset value, beginning of period | $29.07 | $23.65 | $22.55 | $24.81 | $26.17 |
| Income from Investment Operations | | | | | |
| Net investment income (loss)A | .30 | .21 | .27 | .21 | .10 |
| Net realized and unrealized gain (loss) | (2.86) | 5.69 | 1.63 | 1.04 | (.87) |
| Total from investment operations | (2.56) | 5.90 | 1.90 | 1.25 | (.77) |
| Distributions from net investment income | (.15) | (.19) | (.19) | (.06) | – |
| Distributions from net realized gain | (.74) | (.29) | (.62) | (3.45) | (.60) |
| Total distributions | (.89) | (.48) | (.81) | (3.51) | (.60) |
| Redemption fees added to paid in capitalA | –B | –B | .01 | –B | .01 |
| Net asset value, end of period | $25.62 | $29.07 | $23.65 | $22.55 | $24.81 |
| Total ReturnC,D | (9.10)% | 25.47% | 8.79% | 5.90% | (3.00)% |
| Ratios to Average Net AssetsE,F | | | | | |
| Expenses before reductions | 1.77% | 1.84% | 1.90% | 1.87% | 1.77% |
| Expenses net of fee waivers, if any | 1.77% | 1.84% | 1.90% | 1.86% | 1.77% |
| Expenses net of all reductions | 1.76% | 1.84% | 1.90% | 1.86% | 1.76% |
| Net investment income (loss) | 1.05% | .82% | 1.21% | .90% | .38% |
| Supplemental Data | | | | | |
| Net assets, end of period (000 omitted) | $16,362 | $18,148 | $13,331 | $12,400 | $12,296 |
| Portfolio turnover rateG | 25% | 22% | 29% | 36% | 102% |
A Calculated based on average shares outstanding during the period.
B Amount represents less than $.005 per share.
C Total returns would have been lower if certain expenses had not been reduced during the applicable periods shown.
D Total returns do not include the effect of the sales charges.
E Fees and expenses of any underlying Fidelity Central Funds are not included in the Fund's expense ratio. The Fund indirectly bears its proportionate share of the expenses of any underlying Fidelity Central Funds.
F Expense ratios reflect operating expenses of the class. Expenses before reductions do not reflect amounts reimbursed by the investment adviser or reductions from brokerage service arrangements or reductions from other expense offset arrangements and do not represent the amount paid by the class during periods when reimbursements or reductions occur. Expenses net of fee waivers reflect expenses after reimbursement by the investment adviser but prior to reductions from brokerage service arrangements or other expense offset arrangements. Expenses net of all reductions represent the net expenses paid by the class.
G Amount does not include the portfolio activity of any underlying Fidelity Central Funds.
See accompanying notes which are an integral part of the financial statements.
Fidelity International Small Cap Fund Class C
| Years ended October 31, | 2018 | 2017 | 2016 | 2015 | 2014 |
| Selected Per–Share Data | | | | | |
| Net asset value, beginning of period | $28.21 | $22.97 | $21.96 | $24.27 | $25.68 |
| Income from Investment Operations | | | | | |
| Net investment income (loss)A | .16 | .08 | .16 | .09 | (.02) |
| Net realized and unrealized gain (loss) | (2.76) | 5.53 | 1.59 | 1.02 | (.85) |
| Total from investment operations | (2.60) | 5.61 | 1.75 | 1.11 | (.87) |
| Distributions from net investment income | (.10) | (.08) | (.13) | – | – |
| Distributions from net realized gain | (.74) | (.29) | (.62) | (3.42) | (.55) |
| Total distributions | (.84) | (.37) | (.75) | (3.42) | (.55) |
| Redemption fees added to paid in capitalA | –B | –B | .01 | –B | .01 |
| Net asset value, end of period | $24.77 | $28.21 | $22.97 | $21.96 | $24.27 |
| Total ReturnC,D | (9.51)% | 24.85% | 8.26% | 5.37% | (3.43)% |
| Ratios to Average Net AssetsE,F | | | | | |
| Expenses before reductions | 2.24% | 2.33% | 2.40% | 2.36% | 2.23% |
| Expenses net of fee waivers, if any | 2.24% | 2.33% | 2.40% | 2.35% | 2.22% |
| Expenses net of all reductions | 2.23% | 2.32% | 2.39% | 2.35% | 2.22% |
| Net investment income (loss) | .58% | .33% | .71% | .41% | (.07)% |
| Supplemental Data | | | | | |
| Net assets, end of period (000 omitted) | $41,918 | $26,005 | $12,187 | $11,359 | $12,576 |
| Portfolio turnover rateG | 25% | 22% | 29% | 36% | 102% |
A Calculated based on average shares outstanding during the period.
B Amount represents less than $.005 per share.
C Total returns would have been lower if certain expenses had not been reduced during the applicable periods shown.
D Total returns do not include the effect of the contingent deferred sales charge.
E Fees and expenses of any underlying Fidelity Central Funds are not included in the Fund's expense ratio. The Fund indirectly bears its proportionate share of the expenses of any underlying Fidelity Central Funds.
F Expense ratios reflect operating expenses of the class. Expenses before reductions do not reflect amounts reimbursed by the investment adviser or reductions from brokerage service arrangements or reductions from other expense offset arrangements and do not represent the amount paid by the class during periods when reimbursements or reductions occur. Expenses net of fee waivers reflect expenses after reimbursement by the investment adviser but prior to reductions from brokerage service arrangements or other expense offset arrangements. Expenses net of all reductions represent the net expenses paid by the class.
G Amount does not include the portfolio activity of any underlying Fidelity Central Funds.
See accompanying notes which are an integral part of the financial statements.
Fidelity International Small Cap Fund
| Years ended October 31, | 2018 | 2017 | 2016 | 2015 | 2014 |
| Selected Per–Share Data | | | | | |
| Net asset value, beginning of period | $29.77 | $24.23 | $23.06 | $25.34 | $26.67 |
| Income from Investment Operations | | | | | |
| Net investment income (loss)A | .48 | .37 | .40 | .34 | .25 |
| Net realized and unrealized gain (loss) | (2.93) | 5.79 | 1.67 | 1.07 | (.90) |
| Total from investment operations | (2.45) | 6.16 | 2.07 | 1.41 | (.65) |
| Distributions from net investment income | (.29) | (.34) | (.29) | (.24) | (.09) |
| Distributions from net realized gain | (.74) | (.29) | (.62) | (3.45) | (.60) |
| Total distributions | (1.03) | (.63) | (.91) | (3.69) | (.69) |
| Redemption fees added to paid in capitalA | –B | .01 | .01 | –B | .01 |
| Net asset value, end of period | $26.29 | $29.77 | $24.23 | $23.06 | $25.34 |
| Total ReturnC | (8.54)% | 26.18% | 9.39% | 6.53% | (2.48)% |
| Ratios to Average Net AssetsD,E | | | | | |
| Expenses before reductions | 1.20% | 1.25% | 1.34% | 1.31% | 1.21% |
| Expenses net of fee waivers, if any | 1.20% | 1.25% | 1.34% | 1.31% | 1.20% |
| Expenses net of all reductions | 1.19% | 1.24% | 1.33% | 1.31% | 1.20% |
| Net investment income (loss) | 1.62% | 1.41% | 1.77% | 1.45% | .95% |
| Supplemental Data | | | | | |
| Net assets, end of period (000 omitted) | $1,256,193 | $1,418,452 | $906,420 | $811,534 | $842,031 |
| Portfolio turnover rateF | 25% | 22% | 29% | 36% | 102% |
A Calculated based on average shares outstanding during the period.
B Amount represents less than $.005 per share.
C Total returns would have been lower if certain expenses had not been reduced during the applicable periods shown.
D Fees and expenses of any underlying Fidelity Central Funds are not included in the Fund's expense ratio. The Fund indirectly bears its proportionate share of the expenses of any underlying Fidelity Central Funds.
E Expense ratios reflect operating expenses of the class. Expenses before reductions do not reflect amounts reimbursed by the investment adviser or reductions from brokerage service arrangements or reductions from other expense offset arrangements and do not represent the amount paid by the class during periods when reimbursements or reductions occur. Expenses net of fee waivers reflect expenses after reimbursement by the investment adviser but prior to reductions from brokerage service arrangements or other expense offset arrangements. Expenses net of all reductions represent the net expenses paid by the class.
F Amount does not include the portfolio activity of any underlying Fidelity Central Funds.
See accompanying notes which are an integral part of the financial statements.
Fidelity International Small Cap Fund Class I
| Years ended October 31, | 2018 | 2017 | 2016 | 2015 | 2014 |
| Selected Per–Share Data | | | | | |
| Net asset value, beginning of period | $29.97 | $24.42 | $23.24 | $25.34 | $26.67 |
| Income from Investment Operations | | | | | |
| Net investment income (loss)A | .47 | .38 | .41 | .36 | .29 |
| Net realized and unrealized gain (loss) | (2.95) | 5.82 | 1.69 | 1.07 | (.90) |
| Total from investment operations | (2.48) | 6.20 | 2.10 | 1.43 | (.61) |
| Distributions from net investment income | (.30) | (.37) | (.31) | (.08) | (.13) |
| Distributions from net realized gain | (.74) | (.29) | (.62) | (3.45) | (.60) |
| Total distributions | (1.04) | (.66) | (.93) | (3.53) | (.73) |
| Redemption fees added to paid in capitalA | –B | .01 | .01 | –B | .01 |
| Net asset value, end of period | $26.45 | $29.97 | $24.42 | $23.24 | $25.34 |
| Total ReturnC | (8.58)% | 26.17% | 9.43% | 6.60% | (2.35)% |
| Ratios to Average Net AssetsD,E | | | | | |
| Expenses before reductions | 1.21% | 1.28% | 1.31% | 1.24% | 1.08% |
| Expenses net of fee waivers, if any | 1.21% | 1.28% | 1.31% | 1.23% | 1.08% |
| Expenses net of all reductions | 1.20% | 1.27% | 1.31% | 1.23% | 1.08% |
| Net investment income (loss) | 1.61% | 1.39% | 1.80% | 1.53% | 1.07% |
| Supplemental Data | | | | | |
| Net assets, end of period (000 omitted) | $564,988 | $237,469 | $22,727 | $10,070 | $8,092 |
| Portfolio turnover rateF | 25% | 22% | 29% | 36% | 102% |
A Calculated based on average shares outstanding during the period.
B Amount represents less than $.005 per share.
C Total returns would have been lower if certain expenses had not been reduced during the applicable periods shown.
D Fees and expenses of any underlying Fidelity Central Funds are not included in the Fund's expense ratio. The Fund indirectly bears its proportionate share of the expenses of any underlying Fidelity Central Funds.
E Expense ratios reflect operating expenses of the class. Expenses before reductions do not reflect amounts reimbursed by the investment adviser or reductions from brokerage service arrangements or reductions from other expense offset arrangements and do not represent the amount paid by the class during periods when reimbursements or reductions occur. Expenses net of fee waivers reflect expenses after reimbursement by the investment adviser but prior to reductions from brokerage service arrangements or other expense offset arrangements. Expenses net of all reductions represent the net expenses paid by the class.
F Amount does not include the portfolio activity of any underlying Fidelity Central Funds.
See accompanying notes which are an integral part of the financial statements.
Fidelity International Small Cap Fund Class Z
| Year ended October 31, | 2018 A |
| Selected Per–Share Data | |
| Net asset value, beginning of period | $28.78 |
| Income from Investment Operations | |
| Net investment income (loss)B | .03 |
| Net realized and unrealized gain (loss) | (2.35) |
| Total from investment operations | (2.32) |
| Distributions from net investment income | – |
| Distributions from net realized gain | �� |
| Total distributions | – |
| Net asset value, end of period | $26.46 |
| Total ReturnC,D | (8.06)% |
| Ratios to Average Net AssetsE,F | |
| Expenses before reductions | 1.15%G |
| Expenses net of fee waivers, if any | 1.15%G |
| Expenses net of all reductions | 1.14%G |
| Net investment income (loss) | 2.01%G |
| Supplemental Data | |
| Net assets, end of period (000 omitted) | $7,421 |
| Portfolio turnover rateH | 25% |
A For the period October 2, 2018 (commencement of sale of shares) to October 31, 2018.
B Calculated based on average shares outstanding during the period.
C Total returns for periods of less than one year are not annualized.
D Total returns would have been lower if certain expenses had not been reduced during the applicable periods shown.
E Fees and expenses of any underlying Fidelity Central Funds are not included in the Fund's expense ratio. The Fund indirectly bears its proportionate share of the expenses of any underlying Fidelity Central Funds.
F Expense ratios reflect operating expenses of the class. Expenses before reductions do not reflect amounts reimbursed by the investment adviser or reductions from brokerage service arrangements or reductions from other expense offset arrangements and do not represent the amount paid by the class during periods when reimbursements or reductions occur. Expense ratios before reductions for start-up periods may not be representative of longer-term operating periods. Expenses net of fee waivers reflect expenses after reimbursement by the investment adviser but prior to reductions from brokerage service arrangements or other expense offset arrangements. Expenses net of all reductions represent the net expenses paid by the class.
G Annualized
H Amount does not include the portfolio activity of any underlying Fidelity Central Funds.
See accompanying notes which are an integral part of the financial statements.
Notes to Financial Statements
For the period ended October 31, 2018
1. Organization.
Fidelity International Small Cap Fund (the Fund) is a fund of Fidelity Investment Trust (the Trust) and is authorized to issue an unlimited number of shares. The Trust is registered under the Investment Company Act of 1940, as amended (the 1940 Act), as an open-end management investment company organized as a Massachusetts business trust. The Fund commenced sale of Class Z shares on October 2, 2018. The Fund offers Class A, Class M, Class C, International Small Cap, Class I and Class Z shares, each of which has equal rights as to assets and voting privileges. Each class has exclusive voting rights with respect to matters that affect that class. The Fund's investments in emerging markets can be subject to social, economic, regulatory, and political uncertainties and can be extremely volatile.
2. Investments in Fidelity Central Funds.
The Fund invests in Fidelity Central Funds, which are open-end investment companies generally available only to other investment companies and accounts managed by the investment adviser and its affiliates. The Fund's Schedule of Investments lists each of the Fidelity Central Funds held as of period end, if any, as an investment of the Fund, but does not include the underlying holdings of each Fidelity Central Fund. As an Investing Fund, the Fund indirectly bears its proportionate share of the expenses of the underlying Fidelity Central Funds.
The Money Market Central Funds seek preservation of capital and current income and are managed by Fidelity Investments Money Management, Inc. (FIMM), an affiliate of the investment adviser. Annualized expenses of the Money Market Central Funds as of their most recent shareholder report date are less than .005%.
A complete unaudited list of holdings for each Fidelity Central Fund is available upon request or at the Securities and Exchange Commission (the SEC) website at www.sec.gov. In addition, the financial statements of the Fidelity Central Funds, which are not covered by the Fund's Report of Independent Registered Public Accounting Firm, are available on the SEC website or upon request.
3. Significant Accounting Policies.
The Fund is an investment company and applies the accounting and reporting guidance of the Financial Accounting Standards Board (FASB) Accounting Standards Codification Topic 946 Financial Services – Investments Companies. The financial statements have been prepared in conformity with accounting principles generally accepted in the United States of America (GAAP), which require management to make certain estimates and assumptions at the date of the financial statements. Actual results could differ from those estimates. Subsequent events, if any, through the date that the financial statements were issued have been evaluated in the preparation of the financial statements. The following summarizes the significant accounting policies of the Fund:
Investment Valuation. Investments are valued as of 4:00 p.m. Eastern time on the last calendar day of the period. The Board of Trustees (the Board) has delegated the day to day responsibility for the valuation of the Fund's investments to the Fair Value Committee (the Committee) established by the Fund's investment adviser. In accordance with valuation policies and procedures approved by the Board, the Fund attempts to obtain prices from one or more third party pricing vendors or brokers to value its investments. When current market prices, quotations or currency exchange rates are not readily available or reliable, investments will be fair valued in good faith by the Committee, in accordance with procedures adopted by the Board. Factors used in determining fair value vary by investment type and may include market or investment specific events. The frequency with which these procedures are used cannot be predicted and they may be utilized to a significant extent. The Committee oversees the Fund's valuation policies and procedures and reports to the Board on the Committee's activities and fair value determinations. The Board monitors the appropriateness of the procedures used in valuing the Fund's investments and ratifies the fair value determinations of the Committee.
The Fund categorizes the inputs to valuation techniques used to value its investments into a disclosure hierarchy consisting of three levels as shown below:
- Level 1 – quoted prices in active markets for identical investments
- Level 2 – other significant observable inputs (including quoted prices for similar investments, interest rates, prepayment speeds, etc.)
- Level 3 – unobservable inputs (including the Fund's own assumptions based on the best information available)
Valuation techniques used to value the Fund's investments by major category are as follows:
Equity securities, including restricted securities, for which market quotations are readily available, are valued at the last reported sale price or official closing price as reported by a third party pricing vendor on the primary market or exchange on which they are traded and are categorized as Level 1 in the hierarchy. In the event there were no sales during the day or closing prices are not available, securities are valued at the last quoted bid price or may be valued using the last available price and are generally categorized as Level 2 in the hierarchy. For foreign equity securities, when market or security specific events arise, comparisons to the valuation of American Depositary Receipts (ADRs), futures contracts, Exchange-Traded Funds (ETFs) and certain indexes as well as quoted prices for similar securities may be used and would be categorized as Level 2 in the hierarchy. Utilizing these techniques may result in transfers between Level 1 and Level 2. For equity securities, including restricted securities, where observable inputs are limited, assumptions about market activity and risk are used and these securities may be categorized as Level 3 in the hierarchy.
Investments in open-end mutual funds, including the Fidelity Central Funds, are valued at their closing net asset value (NAV) each business day and are categorized as Level 1 in the hierarchy.
Changes in valuation techniques may result in transfers in or out of an assigned level within the disclosure hierarchy. The aggregate value of investments by input level as of October 31, 2018, including information on transfers between Levels 1 and 2, is included at the end of the Fund's Schedule of Investments.
Foreign Currency. The Fund may use foreign currency contracts to facilitate transactions in foreign-denominated securities. Gains and losses from these transactions may arise from changes in the value of the foreign currency or if the counterparties do not perform under the contracts' terms.
Foreign-denominated assets, including investment securities, and liabilities are translated into U.S. dollars at the exchange rates at period end. Purchases and sales of investment securities, income and dividends received and expenses denominated in foreign currencies are translated into U.S. dollars at the exchange rate in effect on the transaction date.
The effects of exchange rate fluctuations on investments are included with the net realized and unrealized gain (loss) on investment securities. Other foreign currency transactions resulting in realized and unrealized gain (loss) are disclosed separately.
Investment Transactions and Income. For financial reporting purposes, the Fund's investment holdings and NAV include trades executed through the end of the last business day of the period. The NAV per share for processing shareholder transactions is calculated as of the close of business of the New York Stock Exchange (NYSE), normally 4:00 p.m. Eastern time and includes trades executed through the end of the prior business day. Gains and losses on securities sold are determined on the basis of identified cost and include proceeds received from litigation. Dividend income is recorded on the ex-dividend date, except for certain dividends from foreign securities where the ex-dividend date may have passed, which are recorded as soon as the Fund is informed of the ex-dividend date. Non-cash dividends included in dividend income, if any, are recorded at the fair market value of the securities received. Income and capital gain distributions from Fidelity Central Funds, if any, are recorded on the ex-dividend date. Certain distributions received by the Fund represent a return of capital or capital gain. The Fund determines the components of these distributions subsequent to the ex-dividend date, based upon receipt of tax filings or other correspondence relating to the underlying investment. These distributions are recorded as a reduction of cost of investments and/or as a realized gain. Investment income is recorded net of foreign taxes withheld where recovery of such taxes is uncertain.
Class Allocations and Expenses. Investment income, realized and unrealized capital gains and losses, common expenses of the Fund, and certain fund-level expense reductions, if any, are allocated daily on a pro-rata basis to each class based on the relative net assets of each class to the total net assets of the Fund. Each class differs with respect to transfer agent and distribution and service plan fees incurred. Certain expense reductions may also differ by class. For the reporting period, the allocated portion of income and expenses to each class as a percent of its average net assets may vary due to the timing of recording these transactions in relation to fluctuating net assets of the classes. Expenses directly attributable to a fund are charged to that fund. Expenses attributable to more than one fund are allocated among the respective funds on the basis of relative net assets or other appropriate methods. Expense estimates are accrued in the period to which they relate and adjustments are made when actual amounts are known.
Income Tax Information and Distributions to Shareholders. Each year, the Fund intends to qualify as a regulated investment company under Subchapter M of the Internal Revenue Code, including distributing substantially all of its taxable income and realized gains. As a result, no provision for U.S. Federal income taxes is required. As of October 31, 2018, the Fund did not have any unrecognized tax benefits in the financial statements; nor is the Fund aware of any tax positions for which it is reasonably possible that the total amounts of unrecognized tax benefits will significantly change in the next twelve months. The Fund files a U.S. federal tax return, in addition to state and local tax returns as required. The Fund's federal income tax returns are subject to examination by the Internal Revenue Service (IRS) for a period of three fiscal years after they are filed. State and local tax returns may be subject to examination for an additional fiscal year depending on the jurisdiction. Foreign taxes are provided for based on the Fund's understanding of the tax rules and rates that exist in the foreign markets in which it invests. The Fund is subject to a tax imposed on capital gains by certain countries in which it invests. An estimated deferred tax liability for net unrealized appreciation on the applicable securities is included in Other payables and accrued expenses on the Statement of Assets & Liabilities.
Distributions are declared and recorded on the ex-dividend date. Income and capital gain distributions are declared separately for each class. Income and capital gain distributions are determined in accordance with income tax regulations, which may differ from GAAP. In addition, the Fund claimed a portion of the payment made to redeeming shareholders as a distribution for income tax purposes.
Capital accounts within the financial statements are adjusted for permanent book-tax differences. These adjustments have no impact on net assets or the results of operations. Capital accounts are not adjusted for temporary book-tax differences which will reverse in a subsequent period.
Book-tax differences are primarily due to foreign currency transactions, certain foreign taxes, passive foreign investment companies (PFIC) and losses deferred due to wash sales.
As of period end, the cost and unrealized appreciation (depreciation) in securities, and derivatives if applicable, for federal income tax purposes were as follows:
| Gross unrealized appreciation | $257,072,862 |
| Gross unrealized depreciation | (296,626,117) |
| Net unrealized appreciation (depreciation) | $(39,553,255) |
| Tax Cost | $2,010,758,017 |
The tax-based components of distributable earnings as of period end were as follows:
| Undistributed ordinary income | $28,180,749 |
| Undistributed long-term capital gain | $73,826,639 |
| Net unrealized appreciation (depreciation) on securities and other investments | $(39,675,343) |
The tax character of distributions paid was as follows:
| | October 31, 2018 | October 31, 2017 |
| Ordinary Income | $36,178,814 | $ 16,336,287 |
| Long-term Capital Gains | 25,374,442 | 10,535,784 |
| Total | $61,553,256 | $ 26,872,071 |
Short-Term Trading (Redemption) Fees. During the period, shares held by investors in the Fund less than 90 days may have been subject to a redemption fee equal to 2.00% of the NAV of shares redeemed. All redemption fees, which reduce the proceeds of the shareholder redemption, are retained by the Fund and accounted for as an addition to paid in capital. In November 2017, the Board of Trustees approved the elimination of these redemption fees effective December 18, 2017.
Restricted Securities. The Fund may invest in securities that are subject to legal or contractual restrictions on resale. These securities generally may be resold in transactions exempt from registration or to the public if the securities are registered. Disposal of these securities may involve time-consuming negotiations and expense, and prompt sale at an acceptable price may be difficult. Information regarding restricted securities is included at the end of the Fund's Schedule of Investments.
New Rule Issuance. During August 2018, the U.S. Securities and Exchange Commission issued Final Rule Release No. 33-10532, Disclosure Update and Simplification. This Final Rule includes amendments specific to registered investment companies that are intended to eliminate overlap in disclosure requirements between Regulation S-X and GAAP. In accordance with these amendments, certain line-items in the Fund's financial statements have been combined or removed for the current period as outlined in the table below.
| Financial Statement | Current Line-Item Presentation | Prior Line-Item Presentation |
| Statement of Assets and Liabilities | Total distributable earnings (loss) | Undistributed/Distributions in excess of/Accumulated net investment income (loss)
Accumulated/Undistributed net realized gain (loss)
Net unrealized appreciation (depreciation) |
| Statement of Changes in Net Assets | N/A - removed | Undistributed/Distributions in excess of/Accumulated net investment income (loss) end of period |
| Statement of Changes in Net Assets | Distributions to shareholders | Distributions to shareholders from net investment income
Distributions to shareholders from net realized gain |
| Distributions to Shareholders Note to Financial Statements | Distributions to shareholders | Distributions to shareholders from net investment income
Distributions to shareholders from net realized gain |
4. Purchases and Sales of Investments.
Purchases and sales of securities, other than short-term securities, aggregated $956,567,607 and $490,410,440, respectively.
5. Fees and Other Transactions with Affiliates.
Management Fee. Fidelity Management & Research Company (the investment adviser) and its affiliates provide the Fund with investment management related services for which the Fund pays a monthly management fee. The management fee is the sum of an individual fund fee rate that is based on an annual rate of .60% of the Fund's average net assets and an annualized group fee rate that averaged .24% during the period. The group fee rate is based upon the average net assets of all the mutual funds advised by the investment adviser, including any mutual funds previously advised by the investment adviser that are currently advised by Fidelity SelectCo, LLC, an affiliate of the investment adviser. The group fee rate decreases as assets under management increase and increases as assets under management decrease. In addition, the management fee is subject to a performance adjustment (up to a maximum of +/- .20% of the Fund's average net assets over a 36 month performance period). The upward or downward adjustment to the management fee is based on the relative investment performance of International Small Cap as compared to its benchmark index, the MSCI ACWI (All Country World Index) ex USA Small Cap Index, over the same 36 month performance period. For the reporting period, the total annual management fee rate, including the performance adjustment, was .93% of the Fund's average net assets. The performance adjustment included in the management fee rate may be higher or lower than the maximum performance adjustment rate due to the difference between the average net assets for the reporting and performance periods.
Distribution and Service Plan Fees. In accordance with Rule 12b-1 of the 1940 Act, the Fund has adopted separate Distribution and Service Plans for each class of shares. Certain classes pay Fidelity Distributors Corporation (FDC), an affiliate of the investment adviser, separate Distribution and Service Fees, each of which is based on an annual percentage of each class' average net assets. In addition, FDC may pay financial intermediaries for selling shares of the Fund and providing shareholder support services. For the period, the Distribution and Service Fee rates, total fees and amounts retained by FDC were as follows:
| | Distribution Fee | Service Fee | Total Fees | Retained by FDC |
| Class A | -% | .25% | $200,038 | $18,213 |
| Class M | .25% | .25% | 99,816 | 1,749 |
| Class C | .75% | .25% | 429,581 | 185,656 |
| | | | $729,435 | $205,618 |
Sales Load. FDC may receive a front-end sales charge of up to 5.75% for selling Class A shares and 3.50% for selling Class M shares, some of which is paid to financial intermediaries for selling shares of the Fund. Depending on the holding period, FDC may receive contingent deferred sales charges levied on Class A, Class M and Class C redemptions. The deferred sales charges are 1.00% for Class C shares, 1.00% for certain purchases of Class A shares and .25% for certain purchases of Class M shares.
For the period, sales charge amounts retained by FDC were as follows:
| | Retained by FDC |
| Class A | $71,485 |
| Class M | 7,085 |
| Class C(a) | 15,967 |
| | $94,537 |
(a) When Class C shares are initially sold, FDC pays commissions from its own resources to financial intermediaries through which the sales are made.
Transfer Agent Fees. Fidelity Investments Institutional Operations Company, Inc., (FIIOC), an affiliate of the investment adviser, is the transfer, dividend disbursing and shareholder servicing agent for each class of the Fund. FIIOC receives account fees and asset-based fees that vary according to the account size and type of account of the shareholders of the respective classes of the Fund, except for Class Z. FIIOC receives an asset-based fee of Class Z's average net assets. FIIOC pays for typesetting, printing and mailing of shareholder reports, except proxy statements.
For the period, transfer agent fees for each class were as follows:
| | Amount | % of Class-Level Average Net Assets |
| Class A | $174,321 | .22 |
| Class M | 49,489 | .25 |
| Class C | 96,452 | .22 |
| International Small Cap | 2,616,004 | .18 |
| Class I | 897,331 | .19 |
| Class Z | 29 | .03(a) |
| | $3,833,626 | |
(a) Annualized
Accounting and Security Lending Fees. Fidelity Service Company, Inc. (FSC), an affiliate of the investment adviser, maintains the Fund's accounting records. The accounting fee is based on the level of average net assets for each month. Under a separate contract, FSC administers the security lending program. The security lending fee is based on the number and duration of lending transactions. For the period, the fees were equivalent to an annual rate of .04%.
Brokerage Commissions. The Fund placed a portion of its portfolio transactions with brokerage firms which are affiliates of the investment adviser. Brokerage commissions are included in net realized gain (loss) and change in net unrealized appreciation (depreciation) in the Statement of Operations. The commissions paid to these affiliated firms were $1,325 for the period.
Interfund Trades. The Fund may purchase from or sell securities to other Fidelity Funds under procedures adopted by the Board. The procedures have been designed to ensure these interfund trades are executed in accordance with Rule 17a-7 of the 1940 Act. Interfund trades are included within the respective purchases and sales amounts shown in the Purchases and Sales of Investments note.
6. Committed Line of Credit.
The Fund participates with other funds managed by the investment adviser or an affiliate in a $4.25 billion credit facility (the "line of credit") to be utilized for temporary or emergency purposes to fund shareholder redemptions or for other short-term liquidity purposes. The Fund has agreed to pay commitment fees on its pro-rata portion of the line of credit, which amounted to $5,622 and is reflected in Miscellaneous expenses on the Statement of Operations. During the period, the Fund did not borrow on this line of credit.
7. Security Lending.
The Fund lends portfolio securities through a lending agent from time to time in order to earn additional income. For equity securities, a lending agent is used and may loan securities to certain qualified borrowers, including Fidelity Capital Markets (FCM), a broker-dealer affiliated with the Fund. On the settlement date of the loan, the Fund receives collateral (in the form of U.S. Treasury obligations, letters of credit and/or cash) against the loaned securities and maintains collateral in an amount not less than 100% of the market value of the loaned securities during the period of the loan. The market value of the loaned securities is determined at the close of business of the Fund and any additional required collateral is delivered to the Fund on the next business day. The Fund or borrower may terminate the loan at any time, and if the borrower defaults on its obligation to return the securities loaned because of insolvency or other reasons, the Fund may apply collateral received from the borrower against the obligation. The Fund may experience delays and costs in recovering the securities loaned. Any cash collateral received is invested in the Fidelity Securities Lending Cash Central Fund. The value of loaned securities and cash collateral at period end are disclosed on the Fund's Statement of Assets and Liabilities. At period end, there were no security loans outstanding with FCM. Security lending income represents the income earned on investing cash collateral, less rebates paid to borrowers and any lending agent fees associated with the loan, plus any premium payments received for lending certain types of securities. Security lending income is presented in the Statement of Operations as a component of income from Fidelity Central Funds Total security lending income during the period amounted to $387,206, including $65 from securities loaned to FCM.
8. Expense Reductions.
Commissions paid to certain brokers with whom the investment adviser, or its affiliates, places trades on behalf of the Fund include an amount in addition to trade execution, which may be rebated back to the Fund to offset certain expenses. This amount totaled $226,649 for the period. In addition, through arrangements with the Fund's custodian, credits realized as a result of certain uninvested cash balances were used to reduce the Fund's expenses. During the period, these credits reduced the Fund's custody expenses by $488.
In addition, during the period the investment adviser reimbursed and/or waived a portion of fund-level operating expenses in the amount of $18,233.
9. Distributions to Shareholders.
Distributions to shareholders of each class were as follows:
| | Year ended
October 31, 2018 | Year ended
October 31, 2017 |
| Distributions to shareholders | | |
| Class A | $2,150,704 | $– |
| Class M | 588,707 | – |
| Class C | 853,838 | – |
| International Small Cap | 49,080,231 | – |
| Class I | 8,879,774 | – |
| Total | $61,553,254 | $– |
| From net investment income | | |
| Class A | $– | $440,395 |
| Class M | – | 105,144 |
| Class C | – | 42,573 |
| International Small Cap | – | 13,342,577 |
| Class I | – | 462,523 |
| Total | $– | $14,393,212 |
| From net realized gain | | |
| Class A | $– | $461,138 |
| Class M | – | 163,369 |
| Class C | – | 151,895 |
| International Small Cap | – | 11,341,189 |
| Class I | – | 361,268 |
| Total | $– | $12,478,859 |
10. Share Transactions.
Share transactions for each class were as follows and may contain automatic conversions between classes or exchanges between affiliated funds:
| | Shares | Shares | Dollars | Dollars |
| | Year ended October 31, 2018(a) | Year ended October 31, 2017 | Year ended October 31, 2018(a) | Year ended October 31, 2017 |
| Class A | | | | |
| Shares sold | 1,993,812 | 1,346,483 | $57,935,672 | $35,353,222 |
| Reinvestment of distributions | 72,621 | 38,390 | 2,060,979 | 881,445 |
| Shares redeemed | (1,118,217) | (746,471) | (32,145,224) | (18,879,894) |
| Net increase (decrease) | 948,216 | 638,402 | $27,851,427 | $17,354,773 |
| Class M | | | | |
| Shares sold | 265,293 | 165,476 | $7,711,211 | $4,273,457 |
| Reinvestment of distributions | 20,707 | 11,602 | 585,586 | 265,460 |
| Shares redeemed | (271,709) | (116,364) | (7,811,190) | (2,968,272) |
| Net increase (decrease) | 14,291 | 60,714 | $485,607 | $1,570,645 |
| Class C | | | | |
| Shares sold | 1,115,556 | 554,853 | $31,833,791 | $14,330,189 |
| Reinvestment of distributions | 30,679 | 8,175 | 842,145 | 182,379 |
| Shares redeemed | (375,660) | (171,623) | (10,374,137) | (4,225,035) |
| Net increase (decrease) | 770,575 | 391,405 | $22,301,799 | $10,287,533 |
| International Small Cap | | | | |
| Shares sold | 16,219,665 | 20,105,455 | $484,453,648 | $528,374,537 |
| Reinvestment of distributions | 1,616,727 | 1,029,746 | 46,674,910 | 24,013,687 |
| Shares redeemed | (17,690,156) | (10,901,622) | (519,774,089) | (292,534,899) |
| Net increase (decrease) | 146,236 | 10,233,579 | $11,354,469 | $259,853,325 |
| Class I | | | | |
| Shares sold | 19,548,705 | 7,788,345 | $583,254,206 | $213,872,926 |
| Reinvestment of distributions | 286,614 | 29,052 | 8,326,151 | 682,131 |
| Shares redeemed | (6,400,003) | (824,089) | (183,131,200) | (22,829,284) |
| Net increase (decrease) | 13,435,316 | 6,993,308 | $408,449,157 | $191,725,773 |
| Class Z | | | | |
| Shares sold | 280,979 | – | $7,304,519 | $– |
| Shares redeemed | (476) | – | (12,407) | – |
| Net increase (decrease) | 280,503 | – | $7,292,112 | $– |
(a) Share transactions for Class Z are for the period October 2, 2018 (commencement of sale of shares) to October 31, 2018
11. Other.
The Fund's organizational documents provide former and current trustees and officers with a limited indemnification against liabilities arising in connection with the performance of their duties to the Fund. In the normal course of business, the Fund may also enter into contracts that provide general indemnifications. The Fund's maximum exposure under these arrangements is unknown as this would be dependent on future claims that may be made against the Fund. The risk of material loss from such claims is considered remote.
Report of Independent Registered Public Accounting Firm
To the Trustees of Fidelity Investment Trust and Shareholders of Fidelity International Small Cap Fund:
Opinion on the Financial Statements and Financial Highlights
We have audited the accompanying statement of assets and liabilities of Fidelity International Small Cap Fund (the "Fund"), a fund of Fidelity Investment Trust, including the schedule of investments, as of October 31, 2018, and the related statement of operations for the year then ended, the statement of changes in net assets for each of the two years in the period then ended, the financial highlights for each of the five years in the period then ended, and the related notes. In our opinion, the financial statements and financial highlights present fairly, in all material respects, the financial position of the Fund as of October 31, 2018, and the results of its operations for the year then ended, the changes in its net assets for each of the two years in the period then ended, and the financial highlights for each of the five years in the period then ended, in conformity with accounting principles generally accepted in the United States of America.
Basis for Opinion
These financial statements and financial highlights are the responsibility of the Fund's management. Our responsibility is to express an opinion on the financial statements and financial highlights based on our audits. We are a public accounting firm registered with the Public Company Accounting Oversight Board (United States) (PCAOB) and are required to be independent with respect to the Fund in accordance with the U.S. federal securities laws and the applicable rules and regulations of the Securities and Exchange Commission and the PCAOB.
We conducted our audits in accordance with the standards of the PCAOB. Those standards require that we plan and perform the audit to obtain reasonable assurance about whether the financial statements and financial highlights are free of material misstatement, whether due to error or fraud. The Fund is not required to have, nor were we engaged to perform, an audit of its internal control over financial reporting. As part of our audits we are required to obtain an understanding of internal control over financial reporting but not for the purpose of expressing an opinion on the effectiveness of the Fund’s internal control over financial reporting. Accordingly, we express no such opinion.
Our audits included performing procedures to assess the risks of material misstatement of the financial statements and financial highlights, whether due to error or fraud, and performing procedures that respond to those risks. Such procedures included examining, on a test basis, evidence regarding the amounts and disclosures in the financial statements and financial highlights. Our audits also included evaluating the accounting principles used and significant estimates made by management, as well as evaluating the overall presentation of the financial statements and financial highlights. Our procedures included confirmation of securities owned as of October 31, 2018, by correspondence with the custodians and brokers; when replies were not received from brokers, we performed other auditing procedures. We believe that our audits provide a reasonable basis for our opinion.
/s/ Deloitte & Touche LLP
Boston, Massachusetts
December 14, 2018
We have served as the auditor of one or more of the Fidelity investment companies since 1999.
Trustees and Officers
The Trustees, Members of the Advisory Board (if any), and officers of the trust and fund, as applicable, are listed below. The Board of Trustees governs the fund and is responsible for protecting the interests of shareholders. The Trustees are experienced executives who meet periodically throughout the year to oversee the fund's activities, review contractual arrangements with companies that provide services to the fund, oversee management of the risks associated with such activities and contractual arrangements, and review the fund's performance. Except for Jonathan Chiel, each of the Trustees oversees 283 funds. Mr. Chiel oversees 154 funds.
The Trustees hold office without limit in time except that (a) any Trustee may resign; (b) any Trustee may be removed by written instrument, signed by at least two-thirds of the number of Trustees prior to such removal; (c) any Trustee who requests to be retired or who has become incapacitated by illness or injury may be retired by written instrument signed by a majority of the other Trustees; and (d) any Trustee may be removed at any special meeting of shareholders by a two-thirds vote of the outstanding voting securities of the trust. Each Trustee who is not an interested person (as defined in the 1940 Act) of the trust and the fund is referred to herein as an Independent Trustee. Each Independent Trustee shall retire not later than the last day of the calendar year in which his or her 75th birthday occurs. The Independent Trustees may waive this mandatory retirement age policy with respect to individual Trustees. Officers and Advisory Board Members hold office without limit in time, except that any officer or Advisory Board Member may resign or may be removed by a vote of a majority of the Trustees at any regular meeting or any special meeting of the Trustees. Except as indicated, each individual has held the office shown or other offices in the same company for the past five years.
The fund’s Statement of Additional Information (SAI) includes more information about the Trustees. To request a free copy, call Fidelity at 1-800-544-8544.
Experience, Skills, Attributes, and Qualifications of the Trustees. The Governance and Nominating Committee has adopted a statement of policy that describes the experience, qualifications, attributes, and skills that are necessary and desirable for potential Independent Trustee candidates (Statement of Policy). The Board believes that each Trustee satisfied at the time he or she was initially elected or appointed a Trustee, and continues to satisfy, the standards contemplated by the Statement of Policy. The Governance and Nominating Committee also engages professional search firms to help identify potential Independent Trustee candidates who have the experience, qualifications, attributes, and skills consistent with the Statement of Policy. From time to time, additional criteria based on the composition and skills of the current Independent Trustees, as well as experience or skills that may be appropriate in light of future changes to board composition, business conditions, and regulatory or other developments, have also been considered by the professional search firms and the Governance and Nominating Committee. In addition, the Board takes into account the Trustees' commitment and participation in Board and committee meetings, as well as their leadership of standing and ad hoc committees throughout their tenure.
In determining that a particular Trustee was and continues to be qualified to serve as a Trustee, the Board has considered a variety of criteria, none of which, in isolation, was controlling. The Board believes that, collectively, the Trustees have balanced and diverse experience, qualifications, attributes, and skills, which allow the Board to operate effectively in governing the fund and protecting the interests of shareholders. Information about the specific experience, skills, attributes, and qualifications of each Trustee, which in each case led to the Board's conclusion that the Trustee should serve (or continue to serve) as a trustee of the fund, is provided below.
Board Structure and Oversight Function. James C. Curvey is an interested person and currently serves as Chairman. The Trustees have determined that an interested Chairman is appropriate and benefits shareholders because an interested Chairman has a personal and professional stake in the quality and continuity of services provided to the fund. Independent Trustees exercise their informed business judgment to appoint an individual of their choosing to serve as Chairman, regardless of whether the Trustee happens to be independent or a member of management. The Independent Trustees have determined that they can act independently and effectively without having an Independent Trustee serve as Chairman and that a key structural component for assuring that they are in a position to do so is for the Independent Trustees to constitute a substantial majority for the Board. The Independent Trustees also regularly meet in executive session. Ned C. Lautenbach serves as Chairman of the Independent Trustees and as such (i) acts as a liaison between the Independent Trustees and management with respect to matters important to the Independent Trustees and (ii) with management prepares agendas for Board meetings.
Fidelity® funds are overseen by different Boards of Trustees. The fund's Board oversees Fidelity's high income and certain equity funds, and other Boards oversee Fidelity's investment-grade bond, money market, asset allocation, and other equity funds. The asset allocation funds may invest in Fidelity® funds overseen by the fund's Board. The use of separate Boards, each with its own committee structure, allows the Trustees of each group of Fidelity® funds to focus on the unique issues of the funds they oversee, including common research, investment, and operational issues. On occasion, the separate Boards establish joint committees to address issues of overlapping consequences for the Fidelity® funds overseen by each Board.
The Trustees operate using a system of committees to facilitate the timely and efficient consideration of all matters of importance to the Trustees, the fund, and fund shareholders and to facilitate compliance with legal and regulatory requirements and oversight of the fund's activities and associated risks. The Board, acting through its committees, has charged FMR and its affiliates with (i) identifying events or circumstances the occurrence of which could have demonstrably adverse effects on the fund's business and/or reputation; (ii) implementing processes and controls to lessen the possibility that such events or circumstances occur or to mitigate the effects of such events or circumstances if they do occur; and (iii) creating and maintaining a system designed to evaluate continuously business and market conditions in order to facilitate the identification and implementation processes described in (i) and (ii) above. Because the day-to-day operations and activities of the fund are carried out by or through FMR, its affiliates, and other service providers, the fund's exposure to risks is mitigated but not eliminated by the processes overseen by the Trustees. While each of the Board's committees has responsibility for overseeing different aspects of the fund's activities, oversight is exercised primarily through the Operations, Audit, and Compliance Committees. In addition, the Independent Trustees have worked with Fidelity to enhance the Board's oversight of investment and financial risks, legal and regulatory risks, technology risks, and operational risks, including the development of additional risk reporting to the Board. Appropriate personnel, including but not limited to the fund's Chief Compliance Officer (CCO), FMR's internal auditor, the independent accountants, the fund's Treasurer and portfolio management personnel, make periodic reports to the Board's committees, as appropriate, including an annual review of Fidelity's risk management program for the Fidelity® funds. The responsibilities of each standing committee, including their oversight responsibilities, are described further under "Standing Committees of the Trustees."
Interested Trustees*:
Correspondence intended for a Trustee who is an interested person may be sent to Fidelity Investments, 245 Summer Street, Boston, Massachusetts 02210.
Name, Year of Birth; Principal Occupations and Other Relevant Experience+
Jonathan Chiel (1957)
Year of Election or Appointment: 2016
Trustee
Mr. Chiel also serves as Trustee of other Fidelity® funds. Mr. Chiel is Executive Vice President and General Counsel for FMR LLC (diversified financial services company, 2012-present). Previously, Mr. Chiel served as general counsel (2004-2012) and senior vice president and deputy general counsel (2000-2004) for John Hancock Financial Services; a partner with Choate, Hall & Stewart (1996-2000) (law firm); and an Assistant United States Attorney for the United States Attorney’s Office of the District of Massachusetts (1986-95), including Chief of the Criminal Division (1993-1995). Mr. Chiel is a director on the boards of the Boston Bar Foundation and the Maimonides School.
James C. Curvey (1935)
Year of Election or Appointment: 2007
Trustee
Chairman of the Board of Trustees
Mr. Curvey also serves as Trustee of other Fidelity® funds. Mr. Curvey is Vice Chairman (2007-present) and Director of FMR LLC (diversified financial services company). In addition, Mr. Curvey is an Overseer Emeritus for the Boston Symphony Orchestra, a Director of Artis-Naples, and a Trustee of Brewster Academy in Wolfeboro, New Hampshire. Previously, Mr. Curvey served as a Director of Fidelity Research & Analysis Co. (investment adviser firm, 2009-2018), Director of Fidelity Investments Money Management, Inc. (investment adviser firm, 2009-2014) and a Director of FMR and FMR Co., Inc. (investment adviser firms, 2007-2014).
Charles S. Morrison (1960)
Year of Election or Appointment: 2014
Trustee
Mr. Morrison also serves as Trustee of other funds. He serves as President of Fidelity SelectCo, LLC (investment adviser firm, 2017-present) and Fidelity Management & Research Company (FMR) (investment adviser firm, 2016-present), a Director of Fidelity Investments Money Management, Inc. (FIMM) (investment adviser firm, 2014-present), Director of Fidelity SelectCo, LLC (investment adviser firm, 2014-present), President, Asset Management (2014-present), and is an employee of Fidelity Investments. Previously, Mr. Morrison served as Vice President of Fidelity's Fixed Income and Asset Allocation Funds (2012-2014), President, Fixed Income (2011-2014), Vice President of Fidelity's Money Market Funds (2005-2009), President, Money Market Group Leader of FMR (investment adviser firm, 2009), and Senior Vice President, Money Market Group of FMR (2004-2009). Mr. Morrison also served as Vice President of Fidelity's Bond Funds (2002-2005), certain Balanced Funds (2002-2005), and certain Asset Allocation Funds (2002-2007), and as Senior Vice President (2002-2005) of Fidelity's Bond Division.
* Determined to be an “Interested Trustee” by virtue of, among other things, his or her affiliation with the trust or various entities under common control with FMR.
+ The information includes the Trustee's principal occupation during the last five years and other information relating to the experience, attributes, and skills relevant to the Trustee's qualifications to serve as a Trustee, which led to the conclusion that the Trustee should serve as a Trustee for the fund.
Independent Trustees:
Correspondence intended for an Independent Trustee may be sent to Fidelity Investments, P.O. Box 55235, Boston, Massachusetts 02205-5235.
Name, Year of Birth; Principal Occupations and Other Relevant Experience+
Dennis J. Dirks (1948)
Year of Election or Appointment: 2005
Trustee
Mr. Dirks also serves as Trustee of other Fidelity® funds. Prior to his retirement in May 2003, Mr. Dirks was Chief Operating Officer and a member of the Board of The Depository Trust & Clearing Corporation (DTCC). He also served as President, Chief Operating Officer, and Board member of The Depository Trust Company (DTC) and President and Board member of the National Securities Clearing Corporation (NSCC). In addition, Mr. Dirks served as Chief Executive Officer and Board member of the Government Securities Clearing Corporation, Chief Executive Officer and Board member of the Mortgage-Backed Securities Clearing Corporation, as a Trustee and a member of the Finance Committee of Manhattan College (2005-2008), as a Trustee and a member of the Finance Committee of AHRC of Nassau County (2006-2008), as a member of the Independent Directors Council (IDC) Governing Council (2010-2015), and as a member of the Board of Directors for The Brookville Center for Children’s Services, Inc. (2009-2017). Mr. Dirks is a member of the Finance Committee (2016-present), Board of Directors (2017-present) and Board of Trustees (2018-present) and is Treasurer (2018-present) of the Asolo Repertory Theatre.
Donald F. Donahue (1950)
Year of Election or Appointment: 2018
Trustee
Mr. Donahue also serves as a Trustee of other Fidelity® funds. Mr. Donahue is President and Chief Executive Officer of Miranda Partners, LLC (risk consulting for the financial services industry, 2012-present). Previously, Mr. Donahue served as a Member of the Advisory Board of certain Fidelity® funds (2015-2018) and Chief Executive Officer (2006-2012), Chief Operating Officer (2003-2006), and Managing Director, Customer Marketing and Development (1999-2003) of The Depository Trust & Clearing Corporation (financial markets infrastructure). Mr. Donahue serves as a Member (2007-present) and Co-Chairman (2016-present) of the Board of Directors of United Way of New York, Member of the Board of Directors of NYC Leadership Academy (2012-present) and Member of the Board of Advisors of Ripple Labs, Inc. (financial services, 2015-present). He also served as Chairman (2010-2012) and Member of the Board of Directors (2012-2013) of Omgeo, LLC (financial services), Treasurer of United Way of New York (2012-2016), and Member of the Board of Directors of XBRL US (financial services non-profit, 2009-2012) and the International Securities Services Association (2009-2012).
Alan J. Lacy (1953)
Year of Election or Appointment: 2008
Trustee
Mr. Lacy also serves as Trustee of other Fidelity® funds. Mr. Lacy serves as a Director of Bristol-Myers Squibb Company (global pharmaceuticals, 2008-present). He is a Trustee of the California Chapter of The Nature Conservancy (2015-present) and a Director of the Center for Advanced Study in the Behavioral Sciences at Stanford University (2015-present). In addition, Mr. Lacy served as Senior Adviser (2007-2014) of Oak Hill Capital Partners, L.P. (private equity) and also served as Chief Executive Officer (2005) and Vice Chairman (2005-2006) of Sears Holdings Corporation (retail) and Chief Executive Officer and Chairman of the Board of Sears, Roebuck and Co. (retail, 2000-2005). Previously, Mr. Lacy served as Chairman (2014-2017) and a member (2010-2017) of the Board of Directors of Dave & Buster’s Entertainment, Inc. (restaurant and entertainment complexes), as Chairman (2008-2011) and a member (2006-2015) of the Board of Trustees of the National Parks Conservation Association, and as a member of the Board of Directors for The Hillman Companies, Inc. (hardware wholesalers, 2010-2014), Earth Fare, Inc. (retail grocery, 2010-2014), and The Western Union Company (global money transfer, 2006-2011).
Ned C. Lautenbach (1944)
Year of Election or Appointment: 2000
Trustee
Chairman of the Independent Trustees
Mr. Lautenbach also serves as Trustee of other Fidelity® funds. Mr. Lautenbach currently serves as Vice Chair of the Board of Governors, State University System of Florida (2013-present) and is a member of the Council on Foreign Relations (1994-present). He is also a member and has most recently served as Chairman of the Board of Directors of Artis-Naples (2012-present). Previously, Mr. Lautenbach served as a member and then Lead Director of the Board of Directors of Eaton Corporation (diversified industrial, 1997-2016). He was also a Partner and Advisory Partner at Clayton, Dubilier & Rice, LLC (private equity investment, 1998-2010), as well as a Director of Sony Corporation (2006-2007). In addition, Mr. Lautenbach also had a 30-year career with IBM (technology company) during which time he served as Senior Vice President and a member of the Corporate Executive Committee (1968-1998).
Joseph Mauriello (1944)
Year of Election or Appointment: 2008
Trustee
Mr. Mauriello also serves as Trustee of other Fidelity® funds. Prior to his retirement in January 2006, Mr. Mauriello served in numerous senior management positions including Deputy Chairman and Chief Operating Officer (2004-2005), and Vice Chairman of Financial Services (2002-2004) of KPMG LLP US (professional services, 1965-2005). Mr. Mauriello currently serves as a member of the Independent Directors Council (IDC) Governing Council (2015-present). Previously, Mr. Mauriello served as a member of the Board of Directors of XL Group plc. (global insurance and re-insurance, 2006-2018).
Cornelia M. Small (1944)
Year of Election or Appointment: 2005
Trustee
Ms. Small also serves as Trustee of other Fidelity® funds. Ms. Small is a member of the Board of Directors (2009-present) and Chair of the Investment Committee (2010-present) of the Teagle Foundation. Ms. Small also serves on the Investment Committee of the Berkshire Taconic Community Foundation (2008-present). Previously, Ms. Small served as Chairperson (2002-2008) and a member of the Investment Committee and Chairperson (2008-2012) and a member of the Board of Trustees of Smith College. In addition, Ms. Small served as Chief Investment Officer, Director of Global Equity Investments, and a member of the Board of Directors of Scudder, Stevens & Clark and Scudder Kemper Investments.
Garnett A. Smith (1947)
Year of Election or Appointment: 2018
Trustee
Mr. Smith also serves as Trustee of other Fidelity® funds. Prior to Mr. Smith's retirement, he served as Chairman and Chief Executive Officer of Inbrand Corp. (manufacturer of personal absorbent products, 1990-1997). He also served as President (1986-1990) of Inbrand Corp. Prior to his employment with Inbrand Corp., he was employed by a retail fabric chain and North Carolina National Bank. In addition, Mr. Smith served as a Member of the Advisory Board of certain Fidelity® funds (2012-2013) and as a board member of the Jackson Hole Land Trust (2009-2012).
David M. Thomas (1949)
Year of Election or Appointment: 2008
Trustee
Mr. Thomas also serves as Trustee of other Fidelity® funds. Mr. Thomas serves as Non-Executive Chairman of the Board of Directors of Fortune Brands Home and Security (home and security products, 2011-present), as a member of the Board of Directors (2004-present) and Presiding Director (2013-present) of Interpublic Group of Companies, Inc. (marketing communication), and as a member of the Board of Trustees of the University of Florida (2013-present). Previously, Mr. Thomas served as Executive Chairman (2005-2006) and Chairman and Chief Executive Officer (2000-2005) of IMS Health, Inc. (pharmaceutical and healthcare information solutions), and a Director of Fortune Brands, Inc. (consumer products, 2000-2011).
+ The information includes the Trustee's principal occupation during the last five years and other information relating to the experience, attributes, and skills relevant to the Trustee's qualifications to serve as a Trustee, which led to the conclusion that the Trustee should serve as a Trustee for the fund.
Advisory Board Members and Officers:
Correspondence intended for a Member of the Advisory Board (if any) may be sent to Fidelity Investments, P.O. Box 55235, Boston, Massachusetts 02205-5235. Correspondence intended for an officer or Peter S. Lynch may be sent to Fidelity Investments, 245 Summer Street, Boston, Massachusetts 02210. Officers appear below in alphabetical order.
Name, Year of Birth; Principal Occupation
Vicki L. Fuller (1957)
Year of Election or Appointment: 2018
Member of the Advisory Board
Ms. Fuller also serves as Member of the Advisory Board of other Fidelity® funds. Ms. Fuller serves as a member of the Board of Directors, Audit Committee, and Nominating and Governance Committee of The Williams Companies, Inc. (natural gas infrastructure, 2018-present). Previously, Ms. Fuller served as the Chief Investment Officer of the New York State Common Retirement Fund (2012-2018) and held a variety of positions at AllianceBernstein L.P. (global asset management, 1985-2012), including Managing Director (2006-2012) and Senior Vice President and Senior Portfolio Manager (2001-2006).
Peter S. Lynch (1944)
Year of Election or Appointment: 2003
Member of the Advisory Board
Mr. Lynch also serves as Member of the Advisory Board of other Fidelity® funds. Mr. Lynch is Vice Chairman and a Director of FMR (investment adviser firm) and FMR Co., Inc. (investment adviser firm). In addition, Mr. Lynch serves as a Trustee of Boston College and as the Chairman of the Inner-City Scholarship Fund. Previously, Mr. Lynch served on the Special Olympics International Board of Directors (1997-2006).
William S. Stavropoulos (1939)
Year of Election or Appointment: 2018
Member of the Advisory Board
Mr. Stavropoulos also serves as Member of the Advisory Board of other Fidelity® funds. Mr. Stavropoulos serves as President and Founder of the Michigan Baseball Foundation, the Great Lakes Loons (2007-present). Mr. Stavropoulos is Chairman Emeritus of the Board of Directors of The Dow Chemical Company, where he previously served in numerous senior management positions, including President, CEO (1995-2000; 2002-2004), Chairman of the Executive Committee (2000-2006), and as a member of the Board of Directors (1990-2006). Currently, Mr. Stavropoulos is Chairman of the Board of Directors of Univar Inc. (global distributor of commodity and specialty chemicals), a Director of Teradata Corporation (data warehousing and technology solutions), and a member of the Advisory Board for Metalmark Capital LLC (private equity investment, 2005-present). Mr. Stavropoulos is an operating advisor to Clayton, Dubilier & Rice, LLC (private equity investment). In addition, Mr. Stavropoulos is a member of the University of Notre Dame Advisory Council for the College of Science, a Trustee of the Rollin L. Gerstacker Foundation, and a Director of Artis-Naples in Naples, Florida. Previously, Mr. Stavropoulos served as Trustee of certain Fidelity® funds (2001-2018) and as a Director of Chemical Financial Corporation (bank holding company, 1993-2012) and Tyco International, Ltd. (multinational manufacturing and services, 2007-2012).
Carol B. Tomé (1957)
Year of Election or Appointment: 2018
Member of the Advisory Board
Ms. Tomé also serves as Member of the Advisory Board of other Fidelity® funds. Ms. Tomé is Chief Financial Officer (2001-present) and Executive Vice President of Corporate Services (2007-present) of The Home Depot, Inc. (home improvement retailer) and a Director (2003-present) and Chair of the Audit Committee (2004-present) of United Parcel Service, Inc. (package delivery and supply chain management). Previously, Ms. Tomé served as Trustee of certain Fidelity® funds (2017), Senior Vice President of Finance and Accounting/Treasurer (2000-2007) and Vice President and Treasurer (1995-2000) of The Home Depot, Inc. and Chair of the Board (2010-2012), Vice Chair of the Board (2009 and 2013), and a Director (2008-2013) of the Federal Reserve Bank of Atlanta. Ms. Tomé is also a director or trustee of many community and professional organizations.
Michael E. Wiley (1950)
Year of Election or Appointment: 2018
Member of the Advisory Board
Mr. Wiley also serves as Trustee or Member of the Advisory Board of other Fidelity® funds. Mr. Wiley serves as a Director of High Point Resources (exploration and production, 2005-present). Previously, Mr. Wiley served as a Director of Andeavor Corporation (independent oil refiner and marketer, 2005-2018), a Director of Andeavor Logistics LP (natural resources logistics, 2015-2018), a Director of Post Oak Bank (privately-held bank, 2004-2018), a Director of Asia Pacific Exploration Consolidated (international oil and gas exploration and production, 2008-2013), a member of the Board of Trustees of the University of Tulsa (2000-2006; 2007-2010), a Senior Energy Advisor of Katzenbach Partners, LLC (consulting, 2006-2007), an Advisory Director of Riverstone Holdings (private investment), a Director of Spinnaker Exploration Company (exploration and production, 2001-2005) and Chairman, President, and CEO of Baker Hughes, Inc. (oilfield services, 2000-2004).
Elizabeth Paige Baumann (1968)
Year of Election or Appointment: 2017
Anti-Money Laundering (AML) Officer
Ms. Baumann also serves as AML Officer of other funds. She is Chief AML Officer (2012-present) and Senior Vice President (2014-present) of FMR LLC (diversified financial services company) and is an employee of Fidelity Investments. Previously, Ms. Baumann served as AML Officer of the funds (2012-2016), and Vice President (2007-2014) and Deputy Anti-Money Laundering Officer (2007-2012) of FMR LLC.
John J. Burke III (1964)
Year of Election or Appointment: 2018
Chief Financial Officer
Mr. Burke also serves as Chief Financial Officer of other funds. Mr. Burke serves as Head of Investment Operations for Fidelity Fund and Investment Operations (2018-present) and is an employee of Fidelity Investments (1998-present). Previously Mr. Burke served as head of Asset Management Investment Operations (2012-2018).
William C. Coffey (1969)
Year of Election or Appointment: 2018
Secretary and Chief Legal Officer (CLO)
Mr. Coffey also serves as Secretary and CLO of other funds. Mr. Coffey serves as CLO, Secretary, and Senior Vice President of Fidelity Management & Research Company and FMR Co., Inc. (investment adviser firms, 2018-present); Secretary of Fidelity SelectCo, LLC and Fidelity Investments Money Management, Inc. (investment adviser firms, 2018-present); and CLO of Fidelity Management & Research (Hong Kong) Limited, FMR Investment Management (UK) Limited, and Fidelity Management & Research (Japan) Limited (investment adviser firms, 2018-present). He is Senior Vice President and Deputy General Counsel of FMR LLC (diversified financial services company, 2010-present), and is an employee of Fidelity Investments. Previously, Mr. Coffey served as Assistant Secretary of certain funds (2009-2018) and as Vice President and Associate General Counsel of FMR LLC (2005-2009).
Timothy M. Cohen (1969)
Year of Election or Appointment: 2018
Vice President
Mr. Cohen also serves as Vice President of other funds. Mr. Cohen serves as Co-Head of Global Equity Research (2016-present), a Director of Fidelity Management & Research (Japan) Limited (investment adviser firm, 2016-present), and is an employee of Fidelity Investments. Previously, Mr. Cohen served as Chief Investment Officer - Equity and a Director of Fidelity Management & Research (U.K.) Inc. (investment adviser firm, 2013-2015) and as a Director of Fidelity Management & Research (Hong Kong) Limited (investment adviser firm, 2017).
Jonathan Davis (1968)
Year of Election or Appointment: 2010
Assistant Treasurer
Mr. Davis also serves as Assistant Treasurer of other funds. Mr. Davis serves as Assistant Treasurer of FMR Capital, Inc. (2017-present) and is an employee of Fidelity Investments. Previously, Mr. Davis served as Vice President and Associate General Counsel of FMR LLC (diversified financial services company, 2003-2010).
Adrien E. Deberghes (1967)
Year of Election or Appointment: 2016
Assistant Treasurer
Mr. Deberghes also serves as an officer of other funds. He serves as Assistant Treasurer of FMR Capital, Inc. (2017-present), Executive Vice President of Fidelity Investments Money Management, Inc. (FIMM) (investment adviser firm, 2016-present), and is an employee of Fidelity Investments (2008-present). Previously, Mr. Deberghes served as President and Treasurer of certain Fidelity® funds (2013-2018). Prior to joining Fidelity Investments, Mr. Deberghes was Senior Vice President of Mutual Fund Administration at State Street Corporation (2007-2008), Senior Director of Mutual Fund Administration at Investors Bank & Trust (2005-2007), and Director of Finance for Dunkin' Brands (2000-2005). Previously, Mr. Deberghes served in other fund officer roles.
Laura M. Del Prato (1964)
Year of Election or Appointment: 2018
Assistant Treasurer
Ms. Del Prato also serves as an officer of other funds. Ms. Del Prato is an employee of Fidelity Investments (2017-present). Prior to joining Fidelity Investments, Ms. Del Prato served as a Managing Director and Treasurer of the JPMorgan Mutual Funds (2014-2017). Prior to JPMorgan, Ms. Del Prato served as a partner at Cohen Fund Audit Services (accounting firm, 2012-2013) and KPMG LLP (accounting firm, 2004-2012).
Colm A. Hogan (1973)
Year of Election or Appointment: 2016
Deputy Treasurer
Mr. Hogan also serves as an officer of other funds. Mr. Hogan serves as Assistant Treasurer of FMR Capital, Inc. (2017-present) and is an employee of Fidelity Investments (2005-present). Previously, Mr. Hogan served as Assistant Treasurer of certain Fidelity® funds (2016-2018).
Pamela R. Holding (1964)
Year of Election or Appointment: 2018
Vice President
Ms. Holding also serves as Vice President of other funds. Ms. Holding serves as Co-Head of Global Equity Research (2018-present) and is an employee of Fidelity Investments (2013-present).
Chris Maher (1972)
Year of Election or Appointment: 2013
Assistant Treasurer
Mr. Maher serves as Assistant Treasurer of other funds. Mr. Maher is Vice President of Valuation Oversight, serves as Assistant Treasurer of FMR Capital, Inc. (2017-present), and is an employee of Fidelity Investments. Previously, Mr. Maher served as Vice President of Asset Management Compliance (2013), Vice President of the Program Management Group of FMR (investment adviser firm, 2010-2013), and Vice President of Valuation Oversight (2008-2010).
Rieco E. Mello (1969)
Year of Election or Appointment: 2017
Assistant Treasurer
Mr. Mello also serves as Assistant Treasurer of other funds. Mr. Mello serves as Assistant Treasurer of FMR Capital, Inc. (2017-present) and is an employee of Fidelity Investments (1995-present).
Kenneth B. Robins (1969)
Year of Election or Appointment: 2016
Chief Compliance Officer
Mr. Robins also serves as an officer of other funds. Mr. Robins serves as Compliance Officer of Fidelity Management & Research Company and FMR Co., Inc. (investment adviser firms, 2016-present) and is an employee of Fidelity Investments (2004-present). Previously, Mr. Robins served as Executive Vice President of Fidelity Investments Money Management, Inc. (investment adviser firm, 2013-2016) and served in other fund officer roles.
Stacie M. Smith (1974)
Year of Election or Appointment: 2016
President and Treasurer
Ms. Smith also serves as an officer of other funds. Ms. Smith serves as Assistant Treasurer of FMR Capital, Inc. (2017-present), is an employee of Fidelity Investments (2009-present), and has served in other fund officer roles. Prior to joining Fidelity Investments, Ms. Smith served as Senior Audit Manager of Ernst & Young LLP (accounting firm, 1996-2009). Previously, Ms. Smith served as Assistant Treasurer (2013-2018) and Deputy Treasurer (2013-2016) of certain Fidelity® funds.
Marc L. Spector (1972)
Year of Election or Appointment: 2016
Assistant Treasurer
Mr. Spector also serves as an officer of other funds. Mr. Spector serves as Assistant Treasurer of FMR Capital, Inc. (2017-present) and is an employee of Fidelity Investments (2016-present). Prior to joining Fidelity Investments, Mr. Spector served as Director at the Siegfried Group (accounting firm, 2013-2016), and prior to Siegfried Group as audit senior manager at Deloitte & Touche (accounting firm, 2005-2013).
Shareholder Expense Example
As a shareholder of the Fund, you incur two types of costs: (1) transaction costs, including sales charges (loads) on purchase payments or redemption proceeds, and (2) ongoing costs, including management fees, distribution and/or service (12b-1) fees and other Fund expenses. This Example is intended to help you understand your ongoing costs (in dollars) of investing in the Fund and to compare these costs with the ongoing costs of investing in other mutual funds.
The actual expense Example is based on an investment of $1,000 invested at the beginning of the period and held for the entire period (May 1, 2018 to October 31, 2018) for Class A, Class M, Class C, International Small Cap and Class I, and for the period (October 2, 2018 to October 31, 2018) for Class Z. The hypothetical expense Example is based on an investment of $1,000 invested for the one-half year period (May 1, 2018 to October 31, 2018).
Actual Expenses
The first line of the accompanying table for each class of the Fund provides information about actual account values and actual expenses. You may use the information in this line, together with the amount you invested, to estimate the expenses that you paid over the period. Simply divide your account value by $1,000.00 (for example, an $8,600 account value divided by $1,000.00 = 8.6), then multiply the result by the number in the first line for a class of the Fund under the heading entitled "Expenses Paid During Period" to estimate the expenses you paid on your account during this period. A small balance maintenance fee of $12.00 that is charged once a year may apply for certain accounts with a value of less than $2,000. This fee, which was eliminated effective August 1, 2018, is not included in the table below. If it was, the estimate of expenses you paid during the period would be higher, and your ending account value lower, by this amount. In addition, the Fund, as a shareholder in the underlying Fidelity Central Funds, will indirectly bear its pro-rata share of the fees and expenses incurred by the underlying Fidelity Central Funds. These fees and expenses are not included in the Fund's annualized expense ratio used to calculate the expense estimate in the table below.
Hypothetical Example for Comparison Purposes
The second line of the accompanying table for each class of the Fund provides information about hypothetical account values and hypothetical expenses based on a Class' actual expense ratio and an assumed rate of return of 5% per year before expenses, which is not the Class' actual return. The hypothetical account values and expenses may not be used to estimate the actual ending account balance or expenses you paid for the period. You may use this information to compare the ongoing costs of investing in the Fund and other funds. To do so, compare this 5% hypothetical example with the 5% hypothetical examples that appear in the shareholder reports of the other funds. A small balance maintenance fee of $12.00 that is charged once a year may apply for certain accounts with a value of less than $2,000. This fee, which was eliminated effective August 1, 2018, is not included in the table below. If it was, the estimate of expenses you paid during the period would be higher, and your ending account value lower, by this amount. In addition, the Fund, as a shareholder in the underlying Fidelity Central Funds, will indirectly bear its pro-rata share of the fees and expenses incurred by the underlying Fidelity Central Funds. These fees and expenses are not included in the Fund's annualized expense ratio used to calculate the expense estimate in the table below.
Please note that the expenses shown in the table are meant to highlight your ongoing costs only and do not reflect any transaction costs. Therefore, the second line of the table is useful in comparing ongoing costs only, and will not help you determine the relative total costs of owning different funds. In addition, if these transactional costs were included, your costs would have been higher.
| | Annualized Expense Ratio-A | Beginning
Account Value | Ending
Account Value
October 31, 2018 | Expenses Paid
During Period |
| Class A | 1.47% | | | |
| Actual | | $1,000.00 | $870.10 | $6.93-B |
| Hypothetical-C | | $1,000.00 | $1,017.80 | $7.48-D |
| Class M | 1.75% | | | |
| Actual | | $1,000.00 | $868.80 | $8.24-B |
| Hypothetical-C | | $1,000.00 | $1,016.38 | $8.89-D |
| Class C | 2.24% | | | |
| Actual | | $1,000.00 | $866.70 | $10.54-B |
| Hypothetical-C | | $1,000.00 | $1,013.91 | $11.37-D |
| International Small Cap | 1.18% | | | |
| Actual | | $1,000.00 | $871.40 | $5.57-B |
| Hypothetical-C | | $1,000.00 | $1,019.26 | $6.01-D |
| Class I | 1.21% | | | |
| Actual | | $1,000.00 | $871.20 | $5.71-B |
| Hypothetical-C | | $1,000.00 | $1,019.11 | $6.16-D |
| Class Z | 1.15% | | | |
| Actual | | $1,000.00 | $919.40 | $.91-B |
| Hypothetical-C | | $1,000.00 | $1,019.41 | $5.85-D |
A Annualized expense ratio reflects expenses net of applicable fee waivers.
B Actual expenses are equal to each Class' annualized expense ratio, multiplied by the average account value over the period, multiplied by 184/365 (to reflect the one-half year period) for Class A, Class M, Class C, International Small Cap and Class I, and multiplied by 30/365 (to reflect the period October 2, 2018 to October 31, 2018) for Class Z.
C 5% return per year before expenses
D Hypothetical expenses are equal to each Class' annualized expense ratio, multiplied by the average account value over the period, multiplied by 184/365 (to reflect the one-half year period).
Distributions (Unaudited)
The Board of Trustees of Fidelity International Small Cap Fund voted to pay to shareholders of record at the opening of business on record date, the following distributions per share derived from capital gains realized from sales of portfolio securities, and dividends derived from net investment income:
| | Pay Date | Record Date | Dividends | Capital Gains |
| Fidelity International Small Cap Fund | | | | |
| Class A | 12/10/18 | 12/07/18 | $0.381 | $1.002 |
| Class M | 12/10/18 | 12/07/18 | $0.274 | $1.002 |
| Class C | 12/10/18 | 12/07/18 | $0.166 | $1.002 |
| Fidelity International Small Cap | 12/10/18 | 12/07/18 | $0.452 | $1.002 |
| Class I | 12/10/18 | 12/07/18 | $0.459 | $1.002 |
| Class Z | 12/10/18 | 12/07/18 | $0.504 | $1.002 |
|
The fund hereby designates as a capital gain dividend with respect to the taxable year ended October 31, 2018, $83,998,263, or, if subsequently determined to be different, the net capital gain of such year.
Class A designates 79%; Class M designates 91%; Class C designates 100%; Fidelity International Small Cap designates 72%; and Class I designates 70%; of the dividend distributed in December during the fiscal year as amounts which may be taken into account as a dividend for purposes of the maximum rate under section 1(h)(11) of the Internal Revenue Code.
The amounts per share which represent income derived from sources within, and taxes paid to, foreign countries or possessions of the United States are as follows:
| | Pay Date | Income | Taxes |
| Fidelity International Small Cap Fund | | | |
| Class A | 12/11/17 | $0.4967 | $0.0578 |
| Class M | 12/11/17 | $0.4316 | $0.0578 |
| Class C | 12/11/17 | $0.3921 | $0.0578 |
| Fidelity International Small Cap | 12/11/17 | $0.5478 | $0.0578 |
| Class I | 12/11/17 | $0.5577 | $0.0578 |
|
The fund will notify shareholders in January 2019 of amounts for use in preparing 2018 income tax returns.
Board Approval of Investment Advisory Contracts
Fidelity International Small Cap Fund
At its July 2018 meeting, the Board of Trustees, including the Independent Trustees (together, the Board), voted to continue the management contract with Fidelity Management & Research Company (FMR) and the sub-advisory agreements (together, the Advisory Contracts) for the fund for six months through January 31, 2019, in connection with the reunification of the Fidelity Equity High Income Funds Board, which oversees the fund, and the Sector Portfolios Board.
The Board considered that the approval of the fund's Advisory Contracts will not result in any changes in (i) the investment process or strategies employed in the management of the fund's assets; (ii) the fees and expenses paid by shareholders; (iii) the nature, extent or quality of services provided under the fund's Advisory Contracts; or (iv) the day-to-day management of the fund or the persons primarily responsible for such management. The Board concluded that the fund's Advisory Contracts are fair and reasonable, and that the fund's Advisory Contracts should be renewed, without modification, through January 31, 2019, with the understanding that the Board will consider the annual renewal for a full one year period in January 2019.
In connection with its consideration of future renewals of the fund's Advisory Contracts, the Board will consider: (i) the nature, extent and quality of services provided to the fund, including shareholder and administrative services and investment performance; (ii) the competitiveness of the management fee and total expenses for the fund; (iii) the costs of the services and profitability, including the revenues earned and the expenses incurred in conducting the business of developing, marketing, distributing, managing, administering, and servicing the fund and its shareholders, to the extent applicable, as well as potential fall-out benefits from Fidelity's non-fund businesses; and (iv) whether there have been economies of scale in respect of the Fidelity funds, whether the Fidelity funds (including the fund) have appropriately benefited from any such economies of scale, and whether there is the potential for realization of any further economies.
Based on its evaluation of all of the conclusions noted above, and after considering all factors it believed relevant, the Board ultimately concluded that the fund's management fee structure is fair and reasonable, and that the continuation of the fund's Advisory Contracts should be approved.

AISC-ANN-1218
1.793569.115
Fidelity® International Small Cap Fund
Annual Report October 31, 2018 |
|
Contents
To view a fund's proxy voting guidelines and proxy voting record for the 12-month period ended June 30, visit http://www.fidelity.com/proxyvotingresults or visit the Securities and Exchange Commission's (SEC) web site at http://www.sec.gov.
You may also call 1-800-544-8544 to request a free copy of the proxy voting guidelines.
Standard & Poor's, S&P and S&P 500 are registered service marks of The McGraw-Hill Companies, Inc. and have been licensed for use by Fidelity Distributors Corporation.
Other third-party marks appearing herein are the property of their respective owners.
All other marks appearing herein are registered or unregistered trademarks or service marks of FMR LLC or an affiliated company. © 2018 FMR LLC. All rights reserved.
This report and the financial statements contained herein are submitted for the general information of the shareholders of the Fund. This report is not authorized for distribution to prospective investors in the Fund unless preceded or accompanied by an effective prospectus.
A fund files its complete schedule of portfolio holdings with the SEC for the first and third quarters of each fiscal year on Form N-Q. Forms N-Q are available on the SEC’s web site at http://www.sec.gov. A fund's Forms N-Q may be reviewed and copied at the SEC’s Public Reference Room in Washington, DC. Information regarding the operation of the SEC's Public Reference Room may be obtained by calling 1-800-SEC-0330.
For a complete list of a fund's portfolio holdings, view the most recent holdings listing, semiannual report, or annual report on Fidelity's web site at http://www.fidelity.com, http://www.institutional.fidelity.com, or http://www.401k.com, as applicable.
NOT FDIC INSURED •MAY LOSE VALUE •NO BANK GUARANTEE
Neither the Fund nor Fidelity Distributors Corporation is a bank.
Performance: The Bottom Line
Average annual total return reflects the change in the value of an investment, assuming reinvestment of distributions from dividend income and capital gains (the profits earned upon the sale of securities that have grown in value, if any) and assuming a constant rate of performance each year. The hypothetical investment and the average annual total returns do not reflect the deduction of taxes that a shareholder would pay on fund distributions or the redemption of fund shares. During periods of reimbursement by Fidelity, a fund’s total return will be greater than it would be had the reimbursement not occurred. How a fund did yesterday is no guarantee of how it will do tomorrow.
Average Annual Total Returns
| For the periods ended October 31, 2018 | Past 1 year | Past 5 years | Past 10 years |
| Fidelity® International Small Cap Fund | (8.54)% | 5.57% | 12.45% |
Prior to April 1, 2014, the fund compared its performance to a different benchmark. The fund's historical performance may not represent its current investment policies.
$10,000 Over 10 Years
Let's say hypothetically that $10,000 was invested in Fidelity® International Small Cap Fund, a class of the fund, on October 31, 2008.
The chart shows how the value of your investment would have changed, and also shows how the MSCI ACWI (All Country World Index) ex USA Small Cap Index performed over the same period.
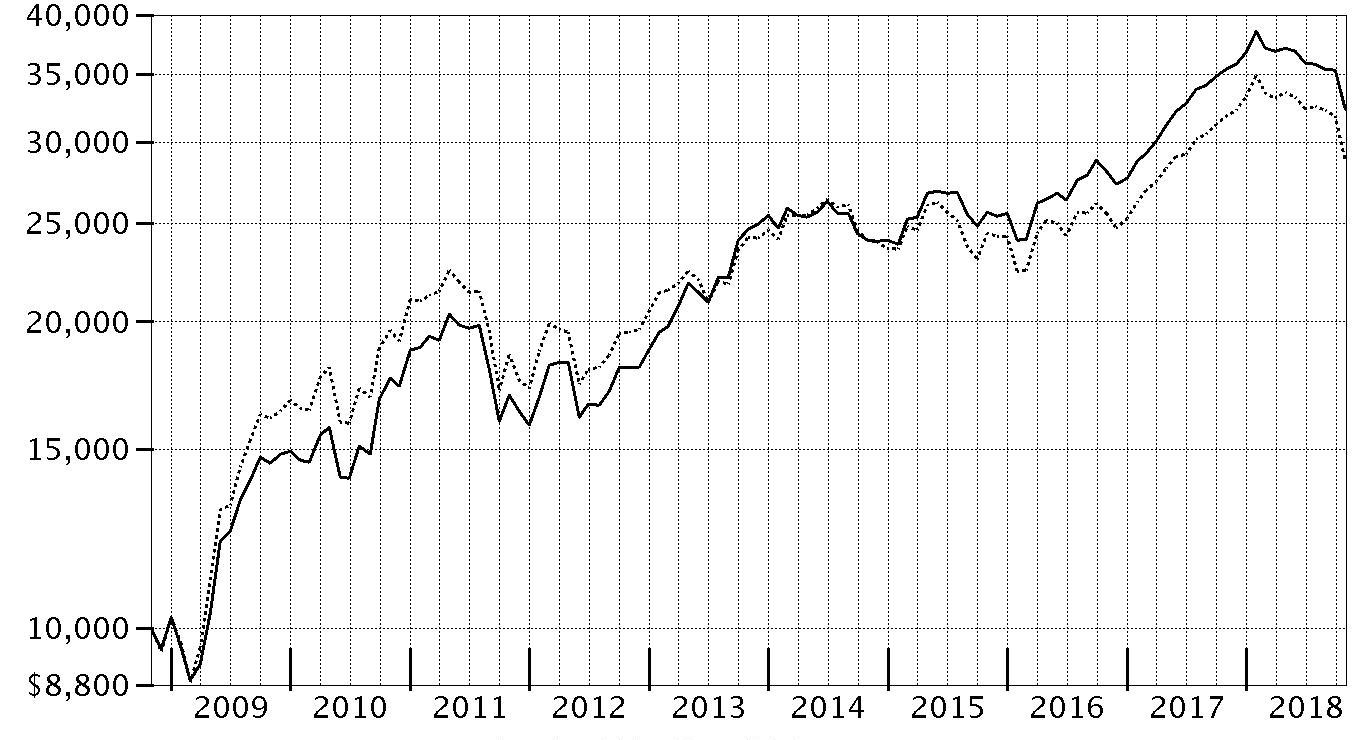
| Period Ending Values |
| $32,326 | Fidelity® International Small Cap Fund |
| $28,744 | MSCI ACWI (All Country World Index) ex USA Small Cap Index |
Management's Discussion of Fund Performance
Market Recap: International equities returned -8.08% for the 12 months ending October 31, 2018, according to the MSCI ACWI (All Country World Index) ex USA Index. A modestly positive first half of the period gave way to a confluence of overwhelmingly negative factors – including escalating trade tension, a surging U.S. dollar, tepid economic growth in Europe, global central bank tightening, concerns about Italy’s budget stalemate with the EU, and weakness in China’s stock market – that yielded a -11% second-half return. The index lost 8% in October alone, its largest monthly drop in more than six years. Among sectors, new-media-infused communications services (-15%) was hit the hardest, while economically sensitive consumer discretionary (-13%), information technology (-12%), financials (-10%), industrials (-9%) and materials (-7%) stocks also fared poorly. Even the more defensive real estate (-9%), utilities (-6%) and consumer staples (-5%) sectors weren’t spared this period. Conversely, elevated crude-oil prices fueled a positive return for energy (+7%), the top-performing sector, followed by the relatively stable-growing health care segment (+2%). Regionally, emerging markets (-12%) fared the worst, hampered by the impact of foreign exchange and concerns about economic weakness in China, India and South Korea. Sluggish growth also pressured shares in continental Europe (-9%). Stocks in Japan (-3%) and the U.K. (-4%) held up better, followed by Canada (-5%) and Asia-Pacific ex Japan (-6%).
Comments from Portfolio Manager Samuel Chamovitz: For the year, the fund’s share classes (excluding sales charges, if applicable) returned in the range of roughly -8.5% to -9.5%, ahead of the -9.62% return of the benchmark MSCI ACWI (All Country World Index) ex USA Small Cap Index. Versus the benchmark, stock selection in industrials aided fund performance, while picks in financials and information technology helped to a lesser extent. A cash position also was beneficial in a declining market. Geographically, positioning in emerging markets bolstered relative performance, along with stock picking in Japan and non-benchmark exposure to the United States. At the stock level, an out-of-benchmark position in Luxfer Holdings was the fund’s top relative contributor. This U.K.-based firm designs, manufactures and supplies high-performance materials, components and high-pressure gas-containment devices. Positioning in Yageo, a Taiwan-based maker of passive electrical components, also added value. I exited this position. A non-index stake in LivaNova, a London-based maker of medical devices, helped as well. Conversely, positioning in the real estate sector detracted, as did stock choices in consumer discretionary. Regionally, picks in the U.K. detracted, along with stock selection in Australia and Canada. A non-index position in U.K.-based enterprise software provider Micro Focus International was the fund’s biggest relative detractor. An out-of-benchmark stake in U.K.-based McColl’s Retail Group further detracted.
The views expressed above reflect those of the portfolio manager(s) only through the end of the period as stated on the cover of this report and do not necessarily represent the views of Fidelity or any other person in the Fidelity organization. Any such views are subject to change at any time based upon market or other conditions and Fidelity disclaims any responsibility to update such views. These views may not be relied on as investment advice and, because investment decisions for a Fidelity fund are based on numerous factors, may not be relied on as an indication of trading intent on behalf of any Fidelity fund.
Investment Summary (Unaudited)
Geographic Diversification (% of fund's net assets)
| As of October 31, 2018 |
| | Japan | 22.2% |
| | United Kingdom | 17.2% |
| | Canada | 5.7% |
| | Australia | 5.1% |
| | Taiwan | 4.0% |
| | United States of America* | 3.9% |
| | Cayman Islands | 3.7% |
| | France | 3.2% |
| | Finland | 2.9% |
| | Other | 32.1% |

* Includes Short-Term investments and Net Other Assets (Liabilities).
Percentages are based on country or territory of incorporation and are adjusted for the effect of futures contracts, if applicable.
Asset Allocation as of October 31, 2018
| | % of fund's net assets |
| Stocks | 96.1 |
| Short-Term Investments and Net Other Assets (Liabilities) | 3.9 |
Top Ten Stocks as of October 31, 2018
| | % of fund's net assets |
| S Foods, Inc. (Japan, Food Products) | 1.3 |
| LivaNova PLC (United Kingdom, Health Care Equipment & Supplies) | 1.1 |
| Inghams Group Ltd. (Australia, Food Products) | 1.1 |
| John Wood Group PLC (United Kingdom, Energy Equipment & Services) | 1.0 |
| Ship Healthcare Holdings, Inc. (Japan, Health Care Providers & Services) | 1.0 |
| JSR Corp. (Japan, Chemicals) | 1.0 |
| Luxfer Holdings PLC sponsored (United Kingdom, Machinery) | 1.0 |
| Cineworld Group PLC (United Kingdom, Entertainment) | 1.0 |
| Micro Focus International PLC (United Kingdom, Software) | 0.9 |
| PALTAC Corp. (Japan, Distributors) | 0.9 |
| | 10.3 |
Top Market Sectors as of October 31, 2018
| | % of fund's net assets |
| Industrials | 19.4 |
| Consumer Discretionary | 14.5 |
| Financials | 13.5 |
| Consumer Staples | 10.3 |
| Materials | 9.6 |
| Information Technology | 8.1 |
| Health Care | 7.6 |
| Real Estate | 5.9 |
| Energy | 3.8 |
| Communication Services | 2.6 |
Schedule of Investments October 31, 2018
Showing Percentage of Net Assets
| Common Stocks - 95.7% | | | |
| | | Shares | Value |
| Australia - 5.1% | | | |
| Aub Group Ltd. | | 897,658 | $8,562,563 |
| Austal Ltd. | | 944,082 | 1,196,707 |
| Challenger Ltd. | | 746,361 | 5,422,775 |
| GUD Holdings Ltd. | | 1,651,154 | 14,428,726 |
| Hansen Technologies Ltd. | | 3,299,442 | 8,084,289 |
| Imdex Ltd. (a) | | 11,388,898 | 9,274,805 |
| Inghams Group Ltd. (b) | | 7,861,299 | 21,711,218 |
| Nanosonics Ltd. (a) | | 4,278,690 | 9,089,863 |
| Pact Group Holdings Ltd. (c) | | 3,120,432 | 7,711,971 |
| Reckon Ltd. | | 5,193,683 | 2,666,482 |
| Servcorp Ltd. | | 3,379,081 | 8,399,066 |
| SomnoMed Ltd. (a)(b) | | 2,687,331 | 3,006,793 |
|
| TOTAL AUSTRALIA | | | 99,555,258 |
|
| Austria - 2.4% | | | |
| Andritz AG | | 192,432 | 9,973,763 |
| IMMOFINANZ Immobilien Anlagen AG | | 608,174 | 14,507,145 |
| Mayr-Melnhof Karton AG | | 76,300 | 9,661,890 |
| Wienerberger AG | | 594,700 | 13,687,287 |
|
| TOTAL AUSTRIA | | | 47,830,085 |
|
| Belgium - 0.6% | | | |
| Barco NV | | 104,983 | 11,962,245 |
| Bermuda - 1.7% | | | |
| China Resource Gas Group Ltd. | | 2,916,000 | 11,155,389 |
| Hiscox Ltd. | | 660,225 | 13,738,685 |
| Petra Diamonds Ltd. (a)(b) | | 16,078,352 | 8,043,798 |
|
| TOTAL BERMUDA | | | 32,937,872 |
|
| Brazil - 1.8% | | | |
| Estacio Participacoes SA | | 2,667,500 | 16,579,141 |
| Sul America SA unit | | 2,657,900 | 17,712,191 |
|
| TOTAL BRAZIL | | | 34,291,332 |
|
| Canada - 5.7% | | | |
| Dorel Industries, Inc. Class B (sub. vtg.) | | 426,803 | 6,976,946 |
| Genesis Land Development Corp. (d) | | 2,266,422 | 5,698,551 |
| Lassonde Industries, Inc. Class A (sub. vtg.) | | 89,669 | 15,815,447 |
| McCoy Global, Inc. (a) | | 1,334,670 | 1,165,916 |
| North West Co., Inc. | | 780,500 | 17,015,724 |
| Open Text Corp. | | 346,496 | 11,696,823 |
| Pinnacle Renewable Holds, Inc. | | 1,114,525 | 12,258,971 |
| Total Energy Services, Inc. | | 622,200 | 4,504,209 |
| TransForce, Inc. | | 421,800 | 14,037,037 |
| Western Forest Products, Inc. | | 9,524,900 | 12,734,114 |
| Whitecap Resources, Inc. | | 2,222,553 | 10,872,605 |
|
| TOTAL CANADA | | | 112,776,343 |
|
| Cayman Islands - 3.7% | | | |
| AMVIG Holdings Ltd. | | 28,280,000 | 7,068,242 |
| Best Pacific International Holdings Ltd. (b) | | 17,964,000 | 4,581,514 |
| China High Precision Automation Group Ltd. (a)(e) | | 712,000 | 1 |
| China Metal Recycling (Holdings) Ltd. (a)(e) | | 436,800 | 1 |
| Haitian International Holdings Ltd. | | 4,404,000 | 8,592,404 |
| Pico Far East Holdings Ltd. | | 24,510,000 | 8,282,570 |
| Precision Tsugami China Corp. Ltd. | | 7,854,000 | 7,160,987 |
| SITC International Holdings Co. Ltd. | | 20,744,000 | 15,236,700 |
| Value Partners Group Ltd. | | 14,410,000 | 10,694,559 |
| Xingda International Holdings Ltd. | | 41,759,909 | 11,236,160 |
|
| TOTAL CAYMAN ISLANDS | | | 72,853,138 |
|
| China - 1.1% | | | |
| Qingdao Port International Co. Ltd. (a)(c) | | 19,928,000 | 11,689,542 |
| Weifu High-Technology Group Co. Ltd. (B Shares) | | 5,679,604 | 9,893,380 |
|
| TOTAL CHINA | | | 21,582,922 |
|
| Denmark - 1.6% | | | |
| Jyske Bank A/S (Reg.) | | 193,403 | 7,907,123 |
| Scandinavian Tobacco Group A/S (c) | | 860,128 | 13,051,632 |
| Spar Nord Bank A/S | | 1,293,600 | 10,722,883 |
|
| TOTAL DENMARK | | | 31,681,638 |
|
| Finland - 2.9% | | | |
| Ahlstrom-Munksjo Oyj | | 602,100 | 9,383,887 |
| Asiakastieto Group Oyj (c) | | 487,423 | 16,010,310 |
| Cramo Oyj (B Shares) | | 445,510 | 8,487,488 |
| Kojamo OYJ | | 854,600 | 8,807,493 |
| Olvi PLC (A Shares) | | 341,938 | 11,463,964 |
| Tikkurila Oyj (b) | | 239,619 | 3,262,282 |
|
| TOTAL FINLAND | | | 57,415,424 |
|
| France - 3.2% | | | |
| Altarea SCA | | 61,330 | 13,490,185 |
| Maisons du Monde SA (c) | | 364,707 | 9,145,710 |
| Rexel SA | | 680,700 | 8,689,112 |
| The Vicat Group | | 215,956 | 11,618,622 |
| Thermador Groupe SA | | 152,666 | 8,230,856 |
| Wendel SA | | 94,535 | 12,270,803 |
|
| TOTAL FRANCE | | | 63,445,288 |
|
| Germany - 1.0% | | | |
| Bertrandt AG | | 155,600 | 12,883,169 |
| SHW Group | | 270,539 | 6,787,336 |
|
| TOTAL GERMANY | | | 19,670,505 |
|
| Greece - 0.8% | | | |
| Mytilineos Holdings SA | | 1,748,116 | 15,463,828 |
| Hong Kong - 2.5% | | | |
| Dah Sing Banking Group Ltd. | | 8,122,800 | 15,433,626 |
| Far East Horizon Ltd. | | 8,745,000 | 8,475,188 |
| Magnificent Hotel Investment Ltd. | | 266,270,000 | 6,213,685 |
| Sino Land Ltd. | | 8,169,251 | 12,813,368 |
| Techtronic Industries Co. Ltd. | | 1,221,000 | 5,714,229 |
|
| TOTAL HONG KONG | | | 48,650,096 |
|
| India - 0.7% | | | |
| Torrent Pharmaceuticals Ltd. | | 593,358 | 13,378,634 |
| Indonesia - 0.6% | | | |
| PT ACE Hardware Indonesia Tbk | | 80,626,400 | 7,265,790 |
| PT Media Nusantara Citra Tbk | | 75,080,400 | 3,852,176 |
|
| TOTAL INDONESIA | | | 11,117,966 |
|
| Ireland - 1.7% | | | |
| Irish Residential Properties REIT PLC | | 6,909,400 | 11,128,475 |
| Mincon Group PLC | | 7,189,744 | 9,772,156 |
| Origin Enterprises PLC | | 920,300 | 5,910,282 |
| United Drug PLC (United Kingdom) | | 907,549 | 7,331,384 |
|
| TOTAL IRELAND | | | 34,142,297 |
|
| Italy - 1.2% | | | |
| Banca Generali SpA | | 533,000 | 10,281,053 |
| Banco di Desio e della Brianza SpA | | 2,376,445 | 4,871,942 |
| Recordati SpA | | 260,900 | 8,841,611 |
|
| TOTAL ITALY | | | 23,994,606 |
|
| Japan - 22.2% | | | |
| A/S One Corp. | | 168,900 | 12,004,945 |
| Aeon Delight Co. Ltd. | | 404,000 | 13,534,098 |
| Arata Corp. | | 387,700 | 17,592,272 |
| Arc Land Sakamoto Co. Ltd. | | 831,800 | 10,947,162 |
| Aucnet, Inc. | | 832,900 | 8,732,403 |
| Broadleaf Co. Ltd. | | 727,800 | 4,205,482 |
| Central Automotive Products Ltd. | | 339,100 | 4,613,094 |
| Daiwa Industries Ltd. | | 1,053,600 | 11,120,996 |
| Dexerials Corp. | | 1,321,000 | 11,367,847 |
| Funai Soken Holdings, Inc. | | 297,180 | 6,302,581 |
| GMO Internet, Inc. | | 708,900 | 10,127,592 |
| Iida Group Holdings Co. Ltd. | | 631,951 | 11,503,765 |
| Isuzu Motors Ltd. | | 1,062,000 | 13,923,403 |
| Japan Meat Co. Ltd. | | 657,800 | 11,921,842 |
| JSR Corp. | | 1,355,200 | 20,249,632 |
| Kirindo Holdings Co. Ltd. (d) | | 647,909 | 9,066,764 |
| Kotobuki Spirits Co. Ltd. | | 45,300 | 1,734,355 |
| Meitec Corp. | | 211,400 | 8,861,807 |
| Mitani Shoji Co. Ltd. | | 285,700 | 13,622,245 |
| Morinaga & Co. Ltd. | | 321,600 | 12,925,564 |
| Nihon Parkerizing Co. Ltd. | | 1,155,200 | 13,954,337 |
| Nitori Holdings Co. Ltd. | | 32,600 | 4,257,199 |
| Otsuka Corp. | | 205,500 | 6,829,663 |
| PALTAC Corp. | | 351,100 | 17,922,949 |
| Paramount Bed Holdings Co. Ltd. | | 413,500 | 17,425,378 |
| Renesas Electronics Corp. (a) | | 2,014,500 | 10,676,395 |
| Ricoh Leasing Co. Ltd. | | 179,300 | 5,887,415 |
| S Foods, Inc. | | 609,600 | 24,608,746 |
| San-Ai Oil Co. Ltd. | | 1,062,000 | 11,473,195 |
| Shinsei Bank Ltd. | | 1,002,800 | 15,275,649 |
| Ship Healthcare Holdings, Inc. | | 559,900 | 20,270,231 |
| Taiheiyo Cement Corp. | | 338,400 | 9,957,991 |
| TKC Corp. | | 259,000 | 9,870,164 |
| Toshiba Plant Systems & Services Corp. | | 711,800 | 14,559,617 |
| Tsuruha Holdings, Inc. | | 86,700 | 9,036,132 |
| VT Holdings Co. Ltd. | | 1,655,600 | 6,896,194 |
| Welcia Holdings Co. Ltd. | | 161,100 | 8,223,831 |
| Yamada Consulting Group Co. Ltd. | | 682,680 | 15,736,701 |
|
| TOTAL JAPAN | | | 437,219,636 |
|
| Korea (South) - 1.0% | | | |
| Hyundai Fire & Marine Insurance Co. Ltd. | | 350,666 | 12,846,484 |
| NS Shopping Co. Ltd. | | 738,049 | 6,985,915 |
|
| TOTAL KOREA (SOUTH) | | | 19,832,399 |
|
| Luxembourg - 0.2% | | | |
| Shurgard Self Storage Europe SARL | | 146,177 | 4,103,587 |
| Mexico - 0.9% | | | |
| Credito Real S.A.B. de CV | | 6,947,800 | 7,948,845 |
| Genomma Lab Internacional SA de CV (a) | | 13,512,000 | 8,680,620 |
|
| TOTAL MEXICO | | | 16,629,465 |
|
| Netherlands - 2.8% | | | |
| Amsterdam Commodities NV | | 443,955 | 9,312,701 |
| Arcadis NV | | 756,989 | 10,245,973 |
| Basic-Fit NV (a)(c) | | 279,800 | 8,065,499 |
| BinckBank NV | | 1,316,280 | 6,380,986 |
| Philips Lighting NV (c) | | 498,400 | 12,306,378 |
| RHI Magnesita NV | | 186,510 | 9,337,274 |
|
| TOTAL NETHERLANDS | | | 55,648,811 |
|
| New Zealand - 1.0% | | | |
| Air New Zealand Ltd. | | 5,215,371 | 9,529,213 |
| EBOS Group Ltd. | | 757,465 | 10,300,874 |
|
| TOTAL NEW ZEALAND | | | 19,830,087 |
|
| Norway - 0.7% | | | |
| ABG Sundal Collier ASA | | 9,702,926 | 5,812,686 |
| Skandiabanken ASA (c) | | 736,574 | 7,339,702 |
|
| TOTAL NORWAY | | | 13,152,388 |
|
| Philippines - 0.3% | | | |
| Century Pacific Food, Inc. | | 25,480,600 | 6,370,508 |
| Romania - 0.6% | | | |
| Banca Transilvania SA | | 22,226,361 | 12,523,110 |
| Singapore - 1.8% | | | |
| Boustead Singapore Ltd. | | 10,252,969 | 5,773,610 |
| Hour Glass Ltd. | | 8,713,000 | 3,994,336 |
| Mapletree Industrial (REIT) | | 8,724,394 | 11,652,261 |
| Wing Tai Holdings Ltd. | | 9,229,100 | 12,859,375 |
|
| TOTAL SINGAPORE | | | 34,279,582 |
|
| South Africa - 0.4% | | | |
| Clicks Group Ltd. | | 677,618 | 8,635,295 |
| Sweden - 1.9% | | | |
| AddTech AB (B Shares) | | 433,819 | 8,864,913 |
| Coor Service Management Holding AB (c) | | 780,600 | 5,501,899 |
| Dustin Group AB (b)(c) | | 1,416,345 | 11,360,291 |
| Dustin Group AB rights 11/7/18 (a)(b) | | 1,316,245 | 206,258 |
| Granges AB | | 1,060,021 | 11,212,802 |
|
| TOTAL SWEDEN | | | 37,146,163 |
|
| Switzerland - 0.7% | | | |
| Vontobel Holdings AG | | 208,799 | 12,957,293 |
| Taiwan - 4.0% | | | |
| King's Town Bank | | 10,376,000 | 9,903,290 |
| Lumax International Corp. Ltd. | | 4,466,600 | 8,973,451 |
| Makalot Industrial Co. Ltd. | | 2,855,540 | 15,310,465 |
| Sporton International, Inc. | | 2,646,740 | 9,831,078 |
| Test Research, Inc. | | 6,278,000 | 8,688,887 |
| Tripod Technology Corp. | | 4,665,000 | 11,255,487 |
| United Microelectronics Corp. | | 22,544,000 | 8,586,248 |
| Yung Chi Paint & Varnish Manufacturing Co. Ltd. | | 2,243,000 | 5,361,089 |
|
| TOTAL TAIWAN | | | 77,909,995 |
|
| Thailand - 1.5% | | | |
| Delta Electronics PCL (For. Reg.) | | 2,484,400 | 5,169,590 |
| Star Petroleum Refining PCL | | 36,584,100 | 15,555,965 |
| TISCO Financial Group PCL | | 3,832,700 | 9,102,085 |
|
| TOTAL THAILAND | | | 29,827,640 |
|
| Turkey - 0.2% | | | |
| Aygaz A/S | | 2,129,000 | 4,631,573 |
| United Kingdom - 17.2% | | | |
| AEW UK REIT PLC (b) | | 4,299,768 | 5,237,653 |
| Alliance Pharma PLC | | 10,916,365 | 9,320,803 |
| Bond International Software PLC (a)(e) | | 899,666 | 12 |
| Cineworld Group PLC | | 5,226,980 | 19,682,597 |
| Close Brothers Group PLC | | 481,823 | 9,065,550 |
| Countrywide PLC (a) | | 61,771,375 | 8,274,607 |
| Diploma PLC | | 593,351 | 9,973,239 |
| Elementis PLC | | 4,973,225 | 13,031,391 |
| Essentra PLC | | 1,892,691 | 9,241,488 |
| Indivior PLC (a) | | 1,927,100 | 4,639,473 |
| Informa PLC | | 1,097,924 | 10,014,423 |
| ITE Group PLC | | 12,845,930 | 9,359,211 |
| James Fisher and Sons PLC | | 284,500 | 6,160,195 |
| John Wood Group PLC | | 2,235,500 | 20,407,666 |
| Knights Group Holdings PLC (a)(d) | | 3,797,900 | 9,077,384 |
| LivaNova PLC (a) | | 196,600 | 22,017,234 |
| Luxfer Holdings PLC sponsored | | 860,709 | 19,865,164 |
| McColl's Retail Group PLC (d) | | 7,053,881 | 11,518,286 |
| Mears Group PLC | | 2,897,612 | 13,148,233 |
| Melrose Industries PLC | | 4,272,270 | 9,209,665 |
| Micro Focus International PLC | | 1,195,040 | 18,525,769 |
| Moneysupermarket.com Group PLC | | 3,472,579 | 13,018,562 |
| PayPoint PLC | | 806,811 | 8,157,313 |
| Sabre Insurance Group PLC (c) | | 2,916,015 | 9,839,941 |
| Spectris PLC | | 417,791 | 11,449,399 |
| Ten Entertainment Group PLC (d) | | 3,787,019 | 11,133,306 |
| The Weir Group PLC | | 621,638 | 12,602,002 |
| Topps Tiles PLC | | 6,514,169 | 5,237,312 |
| Tullett Prebon PLC | | 3,629,226 | 13,452,742 |
| Ultra Electronics Holdings PLC | | 373,197 | 6,859,553 |
| Volution Group PLC | | 3,956,300 | 8,748,511 |
|
| TOTAL UNITED KINGDOM | | | 338,268,684 |
|
| TOTAL COMMON STOCKS | | | |
| (Cost $1,897,164,960) | | | 1,881,715,693 |
|
| Nonconvertible Preferred Stocks - 0.4% | | | |
| Brazil - 0.4% | | | |
| Banco ABC Brasil SA | | | |
| (Cost $8,133,217) | | 2,035,858 | 8,845,848 |
|
| Money Market Funds - 4.1% | | | |
| Fidelity Cash Central Fund, 2.23% (f) | | 63,608,475 | 63,621,197 |
| Fidelity Securities Lending Cash Central Fund 2.23% (f)(g) | | 17,020,322 | 17,022,024 |
| TOTAL MONEY MARKET FUNDS | | | |
| (Cost $80,634,414) | | | 80,643,221 |
| TOTAL INVESTMENT IN SECURITIES - 100.2% | | | |
| (Cost $1,985,932,591) | | | 1,971,204,762 |
| NET OTHER ASSETS (LIABILITIES) - (0.2)% | | | (3,926,534) |
| NET ASSETS - 100% | | | $1,967,278,228 |
Categorizations in the Schedule of Investments are based on country or territory of incorporation.
Legend
(a) Non-income producing
(b) Security or a portion of the security is on loan at period end.
(c) Security exempt from registration under Rule 144A of the Securities Act of 1933. These securities may be resold in transactions exempt from registration, normally to qualified institutional buyers. At the end of the period, the value of these securities amounted to $112,022,875 or 5.7% of net assets.
(d) Affiliated company
(e) Level 3 security
(f) Affiliated fund that is generally available only to investment companies and other accounts managed by Fidelity Investments. The rate quoted is the annualized seven-day yield of the fund at period end. A complete unaudited listing of the fund's holdings as of its most recent quarter end is available upon request. In addition, each Fidelity Central Fund's financial statements, which are not covered by the Fund's Report of Independent Registered Public Accounting Firm, are available on the SEC's website or upon request.
(g) Investment made with cash collateral received from securities on loan.
Affiliated Central Funds
Information regarding fiscal year to date income earned by the Fund from investments in Fidelity Central Funds is as follows:
| Fund | Income earned |
| Fidelity Cash Central Fund | $1,601,702 |
| Fidelity Securities Lending Cash Central Fund | 387,206 |
| Total | $1,988,908 |
Amounts in the income column in the above table include any capital gain distributions from underlying funds, which are presented in the corresponding line-item in the Statement of Operations if applicable.
Other Affiliated Issuers
An affiliated company is a company in which the Fund has ownership of at least 5% of the voting securities. Fiscal year to date transactions with companies which are or were affiliates are as follows:
| Affiliate | Value, beginning of period | Purchases | Sales Proceeds | Dividend Income | Realized Gain (loss) | Change in Unrealized appreciation (depreciation) | Value, end of period |
| Genesis Land Development Corp. | $6,005,072 | $672,245 | $-- | $697,316 | $-- | $(978,766) | $5,698,551 |
| Kirindo Holdings Co. Ltd. | 8,403,137 | 433,323 | -- | 184,989 | -- | 230,304 | 9,066,764 |
| Knights Group Holdings PLC | -- | 7,376,799 | -- | -- | -- | 1,700,585 | 9,077,384 |
| McColl's Retail Group PLC | 14,243,650 | 8,050,485 | -- | 712,123 | -- | (10,775,849) | 11,518,286 |
| Ten Entertainment Group PLC | 10,172,260 | 863,195 | -- | 496,457 | -- | 97,851 | 11,133,306 |
| Total | $38,824,119 | $17,396,047 | $-- | $2,090,885 | $-- | $(9,725,875) | $46,494,291 |
Investment Valuation
The following is a summary of the inputs used, as of October 31, 2018, involving the Fund's assets and liabilities carried at fair value. The inputs or methodology used for valuing securities may not be an indication of the risk associated with investing in those securities. For more information on valuation inputs, and their aggregation into the levels used below, please refer to the Investment Valuation section in the accompanying Notes to Financial Statements.
| | Valuation Inputs at Reporting Date: |
| Description | Total | Level 1 | Level 2 | Level 3 |
| Investments in Securities: | | | | |
| Equities: | | | | |
| Communication Services | $51,190,977 | $51,190,977 | $-- | $-- |
| Consumer Discretionary | 279,600,386 | 265,676,983 | 13,923,403 | -- |
| Consumer Staples | 198,322,291 | 198,322,291 | -- | -- |
| Energy | 76,238,527 | 76,238,527 | -- | -- |
| Financials | 273,275,017 | 257,999,368 | 15,275,649 | -- |
| Health Care | 146,307,843 | 146,307,843 | -- | -- |
| Industrials | 384,606,116 | 384,606,116 | -- | -- |
| Information Technology | 163,468,753 | 136,356,723 | 27,112,017 | 13 |
| Materials | 184,792,903 | 174,834,911 | 9,957,991 | 1 |
| Real Estate | 116,971,766 | 116,971,766 | -- | -- |
| Utilities | 15,786,962 | 15,786,962 | -- | -- |
| Money Market Funds | 80,643,221 | 80,643,221 | -- | -- |
| Total Investments in Securities: | $1,971,204,762 | $1,904,935,688 | $66,269,060 | $14 |
The following is a summary of transfers between Level 1 and Level 2 for the period ended October 31, 2018. Transfers are assumed to have occurred at the beginning of the period, and are primarily attributable to the valuation techniques used for foreign equity securities, as discussed in the accompanying Notes to Financial Statements:
| Transfers | Total |
| Level 1 to Level 2 | $19,940,948 |
| Level 2 to Level 1 | $326,046,864 |
See accompanying notes which are an integral part of the financial statements.
Financial Statements
Statement of Assets and Liabilities
| | | October 31, 2018 |
| Assets | | |
Investment in securities, at value (including securities loaned of $16,054,694) — See accompanying schedule:
Unaffiliated issuers (cost $1,858,794,155) | $1,844,067,250 | |
| Fidelity Central Funds (cost $80,634,414) | 80,643,221 | |
| Other affiliated issuers (cost $46,504,022) | 46,494,291 | |
| Total Investment in Securities (cost $1,985,932,591) | | $1,971,204,762 |
| Foreign currency held at value (cost $455,970) | | 455,547 |
| Receivable for investments sold | | 3,395,293 |
| Receivable for fund shares sold | | 9,716,162 |
| Dividends receivable | | 6,167,155 |
| Distributions receivable from Fidelity Central Funds | | 204,510 |
| Prepaid expenses | | 4,247 |
| Other receivables | | 70,119 |
| Total assets | | 1,991,217,795 |
| Liabilities | | |
| Payable for investments purchased | $1,921,485 | |
| Payable for fund shares redeemed | 2,591,383 | |
| Accrued management fee | 1,633,348 | |
| Distribution and service plan fees payable | 61,100 | |
| Other affiliated payables | 410,731 | |
| Other payables and accrued expenses | 297,248 | |
| Collateral on securities loaned | 17,024,272 | |
| Total liabilities | | 23,939,567 |
| Net Assets | | $1,967,278,228 |
| Net Assets consist of: | | |
| Paid in capital | | $1,904,983,681 |
| Total distributable earnings (loss) | | 62,294,547 |
| Net Assets | | $1,967,278,228 |
| Net Asset Value and Maximum Offering Price | | |
| Class A: | | |
| Net Asset Value and redemption price per share ($80,395,428 ÷ 3,118,459 shares) | | $25.78 |
| Maximum offering price per share (100/94.25 of $25.78) | | $27.35 |
| Class M: | | |
| Net Asset Value and redemption price per share ($16,362,392 ÷ 638,668 shares) | | $25.62 |
| Maximum offering price per share (100/96.50 of $25.62) | | $26.55 |
| Class C: | | |
| Net Asset Value and offering price per share ($41,917,911 ÷ 1,692,433 shares)(a) | | $24.77 |
| International Small Cap: | | |
| Net Asset Value, offering price and redemption price per share ($1,256,192,753 ÷ 47,788,306 shares) | | $26.29 |
| Class I: | | |
| Net Asset Value, offering price and redemption price per share ($564,988,327 ÷ 21,359,197 shares) | | $26.45 |
| Class Z: | | |
| Net Asset Value, offering price and redemption price per share ($7,421,417 ÷ 280,503 shares) | | $26.46 |
(a) Redemption price per share is equal to net asset value less any applicable contingent deferred sales charge.
See accompanying notes which are an integral part of the financial statements.
Statement of Operations
| | | Year ended October 31, 2018 |
| Investment Income | | |
| Dividends (including $2,090,885 earned from other affiliated issuers) | | $62,918,743 |
| Income from Fidelity Central Funds | | 1,988,908 |
| Income before foreign taxes withheld | | 64,907,651 |
| Less foreign taxes withheld | | (5,717,603) |
| Total income | | 59,190,048 |
| Expenses | | |
| Management fee | | |
| Basic fee | $17,682,860 | |
| Performance adjustment | 1,960,527 | |
| Transfer agent fees | 3,833,626 | |
| Distribution and service plan fees | 729,435 | |
| Accounting and security lending fees | 928,047 | |
| Custodian fees and expenses | 603,520 | |
| Independent trustees' fees and expenses | 10,371 | |
| Registration fees | 192,729 | |
| Audit | 103,621 | |
| Legal | 4,880 | |
| Miscellaneous | 12,544 | |
| Total expenses before reductions | 26,062,160 | |
| Expense reductions | (245,370) | |
| Total expenses after reductions | | 25,816,790 |
| Net investment income (loss) | | 33,373,258 |
| Realized and Unrealized Gain (Loss) | | |
| Net realized gain (loss) on: | | |
| Investment securities: | | |
| Unaffiliated issuers | 77,660,559 | |
| Fidelity Central Funds | (2,374) | |
| Foreign currency transactions | (891,151) | |
| Total net realized gain (loss) | | 76,767,034 |
| Change in net unrealized appreciation (depreciation) on: | | |
| Investment securities: | | |
| Unaffiliated issuers (net of increase in deferred foreign taxes of $37,498) | (312,871,323) | |
| Fidelity Central Funds | 20 | |
| Other affiliated issuers | (9,725,875) | |
| Assets and liabilities in foreign currencies | (27,619) | |
| Total change in net unrealized appreciation (depreciation) | | (322,624,797) |
| Net gain (loss) | | (245,857,763) |
| Net increase (decrease) in net assets resulting from operations | | $(212,484,505) |
See accompanying notes which are an integral part of the financial statements.
Statement of Changes in Net Assets
| | Year ended October 31, 2018 | Year ended October 31, 2017 |
| Increase (Decrease) in Net Assets | | |
| Operations | | |
| Net investment income (loss) | $33,373,258 | $18,356,208 |
| Net realized gain (loss) | 76,767,034 | 41,195,813 |
| Change in net unrealized appreciation (depreciation) | (322,624,797) | 258,657,737 |
| Net increase (decrease) in net assets resulting from operations | (212,484,505) | 318,209,758 |
| Distributions to shareholders | (61,553,254) | – |
| Distributions to shareholders from net investment income | – | (14,393,212) |
| Distributions to shareholders from net realized gain | – | (12,478,859) |
| Total distributions | (61,553,254) | (26,872,071) |
| Share transactions - net increase (decrease) | 477,734,571 | 480,792,049 |
| Redemption fees | 48,167 | 258,237 |
| Total increase (decrease) in net assets | 203,744,979 | 772,387,973 |
| Net Assets | | |
| Beginning of period | 1,763,533,249 | 991,145,276 |
| End of period | $1,967,278,228 | $1,763,533,249 |
| Other Information | | |
| Undistributed net investment income end of period | | $16,549,081 |
See accompanying notes which are an integral part of the financial statements.
Financial Highlights
Fidelity International Small Cap Fund Class A
| Years ended October 31, | 2018 | 2017 | 2016 | 2015 | 2014 |
| Selected Per–Share Data | | | | | |
| Net asset value, beginning of period | $29.24 | $23.81 | $22.69 | $24.98 | $26.34 |
| Income from Investment Operations | | | | | |
| Net investment income (loss)A | .38 | .29 | .34 | .27 | .17 |
| Net realized and unrealized gain (loss) | (2.87) | 5.70 | 1.64 | 1.05 | (.89) |
| Total from investment operations | (2.49) | 5.99 | 1.98 | 1.32 | (.72) |
| Distributions from net investment income | (.23) | (.28) | (.25) | (.16) | (.05) |
| Distributions from net realized gain | (.74) | (.29) | (.62) | (3.45) | (.60) |
| Total distributions | (.97) | (.57) | (.87) | (3.61) | (.65) |
| Redemption fees added to paid in capitalA | –B | .01 | .01 | –B | .01 |
| Net asset value, end of period | $25.78 | $29.24 | $23.81 | $22.69 | $24.98 |
| Total ReturnC,D | (8.83)% | 25.83% | 9.11% | 6.21% | (2.79)% |
| Ratios to Average Net AssetsE,F | | | | | |
| Expenses before reductions | 1.49% | 1.55% | 1.61% | 1.59% | 1.50% |
| Expenses net of fee waivers, if any | 1.49% | 1.55% | 1.61% | 1.58% | 1.50% |
| Expenses net of all reductions | 1.48% | 1.55% | 1.61% | 1.58% | 1.50% |
| Net investment income (loss) | 1.33% | 1.11% | 1.50% | 1.18% | .65% |
| Supplemental Data | | | | | |
| Net assets, end of period (000 omitted) | $80,395 | $63,459 | $36,480 | $28,238 | $24,572 |
| Portfolio turnover rateG | 25% | 22% | 29% | 36% | 102% |
A Calculated based on average shares outstanding during the period.
B Amount represents less than $.005 per share.
C Total returns would have been lower if certain expenses had not been reduced during the applicable periods shown.
D Total returns do not include the effect of the sales charges.
E Fees and expenses of any underlying Fidelity Central Funds are not included in the Fund's expense ratio. The Fund indirectly bears its proportionate share of the expenses of any underlying Fidelity Central Funds.
F Expense ratios reflect operating expenses of the class. Expenses before reductions do not reflect amounts reimbursed by the investment adviser or reductions from brokerage service arrangements or reductions from other expense offset arrangements and do not represent the amount paid by the class during periods when reimbursements or reductions occur. Expenses net of fee waivers reflect expenses after reimbursement by the investment adviser but prior to reductions from brokerage service arrangements or other expense offset arrangements. Expenses net of all reductions represent the net expenses paid by the class.
G Amount does not include the portfolio activity of any underlying Fidelity Central Funds.
See accompanying notes which are an integral part of the financial statements.
Fidelity International Small Cap Fund Class M
| Years ended October 31, | 2018 | 2017 | 2016 | 2015 | 2014 |
| Selected Per–Share Data | | | | | |
| Net asset value, beginning of period | $29.07 | $23.65 | $22.55 | $24.81 | $26.17 |
| Income from Investment Operations | | | | | |
| Net investment income (loss)A | .30 | .21 | .27 | .21 | .10 |
| Net realized and unrealized gain (loss) | (2.86) | 5.69 | 1.63 | 1.04 | (.87) |
| Total from investment operations | (2.56) | 5.90 | 1.90 | 1.25 | (.77) |
| Distributions from net investment income | (.15) | (.19) | (.19) | (.06) | – |
| Distributions from net realized gain | (.74) | (.29) | (.62) | (3.45) | (.60) |
| Total distributions | (.89) | (.48) | (.81) | (3.51) | (.60) |
| Redemption fees added to paid in capitalA | –B | –B | .01 | –B | .01 |
| Net asset value, end of period | $25.62 | $29.07 | $23.65 | $22.55 | $24.81 |
| Total ReturnC,D | (9.10)% | 25.47% | 8.79% | 5.90% | (3.00)% |
| Ratios to Average Net AssetsE,F | | | | | |
| Expenses before reductions | 1.77% | 1.84% | 1.90% | 1.87% | 1.77% |
| Expenses net of fee waivers, if any | 1.77% | 1.84% | 1.90% | 1.86% | 1.77% |
| Expenses net of all reductions | 1.76% | 1.84% | 1.90% | 1.86% | 1.76% |
| Net investment income (loss) | 1.05% | .82% | 1.21% | .90% | .38% |
| Supplemental Data | | | | | |
| Net assets, end of period (000 omitted) | $16,362 | $18,148 | $13,331 | $12,400 | $12,296 |
| Portfolio turnover rateG | 25% | 22% | 29% | 36% | 102% |
A Calculated based on average shares outstanding during the period.
B Amount represents less than $.005 per share.
C Total returns would have been lower if certain expenses had not been reduced during the applicable periods shown.
D Total returns do not include the effect of the sales charges.
E Fees and expenses of any underlying Fidelity Central Funds are not included in the Fund's expense ratio. The Fund indirectly bears its proportionate share of the expenses of any underlying Fidelity Central Funds.
F Expense ratios reflect operating expenses of the class. Expenses before reductions do not reflect amounts reimbursed by the investment adviser or reductions from brokerage service arrangements or reductions from other expense offset arrangements and do not represent the amount paid by the class during periods when reimbursements or reductions occur. Expenses net of fee waivers reflect expenses after reimbursement by the investment adviser but prior to reductions from brokerage service arrangements or other expense offset arrangements. Expenses net of all reductions represent the net expenses paid by the class.
G Amount does not include the portfolio activity of any underlying Fidelity Central Funds.
See accompanying notes which are an integral part of the financial statements.
Fidelity International Small Cap Fund Class C
| Years ended October 31, | 2018 | 2017 | 2016 | 2015 | 2014 |
| Selected Per–Share Data | | | | | |
| Net asset value, beginning of period | $28.21 | $22.97 | $21.96 | $24.27 | $25.68 |
| Income from Investment Operations | | | | | |
| Net investment income (loss)A | .16 | .08 | .16 | .09 | (.02) |
| Net realized and unrealized gain (loss) | (2.76) | 5.53 | 1.59 | 1.02 | (.85) |
| Total from investment operations | (2.60) | 5.61 | 1.75 | 1.11 | (.87) |
| Distributions from net investment income | (.10) | (.08) | (.13) | – | – |
| Distributions from net realized gain | (.74) | (.29) | (.62) | (3.42) | (.55) |
| Total distributions | (.84) | (.37) | (.75) | (3.42) | (.55) |
| Redemption fees added to paid in capitalA | –B | –B | .01 | –B | .01 |
| Net asset value, end of period | $24.77 | $28.21 | $22.97 | $21.96 | $24.27 |
| Total ReturnC,D | (9.51)% | 24.85% | 8.26% | 5.37% | (3.43)% |
| Ratios to Average Net AssetsE,F | | | | | |
| Expenses before reductions | 2.24% | 2.33% | 2.40% | 2.36% | 2.23% |
| Expenses net of fee waivers, if any | 2.24% | 2.33% | 2.40% | 2.35% | 2.22% |
| Expenses net of all reductions | 2.23% | 2.32% | 2.39% | 2.35% | 2.22% |
| Net investment income (loss) | .58% | .33% | .71% | .41% | (.07)% |
| Supplemental Data | | | | | |
| Net assets, end of period (000 omitted) | $41,918 | $26,005 | $12,187 | $11,359 | $12,576 |
| Portfolio turnover rateG | 25% | 22% | 29% | 36% | 102% |
A Calculated based on average shares outstanding during the period.
B Amount represents less than $.005 per share.
C Total returns would have been lower if certain expenses had not been reduced during the applicable periods shown.
D Total returns do not include the effect of the contingent deferred sales charge.
E Fees and expenses of any underlying Fidelity Central Funds are not included in the Fund's expense ratio. The Fund indirectly bears its proportionate share of the expenses of any underlying Fidelity Central Funds.
F Expense ratios reflect operating expenses of the class. Expenses before reductions do not reflect amounts reimbursed by the investment adviser or reductions from brokerage service arrangements or reductions from other expense offset arrangements and do not represent the amount paid by the class during periods when reimbursements or reductions occur. Expenses net of fee waivers reflect expenses after reimbursement by the investment adviser but prior to reductions from brokerage service arrangements or other expense offset arrangements. Expenses net of all reductions represent the net expenses paid by the class.
G Amount does not include the portfolio activity of any underlying Fidelity Central Funds.
See accompanying notes which are an integral part of the financial statements.
Fidelity International Small Cap Fund
| Years ended October 31, | 2018 | 2017 | 2016 | 2015 | 2014 |
| Selected Per–Share Data | | | | | |
| Net asset value, beginning of period | $29.77 | $24.23 | $23.06 | $25.34 | $26.67 |
| Income from Investment Operations | | | | | |
| Net investment income (loss)A | .48 | .37 | .40 | .34 | .25 |
| Net realized and unrealized gain (loss) | (2.93) | 5.79 | 1.67 | 1.07 | (.90) |
| Total from investment operations | (2.45) | 6.16 | 2.07 | 1.41 | (.65) |
| Distributions from net investment income | (.29) | (.34) | (.29) | (.24) | (.09) |
| Distributions from net realized gain | (.74) | (.29) | (.62) | (3.45) | (.60) |
| Total distributions | (1.03) | (.63) | (.91) | (3.69) | (.69) |
| Redemption fees added to paid in capitalA | –B | .01 | .01 | –B | .01 |
| Net asset value, end of period | $26.29 | $29.77 | $24.23 | $23.06 | $25.34 |
| Total ReturnC | (8.54)% | 26.18% | 9.39% | 6.53% | (2.48)% |
| Ratios to Average Net AssetsD,E | | | | | |
| Expenses before reductions | 1.20% | 1.25% | 1.34% | 1.31% | 1.21% |
| Expenses net of fee waivers, if any | 1.20% | 1.25% | 1.34% | 1.31% | 1.20% |
| Expenses net of all reductions | 1.19% | 1.24% | 1.33% | 1.31% | 1.20% |
| Net investment income (loss) | 1.62% | 1.41% | 1.77% | 1.45% | .95% |
| Supplemental Data | | | | | |
| Net assets, end of period (000 omitted) | $1,256,193 | $1,418,452 | $906,420 | $811,534 | $842,031 |
| Portfolio turnover rateF | 25% | 22% | 29% | 36% | 102% |
A Calculated based on average shares outstanding during the period.
B Amount represents less than $.005 per share.
C Total returns would have been lower if certain expenses had not been reduced during the applicable periods shown.
D Fees and expenses of any underlying Fidelity Central Funds are not included in the Fund's expense ratio. The Fund indirectly bears its proportionate share of the expenses of any underlying Fidelity Central Funds.
E Expense ratios reflect operating expenses of the class. Expenses before reductions do not reflect amounts reimbursed by the investment adviser or reductions from brokerage service arrangements or reductions from other expense offset arrangements and do not represent the amount paid by the class during periods when reimbursements or reductions occur. Expenses net of fee waivers reflect expenses after reimbursement by the investment adviser but prior to reductions from brokerage service arrangements or other expense offset arrangements. Expenses net of all reductions represent the net expenses paid by the class.
F Amount does not include the portfolio activity of any underlying Fidelity Central Funds.
See accompanying notes which are an integral part of the financial statements.
Fidelity International Small Cap Fund Class I
| Years ended October 31, | 2018 | 2017 | 2016 | 2015 | 2014 |
| Selected Per–Share Data | | | | | |
| Net asset value, beginning of period | $29.97 | $24.42 | $23.24 | $25.34 | $26.67 |
| Income from Investment Operations | | | | | |
| Net investment income (loss)A | .47 | .38 | .41 | .36 | .29 |
| Net realized and unrealized gain (loss) | (2.95) | 5.82 | 1.69 | 1.07 | (.90) |
| Total from investment operations | (2.48) | 6.20 | 2.10 | 1.43 | (.61) |
| Distributions from net investment income | (.30) | (.37) | (.31) | (.08) | (.13) |
| Distributions from net realized gain | (.74) | (.29) | (.62) | (3.45) | (.60) |
| Total distributions | (1.04) | (.66) | (.93) | (3.53) | (.73) |
| Redemption fees added to paid in capitalA | –B | .01 | .01 | –B | .01 |
| Net asset value, end of period | $26.45 | $29.97 | $24.42 | $23.24 | $25.34 |
| Total ReturnC | (8.58)% | 26.17% | 9.43% | 6.60% | (2.35)% |
| Ratios to Average Net AssetsD,E | | | | | |
| Expenses before reductions | 1.21% | 1.28% | 1.31% | 1.24% | 1.08% |
| Expenses net of fee waivers, if any | 1.21% | 1.28% | 1.31% | 1.23% | 1.08% |
| Expenses net of all reductions | 1.20% | 1.27% | 1.31% | 1.23% | 1.08% |
| Net investment income (loss) | 1.61% | 1.39% | 1.80% | 1.53% | 1.07% |
| Supplemental Data | | | | | |
| Net assets, end of period (000 omitted) | $564,988 | $237,469 | $22,727 | $10,070 | $8,092 |
| Portfolio turnover rateF | 25% | 22% | 29% | 36% | 102% |
A Calculated based on average shares outstanding during the period.
B Amount represents less than $.005 per share.
C Total returns would have been lower if certain expenses had not been reduced during the applicable periods shown.
D Fees and expenses of any underlying Fidelity Central Funds are not included in the Fund's expense ratio. The Fund indirectly bears its proportionate share of the expenses of any underlying Fidelity Central Funds.
E Expense ratios reflect operating expenses of the class. Expenses before reductions do not reflect amounts reimbursed by the investment adviser or reductions from brokerage service arrangements or reductions from other expense offset arrangements and do not represent the amount paid by the class during periods when reimbursements or reductions occur. Expenses net of fee waivers reflect expenses after reimbursement by the investment adviser but prior to reductions from brokerage service arrangements or other expense offset arrangements. Expenses net of all reductions represent the net expenses paid by the class.
F Amount does not include the portfolio activity of any underlying Fidelity Central Funds.
See accompanying notes which are an integral part of the financial statements.
Fidelity International Small Cap Fund Class Z
| Year ended October 31, | 2018 A |
| Selected Per–Share Data | |
| Net asset value, beginning of period | $28.78 |
| Income from Investment Operations | |
| Net investment income (loss)B | .03 |
| Net realized and unrealized gain (loss) | (2.35) |
| Total from investment operations | (2.32) |
| Distributions from net investment income | – |
| Distributions from net realized gain | – |
| Total distributions | – |
| Net asset value, end of period | $26.46 |
| Total ReturnC,D | (8.06)% |
| Ratios to Average Net AssetsE,F | |
| Expenses before reductions | 1.15%G |
| Expenses net of fee waivers, if any | 1.15%G |
| Expenses net of all reductions | 1.14%G |
| Net investment income (loss) | 2.01%G |
| Supplemental Data | |
| Net assets, end of period (000 omitted) | $7,421 |
| Portfolio turnover rateH | 25% |
A For the period October 2, 2018 (commencement of sale of shares) to October 31, 2018.
B Calculated based on average shares outstanding during the period.
C Total returns for periods of less than one year are not annualized.
D Total returns would have been lower if certain expenses had not been reduced during the applicable periods shown.
E Fees and expenses of any underlying Fidelity Central Funds are not included in the Fund's expense ratio. The Fund indirectly bears its proportionate share of the expenses of any underlying Fidelity Central Funds.
F Expense ratios reflect operating expenses of the class. Expenses before reductions do not reflect amounts reimbursed by the investment adviser or reductions from brokerage service arrangements or reductions from other expense offset arrangements and do not represent the amount paid by the class during periods when reimbursements or reductions occur. Expense ratios before reductions for start-up periods may not be representative of longer-term operating periods. Expenses net of fee waivers reflect expenses after reimbursement by the investment adviser but prior to reductions from brokerage service arrangements or other expense offset arrangements. Expenses net of all reductions represent the net expenses paid by the class.
G Annualized
H Amount does not include the portfolio activity of any underlying Fidelity Central Funds.
See accompanying notes which are an integral part of the financial statements.
Notes to Financial Statements
For the period ended October 31, 2018
1. Organization.
Fidelity International Small Cap Fund (the Fund) is a fund of Fidelity Investment Trust (the Trust) and is authorized to issue an unlimited number of shares. The Trust is registered under the Investment Company Act of 1940, as amended (the 1940 Act), as an open-end management investment company organized as a Massachusetts business trust. The Fund commenced sale of Class Z shares on October 2, 2018. The Fund offers Class A, Class M, Class C, International Small Cap, Class I and Class Z shares, each of which has equal rights as to assets and voting privileges. Each class has exclusive voting rights with respect to matters that affect that class. The Fund's investments in emerging markets can be subject to social, economic, regulatory, and political uncertainties and can be extremely volatile.
2. Investments in Fidelity Central Funds.
The Fund invests in Fidelity Central Funds, which are open-end investment companies generally available only to other investment companies and accounts managed by the investment adviser and its affiliates. The Fund's Schedule of Investments lists each of the Fidelity Central Funds held as of period end, if any, as an investment of the Fund, but does not include the underlying holdings of each Fidelity Central Fund. As an Investing Fund, the Fund indirectly bears its proportionate share of the expenses of the underlying Fidelity Central Funds.
The Money Market Central Funds seek preservation of capital and current income and are managed by Fidelity Investments Money Management, Inc. (FIMM), an affiliate of the investment adviser. Annualized expenses of the Money Market Central Funds as of their most recent shareholder report date are less than .005%.
A complete unaudited list of holdings for each Fidelity Central Fund is available upon request or at the Securities and Exchange Commission (the SEC) website at www.sec.gov. In addition, the financial statements of the Fidelity Central Funds, which are not covered by the Fund's Report of Independent Registered Public Accounting Firm, are available on the SEC website or upon request.
3. Significant Accounting Policies.
The Fund is an investment company and applies the accounting and reporting guidance of the Financial Accounting Standards Board (FASB) Accounting Standards Codification Topic 946 Financial Services – Investments Companies. The financial statements have been prepared in conformity with accounting principles generally accepted in the United States of America (GAAP), which require management to make certain estimates and assumptions at the date of the financial statements. Actual results could differ from those estimates. Subsequent events, if any, through the date that the financial statements were issued have been evaluated in the preparation of the financial statements. The following summarizes the significant accounting policies of the Fund:
Investment Valuation. Investments are valued as of 4:00 p.m. Eastern time on the last calendar day of the period. The Board of Trustees (the Board) has delegated the day to day responsibility for the valuation of the Fund's investments to the Fair Value Committee (the Committee) established by the Fund's investment adviser. In accordance with valuation policies and procedures approved by the Board, the Fund attempts to obtain prices from one or more third party pricing vendors or brokers to value its investments. When current market prices, quotations or currency exchange rates are not readily available or reliable, investments will be fair valued in good faith by the Committee, in accordance with procedures adopted by the Board. Factors used in determining fair value vary by investment type and may include market or investment specific events. The frequency with which these procedures are used cannot be predicted and they may be utilized to a significant extent. The Committee oversees the Fund's valuation policies and procedures and reports to the Board on the Committee's activities and fair value determinations. The Board monitors the appropriateness of the procedures used in valuing the Fund's investments and ratifies the fair value determinations of the Committee.
The Fund categorizes the inputs to valuation techniques used to value its investments into a disclosure hierarchy consisting of three levels as shown below:
- Level 1 – quoted prices in active markets for identical investments
- Level 2 – other significant observable inputs (including quoted prices for similar investments, interest rates, prepayment speeds, etc.)
- Level 3 – unobservable inputs (including the Fund's own assumptions based on the best information available)
Valuation techniques used to value the Fund's investments by major category are as follows:
Equity securities, including restricted securities, for which market quotations are readily available, are valued at the last reported sale price or official closing price as reported by a third party pricing vendor on the primary market or exchange on which they are traded and are categorized as Level 1 in the hierarchy. In the event there were no sales during the day or closing prices are not available, securities are valued at the last quoted bid price or may be valued using the last available price and are generally categorized as Level 2 in the hierarchy. For foreign equity securities, when market or security specific events arise, comparisons to the valuation of American Depositary Receipts (ADRs), futures contracts, Exchange-Traded Funds (ETFs) and certain indexes as well as quoted prices for similar securities may be used and would be categorized as Level 2 in the hierarchy. Utilizing these techniques may result in transfers between Level 1 and Level 2. For equity securities, including restricted securities, where observable inputs are limited, assumptions about market activity and risk are used and these securities may be categorized as Level 3 in the hierarchy.
Investments in open-end mutual funds, including the Fidelity Central Funds, are valued at their closing net asset value (NAV) each business day and are categorized as Level 1 in the hierarchy.
Changes in valuation techniques may result in transfers in or out of an assigned level within the disclosure hierarchy. The aggregate value of investments by input level as of October 31, 2018, including information on transfers between Levels 1 and 2, is included at the end of the Fund's Schedule of Investments.
Foreign Currency. The Fund may use foreign currency contracts to facilitate transactions in foreign-denominated securities. Gains and losses from these transactions may arise from changes in the value of the foreign currency or if the counterparties do not perform under the contracts' terms.
Foreign-denominated assets, including investment securities, and liabilities are translated into U.S. dollars at the exchange rates at period end. Purchases and sales of investment securities, income and dividends received and expenses denominated in foreign currencies are translated into U.S. dollars at the exchange rate in effect on the transaction date.
The effects of exchange rate fluctuations on investments are included with the net realized and unrealized gain (loss) on investment securities. Other foreign currency transactions resulting in realized and unrealized gain (loss) are disclosed separately.
Investment Transactions and Income. For financial reporting purposes, the Fund's investment holdings and NAV include trades executed through the end of the last business day of the period. The NAV per share for processing shareholder transactions is calculated as of the close of business of the New York Stock Exchange (NYSE), normally 4:00 p.m. Eastern time and includes trades executed through the end of the prior business day. Gains and losses on securities sold are determined on the basis of identified cost and include proceeds received from litigation. Dividend income is recorded on the ex-dividend date, except for certain dividends from foreign securities where the ex-dividend date may have passed, which are recorded as soon as the Fund is informed of the ex-dividend date. Non-cash dividends included in dividend income, if any, are recorded at the fair market value of the securities received. Income and capital gain distributions from Fidelity Central Funds, if any, are recorded on the ex-dividend date. Certain distributions received by the Fund represent a return of capital or capital gain. The Fund determines the components of these distributions subsequent to the ex-dividend date, based upon receipt of tax filings or other correspondence relating to the underlying investment. These distributions are recorded as a reduction of cost of investments and/or as a realized gain. Investment income is recorded net of foreign taxes withheld where recovery of such taxes is uncertain.
Class Allocations and Expenses. Investment income, realized and unrealized capital gains and losses, common expenses of the Fund, and certain fund-level expense reductions, if any, are allocated daily on a pro-rata basis to each class based on the relative net assets of each class to the total net assets of the Fund. Each class differs with respect to transfer agent and distribution and service plan fees incurred. Certain expense reductions may also differ by class. For the reporting period, the allocated portion of income and expenses to each class as a percent of its average net assets may vary due to the timing of recording these transactions in relation to fluctuating net assets of the classes. Expenses directly attributable to a fund are charged to that fund. Expenses attributable to more than one fund are allocated among the respective funds on the basis of relative net assets or other appropriate methods. Expense estimates are accrued in the period to which they relate and adjustments are made when actual amounts are known.
Income Tax Information and Distributions to Shareholders. Each year, the Fund intends to qualify as a regulated investment company under Subchapter M of the Internal Revenue Code, including distributing substantially all of its taxable income and realized gains. As a result, no provision for U.S. Federal income taxes is required. As of October 31, 2018, the Fund did not have any unrecognized tax benefits in the financial statements; nor is the Fund aware of any tax positions for which it is reasonably possible that the total amounts of unrecognized tax benefits will significantly change in the next twelve months. The Fund files a U.S. federal tax return, in addition to state and local tax returns as required. The Fund's federal income tax returns are subject to examination by the Internal Revenue Service (IRS) for a period of three fiscal years after they are filed. State and local tax returns may be subject to examination for an additional fiscal year depending on the jurisdiction. Foreign taxes are provided for based on the Fund's understanding of the tax rules and rates that exist in the foreign markets in which it invests. The Fund is subject to a tax imposed on capital gains by certain countries in which it invests. An estimated deferred tax liability for net unrealized appreciation on the applicable securities is included in Other payables and accrued expenses on the Statement of Assets & Liabilities.
Distributions are declared and recorded on the ex-dividend date. Income and capital gain distributions are declared separately for each class. Income and capital gain distributions are determined in accordance with income tax regulations, which may differ from GAAP. In addition, the Fund claimed a portion of the payment made to redeeming shareholders as a distribution for income tax purposes.
Capital accounts within the financial statements are adjusted for permanent book-tax differences. These adjustments have no impact on net assets or the results of operations. Capital accounts are not adjusted for temporary book-tax differences which will reverse in a subsequent period.
Book-tax differences are primarily due to foreign currency transactions, certain foreign taxes, passive foreign investment companies (PFIC) and losses deferred due to wash sales.
As of period end, the cost and unrealized appreciation (depreciation) in securities, and derivatives if applicable, for federal income tax purposes were as follows:
| Gross unrealized appreciation | $257,072,862 |
| Gross unrealized depreciation | (296,626,117) |
| Net unrealized appreciation (depreciation) | $(39,553,255) |
| Tax Cost | $2,010,758,017 |
The tax-based components of distributable earnings as of period end were as follows:
| Undistributed ordinary income | $28,180,749 |
| Undistributed long-term capital gain | $73,826,639 |
| Net unrealized appreciation (depreciation) on securities and other investments | $(39,675,343) |
The tax character of distributions paid was as follows:
| | October 31, 2018 | October 31, 2017 |
| Ordinary Income | $36,178,814 | $ 16,336,287 |
| Long-term Capital Gains | 25,374,442 | 10,535,784 |
| Total | $61,553,256 | $ 26,872,071 |
Short-Term Trading (Redemption) Fees. During the period, shares held by investors in the Fund less than 90 days may have been subject to a redemption fee equal to 2.00% of the NAV of shares redeemed. All redemption fees, which reduce the proceeds of the shareholder redemption, are retained by the Fund and accounted for as an addition to paid in capital. In November 2017, the Board of Trustees approved the elimination of these redemption fees effective December 18, 2017.
Restricted Securities. The Fund may invest in securities that are subject to legal or contractual restrictions on resale. These securities generally may be resold in transactions exempt from registration or to the public if the securities are registered. Disposal of these securities may involve time-consuming negotiations and expense, and prompt sale at an acceptable price may be difficult. Information regarding restricted securities is included at the end of the Fund's Schedule of Investments.
New Rule Issuance. During August 2018, the U.S. Securities and Exchange Commission issued Final Rule Release No. 33-10532, Disclosure Update and Simplification. This Final Rule includes amendments specific to registered investment companies that are intended to eliminate overlap in disclosure requirements between Regulation S-X and GAAP. In accordance with these amendments, certain line-items in the Fund's financial statements have been combined or removed for the current period as outlined in the table below.
| Financial Statement | Current Line-Item Presentation | Prior Line-Item Presentation |
| Statement of Assets and Liabilities | Total distributable earnings (loss) | Undistributed/Distributions in excess of/Accumulated net investment income (loss)
Accumulated/Undistributed net realized gain (loss)
Net unrealized appreciation (depreciation) |
| Statement of Changes in Net Assets | N/A - removed | Undistributed/Distributions in excess of/Accumulated net investment income (loss) end of period |
| Statement of Changes in Net Assets | Distributions to shareholders | Distributions to shareholders from net investment income
Distributions to shareholders from net realized gain |
| Distributions to Shareholders Note to Financial Statements | Distributions to shareholders | Distributions to shareholders from net investment income
Distributions to shareholders from net realized gain |
4. Purchases and Sales of Investments.
Purchases and sales of securities, other than short-term securities, aggregated $956,567,607 and $490,410,440, respectively.
5. Fees and Other Transactions with Affiliates.
Management Fee. Fidelity Management & Research Company (the investment adviser) and its affiliates provide the Fund with investment management related services for which the Fund pays a monthly management fee. The management fee is the sum of an individual fund fee rate that is based on an annual rate of .60% of the Fund's average net assets and an annualized group fee rate that averaged .24% during the period. The group fee rate is based upon the average net assets of all the mutual funds advised by the investment adviser, including any mutual funds previously advised by the investment adviser that are currently advised by Fidelity SelectCo, LLC, an affiliate of the investment adviser. The group fee rate decreases as assets under management increase and increases as assets under management decrease. In addition, the management fee is subject to a performance adjustment (up to a maximum of +/- .20% of the Fund's average net assets over a 36 month performance period). The upward or downward adjustment to the management fee is based on the relative investment performance of International Small Cap as compared to its benchmark index, the MSCI ACWI (All Country World Index) ex USA Small Cap Index, over the same 36 month performance period. For the reporting period, the total annual management fee rate, including the performance adjustment, was .93% of the Fund's average net assets. The performance adjustment included in the management fee rate may be higher or lower than the maximum performance adjustment rate due to the difference between the average net assets for the reporting and performance periods.
Distribution and Service Plan Fees. In accordance with Rule 12b-1 of the 1940 Act, the Fund has adopted separate Distribution and Service Plans for each class of shares. Certain classes pay Fidelity Distributors Corporation (FDC), an affiliate of the investment adviser, separate Distribution and Service Fees, each of which is based on an annual percentage of each class' average net assets. In addition, FDC may pay financial intermediaries for selling shares of the Fund and providing shareholder support services. For the period, the Distribution and Service Fee rates, total fees and amounts retained by FDC were as follows:
| | Distribution Fee | Service Fee | Total Fees | Retained by FDC |
| Class A | -% | .25% | $200,038 | $18,213 |
| Class M | .25% | .25% | 99,816 | 1,749 |
| Class C | .75% | .25% | 429,581 | 185,656 |
| | | | $729,435 | $205,618 |
Sales Load. FDC may receive a front-end sales charge of up to 5.75% for selling Class A shares and 3.50% for selling Class M shares, some of which is paid to financial intermediaries for selling shares of the Fund. Depending on the holding period, FDC may receive contingent deferred sales charges levied on Class A, Class M and Class C redemptions. The deferred sales charges are 1.00% for Class C shares, 1.00% for certain purchases of Class A shares and .25% for certain purchases of Class M shares.
For the period, sales charge amounts retained by FDC were as follows:
| | Retained by FDC |
| Class A | $71,485 |
| Class M | 7,085 |
| Class C(a) | 15,967 |
| | $94,537 |
(a) When Class C shares are initially sold, FDC pays commissions from its own resources to financial intermediaries through which the sales are made.
Transfer Agent Fees. Fidelity Investments Institutional Operations Company, Inc., (FIIOC), an affiliate of the investment adviser, is the transfer, dividend disbursing and shareholder servicing agent for each class of the Fund. FIIOC receives account fees and asset-based fees that vary according to the account size and type of account of the shareholders of the respective classes of the Fund, except for Class Z. FIIOC receives an asset-based fee of Class Z's average net assets. FIIOC pays for typesetting, printing and mailing of shareholder reports, except proxy statements.
For the period, transfer agent fees for each class were as follows:
| | Amount | % of Class-Level Average Net Assets |
| Class A | $174,321 | .22 |
| Class M | 49,489 | .25 |
| Class C | 96,452 | .22 |
| International Small Cap | 2,616,004 | .18 |
| Class I | 897,331 | .19 |
| Class Z | 29 | .03(a) |
| | $3,833,626 | |
(a) Annualized
Accounting and Security Lending Fees. Fidelity Service Company, Inc. (FSC), an affiliate of the investment adviser, maintains the Fund's accounting records. The accounting fee is based on the level of average net assets for each month. Under a separate contract, FSC administers the security lending program. The security lending fee is based on the number and duration of lending transactions. For the period, the fees were equivalent to an annual rate of .04%.
Brokerage Commissions. The Fund placed a portion of its portfolio transactions with brokerage firms which are affiliates of the investment adviser. Brokerage commissions are included in net realized gain (loss) and change in net unrealized appreciation (depreciation) in the Statement of Operations. The commissions paid to these affiliated firms were $1,325 for the period.
Interfund Trades. The Fund may purchase from or sell securities to other Fidelity Funds under procedures adopted by the Board. The procedures have been designed to ensure these interfund trades are executed in accordance with Rule 17a-7 of the 1940 Act. Interfund trades are included within the respective purchases and sales amounts shown in the Purchases and Sales of Investments note.
6. Committed Line of Credit.
The Fund participates with other funds managed by the investment adviser or an affiliate in a $4.25 billion credit facility (the "line of credit") to be utilized for temporary or emergency purposes to fund shareholder redemptions or for other short-term liquidity purposes. The Fund has agreed to pay commitment fees on its pro-rata portion of the line of credit, which amounted to $5,622 and is reflected in Miscellaneous expenses on the Statement of Operations. During the period, the Fund did not borrow on this line of credit.
7. Security Lending.
The Fund lends portfolio securities through a lending agent from time to time in order to earn additional income. For equity securities, a lending agent is used and may loan securities to certain qualified borrowers, including Fidelity Capital Markets (FCM), a broker-dealer affiliated with the Fund. On the settlement date of the loan, the Fund receives collateral (in the form of U.S. Treasury obligations, letters of credit and/or cash) against the loaned securities and maintains collateral in an amount not less than 100% of the market value of the loaned securities during the period of the loan. The market value of the loaned securities is determined at the close of business of the Fund and any additional required collateral is delivered to the Fund on the next business day. The Fund or borrower may terminate the loan at any time, and if the borrower defaults on its obligation to return the securities loaned because of insolvency or other reasons, the Fund may apply collateral received from the borrower against the obligation. The Fund may experience delays and costs in recovering the securities loaned. Any cash collateral received is invested in the Fidelity Securities Lending Cash Central Fund. The value of loaned securities and cash collateral at period end are disclosed on the Fund's Statement of Assets and Liabilities. At period end, there were no security loans outstanding with FCM. Security lending income represents the income earned on investing cash collateral, less rebates paid to borrowers and any lending agent fees associated with the loan, plus any premium payments received for lending certain types of securities. Security lending income is presented in the Statement of Operations as a component of income from Fidelity Central Funds Total security lending income during the period amounted to $387,206, including $65 from securities loaned to FCM.
8. Expense Reductions.
Commissions paid to certain brokers with whom the investment adviser, or its affiliates, places trades on behalf of the Fund include an amount in addition to trade execution, which may be rebated back to the Fund to offset certain expenses. This amount totaled $226,649 for the period. In addition, through arrangements with the Fund's custodian, credits realized as a result of certain uninvested cash balances were used to reduce the Fund's expenses. During the period, these credits reduced the Fund's custody expenses by $488.
In addition, during the period the investment adviser reimbursed and/or waived a portion of fund-level operating expenses in the amount of $18,233.
9. Distributions to Shareholders.
Distributions to shareholders of each class were as follows:
| | Year ended
October 31, 2018 | Year ended
October 31, 2017 |
| Distributions to shareholders | | |
| Class A | $2,150,704 | $– |
| Class M | 588,707 | – |
| Class C | 853,838 | – |
| International Small Cap | 49,080,231 | – |
| Class I | 8,879,774 | – |
| Total | $61,553,254 | $– |
| From net investment income | | |
| Class A | $– | $440,395 |
| Class M | – | 105,144 |
| Class C | – | 42,573 |
| International Small Cap | – | 13,342,577 |
| Class I | – | 462,523 |
| Total | $– | $14,393,212 |
| From net realized gain | | |
| Class A | $– | $461,138 |
| Class M | – | 163,369 |
| Class C | – | 151,895 |
| International Small Cap | – | 11,341,189 |
| Class I | – | 361,268 |
| Total | $– | $12,478,859 |
10. Share Transactions.
Share transactions for each class were as follows and may contain automatic conversions between classes or exchanges between affiliated funds:
| | Shares | Shares | Dollars | Dollars |
| | Year ended October 31, 2018(a) | Year ended October 31, 2017 | Year ended October 31, 2018(a) | Year ended October 31, 2017 |
| Class A | | | | |
| Shares sold | 1,993,812 | 1,346,483 | $57,935,672 | $35,353,222 |
| Reinvestment of distributions | 72,621 | 38,390 | 2,060,979 | 881,445 |
| Shares redeemed | (1,118,217) | (746,471) | (32,145,224) | (18,879,894) |
| Net increase (decrease) | 948,216 | 638,402 | $27,851,427 | $17,354,773 |
| Class M | | | | |
| Shares sold | 265,293 | 165,476 | $7,711,211 | $4,273,457 |
| Reinvestment of distributions | 20,707 | 11,602 | 585,586 | 265,460 |
| Shares redeemed | (271,709) | (116,364) | (7,811,190) | (2,968,272) |
| Net increase (decrease) | 14,291 | 60,714 | $485,607 | $1,570,645 |
| Class C | | | | |
| Shares sold | 1,115,556 | 554,853 | $31,833,791 | $14,330,189 |
| Reinvestment of distributions | 30,679 | 8,175 | 842,145 | 182,379 |
| Shares redeemed | (375,660) | (171,623) | (10,374,137) | (4,225,035) |
| Net increase (decrease) | 770,575 | 391,405 | $22,301,799 | $10,287,533 |
| International Small Cap | | | | |
| Shares sold | 16,219,665 | 20,105,455 | $484,453,648 | $528,374,537 |
| Reinvestment of distributions | 1,616,727 | 1,029,746 | 46,674,910 | 24,013,687 |
| Shares redeemed | (17,690,156) | (10,901,622) | (519,774,089) | (292,534,899) |
| Net increase (decrease) | 146,236 | 10,233,579 | $11,354,469 | $259,853,325 |
| Class I | | | | |
| Shares sold | 19,548,705 | 7,788,345 | $583,254,206 | $213,872,926 |
| Reinvestment of distributions | 286,614 | 29,052 | 8,326,151 | 682,131 |
| Shares redeemed | (6,400,003) | (824,089) | (183,131,200) | (22,829,284) |
| Net increase (decrease) | 13,435,316 | 6,993,308 | $408,449,157 | $191,725,773 |
| Class Z | | | | |
| Shares sold | 280,979 | – | $7,304,519 | $– |
| Shares redeemed | (476) | – | (12,407) | – |
| Net increase (decrease) | 280,503 | – | $7,292,112 | $– |
(a) Share transactions for Class Z are for the period October 2, 2018 (commencement of sale of shares) to October 31, 2018
11. Other.
The Fund's organizational documents provide former and current trustees and officers with a limited indemnification against liabilities arising in connection with the performance of their duties to the Fund. In the normal course of business, the Fund may also enter into contracts that provide general indemnifications. The Fund's maximum exposure under these arrangements is unknown as this would be dependent on future claims that may be made against the Fund. The risk of material loss from such claims is considered remote.
Report of Independent Registered Public Accounting Firm
To the Trustees of Fidelity Investment Trust and Shareholders of Fidelity International Small Cap Fund:
Opinion on the Financial Statements and Financial Highlights
We have audited the accompanying statement of assets and liabilities of Fidelity International Small Cap Fund (the "Fund"), a fund of Fidelity Investment Trust, including the schedule of investments, as of October 31, 2018, and the related statement of operations for the year then ended, the statement of changes in net assets for each of the two years in the period then ended, the financial highlights for each of the five years in the period then ended, and the related notes. In our opinion, the financial statements and financial highlights present fairly, in all material respects, the financial position of the Fund as of October 31, 2018, and the results of its operations for the year then ended, the changes in its net assets for each of the two years in the period then ended, and the financial highlights for each of the five years in the period then ended, in conformity with accounting principles generally accepted in the United States of America.
Basis for Opinion
These financial statements and financial highlights are the responsibility of the Fund's management. Our responsibility is to express an opinion on the financial statements and financial highlights based on our audits. We are a public accounting firm registered with the Public Company Accounting Oversight Board (United States) (PCAOB) and are required to be independent with respect to the Fund in accordance with the U.S. federal securities laws and the applicable rules and regulations of the Securities and Exchange Commission and the PCAOB.
We conducted our audits in accordance with the standards of the PCAOB. Those standards require that we plan and perform the audit to obtain reasonable assurance about whether the financial statements and financial highlights are free of material misstatement, whether due to error or fraud. The Fund is not required to have, nor were we engaged to perform, an audit of its internal control over financial reporting. As part of our audits we are required to obtain an understanding of internal control over financial reporting but not for the purpose of expressing an opinion on the effectiveness of the Fund’s internal control over financial reporting. Accordingly, we express no such opinion.
Our audits included performing procedures to assess the risks of material misstatement of the financial statements and financial highlights, whether due to error or fraud, and performing procedures that respond to those risks. Such procedures included examining, on a test basis, evidence regarding the amounts and disclosures in the financial statements and financial highlights. Our audits also included evaluating the accounting principles used and significant estimates made by management, as well as evaluating the overall presentation of the financial statements and financial highlights. Our procedures included confirmation of securities owned as of October 31, 2018, by correspondence with the custodians and brokers; when replies were not received from brokers, we performed other auditing procedures. We believe that our audits provide a reasonable basis for our opinion.
/s/ Deloitte & Touche LLP
Boston, Massachusetts
December 14, 2018
We have served as the auditor of one or more of the Fidelity investment companies since 1999.
Trustees and Officers
The Trustees, Members of the Advisory Board (if any), and officers of the trust and fund, as applicable, are listed below. The Board of Trustees governs the fund and is responsible for protecting the interests of shareholders. The Trustees are experienced executives who meet periodically throughout the year to oversee the fund's activities, review contractual arrangements with companies that provide services to the fund, oversee management of the risks associated with such activities and contractual arrangements, and review the fund's performance. Except for Jonathan Chiel, each of the Trustees oversees 283 funds. Mr. Chiel oversees 154 funds.
The Trustees hold office without limit in time except that (a) any Trustee may resign; (b) any Trustee may be removed by written instrument, signed by at least two-thirds of the number of Trustees prior to such removal; (c) any Trustee who requests to be retired or who has become incapacitated by illness or injury may be retired by written instrument signed by a majority of the other Trustees; and (d) any Trustee may be removed at any special meeting of shareholders by a two-thirds vote of the outstanding voting securities of the trust. Each Trustee who is not an interested person (as defined in the 1940 Act) of the trust and the fund is referred to herein as an Independent Trustee. Each Independent Trustee shall retire not later than the last day of the calendar year in which his or her 75th birthday occurs. The Independent Trustees may waive this mandatory retirement age policy with respect to individual Trustees. Officers and Advisory Board Members hold office without limit in time, except that any officer or Advisory Board Member may resign or may be removed by a vote of a majority of the Trustees at any regular meeting or any special meeting of the Trustees. Except as indicated, each individual has held the office shown or other offices in the same company for the past five years.
The fund’s Statement of Additional Information (SAI) includes more information about the Trustees. To request a free copy, call Fidelity at 1-800-544-8544.
Experience, Skills, Attributes, and Qualifications of the Trustees. The Governance and Nominating Committee has adopted a statement of policy that describes the experience, qualifications, attributes, and skills that are necessary and desirable for potential Independent Trustee candidates (Statement of Policy). The Board believes that each Trustee satisfied at the time he or she was initially elected or appointed a Trustee, and continues to satisfy, the standards contemplated by the Statement of Policy. The Governance and Nominating Committee also engages professional search firms to help identify potential Independent Trustee candidates who have the experience, qualifications, attributes, and skills consistent with the Statement of Policy. From time to time, additional criteria based on the composition and skills of the current Independent Trustees, as well as experience or skills that may be appropriate in light of future changes to board composition, business conditions, and regulatory or other developments, have also been considered by the professional search firms and the Governance and Nominating Committee. In addition, the Board takes into account the Trustees' commitment and participation in Board and committee meetings, as well as their leadership of standing and ad hoc committees throughout their tenure.
In determining that a particular Trustee was and continues to be qualified to serve as a Trustee, the Board has considered a variety of criteria, none of which, in isolation, was controlling. The Board believes that, collectively, the Trustees have balanced and diverse experience, qualifications, attributes, and skills, which allow the Board to operate effectively in governing the fund and protecting the interests of shareholders. Information about the specific experience, skills, attributes, and qualifications of each Trustee, which in each case led to the Board's conclusion that the Trustee should serve (or continue to serve) as a trustee of the fund, is provided below.
Board Structure and Oversight Function. James C. Curvey is an interested person and currently serves as Chairman. The Trustees have determined that an interested Chairman is appropriate and benefits shareholders because an interested Chairman has a personal and professional stake in the quality and continuity of services provided to the fund. Independent Trustees exercise their informed business judgment to appoint an individual of their choosing to serve as Chairman, regardless of whether the Trustee happens to be independent or a member of management. The Independent Trustees have determined that they can act independently and effectively without having an Independent Trustee serve as Chairman and that a key structural component for assuring that they are in a position to do so is for the Independent Trustees to constitute a substantial majority for the Board. The Independent Trustees also regularly meet in executive session. Ned C. Lautenbach serves as Chairman of the Independent Trustees and as such (i) acts as a liaison between the Independent Trustees and management with respect to matters important to the Independent Trustees and (ii) with management prepares agendas for Board meetings.
Fidelity® funds are overseen by different Boards of Trustees. The fund's Board oversees Fidelity's high income and certain equity funds, and other Boards oversee Fidelity's investment-grade bond, money market, asset allocation, and other equity funds. The asset allocation funds may invest in Fidelity® funds overseen by the fund's Board. The use of separate Boards, each with its own committee structure, allows the Trustees of each group of Fidelity® funds to focus on the unique issues of the funds they oversee, including common research, investment, and operational issues. On occasion, the separate Boards establish joint committees to address issues of overlapping consequences for the Fidelity® funds overseen by each Board.
The Trustees operate using a system of committees to facilitate the timely and efficient consideration of all matters of importance to the Trustees, the fund, and fund shareholders and to facilitate compliance with legal and regulatory requirements and oversight of the fund's activities and associated risks. The Board, acting through its committees, has charged FMR and its affiliates with (i) identifying events or circumstances the occurrence of which could have demonstrably adverse effects on the fund's business and/or reputation; (ii) implementing processes and controls to lessen the possibility that such events or circumstances occur or to mitigate the effects of such events or circumstances if they do occur; and (iii) creating and maintaining a system designed to evaluate continuously business and market conditions in order to facilitate the identification and implementation processes described in (i) and (ii) above. Because the day-to-day operations and activities of the fund are carried out by or through FMR, its affiliates, and other service providers, the fund's exposure to risks is mitigated but not eliminated by the processes overseen by the Trustees. While each of the Board's committees has responsibility for overseeing different aspects of the fund's activities, oversight is exercised primarily through the Operations, Audit, and Compliance Committees. In addition, the Independent Trustees have worked with Fidelity to enhance the Board's oversight of investment and financial risks, legal and regulatory risks, technology risks, and operational risks, including the development of additional risk reporting to the Board. Appropriate personnel, including but not limited to the fund's Chief Compliance Officer (CCO), FMR's internal auditor, the independent accountants, the fund's Treasurer and portfolio management personnel, make periodic reports to the Board's committees, as appropriate, including an annual review of Fidelity's risk management program for the Fidelity® funds. The responsibilities of each standing committee, including their oversight responsibilities, are described further under "Standing Committees of the Trustees."
Interested Trustees*:
Correspondence intended for a Trustee who is an interested person may be sent to Fidelity Investments, 245 Summer Street, Boston, Massachusetts 02210.
Name, Year of Birth; Principal Occupations and Other Relevant Experience+
Jonathan Chiel (1957)
Year of Election or Appointment: 2016
Trustee
Mr. Chiel also serves as Trustee of other Fidelity® funds. Mr. Chiel is Executive Vice President and General Counsel for FMR LLC (diversified financial services company, 2012-present). Previously, Mr. Chiel served as general counsel (2004-2012) and senior vice president and deputy general counsel (2000-2004) for John Hancock Financial Services; a partner with Choate, Hall & Stewart (1996-2000) (law firm); and an Assistant United States Attorney for the United States Attorney’s Office of the District of Massachusetts (1986-95), including Chief of the Criminal Division (1993-1995). Mr. Chiel is a director on the boards of the Boston Bar Foundation and the Maimonides School.
James C. Curvey (1935)
Year of Election or Appointment: 2007
Trustee
Chairman of the Board of Trustees
Mr. Curvey also serves as Trustee of other Fidelity® funds. Mr. Curvey is Vice Chairman (2007-present) and Director of FMR LLC (diversified financial services company). In addition, Mr. Curvey is an Overseer Emeritus for the Boston Symphony Orchestra, a Director of Artis-Naples, and a Trustee of Brewster Academy in Wolfeboro, New Hampshire. Previously, Mr. Curvey served as a Director of Fidelity Research & Analysis Co. (investment adviser firm, 2009-2018), Director of Fidelity Investments Money Management, Inc. (investment adviser firm, 2009-2014) and a Director of FMR and FMR Co., Inc. (investment adviser firms, 2007-2014).
Charles S. Morrison (1960)
Year of Election or Appointment: 2014
Trustee
Mr. Morrison also serves as Trustee of other funds. He serves as President of Fidelity SelectCo, LLC (investment adviser firm, 2017-present) and Fidelity Management & Research Company (FMR) (investment adviser firm, 2016-present), a Director of Fidelity Investments Money Management, Inc. (FIMM) (investment adviser firm, 2014-present), Director of Fidelity SelectCo, LLC (investment adviser firm, 2014-present), President, Asset Management (2014-present), and is an employee of Fidelity Investments. Previously, Mr. Morrison served as Vice President of Fidelity's Fixed Income and Asset Allocation Funds (2012-2014), President, Fixed Income (2011-2014), Vice President of Fidelity's Money Market Funds (2005-2009), President, Money Market Group Leader of FMR (investment adviser firm, 2009), and Senior Vice President, Money Market Group of FMR (2004-2009). Mr. Morrison also served as Vice President of Fidelity's Bond Funds (2002-2005), certain Balanced Funds (2002-2005), and certain Asset Allocation Funds (2002-2007), and as Senior Vice President (2002-2005) of Fidelity's Bond Division.
* Determined to be an “Interested Trustee” by virtue of, among other things, his or her affiliation with the trust or various entities under common control with FMR.
+ The information includes the Trustee's principal occupation during the last five years and other information relating to the experience, attributes, and skills relevant to the Trustee's qualifications to serve as a Trustee, which led to the conclusion that the Trustee should serve as a Trustee for the fund.
Independent Trustees:
Correspondence intended for an Independent Trustee may be sent to Fidelity Investments, P.O. Box 55235, Boston, Massachusetts 02205-5235.
Name, Year of Birth; Principal Occupations and Other Relevant Experience+
Dennis J. Dirks (1948)
Year of Election or Appointment: 2005
Trustee
Mr. Dirks also serves as Trustee of other Fidelity® funds. Prior to his retirement in May 2003, Mr. Dirks was Chief Operating Officer and a member of the Board of The Depository Trust & Clearing Corporation (DTCC). He also served as President, Chief Operating Officer, and Board member of The Depository Trust Company (DTC) and President and Board member of the National Securities Clearing Corporation (NSCC). In addition, Mr. Dirks served as Chief Executive Officer and Board member of the Government Securities Clearing Corporation, Chief Executive Officer and Board member of the Mortgage-Backed Securities Clearing Corporation, as a Trustee and a member of the Finance Committee of Manhattan College (2005-2008), as a Trustee and a member of the Finance Committee of AHRC of Nassau County (2006-2008), as a member of the Independent Directors Council (IDC) Governing Council (2010-2015), and as a member of the Board of Directors for The Brookville Center for Children’s Services, Inc. (2009-2017). Mr. Dirks is a member of the Finance Committee (2016-present), Board of Directors (2017-present) and Board of Trustees (2018-present) and is Treasurer (2018-present) of the Asolo Repertory Theatre.
Donald F. Donahue (1950)
Year of Election or Appointment: 2018
Trustee
Mr. Donahue also serves as a Trustee of other Fidelity® funds. Mr. Donahue is President and Chief Executive Officer of Miranda Partners, LLC (risk consulting for the financial services industry, 2012-present). Previously, Mr. Donahue served as a Member of the Advisory Board of certain Fidelity® funds (2015-2018) and Chief Executive Officer (2006-2012), Chief Operating Officer (2003-2006), and Managing Director, Customer Marketing and Development (1999-2003) of The Depository Trust & Clearing Corporation (financial markets infrastructure). Mr. Donahue serves as a Member (2007-present) and Co-Chairman (2016-present) of the Board of Directors of United Way of New York, Member of the Board of Directors of NYC Leadership Academy (2012-present) and Member of the Board of Advisors of Ripple Labs, Inc. (financial services, 2015-present). He also served as Chairman (2010-2012) and Member of the Board of Directors (2012-2013) of Omgeo, LLC (financial services), Treasurer of United Way of New York (2012-2016), and Member of the Board of Directors of XBRL US (financial services non-profit, 2009-2012) and the International Securities Services Association (2009-2012).
Alan J. Lacy (1953)
Year of Election or Appointment: 2008
Trustee
Mr. Lacy also serves as Trustee of other Fidelity® funds. Mr. Lacy serves as a Director of Bristol-Myers Squibb Company (global pharmaceuticals, 2008-present). He is a Trustee of the California Chapter of The Nature Conservancy (2015-present) and a Director of the Center for Advanced Study in the Behavioral Sciences at Stanford University (2015-present). In addition, Mr. Lacy served as Senior Adviser (2007-2014) of Oak Hill Capital Partners, L.P. (private equity) and also served as Chief Executive Officer (2005) and Vice Chairman (2005-2006) of Sears Holdings Corporation (retail) and Chief Executive Officer and Chairman of the Board of Sears, Roebuck and Co. (retail, 2000-2005). Previously, Mr. Lacy served as Chairman (2014-2017) and a member (2010-2017) of the Board of Directors of Dave & Buster’s Entertainment, Inc. (restaurant and entertainment complexes), as Chairman (2008-2011) and a member (2006-2015) of the Board of Trustees of the National Parks Conservation Association, and as a member of the Board of Directors for The Hillman Companies, Inc. (hardware wholesalers, 2010-2014), Earth Fare, Inc. (retail grocery, 2010-2014), and The Western Union Company (global money transfer, 2006-2011).
Ned C. Lautenbach (1944)
Year of Election or Appointment: 2000
Trustee
Chairman of the Independent Trustees
Mr. Lautenbach also serves as Trustee of other Fidelity® funds. Mr. Lautenbach currently serves as Vice Chair of the Board of Governors, State University System of Florida (2013-present) and is a member of the Council on Foreign Relations (1994-present). He is also a member and has most recently served as Chairman of the Board of Directors of Artis-Naples (2012-present). Previously, Mr. Lautenbach served as a member and then Lead Director of the Board of Directors of Eaton Corporation (diversified industrial, 1997-2016). He was also a Partner and Advisory Partner at Clayton, Dubilier & Rice, LLC (private equity investment, 1998-2010), as well as a Director of Sony Corporation (2006-2007). In addition, Mr. Lautenbach also had a 30-year career with IBM (technology company) during which time he served as Senior Vice President and a member of the Corporate Executive Committee (1968-1998).
Joseph Mauriello (1944)
Year of Election or Appointment: 2008
Trustee
Mr. Mauriello also serves as Trustee of other Fidelity® funds. Prior to his retirement in January 2006, Mr. Mauriello served in numerous senior management positions including Deputy Chairman and Chief Operating Officer (2004-2005), and Vice Chairman of Financial Services (2002-2004) of KPMG LLP US (professional services, 1965-2005). Mr. Mauriello currently serves as a member of the Independent Directors Council (IDC) Governing Council (2015-present). Previously, Mr. Mauriello served as a member of the Board of Directors of XL Group plc. (global insurance and re-insurance, 2006-2018).
Cornelia M. Small (1944)
Year of Election or Appointment: 2005
Trustee
Ms. Small also serves as Trustee of other Fidelity® funds. Ms. Small is a member of the Board of Directors (2009-present) and Chair of the Investment Committee (2010-present) of the Teagle Foundation. Ms. Small also serves on the Investment Committee of the Berkshire Taconic Community Foundation (2008-present). Previously, Ms. Small served as Chairperson (2002-2008) and a member of the Investment Committee and Chairperson (2008-2012) and a member of the Board of Trustees of Smith College. In addition, Ms. Small served as Chief Investment Officer, Director of Global Equity Investments, and a member of the Board of Directors of Scudder, Stevens & Clark and Scudder Kemper Investments.
Garnett A. Smith (1947)
Year of Election or Appointment: 2018
Trustee
Mr. Smith also serves as Trustee of other Fidelity® funds. Prior to Mr. Smith's retirement, he served as Chairman and Chief Executive Officer of Inbrand Corp. (manufacturer of personal absorbent products, 1990-1997). He also served as President (1986-1990) of Inbrand Corp. Prior to his employment with Inbrand Corp., he was employed by a retail fabric chain and North Carolina National Bank. In addition, Mr. Smith served as a Member of the Advisory Board of certain Fidelity® funds (2012-2013) and as a board member of the Jackson Hole Land Trust (2009-2012).
David M. Thomas (1949)
Year of Election or Appointment: 2008
Trustee
Mr. Thomas also serves as Trustee of other Fidelity® funds. Mr. Thomas serves as Non-Executive Chairman of the Board of Directors of Fortune Brands Home and Security (home and security products, 2011-present), as a member of the Board of Directors (2004-present) and Presiding Director (2013-present) of Interpublic Group of Companies, Inc. (marketing communication), and as a member of the Board of Trustees of the University of Florida (2013-present). Previously, Mr. Thomas served as Executive Chairman (2005-2006) and Chairman and Chief Executive Officer (2000-2005) of IMS Health, Inc. (pharmaceutical and healthcare information solutions), and a Director of Fortune Brands, Inc. (consumer products, 2000-2011).
+ The information includes the Trustee's principal occupation during the last five years and other information relating to the experience, attributes, and skills relevant to the Trustee's qualifications to serve as a Trustee, which led to the conclusion that the Trustee should serve as a Trustee for the fund.
Advisory Board Members and Officers:
Correspondence intended for a Member of the Advisory Board (if any) may be sent to Fidelity Investments, P.O. Box 55235, Boston, Massachusetts 02205-5235. Correspondence intended for an officer or Peter S. Lynch may be sent to Fidelity Investments, 245 Summer Street, Boston, Massachusetts 02210. Officers appear below in alphabetical order.
Name, Year of Birth; Principal Occupation
Vicki L. Fuller (1957)
Year of Election or Appointment: 2018
Member of the Advisory Board
Ms. Fuller also serves as Member of the Advisory Board of other Fidelity® funds. Ms. Fuller serves as a member of the Board of Directors, Audit Committee, and Nominating and Governance Committee of The Williams Companies, Inc. (natural gas infrastructure, 2018-present). Previously, Ms. Fuller served as the Chief Investment Officer of the New York State Common Retirement Fund (2012-2018) and held a variety of positions at AllianceBernstein L.P. (global asset management, 1985-2012), including Managing Director (2006-2012) and Senior Vice President and Senior Portfolio Manager (2001-2006).
Peter S. Lynch (1944)
Year of Election or Appointment: 2003
Member of the Advisory Board
Mr. Lynch also serves as Member of the Advisory Board of other Fidelity® funds. Mr. Lynch is Vice Chairman and a Director of FMR (investment adviser firm) and FMR Co., Inc. (investment adviser firm). In addition, Mr. Lynch serves as a Trustee of Boston College and as the Chairman of the Inner-City Scholarship Fund. Previously, Mr. Lynch served on the Special Olympics International Board of Directors (1997-2006).
William S. Stavropoulos (1939)
Year of Election or Appointment: 2018
Member of the Advisory Board
Mr. Stavropoulos also serves as Member of the Advisory Board of other Fidelity® funds. Mr. Stavropoulos serves as President and Founder of the Michigan Baseball Foundation, the Great Lakes Loons (2007-present). Mr. Stavropoulos is Chairman Emeritus of the Board of Directors of The Dow Chemical Company, where he previously served in numerous senior management positions, including President, CEO (1995-2000; 2002-2004), Chairman of the Executive Committee (2000-2006), and as a member of the Board of Directors (1990-2006). Currently, Mr. Stavropoulos is Chairman of the Board of Directors of Univar Inc. (global distributor of commodity and specialty chemicals), a Director of Teradata Corporation (data warehousing and technology solutions), and a member of the Advisory Board for Metalmark Capital LLC (private equity investment, 2005-present). Mr. Stavropoulos is an operating advisor to Clayton, Dubilier & Rice, LLC (private equity investment). In addition, Mr. Stavropoulos is a member of the University of Notre Dame Advisory Council for the College of Science, a Trustee of the Rollin L. Gerstacker Foundation, and a Director of Artis-Naples in Naples, Florida. Previously, Mr. Stavropoulos served as Trustee of certain Fidelity® funds (2001-2018) and as a Director of Chemical Financial Corporation (bank holding company, 1993-2012) and Tyco International, Ltd. (multinational manufacturing and services, 2007-2012).
Carol B. Tomé (1957)
Year of Election or Appointment: 2018
Member of the Advisory Board
Ms. Tomé also serves as Member of the Advisory Board of other Fidelity® funds. Ms. Tomé is Chief Financial Officer (2001-present) and Executive Vice President of Corporate Services (2007-present) of The Home Depot, Inc. (home improvement retailer) and a Director (2003-present) and Chair of the Audit Committee (2004-present) of United Parcel Service, Inc. (package delivery and supply chain management). Previously, Ms. Tomé served as Trustee of certain Fidelity® funds (2017), Senior Vice President of Finance and Accounting/Treasurer (2000-2007) and Vice President and Treasurer (1995-2000) of The Home Depot, Inc. and Chair of the Board (2010-2012), Vice Chair of the Board (2009 and 2013), and a Director (2008-2013) of the Federal Reserve Bank of Atlanta. Ms. Tomé is also a director or trustee of many community and professional organizations.
Michael E. Wiley (1950)
Year of Election or Appointment: 2018
Member of the Advisory Board
Mr. Wiley also serves as Trustee or Member of the Advisory Board of other Fidelity® funds. Mr. Wiley serves as a Director of High Point Resources (exploration and production, 2005-present). Previously, Mr. Wiley served as a Director of Andeavor Corporation (independent oil refiner and marketer, 2005-2018), a Director of Andeavor Logistics LP (natural resources logistics, 2015-2018), a Director of Post Oak Bank (privately-held bank, 2004-2018), a Director of Asia Pacific Exploration Consolidated (international oil and gas exploration and production, 2008-2013), a member of the Board of Trustees of the University of Tulsa (2000-2006; 2007-2010), a Senior Energy Advisor of Katzenbach Partners, LLC (consulting, 2006-2007), an Advisory Director of Riverstone Holdings (private investment), a Director of Spinnaker Exploration Company (exploration and production, 2001-2005) and Chairman, President, and CEO of Baker Hughes, Inc. (oilfield services, 2000-2004).
Elizabeth Paige Baumann (1968)
Year of Election or Appointment: 2017
Anti-Money Laundering (AML) Officer
Ms. Baumann also serves as AML Officer of other funds. She is Chief AML Officer (2012-present) and Senior Vice President (2014-present) of FMR LLC (diversified financial services company) and is an employee of Fidelity Investments. Previously, Ms. Baumann served as AML Officer of the funds (2012-2016), and Vice President (2007-2014) and Deputy Anti-Money Laundering Officer (2007-2012) of FMR LLC.
John J. Burke III (1964)
Year of Election or Appointment: 2018
Chief Financial Officer
Mr. Burke also serves as Chief Financial Officer of other funds. Mr. Burke serves as Head of Investment Operations for Fidelity Fund and Investment Operations (2018-present) and is an employee of Fidelity Investments (1998-present). Previously Mr. Burke served as head of Asset Management Investment Operations (2012-2018).
William C. Coffey (1969)
Year of Election or Appointment: 2018
Secretary and Chief Legal Officer (CLO)
Mr. Coffey also serves as Secretary and CLO of other funds. Mr. Coffey serves as CLO, Secretary, and Senior Vice President of Fidelity Management & Research Company and FMR Co., Inc. (investment adviser firms, 2018-present); Secretary of Fidelity SelectCo, LLC and Fidelity Investments Money Management, Inc. (investment adviser firms, 2018-present); and CLO of Fidelity Management & Research (Hong Kong) Limited, FMR Investment Management (UK) Limited, and Fidelity Management & Research (Japan) Limited (investment adviser firms, 2018-present). He is Senior Vice President and Deputy General Counsel of FMR LLC (diversified financial services company, 2010-present), and is an employee of Fidelity Investments. Previously, Mr. Coffey served as Assistant Secretary of certain funds (2009-2018) and as Vice President and Associate General Counsel of FMR LLC (2005-2009).
Timothy M. Cohen (1969)
Year of Election or Appointment: 2018
Vice President
Mr. Cohen also serves as Vice President of other funds. Mr. Cohen serves as Co-Head of Global Equity Research (2016-present), a Director of Fidelity Management & Research (Japan) Limited (investment adviser firm, 2016-present), and is an employee of Fidelity Investments. Previously, Mr. Cohen served as Chief Investment Officer - Equity and a Director of Fidelity Management & Research (U.K.) Inc. (investment adviser firm, 2013-2015) and as a Director of Fidelity Management & Research (Hong Kong) Limited (investment adviser firm, 2017).
Jonathan Davis (1968)
Year of Election or Appointment: 2010
Assistant Treasurer
Mr. Davis also serves as Assistant Treasurer of other funds. Mr. Davis serves as Assistant Treasurer of FMR Capital, Inc. (2017-present) and is an employee of Fidelity Investments. Previously, Mr. Davis served as Vice President and Associate General Counsel of FMR LLC (diversified financial services company, 2003-2010).
Adrien E. Deberghes (1967)
Year of Election or Appointment: 2016
Assistant Treasurer
Mr. Deberghes also serves as an officer of other funds. He serves as Assistant Treasurer of FMR Capital, Inc. (2017-present), Executive Vice President of Fidelity Investments Money Management, Inc. (FIMM) (investment adviser firm, 2016-present), and is an employee of Fidelity Investments (2008-present). Previously, Mr. Deberghes served as President and Treasurer of certain Fidelity® funds (2013-2018). Prior to joining Fidelity Investments, Mr. Deberghes was Senior Vice President of Mutual Fund Administration at State Street Corporation (2007-2008), Senior Director of Mutual Fund Administration at Investors Bank & Trust (2005-2007), and Director of Finance for Dunkin' Brands (2000-2005). Previously, Mr. Deberghes served in other fund officer roles.
Laura M. Del Prato (1964)
Year of Election or Appointment: 2018
Assistant Treasurer
Ms. Del Prato also serves as an officer of other funds. Ms. Del Prato is an employee of Fidelity Investments (2017-present). Prior to joining Fidelity Investments, Ms. Del Prato served as a Managing Director and Treasurer of the JPMorgan Mutual Funds (2014-2017). Prior to JPMorgan, Ms. Del Prato served as a partner at Cohen Fund Audit Services (accounting firm, 2012-2013) and KPMG LLP (accounting firm, 2004-2012).
Colm A. Hogan (1973)
Year of Election or Appointment: 2016
Deputy Treasurer
Mr. Hogan also serves as an officer of other funds. Mr. Hogan serves as Assistant Treasurer of FMR Capital, Inc. (2017-present) and is an employee of Fidelity Investments (2005-present). Previously, Mr. Hogan served as Assistant Treasurer of certain Fidelity® funds (2016-2018).
Pamela R. Holding (1964)
Year of Election or Appointment: 2018
Vice President
Ms. Holding also serves as Vice President of other funds. Ms. Holding serves as Co-Head of Global Equity Research (2018-present) and is an employee of Fidelity Investments (2013-present).
Chris Maher (1972)
Year of Election or Appointment: 2013
Assistant Treasurer
Mr. Maher serves as Assistant Treasurer of other funds. Mr. Maher is Vice President of Valuation Oversight, serves as Assistant Treasurer of FMR Capital, Inc. (2017-present), and is an employee of Fidelity Investments. Previously, Mr. Maher served as Vice President of Asset Management Compliance (2013), Vice President of the Program Management Group of FMR (investment adviser firm, 2010-2013), and Vice President of Valuation Oversight (2008-2010).
Rieco E. Mello (1969)
Year of Election or Appointment: 2017
Assistant Treasurer
Mr. Mello also serves as Assistant Treasurer of other funds. Mr. Mello serves as Assistant Treasurer of FMR Capital, Inc. (2017-present) and is an employee of Fidelity Investments (1995-present).
Kenneth B. Robins (1969)
Year of Election or Appointment: 2016
Chief Compliance Officer
Mr. Robins also serves as an officer of other funds. Mr. Robins serves as Compliance Officer of Fidelity Management & Research Company and FMR Co., Inc. (investment adviser firms, 2016-present) and is an employee of Fidelity Investments (2004-present). Previously, Mr. Robins served as Executive Vice President of Fidelity Investments Money Management, Inc. (investment adviser firm, 2013-2016) and served in other fund officer roles.
Stacie M. Smith (1974)
Year of Election or Appointment: 2016
President and Treasurer
Ms. Smith also serves as an officer of other funds. Ms. Smith serves as Assistant Treasurer of FMR Capital, Inc. (2017-present), is an employee of Fidelity Investments (2009-present), and has served in other fund officer roles. Prior to joining Fidelity Investments, Ms. Smith served as Senior Audit Manager of Ernst & Young LLP (accounting firm, 1996-2009). Previously, Ms. Smith served as Assistant Treasurer (2013-2018) and Deputy Treasurer (2013-2016) of certain Fidelity® funds.
Marc L. Spector (1972)
Year of Election or Appointment: 2016
Assistant Treasurer
Mr. Spector also serves as an officer of other funds. Mr. Spector serves as Assistant Treasurer of FMR Capital, Inc. (2017-present) and is an employee of Fidelity Investments (2016-present). Prior to joining Fidelity Investments, Mr. Spector served as Director at the Siegfried Group (accounting firm, 2013-2016), and prior to Siegfried Group as audit senior manager at Deloitte & Touche (accounting firm, 2005-2013).
Shareholder Expense Example
As a shareholder of the Fund, you incur two types of costs: (1) transaction costs, including sales charges (loads) on purchase payments or redemption proceeds, and (2) ongoing costs, including management fees, distribution and/or service (12b-1) fees and other Fund expenses. This Example is intended to help you understand your ongoing costs (in dollars) of investing in the Fund and to compare these costs with the ongoing costs of investing in other mutual funds.
The actual expense Example is based on an investment of $1,000 invested at the beginning of the period and held for the entire period (May 1, 2018 to October 31, 2018) for Class A, Class M, Class C, International Small Cap and Class I, and for the period (October 2, 2018 to October 31, 2018) for Class Z. The hypothetical expense Example is based on an investment of $1,000 invested for the one-half year period (May 1, 2018 to October 31, 2018).
Actual Expenses
The first line of the accompanying table for each class of the Fund provides information about actual account values and actual expenses. You may use the information in this line, together with the amount you invested, to estimate the expenses that you paid over the period. Simply divide your account value by $1,000.00 (for example, an $8,600 account value divided by $1,000.00 = 8.6), then multiply the result by the number in the first line for a class of the Fund under the heading entitled "Expenses Paid During Period" to estimate the expenses you paid on your account during this period. A small balance maintenance fee of $12.00 that is charged once a year may apply for certain accounts with a value of less than $2,000. This fee, which was eliminated effective August 1, 2018, is not included in the table below. If it was, the estimate of expenses you paid during the period would be higher, and your ending account value lower, by this amount. In addition, the Fund, as a shareholder in the underlying Fidelity Central Funds, will indirectly bear its pro-rata share of the fees and expenses incurred by the underlying Fidelity Central Funds. These fees and expenses are not included in the Fund's annualized expense ratio used to calculate the expense estimate in the table below.
Hypothetical Example for Comparison Purposes
The second line of the accompanying table for each class of the Fund provides information about hypothetical account values and hypothetical expenses based on a Class' actual expense ratio and an assumed rate of return of 5% per year before expenses, which is not the Class' actual return. The hypothetical account values and expenses may not be used to estimate the actual ending account balance or expenses you paid for the period. You may use this information to compare the ongoing costs of investing in the Fund and other funds. To do so, compare this 5% hypothetical example with the 5% hypothetical examples that appear in the shareholder reports of the other funds. A small balance maintenance fee of $12.00 that is charged once a year may apply for certain accounts with a value of less than $2,000. This fee, which was eliminated effective August 1, 2018, is not included in the table below. If it was, the estimate of expenses you paid during the period would be higher, and your ending account value lower, by this amount. In addition, the Fund, as a shareholder in the underlying Fidelity Central Funds, will indirectly bear its pro-rata share of the fees and expenses incurred by the underlying Fidelity Central Funds. These fees and expenses are not included in the Fund's annualized expense ratio used to calculate the expense estimate in the table below.
Please note that the expenses shown in the table are meant to highlight your ongoing costs only and do not reflect any transaction costs. Therefore, the second line of the table is useful in comparing ongoing costs only, and will not help you determine the relative total costs of owning different funds. In addition, if these transactional costs were included, your costs would have been higher.
| | Annualized Expense Ratio-A | Beginning
Account Value | Ending
Account Value
October 31, 2018 | Expenses Paid
During Period |
| Class A | 1.47% | | | |
| Actual | | $1,000.00 | $870.10 | $6.93-B |
| Hypothetical-C | | $1,000.00 | $1,017.80 | $7.48-D |
| Class M | 1.75% | | | |
| Actual | | $1,000.00 | $868.80 | $8.24-B |
| Hypothetical-C | | $1,000.00 | $1,016.38 | $8.89-D |
| Class C | 2.24% | | | |
| Actual | | $1,000.00 | $866.70 | $10.54-B |
| Hypothetical-C | | $1,000.00 | $1,013.91 | $11.37-D |
| International Small Cap | 1.18% | | | |
| Actual | | $1,000.00 | $871.40 | $5.57-B |
| Hypothetical-C | | $1,000.00 | $1,019.26 | $6.01-D |
| Class I | 1.21% | | | |
| Actual | | $1,000.00 | $871.20 | $5.71-B |
| Hypothetical-C | | $1,000.00 | $1,019.11 | $6.16-D |
| Class Z | 1.15% | | | |
| Actual | | $1,000.00 | $919.40 | $.91-B |
| Hypothetical-C | | $1,000.00 | $1,019.41 | $5.85-D |
A Annualized expense ratio reflects expenses net of applicable fee waivers.
B Actual expenses are equal to each Class' annualized expense ratio, multiplied by the average account value over the period, multiplied by 184/365 (to reflect the one-half year period) for Class A, Class M, Class C, International Small Cap and Class I, and multiplied by 30/365 (to reflect the period October 2, 2018 to October 31, 2018) for Class Z.
C 5% return per year before expenses
D Hypothetical expenses are equal to each Class' annualized expense ratio, multiplied by the average account value over the period, multiplied by 184/365 (to reflect the one-half year period).
Distributions (Unaudited)
The Board of Trustees of Fidelity International Small Cap Fund voted to pay to shareholders of record at the opening of business on record date, the following distributions per share derived from capital gains realized from sales of portfolio securities, and dividends derived from net investment income:
| | Pay Date | Record Date | Dividends | Capital Gains |
| Fidelity International Small Cap Fund | | | | |
| Class A | 12/10/18 | 12/07/18 | $0.381 | $1.002 |
| Class M | 12/10/18 | 12/07/18 | $0.274 | $1.002 |
| Class C | 12/10/18 | 12/07/18 | $0.166 | $1.002 |
| Fidelity International Small Cap | 12/10/18 | 12/07/18 | $0.452 | $1.002 |
| Class I | 12/10/18 | 12/07/18 | $0.459 | $1.002 |
| Class Z | 12/10/18 | 12/07/18 | $0.504 | $1.002 |
|
The fund hereby designates as a capital gain dividend with respect to the taxable year ended October 31, 2018, $83,998,263, or, if subsequently determined to be different, the net capital gain of such year.
Class A designates 79%; Class M designates 91%; Class C designates 100%; Fidelity International Small Cap designates 72%; and Class I designates 70%; of the dividend distributed in December during the fiscal year as amounts which may be taken into account as a dividend for purposes of the maximum rate under section 1(h)(11) of the Internal Revenue Code.
The amounts per share which represent income derived from sources within, and taxes paid to, foreign countries or possessions of the United States are as follows:
| | Pay Date | Income | Taxes |
| Fidelity International Small Cap Fund | | | |
| Class A | 12/11/17 | $0.4967 | $0.0578 |
| Class M | 12/11/17 | $0.4316 | $0.0578 |
| Class C | 12/11/17 | $0.3921 | $0.0578 |
| Fidelity International Small Cap | 12/11/17 | $0.5478 | $0.0578 |
| Class I | 12/11/17 | $0.5577 | $0.0578 |
|
The fund will notify shareholders in January 2019 of amounts for use in preparing 2018 income tax returns.
Board Approval of Investment Advisory Contracts
Fidelity International Small Cap Fund
At its July 2018 meeting, the Board of Trustees, including the Independent Trustees (together, the Board), voted to continue the management contract with Fidelity Management & Research Company (FMR) and the sub-advisory agreements (together, the Advisory Contracts) for the fund for six months through January 31, 2019, in connection with the reunification of the Fidelity Equity High Income Funds Board, which oversees the fund, and the Sector Portfolios Board.
The Board considered that the approval of the fund's Advisory Contracts will not result in any changes in (i) the investment process or strategies employed in the management of the fund's assets; (ii) the fees and expenses paid by shareholders; (iii) the nature, extent or quality of services provided under the fund's Advisory Contracts; or (iv) the day-to-day management of the fund or the persons primarily responsible for such management. The Board concluded that the fund's Advisory Contracts are fair and reasonable, and that the fund's Advisory Contracts should be renewed, without modification, through January 31, 2019, with the understanding that the Board will consider the annual renewal for a full one year period in January 2019.
In connection with its consideration of future renewals of the fund's Advisory Contracts, the Board will consider: (i) the nature, extent and quality of services provided to the fund, including shareholder and administrative services and investment performance; (ii) the competitiveness of the management fee and total expenses for the fund; (iii) the costs of the services and profitability, including the revenues earned and the expenses incurred in conducting the business of developing, marketing, distributing, managing, administering, and servicing the fund and its shareholders, to the extent applicable, as well as potential fall-out benefits from Fidelity's non-fund businesses; and (iv) whether there have been economies of scale in respect of the Fidelity funds, whether the Fidelity funds (including the fund) have appropriately benefited from any such economies of scale, and whether there is the potential for realization of any further economies.
Based on its evaluation of all of the conclusions noted above, and after considering all factors it believed relevant, the Board ultimately concluded that the fund's management fee structure is fair and reasonable, and that the continuation of the fund's Advisory Contracts should be approved.
Corporate Headquarters
245 Summer St.
Boston, MA 02210
www.fidelity.com
ISC-ANN-1218
1.793585.115
Fidelity Advisor® International Small Cap Opportunities Fund - Class A, Class M, Class C, Class I and Class Z
Annual Report October 31, 2018 Class A, Class M, Class C, Class I and Class Z are classes of Fidelity® International Small Cap Opportunities Fund |
|
Contents
To view a fund's proxy voting guidelines and proxy voting record for the 12-month period ended June 30, visit http://www.fidelity.com/proxyvotingresults or visit the Securities and Exchange Commission's (SEC) web site at http://www.sec.gov.
You may also call 1-877-208-0098 to request a free copy of the proxy voting guidelines.
Standard & Poor's, S&P and S&P 500 are registered service marks of The McGraw-Hill Companies, Inc. and have been licensed for use by Fidelity Distributors Corporation.
Other third-party marks appearing herein are the property of their respective owners.
All other marks appearing herein are registered or unregistered trademarks or service marks of FMR LLC or an affiliated company. © 2018 FMR LLC. All rights reserved.
This report and the financial statements contained herein are submitted for the general information of the shareholders of the Fund. This report is not authorized for distribution to prospective investors in the Fund unless preceded or accompanied by an effective prospectus.
A fund files its complete schedule of portfolio holdings with the SEC for the first and third quarters of each fiscal year on Form N-Q. Forms N-Q are available on the SEC’s web site at http://www.sec.gov. A fund's Forms N-Q may be reviewed and copied at the SEC’s Public Reference Room in Washington, DC. Information regarding the operation of the SEC's Public Reference Room may be obtained by calling 1-800-SEC-0330.
For a complete list of a fund's portfolio holdings, view the most recent holdings listing, semiannual report, or annual report on Fidelity's web site at http://www.fidelity.com, http://www.institutional.fidelity.com, or http://www.401k.com, as applicable.
NOT FDIC INSURED •MAY LOSE VALUE •NO BANK GUARANTEE
Neither the Fund nor Fidelity Distributors Corporation is a bank.
Performance: The Bottom Line
Average annual total return reflects the change in the value of an investment, assuming reinvestment of distributions from dividend income and capital gains (the profits earned upon the sale of securities that have grown in value, if any) and assuming a constant rate of performance each year. The hypothetical investment and the average annual total returns do not reflect the deduction of taxes that a shareholder would pay on fund distributions or the redemption of fund shares. During periods of reimbursement by Fidelity, a fund’s total return will be greater than it would be had the reimbursement not occurred. How a fund did yesterday is no guarantee of how it will do tomorrow.
Average Annual Total Returns
| For the periods ended October 31, 2018 | Past 1 year | Past 5 years | Past 10 years |
| Class A (incl. 5.75% sales charge) | (9.97)% | 4.70% | 11.28% |
| Class M (incl. 3.50% sales charge) | (8.08)% | 4.88% | 11.24% |
| Class C (incl. contingent deferred sales charge) | (6.12)% | 5.12% | 11.11% |
| Class I | (4.21)% | 6.25% | 12.27% |
| Class Z | (4.21)% | 6.25% | 12.27% |
Class C shares' contingent deferred sales charges included in the past one year, past five years and past ten years total return figures are 1%, 0% and 0%, respectively.
The initial offering of Class Z shares took place on October 2, 2018. Returns prior to October 2, 2018, are those of Class I.
$10,000 Over 10 Years
Let's say hypothetically that $10,000 was invested in Fidelity Advisor® International Small Cap Opportunities Fund - Class A on October 31, 2008, and the current 5.75% sales charge was paid.
The chart shows how the value of your investment would have changed, and also shows how the MSCI EAFE Small Cap Index performed over the same period.

| Period Ending Values |
| $29,131 | Fidelity Advisor® International Small Cap Opportunities Fund - Class A |
| $30,168 | MSCI EAFE Small Cap Index |
Management's Discussion of Fund Performance
Market Recap: International equities returned -8.08% for the 12 months ending October 31, 2018, according to the MSCI ACWI (All Country World Index) ex USA Index. A modestly positive first half of the period gave way to a confluence of overwhelmingly negative factors – including escalating trade tensions, a surging U.S. dollar, tepid economic growth in Europe, global central bank tightening, concerns about Italy’s budget stalemate with the EU, and weakness in China’s stock market – that yielded a -11% second-half return. The index lost 8% in October alone, its largest monthly drop in more than six years. Among sectors, new-media-infused communications services (-15%) was hit the hardest, while economically sensitive consumer discretionary (-13%), information technology (-12%), financials (-10%), industrials (-9%) and materials (-7%) stocks also fared poorly. Even the more defensive real estate (-9%), utilities (-6%) and consumer staples (-5%) sectors weren’t spared this period. Conversely, elevated crude-oil prices fueled a positive return for energy (+7%), the top-performing sector, followed by the relatively stable-growing health care segment (+2%). Regionally, emerging markets (-12%) fared the worst, hampered by the impact of foreign exchange and concerns about economic weakness in China, India and South Korea. Sluggish growth also pressured shares in continental Europe (-9%). Stocks in Japan (-3%) and the U.K. (-4%) held up better, followed by Canada (-5%) and Asia-Pacific ex Japan (-6%).
Comments from Portfolio Manager Jed Weiss: For the fiscal year, the fund’s share classes (excluding sales charges, if applicable) returned roughly -4% to -5%, outpacing the -7.68% return of the benchmark MSCI EAFE Small Cap Index. Versus the benchmark, security selection within Japan was by far the biggest contributor, followed by Germany. My choices among emerging markets also helped our relative result, particularly South Africa. Conversely, picks in a number of Scandanavian countries, including Sweden and Denmark, hampered the portfolio's performance versus the benchmark, as did an underweighting in Australia. A number of Japanese holdings helped the fund top the benchmark this period. This included a sizable out-of-benchmark stake in technology service management company OBIC, our largest individual relative contributor which continued to execute well during the period. In addition, it helped to hold a non-benchmark position in Workman, the leading workwear retailer in Japan. Workman's share price benefited from strong sales trends this period. Also contributing was an overweighting in Lasertec, a Japan-based maker of semiconductor inspection systems that gained roughly 33% the past 12 months. Lastly, I'll note that the fund's stake in cash – representing about 4% of assets, on average – helped our relative result in a down market. Conversely, the fund's biggest detractor was Nabtesco, a maker of gearboxes and machinery. Our non-benchmark holdings returned -43% this period, as the company was held back by economic weakness in China, its second-largest market. Untimely ownership of gaming software company Playtech also detracted, as its shares declined amid deterioration of the firm's pricing power, as well as heightened competition. Playtech was not held at period end. Lastly, Swedish light-fixture maker Fagerhult, another non-benchmark holding, returned about -31% and weighed on the fund's relative result.
The views expressed above reflect those of the portfolio manager(s) only through the end of the period as stated on the cover of this report and do not necessarily represent the views of Fidelity or any other person in the Fidelity organization. Any such views are subject to change at any time based upon market or other conditions and Fidelity disclaims any responsibility to update such views. These views may not be relied on as investment advice and, because investment decisions for a Fidelity fund are based on numerous factors, may not be relied on as an indication of trading intent on behalf of any Fidelity fund.
Investment Summary (Unaudited)
Geographic Diversification (% of fund's net assets)
| As of October 31, 2018 |
| | Japan | 33.8% |
| | United Kingdom | 16.1% |
| | United States of America* | 12.7% |
| | Germany | 5.3% |
| | Sweden | 4.7% |
| | France | 2.8% |
| | Denmark | 2.6% |
| | Israel | 2.5% |
| | Netherlands | 2.2% |
| | Other | 17.3% |

* Includes Short-Term investments and Net Other Assets (Liabilities).
Percentages are based on country or territory of incorporation and are adjusted for the effect of futures contracts, if applicable.
Asset Allocation as of October 31, 2018
| | % of fund's net assets |
| Stocks and Investment Companies | 92.9 |
| Short-Term Investments and Net Other Assets (Liabilities) | 7.1 |
Top Ten Stocks as of October 31, 2018
| | % of fund's net assets |
| Spirax-Sarco Engineering PLC (United Kingdom, Machinery) | 2.3 |
| OBIC Co. Ltd. (Japan, IT Services) | 2.2 |
| Azbil Corp. (Japan, Electronic Equipment & Components) | 2.1 |
| Spectris PLC (United Kingdom, Electronic Equipment & Components) | 2.1 |
| CompuGroup Medical AG (Germany, Health Care Technology) | 2.0 |
| SHO-BOND Holdings Co. Ltd. (Japan, Construction & Engineering) | 1.8 |
| Dechra Pharmaceuticals PLC (United Kingdom, Pharmaceuticals) | 1.8 |
| KBC Ancora (Belgium, Diversified Financial Services) | 1.6 |
| OSG Corp. (Japan, Machinery) | 1.6 |
| Nihon Parkerizing Co. Ltd. (Japan, Chemicals) | 1.6 |
| | 19.1 |
Top Market Sectors as of October 31, 2018
| | % of fund's net assets |
| Industrials | 22.9 |
| Health Care | 13.0 |
| Information Technology | 12.2 |
| Consumer Discretionary | 8.9 |
| Consumer Staples | 8.0 |
| Materials | 6.7 |
| Media & Entertainment | 6.5 |
| Financials | 5.0 |
| Real Estate | 4.2 |
| Energy | 2.1 |
Schedule of Investments October 31, 2018
Showing Percentage of Net Assets
| Common Stocks - 88.5% | | | |
| | | Shares | Value |
| Australia - 1.8% | | | |
| Accent Group Ltd. | | 2,858,149 | $2,519,878 |
| Adelaide Brighton Ltd. | | 909,157 | 3,650,457 |
| Beacon Lighting Group Ltd. | | 2,785,250 | 2,731,739 |
| DuluxGroup Ltd. | | 1,827,588 | 9,577,128 |
| Imdex Ltd. (a) | | 3,540,102 | 2,882,962 |
| Quintis Ltd. (a)(b)(c) | | 2,011,191 | 14 |
|
| TOTAL AUSTRALIA | | | 21,362,178 |
|
| Austria - 0.7% | | | |
| Andritz AG | | 160,500 | 8,318,725 |
| Bailiwick of Jersey - 0.4% | | | |
| Integrated Diagnostics Holdings PLC (d) | | 1,483,779 | 5,119,038 |
| Belgium - 1.6% | | | |
| KBC Ancora | | 420,056 | 19,430,709 |
| Bermuda - 0.5% | | | |
| Vostok New Ventures Ltd. (depositary receipt) (a) | | 701,789 | 5,337,527 |
| Canada - 1.4% | | | |
| McCoy Global, Inc. (a) | | 633,615 | 553,502 |
| New Look Vision Group, Inc. | | 227,200 | 5,565,878 |
| Pason Systems, Inc. | | 351,800 | 5,309,937 |
| PrairieSky Royalty Ltd. | | 182,700 | 2,775,647 |
| ShawCor Ltd. Class A | | 164,900 | 2,991,236 |
|
| TOTAL CANADA | | | 17,196,200 |
|
| Cayman Islands - 0.3% | | | |
| Value Partners Group Ltd. | | 4,315,000 | 3,202,431 |
| Denmark - 2.6% | | | |
| Jyske Bank A/S (Reg.) | | 233,352 | 9,540,405 |
| Netcompany Group A/S | | 99,726 | 3,298,260 |
| Scandinavian Tobacco Group A/S (d) | | 195,906 | 2,972,689 |
| SimCorp A/S | | 93,500 | 7,203,882 |
| Spar Nord Bank A/S | | 1,030,077 | 8,538,494 |
|
| TOTAL DENMARK | | | 31,553,730 |
|
| Finland - 0.4% | | | |
| Tikkurila Oyj (b) | | 330,959 | 4,505,826 |
| France - 2.8% | | | |
| Elis SA | | 838,942 | 16,942,559 |
| Laurent-Perrier Group SA | | 51,163 | 5,250,249 |
| Vetoquinol SA | | 117,184 | 6,570,059 |
| Virbac SA (a) | | 26,852 | 4,312,694 |
|
| TOTAL FRANCE | | | 33,075,561 |
|
| Germany - 4.3% | | | |
| CompuGroup Medical AG | | 429,921 | 24,347,501 |
| CTS Eventim AG | | 282,693 | 10,617,574 |
| Nexus AG | | 291,358 | 7,953,160 |
| WashTec AG | | 111,625 | 8,610,023 |
|
| TOTAL GERMANY | | | 51,528,258 |
|
| Greece - 0.3% | | | |
| Motor Oil (HELLAS) Corinth Refineries SA | | 161,800 | 3,830,192 |
| India - 0.2% | | | |
| Jyothy Laboratories Ltd. | | 917,276 | 2,347,760 |
| Ireland - 1.1% | | | |
| FBD Holdings PLC | | 243,128 | 2,960,323 |
| James Hardie Industries PLC CDI | | 775,840 | 10,323,434 |
|
| TOTAL IRELAND | | | 13,283,757 |
|
| Israel - 2.5% | | | |
| Azrieli Group | | 59,105 | 2,869,568 |
| Ituran Location & Control Ltd. | | 460,008 | 15,695,473 |
| Strauss Group Ltd. | | 513,644 | 11,271,626 |
|
| TOTAL ISRAEL | | | 29,836,667 |
|
| Italy - 1.4% | | | |
| Interpump Group SpA | | 588,277 | 16,990,955 |
| Japan - 33.8% | | | |
| Ai Holdings Corp. | | 202,400 | 3,863,780 |
| Aoki Super Co. Ltd. | | 165,000 | 3,861,967 |
| Artnature, Inc. | | 511,600 | 3,006,078 |
| Aucnet, Inc. | | 212,251 | 2,225,311 |
| Azbil Corp. | | 1,367,800 | 25,480,707 |
| Broadleaf Co. Ltd. | | 561,100 | 3,242,232 |
| Central Automotive Products Ltd. | | 135,400 | 1,841,973 |
| Century21 Real Estate Japan Ltd. | | 66,500 | 726,676 |
| Coca-Cola West Co. Ltd. | | 137,475 | 3,600,289 |
| Daiichikosho Co. Ltd. | | 302,000 | 13,917,667 |
| Daikokutenbussan Co. Ltd. | | 205,900 | 7,700,607 |
| Funai Soken Holdings, Inc. | | 373,550 | 7,922,233 |
| GCA Savvian Group Corp. | | 555,461 | 4,450,186 |
| Goldcrest Co. Ltd. | | 624,130 | 9,762,835 |
| Iwatsuka Confectionary Co. Ltd. | | 21,400 | 835,441 |
| Kobayashi Pharmaceutical Co. Ltd. | | 128,400 | 8,420,791 |
| Koshidaka Holdings Co. Ltd. | | 1,035,300 | 12,047,227 |
| Kusuri No Aoki Holdings Co. Ltd. | | 122,800 | 8,815,350 |
| Lasertec Corp. | | 469,072 | 13,469,165 |
| Medikit Co. Ltd. | | 111,100 | 6,006,204 |
| Miroku Jyoho Service Co., Ltd. | | 177,200 | 3,345,026 |
| Misumi Group, Inc. | | 464,650 | 9,331,297 |
| Mitsuboshi Belting Ltd. | | 132,000 | 3,241,654 |
| Nabtesco Corp. | | 464,100 | 10,233,357 |
| Nagaileben Co. Ltd. | | 619,500 | 13,912,465 |
| Nakano Refrigerators Co. Ltd. | | 86,300 | 4,611,947 |
| ND Software Co. Ltd. | | 97,942 | 1,092,826 |
| Nihon Parkerizing Co. Ltd. | | 1,562,000 | 18,868,312 |
| NS Tool Co. Ltd. | | 156,800 | 3,688,104 |
| OBIC Co. Ltd. | | 295,300 | 26,903,744 |
| OSG Corp. | | 935,300 | 19,346,747 |
| Paramount Bed Holdings Co. Ltd. | | 366,400 | 15,440,528 |
| ProNexus, Inc. | | 472,400 | 4,592,749 |
| San-Ai Oil Co. Ltd. | | 992,400 | 10,721,280 |
| SHO-BOND Holdings Co. Ltd. | | 302,800 | 21,575,859 |
| Shoei Co. Ltd. | | 400,626 | 15,640,161 |
| SK Kaken Co. Ltd. | | 19,200 | 8,142,154 |
| Software Service, Inc. | | 93,800 | 7,066,070 |
| Techno Medica Co. Ltd. | | 80,791 | 1,485,005 |
| The Monogatari Corp. | | 63,400 | 5,663,775 |
| TKC Corp. | | 193,600 | 7,377,853 |
| Tocalo Co. Ltd. | | 483,100 | 4,200,125 |
| USS Co. Ltd. | | 966,500 | 17,448,137 |
| Welcia Holdings Co. Ltd. | | 166,700 | 8,509,700 |
| Workman Co. Ltd. (b) | | 148,800 | 9,415,802 |
| Yamada Consulting Group Co. Ltd. | | 395,500 | 9,116,812 |
| Yamato Kogyo Co. Ltd. | | 127,700 | 3,361,271 |
|
| TOTAL JAPAN | | | 405,529,479 |
|
| Korea (South) - 0.9% | | | |
| BGF Retail Co. Ltd. | | 51,926 | 7,668,301 |
| Leeno Industrial, Inc. | | 52,428 | 2,752,355 |
|
| TOTAL KOREA (SOUTH) | | | 10,420,656 |
|
| Mexico - 0.2% | | | |
| Consorcio ARA S.A.B. de CV | | 8,852,578 | 2,348,979 |
| Netherlands - 2.2% | | | |
| Aalberts Industries NV | | 416,901 | 15,322,985 |
| Takeaway.com Holding BV (a)(d) | | 99,887 | 5,883,125 |
| VastNed Retail NV | | 118,002 | 4,677,924 |
|
| TOTAL NETHERLANDS | | | 25,884,034 |
|
| Norway - 1.3% | | | |
| Kongsberg Gruppen ASA (b) | | 578,373 | 9,509,419 |
| Skandiabanken ASA (d) | | 623,200 | 6,209,969 |
|
| TOTAL NORWAY | | | 15,719,388 |
|
| Philippines - 0.6% | | | |
| Jollibee Food Corp. | | 1,309,740 | 6,764,756 |
| South Africa - 0.9% | | | |
| Clicks Group Ltd. | | 877,329 | 11,180,332 |
| Spain - 2.0% | | | |
| Merlin Properties Socimi SA | | 538,500 | 6,758,047 |
| Prosegur Compania de Seguridad SA (Reg.) | | 2,966,290 | 16,489,743 |
|
| TOTAL SPAIN | | | 23,247,790 |
|
| Sweden - 4.7% | | | |
| Addlife AB | | 288,572 | 6,622,132 |
| AddTech AB (B Shares) | | 606,043 | 12,384,240 |
| Fagerhult AB (b) | | 935,139 | 8,215,926 |
| Lagercrantz Group AB (B Shares) | | 919,775 | 9,055,881 |
| Loomis AB (B Shares) | | 334,600 | 10,347,530 |
| Saab AB (B Shares) | | 257,900 | 10,106,155 |
|
| TOTAL SWEDEN | | | 56,731,864 |
|
| Switzerland - 0.9% | | | |
| Tecan Group AG | | 49,820 | 11,238,747 |
| Taiwan - 0.4% | | | |
| Addcn Technology Co. Ltd. | | 638,435 | 4,969,650 |
| United Kingdom - 16.1% | | | |
| Alliance Pharma PLC | | 6,290,137 | 5,370,755 |
| Ascential PLC | | 2,376,876 | 11,447,647 |
| Avon Rubber PLC | | 283,700 | 4,351,504 |
| Cineworld Group PLC | | 1,353,500 | 5,096,709 |
| Dechra Pharmaceuticals PLC | | 725,909 | 21,210,808 |
| DP Poland PLC (a) | | 7,057,200 | 2,435,539 |
| Elementis PLC | | 5,102,137 | 13,369,181 |
| Great Portland Estates PLC | | 1,151,542 | 10,269,453 |
| Hilton Food Group PLC | | 315,326 | 3,716,118 |
| Howden Joinery Group PLC | | 755,700 | 4,531,205 |
| Informa PLC | | 1,684,956 | 15,368,880 |
| InterContinental Hotel Group PLC ADR | | 72,195 | 3,881,203 |
| ITE Group PLC | | 7,952,093 | 5,793,688 |
| Rightmove PLC | | 1,627,470 | 9,405,770 |
| Shaftesbury PLC | | 1,287,173 | 14,758,023 |
| Spectris PLC | | 912,878 | 25,017,064 |
| Spirax-Sarco Engineering PLC | | 331,991 | 27,455,503 |
| Topps Tiles PLC | | 3,398,115 | 2,732,043 |
| Ultra Electronics Holdings PLC | | 358,458 | 6,588,643 |
|
| TOTAL UNITED KINGDOM | | | 192,799,736 |
|
| United States of America - 2.2% | | | |
| Autoliv, Inc. (b) | | 31,300 | 2,608,542 |
| Martin Marietta Materials, Inc. | | 23,820 | 4,079,890 |
| Mohawk Industries, Inc. (a) | | 14,300 | 1,783,639 |
| PriceSmart, Inc. | | 118,574 | 8,317,966 |
| ResMed, Inc. | | 54,495 | 5,772,110 |
| Veoneer, Inc. (a)(b) | | 124,900 | 4,194,142 |
|
| TOTAL UNITED STATES OF AMERICA | | | 26,756,289 |
|
| TOTAL COMMON STOCKS | | | |
| (Cost $895,549,541) | | | 1,060,511,214 |
|
| Nonconvertible Preferred Stocks - 1.0% | | | |
| Germany - 1.0% | | | |
| Sartorius AG (non-vtg.) | | | |
| (Cost $2,418,851) | | 85,180 | 12,349,328 |
|
| Investment Companies - 3.4% | | | |
| United States of America - 3.4% | | | |
| iShares MSCI EAFE Small-Cap ETF | | | |
| (Cost $47,211,212) | | 715,000 | 40,218,744 |
|
| Money Market Funds - 7.1% | | | |
| Fidelity Cash Central Fund, 2.23% (e) | | 74,075,591 | 74,090,406 |
| Fidelity Securities Lending Cash Central Fund 2.23% (e)(f) | | 11,458,043 | 11,459,189 |
| TOTAL MONEY MARKET FUNDS | | | |
| (Cost $85,549,595) | | | 85,549,595 |
| TOTAL INVESTMENT IN SECURITIES - 100.0% | | | |
| (Cost $1,030,729,199) | | | 1,198,628,881 |
| NET OTHER ASSETS (LIABILITIES) - 0.0% | | | 309,571 |
| NET ASSETS - 100% | | | $1,198,938,452 |
Security Type Abbreviations
ETF – Exchange-Traded Fund
Categorizations in the Schedule of Investments are based on country or territory of incorporation.
Legend
(a) Non-income producing
(b) Security or a portion of the security is on loan at period end.
(c) Level 3 security
(d) Security exempt from registration under Rule 144A of the Securities Act of 1933. These securities may be resold in transactions exempt from registration, normally to qualified institutional buyers. At the end of the period, the value of these securities amounted to $20,184,821 or 1.7% of net assets.
(e) Affiliated fund that is generally available only to investment companies and other accounts managed by Fidelity Investments. The rate quoted is the annualized seven-day yield of the fund at period end. A complete unaudited listing of the fund's holdings as of its most recent quarter end is available upon request. In addition, each Fidelity Central Fund's financial statements, which are not covered by the Fund's Report of Independent Registered Public Accounting Firm, are available on the SEC's website or upon request.
(f) Investment made with cash collateral received from securities on loan.
Affiliated Central Funds
Information regarding fiscal year to date income earned by the Fund from investments in Fidelity Central Funds is as follows:
| Fund | Income earned |
| Fidelity Cash Central Fund | $961,001 |
| Fidelity Securities Lending Cash Central Fund | 112,732 |
| Total | $1,073,733 |
Amounts in the income column in the above table include any capital gain distributions from underlying funds, which are presented in the corresponding line-item in the Statement of Operations if applicable.
Investment Valuation
The following is a summary of the inputs used, as of October 31, 2018, involving the Fund's assets and liabilities carried at fair value. The inputs or methodology used for valuing securities may not be an indication of the risk associated with investing in those securities. For more information on valuation inputs, and their aggregation into the levels used below, please refer to the Investment Valuation section in the accompanying Notes to Financial Statements.
| | Valuation Inputs at Reporting Date: |
| Description | Total | Level 1 | Level 2 | Level 3 |
| Investments in Securities: | | | | |
| Equities: | | | | |
| Communication Services | $76,617,585 | $76,617,585 | $-- | $-- |
| Consumer Discretionary | 107,731,849 | 107,731,849 | -- | -- |
| Consumer Staples | 97,475,264 | 97,475,264 | -- | -- |
| Energy | 26,181,794 | 26,181,794 | -- | -- |
| Financials | 59,670,044 | 59,670,044 | -- | -- |
| Health Care | 155,869,430 | 155,869,430 | -- | -- |
| Industrials | 274,025,999 | 274,025,999 | -- | -- |
| Information Technology | 146,705,422 | 146,705,422 | -- | -- |
| Materials | 78,760,629 | 78,760,615 | -- | 14 |
| Real Estate | 49,822,526 | 49,822,526 | -- | -- |
| Investment Companies | 40,218,744 | 40,218,744 | -- | -- |
| Money Market Funds | 85,549,595 | 85,549,595 | -- | -- |
| Total Investments in Securities: | $1,198,628,881 | $1,198,628,867 | $-- | $14 |
The following is a summary of transfers between Level 1 and Level 2 for the period ended October 31, 2018. Transfers are assumed to have occurred at the beginning of the period, and are primarily attributable to the valuation techniques used for foreign equity securities, as discussed in the accompanying Notes to Financial Statements:
| Transfers | Total |
| Level 1 to Level 2 | $0 |
| Level 2 to Level 1 | $374,431,502 |
The following is a reconciliation of Investments in Securities for which Level 3 inputs were used in determining value:
| Investments in Securities: | |
| Equities - Industrials | |
| Beginning Balance | $16,532,055 |
| Net Realized Gain (Loss) on Investment Securities | (2,430,489) |
| Net Unrealized Gain (Loss) on Investment Securities | (2,765,044) |
| Cost of Purchases | 4,642,612 |
| Proceeds of Sales | (15,979,134) |
| Amortization/Accretion | -- |
| Transfers into Level 3 | -- |
| Transfers out of Level 3 | -- |
| Ending Balance | $-- |
| The change in unrealized gain (loss) for the period attributable to Level 3 securities held at October 31, 2018 | $-- |
| Other Investments in Securities | |
| Beginning Balance | $454,083 |
| Net Realized Gain (Loss) on Investment Securities | -- |
| Net Unrealized Gain (Loss) on Investment Securities | (454,069) |
| Cost of Purchases | -- |
| Proceeds of Sales | -- |
| Amortization/Accretion | -- |
| Transfers into Level 3 | -- |
| Transfers out of Level 3 | -- |
| Ending Balance | $14 |
| The change in unrealized gain (loss) for the period attributable to Level 3 securities held at October 31, 2018 | $(454,069) |
The information used in the above reconciliation represents fiscal year to date activity for any Investments in Securities identified as using Level 3 inputs at either the beginning or the end of the current fiscal period. Transfers in or out of Level 3 represent the beginning value of any Security or Instrument where a change in the pricing level occurred from the beginning to the end of the period. The cost of purchases and the proceeds of sales may include securities received or delivered through corporate actions or exchanges. Realized and unrealized gains (losses) disclosed in the reconciliation are included in Net Gain (Loss) on the Fund's Statement of Operations.
See accompanying notes which are an integral part of the financial statements.
Financial Statements
Statement of Assets and Liabilities
| | | October 31, 2018 |
| Assets | | |
Investment in securities, at value (including securities loaned of $11,123,160) — See accompanying schedule:
Unaffiliated issuers (cost $945,179,604) | $1,113,079,286 | |
| Fidelity Central Funds (cost $85,549,595) | 85,549,595 | |
| Total Investment in Securities (cost $1,030,729,199) | | $1,198,628,881 |
| Foreign currency held at value (cost $13,529) | | 13,529 |
| Receivable for investments sold | | 3,747,500 |
| Receivable for fund shares sold | | 8,403,412 |
| Dividends receivable | | 4,488,172 |
| Distributions receivable from Fidelity Central Funds | | 163,283 |
| Prepaid expenses | | 2,548 |
| Other receivables | | 31,785 |
| Total assets | | 1,215,479,110 |
| Liabilities | | |
| Payable for investments purchased | $2,223,374 | |
| Payable for fund shares redeemed | 1,334,350 | |
| Accrued management fee | 880,035 | |
| Distribution and service plan fees payable | 27,073 | |
| Other affiliated payables | 282,523 | |
| Other payables and accrued expenses | 332,881 | |
| Collateral on securities loaned | 11,460,422 | |
| Total liabilities | | 16,540,658 |
| Net Assets | | $1,198,938,452 |
| Net Assets consist of: | | |
| Paid in capital | | $1,012,690,294 |
| Total distributable earnings (loss) | | 186,248,158 |
| Net Assets | | $1,198,938,452 |
| Net Asset Value and Maximum Offering Price | | |
| Class A: | | |
| Net Asset Value and redemption price per share ($41,164,371 ÷ 2,375,836 shares) | | $17.33 |
| Maximum offering price per share (100/94.25 of $17.33) | | $18.39 |
| Class M: | | |
| Net Asset Value and redemption price per share ($13,245,166 ÷ 771,565 shares) | | $17.17 |
| Maximum offering price per share (100/96.50 of $17.17) | | $17.79 |
| Class C: | | |
| Net Asset Value and offering price per share ($14,461,134 ÷ 866,658 shares)(a) | | $16.69 |
| International Small Cap Opportunities: | | |
| Net Asset Value, offering price and redemption price per share ($965,482,329 ÷ 55,069,955 shares) | | $17.53 |
| Class I: | | |
| Net Asset Value, offering price and redemption price per share ($159,968,400 ÷ 9,137,598 shares) | | $17.51 |
| Class Z: | | |
| Net Asset Value, offering price and redemption price per share ($4,617,052 ÷ 263,741 shares) | | $17.51 |
(a) Redemption price per share is equal to net asset value less any applicable contingent deferred sales charge.
See accompanying notes which are an integral part of the financial statements.
Statement of Operations
| | | Year ended October 31, 2018 |
| Investment Income | | |
| Dividends | | $27,145,284 |
| Income from Fidelity Central Funds | | 1,073,733 |
| Income before foreign taxes withheld | | 28,219,017 |
| Less foreign taxes withheld | | (2,495,312) |
| Total income | | 25,723,705 |
| Expenses | | |
| Management fee | | |
| Basic fee | $10,686,972 | |
| Performance adjustment | (145,341) | |
| Transfer agent fees | 2,545,974 | |
| Distribution and service plan fees | 358,147 | |
| Accounting and security lending fees | 581,030 | |
| Custodian fees and expenses | 183,996 | |
| Independent trustees' fees and expenses | 6,307 | |
| Registration fees | 115,350 | |
| Audit | 69,609 | |
| Legal | 3,981 | |
| Miscellaneous | 8,475 | |
| Total expenses before reductions | 14,414,500 | |
| Expense reductions | (83,719) | |
| Total expenses after reductions | | 14,330,781 |
| Net investment income (loss) | | 11,392,924 |
| Realized and Unrealized Gain (Loss) | | |
| Net realized gain (loss) on: | | |
| Investment securities: | | |
| Unaffiliated issuers | 25,569,977 | |
| Fidelity Central Funds | (1,739) | |
| Foreign currency transactions | (97,551) | |
| Total net realized gain (loss) | | 25,470,687 |
| Change in net unrealized appreciation (depreciation) on: | | |
| Investment securities: | | |
| Unaffiliated issuers (net of increase in deferred foreign taxes of $205,432) | (105,461,299) | |
| Fidelity Central Funds | 647 | |
| Assets and liabilities in foreign currencies | (46,473) | |
| Total change in net unrealized appreciation (depreciation) | | (105,507,125) |
| Net gain (loss) | | (80,036,438) |
| Net increase (decrease) in net assets resulting from operations | | $(68,643,514) |
See accompanying notes which are an integral part of the financial statements.
Statement of Changes in Net Assets
| | Year ended October 31, 2018 | Year ended October 31, 2017 |
| Increase (Decrease) in Net Assets | | |
| Operations | | |
| Net investment income (loss) | $11,392,924 | $9,131,889 |
| Net realized gain (loss) | 25,470,687 | 41,561,179 |
| Change in net unrealized appreciation (depreciation) | (105,507,125) | 187,420,991 |
| Net increase (decrease) in net assets resulting from operations | (68,643,514) | 238,114,059 |
| Distributions to shareholders | (23,288,503) | – |
| Distributions to shareholders from net investment income | – | (10,624,038) |
| Distributions to shareholders from net realized gain | – | (2,566,511) |
| Total distributions | (23,288,503) | (13,190,549) |
| Share transactions - net increase (decrease) | 138,801,633 | (108,646,188) |
| Redemption fees | 14,959 | 188,947 |
| Total increase (decrease) in net assets | 46,884,575 | 116,466,269 |
| Net Assets | | |
| Beginning of period | 1,152,053,877 | 1,035,587,608 |
| End of period | $1,198,938,452 | $1,152,053,877 |
| Other Information | | |
| Undistributed net investment income end of period | | $8,057,934 |
See accompanying notes which are an integral part of the financial statements.
Financial Highlights
Fidelity International Small Cap Opportunities Fund Class A
| Years ended October 31, | 2018 | 2017 | 2016 | 2015 | 2014 |
| Selected Per–Share Data | | | | | |
| Net asset value, beginning of period | $18.47 | $14.82 | $14.75 | $13.65 | $13.68 |
| Income from Investment Operations | | | | | |
| Net investment income (loss)A | .12 | .10 | .09 | .06 | .05 |
| Net realized and unrealized gain (loss) | (.92) | 3.71 | .10 | 1.11 | .05 |
| Total from investment operations | (.80) | 3.81 | .19 | 1.17 | .10 |
| Distributions from net investment income | (.09) | (.12) | (.05) | (.05) | (.06) |
| Distributions from net realized gain | (.24) | (.04) | (.07) | (.02) | (.08) |
| Total distributions | (.34)B | (.16) | (.12) | (.07) | (.13)C |
| Redemption fees added to paid in capitalA,D | – | – | – | – | – |
| Net asset value, end of period | $17.33 | $18.47 | $14.82 | $14.75 | $13.65 |
| Total ReturnE,F | (4.48)% | 26.00% | 1.30% | 8.62% | .78% |
| Ratios to Average Net AssetsG,H | | | | | |
| Expenses before reductions | 1.38% | 1.43% | 1.45% | 1.52% | 1.63% |
| Expenses net of fee waivers, if any | 1.38% | 1.43% | 1.45% | 1.52% | 1.63% |
| Expenses net of all reductions | 1.37% | 1.43% | 1.45% | 1.51% | 1.63% |
| Net investment income (loss) | .65% | .61% | .62% | .38% | .33% |
| Supplemental Data | | | | | |
| Net assets, end of period (000 omitted) | $41,164 | $41,324 | $45,151 | $42,289 | $25,041 |
| Portfolio turnover rateI | 19% | 11% | 24% | 21% | 18% |
A Calculated based on average shares outstanding during the period.
B Total distributions of $.34 per share is comprised of distributions from net investment income of $.093 and distributions from net realized gain of $.243 per share.
C Total distributions of $.13 per share is comprised of distributions from net investment income of $.055 and distributions from net realized gain of $.079 per share.
D Amount represents less than $.005 per share.
E Total returns would have been lower if certain expenses had not been reduced during the applicable periods shown.
F Total returns do not include the effect of the sales charges.
G Fees and expenses of any underlying Fidelity Central Funds are not included in the Fund's expense ratio. The Fund indirectly bears its proportionate share of the expenses of any underlying Fidelity Central Funds.
H Expense ratios reflect operating expenses of the class. Expenses before reductions do not reflect amounts reimbursed by the investment adviser or reductions from brokerage service arrangements or reductions from other expense offset arrangements and do not represent the amount paid by the class during periods when reimbursements or reductions occur. Expenses net of fee waivers reflect expenses after reimbursement by the investment adviser but prior to reductions from brokerage service arrangements or other expense offset arrangements. Expenses net of all reductions represent the net expenses paid by the class.
I Amount does not include the portfolio activity of any underlying Fidelity Central Funds.
See accompanying notes which are an integral part of the financial statements.
Fidelity International Small Cap Opportunities Fund Class M
| Years ended October 31, | 2018 | 2017 | 2016 | 2015 | 2014 |
| Selected Per–Share Data | | | | | |
| Net asset value, beginning of period | $18.32 | $14.68 | $14.62 | $13.53 | $13.56 |
| Income from Investment Operations | | | | | |
| Net investment income (loss)A | .07 | .05 | .04 | .01 | .01 |
| Net realized and unrealized gain (loss) | (.92) | 3.69 | .10 | 1.11 | .06 |
| Total from investment operations | (.85) | 3.74 | .14 | 1.12 | .07 |
| Distributions from net investment income | (.06) | (.06) | (.01) | (.01) | (.02) |
| Distributions from net realized gain | (.24) | (.04) | (.07) | (.02) | (.08) |
| Total distributions | (.30) | (.10) | (.08) | (.03) | (.10) |
| Redemption fees added to paid in capitalA,B | – | – | – | – | – |
| Net asset value, end of period | $17.17 | $18.32 | $14.68 | $14.62 | $13.53 |
| Total ReturnC,D | (4.74)% | 25.63% | .95% | 8.27% | .55% |
| Ratios to Average Net AssetsE,F | | | | | |
| Expenses before reductions | 1.67% | 1.73% | 1.77% | 1.80% | 1.89% |
| Expenses net of fee waivers, if any | 1.67% | 1.73% | 1.77% | 1.80% | 1.89% |
| Expenses net of all reductions | 1.66% | 1.73% | 1.77% | 1.80% | 1.89% |
| Net investment income (loss) | .36% | .31% | .30% | .10% | .07% |
| Supplemental Data | | | | | |
| Net assets, end of period (000 omitted) | $13,245 | $14,422 | $12,308 | $13,296 | $9,913 |
| Portfolio turnover rateG | 19% | 11% | 24% | 21% | 18% |
A Calculated based on average shares outstanding during the period.
B Amount represents less than $.005 per share.
C Total returns would have been lower if certain expenses had not been reduced during the applicable periods shown.
D Total returns do not include the effect of the sales charges.
E Fees and expenses of any underlying Fidelity Central Funds are not included in the Fund's expense ratio. The Fund indirectly bears its proportionate share of the expenses of any underlying Fidelity Central Funds.
F Expense ratios reflect operating expenses of the class. Expenses before reductions do not reflect amounts reimbursed by the investment adviser or reductions from brokerage service arrangements or reductions from other expense offset arrangements and do not represent the amount paid by the class during periods when reimbursements or reductions occur. Expenses net of fee waivers reflect expenses after reimbursement by the investment adviser but prior to reductions from brokerage service arrangements or other expense offset arrangements. Expenses net of all reductions represent the net expenses paid by the class.
G Amount does not include the portfolio activity of any underlying Fidelity Central Funds.
See accompanying notes which are an integral part of the financial statements.
Fidelity International Small Cap Opportunities Fund Class C
| Years ended October 31, | 2018 | 2017 | 2016 | 2015 | 2014 |
| Selected Per–Share Data | | | | | |
| Net asset value, beginning of period | $17.84 | $14.27 | $14.26 | $13.23 | $13.28 |
| Income from Investment Operations | | | | | |
| Net investment income (loss)A | (.02) | (.03) | (.03) | (.05) | (.06) |
| Net realized and unrealized gain (loss) | (.89) | 3.60 | .09 | 1.08 | .06 |
| Total from investment operations | (.91) | 3.57 | .06 | 1.03 | – |
| Distributions from net investment income | – | – | – | – | – |
| Distributions from net realized gain | (.24) | – | (.05) | – | (.05) |
| Total distributions | (.24) | – | (.05) | – | (.05) |
| Redemption fees added to paid in capitalA,B | – | – | – | – | – |
| Net asset value, end of period | $16.69 | $17.84 | $14.27 | $14.26 | $13.23 |
| Total ReturnC,D | (5.19)% | 25.02% | .44% | 7.79% | .03% |
| Ratios to Average Net AssetsE,F | | | | | |
| Expenses before reductions | 2.15% | 2.22% | 2.26% | 2.27% | 2.38% |
| Expenses net of fee waivers, if any | 2.15% | 2.22% | 2.26% | 2.27% | 2.38% |
| Expenses net of all reductions | 2.14% | 2.21% | 2.25% | 2.26% | 2.38% |
| Net investment income (loss) | (.12)% | (.17)% | (.19)% | (.36)% | (.42)% |
| Supplemental Data | | | | | |
| Net assets, end of period (000 omitted) | $14,461 | $14,547 | $12,625 | $17,370 | $8,438 |
| Portfolio turnover rateG | 19% | 11% | 24% | 21% | 18% |
A Calculated based on average shares outstanding during the period.
B Amount represents less than $.005 per share.
C Total returns would have been lower if certain expenses had not been reduced during the applicable periods shown.
D Total returns do not include the effect of the contingent deferred sales charge.
E Fees and expenses of any underlying Fidelity Central Funds are not included in the Fund's expense ratio. The Fund indirectly bears its proportionate share of the expenses of any underlying Fidelity Central Funds.
F Expense ratios reflect operating expenses of the class. Expenses before reductions do not reflect amounts reimbursed by the investment adviser or reductions from brokerage service arrangements or reductions from other expense offset arrangements and do not represent the amount paid by the class during periods when reimbursements or reductions occur. Expenses net of fee waivers reflect expenses after reimbursement by the investment adviser but prior to reductions from brokerage service arrangements or other expense offset arrangements. Expenses net of all reductions represent the net expenses paid by the class.
G Amount does not include the portfolio activity of any underlying Fidelity Central Funds.
See accompanying notes which are an integral part of the financial statements.
Fidelity International Small Cap Opportunities Fund
| Years ended October 31, | 2018 | 2017 | 2016 | 2015 | 2014 |
| Selected Per–Share Data | | | | | |
| Net asset value, beginning of period | $18.69 | $15.00 | $14.91 | $13.80 | $13.82 |
| Income from Investment Operations | | | | | |
| Net investment income (loss)A | .18 | .15 | .13 | .10 | .09 |
| Net realized and unrealized gain (loss) | (.95) | 3.75 | .11 | 1.12 | .06 |
| Total from investment operations | (.77) | 3.90 | .24 | 1.22 | .15 |
| Distributions from net investment income | (.15) | (.17) | (.08) | (.09) | (.09) |
| Distributions from net realized gain | (.24) | (.04) | (.07) | (.02) | (.08) |
| Total distributions | (.39) | (.21) | (.15) | (.11) | (.17) |
| Redemption fees added to paid in capitalA,B | – | – | – | – | – |
| Net asset value, end of period | $17.53 | $18.69 | $15.00 | $14.91 | $13.80 |
| Total ReturnC | (4.25)% | 26.39% | 1.58% | 8.92% | 1.11% |
| Ratios to Average Net AssetsD,E | | | | | |
| Expenses before reductions | 1.10% | 1.13% | 1.17% | 1.23% | 1.30% |
| Expenses net of fee waivers, if any | 1.10% | 1.13% | 1.17% | 1.22% | 1.30% |
| Expenses net of all reductions | 1.09% | 1.13% | 1.16% | 1.22% | 1.30% |
| Net investment income (loss) | .93% | .91% | .90% | .68% | .65% |
| Supplemental Data | | | | | |
| Net assets, end of period (000 omitted) | $965,482 | $916,882 | $809,952 | $762,563 | $584,253 |
| Portfolio turnover rateF | 19% | 11% | 24% | 21% | 18% |
A Calculated based on average shares outstanding during the period.
B Amount represents less than $.005 per share.
C Total returns would have been lower if certain expenses had not been reduced during the applicable periods shown.
D Fees and expenses of any underlying Fidelity Central Funds are not included in the Fund's expense ratio. The Fund indirectly bears its proportionate share of the expenses of any underlying Fidelity Central Funds.
E Expense ratios reflect operating expenses of the class. Expenses before reductions do not reflect amounts reimbursed by the investment adviser or reductions from brokerage service arrangements or reductions from other expense offset arrangements and do not represent the amount paid by the class during periods when reimbursements or reductions occur. Expenses net of fee waivers reflect expenses after reimbursement by the investment adviser but prior to reductions from brokerage service arrangements or other expense offset arrangements. Expenses net of all reductions represent the net expenses paid by the class.
F Amount does not include the portfolio activity of any underlying Fidelity Central Funds.
See accompanying notes which are an integral part of the financial statements.
Fidelity International Small Cap Opportunities Fund Class I
| Years ended October 31, | 2018 | 2017 | 2016 | 2015 | 2014 |
| Selected Per–Share Data | | | | | |
| Net asset value, beginning of period | $18.66 | $14.99 | $14.91 | $13.81 | $13.83 |
| Income from Investment Operations | | | | | |
| Net investment income (loss)A | .18 | .15 | .13 | .10 | .08 |
| Net realized and unrealized gain (loss) | (.94) | 3.74 | .10 | 1.13 | .07 |
| Total from investment operations | (.76) | 3.89 | .23 | 1.23 | .15 |
| Distributions from net investment income | (.15) | (.18) | (.08) | (.11) | (.09) |
| Distributions from net realized gain | (.24) | (.04) | (.07) | (.02) | (.08) |
| Total distributions | (.39) | (.22) | (.15) | (.13) | (.17) |
| Redemption fees added to paid in capitalA,B | – | – | – | – | – |
| Net asset value, end of period | $17.51 | $18.66 | $14.99 | $14.91 | $13.81 |
| Total ReturnC | (4.21)% | 26.34% | 1.56% | 8.98% | 1.11% |
| Ratios to Average Net AssetsD,E | | | | | |
| Expenses before reductions | 1.12% | 1.14% | 1.16% | 1.19% | 1.36% |
| Expenses net of fee waivers, if any | 1.12% | 1.14% | 1.16% | 1.19% | 1.36% |
| Expenses net of all reductions | 1.11% | 1.14% | 1.16% | 1.18% | 1.36% |
| Net investment income (loss) | .91% | .90% | .91% | .71% | .60% |
| Supplemental Data | | | | | |
| Net assets, end of period (000 omitted) | $159,968 | $164,878 | $155,551 | $120,723 | $29,822 |
| Portfolio turnover rateF | 19% | 11% | 24% | 21% | 18% |
A Calculated based on average shares outstanding during the period.
B Amount represents less than $.005 per share.
C Total returns would have been lower if certain expenses had not been reduced during the applicable periods shown.
D Fees and expenses of any underlying Fidelity Central Funds are not included in the Fund's expense ratio. The Fund indirectly bears its proportionate share of the expenses of any underlying Fidelity Central Funds.
E Expense ratios reflect operating expenses of the class. Expenses before reductions do not reflect amounts reimbursed by the investment adviser or reductions from brokerage service arrangements or reductions from other expense offset arrangements and do not represent the amount paid by the class during periods when reimbursements or reductions occur. Expenses net of fee waivers reflect expenses after reimbursement by the investment adviser but prior to reductions from brokerage service arrangements or other expense offset arrangements. Expenses net of all reductions represent the net expenses paid by the class.
F Amount does not include the portfolio activity of any underlying Fidelity Central Funds.
See accompanying notes which are an integral part of the financial statements.
Fidelity International Small Cap Opportunities Fund Class Z
| Year ended October 31, | 2018 A |
| Selected Per–Share Data | |
| Net asset value, beginning of period | $19.11 |
| Income from Investment Operations | |
| Net investment income (loss)B | –C |
| Net realized and unrealized gain (loss) | (1.60) |
| Total from investment operations | (1.60) |
| Distributions from net investment income | – |
| Distributions from net realized gain | – |
| Total distributions | – |
| Net asset value, end of period | $17.51 |
| Total ReturnD,E | (8.37)% |
| Ratios to Average Net AssetsF,G | |
| Expenses before reductions | 1.03%H |
| Expenses net of fee waivers, if any | 1.03%H |
| Expenses net of all reductions | 1.02%H |
| Net investment income (loss) | .16%H |
| Supplemental Data | |
| Net assets, end of period (000 omitted) | $4,617 |
| Portfolio turnover rateI | 19% |
A For the period October 2, 2018 (commencement of sale of shares) to October 31, 2018.
B Calculated based on average shares outstanding during the period.
C Amount represents less than $.005 per share.
D Total returns for periods of less than one year are not annualized.
E Total returns would have been lower if certain expenses had not been reduced during the applicable periods shown.
F Fees and expenses of any underlying Fidelity Central Funds are not included in the Fund's expense ratio. The Fund indirectly bears its proportionate share of the expenses of any underlying Fidelity Central Funds.
G Expense ratios reflect operating expenses of the class. Expenses before reductions do not reflect amounts reimbursed by the investment adviser or reductions from brokerage service arrangements or reductions from other expense offset arrangements and do not represent the amount paid by the class during periods when reimbursements or reductions occur. Expense ratios before reductions for start-up periods may not be representative of longer-term operating periods. Expenses net of fee waivers reflect expenses after reimbursement by the investment adviser but prior to reductions from brokerage service arrangements or other expense offset arrangements. Expenses net of all reductions represent the net expenses paid by the class.
H Annualized
I Amount does not include the portfolio activity of any underlying Fidelity Central Funds.
See accompanying notes which are an integral part of the financial statements.
Notes to Financial Statements
For the period ended October 31, 2018
1. Organization.
Fidelity International Small Cap Opportunities Fund (the Fund) is a fund of Fidelity Investment Trust (the Trust) and is authorized to issue an unlimited number of shares. The Trust is registered under the Investment Company Act of 1940, as amended (the 1940 Act), as an open-end management investment company organized as a Massachusetts business trust. The Fund commenced sale of Class Z shares on October 2, 2018. The Fund offers Class A, Class M, Class C, International Small Cap Opportunities, Class I and Class Z shares, each of which has equal rights as to assets and voting privileges. Each class has exclusive voting rights with respect to matters that affect that class.
2. Investments in Fidelity Central Funds.
The Fund invests in Fidelity Central Funds, which are open-end investment companies generally available only to other investment companies and accounts managed by the investment adviser and its affiliates. The Fund's Schedule of Investments lists each of the Fidelity Central Funds held as of period end, if any, as an investment of the Fund, but does not include the underlying holdings of each Fidelity Central Fund. As an Investing Fund, the Fund indirectly bears its proportionate share of the expenses of the underlying Fidelity Central Funds.
The Money Market Central Funds seek preservation of capital and current income and are managed by Fidelity Investments Money Management, Inc. (FIMM), an affiliate of the investment adviser. Annualized expenses of the Money Market Central Funds as of their most recent shareholder report date are less than .005%.
A complete unaudited list of holdings for each Fidelity Central Fund is available upon request or at the Securities and Exchange Commission (the SEC) website at www.sec.gov. In addition, the financial statements of the Fidelity Central Funds, which are not covered by the Fund's Report of Independent Registered Public Accounting Firm, are available on the SEC website or upon request.
3. Significant Accounting Policies.
The Fund is an investment company and applies the accounting and reporting guidance of the Financial Accounting Standards Board (FASB) Accounting Standards Codification Topic 946 Financial Services – Investments Companies. The financial statements have been prepared in conformity with accounting principles generally accepted in the United States of America (GAAP), which require management to make certain estimates and assumptions at the date of the financial statements. Actual results could differ from those estimates. Subsequent events, if any, through the date that the financial statements were issued have been evaluated in the preparation of the financial statements. The following summarizes the significant accounting policies of the Fund:
Investment Valuation. Investments are valued as of 4:00 p.m. Eastern time on the last calendar day of the period. The Board of Trustees (the Board) has delegated the day to day responsibility for the valuation of the Fund's investments to the Fair Value Committee (the Committee) established by the Fund's investment adviser. In accordance with valuation policies and procedures approved by the Board, the Fund attempts to obtain prices from one or more third party pricing vendors or brokers to value its investments. When current market prices, quotations or currency exchange rates are not readily available or reliable, investments will be fair valued in good faith by the Committee, in accordance with procedures adopted by the Board. Factors used in determining fair value vary by investment type and may include market or investment specific events. The frequency with which these procedures are used cannot be predicted and they may be utilized to a significant extent. The Committee oversees the Fund's valuation policies and procedures and reports to the Board on the Committee's activities and fair value determinations. The Board monitors the appropriateness of the procedures used in valuing the Fund's investments and ratifies the fair value determinations of the Committee.
The Fund categorizes the inputs to valuation techniques used to value its investments into a disclosure hierarchy consisting of three levels as shown below:
- Level 1 – quoted prices in active markets for identical investments
- Level 2 – other significant observable inputs (including quoted prices for similar investments, interest rates, prepayment speeds, etc.)
- Level 3 – unobservable inputs (including the Fund's own assumptions based on the best information available)
Valuation techniques used to value the Fund's investments by major category are as follows:
Equity securities, including restricted securities, for which market quotations are readily available, are valued at the last reported sale price or official closing price as reported by a third party pricing vendor on the primary market or exchange on which they are traded and are categorized as Level 1 in the hierarchy. In the event there were no sales during the day or closing prices are not available, securities are valued at the last quoted bid price or may be valued using the last available price and are generally categorized as Level 2 in the hierarchy. For foreign equity securities, when market or security specific events arise, comparisons to the valuation of American Depositary Receipts (ADRs), futures contracts, Exchange-Traded Funds (ETFs) and certain indexes as well as quoted prices for similar securities may be used and would be categorized as Level 2 in the hierarchy. Utilizing these techniques may result in transfers between Level 1 and Level 2. For equity securities, including restricted securities, where observable inputs are limited, assumptions about market activity and risk are used and these securities may be categorized as Level 3 in the hierarchy.
ETFs are valued at their last sale price or official closing price as reported by a third party pricing vendor on the primary market or exchange on which they are traded and are categorized as Level 1 in the hierarchy. In the event there were no sales during the day but the exchange reports a closing bid level, ETFs are valued at the closing bid and would be categorized as Level 1 in the hierarchy. In the event there was no closing bid, ETFs may be valued by another method that the Board believes reflects fair value in accordance with the Board's fair value pricing policies and may be categorized as Level 2 in the hierarchy.
Investments in open-end mutual funds, including the Fidelity Central Funds, are valued at their closing net asset value (NAV) each business day and are categorized as Level 1 in the hierarchy.
Changes in valuation techniques may result in transfers in or out of an assigned level within the disclosure hierarchy. The aggregate value of investments by input level as of October 31, 2018 including information on transfers between Levels 1 and 2, as well as a roll forward of Level 3 investments, is included at the end of the Fund's Schedule of Investments.
Foreign Currency. The Fund may use foreign currency contracts to facilitate transactions in foreign-denominated securities. Gains and losses from these transactions may arise from changes in the value of the foreign currency or if the counterparties do not perform under the contracts' terms.
Foreign-denominated assets, including investment securities, and liabilities are translated into U.S. dollars at the exchange rates at period end. Purchases and sales of investment securities, income and dividends received and expenses denominated in foreign currencies are translated into U.S. dollars at the exchange rate in effect on the transaction date.
The effects of exchange rate fluctuations on investments are included with the net realized and unrealized gain (loss) on investment securities. Other foreign currency transactions resulting in realized and unrealized gain (loss) are disclosed separately.
Investment Transactions and Income. For financial reporting purposes, the Fund's investment holdings and NAV include trades executed through the end of the last business day of the period. The NAV per share for processing shareholder transactions is calculated as of the close of business of the New York Stock Exchange (NYSE), normally 4:00 p.m. Eastern time and includes trades executed through the end of the prior business day. Gains and losses on securities sold are determined on the basis of identified cost and include proceeds received from litigation. Dividend income is recorded on the ex-dividend date, except for certain dividends from foreign securities where the ex-dividend date may have passed, which are recorded as soon as the Fund is informed of the ex-dividend date. Non-cash dividends included in dividend income, if any, are recorded at the fair market value of the securities received. Income and capital gain distributions from Fidelity Central Funds, if any, are recorded on the ex-dividend date. Certain distributions received by the Fund represent a return of capital or capital gain. The Fund determines the components of these distributions subsequent to the ex-dividend date, based upon receipt of tax filings or other correspondence relating to the underlying investment. These distributions are recorded as a reduction of cost of investments and/or as a realized gain. Investment income is recorded net of foreign taxes withheld where recovery of such taxes is uncertain.
Class Allocations and Expenses. Investment income, realized and unrealized capital gains and losses, common expenses of the Fund, and certain fund-level expense reductions, if any, are allocated daily on a pro-rata basis to each class based on the relative net assets of each class to the total net assets of the Fund. Each class differs with respect to transfer agent and distribution and service plan fees incurred. Certain expense reductions may also differ by class. For the reporting period, the allocated portion of income and expenses to each class as a percent of its average net assets may vary due to the timing of recording these transactions in relation to fluctuating net assets of the classes. Expenses directly attributable to a fund are charged to that fund. Expenses attributable to more than one fund are allocated among the respective funds on the basis of relative net assets or other appropriate methods. Expense estimates are accrued in the period to which they relate and adjustments are made when actual amounts are known.
Income Tax Information and Distributions to Shareholders. Each year, the Fund intends to qualify as a regulated investment company under Subchapter M of the Internal Revenue Code, including distributing substantially all of its taxable income and realized gains. As a result, no provision for U.S. Federal income taxes is required. As of October 31, 2018, the Fund did not have any unrecognized tax benefits in the financial statements; nor is the Fund aware of any tax positions for which it is reasonably possible that the total amounts of unrecognized tax benefits will significantly change in the next twelve months. The Fund files a U.S. federal tax return, in addition to state and local tax returns as required. The Fund's federal income tax returns are subject to examination by the Internal Revenue Service (IRS) for a period of three fiscal years after they are filed. State and local tax returns may be subject to examination for an additional fiscal year depending on the jurisdiction. Foreign taxes are provided for based on the Fund's understanding of the tax rules and rates that exist in the foreign markets in which it invests. The Fund is subject to a tax imposed on capital gains by certain countries in which it invests. An estimated deferred tax liability for net unrealized appreciation on the applicable securities is included in Other payables and accrued expenses on the Statement of Assets & Liabilities.
Distributions are declared and recorded on the ex-dividend date. Income and capital gain distributions are declared separately for each class. Income and capital gain distributions are determined in accordance with income tax regulations, which may differ from GAAP.
Capital accounts within the financial statements are adjusted for permanent book-tax differences. These adjustments have no impact on net assets or the results of operations. Capital accounts are not adjusted for temporary book-tax differences which will reverse in a subsequent period.
Book-tax differences are primarily due to foreign currency transactions, passive foreign investment companies (PFIC) and losses deferred due to wash sales.
As of period end, the cost and unrealized appreciation (depreciation) in securities, and derivatives if applicable, for federal income tax purposes were as follows:
| Gross unrealized appreciation | $252,708,344 |
| Gross unrealized depreciation | (98,145,275) |
| Net unrealized appreciation (depreciation) | $154,563,069 |
| Tax Cost | $1,044,065,812 |
The tax-based components of distributable earnings as of period end were as follows:
| Undistributed ordinary income | $11,992,475 |
| Undistributed long-term capital gain | $19,946,356 |
| Net unrealized appreciation (depreciation) on securities and other investments | $154,514,759 |
The tax character of distributions paid was as follows:
| | October 31, 2018 | October 31, 2017 |
| Ordinary Income | $23,288,503 | $ 13,190,549 |
Short-Term Trading (Redemption) Fees. During the period, shares held by investors in the Fund less than 90 days may have been subject to a redemption fee equal to 2.00% of the NAV of shares redeemed. All redemption fees, which reduce the proceeds of the shareholder redemption, are retained by the Fund and accounted for as an addition to paid in capital. In November 2017, the Board of Trustees approved the elimination of these redemption fees effective December 18, 2017.
Restricted Securities. The Fund may invest in securities that are subject to legal or contractual restrictions on resale. These securities generally may be resold in transactions exempt from registration or to the public if the securities are registered. Disposal of these securities may involve time-consuming negotiations and expense, and prompt sale at an acceptable price may be difficult. Information regarding restricted securities is included at the end of the Fund's Schedule of Investments.
New Rule Issuance. During August 2018, the U.S. Securities and Exchange Commission issued Final Rule Release No. 33-10532, Disclosure Update and Simplification. This Final Rule includes amendments specific to registered investment companies that are intended to eliminate overlap in disclosure requirements between Regulation S-X and GAAP. In accordance with these amendments, certain line-items in the Fund's financial statements have been combined or removed for the current period as outlined in the table below.
| Financial Statement | Current Line-Item Presentation | Prior Line-Item Presentation |
| Statement of Assets and Liabilities | Total distributable earnings (loss) | Undistributed/Distributions in excess of/Accumulated net investment income (loss)
Accumulated/Undistributed net realized gain (loss)
Net unrealized appreciation (depreciation) |
| Statement of Changes in Net Assets | N/A - removed | Undistributed/Distributions in excess of/Accumulated net investment income (loss) end of period |
| Statement of Changes in Net Assets | Distributions to shareholders | Distributions to shareholders from net investment income
Distributions to shareholders from net realized gain |
| Distributions to Shareholders Note to Financial Statements | Distributions to shareholders | Distributions to shareholders from net investment income
Distributions to shareholders from net realized gain |
4. Purchases and Sales of Investments.
Purchases and sales of securities, other than short-term securities, aggregated $323,088,886 and $231,920,121, respectively.
5. Fees and Other Transactions with Affiliates.
Management Fee. Fidelity Management & Research Company (the investment adviser) and its affiliates provide the Fund with investment management related services for which the Fund pays a monthly management fee. The management fee is the sum of an individual fund fee rate that is based on an annual rate of .60% of the Fund's average net assets and an annualized group fee rate that averaged .24% during the period. The group fee rate is based upon the average net assets of all the mutual funds advised by the investment adviser, including any mutual funds previously advised by the investment adviser that are currently advised by Fidelity SelectCo, LLC, an affiliate of the investment adviser. The group fee rate decreases as assets under management increase and increases as assets under management decrease. In addition, the management fee is subject to a performance adjustment (up to a maximum of +/- .20% of the Fund's average net assets over a 36 month performance period). The upward or downward adjustment to the management fee is based on the relative investment performance of International Small Cap Opportunities as compared to its benchmark index, the MSCI EAFE Small Cap Index, over the same 36 month performance period. For the reporting period, the total annual management fee rate, including the performance adjustment, was .83% of the Fund's average net assets. The performance adjustment included in the management fee rate may be higher or lower than the maximum performance adjustment rate due to the difference between the average net assets for the reporting and performance periods.
Distribution and Service Plan Fees. In accordance with Rule 12b-1 of the 1940 Act, the Fund has adopted separate Distribution and Service Plans for each class of shares. Certain classes pay Fidelity Distributors Corporation (FDC), an affiliate of the investment adviser, separate Distribution and Service Fees, each of which is based on an annual percentage of each class' average net assets. In addition, FDC may pay financial intermediaries for selling shares of the Fund and providing shareholder support services. For the period, the Distribution and Service Fee rates, total fees and amounts retained by FDC were as follows:
| | Distribution Fee | Service Fee | Total Fees | Retained by FDC |
| Class A | -% | .25% | $114,904 | $4,506 |
| Class M | .25% | .25% | 76,670 | 1,966 |
| Class C | .75% | .25% | 166,573 | 24,547 |
| | | | $358,147 | $31,019 |
Sales Load. FDC may receive a front-end sales charge of up to 5.75% for selling Class A shares and 3.50% for selling Class M shares, some of which is paid to financial intermediaries for selling shares of the Fund. Depending on the holding period, FDC may receive contingent deferred sales charges levied on Class A, Class M and Class C redemptions. The deferred sales charges are 1.00% for Class C shares, 1.00% for certain purchases of Class A shares and .25% for certain purchases of Class M shares.
For the period, sales charge amounts retained by FDC were as follows:
| | Retained by FDC |
| Class A | $21,917 |
| Class M | 4,238 |
| Class C(a) | 4,114 |
| | $30,269 |
(a) When Class C shares are initially sold, FDC pays commissions from its own resources to financial intermediaries through which the sales are made.
Transfer Agent Fees. Fidelity Investments Institutional Operations Company, Inc., (FIIOC), an affiliate of the investment adviser, is the transfer, dividend disbursing and shareholder servicing agent for each class of the Fund. FIIOC receives account fees and asset-based fees that vary according to the account size and type of account of the shareholders of the respective classes of the Fund, except for Class Z. FIIOC receives an asset-based fee of Class Z's average net assets. FIIOC pays for typesetting, printing and mailing of shareholder reports, except proxy statements.
For the period, transfer agent fees for each class were as follows:
| | Amount | % of Class-Level Average Net Assets |
| Class A | $103,952 | .23 |
| Class M | 40,173 | .26 |
| Class C | 40,793 | .24 |
| International Small Cap Opportunities | 1,948,710 | .19 |
| Class I | 412,319 | .21 |
| Class Z | 27 | .04(a) |
| | $2,545,974 | |
(a) Annualized
Accounting and Security Lending Fees. Fidelity Service Company, Inc. (FSC), an affiliate of the investment adviser, maintains the Fund's accounting records. The accounting fee is based on the level of average net assets for each month. Under a separate contract, FSC administers the security lending program. The security lending fee is based on the number and duration of lending transactions. For the period, the fees were equivalent to an annual rate of .05%.
Brokerage Commissions. The Fund placed a portion of its portfolio transactions with brokerage firms which are affiliates of the investment adviser. Brokerage commissions are included in net realized gain (loss) and change in net unrealized appreciation (depreciation) in the Statement of Operations. The commissions paid to these affiliated firms were $508 for the period.
Interfund Trades. The Fund may purchase from or sell securities to other Fidelity Funds under procedures adopted by the Board. The procedures have been designed to ensure these interfund trades are executed in accordance with Rule 17a-7 of the 1940 Act. Interfund trades are included within the respective purchases and sales amounts shown in the Purchases and Sales of Investments note.
6. Committed Line of Credit.
The Fund participates with other funds managed by the investment adviser or an affiliate in a $4.25 billion credit facility (the "line of credit") to be utilized for temporary or emergency purposes to fund shareholder redemptions or for other short-term liquidity purposes. The Fund has agreed to pay commitment fees on its pro-rata portion of the line of credit, which amounted to $3,433 and is reflected in Miscellaneous expenses on the Statement of Operations. During the period, the Fund did not borrow on this line of credit.
7. Security Lending.
The Fund lends portfolio securities through a lending agent from time to time in order to earn additional income. For equity securities, a lending agent is used and may loan securities to certain qualified borrowers, including Fidelity Capital Markets (FCM), a broker-dealer affiliated with the Fund. On the settlement date of the loan, the Fund receives collateral (in the form of U.S. Treasury obligations, letters of credit and/or cash) against the loaned securities and maintains collateral in an amount not less than 100% of the market value of the loaned securities during the period of the loan. The market value of the loaned securities is determined at the close of business of the Fund and any additional required collateral is delivered to the Fund on the next business day. The Fund or borrower may terminate the loan at any time, and if the borrower defaults on its obligation to return the securities loaned because of insolvency or other reasons, the Fund may apply collateral received from the borrower against the obligation. The Fund may experience delays and costs in recovering the securities loaned. Any cash collateral received is invested in the Fidelity Securities Lending Cash Central Fund. The value of loaned securities and cash collateral at period end are disclosed on the Fund's Statement of Assets and Liabilities. At period end, there were no security loans outstanding with FCM. Security lending income represents the income earned on investing cash collateral, less rebates paid to borrowers and any lending agent fees associated with the loan, plus any premium payments received for lending certain types of securities. Security lending income is presented in the Statement of Operations as a component of income from Fidelity Central Funds. Total security lending income during the period amounted to $112,732, including $171 from securities loaned to FCM.
8. Expense Reductions.
Commissions paid to certain brokers with whom the investment adviser, or its affiliates, places trades on behalf of the Fund include an amount in addition to trade execution, which may be rebated back to the Fund to offset certain expenses. This amount totaled $71,803 for the period. Through arrangements with the Fund's custodian, credits realized as a result of certain uninvested cash balances were used to reduce the Fund's expenses. During the period, these credits reduced the Fund's custody expenses by $372.
In addition, during the period the investment adviser reimbursed and/or waived a portion of fund-level operating expenses in the amount of $11,544.
9. Distributions to Shareholders.
Distributions to shareholders of each class were as follows:
| | Year ended
October 31, 2018 | Year ended
October 31, 2017 |
| Distributions to shareholders | | |
| Class A | $756,833 | $– |
| Class M | 237,606 | – |
| Class C | 199,761 | – |
| International Small Cap Opportunities | 18,505,353 | – |
| Class I | 3,588,950 | – |
| Total | $23,288,503 | $– |
| From net investment income | | |
| Class A | $– | $345,589 |
| Class M | – | 44,101 |
| International Small Cap Opportunities | – | 8,436,166 |
| Class I | – | 1,798,182 |
| Total | $– | $10,624,038 |
| From net realized gain | | |
| Class A | $– | $117,149 |
| Class M | – | 32,073 |
| International Small Cap Opportunities | – | 2,008,611 |
| Class I | – | 408,678 |
| Total | $– | $2,566,511 |
10. Share Transactions.
Share transactions for each class were as follows and may contain automatic conversions between classes or exchanges between affiliated funds:
| | Shares | Shares | Dollars | Dollars |
| | Year ended October 31, 2018(a) | Year ended October 31, 2017 | Year ended October 31, 2018(a) | Year ended October 31, 2017 |
| Class A | | | | |
| Shares sold | 659,827 | 617,618 | $12,815,405 | $9,892,785 |
| Reinvestment of distributions | 39,412 | 30,743 | 734,649 | 441,465 |
| Shares redeemed | (560,866) | (1,457,378) | (10,795,406) | (22,890,236) |
| Net increase (decrease) | 138,373 | (809,017) | $2,754,648 | $(12,555,986) |
| Class M | | | | |
| Shares sold | 195,023 | 184,978 | $3,737,868 | $3,117,188 |
| Reinvestment of distributions | 12,748 | 5,229 | 235,975 | 74,674 |
| Shares redeemed | (223,377) | (241,247) | (4,246,469) | (3,797,029) |
| Net increase (decrease) | (15,606) | (51,040) | $(272,626) | $(605,167) |
| Class C | | | | |
| Shares sold | 289,466 | 166,898 | $5,517,711 | $2,711,727 |
| Reinvestment of distributions | 10,900 | – | 196,970 | – |
| Shares redeemed | (248,989) | (236,034) | (4,607,733) | (3,599,444) |
| Net increase (decrease) | 51,377 | (69,136) | $1,106,948 | $(887,717) |
| International Small Cap Opportunities | | | | |
| Shares sold | 18,665,452 | 8,291,089 | $367,097,669 | $139,007,305 |
| Reinvestment of distributions | 814,355 | 594,332 | 15,335,912 | 8,611,863 |
| Shares redeemed | (13,474,898) | (13,816,436) | (259,980,891) | (218,659,907) |
| Net increase (decrease) | 6,004,909 | (4,931,015) | $122,452,690 | $(71,040,739) |
| Class I | | | | |
| Shares sold | 5,599,350 | 4,860,065 | $109,721,452 | $80,212,539 |
| Reinvestment of distributions | 153,156 | 138,286 | 2,881,165 | 2,000,992 |
| Shares redeemed | (5,449,347) | (6,539,728) | (104,456,236) | (105,770,110) |
| Net increase (decrease) | 303,159 | (1,541,377) | $8,146,381 | $(23,556,579) |
| Class Z | | | | |
| Shares sold | 265,126 | – | $4,637,404 | $– |
| Shares redeemed | (1,385) | – | (23,812) | – |
| Net increase (decrease) | 263,741 | – | $4,613,592 | $– |
(a) Share transactions for Class Z are for the period October 2, 2018 (commencement of sale of shares) to October 31, 2018
11. Other.
The Fund's organizational documents provide former and current trustees and officers with a limited indemnification against liabilities arising in connection with the performance of their duties to the Fund. In the normal course of business, the Fund may also enter into contracts that provide general indemnifications. The Fund's maximum exposure under these arrangements is unknown as this would be dependent on future claims that may be made against the Fund. The risk of material loss from such claims is considered remote.
Report of Independent Registered Public Accounting Firm
To the Trustees of Fidelity Investment Trust and Shareholders of Fidelity International Small Cap Opportunities Fund:
Opinion on the Financial Statements and Financial Highlights
We have audited the accompanying statement of assets and liabilities of Fidelity International Small Cap Opportunities Fund (the "Fund"), a fund of Fidelity Investment Trust, including the schedule of investments, as of October 31, 2018, and the related statement of operations for the year then ended, the statement of changes in net assets for each of the two years in the period then ended, the financial highlights for each of the five years in the period then ended, and the related notes. In our opinion, the financial statements and financial highlights present fairly, in all material respects, the financial position of the Fund as of October 31, 2018, and the results of its operations for the year then ended, the changes in its net assets for each of the two years in the period then ended, and the financial highlights for each of the five years in the period then ended, in conformity with accounting principles generally accepted in the United States of America.
Basis for Opinion
These financial statements and financial highlights are the responsibility of the Fund's management. Our responsibility is to express an opinion on the Fund's financial statements and financial highlights based on our audits. We are a public accounting firm registered with the Public Company Accounting Oversight Board (United States) (PCAOB) and are required to be independent with respect to the Fund in accordance with the U.S. federal securities laws and the applicable rules and regulations of the Securities and Exchange Commission and the PCAOB.
We conducted our audits in accordance with the standards of the PCAOB. Those standards require that we plan and perform the audit to obtain reasonable assurance about whether the financial statements and financial highlights are free of material misstatement, whether due to error or fraud. The Fund is not required to have, nor were we engaged to perform, an audit of its internal control over financial reporting. As part of our audits we are required to obtain an understanding of internal control over financial reporting but not for the purpose of expressing an opinion on the effectiveness of the Fund’s internal control over financial reporting. Accordingly, we express no such opinion.
Our audits included performing procedures to assess the risks of material misstatement of the financial statements and financial highlights, whether due to error or fraud, and performing procedures that respond to those risks. Such procedures included examining, on a test basis, evidence regarding the amounts and disclosures in the financial statements and financial highlights. Our audits also included evaluating the accounting principles used and significant estimates made by management, as well as evaluating the overall presentation of the financial statements and financial highlights. Our procedures included confirmation of securities owned as of October 31, 2018, by correspondence with the custodians and brokers; when replies were not received from brokers, we performed other auditing procedures. We believe that our audits provide a reasonable basis for our opinion.
/s/ Deloitte & Touche LLP
Boston, Massachusetts
December 13, 2018
We have served as the auditor of one or more of the Fidelity investment companies since 1999.
Trustees and Officers
The Trustees, Members of the Advisory Board (if any), and officers of the trust and fund, as applicable, are listed below. The Board of Trustees governs the fund and is responsible for protecting the interests of shareholders. The Trustees are experienced executives who meet periodically throughout the year to oversee the fund's activities, review contractual arrangements with companies that provide services to the fund, oversee management of the risks associated with such activities and contractual arrangements, and review the fund's performance. Except for Jonathan Chiel, each of the Trustees oversees 283 funds. Mr. Chiel oversees 154 funds.
The Trustees hold office without limit in time except that (a) any Trustee may resign; (b) any Trustee may be removed by written instrument, signed by at least two-thirds of the number of Trustees prior to such removal; (c) any Trustee who requests to be retired or who has become incapacitated by illness or injury may be retired by written instrument signed by a majority of the other Trustees; and (d) any Trustee may be removed at any special meeting of shareholders by a two-thirds vote of the outstanding voting securities of the trust. Each Trustee who is not an interested person (as defined in the 1940 Act) of the trust and the fund is referred to herein as an Independent Trustee. Each Independent Trustee shall retire not later than the last day of the calendar year in which his or her 75th birthday occurs. The Independent Trustees may waive this mandatory retirement age policy with respect to individual Trustees. Officers and Advisory Board Members hold office without limit in time, except that any officer or Advisory Board Member may resign or may be removed by a vote of a majority of the Trustees at any regular meeting or any special meeting of the Trustees. Except as indicated, each individual has held the office shown or other offices in the same company for the past five years.
The fund’s Statement of Additional Information (SAI) includes more information about the Trustees. To request a free copy, call Fidelity at 1-877-208-0098.
Experience, Skills, Attributes, and Qualifications of the Trustees. The Governance and Nominating Committee has adopted a statement of policy that describes the experience, qualifications, attributes, and skills that are necessary and desirable for potential Independent Trustee candidates (Statement of Policy). The Board believes that each Trustee satisfied at the time he or she was initially elected or appointed a Trustee, and continues to satisfy, the standards contemplated by the Statement of Policy. The Governance and Nominating Committee also engages professional search firms to help identify potential Independent Trustee candidates who have the experience, qualifications, attributes, and skills consistent with the Statement of Policy. From time to time, additional criteria based on the composition and skills of the current Independent Trustees, as well as experience or skills that may be appropriate in light of future changes to board composition, business conditions, and regulatory or other developments, have also been considered by the professional search firms and the Governance and Nominating Committee. In addition, the Board takes into account the Trustees' commitment and participation in Board and committee meetings, as well as their leadership of standing and ad hoc committees throughout their tenure.
In determining that a particular Trustee was and continues to be qualified to serve as a Trustee, the Board has considered a variety of criteria, none of which, in isolation, was controlling. The Board believes that, collectively, the Trustees have balanced and diverse experience, qualifications, attributes, and skills, which allow the Board to operate effectively in governing the fund and protecting the interests of shareholders. Information about the specific experience, skills, attributes, and qualifications of each Trustee, which in each case led to the Board's conclusion that the Trustee should serve (or continue to serve) as a trustee of the fund, is provided below.
Board Structure and Oversight Function. James C. Curvey is an interested person and currently serves as Chairman. The Trustees have determined that an interested Chairman is appropriate and benefits shareholders because an interested Chairman has a personal and professional stake in the quality and continuity of services provided to the fund. Independent Trustees exercise their informed business judgment to appoint an individual of their choosing to serve as Chairman, regardless of whether the Trustee happens to be independent or a member of management. The Independent Trustees have determined that they can act independently and effectively without having an Independent Trustee serve as Chairman and that a key structural component for assuring that they are in a position to do so is for the Independent Trustees to constitute a substantial majority for the Board. The Independent Trustees also regularly meet in executive session. Ned C. Lautenbach serves as Chairman of the Independent Trustees and as such (i) acts as a liaison between the Independent Trustees and management with respect to matters important to the Independent Trustees and (ii) with management prepares agendas for Board meetings.
Fidelity® funds are overseen by different Boards of Trustees. The fund's Board oversees Fidelity's high income and certain equity funds, and other Boards oversee Fidelity's investment-grade bond, money market, asset allocation, and other equity funds. The asset allocation funds may invest in Fidelity® funds overseen by the fund's Board. The use of separate Boards, each with its own committee structure, allows the Trustees of each group of Fidelity® funds to focus on the unique issues of the funds they oversee, including common research, investment, and operational issues. On occasion, the separate Boards establish joint committees to address issues of overlapping consequences for the Fidelity® funds overseen by each Board.
The Trustees operate using a system of committees to facilitate the timely and efficient consideration of all matters of importance to the Trustees, the fund, and fund shareholders and to facilitate compliance with legal and regulatory requirements and oversight of the fund's activities and associated risks. The Board, acting through its committees, has charged FMR and its affiliates with (i) identifying events or circumstances the occurrence of which could have demonstrably adverse effects on the fund's business and/or reputation; (ii) implementing processes and controls to lessen the possibility that such events or circumstances occur or to mitigate the effects of such events or circumstances if they do occur; and (iii) creating and maintaining a system designed to evaluate continuously business and market conditions in order to facilitate the identification and implementation processes described in (i) and (ii) above. Because the day-to-day operations and activities of the fund are carried out by or through FMR, its affiliates, and other service providers, the fund's exposure to risks is mitigated but not eliminated by the processes overseen by the Trustees. While each of the Board's committees has responsibility for overseeing different aspects of the fund's activities, oversight is exercised primarily through the Operations, Audit, and Compliance Committees. In addition, the Independent Trustees have worked with Fidelity to enhance the Board's oversight of investment and financial risks, legal and regulatory risks, technology risks, and operational risks, including the development of additional risk reporting to the Board. Appropriate personnel, including but not limited to the fund's Chief Compliance Officer (CCO), FMR's internal auditor, the independent accountants, the fund's Treasurer and portfolio management personnel, make periodic reports to the Board's committees, as appropriate, including an annual review of Fidelity's risk management program for the Fidelity® funds. The responsibilities of each standing committee, including their oversight responsibilities, are described further under "Standing Committees of the Trustees."
Interested Trustees*:
Correspondence intended for a Trustee who is an interested person may be sent to Fidelity Investments, 245 Summer Street, Boston, Massachusetts 02210.
Name, Year of Birth; Principal Occupations and Other Relevant Experience+
Jonathan Chiel (1957)
Year of Election or Appointment: 2016
Trustee
Mr. Chiel also serves as Trustee of other Fidelity® funds. Mr. Chiel is Executive Vice President and General Counsel for FMR LLC (diversified financial services company, 2012-present). Previously, Mr. Chiel served as general counsel (2004-2012) and senior vice president and deputy general counsel (2000-2004) for John Hancock Financial Services; a partner with Choate, Hall & Stewart (1996-2000) (law firm); and an Assistant United States Attorney for the United States Attorney’s Office of the District of Massachusetts (1986-95), including Chief of the Criminal Division (1993-1995). Mr. Chiel is a director on the boards of the Boston Bar Foundation and the Maimonides School.
James C. Curvey (1935)
Year of Election or Appointment: 2007
Trustee
Chairman of the Board of Trustees
Mr. Curvey also serves as Trustee of other Fidelity® funds. Mr. Curvey is Vice Chairman (2007-present) and Director of FMR LLC (diversified financial services company). In addition, Mr. Curvey is an Overseer Emeritus for the Boston Symphony Orchestra, a Director of Artis-Naples, and a Trustee of Brewster Academy in Wolfeboro, New Hampshire. Previously, Mr. Curvey served as a Director of Fidelity Research & Analysis Co. (investment adviser firm, 2009-2018), Director of Fidelity Investments Money Management, Inc. (investment adviser firm, 2009-2014) and a Director of FMR and FMR Co., Inc. (investment adviser firms, 2007-2014).
Charles S. Morrison (1960)
Year of Election or Appointment: 2014
Trustee
Mr. Morrison also serves as Trustee of other funds. He serves as President of Fidelity SelectCo, LLC (investment adviser firm, 2017-present) and Fidelity Management & Research Company (FMR) (investment adviser firm, 2016-present), a Director of Fidelity Investments Money Management, Inc. (FIMM) (investment adviser firm, 2014-present), Director of Fidelity SelectCo, LLC (investment adviser firm, 2014-present), President, Asset Management (2014-present), and is an employee of Fidelity Investments. Previously, Mr. Morrison served as Vice President of Fidelity's Fixed Income and Asset Allocation Funds (2012-2014), President, Fixed Income (2011-2014), Vice President of Fidelity's Money Market Funds (2005-2009), President, Money Market Group Leader of FMR (investment adviser firm, 2009), and Senior Vice President, Money Market Group of FMR (2004-2009). Mr. Morrison also served as Vice President of Fidelity's Bond Funds (2002-2005), certain Balanced Funds (2002-2005), and certain Asset Allocation Funds (2002-2007), and as Senior Vice President (2002-2005) of Fidelity's Bond Division.
* Determined to be an “Interested Trustee” by virtue of, among other things, his or her affiliation with the trust or various entities under common control with FMR.
+ The information includes the Trustee's principal occupation during the last five years and other information relating to the experience, attributes, and skills relevant to the Trustee's qualifications to serve as a Trustee, which led to the conclusion that the Trustee should serve as a Trustee for the fund.
Independent Trustees:
Correspondence intended for an Independent Trustee may be sent to Fidelity Investments, P.O. Box 55235, Boston, Massachusetts 02205-5235.
Name, Year of Birth; Principal Occupations and Other Relevant Experience+
Dennis J. Dirks (1948)
Year of Election or Appointment: 2005
Trustee
Mr. Dirks also serves as Trustee of other Fidelity® funds. Prior to his retirement in May 2003, Mr. Dirks was Chief Operating Officer and a member of the Board of The Depository Trust & Clearing Corporation (DTCC). He also served as President, Chief Operating Officer, and Board member of The Depository Trust Company (DTC) and President and Board member of the National Securities Clearing Corporation (NSCC). In addition, Mr. Dirks served as Chief Executive Officer and Board member of the Government Securities Clearing Corporation, Chief Executive Officer and Board member of the Mortgage-Backed Securities Clearing Corporation, as a Trustee and a member of the Finance Committee of Manhattan College (2005-2008), as a Trustee and a member of the Finance Committee of AHRC of Nassau County (2006-2008), as a member of the Independent Directors Council (IDC) Governing Council (2010-2015), and as a member of the Board of Directors for The Brookville Center for Children’s Services, Inc. (2009-2017). Mr. Dirks is a member of the Finance Committee (2016-present), Board of Directors (2017-present) and Board of Trustees (2018-present) and is Treasurer (2018-present) of the Asolo Repertory Theatre.
Donald F. Donahue (1950)
Year of Election or Appointment: 2018
Trustee
Mr. Donahue also serves as a Trustee of other Fidelity® funds. Mr. Donahue is President and Chief Executive Officer of Miranda Partners, LLC (risk consulting for the financial services industry, 2012-present). Previously, Mr. Donahue served as a Member of the Advisory Board of certain Fidelity® funds (2015-2018) and Chief Executive Officer (2006-2012), Chief Operating Officer (2003-2006), and Managing Director, Customer Marketing and Development (1999-2003) of The Depository Trust & Clearing Corporation (financial markets infrastructure). Mr. Donahue serves as a Member (2007-present) and Co-Chairman (2016-present) of the Board of Directors of United Way of New York, Member of the Board of Directors of NYC Leadership Academy (2012-present) and Member of the Board of Advisors of Ripple Labs, Inc. (financial services, 2015-present). He also served as Chairman (2010-2012) and Member of the Board of Directors (2012-2013) of Omgeo, LLC (financial services), Treasurer of United Way of New York (2012-2016), and Member of the Board of Directors of XBRL US (financial services non-profit, 2009-2012) and the International Securities Services Association (2009-2012).
Alan J. Lacy (1953)
Year of Election or Appointment: 2008
Trustee
Mr. Lacy also serves as Trustee of other Fidelity® funds. Mr. Lacy serves as a Director of Bristol-Myers Squibb Company (global pharmaceuticals, 2008-present). He is a Trustee of the California Chapter of The Nature Conservancy (2015-present) and a Director of the Center for Advanced Study in the Behavioral Sciences at Stanford University (2015-present). In addition, Mr. Lacy served as Senior Adviser (2007-2014) of Oak Hill Capital Partners, L.P. (private equity) and also served as Chief Executive Officer (2005) and Vice Chairman (2005-2006) of Sears Holdings Corporation (retail) and Chief Executive Officer and Chairman of the Board of Sears, Roebuck and Co. (retail, 2000-2005). Previously, Mr. Lacy served as Chairman (2014-2017) and a member (2010-2017) of the Board of Directors of Dave & Buster’s Entertainment, Inc. (restaurant and entertainment complexes), as Chairman (2008-2011) and a member (2006-2015) of the Board of Trustees of the National Parks Conservation Association, and as a member of the Board of Directors for The Hillman Companies, Inc. (hardware wholesalers, 2010-2014), Earth Fare, Inc. (retail grocery, 2010-2014), and The Western Union Company (global money transfer, 2006-2011).
Ned C. Lautenbach (1944)
Year of Election or Appointment: 2000
Trustee
Chairman of the Independent Trustees
Mr. Lautenbach also serves as Trustee of other Fidelity® funds. Mr. Lautenbach currently serves as Vice Chair of the Board of Governors, State University System of Florida (2013-present) and is a member of the Council on Foreign Relations (1994-present). He is also a member and has most recently served as Chairman of the Board of Directors of Artis-Naples (2012-present). Previously, Mr. Lautenbach served as a member and then Lead Director of the Board of Directors of Eaton Corporation (diversified industrial, 1997-2016). He was also a Partner and Advisory Partner at Clayton, Dubilier & Rice, LLC (private equity investment, 1998-2010), as well as a Director of Sony Corporation (2006-2007). In addition, Mr. Lautenbach also had a 30-year career with IBM (technology company) during which time he served as Senior Vice President and a member of the Corporate Executive Committee (1968-1998).
Joseph Mauriello (1944)
Year of Election or Appointment: 2008
Trustee
Mr. Mauriello also serves as Trustee of other Fidelity® funds. Prior to his retirement in January 2006, Mr. Mauriello served in numerous senior management positions including Deputy Chairman and Chief Operating Officer (2004-2005), and Vice Chairman of Financial Services (2002-2004) of KPMG LLP US (professional services, 1965-2005). Mr. Mauriello currently serves as a member of the Independent Directors Council (IDC) Governing Council (2015-present). Previously, Mr. Mauriello served as a member of the Board of Directors of XL Group plc. (global insurance and re-insurance, 2006-2018).
Cornelia M. Small (1944)
Year of Election or Appointment: 2005
Trustee
Ms. Small also serves as Trustee of other Fidelity® funds. Ms. Small is a member of the Board of Directors (2009-present) and Chair of the Investment Committee (2010-present) of the Teagle Foundation. Ms. Small also serves on the Investment Committee of the Berkshire Taconic Community Foundation (2008-present). Previously, Ms. Small served as Chairperson (2002-2008) and a member of the Investment Committee and Chairperson (2008-2012) and a member of the Board of Trustees of Smith College. In addition, Ms. Small served as Chief Investment Officer, Director of Global Equity Investments, and a member of the Board of Directors of Scudder, Stevens & Clark and Scudder Kemper Investments.
Garnett A. Smith (1947)
Year of Election or Appointment: 2018
Trustee
Mr. Smith also serves as Trustee of other Fidelity® funds. Prior to Mr. Smith's retirement, he served as Chairman and Chief Executive Officer of Inbrand Corp. (manufacturer of personal absorbent products, 1990-1997). He also served as President (1986-1990) of Inbrand Corp. Prior to his employment with Inbrand Corp., he was employed by a retail fabric chain and North Carolina National Bank. In addition, Mr. Smith served as a Member of the Advisory Board of certain Fidelity® funds (2012-2013) and as a board member of the Jackson Hole Land Trust (2009-2012).
David M. Thomas (1949)
Year of Election or Appointment: 2008
Trustee
Mr. Thomas also serves as Trustee of other Fidelity® funds. Mr. Thomas serves as Non-Executive Chairman of the Board of Directors of Fortune Brands Home and Security (home and security products, 2011-present), as a member of the Board of Directors (2004-present) and Presiding Director (2013-present) of Interpublic Group of Companies, Inc. (marketing communication), and as a member of the Board of Trustees of the University of Florida (2013-present). Previously, Mr. Thomas served as Executive Chairman (2005-2006) and Chairman and Chief Executive Officer (2000-2005) of IMS Health, Inc. (pharmaceutical and healthcare information solutions), and a Director of Fortune Brands, Inc. (consumer products, 2000-2011).
+ The information includes the Trustee's principal occupation during the last five years and other information relating to the experience, attributes, and skills relevant to the Trustee's qualifications to serve as a Trustee, which led to the conclusion that the Trustee should serve as a Trustee for the fund.
Advisory Board Members and Officers:
Correspondence intended for a Member of the Advisory Board (if any) may be sent to Fidelity Investments, P.O. Box 55235, Boston, Massachusetts 02205-5235. Correspondence intended for an officer or Peter S. Lynch may be sent to Fidelity Investments, 245 Summer Street, Boston, Massachusetts 02210. Officers appear below in alphabetical order.
Name, Year of Birth; Principal Occupation
Vicki L. Fuller (1957)
Year of Election or Appointment: 2018
Member of the Advisory Board
Ms. Fuller also serves as Member of the Advisory Board of other Fidelity® funds. Ms. Fuller serves as a member of the Board of Directors, Audit Committee, and Nominating and Governance Committee of The Williams Companies, Inc. (natural gas infrastructure, 2018-present). Previously, Ms. Fuller served as the Chief Investment Officer of the New York State Common Retirement Fund (2012-2018) and held a variety of positions at AllianceBernstein L.P. (global asset management, 1985-2012), including Managing Director (2006-2012) and Senior Vice President and Senior Portfolio Manager (2001-2006).
Peter S. Lynch (1944)
Year of Election or Appointment: 2003
Member of the Advisory Board
Mr. Lynch also serves as Member of the Advisory Board of other Fidelity® funds. Mr. Lynch is Vice Chairman and a Director of FMR (investment adviser firm) and FMR Co., Inc. (investment adviser firm). In addition, Mr. Lynch serves as a Trustee of Boston College and as the Chairman of the Inner-City Scholarship Fund. Previously, Mr. Lynch served on the Special Olympics International Board of Directors (1997-2006).
William S. Stavropoulos (1939)
Year of Election or Appointment: 2018
Member of the Advisory Board
Mr. Stavropoulos also serves as Member of the Advisory Board of other Fidelity® funds. Mr. Stavropoulos serves as President and Founder of the Michigan Baseball Foundation, the Great Lakes Loons (2007-present). Mr. Stavropoulos is Chairman Emeritus of the Board of Directors of The Dow Chemical Company, where he previously served in numerous senior management positions, including President, CEO (1995-2000; 2002-2004), Chairman of the Executive Committee (2000-2006), and as a member of the Board of Directors (1990-2006). Currently, Mr. Stavropoulos is Chairman of the Board of Directors of Univar Inc. (global distributor of commodity and specialty chemicals), a Director of Teradata Corporation (data warehousing and technology solutions), and a member of the Advisory Board for Metalmark Capital LLC (private equity investment, 2005-present). Mr. Stavropoulos is an operating advisor to Clayton, Dubilier & Rice, LLC (private equity investment). In addition, Mr. Stavropoulos is a member of the University of Notre Dame Advisory Council for the College of Science, a Trustee of the Rollin L. Gerstacker Foundation, and a Director of Artis-Naples in Naples, Florida. Previously, Mr. Stavropoulos served as Trustee of certain Fidelity® funds (2001-2018) and as a Director of Chemical Financial Corporation (bank holding company, 1993-2012) and Tyco International, Ltd. (multinational manufacturing and services, 2007-2012).
Carol B. Tomé (1957)
Year of Election or Appointment: 2018
Member of the Advisory Board
Ms. Tomé also serves as Member of the Advisory Board of other Fidelity® funds. Ms. Tomé is Chief Financial Officer (2001-present) and Executive Vice President of Corporate Services (2007-present) of The Home Depot, Inc. (home improvement retailer) and a Director (2003-present) and Chair of the Audit Committee (2004-present) of United Parcel Service, Inc. (package delivery and supply chain management). Previously, Ms. Tomé served as Trustee of certain Fidelity® funds (2017), Senior Vice President of Finance and Accounting/Treasurer (2000-2007) and Vice President and Treasurer (1995-2000) of The Home Depot, Inc. and Chair of the Board (2010-2012), Vice Chair of the Board (2009 and 2013), and a Director (2008-2013) of the Federal Reserve Bank of Atlanta. Ms. Tomé is also a director or trustee of many community and professional organizations.
Michael E. Wiley (1950)
Year of Election or Appointment: 2018
Member of the Advisory Board
Mr. Wiley also serves as Trustee or Member of the Advisory Board of other Fidelity® funds. Mr. Wiley serves as a Director of High Point Resources (exploration and production, 2005-present). Previously, Mr. Wiley served as a Director of Andeavor Corporation (independent oil refiner and marketer, 2005-2018), a Director of Andeavor Logistics LP (natural resources logistics, 2015-2018), a Director of Post Oak Bank (privately-held bank, 2004-2018), a Director of Asia Pacific Exploration Consolidated (international oil and gas exploration and production, 2008-2013), a member of the Board of Trustees of the University of Tulsa (2000-2006; 2007-2010), a Senior Energy Advisor of Katzenbach Partners, LLC (consulting, 2006-2007), an Advisory Director of Riverstone Holdings (private investment), a Director of Spinnaker Exploration Company (exploration and production, 2001-2005) and Chairman, President, and CEO of Baker Hughes, Inc. (oilfield services, 2000-2004).
Elizabeth Paige Baumann (1968)
Year of Election or Appointment: 2017
Anti-Money Laundering (AML) Officer
Ms. Baumann also serves as AML Officer of other funds. She is Chief AML Officer (2012-present) and Senior Vice President (2014-present) of FMR LLC (diversified financial services company) and is an employee of Fidelity Investments. Previously, Ms. Baumann served as AML Officer of the funds (2012-2016), and Vice President (2007-2014) and Deputy Anti-Money Laundering Officer (2007-2012) of FMR LLC.
John J. Burke III (1964)
Year of Election or Appointment: 2018
Chief Financial Officer
Mr. Burke also serves as Chief Financial Officer of other funds. Mr. Burke serves as Head of Investment Operations for Fidelity Fund and Investment Operations (2018-present) and is an employee of Fidelity Investments (1998-present). Previously Mr. Burke served as head of Asset Management Investment Operations (2012-2018).
William C. Coffey (1969)
Year of Election or Appointment: 2018
Secretary and Chief Legal Officer (CLO)
Mr. Coffey also serves as Secretary and CLO of other funds. Mr. Coffey serves as CLO, Secretary, and Senior Vice President of Fidelity Management & Research Company and FMR Co., Inc. (investment adviser firms, 2018-present); Secretary of Fidelity SelectCo, LLC and Fidelity Investments Money Management, Inc. (investment adviser firms, 2018-present); and CLO of Fidelity Management & Research (Hong Kong) Limited, FMR Investment Management (UK) Limited, and Fidelity Management & Research (Japan) Limited (investment adviser firms, 2018-present). He is Senior Vice President and Deputy General Counsel of FMR LLC (diversified financial services company, 2010-present), and is an employee of Fidelity Investments. Previously, Mr. Coffey served as Assistant Secretary of certain funds (2009-2018) and as Vice President and Associate General Counsel of FMR LLC (2005-2009).
Timothy M. Cohen (1969)
Year of Election or Appointment: 2018
Vice President
Mr. Cohen also serves as Vice President of other funds. Mr. Cohen serves as Co-Head of Global Equity Research (2016-present), a Director of Fidelity Management & Research (Japan) Limited (investment adviser firm, 2016-present), and is an employee of Fidelity Investments. Previously, Mr. Cohen served as Chief Investment Officer - Equity and a Director of Fidelity Management & Research (U.K.) Inc. (investment adviser firm, 2013-2015) and as a Director of Fidelity Management & Research (Hong Kong) Limited (investment adviser firm, 2017).
Jonathan Davis (1968)
Year of Election or Appointment: 2010
Assistant Treasurer
Mr. Davis also serves as Assistant Treasurer of other funds. Mr. Davis serves as Assistant Treasurer of FMR Capital, Inc. (2017-present) and is an employee of Fidelity Investments. Previously, Mr. Davis served as Vice President and Associate General Counsel of FMR LLC (diversified financial services company, 2003-2010).
Adrien E. Deberghes (1967)
Year of Election or Appointment: 2016
Assistant Treasurer
Mr. Deberghes also serves as an officer of other funds. He serves as Assistant Treasurer of FMR Capital, Inc. (2017-present), Executive Vice President of Fidelity Investments Money Management, Inc. (FIMM) (investment adviser firm, 2016-present), and is an employee of Fidelity Investments (2008-present). Previously, Mr. Deberghes served as President and Treasurer of certain Fidelity® funds (2013-2018). Prior to joining Fidelity Investments, Mr. Deberghes was Senior Vice President of Mutual Fund Administration at State Street Corporation (2007-2008), Senior Director of Mutual Fund Administration at Investors Bank & Trust (2005-2007), and Director of Finance for Dunkin' Brands (2000-2005). Previously, Mr. Deberghes served in other fund officer roles.
Laura M. Del Prato (1964)
Year of Election or Appointment: 2018
Assistant Treasurer
Ms. Del Prato also serves as an officer of other funds. Ms. Del Prato is an employee of Fidelity Investments (2017-present). Prior to joining Fidelity Investments, Ms. Del Prato served as a Managing Director and Treasurer of the JPMorgan Mutual Funds (2014-2017). Prior to JPMorgan, Ms. Del Prato served as a partner at Cohen Fund Audit Services (accounting firm, 2012-2013) and KPMG LLP (accounting firm, 2004-2012).
Colm A. Hogan (1973)
Year of Election or Appointment: 2016
Deputy Treasurer
Mr. Hogan also serves as an officer of other funds. Mr. Hogan serves as Assistant Treasurer of FMR Capital, Inc. (2017-present) and is an employee of Fidelity Investments (2005-present). Previously, Mr. Hogan served as Assistant Treasurer of certain Fidelity® funds (2016-2018).
Pamela R. Holding (1964)
Year of Election or Appointment: 2018
Vice President
Ms. Holding also serves as Vice President of other funds. Ms. Holding serves as Co-Head of Global Equity Research (2018-present) and is an employee of Fidelity Investments (2013-present).
Chris Maher (1972)
Year of Election or Appointment: 2013
Assistant Treasurer
Mr. Maher serves as Assistant Treasurer of other funds. Mr. Maher is Vice President of Valuation Oversight, serves as Assistant Treasurer of FMR Capital, Inc. (2017-present), and is an employee of Fidelity Investments. Previously, Mr. Maher served as Vice President of Asset Management Compliance (2013), Vice President of the Program Management Group of FMR (investment adviser firm, 2010-2013), and Vice President of Valuation Oversight (2008-2010).
Rieco E. Mello (1969)
Year of Election or Appointment: 2017
Assistant Treasurer
Mr. Mello also serves as Assistant Treasurer of other funds. Mr. Mello serves as Assistant Treasurer of FMR Capital, Inc. (2017-present) and is an employee of Fidelity Investments (1995-present).
Kenneth B. Robins (1969)
Year of Election or Appointment: 2016
Chief Compliance Officer
Mr. Robins also serves as an officer of other funds. Mr. Robins serves as Compliance Officer of Fidelity Management & Research Company and FMR Co., Inc. (investment adviser firms, 2016-present) and is an employee of Fidelity Investments (2004-present). Previously, Mr. Robins served as Executive Vice President of Fidelity Investments Money Management, Inc. (investment adviser firm, 2013-2016) and served in other fund officer roles.
Stacie M. Smith (1974)
Year of Election or Appointment: 2016
President and Treasurer
Ms. Smith also serves as an officer of other funds. Ms. Smith serves as Assistant Treasurer of FMR Capital, Inc. (2017-present), is an employee of Fidelity Investments (2009-present), and has served in other fund officer roles. Prior to joining Fidelity Investments, Ms. Smith served as Senior Audit Manager of Ernst & Young LLP (accounting firm, 1996-2009). Previously, Ms. Smith served as Assistant Treasurer (2013-2018) and Deputy Treasurer (2013-2016) of certain Fidelity® funds.
Marc L. Spector (1972)
Year of Election or Appointment: 2016
Assistant Treasurer
Mr. Spector also serves as an officer of other funds. Mr. Spector serves as Assistant Treasurer of FMR Capital, Inc. (2017-present) and is an employee of Fidelity Investments (2016-present). Prior to joining Fidelity Investments, Mr. Spector served as Director at the Siegfried Group (accounting firm, 2013-2016), and prior to Siegfried Group as audit senior manager at Deloitte & Touche (accounting firm, 2005-2013).
Shareholder Expense Example
As a shareholder of the Fund, you incur two types of costs: (1) transaction costs, including sales charges (loads) on purchase payments or redemption proceeds, and (2) ongoing costs, including management fees, distribution and/or service (12b-1) fees and other Fund expenses. This Example is intended to help you understand your ongoing costs (in dollars) of investing in the Fund and to compare these costs with the ongoing costs of investing in other mutual funds.
The actual expense Example is based on an investment of $1,000 invested at the beginning of the period and held for the entire period (May 1, 2018 to October 31, 2018) for Class A, Class M, Class C, International Small Cap Opportunities and Class I, and for the period (October 2, 2018 to October 31, 2018) for Class Z. The hypothetical expense Example is based on an investment of $1,000 invested for the one-half year period (May 1, 2018 to October 31, 2018).
Actual Expenses
The first line of the accompanying table for each class of the Fund provides information about actual account values and actual expenses. You may use the information in this line, together with the amount you invested, to estimate the expenses that you paid over the period. Simply divide your account value by $1,000.00 (for example, an $8,600 account value divided by $1,000.00 = 8.6), then multiply the result by the number in the first line for a class of the Fund under the heading entitled "Expenses Paid During Period" to estimate the expenses you paid on your account during this period. A small balance maintenance fee of $12.00 that is charged once a year may apply for certain accounts with a value of less than $2,000. This fee, which was eliminated effective August 1, 2018, is not included in the table below. If it was, the estimate of expenses you paid during the period would be higher, and your ending account value lower, by this amount. In addition, the Fund, as a shareholder in the underlying Fidelity Central Funds, will indirectly bear its pro-rata share of the fees and expenses incurred by the underlying Fidelity Central Funds. These fees and expenses are not included in the Fund's annualized expense ratio used to calculate the expense estimate in the table below.
Hypothetical Example for Comparison Purposes
The second line of the accompanying table for each class of the Fund provides information about hypothetical account values and hypothetical expenses based on a Class' actual expense ratio and an assumed rate of return of 5% per year before expenses, which is not the Class' actual return. The hypothetical account values and expenses may not be used to estimate the actual ending account balance or expenses you paid for the period. You may use this information to compare the ongoing costs of investing in the Fund and other funds. To do so, compare this 5% hypothetical example with the 5% hypothetical examples that appear in the shareholder reports of the other funds. A small balance maintenance fee of $12.00 that is charged once a year may apply for certain accounts with a value of less than $2,000. This fee, which was eliminated effective August 1, 2018, is not included in the table below. If it was, the estimate of expenses you paid during the period would be higher, and your ending account value lower, by this amount. In addition, the Fund, as a shareholder in the underlying Fidelity Central Funds, will indirectly bear its pro-rata share of the fees and expenses incurred by the underlying Fidelity Central Funds. These fees and expenses are not included in the Fund's annualized expense ratio used to calculate the expense estimate in the table below.
Please note that the expenses shown in the table are meant to highlight your ongoing costs only and do not reflect any transaction costs. Therefore, the second line of the table is useful in comparing ongoing costs only, and will not help you determine the relative total costs of owning different funds. In addition, if these transactional costs were included, your costs would have been higher.
| | Annualized Expense Ratio-A | Beginning
Account Value | Ending
Account Value
October 31, 2018 | Expenses Paid
During Period |
| Class A | 1.36% | | | |
| Actual | | $1,000.00 | $873.90 | $6.42-B |
| Hypothetical-C | | $1,000.00 | $1,018.35 | $6.92-D |
| Class M | 1.65% | | | |
| Actual | | $1,000.00 | $872.90 | $7.79-B |
| Hypothetical-C | | $1,000.00 | $1,016.89 | $8.39-D |
| Class C | 2.13% | | | |
| Actual | | $1,000.00 | $870.60 | $10.04-B |
| Hypothetical-C | | $1,000.00 | $1,014.47 | $10.82-D |
| International Small Cap Opportunities | 1.09% | | | |
| Actual | | $1,000.00 | $875.20 | $5.15-B |
| Hypothetical-C | | $1,000.00 | $1,019.71 | $5.55-D |
| Class I | 1.11% | | | |
| Actual | | $1,000.00 | $875.10 | $5.25-B |
| Hypothetical-C | | $1,000.00 | $1,019.61 | $5.65-D |
| Class Z | 1.03% | | | |
| Actual | | $1,000.00 | $916.30 | $.81-B |
| Hypothetical-C | | $1,000.00 | $1,020.01 | $5.24-D |
A Annualized expense ratio reflects expenses net of applicable fee waivers.
B Actual expenses are equal to each Class' annualized expense ratio, multiplied by the average account value over the period, multiplied by 184/365 (to reflect the one-half year period) for Class A, Class M, Class C, International Small Cap Opportunities and Class I, and multiplied by 30/365 (to reflect the period October 2, 2018 to October 31, 2018) for Class Z.
C 5% return per year before expenses
D Hypothetical expenses are equal to each Class' annualized expense ratio, multiplied by the average account value over the period, multiplied by 184/365 (to reflect the one-half year period).
Distributions (Unaudited)
The Board of Trustees of Fidelity International Small Cap Opportunities Fund voted to pay to shareholders of record at the opening of business on record date, the following distributions per share derived from capital gains realized from sales of portfolio securities, and dividends derived from net investment income:
| | Pay Date | Record Date | Dividends | Capital Gains |
| Fidelity International Small Cap Opportunities Fund | | | | |
| Class A | 12/10/18 | 12/07/18 | $0.113 | $0.313 |
| Class M | 12/10/18 | 12/07/18 | $0.057 | $0.313 |
| Class C | 12/10/18 | 12/07/18 | $0.000 | $0.293 |
| International Small Cap Opportunities | 12/10/18 | 12/07/18 | $0.170 | $0.313 |
| Class I | 12/10/18 | 12/07/18 | $0.162 | $0.313 |
| Class Z | 12/10/18 | 12/07/18 | $0.204 | $0.313 |
|
The fund hereby designates as a capital gain dividend with respect to the taxable year ended October 31, 2018, $19,946,356, or, if subsequently determined to be different, the net capital gain of such year.
A percentage of the dividends distributed during the fiscal year qualify for the dividends–received deduction for corporate shareholders:
| | Class A | Class M | Class C | International Small Cap Opportunities | Class I |
| Fidelity International Small Cap Opportunities Fund | | | | | |
| December 08, 2017 | 1% | 1% | 1% | 1% | 1% |
| December 28, 2017 | – | – | – | 9% | 9% |
|
A percentage of the dividends distributed during the fiscal year may be taken into account as a dividend for purposes of the maximum rate under section 1(h)(11) of the Internal Revenue Code.
| | Class A | Class M | Class C | International Small Cap Opportunities | Class I |
| Fidelity International Small Cap Opportunities Fund | | | | | |
| December 08, 2017 | 80% | 87% | 100% | 71% | 71% |
| December 28, 2017 | – | – | – | 100% | 100% |
|
The amounts per share which represent income derived from sources within, and taxes paid to, foreign countries or possessions of the United States are as follows:
| | Pay Date | Income | Taxes |
| Fidelity International Small Cap Opportunities Fund | | | |
| Class A | 12/11/17 | $0.2921 | $0.0308 |
| Class M | 12/11/17 | $0.2658 | $0.0308 |
| Class C | 12/11/17 | $0.2181 | $0.0308 |
| International Small Cap Opportunities | 12/11/17 | $0.3288 | $0.0308 |
| Class I | 12/11/17 | $0.3280 | $0.0308 |
|
The fund will notify shareholders in January 2019 of amounts for use in preparing 2018 income tax returns.
Board Approval of Investment Advisory Contracts
Fidelity International Small Cap Opportunities Fund
At its July 2018 meeting, the Board of Trustees, including the Independent Trustees (together, the Board), voted to continue the management contract with Fidelity Management & Research Company (FMR) and the sub-advisory agreements (together, the Advisory Contracts) for the fund for six months through January 31, 2019, in connection with the reunification of the Fidelity Equity High Income Funds Board, which oversees the fund, and the Sector Portfolios Board.
The Board considered that the approval of the fund's Advisory Contracts will not result in any changes in (i) the investment process or strategies employed in the management of the fund's assets; (ii) the fees and expenses paid by shareholders; (iii) the nature, extent or quality of services provided under the fund's Advisory Contracts; or (iv) the day-to-day management of the fund or the persons primarily responsible for such management. The Board concluded that the fund's Advisory Contracts are fair and reasonable, and that the fund's Advisory Contracts should be renewed, without modification, through January 31, 2019, with the understanding that the Board will consider the annual renewal for a full one year period in January 2019.
In connection with its consideration of future renewals of the fund's Advisory Contracts, the Board will consider: (i) the nature, extent and quality of services provided to the fund, including shareholder and administrative services and investment performance; (ii) the competitiveness of the management fee and total expenses for the fund; (iii) the costs of the services and profitability, including the revenues earned and the expenses incurred in conducting the business of developing, marketing, distributing, managing, administering, and servicing the fund and its shareholders, to the extent applicable, as well as potential fall-out benefits from Fidelity's non-fund businesses; and (iv) whether there have been economies of scale in respect of the Fidelity funds, whether the Fidelity funds (including the fund) have appropriately benefited from any such economies of scale, and whether there is the potential for realization of any further economies.
Based on its evaluation of all of the conclusions noted above, and after considering all factors it believed relevant, the Board ultimately concluded that the fund's management fee structure is fair and reasonable, and that the continuation of the fund's Advisory Contracts should be approved.
AILS-ANN-1218
1.815091.113
Fidelity® International Small Cap Opportunities Fund
Annual Report October 31, 2018 |
|
Contents
To view a fund's proxy voting guidelines and proxy voting record for the 12-month period ended June 30, visit http://www.fidelity.com/proxyvotingresults or visit the Securities and Exchange Commission's (SEC) web site at http://www.sec.gov.
You may also call 1-800-544-8544 to request a free copy of the proxy voting guidelines.
Standard & Poor's, S&P and S&P 500 are registered service marks of The McGraw-Hill Companies, Inc. and have been licensed for use by Fidelity Distributors Corporation.
Other third-party marks appearing herein are the property of their respective owners.
All other marks appearing herein are registered or unregistered trademarks or service marks of FMR LLC or an affiliated company. © 2018 FMR LLC. All rights reserved.
This report and the financial statements contained herein are submitted for the general information of the shareholders of the Fund. This report is not authorized for distribution to prospective investors in the Fund unless preceded or accompanied by an effective prospectus.
A fund files its complete schedule of portfolio holdings with the SEC for the first and third quarters of each fiscal year on Form N-Q. Forms N-Q are available on the SEC’s web site at http://www.sec.gov. A fund's Forms N-Q may be reviewed and copied at the SEC’s Public Reference Room in Washington, DC. Information regarding the operation of the SEC's Public Reference Room may be obtained by calling 1-800-SEC-0330.
For a complete list of a fund's portfolio holdings, view the most recent holdings listing, semiannual report, or annual report on Fidelity's web site at http://www.fidelity.com, http://www.institutional.fidelity.com, or http://www.401k.com, as applicable.
NOT FDIC INSURED •MAY LOSE VALUE •NO BANK GUARANTEE
Neither the Fund nor Fidelity Distributors Corporation is a bank.
Performance: The Bottom Line
Average annual total return reflects the change in the value of an investment, assuming reinvestment of distributions from dividend income and capital gains (the profits earned upon the sale of securities that have grown in value, if any) and assuming a constant rate of performance each year. The hypothetical investment and the average annual total returns do not reflect the deduction of taxes that a shareholder would pay on fund distributions or the redemption of fund shares. During periods of reimbursement by Fidelity, a fund’s total return will be greater than it would be had the reimbursement not occurred. How a fund did yesterday is no guarantee of how it will do tomorrow.
Average Annual Total Returns
| For the periods ended October 31, 2018 | Past 1 year | Past 5 years | Past 10 years |
| Fidelity® International Small Cap Opportunities Fund | (4.25)% | 6.24% | 12.26% |
$10,000 Over 10 Years
Let's say hypothetically that $10,000 was invested in Fidelity® International Small Cap Opportunities Fund, a class of the fund, on October 31, 2008.
The chart shows how the value of your investment would have changed, and also shows how the MSCI EAFE Small Cap Index performed over the same period.
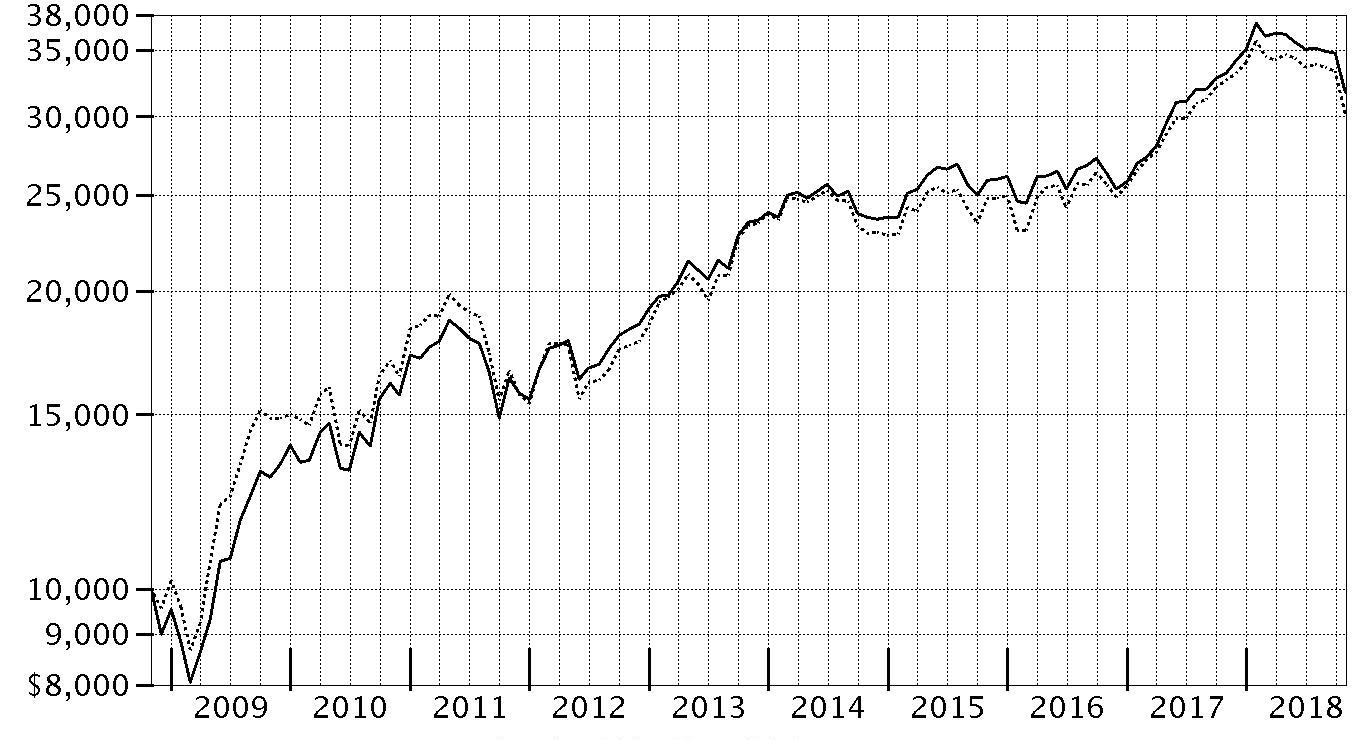
| Period Ending Values |
| $31,779 | Fidelity® International Small Cap Opportunities Fund |
| $30,168 | MSCI EAFE Small Cap Index |
Management's Discussion of Fund Performance
Market Recap: International equities returned -8.08% for the 12 months ending October 31, 2018, according to the MSCI ACWI (All Country World Index) ex USA Index. A modestly positive first half of the period gave way to a confluence of overwhelmingly negative factors – including escalating trade tensions, a surging U.S. dollar, tepid economic growth in Europe, global central bank tightening, concerns about Italy’s budget stalemate with the EU, and weakness in China’s stock market – that yielded a -11% second-half return. The index lost 8% in October alone, its largest monthly drop in more than six years. Among sectors, new-media-infused communications services (-15%) was hit the hardest, while economically sensitive consumer discretionary (-13%), information technology (-12%), financials (-10%), industrials (-9%) and materials (-7%) stocks also fared poorly. Even the more defensive real estate (-9%), utilities (-6%) and consumer staples (-5%) sectors weren’t spared this period. Conversely, elevated crude-oil prices fueled a positive return for energy (+7%), the top-performing sector, followed by the relatively stable-growing health care segment (+2%). Regionally, emerging markets (-12%) fared the worst, hampered by the impact of foreign exchange and concerns about economic weakness in China, India and South Korea. Sluggish growth also pressured shares in continental Europe (-9%). Stocks in Japan (-3%) and the U.K. (-4%) held up better, followed by Canada (-5%) and Asia-Pacific ex Japan (-6%).
Comments from Portfolio Manager Jed Weiss: For the fiscal year, the fund’s share classes (excluding sales charges, if applicable) returned roughly -4% to -5%, outpacing the -7.68% return of the benchmark MSCI EAFE Small Cap Index. Versus the benchmark, security selection within Japan was by far the biggest contributor, followed by Germany. My choices among emerging markets also helped our relative result, particularly South Africa. Conversely, picks in a number of Scandanavian countries, including Sweden and Denmark, hampered the portfolio's performance versus the benchmark, as did an underweighting in Australia. A number of Japanese holdings helped the fund top the benchmark this period. This included a sizable out-of-benchmark stake in technology service management company OBIC, our largest individual relative contributor which continued to execute well during the period. In addition, it helped to hold a non-benchmark position in Workman, the leading workwear retailer in Japan. Workman's share price benefited from strong sales trends this period. Also contributing was an overweighting in Lasertec, a Japan-based maker of semiconductor inspection systems that gained roughly 33% the past 12 months. Lastly, I'll note that the fund's stake in cash – representing about 4% of assets, on average – helped our relative result in a down market. Conversely, the fund's biggest detractor was Nabtesco, a maker of gearboxes and machinery. Our non-benchmark holdings returned -43% this period, as the company was held back by economic weakness in China, its second-largest market. Untimely ownership of gaming software company Playtech also detracted, as its shares declined amid deterioration of the firm's pricing power, as well as heightened competition. Playtech was not held at period end. Lastly, Swedish light-fixture maker Fagerhult, another non-benchmark holding, returned about -31% and weighed on the fund's relative result.
The views expressed above reflect those of the portfolio manager(s) only through the end of the period as stated on the cover of this report and do not necessarily represent the views of Fidelity or any other person in the Fidelity organization. Any such views are subject to change at any time based upon market or other conditions and Fidelity disclaims any responsibility to update such views. These views may not be relied on as investment advice and, because investment decisions for a Fidelity fund are based on numerous factors, may not be relied on as an indication of trading intent on behalf of any Fidelity fund.
Investment Summary (Unaudited)
Geographic Diversification (% of fund's net assets)
| As of October 31, 2018 |
| | Japan | 33.8% |
| | United Kingdom | 16.1% |
| | United States of America* | 12.7% |
| | Germany | 5.3% |
| | Sweden | 4.7% |
| | France | 2.8% |
| | Denmark | 2.6% |
| | Israel | 2.5% |
| | Netherlands | 2.2% |
| | Other | 17.3% |
* Includes Short-Term investments and Net Other Assets (Liabilities).
Percentages are based on country or territory of incorporation and are adjusted for the effect of futures contracts, if applicable.
Asset Allocation as of October 31, 2018
| | % of fund's net assets |
| Stocks and Investment Companies | 92.9 |
| Short-Term Investments and Net Other Assets (Liabilities) | 7.1 |
Top Ten Stocks as of October 31, 2018
| | % of fund's net assets |
| Spirax-Sarco Engineering PLC (United Kingdom, Machinery) | 2.3 |
| OBIC Co. Ltd. (Japan, IT Services) | 2.2 |
| Azbil Corp. (Japan, Electronic Equipment & Components) | 2.1 |
| Spectris PLC (United Kingdom, Electronic Equipment & Components) | 2.1 |
| CompuGroup Medical AG (Germany, Health Care Technology) | 2.0 |
| SHO-BOND Holdings Co. Ltd. (Japan, Construction & Engineering) | 1.8 |
| Dechra Pharmaceuticals PLC (United Kingdom, Pharmaceuticals) | 1.8 |
| KBC Ancora (Belgium, Diversified Financial Services) | 1.6 |
| OSG Corp. (Japan, Machinery) | 1.6 |
| Nihon Parkerizing Co. Ltd. (Japan, Chemicals) | 1.6 |
| | 19.1 |
Top Market Sectors as of October 31, 2018
| | % of fund's net assets |
| Industrials | 22.9 |
| Health Care | 13.0 |
| Information Technology | 12.2 |
| Consumer Discretionary | 8.9 |
| Consumer Staples | 8.0 |
| Materials | 6.7 |
| Media & Entertainment | 6.5 |
| Financials | 5.0 |
| Real Estate | 4.2 |
| Energy | 2.1 |
Schedule of Investments October 31, 2018
Showing Percentage of Net Assets
| Common Stocks - 88.5% | | | |
| | | Shares | Value |
| Australia - 1.8% | | | |
| Accent Group Ltd. | | 2,858,149 | $2,519,878 |
| Adelaide Brighton Ltd. | | 909,157 | 3,650,457 |
| Beacon Lighting Group Ltd. | | 2,785,250 | 2,731,739 |
| DuluxGroup Ltd. | | 1,827,588 | 9,577,128 |
| Imdex Ltd. (a) | | 3,540,102 | 2,882,962 |
| Quintis Ltd. (a)(b)(c) | | 2,011,191 | 14 |
|
| TOTAL AUSTRALIA | | | 21,362,178 |
|
| Austria - 0.7% | | | |
| Andritz AG | | 160,500 | 8,318,725 |
| Bailiwick of Jersey - 0.4% | | | |
| Integrated Diagnostics Holdings PLC (d) | | 1,483,779 | 5,119,038 |
| Belgium - 1.6% | | | |
| KBC Ancora | | 420,056 | 19,430,709 |
| Bermuda - 0.5% | | | |
| Vostok New Ventures Ltd. (depositary receipt) (a) | | 701,789 | 5,337,527 |
| Canada - 1.4% | | | |
| McCoy Global, Inc. (a) | | 633,615 | 553,502 |
| New Look Vision Group, Inc. | | 227,200 | 5,565,878 |
| Pason Systems, Inc. | | 351,800 | 5,309,937 |
| PrairieSky Royalty Ltd. | | 182,700 | 2,775,647 |
| ShawCor Ltd. Class A | | 164,900 | 2,991,236 |
|
| TOTAL CANADA | | | 17,196,200 |
|
| Cayman Islands - 0.3% | | | |
| Value Partners Group Ltd. | | 4,315,000 | 3,202,431 |
| Denmark - 2.6% | | | |
| Jyske Bank A/S (Reg.) | | 233,352 | 9,540,405 |
| Netcompany Group A/S | | 99,726 | 3,298,260 |
| Scandinavian Tobacco Group A/S (d) | | 195,906 | 2,972,689 |
| SimCorp A/S | | 93,500 | 7,203,882 |
| Spar Nord Bank A/S | | 1,030,077 | 8,538,494 |
|
| TOTAL DENMARK | | | 31,553,730 |
|
| Finland - 0.4% | | | |
| Tikkurila Oyj (b) | | 330,959 | 4,505,826 |
| France - 2.8% | | | |
| Elis SA | | 838,942 | 16,942,559 |
| Laurent-Perrier Group SA | | 51,163 | 5,250,249 |
| Vetoquinol SA | | 117,184 | 6,570,059 |
| Virbac SA (a) | | 26,852 | 4,312,694 |
|
| TOTAL FRANCE | | | 33,075,561 |
|
| Germany - 4.3% | | | |
| CompuGroup Medical AG | | 429,921 | 24,347,501 |
| CTS Eventim AG | | 282,693 | 10,617,574 |
| Nexus AG | | 291,358 | 7,953,160 |
| WashTec AG | | 111,625 | 8,610,023 |
|
| TOTAL GERMANY | | | 51,528,258 |
|
| Greece - 0.3% | | | |
| Motor Oil (HELLAS) Corinth Refineries SA | | 161,800 | 3,830,192 |
| India - 0.2% | | | |
| Jyothy Laboratories Ltd. | | 917,276 | 2,347,760 |
| Ireland - 1.1% | | | |
| FBD Holdings PLC | | 243,128 | 2,960,323 |
| James Hardie Industries PLC CDI | | 775,840 | 10,323,434 |
|
| TOTAL IRELAND | | | 13,283,757 |
|
| Israel - 2.5% | | | |
| Azrieli Group | | 59,105 | 2,869,568 |
| Ituran Location & Control Ltd. | | 460,008 | 15,695,473 |
| Strauss Group Ltd. | | 513,644 | 11,271,626 |
|
| TOTAL ISRAEL | | | 29,836,667 |
|
| Italy - 1.4% | | | |
| Interpump Group SpA | | 588,277 | 16,990,955 |
| Japan - 33.8% | | | |
| Ai Holdings Corp. | | 202,400 | 3,863,780 |
| Aoki Super Co. Ltd. | | 165,000 | 3,861,967 |
| Artnature, Inc. | | 511,600 | 3,006,078 |
| Aucnet, Inc. | | 212,251 | 2,225,311 |
| Azbil Corp. | | 1,367,800 | 25,480,707 |
| Broadleaf Co. Ltd. | | 561,100 | 3,242,232 |
| Central Automotive Products Ltd. | | 135,400 | 1,841,973 |
| Century21 Real Estate Japan Ltd. | | 66,500 | 726,676 |
| Coca-Cola West Co. Ltd. | | 137,475 | 3,600,289 |
| Daiichikosho Co. Ltd. | | 302,000 | 13,917,667 |
| Daikokutenbussan Co. Ltd. | | 205,900 | 7,700,607 |
| Funai Soken Holdings, Inc. | | 373,550 | 7,922,233 |
| GCA Savvian Group Corp. | | 555,461 | 4,450,186 |
| Goldcrest Co. Ltd. | | 624,130 | 9,762,835 |
| Iwatsuka Confectionary Co. Ltd. | | 21,400 | 835,441 |
| Kobayashi Pharmaceutical Co. Ltd. | | 128,400 | 8,420,791 |
| Koshidaka Holdings Co. Ltd. | | 1,035,300 | 12,047,227 |
| Kusuri No Aoki Holdings Co. Ltd. | | 122,800 | 8,815,350 |
| Lasertec Corp. | | 469,072 | 13,469,165 |
| Medikit Co. Ltd. | | 111,100 | 6,006,204 |
| Miroku Jyoho Service Co., Ltd. | | 177,200 | 3,345,026 |
| Misumi Group, Inc. | | 464,650 | 9,331,297 |
| Mitsuboshi Belting Ltd. | | 132,000 | 3,241,654 |
| Nabtesco Corp. | | 464,100 | 10,233,357 |
| Nagaileben Co. Ltd. | | 619,500 | 13,912,465 |
| Nakano Refrigerators Co. Ltd. | | 86,300 | 4,611,947 |
| ND Software Co. Ltd. | | 97,942 | 1,092,826 |
| Nihon Parkerizing Co. Ltd. | | 1,562,000 | 18,868,312 |
| NS Tool Co. Ltd. | | 156,800 | 3,688,104 |
| OBIC Co. Ltd. | | 295,300 | 26,903,744 |
| OSG Corp. | | 935,300 | 19,346,747 |
| Paramount Bed Holdings Co. Ltd. | | 366,400 | 15,440,528 |
| ProNexus, Inc. | | 472,400 | 4,592,749 |
| San-Ai Oil Co. Ltd. | | 992,400 | 10,721,280 |
| SHO-BOND Holdings Co. Ltd. | | 302,800 | 21,575,859 |
| Shoei Co. Ltd. | | 400,626 | 15,640,161 |
| SK Kaken Co. Ltd. | | 19,200 | 8,142,154 |
| Software Service, Inc. | | 93,800 | 7,066,070 |
| Techno Medica Co. Ltd. | | 80,791 | 1,485,005 |
| The Monogatari Corp. | | 63,400 | 5,663,775 |
| TKC Corp. | | 193,600 | 7,377,853 |
| Tocalo Co. Ltd. | | 483,100 | 4,200,125 |
| USS Co. Ltd. | | 966,500 | 17,448,137 |
| Welcia Holdings Co. Ltd. | | 166,700 | 8,509,700 |
| Workman Co. Ltd. (b) | | 148,800 | 9,415,802 |
| Yamada Consulting Group Co. Ltd. | | 395,500 | 9,116,812 |
| Yamato Kogyo Co. Ltd. | | 127,700 | 3,361,271 |
|
| TOTAL JAPAN | | | 405,529,479 |
|
| Korea (South) - 0.9% | | | |
| BGF Retail Co. Ltd. | | 51,926 | 7,668,301 |
| Leeno Industrial, Inc. | | 52,428 | 2,752,355 |
|
| TOTAL KOREA (SOUTH) | | | 10,420,656 |
|
| Mexico - 0.2% | | | |
| Consorcio ARA S.A.B. de CV | | 8,852,578 | 2,348,979 |
| Netherlands - 2.2% | | | |
| Aalberts Industries NV | | 416,901 | 15,322,985 |
| Takeaway.com Holding BV (a)(d) | | 99,887 | 5,883,125 |
| VastNed Retail NV | | 118,002 | 4,677,924 |
|
| TOTAL NETHERLANDS | | | 25,884,034 |
|
| Norway - 1.3% | | | |
| Kongsberg Gruppen ASA (b) | | 578,373 | 9,509,419 |
| Skandiabanken ASA (d) | | 623,200 | 6,209,969 |
|
| TOTAL NORWAY | | | 15,719,388 |
|
| Philippines - 0.6% | | | |
| Jollibee Food Corp. | | 1,309,740 | 6,764,756 |
| South Africa - 0.9% | | | |
| Clicks Group Ltd. | | 877,329 | 11,180,332 |
| Spain - 2.0% | | | |
| Merlin Properties Socimi SA | | 538,500 | 6,758,047 |
| Prosegur Compania de Seguridad SA (Reg.) | | 2,966,290 | 16,489,743 |
|
| TOTAL SPAIN | | | 23,247,790 |
|
| Sweden - 4.7% | | | |
| Addlife AB | | 288,572 | 6,622,132 |
| AddTech AB (B Shares) | | 606,043 | 12,384,240 |
| Fagerhult AB (b) | | 935,139 | 8,215,926 |
| Lagercrantz Group AB (B Shares) | | 919,775 | 9,055,881 |
| Loomis AB (B Shares) | | 334,600 | 10,347,530 |
| Saab AB (B Shares) | | 257,900 | 10,106,155 |
|
| TOTAL SWEDEN | | | 56,731,864 |
|
| Switzerland - 0.9% | | | |
| Tecan Group AG | | 49,820 | 11,238,747 |
| Taiwan - 0.4% | | | |
| Addcn Technology Co. Ltd. | | 638,435 | 4,969,650 |
| United Kingdom - 16.1% | | | |
| Alliance Pharma PLC | | 6,290,137 | 5,370,755 |
| Ascential PLC | | 2,376,876 | 11,447,647 |
| Avon Rubber PLC | | 283,700 | 4,351,504 |
| Cineworld Group PLC | | 1,353,500 | 5,096,709 |
| Dechra Pharmaceuticals PLC | | 725,909 | 21,210,808 |
| DP Poland PLC (a) | | 7,057,200 | 2,435,539 |
| Elementis PLC | | 5,102,137 | 13,369,181 |
| Great Portland Estates PLC | | 1,151,542 | 10,269,453 |
| Hilton Food Group PLC | | 315,326 | 3,716,118 |
| Howden Joinery Group PLC | | 755,700 | 4,531,205 |
| Informa PLC | | 1,684,956 | 15,368,880 |
| InterContinental Hotel Group PLC ADR | | 72,195 | 3,881,203 |
| ITE Group PLC | | 7,952,093 | 5,793,688 |
| Rightmove PLC | | 1,627,470 | 9,405,770 |
| Shaftesbury PLC | | 1,287,173 | 14,758,023 |
| Spectris PLC | | 912,878 | 25,017,064 |
| Spirax-Sarco Engineering PLC | | 331,991 | 27,455,503 |
| Topps Tiles PLC | | 3,398,115 | 2,732,043 |
| Ultra Electronics Holdings PLC | | 358,458 | 6,588,643 |
|
| TOTAL UNITED KINGDOM | | | 192,799,736 |
|
| United States of America - 2.2% | | | |
| Autoliv, Inc. (b) | | 31,300 | 2,608,542 |
| Martin Marietta Materials, Inc. | | 23,820 | 4,079,890 |
| Mohawk Industries, Inc. (a) | | 14,300 | 1,783,639 |
| PriceSmart, Inc. | | 118,574 | 8,317,966 |
| ResMed, Inc. | | 54,495 | 5,772,110 |
| Veoneer, Inc. (a)(b) | | 124,900 | 4,194,142 |
|
| TOTAL UNITED STATES OF AMERICA | | | 26,756,289 |
|
| TOTAL COMMON STOCKS | | | |
| (Cost $895,549,541) | | | 1,060,511,214 |
|
| Nonconvertible Preferred Stocks - 1.0% | | | |
| Germany - 1.0% | | | |
| Sartorius AG (non-vtg.) | | | |
| (Cost $2,418,851) | | 85,180 | 12,349,328 |
|
| Investment Companies - 3.4% | | | |
| United States of America - 3.4% | | | |
| iShares MSCI EAFE Small-Cap ETF | | | |
| (Cost $47,211,212) | | 715,000 | 40,218,744 |
|
| Money Market Funds - 7.1% | | | |
| Fidelity Cash Central Fund, 2.23% (e) | | 74,075,591 | 74,090,406 |
| Fidelity Securities Lending Cash Central Fund 2.23% (e)(f) | | 11,458,043 | 11,459,189 |
| TOTAL MONEY MARKET FUNDS | | | |
| (Cost $85,549,595) | | | 85,549,595 |
| TOTAL INVESTMENT IN SECURITIES - 100.0% | | | |
| (Cost $1,030,729,199) | | | 1,198,628,881 |
| NET OTHER ASSETS (LIABILITIES) - 0.0% | | | 309,571 |
| NET ASSETS - 100% | | | $1,198,938,452 |
Security Type Abbreviations
ETF – Exchange-Traded Fund
Categorizations in the Schedule of Investments are based on country or territory of incorporation.
Legend
(a) Non-income producing
(b) Security or a portion of the security is on loan at period end.
(c) Level 3 security
(d) Security exempt from registration under Rule 144A of the Securities Act of 1933. These securities may be resold in transactions exempt from registration, normally to qualified institutional buyers. At the end of the period, the value of these securities amounted to $20,184,821 or 1.7% of net assets.
(e) Affiliated fund that is generally available only to investment companies and other accounts managed by Fidelity Investments. The rate quoted is the annualized seven-day yield of the fund at period end. A complete unaudited listing of the fund's holdings as of its most recent quarter end is available upon request. In addition, each Fidelity Central Fund's financial statements, which are not covered by the Fund's Report of Independent Registered Public Accounting Firm, are available on the SEC's website or upon request.
(f) Investment made with cash collateral received from securities on loan.
Affiliated Central Funds
Information regarding fiscal year to date income earned by the Fund from investments in Fidelity Central Funds is as follows:
| Fund | Income earned |
| Fidelity Cash Central Fund | $961,001 |
| Fidelity Securities Lending Cash Central Fund | 112,732 |
| Total | $1,073,733 |
Amounts in the income column in the above table include any capital gain distributions from underlying funds, which are presented in the corresponding line-item in the Statement of Operations if applicable.
Investment Valuation
The following is a summary of the inputs used, as of October 31, 2018, involving the Fund's assets and liabilities carried at fair value. The inputs or methodology used for valuing securities may not be an indication of the risk associated with investing in those securities. For more information on valuation inputs, and their aggregation into the levels used below, please refer to the Investment Valuation section in the accompanying Notes to Financial Statements.
| | Valuation Inputs at Reporting Date: |
| Description | Total | Level 1 | Level 2 | Level 3 |
| Investments in Securities: | | | | |
| Equities: | | | | |
| Communication Services | $76,617,585 | $76,617,585 | $-- | $-- |
| Consumer Discretionary | 107,731,849 | 107,731,849 | -- | -- |
| Consumer Staples | 97,475,264 | 97,475,264 | -- | -- |
| Energy | 26,181,794 | 26,181,794 | -- | -- |
| Financials | 59,670,044 | 59,670,044 | -- | -- |
| Health Care | 155,869,430 | 155,869,430 | -- | -- |
| Industrials | 274,025,999 | 274,025,999 | -- | -- |
| Information Technology | 146,705,422 | 146,705,422 | -- | -- |
| Materials | 78,760,629 | 78,760,615 | -- | 14 |
| Real Estate | 49,822,526 | 49,822,526 | -- | -- |
| Investment Companies | 40,218,744 | 40,218,744 | -- | -- |
| Money Market Funds | 85,549,595 | 85,549,595 | -- | -- |
| Total Investments in Securities: | $1,198,628,881 | $1,198,628,867 | $-- | $14 |
The following is a summary of transfers between Level 1 and Level 2 for the period ended October 31, 2018. Transfers are assumed to have occurred at the beginning of the period, and are primarily attributable to the valuation techniques used for foreign equity securities, as discussed in the accompanying Notes to Financial Statements:
| Transfers | Total |
| Level 1 to Level 2 | $0 |
| Level 2 to Level 1 | $374,431,502 |
The following is a reconciliation of Investments in Securities for which Level 3 inputs were used in determining value:
| Investments in Securities: | |
| Equities - Industrials | |
| Beginning Balance | $16,532,055 |
| Net Realized Gain (Loss) on Investment Securities | (2,430,489) |
| Net Unrealized Gain (Loss) on Investment Securities | (2,765,044) |
| Cost of Purchases | 4,642,612 |
| Proceeds of Sales | (15,979,134) |
| Amortization/Accretion | -- |
| Transfers into Level 3 | -- |
| Transfers out of Level 3 | -- |
| Ending Balance | $-- |
| The change in unrealized gain (loss) for the period attributable to Level 3 securities held at October 31, 2018 | $-- |
| Other Investments in Securities | |
| Beginning Balance | $454,083 |
| Net Realized Gain (Loss) on Investment Securities | -- |
| Net Unrealized Gain (Loss) on Investment Securities | (454,069) |
| Cost of Purchases | -- |
| Proceeds of Sales | -- |
| Amortization/Accretion | -- |
| Transfers into Level 3 | -- |
| Transfers out of Level 3 | -- |
| Ending Balance | $14 |
| The change in unrealized gain (loss) for the period attributable to Level 3 securities held at October 31, 2018 | $(454,069) |
The information used in the above reconciliation represents fiscal year to date activity for any Investments in Securities identified as using Level 3 inputs at either the beginning or the end of the current fiscal period. Transfers in or out of Level 3 represent the beginning value of any Security or Instrument where a change in the pricing level occurred from the beginning to the end of the period. The cost of purchases and the proceeds of sales may include securities received or delivered through corporate actions or exchanges. Realized and unrealized gains (losses) disclosed in the reconciliation are included in Net Gain (Loss) on the Fund's Statement of Operations.
See accompanying notes which are an integral part of the financial statements.
Financial Statements
Statement of Assets and Liabilities
| | | October 31, 2018 |
| Assets | | |
Investment in securities, at value (including securities loaned of $11,123,160) — See accompanying schedule:
Unaffiliated issuers (cost $945,179,604) | $1,113,079,286 | |
| Fidelity Central Funds (cost $85,549,595) | 85,549,595 | |
| Total Investment in Securities (cost $1,030,729,199) | | $1,198,628,881 |
| Foreign currency held at value (cost $13,529) | | 13,529 |
| Receivable for investments sold | | 3,747,500 |
| Receivable for fund shares sold | | 8,403,412 |
| Dividends receivable | | 4,488,172 |
| Distributions receivable from Fidelity Central Funds | | 163,283 |
| Prepaid expenses | | 2,548 |
| Other receivables | | 31,785 |
| Total assets | | 1,215,479,110 |
| Liabilities | | |
| Payable for investments purchased | $2,223,374 | |
| Payable for fund shares redeemed | 1,334,350 | |
| Accrued management fee | 880,035 | |
| Distribution and service plan fees payable | 27,073 | |
| Other affiliated payables | 282,523 | |
| Other payables and accrued expenses | 332,881 | |
| Collateral on securities loaned | 11,460,422 | |
| Total liabilities | | 16,540,658 |
| Net Assets | | $1,198,938,452 |
| Net Assets consist of: | | |
| Paid in capital | | $1,012,690,294 |
| Total distributable earnings (loss) | | 186,248,158 |
| Net Assets | | $1,198,938,452 |
| Net Asset Value and Maximum Offering Price | | |
| Class A: | | |
| Net Asset Value and redemption price per share ($41,164,371 ÷ 2,375,836 shares) | | $17.33 |
| Maximum offering price per share (100/94.25 of $17.33) | | $18.39 |
| Class M: | | |
| Net Asset Value and redemption price per share ($13,245,166 ÷ 771,565 shares) | | $17.17 |
| Maximum offering price per share (100/96.50 of $17.17) | | $17.79 |
| Class C: | | |
| Net Asset Value and offering price per share ($14,461,134 ÷ 866,658 shares)(a) | | $16.69 |
| International Small Cap Opportunities: | | |
| Net Asset Value, offering price and redemption price per share ($965,482,329 ÷ 55,069,955 shares) | | $17.53 |
| Class I: | | |
| Net Asset Value, offering price and redemption price per share ($159,968,400 ÷ 9,137,598 shares) | | $17.51 |
| Class Z: | | |
| Net Asset Value, offering price and redemption price per share ($4,617,052 ÷ 263,741 shares) | | $17.51 |
(a) Redemption price per share is equal to net asset value less any applicable contingent deferred sales charge.
See accompanying notes which are an integral part of the financial statements.
Statement of Operations
| | | Year ended October 31, 2018 |
| Investment Income | | |
| Dividends | | $27,145,284 |
| Income from Fidelity Central Funds | | 1,073,733 |
| Income before foreign taxes withheld | | 28,219,017 |
| Less foreign taxes withheld | | (2,495,312) |
| Total income | | 25,723,705 |
| Expenses | | |
| Management fee | | |
| Basic fee | $10,686,972 | |
| Performance adjustment | (145,341) | |
| Transfer agent fees | 2,545,974 | |
| Distribution and service plan fees | 358,147 | |
| Accounting and security lending fees | 581,030 | |
| Custodian fees and expenses | 183,996 | |
| Independent trustees' fees and expenses | 6,307 | |
| Registration fees | 115,350 | |
| Audit | 69,609 | |
| Legal | 3,981 | |
| Miscellaneous | 8,475 | |
| Total expenses before reductions | 14,414,500 | |
| Expense reductions | (83,719) | |
| Total expenses after reductions | | 14,330,781 |
| Net investment income (loss) | | 11,392,924 |
| Realized and Unrealized Gain (Loss) | | |
| Net realized gain (loss) on: | | |
| Investment securities: | | |
| Unaffiliated issuers | 25,569,977 | |
| Fidelity Central Funds | (1,739) | |
| Foreign currency transactions | (97,551) | |
| Total net realized gain (loss) | | 25,470,687 |
| Change in net unrealized appreciation (depreciation) on: | | |
| Investment securities: | | |
| Unaffiliated issuers (net of increase in deferred foreign taxes of $205,432) | (105,461,299) | |
| Fidelity Central Funds | 647 | |
| Assets and liabilities in foreign currencies | (46,473) | |
| Total change in net unrealized appreciation (depreciation) | | (105,507,125) |
| Net gain (loss) | | (80,036,438) |
| Net increase (decrease) in net assets resulting from operations | | $(68,643,514) |
See accompanying notes which are an integral part of the financial statements.
Statement of Changes in Net Assets
| | Year ended October 31, 2018 | Year ended October 31, 2017 |
| Increase (Decrease) in Net Assets | | |
| Operations | | |
| Net investment income (loss) | $11,392,924 | $9,131,889 |
| Net realized gain (loss) | 25,470,687 | 41,561,179 |
| Change in net unrealized appreciation (depreciation) | (105,507,125) | 187,420,991 |
| Net increase (decrease) in net assets resulting from operations | (68,643,514) | 238,114,059 |
| Distributions to shareholders | (23,288,503) | – |
| Distributions to shareholders from net investment income | – | (10,624,038) |
| Distributions to shareholders from net realized gain | – | (2,566,511) |
| Total distributions | (23,288,503) | (13,190,549) |
| Share transactions - net increase (decrease) | 138,801,633 | (108,646,188) |
| Redemption fees | 14,959 | 188,947 |
| Total increase (decrease) in net assets | 46,884,575 | 116,466,269 |
| Net Assets | | |
| Beginning of period | 1,152,053,877 | 1,035,587,608 |
| End of period | $1,198,938,452 | $1,152,053,877 |
| Other Information | | |
| Undistributed net investment income end of period | | $8,057,934 |
See accompanying notes which are an integral part of the financial statements.
Financial Highlights
Fidelity International Small Cap Opportunities Fund Class A
| Years ended October 31, | 2018 | 2017 | 2016 | 2015 | 2014 |
| Selected Per–Share Data | | | | | |
| Net asset value, beginning of period | $18.47 | $14.82 | $14.75 | $13.65 | $13.68 |
| Income from Investment Operations | | | | | |
| Net investment income (loss)A | .12 | .10 | .09 | .06 | .05 |
| Net realized and unrealized gain (loss) | (.92) | 3.71 | .10 | 1.11 | .05 |
| Total from investment operations | (.80) | 3.81 | .19 | 1.17 | .10 |
| Distributions from net investment income | (.09) | (.12) | (.05) | (.05) | (.06) |
| Distributions from net realized gain | (.24) | (.04) | (.07) | (.02) | (.08) |
| Total distributions | (.34)B | (.16) | (.12) | (.07) | (.13)C |
| Redemption fees added to paid in capitalA,D | – | – | – | – | – |
| Net asset value, end of period | $17.33 | $18.47 | $14.82 | $14.75 | $13.65 |
| Total ReturnE,F | (4.48)% | 26.00% | 1.30% | 8.62% | .78% |
| Ratios to Average Net AssetsG,H | | | | | |
| Expenses before reductions | 1.38% | 1.43% | 1.45% | 1.52% | 1.63% |
| Expenses net of fee waivers, if any | 1.38% | 1.43% | 1.45% | 1.52% | 1.63% |
| Expenses net of all reductions | 1.37% | 1.43% | 1.45% | 1.51% | 1.63% |
| Net investment income (loss) | .65% | .61% | .62% | .38% | .33% |
| Supplemental Data | | | | | |
| Net assets, end of period (000 omitted) | $41,164 | $41,324 | $45,151 | $42,289 | $25,041 |
| Portfolio turnover rateI | 19% | 11% | 24% | 21% | 18% |
A Calculated based on average shares outstanding during the period.
B Total distributions of $.34 per share is comprised of distributions from net investment income of $.093 and distributions from net realized gain of $.243 per share.
C Total distributions of $.13 per share is comprised of distributions from net investment income of $.055 and distributions from net realized gain of $.079 per share.
D Amount represents less than $.005 per share.
E Total returns would have been lower if certain expenses had not been reduced during the applicable periods shown.
F Total returns do not include the effect of the sales charges.
G Fees and expenses of any underlying Fidelity Central Funds are not included in the Fund's expense ratio. The Fund indirectly bears its proportionate share of the expenses of any underlying Fidelity Central Funds.
H Expense ratios reflect operating expenses of the class. Expenses before reductions do not reflect amounts reimbursed by the investment adviser or reductions from brokerage service arrangements or reductions from other expense offset arrangements and do not represent the amount paid by the class during periods when reimbursements or reductions occur. Expenses net of fee waivers reflect expenses after reimbursement by the investment adviser but prior to reductions from brokerage service arrangements or other expense offset arrangements. Expenses net of all reductions represent the net expenses paid by the class.
I Amount does not include the portfolio activity of any underlying Fidelity Central Funds.
See accompanying notes which are an integral part of the financial statements.
Fidelity International Small Cap Opportunities Fund Class M
| Years ended October 31, | 2018 | 2017 | 2016 | 2015 | 2014 |
| Selected Per–Share Data | | | | | |
| Net asset value, beginning of period | $18.32 | $14.68 | $14.62 | $13.53 | $13.56 |
| Income from Investment Operations | | | | | |
| Net investment income (loss)A | .07 | .05 | .04 | .01 | .01 |
| Net realized and unrealized gain (loss) | (.92) | 3.69 | .10 | 1.11 | .06 |
| Total from investment operations | (.85) | 3.74 | .14 | 1.12 | .07 |
| Distributions from net investment income | (.06) | (.06) | (.01) | (.01) | (.02) |
| Distributions from net realized gain | (.24) | (.04) | (.07) | (.02) | (.08) |
| Total distributions | (.30) | (.10) | (.08) | (.03) | (.10) |
| Redemption fees added to paid in capitalA,B | – | – | – | – | – |
| Net asset value, end of period | $17.17 | $18.32 | $14.68 | $14.62 | $13.53 |
| Total ReturnC,D | (4.74)% | 25.63% | .95% | 8.27% | .55% |
| Ratios to Average Net AssetsE,F | | | | | |
| Expenses before reductions | 1.67% | 1.73% | 1.77% | 1.80% | 1.89% |
| Expenses net of fee waivers, if any | 1.67% | 1.73% | 1.77% | 1.80% | 1.89% |
| Expenses net of all reductions | 1.66% | 1.73% | 1.77% | 1.80% | 1.89% |
| Net investment income (loss) | .36% | .31% | .30% | .10% | .07% |
| Supplemental Data | | | | | |
| Net assets, end of period (000 omitted) | $13,245 | $14,422 | $12,308 | $13,296 | $9,913 |
| Portfolio turnover rateG | 19% | 11% | 24% | 21% | 18% |
A Calculated based on average shares outstanding during the period.
B Amount represents less than $.005 per share.
C Total returns would have been lower if certain expenses had not been reduced during the applicable periods shown.
D Total returns do not include the effect of the sales charges.
E Fees and expenses of any underlying Fidelity Central Funds are not included in the Fund's expense ratio. The Fund indirectly bears its proportionate share of the expenses of any underlying Fidelity Central Funds.
F Expense ratios reflect operating expenses of the class. Expenses before reductions do not reflect amounts reimbursed by the investment adviser or reductions from brokerage service arrangements or reductions from other expense offset arrangements and do not represent the amount paid by the class during periods when reimbursements or reductions occur. Expenses net of fee waivers reflect expenses after reimbursement by the investment adviser but prior to reductions from brokerage service arrangements or other expense offset arrangements. Expenses net of all reductions represent the net expenses paid by the class.
G Amount does not include the portfolio activity of any underlying Fidelity Central Funds.
See accompanying notes which are an integral part of the financial statements.
Fidelity International Small Cap Opportunities Fund Class C
| Years ended October 31, | 2018 | 2017 | 2016 | 2015 | 2014 |
| Selected Per–Share Data | | | | | |
| Net asset value, beginning of period | $17.84 | $14.27 | $14.26 | $13.23 | $13.28 |
| Income from Investment Operations | | | | | |
| Net investment income (loss)A | (.02) | (.03) | (.03) | (.05) | (.06) |
| Net realized and unrealized gain (loss) | (.89) | 3.60 | .09 | 1.08 | .06 |
| Total from investment operations | (.91) | 3.57 | .06 | 1.03 | – |
| Distributions from net investment income | – | – | – | – | – |
| Distributions from net realized gain | (.24) | – | (.05) | – | (.05) |
| Total distributions | (.24) | – | (.05) | – | (.05) |
| Redemption fees added to paid in capitalA,B | – | – | – | – | – |
| Net asset value, end of period | $16.69 | $17.84 | $14.27 | $14.26 | $13.23 |
| Total ReturnC,D | (5.19)% | 25.02% | .44% | 7.79% | .03% |
| Ratios to Average Net AssetsE,F | | | | | |
| Expenses before reductions | 2.15% | 2.22% | 2.26% | 2.27% | 2.38% |
| Expenses net of fee waivers, if any | 2.15% | 2.22% | 2.26% | 2.27% | 2.38% |
| Expenses net of all reductions | 2.14% | 2.21% | 2.25% | 2.26% | 2.38% |
| Net investment income (loss) | (.12)% | (.17)% | (.19)% | (.36)% | (.42)% |
| Supplemental Data | | | | | |
| Net assets, end of period (000 omitted) | $14,461 | $14,547 | $12,625 | $17,370 | $8,438 |
| Portfolio turnover rateG | 19% | 11% | 24% | 21% | 18% |
A Calculated based on average shares outstanding during the period.
B Amount represents less than $.005 per share.
C Total returns would have been lower if certain expenses had not been reduced during the applicable periods shown.
D Total returns do not include the effect of the contingent deferred sales charge.
E Fees and expenses of any underlying Fidelity Central Funds are not included in the Fund's expense ratio. The Fund indirectly bears its proportionate share of the expenses of any underlying Fidelity Central Funds.
F Expense ratios reflect operating expenses of the class. Expenses before reductions do not reflect amounts reimbursed by the investment adviser or reductions from brokerage service arrangements or reductions from other expense offset arrangements and do not represent the amount paid by the class during periods when reimbursements or reductions occur. Expenses net of fee waivers reflect expenses after reimbursement by the investment adviser but prior to reductions from brokerage service arrangements or other expense offset arrangements. Expenses net of all reductions represent the net expenses paid by the class.
G Amount does not include the portfolio activity of any underlying Fidelity Central Funds.
See accompanying notes which are an integral part of the financial statements.
Fidelity International Small Cap Opportunities Fund
| Years ended October 31, | 2018 | 2017 | 2016 | 2015 | 2014 |
| Selected Per–Share Data | | | | | |
| Net asset value, beginning of period | $18.69 | $15.00 | $14.91 | $13.80 | $13.82 |
| Income from Investment Operations | | | | | |
| Net investment income (loss)A | .18 | .15 | .13 | .10 | .09 |
| Net realized and unrealized gain (loss) | (.95) | 3.75 | .11 | 1.12 | .06 |
| Total from investment operations | (.77) | 3.90 | .24 | 1.22 | .15 |
| Distributions from net investment income | (.15) | (.17) | (.08) | (.09) | (.09) |
| Distributions from net realized gain | (.24) | (.04) | (.07) | (.02) | (.08) |
| Total distributions | (.39) | (.21) | (.15) | (.11) | (.17) |
| Redemption fees added to paid in capitalA,B | – | – | – | – | – |
| Net asset value, end of period | $17.53 | $18.69 | $15.00 | $14.91 | $13.80 |
| Total ReturnC | (4.25)% | 26.39% | 1.58% | 8.92% | 1.11% |
| Ratios to Average Net AssetsD,E | | | | | |
| Expenses before reductions | 1.10% | 1.13% | 1.17% | 1.23% | 1.30% |
| Expenses net of fee waivers, if any | 1.10% | 1.13% | 1.17% | 1.22% | 1.30% |
| Expenses net of all reductions | 1.09% | 1.13% | 1.16% | 1.22% | 1.30% |
| Net investment income (loss) | .93% | .91% | .90% | .68% | .65% |
| Supplemental Data | | | | | |
| Net assets, end of period (000 omitted) | $965,482 | $916,882 | $809,952 | $762,563 | $584,253 |
| Portfolio turnover rateF | 19% | 11% | 24% | 21% | 18% |
A Calculated based on average shares outstanding during the period.
B Amount represents less than $.005 per share.
C Total returns would have been lower if certain expenses had not been reduced during the applicable periods shown.
D Fees and expenses of any underlying Fidelity Central Funds are not included in the Fund's expense ratio. The Fund indirectly bears its proportionate share of the expenses of any underlying Fidelity Central Funds.
E Expense ratios reflect operating expenses of the class. Expenses before reductions do not reflect amounts reimbursed by the investment adviser or reductions from brokerage service arrangements or reductions from other expense offset arrangements and do not represent the amount paid by the class during periods when reimbursements or reductions occur. Expenses net of fee waivers reflect expenses after reimbursement by the investment adviser but prior to reductions from brokerage service arrangements or other expense offset arrangements. Expenses net of all reductions represent the net expenses paid by the class.
F Amount does not include the portfolio activity of any underlying Fidelity Central Funds.
See accompanying notes which are an integral part of the financial statements.
Fidelity International Small Cap Opportunities Fund Class I
| Years ended October 31, | 2018 | 2017 | 2016 | 2015 | 2014 |
| Selected Per–Share Data | | | | | |
| Net asset value, beginning of period | $18.66 | $14.99 | $14.91 | $13.81 | $13.83 |
| Income from Investment Operations | | | | | |
| Net investment income (loss)A | .18 | .15 | .13 | .10 | .08 |
| Net realized and unrealized gain (loss) | (.94) | 3.74 | .10 | 1.13 | .07 |
| Total from investment operations | (.76) | 3.89 | .23 | 1.23 | .15 |
| Distributions from net investment income | (.15) | (.18) | (.08) | (.11) | (.09) |
| Distributions from net realized gain | (.24) | (.04) | (.07) | (.02) | (.08) |
| Total distributions | (.39) | (.22) | (.15) | (.13) | (.17) |
| Redemption fees added to paid in capitalA,B | – | – | – | – | – |
| Net asset value, end of period | $17.51 | $18.66 | $14.99 | $14.91 | $13.81 |
| Total ReturnC | (4.21)% | 26.34% | 1.56% | 8.98% | 1.11% |
| Ratios to Average Net AssetsD,E | | | | | |
| Expenses before reductions | 1.12% | 1.14% | 1.16% | 1.19% | 1.36% |
| Expenses net of fee waivers, if any | 1.12% | 1.14% | 1.16% | 1.19% | 1.36% |
| Expenses net of all reductions | 1.11% | 1.14% | 1.16% | 1.18% | 1.36% |
| Net investment income (loss) | .91% | .90% | .91% | .71% | .60% |
| Supplemental Data | | | | | |
| Net assets, end of period (000 omitted) | $159,968 | $164,878 | $155,551 | $120,723 | $29,822 |
| Portfolio turnover rateF | 19% | 11% | 24% | 21% | 18% |
A Calculated based on average shares outstanding during the period.
B Amount represents less than $.005 per share.
C Total returns would have been lower if certain expenses had not been reduced during the applicable periods shown.
D Fees and expenses of any underlying Fidelity Central Funds are not included in the Fund's expense ratio. The Fund indirectly bears its proportionate share of the expenses of any underlying Fidelity Central Funds.
E Expense ratios reflect operating expenses of the class. Expenses before reductions do not reflect amounts reimbursed by the investment adviser or reductions from brokerage service arrangements or reductions from other expense offset arrangements and do not represent the amount paid by the class during periods when reimbursements or reductions occur. Expenses net of fee waivers reflect expenses after reimbursement by the investment adviser but prior to reductions from brokerage service arrangements or other expense offset arrangements. Expenses net of all reductions represent the net expenses paid by the class.
F Amount does not include the portfolio activity of any underlying Fidelity Central Funds.
See accompanying notes which are an integral part of the financial statements.
Fidelity International Small Cap Opportunities Fund Class Z
| Year ended October 31, | 2018 A |
| Selected Per–Share Data | |
| Net asset value, beginning of period | $19.11 |
| Income from Investment Operations | |
| Net investment income (loss)B | –C |
| Net realized and unrealized gain (loss) | (1.60) |
| Total from investment operations | (1.60) |
| Distributions from net investment income | – |
| Distributions from net realized gain | – |
| Total distributions | – |
| Net asset value, end of period | $17.51 |
| Total ReturnD,E | (8.37)% |
| Ratios to Average Net AssetsF,G | |
| Expenses before reductions | 1.03%H |
| Expenses net of fee waivers, if any | 1.03%H |
| Expenses net of all reductions | 1.02%H |
| Net investment income (loss) | .16%H |
| Supplemental Data | |
| Net assets, end of period (000 omitted) | $4,617 |
| Portfolio turnover rateI | 19% |
A For the period October 2, 2018 (commencement of sale of shares) to October 31, 2018.
B Calculated based on average shares outstanding during the period.
C Amount represents less than $.005 per share.
D Total returns for periods of less than one year are not annualized.
E Total returns would have been lower if certain expenses had not been reduced during the applicable periods shown.
F Fees and expenses of any underlying Fidelity Central Funds are not included in the Fund's expense ratio. The Fund indirectly bears its proportionate share of the expenses of any underlying Fidelity Central Funds.
G Expense ratios reflect operating expenses of the class. Expenses before reductions do not reflect amounts reimbursed by the investment adviser or reductions from brokerage service arrangements or reductions from other expense offset arrangements and do not represent the amount paid by the class during periods when reimbursements or reductions occur. Expense ratios before reductions for start-up periods may not be representative of longer-term operating periods. Expenses net of fee waivers reflect expenses after reimbursement by the investment adviser but prior to reductions from brokerage service arrangements or other expense offset arrangements. Expenses net of all reductions represent the net expenses paid by the class.
H Annualized
I Amount does not include the portfolio activity of any underlying Fidelity Central Funds.
See accompanying notes which are an integral part of the financial statements.
Notes to Financial Statements
For the period ended October 31, 2018
1. Organization.
Fidelity International Small Cap Opportunities Fund (the Fund) is a fund of Fidelity Investment Trust (the Trust) and is authorized to issue an unlimited number of shares. The Trust is registered under the Investment Company Act of 1940, as amended (the 1940 Act), as an open-end management investment company organized as a Massachusetts business trust. The Fund commenced sale of Class Z shares on October 2, 2018. The Fund offers Class A, Class M, Class C, International Small Cap Opportunities, Class I and Class Z shares, each of which has equal rights as to assets and voting privileges. Each class has exclusive voting rights with respect to matters that affect that class.
2. Investments in Fidelity Central Funds.
The Fund invests in Fidelity Central Funds, which are open-end investment companies generally available only to other investment companies and accounts managed by the investment adviser and its affiliates. The Fund's Schedule of Investments lists each of the Fidelity Central Funds held as of period end, if any, as an investment of the Fund, but does not include the underlying holdings of each Fidelity Central Fund. As an Investing Fund, the Fund indirectly bears its proportionate share of the expenses of the underlying Fidelity Central Funds.
The Money Market Central Funds seek preservation of capital and current income and are managed by Fidelity Investments Money Management, Inc. (FIMM), an affiliate of the investment adviser. Annualized expenses of the Money Market Central Funds as of their most recent shareholder report date are less than .005%.
A complete unaudited list of holdings for each Fidelity Central Fund is available upon request or at the Securities and Exchange Commission (the SEC) website at www.sec.gov. In addition, the financial statements of the Fidelity Central Funds, which are not covered by the Fund's Report of Independent Registered Public Accounting Firm, are available on the SEC website or upon request.
3. Significant Accounting Policies.
The Fund is an investment company and applies the accounting and reporting guidance of the Financial Accounting Standards Board (FASB) Accounting Standards Codification Topic 946 Financial Services – Investments Companies. The financial statements have been prepared in conformity with accounting principles generally accepted in the United States of America (GAAP), which require management to make certain estimates and assumptions at the date of the financial statements. Actual results could differ from those estimates. Subsequent events, if any, through the date that the financial statements were issued have been evaluated in the preparation of the financial statements. The following summarizes the significant accounting policies of the Fund:
Investment Valuation. Investments are valued as of 4:00 p.m. Eastern time on the last calendar day of the period. The Board of Trustees (the Board) has delegated the day to day responsibility for the valuation of the Fund's investments to the Fair Value Committee (the Committee) established by the Fund's investment adviser. In accordance with valuation policies and procedures approved by the Board, the Fund attempts to obtain prices from one or more third party pricing vendors or brokers to value its investments. When current market prices, quotations or currency exchange rates are not readily available or reliable, investments will be fair valued in good faith by the Committee, in accordance with procedures adopted by the Board. Factors used in determining fair value vary by investment type and may include market or investment specific events. The frequency with which these procedures are used cannot be predicted and they may be utilized to a significant extent. The Committee oversees the Fund's valuation policies and procedures and reports to the Board on the Committee's activities and fair value determinations. The Board monitors the appropriateness of the procedures used in valuing the Fund's investments and ratifies the fair value determinations of the Committee.
The Fund categorizes the inputs to valuation techniques used to value its investments into a disclosure hierarchy consisting of three levels as shown below:
- Level 1 – quoted prices in active markets for identical investments
- Level 2 – other significant observable inputs (including quoted prices for similar investments, interest rates, prepayment speeds, etc.)
- Level 3 – unobservable inputs (including the Fund's own assumptions based on the best information available)
Valuation techniques used to value the Fund's investments by major category are as follows:
Equity securities, including restricted securities, for which market quotations are readily available, are valued at the last reported sale price or official closing price as reported by a third party pricing vendor on the primary market or exchange on which they are traded and are categorized as Level 1 in the hierarchy. In the event there were no sales during the day or closing prices are not available, securities are valued at the last quoted bid price or may be valued using the last available price and are generally categorized as Level 2 in the hierarchy. For foreign equity securities, when market or security specific events arise, comparisons to the valuation of American Depositary Receipts (ADRs), futures contracts, Exchange-Traded Funds (ETFs) and certain indexes as well as quoted prices for similar securities may be used and would be categorized as Level 2 in the hierarchy. Utilizing these techniques may result in transfers between Level 1 and Level 2. For equity securities, including restricted securities, where observable inputs are limited, assumptions about market activity and risk are used and these securities may be categorized as Level 3 in the hierarchy.
ETFs are valued at their last sale price or official closing price as reported by a third party pricing vendor on the primary market or exchange on which they are traded and are categorized as Level 1 in the hierarchy. In the event there were no sales during the day but the exchange reports a closing bid level, ETFs are valued at the closing bid and would be categorized as Level 1 in the hierarchy. In the event there was no closing bid, ETFs may be valued by another method that the Board believes reflects fair value in accordance with the Board's fair value pricing policies and may be categorized as Level 2 in the hierarchy.
Investments in open-end mutual funds, including the Fidelity Central Funds, are valued at their closing net asset value (NAV) each business day and are categorized as Level 1 in the hierarchy.
Changes in valuation techniques may result in transfers in or out of an assigned level within the disclosure hierarchy. The aggregate value of investments by input level as of October 31, 2018 including information on transfers between Levels 1 and 2, as well as a roll forward of Level 3 investments, is included at the end of the Fund's Schedule of Investments.
Foreign Currency. The Fund may use foreign currency contracts to facilitate transactions in foreign-denominated securities. Gains and losses from these transactions may arise from changes in the value of the foreign currency or if the counterparties do not perform under the contracts' terms.
Foreign-denominated assets, including investment securities, and liabilities are translated into U.S. dollars at the exchange rates at period end. Purchases and sales of investment securities, income and dividends received and expenses denominated in foreign currencies are translated into U.S. dollars at the exchange rate in effect on the transaction date.
The effects of exchange rate fluctuations on investments are included with the net realized and unrealized gain (loss) on investment securities. Other foreign currency transactions resulting in realized and unrealized gain (loss) are disclosed separately.
Investment Transactions and Income. For financial reporting purposes, the Fund's investment holdings and NAV include trades executed through the end of the last business day of the period. The NAV per share for processing shareholder transactions is calculated as of the close of business of the New York Stock Exchange (NYSE), normally 4:00 p.m. Eastern time and includes trades executed through the end of the prior business day. Gains and losses on securities sold are determined on the basis of identified cost and include proceeds received from litigation. Dividend income is recorded on the ex-dividend date, except for certain dividends from foreign securities where the ex-dividend date may have passed, which are recorded as soon as the Fund is informed of the ex-dividend date. Non-cash dividends included in dividend income, if any, are recorded at the fair market value of the securities received. Income and capital gain distributions from Fidelity Central Funds, if any, are recorded on the ex-dividend date. Certain distributions received by the Fund represent a return of capital or capital gain. The Fund determines the components of these distributions subsequent to the ex-dividend date, based upon receipt of tax filings or other correspondence relating to the underlying investment. These distributions are recorded as a reduction of cost of investments and/or as a realized gain. Investment income is recorded net of foreign taxes withheld where recovery of such taxes is uncertain.
Class Allocations and Expenses. Investment income, realized and unrealized capital gains and losses, common expenses of the Fund, and certain fund-level expense reductions, if any, are allocated daily on a pro-rata basis to each class based on the relative net assets of each class to the total net assets of the Fund. Each class differs with respect to transfer agent and distribution and service plan fees incurred. Certain expense reductions may also differ by class. For the reporting period, the allocated portion of income and expenses to each class as a percent of its average net assets may vary due to the timing of recording these transactions in relation to fluctuating net assets of the classes. Expenses directly attributable to a fund are charged to that fund. Expenses attributable to more than one fund are allocated among the respective funds on the basis of relative net assets or other appropriate methods. Expense estimates are accrued in the period to which they relate and adjustments are made when actual amounts are known.
Income Tax Information and Distributions to Shareholders. Each year, the Fund intends to qualify as a regulated investment company under Subchapter M of the Internal Revenue Code, including distributing substantially all of its taxable income and realized gains. As a result, no provision for U.S. Federal income taxes is required. As of October 31, 2018, the Fund did not have any unrecognized tax benefits in the financial statements; nor is the Fund aware of any tax positions for which it is reasonably possible that the total amounts of unrecognized tax benefits will significantly change in the next twelve months. The Fund files a U.S. federal tax return, in addition to state and local tax returns as required. The Fund's federal income tax returns are subject to examination by the Internal Revenue Service (IRS) for a period of three fiscal years after they are filed. State and local tax returns may be subject to examination for an additional fiscal year depending on the jurisdiction. Foreign taxes are provided for based on the Fund's understanding of the tax rules and rates that exist in the foreign markets in which it invests. The Fund is subject to a tax imposed on capital gains by certain countries in which it invests. An estimated deferred tax liability for net unrealized appreciation on the applicable securities is included in Other payables and accrued expenses on the Statement of Assets & Liabilities.
Distributions are declared and recorded on the ex-dividend date. Income and capital gain distributions are declared separately for each class. Income and capital gain distributions are determined in accordance with income tax regulations, which may differ from GAAP.
Capital accounts within the financial statements are adjusted for permanent book-tax differences. These adjustments have no impact on net assets or the results of operations. Capital accounts are not adjusted for temporary book-tax differences which will reverse in a subsequent period.
Book-tax differences are primarily due to foreign currency transactions, passive foreign investment companies (PFIC) and losses deferred due to wash sales.
As of period end, the cost and unrealized appreciation (depreciation) in securities, and derivatives if applicable, for federal income tax purposes were as follows:
| Gross unrealized appreciation | $252,708,344 |
| Gross unrealized depreciation | (98,145,275) |
| Net unrealized appreciation (depreciation) | $154,563,069 |
| Tax Cost | $1,044,065,812 |
The tax-based components of distributable earnings as of period end were as follows:
| Undistributed ordinary income | $11,992,475 |
| Undistributed long-term capital gain | $19,946,356 |
| Net unrealized appreciation (depreciation) on securities and other investments | $154,514,759 |
The tax character of distributions paid was as follows:
| | October 31, 2018 | October 31, 2017 |
| Ordinary Income | $23,288,503 | $ 13,190,549 |
Short-Term Trading (Redemption) Fees. During the period, shares held by investors in the Fund less than 90 days may have been subject to a redemption fee equal to 2.00% of the NAV of shares redeemed. All redemption fees, which reduce the proceeds of the shareholder redemption, are retained by the Fund and accounted for as an addition to paid in capital. In November 2017, the Board of Trustees approved the elimination of these redemption fees effective December 18, 2017.
Restricted Securities. The Fund may invest in securities that are subject to legal or contractual restrictions on resale. These securities generally may be resold in transactions exempt from registration or to the public if the securities are registered. Disposal of these securities may involve time-consuming negotiations and expense, and prompt sale at an acceptable price may be difficult. Information regarding restricted securities is included at the end of the Fund's Schedule of Investments.
New Rule Issuance. During August 2018, the U.S. Securities and Exchange Commission issued Final Rule Release No. 33-10532, Disclosure Update and Simplification. This Final Rule includes amendments specific to registered investment companies that are intended to eliminate overlap in disclosure requirements between Regulation S-X and GAAP. In accordance with these amendments, certain line-items in the Fund's financial statements have been combined or removed for the current period as outlined in the table below.
| Financial Statement | Current Line-Item Presentation | Prior Line-Item Presentation |
| Statement of Assets and Liabilities | Total distributable earnings (loss) | Undistributed/Distributions in excess of/Accumulated net investment income (loss)
Accumulated/Undistributed net realized gain (loss)
Net unrealized appreciation (depreciation) |
| Statement of Changes in Net Assets | N/A - removed | Undistributed/Distributions in excess of/Accumulated net investment income (loss) end of period |
| Statement of Changes in Net Assets | Distributions to shareholders | Distributions to shareholders from net investment income
Distributions to shareholders from net realized gain |
| Distributions to Shareholders Note to Financial Statements | Distributions to shareholders | Distributions to shareholders from net investment income
Distributions to shareholders from net realized gain |
4. Purchases and Sales of Investments.
Purchases and sales of securities, other than short-term securities, aggregated $323,088,886 and $231,920,121, respectively.
5. Fees and Other Transactions with Affiliates.
Management Fee. Fidelity Management & Research Company (the investment adviser) and its affiliates provide the Fund with investment management related services for which the Fund pays a monthly management fee. The management fee is the sum of an individual fund fee rate that is based on an annual rate of .60% of the Fund's average net assets and an annualized group fee rate that averaged .24% during the period. The group fee rate is based upon the average net assets of all the mutual funds advised by the investment adviser, including any mutual funds previously advised by the investment adviser that are currently advised by Fidelity SelectCo, LLC, an affiliate of the investment adviser. The group fee rate decreases as assets under management increase and increases as assets under management decrease. In addition, the management fee is subject to a performance adjustment (up to a maximum of +/- .20% of the Fund's average net assets over a 36 month performance period). The upward or downward adjustment to the management fee is based on the relative investment performance of International Small Cap Opportunities as compared to its benchmark index, the MSCI EAFE Small Cap Index, over the same 36 month performance period. For the reporting period, the total annual management fee rate, including the performance adjustment, was .83% of the Fund's average net assets. The performance adjustment included in the management fee rate may be higher or lower than the maximum performance adjustment rate due to the difference between the average net assets for the reporting and performance periods.
Distribution and Service Plan Fees. In accordance with Rule 12b-1 of the 1940 Act, the Fund has adopted separate Distribution and Service Plans for each class of shares. Certain classes pay Fidelity Distributors Corporation (FDC), an affiliate of the investment adviser, separate Distribution and Service Fees, each of which is based on an annual percentage of each class' average net assets. In addition, FDC may pay financial intermediaries for selling shares of the Fund and providing shareholder support services. For the period, the Distribution and Service Fee rates, total fees and amounts retained by FDC were as follows:
| | Distribution Fee | Service Fee | Total Fees | Retained by FDC |
| Class A | -% | .25% | $114,904 | $4,506 |
| Class M | .25% | .25% | 76,670 | 1,966 |
| Class C | .75% | .25% | 166,573 | 24,547 |
| | | | $358,147 | $31,019 |
Sales Load. FDC may receive a front-end sales charge of up to 5.75% for selling Class A shares and 3.50% for selling Class M shares, some of which is paid to financial intermediaries for selling shares of the Fund. Depending on the holding period, FDC may receive contingent deferred sales charges levied on Class A, Class M and Class C redemptions. The deferred sales charges are 1.00% for Class C shares, 1.00% for certain purchases of Class A shares and .25% for certain purchases of Class M shares.
For the period, sales charge amounts retained by FDC were as follows:
| | Retained by FDC |
| Class A | $21,917 |
| Class M | 4,238 |
| Class C(a) | 4,114 |
| | $30,269 |
(a) When Class C shares are initially sold, FDC pays commissions from its own resources to financial intermediaries through which the sales are made.
Transfer Agent Fees. Fidelity Investments Institutional Operations Company, Inc., (FIIOC), an affiliate of the investment adviser, is the transfer, dividend disbursing and shareholder servicing agent for each class of the Fund. FIIOC receives account fees and asset-based fees that vary according to the account size and type of account of the shareholders of the respective classes of the Fund, except for Class Z. FIIOC receives an asset-based fee of Class Z's average net assets. FIIOC pays for typesetting, printing and mailing of shareholder reports, except proxy statements.
For the period, transfer agent fees for each class were as follows:
| | Amount | % of Class-Level Average Net Assets |
| Class A | $103,952 | .23 |
| Class M | 40,173 | .26 |
| Class C | 40,793 | .24 |
| International Small Cap Opportunities | 1,948,710 | .19 |
| Class I | 412,319 | .21 |
| Class Z | 27 | .04(a) |
| | $2,545,974 | |
(a) Annualized
Accounting and Security Lending Fees. Fidelity Service Company, Inc. (FSC), an affiliate of the investment adviser, maintains the Fund's accounting records. The accounting fee is based on the level of average net assets for each month. Under a separate contract, FSC administers the security lending program. The security lending fee is based on the number and duration of lending transactions. For the period, the fees were equivalent to an annual rate of .05%.
Brokerage Commissions. The Fund placed a portion of its portfolio transactions with brokerage firms which are affiliates of the investment adviser. Brokerage commissions are included in net realized gain (loss) and change in net unrealized appreciation (depreciation) in the Statement of Operations. The commissions paid to these affiliated firms were $508 for the period.
Interfund Trades. The Fund may purchase from or sell securities to other Fidelity Funds under procedures adopted by the Board. The procedures have been designed to ensure these interfund trades are executed in accordance with Rule 17a-7 of the 1940 Act. Interfund trades are included within the respective purchases and sales amounts shown in the Purchases and Sales of Investments note.
6. Committed Line of Credit.
The Fund participates with other funds managed by the investment adviser or an affiliate in a $4.25 billion credit facility (the "line of credit") to be utilized for temporary or emergency purposes to fund shareholder redemptions or for other short-term liquidity purposes. The Fund has agreed to pay commitment fees on its pro-rata portion of the line of credit, which amounted to $3,433 and is reflected in Miscellaneous expenses on the Statement of Operations. During the period, the Fund did not borrow on this line of credit.
7. Security Lending.
The Fund lends portfolio securities through a lending agent from time to time in order to earn additional income. For equity securities, a lending agent is used and may loan securities to certain qualified borrowers, including Fidelity Capital Markets (FCM), a broker-dealer affiliated with the Fund. On the settlement date of the loan, the Fund receives collateral (in the form of U.S. Treasury obligations, letters of credit and/or cash) against the loaned securities and maintains collateral in an amount not less than 100% of the market value of the loaned securities during the period of the loan. The market value of the loaned securities is determined at the close of business of the Fund and any additional required collateral is delivered to the Fund on the next business day. The Fund or borrower may terminate the loan at any time, and if the borrower defaults on its obligation to return the securities loaned because of insolvency or other reasons, the Fund may apply collateral received from the borrower against the obligation. The Fund may experience delays and costs in recovering the securities loaned. Any cash collateral received is invested in the Fidelity Securities Lending Cash Central Fund. The value of loaned securities and cash collateral at period end are disclosed on the Fund's Statement of Assets and Liabilities. At period end, there were no security loans outstanding with FCM. Security lending income represents the income earned on investing cash collateral, less rebates paid to borrowers and any lending agent fees associated with the loan, plus any premium payments received for lending certain types of securities. Security lending income is presented in the Statement of Operations as a component of income from Fidelity Central Funds. Total security lending income during the period amounted to $112,732, including $171 from securities loaned to FCM.
8. Expense Reductions.
Commissions paid to certain brokers with whom the investment adviser, or its affiliates, places trades on behalf of the Fund include an amount in addition to trade execution, which may be rebated back to the Fund to offset certain expenses. This amount totaled $71,803 for the period. Through arrangements with the Fund's custodian, credits realized as a result of certain uninvested cash balances were used to reduce the Fund's expenses. During the period, these credits reduced the Fund's custody expenses by $372.
In addition, during the period the investment adviser reimbursed and/or waived a portion of fund-level operating expenses in the amount of $11,544.
9. Distributions to Shareholders.
Distributions to shareholders of each class were as follows:
| | Year ended
October 31, 2018 | Year ended
October 31, 2017 |
| Distributions to shareholders | | |
| Class A | $756,833 | $– |
| Class M | 237,606 | – |
| Class C | 199,761 | – |
| International Small Cap Opportunities | 18,505,353 | – |
| Class I | 3,588,950 | – |
| Total | $23,288,503 | $– |
| From net investment income | | |
| Class A | $– | $345,589 |
| Class M | – | 44,101 |
| International Small Cap Opportunities | – | 8,436,166 |
| Class I | – | 1,798,182 |
| Total | $– | $10,624,038 |
| From net realized gain | | |
| Class A | $– | $117,149 |
| Class M | – | 32,073 |
| International Small Cap Opportunities | – | 2,008,611 |
| Class I | – | 408,678 |
| Total | $– | $2,566,511 |
10. Share Transactions.
Share transactions for each class were as follows and may contain automatic conversions between classes or exchanges between affiliated funds:
| | Shares | Shares | Dollars | Dollars |
| | Year ended October 31, 2018(a) | Year ended October 31, 2017 | Year ended October 31, 2018(a) | Year ended October 31, 2017 |
| Class A | | | | |
| Shares sold | 659,827 | 617,618 | $12,815,405 | $9,892,785 |
| Reinvestment of distributions | 39,412 | 30,743 | 734,649 | 441,465 |
| Shares redeemed | (560,866) | (1,457,378) | (10,795,406) | (22,890,236) |
| Net increase (decrease) | 138,373 | (809,017) | $2,754,648 | $(12,555,986) |
| Class M | | | | |
| Shares sold | 195,023 | 184,978 | $3,737,868 | $3,117,188 |
| Reinvestment of distributions | 12,748 | 5,229 | 235,975 | 74,674 |
| Shares redeemed | (223,377) | (241,247) | (4,246,469) | (3,797,029) |
| Net increase (decrease) | (15,606) | (51,040) | $(272,626) | $(605,167) |
| Class C | | | | |
| Shares sold | 289,466 | 166,898 | $5,517,711 | $2,711,727 |
| Reinvestment of distributions | 10,900 | – | 196,970 | – |
| Shares redeemed | (248,989) | (236,034) | (4,607,733) | (3,599,444) |
| Net increase (decrease) | 51,377 | (69,136) | $1,106,948 | $(887,717) |
| International Small Cap Opportunities | | | | |
| Shares sold | 18,665,452 | 8,291,089 | $367,097,669 | $139,007,305 |
| Reinvestment of distributions | 814,355 | 594,332 | 15,335,912 | 8,611,863 |
| Shares redeemed | (13,474,898) | (13,816,436) | (259,980,891) | (218,659,907) |
| Net increase (decrease) | 6,004,909 | (4,931,015) | $122,452,690 | $(71,040,739) |
| Class I | | | | |
| Shares sold | 5,599,350 | 4,860,065 | $109,721,452 | $80,212,539 |
| Reinvestment of distributions | 153,156 | 138,286 | 2,881,165 | 2,000,992 |
| Shares redeemed | (5,449,347) | (6,539,728) | (104,456,236) | (105,770,110) |
| Net increase (decrease) | 303,159 | (1,541,377) | $8,146,381 | $(23,556,579) |
| Class Z | | | | |
| Shares sold | 265,126 | – | $4,637,404 | $– |
| Shares redeemed | (1,385) | – | (23,812) | – |
| Net increase (decrease) | 263,741 | – | $4,613,592 | $– |
(a) Share transactions for Class Z are for the period October 2, 2018 (commencement of sale of shares) to October 31, 2018
11. Other.
The Fund's organizational documents provide former and current trustees and officers with a limited indemnification against liabilities arising in connection with the performance of their duties to the Fund. In the normal course of business, the Fund may also enter into contracts that provide general indemnifications. The Fund's maximum exposure under these arrangements is unknown as this would be dependent on future claims that may be made against the Fund. The risk of material loss from such claims is considered remote.
Report of Independent Registered Public Accounting Firm
To the Trustees of Fidelity Investment Trust and Shareholders of Fidelity International Small Cap Opportunities Fund:
Opinion on the Financial Statements and Financial Highlights
We have audited the accompanying statement of assets and liabilities of Fidelity International Small Cap Opportunities Fund (the "Fund"), a fund of Fidelity Investment Trust, including the schedule of investments, as of October 31, 2018, and the related statement of operations for the year then ended, the statement of changes in net assets for each of the two years in the period then ended, the financial highlights for each of the five years in the period then ended, and the related notes. In our opinion, the financial statements and financial highlights present fairly, in all material respects, the financial position of the Fund as of October 31, 2018, and the results of its operations for the year then ended, the changes in its net assets for each of the two years in the period then ended, and the financial highlights for each of the five years in the period then ended, in conformity with accounting principles generally accepted in the United States of America.
Basis for Opinion
These financial statements and financial highlights are the responsibility of the Fund's management. Our responsibility is to express an opinion on the Fund's financial statements and financial highlights based on our audits. We are a public accounting firm registered with the Public Company Accounting Oversight Board (United States) (PCAOB) and are required to be independent with respect to the Fund in accordance with the U.S. federal securities laws and the applicable rules and regulations of the Securities and Exchange Commission and the PCAOB.
We conducted our audits in accordance with the standards of the PCAOB. Those standards require that we plan and perform the audit to obtain reasonable assurance about whether the financial statements and financial highlights are free of material misstatement, whether due to error or fraud. The Fund is not required to have, nor were we engaged to perform, an audit of its internal control over financial reporting. As part of our audits we are required to obtain an understanding of internal control over financial reporting but not for the purpose of expressing an opinion on the effectiveness of the Fund’s internal control over financial reporting. Accordingly, we express no such opinion.
Our audits included performing procedures to assess the risks of material misstatement of the financial statements and financial highlights, whether due to error or fraud, and performing procedures that respond to those risks. Such procedures included examining, on a test basis, evidence regarding the amounts and disclosures in the financial statements and financial highlights. Our audits also included evaluating the accounting principles used and significant estimates made by management, as well as evaluating the overall presentation of the financial statements and financial highlights. Our procedures included confirmation of securities owned as of October 31, 2018, by correspondence with the custodians and brokers; when replies were not received from brokers, we performed other auditing procedures. We believe that our audits provide a reasonable basis for our opinion.
/s/ Deloitte & Touche LLP
Boston, Massachusetts
December 13, 2018
We have served as the auditor of one or more of the Fidelity investment companies since 1999.
Trustees and Officers
The Trustees, Members of the Advisory Board (if any), and officers of the trust and fund, as applicable, are listed below. The Board of Trustees governs the fund and is responsible for protecting the interests of shareholders. The Trustees are experienced executives who meet periodically throughout the year to oversee the fund's activities, review contractual arrangements with companies that provide services to the fund, oversee management of the risks associated with such activities and contractual arrangements, and review the fund's performance. Except for Jonathan Chiel, each of the Trustees oversees 283 funds. Mr. Chiel oversees 154 funds.
The Trustees hold office without limit in time except that (a) any Trustee may resign; (b) any Trustee may be removed by written instrument, signed by at least two-thirds of the number of Trustees prior to such removal; (c) any Trustee who requests to be retired or who has become incapacitated by illness or injury may be retired by written instrument signed by a majority of the other Trustees; and (d) any Trustee may be removed at any special meeting of shareholders by a two-thirds vote of the outstanding voting securities of the trust. Each Trustee who is not an interested person (as defined in the 1940 Act) of the trust and the fund is referred to herein as an Independent Trustee. Each Independent Trustee shall retire not later than the last day of the calendar year in which his or her 75th birthday occurs. The Independent Trustees may waive this mandatory retirement age policy with respect to individual Trustees. Officers and Advisory Board Members hold office without limit in time, except that any officer or Advisory Board Member may resign or may be removed by a vote of a majority of the Trustees at any regular meeting or any special meeting of the Trustees. Except as indicated, each individual has held the office shown or other offices in the same company for the past five years.
The fund’s Statement of Additional Information (SAI) includes more information about the Trustees. To request a free copy, call Fidelity at 1-800-544-8544.
Experience, Skills, Attributes, and Qualifications of the Trustees. The Governance and Nominating Committee has adopted a statement of policy that describes the experience, qualifications, attributes, and skills that are necessary and desirable for potential Independent Trustee candidates (Statement of Policy). The Board believes that each Trustee satisfied at the time he or she was initially elected or appointed a Trustee, and continues to satisfy, the standards contemplated by the Statement of Policy. The Governance and Nominating Committee also engages professional search firms to help identify potential Independent Trustee candidates who have the experience, qualifications, attributes, and skills consistent with the Statement of Policy. From time to time, additional criteria based on the composition and skills of the current Independent Trustees, as well as experience or skills that may be appropriate in light of future changes to board composition, business conditions, and regulatory or other developments, have also been considered by the professional search firms and the Governance and Nominating Committee. In addition, the Board takes into account the Trustees' commitment and participation in Board and committee meetings, as well as their leadership of standing and ad hoc committees throughout their tenure.
In determining that a particular Trustee was and continues to be qualified to serve as a Trustee, the Board has considered a variety of criteria, none of which, in isolation, was controlling. The Board believes that, collectively, the Trustees have balanced and diverse experience, qualifications, attributes, and skills, which allow the Board to operate effectively in governing the fund and protecting the interests of shareholders. Information about the specific experience, skills, attributes, and qualifications of each Trustee, which in each case led to the Board's conclusion that the Trustee should serve (or continue to serve) as a trustee of the fund, is provided below.
Board Structure and Oversight Function. James C. Curvey is an interested person and currently serves as Chairman. The Trustees have determined that an interested Chairman is appropriate and benefits shareholders because an interested Chairman has a personal and professional stake in the quality and continuity of services provided to the fund. Independent Trustees exercise their informed business judgment to appoint an individual of their choosing to serve as Chairman, regardless of whether the Trustee happens to be independent or a member of management. The Independent Trustees have determined that they can act independently and effectively without having an Independent Trustee serve as Chairman and that a key structural component for assuring that they are in a position to do so is for the Independent Trustees to constitute a substantial majority for the Board. The Independent Trustees also regularly meet in executive session. Ned C. Lautenbach serves as Chairman of the Independent Trustees and as such (i) acts as a liaison between the Independent Trustees and management with respect to matters important to the Independent Trustees and (ii) with management prepares agendas for Board meetings.
Fidelity® funds are overseen by different Boards of Trustees. The fund's Board oversees Fidelity's high income and certain equity funds, and other Boards oversee Fidelity's investment-grade bond, money market, asset allocation, and other equity funds. The asset allocation funds may invest in Fidelity® funds overseen by the fund's Board. The use of separate Boards, each with its own committee structure, allows the Trustees of each group of Fidelity® funds to focus on the unique issues of the funds they oversee, including common research, investment, and operational issues. On occasion, the separate Boards establish joint committees to address issues of overlapping consequences for the Fidelity® funds overseen by each Board.
The Trustees operate using a system of committees to facilitate the timely and efficient consideration of all matters of importance to the Trustees, the fund, and fund shareholders and to facilitate compliance with legal and regulatory requirements and oversight of the fund's activities and associated risks. The Board, acting through its committees, has charged FMR and its affiliates with (i) identifying events or circumstances the occurrence of which could have demonstrably adverse effects on the fund's business and/or reputation; (ii) implementing processes and controls to lessen the possibility that such events or circumstances occur or to mitigate the effects of such events or circumstances if they do occur; and (iii) creating and maintaining a system designed to evaluate continuously business and market conditions in order to facilitate the identification and implementation processes described in (i) and (ii) above. Because the day-to-day operations and activities of the fund are carried out by or through FMR, its affiliates, and other service providers, the fund's exposure to risks is mitigated but not eliminated by the processes overseen by the Trustees. While each of the Board's committees has responsibility for overseeing different aspects of the fund's activities, oversight is exercised primarily through the Operations, Audit, and Compliance Committees. In addition, the Independent Trustees have worked with Fidelity to enhance the Board's oversight of investment and financial risks, legal and regulatory risks, technology risks, and operational risks, including the development of additional risk reporting to the Board. Appropriate personnel, including but not limited to the fund's Chief Compliance Officer (CCO), FMR's internal auditor, the independent accountants, the fund's Treasurer and portfolio management personnel, make periodic reports to the Board's committees, as appropriate, including an annual review of Fidelity's risk management program for the Fidelity® funds. The responsibilities of each standing committee, including their oversight responsibilities, are described further under "Standing Committees of the Trustees."
Interested Trustees*:
Correspondence intended for a Trustee who is an interested person may be sent to Fidelity Investments, 245 Summer Street, Boston, Massachusetts 02210.
Name, Year of Birth; Principal Occupations and Other Relevant Experience+
Jonathan Chiel (1957)
Year of Election or Appointment: 2016
Trustee
Mr. Chiel also serves as Trustee of other Fidelity® funds. Mr. Chiel is Executive Vice President and General Counsel for FMR LLC (diversified financial services company, 2012-present). Previously, Mr. Chiel served as general counsel (2004-2012) and senior vice president and deputy general counsel (2000-2004) for John Hancock Financial Services; a partner with Choate, Hall & Stewart (1996-2000) (law firm); and an Assistant United States Attorney for the United States Attorney’s Office of the District of Massachusetts (1986-95), including Chief of the Criminal Division (1993-1995). Mr. Chiel is a director on the boards of the Boston Bar Foundation and the Maimonides School.
James C. Curvey (1935)
Year of Election or Appointment: 2007
Trustee
Chairman of the Board of Trustees
Mr. Curvey also serves as Trustee of other Fidelity® funds. Mr. Curvey is Vice Chairman (2007-present) and Director of FMR LLC (diversified financial services company). In addition, Mr. Curvey is an Overseer Emeritus for the Boston Symphony Orchestra, a Director of Artis-Naples, and a Trustee of Brewster Academy in Wolfeboro, New Hampshire. Previously, Mr. Curvey served as a Director of Fidelity Research & Analysis Co. (investment adviser firm, 2009-2018), Director of Fidelity Investments Money Management, Inc. (investment adviser firm, 2009-2014) and a Director of FMR and FMR Co., Inc. (investment adviser firms, 2007-2014).
Charles S. Morrison (1960)
Year of Election or Appointment: 2014
Trustee
Mr. Morrison also serves as Trustee of other funds. He serves as President of Fidelity SelectCo, LLC (investment adviser firm, 2017-present) and Fidelity Management & Research Company (FMR) (investment adviser firm, 2016-present), a Director of Fidelity Investments Money Management, Inc. (FIMM) (investment adviser firm, 2014-present), Director of Fidelity SelectCo, LLC (investment adviser firm, 2014-present), President, Asset Management (2014-present), and is an employee of Fidelity Investments. Previously, Mr. Morrison served as Vice President of Fidelity's Fixed Income and Asset Allocation Funds (2012-2014), President, Fixed Income (2011-2014), Vice President of Fidelity's Money Market Funds (2005-2009), President, Money Market Group Leader of FMR (investment adviser firm, 2009), and Senior Vice President, Money Market Group of FMR (2004-2009). Mr. Morrison also served as Vice President of Fidelity's Bond Funds (2002-2005), certain Balanced Funds (2002-2005), and certain Asset Allocation Funds (2002-2007), and as Senior Vice President (2002-2005) of Fidelity's Bond Division.
* Determined to be an “Interested Trustee” by virtue of, among other things, his or her affiliation with the trust or various entities under common control with FMR.
+ The information includes the Trustee's principal occupation during the last five years and other information relating to the experience, attributes, and skills relevant to the Trustee's qualifications to serve as a Trustee, which led to the conclusion that the Trustee should serve as a Trustee for the fund.
Independent Trustees:
Correspondence intended for an Independent Trustee may be sent to Fidelity Investments, P.O. Box 55235, Boston, Massachusetts 02205-5235.
Name, Year of Birth; Principal Occupations and Other Relevant Experience+
Dennis J. Dirks (1948)
Year of Election or Appointment: 2005
Trustee
Mr. Dirks also serves as Trustee of other Fidelity® funds. Prior to his retirement in May 2003, Mr. Dirks was Chief Operating Officer and a member of the Board of The Depository Trust & Clearing Corporation (DTCC). He also served as President, Chief Operating Officer, and Board member of The Depository Trust Company (DTC) and President and Board member of the National Securities Clearing Corporation (NSCC). In addition, Mr. Dirks served as Chief Executive Officer and Board member of the Government Securities Clearing Corporation, Chief Executive Officer and Board member of the Mortgage-Backed Securities Clearing Corporation, as a Trustee and a member of the Finance Committee of Manhattan College (2005-2008), as a Trustee and a member of the Finance Committee of AHRC of Nassau County (2006-2008), as a member of the Independent Directors Council (IDC) Governing Council (2010-2015), and as a member of the Board of Directors for The Brookville Center for Children’s Services, Inc. (2009-2017). Mr. Dirks is a member of the Finance Committee (2016-present), Board of Directors (2017-present) and Board of Trustees (2018-present) and is Treasurer (2018-present) of the Asolo Repertory Theatre.
Donald F. Donahue (1950)
Year of Election or Appointment: 2018
Trustee
Mr. Donahue also serves as a Trustee of other Fidelity® funds. Mr. Donahue is President and Chief Executive Officer of Miranda Partners, LLC (risk consulting for the financial services industry, 2012-present). Previously, Mr. Donahue served as a Member of the Advisory Board of certain Fidelity® funds (2015-2018) and Chief Executive Officer (2006-2012), Chief Operating Officer (2003-2006), and Managing Director, Customer Marketing and Development (1999-2003) of The Depository Trust & Clearing Corporation (financial markets infrastructure). Mr. Donahue serves as a Member (2007-present) and Co-Chairman (2016-present) of the Board of Directors of United Way of New York, Member of the Board of Directors of NYC Leadership Academy (2012-present) and Member of the Board of Advisors of Ripple Labs, Inc. (financial services, 2015-present). He also served as Chairman (2010-2012) and Member of the Board of Directors (2012-2013) of Omgeo, LLC (financial services), Treasurer of United Way of New York (2012-2016), and Member of the Board of Directors of XBRL US (financial services non-profit, 2009-2012) and the International Securities Services Association (2009-2012).
Alan J. Lacy (1953)
Year of Election or Appointment: 2008
Trustee
Mr. Lacy also serves as Trustee of other Fidelity® funds. Mr. Lacy serves as a Director of Bristol-Myers Squibb Company (global pharmaceuticals, 2008-present). He is a Trustee of the California Chapter of The Nature Conservancy (2015-present) and a Director of the Center for Advanced Study in the Behavioral Sciences at Stanford University (2015-present). In addition, Mr. Lacy served as Senior Adviser (2007-2014) of Oak Hill Capital Partners, L.P. (private equity) and also served as Chief Executive Officer (2005) and Vice Chairman (2005-2006) of Sears Holdings Corporation (retail) and Chief Executive Officer and Chairman of the Board of Sears, Roebuck and Co. (retail, 2000-2005). Previously, Mr. Lacy served as Chairman (2014-2017) and a member (2010-2017) of the Board of Directors of Dave & Buster’s Entertainment, Inc. (restaurant and entertainment complexes), as Chairman (2008-2011) and a member (2006-2015) of the Board of Trustees of the National Parks Conservation Association, and as a member of the Board of Directors for The Hillman Companies, Inc. (hardware wholesalers, 2010-2014), Earth Fare, Inc. (retail grocery, 2010-2014), and The Western Union Company (global money transfer, 2006-2011).
Ned C. Lautenbach (1944)
Year of Election or Appointment: 2000
Trustee
Chairman of the Independent Trustees
Mr. Lautenbach also serves as Trustee of other Fidelity® funds. Mr. Lautenbach currently serves as Vice Chair of the Board of Governors, State University System of Florida (2013-present) and is a member of the Council on Foreign Relations (1994-present). He is also a member and has most recently served as Chairman of the Board of Directors of Artis-Naples (2012-present). Previously, Mr. Lautenbach served as a member and then Lead Director of the Board of Directors of Eaton Corporation (diversified industrial, 1997-2016). He was also a Partner and Advisory Partner at Clayton, Dubilier & Rice, LLC (private equity investment, 1998-2010), as well as a Director of Sony Corporation (2006-2007). In addition, Mr. Lautenbach also had a 30-year career with IBM (technology company) during which time he served as Senior Vice President and a member of the Corporate Executive Committee (1968-1998).
Joseph Mauriello (1944)
Year of Election or Appointment: 2008
Trustee
Mr. Mauriello also serves as Trustee of other Fidelity® funds. Prior to his retirement in January 2006, Mr. Mauriello served in numerous senior management positions including Deputy Chairman and Chief Operating Officer (2004-2005), and Vice Chairman of Financial Services (2002-2004) of KPMG LLP US (professional services, 1965-2005). Mr. Mauriello currently serves as a member of the Independent Directors Council (IDC) Governing Council (2015-present). Previously, Mr. Mauriello served as a member of the Board of Directors of XL Group plc. (global insurance and re-insurance, 2006-2018).
Cornelia M. Small (1944)
Year of Election or Appointment: 2005
Trustee
Ms. Small also serves as Trustee of other Fidelity® funds. Ms. Small is a member of the Board of Directors (2009-present) and Chair of the Investment Committee (2010-present) of the Teagle Foundation. Ms. Small also serves on the Investment Committee of the Berkshire Taconic Community Foundation (2008-present). Previously, Ms. Small served as Chairperson (2002-2008) and a member of the Investment Committee and Chairperson (2008-2012) and a member of the Board of Trustees of Smith College. In addition, Ms. Small served as Chief Investment Officer, Director of Global Equity Investments, and a member of the Board of Directors of Scudder, Stevens & Clark and Scudder Kemper Investments.
Garnett A. Smith (1947)
Year of Election or Appointment: 2018
Trustee
Mr. Smith also serves as Trustee of other Fidelity® funds. Prior to Mr. Smith's retirement, he served as Chairman and Chief Executive Officer of Inbrand Corp. (manufacturer of personal absorbent products, 1990-1997). He also served as President (1986-1990) of Inbrand Corp. Prior to his employment with Inbrand Corp., he was employed by a retail fabric chain and North Carolina National Bank. In addition, Mr. Smith served as a Member of the Advisory Board of certain Fidelity® funds (2012-2013) and as a board member of the Jackson Hole Land Trust (2009-2012).
David M. Thomas (1949)
Year of Election or Appointment: 2008
Trustee
Mr. Thomas also serves as Trustee of other Fidelity® funds. Mr. Thomas serves as Non-Executive Chairman of the Board of Directors of Fortune Brands Home and Security (home and security products, 2011-present), as a member of the Board of Directors (2004-present) and Presiding Director (2013-present) of Interpublic Group of Companies, Inc. (marketing communication), and as a member of the Board of Trustees of the University of Florida (2013-present). Previously, Mr. Thomas served as Executive Chairman (2005-2006) and Chairman and Chief Executive Officer (2000-2005) of IMS Health, Inc. (pharmaceutical and healthcare information solutions), and a Director of Fortune Brands, Inc. (consumer products, 2000-2011).
+ The information includes the Trustee's principal occupation during the last five years and other information relating to the experience, attributes, and skills relevant to the Trustee's qualifications to serve as a Trustee, which led to the conclusion that the Trustee should serve as a Trustee for the fund.
Advisory Board Members and Officers:
Correspondence intended for a Member of the Advisory Board (if any) may be sent to Fidelity Investments, P.O. Box 55235, Boston, Massachusetts 02205-5235. Correspondence intended for an officer or Peter S. Lynch may be sent to Fidelity Investments, 245 Summer Street, Boston, Massachusetts 02210. Officers appear below in alphabetical order.
Name, Year of Birth; Principal Occupation
Vicki L. Fuller (1957)
Year of Election or Appointment: 2018
Member of the Advisory Board
Ms. Fuller also serves as Member of the Advisory Board of other Fidelity® funds. Ms. Fuller serves as a member of the Board of Directors, Audit Committee, and Nominating and Governance Committee of The Williams Companies, Inc. (natural gas infrastructure, 2018-present). Previously, Ms. Fuller served as the Chief Investment Officer of the New York State Common Retirement Fund (2012-2018) and held a variety of positions at AllianceBernstein L.P. (global asset management, 1985-2012), including Managing Director (2006-2012) and Senior Vice President and Senior Portfolio Manager (2001-2006).
Peter S. Lynch (1944)
Year of Election or Appointment: 2003
Member of the Advisory Board
Mr. Lynch also serves as Member of the Advisory Board of other Fidelity® funds. Mr. Lynch is Vice Chairman and a Director of FMR (investment adviser firm) and FMR Co., Inc. (investment adviser firm). In addition, Mr. Lynch serves as a Trustee of Boston College and as the Chairman of the Inner-City Scholarship Fund. Previously, Mr. Lynch served on the Special Olympics International Board of Directors (1997-2006).
William S. Stavropoulos (1939)
Year of Election or Appointment: 2018
Member of the Advisory Board
Mr. Stavropoulos also serves as Member of the Advisory Board of other Fidelity® funds. Mr. Stavropoulos serves as President and Founder of the Michigan Baseball Foundation, the Great Lakes Loons (2007-present). Mr. Stavropoulos is Chairman Emeritus of the Board of Directors of The Dow Chemical Company, where he previously served in numerous senior management positions, including President, CEO (1995-2000; 2002-2004), Chairman of the Executive Committee (2000-2006), and as a member of the Board of Directors (1990-2006). Currently, Mr. Stavropoulos is Chairman of the Board of Directors of Univar Inc. (global distributor of commodity and specialty chemicals), a Director of Teradata Corporation (data warehousing and technology solutions), and a member of the Advisory Board for Metalmark Capital LLC (private equity investment, 2005-present). Mr. Stavropoulos is an operating advisor to Clayton, Dubilier & Rice, LLC (private equity investment). In addition, Mr. Stavropoulos is a member of the University of Notre Dame Advisory Council for the College of Science, a Trustee of the Rollin L. Gerstacker Foundation, and a Director of Artis-Naples in Naples, Florida. Previously, Mr. Stavropoulos served as Trustee of certain Fidelity® funds (2001-2018) and as a Director of Chemical Financial Corporation (bank holding company, 1993-2012) and Tyco International, Ltd. (multinational manufacturing and services, 2007-2012).
Carol B. Tomé (1957)
Year of Election or Appointment: 2018
Member of the Advisory Board
Ms. Tomé also serves as Member of the Advisory Board of other Fidelity® funds. Ms. Tomé is Chief Financial Officer (2001-present) and Executive Vice President of Corporate Services (2007-present) of The Home Depot, Inc. (home improvement retailer) and a Director (2003-present) and Chair of the Audit Committee (2004-present) of United Parcel Service, Inc. (package delivery and supply chain management). Previously, Ms. Tomé served as Trustee of certain Fidelity® funds (2017), Senior Vice President of Finance and Accounting/Treasurer (2000-2007) and Vice President and Treasurer (1995-2000) of The Home Depot, Inc. and Chair of the Board (2010-2012), Vice Chair of the Board (2009 and 2013), and a Director (2008-2013) of the Federal Reserve Bank of Atlanta. Ms. Tomé is also a director or trustee of many community and professional organizations.
Michael E. Wiley (1950)
Year of Election or Appointment: 2018
Member of the Advisory Board
Mr. Wiley also serves as Trustee or Member of the Advisory Board of other Fidelity® funds. Mr. Wiley serves as a Director of High Point Resources (exploration and production, 2005-present). Previously, Mr. Wiley served as a Director of Andeavor Corporation (independent oil refiner and marketer, 2005-2018), a Director of Andeavor Logistics LP (natural resources logistics, 2015-2018), a Director of Post Oak Bank (privately-held bank, 2004-2018), a Director of Asia Pacific Exploration Consolidated (international oil and gas exploration and production, 2008-2013), a member of the Board of Trustees of the University of Tulsa (2000-2006; 2007-2010), a Senior Energy Advisor of Katzenbach Partners, LLC (consulting, 2006-2007), an Advisory Director of Riverstone Holdings (private investment), a Director of Spinnaker Exploration Company (exploration and production, 2001-2005) and Chairman, President, and CEO of Baker Hughes, Inc. (oilfield services, 2000-2004).
Elizabeth Paige Baumann (1968)
Year of Election or Appointment: 2017
Anti-Money Laundering (AML) Officer
Ms. Baumann also serves as AML Officer of other funds. She is Chief AML Officer (2012-present) and Senior Vice President (2014-present) of FMR LLC (diversified financial services company) and is an employee of Fidelity Investments. Previously, Ms. Baumann served as AML Officer of the funds (2012-2016), and Vice President (2007-2014) and Deputy Anti-Money Laundering Officer (2007-2012) of FMR LLC.
John J. Burke III (1964)
Year of Election or Appointment: 2018
Chief Financial Officer
Mr. Burke also serves as Chief Financial Officer of other funds. Mr. Burke serves as Head of Investment Operations for Fidelity Fund and Investment Operations (2018-present) and is an employee of Fidelity Investments (1998-present). Previously Mr. Burke served as head of Asset Management Investment Operations (2012-2018).
William C. Coffey (1969)
Year of Election or Appointment: 2018
Secretary and Chief Legal Officer (CLO)
Mr. Coffey also serves as Secretary and CLO of other funds. Mr. Coffey serves as CLO, Secretary, and Senior Vice President of Fidelity Management & Research Company and FMR Co., Inc. (investment adviser firms, 2018-present); Secretary of Fidelity SelectCo, LLC and Fidelity Investments Money Management, Inc. (investment adviser firms, 2018-present); and CLO of Fidelity Management & Research (Hong Kong) Limited, FMR Investment Management (UK) Limited, and Fidelity Management & Research (Japan) Limited (investment adviser firms, 2018-present). He is Senior Vice President and Deputy General Counsel of FMR LLC (diversified financial services company, 2010-present), and is an employee of Fidelity Investments. Previously, Mr. Coffey served as Assistant Secretary of certain funds (2009-2018) and as Vice President and Associate General Counsel of FMR LLC (2005-2009).
Timothy M. Cohen (1969)
Year of Election or Appointment: 2018
Vice President
Mr. Cohen also serves as Vice President of other funds. Mr. Cohen serves as Co-Head of Global Equity Research (2016-present), a Director of Fidelity Management & Research (Japan) Limited (investment adviser firm, 2016-present), and is an employee of Fidelity Investments. Previously, Mr. Cohen served as Chief Investment Officer - Equity and a Director of Fidelity Management & Research (U.K.) Inc. (investment adviser firm, 2013-2015) and as a Director of Fidelity Management & Research (Hong Kong) Limited (investment adviser firm, 2017).
Jonathan Davis (1968)
Year of Election or Appointment: 2010
Assistant Treasurer
Mr. Davis also serves as Assistant Treasurer of other funds. Mr. Davis serves as Assistant Treasurer of FMR Capital, Inc. (2017-present) and is an employee of Fidelity Investments. Previously, Mr. Davis served as Vice President and Associate General Counsel of FMR LLC (diversified financial services company, 2003-2010).
Adrien E. Deberghes (1967)
Year of Election or Appointment: 2016
Assistant Treasurer
Mr. Deberghes also serves as an officer of other funds. He serves as Assistant Treasurer of FMR Capital, Inc. (2017-present), Executive Vice President of Fidelity Investments Money Management, Inc. (FIMM) (investment adviser firm, 2016-present), and is an employee of Fidelity Investments (2008-present). Previously, Mr. Deberghes served as President and Treasurer of certain Fidelity® funds (2013-2018). Prior to joining Fidelity Investments, Mr. Deberghes was Senior Vice President of Mutual Fund Administration at State Street Corporation (2007-2008), Senior Director of Mutual Fund Administration at Investors Bank & Trust (2005-2007), and Director of Finance for Dunkin' Brands (2000-2005). Previously, Mr. Deberghes served in other fund officer roles.
Laura M. Del Prato (1964)
Year of Election or Appointment: 2018
Assistant Treasurer
Ms. Del Prato also serves as an officer of other funds. Ms. Del Prato is an employee of Fidelity Investments (2017-present). Prior to joining Fidelity Investments, Ms. Del Prato served as a Managing Director and Treasurer of the JPMorgan Mutual Funds (2014-2017). Prior to JPMorgan, Ms. Del Prato served as a partner at Cohen Fund Audit Services (accounting firm, 2012-2013) and KPMG LLP (accounting firm, 2004-2012).
Colm A. Hogan (1973)
Year of Election or Appointment: 2016
Deputy Treasurer
Mr. Hogan also serves as an officer of other funds. Mr. Hogan serves as Assistant Treasurer of FMR Capital, Inc. (2017-present) and is an employee of Fidelity Investments (2005-present). Previously, Mr. Hogan served as Assistant Treasurer of certain Fidelity® funds (2016-2018).
Pamela R. Holding (1964)
Year of Election or Appointment: 2018
Vice President
Ms. Holding also serves as Vice President of other funds. Ms. Holding serves as Co-Head of Global Equity Research (2018-present) and is an employee of Fidelity Investments (2013-present).
Chris Maher (1972)
Year of Election or Appointment: 2013
Assistant Treasurer
Mr. Maher serves as Assistant Treasurer of other funds. Mr. Maher is Vice President of Valuation Oversight, serves as Assistant Treasurer of FMR Capital, Inc. (2017-present), and is an employee of Fidelity Investments. Previously, Mr. Maher served as Vice President of Asset Management Compliance (2013), Vice President of the Program Management Group of FMR (investment adviser firm, 2010-2013), and Vice President of Valuation Oversight (2008-2010).
Rieco E. Mello (1969)
Year of Election or Appointment: 2017
Assistant Treasurer
Mr. Mello also serves as Assistant Treasurer of other funds. Mr. Mello serves as Assistant Treasurer of FMR Capital, Inc. (2017-present) and is an employee of Fidelity Investments (1995-present).
Kenneth B. Robins (1969)
Year of Election or Appointment: 2016
Chief Compliance Officer
Mr. Robins also serves as an officer of other funds. Mr. Robins serves as Compliance Officer of Fidelity Management & Research Company and FMR Co., Inc. (investment adviser firms, 2016-present) and is an employee of Fidelity Investments (2004-present). Previously, Mr. Robins served as Executive Vice President of Fidelity Investments Money Management, Inc. (investment adviser firm, 2013-2016) and served in other fund officer roles.
Stacie M. Smith (1974)
Year of Election or Appointment: 2016
President and Treasurer
Ms. Smith also serves as an officer of other funds. Ms. Smith serves as Assistant Treasurer of FMR Capital, Inc. (2017-present), is an employee of Fidelity Investments (2009-present), and has served in other fund officer roles. Prior to joining Fidelity Investments, Ms. Smith served as Senior Audit Manager of Ernst & Young LLP (accounting firm, 1996-2009). Previously, Ms. Smith served as Assistant Treasurer (2013-2018) and Deputy Treasurer (2013-2016) of certain Fidelity® funds.
Marc L. Spector (1972)
Year of Election or Appointment: 2016
Assistant Treasurer
Mr. Spector also serves as an officer of other funds. Mr. Spector serves as Assistant Treasurer of FMR Capital, Inc. (2017-present) and is an employee of Fidelity Investments (2016-present). Prior to joining Fidelity Investments, Mr. Spector served as Director at the Siegfried Group (accounting firm, 2013-2016), and prior to Siegfried Group as audit senior manager at Deloitte & Touche (accounting firm, 2005-2013).
Shareholder Expense Example
As a shareholder of the Fund, you incur two types of costs: (1) transaction costs, including sales charges (loads) on purchase payments or redemption proceeds, and (2) ongoing costs, including management fees, distribution and/or service (12b-1) fees and other Fund expenses. This Example is intended to help you understand your ongoing costs (in dollars) of investing in the Fund and to compare these costs with the ongoing costs of investing in other mutual funds.
The actual expense Example is based on an investment of $1,000 invested at the beginning of the period and held for the entire period (May 1, 2018 to October 31, 2018) for Class A, Class M, Class C, International Small Cap Opportunities and Class I, and for the period (October 2, 2018 to October 31, 2018) for Class Z. The hypothetical expense Example is based on an investment of $1,000 invested for the one-half year period (May 1, 2018 to October 31, 2018).
Actual Expenses
The first line of the accompanying table for each class of the Fund provides information about actual account values and actual expenses. You may use the information in this line, together with the amount you invested, to estimate the expenses that you paid over the period. Simply divide your account value by $1,000.00 (for example, an $8,600 account value divided by $1,000.00 = 8.6), then multiply the result by the number in the first line for a class of the Fund under the heading entitled "Expenses Paid During Period" to estimate the expenses you paid on your account during this period. A small balance maintenance fee of $12.00 that is charged once a year may apply for certain accounts with a value of less than $2,000. This fee, which was eliminated effective August 1, 2018, is not included in the table below. If it was, the estimate of expenses you paid during the period would be higher, and your ending account value lower, by this amount. In addition, the Fund, as a shareholder in the underlying Fidelity Central Funds, will indirectly bear its pro-rata share of the fees and expenses incurred by the underlying Fidelity Central Funds. These fees and expenses are not included in the Fund's annualized expense ratio used to calculate the expense estimate in the table below.
Hypothetical Example for Comparison Purposes
The second line of the accompanying table for each class of the Fund provides information about hypothetical account values and hypothetical expenses based on a Class' actual expense ratio and an assumed rate of return of 5% per year before expenses, which is not the Class' actual return. The hypothetical account values and expenses may not be used to estimate the actual ending account balance or expenses you paid for the period. You may use this information to compare the ongoing costs of investing in the Fund and other funds. To do so, compare this 5% hypothetical example with the 5% hypothetical examples that appear in the shareholder reports of the other funds. A small balance maintenance fee of $12.00 that is charged once a year may apply for certain accounts with a value of less than $2,000. This fee, which was eliminated effective August 1, 2018, is not included in the table below. If it was, the estimate of expenses you paid during the period would be higher, and your ending account value lower, by this amount. In addition, the Fund, as a shareholder in the underlying Fidelity Central Funds, will indirectly bear its pro-rata share of the fees and expenses incurred by the underlying Fidelity Central Funds. These fees and expenses are not included in the Fund's annualized expense ratio used to calculate the expense estimate in the table below.
Please note that the expenses shown in the table are meant to highlight your ongoing costs only and do not reflect any transaction costs. Therefore, the second line of the table is useful in comparing ongoing costs only, and will not help you determine the relative total costs of owning different funds. In addition, if these transactional costs were included, your costs would have been higher.
| | Annualized Expense Ratio-A | Beginning
Account Value | Ending
Account Value
October 31, 2018 | Expenses Paid
During Period |
| Class A | 1.36% | | | |
| Actual | | $1,000.00 | $873.90 | $6.42-B |
| Hypothetical-C | | $1,000.00 | $1,018.35 | $6.92-D |
| Class M | 1.65% | | | |
| Actual | | $1,000.00 | $872.90 | $7.79-B |
| Hypothetical-C | | $1,000.00 | $1,016.89 | $8.39-D |
| Class C | 2.13% | | | |
| Actual | | $1,000.00 | $870.60 | $10.04-B |
| Hypothetical-C | | $1,000.00 | $1,014.47 | $10.82-D |
| International Small Cap Opportunities | 1.09% | | | |
| Actual | | $1,000.00 | $875.20 | $5.15-B |
| Hypothetical-C | | $1,000.00 | $1,019.71 | $5.55-D |
| Class I | 1.11% | | | |
| Actual | | $1,000.00 | $875.10 | $5.25-B |
| Hypothetical-C | | $1,000.00 | $1,019.61 | $5.65-D |
| Class Z | 1.03% | | | |
| Actual | | $1,000.00 | $916.30 | $.81-B |
| Hypothetical-C | | $1,000.00 | $1,020.01 | $5.24-D |
A Annualized expense ratio reflects expenses net of applicable fee waivers.
B Actual expenses are equal to each Class' annualized expense ratio, multiplied by the average account value over the period, multiplied by 184/365 (to reflect the one-half year period) for Class A, Class M, Class C, International Small Cap Opportunities and Class I, and multiplied by 30/365 (to reflect the period October 2, 2018 to October 31, 2018) for Class Z.
C 5% return per year before expenses
D Hypothetical expenses are equal to each Class' annualized expense ratio, multiplied by the average account value over the period, multiplied by 184/365 (to reflect the one-half year period).
Distributions (Unaudited)
The Board of Trustees of Fidelity International Small Cap Opportunities Fund voted to pay to shareholders of record at the opening of business on record date, the following distributions per share derived from capital gains realized from sales of portfolio securities, and dividends derived from net investment income:
| | Pay Date | Record Date | Dividends | Capital Gains |
| Fidelity International Small Cap Opportunities Fund | | | | |
| Class A | 12/10/18 | 12/07/18 | $0.113 | $0.313 |
| Class M | 12/10/18 | 12/07/18 | $0.057 | $0.313 |
| Class C | 12/10/18 | 12/07/18 | $0.000 | $0.293 |
| International Small Cap Opportunities | 12/10/18 | 12/07/18 | $0.170 | $0.313 |
| Class I | 12/10/18 | 12/07/18 | $0.162 | $0.313 |
| Class Z | 12/10/18 | 12/07/18 | $0.204 | $0.313 |
|
The fund hereby designates as a capital gain dividend with respect to the taxable year ended October 31, 2018, $19,946,356, or, if subsequently determined to be different, the net capital gain of such year.
A percentage of the dividends distributed during the fiscal year qualify for the dividends–received deduction for corporate shareholders:
| | Class A | Class M | Class C | International Small Cap Opportunities | Class I |
| Fidelity International Small Cap Opportunities Fund | | | | | |
| December 08, 2017 | 1% | 1% | 1% | 1% | 1% |
| December 28, 2017 | – | – | – | 9% | 9% |
|
A percentage of the dividends distributed during the fiscal year may be taken into account as a dividend for purposes of the maximum rate under section 1(h)(11) of the Internal Revenue Code.
| | Class A | Class M | Class C | International Small Cap Opportunities | Class I |
| Fidelity International Small Cap Opportunities Fund | | | | | |
| December 08, 2017 | 80% | 87% | 100% | 71% | 71% |
| December 28, 2017 | – | – | – | 100% | 100% |
|
The amounts per share which represent income derived from sources within, and taxes paid to, foreign countries or possessions of the United States are as follows:
| | Pay Date | Income | Taxes |
| Fidelity International Small Cap Opportunities Fund | | | |
| Class A | 12/11/17 | $0.2921 | $0.0308 |
| Class M | 12/11/17 | $0.2658 | $0.0308 |
| Class C | 12/11/17 | $0.2181 | $0.0308 |
| International Small Cap Opportunities | 12/11/17 | $0.3288 | $0.0308 |
| Class I | 12/11/17 | $0.3280 | $0.0308 |
|
The fund will notify shareholders in January 2019 of amounts for use in preparing 2018 income tax returns.
Board Approval of Investment Advisory Contracts
Fidelity International Small Cap Opportunities Fund
At its July 2018 meeting, the Board of Trustees, including the Independent Trustees (together, the Board), voted to continue the management contract with Fidelity Management & Research Company (FMR) and the sub-advisory agreements (together, the Advisory Contracts) for the fund for six months through January 31, 2019, in connection with the reunification of the Fidelity Equity High Income Funds Board, which oversees the fund, and the Sector Portfolios Board.
The Board considered that the approval of the fund's Advisory Contracts will not result in any changes in (i) the investment process or strategies employed in the management of the fund's assets; (ii) the fees and expenses paid by shareholders; (iii) the nature, extent or quality of services provided under the fund's Advisory Contracts; or (iv) the day-to-day management of the fund or the persons primarily responsible for such management. The Board concluded that the fund's Advisory Contracts are fair and reasonable, and that the fund's Advisory Contracts should be renewed, without modification, through January 31, 2019, with the understanding that the Board will consider the annual renewal for a full one year period in January 2019.
In connection with its consideration of future renewals of the fund's Advisory Contracts, the Board will consider: (i) the nature, extent and quality of services provided to the fund, including shareholder and administrative services and investment performance; (ii) the competitiveness of the management fee and total expenses for the fund; (iii) the costs of the services and profitability, including the revenues earned and the expenses incurred in conducting the business of developing, marketing, distributing, managing, administering, and servicing the fund and its shareholders, to the extent applicable, as well as potential fall-out benefits from Fidelity's non-fund businesses; and (iv) whether there have been economies of scale in respect of the Fidelity funds, whether the Fidelity funds (including the fund) have appropriately benefited from any such economies of scale, and whether there is the potential for realization of any further economies.
Based on its evaluation of all of the conclusions noted above, and after considering all factors it believed relevant, the Board ultimately concluded that the fund's management fee structure is fair and reasonable, and that the continuation of the fund's Advisory Contracts should be approved.
Corporate Headquarters
245 Summer St.
Boston, MA 02210
www.fidelity.com
ILS-ANN-1218
1.815075.114
Fidelity Advisor® International Value Fund - Class A, Class M, Class C, Class I and Class Z
Annual Report October 31, 2018 Class A, Class M, Class C, Class I and Class Z are classes of Fidelity® International Value Fund |
|
Contents
To view a fund's proxy voting guidelines and proxy voting record for the 12-month period ended June 30, visit http://www.fidelity.com/proxyvotingresults or visit the Securities and Exchange Commission's (SEC) web site at http://www.sec.gov.
You may also call 1-877-208-0098 to request a free copy of the proxy voting guidelines.
Standard & Poor's, S&P and S&P 500 are registered service marks of The McGraw-Hill Companies, Inc. and have been licensed for use by Fidelity Distributors Corporation.
Other third-party marks appearing herein are the property of their respective owners.
All other marks appearing herein are registered or unregistered trademarks or service marks of FMR LLC or an affiliated company. © 2018 FMR LLC. All rights reserved.
This report and the financial statements contained herein are submitted for the general information of the shareholders of the Fund. This report is not authorized for distribution to prospective investors in the Fund unless preceded or accompanied by an effective prospectus.
A fund files its complete schedule of portfolio holdings with the SEC for the first and third quarters of each fiscal year on Form N-Q. Forms N-Q are available on the SEC’s web site at http://www.sec.gov. A fund's Forms N-Q may be reviewed and copied at the SEC’s Public Reference Room in Washington, DC. Information regarding the operation of the SEC's Public Reference Room may be obtained by calling 1-800-SEC-0330.
For a complete list of a fund's portfolio holdings, view the most recent holdings listing, semiannual report, or annual report on Fidelity's web site at http://www.fidelity.com, http://www.institutional.fidelity.com, or http://www.401k.com, as applicable.
NOT FDIC INSURED •MAY LOSE VALUE •NO BANK GUARANTEE
Neither the Fund nor Fidelity Distributors Corporation is a bank.
Performance: The Bottom Line
Average annual total return reflects the change in the value of an investment, assuming reinvestment of distributions from dividend income and capital gains (the profits earned upon the sale of securities that have grown in value, if any) and assuming a constant rate of performance each year. The hypothetical investment and the average annual total returns do not reflect the deduction of taxes that a shareholder would pay on fund distributions or the redemption of fund shares. During periods of reimbursement by Fidelity, a fund’s total return will be greater than it would be had the reimbursement not occurred. How a fund did yesterday is no guarantee of how it will do tomorrow.
Average Annual Total Returns
| For the periods ended October 31, 2018 | Past 1 year | Past 5 years | Past 10 years |
| Class A (incl. 5.75% sales charge) | (14.52)% | (1.12)% | 4.91% |
| Class M (incl. 3.50% sales charge) | (12.76)% | (0.94)% | 4.86% |
| Class C (incl. contingent deferred sales charge) | (10.95)% | (0.71)% | 4.72% |
| Class I | (9.04)% | 0.32% | 5.86% |
| Class Z | (9.15)% | 0.30% | 5.85% |
Class C shares' contingent deferred sales charges included in the past one year, past five years and past ten years total return figures are 1%, 0% and 0%, respectively.
The initial offering of Class Z shares took place on October 2, 2018. Returns prior to October 2, 2018, are those of Class I.
$10,000 Over 10 Years
Let's say hypothetically that $10,000 was invested in Fidelity Advisor® International Value Fund - Class A on October 31, 2008, and the current 5.75% sales charge was paid.
The chart shows how the value of your investment would have changed, and also shows how the MSCI EAFE Value Index performed over the same period.
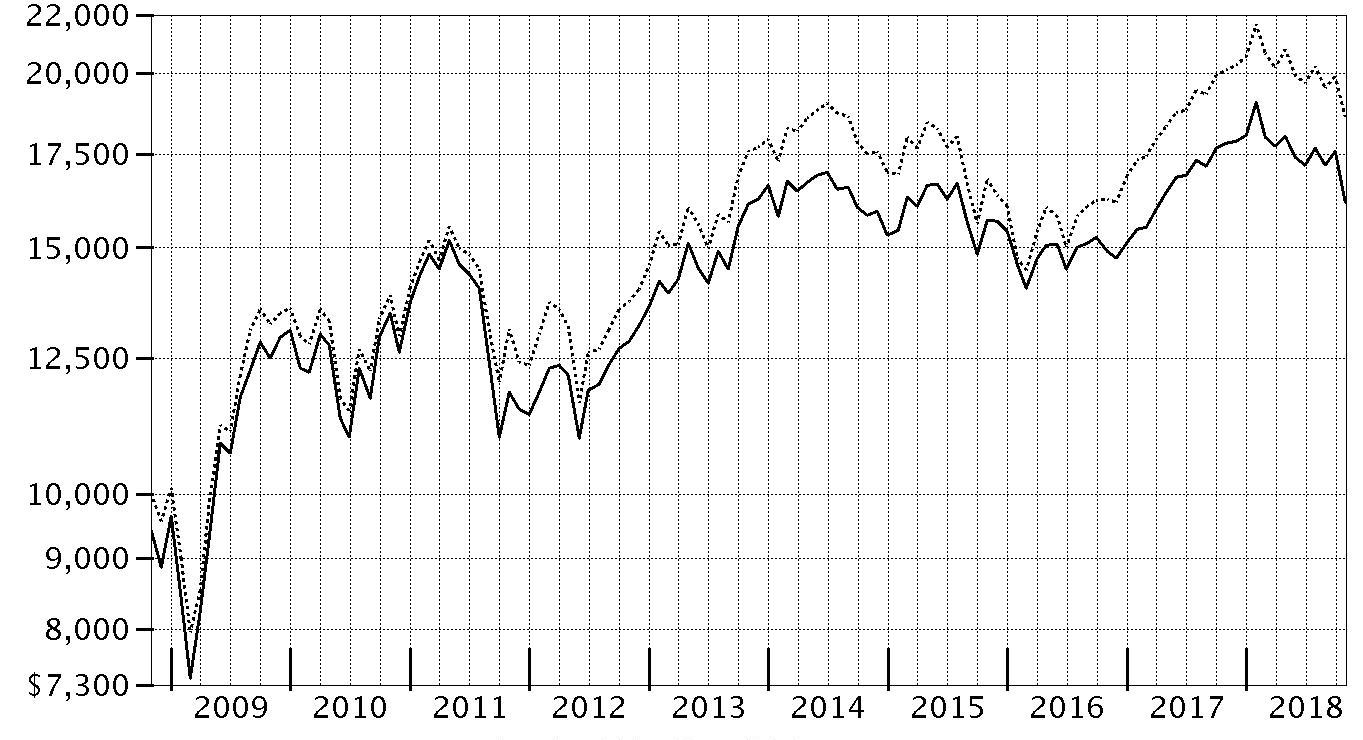
| Period Ending Values |
| $16,155 | Fidelity Advisor® International Value Fund - Class A |
| $18,577 | MSCI EAFE Value Index |
Management's Discussion of Fund Performance
Market Recap: International equities returned -8.08% for the 12 months ending October 31, 2018, according to the MSCI ACWI (All Country World Index) ex USA Index. A modestly positive first half of the period gave way to a confluence of overwhelmingly negative factors – including escalating trade tensions, a surging U.S. dollar, tepid economic growth in Europe, global central bank tightening, concerns about Italy’s budget stalemate with the EU, and weakness in China’s stock market – that yielded a -11% second-half return. The index lost 8% in October alone, its largest monthly drop in more than six years. Among sectors, new-media-infused communications services (-15%) was hit the hardest, while economically sensitive consumer discretionary (-13%), information technology (-12%), financials (-10%), industrials (-9%) and materials (-7%) stocks also fared poorly. Even the more defensive real estate (-9%), utilities (-6%) and consumer staples (-5%) sectors weren’t spared this period. Conversely, elevated crude-oil prices fueled a positive return for energy (+7%), the top-performing sector, followed by the relatively stable-growing health care segment (+2%). Regionally, emerging markets (-12%) fared the worst, hampered by the impact of foreign exchange and concerns about economic weakness in China, India and South Korea. Sluggish growth also pressured shares in continental Europe (-9%). Stocks in Japan (-3%) and the U.K. (-4%) held up better, followed by Canada (-5%) and Asia-Pacific ex Japan (-6%).
Comments from Portfolio Manager Alexander Zavratsky: For the fiscal year, the fund’s share classes returned in a range between -9% and -10%, behind the -7.46% result of the benchmark MSCI EAFE Value Index. Versus the MSCI index, both stock selection and sector allocation detracted from the fund’s relative result, especially choices in health care and, to a lesser extent, consumer staples. Regionally, the bulk of the underperformance the past 12 months came out of the U.K., where concerns about the outcome of Britain’s negotiations to exit from the European Union intensified late in the period. Among individual stocks, our largest relative laggard was underexposure to index constituent Novartis. Despite being one of our largest holdings this period, the fund was still underweighted in the Switzerland-based pharmaceuticals firm earlier in the period, and we eventually exited our position entirely when the stock’s valuation no longer looked attractive to us. Unfortunately for the fund, we missed out on the stock’s 10% gain for the full 12 months. Novartis benefited from a new CEO, a promising growth outlook for 2018, and consecutive quarters of solid earnings. Underexposure to index heavyweight Royal Dutch Shell was another notable detractor because shares of the Anglo-Dutch multinational oil and gas giant advanced about 8% on higher crude-oil prices and solid quarterly financial results. Conversely, the fund’s large position in diversified energy firm Equinor (formerly Statoil) helped more than any other individual stock. The stock advanced 34% the past 12 months. An out-of-benchmark stake in exploration & production company ConocoPhillips also contributed, as the stock gained about 38%.
The views expressed above reflect those of the portfolio manager(s) only through the end of the period as stated on the cover of this report and do not necessarily represent the views of Fidelity or any other person in the Fidelity organization. Any such views are subject to change at any time based upon market or other conditions and Fidelity disclaims any responsibility to update such views. These views may not be relied on as investment advice and, because investment decisions for a Fidelity fund are based on numerous factors, may not be relied on as an indication of trading intent on behalf of any Fidelity fund.
Investment Summary (Unaudited)
Geographic Diversification (% of fund's net assets)
| As of October 31, 2018 |
| | Japan | 24.0% |
| | United Kingdom | 19.8% |
| | France | 15.1% |
| | Germany | 9.8% |
| | Switzerland | 4.6% |
| | Spain | 3.9% |
| | Sweden | 3.3% |
| | Australia | 3.1% |
| | United States of America* | 2.8% |
| | Other | 13.6% |
* Includes Short-Term investments and Net Other Assets (Liabilities).
Percentages are based on country or territory of incorporation and are adjusted for the effect of futures contracts, if applicable.
Asset Allocation as of October 31, 2018
| | % of fund's net assets |
| Stocks | 98.7 |
| Short-Term Investments and Net Other Assets (Liabilities) | 1.3 |
Top Ten Stocks as of October 31, 2018
| | % of fund's net assets |
| Total SA (France, Oil, Gas & Consumable Fuels) | 3.3 |
| BP PLC (United Kingdom, Oil, Gas & Consumable Fuels) | 3.3 |
| Sanofi SA (France, Pharmaceuticals) | 2.7 |
| BHP Billiton PLC (United Kingdom, Metals & Mining) | 2.5 |
| Royal Dutch Shell PLC Class B sponsored ADR (United Kingdom, Oil, Gas & Consumable Fuels) | 2.1 |
| Banco Santander SA (Spain, Banks) | 2.0 |
| Mitsubishi UFJ Financial Group, Inc. (Japan, Banks) | 2.0 |
| Bayer AG (Germany, Pharmaceuticals) | 1.7 |
| AstraZeneca PLC (United Kingdom) (United Kingdom, Pharmaceuticals) | 1.7 |
| AXA SA (France, Insurance) | 1.6 |
| | 22.9 |
Top Market Sectors as of October 31, 2018
| | % of fund's net assets |
| Financials | 36.5 |
| Energy | 12.8 |
| Health Care | 11.6 |
| Industrials | 10.5 |
| Materials | 6.6 |
| Communication Services | 5.2 |
| Consumer Discretionary | 5.2 |
| Information Technology | 4.6 |
| Consumer Staples | 3.8 |
| Real Estate | 1.9 |
Schedule of Investments October 31, 2018
Showing Percentage of Net Assets
| Common Stocks - 97.6% | | | |
| | | Shares | Value |
| Australia - 3.1% | | | |
| Commonwealth Bank of Australia | | 149,146 | $7,311,916 |
| Insurance Australia Group Ltd. | | 618,266 | 2,990,345 |
| Macquarie Group Ltd. | | 45,547 | 3,780,181 |
|
| TOTAL AUSTRALIA | | | 14,082,442 |
|
| Austria - 0.8% | | | |
| Erste Group Bank AG | | 89,100 | 3,633,088 |
| Bailiwick of Jersey - 2.1% | | | |
| Ferguson PLC | | 25,971 | 1,753,752 |
| Glencore Xstrata PLC | | 1,410,800 | 5,749,773 |
| WPP PLC | | 206,900 | 2,341,225 |
|
| TOTAL BAILIWICK OF JERSEY | | | 9,844,750 |
|
| Belgium - 1.2% | | | |
| KBC Groep NV | | 79,125 | 5,457,915 |
| Canada - 0.6% | | | |
| Nutrien Ltd. | | 49,180 | 2,603,482 |
| Denmark - 0.4% | | | |
| A.P. Moller - Maersk A/S Series B | | 1,341 | 1,692,624 |
| Finland - 1.9% | | | |
| Nordea Bank ABP (a) | | 477,300 | 4,151,206 |
| Sampo Oyj (A Shares) | | 95,834 | 4,413,496 |
|
| TOTAL FINLAND | | | 8,564,702 |
|
| France - 15.1% | | | |
| Accor SA | | 48,600 | 2,224,991 |
| Atos Origin SA | | 30,671 | 2,632,560 |
| AXA SA | | 296,621 | 7,423,439 |
| Bouygues SA | | 77,105 | 2,815,615 |
| Capgemini SA | | 29,493 | 3,607,767 |
| Compagnie de St. Gobain | | 67,500 | 2,542,821 |
| Natixis SA | | 553,000 | 3,235,752 |
| Sanofi SA | | 136,879 | 12,231,586 |
| Societe Generale Series A | | 101,500 | 3,720,762 |
| SR Teleperformance SA | | 17,900 | 2,951,958 |
| Total SA (b) | | 258,157 | 15,147,470 |
| VINCI SA (b) | | 80,900 | 7,200,049 |
| Vivendi SA | | 145,992 | 3,521,081 |
|
| TOTAL FRANCE | | | 69,255,851 |
|
| Germany - 9.2% | | | |
| Bayer AG | | 102,200 | 7,833,881 |
| Brenntag AG | | 47,900 | 2,504,904 |
| Continental AG | | 9,400 | 1,553,917 |
| Deutsche Telekom AG | | 422,600 | 6,931,349 |
| Fresenius SE & Co. KGaA | | 32,700 | 2,078,276 |
| Hannover Reuck SE | | 36,100 | 4,869,840 |
| HeidelbergCement Finance AG | | 31,600 | 2,147,504 |
| Linde PLC | | 30,014 | 4,924,227 |
| SAP SE | | 32,160 | 3,443,484 |
| Vonovia SE | | 123,593 | 5,658,299 |
|
| TOTAL GERMANY | | | 41,945,681 |
|
| Ireland - 0.7% | | | |
| CRH PLC | | 111,302 | 3,319,936 |
| Italy - 1.2% | | | |
| Assicurazioni Generali SpA | | 137,200 | 2,219,106 |
| Intesa Sanpaolo SpA | | 995,800 | 2,205,771 |
| Mediobanca SpA | | 144,925 | 1,272,485 |
|
| TOTAL ITALY | | | 5,697,362 |
|
| Japan - 24.0% | | | |
| Honda Motor Co. Ltd. | | 243,600 | 6,953,691 |
| Hoya Corp. | | 61,700 | 3,507,279 |
| Idemitsu Kosan Co. Ltd. | | 58,600 | 2,674,613 |
| INPEX Corp. | | 162,000 | 1,844,631 |
| Itochu Corp. | | 320,900 | 5,951,401 |
| Japan Tobacco, Inc. | | 156,000 | 4,008,471 |
| Kao Corp. | | 45,400 | 3,020,109 |
| Makita Corp. | | 72,600 | 2,512,545 |
| Minebea Mitsumi, Inc. | | 107,500 | 1,644,538 |
| Mitsubishi UFJ Financial Group, Inc. | | 1,511,500 | 9,148,343 |
| Mitsui Fudosan Co. Ltd. | | 150,100 | 3,380,589 |
| Nintendo Co. Ltd. | | 4,700 | 1,467,354 |
| Nomura Holdings, Inc. | | 630,400 | 3,027,155 |
| OBIC Co. Ltd. | | 41,100 | 3,744,476 |
| Oracle Corp. Japan | | 30,900 | 2,097,700 |
| ORIX Corp. | | 343,400 | 5,602,866 |
| Panasonic Corp. | | 282,400 | 3,030,563 |
| Recruit Holdings Co. Ltd. | | 93,800 | 2,517,554 |
| Shin-Etsu Chemical Co. Ltd. | | 40,200 | 3,359,133 |
| Shinsei Bank Ltd. | | 190,400 | 2,900,363 |
| SoftBank Corp. | | 42,200 | 3,339,658 |
| Sony Corp. | | 64,200 | 3,474,296 |
| Sony Financial Holdings, Inc. | | 190,500 | 4,394,732 |
| Subaru Corp. | | 84,000 | 2,265,875 |
| Sumitomo Mitsui Financial Group, Inc. | | 188,600 | 7,343,160 |
| T&D Holdings, Inc. | | 212,500 | 3,396,964 |
| Taiheiyo Cement Corp. | | 57,200 | 1,683,207 |
| Takeda Pharmaceutical Co. Ltd. | | 128,900 | 5,344,136 |
| Tokio Marine Holdings, Inc. | | 127,900 | 6,025,643 |
|
| TOTAL JAPAN | | | 109,661,045 |
|
| Netherlands - 2.4% | | | |
| ING Groep NV (Certificaten Van Aandelen) | | 366,590 | 4,337,125 |
| Koninklijke Philips Electronics NV | | 94,104 | 3,509,689 |
| Wolters Kluwer NV | | 57,055 | 3,241,507 |
|
| TOTAL NETHERLANDS | | | 11,088,321 |
|
| Norway - 1.6% | | | |
| Equinor ASA | | 273,976 | 7,127,445 |
| Portugal - 0.7% | | | |
| Galp Energia SGPS SA Class B | | 177,494 | 3,094,989 |
| Spain - 3.4% | | | |
| Banco Santander SA | | 1,924,521 | 9,156,788 |
| Banco Santander SA rights (a) | | 1,885,521 | 73,252 |
| CaixaBank SA (b) | | 855,097 | 3,460,331 |
| Masmovil Ibercom SA (a) | | 10,585 | 1,373,951 |
| Unicaja Banco SA (c) | | 1,031,900 | 1,321,892 |
|
| TOTAL SPAIN | | | 15,386,214 |
|
| Sweden - 3.3% | | | |
| Alfa Laval AB | | 119,600 | 3,054,318 |
| Investor AB (B Shares) | | 81,660 | 3,539,940 |
| Swedbank AB (A Shares) | | 221,842 | 4,996,272 |
| Telefonaktiebolaget LM Ericsson (B Shares) | | 396,600 | 3,453,100 |
|
| TOTAL SWEDEN | | | 15,043,630 |
|
| Switzerland - 4.6% | | | |
| Credit Suisse Group AG | | 278,856 | 3,645,671 |
| Swiss Life Holding AG | | 8,960 | 3,382,408 |
| UBS Group AG(b) | | 510,458 | 7,095,366 |
| Zurich Insurance Group AG | | 23,071 | 7,163,117 |
|
| TOTAL SWITZERLAND | | | 21,286,562 |
|
| United Kingdom - 19.8% | | | |
| AstraZeneca PLC (United Kingdom) | | 98,512 | 7,535,150 |
| Aviva PLC | | 881,873 | 4,819,338 |
| BAE Systems PLC | | 548,641 | 3,678,795 |
| BHP Billiton PLC | | 572,366 | 11,417,953 |
| BP PLC | | 2,075,761 | 14,994,717 |
| British American Tobacco PLC (United Kingdom) | | 129,486 | 5,613,253 |
| Bunzl PLC | | 100,128 | 2,957,701 |
| Compass Group PLC | | 80,193 | 1,578,541 |
| GlaxoSmithKline PLC | | 228,332 | 4,422,280 |
| HSBC Holdings PLC sponsored ADR (b) | | 84,211 | 3,460,230 |
| Imperial Tobacco Group PLC | | 132,272 | 4,485,429 |
| Informa PLC | | 397,964 | 3,629,923 |
| ITV PLC | | 703,015 | 1,338,455 |
| Micro Focus International PLC | | 119,104 | 1,846,376 |
| Royal Dutch Shell PLC Class B sponsored ADR (b) | | 149,100 | 9,797,361 |
| RSA Insurance Group PLC | | 293,910 | 2,120,314 |
| Standard Chartered PLC (United Kingdom) | | 326,611 | 2,294,021 |
| Standard Life PLC | | 724,363 | 2,504,508 |
| The Weir Group PLC | | 91,052 | 1,845,829 |
|
| TOTAL UNITED KINGDOM | | | 90,340,174 |
|
| United States of America - 1.5% | | | |
| Amgen, Inc. | | 15,700 | 3,026,803 |
| ConocoPhillips Co. | | 53,900 | 3,767,610 |
|
| TOTAL UNITED STATES OF AMERICA | | | 6,794,413 |
|
| TOTAL COMMON STOCKS | | | |
| (Cost $485,969,543) | | | 445,920,626 |
|
| Nonconvertible Preferred Stocks - 1.1% | | | |
| Germany - 0.6% | | | |
| Porsche Automobil Holding SE (Germany) | | 42,100 | 2,677,349 |
| Spain - 0.5% | | | |
| Grifols SA Class B | | 114,900 | 2,387,801 |
| TOTAL NONCONVERTIBLE PREFERRED STOCKS | | | |
| (Cost $5,599,969) | | | 5,065,150 |
|
| Money Market Funds - 4.4% | | | |
| Fidelity Cash Central Fund, 2.23% (d) | | 4,245,932 | 4,246,782 |
| Fidelity Securities Lending Cash Central Fund 2.23% (d)(e) | | 15,774,036 | 15,775,614 |
| TOTAL MONEY MARKET FUNDS | | | |
| (Cost $20,022,870) | | | 20,022,396 |
| TOTAL INVESTMENT IN SECURITIES - 103.1% | | | |
| (Cost $511,592,382) | | | 471,008,172 |
| NET OTHER ASSETS (LIABILITIES) - (3.1)% | | | (13,974,665) |
| NET ASSETS - 100% | | | $457,033,507 |
Categorizations in the Schedule of Investments are based on country or territory of incorporation.
Legend
(a) Non-income producing
(b) Security or a portion of the security is on loan at period end.
(c) Security exempt from registration under Rule 144A of the Securities Act of 1933. These securities may be resold in transactions exempt from registration, normally to qualified institutional buyers. At the end of the period, the value of these securities amounted to $1,321,892 or 0.3% of net assets.
(d) Affiliated fund that is generally available only to investment companies and other accounts managed by Fidelity Investments. The rate quoted is the annualized seven-day yield of the fund at period end. A complete unaudited listing of the fund's holdings as of its most recent quarter end is available upon request. In addition, each Fidelity Central Fund's financial statements, which are not covered by the Fund's Report of Independent Registered Public Accounting Firm, are available on the SEC's website or upon request.
(e) Investment made with cash collateral received from securities on loan.
Affiliated Central Funds
Information regarding fiscal year to date income earned by the Fund from investments in Fidelity Central Funds is as follows:
| Fund | Income earned |
| Fidelity Cash Central Fund | $52,611 |
| Fidelity Securities Lending Cash Central Fund | 262,207 |
| Total | $314,818 |
Amounts in the income column in the above table include any capital gain distributions from underlying funds, which are presented in the corresponding line-item in the Statement of Operations if applicable.
Investment Valuation
The following is a summary of the inputs used, as of October 31, 2018, involving the Fund's assets and liabilities carried at fair value. The inputs or methodology used for valuing securities may not be an indication of the risk associated with investing in those securities. For more information on valuation inputs, and their aggregation into the levels used below, please refer to the Investment Valuation section in the accompanying Notes to Financial Statements.
| | Valuation Inputs at Reporting Date: |
| Description | Total | Level 1 | Level 2 | Level 3 |
| Investments in Securities: | | | | |
| Equities: | | | | |
| Communication Services | $23,942,996 | $6,342,329 | $17,600,667 | $-- |
| Consumer Discretionary | 23,759,223 | 5,357,449 | 18,401,774 | -- |
| Consumer Staples | 17,127,262 | 4,485,429 | 12,641,833 | -- |
| Energy | 58,448,836 | 26,462,018 | 31,986,818 | -- |
| Financials | 166,819,328 | 84,650,626 | 82,168,702 | -- |
| Health Care | 51,876,881 | 6,534,082 | 45,342,799 | -- |
| Industrials | 48,865,911 | 23,638,129 | 25,227,782 | -- |
| Information Technology | 20,825,463 | 12,082,503 | 8,742,960 | -- |
| Materials | 30,280,988 | 10,500,759 | 19,780,229 | -- |
| Real Estate | 9,038,888 | 5,658,299 | 3,380,589 | -- |
| Money Market Funds | 20,022,396 | 20,022,396 | -- | -- |
| Total Investments in Securities: | $471,008,172 | $205,734,019 | $265,274,153 | $-- |
The following is a summary of transfers between Level 1 and Level 2 for the period ended October 31, 2018. Transfers are assumed to have occurred at the beginning of the period, and are primarily attributable to the valuation techniques used for foreign equity securities, as discussed in the accompanying Notes to Financial Statements:
| Transfers | Total |
| Level 1 to Level 2 | $27,236,627 |
| Level 2 to Level 1 | $20,314,020 |
See accompanying notes which are an integral part of the financial statements.
Financial Statements
Statement of Assets and Liabilities
| | | October 31, 2018 |
| Assets | | |
Investment in securities, at value (including securities loaned of $15,231,117) — See accompanying schedule:
Unaffiliated issuers (cost $491,569,512) | $450,985,776 | |
| Fidelity Central Funds (cost $20,022,870) | 20,022,396 | |
| Total Investment in Securities (cost $511,592,382) | | $471,008,172 |
| Foreign currency held at value (cost $80,113) | | 80,113 |
| Receivable for fund shares sold | | 7,469,017 |
| Dividends receivable | | 2,628,658 |
| Distributions receivable from Fidelity Central Funds | | 12,827 |
| Prepaid expenses | | 920 |
| Other receivables | | 22,926 |
| Total assets | | 481,222,633 |
| Liabilities | | |
| Payable for investments purchased | $7,785,910 | |
| Payable for fund shares redeemed | 231,990 | |
| Accrued management fee | 221,669 | |
| Distribution and service plan fees payable | 8,008 | |
| Other affiliated payables | 86,468 | |
| Other payables and accrued expenses | 77,953 | |
| Collateral on securities loaned | 15,777,128 | |
| Total liabilities | | 24,189,126 |
| Net Assets | | $457,033,507 |
| Net Assets consist of: | | |
| Paid in capital | | $505,925,359 |
| Total distributable earnings (loss) | | (48,891,852) |
| Net Assets | | $457,033,507 |
| Net Asset Value and Maximum Offering Price | | |
| Class A: | | |
| Net Asset Value and redemption price per share ($7,887,242 ÷ 970,163 shares) | | $8.13 |
| Maximum offering price per share (100/94.25 of $8.13) | | $8.63 |
| Class M: | | |
| Net Asset Value and redemption price per share ($3,919,977 ÷ 483,320 shares) | | $8.11 |
| Maximum offering price per share (100/96.50 of $8.11) | | $8.40 |
| Class C: | | |
| Net Asset Value and offering price per share ($5,339,305 ÷ 660,917 shares)(a) | | $8.08 |
| International Value: | | |
| Net Asset Value, offering price and redemption price per share ($433,015,468 ÷ 53,228,066 shares) | | $8.14 |
| Class I: | | |
| Net Asset Value, offering price and redemption price per share ($6,779,070 ÷ 832,272 shares) | | $8.15 |
| Class Z: | | |
| Net Asset Value, offering price and redemption price per share ($92,445 ÷ 11,351 shares) | | $8.14 |
(a) Redemption price per share is equal to net asset value less any applicable contingent deferred sales charge.
See accompanying notes which are an integral part of the financial statements.
Statement of Operations
| | | Year ended October 31, 2018 |
| Investment Income | | |
| Dividends | | $19,726,153 |
| Income from Fidelity Central Funds | | 314,818 |
| Income before foreign taxes withheld | | 20,040,971 |
| Less foreign taxes withheld | | (1,743,150) |
| Total income | | 18,297,821 |
| Expenses | | |
| Management fee | | |
| Basic fee | $3,540,480 | |
| Performance adjustment | (294,667) | |
| Transfer agent fees | 848,275 | |
| Distribution and service plan fees | 100,081 | |
| Accounting and security lending fees | 266,165 | |
| Custodian fees and expenses | 86,817 | |
| Independent trustees' fees and expenses | 2,495 | |
| Registration fees | 78,774 | |
| Audit | 68,016 | |
| Legal | 1,427 | |
| Interest | 1,357 | |
| Miscellaneous | 2,827 | |
| Total expenses before reductions | 4,702,047 | |
| Expense reductions | (94,245) | |
| Total expenses after reductions | | 4,607,802 |
| Net investment income (loss) | | 13,690,019 |
| Realized and Unrealized Gain (Loss) | | |
| Net realized gain (loss) on: | | |
| Investment securities: | | |
| Unaffiliated issuers | 17,678,169 | |
| Fidelity Central Funds | (1,131) | |
| Foreign currency transactions | (6,284) | |
| Total net realized gain (loss) | | 17,670,754 |
| Change in net unrealized appreciation (depreciation) on: | | |
| Investment securities: | | |
| Unaffiliated issuers | (75,930,956) | |
| Fidelity Central Funds | (461) | |
| Assets and liabilities in foreign currencies | (24,662) | |
| Total change in net unrealized appreciation (depreciation) | | (75,956,079) |
| Net gain (loss) | | (58,285,325) |
| Net increase (decrease) in net assets resulting from operations | | $(44,595,306) |
See accompanying notes which are an integral part of the financial statements.
Statement of Changes in Net Assets
| | Year ended October 31, 2018 | Year ended October 31, 2017 |
| Increase (Decrease) in Net Assets | | |
| Operations | | |
| Net investment income (loss) | $13,690,019 | $8,130,796 |
| Net realized gain (loss) | 17,670,754 | 518,118 |
| Change in net unrealized appreciation (depreciation) | (75,956,079) | 54,057,696 |
| Net increase (decrease) in net assets resulting from operations | (44,595,306) | 62,706,610 |
| Distributions to shareholders | (8,990,094) | – |
| Distributions to shareholders from net investment income | – | (8,124,122) |
| Distributions to shareholders from net realized gain | – | (457,331) |
| Total distributions | (8,990,094) | (8,581,453) |
| Share transactions - net increase (decrease) | 127,811,807 | 1,925,222 |
| Redemption fees | 12,452 | 1,612 |
| Total increase (decrease) in net assets | 74,238,859 | 56,051,991 |
| Net Assets | | |
| Beginning of period | 382,794,648 | 326,742,657 |
| End of period | $457,033,507 | $382,794,648 |
| Other Information | | |
| Undistributed net investment income end of period | | $7,489,052 |
See accompanying notes which are an integral part of the financial statements.
Financial Highlights
Fidelity International Value Fund Class A
| Years ended October 31, | 2018 | 2017 | 2016 | 2015 | 2014 |
| Selected Per–Share Data | | | | | |
| Net asset value, beginning of period | $9.08 | $7.78 | $8.27 | $8.62 | $8.96 |
| Income from Investment Operations | | | | | |
| Net investment income (loss)A | .21 | .17 | .17 | .13 | .31B |
| Net realized and unrealized gain (loss) | (1.04) | 1.31 | (.57) | (.20) | (.47) |
| Total from investment operations | (.83) | 1.48 | (.40) | (.07) | (.16) |
| Distributions from net investment income | (.10) | (.17) | (.09) | (.28) | (.17) |
| Distributions from net realized gain | (.01) | (.01) | – | – | (.01) |
| Total distributions | (.12)C | (.18) | (.09) | (.28) | (.18) |
| Redemption fees added to paid in capitalA,D | – | – | – | – | – |
| Net asset value, end of period | $8.13 | $9.08 | $7.78 | $8.27 | $8.62 |
| Total ReturnE,F | (9.30)% | 19.36% | (4.91)% | (.81)% | (1.76)% |
| Ratios to Average Net AssetsG,H | | | | | |
| Expenses before reductions | 1.23% | 1.33% | 1.40% | 1.37% | 1.32% |
| Expenses net of fee waivers, if any | 1.23% | 1.33% | 1.40% | 1.37% | 1.32% |
| Expenses net of all reductions | 1.21% | 1.32% | 1.39% | 1.36% | 1.32% |
| Net investment income (loss) | 2.36% | 2.01% | 2.19% | 1.58% | 3.44%B |
| Supplemental Data | | | | | |
| Net assets, end of period (000 omitted) | $7,887 | $8,151 | $7,717 | $8,956 | $6,296 |
| Portfolio turnover rateI | 55% | 50% | 47% | 44% | 69% |
A Calculated based on average shares outstanding during the period.
B Net investment income per share reflects a large, non-recurring dividend which amounted to $.14 per share. Excluding this non-recurring dividend, the ratio of net investment income (loss) to average net assets would have been 1.90%.
C Total distributions of $.12 per share is comprised of distributions from net investment income of $.102 and distributions from net realized gain of $.014 per share.
D Amount represents less than $.005 per share.
E Total returns would have been lower if certain expenses had not been reduced during the applicable periods shown.
F Total returns do not include the effect of the sales charges.
G Fees and expenses of any underlying Fidelity Central Funds are not included in the Fund's expense ratio. The Fund indirectly bears its proportionate share of the expenses of any underlying Fidelity Central Funds.
H Expense ratios reflect operating expenses of the class. Expenses before reductions do not reflect amounts reimbursed by the investment adviser or reductions from brokerage service arrangements or reductions from other expense offset arrangements and do not represent the amount paid by the class during periods when reimbursements or reductions occur. Expenses net of fee waivers reflect expenses after reimbursement by the investment adviser but prior to reductions from brokerage service arrangements or other expense offset arrangements. Expenses net of all reductions represent the net expenses paid by the class.
I Amount does not include the portfolio activity of any underlying Fidelity Central Funds.
See accompanying notes which are an integral part of the financial statements.
Fidelity International Value Fund Class M
| Years ended October 31, | 2018 | 2017 | 2016 | 2015 | 2014 |
| Selected Per–Share Data | | | | | |
| Net asset value, beginning of period | $9.06 | $7.76 | $8.25 | $8.60 | $8.94 |
| Income from Investment Operations | | | | | |
| Net investment income (loss)A | .18 | .14 | .15 | .11 | .28B |
| Net realized and unrealized gain (loss) | (1.04) | 1.31 | (.58) | (.20) | (.46) |
| Total from investment operations | (.86) | 1.45 | (.43) | (.09) | (.18) |
| Distributions from net investment income | (.08) | (.14) | (.06) | (.26) | (.15) |
| Distributions from net realized gain | (.01) | (.01) | – | – | (.01) |
| Total distributions | (.09) | (.15) | (.06) | (.26) | (.16) |
| Redemption fees added to paid in capitalA,C | – | – | – | – | – |
| Net asset value, end of period | $8.11 | $9.06 | $7.76 | $8.25 | $8.60 |
| Total ReturnD,E | (9.59)% | 19.04% | (5.24)% | (1.09)% | (1.99)% |
| Ratios to Average Net AssetsF,G | | | | | |
| Expenses before reductions | 1.56% | 1.64% | 1.70% | 1.66% | 1.59% |
| Expenses net of fee waivers, if any | 1.55% | 1.64% | 1.70% | 1.66% | 1.59% |
| Expenses net of all reductions | 1.54% | 1.63% | 1.69% | 1.65% | 1.59% |
| Net investment income (loss) | 2.04% | 1.70% | 1.89% | 1.29% | 3.17%B |
| Supplemental Data | | | | | |
| Net assets, end of period (000 omitted) | $3,920 | $4,181 | $3,703 | $4,086 | $3,604 |
| Portfolio turnover rateH | 55% | 50% | 47% | 44% | 69% |
A Calculated based on average shares outstanding during the period.
B Net investment income per share reflects a large, non-recurring dividend which amounted to $.14 per share. Excluding this non-recurring dividend, the ratio of net investment income (loss) to average net assets would have been 1.64%.
C Amount represents less than $.005 per share.
D Total returns would have been lower if certain expenses had not been reduced during the applicable periods shown.
E Total returns do not include the effect of the sales charges.
F Fees and expenses of any underlying Fidelity Central Funds are not included in the Fund's expense ratio. The Fund indirectly bears its proportionate share of the expenses of any underlying Fidelity Central Funds.
G Expense ratios reflect operating expenses of the class. Expenses before reductions do not reflect amounts reimbursed by the investment adviser or reductions from brokerage service arrangements or reductions from other expense offset arrangements and do not represent the amount paid by the class during periods when reimbursements or reductions occur. Expenses net of fee waivers reflect expenses after reimbursement by the investment adviser but prior to reductions from brokerage service arrangements or other expense offset arrangements. Expenses net of all reductions represent the net expenses paid by the class.
H Amount does not include the portfolio activity of any underlying Fidelity Central Funds.
See accompanying notes which are an integral part of the financial statements.
Fidelity International Value Fund Class C
| Years ended October 31, | 2018 | 2017 | 2016 | 2015 | 2014 |
| Selected Per–Share Data | | | | | |
| Net asset value, beginning of period | $9.04 | $7.75 | $8.23 | $8.59 | $8.93 |
| Income from Investment Operations | | | | | |
| Net investment income (loss)A | .14 | .10 | .11 | .07 | .24B |
| Net realized and unrealized gain (loss) | (1.04) | 1.31 | (.57) | (.20) | (.45) |
| Total from investment operations | (.90) | 1.41 | (.46) | (.13) | (.21) |
| Distributions from net investment income | (.04) | (.11) | (.02) | (.23) | (.11) |
| Distributions from net realized gain | (.01) | (.01) | – | – | (.01) |
| Total distributions | (.06)C | (.12) | (.02) | (.23) | (.13)D |
| Redemption fees added to paid in capitalA,E | – | – | – | – | – |
| Net asset value, end of period | $8.08 | $9.04 | $7.75 | $8.23 | $8.59 |
| Total ReturnF,G | (10.06)% | 18.41% | (5.61)% | (1.58)% | (2.43)% |
| Ratios to Average Net AssetsH,I | | | | | |
| Expenses before reductions | 2.04% | 2.12% | 2.17% | 2.15% | 2.07% |
| Expenses net of fee waivers, if any | 2.04% | 2.12% | 2.17% | 2.14% | 2.07% |
| Expenses net of all reductions | 2.02% | 2.11% | 2.17% | 2.14% | 2.07% |
| Net investment income (loss) | 1.55% | 1.22% | 1.42% | .81% | 2.69%B |
| Supplemental Data | | | | | |
| Net assets, end of period (000 omitted) | $5,339 | $5,171 | $4,168 | $4,502 | $3,647 |
| Portfolio turnover rateJ | 55% | 50% | 47% | 44% | 69% |
A Calculated based on average shares outstanding during the period.
B Net investment income per share reflects a large, non-recurring dividend which amounted to $.14 per share. Excluding this non-recurring dividend, the ratio of net investment income (loss) to average net assets would have been 1.15%.
C Total distributions of $.06 per share is comprised of distributions from net investment income of $.042 and distributions from net realized gain of $.014 per share.
D Total distributions of $.13 per share is comprised of distributions from net investment income of $.111 and distributions from net realized gain of $.014 per share.
E Amount represents less than $.005 per share.
F Total returns would have been lower if certain expenses had not been reduced during the applicable periods shown.
G Total returns do not include the effect of the contingent deferred sales charge.
H Fees and expenses of any underlying Fidelity Central Funds are not included in the Fund's expense ratio. The Fund indirectly bears its proportionate share of the expenses of any underlying Fidelity Central Funds.
I Expense ratios reflect operating expenses of the class. Expenses before reductions do not reflect amounts reimbursed by the investment adviser or reductions from brokerage service arrangements or reductions from other expense offset arrangements and do not represent the amount paid by the class during periods when reimbursements or reductions occur. Expenses net of fee waivers reflect expenses after reimbursement by the investment adviser but prior to reductions from brokerage service arrangements or other expense offset arrangements. Expenses net of all reductions represent the net expenses paid by the class.
J Amount does not include the portfolio activity of any underlying Fidelity Central Funds.
See accompanying notes which are an integral part of the financial statements.
Fidelity International Value Fund
| Years ended October 31, | 2018 | 2017 | 2016 | 2015 | 2014 |
| Selected Per–Share Data | | | | | |
| Net asset value, beginning of period | $9.09 | $7.79 | $8.29 | $8.64 | $8.97 |
| Income from Investment Operations | | | | | |
| Net investment income (loss)A | .24 | .20 | .20 | .16 | .34B |
| Net realized and unrealized gain (loss) | (1.04) | 1.31 | (.58) | (.19) | (.46) |
| Total from investment operations | (.80) | 1.51 | (.38) | (.03) | (.12) |
| Distributions from net investment income | (.14) | (.20) | (.12) | (.32) | (.20) |
| Distributions from net realized gain | (.01) | (.01) | – | – | (.01) |
| Total distributions | (.15) | (.21) | (.12) | (.32) | (.21) |
| Redemption fees added to paid in capitalA,C | – | – | – | – | – |
| Net asset value, end of period | $8.14 | $9.09 | $7.79 | $8.29 | $8.64 |
| Total ReturnD | (8.95)% | 19.83% | (4.69)% | (.41)% | (1.34)% |
| Ratios to Average Net AssetsE,F | | | | | |
| Expenses before reductions | .89% | .97% | 1.03% | 1.02% | .96% |
| Expenses net of fee waivers, if any | .89% | .97% | 1.03% | 1.02% | .96% |
| Expenses net of all reductions | .87% | .96% | 1.03% | 1.01% | .95% |
| Net investment income (loss) | 2.70% | 2.36% | 2.56% | 1.93% | 3.80%B |
| Supplemental Data | | | | | |
| Net assets, end of period (000 omitted) | $433,015 | $359,770 | $309,199 | $267,567 | $192,789 |
| Portfolio turnover rateG | 55% | 50% | 47% | 44% | 69% |
A Calculated based on average shares outstanding during the period.
B Net investment income per share reflects a large, non-recurring dividend which amounted to $.14 per share. Excluding this non-recurring dividend, the ratio of net investment income (loss) to average net assets would have been 2.27%.
C Amount represents less than $.005 per share.
D Total returns would have been lower if certain expenses had not been reduced during the applicable periods shown.
E Fees and expenses of any underlying Fidelity Central Funds are not included in the Fund's expense ratio. The Fund indirectly bears its proportionate share of the expenses of any underlying Fidelity Central Funds.
F Expense ratios reflect operating expenses of the class. Expenses before reductions do not reflect amounts reimbursed by the investment adviser or reductions from brokerage service arrangements or reductions from other expense offset arrangements and do not represent the amount paid by the class during periods when reimbursements or reductions occur. Expenses net of fee waivers reflect expenses after reimbursement by the investment adviser but prior to reductions from brokerage service arrangements or other expense offset arrangements. Expenses net of all reductions represent the net expenses paid by the class.
G Amount does not include the portfolio activity of any underlying Fidelity Central Funds.
See accompanying notes which are an integral part of the financial statements.
Fidelity International Value Fund Class I
| Years ended October 31, | 2018 | 2017 | 2016 | 2015 | 2014 |
| Selected Per–Share Data | | | | | |
| Net asset value, beginning of period | $9.10 | $7.80 | $8.29 | $8.65 | $8.98 |
| Income from Investment Operations | | | | | |
| Net investment income (loss)A | .23 | .19 | .19 | .15 | .33B |
| Net realized and unrealized gain (loss) | (1.04) | 1.31 | (.58) | (.19) | (.45) |
| Total from investment operations | (.81) | 1.50 | (.39) | (.04) | (.12) |
| Distributions from net investment income | (.13) | (.19) | (.10) | (.32) | (.19) |
| Distributions from net realized gain | (.01) | (.01) | – | – | (.01) |
| Total distributions | (.14) | (.20) | (.10) | (.32) | (.21)C |
| Redemption fees added to paid in capitalA,D | – | – | – | – | – |
| Net asset value, end of period | $8.15 | $9.10 | $7.80 | $8.29 | $8.65 |
| Total ReturnE | (9.04)% | 19.68% | (4.81)% | (.53)% | (1.41)% |
| Ratios to Average Net AssetsF,G | | | | | |
| Expenses before reductions | .97% | 1.10% | 1.17% | 1.14% | 1.05% |
| Expenses net of fee waivers, if any | .97% | 1.10% | 1.17% | 1.14% | 1.05% |
| Expenses net of all reductions | .95% | 1.09% | 1.16% | 1.13% | 1.04% |
| Net investment income (loss) | 2.62% | 2.23% | 2.42% | 1.81% | 3.71%B |
| Supplemental Data | | | | | |
| Net assets, end of period (000 omitted) | $6,779 | $5,523 | $1,955 | $1,969 | $1,310 |
| Portfolio turnover rateH | 55% | 50% | 47% | 44% | 69% |
A Calculated based on average shares outstanding during the period.
B Net investment income per share reflects a large, non-recurring dividend which amounted to $.14 per share. Excluding this non-recurring dividend, the ratio of net investment income (loss) to average net assets would have been 2.18%.
C Total distributions of $.21 per share is comprised of distributions from net investment income of $.191 and distributions from net realized gain of $.014 per share.
D Amount represents less than $.005 per share.
E Total returns would have been lower if certain expenses had not been reduced during the applicable periods shown.
F Fees and expenses of any underlying Fidelity Central Funds are not included in the Fund's expense ratio. The Fund indirectly bears its proportionate share of the expenses of any underlying Fidelity Central Funds.
G Expense ratios reflect operating expenses of the class. Expenses before reductions do not reflect amounts reimbursed by the investment adviser or reductions from brokerage service arrangements or reductions from other expense offset arrangements and do not represent the amount paid by the class during periods when reimbursements or reductions occur. Expenses net of fee waivers reflect expenses after reimbursement by the investment adviser but prior to reductions from brokerage service arrangements or other expense offset arrangements. Expenses net of all reductions represent the net expenses paid by the class.
H Amount does not include the portfolio activity of any underlying Fidelity Central Funds.
See accompanying notes which are an integral part of the financial statements.
Fidelity International Value Fund Class Z
| Year ended October 31, | 2018 A |
| Selected Per–Share Data | |
| Net asset value, beginning of period | $8.81 |
| Income from Investment Operations | |
| Net investment income (loss)B | .01 |
| Net realized and unrealized gain (loss) | (.68) |
| Total from investment operations | (.67) |
| Net asset value, end of period | $8.14 |
| Total ReturnC,D | (7.60)% |
| Ratios to Average Net AssetsE,F | |
| Expenses before reductions | .84%G |
| Expenses net of fee waivers, if any | .84%G |
| Expenses net of all reductions | .82%G |
| Net investment income (loss) | 1.58%G |
| Supplemental Data | |
| Net assets, end of period (000 omitted) | $92 |
| Portfolio turnover rateH | 55% |
A For the period October 2, 2018 (commencement of sale of shares) to October 31, 2018.
B Calculated based on average shares outstanding during the period.
C Total returns for periods of less than one year are not annualized.
D Total returns would have been lower if certain expenses had not been reduced during the applicable periods shown.
E Fees and expenses of any underlying Fidelity Central Funds are not included in the Fund's expense ratio. The Fund indirectly bears its proportionate share of the expenses of any underlying Fidelity Central Funds.
F Expense ratios reflect operating expenses of the class. Expenses before reductions do not reflect amounts reimbursed by the investment adviser or reductions from brokerage service arrangements or reductions from other expense offset arrangements and do not represent the amount paid by the class during periods when reimbursements or reductions occur. Expense ratios before reductions for start-up periods may not be representative of longer-term operating periods. Expenses net of fee waivers reflect expenses after reimbursement by the investment adviser but prior to reductions from brokerage service arrangements or other expense offset arrangements. Expenses net of all reductions represent the net expenses paid by the class.
G Annualized
H Amount does not include the portfolio activity of any underlying Fidelity Central Funds.
See accompanying notes which are an integral part of the financial statements.
Notes to Financial Statements
For the period ended October 31, 2018
1. Organization.
Fidelity International Value Fund (the Fund) is a fund of Fidelity Investment Trust (the Trust) and is authorized to issue an unlimited number of shares. The Trust is registered under the Investment Company Act of 1940, as amended (the 1940 Act), as an open-end management investment company organized as a Massachusetts business trust. The Fund commenced sale of Class Z shares on October 2, 2018. The Fund offers Class A, Class M, Class C, International Value, Class I and Class Z shares, each of which has equal rights as to assets and voting privileges. Each class has exclusive voting rights with respect to matters that affect that class.
2. Investments in Fidelity Central Funds.
The Fund invests in Fidelity Central Funds, which are open-end investment companies generally available only to other investment companies and accounts managed by the investment adviser and its affiliates. The Fund's Schedule of Investments lists each of the Fidelity Central Funds held as of period end, if any, as an investment of the Fund, but does not include the underlying holdings of each Fidelity Central Fund. As an Investing Fund, the Fund indirectly bears its proportionate share of the expenses of the underlying Fidelity Central Funds.
The Money Market Central Funds seek preservation of capital and current income and are managed by Fidelity Investments Money Management, Inc. (FIMM), an affiliate of the investment adviser. Annualized expenses of the Money Market Central Funds as of their most recent shareholder report date are less than .005%.
A complete unaudited list of holdings for each Fidelity Central Fund is available upon request or at the Securities and Exchange Commission (the SEC) website at www.sec.gov. In addition, the financial statements of the Fidelity Central Funds, which are not covered by the Fund's Report of Independent Registered Public Accounting Firm, are available on the SEC website or upon request.
3. Significant Accounting Policies.
The Fund is an investment company and applies the accounting and reporting guidance of the Financial Accounting Standards Board (FASB) Accounting Standards Codification Topic 946 Financial Services – Investments Companies. The financial statements have been prepared in conformity with accounting principles generally accepted in the United States of America (GAAP), which require management to make certain estimates and assumptions at the date of the financial statements. Actual results could differ from those estimates. Subsequent events, if any, through the date that the financial statements were issued have been evaluated in the preparation of the financial statements. The following summarizes the significant accounting policies of the Fund:
Investment Valuation. Investments are valued as of 4:00 p.m. Eastern time on the last calendar day of the period. The Board of Trustees (the Board) has delegated the day to day responsibility for the valuation of the Fund's investments to the Fair Value Committee (the Committee) established by the Fund's investment adviser. In accordance with valuation policies and procedures approved by the Board, the Fund attempts to obtain prices from one or more third party pricing vendors or brokers to value its investments. When current market prices, quotations or currency exchange rates are not readily available or reliable, investments will be fair valued in good faith by the Committee, in accordance with procedures adopted by the Board. Factors used in determining fair value vary by investment type and may include market or investment specific events. The frequency with which these procedures are used cannot be predicted and they may be utilized to a significant extent. The Committee oversees the Fund's valuation policies and procedures and reports to the Board on the Committee's activities and fair value determinations. The Board monitors the appropriateness of the procedures used in valuing the Fund's investments and ratifies the fair value determinations of the Committee.
The Fund categorizes the inputs to valuation techniques used to value its investments into a disclosure hierarchy consisting of three levels as shown below:
- Level 1 – quoted prices in active markets for identical investments
- Level 2 – other significant observable inputs (including quoted prices for similar investments, interest rates, prepayment speeds, etc.)
- Level 3 – unobservable inputs (including the Fund's own assumptions based on the best information available)
Valuation techniques used to value the Fund's investments by major category are as follows:
Equity securities, including restricted securities, for which market quotations are readily available, are valued at the last reported sale price or official closing price as reported by a third party pricing vendor on the primary market or exchange on which they are traded and are categorized as Level 1 in the hierarchy. In the event there were no sales during the day or closing prices are not available, securities are valued at the last quoted bid price or may be valued using the last available price and are generally categorized as Level 2 in the hierarchy. For foreign equity securities, when market or security specific events arise, comparisons to the valuation of American Depositary Receipts (ADRs), futures contracts, Exchange-Traded Funds (ETFs) and certain indexes as well as quoted prices for similar securities may be used and would be categorized as Level 2 in the hierarchy. Utilizing these techniques may result in transfers between Level 1 and Level 2. For equity securities, including restricted securities, where observable inputs are limited, assumptions about market activity and risk are used and these securities may be categorized as Level 3 in the hierarchy.
Investments in open-end mutual funds, including the Fidelity Central Funds, are valued at their closing net asset value (NAV) each business day and are categorized as Level 1 in the hierarchy.
Changes in valuation techniques may result in transfers in or out of an assigned level within the disclosure hierarchy. The aggregate value of investments by input level as of October 31, 2018, including information on transfers between Levels 1 and 2, is included at the end of the Fund's Schedule of Investments.
Foreign Currency. The Fund may use foreign currency contracts to facilitate transactions in foreign-denominated securities. Gains and losses from these transactions may arise from changes in the value of the foreign currency or if the counterparties do not perform under the contracts' terms.
Foreign-denominated assets, including investment securities, and liabilities are translated into U.S. dollars at the exchange rates at period end. Purchases and sales of investment securities, income and dividends received and expenses denominated in foreign currencies are translated into U.S. dollars at the exchange rate in effect on the transaction date.
The effects of exchange rate fluctuations on investments are included with the net realized and unrealized gain (loss) on investment securities. Other foreign currency transactions resulting in realized and unrealized gain (loss) are disclosed separately.
Investment Transactions and Income. For financial reporting purposes, the Fund's investment holdings and NAV include trades executed through the end of the last business day of the period. The NAV per share for processing shareholder transactions is calculated as of the close of business of the New York Stock Exchange (NYSE), normally 4:00 p.m. Eastern time and includes trades executed through the end of the prior business day. Gains and losses on securities sold are determined on the basis of identified cost and include proceeds received from litigation. Dividend income is recorded on the ex-dividend date, except for certain dividends from foreign securities where the ex-dividend date may have passed, which are recorded as soon as the Fund is informed of the ex-dividend date. Non-cash dividends included in dividend income, if any, are recorded at the fair market value of the securities received. Income and capital gain distributions from Fidelity Central Funds, if any, are recorded on the ex-dividend date. Certain distributions received by the Fund represent a return of capital or capital gain. The Fund determines the components of these distributions subsequent to the ex-dividend date, based upon receipt of tax filings or other correspondence relating to the underlying investment. These distributions are recorded as a reduction of cost of investments and/or as a realized gain. Interest income is accrued as earned and includes coupon interest and amortization of premium and accretion of discount on debt securities as applicable. Investment income is recorded net of foreign taxes withheld where recovery of such taxes is uncertain.
Class Allocations and Expenses. Investment income, realized and unrealized capital gains and losses, common expenses of the Fund, and certain fund-level expense reductions, if any, are allocated daily on a pro-rata basis to each class based on the relative net assets of each class to the total net assets of the Fund. Each class differs with respect to transfer agent and distribution and service plan fees incurred. Certain expense reductions may also differ by class. For the reporting period, the allocated portion of income and expenses to each class as a percent of its average net assets may vary due to the timing of recording these transactions in relation to fluctuating net assets of the classes. Expenses directly attributable to a fund are charged to that fund. Expenses attributable to more than one fund are allocated among the respective funds on the basis of relative net assets or other appropriate methods. Expense estimates are accrued in the period to which they relate and adjustments are made when actual amounts are known.
Income Tax Information and Distributions to Shareholders. Each year, the Fund intends to qualify as a regulated investment company under Subchapter M of the Internal Revenue Code, including distributing substantially all of its taxable income and realized gains. As a result, no provision for U.S. Federal income taxes is required. As of October 31, 2018, the Fund did not have any unrecognized tax benefits in the financial statements; nor is the Fund aware of any tax positions for which it is reasonably possible that the total amounts of unrecognized tax benefits will significantly change in the next twelve months. The Fund files a U.S. federal tax return, in addition to state and local tax returns as required. The Fund's federal income tax returns are subject to examination by the Internal Revenue Service (IRS) for a period of three fiscal years after they are filed. State and local tax returns may be subject to examination for an additional fiscal year depending on the jurisdiction. Foreign taxes are provided for based on the Fund's understanding of the tax rules and rates that exist in the foreign markets in which it invests.
Distributions are declared and recorded on the ex-dividend date. Income and capital gain distributions are declared separately for each class. Income and capital gain distributions are determined in accordance with income tax regulations, which may differ from GAAP.
Capital accounts within the financial statements are adjusted for permanent book-tax differences. These adjustments have no impact on net assets or the results of operations. Capital accounts are not adjusted for temporary book-tax differences which will reverse in a subsequent period.
Book-tax differences are primarily due to foreign currency transactions, passive foreign investment companies (PFIC), expiring capital loss carryforwards, capital loss carryforwards and losses deferred due to wash sales.
As of period end, the cost and unrealized appreciation (depreciation) in securities, and derivatives if applicable, for federal income tax purposes were as follows:
| Gross unrealized appreciation | $20,605,169 |
| Gross unrealized depreciation | (62,548,863) |
| Net unrealized appreciation (depreciation) | $(41,943,694) |
| Tax Cost | $512,951,866 |
The tax-based components of distributable earnings as of period end were as follows:
| Undistributed ordinary income | $12,539,510 |
| Capital loss carryforward | $(19,448,816) |
| Net unrealized appreciation (depreciation) on securities and other investments | $(41,982,545) |
Capital loss carryforwards are only available to offset future capital gains of the Fund to the extent provided by regulations and may be limited. Under the Regulated Investment Company Modernization Act of 2010 (the Act), the Fund is permitted to carry forward capital losses incurred in taxable years beginning after December 22, 2010 for an unlimited period and such capital losses are required to be used prior to any losses that expire. The capital loss carryforward information presented below, including any applicable limitation, is estimated as of fiscal period end and is subject to adjustment.
| Fiscal year of expiration | |
| 2019 | $(19,448,816) |
| Total with expiration | $(19,448,816) |
| Total capital loss carryforward | $(19,448,816) |
The tax character of distributions paid was as follows:
| | October 31, 2018 | October 31, 2017 |
| Ordinary Income | $ 8,990,094 | $ 8,581,453 |
Short-Term Trading (Redemption) Fees. Shares held by investors in the Fund less than 30 days may have been subject to a redemption fee equal to 1.00% of the NAV of shares redeemed. All redemption fees, which reduce the proceeds of the shareholder redemption, are retained by the Fund and accounted for as an addition to paid in capital. In November 2017, the Board of Trustees approved the elimination of these redemption fees effective December 18, 2017.
Restricted Securities. The Fund may invest in securities that are subject to legal or contractual restrictions on resale. These securities generally may be resold in transactions exempt from registration or to the public if the securities are registered. Disposal of these securities may involve time-consuming negotiations and expense, and prompt sale at an acceptable price may be difficult. Information regarding restricted securities is included at the end of the Fund's Schedule of Investments.
New Rule Issuance. During August 2018, the U.S. Securities and Exchange Commission issued Final Rule Release No. 33-10532, Disclosure Update and Simplification. This Final Rule includes amendments specific to registered investment companies that are intended to eliminate overlap in disclosure requirements between Regulation S-X and GAAP. In accordance with these amendments, certain line-items in the Fund's financial statements have been combined or removed for the current period as outlined in the table below.
| Financial Statement | Current Line-Item Presentation | Prior Line-Item Presentation |
| Statement of Assets and Liabilities | Total distributable earnings (loss) | Undistributed/Distributions in excess of/Accumulated net investment income (loss)
Accumulated/Undistributed net realized gain (loss)
Net unrealized appreciation (depreciation) |
| Statement of Changes in Net Assets | N/A - removed | Undistributed/Distributions in excess of/Accumulated net investment income (loss) end of period |
| Statement of Changes in Net Assets | Distributions to shareholders | Distributions to shareholders from net investment income
Distributions to shareholders from net realized gain |
| Distributions to Shareholders Note to Financial Statements | Distributions to shareholders | Distributions to shareholders from net investment income
Distributions to shareholders from net realized gain |
4. Purchases and Sales of Investments.
Purchases and sales of securities, other than short-term securities, aggregated $405,058,388 and $273,996,296, respectively.
5. Fees and Other Transactions with Affiliates.
Management Fee. Fidelity Management & Research Company (the investment adviser) and its affiliates provide the Fund with investment management related services for which the Fund pays a monthly management fee. The management fee is the sum of an individual fund fee rate that is based on an annual rate of .45% of the Fund's average net assets and an annualized group fee rate that averaged .24% during the period. The group fee rate is based upon the average net assets of all the mutual funds advised by the investment adviser, including any mutual funds previously advised by the investment adviser that are currently advised by Fidelity SelectCo, LLC, an affiliate of the investment adviser. The group fee rate decreases as assets under management increase and increases as assets under management decrease. In addition, the management fee is subject to a performance adjustment (up to a maximum of +/- .20% of the Fund's average net assets over a 36 month performance period). The upward or downward adjustment to the management fee is based on the relative investment performance of International Value as compared to its benchmark index, the MSCI EAFE Value Index, over the same 36 month performance period. For the reporting period, the total annual management fee rate, including the performance adjustment, was .63% of the Fund's average net assets. The performance adjustment included in the management fee rate may be higher or lower than the maximum performance adjustment rate due to the difference between the average net assets for the reporting and performance periods.
Distribution and Service Plan Fees. In accordance with Rule 12b-1 of the 1940 Act, the Fund has adopted separate Distribution and Service Plans for each class of shares. Certain classes pay Fidelity Distributors Corporation (FDC), an affiliate of the investment adviser, separate Distribution and Service Fees, each of which is based on an annual percentage of each class' average net assets. In addition, FDC may pay financial intermediaries for selling shares of the Fund and providing shareholder support services. For the period, the Distribution and Service Fee rates, total fees and amounts retained by FDC were as follows:
| | Distribution Fee | Service Fee | Total Fees | Retained by FDC |
| Class A | -% | .25% | $21,210 | $995 |
| Class M | .25% | .25% | 20,998 | 40 |
| Class C | .75% | .25% | 57,873 | 7,920 |
| | | | $100,081 | $8,955 |
Sales Load. FDC may receive a front-end sales charge of up to 5.75% for selling Class A shares and 3.50% for selling Class M shares, some of which is paid to financial intermediaries for selling shares of the Fund. Depending on the holding period, FDC may receive contingent deferred sales charges levied on Class A, Class M and Class C redemptions. The deferred sales charges are 1.00% for Class C shares, 1.00% for certain purchases of Class A shares and .25% for certain purchases of Class M shares.
For the period, sales charge amounts retained by FDC were as follows:
| | Retained by FDC |
| Class A | $5,328 |
| Class M | 1,081 |
| Class C(a) | 341 |
| | $6,750 |
(a) When Class C shares are initially sold, FDC pays commissions from its own resources to financial intermediaries through which the sales are made.
Transfer Agent Fees. Fidelity Investments Institutional Operations Company, Inc., (FIIOC), an affiliate of the investment adviser, is the transfer, dividend disbursing and shareholder servicing agent for each class of the Fund. FIIOC receives account fees and asset-based fees that vary according to the account size and type of account of the shareholders of the respective classes of the Fund, except for Class Z. FIIOC receives an asset-based fee of Class Z's average net assets. FIIOC pays for typesetting, printing and mailing of shareholder reports, except proxy statements.
For the period, transfer agent fees for each class were as follows:
| | Amount | % of Class-Level Average Net Assets |
| Class A | $20,733 | .24 |
| Class M | 13,543 | .32 |
| Class C | 17,618 | .30 |
| International Value | 780,074 | .16 |
| Class I | 16,304 | .24 |
| Class Z | 3 | .04(a) |
| | $848,275 | |
(a) Annualized
Accounting and Security Lending Fees. Fidelity Service Company, Inc. (FSC), an affiliate of the investment adviser, maintains the Fund's accounting records. The accounting fee is based on the level of average net assets for each month. Under a separate contract, FSC administers the security lending program. The security lending fee is based on the number and duration of lending transactions. For the period, the fees were equivalent to an annual rate of .05%.
Brokerage Commissions. The Fund placed a portion of its portfolio transactions with brokerage firms which are affiliates of the investment adviser. Brokerage commissions are included in net realized gain (loss) and change in net unrealized appreciation (depreciation) in the Statement of Operations. The commissions paid to these affiliated firms were $517 for the period.
Interfund Lending Program. Pursuant to an Exemptive Order issued by the SEC, the Fund, along with other registered investment companies having management contracts with Fidelity Management & Research Company (FMR) or other affiliated entities of FMR, may participate in an interfund lending program. This program provides an alternative credit facility allowing the funds to borrow from, or lend money to, other participating affiliated funds. At period end, there were no interfund loans outstanding. The Fund's activity in this program during the period for which loans were outstanding was as follows:
| Borrower or Lender | Average Loan Balance | Weighted Average Interest Rate | Interest Expense |
| Borrower | $3,180,778 | 1.71% | $1,357 |
Interfund Trades. The Fund may purchase from or sell securities to other Fidelity Funds under procedures adopted by the Board. The procedures have been designed to ensure these interfund trades are executed in accordance with Rule 17a-7 of the 1940 Act. Interfund trades are included within the respective purchases and sales amounts shown in the Purchases and Sales of Investments note.
6. Committed Line of Credit.
The Fund participates with other funds managed by the investment adviser or an affiliate in a $4.25 billion credit facility (the "line of credit") to be utilized for temporary or emergency purposes to fund shareholder redemptions or for other short-term liquidity purposes. The Fund has agreed to pay commitment fees on its pro-rata portion of the line of credit, which amounted to $1,362 and is reflected in Miscellaneous expenses on the Statement of Operations. During the period, the Fund did not borrow on this line of credit.
7. Security Lending.
The Fund lends portfolio securities through a lending agent from time to time in order to earn additional income. For equity securities, a lending agent is used and may loan securities to certain qualified borrowers, including Fidelity Capital Markets (FCM), a broker-dealer affiliated with the Fund. On the settlement date of the loan, the Fund receives collateral (in the form of U.S. Treasury obligations, letters of credit and/or cash) against the loaned securities and maintains collateral in an amount not less than 100% of the market value of the loaned securities during the period of the loan. The market value of the loaned securities is determined at the close of business of the Fund and any additional required collateral is delivered to the Fund on the next business day. The Fund or borrower may terminate the loan at any time, and if the borrower defaults on its obligation to return the securities loaned because of insolvency or other reasons, the Fund may apply collateral received from the borrower against the obligation. The Fund may experience delays and costs in recovering the securities loaned. Any cash collateral received is invested in the Fidelity Securities Lending Cash Central Fund. The value of loaned securities and cash collateral at period end are disclosed on the Fund's Statement of Assets and Liabilities. Security lending income represents the income earned on investing cash collateral, less rebates paid to borrowers and any lending agent fees associated with the loan, plus any premium payments received for lending certain types of securities. Security lending income is presented in the Statement of Operations as a component of income from Fidelity Central Funds. Total security lending income during the period amounted to $262,207. During the period, there were no securities loaned to FCM.
8. Expense Reductions.
Commissions paid to certain brokers with whom the investment adviser, or its affiliates, places trades on behalf of the Fund include an amount in addition to trade execution, which may be rebated back to the Fund to offset certain expenses. This amount totaled $88,742 for the period.
In addition, during the period the investment adviser reimbursed and/or waived a portion of fund-level operating expenses in the amount of $5,503.
9. Distributions to Shareholders.
Distributions to shareholders of each class were as follows:
| | Year ended
October 31, 2018 | Year ended
October 31, 2017 |
| Distributions to shareholders | | |
| Class A | $103,389 | $– |
| Class M | 41,092 | – |
| Class C | 32,748 | – |
| International Value | 8,724,460 | – |
| Class I | 88,405 | – |
| Total | $8,990,094 | $– |
| From net investment income | | |
| Class A | $– | $160,715 |
| Class M | – | 64,948 |
| Class C | – | 57,557 |
| International Value | – | 7,786,373 |
| Class I | – | 54,529 |
| Total | $– | $8,124,122 |
| From net realized gain | | |
| Class A | $– | $10,650 |
| Class M | – | 5,031 |
| Class C | – | 5,917 |
| International Value | – | 432,576 |
| Class I | – | 3,157 |
| Total | $– | $457,331 |
10. Share Transactions.
Share transactions for each class were as follows and may contain automatic conversions between classes or exchanges between affiliated funds:
| | Shares | Shares | Dollars | Dollars |
| | Year ended October 31, 2018(a) | Year ended October 31, 2017 | Year ended October 31, 2018(a) | Year ended October 31, 2017 |
| Class A | | | | |
| Shares sold | 286,375 | 276,572 | $2,567,358 | $2,327,962 |
| Reinvestment of distributions | 11,240 | 21,396 | 100,489 | 166,672 |
| Shares redeemed | (224,999) | (392,253) | (2,007,679) | (3,202,452) |
| Net increase (decrease) | 72,616 | (94,285) | $660,168 | $(707,818) |
| Class M | | | | |
| Shares sold | 84,749 | 101,768 | $765,119 | $836,059 |
| Reinvestment of distributions | 4,596 | 8,935 | 41,092 | 69,695 |
| Shares redeemed | (67,389) | (126,227) | (604,451) | (1,023,584) |
| Net increase (decrease) | 21,956 | (15,524) | $201,760 | $(117,830) |
| Class C | | | | |
| Shares sold | 224,225 | 120,429 | $2,034,976 | $1,017,626 |
| Reinvestment of distributions | 3,587 | 7,631 | 32,067 | 59,598 |
| Shares redeemed | (139,088) | (94,013) | (1,223,224) | (768,940) |
| Net increase (decrease) | 88,724 | 34,047 | $843,819 | $308,284 |
| International Value | | | | |
| Shares sold | 22,242,584 | 2,636,526 | $201,187,963 | $22,208,337 |
| Reinvestment of distributions | 477,419 | 1,033,790 | 4,258,580 | 8,032,545 |
| Shares redeemed | (9,065,603) | (3,774,158) | (81,505,210) | (30,751,436) |
| Net increase (decrease) | 13,654,400 | (103,842) | $123,941,333 | $(510,554) |
| Class I | | | | |
| Shares sold | 519,858 | 426,959 | $4,669,763 | $3,538,590 |
| Reinvestment of distributions | 9,287 | 6,933 | 82,930 | 54,005 |
| Shares redeemed | (303,812) | (77,592) | (2,687,966) | (639,455) |
| Net increase (decrease) | 225,333 | 356,300 | $2,064,727 | $2,953,140 |
| Class Z | | | | |
| Shares sold | 11,351 | – | $100,000 | $– |
| Net increase (decrease) | 11,351 | – | $100,000 | $– |
(a) Share transactions for Class Z are for the period October 2, 2018 (commencement of sale of shares) to October 31, 2018
11. Other.
The Fund's organizational documents provide former and current trustees and officers with a limited indemnification against liabilities arising in connection with the performance of their duties to the Fund. In the normal course of business, the Fund may also enter into contracts that provide general indemnifications. The Fund's maximum exposure under these arrangements is unknown as this would be dependent on future claims that may be made against the Fund. The risk of material loss from such claims is considered remote.
At the end of the period, Strategic Advisers Fidelity International Fund, VIP FundsManager 50% Portfolio and VIP FundsManager 60% Portfolio were the owners of record of approximately 45%, 11% and 13%, respectively, of the total outstanding shares of the Fund. Mutual funds managed by the investment adviser or its affiliates were the owners of record, in the aggregate, of approximately 75% of the total outstanding shares of the Fund.
Report of Independent Registered Public Accounting Firm
To the Trustees of Fidelity Investment Trust and Shareholders of Fidelity International Value Fund:
Opinion on the Financial Statements and Financial Highlights
We have audited the accompanying statement of assets and liabilities of Fidelity International Value Fund (the "Fund"), a fund of Fidelity Investment Trust, including the schedule of investments, as of October 31, 2018, and the related statement of operations for the year then ended, the statement of changes in net assets for each of the two years in the period then ended, the financial highlights for each of the five years in the period then ended, and the related notes. In our opinion, the financial statements and financial highlights present fairly, in all material respects, the financial position of the Fund as of October 31, 2018, and the results of its operations for the year then ended, the changes in its net assets for each of the two years in the period then ended, and the financial highlights for each of the five years in the period then ended, in conformity with accounting principles generally accepted in the United States of America.
Basis for Opinion
These financial statements and financial highlights are the responsibility of the Fund's management. Our responsibility is to express an opinion on the Fund's financial statements and financial highlights based on our audits. We are a public accounting firm registered with the Public Company Accounting Oversight Board (United States) (PCAOB) and are required to be independent with respect to the Fund in accordance with the U.S. federal securities laws and the applicable rules and regulations of the Securities and Exchange Commission and the PCAOB.
We conducted our audits in accordance with the standards of the PCAOB. Those standards require that we plan and perform the audit to obtain reasonable assurance about whether the financial statements and financial highlights are free of material misstatement, whether due to error or fraud. The Fund is not required to have, nor were we engaged to perform, an audit of its internal control over financial reporting. As part of our audits we are required to obtain an understanding of internal control over financial reporting but not for the purpose of expressing an opinion on the effectiveness of the Fund’s internal control over financial reporting. Accordingly, we express no such opinion.
Our audits included performing procedures to assess the risks of material misstatement of the financial statements and financial highlights, whether due to error or fraud, and performing procedures that respond to those risks. Such procedures included examining, on a test basis, evidence regarding the amounts and disclosures in the financial statements and financial highlights. Our audits also included evaluating the accounting principles used and significant estimates made by management, as well as evaluating the overall presentation of the financial statements and financial highlights. Our procedures included confirmation of securities owned as of October 31, 2018, by correspondence with the custodians and brokers; when replies were not received from brokers, we performed other auditing procedures. We believe that our audits provide a reasonable basis for our opinion.
/s/ Deloitte & Touche LLP
Boston, Massachusetts
December 13, 2018
We have served as the auditor of one or more of the Fidelity investment companies since 1999.
Trustees and Officers
The Trustees, Members of the Advisory Board (if any), and officers of the trust and fund, as applicable, are listed below. The Board of Trustees governs the fund and is responsible for protecting the interests of shareholders. The Trustees are experienced executives who meet periodically throughout the year to oversee the fund's activities, review contractual arrangements with companies that provide services to the fund, oversee management of the risks associated with such activities and contractual arrangements, and review the fund's performance. Except for Jonathan Chiel, each of the Trustees oversees 283 funds. Mr. Chiel oversees 154 funds.
The Trustees hold office without limit in time except that (a) any Trustee may resign; (b) any Trustee may be removed by written instrument, signed by at least two-thirds of the number of Trustees prior to such removal; (c) any Trustee who requests to be retired or who has become incapacitated by illness or injury may be retired by written instrument signed by a majority of the other Trustees; and (d) any Trustee may be removed at any special meeting of shareholders by a two-thirds vote of the outstanding voting securities of the trust. Each Trustee who is not an interested person (as defined in the 1940 Act) of the trust and the fund is referred to herein as an Independent Trustee. Each Independent Trustee shall retire not later than the last day of the calendar year in which his or her 75th birthday occurs. The Independent Trustees may waive this mandatory retirement age policy with respect to individual Trustees. Officers and Advisory Board Members hold office without limit in time, except that any officer or Advisory Board Member may resign or may be removed by a vote of a majority of the Trustees at any regular meeting or any special meeting of the Trustees. Except as indicated, each individual has held the office shown or other offices in the same company for the past five years.
The fund’s Statement of Additional Information (SAI) includes more information about the Trustees. To request a free copy, call Fidelity at 1-877-208-0098.
Experience, Skills, Attributes, and Qualifications of the Trustees. The Governance and Nominating Committee has adopted a statement of policy that describes the experience, qualifications, attributes, and skills that are necessary and desirable for potential Independent Trustee candidates (Statement of Policy). The Board believes that each Trustee satisfied at the time he or she was initially elected or appointed a Trustee, and continues to satisfy, the standards contemplated by the Statement of Policy. The Governance and Nominating Committee also engages professional search firms to help identify potential Independent Trustee candidates who have the experience, qualifications, attributes, and skills consistent with the Statement of Policy. From time to time, additional criteria based on the composition and skills of the current Independent Trustees, as well as experience or skills that may be appropriate in light of future changes to board composition, business conditions, and regulatory or other developments, have also been considered by the professional search firms and the Governance and Nominating Committee. In addition, the Board takes into account the Trustees' commitment and participation in Board and committee meetings, as well as their leadership of standing and ad hoc committees throughout their tenure.
In determining that a particular Trustee was and continues to be qualified to serve as a Trustee, the Board has considered a variety of criteria, none of which, in isolation, was controlling. The Board believes that, collectively, the Trustees have balanced and diverse experience, qualifications, attributes, and skills, which allow the Board to operate effectively in governing the fund and protecting the interests of shareholders. Information about the specific experience, skills, attributes, and qualifications of each Trustee, which in each case led to the Board's conclusion that the Trustee should serve (or continue to serve) as a trustee of the fund, is provided below.
Board Structure and Oversight Function. James C. Curvey is an interested person and currently serves as Chairman. The Trustees have determined that an interested Chairman is appropriate and benefits shareholders because an interested Chairman has a personal and professional stake in the quality and continuity of services provided to the fund. Independent Trustees exercise their informed business judgment to appoint an individual of their choosing to serve as Chairman, regardless of whether the Trustee happens to be independent or a member of management. The Independent Trustees have determined that they can act independently and effectively without having an Independent Trustee serve as Chairman and that a key structural component for assuring that they are in a position to do so is for the Independent Trustees to constitute a substantial majority for the Board. The Independent Trustees also regularly meet in executive session. Ned C. Lautenbach serves as Chairman of the Independent Trustees and as such (i) acts as a liaison between the Independent Trustees and management with respect to matters important to the Independent Trustees and (ii) with management prepares agendas for Board meetings.
Fidelity® funds are overseen by different Boards of Trustees. The fund's Board oversees Fidelity's high income and certain equity funds, and other Boards oversee Fidelity's investment-grade bond, money market, asset allocation, and other equity funds. The asset allocation funds may invest in Fidelity® funds overseen by the fund's Board. The use of separate Boards, each with its own committee structure, allows the Trustees of each group of Fidelity® funds to focus on the unique issues of the funds they oversee, including common research, investment, and operational issues. On occasion, the separate Boards establish joint committees to address issues of overlapping consequences for the Fidelity® funds overseen by each Board.
The Trustees operate using a system of committees to facilitate the timely and efficient consideration of all matters of importance to the Trustees, the fund, and fund shareholders and to facilitate compliance with legal and regulatory requirements and oversight of the fund's activities and associated risks. The Board, acting through its committees, has charged FMR and its affiliates with (i) identifying events or circumstances the occurrence of which could have demonstrably adverse effects on the fund's business and/or reputation; (ii) implementing processes and controls to lessen the possibility that such events or circumstances occur or to mitigate the effects of such events or circumstances if they do occur; and (iii) creating and maintaining a system designed to evaluate continuously business and market conditions in order to facilitate the identification and implementation processes described in (i) and (ii) above. Because the day-to-day operations and activities of the fund are carried out by or through FMR, its affiliates, and other service providers, the fund's exposure to risks is mitigated but not eliminated by the processes overseen by the Trustees. While each of the Board's committees has responsibility for overseeing different aspects of the fund's activities, oversight is exercised primarily through the Operations, Audit, and Compliance Committees. In addition, the Independent Trustees have worked with Fidelity to enhance the Board's oversight of investment and financial risks, legal and regulatory risks, technology risks, and operational risks, including the development of additional risk reporting to the Board. Appropriate personnel, including but not limited to the fund's Chief Compliance Officer (CCO), FMR's internal auditor, the independent accountants, the fund's Treasurer and portfolio management personnel, make periodic reports to the Board's committees, as appropriate, including an annual review of Fidelity's risk management program for the Fidelity® funds. The responsibilities of each standing committee, including their oversight responsibilities, are described further under "Standing Committees of the Trustees."
Interested Trustees*:
Correspondence intended for a Trustee who is an interested person may be sent to Fidelity Investments, 245 Summer Street, Boston, Massachusetts 02210.
Name, Year of Birth; Principal Occupations and Other Relevant Experience+
Jonathan Chiel (1957)
Year of Election or Appointment: 2016
Trustee
Mr. Chiel also serves as Trustee of other Fidelity® funds. Mr. Chiel is Executive Vice President and General Counsel for FMR LLC (diversified financial services company, 2012-present). Previously, Mr. Chiel served as general counsel (2004-2012) and senior vice president and deputy general counsel (2000-2004) for John Hancock Financial Services; a partner with Choate, Hall & Stewart (1996-2000) (law firm); and an Assistant United States Attorney for the United States Attorney’s Office of the District of Massachusetts (1986-95), including Chief of the Criminal Division (1993-1995). Mr. Chiel is a director on the boards of the Boston Bar Foundation and the Maimonides School.
James C. Curvey (1935)
Year of Election or Appointment: 2007
Trustee
Chairman of the Board of Trustees
Mr. Curvey also serves as Trustee of other Fidelity® funds. Mr. Curvey is Vice Chairman (2007-present) and Director of FMR LLC (diversified financial services company). In addition, Mr. Curvey is an Overseer Emeritus for the Boston Symphony Orchestra, a Director of Artis-Naples, and a Trustee of Brewster Academy in Wolfeboro, New Hampshire. Previously, Mr. Curvey served as a Director of Fidelity Research & Analysis Co. (investment adviser firm, 2009-2018), Director of Fidelity Investments Money Management, Inc. (investment adviser firm, 2009-2014) and a Director of FMR and FMR Co., Inc. (investment adviser firms, 2007-2014).
Charles S. Morrison (1960)
Year of Election or Appointment: 2014
Trustee
Mr. Morrison also serves as Trustee of other funds. He serves as President of Fidelity SelectCo, LLC (investment adviser firm, 2017-present) and Fidelity Management & Research Company (FMR) (investment adviser firm, 2016-present), a Director of Fidelity Investments Money Management, Inc. (FIMM) (investment adviser firm, 2014-present), Director of Fidelity SelectCo, LLC (investment adviser firm, 2014-present), President, Asset Management (2014-present), and is an employee of Fidelity Investments. Previously, Mr. Morrison served as Vice President of Fidelity's Fixed Income and Asset Allocation Funds (2012-2014), President, Fixed Income (2011-2014), Vice President of Fidelity's Money Market Funds (2005-2009), President, Money Market Group Leader of FMR (investment adviser firm, 2009), and Senior Vice President, Money Market Group of FMR (2004-2009). Mr. Morrison also served as Vice President of Fidelity's Bond Funds (2002-2005), certain Balanced Funds (2002-2005), and certain Asset Allocation Funds (2002-2007), and as Senior Vice President (2002-2005) of Fidelity's Bond Division.
* Determined to be an “Interested Trustee” by virtue of, among other things, his or her affiliation with the trust or various entities under common control with FMR.
+ The information includes the Trustee's principal occupation during the last five years and other information relating to the experience, attributes, and skills relevant to the Trustee's qualifications to serve as a Trustee, which led to the conclusion that the Trustee should serve as a Trustee for the fund.
Independent Trustees:
Correspondence intended for an Independent Trustee may be sent to Fidelity Investments, P.O. Box 55235, Boston, Massachusetts 02205-5235.
Name, Year of Birth; Principal Occupations and Other Relevant Experience+
Dennis J. Dirks (1948)
Year of Election or Appointment: 2005
Trustee
Mr. Dirks also serves as Trustee of other Fidelity® funds. Prior to his retirement in May 2003, Mr. Dirks was Chief Operating Officer and a member of the Board of The Depository Trust & Clearing Corporation (DTCC). He also served as President, Chief Operating Officer, and Board member of The Depository Trust Company (DTC) and President and Board member of the National Securities Clearing Corporation (NSCC). In addition, Mr. Dirks served as Chief Executive Officer and Board member of the Government Securities Clearing Corporation, Chief Executive Officer and Board member of the Mortgage-Backed Securities Clearing Corporation, as a Trustee and a member of the Finance Committee of Manhattan College (2005-2008), as a Trustee and a member of the Finance Committee of AHRC of Nassau County (2006-2008), as a member of the Independent Directors Council (IDC) Governing Council (2010-2015), and as a member of the Board of Directors for The Brookville Center for Children’s Services, Inc. (2009-2017). Mr. Dirks is a member of the Finance Committee (2016-present), Board of Directors (2017-present) and Board of Trustees (2018-present) and is Treasurer (2018-present) of the Asolo Repertory Theatre.
Donald F. Donahue (1950)
Year of Election or Appointment: 2018
Trustee
Mr. Donahue also serves as a Trustee of other Fidelity® funds. Mr. Donahue is President and Chief Executive Officer of Miranda Partners, LLC (risk consulting for the financial services industry, 2012-present). Previously, Mr. Donahue served as a Member of the Advisory Board of certain Fidelity® funds (2015-2018) and Chief Executive Officer (2006-2012), Chief Operating Officer (2003-2006), and Managing Director, Customer Marketing and Development (1999-2003) of The Depository Trust & Clearing Corporation (financial markets infrastructure). Mr. Donahue serves as a Member (2007-present) and Co-Chairman (2016-present) of the Board of Directors of United Way of New York, Member of the Board of Directors of NYC Leadership Academy (2012-present) and Member of the Board of Advisors of Ripple Labs, Inc. (financial services, 2015-present). He also served as Chairman (2010-2012) and Member of the Board of Directors (2012-2013) of Omgeo, LLC (financial services), Treasurer of United Way of New York (2012-2016), and Member of the Board of Directors of XBRL US (financial services non-profit, 2009-2012) and the International Securities Services Association (2009-2012).
Alan J. Lacy (1953)
Year of Election or Appointment: 2008
Trustee
Mr. Lacy also serves as Trustee of other Fidelity® funds. Mr. Lacy serves as a Director of Bristol-Myers Squibb Company (global pharmaceuticals, 2008-present). He is a Trustee of the California Chapter of The Nature Conservancy (2015-present) and a Director of the Center for Advanced Study in the Behavioral Sciences at Stanford University (2015-present). In addition, Mr. Lacy served as Senior Adviser (2007-2014) of Oak Hill Capital Partners, L.P. (private equity) and also served as Chief Executive Officer (2005) and Vice Chairman (2005-2006) of Sears Holdings Corporation (retail) and Chief Executive Officer and Chairman of the Board of Sears, Roebuck and Co. (retail, 2000-2005). Previously, Mr. Lacy served as Chairman (2014-2017) and a member (2010-2017) of the Board of Directors of Dave & Buster’s Entertainment, Inc. (restaurant and entertainment complexes), as Chairman (2008-2011) and a member (2006-2015) of the Board of Trustees of the National Parks Conservation Association, and as a member of the Board of Directors for The Hillman Companies, Inc. (hardware wholesalers, 2010-2014), Earth Fare, Inc. (retail grocery, 2010-2014), and The Western Union Company (global money transfer, 2006-2011).
Ned C. Lautenbach (1944)
Year of Election or Appointment: 2000
Trustee
Chairman of the Independent Trustees
Mr. Lautenbach also serves as Trustee of other Fidelity® funds. Mr. Lautenbach currently serves as Vice Chair of the Board of Governors, State University System of Florida (2013-present) and is a member of the Council on Foreign Relations (1994-present). He is also a member and has most recently served as Chairman of the Board of Directors of Artis-Naples (2012-present). Previously, Mr. Lautenbach served as a member and then Lead Director of the Board of Directors of Eaton Corporation (diversified industrial, 1997-2016). He was also a Partner and Advisory Partner at Clayton, Dubilier & Rice, LLC (private equity investment, 1998-2010), as well as a Director of Sony Corporation (2006-2007). In addition, Mr. Lautenbach also had a 30-year career with IBM (technology company) during which time he served as Senior Vice President and a member of the Corporate Executive Committee (1968-1998).
Joseph Mauriello (1944)
Year of Election or Appointment: 2008
Trustee
Mr. Mauriello also serves as Trustee of other Fidelity® funds. Prior to his retirement in January 2006, Mr. Mauriello served in numerous senior management positions including Deputy Chairman and Chief Operating Officer (2004-2005), and Vice Chairman of Financial Services (2002-2004) of KPMG LLP US (professional services, 1965-2005). Mr. Mauriello currently serves as a member of the Independent Directors Council (IDC) Governing Council (2015-present). Previously, Mr. Mauriello served as a member of the Board of Directors of XL Group plc. (global insurance and re-insurance, 2006-2018).
Cornelia M. Small (1944)
Year of Election or Appointment: 2005
Trustee
Ms. Small also serves as Trustee of other Fidelity® funds. Ms. Small is a member of the Board of Directors (2009-present) and Chair of the Investment Committee (2010-present) of the Teagle Foundation. Ms. Small also serves on the Investment Committee of the Berkshire Taconic Community Foundation (2008-present). Previously, Ms. Small served as Chairperson (2002-2008) and a member of the Investment Committee and Chairperson (2008-2012) and a member of the Board of Trustees of Smith College. In addition, Ms. Small served as Chief Investment Officer, Director of Global Equity Investments, and a member of the Board of Directors of Scudder, Stevens & Clark and Scudder Kemper Investments.
Garnett A. Smith (1947)
Year of Election or Appointment: 2018
Trustee
Mr. Smith also serves as Trustee of other Fidelity® funds. Prior to Mr. Smith's retirement, he served as Chairman and Chief Executive Officer of Inbrand Corp. (manufacturer of personal absorbent products, 1990-1997). He also served as President (1986-1990) of Inbrand Corp. Prior to his employment with Inbrand Corp., he was employed by a retail fabric chain and North Carolina National Bank. In addition, Mr. Smith served as a Member of the Advisory Board of certain Fidelity® funds (2012-2013) and as a board member of the Jackson Hole Land Trust (2009-2012).
David M. Thomas (1949)
Year of Election or Appointment: 2008
Trustee
Mr. Thomas also serves as Trustee of other Fidelity® funds. Mr. Thomas serves as Non-Executive Chairman of the Board of Directors of Fortune Brands Home and Security (home and security products, 2011-present), as a member of the Board of Directors (2004-present) and Presiding Director (2013-present) of Interpublic Group of Companies, Inc. (marketing communication), and as a member of the Board of Trustees of the University of Florida (2013-present). Previously, Mr. Thomas served as Executive Chairman (2005-2006) and Chairman and Chief Executive Officer (2000-2005) of IMS Health, Inc. (pharmaceutical and healthcare information solutions), and a Director of Fortune Brands, Inc. (consumer products, 2000-2011).
+ The information includes the Trustee's principal occupation during the last five years and other information relating to the experience, attributes, and skills relevant to the Trustee's qualifications to serve as a Trustee, which led to the conclusion that the Trustee should serve as a Trustee for the fund.
Advisory Board Members and Officers:
Correspondence intended for a Member of the Advisory Board (if any) may be sent to Fidelity Investments, P.O. Box 55235, Boston, Massachusetts 02205-5235. Correspondence intended for an officer or Peter S. Lynch may be sent to Fidelity Investments, 245 Summer Street, Boston, Massachusetts 02210. Officers appear below in alphabetical order.
Name, Year of Birth; Principal Occupation
Vicki L. Fuller (1957)
Year of Election or Appointment: 2018
Member of the Advisory Board
Ms. Fuller also serves as Member of the Advisory Board of other Fidelity® funds. Ms. Fuller serves as a member of the Board of Directors, Audit Committee, and Nominating and Governance Committee of The Williams Companies, Inc. (natural gas infrastructure, 2018-present). Previously, Ms. Fuller served as the Chief Investment Officer of the New York State Common Retirement Fund (2012-2018) and held a variety of positions at AllianceBernstein L.P. (global asset management, 1985-2012), including Managing Director (2006-2012) and Senior Vice President and Senior Portfolio Manager (2001-2006).
Peter S. Lynch (1944)
Year of Election or Appointment: 2003
Member of the Advisory Board
Mr. Lynch also serves as Member of the Advisory Board of other Fidelity® funds. Mr. Lynch is Vice Chairman and a Director of FMR (investment adviser firm) and FMR Co., Inc. (investment adviser firm). In addition, Mr. Lynch serves as a Trustee of Boston College and as the Chairman of the Inner-City Scholarship Fund. Previously, Mr. Lynch served on the Special Olympics International Board of Directors (1997-2006).
William S. Stavropoulos (1939)
Year of Election or Appointment: 2018
Member of the Advisory Board
Mr. Stavropoulos also serves as Member of the Advisory Board of other Fidelity® funds. Mr. Stavropoulos serves as President and Founder of the Michigan Baseball Foundation, the Great Lakes Loons (2007-present). Mr. Stavropoulos is Chairman Emeritus of the Board of Directors of The Dow Chemical Company, where he previously served in numerous senior management positions, including President, CEO (1995-2000; 2002-2004), Chairman of the Executive Committee (2000-2006), and as a member of the Board of Directors (1990-2006). Currently, Mr. Stavropoulos is Chairman of the Board of Directors of Univar Inc. (global distributor of commodity and specialty chemicals), a Director of Teradata Corporation (data warehousing and technology solutions), and a member of the Advisory Board for Metalmark Capital LLC (private equity investment, 2005-present). Mr. Stavropoulos is an operating advisor to Clayton, Dubilier & Rice, LLC (private equity investment). In addition, Mr. Stavropoulos is a member of the University of Notre Dame Advisory Council for the College of Science, a Trustee of the Rollin L. Gerstacker Foundation, and a Director of Artis-Naples in Naples, Florida. Previously, Mr. Stavropoulos served as Trustee of certain Fidelity® funds (2001-2018) and as a Director of Chemical Financial Corporation (bank holding company, 1993-2012) and Tyco International, Ltd. (multinational manufacturing and services, 2007-2012).
Carol B. Tomé (1957)
Year of Election or Appointment: 2018
Member of the Advisory Board
Ms. Tomé also serves as Member of the Advisory Board of other Fidelity® funds. Ms. Tomé is Chief Financial Officer (2001-present) and Executive Vice President of Corporate Services (2007-present) of The Home Depot, Inc. (home improvement retailer) and a Director (2003-present) and Chair of the Audit Committee (2004-present) of United Parcel Service, Inc. (package delivery and supply chain management). Previously, Ms. Tomé served as Trustee of certain Fidelity® funds (2017), Senior Vice President of Finance and Accounting/Treasurer (2000-2007) and Vice President and Treasurer (1995-2000) of The Home Depot, Inc. and Chair of the Board (2010-2012), Vice Chair of the Board (2009 and 2013), and a Director (2008-2013) of the Federal Reserve Bank of Atlanta. Ms. Tomé is also a director or trustee of many community and professional organizations.
Michael E. Wiley (1950)
Year of Election or Appointment: 2018
Member of the Advisory Board
Mr. Wiley also serves as Trustee or Member of the Advisory Board of other Fidelity® funds. Mr. Wiley serves as a Director of High Point Resources (exploration and production, 2005-present). Previously, Mr. Wiley served as a Director of Andeavor Corporation (independent oil refiner and marketer, 2005-2018), a Director of Andeavor Logistics LP (natural resources logistics, 2015-2018), a Director of Post Oak Bank (privately-held bank, 2004-2018), a Director of Asia Pacific Exploration Consolidated (international oil and gas exploration and production, 2008-2013), a member of the Board of Trustees of the University of Tulsa (2000-2006; 2007-2010), a Senior Energy Advisor of Katzenbach Partners, LLC (consulting, 2006-2007), an Advisory Director of Riverstone Holdings (private investment), a Director of Spinnaker Exploration Company (exploration and production, 2001-2005) and Chairman, President, and CEO of Baker Hughes, Inc. (oilfield services, 2000-2004).
Elizabeth Paige Baumann (1968)
Year of Election or Appointment: 2017
Anti-Money Laundering (AML) Officer
Ms. Baumann also serves as AML Officer of other funds. She is Chief AML Officer (2012-present) and Senior Vice President (2014-present) of FMR LLC (diversified financial services company) and is an employee of Fidelity Investments. Previously, Ms. Baumann served as AML Officer of the funds (2012-2016), and Vice President (2007-2014) and Deputy Anti-Money Laundering Officer (2007-2012) of FMR LLC.
John J. Burke III (1964)
Year of Election or Appointment: 2018
Chief Financial Officer
Mr. Burke also serves as Chief Financial Officer of other funds. Mr. Burke serves as Head of Investment Operations for Fidelity Fund and Investment Operations (2018-present) and is an employee of Fidelity Investments (1998-present). Previously Mr. Burke served as head of Asset Management Investment Operations (2012-2018).
William C. Coffey (1969)
Year of Election or Appointment: 2018
Secretary and Chief Legal Officer (CLO)
Mr. Coffey also serves as Secretary and CLO of other funds. Mr. Coffey serves as CLO, Secretary, and Senior Vice President of Fidelity Management & Research Company and FMR Co., Inc. (investment adviser firms, 2018-present); Secretary of Fidelity SelectCo, LLC and Fidelity Investments Money Management, Inc. (investment adviser firms, 2018-present); and CLO of Fidelity Management & Research (Hong Kong) Limited, FMR Investment Management (UK) Limited, and Fidelity Management & Research (Japan) Limited (investment adviser firms, 2018-present). He is Senior Vice President and Deputy General Counsel of FMR LLC (diversified financial services company, 2010-present), and is an employee of Fidelity Investments. Previously, Mr. Coffey served as Assistant Secretary of certain funds (2009-2018) and as Vice President and Associate General Counsel of FMR LLC (2005-2009).
Timothy M. Cohen (1969)
Year of Election or Appointment: 2018
Vice President
Mr. Cohen also serves as Vice President of other funds. Mr. Cohen serves as Co-Head of Global Equity Research (2016-present), a Director of Fidelity Management & Research (Japan) Limited (investment adviser firm, 2016-present), and is an employee of Fidelity Investments. Previously, Mr. Cohen served as Chief Investment Officer - Equity and a Director of Fidelity Management & Research (U.K.) Inc. (investment adviser firm, 2013-2015) and as a Director of Fidelity Management & Research (Hong Kong) Limited (investment adviser firm, 2017).
Jonathan Davis (1968)
Year of Election or Appointment: 2010
Assistant Treasurer
Mr. Davis also serves as Assistant Treasurer of other funds. Mr. Davis serves as Assistant Treasurer of FMR Capital, Inc. (2017-present) and is an employee of Fidelity Investments. Previously, Mr. Davis served as Vice President and Associate General Counsel of FMR LLC (diversified financial services company, 2003-2010).
Adrien E. Deberghes (1967)
Year of Election or Appointment: 2016
Assistant Treasurer
Mr. Deberghes also serves as an officer of other funds. He serves as Assistant Treasurer of FMR Capital, Inc. (2017-present), Executive Vice President of Fidelity Investments Money Management, Inc. (FIMM) (investment adviser firm, 2016-present), and is an employee of Fidelity Investments (2008-present). Previously, Mr. Deberghes served as President and Treasurer of certain Fidelity® funds (2013-2018). Prior to joining Fidelity Investments, Mr. Deberghes was Senior Vice President of Mutual Fund Administration at State Street Corporation (2007-2008), Senior Director of Mutual Fund Administration at Investors Bank & Trust (2005-2007), and Director of Finance for Dunkin' Brands (2000-2005). Previously, Mr. Deberghes served in other fund officer roles.
Laura M. Del Prato (1964)
Year of Election or Appointment: 2018
Assistant Treasurer
Ms. Del Prato also serves as an officer of other funds. Ms. Del Prato is an employee of Fidelity Investments (2017-present). Prior to joining Fidelity Investments, Ms. Del Prato served as a Managing Director and Treasurer of the JPMorgan Mutual Funds (2014-2017). Prior to JPMorgan, Ms. Del Prato served as a partner at Cohen Fund Audit Services (accounting firm, 2012-2013) and KPMG LLP (accounting firm, 2004-2012).
Colm A. Hogan (1973)
Year of Election or Appointment: 2016
Deputy Treasurer
Mr. Hogan also serves as an officer of other funds. Mr. Hogan serves as Assistant Treasurer of FMR Capital, Inc. (2017-present) and is an employee of Fidelity Investments (2005-present). Previously, Mr. Hogan served as Assistant Treasurer of certain Fidelity® funds (2016-2018).
Pamela R. Holding (1964)
Year of Election or Appointment: 2018
Vice President
Ms. Holding also serves as Vice President of other funds. Ms. Holding serves as Co-Head of Global Equity Research (2018-present) and is an employee of Fidelity Investments (2013-present).
Chris Maher (1972)
Year of Election or Appointment: 2013
Assistant Treasurer
Mr. Maher serves as Assistant Treasurer of other funds. Mr. Maher is Vice President of Valuation Oversight, serves as Assistant Treasurer of FMR Capital, Inc. (2017-present), and is an employee of Fidelity Investments. Previously, Mr. Maher served as Vice President of Asset Management Compliance (2013), Vice President of the Program Management Group of FMR (investment adviser firm, 2010-2013), and Vice President of Valuation Oversight (2008-2010).
Rieco E. Mello (1969)
Year of Election or Appointment: 2017
Assistant Treasurer
Mr. Mello also serves as Assistant Treasurer of other funds. Mr. Mello serves as Assistant Treasurer of FMR Capital, Inc. (2017-present) and is an employee of Fidelity Investments (1995-present).
Kenneth B. Robins (1969)
Year of Election or Appointment: 2016
Chief Compliance Officer
Mr. Robins also serves as an officer of other funds. Mr. Robins serves as Compliance Officer of Fidelity Management & Research Company and FMR Co., Inc. (investment adviser firms, 2016-present) and is an employee of Fidelity Investments (2004-present). Previously, Mr. Robins served as Executive Vice President of Fidelity Investments Money Management, Inc. (investment adviser firm, 2013-2016) and served in other fund officer roles.
Stacie M. Smith (1974)
Year of Election or Appointment: 2016
President and Treasurer
Ms. Smith also serves as an officer of other funds. Ms. Smith serves as Assistant Treasurer of FMR Capital, Inc. (2017-present), is an employee of Fidelity Investments (2009-present), and has served in other fund officer roles. Prior to joining Fidelity Investments, Ms. Smith served as Senior Audit Manager of Ernst & Young LLP (accounting firm, 1996-2009). Previously, Ms. Smith served as Assistant Treasurer (2013-2018) and Deputy Treasurer (2013-2016) of certain Fidelity® funds.
Marc L. Spector (1972)
Year of Election or Appointment: 2016
Assistant Treasurer
Mr. Spector also serves as an officer of other funds. Mr. Spector serves as Assistant Treasurer of FMR Capital, Inc. (2017-present) and is an employee of Fidelity Investments (2016-present). Prior to joining Fidelity Investments, Mr. Spector served as Director at the Siegfried Group (accounting firm, 2013-2016), and prior to Siegfried Group as audit senior manager at Deloitte & Touche (accounting firm, 2005-2013).
Shareholder Expense Example
As a shareholder of the Fund, you incur two types of costs: (1) transaction costs, including sales charges (loads) on purchase payments or redemption proceeds, redemption fees and (2) ongoing costs, including management fees, distribution and/or service (12b-1) fees and other Fund expenses. This Example is intended to help you understand your ongoing costs (in dollars) of investing in the Fund and to compare these costs with the ongoing costs of investing in other mutual funds.
The actual expense Example is based on an investment of $1,000 invested at the beginning of the period and held for the entire period (May 1, 2018 to October 31, 2018) for Class A, Class M, Class C, International Value and Class I, and for the period (October 2, 2018 to October 31, 2018) for Class Z. The hypothetical expense Example is based on an investment of $1,000 invested for one-half year period (May 1, 2018 to October 31, 2018)
Actual Expenses
The first line of the accompanying table for each class of the Fund provides information about actual account values and actual expenses. You may use the information in this line, together with the amount you invested, to estimate the expenses that you paid over the period. Simply divide your account value by $1,000.00 (for example, an $8,600 account value divided by $1,000.00 = 8.6), then multiply the result by the number in the first line for a class of the Fund under the heading entitled "Expenses Paid During Period" to estimate the expenses you paid on your account during this period. A small balance maintenance fee of $12.00 that is charged once a year may apply for certain accounts with a value of less than $2,000. This fee, which was eliminated effective August 1, 2018, is not included in the table below. If it was, the estimate of expenses you paid during the period would be higher, and your ending account value lower, by this amount. In addition, the Fund, as a shareholder in the underlying Fidelity Central Funds, will indirectly bear its pro-rata share of the fees and expenses incurred by the underlying Fidelity Central Funds. These fees and expenses are not included in the Fund's annualized expense ratio used to calculate the expense estimate in the table below.
Hypothetical Example for Comparison Purposes
The second line of the accompanying table for each class of the Fund provides information about hypothetical account values and hypothetical expenses based on a Class' actual expense ratio and an assumed rate of return of 5% per year before expenses, which is not the Class' actual return. The hypothetical account values and expenses may not be used to estimate the actual ending account balance or expenses you paid for the period. You may use this information to compare the ongoing costs of investing in the Fund and other funds. To do so, compare this 5% hypothetical example with the 5% hypothetical examples that appear in the shareholder reports of the other funds. A small balance maintenance fee of $12.00 that is charged once a year may apply for certain accounts with a value of less than $2,000. This fee, which was eliminated effective August 1, 2018, is not included in the table below. If it was, the estimate of expenses you paid during the period would be higher, and your ending account value lower, by this amount. In addition, the Fund, as a shareholder in the underlying Fidelity Central Funds, will indirectly bear its pro-rata share of the fees and expenses incurred by the underlying Fidelity Central Funds. These fees and expenses are not included in the Fund's annualized expense ratio used to calculate the expense estimate in the table below.
Please note that the expenses shown in the table are meant to highlight your ongoing costs only and do not reflect any transaction costs. Therefore, the second line of the table is useful in comparing ongoing costs only, and will not help you determine the relative total costs of owning different funds. In addition, if these transactional costs were included, your costs would have been higher.
| | Annualized Expense Ratio-A | Beginning
Account Value | Ending
Account Value | Expenses Paid
During Period |
| Class A | 1.19% | | | |
| Actual | | $1,000.00 | $896.40 | $5.69-B |
| Hypothetical-C | | $1,000.00 | $1,019.21 | $6.06-D |
| Class M | 1.51% | | | |
| Actual | | $1,000.00 | $895.10 | $7.21-B |
| Hypothetical-C | | $1,000.00 | $1,017.59 | $7.68-D |
| Class C | 2.00% | | | |
| Actual | | $1,000.00 | $892.80 | $9.54-B |
| Hypothetical-C | | $1,000.00 | $1,015.12 | $10.16-D |
| International Value | .85% | | | |
| Actual | | $1,000.00 | $898.50 | $4.07-B |
| Hypothetical-C | | $1,000.00 | $1,020.92 | $4.33-D |
| Class I | .94% | | | |
| Actual | | $1,000.00 | $898.60 | $4.50-B |
| Hypothetical-C | | $1,000.00 | $1,020.47 | $4.79-D |
| Class Z | .85% | | | |
| Actual | | $1,000.00 | $924.00 | $.67-B |
| Hypothetical-C | | $1,000.00 | $1,020.92 | $4.33-D |
A Annualized expense ratio reflects expenses net of applicable fee waivers.
B Actual expenses are equal to each Class' annualized expense ratio, multiplied by the average account value over the period, multiplied by 184/365 (to reflect the one-half year period) for Class A, Class M, Class C, International Value and Class I, and multiplied by 30/365 (to reflect the period October 2, 2018 to October 31, 2018) for Class Z.
C 5% return per year before expenses
D Hypothetical expenses are equal to each Class' annualized expense ratio, multiplied by the average account value over the period, multiplied by 184/365 (to reflect the one-half year period).
Distributions (Unaudited)
Class A designates 2%, Class M designates 3%, Class C designates 5%, International Value designates 2%, and Class I designates 2% of the dividends distributed during the fiscal year as qualifying for the dividends–received deduction for corporate shareholders.
Class A designates 100%, Class M designates 100%, Class C designates 100%, International Value designates 96%, and Class I designates 100% of the dividends distributed during the fiscal year as amounts which may be taken into account as a dividend for purposes of the maximum rate under section 1(h)(11) of the Internal Revenue Code.
The amounts per share which represent income derived from sources within, and taxes paid to, foreign countries or possessions of the United States are as follows:
| | Pay Date | Income | Taxes |
| Class A | 12/11/2017 | $0.1246 | $0.0086 |
| Class M | 12/11/2017 | $0.0976 | $0.0086 |
| Class C | 12/11/2017 | $0.0646 | $0.0086 |
| International Value | 12/11/2017 | $0.1586 | $0.0086 |
| Class I | 12/11/2017 | $0.1486 | $0.0086 |
|
The fund will notify shareholders in January 2019 of amounts for use in preparing 2018 income tax returns.
Board Approval of Investment Advisory Contracts
Fidelity International Value Fund
At its July 2018 meeting, the Board of Trustees, including the Independent Trustees (together, the Board), voted to continue the management contract with Fidelity Management & Research Company (FMR) and the sub-advisory agreements (together, the Advisory Contracts) for the fund for six months through January 31, 2019, in connection with the reunification of the Fidelity Equity High Income Funds Board, which oversees the fund, and the Sector Portfolios Board.
The Board considered that the approval of the fund's Advisory Contracts will not result in any changes in (i) the investment process or strategies employed in the management of the fund's assets; (ii) the fees and expenses paid by shareholders; (iii) the nature, extent or quality of services provided under the fund's Advisory Contracts; or (iv) the day-to-day management of the fund or the persons primarily responsible for such management. The Board concluded that the fund's Advisory Contracts are fair and reasonable, and that the fund's Advisory Contracts should be renewed, without modification, through January 31, 2019, with the understanding that the Board will consider the annual renewal for a full one year period in January 2019.
In connection with its consideration of future renewals of the fund's Advisory Contracts, the Board will consider: (i) the nature, extent and quality of services provided to the fund, including shareholder and administrative services and investment performance; (ii) the competitiveness of the management fee and total expenses for the fund; (iii) the costs of the services and profitability, including the revenues earned and the expenses incurred in conducting the business of developing, marketing, distributing, managing, administering, and servicing the fund and its shareholders, to the extent applicable, as well as potential fall-out benefits from Fidelity's non-fund businesses; and (iv) whether there have been economies of scale in respect of the Fidelity funds, whether the Fidelity funds (including the fund) have appropriately benefited from any such economies of scale, and whether there is the potential for realization of any further economies.
Based on its evaluation of all of the conclusions noted above, and after considering all factors it believed relevant, the Board ultimately concluded that the fund's management fee structure is fair and reasonable, and that the continuation of the fund's Advisory Contracts should be approved.
AFIV-ANN-1218
1.827497.112
Fidelity® International Value Fund
Annual Report October 31, 2018 |
|
Contents
To view a fund's proxy voting guidelines and proxy voting record for the 12-month period ended June 30, visit http://www.fidelity.com/proxyvotingresults or visit the Securities and Exchange Commission's (SEC) web site at http://www.sec.gov.
You may also call 1-800-544-8544 to request a free copy of the proxy voting guidelines.
Standard & Poor's, S&P and S&P 500 are registered service marks of The McGraw-Hill Companies, Inc. and have been licensed for use by Fidelity Distributors Corporation.
Other third-party marks appearing herein are the property of their respective owners.
All other marks appearing herein are registered or unregistered trademarks or service marks of FMR LLC or an affiliated company. © 2018 FMR LLC. All rights reserved.
This report and the financial statements contained herein are submitted for the general information of the shareholders of the Fund. This report is not authorized for distribution to prospective investors in the Fund unless preceded or accompanied by an effective prospectus.
A fund files its complete schedule of portfolio holdings with the SEC for the first and third quarters of each fiscal year on Form N-Q. Forms N-Q are available on the SEC’s web site at http://www.sec.gov. A fund's Forms N-Q may be reviewed and copied at the SEC’s Public Reference Room in Washington, DC. Information regarding the operation of the SEC's Public Reference Room may be obtained by calling 1-800-SEC-0330.
For a complete list of a fund's portfolio holdings, view the most recent holdings listing, semiannual report, or annual report on Fidelity's web site at http://www.fidelity.com, http://www.institutional.fidelity.com, or http://www.401k.com, as applicable.
NOT FDIC INSURED •MAY LOSE VALUE •NO BANK GUARANTEE
Neither the Fund nor Fidelity Distributors Corporation is a bank.
Performance: The Bottom Line
Average annual total return reflects the change in the value of an investment, assuming reinvestment of distributions from dividend income and capital gains (the profits earned upon the sale of securities that have grown in value, if any) and assuming a constant rate of performance each year. The hypothetical investment and the average annual total returns do not reflect the deduction of taxes that a shareholder would pay on fund distributions or the redemption of fund shares. During periods of reimbursement by Fidelity, a fund’s total return will be greater than it would be had the reimbursement not occurred. How a fund did yesterday is no guarantee of how it will do tomorrow.
Average Annual Total Returns
| For the periods ended October 31, 2018 | Past 1 year | Past 5 years | Past 10 years |
| Fidelity® International Value Fund | (8.95)% | 0.43% | 5.89% |
$10,000 Over 10 Years
Let's say hypothetically that $10,000 was invested in Fidelity® International Value Fund, a class of the fund, on October 31, 2008.
The chart shows how the value of your investment would have changed, and also shows how the MSCI EAFE Value Index performed over the same period.
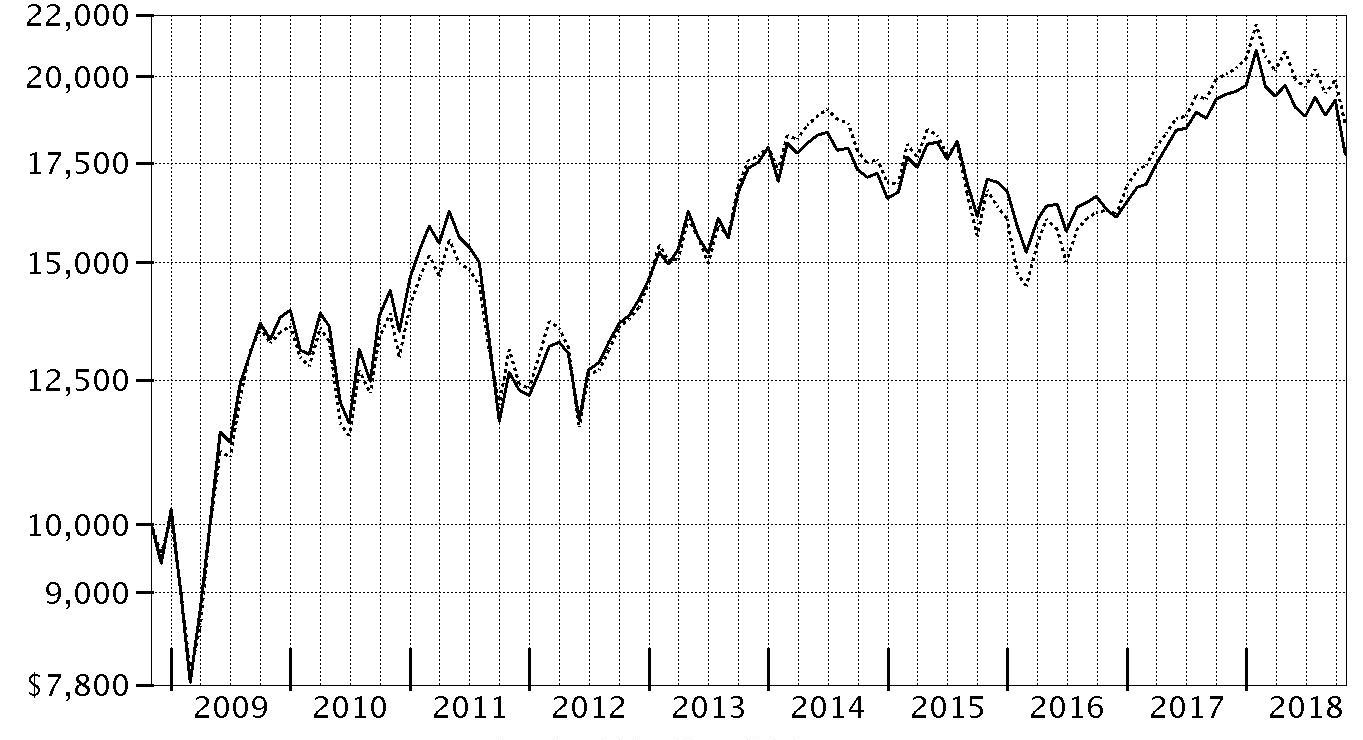
| Period Ending Values |
| $17,730 | Fidelity® International Value Fund |
| $18,577 | MSCI EAFE Value Index |
Management's Discussion of Fund Performance
Market Recap: International equities returned -8.08% for the 12 months ending October 31, 2018, according to the MSCI ACWI (All Country World Index) ex USA Index. A modestly positive first half of the period gave way to a confluence of overwhelmingly negative factors – including escalating trade tensions, a surging U.S. dollar, tepid economic growth in Europe, global central bank tightening, concerns about Italy’s budget stalemate with the EU, and weakness in China’s stock market – that yielded a -11% second-half return. The index lost 8% in October alone, its largest monthly drop in more than six years. Among sectors, new-media-infused communications services (-15%) was hit the hardest, while economically sensitive consumer discretionary (-13%), information technology (-12%), financials (-10%), industrials (-9%) and materials (-7%) stocks also fared poorly. Even the more defensive real estate (-9%), utilities (-6%) and consumer staples (-5%) sectors weren’t spared this period. Conversely, elevated crude-oil prices fueled a positive return for energy (+7%), the top-performing sector, followed by the relatively stable-growing health care segment (+2%). Regionally, emerging markets (-12%) fared the worst, hampered by the impact of foreign exchange and concerns about economic weakness in China, India and South Korea. Sluggish growth also pressured shares in continental Europe (-9%). Stocks in Japan (-3%) and the U.K. (-4%) held up better, followed by Canada (-5%) and Asia-Pacific ex Japan (-6%).
Comments from Portfolio Manager Alexander Zavratsky: For the fiscal year, the fund’s share classes returned in a range between -9% and -10%, behind the -7.46% result of the benchmark MSCI EAFE Value Index. Versus the MSCI index, both stock selection and sector allocation detracted from the fund’s relative result, especially choices in health care and, to a lesser extent, consumer staples. Regionally, the bulk of the underperformance the past 12 months came out of the U.K., where concerns about the outcome of Britain’s negotiations to exit from the European Union intensified late in the period. Among individual stocks, our largest relative laggard was underexposure to index constituent Novartis. Despite being one of our largest holdings this period, the fund was still underweighted in the Switzerland-based pharmaceuticals firm earlier in the period, and we eventually exited our position entirely when the stock’s valuation no longer looked attractive to us. Unfortunately for the fund, we missed out on the stock’s 10% gain for the full 12 months. Novartis benefited from a new CEO, a promising growth outlook for 2018, and consecutive quarters of solid earnings. Underexposure to index heavyweight Royal Dutch Shell was another notable detractor because shares of the Anglo-Dutch multinational oil and gas giant advanced about 8% on higher crude-oil prices and solid quarterly financial results. Conversely, the fund’s large position in diversified energy firm Equinor (formerly Statoil) helped more than any other individual stock. The stock advanced 34% the past 12 months. An out-of-benchmark stake in exploration & production company ConocoPhillips also contributed, as the stock gained about 38%.
The views expressed above reflect those of the portfolio manager(s) only through the end of the period as stated on the cover of this report and do not necessarily represent the views of Fidelity or any other person in the Fidelity organization. Any such views are subject to change at any time based upon market or other conditions and Fidelity disclaims any responsibility to update such views. These views may not be relied on as investment advice and, because investment decisions for a Fidelity fund are based on numerous factors, may not be relied on as an indication of trading intent on behalf of any Fidelity fund.
Investment Summary (Unaudited)
Geographic Diversification (% of fund's net assets)
| As of October 31, 2018 |
| | Japan | 24.0% |
| | United Kingdom | 19.8% |
| | France | 15.1% |
| | Germany | 9.8% |
| | Switzerland | 4.6% |
| | Spain | 3.9% |
| | Sweden | 3.3% |
| | Australia | 3.1% |
| | United States of America* | 2.8% |
| | Other | 13.6% |

* Includes Short-Term investments and Net Other Assets (Liabilities).
Percentages are based on country or territory of incorporation and are adjusted for the effect of futures contracts, if applicable.
Asset Allocation as of October 31, 2018
| | % of fund's net assets |
| Stocks | 98.7 |
| Short-Term Investments and Net Other Assets (Liabilities) | 1.3 |
Top Ten Stocks as of October 31, 2018
| | % of fund's net assets |
| Total SA (France, Oil, Gas & Consumable Fuels) | 3.3 |
| BP PLC (United Kingdom, Oil, Gas & Consumable Fuels) | 3.3 |
| Sanofi SA (France, Pharmaceuticals) | 2.7 |
| BHP Billiton PLC (United Kingdom, Metals & Mining) | 2.5 |
| Royal Dutch Shell PLC Class B sponsored ADR (United Kingdom, Oil, Gas & Consumable Fuels) | 2.1 |
| Banco Santander SA (Spain, Banks) | 2.0 |
| Mitsubishi UFJ Financial Group, Inc. (Japan, Banks) | 2.0 |
| Bayer AG (Germany, Pharmaceuticals) | 1.7 |
| AstraZeneca PLC (United Kingdom) (United Kingdom, Pharmaceuticals) | 1.7 |
| AXA SA (France, Insurance) | 1.6 |
| | 22.9 |
Top Market Sectors as of October 31, 2018
| | % of fund's net assets |
| Financials | 36.5 |
| Energy | 12.8 |
| Health Care | 11.6 |
| Industrials | 10.5 |
| Materials | 6.6 |
| Communication Services | 5.2 |
| Consumer Discretionary | 5.2 |
| Information Technology | 4.6 |
| Consumer Staples | 3.8 |
| Real Estate | 1.9 |
Schedule of Investments October 31, 2018
Showing Percentage of Net Assets
| Common Stocks - 97.6% | | | |
| | | Shares | Value |
| Australia - 3.1% | | | |
| Commonwealth Bank of Australia | | 149,146 | $7,311,916 |
| Insurance Australia Group Ltd. | | 618,266 | 2,990,345 |
| Macquarie Group Ltd. | | 45,547 | 3,780,181 |
|
| TOTAL AUSTRALIA | | | 14,082,442 |
|
| Austria - 0.8% | | | |
| Erste Group Bank AG | | 89,100 | 3,633,088 |
| Bailiwick of Jersey - 2.1% | | | |
| Ferguson PLC | | 25,971 | 1,753,752 |
| Glencore Xstrata PLC | | 1,410,800 | 5,749,773 |
| WPP PLC | | 206,900 | 2,341,225 |
|
| TOTAL BAILIWICK OF JERSEY | | | 9,844,750 |
|
| Belgium - 1.2% | | | |
| KBC Groep NV | | 79,125 | 5,457,915 |
| Canada - 0.6% | | | |
| Nutrien Ltd. | | 49,180 | 2,603,482 |
| Denmark - 0.4% | | | |
| A.P. Moller - Maersk A/S Series B | | 1,341 | 1,692,624 |
| Finland - 1.9% | | | |
| Nordea Bank ABP (a) | | 477,300 | 4,151,206 |
| Sampo Oyj (A Shares) | | 95,834 | 4,413,496 |
|
| TOTAL FINLAND | | | 8,564,702 |
|
| France - 15.1% | | | |
| Accor SA | | 48,600 | 2,224,991 |
| Atos Origin SA | | 30,671 | 2,632,560 |
| AXA SA | | 296,621 | 7,423,439 |
| Bouygues SA | | 77,105 | 2,815,615 |
| Capgemini SA | | 29,493 | 3,607,767 |
| Compagnie de St. Gobain | | 67,500 | 2,542,821 |
| Natixis SA | | 553,000 | 3,235,752 |
| Sanofi SA | | 136,879 | 12,231,586 |
| Societe Generale Series A | | 101,500 | 3,720,762 |
| SR Teleperformance SA | | 17,900 | 2,951,958 |
| Total SA (b) | | 258,157 | 15,147,470 |
| VINCI SA (b) | | 80,900 | 7,200,049 |
| Vivendi SA | | 145,992 | 3,521,081 |
|
| TOTAL FRANCE | | | 69,255,851 |
|
| Germany - 9.2% | | | |
| Bayer AG | | 102,200 | 7,833,881 |
| Brenntag AG | | 47,900 | 2,504,904 |
| Continental AG | | 9,400 | 1,553,917 |
| Deutsche Telekom AG | | 422,600 | 6,931,349 |
| Fresenius SE & Co. KGaA | | 32,700 | 2,078,276 |
| Hannover Reuck SE | | 36,100 | 4,869,840 |
| HeidelbergCement Finance AG | | 31,600 | 2,147,504 |
| Linde PLC | | 30,014 | 4,924,227 |
| SAP SE | | 32,160 | 3,443,484 |
| Vonovia SE | | 123,593 | 5,658,299 |
|
| TOTAL GERMANY | | | 41,945,681 |
|
| Ireland - 0.7% | | | |
| CRH PLC | | 111,302 | 3,319,936 |
| Italy - 1.2% | | | |
| Assicurazioni Generali SpA | | 137,200 | 2,219,106 |
| Intesa Sanpaolo SpA | | 995,800 | 2,205,771 |
| Mediobanca SpA | | 144,925 | 1,272,485 |
|
| TOTAL ITALY | | | 5,697,362 |
|
| Japan - 24.0% | | | |
| Honda Motor Co. Ltd. | | 243,600 | 6,953,691 |
| Hoya Corp. | | 61,700 | 3,507,279 |
| Idemitsu Kosan Co. Ltd. | | 58,600 | 2,674,613 |
| INPEX Corp. | | 162,000 | 1,844,631 |
| Itochu Corp. | | 320,900 | 5,951,401 |
| Japan Tobacco, Inc. | | 156,000 | 4,008,471 |
| Kao Corp. | | 45,400 | 3,020,109 |
| Makita Corp. | | 72,600 | 2,512,545 |
| Minebea Mitsumi, Inc. | | 107,500 | 1,644,538 |
| Mitsubishi UFJ Financial Group, Inc. | | 1,511,500 | 9,148,343 |
| Mitsui Fudosan Co. Ltd. | | 150,100 | 3,380,589 |
| Nintendo Co. Ltd. | | 4,700 | 1,467,354 |
| Nomura Holdings, Inc. | | 630,400 | 3,027,155 |
| OBIC Co. Ltd. | | 41,100 | 3,744,476 |
| Oracle Corp. Japan | | 30,900 | 2,097,700 |
| ORIX Corp. | | 343,400 | 5,602,866 |
| Panasonic Corp. | | 282,400 | 3,030,563 |
| Recruit Holdings Co. Ltd. | | 93,800 | 2,517,554 |
| Shin-Etsu Chemical Co. Ltd. | | 40,200 | 3,359,133 |
| Shinsei Bank Ltd. | | 190,400 | 2,900,363 |
| SoftBank Corp. | | 42,200 | 3,339,658 |
| Sony Corp. | | 64,200 | 3,474,296 |
| Sony Financial Holdings, Inc. | | 190,500 | 4,394,732 |
| Subaru Corp. | | 84,000 | 2,265,875 |
| Sumitomo Mitsui Financial Group, Inc. | | 188,600 | 7,343,160 |
| T&D Holdings, Inc. | | 212,500 | 3,396,964 |
| Taiheiyo Cement Corp. | | 57,200 | 1,683,207 |
| Takeda Pharmaceutical Co. Ltd. | | 128,900 | 5,344,136 |
| Tokio Marine Holdings, Inc. | | 127,900 | 6,025,643 |
|
| TOTAL JAPAN | | | 109,661,045 |
|
| Netherlands - 2.4% | | | |
| ING Groep NV (Certificaten Van Aandelen) | | 366,590 | 4,337,125 |
| Koninklijke Philips Electronics NV | | 94,104 | 3,509,689 |
| Wolters Kluwer NV | | 57,055 | 3,241,507 |
|
| TOTAL NETHERLANDS | | | 11,088,321 |
|
| Norway - 1.6% | | | |
| Equinor ASA | | 273,976 | 7,127,445 |
| Portugal - 0.7% | | | |
| Galp Energia SGPS SA Class B | | 177,494 | 3,094,989 |
| Spain - 3.4% | | | |
| Banco Santander SA | | 1,924,521 | 9,156,788 |
| Banco Santander SA rights (a) | | 1,885,521 | 73,252 |
| CaixaBank SA (b) | | 855,097 | 3,460,331 |
| Masmovil Ibercom SA (a) | | 10,585 | 1,373,951 |
| Unicaja Banco SA (c) | | 1,031,900 | 1,321,892 |
|
| TOTAL SPAIN | | | 15,386,214 |
|
| Sweden - 3.3% | | | |
| Alfa Laval AB | | 119,600 | 3,054,318 |
| Investor AB (B Shares) | | 81,660 | 3,539,940 |
| Swedbank AB (A Shares) | | 221,842 | 4,996,272 |
| Telefonaktiebolaget LM Ericsson (B Shares) | | 396,600 | 3,453,100 |
|
| TOTAL SWEDEN | | | 15,043,630 |
|
| Switzerland - 4.6% | | | |
| Credit Suisse Group AG | | 278,856 | 3,645,671 |
| Swiss Life Holding AG | | 8,960 | 3,382,408 |
| UBS Group AG(b) | | 510,458 | 7,095,366 |
| Zurich Insurance Group AG | | 23,071 | 7,163,117 |
|
| TOTAL SWITZERLAND | | | 21,286,562 |
|
| United Kingdom - 19.8% | | | |
| AstraZeneca PLC (United Kingdom) | | 98,512 | 7,535,150 |
| Aviva PLC | | 881,873 | 4,819,338 |
| BAE Systems PLC | | 548,641 | 3,678,795 |
| BHP Billiton PLC | | 572,366 | 11,417,953 |
| BP PLC | | 2,075,761 | 14,994,717 |
| British American Tobacco PLC (United Kingdom) | | 129,486 | 5,613,253 |
| Bunzl PLC | | 100,128 | 2,957,701 |
| Compass Group PLC | | 80,193 | 1,578,541 |
| GlaxoSmithKline PLC | | 228,332 | 4,422,280 |
| HSBC Holdings PLC sponsored ADR (b) | | 84,211 | 3,460,230 |
| Imperial Tobacco Group PLC | | 132,272 | 4,485,429 |
| Informa PLC | | 397,964 | 3,629,923 |
| ITV PLC | | 703,015 | 1,338,455 |
| Micro Focus International PLC | | 119,104 | 1,846,376 |
| Royal Dutch Shell PLC Class B sponsored ADR (b) | | 149,100 | 9,797,361 |
| RSA Insurance Group PLC | | 293,910 | 2,120,314 |
| Standard Chartered PLC (United Kingdom) | | 326,611 | 2,294,021 |
| Standard Life PLC | | 724,363 | 2,504,508 |
| The Weir Group PLC | | 91,052 | 1,845,829 |
|
| TOTAL UNITED KINGDOM | | | 90,340,174 |
|
| United States of America - 1.5% | | | |
| Amgen, Inc. | | 15,700 | 3,026,803 |
| ConocoPhillips Co. | | 53,900 | 3,767,610 |
|
| TOTAL UNITED STATES OF AMERICA | | | 6,794,413 |
|
| TOTAL COMMON STOCKS | | | |
| (Cost $485,969,543) | | | 445,920,626 |
|
| Nonconvertible Preferred Stocks - 1.1% | | | |
| Germany - 0.6% | | | |
| Porsche Automobil Holding SE (Germany) | | 42,100 | 2,677,349 |
| Spain - 0.5% | | | |
| Grifols SA Class B | | 114,900 | 2,387,801 |
| TOTAL NONCONVERTIBLE PREFERRED STOCKS | | | |
| (Cost $5,599,969) | | | 5,065,150 |
|
| Money Market Funds - 4.4% | | | |
| Fidelity Cash Central Fund, 2.23% (d) | | 4,245,932 | 4,246,782 |
| Fidelity Securities Lending Cash Central Fund 2.23% (d)(e) | | 15,774,036 | 15,775,614 |
| TOTAL MONEY MARKET FUNDS | | | |
| (Cost $20,022,870) | | | 20,022,396 |
| TOTAL INVESTMENT IN SECURITIES - 103.1% | | | |
| (Cost $511,592,382) | | | 471,008,172 |
| NET OTHER ASSETS (LIABILITIES) - (3.1)% | | | (13,974,665) |
| NET ASSETS - 100% | | | $457,033,507 |
Categorizations in the Schedule of Investments are based on country or territory of incorporation.
Legend
(a) Non-income producing
(b) Security or a portion of the security is on loan at period end.
(c) Security exempt from registration under Rule 144A of the Securities Act of 1933. These securities may be resold in transactions exempt from registration, normally to qualified institutional buyers. At the end of the period, the value of these securities amounted to $1,321,892 or 0.3% of net assets.
(d) Affiliated fund that is generally available only to investment companies and other accounts managed by Fidelity Investments. The rate quoted is the annualized seven-day yield of the fund at period end. A complete unaudited listing of the fund's holdings as of its most recent quarter end is available upon request. In addition, each Fidelity Central Fund's financial statements, which are not covered by the Fund's Report of Independent Registered Public Accounting Firm, are available on the SEC's website or upon request.
(e) Investment made with cash collateral received from securities on loan.
Affiliated Central Funds
Information regarding fiscal year to date income earned by the Fund from investments in Fidelity Central Funds is as follows:
| Fund | Income earned |
| Fidelity Cash Central Fund | $52,611 |
| Fidelity Securities Lending Cash Central Fund | 262,207 |
| Total | $314,818 |
Amounts in the income column in the above table include any capital gain distributions from underlying funds, which are presented in the corresponding line-item in the Statement of Operations if applicable.
Investment Valuation
The following is a summary of the inputs used, as of October 31, 2018, involving the Fund's assets and liabilities carried at fair value. The inputs or methodology used for valuing securities may not be an indication of the risk associated with investing in those securities. For more information on valuation inputs, and their aggregation into the levels used below, please refer to the Investment Valuation section in the accompanying Notes to Financial Statements.
| | Valuation Inputs at Reporting Date: |
| Description | Total | Level 1 | Level 2 | Level 3 |
| Investments in Securities: | | | | |
| Equities: | | | | |
| Communication Services | $23,942,996 | $6,342,329 | $17,600,667 | $-- |
| Consumer Discretionary | 23,759,223 | 5,357,449 | 18,401,774 | -- |
| Consumer Staples | 17,127,262 | 4,485,429 | 12,641,833 | -- |
| Energy | 58,448,836 | 26,462,018 | 31,986,818 | -- |
| Financials | 166,819,328 | 84,650,626 | 82,168,702 | -- |
| Health Care | 51,876,881 | 6,534,082 | 45,342,799 | -- |
| Industrials | 48,865,911 | 23,638,129 | 25,227,782 | -- |
| Information Technology | 20,825,463 | 12,082,503 | 8,742,960 | -- |
| Materials | 30,280,988 | 10,500,759 | 19,780,229 | -- |
| Real Estate | 9,038,888 | 5,658,299 | 3,380,589 | -- |
| Money Market Funds | 20,022,396 | 20,022,396 | -- | -- |
| Total Investments in Securities: | $471,008,172 | $205,734,019 | $265,274,153 | $-- |
The following is a summary of transfers between Level 1 and Level 2 for the period ended October 31, 2018. Transfers are assumed to have occurred at the beginning of the period, and are primarily attributable to the valuation techniques used for foreign equity securities, as discussed in the accompanying Notes to Financial Statements:
| Transfers | Total |
| Level 1 to Level 2 | $27,236,627 |
| Level 2 to Level 1 | $20,314,020 |
See accompanying notes which are an integral part of the financial statements.
Financial Statements
Statement of Assets and Liabilities
| | | October 31, 2018 |
| Assets | | |
Investment in securities, at value (including securities loaned of $15,231,117) — See accompanying schedule:
Unaffiliated issuers (cost $491,569,512) | $450,985,776 | |
| Fidelity Central Funds (cost $20,022,870) | 20,022,396 | |
| Total Investment in Securities (cost $511,592,382) | | $471,008,172 |
| Foreign currency held at value (cost $80,113) | | 80,113 |
| Receivable for fund shares sold | | 7,469,017 |
| Dividends receivable | | 2,628,658 |
| Distributions receivable from Fidelity Central Funds | | 12,827 |
| Prepaid expenses | | 920 |
| Other receivables | | 22,926 |
| Total assets | | 481,222,633 |
| Liabilities | | |
| Payable for investments purchased | $7,785,910 | |
| Payable for fund shares redeemed | 231,990 | |
| Accrued management fee | 221,669 | |
| Distribution and service plan fees payable | 8,008 | |
| Other affiliated payables | 86,468 | |
| Other payables and accrued expenses | 77,953 | |
| Collateral on securities loaned | 15,777,128 | |
| Total liabilities | | 24,189,126 |
| Net Assets | | $457,033,507 |
| Net Assets consist of: | | |
| Paid in capital | | $505,925,359 |
| Total distributable earnings (loss) | | (48,891,852) |
| Net Assets | | $457,033,507 |
| Net Asset Value and Maximum Offering Price | | |
| Class A: | | |
| Net Asset Value and redemption price per share ($7,887,242 ÷ 970,163 shares) | | $8.13 |
| Maximum offering price per share (100/94.25 of $8.13) | | $8.63 |
| Class M: | | |
| Net Asset Value and redemption price per share ($3,919,977 ÷ 483,320 shares) | | $8.11 |
| Maximum offering price per share (100/96.50 of $8.11) | | $8.40 |
| Class C: | | |
| Net Asset Value and offering price per share ($5,339,305 ÷ 660,917 shares)(a) | | $8.08 |
| International Value: | | |
| Net Asset Value, offering price and redemption price per share ($433,015,468 ÷ 53,228,066 shares) | | $8.14 |
| Class I: | | |
| Net Asset Value, offering price and redemption price per share ($6,779,070 ÷ 832,272 shares) | | $8.15 |
| Class Z: | | |
| Net Asset Value, offering price and redemption price per share ($92,445 ÷ 11,351 shares) | | $8.14 |
(a) Redemption price per share is equal to net asset value less any applicable contingent deferred sales charge.
See accompanying notes which are an integral part of the financial statements.
Statement of Operations
| | | Year ended October 31, 2018 |
| Investment Income | | |
| Dividends | | $19,726,153 |
| Income from Fidelity Central Funds | | 314,818 |
| Income before foreign taxes withheld | | 20,040,971 |
| Less foreign taxes withheld | | (1,743,150) |
| Total income | | 18,297,821 |
| Expenses | | |
| Management fee | | |
| Basic fee | $3,540,480 | |
| Performance adjustment | (294,667) | |
| Transfer agent fees | 848,275 | |
| Distribution and service plan fees | 100,081 | |
| Accounting and security lending fees | 266,165 | |
| Custodian fees and expenses | 86,817 | |
| Independent trustees' fees and expenses | 2,495 | |
| Registration fees | 78,774 | |
| Audit | 68,016 | |
| Legal | 1,427 | |
| Interest | 1,357 | |
| Miscellaneous | 2,827 | |
| Total expenses before reductions | 4,702,047 | |
| Expense reductions | (94,245) | |
| Total expenses after reductions | | 4,607,802 |
| Net investment income (loss) | | 13,690,019 |
| Realized and Unrealized Gain (Loss) | | |
| Net realized gain (loss) on: | | |
| Investment securities: | | |
| Unaffiliated issuers | 17,678,169 | |
| Fidelity Central Funds | (1,131) | |
| Foreign currency transactions | (6,284) | |
| Total net realized gain (loss) | | 17,670,754 |
| Change in net unrealized appreciation (depreciation) on: | | |
| Investment securities: | | |
| Unaffiliated issuers | (75,930,956) | |
| Fidelity Central Funds | (461) | |
| Assets and liabilities in foreign currencies | (24,662) | |
| Total change in net unrealized appreciation (depreciation) | | (75,956,079) |
| Net gain (loss) | | (58,285,325) |
| Net increase (decrease) in net assets resulting from operations | | $(44,595,306) |
See accompanying notes which are an integral part of the financial statements.
Statement of Changes in Net Assets
| | Year ended October 31, 2018 | Year ended October 31, 2017 |
| Increase (Decrease) in Net Assets | | |
| Operations | | |
| Net investment income (loss) | $13,690,019 | $8,130,796 |
| Net realized gain (loss) | 17,670,754 | 518,118 |
| Change in net unrealized appreciation (depreciation) | (75,956,079) | 54,057,696 |
| Net increase (decrease) in net assets resulting from operations | (44,595,306) | 62,706,610 |
| Distributions to shareholders | (8,990,094) | – |
| Distributions to shareholders from net investment income | – | (8,124,122) |
| Distributions to shareholders from net realized gain | – | (457,331) |
| Total distributions | (8,990,094) | (8,581,453) |
| Share transactions - net increase (decrease) | 127,811,807 | 1,925,222 |
| Redemption fees | 12,452 | 1,612 |
| Total increase (decrease) in net assets | 74,238,859 | 56,051,991 |
| Net Assets | | |
| Beginning of period | 382,794,648 | 326,742,657 |
| End of period | $457,033,507 | $382,794,648 |
| Other Information | | |
| Undistributed net investment income end of period | | $7,489,052 |
See accompanying notes which are an integral part of the financial statements.
Financial Highlights
Fidelity International Value Fund Class A
| Years ended October 31, | 2018 | 2017 | 2016 | 2015 | 2014 |
| Selected Per–Share Data | | | | | |
| Net asset value, beginning of period | $9.08 | $7.78 | $8.27 | $8.62 | $8.96 |
| Income from Investment Operations | | | | | |
| Net investment income (loss)A | .21 | .17 | .17 | .13 | .31B |
| Net realized and unrealized gain (loss) | (1.04) | 1.31 | (.57) | (.20) | (.47) |
| Total from investment operations | (.83) | 1.48 | (.40) | (.07) | (.16) |
| Distributions from net investment income | (.10) | (.17) | (.09) | (.28) | (.17) |
| Distributions from net realized gain | (.01) | (.01) | – | – | (.01) |
| Total distributions | (.12)C | (.18) | (.09) | (.28) | (.18) |
| Redemption fees added to paid in capitalA,D | – | – | – | – | – |
| Net asset value, end of period | $8.13 | $9.08 | $7.78 | $8.27 | $8.62 |
| Total ReturnE,F | (9.30)% | 19.36% | (4.91)% | (.81)% | (1.76)% |
| Ratios to Average Net AssetsG,H | | | | | |
| Expenses before reductions | 1.23% | 1.33% | 1.40% | 1.37% | 1.32% |
| Expenses net of fee waivers, if any | 1.23% | 1.33% | 1.40% | 1.37% | 1.32% |
| Expenses net of all reductions | 1.21% | 1.32% | 1.39% | 1.36% | 1.32% |
| Net investment income (loss) | 2.36% | 2.01% | 2.19% | 1.58% | 3.44%B |
| Supplemental Data | | | | | |
| Net assets, end of period (000 omitted) | $7,887 | $8,151 | $7,717 | $8,956 | $6,296 |
| Portfolio turnover rateI | 55% | 50% | 47% | 44% | 69% |
A Calculated based on average shares outstanding during the period.
B Net investment income per share reflects a large, non-recurring dividend which amounted to $.14 per share. Excluding this non-recurring dividend, the ratio of net investment income (loss) to average net assets would have been 1.90%.
C Total distributions of $.12 per share is comprised of distributions from net investment income of $.102 and distributions from net realized gain of $.014 per share.
D Amount represents less than $.005 per share.
E Total returns would have been lower if certain expenses had not been reduced during the applicable periods shown.
F Total returns do not include the effect of the sales charges.
G Fees and expenses of any underlying Fidelity Central Funds are not included in the Fund's expense ratio. The Fund indirectly bears its proportionate share of the expenses of any underlying Fidelity Central Funds.
H Expense ratios reflect operating expenses of the class. Expenses before reductions do not reflect amounts reimbursed by the investment adviser or reductions from brokerage service arrangements or reductions from other expense offset arrangements and do not represent the amount paid by the class during periods when reimbursements or reductions occur. Expenses net of fee waivers reflect expenses after reimbursement by the investment adviser but prior to reductions from brokerage service arrangements or other expense offset arrangements. Expenses net of all reductions represent the net expenses paid by the class.
I Amount does not include the portfolio activity of any underlying Fidelity Central Funds.
See accompanying notes which are an integral part of the financial statements.
Fidelity International Value Fund Class M
| Years ended October 31, | 2018 | 2017 | 2016 | 2015 | 2014 |
| Selected Per–Share Data | | | | | |
| Net asset value, beginning of period | $9.06 | $7.76 | $8.25 | $8.60 | $8.94 |
| Income from Investment Operations | | | | | |
| Net investment income (loss)A | .18 | .14 | .15 | .11 | .28B |
| Net realized and unrealized gain (loss) | (1.04) | 1.31 | (.58) | (.20) | (.46) |
| Total from investment operations | (.86) | 1.45 | (.43) | (.09) | (.18) |
| Distributions from net investment income | (.08) | (.14) | (.06) | (.26) | (.15) |
| Distributions from net realized gain | (.01) | (.01) | – | – | (.01) |
| Total distributions | (.09) | (.15) | (.06) | (.26) | (.16) |
| Redemption fees added to paid in capitalA,C | – | – | – | – | – |
| Net asset value, end of period | $8.11 | $9.06 | $7.76 | $8.25 | $8.60 |
| Total ReturnD,E | (9.59)% | 19.04% | (5.24)% | (1.09)% | (1.99)% |
| Ratios to Average Net AssetsF,G | | | | | |
| Expenses before reductions | 1.56% | 1.64% | 1.70% | 1.66% | 1.59% |
| Expenses net of fee waivers, if any | 1.55% | 1.64% | 1.70% | 1.66% | 1.59% |
| Expenses net of all reductions | 1.54% | 1.63% | 1.69% | 1.65% | 1.59% |
| Net investment income (loss) | 2.04% | 1.70% | 1.89% | 1.29% | 3.17%B |
| Supplemental Data | | | | | |
| Net assets, end of period (000 omitted) | $3,920 | $4,181 | $3,703 | $4,086 | $3,604 |
| Portfolio turnover rateH | 55% | 50% | 47% | 44% | 69% |
A Calculated based on average shares outstanding during the period.
B Net investment income per share reflects a large, non-recurring dividend which amounted to $.14 per share. Excluding this non-recurring dividend, the ratio of net investment income (loss) to average net assets would have been 1.64%.
C Amount represents less than $.005 per share.
D Total returns would have been lower if certain expenses had not been reduced during the applicable periods shown.
E Total returns do not include the effect of the sales charges.
F Fees and expenses of any underlying Fidelity Central Funds are not included in the Fund's expense ratio. The Fund indirectly bears its proportionate share of the expenses of any underlying Fidelity Central Funds.
G Expense ratios reflect operating expenses of the class. Expenses before reductions do not reflect amounts reimbursed by the investment adviser or reductions from brokerage service arrangements or reductions from other expense offset arrangements and do not represent the amount paid by the class during periods when reimbursements or reductions occur. Expenses net of fee waivers reflect expenses after reimbursement by the investment adviser but prior to reductions from brokerage service arrangements or other expense offset arrangements. Expenses net of all reductions represent the net expenses paid by the class.
H Amount does not include the portfolio activity of any underlying Fidelity Central Funds.
See accompanying notes which are an integral part of the financial statements.
Fidelity International Value Fund Class C
| Years ended October 31, | 2018 | 2017 | 2016 | 2015 | 2014 |
| Selected Per–Share Data | | | | | |
| Net asset value, beginning of period | $9.04 | $7.75 | $8.23 | $8.59 | $8.93 |
| Income from Investment Operations | | | | | |
| Net investment income (loss)A | .14 | .10 | .11 | .07 | .24B |
| Net realized and unrealized gain (loss) | (1.04) | 1.31 | (.57) | (.20) | (.45) |
| Total from investment operations | (.90) | 1.41 | (.46) | (.13) | (.21) |
| Distributions from net investment income | (.04) | (.11) | (.02) | (.23) | (.11) |
| Distributions from net realized gain | (.01) | (.01) | – | – | (.01) |
| Total distributions | (.06)C | (.12) | (.02) | (.23) | (.13)D |
| Redemption fees added to paid in capitalA,E | – | – | – | – | – |
| Net asset value, end of period | $8.08 | $9.04 | $7.75 | $8.23 | $8.59 |
| Total ReturnF,G | (10.06)% | 18.41% | (5.61)% | (1.58)% | (2.43)% |
| Ratios to Average Net AssetsH,I | | | | | |
| Expenses before reductions | 2.04% | 2.12% | 2.17% | 2.15% | 2.07% |
| Expenses net of fee waivers, if any | 2.04% | 2.12% | 2.17% | 2.14% | 2.07% |
| Expenses net of all reductions | 2.02% | 2.11% | 2.17% | 2.14% | 2.07% |
| Net investment income (loss) | 1.55% | 1.22% | 1.42% | .81% | 2.69%B |
| Supplemental Data | | | | | |
| Net assets, end of period (000 omitted) | $5,339 | $5,171 | $4,168 | $4,502 | $3,647 |
| Portfolio turnover rateJ | 55% | 50% | 47% | 44% | 69% |
A Calculated based on average shares outstanding during the period.
B Net investment income per share reflects a large, non-recurring dividend which amounted to $.14 per share. Excluding this non-recurring dividend, the ratio of net investment income (loss) to average net assets would have been 1.15%.
C Total distributions of $.06 per share is comprised of distributions from net investment income of $.042 and distributions from net realized gain of $.014 per share.
D Total distributions of $.13 per share is comprised of distributions from net investment income of $.111 and distributions from net realized gain of $.014 per share.
E Amount represents less than $.005 per share.
F Total returns would have been lower if certain expenses had not been reduced during the applicable periods shown.
G Total returns do not include the effect of the contingent deferred sales charge.
H Fees and expenses of any underlying Fidelity Central Funds are not included in the Fund's expense ratio. The Fund indirectly bears its proportionate share of the expenses of any underlying Fidelity Central Funds.
I Expense ratios reflect operating expenses of the class. Expenses before reductions do not reflect amounts reimbursed by the investment adviser or reductions from brokerage service arrangements or reductions from other expense offset arrangements and do not represent the amount paid by the class during periods when reimbursements or reductions occur. Expenses net of fee waivers reflect expenses after reimbursement by the investment adviser but prior to reductions from brokerage service arrangements or other expense offset arrangements. Expenses net of all reductions represent the net expenses paid by the class.
J Amount does not include the portfolio activity of any underlying Fidelity Central Funds.
See accompanying notes which are an integral part of the financial statements.
Fidelity International Value Fund
| Years ended October 31, | 2018 | 2017 | 2016 | 2015 | 2014 |
| Selected Per–Share Data | | | | | |
| Net asset value, beginning of period | $9.09 | $7.79 | $8.29 | $8.64 | $8.97 |
| Income from Investment Operations | | | | | |
| Net investment income (loss)A | .24 | .20 | .20 | .16 | .34B |
| Net realized and unrealized gain (loss) | (1.04) | 1.31 | (.58) | (.19) | (.46) |
| Total from investment operations | (.80) | 1.51 | (.38) | (.03) | (.12) |
| Distributions from net investment income | (.14) | (.20) | (.12) | (.32) | (.20) |
| Distributions from net realized gain | (.01) | (.01) | – | – | (.01) |
| Total distributions | (.15) | (.21) | (.12) | (.32) | (.21) |
| Redemption fees added to paid in capitalA,C | – | – | – | – | – |
| Net asset value, end of period | $8.14 | $9.09 | $7.79 | $8.29 | $8.64 |
| Total ReturnD | (8.95)% | 19.83% | (4.69)% | (.41)% | (1.34)% |
| Ratios to Average Net AssetsE,F | | | | | |
| Expenses before reductions | .89% | .97% | 1.03% | 1.02% | .96% |
| Expenses net of fee waivers, if any | .89% | .97% | 1.03% | 1.02% | .96% |
| Expenses net of all reductions | .87% | .96% | 1.03% | 1.01% | .95% |
| Net investment income (loss) | 2.70% | 2.36% | 2.56% | 1.93% | 3.80%B |
| Supplemental Data | | | | | |
| Net assets, end of period (000 omitted) | $433,015 | $359,770 | $309,199 | $267,567 | $192,789 |
| Portfolio turnover rateG | 55% | 50% | 47% | 44% | 69% |
A Calculated based on average shares outstanding during the period.
B Net investment income per share reflects a large, non-recurring dividend which amounted to $.14 per share. Excluding this non-recurring dividend, the ratio of net investment income (loss) to average net assets would have been 2.27%.
C Amount represents less than $.005 per share.
D Total returns would have been lower if certain expenses had not been reduced during the applicable periods shown.
E Fees and expenses of any underlying Fidelity Central Funds are not included in the Fund's expense ratio. The Fund indirectly bears its proportionate share of the expenses of any underlying Fidelity Central Funds.
F Expense ratios reflect operating expenses of the class. Expenses before reductions do not reflect amounts reimbursed by the investment adviser or reductions from brokerage service arrangements or reductions from other expense offset arrangements and do not represent the amount paid by the class during periods when reimbursements or reductions occur. Expenses net of fee waivers reflect expenses after reimbursement by the investment adviser but prior to reductions from brokerage service arrangements or other expense offset arrangements. Expenses net of all reductions represent the net expenses paid by the class.
G Amount does not include the portfolio activity of any underlying Fidelity Central Funds.
See accompanying notes which are an integral part of the financial statements.
Fidelity International Value Fund Class I
| Years ended October 31, | 2018 | 2017 | 2016 | 2015 | 2014 |
| Selected Per–Share Data | | | | | |
| Net asset value, beginning of period | $9.10 | $7.80 | $8.29 | $8.65 | $8.98 |
| Income from Investment Operations | | | | | |
| Net investment income (loss)A | .23 | .19 | .19 | .15 | .33B |
| Net realized and unrealized gain (loss) | (1.04) | 1.31 | (.58) | (.19) | (.45) |
| Total from investment operations | (.81) | 1.50 | (.39) | (.04) | (.12) |
| Distributions from net investment income | (.13) | (.19) | (.10) | (.32) | (.19) |
| Distributions from net realized gain | (.01) | (.01) | – | – | (.01) |
| Total distributions | (.14) | (.20) | (.10) | (.32) | (.21)C |
| Redemption fees added to paid in capitalA,D | – | – | – | – | – |
| Net asset value, end of period | $8.15 | $9.10 | $7.80 | $8.29 | $8.65 |
| Total ReturnE | (9.04)% | 19.68% | (4.81)% | (.53)% | (1.41)% |
| Ratios to Average Net AssetsF,G | | | | | |
| Expenses before reductions | .97% | 1.10% | 1.17% | 1.14% | 1.05% |
| Expenses net of fee waivers, if any | .97% | 1.10% | 1.17% | 1.14% | 1.05% |
| Expenses net of all reductions | .95% | 1.09% | 1.16% | 1.13% | 1.04% |
| Net investment income (loss) | 2.62% | 2.23% | 2.42% | 1.81% | 3.71%B |
| Supplemental Data | | | | | |
| Net assets, end of period (000 omitted) | $6,779 | $5,523 | $1,955 | $1,969 | $1,310 |
| Portfolio turnover rateH | 55% | 50% | 47% | 44% | 69% |
A Calculated based on average shares outstanding during the period.
B Net investment income per share reflects a large, non-recurring dividend which amounted to $.14 per share. Excluding this non-recurring dividend, the ratio of net investment income (loss) to average net assets would have been 2.18%.
C Total distributions of $.21 per share is comprised of distributions from net investment income of $.191 and distributions from net realized gain of $.014 per share.
D Amount represents less than $.005 per share.
E Total returns would have been lower if certain expenses had not been reduced during the applicable periods shown.
F Fees and expenses of any underlying Fidelity Central Funds are not included in the Fund's expense ratio. The Fund indirectly bears its proportionate share of the expenses of any underlying Fidelity Central Funds.
G Expense ratios reflect operating expenses of the class. Expenses before reductions do not reflect amounts reimbursed by the investment adviser or reductions from brokerage service arrangements or reductions from other expense offset arrangements and do not represent the amount paid by the class during periods when reimbursements or reductions occur. Expenses net of fee waivers reflect expenses after reimbursement by the investment adviser but prior to reductions from brokerage service arrangements or other expense offset arrangements. Expenses net of all reductions represent the net expenses paid by the class.
H Amount does not include the portfolio activity of any underlying Fidelity Central Funds.
See accompanying notes which are an integral part of the financial statements.
Fidelity International Value Fund Class Z
| Year ended October 31, | 2018 A |
| Selected Per–Share Data | |
| Net asset value, beginning of period | $8.81 |
| Income from Investment Operations | |
| Net investment income (loss)B | .01 |
| Net realized and unrealized gain (loss) | (.68) |
| Total from investment operations | (.67) |
| Net asset value, end of period | $8.14 |
| Total ReturnC,D | (7.60)% |
| Ratios to Average Net AssetsE,F | |
| Expenses before reductions | .84%G |
| Expenses net of fee waivers, if any | .84%G |
| Expenses net of all reductions | .82%G |
| Net investment income (loss) | 1.58%G |
| Supplemental Data | |
| Net assets, end of period (000 omitted) | $92 |
| Portfolio turnover rateH | 55% |
A For the period October 2, 2018 (commencement of sale of shares) to October 31, 2018.
B Calculated based on average shares outstanding during the period.
C Total returns for periods of less than one year are not annualized.
D Total returns would have been lower if certain expenses had not been reduced during the applicable periods shown.
E Fees and expenses of any underlying Fidelity Central Funds are not included in the Fund's expense ratio. The Fund indirectly bears its proportionate share of the expenses of any underlying Fidelity Central Funds.
F Expense ratios reflect operating expenses of the class. Expenses before reductions do not reflect amounts reimbursed by the investment adviser or reductions from brokerage service arrangements or reductions from other expense offset arrangements and do not represent the amount paid by the class during periods when reimbursements or reductions occur. Expense ratios before reductions for start-up periods may not be representative of longer-term operating periods. Expenses net of fee waivers reflect expenses after reimbursement by the investment adviser but prior to reductions from brokerage service arrangements or other expense offset arrangements. Expenses net of all reductions represent the net expenses paid by the class.
G Annualized
H Amount does not include the portfolio activity of any underlying Fidelity Central Funds.
See accompanying notes which are an integral part of the financial statements.
Notes to Financial Statements
For the period ended October 31, 2018
1. Organization.
Fidelity International Value Fund (the Fund) is a fund of Fidelity Investment Trust (the Trust) and is authorized to issue an unlimited number of shares. The Trust is registered under the Investment Company Act of 1940, as amended (the 1940 Act), as an open-end management investment company organized as a Massachusetts business trust. The Fund commenced sale of Class Z shares on October 2, 2018. The Fund offers Class A, Class M, Class C, International Value, Class I and Class Z shares, each of which has equal rights as to assets and voting privileges. Each class has exclusive voting rights with respect to matters that affect that class.
2. Investments in Fidelity Central Funds.
The Fund invests in Fidelity Central Funds, which are open-end investment companies generally available only to other investment companies and accounts managed by the investment adviser and its affiliates. The Fund's Schedule of Investments lists each of the Fidelity Central Funds held as of period end, if any, as an investment of the Fund, but does not include the underlying holdings of each Fidelity Central Fund. As an Investing Fund, the Fund indirectly bears its proportionate share of the expenses of the underlying Fidelity Central Funds.
The Money Market Central Funds seek preservation of capital and current income and are managed by Fidelity Investments Money Management, Inc. (FIMM), an affiliate of the investment adviser. Annualized expenses of the Money Market Central Funds as of their most recent shareholder report date are less than .005%.
A complete unaudited list of holdings for each Fidelity Central Fund is available upon request or at the Securities and Exchange Commission (the SEC) website at www.sec.gov. In addition, the financial statements of the Fidelity Central Funds, which are not covered by the Fund's Report of Independent Registered Public Accounting Firm, are available on the SEC website or upon request.
3. Significant Accounting Policies.
The Fund is an investment company and applies the accounting and reporting guidance of the Financial Accounting Standards Board (FASB) Accounting Standards Codification Topic 946 Financial Services – Investments Companies. The financial statements have been prepared in conformity with accounting principles generally accepted in the United States of America (GAAP), which require management to make certain estimates and assumptions at the date of the financial statements. Actual results could differ from those estimates. Subsequent events, if any, through the date that the financial statements were issued have been evaluated in the preparation of the financial statements. The following summarizes the significant accounting policies of the Fund:
Investment Valuation. Investments are valued as of 4:00 p.m. Eastern time on the last calendar day of the period. The Board of Trustees (the Board) has delegated the day to day responsibility for the valuation of the Fund's investments to the Fair Value Committee (the Committee) established by the Fund's investment adviser. In accordance with valuation policies and procedures approved by the Board, the Fund attempts to obtain prices from one or more third party pricing vendors or brokers to value its investments. When current market prices, quotations or currency exchange rates are not readily available or reliable, investments will be fair valued in good faith by the Committee, in accordance with procedures adopted by the Board. Factors used in determining fair value vary by investment type and may include market or investment specific events. The frequency with which these procedures are used cannot be predicted and they may be utilized to a significant extent. The Committee oversees the Fund's valuation policies and procedures and reports to the Board on the Committee's activities and fair value determinations. The Board monitors the appropriateness of the procedures used in valuing the Fund's investments and ratifies the fair value determinations of the Committee.
The Fund categorizes the inputs to valuation techniques used to value its investments into a disclosure hierarchy consisting of three levels as shown below:
- Level 1 – quoted prices in active markets for identical investments
- Level 2 – other significant observable inputs (including quoted prices for similar investments, interest rates, prepayment speeds, etc.)
- Level 3 – unobservable inputs (including the Fund's own assumptions based on the best information available)
Valuation techniques used to value the Fund's investments by major category are as follows:
Equity securities, including restricted securities, for which market quotations are readily available, are valued at the last reported sale price or official closing price as reported by a third party pricing vendor on the primary market or exchange on which they are traded and are categorized as Level 1 in the hierarchy. In the event there were no sales during the day or closing prices are not available, securities are valued at the last quoted bid price or may be valued using the last available price and are generally categorized as Level 2 in the hierarchy. For foreign equity securities, when market or security specific events arise, comparisons to the valuation of American Depositary Receipts (ADRs), futures contracts, Exchange-Traded Funds (ETFs) and certain indexes as well as quoted prices for similar securities may be used and would be categorized as Level 2 in the hierarchy. Utilizing these techniques may result in transfers between Level 1 and Level 2. For equity securities, including restricted securities, where observable inputs are limited, assumptions about market activity and risk are used and these securities may be categorized as Level 3 in the hierarchy.
Investments in open-end mutual funds, including the Fidelity Central Funds, are valued at their closing net asset value (NAV) each business day and are categorized as Level 1 in the hierarchy.
Changes in valuation techniques may result in transfers in or out of an assigned level within the disclosure hierarchy. The aggregate value of investments by input level as of October 31, 2018, including information on transfers between Levels 1 and 2, is included at the end of the Fund's Schedule of Investments.
Foreign Currency. The Fund may use foreign currency contracts to facilitate transactions in foreign-denominated securities. Gains and losses from these transactions may arise from changes in the value of the foreign currency or if the counterparties do not perform under the contracts' terms.
Foreign-denominated assets, including investment securities, and liabilities are translated into U.S. dollars at the exchange rates at period end. Purchases and sales of investment securities, income and dividends received and expenses denominated in foreign currencies are translated into U.S. dollars at the exchange rate in effect on the transaction date.
The effects of exchange rate fluctuations on investments are included with the net realized and unrealized gain (loss) on investment securities. Other foreign currency transactions resulting in realized and unrealized gain (loss) are disclosed separately.
Investment Transactions and Income. For financial reporting purposes, the Fund's investment holdings and NAV include trades executed through the end of the last business day of the period. The NAV per share for processing shareholder transactions is calculated as of the close of business of the New York Stock Exchange (NYSE), normally 4:00 p.m. Eastern time and includes trades executed through the end of the prior business day. Gains and losses on securities sold are determined on the basis of identified cost and include proceeds received from litigation. Dividend income is recorded on the ex-dividend date, except for certain dividends from foreign securities where the ex-dividend date may have passed, which are recorded as soon as the Fund is informed of the ex-dividend date. Non-cash dividends included in dividend income, if any, are recorded at the fair market value of the securities received. Income and capital gain distributions from Fidelity Central Funds, if any, are recorded on the ex-dividend date. Certain distributions received by the Fund represent a return of capital or capital gain. The Fund determines the components of these distributions subsequent to the ex-dividend date, based upon receipt of tax filings or other correspondence relating to the underlying investment. These distributions are recorded as a reduction of cost of investments and/or as a realized gain. Interest income is accrued as earned and includes coupon interest and amortization of premium and accretion of discount on debt securities as applicable. Investment income is recorded net of foreign taxes withheld where recovery of such taxes is uncertain.
Class Allocations and Expenses. Investment income, realized and unrealized capital gains and losses, common expenses of the Fund, and certain fund-level expense reductions, if any, are allocated daily on a pro-rata basis to each class based on the relative net assets of each class to the total net assets of the Fund. Each class differs with respect to transfer agent and distribution and service plan fees incurred. Certain expense reductions may also differ by class. For the reporting period, the allocated portion of income and expenses to each class as a percent of its average net assets may vary due to the timing of recording these transactions in relation to fluctuating net assets of the classes. Expenses directly attributable to a fund are charged to that fund. Expenses attributable to more than one fund are allocated among the respective funds on the basis of relative net assets or other appropriate methods. Expense estimates are accrued in the period to which they relate and adjustments are made when actual amounts are known.
Income Tax Information and Distributions to Shareholders. Each year, the Fund intends to qualify as a regulated investment company under Subchapter M of the Internal Revenue Code, including distributing substantially all of its taxable income and realized gains. As a result, no provision for U.S. Federal income taxes is required. As of October 31, 2018, the Fund did not have any unrecognized tax benefits in the financial statements; nor is the Fund aware of any tax positions for which it is reasonably possible that the total amounts of unrecognized tax benefits will significantly change in the next twelve months. The Fund files a U.S. federal tax return, in addition to state and local tax returns as required. The Fund's federal income tax returns are subject to examination by the Internal Revenue Service (IRS) for a period of three fiscal years after they are filed. State and local tax returns may be subject to examination for an additional fiscal year depending on the jurisdiction. Foreign taxes are provided for based on the Fund's understanding of the tax rules and rates that exist in the foreign markets in which it invests.
Distributions are declared and recorded on the ex-dividend date. Income and capital gain distributions are declared separately for each class. Income and capital gain distributions are determined in accordance with income tax regulations, which may differ from GAAP.
Capital accounts within the financial statements are adjusted for permanent book-tax differences. These adjustments have no impact on net assets or the results of operations. Capital accounts are not adjusted for temporary book-tax differences which will reverse in a subsequent period.
Book-tax differences are primarily due to foreign currency transactions, passive foreign investment companies (PFIC), expiring capital loss carryforwards, capital loss carryforwards and losses deferred due to wash sales.
As of period end, the cost and unrealized appreciation (depreciation) in securities, and derivatives if applicable, for federal income tax purposes were as follows:
| Gross unrealized appreciation | $20,605,169 |
| Gross unrealized depreciation | (62,548,863) |
| Net unrealized appreciation (depreciation) | $(41,943,694) |
| Tax Cost | $512,951,866 |
The tax-based components of distributable earnings as of period end were as follows:
| Undistributed ordinary income | $12,539,510 |
| Capital loss carryforward | $(19,448,816) |
| Net unrealized appreciation (depreciation) on securities and other investments | $(41,982,545) |
Capital loss carryforwards are only available to offset future capital gains of the Fund to the extent provided by regulations and may be limited. Under the Regulated Investment Company Modernization Act of 2010 (the Act), the Fund is permitted to carry forward capital losses incurred in taxable years beginning after December 22, 2010 for an unlimited period and such capital losses are required to be used prior to any losses that expire. The capital loss carryforward information presented below, including any applicable limitation, is estimated as of fiscal period end and is subject to adjustment.
| Fiscal year of expiration | |
| 2019 | $(19,448,816) |
| Total with expiration | $(19,448,816) |
| Total capital loss carryforward | $(19,448,816) |
The tax character of distributions paid was as follows:
| | October 31, 2018 | October 31, 2017 |
| Ordinary Income | $ 8,990,094 | $ 8,581,453 |
Short-Term Trading (Redemption) Fees. Shares held by investors in the Fund less than 30 days may have been subject to a redemption fee equal to 1.00% of the NAV of shares redeemed. All redemption fees, which reduce the proceeds of the shareholder redemption, are retained by the Fund and accounted for as an addition to paid in capital. In November 2017, the Board of Trustees approved the elimination of these redemption fees effective December 18, 2017.
Restricted Securities. The Fund may invest in securities that are subject to legal or contractual restrictions on resale. These securities generally may be resold in transactions exempt from registration or to the public if the securities are registered. Disposal of these securities may involve time-consuming negotiations and expense, and prompt sale at an acceptable price may be difficult. Information regarding restricted securities is included at the end of the Fund's Schedule of Investments.
New Rule Issuance. During August 2018, the U.S. Securities and Exchange Commission issued Final Rule Release No. 33-10532, Disclosure Update and Simplification. This Final Rule includes amendments specific to registered investment companies that are intended to eliminate overlap in disclosure requirements between Regulation S-X and GAAP. In accordance with these amendments, certain line-items in the Fund's financial statements have been combined or removed for the current period as outlined in the table below.
| Financial Statement | Current Line-Item Presentation | Prior Line-Item Presentation |
| Statement of Assets and Liabilities | Total distributable earnings (loss) | Undistributed/Distributions in excess of/Accumulated net investment income (loss)
Accumulated/Undistributed net realized gain (loss)
Net unrealized appreciation (depreciation) |
| Statement of Changes in Net Assets | N/A - removed | Undistributed/Distributions in excess of/Accumulated net investment income (loss) end of period |
| Statement of Changes in Net Assets | Distributions to shareholders | Distributions to shareholders from net investment income
Distributions to shareholders from net realized gain |
| Distributions to Shareholders Note to Financial Statements | Distributions to shareholders | Distributions to shareholders from net investment income
Distributions to shareholders from net realized gain |
4. Purchases and Sales of Investments.
Purchases and sales of securities, other than short-term securities, aggregated $405,058,388 and $273,996,296, respectively.
5. Fees and Other Transactions with Affiliates.
Management Fee. Fidelity Management & Research Company (the investment adviser) and its affiliates provide the Fund with investment management related services for which the Fund pays a monthly management fee. The management fee is the sum of an individual fund fee rate that is based on an annual rate of .45% of the Fund's average net assets and an annualized group fee rate that averaged .24% during the period. The group fee rate is based upon the average net assets of all the mutual funds advised by the investment adviser, including any mutual funds previously advised by the investment adviser that are currently advised by Fidelity SelectCo, LLC, an affiliate of the investment adviser. The group fee rate decreases as assets under management increase and increases as assets under management decrease. In addition, the management fee is subject to a performance adjustment (up to a maximum of +/- .20% of the Fund's average net assets over a 36 month performance period). The upward or downward adjustment to the management fee is based on the relative investment performance of International Value as compared to its benchmark index, the MSCI EAFE Value Index, over the same 36 month performance period. For the reporting period, the total annual management fee rate, including the performance adjustment, was .63% of the Fund's average net assets. The performance adjustment included in the management fee rate may be higher or lower than the maximum performance adjustment rate due to the difference between the average net assets for the reporting and performance periods.
Distribution and Service Plan Fees. In accordance with Rule 12b-1 of the 1940 Act, the Fund has adopted separate Distribution and Service Plans for each class of shares. Certain classes pay Fidelity Distributors Corporation (FDC), an affiliate of the investment adviser, separate Distribution and Service Fees, each of which is based on an annual percentage of each class' average net assets. In addition, FDC may pay financial intermediaries for selling shares of the Fund and providing shareholder support services. For the period, the Distribution and Service Fee rates, total fees and amounts retained by FDC were as follows:
| | Distribution Fee | Service Fee | Total Fees | Retained by FDC |
| Class A | -% | .25% | $21,210 | $995 |
| Class M | .25% | .25% | 20,998 | 40 |
| Class C | .75% | .25% | 57,873 | 7,920 |
| | | | $100,081 | $8,955 |
Sales Load. FDC may receive a front-end sales charge of up to 5.75% for selling Class A shares and 3.50% for selling Class M shares, some of which is paid to financial intermediaries for selling shares of the Fund. Depending on the holding period, FDC may receive contingent deferred sales charges levied on Class A, Class M and Class C redemptions. The deferred sales charges are 1.00% for Class C shares, 1.00% for certain purchases of Class A shares and .25% for certain purchases of Class M shares.
For the period, sales charge amounts retained by FDC were as follows:
| | Retained by FDC |
| Class A | $5,328 |
| Class M | 1,081 |
| Class C(a) | 341 |
| | $6,750 |
(a) When Class C shares are initially sold, FDC pays commissions from its own resources to financial intermediaries through which the sales are made.
Transfer Agent Fees. Fidelity Investments Institutional Operations Company, Inc., (FIIOC), an affiliate of the investment adviser, is the transfer, dividend disbursing and shareholder servicing agent for each class of the Fund. FIIOC receives account fees and asset-based fees that vary according to the account size and type of account of the shareholders of the respective classes of the Fund, except for Class Z. FIIOC receives an asset-based fee of Class Z's average net assets. FIIOC pays for typesetting, printing and mailing of shareholder reports, except proxy statements.
For the period, transfer agent fees for each class were as follows:
| | Amount | % of Class-Level Average Net Assets |
| Class A | $20,733 | .24 |
| Class M | 13,543 | .32 |
| Class C | 17,618 | .30 |
| International Value | 780,074 | .16 |
| Class I | 16,304 | .24 |
| Class Z | 3 | .04(a) |
| | $848,275 | |
(a) Annualized
Accounting and Security Lending Fees. Fidelity Service Company, Inc. (FSC), an affiliate of the investment adviser, maintains the Fund's accounting records. The accounting fee is based on the level of average net assets for each month. Under a separate contract, FSC administers the security lending program. The security lending fee is based on the number and duration of lending transactions. For the period, the fees were equivalent to an annual rate of .05%.
Brokerage Commissions. The Fund placed a portion of its portfolio transactions with brokerage firms which are affiliates of the investment adviser. Brokerage commissions are included in net realized gain (loss) and change in net unrealized appreciation (depreciation) in the Statement of Operations. The commissions paid to these affiliated firms were $517 for the period.
Interfund Lending Program. Pursuant to an Exemptive Order issued by the SEC, the Fund, along with other registered investment companies having management contracts with Fidelity Management & Research Company (FMR) or other affiliated entities of FMR, may participate in an interfund lending program. This program provides an alternative credit facility allowing the funds to borrow from, or lend money to, other participating affiliated funds. At period end, there were no interfund loans outstanding. The Fund's activity in this program during the period for which loans were outstanding was as follows:
| Borrower or Lender | Average Loan Balance | Weighted Average Interest Rate | Interest Expense |
| Borrower | $3,180,778 | 1.71% | $1,357 |
Interfund Trades. The Fund may purchase from or sell securities to other Fidelity Funds under procedures adopted by the Board. The procedures have been designed to ensure these interfund trades are executed in accordance with Rule 17a-7 of the 1940 Act. Interfund trades are included within the respective purchases and sales amounts shown in the Purchases and Sales of Investments note.
6. Committed Line of Credit.
The Fund participates with other funds managed by the investment adviser or an affiliate in a $4.25 billion credit facility (the "line of credit") to be utilized for temporary or emergency purposes to fund shareholder redemptions or for other short-term liquidity purposes. The Fund has agreed to pay commitment fees on its pro-rata portion of the line of credit, which amounted to $1,362 and is reflected in Miscellaneous expenses on the Statement of Operations. During the period, the Fund did not borrow on this line of credit.
7. Security Lending.
The Fund lends portfolio securities through a lending agent from time to time in order to earn additional income. For equity securities, a lending agent is used and may loan securities to certain qualified borrowers, including Fidelity Capital Markets (FCM), a broker-dealer affiliated with the Fund. On the settlement date of the loan, the Fund receives collateral (in the form of U.S. Treasury obligations, letters of credit and/or cash) against the loaned securities and maintains collateral in an amount not less than 100% of the market value of the loaned securities during the period of the loan. The market value of the loaned securities is determined at the close of business of the Fund and any additional required collateral is delivered to the Fund on the next business day. The Fund or borrower may terminate the loan at any time, and if the borrower defaults on its obligation to return the securities loaned because of insolvency or other reasons, the Fund may apply collateral received from the borrower against the obligation. The Fund may experience delays and costs in recovering the securities loaned. Any cash collateral received is invested in the Fidelity Securities Lending Cash Central Fund. The value of loaned securities and cash collateral at period end are disclosed on the Fund's Statement of Assets and Liabilities. Security lending income represents the income earned on investing cash collateral, less rebates paid to borrowers and any lending agent fees associated with the loan, plus any premium payments received for lending certain types of securities. Security lending income is presented in the Statement of Operations as a component of income from Fidelity Central Funds. Total security lending income during the period amounted to $262,207. During the period, there were no securities loaned to FCM.
8. Expense Reductions.
Commissions paid to certain brokers with whom the investment adviser, or its affiliates, places trades on behalf of the Fund include an amount in addition to trade execution, which may be rebated back to the Fund to offset certain expenses. This amount totaled $88,742 for the period.
In addition, during the period the investment adviser reimbursed and/or waived a portion of fund-level operating expenses in the amount of $5,503.
9. Distributions to Shareholders.
Distributions to shareholders of each class were as follows:
| | Year ended
October 31, 2018 | Year ended
October 31, 2017 |
| Distributions to shareholders | | |
| Class A | $103,389 | $– |
| Class M | 41,092 | – |
| Class C | 32,748 | – |
| International Value | 8,724,460 | – |
| Class I | 88,405 | – |
| Total | $8,990,094 | $– |
| From net investment income | | |
| Class A | $– | $160,715 |
| Class M | – | 64,948 |
| Class C | – | 57,557 |
| International Value | – | 7,786,373 |
| Class I | – | 54,529 |
| Total | $– | $8,124,122 |
| From net realized gain | | |
| Class A | $– | $10,650 |
| Class M | – | 5,031 |
| Class C | – | 5,917 |
| International Value | – | 432,576 |
| Class I | – | 3,157 |
| Total | $– | $457,331 |
10. Share Transactions.
Share transactions for each class were as follows and may contain automatic conversions between classes or exchanges between affiliated funds:
| | Shares | Shares | Dollars | Dollars |
| | Year ended October 31, 2018(a) | Year ended October 31, 2017 | Year ended October 31, 2018(a) | Year ended October 31, 2017 |
| Class A | | | | |
| Shares sold | 286,375 | 276,572 | $2,567,358 | $2,327,962 |
| Reinvestment of distributions | 11,240 | 21,396 | 100,489 | 166,672 |
| Shares redeemed | (224,999) | (392,253) | (2,007,679) | (3,202,452) |
| Net increase (decrease) | 72,616 | (94,285) | $660,168 | $(707,818) |
| Class M | | | | |
| Shares sold | 84,749 | 101,768 | $765,119 | $836,059 |
| Reinvestment of distributions | 4,596 | 8,935 | 41,092 | 69,695 |
| Shares redeemed | (67,389) | (126,227) | (604,451) | (1,023,584) |
| Net increase (decrease) | 21,956 | (15,524) | $201,760 | $(117,830) |
| Class C | | | | |
| Shares sold | 224,225 | 120,429 | $2,034,976 | $1,017,626 |
| Reinvestment of distributions | 3,587 | 7,631 | 32,067 | 59,598 |
| Shares redeemed | (139,088) | (94,013) | (1,223,224) | (768,940) |
| Net increase (decrease) | 88,724 | 34,047 | $843,819 | $308,284 |
| International Value | | | | |
| Shares sold | 22,242,584 | 2,636,526 | $201,187,963 | $22,208,337 |
| Reinvestment of distributions | 477,419 | 1,033,790 | 4,258,580 | 8,032,545 |
| Shares redeemed | (9,065,603) | (3,774,158) | (81,505,210) | (30,751,436) |
| Net increase (decrease) | 13,654,400 | (103,842) | $123,941,333 | $(510,554) |
| Class I | | | | |
| Shares sold | 519,858 | 426,959 | $4,669,763 | $3,538,590 |
| Reinvestment of distributions | 9,287 | 6,933 | 82,930 | 54,005 |
| Shares redeemed | (303,812) | (77,592) | (2,687,966) | (639,455) |
| Net increase (decrease) | 225,333 | 356,300 | $2,064,727 | $2,953,140 |
| Class Z | | | | |
| Shares sold | 11,351 | – | $100,000 | $– |
| Net increase (decrease) | 11,351 | – | $100,000 | $– |
(a) Share transactions for Class Z are for the period October 2, 2018 (commencement of sale of shares) to October 31, 2018
11. Other.
The Fund's organizational documents provide former and current trustees and officers with a limited indemnification against liabilities arising in connection with the performance of their duties to the Fund. In the normal course of business, the Fund may also enter into contracts that provide general indemnifications. The Fund's maximum exposure under these arrangements is unknown as this would be dependent on future claims that may be made against the Fund. The risk of material loss from such claims is considered remote.
At the end of the period, Strategic Advisers Fidelity International Fund, VIP FundsManager 50% Portfolio and VIP FundsManager 60% Portfolio were the owners of record of approximately 45%, 11% and 13%, respectively, of the total outstanding shares of the Fund. Mutual funds managed by the investment adviser or its affiliates were the owners of record, in the aggregate, of approximately 75% of the total outstanding shares of the Fund.
Report of Independent Registered Public Accounting Firm
To the Trustees of Fidelity Investment Trust and Shareholders of Fidelity International Value Fund:
Opinion on the Financial Statements and Financial Highlights
We have audited the accompanying statement of assets and liabilities of Fidelity International Value Fund (the "Fund"), a fund of Fidelity Investment Trust, including the schedule of investments, as of October 31, 2018, and the related statement of operations for the year then ended, the statement of changes in net assets for each of the two years in the period then ended, the financial highlights for each of the five years in the period then ended, and the related notes. In our opinion, the financial statements and financial highlights present fairly, in all material respects, the financial position of the Fund as of October 31, 2018, and the results of its operations for the year then ended, the changes in its net assets for each of the two years in the period then ended, and the financial highlights for each of the five years in the period then ended, in conformity with accounting principles generally accepted in the United States of America.
Basis for Opinion
These financial statements and financial highlights are the responsibility of the Fund's management. Our responsibility is to express an opinion on the Fund's financial statements and financial highlights based on our audits. We are a public accounting firm registered with the Public Company Accounting Oversight Board (United States) (PCAOB) and are required to be independent with respect to the Fund in accordance with the U.S. federal securities laws and the applicable rules and regulations of the Securities and Exchange Commission and the PCAOB.
We conducted our audits in accordance with the standards of the PCAOB. Those standards require that we plan and perform the audit to obtain reasonable assurance about whether the financial statements and financial highlights are free of material misstatement, whether due to error or fraud. The Fund is not required to have, nor were we engaged to perform, an audit of its internal control over financial reporting. As part of our audits we are required to obtain an understanding of internal control over financial reporting but not for the purpose of expressing an opinion on the effectiveness of the Fund’s internal control over financial reporting. Accordingly, we express no such opinion.
Our audits included performing procedures to assess the risks of material misstatement of the financial statements and financial highlights, whether due to error or fraud, and performing procedures that respond to those risks. Such procedures included examining, on a test basis, evidence regarding the amounts and disclosures in the financial statements and financial highlights. Our audits also included evaluating the accounting principles used and significant estimates made by management, as well as evaluating the overall presentation of the financial statements and financial highlights. Our procedures included confirmation of securities owned as of October 31, 2018, by correspondence with the custodians and brokers; when replies were not received from brokers, we performed other auditing procedures. We believe that our audits provide a reasonable basis for our opinion.
/s/ Deloitte & Touche LLP
Boston, Massachusetts
December 13, 2018
We have served as the auditor of one or more of the Fidelity investment companies since 1999.
Trustees and Officers
The Trustees, Members of the Advisory Board (if any), and officers of the trust and fund, as applicable, are listed below. The Board of Trustees governs the fund and is responsible for protecting the interests of shareholders. The Trustees are experienced executives who meet periodically throughout the year to oversee the fund's activities, review contractual arrangements with companies that provide services to the fund, oversee management of the risks associated with such activities and contractual arrangements, and review the fund's performance. Except for Jonathan Chiel, each of the Trustees oversees 283 funds. Mr. Chiel oversees 154 funds.
The Trustees hold office without limit in time except that (a) any Trustee may resign; (b) any Trustee may be removed by written instrument, signed by at least two-thirds of the number of Trustees prior to such removal; (c) any Trustee who requests to be retired or who has become incapacitated by illness or injury may be retired by written instrument signed by a majority of the other Trustees; and (d) any Trustee may be removed at any special meeting of shareholders by a two-thirds vote of the outstanding voting securities of the trust. Each Trustee who is not an interested person (as defined in the 1940 Act) of the trust and the fund is referred to herein as an Independent Trustee. Each Independent Trustee shall retire not later than the last day of the calendar year in which his or her 75th birthday occurs. The Independent Trustees may waive this mandatory retirement age policy with respect to individual Trustees. Officers and Advisory Board Members hold office without limit in time, except that any officer or Advisory Board Member may resign or may be removed by a vote of a majority of the Trustees at any regular meeting or any special meeting of the Trustees. Except as indicated, each individual has held the office shown or other offices in the same company for the past five years.
The fund’s Statement of Additional Information (SAI) includes more information about the Trustees. To request a free copy, call Fidelity at 1-800-544-8544.
Experience, Skills, Attributes, and Qualifications of the Trustees. The Governance and Nominating Committee has adopted a statement of policy that describes the experience, qualifications, attributes, and skills that are necessary and desirable for potential Independent Trustee candidates (Statement of Policy). The Board believes that each Trustee satisfied at the time he or she was initially elected or appointed a Trustee, and continues to satisfy, the standards contemplated by the Statement of Policy. The Governance and Nominating Committee also engages professional search firms to help identify potential Independent Trustee candidates who have the experience, qualifications, attributes, and skills consistent with the Statement of Policy. From time to time, additional criteria based on the composition and skills of the current Independent Trustees, as well as experience or skills that may be appropriate in light of future changes to board composition, business conditions, and regulatory or other developments, have also been considered by the professional search firms and the Governance and Nominating Committee. In addition, the Board takes into account the Trustees' commitment and participation in Board and committee meetings, as well as their leadership of standing and ad hoc committees throughout their tenure.
In determining that a particular Trustee was and continues to be qualified to serve as a Trustee, the Board has considered a variety of criteria, none of which, in isolation, was controlling. The Board believes that, collectively, the Trustees have balanced and diverse experience, qualifications, attributes, and skills, which allow the Board to operate effectively in governing the fund and protecting the interests of shareholders. Information about the specific experience, skills, attributes, and qualifications of each Trustee, which in each case led to the Board's conclusion that the Trustee should serve (or continue to serve) as a trustee of the fund, is provided below.
Board Structure and Oversight Function. James C. Curvey is an interested person and currently serves as Chairman. The Trustees have determined that an interested Chairman is appropriate and benefits shareholders because an interested Chairman has a personal and professional stake in the quality and continuity of services provided to the fund. Independent Trustees exercise their informed business judgment to appoint an individual of their choosing to serve as Chairman, regardless of whether the Trustee happens to be independent or a member of management. The Independent Trustees have determined that they can act independently and effectively without having an Independent Trustee serve as Chairman and that a key structural component for assuring that they are in a position to do so is for the Independent Trustees to constitute a substantial majority for the Board. The Independent Trustees also regularly meet in executive session. Ned C. Lautenbach serves as Chairman of the Independent Trustees and as such (i) acts as a liaison between the Independent Trustees and management with respect to matters important to the Independent Trustees and (ii) with management prepares agendas for Board meetings.
Fidelity® funds are overseen by different Boards of Trustees. The fund's Board oversees Fidelity's high income and certain equity funds, and other Boards oversee Fidelity's investment-grade bond, money market, asset allocation, and other equity funds. The asset allocation funds may invest in Fidelity® funds overseen by the fund's Board. The use of separate Boards, each with its own committee structure, allows the Trustees of each group of Fidelity® funds to focus on the unique issues of the funds they oversee, including common research, investment, and operational issues. On occasion, the separate Boards establish joint committees to address issues of overlapping consequences for the Fidelity® funds overseen by each Board.
The Trustees operate using a system of committees to facilitate the timely and efficient consideration of all matters of importance to the Trustees, the fund, and fund shareholders and to facilitate compliance with legal and regulatory requirements and oversight of the fund's activities and associated risks. The Board, acting through its committees, has charged FMR and its affiliates with (i) identifying events or circumstances the occurrence of which could have demonstrably adverse effects on the fund's business and/or reputation; (ii) implementing processes and controls to lessen the possibility that such events or circumstances occur or to mitigate the effects of such events or circumstances if they do occur; and (iii) creating and maintaining a system designed to evaluate continuously business and market conditions in order to facilitate the identification and implementation processes described in (i) and (ii) above. Because the day-to-day operations and activities of the fund are carried out by or through FMR, its affiliates, and other service providers, the fund's exposure to risks is mitigated but not eliminated by the processes overseen by the Trustees. While each of the Board's committees has responsibility for overseeing different aspects of the fund's activities, oversight is exercised primarily through the Operations, Audit, and Compliance Committees. In addition, the Independent Trustees have worked with Fidelity to enhance the Board's oversight of investment and financial risks, legal and regulatory risks, technology risks, and operational risks, including the development of additional risk reporting to the Board. Appropriate personnel, including but not limited to the fund's Chief Compliance Officer (CCO), FMR's internal auditor, the independent accountants, the fund's Treasurer and portfolio management personnel, make periodic reports to the Board's committees, as appropriate, including an annual review of Fidelity's risk management program for the Fidelity® funds. The responsibilities of each standing committee, including their oversight responsibilities, are described further under "Standing Committees of the Trustees."
Interested Trustees*:
Correspondence intended for a Trustee who is an interested person may be sent to Fidelity Investments, 245 Summer Street, Boston, Massachusetts 02210.
Name, Year of Birth; Principal Occupations and Other Relevant Experience+
Jonathan Chiel (1957)
Year of Election or Appointment: 2016
Trustee
Mr. Chiel also serves as Trustee of other Fidelity® funds. Mr. Chiel is Executive Vice President and General Counsel for FMR LLC (diversified financial services company, 2012-present). Previously, Mr. Chiel served as general counsel (2004-2012) and senior vice president and deputy general counsel (2000-2004) for John Hancock Financial Services; a partner with Choate, Hall & Stewart (1996-2000) (law firm); and an Assistant United States Attorney for the United States Attorney’s Office of the District of Massachusetts (1986-95), including Chief of the Criminal Division (1993-1995). Mr. Chiel is a director on the boards of the Boston Bar Foundation and the Maimonides School.
James C. Curvey (1935)
Year of Election or Appointment: 2007
Trustee
Chairman of the Board of Trustees
Mr. Curvey also serves as Trustee of other Fidelity® funds. Mr. Curvey is Vice Chairman (2007-present) and Director of FMR LLC (diversified financial services company). In addition, Mr. Curvey is an Overseer Emeritus for the Boston Symphony Orchestra, a Director of Artis-Naples, and a Trustee of Brewster Academy in Wolfeboro, New Hampshire. Previously, Mr. Curvey served as a Director of Fidelity Research & Analysis Co. (investment adviser firm, 2009-2018), Director of Fidelity Investments Money Management, Inc. (investment adviser firm, 2009-2014) and a Director of FMR and FMR Co., Inc. (investment adviser firms, 2007-2014).
Charles S. Morrison (1960)
Year of Election or Appointment: 2014
Trustee
Mr. Morrison also serves as Trustee of other funds. He serves as President of Fidelity SelectCo, LLC (investment adviser firm, 2017-present) and Fidelity Management & Research Company (FMR) (investment adviser firm, 2016-present), a Director of Fidelity Investments Money Management, Inc. (FIMM) (investment adviser firm, 2014-present), Director of Fidelity SelectCo, LLC (investment adviser firm, 2014-present), President, Asset Management (2014-present), and is an employee of Fidelity Investments. Previously, Mr. Morrison served as Vice President of Fidelity's Fixed Income and Asset Allocation Funds (2012-2014), President, Fixed Income (2011-2014), Vice President of Fidelity's Money Market Funds (2005-2009), President, Money Market Group Leader of FMR (investment adviser firm, 2009), and Senior Vice President, Money Market Group of FMR (2004-2009). Mr. Morrison also served as Vice President of Fidelity's Bond Funds (2002-2005), certain Balanced Funds (2002-2005), and certain Asset Allocation Funds (2002-2007), and as Senior Vice President (2002-2005) of Fidelity's Bond Division.
* Determined to be an “Interested Trustee” by virtue of, among other things, his or her affiliation with the trust or various entities under common control with FMR.
+ The information includes the Trustee's principal occupation during the last five years and other information relating to the experience, attributes, and skills relevant to the Trustee's qualifications to serve as a Trustee, which led to the conclusion that the Trustee should serve as a Trustee for the fund.
Independent Trustees:
Correspondence intended for an Independent Trustee may be sent to Fidelity Investments, P.O. Box 55235, Boston, Massachusetts 02205-5235.
Name, Year of Birth; Principal Occupations and Other Relevant Experience+
Dennis J. Dirks (1948)
Year of Election or Appointment: 2005
Trustee
Mr. Dirks also serves as Trustee of other Fidelity® funds. Prior to his retirement in May 2003, Mr. Dirks was Chief Operating Officer and a member of the Board of The Depository Trust & Clearing Corporation (DTCC). He also served as President, Chief Operating Officer, and Board member of The Depository Trust Company (DTC) and President and Board member of the National Securities Clearing Corporation (NSCC). In addition, Mr. Dirks served as Chief Executive Officer and Board member of the Government Securities Clearing Corporation, Chief Executive Officer and Board member of the Mortgage-Backed Securities Clearing Corporation, as a Trustee and a member of the Finance Committee of Manhattan College (2005-2008), as a Trustee and a member of the Finance Committee of AHRC of Nassau County (2006-2008), as a member of the Independent Directors Council (IDC) Governing Council (2010-2015), and as a member of the Board of Directors for The Brookville Center for Children’s Services, Inc. (2009-2017). Mr. Dirks is a member of the Finance Committee (2016-present), Board of Directors (2017-present) and Board of Trustees (2018-present) and is Treasurer (2018-present) of the Asolo Repertory Theatre.
Donald F. Donahue (1950)
Year of Election or Appointment: 2018
Trustee
Mr. Donahue also serves as a Trustee of other Fidelity® funds. Mr. Donahue is President and Chief Executive Officer of Miranda Partners, LLC (risk consulting for the financial services industry, 2012-present). Previously, Mr. Donahue served as a Member of the Advisory Board of certain Fidelity® funds (2015-2018) and Chief Executive Officer (2006-2012), Chief Operating Officer (2003-2006), and Managing Director, Customer Marketing and Development (1999-2003) of The Depository Trust & Clearing Corporation (financial markets infrastructure). Mr. Donahue serves as a Member (2007-present) and Co-Chairman (2016-present) of the Board of Directors of United Way of New York, Member of the Board of Directors of NYC Leadership Academy (2012-present) and Member of the Board of Advisors of Ripple Labs, Inc. (financial services, 2015-present). He also served as Chairman (2010-2012) and Member of the Board of Directors (2012-2013) of Omgeo, LLC (financial services), Treasurer of United Way of New York (2012-2016), and Member of the Board of Directors of XBRL US (financial services non-profit, 2009-2012) and the International Securities Services Association (2009-2012).
Alan J. Lacy (1953)
Year of Election or Appointment: 2008
Trustee
Mr. Lacy also serves as Trustee of other Fidelity® funds. Mr. Lacy serves as a Director of Bristol-Myers Squibb Company (global pharmaceuticals, 2008-present). He is a Trustee of the California Chapter of The Nature Conservancy (2015-present) and a Director of the Center for Advanced Study in the Behavioral Sciences at Stanford University (2015-present). In addition, Mr. Lacy served as Senior Adviser (2007-2014) of Oak Hill Capital Partners, L.P. (private equity) and also served as Chief Executive Officer (2005) and Vice Chairman (2005-2006) of Sears Holdings Corporation (retail) and Chief Executive Officer and Chairman of the Board of Sears, Roebuck and Co. (retail, 2000-2005). Previously, Mr. Lacy served as Chairman (2014-2017) and a member (2010-2017) of the Board of Directors of Dave & Buster’s Entertainment, Inc. (restaurant and entertainment complexes), as Chairman (2008-2011) and a member (2006-2015) of the Board of Trustees of the National Parks Conservation Association, and as a member of the Board of Directors for The Hillman Companies, Inc. (hardware wholesalers, 2010-2014), Earth Fare, Inc. (retail grocery, 2010-2014), and The Western Union Company (global money transfer, 2006-2011).
Ned C. Lautenbach (1944)
Year of Election or Appointment: 2000
Trustee
Chairman of the Independent Trustees
Mr. Lautenbach also serves as Trustee of other Fidelity® funds. Mr. Lautenbach currently serves as Vice Chair of the Board of Governors, State University System of Florida (2013-present) and is a member of the Council on Foreign Relations (1994-present). He is also a member and has most recently served as Chairman of the Board of Directors of Artis-Naples (2012-present). Previously, Mr. Lautenbach served as a member and then Lead Director of the Board of Directors of Eaton Corporation (diversified industrial, 1997-2016). He was also a Partner and Advisory Partner at Clayton, Dubilier & Rice, LLC (private equity investment, 1998-2010), as well as a Director of Sony Corporation (2006-2007). In addition, Mr. Lautenbach also had a 30-year career with IBM (technology company) during which time he served as Senior Vice President and a member of the Corporate Executive Committee (1968-1998).
Joseph Mauriello (1944)
Year of Election or Appointment: 2008
Trustee
Mr. Mauriello also serves as Trustee of other Fidelity® funds. Prior to his retirement in January 2006, Mr. Mauriello served in numerous senior management positions including Deputy Chairman and Chief Operating Officer (2004-2005), and Vice Chairman of Financial Services (2002-2004) of KPMG LLP US (professional services, 1965-2005). Mr. Mauriello currently serves as a member of the Independent Directors Council (IDC) Governing Council (2015-present). Previously, Mr. Mauriello served as a member of the Board of Directors of XL Group plc. (global insurance and re-insurance, 2006-2018).
Cornelia M. Small (1944)
Year of Election or Appointment: 2005
Trustee
Ms. Small also serves as Trustee of other Fidelity® funds. Ms. Small is a member of the Board of Directors (2009-present) and Chair of the Investment Committee (2010-present) of the Teagle Foundation. Ms. Small also serves on the Investment Committee of the Berkshire Taconic Community Foundation (2008-present). Previously, Ms. Small served as Chairperson (2002-2008) and a member of the Investment Committee and Chairperson (2008-2012) and a member of the Board of Trustees of Smith College. In addition, Ms. Small served as Chief Investment Officer, Director of Global Equity Investments, and a member of the Board of Directors of Scudder, Stevens & Clark and Scudder Kemper Investments.
Garnett A. Smith (1947)
Year of Election or Appointment: 2018
Trustee
Mr. Smith also serves as Trustee of other Fidelity® funds. Prior to Mr. Smith's retirement, he served as Chairman and Chief Executive Officer of Inbrand Corp. (manufacturer of personal absorbent products, 1990-1997). He also served as President (1986-1990) of Inbrand Corp. Prior to his employment with Inbrand Corp., he was employed by a retail fabric chain and North Carolina National Bank. In addition, Mr. Smith served as a Member of the Advisory Board of certain Fidelity® funds (2012-2013) and as a board member of the Jackson Hole Land Trust (2009-2012).
David M. Thomas (1949)
Year of Election or Appointment: 2008
Trustee
Mr. Thomas also serves as Trustee of other Fidelity® funds. Mr. Thomas serves as Non-Executive Chairman of the Board of Directors of Fortune Brands Home and Security (home and security products, 2011-present), as a member of the Board of Directors (2004-present) and Presiding Director (2013-present) of Interpublic Group of Companies, Inc. (marketing communication), and as a member of the Board of Trustees of the University of Florida (2013-present). Previously, Mr. Thomas served as Executive Chairman (2005-2006) and Chairman and Chief Executive Officer (2000-2005) of IMS Health, Inc. (pharmaceutical and healthcare information solutions), and a Director of Fortune Brands, Inc. (consumer products, 2000-2011).
+ The information includes the Trustee's principal occupation during the last five years and other information relating to the experience, attributes, and skills relevant to the Trustee's qualifications to serve as a Trustee, which led to the conclusion that the Trustee should serve as a Trustee for the fund.
Advisory Board Members and Officers:
Correspondence intended for a Member of the Advisory Board (if any) may be sent to Fidelity Investments, P.O. Box 55235, Boston, Massachusetts 02205-5235. Correspondence intended for an officer or Peter S. Lynch may be sent to Fidelity Investments, 245 Summer Street, Boston, Massachusetts 02210. Officers appear below in alphabetical order.
Name, Year of Birth; Principal Occupation
Vicki L. Fuller (1957)
Year of Election or Appointment: 2018
Member of the Advisory Board
Ms. Fuller also serves as Member of the Advisory Board of other Fidelity® funds. Ms. Fuller serves as a member of the Board of Directors, Audit Committee, and Nominating and Governance Committee of The Williams Companies, Inc. (natural gas infrastructure, 2018-present). Previously, Ms. Fuller served as the Chief Investment Officer of the New York State Common Retirement Fund (2012-2018) and held a variety of positions at AllianceBernstein L.P. (global asset management, 1985-2012), including Managing Director (2006-2012) and Senior Vice President and Senior Portfolio Manager (2001-2006).
Peter S. Lynch (1944)
Year of Election or Appointment: 2003
Member of the Advisory Board
Mr. Lynch also serves as Member of the Advisory Board of other Fidelity® funds. Mr. Lynch is Vice Chairman and a Director of FMR (investment adviser firm) and FMR Co., Inc. (investment adviser firm). In addition, Mr. Lynch serves as a Trustee of Boston College and as the Chairman of the Inner-City Scholarship Fund. Previously, Mr. Lynch served on the Special Olympics International Board of Directors (1997-2006).
William S. Stavropoulos (1939)
Year of Election or Appointment: 2018
Member of the Advisory Board
Mr. Stavropoulos also serves as Member of the Advisory Board of other Fidelity® funds. Mr. Stavropoulos serves as President and Founder of the Michigan Baseball Foundation, the Great Lakes Loons (2007-present). Mr. Stavropoulos is Chairman Emeritus of the Board of Directors of The Dow Chemical Company, where he previously served in numerous senior management positions, including President, CEO (1995-2000; 2002-2004), Chairman of the Executive Committee (2000-2006), and as a member of the Board of Directors (1990-2006). Currently, Mr. Stavropoulos is Chairman of the Board of Directors of Univar Inc. (global distributor of commodity and specialty chemicals), a Director of Teradata Corporation (data warehousing and technology solutions), and a member of the Advisory Board for Metalmark Capital LLC (private equity investment, 2005-present). Mr. Stavropoulos is an operating advisor to Clayton, Dubilier & Rice, LLC (private equity investment). In addition, Mr. Stavropoulos is a member of the University of Notre Dame Advisory Council for the College of Science, a Trustee of the Rollin L. Gerstacker Foundation, and a Director of Artis-Naples in Naples, Florida. Previously, Mr. Stavropoulos served as Trustee of certain Fidelity® funds (2001-2018) and as a Director of Chemical Financial Corporation (bank holding company, 1993-2012) and Tyco International, Ltd. (multinational manufacturing and services, 2007-2012).
Carol B. Tomé (1957)
Year of Election or Appointment: 2018
Member of the Advisory Board
Ms. Tomé also serves as Member of the Advisory Board of other Fidelity® funds. Ms. Tomé is Chief Financial Officer (2001-present) and Executive Vice President of Corporate Services (2007-present) of The Home Depot, Inc. (home improvement retailer) and a Director (2003-present) and Chair of the Audit Committee (2004-present) of United Parcel Service, Inc. (package delivery and supply chain management). Previously, Ms. Tomé served as Trustee of certain Fidelity® funds (2017), Senior Vice President of Finance and Accounting/Treasurer (2000-2007) and Vice President and Treasurer (1995-2000) of The Home Depot, Inc. and Chair of the Board (2010-2012), Vice Chair of the Board (2009 and 2013), and a Director (2008-2013) of the Federal Reserve Bank of Atlanta. Ms. Tomé is also a director or trustee of many community and professional organizations.
Michael E. Wiley (1950)
Year of Election or Appointment: 2018
Member of the Advisory Board
Mr. Wiley also serves as Trustee or Member of the Advisory Board of other Fidelity® funds. Mr. Wiley serves as a Director of High Point Resources (exploration and production, 2005-present). Previously, Mr. Wiley served as a Director of Andeavor Corporation (independent oil refiner and marketer, 2005-2018), a Director of Andeavor Logistics LP (natural resources logistics, 2015-2018), a Director of Post Oak Bank (privately-held bank, 2004-2018), a Director of Asia Pacific Exploration Consolidated (international oil and gas exploration and production, 2008-2013), a member of the Board of Trustees of the University of Tulsa (2000-2006; 2007-2010), a Senior Energy Advisor of Katzenbach Partners, LLC (consulting, 2006-2007), an Advisory Director of Riverstone Holdings (private investment), a Director of Spinnaker Exploration Company (exploration and production, 2001-2005) and Chairman, President, and CEO of Baker Hughes, Inc. (oilfield services, 2000-2004).
Elizabeth Paige Baumann (1968)
Year of Election or Appointment: 2017
Anti-Money Laundering (AML) Officer
Ms. Baumann also serves as AML Officer of other funds. She is Chief AML Officer (2012-present) and Senior Vice President (2014-present) of FMR LLC (diversified financial services company) and is an employee of Fidelity Investments. Previously, Ms. Baumann served as AML Officer of the funds (2012-2016), and Vice President (2007-2014) and Deputy Anti-Money Laundering Officer (2007-2012) of FMR LLC.
John J. Burke III (1964)
Year of Election or Appointment: 2018
Chief Financial Officer
Mr. Burke also serves as Chief Financial Officer of other funds. Mr. Burke serves as Head of Investment Operations for Fidelity Fund and Investment Operations (2018-present) and is an employee of Fidelity Investments (1998-present). Previously Mr. Burke served as head of Asset Management Investment Operations (2012-2018).
William C. Coffey (1969)
Year of Election or Appointment: 2018
Secretary and Chief Legal Officer (CLO)
Mr. Coffey also serves as Secretary and CLO of other funds. Mr. Coffey serves as CLO, Secretary, and Senior Vice President of Fidelity Management & Research Company and FMR Co., Inc. (investment adviser firms, 2018-present); Secretary of Fidelity SelectCo, LLC and Fidelity Investments Money Management, Inc. (investment adviser firms, 2018-present); and CLO of Fidelity Management & Research (Hong Kong) Limited, FMR Investment Management (UK) Limited, and Fidelity Management & Research (Japan) Limited (investment adviser firms, 2018-present). He is Senior Vice President and Deputy General Counsel of FMR LLC (diversified financial services company, 2010-present), and is an employee of Fidelity Investments. Previously, Mr. Coffey served as Assistant Secretary of certain funds (2009-2018) and as Vice President and Associate General Counsel of FMR LLC (2005-2009).
Timothy M. Cohen (1969)
Year of Election or Appointment: 2018
Vice President
Mr. Cohen also serves as Vice President of other funds. Mr. Cohen serves as Co-Head of Global Equity Research (2016-present), a Director of Fidelity Management & Research (Japan) Limited (investment adviser firm, 2016-present), and is an employee of Fidelity Investments. Previously, Mr. Cohen served as Chief Investment Officer - Equity and a Director of Fidelity Management & Research (U.K.) Inc. (investment adviser firm, 2013-2015) and as a Director of Fidelity Management & Research (Hong Kong) Limited (investment adviser firm, 2017).
Jonathan Davis (1968)
Year of Election or Appointment: 2010
Assistant Treasurer
Mr. Davis also serves as Assistant Treasurer of other funds. Mr. Davis serves as Assistant Treasurer of FMR Capital, Inc. (2017-present) and is an employee of Fidelity Investments. Previously, Mr. Davis served as Vice President and Associate General Counsel of FMR LLC (diversified financial services company, 2003-2010).
Adrien E. Deberghes (1967)
Year of Election or Appointment: 2016
Assistant Treasurer
Mr. Deberghes also serves as an officer of other funds. He serves as Assistant Treasurer of FMR Capital, Inc. (2017-present), Executive Vice President of Fidelity Investments Money Management, Inc. (FIMM) (investment adviser firm, 2016-present), and is an employee of Fidelity Investments (2008-present). Previously, Mr. Deberghes served as President and Treasurer of certain Fidelity® funds (2013-2018). Prior to joining Fidelity Investments, Mr. Deberghes was Senior Vice President of Mutual Fund Administration at State Street Corporation (2007-2008), Senior Director of Mutual Fund Administration at Investors Bank & Trust (2005-2007), and Director of Finance for Dunkin' Brands (2000-2005). Previously, Mr. Deberghes served in other fund officer roles.
Laura M. Del Prato (1964)
Year of Election or Appointment: 2018
Assistant Treasurer
Ms. Del Prato also serves as an officer of other funds. Ms. Del Prato is an employee of Fidelity Investments (2017-present). Prior to joining Fidelity Investments, Ms. Del Prato served as a Managing Director and Treasurer of the JPMorgan Mutual Funds (2014-2017). Prior to JPMorgan, Ms. Del Prato served as a partner at Cohen Fund Audit Services (accounting firm, 2012-2013) and KPMG LLP (accounting firm, 2004-2012).
Colm A. Hogan (1973)
Year of Election or Appointment: 2016
Deputy Treasurer
Mr. Hogan also serves as an officer of other funds. Mr. Hogan serves as Assistant Treasurer of FMR Capital, Inc. (2017-present) and is an employee of Fidelity Investments (2005-present). Previously, Mr. Hogan served as Assistant Treasurer of certain Fidelity® funds (2016-2018).
Pamela R. Holding (1964)
Year of Election or Appointment: 2018
Vice President
Ms. Holding also serves as Vice President of other funds. Ms. Holding serves as Co-Head of Global Equity Research (2018-present) and is an employee of Fidelity Investments (2013-present).
Chris Maher (1972)
Year of Election or Appointment: 2013
Assistant Treasurer
Mr. Maher serves as Assistant Treasurer of other funds. Mr. Maher is Vice President of Valuation Oversight, serves as Assistant Treasurer of FMR Capital, Inc. (2017-present), and is an employee of Fidelity Investments. Previously, Mr. Maher served as Vice President of Asset Management Compliance (2013), Vice President of the Program Management Group of FMR (investment adviser firm, 2010-2013), and Vice President of Valuation Oversight (2008-2010).
Rieco E. Mello (1969)
Year of Election or Appointment: 2017
Assistant Treasurer
Mr. Mello also serves as Assistant Treasurer of other funds. Mr. Mello serves as Assistant Treasurer of FMR Capital, Inc. (2017-present) and is an employee of Fidelity Investments (1995-present).
Kenneth B. Robins (1969)
Year of Election or Appointment: 2016
Chief Compliance Officer
Mr. Robins also serves as an officer of other funds. Mr. Robins serves as Compliance Officer of Fidelity Management & Research Company and FMR Co., Inc. (investment adviser firms, 2016-present) and is an employee of Fidelity Investments (2004-present). Previously, Mr. Robins served as Executive Vice President of Fidelity Investments Money Management, Inc. (investment adviser firm, 2013-2016) and served in other fund officer roles.
Stacie M. Smith (1974)
Year of Election or Appointment: 2016
President and Treasurer
Ms. Smith also serves as an officer of other funds. Ms. Smith serves as Assistant Treasurer of FMR Capital, Inc. (2017-present), is an employee of Fidelity Investments (2009-present), and has served in other fund officer roles. Prior to joining Fidelity Investments, Ms. Smith served as Senior Audit Manager of Ernst & Young LLP (accounting firm, 1996-2009). Previously, Ms. Smith served as Assistant Treasurer (2013-2018) and Deputy Treasurer (2013-2016) of certain Fidelity® funds.
Marc L. Spector (1972)
Year of Election or Appointment: 2016
Assistant Treasurer
Mr. Spector also serves as an officer of other funds. Mr. Spector serves as Assistant Treasurer of FMR Capital, Inc. (2017-present) and is an employee of Fidelity Investments (2016-present). Prior to joining Fidelity Investments, Mr. Spector served as Director at the Siegfried Group (accounting firm, 2013-2016), and prior to Siegfried Group as audit senior manager at Deloitte & Touche (accounting firm, 2005-2013).
Shareholder Expense Example
As a shareholder of the Fund, you incur two types of costs: (1) transaction costs, including sales charges (loads) on purchase payments or redemption proceeds, redemption fees and (2) ongoing costs, including management fees, distribution and/or service (12b-1) fees and other Fund expenses. This Example is intended to help you understand your ongoing costs (in dollars) of investing in the Fund and to compare these costs with the ongoing costs of investing in other mutual funds.
The actual expense Example is based on an investment of $1,000 invested at the beginning of the period and held for the entire period (May 1, 2018 to October 31, 2018) for Class A, Class M, Class C, International Value and Class I, and for the period (October 2, 2018 to October 31, 2018) for Class Z. The hypothetical expense Example is based on an investment of $1,000 invested for one-half year period (May 1, 2018 to October 31, 2018)
Actual Expenses
The first line of the accompanying table for each class of the Fund provides information about actual account values and actual expenses. You may use the information in this line, together with the amount you invested, to estimate the expenses that you paid over the period. Simply divide your account value by $1,000.00 (for example, an $8,600 account value divided by $1,000.00 = 8.6), then multiply the result by the number in the first line for a class of the Fund under the heading entitled "Expenses Paid During Period" to estimate the expenses you paid on your account during this period. A small balance maintenance fee of $12.00 that is charged once a year may apply for certain accounts with a value of less than $2,000. This fee, which was eliminated effective August 1, 2018, is not included in the table below. If it was, the estimate of expenses you paid during the period would be higher, and your ending account value lower, by this amount. In addition, the Fund, as a shareholder in the underlying Fidelity Central Funds, will indirectly bear its pro-rata share of the fees and expenses incurred by the underlying Fidelity Central Funds. These fees and expenses are not included in the Fund's annualized expense ratio used to calculate the expense estimate in the table below.
Hypothetical Example for Comparison Purposes
The second line of the accompanying table for each class of the Fund provides information about hypothetical account values and hypothetical expenses based on a Class' actual expense ratio and an assumed rate of return of 5% per year before expenses, which is not the Class' actual return. The hypothetical account values and expenses may not be used to estimate the actual ending account balance or expenses you paid for the period. You may use this information to compare the ongoing costs of investing in the Fund and other funds. To do so, compare this 5% hypothetical example with the 5% hypothetical examples that appear in the shareholder reports of the other funds. A small balance maintenance fee of $12.00 that is charged once a year may apply for certain accounts with a value of less than $2,000. This fee, which was eliminated effective August 1, 2018, is not included in the table below. If it was, the estimate of expenses you paid during the period would be higher, and your ending account value lower, by this amount. In addition, the Fund, as a shareholder in the underlying Fidelity Central Funds, will indirectly bear its pro-rata share of the fees and expenses incurred by the underlying Fidelity Central Funds. These fees and expenses are not included in the Fund's annualized expense ratio used to calculate the expense estimate in the table below.
Please note that the expenses shown in the table are meant to highlight your ongoing costs only and do not reflect any transaction costs. Therefore, the second line of the table is useful in comparing ongoing costs only, and will not help you determine the relative total costs of owning different funds. In addition, if these transactional costs were included, your costs would have been higher.
| | Annualized Expense Ratio-A | Beginning
Account Value
| Ending
Account Value
| Expenses Paid
During Period
|
| Class A | 1.19% | | | |
| Actual | | $1,000.00 | $896.40 | $5.69-B |
| Hypothetical-C | | $1,000.00 | $1,019.21 | $6.06-D |
| Class M | 1.51% | | | |
| Actual | | $1,000.00 | $895.10 | $7.21-B |
| Hypothetical-C | | $1,000.00 | $1,017.59 | $7.68-D |
| Class C | 2.00% | | | |
| Actual | | $1,000.00 | $892.80 | $9.54-B |
| Hypothetical-C | | $1,000.00 | $1,015.12 | $10.16-D |
| International Value | .85% | | | |
| Actual | | $1,000.00 | $898.50 | $4.07-B |
| Hypothetical-C | | $1,000.00 | $1,020.92 | $4.33-D |
| Class I | .94% | | | |
| Actual | | $1,000.00 | $898.60 | $4.50-B |
| Hypothetical-C | | $1,000.00 | $1,020.47 | $4.79-D |
| Class Z | .85% | | | |
| Actual | | $1,000.00 | $924.00 | $.67-B |
| Hypothetical-C | | $1,000.00 | $1,020.92 | $4.33-D |
A Annualized expense ratio reflects expenses net of applicable fee waivers.
B Actual expenses are equal to each Class' annualized expense ratio, multiplied by the average account value over the period, multiplied by 184/365 (to reflect the one-half year period) for Class A, Class M, Class C, International Value and Class I, and multiplied by 30/365 (to reflect the period October 2, 2018 to October 31, 2018) for Class Z.
C 5% return per year before expenses
D Hypothetical expenses are equal to each Class' annualized expense ratio, multiplied by the average account value over the period, multiplied by 184/365 (to reflect the one-half year period).
Distributions (Unaudited)
Class A designates 2%, Class M designates 3%, Class C designates 5%, International Value designates 2%, and Class I designates 2% of the dividends distributed during the fiscal year as qualifying for the dividends–received deduction for corporate shareholders.
Class A designates 100%, Class M designates 100%, Class C designates 100%, International Value designates 96%, and Class I designates 100% of the dividends distributed during the fiscal year as amounts which may be taken into account as a dividend for purposes of the maximum rate under section 1(h)(11) of the Internal Revenue Code.
The amounts per share which represent income derived from sources within, and taxes paid to, foreign countries or possessions of the United States are as follows:
| | Pay Date | Income | Taxes |
| Class A | 12/11/2017 | $0.1246 | $0.0086 |
| Class M | 12/11/2017 | $0.0976 | $0.0086 |
| Class C | 12/11/2017 | $0.0646 | $0.0086 |
| International Value | 12/11/2017 | $0.1586 | $0.0086 |
| Class I | 12/11/2017 | $0.1486 | $0.0086 |
|
The fund will notify shareholders in January 2019 of amounts for use in preparing 2018 income tax returns.
Board Approval of Investment Advisory Contracts
Fidelity International Value Fund
At its July 2018 meeting, the Board of Trustees, including the Independent Trustees (together, the Board), voted to continue the management contract with Fidelity Management & Research Company (FMR) and the sub-advisory agreements (together, the Advisory Contracts) for the fund for six months through January 31, 2019, in connection with the reunification of the Fidelity Equity High Income Funds Board, which oversees the fund, and the Sector Portfolios Board.
The Board considered that the approval of the fund's Advisory Contracts will not result in any changes in (i) the investment process or strategies employed in the management of the fund's assets; (ii) the fees and expenses paid by shareholders; (iii) the nature, extent or quality of services provided under the fund's Advisory Contracts; or (iv) the day-to-day management of the fund or the persons primarily responsible for such management. The Board concluded that the fund's Advisory Contracts are fair and reasonable, and that the fund's Advisory Contracts should be renewed, without modification, through January 31, 2019, with the understanding that the Board will consider the annual renewal for a full one year period in January 2019.
In connection with its consideration of future renewals of the fund's Advisory Contracts, the Board will consider: (i) the nature, extent and quality of services provided to the fund, including shareholder and administrative services and investment performance; (ii) the competitiveness of the management fee and total expenses for the fund; (iii) the costs of the services and profitability, including the revenues earned and the expenses incurred in conducting the business of developing, marketing, distributing, managing, administering, and servicing the fund and its shareholders, to the extent applicable, as well as potential fall-out benefits from Fidelity's non-fund businesses; and (iv) whether there have been economies of scale in respect of the Fidelity funds, whether the Fidelity funds (including the fund) have appropriately benefited from any such economies of scale, and whether there is the potential for realization of any further economies.
Based on its evaluation of all of the conclusions noted above, and after considering all factors it believed relevant, the Board ultimately concluded that the fund's management fee structure is fair and reasonable, and that the continuation of the fund's Advisory Contracts should be approved.
Corporate Headquarters
245 Summer St.
Boston, MA 02210
www.fidelity.com
FIV-ANN-1218
1.827482.112
Fidelity Advisor® International Discovery Fund - Class A, Class M, Class C, Class I and Class Z
Annual Report October 31, 2018 Class A, Class M, Class C, Class I and Class Z are classes of Fidelity® International Discovery Fund |
|
Contents
To view a fund's proxy voting guidelines and proxy voting record for the 12-month period ended June 30, visit http://www.fidelity.com/proxyvotingresults or visit the Securities and Exchange Commission's (SEC) web site at http://www.sec.gov.
You may also call 1-877-208-0098 to request a free copy of the proxy voting guidelines.
Standard & Poor's, S&P and S&P 500 are registered service marks of The McGraw-Hill Companies, Inc. and have been licensed for use by Fidelity Distributors Corporation.
Other third-party marks appearing herein are the property of their respective owners.
All other marks appearing herein are registered or unregistered trademarks or service marks of FMR LLC or an affiliated company. © 2018 FMR LLC. All rights reserved.
This report and the financial statements contained herein are submitted for the general information of the shareholders of the Fund. This report is not authorized for distribution to prospective investors in the Fund unless preceded or accompanied by an effective prospectus.
A fund files its complete schedule of portfolio holdings with the SEC for the first and third quarters of each fiscal year on Form N-Q. Forms N-Q are available on the SEC’s web site at http://www.sec.gov. A fund's Forms N-Q may be reviewed and copied at the SEC’s Public Reference Room in Washington, DC. Information regarding the operation of the SEC's Public Reference Room may be obtained by calling 1-800-SEC-0330.
For a complete list of a fund's portfolio holdings, view the most recent holdings listing, semiannual report, or annual report on Fidelity's web site at http://www.fidelity.com, http://www.institutional.fidelity.com, or http://www.401k.com, as applicable.
NOT FDIC INSURED •MAY LOSE VALUE •NO BANK GUARANTEE
Neither the Fund nor Fidelity Distributors Corporation is a bank.
Performance: The Bottom Line
Average annual total return reflects the change in the value of an investment, assuming reinvestment of distributions from dividend income and capital gains (the profits earned upon the sale of securities that have grown in value, if any) and assuming a constant rate of performance each year. The hypothetical investment and the average annual total returns do not reflect the deduction of taxes that a shareholder would pay on fund distributions or the redemption of fund shares. During periods of reimbursement by Fidelity, a fund’s total return will be greater than it would be had the reimbursement not occurred. How a fund did yesterday is no guarantee of how it will do tomorrow.
Average Annual Total Returns
| For the periods ended October 31, 2018 | Past 1 year | Past 5 years | Past 10 years |
| Class A (incl. 5.75% sales charge) | (15.27)% | 0.84% | 6.37% |
| Class M (incl. 3.50% sales charge) | (13.45)% | 1.07% | 6.35% |
| Class C (incl. contingent deferred sales charge) | (11.66)% | 1.27% | 6.19% |
| Class I | (9.81)% | 2.38% | 7.36% |
| Class Z | (9.68)% | 2.52% | 7.44% |
Class C shares' contingent deferred sales charges included in the past one year, past five years and past ten years total return figures are 1%, 0% and 0%, respectively.
The initial offering of Class Z shares took place on August 13, 2013. Returns prior to August 13, 2013, are those of Class I.
$10,000 Over 10 Years
Let's say hypothetically that $10,000 was invested in Fidelity Advisor® International Discovery Fund - Class A on October 31, 2008, and the current 5.75% sales charge was paid.
The chart shows how the value of your investment would have changed, and also shows how the MSCI EAFE Index performed over the same period.
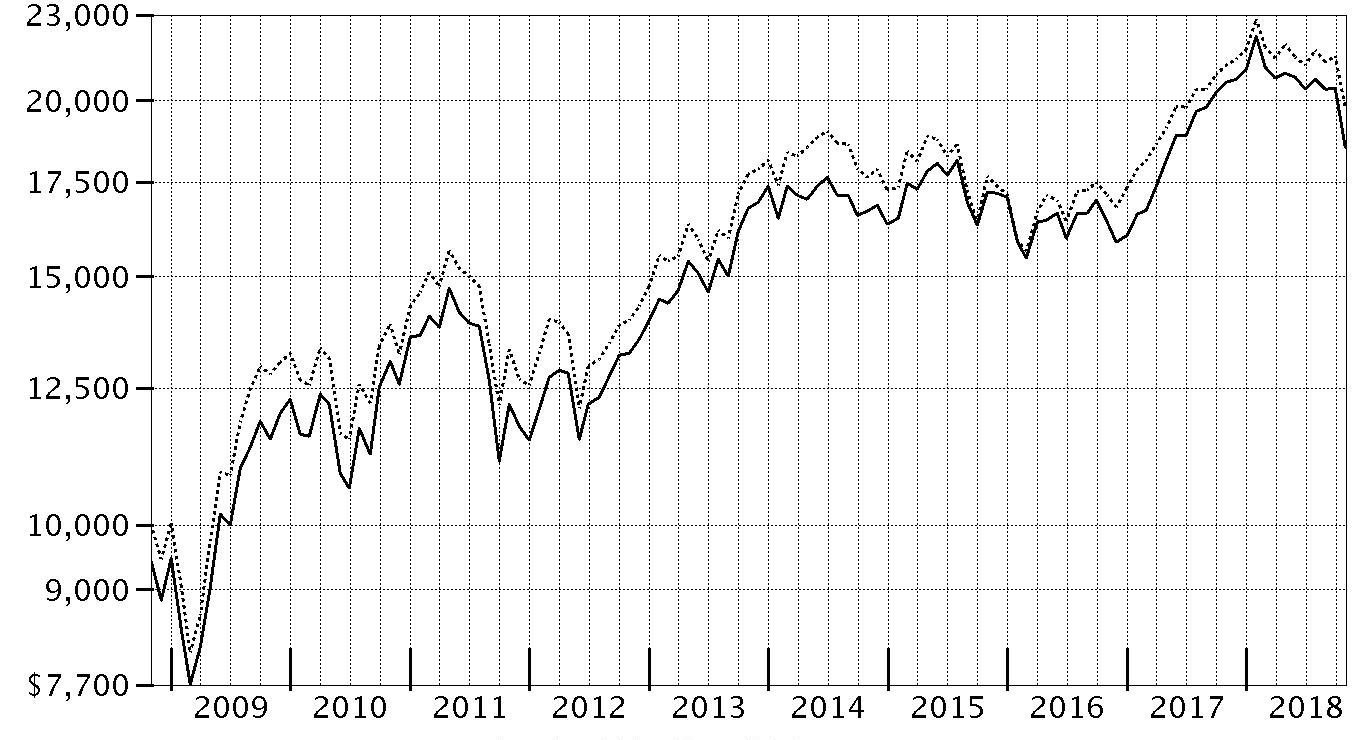
| Period Ending Values |
| $18,540 | Fidelity Advisor® International Discovery Fund - Class A |
| $19,780 | MSCI EAFE Index |
Management's Discussion of Fund Performance
Market Recap: International equities returned -8.08% for the 12 months ending October 31, 2018, according to the MSCI ACWI (All Country World Index) ex USA Index. A modestly positive first half of the period gave way to a confluence of overwhelmingly negative factors – including escalating trade tensions, a surging U.S. dollar, tepid economic growth in Europe, global central bank tightening, concerns about Italy’s budget stalemate with the EU, and weakness in China’s stock market – that yielded a -11% second-half return. The index lost 8% in October alone, its largest monthly drop in more than six years. Among sectors, new-media-infused communications services (-15%) was hit the hardest, while economically sensitive consumer discretionary (-13%), information technology (-12%), financials (-10%), industrials (-9%) and materials (-7%) stocks also fared poorly. Even the more defensive real estate (-9%), utilities (-6%) and consumer staples (-5%) sectors weren’t spared this period. Conversely, elevated crude-oil prices fueled a positive return for energy (+7%), the top-performing sector, followed by the relatively stable-growing health care segment (+2%). Regionally, emerging markets (-12%) fared the worst, hampered by the impact of foreign exchange and concerns about economic weakness in China, India and South Korea. Sluggish growth also pressured shares in continental Europe (-9%). Stocks in Japan (-3%) and the U.K. (-4%) held up better, followed by Canada (-5%) and Asia-Pacific ex Japan (-6%).
Comments from Portfolio Manager William Kennedy: For the fiscal year, the fund’s share classes (excluding sales charges, if applicable) returned roughly -10% to -11%, lagging the -6.65% return of the MSCI EAFE Index. Security selection, notably in the consumer staples and industrials sectors, detracted from relative performance. Geographically, positioning in emerging markets and stock picks in the U.K. and Japan caused the fund to lag the index. Individual disappointments included software company Micro Focus International and food and alcoholic drinks distributor Conviviality, both based in the U.K. Micro Focus’s shares returned -53% for the period because synergies from a recent acquisition have not materialized as fast as investors expected. Conviviality, a non-benchmark position, faced financial distress and went into bankruptcy. In Japan, an average overweighting in semiconductor manufacturer Renesas Electronics hurt, as excess industry capacity and weakening demand from end markets pressured the stock. We no longer owned Renesas at period end. Conversely, security selection in Europe Ex U.K., the U.S. and materials aided relative performance. Individual contributors included Norway-based exploration and production company Equinor (formerly Statoil), a top holding that gained from higher oil prices.
The views expressed above reflect those of the portfolio manager(s) only through the end of the period as stated on the cover of this report and do not necessarily represent the views of Fidelity or any other person in the Fidelity organization. Any such views are subject to change at any time based upon market or other conditions and Fidelity disclaims any responsibility to update such views. These views may not be relied on as investment advice and, because investment decisions for a Fidelity fund are based on numerous factors, may not be relied on as an indication of trading intent on behalf of any Fidelity fund.
Investment Summary (Unaudited)
Geographic Diversification (% of fund's net assets)
| As of October 31, 2018 |
| | Japan | 17.6% |
| | United Kingdom | 10.7% |
| | Germany | 10.2% |
| | United States of America* | 10.1% |
| | France | 8.7% |
| | Switzerland | 8.5% |
| | Netherlands | 5.2% |
| | Spain | 4.0% |
| | India | 3.1% |
| | Other | 21.9% |
* Includes Short-Term investments and Net Other Assets (Liabilities).
Percentages are based on country or territory of incorporation and are adjusted for the effect of futures contracts, if applicable.
Asset Allocation as of October 31, 2018
| | % of fund's net assets |
| Stocks and Equity Futures | 90.7 |
| Short-Term Investments and Net Other Assets (Liabilities) | 9.3 |
Top Ten Stocks as of October 31, 2018
| | % of fund's net assets |
| Total SA (France, Oil, Gas & Consumable Fuels) | 2.9 |
| Equinor ASA (Norway, Oil, Gas & Consumable Fuels) | 2.6 |
| Nestle SA (Reg. S) (Switzerland, Food Products) | 2.5 |
| Roche Holding AG (participation certificate) (Switzerland, Pharmaceuticals) | 2.1 |
| AstraZeneca PLC (United Kingdom) (United Kingdom, Pharmaceuticals) | 1.9 |
| SAP SE (Germany, Software) | 1.8 |
| ORIX Corp. (Japan, Diversified Financial Services) | 1.5 |
| Unilever NV (Certificaten Van Aandelen) (Bearer) (Netherlands, Personal Products) | 1.4 |
| Sony Corp. (Japan, Household Durables) | 1.4 |
| HDFC Bank Ltd. (India, Banks) | 1.4 |
| | 19.5 |
Top Market Sectors as of October 31, 2018
| | % of fund's net assets |
| Financials | 18.8 |
| Health Care | 13.3 |
| Industrials | 12.4 |
| Information Technology | 9.7 |
| Consumer Discretionary | 9.5 |
| Consumer Staples | 8.8 |
| Energy | 6.6 |
| Materials | 3.9 |
| Real Estate | 2.7 |
| Communication Services | 1.4 |
Schedule of Investments October 31, 2018
Showing Percentage of Net Assets
| Common Stocks - 87.1% | | | |
| | | Shares | Value (000s) |
| Australia - 1.2% | | | |
| Bapcor Ltd. | | 8,839,382 | $42,753 |
| Blue Sky Alternative Investments Ltd. (a) | | 3,155,936 | 2,704 |
| Inghams Group Ltd. (b) | | 7,274,630 | 20,091 |
| Magellan Financial Group Ltd. | | 1,192,618 | 22,499 |
| National Storage (REIT) unit | | 20,935,348 | 25,277 |
| Rio Tinto Ltd. | | 4,010 | 217 |
|
| TOTAL AUSTRALIA | | | 113,541 |
|
| Austria - 1.4% | | | |
| Erste Group Bank AG | | 1,778,600 | 72,523 |
| Wienerberger AG | | 2,708,000 | 62,326 |
|
| TOTAL AUSTRIA | | | 134,849 |
|
| Bailiwick of Jersey - 0.3% | | | |
| Glencore Xstrata PLC | | 6,935,113 | 28,264 |
| Belgium - 1.0% | | | |
| KBC Groep NV | | 1,403,659 | 96,822 |
| Bermuda - 0.6% | | | |
| Hiscox Ltd. | | 2,788,120 | 58,018 |
| Canada - 2.1% | | | |
| Alimentation Couche-Tard, Inc. Class B (sub. vtg.) | | 1,074,800 | 51,329 |
| Cenovus Energy, Inc. (Canada) | | 3,258,400 | 27,573 |
| Constellation Software, Inc. | | 74,900 | 51,548 |
| Suncor Energy, Inc. | | 2,122,800 | 71,209 |
|
| TOTAL CANADA | | | 201,659 |
|
| Cayman Islands - 1.1% | | | |
| Alibaba Group Holding Ltd. sponsored ADR (a) | | 284,700 | 40,507 |
| ENN Energy Holdings Ltd. | | 3,407,500 | 28,961 |
| Meituan Dianping Class B | | 5,958,244 | 34,669 |
|
| TOTAL CAYMAN ISLANDS | | | 104,137 |
|
| China - 0.3% | | | |
| Qingdao Port International Co. Ltd. (a)(c) | | 11,047,000 | 6,480 |
| Shanghai International Airport Co. Ltd. (A Shares) | | 2,634,600 | 18,714 |
|
| TOTAL CHINA | | | 25,194 |
|
| Denmark - 1.0% | | | |
| Netcompany Group A/S | | 916,278 | 30,304 |
| Novo Nordisk A/S Series B | | 953,445 | 41,176 |
| Novozymes A/S Series B | | 389,400 | 19,243 |
|
| TOTAL DENMARK | | | 90,723 |
|
| Finland - 0.4% | | | |
| Sampo Oyj (A Shares) | | 917,500 | 42,254 |
| France - 8.7% | | | |
| ALTEN | | 343,360 | 33,115 |
| Capgemini SA | | 751,250 | 91,898 |
| Cegedim SA (a) | | 577,424 | 14,454 |
| Elis SA | | 1,912,711 | 38,627 |
| LVMH Moet Hennessy - Louis Vuitton SA | | 246,433 | 74,769 |
| Sartorius Stedim Biotech | | 312,490 | 38,792 |
| SMCP S.A.S. (c) | | 1,005,880 | 23,812 |
| Societe Generale Series A | | 1,519,483 | 55,701 |
| Thales SA | | 447,762 | 57,309 |
| Total SA | | 4,726,358 | 277,323 |
| VINCI SA (b) | | 1,340,505 | 119,304 |
|
| TOTAL FRANCE | | | 825,104 |
|
| Germany - 10.2% | | | |
| adidas AG | | 458,206 | 107,949 |
| Akasol AG | | 280,077 | 12,927 |
| Allianz SE | | 392,900 | 81,849 |
| Aumann AG (c) | | 118,851 | 5,869 |
| Deutsche Borse AG | | 162,981 | 20,596 |
| Deutsche Post AG | | 2,286,440 | 72,195 |
| Fresenius SE & Co. KGaA | | 1,181,000 | 75,059 |
| Instone Real Estate Group BV (c) | | 1,005,000 | 23,574 |
| JOST Werke AG (c) | | 218,300 | 7,616 |
| Linde PLC | | 600,446 | 98,512 |
| MTU Aero Engines Holdings AG | | 390,800 | 83,128 |
| Muenchener Rueckversicherungs AG | | 212,900 | 45,805 |
| Nexus AG | | 598,705 | 16,343 |
| Rational AG | | 36,405 | 21,112 |
| Rheinmetall AG | | 300,500 | 26,051 |
| SAP SE | | 1,631,171 | 174,655 |
| Vonovia SE | | 959,200 | 43,914 |
| Wirecard AG | | 274,800 | 51,481 |
|
| TOTAL GERMANY | | | 968,635 |
|
| Hong Kong - 1.8% | | | |
| AIA Group Ltd. | | 16,381,000 | 123,976 |
| Techtronic Industries Co. Ltd. | | 10,497,500 | 49,128 |
|
| TOTAL HONG KONG | | | 173,104 |
|
| India - 3.1% | | | |
| Avenue Supermarts Ltd. (a)(c) | | 595,148 | 10,766 |
| HDFC Bank Ltd. | | 1,783,391 | 46,297 |
| HDFC Bank Ltd. sponsored ADR | | 955,784 | 84,979 |
| Housing Development Finance Corp. Ltd. | | 4,738,215 | 113,346 |
| Sunteck Realty Ltd. (a) | | 3,638,783 | 15,948 |
| TCNS Clothing Co. Ltd. (a) | | 2,290,991 | 19,143 |
|
| TOTAL INDIA | | | 290,479 |
|
| Ireland - 3.0% | | | |
| Cairn Homes PLC (a) | | 24,761,863 | 39,770 |
| CRH PLC | | 1,072,547 | 31,992 |
| Dalata Hotel Group PLC | | 6,380,738 | 39,532 |
| DCC PLC (United Kingdom) | | 234,900 | 20,162 |
| Glenveagh Properties PLC (c) | | 18,258,476 | 17,289 |
| Green REIT PLC | | 9,492,200 | 15,675 |
| Kerry Group PLC Class A | | 575,200 | 58,961 |
| Ryanair Holdings PLC sponsored ADR (a) | | 340,266 | 28,174 |
| United Drug PLC (United Kingdom) | | 3,890,900 | 31,432 |
|
| TOTAL IRELAND | | | 282,987 |
|
| Italy - 0.7% | | | |
| Prada SpA | | 4,817,375 | 17,016 |
| Recordati SpA | | 1,498,900 | 50,796 |
|
| TOTAL ITALY | | | 67,812 |
|
| Japan - 14.0% | | | |
| AEON Financial Service Co. Ltd. | | 1,567,500 | 30,785 |
| Hoya Corp. | | 1,803,500 | 102,518 |
| Keyence Corp. | | 161,620 | 79,209 |
| Mercari, Inc. (a)(b) | | 186,200 | 4,713 |
| Minebea Mitsumi, Inc. | | 3,146,200 | 48,131 |
| Misumi Group, Inc. | | 1,127,900 | 22,651 |
| Mitsubishi UFJ Financial Group, Inc. | | 13,512,400 | 81,784 |
| Monex Group, Inc. (b) | | 3,474,649 | 13,703 |
| Morinaga & Co. Ltd. | | 572,700 | 23,018 |
| Murata Manufacturing Co. Ltd. | | 203,800 | 31,003 |
| Nidec Corp. | | 355,700 | 45,678 |
| Nitori Holdings Co. Ltd. | | 503,400 | 65,738 |
| ORIX Corp. | | 8,623,800 | 140,705 |
| Panasonic Corp. | | 6,347,500 | 68,118 |
| Recruit Holdings Co. Ltd. | | 942,500 | 25,296 |
| Relo Group, Inc. | | 2,647,500 | 62,554 |
| Shiseido Co. Ltd. | | 236,100 | 14,897 |
| SMC Corp. | | 232,200 | 74,392 |
| SoftBank Corp. | | 837,600 | 66,287 |
| Sony Corp. | | 2,455,200 | 132,867 |
| Takeda Pharmaceutical Co. Ltd. | | 1,170,300 | 48,520 |
| Tsuruha Holdings, Inc. | | 481,100 | 50,142 |
| VT Holdings Co. Ltd. | | 496,700 | 2,069 |
| Welcia Holdings Co. Ltd. | | 1,710,100 | 87,297 |
| Zozo, Inc. | | 494,200 | 11,909 |
|
| TOTAL JAPAN | | | 1,333,984 |
|
| Korea (South) - 0.5% | | | |
| Cafe24 Corp. (a) | | 223,645 | 21,659 |
| Hyundai Fire & Marine Insurance Co. Ltd. | | 331,774 | 12,154 |
| KB Financial Group, Inc. | | 437,375 | 18,191 |
|
| TOTAL KOREA (SOUTH) | | | 52,004 |
|
| Netherlands - 5.2% | | | |
| Adyen BV (c) | | 113,603 | 73,485 |
| ASML Holding NV (Netherlands) | | 579,200 | 99,764 |
| Basic-Fit NV (a)(c) | | 573,600 | 16,535 |
| IMCD Group BV | | 777,945 | 52,824 |
| Koninklijke Philips Electronics NV | | 2,812,269 | 104,886 |
| Unilever NV (Certificaten Van Aandelen) (Bearer) | | 2,572,632 | 138,240 |
| Van Lanschot NV (Bearer) | | 221,500 | 5,432 |
|
| TOTAL NETHERLANDS | | | 491,166 |
|
| New Zealand - 1.3% | | | |
| EBOS Group Ltd. | | 3,124,713 | 42,493 |
| Fisher & Paykel Healthcare Corp. | | 3,760,394 | 33,372 |
| Ryman Healthcare Group Ltd. | | 6,308,132 | 49,808 |
|
| TOTAL NEW ZEALAND | | | 125,673 |
|
| Norway - 2.6% | | | |
| Equinor ASA | | 9,619,813 | 250,258 |
| Spain - 4.0% | | | |
| Aedas Homes SAU (c) | | 402,926 | 10,424 |
| Amadeus IT Holding SA Class A | | 810,800 | 65,368 |
| CaixaBank SA (b) | | 32,146,733 | 130,089 |
| Grifols SA ADR | | 2,966,058 | 60,567 |
| Masmovil Ibercom SA (a) | | 536,548 | 69,645 |
| Neinor Homes SLU (a)(c) | | 732,900 | 11,788 |
| Prosegur Cash SA (c) | | 4,229,512 | 8,383 |
| Zardoya Otis SA | | 3,001,173 | 20,566 |
|
| TOTAL SPAIN | | | 376,830 |
|
| Sweden - 2.6% | | | |
| ASSA ABLOY AB (B Shares) | | 3,408,900 | 67,806 |
| HEXPOL AB (B Shares) | | 1,854,700 | 17,166 |
| Indutrade AB | | 2,158,900 | 51,807 |
| Saab AB (B Shares) | | 783,100 | 30,687 |
| Svenska Cellulosa AB (SCA) (B Shares) | | 4,064,100 | 38,469 |
| Telefonaktiebolaget LM Ericsson (B Shares) | | 4,514,200 | 39,304 |
|
| TOTAL SWEDEN | | | 245,239 |
|
| Switzerland - 8.5% | | | |
| Credit Suisse Group AG | | 2,446,505 | 31,985 |
| Forbo Holding AG (Reg.) | | 19,930 | 29,267 |
| Julius Baer Group Ltd. | | 857,090 | 39,087 |
| Kaba Holding AG (B Shares) (Reg.) | | 41,000 | 29,595 |
| Lonza Group AG | | 259,158 | 81,493 |
| Nestle SA (Reg. S) | | 2,839,470 | 239,717 |
| Partners Group Holding AG | | 106,960 | 76,199 |
| Roche Holding AG (participation certificate) | | 801,468 | 195,047 |
| Schindler Holding AG (participation certificate) | | 168,047 | 35,440 |
| UBS Group AG | | 3,674,380 | 51,404 |
|
| TOTAL SWITZERLAND | | | 809,234 |
|
| United Kingdom - 10.7% | | | |
| Anglo American PLC (United Kingdom) | | 1,430,245 | 30,625 |
| AstraZeneca PLC (United Kingdom) | | 2,369,091 | 181,211 |
| Beazley PLC | | 4,167,000 | 28,096 |
| BHP Billiton PLC | | 3,499,778 | 69,816 |
| Big Yellow Group PLC | | 2,523,600 | 27,821 |
| British American Tobacco PLC: | | | |
| (United Kingdom) | | 1,513,778 | 65,623 |
| sponsored ADR | | 419,000 | 18,185 |
| Bunzl PLC | | 2,743,559 | 81,043 |
| Compass Group PLC | | 2,420,296 | 47,642 |
| Conviviality PLC (d) | | 5,464,968 | 0 |
| Cranswick PLC | | 1,414,158 | 52,239 |
| Dechra Pharmaceuticals PLC | | 1,370,476 | 40,045 |
| JTC PLC | | 3,846,100 | 16,469 |
| Keywords Studios PLC | | 627,800 | 10,994 |
| LivaNova PLC (a) | | 363,102 | 40,664 |
| London Stock Exchange Group PLC | | 1,209,936 | 66,733 |
| Melrose Industries PLC | | 11,062,816 | 23,848 |
| Micro Focus International PLC | | 3,041,005 | 47,142 |
| Moneysupermarket.com Group PLC | | 835 | 3 |
| NCC Group Ltd. | | 9,063,500 | 22,776 |
| Reckitt Benckiser Group PLC | | 449,822 | 36,374 |
| Rio Tinto PLC | | 936,125 | 45,450 |
| Senior Engineering Group PLC | | 7,063,700 | 24,649 |
| St. James's Place Capital PLC | | 2,486,954 | 32,217 |
| Standard Chartered PLC (United Kingdom) | | 63,290 | 445 |
| The Weir Group PLC | | 585,500 | 11,869 |
|
| TOTAL UNITED KINGDOM | | | 1,021,979 |
|
| United States of America - 0.8% | | | |
| International Flavors & Fragrances, Inc. (Israel) | | 209,161 | 30,200 |
| Marsh & McLennan Companies, Inc. | | 516,900 | 43,807 |
|
| TOTAL UNITED STATES OF AMERICA | | | 74,007 |
|
| TOTAL COMMON STOCKS | | | |
| (Cost $7,415,622) | | | 8,283,956 |
| | | Principal Amount (000s) | Value (000s) |
|
| Government Obligations - 0.1% | | | |
| United States of America - 0.1% | | | |
| U.S. Treasury Bills, yield at date of purchase 1.99% to 2.3% 11/1/18 to 1/31/19(e) | | | |
| (Cost $13,725) | | 13,770 | 13,725 |
| | | Shares | Value (000s) |
|
| Money Market Funds - 14.7% | | | |
| Fidelity Cash Central Fund, 2.23% (f) | | 1,172,025,582 | 1,172,260 |
| Fidelity Securities Lending Cash Central Fund 2.23% (f)(g) | | 225,820,857 | 225,843 |
| TOTAL MONEY MARKET FUNDS | | | |
| (Cost $1,398,103) | | | 1,398,103 |
| TOTAL INVESTMENT IN SECURITIES - 101.9% | | | |
| (Cost $8,827,450) | | | 9,695,784 |
| NET OTHER ASSETS (LIABILITIES) - (1.9)% | | | (180,375) |
| NET ASSETS - 100% | | | $9,515,409 |
| Futures Contracts | | | | | |
| | Number of contracts | Expiration Date | Notional Amount (000s) | Value (000s) | Unrealized Appreciation/(Depreciation) (000s) |
| Purchased | | | | | |
| Equity Index Contracts | | | | | |
| TSE TOPIX Index Contracts (Japan) | 2,383 | Dec. 2018 | $346,568 | $(7,547) | $(7,547) |
The notional amount of futures purchased as a percentage of Net Assets is 3.6%
Categorizations in the Schedule of Investments are based on country or territory of incorporation.
Values shown as $0 in the Schedule of Investments may reflect amounts less than $500.
Legend
(a) Non-income producing
(b) Security or a portion of the security is on loan at period end.
(c) Security exempt from registration under Rule 144A of the Securities Act of 1933. These securities may be resold in transactions exempt from registration, normally to qualified institutional buyers. At the end of the period, the value of these securities amounted to $216,021,000 or 2.3% of net assets.
(d) Level 3 security
(e) Security or a portion of the security was pledged to cover margin requirements for futures contracts. At period end, the value of securities pledged amounted to $13,725,000.
(f) Affiliated fund that is generally available only to investment companies and other accounts managed by Fidelity Investments. The rate quoted is the annualized seven-day yield of the fund at period end. A complete unaudited listing of the fund's holdings as of its most recent quarter end is available upon request. In addition, each Fidelity Central Fund's financial statements, which are not covered by the Fund's Report of Independent Registered Public Accounting Firm, are available on the SEC's website or upon request.
(g) Includes investment made with cash collateral received from securities on loan.
Affiliated Central Funds
Information regarding fiscal year to date income earned by the Fund from investments in Fidelity Central Funds is as follows:
| Fund | Income earned |
| | (Amounts in thousands) |
| Fidelity Cash Central Fund | $11,311 |
| Fidelity Securities Lending Cash Central Fund | 3,292 |
| Total | $14,603 |
Amounts in the income column in the above table include any capital gain distributions from underlying funds, which are presented in the corresponding line-item in the Statement of Operations if applicable.
Other Affiliated Issuers
An affiliated company is a company in which the Fund has ownership of at least 5% of the voting securities. Fiscal year to date transactions with companies which are or were affiliates are as follows:
| Affiliate (Amounts in thousands) | Value, beginning of period | Purchases | Sales Proceeds(a),(b) | Dividend Income | Realized Gain (loss) | Change in Unrealized appreciation (depreciation) | Value, end of period |
| Rex Bionics PLC | $30 | $-- | $0 | $-- | $(3,941) | $3,911 | $-- |
| Total | $30 | $-- | $0 | $-- | $(3,941) | $3,911 | $-- |
(a) Values shown as $0 may reflect amounts less than $500.
(b) Includes the value of securities delivered through in-kind transactions, if applicable.
Investment Valuation
The following is a summary of the inputs used, as of October 31, 2018, involving the Fund's assets and liabilities carried at fair value. The inputs or methodology used for valuing securities may not be an indication of the risk associated with investing in those securities. For more information on valuation inputs, and their aggregation into the levels used below, please refer to the Investment Valuation section in the accompanying Notes to Financial Statements.
| | Valuation Inputs at Reporting Date: |
| Description | Total | Level 1 | Level 2 | Level 3 |
| (Amounts in thousands) | | | | |
| Investments in Securities: | | | | |
| Equities: | | | | |
| Communication Services | $135,932 | $69,645 | $66,287 | $-- |
| Consumer Discretionary | 911,006 | 600,583 | 310,423 | -- |
| Consumer Staples | 856,113 | 361,262 | 494,851 | 0 |
| Energy | 626,363 | 349,040 | 277,323 | -- |
| Financials | 1,793,549 | 1,287,970 | 505,579 | -- |
| Health Care | 1,248,676 | 602,777 | 645,899 | -- |
| Industrials | 1,143,407 | 810,675 | 332,732 | -- |
| Information Technology | 923,705 | 562,840 | 360,865 | -- |
| Materials | 373,768 | 226,510 | 147,258 | -- |
| Real Estate | 242,476 | 242,476 | -- | -- |
| Utilities | 28,961 | 28,961 | -- | -- |
| Government Obligations | 13,725 | -- | 13,725 | -- |
| Money Market Funds | 1,398,103 | 1,398,103 | -- | -- |
| Total Investments in Securities: | $9,695,784 | $6,540,842 | $3,154,942 | $0 |
| Derivative Instruments: | | | | |
| Liabilities | | | | |
| Futures Contracts | $(7,547) | $(7,547) | $-- | $-- |
| Total Liabilities | $(7,547) | $(7,547) | $-- | $-- |
| Total Derivative Instruments: | $(7,547) | $(7,547) | $-- | $-- |
The following is a summary of transfers between Level 1 and Level 2 for the period ended October 31, 2018. Transfers are assumed to have occurred at the beginning of the period, and are primarily attributable to the valuation techniques used for foreign equity securities, as discussed in the accompanying Notes to Financial Statements:
| Transfers | Total (000s) |
| Level 1 to Level 2 | $465,253 |
| Level 2 to Level 1 | $999,772 |
Value of Derivative Instruments
The following table is a summary of the Fund's value of derivative instruments by primary risk exposure as of October 31, 2018. For additional information on derivative instruments, please refer to the Derivative Instruments section in the accompanying Notes to Financial Statements.
| Primary Risk Exposure / Derivative Type | Value |
| | Asset | Liability |
| (Amounts in thousands) | | |
| Equity Risk | | |
| Futures Contracts(a) | $0 | $(7,547) |
| Total Equity Risk | 0 | (7,547) |
| Total Value of Derivatives | $0 | $(7,547) |
(a) Reflects gross cumulative appreciation (depreciation) on futures contracts as presented in the Schedule of Investments. In the Statement of Assets and Liabilities, the period end daily variation margin is included in receivable or payable for daily variation margin on futures contracts, and the net cumulative appreciation (depreciation) is included in net unrealized appreciation (depreciation).
See accompanying notes which are an integral part of the financial statements.
Financial Statements
Statement of Assets and Liabilities
| Amounts in thousands (except per-share amounts) | | October 31, 2018 |
| Assets | | |
Investment in securities, at value (including securities loaned of $215,012) — See accompanying schedule:
Unaffiliated issuers (cost $7,429,347) | $8,297,681 | |
| Fidelity Central Funds (cost $1,398,103) | 1,398,103 | |
| Total Investment in Securities (cost $8,827,450) | | $9,695,784 |
| Foreign currency held at value (cost $821) | | 818 |
| Receivable for investments sold | | 7,222 |
| Receivable for fund shares sold | | 17,779 |
| Dividends receivable | | 22,808 |
| Distributions receivable from Fidelity Central Funds | | 2,215 |
| Receivable for daily variation margin on futures contracts | | 6,547 |
| Prepaid expenses | | 20 |
| Other receivables | | 4,016 |
| Total assets | | 9,757,209 |
| Liabilities | | |
| Payable for investments purchased | $31 | |
| Payable for fund shares redeemed | 8,363 | |
| Accrued management fee | 4,872 | |
| Distribution and service plan fees payable | 72 | |
| Other affiliated payables | 1,317 | |
| Other payables and accrued expenses | 1,304 | |
| Collateral on securities loaned | 225,841 | |
| Total liabilities | | 241,800 |
| Net Assets | | $9,515,409 |
| Net Assets consist of: | | |
| Paid in capital | | $8,369,714 |
| Total distributable earnings (loss) | | 1,145,695 |
| Net Assets | | $9,515,409 |
| Net Asset Value and Maximum Offering Price | | |
| Class A: | | |
| Net Asset Value and redemption price per share ($190,720 ÷ 4,769.1 shares) | | $39.99 |
| Maximum offering price per share (100/94.25 of $39.99) | | $42.43 |
| Class M: | | |
| Net Asset Value and redemption price per share ($27,840 ÷ 701.0 shares) | | $39.71 |
| Maximum offering price per share (100/96.50 of $39.71) | | $41.15 |
| Class C: | | |
| Net Asset Value and offering price per share ($21,537 ÷ 547.8 shares)(a) | | $39.32 |
| International Discovery: | | |
| Net Asset Value, offering price and redemption price per share ($6,514,516 ÷ 161,559.9 shares) | | $40.32 |
| Class K: | | |
| Net Asset Value, offering price and redemption price per share ($2,063,585 ÷ 51,271.1 shares) | | $40.25 |
| Class I: | | |
| Net Asset Value, offering price and redemption price per share ($579,134 ÷ 14,400.3 shares) | | $40.22 |
| Class Z: | | |
| Net Asset Value, offering price and redemption price per share ($118,077 ÷ 2,935.8 shares) | | $40.22 |
(a) Redemption price per share is equal to net asset value less any applicable contingent deferred sales charge.
See accompanying notes which are an integral part of the financial statements.
Statement of Operations
| Amounts in thousands | | Year ended October 31, 2018 |
| Investment Income | | |
| Dividends | | $225,604 |
| Interest | | 143 |
| Income from Fidelity Central Funds | | 14,603 |
| Income before foreign taxes withheld | | 240,350 |
| Less foreign taxes withheld | | (22,110) |
| Total income | | 218,240 |
| Expenses | | |
| Management fee | | |
| Basic fee | $71,011 | |
| Performance adjustment | 2,254 | |
| Transfer agent fees | 14,527 | |
| Distribution and service plan fees | 1,011 | |
| Accounting and security lending fees | 1,828 | |
| Custodian fees and expenses | 1,634 | |
| Independent trustees' fees and expenses | 53 | |
| Registration fees | 184 | |
| Audit | 115 | |
| Legal | 30 | |
| Miscellaneous | 74 | |
| Total expenses before reductions | 92,721 | |
| Expense reductions | (1,283) | |
| Total expenses after reductions | | 91,438 |
| Net investment income (loss) | | 126,802 |
| Realized and Unrealized Gain (Loss) | | |
| Net realized gain (loss) on: | | |
| Investment securities: | | |
| Unaffiliated issuers | 278,786 | |
| Fidelity Central Funds | 25 | |
| Other affiliated issuers | (3,941) | |
| Foreign currency transactions | (1,188) | |
| Futures contracts | 4,030 | |
| Total net realized gain (loss) | | 277,712 |
| Change in net unrealized appreciation (depreciation) on: | | |
| Investment securities: | | |
| Unaffiliated issuers | (1,409,375) | |
| Fidelity Central Funds | 8 | |
| Other affiliated issuers | 3,911 | |
| Assets and liabilities in foreign currencies | (510) | |
| Futures contracts | (24,387) | |
| Total change in net unrealized appreciation (depreciation) | | (1,430,353) |
| Net gain (loss) | | (1,152,641) |
| Net increase (decrease) in net assets resulting from operations | | $(1,025,839) |
See accompanying notes which are an integral part of the financial statements.
Statement of Changes in Net Assets
| Amounts in thousands | Year ended October 31, 2018 | Year ended October 31, 2017 |
| Increase (Decrease) in Net Assets | | |
| Operations | | |
| Net investment income (loss) | $126,802 | $118,923 |
| Net realized gain (loss) | 277,712 | 1,030,476 |
| Change in net unrealized appreciation (depreciation) | (1,430,353) | 1,102,421 |
| Net increase (decrease) in net assets resulting from operations | (1,025,839) | 2,251,820 |
| Distributions to shareholders | (535,941) | – |
| Distributions to shareholders from net investment income | – | (150,174) |
| Distributions to shareholders from net realized gain | – | (11,939) |
| Total distributions | (535,941) | (162,113) |
| Share transactions - net increase (decrease) | 427,927 | (822,002) |
| Redemption fees | – | 9 |
| Total increase (decrease) in net assets | (1,133,853) | 1,267,714 |
| Net Assets | | |
| Beginning of period | 10,649,262 | 9,381,548 |
| End of period | $9,515,409 | $10,649,262 |
| Other Information | | |
| Undistributed net investment income end of period | | $108,446 |
See accompanying notes which are an integral part of the financial statements.
Financial Highlights
Fidelity International Discovery Fund Class A
| Years ended October 31, | 2018 | 2017 | 2016 | 2015 | 2014 |
| Selected Per–Share Data | | | | | |
| Net asset value, beginning of period | $46.66 | $37.60 | $39.78 | $38.70 | $39.49 |
| Income from Investment Operations | | | | | |
| Net investment income (loss)A | .37 | .36 | .47B | .40C | .53D |
| Net realized and unrealized gain (loss) | (4.87) | 9.22 | (2.38) | .79 | (.67) |
| Total from investment operations | (4.50) | 9.58 | (1.91) | 1.19 | (.14) |
| Distributions from net investment income | (.34) | (.47) | (.27) | (.11) | (.33) |
| Distributions from net realized gain | (1.83) | (.05) | (.01) | – | (.31) |
| Total distributions | (2.17) | (.52) | (.27)E | (.11) | (.65)F |
| Redemption fees added to paid in capitalA | – | –G | –G | –G | –G |
| Net asset value, end of period | $39.99 | $46.66 | $37.60 | $39.78 | $38.70 |
| Total ReturnH,I | (10.11)% | 25.87% | (4.83)% | 3.09% | (.36)% |
| Ratios to Average Net AssetsJ,K | | | | | |
| Expenses before reductions | 1.22% | 1.29% | 1.35% | 1.33% | 1.28% |
| Expenses net of fee waivers, if any | 1.22% | 1.29% | 1.35% | 1.33% | 1.28% |
| Expenses net of all reductions | 1.21% | 1.27% | 1.34% | 1.32% | 1.28% |
| Net investment income (loss) | .83% | .88% | 1.26%B | 1.00%C | 1.35%D |
| Supplemental Data | | | | | |
| Net assets, end of period (in millions) | $191 | $248 | $236 | $283 | $297 |
| Portfolio turnover rateL | 45%M | 42% | 50%M | 60%M | 57% |
A Calculated based on average shares outstanding during the period.
B Net investment income per share reflects a large, non-recurring dividend which amounted to $.14 per share. Excluding this non-recurring dividend, the ratio of net investment income (loss) to average net assets would have been .88%.
C Net investment income per share reflects a large, non-recurring dividend which amounted to $.12 per share. Excluding this non-recurring dividend, the ratio of net investment income (loss) to average net assets would have been .69%.
D Net investment income per share reflects a large, non-recurring dividend which amounted to $.22 per share. Excluding this non-recurring dividend, the ratio of net investment income (loss) to average net assets would have been .80%.
E Total distributions of $.27 per share is comprised of distributions from net investment income of $.269 and distributions from net realized gain of $.005 per share.
F Total distributions of $.65 per share is comprised of distributions from net investment income of $.334 and distributions from net realized gain of $.311 per share.
G Amount represents less than $.005 per share.
H Total returns would have been lower if certain expenses had not been reduced during the applicable periods shown.
I Total returns do not include the effect of the sales charges.
J Fees and expenses of any underlying Fidelity Central Funds are not included in the Fund's expense ratio. The Fund indirectly bears its proportionate share of the expenses of any underlying Fidelity Central Funds.
K Expense ratios reflect operating expenses of the class. Expenses before reductions do not reflect amounts reimbursed by the investment adviser or reductions from brokerage service arrangements or reductions from other expense offset arrangements and do not represent the amount paid by the class during periods when reimbursements or reductions occur. Expenses net of fee waivers reflect expenses after reimbursement by the investment adviser but prior to reductions from brokerage service arrangements or other expense offset arrangements. Expenses net of all reductions represent the net expenses paid by the class.
L Amount does not include the portfolio activity of any underlying Fidelity Central Funds.
M Portfolio turnover rate excludes securities received or delivered in-kind.
See accompanying notes which are an integral part of the financial statements.
Fidelity International Discovery Fund Class M
| Years ended October 31, | 2018 | 2017 | 2016 | 2015 | 2014 |
| Selected Per–Share Data | | | | | |
| Net asset value, beginning of period | $46.35 | $37.34 | $39.51 | $38.43 | $39.23 |
| Income from Investment Operations | | | | | |
| Net investment income (loss)A | .27 | .26 | .38B | .30C | .44D |
| Net realized and unrealized gain (loss) | (4.84) | 9.17 | (2.37) | .80 | (.68) |
| Total from investment operations | (4.57) | 9.43 | (1.99) | 1.10 | (.24) |
| Distributions from net investment income | (.24) | (.37) | (.17) | (.02) | (.25) |
| Distributions from net realized gain | (1.83) | (.05) | (.01) | – | (.31) |
| Total distributions | (2.07) | (.42) | (.18) | (.02) | (.56) |
| Redemption fees added to paid in capitalA | – | –E | –E | –E | –E |
| Net asset value, end of period | $39.71 | $46.35 | $37.34 | $39.51 | $38.43 |
| Total ReturnF,G | (10.31)% | 25.57% | (5.07)% | 2.86% | (.60)% |
| Ratios to Average Net AssetsH,I | | | | | |
| Expenses before reductions | 1.46% | 1.53% | 1.58% | 1.57% | 1.51% |
| Expenses net of fee waivers, if any | 1.46% | 1.52% | 1.58% | 1.57% | 1.51% |
| Expenses net of all reductions | 1.45% | 1.51% | 1.57% | 1.56% | 1.51% |
| Net investment income (loss) | .59% | .64% | 1.02%B | .76%C | 1.11%D |
| Supplemental Data | | | | | |
| Net assets, end of period (in millions) | $28 | $35 | $35 | $43 | $49 |
| Portfolio turnover rateJ | 45%K | 42% | 50%K | 60%K | 57% |
A Calculated based on average shares outstanding during the period.
B Net investment income per share reflects a large, non-recurring dividend which amounted to $.14 per share. Excluding this non-recurring dividend, the ratio of net investment income (loss) to average net assets would have been .64%.
C Net investment income per share reflects a large, non-recurring dividend which amounted to $.12 per share. Excluding this non-recurring dividend, the ratio of net investment income (loss) to average net assets would have been .45%.
D Net investment income per share reflects a large, non-recurring dividend which amounted to $.21 per share. Excluding this non-recurring dividend, the ratio of net investment income (loss) to average net assets would have been .56%.
E Amount represents less than $.005 per share.
F Total returns would have been lower if certain expenses had not been reduced during the applicable periods shown.
G Total returns do not include the effect of the sales charges.
H Fees and expenses of any underlying Fidelity Central Funds are not included in the Fund's expense ratio. The Fund indirectly bears its proportionate share of the expenses of any underlying Fidelity Central Funds.
I Expense ratios reflect operating expenses of the class. Expenses before reductions do not reflect amounts reimbursed by the investment adviser or reductions from brokerage service arrangements or reductions from other expense offset arrangements and do not represent the amount paid by the class during periods when reimbursements or reductions occur. Expenses net of fee waivers reflect expenses after reimbursement by the investment adviser but prior to reductions from brokerage service arrangements or other expense offset arrangements. Expenses net of all reductions represent the net expenses paid by the class.
J Amount does not include the portfolio activity of any underlying Fidelity Central Funds.
K Portfolio turnover rate excludes securities received or delivered in-kind.
See accompanying notes which are an integral part of the financial statements.
Fidelity International Discovery Fund Class C
| Years ended October 31, | 2018 | 2017 | 2016 | 2015 | 2014 |
| Selected Per–Share Data | | | | | |
| Net asset value, beginning of period | $45.94 | $36.96 | $39.14 | $38.25 | $39.07 |
| Income from Investment Operations | | | | | |
| Net investment income (loss)A | .02 | .04 | .19B | .10C | .23D |
| Net realized and unrealized gain (loss) | (4.79) | 9.12 | (2.37) | .79 | (.66) |
| Total from investment operations | (4.77) | 9.16 | (2.18) | .89 | (.43) |
| Distributions from net investment income | (.02) | (.13) | – | – | (.08) |
| Distributions from net realized gain | (1.83) | (.05) | – | – | (.31) |
| Total distributions | (1.85) | (.18) | – | – | (.39) |
| Redemption fees added to paid in capitalA | – | –E | –E | –E | –E |
| Net asset value, end of period | $39.32 | $45.94 | $36.96 | $39.14 | $38.25 |
| Total ReturnF,G | (10.80)% | 24.93% | (5.57)% | 2.33% | (1.10)% |
| Ratios to Average Net AssetsH,I | | | | | |
| Expenses before reductions | 2.00% | 2.05% | 2.10% | 2.09% | 2.03% |
| Expenses net of fee waivers, if any | 2.00% | 2.05% | 2.10% | 2.09% | 2.03% |
| Expenses net of all reductions | 1.99% | 2.04% | 2.09% | 2.08% | 2.02% |
| Net investment income (loss) | .05% | .11% | .50%B | .24%C | .60%D |
| Supplemental Data | | | | | |
| Net assets, end of period (in millions) | $22 | $28 | $26 | $32 | $35 |
| Portfolio turnover rateJ | 45%K | 42% | 50%K | 60%K | 57% |
A Calculated based on average shares outstanding during the period.
B Net investment income per share reflects a large, non-recurring dividend which amounted to $.14 per share. Excluding this non-recurring dividend, the ratio of net investment income (loss) to average net assets would have been .13%.
C Net investment income per share reflects a large, non-recurring dividend which amounted to $.12 per share. Excluding this non-recurring dividend, the ratio of net investment income (loss) to average net assets would have been (.06) %.
D Net investment income per share reflects a large, non-recurring dividend which amounted to $.21 per share. Excluding this non-recurring dividend, the ratio of net investment income (loss) to average net assets would have been .05%.
E Amount represents less than $.005 per share.
F Total returns would have been lower if certain expenses had not been reduced during the applicable periods shown.
G Total returns do not include the effect of the contingent deferred sales charge.
H Fees and expenses of any underlying Fidelity Central Funds are not included in the Fund's expense ratio. The Fund indirectly bears its proportionate share of the expenses of any underlying Fidelity Central Funds.
I Expense ratios reflect operating expenses of the class. Expenses before reductions do not reflect amounts reimbursed by the investment adviser or reductions from brokerage service arrangements or reductions from other expense offset arrangements and do not represent the amount paid by the class during periods when reimbursements or reductions occur. Expenses net of fee waivers reflect expenses after reimbursement by the investment adviser but prior to reductions from brokerage service arrangements or other expense offset arrangements. Expenses net of all reductions represent the net expenses paid by the class.
J Amount does not include the portfolio activity of any underlying Fidelity Central Funds.
K Portfolio turnover rate excludes securities received or delivered in-kind.
See accompanying notes which are an integral part of the financial statements.
Fidelity International Discovery Fund
| Years ended October 31, | 2018 | 2017 | 2016 | 2015 | 2014 |
| Selected Per–Share Data | | | | | |
| Net asset value, beginning of period | $47.04 | $37.91 | $40.12 | $39.03 | $39.82 |
| Income from Investment Operations | | | | | |
| Net investment income (loss)A | .53 | .50 | .61B | .54C | .67D |
| Net realized and unrealized gain (loss) | (4.92) | 9.29 | (2.41) | .81 | (.68) |
| Total from investment operations | (4.39) | 9.79 | (1.80) | 1.35 | (.01) |
| Distributions from net investment income | (.50) | (.61) | (.41) | (.26) | (.47) |
| Distributions from net realized gain | (1.83) | (.05) | (.01) | – | (.31) |
| Total distributions | (2.33) | (.66) | (.41)E | (.26) | (.78) |
| Redemption fees added to paid in capitalA | – | –F | –F | –F | –F |
| Net asset value, end of period | $40.32 | $47.04 | $37.91 | $40.12 | $39.03 |
| Total ReturnG | (9.81)% | 26.33% | (4.53)% | 3.47% | (.01)% |
| Ratios to Average Net AssetsH,I | | | | | |
| Expenses before reductions | .88% | .94% | 1.00% | .99% | .93% |
| Expenses net of fee waivers, if any | .88% | .94% | 1.00% | .99% | .93% |
| Expenses net of all reductions | .87% | .92% | .99% | .98% | .93% |
| Net investment income (loss) | 1.17% | 1.22% | 1.61%B | 1.34%C | 1.69%D |
| Supplemental Data | | | | | |
| Net assets, end of period (in millions) | $6,515 | $7,351 | $6,421 | $7,209 | $7,464 |
| Portfolio turnover rateJ | 45%K | 42% | 50%K | 60%K | 57% |
A Calculated based on average shares outstanding during the period.
B Net investment income per share reflects a large, non-recurring dividend which amounted to $.14 per share. Excluding this non-recurring dividend, the ratio of net investment income (loss) to average net assets would have been 1.23%.
C Net investment income per share reflects a large, non-recurring dividend which amounted to $.12 per share. Excluding this non-recurring dividend, the ratio of net investment income (loss) to average net assets would have been 1.03%.
D Net investment income per share reflects a large, non-recurring dividend which amounted to $.22 per share. Excluding this non-recurring dividend, the ratio of net investment income (loss) to average net assets would have been 1.15%.
E Total distributions of $.41 per share is comprised of distributions from net investment income of $.409 and distributions from net realized gain of $.005 per share.
F Amount represents less than $.005 per share.
G Total returns would have been lower if certain expenses had not been reduced during the applicable periods shown.
H Fees and expenses of any underlying Fidelity Central Funds are not included in the Fund's expense ratio. The Fund indirectly bears its proportionate share of the expenses of any underlying Fidelity Central Funds.
I Expense ratios reflect operating expenses of the class. Expenses before reductions do not reflect amounts reimbursed by the investment adviser or reductions from brokerage service arrangements or reductions from other expense offset arrangements and do not represent the amount paid by the class during periods when reimbursements or reductions occur. Expenses net of fee waivers reflect expenses after reimbursement by the investment adviser but prior to reductions from brokerage service arrangements or other expense offset arrangements. Expenses net of all reductions represent the net expenses paid by the class.
J Amount does not include the portfolio activity of any underlying Fidelity Central Funds.
K Portfolio turnover rate excludes securities received or delivered in-kind.
See accompanying notes which are an integral part of the financial statements.
Fidelity International Discovery Fund Class K
| Years ended October 31, | 2018 | 2017 | 2016 | 2015 | 2014 |
| Selected Per–Share Data | | | | | |
| Net asset value, beginning of period | $46.96 | $37.86 | $40.06 | $38.97 | $39.76 |
| Income from Investment Operations | | | | | |
| Net investment income (loss)A | .58 | .55 | .66B | .59C | .72D |
| Net realized and unrealized gain (loss) | (4.90) | 9.26 | (2.39) | .81 | (.67) |
| Total from investment operations | (4.32) | 9.81 | (1.73) | 1.40 | .05 |
| Distributions from net investment income | (.55) | (.66) | (.46) | (.31) | (.53) |
| Distributions from net realized gain | (1.83) | (.05) | (.01) | – | (.31) |
| Total distributions | (2.39)E | (.71) | (.47) | (.31) | (.84) |
| Redemption fees added to paid in capitalA | – | –F | –F | –F | –F |
| Net asset value, end of period | $40.25 | $46.96 | $37.86 | $40.06 | $38.97 |
| Total ReturnG | (9.70)% | 26.47% | (4.38)% | 3.61% | .13% |
| Ratios to Average Net AssetsH,I | | | | | |
| Expenses before reductions | .77% | .82% | .86% | .86% | .80% |
| Expenses net of fee waivers, if any | .77% | .82% | .86% | .86% | .80% |
| Expenses net of all reductions | .76% | .80% | .85% | .85% | .79% |
| Net investment income (loss) | 1.29% | 1.35% | 1.74%B | 1.47%C | 1.83%D |
| Supplemental Data | | | | | |
| Net assets, end of period (in millions) | $2,064 | $2,228 | $1,880 | $2,308 | $2,464 |
| Portfolio turnover rateJ | 45%K | 42% | 50%K | 60%K | 57% |
A Calculated based on average shares outstanding during the period.
B Net investment income per share reflects a large, non-recurring dividend which amounted to $.14 per share. Excluding this non-recurring dividend, the ratio of net investment income (loss) to average net assets would have been 1.36%.
C Net investment income per share reflects a large, non-recurring dividend which amounted to $.12 per share. Excluding this non-recurring dividend, the ratio of net investment income (loss) to average net assets would have been 1.16%.
D Net investment income per share reflects a large, non-recurring dividend which amounted to $.22 per share. Excluding this non-recurring dividend, the ratio of net investment income (loss) to average net assets would have been 1.28%.
E Total distributions of $2.39 per share is comprised of distributions from net investment income of $.554 and distributions from net realized gain of $1.832 per share.
F Amount represents less than $.005 per share.
G Total returns would have been lower if certain expenses had not been reduced during the applicable periods shown.
H Fees and expenses of any underlying Fidelity Central Funds are not included in the Fund's expense ratio. The Fund indirectly bears its proportionate share of the expenses of any underlying Fidelity Central Funds.
I Expense ratios reflect operating expenses of the class. Expenses before reductions do not reflect amounts reimbursed by the investment adviser or reductions from brokerage service arrangements or reductions from other expense offset arrangements and do not represent the amount paid by the class during periods when reimbursements or reductions occur. Expenses net of fee waivers reflect expenses after reimbursement by the investment adviser but prior to reductions from brokerage service arrangements or other expense offset arrangements. Expenses net of all reductions represent the net expenses paid by the class.
J Amount does not include the portfolio activity of any underlying Fidelity Central Funds.
K Portfolio turnover rate excludes securities received or delivered in-kind.
See accompanying notes which are an integral part of the financial statements.
Fidelity International Discovery Fund Class I
| Years ended October 31, | 2018 | 2017 | 2016 | 2015 | 2014 |
| Selected Per–Share Data | | | | | |
| Net asset value, beginning of period | $46.92 | $37.82 | $40.03 | $38.96 | $39.76 |
| Income from Investment Operations | | | | | |
| Net investment income (loss)A | .52 | .49 | .61B | .53C | .67D |
| Net realized and unrealized gain (loss) | (4.90) | 9.27 | (2.40) | .80 | (.68) |
| Total from investment operations | (4.38) | 9.76 | (1.79) | 1.33 | (.01) |
| Distributions from net investment income | (.49) | (.61) | (.42) | (.26) | (.48) |
| Distributions from net realized gain | (1.83) | (.05) | (.01) | – | (.31) |
| Total distributions | (2.32) | (.66) | (.42)E | (.26) | (.79) |
| Redemption fees added to paid in capitalA | – | –F | –F | –F | –F |
| Net asset value, end of period | $40.22 | $46.92 | $37.82 | $40.03 | $38.96 |
| Total ReturnG | (9.81)% | 26.29% | (4.52)% | 3.44% | (.01)% |
| Ratios to Average Net AssetsH,I | | | | | |
| Expenses before reductions | .91% | .96% | 1.00% | 1.00% | .93% |
| Expenses net of fee waivers, if any | .91% | .96% | 1.00% | .99% | .93% |
| Expenses net of all reductions | .90% | .94% | .99% | .98% | .93% |
| Net investment income (loss) | 1.15% | 1.21% | 1.60%B | 1.33%C | 1.69%D |
| Supplemental Data | | | | | |
| Net assets, end of period (in millions) | $579 | $658 | $745 | $1,061 | $650 |
| Portfolio turnover rateJ | 45%K | 42% | 50%K | 60%K | 57% |
A Calculated based on average shares outstanding during the period.
B Net investment income per share reflects a large, non-recurring dividend which amounted to $.14 per share. Excluding this non-recurring dividend, the ratio of net investment income (loss) to average net assets would have been 1.22%.
C Net investment income per share reflects a large, non-recurring dividend which amounted to $.12 per share. Excluding this non-recurring dividend, the ratio of net investment income (loss) to average net assets would have been 1.03%.
D Net investment income per share reflects a large, non-recurring dividend which amounted to $.22 per share. Excluding this non-recurring dividend, the ratio of net investment income (loss) to average net assets would have been 1.14%.
E Total distributions of $.42 per share is comprised of distributions from net investment income of $.418 and distributions from net realized gain of $.005 per share.
F Amount represents less than $.005 per share.
G Total returns would have been lower if certain expenses had not been reduced during the applicable periods shown.
H Fees and expenses of any underlying Fidelity Central Funds are not included in the Fund's expense ratio. The Fund indirectly bears its proportionate share of the expenses of any underlying Fidelity Central Funds.
I Expense ratios reflect operating expenses of the class. Expenses before reductions do not reflect amounts reimbursed by the investment adviser or reductions from brokerage service arrangements or reductions from other expense offset arrangements and do not represent the amount paid by the class during periods when reimbursements or reductions occur. Expenses net of fee waivers reflect expenses after reimbursement by the investment adviser but prior to reductions from brokerage service arrangements or other expense offset arrangements. Expenses net of all reductions represent the net expenses paid by the class.
J Amount does not include the portfolio activity of any underlying Fidelity Central Funds.
K Portfolio turnover rate excludes securities received or delivered in-kind.
See accompanying notes which are an integral part of the financial statements.
Fidelity International Discovery Fund Class Z
| Years ended October 31, | 2018 | 2017 | 2016 | 2015 | 2014 |
| Selected Per–Share Data | | | | | |
| Net asset value, beginning of period | $46.92 | $37.84 | $40.03 | $38.96 | $39.77 |
| Income from Investment Operations | | | | | |
| Net investment income (loss)A | .58 | .56 | .66B | .59C | .72D |
| Net realized and unrealized gain (loss) | (4.89) | 9.24 | (2.38) | .80 | (.68) |
| Total from investment operations | (4.31) | 9.80 | (1.72) | 1.39 | .04 |
| Distributions from net investment income | (.56) | (.67) | (.46) | (.32) | (.54) |
| Distributions from net realized gain | (1.83) | (.05) | (.01) | – | (.31) |
| Total distributions | (2.39) | (.72) | (.47) | (.32) | (.85) |
| Redemption fees added to paid in capitalA | – | –E | –E | –E | –E |
| Net asset value, end of period | $40.22 | $46.92 | $37.84 | $40.03 | $38.96 |
| Total ReturnF | (9.68)% | 26.44% | (4.36)% | 3.58% | .12% |
| Ratios to Average Net AssetsG,H | | | | | |
| Expenses before reductions | .77% | .82% | .86% | .86% | .80% |
| Expenses net of fee waivers, if any | .77% | .82% | .86% | .86% | .80% |
| Expenses net of all reductions | .76% | .80% | .85% | .85% | .79% |
| Net investment income (loss) | 1.29% | 1.35% | 1.74%B | 1.47%C | 1.83%D |
| Supplemental Data | | | | | |
| Net assets, end of period (in millions) | $118 | $101 | $38 | $30 | $35 |
| Portfolio turnover rateI | 45%J | 42% | 50%J | 60%J | 57% |
A Calculated based on average shares outstanding during the period.
B Net investment income per share reflects a large, non-recurring dividend which amounted to $.14 per share. Excluding this non-recurring dividend, the ratio of net investment income (loss) to average net assets would have been 1.36%.
C Net investment income per share reflects a large, non-recurring dividend which amounted to $.12 per share. Excluding this non-recurring dividend, the ratio of net investment income (loss) to average net assets would have been 1.16%.
D Net investment income per share reflects a large, non-recurring dividend which amounted to $.21 per share. Excluding this non-recurring dividend, the ratio of net investment income (loss) to average net assets would have been 1.28%.
E Amount represents less than $.005 per share.
F Total returns would have been lower if certain expenses had not been reduced during the applicable periods shown.
G Fees and expenses of any underlying Fidelity Central Funds are not included in the Fund's expense ratio. The Fund indirectly bears its proportionate share of the expenses of any underlying Fidelity Central Funds.
H Expense ratios reflect operating expenses of the class. Expenses before reductions do not reflect amounts reimbursed by the investment adviser or reductions from brokerage service arrangements or reductions from other expense offset arrangements and do not represent the amount paid by the class during periods when reimbursements or reductions occur. Expenses net of fee waivers reflect expenses after reimbursement by the investment adviser but prior to reductions from brokerage service arrangements or other expense offset arrangements. Expenses net of all reductions represent the net expenses paid by the class.
I Amount does not include the portfolio activity of any underlying Fidelity Central Funds.
J Portfolio turnover rate excludes securities received or delivered in-kind.
See accompanying notes which are an integral part of the financial statements.
Notes to Financial Statements
For the period ended October 31, 2018
(Amounts in thousands except percentages)
1. Organization.
Fidelity International Discovery Fund (the Fund) is a fund of Fidelity Investment Trust (the Trust) and is authorized to issue an unlimited number of shares. The Trust is registered under the Investment Company Act of 1940, as amended (the 1940 Act), as an open-end management investment company organized as a Massachusetts business trust. The Fund offers Class A, Class M, Class C, International Discovery, Class K, Class I and Class Z shares, each of which has equal rights as to assets and voting privileges. Each class has exclusive voting rights with respect to matters that affect that class.
2. Investments in Fidelity Central Funds.
The Fund invests in Fidelity Central Funds, which are open-end investment companies generally available only to other investment companies and accounts managed by the investment adviser and its affiliates. The Fund's Schedule of Investments lists each of the Fidelity Central Funds held as of period end, if any, as an investment of the Fund, but does not include the underlying holdings of each Fidelity Central Fund. As an Investing Fund, the Fund indirectly bears its proportionate share of the expenses of the underlying Fidelity Central Funds.
The Money Market Central Funds seek preservation of capital and current income and are managed by Fidelity Investments Money Management, Inc. (FIMM), an affiliate of the investment adviser. Annualized expenses of the Money Market Central Funds as of their most recent shareholder report date are less than .005%.
A complete unaudited list of holdings for each Fidelity Central Fund is available upon request or at the Securities and Exchange Commission (the SEC) website at www.sec.gov. In addition, the financial statements of the Fidelity Central Funds, which are not covered by the Fund's Report of Independent Registered Public Accounting Firm, are available on the SEC website or upon request.
3. Significant Accounting Policies.
The Fund is an investment company and applies the accounting and reporting guidance of the Financial Accounting Standards Board (FASB) Accounting Standards Codification Topic 946 Financial Services – Investments Companies. The financial statements have been prepared in conformity with accounting principles generally accepted in the United States of America (GAAP), which require management to make certain estimates and assumptions at the date of the financial statements. Actual results could differ from those estimates. Subsequent events, if any, through the date that the financial statements were issued have been evaluated in the preparation of the financial statements. The following summarizes the significant accounting policies of the Fund:
Investment Valuation. Investments are valued as of 4:00 p.m. Eastern time on the last calendar day of the period. The Board of Trustees (the Board) has delegated the day to day responsibility for the valuation of the Fund's investments to the Fair Value Committee (the Committee) established by the Fund's investment adviser. In accordance with valuation policies and procedures approved by the Board, the Fund attempts to obtain prices from one or more third party pricing vendors or brokers to value its investments. When current market prices, quotations or currency exchange rates are not readily available or reliable, investments will be fair valued in good faith by the Committee, in accordance with procedures adopted by the Board. Factors used in determining fair value vary by investment type and may include market or investment specific events, changes in interest rates and credit quality. The frequency with which these procedures are used cannot be predicted and they may be utilized to a significant extent. The Committee oversees the Fund's valuation policies and procedures and reports to the Board on the Committee's activities and fair value determinations. The Board monitors the appropriateness of the procedures used in valuing the Fund's investments and ratifies the fair value determinations of the Committee.
The Fund categorizes the inputs to valuation techniques used to value its investments into a disclosure hierarchy consisting of three levels as shown below:
- Level 1 – quoted prices in active markets for identical investments
- Level 2 – other significant observable inputs (including quoted prices for similar investments, interest rates, prepayment speeds, etc.)
- Level 3 – unobservable inputs (including the Fund's own assumptions based on the best information available)
Valuation techniques used to value the Fund's investments by major category are as follows:
Equity securities, including restricted securities, for which market quotations are readily available, are valued at the last reported sale price or official closing price as reported by a third party pricing vendor on the primary market or exchange on which they are traded and are categorized as Level 1 in the hierarchy. In the event there were no sales during the day or closing prices are not available, securities are valued at the last quoted bid price or may be valued using the last available price and are generally categorized as Level 2 in the hierarchy. For foreign equity securities, when market or security specific events arise, comparisons to the valuation of American Depositary Receipts (ADRs), futures contracts, Exchange-Traded Funds (ETFs) and certain indexes as well as quoted prices for similar securities may be used and would be categorized as Level 2 in the hierarchy. Utilizing these techniques may result in transfers between Level 1 and Level 2. For equity securities, including restricted securities, where observable inputs are limited, assumptions about market activity and risk are used and these securities may be categorized as Level 3 in the hierarchy.
Debt securities, including restricted securities, are valued based on evaluated prices received from third party pricing vendors or from brokers who make markets in such securities. U.S. government and government agency obligations are valued by pricing vendors who utilize matrix pricing which considers yield or price of bonds of comparable quality, coupon, maturity and type or by broker-supplied prices. When independent prices are unavailable or unreliable, debt securities may be valued utilizing pricing methodologies which consider similar factors that would be used by third party pricing vendors. Debt securities are generally categorized as Level 2 in the hierarchy but may be Level 3 depending on the circumstances.
Futures contracts are valued at the settlement price established each day by the board of trade or exchange on which they are traded and are categorized as Level 1 in the hierarchy. Investments in open-end mutual funds, including the Fidelity Central Funds, are valued at their closing net asset value (NAV) each business day and are categorized as Level 1 in the hierarchy.
Changes in valuation techniques may result in transfers in or out of an assigned level within the disclosure hierarchy. The aggregate value of investments by input level as of October 31, 2018, including information on transfers between Levels 1 and 2, is included at the end of the Fund's Schedule of Investments.
Foreign Currency. The Fund may use foreign currency contracts to facilitate transactions in foreign-denominated securities. Gains and losses from these transactions may arise from changes in the value of the foreign currency or if the counterparties do not perform under the contracts' terms.
Foreign-denominated assets, including investment securities, and liabilities are translated into U.S. dollars at the exchange rates at period end. Purchases and sales of investment securities, income and dividends received and expenses denominated in foreign currencies are translated into U.S. dollars at the exchange rate in effect on the transaction date.
The effects of exchange rate fluctuations on investments are included with the net realized and unrealized gain (loss) on investment securities. Other foreign currency transactions resulting in realized and unrealized gain (loss) are disclosed separately.
Investment Transactions and Income. For financial reporting purposes, the Fund's investment holdings and NAV include trades executed through the end of the last business day of the period. The NAV per share for processing shareholder transactions is calculated as of the close of business of the New York Stock Exchange (NYSE), normally 4:00 p.m. Eastern time and includes trades executed through the end of the prior business day. Gains and losses on securities sold are determined on the basis of identified cost and include proceeds received from litigation. Dividend income is recorded on the ex-dividend date, except for certain dividends from foreign securities where the ex-dividend date may have passed, which are recorded as soon as the Fund is informed of the ex-dividend date. Non-cash dividends included in dividend income, if any, are recorded at the fair market value of the securities received. Income and capital gain distributions from Fidelity Central Funds, if any, are recorded on the ex-dividend date. Certain distributions received by the Fund represent a return of capital or capital gain. The Fund determines the components of these distributions subsequent to the ex-dividend date, based upon receipt of tax filings or other correspondence relating to the underlying investment. These distributions are recorded as a reduction of cost of investments and/or as a realized gain. Interest income is accrued as earned and includes coupon interest and amortization of premium and accretion of discount on debt securities as applicable. Investment income is recorded net of foreign taxes withheld where recovery of such taxes is uncertain.
Class Allocations and Expenses. Investment income, realized and unrealized capital gains and losses, common expenses of the Fund, and certain fund-level expense reductions, if any, are allocated daily on a pro-rata basis to each class based on the relative net assets of each class to the total net assets of the Fund. Each class differs with respect to transfer agent and distribution and service plan fees incurred. Certain expense reductions may also differ by class. For the reporting period, the allocated portion of income and expenses to each class as a percent of its average net assets may vary due to the timing of recording these transactions in relation to fluctuating net assets of the classes. Expenses directly attributable to a fund are charged to that fund. Expenses attributable to more than one fund are allocated among the respective funds on the basis of relative net assets or other appropriate methods. Expense estimates are accrued in the period to which they relate and adjustments are made when actual amounts are known.
Deferred Trustee Compensation. Under a Deferred Compensation Plan (the Plan) for the Fund, certain independent Trustees have elected to defer receipt of a portion of their annual compensation. Deferred amounts are invested in a cross-section of Fidelity funds, are marked-to-market and remain in the Fund until distributed in accordance with the Plan. The investment of deferred amounts and the offsetting payable to the Trustees of $533 are included in the accompanying Statement of Assets and Liabilities in other receivables and other payables and accrued expenses, respectively.
Income Tax Information and Distributions to Shareholders. Each year, the Fund intends to qualify as a regulated investment company under Subchapter M of the Internal Revenue Code, including distributing substantially all of its taxable income and realized gains. As a result, no provision for U.S. Federal income taxes is required. As of October 31, 2018, the Fund did not have any unrecognized tax benefits in the financial statements; nor is the Fund aware of any tax positions for which it is reasonably possible that the total amounts of unrecognized tax benefits will significantly change in the next twelve months. The Fund files a U.S. federal tax return, in addition to state and local tax returns as required. The Fund's federal income tax returns are subject to examination by the Internal Revenue Service (IRS) for a period of three fiscal years after they are filed. State and local tax returns may be subject to examination for an additional fiscal year depending on the jurisdiction. Foreign taxes are provided for based on the Fund's understanding of the tax rules and rates that exist in the foreign markets in which it invests.
Distributions are declared and recorded on the ex-dividend date. Income and capital gain distributions are declared separately for each class. Income and capital gain distributions are determined in accordance with income tax regulations, which may differ from GAAP. In addition, the Fund claimed a portion of the payment made to redeeming shareholders as a distribution for income tax purposes.
Capital accounts within the financial statements are adjusted for permanent book-tax differences. These adjustments have no impact on net assets or the results of operations. Capital accounts are not adjusted for temporary book-tax differences which will reverse in a subsequent period.
Book-tax differences are primarily due to foreign currency transactions, passive foreign investment companies (PFIC), market discount, redemptions in kind, deferred trustees compensation and losses deferred due to wash sales.
As of period end, the cost and unrealized appreciation (depreciation) in securities, and derivatives if applicable, for federal income tax purposes were as follows:
| Gross unrealized appreciation | $1,387,775 |
| Gross unrealized depreciation | (552,589) |
| Net unrealized appreciation (depreciation) | $835,186 |
| Tax Cost | $8,853,051 |
The tax-based components of distributable earnings as of period end were as follows:
| Undistributed ordinary income | $100,442 |
| Undistributed long-term capital gain | $212,907 |
| Net unrealized appreciation (depreciation) on securities and other investments | $832,878 |
The tax character of distributions paid was as follows:
| | October 31, 2018 | October 31, 2017 |
| Ordinary Income | $123,038 | $ 162,113 |
| Long-term Capital Gains | 412,903 | – |
| Total | $535,941 | $ 162,113 |
Restricted Securities. The Fund may invest in securities that are subject to legal or contractual restrictions on resale. These securities generally may be resold in transactions exempt from registration or to the public if the securities are registered. Disposal of these securities may involve time-consuming negotiations and expense, and prompt sale at an acceptable price may be difficult. Information regarding restricted securities is included at the end of the Fund's Schedule of Investments.
New Rule Issuance. During August 2018, the U.S. Securities and Exchange Commission issued Final Rule Release No. 33-10532, Disclosure Update and Simplification. This Final Rule includes amendments specific to registered investment companies that are intended to eliminate overlap in disclosure requirements between Regulation S-X and GAAP. In accordance with these amendments, certain line-items in the Fund's financial statements have been combined or removed for the current period as outlined in the table below.
| Financial Statement | Current Line-Item Presentation | Prior Line-Item Presentation |
| Statement of Assets and Liabilities | Total distributable earnings (loss) | Undistributed/Distributions in excess of/Accumulated net investment income (loss)
Accumulated/Undistributed net realized gain (loss)
Net unrealized appreciation (depreciation) |
| Statement of Changes in Net Assets | N/A - removed | Undistributed/Distributions in excess of/Accumulated net investment income (loss) end of period |
| Statement of Changes in Net Assets | Distributions to shareholders | Distributions to shareholders from net investment income
Distributions to shareholders from net realized gain |
| Distributions to Shareholders Note to Financial Statements | Distributions to shareholders | Distributions to shareholders from net investment income
Distributions to shareholders from net realized gain |
4. Derivative Instruments.
Risk Exposures and the Use of Derivative Instruments. The Fund's investment objective allows the Fund to enter into various types of derivative contracts, including futures contracts. Derivatives are investments whose value is primarily derived from underlying assets, indices or reference rates and may be transacted on an exchange or over-the-counter (OTC). Derivatives may involve a future commitment to buy or sell a specified asset based on specified terms, to exchange future cash flows at periodic intervals based on a notional principal amount, or for one party to make one or more payments upon the occurrence of specified events in exchange for periodic payments from the other party.
The Fund used derivatives to increase returns and to manage exposure to certain risks as defined below. The success of any strategy involving derivatives depends on analysis of numerous economic factors, and if the strategies for investment do not work as intended, the Fund may not achieve its objectives.
The Fund's use of derivatives increased or decreased its exposure to the following risk:
| Equity Risk | Equity risk relates to the fluctuations in the value of financial instruments as a result of changes in market prices (other than those arising from interest rate risk or foreign exchange risk), whether caused by factors specific to an individual investment, its issuer, or all factors affecting all instruments traded in a market or market segment.
|
The Fund is also exposed to additional risks from investing in derivatives, such as liquidity risk and counterparty credit risk. Liquidity risk is the risk that the Fund will be unable to close out the derivative in the open market in a timely manner. Counterparty credit risk is the risk that the counterparty will not be able to fulfill its obligation to the Fund. Counterparty credit risk related to exchange-traded futures contracts may be mitigated by the protection provided by the exchange on which they trade.
Investing in derivatives may involve greater risks than investing in the underlying assets directly and, to varying degrees, may involve risk of loss in excess of any initial investment and collateral received and amounts recognized in the Statement of Assets and Liabilities. In addition, there may be the risk that the change in value of the derivative contract does not correspond to the change in value of the underlying instrument.
Futures Contracts. A futures contract is an agreement between two parties to buy or sell a specified underlying instrument for a fixed price at a specified future date. The Fund used futures contracts to manage its exposure to the stock market.
Upon entering into a futures contract, a fund is required to deposit either cash or securities (initial margin) with a clearing broker in an amount equal to a certain percentage of the face value of the contract. Futures contracts are marked-to-market daily and subsequent daily payments (variation margin) are made or received by a fund depending on the daily fluctuations in the value of the futures contracts and are recorded as unrealized appreciation or (depreciation). This receivable and/or payable, if any, is included in daily variation margin on futures contracts in the Statement of Assets and Liabilities. Realized gain or (loss) is recorded upon the expiration or closing of a futures contract. The net realized gain (loss) and change in net unrealized appreciation (depreciation) on futures contracts during the period is presented in the Statement of Operations.
Any open futures contracts at period end are presented in the Schedule of Investments under the caption "Futures Contracts". The notional amount at value reflects each contract's exposure to the underlying instrument or index at period end and is representative of volume of activity during the period. Securities deposited to meet initial margin requirements are identified in the Schedule of Investments.
5. Purchases and Sales of Investments.
Purchases and sales of securities, other than short-term securities and in-kind transactions, aggregated $4,496,106 and $5,146,595, respectively.
Redemptions In-Kind. During the period, 2,145 shares of the Fund held by unaffiliated entities were redeemed in-kind for investments and cash with a value of $96,039. The net realized gain of $24,574 on investments delivered through the in-kind redemptions is included in the accompanying Statement of Operations. The amount of the redemptions is included in share transactions activity shown in the accompanying Statement of Changes in Net Assets as well as the Notes to Financial Statements. The Fund recognized no gain or loss for federal income tax purposes.
6. Fees and Other Transactions with Affiliates.
Management Fee. Fidelity Management & Research Company (the investment adviser) and its affiliates provide the Fund with investment management related services for which the Fund pays a monthly management fee. The management fee is the sum of an individual fund fee rate that is based on an annual rate of .424% of the Fund's average net assets and an annualized group fee rate that averaged .24% during the period. The group fee rate is based upon the average net assets of all the mutual funds advised by the investment adviser, including any mutual funds previously advised by the investment adviser that are currently advised by Fidelity SelectCo, LLC, an affiliate of the investment adviser. The group fee rate decreases as assets under management increase and increases as assets under management decrease. In addition, the management fee is subject to a performance adjustment (up to a maximum of +/- .20% of the Fund's average net assets over a 36 month performance period). The upward or downward adjustment to the management fee is based on the relative investment performance of International Discovery as compared to its benchmark index, the MSCI EAFE Index, over the same 36 month performance period. For the reporting period, the total annual management fee rate, including the performance adjustment, was .69% of the Fund's average net assets. The performance adjustment included in the management fee rate may be higher or lower than the maximum performance adjustment rate due to the difference between the average net assets for the reporting and performance periods.
Distribution and Service Plan Fees. In accordance with Rule 12b-1 of the 1940 Act, the Fund has adopted separate Distribution and Service Plans for each class of shares. Certain classes pay Fidelity Distributors Corporation (FDC), an affiliate of the investment adviser, separate Distribution and Service Fees, each of which is based on an annual percentage of each class' average net assets. In addition, FDC may pay financial intermediaries for selling shares of the Fund and providing shareholder support services. For the period, the Distribution and Service Fee rates, total fees and amounts retained by FDC were as follows:
| | Distribution Fee | Service Fee | Total Fees | Retained by FDC |
| Class A | -% | .25% | $579 | $12 |
| Class M | .25% | .25% | 167 | 1 |
| Class C | .75% | .25% | 265 | 24 |
| | | | $1,011 | $37 |
Sales Load. FDC may receive a front-end sales charge of up to 5.75% for selling Class A shares and 3.50% for selling Class M shares, some of which is paid to financial intermediaries for selling shares of the Fund. Depending on the holding period, FDC may receive contingent deferred sales charges levied on Class A, Class M and Class C redemptions. The deferred sales charges are 1.00% for Class C shares, 1.00% for certain purchases of Class A shares and .25% for certain purchases of Class M shares.
For the period, sales charge amounts retained by FDC were as follows:
| | Retained by FDC |
| Class A | $38 |
| Class M | 3 |
| Class C(a) | 4 |
| | $45 |
(a) When Class C shares are initially sold, FDC pays commissions from its own resources to financial intermediaries through which the sales are made.
Transfer Agent Fees. Fidelity Investments Institutional Operations Company, Inc., (FIIOC), an affiliate of the investment adviser, is the transfer, dividend disbursing and shareholder servicing agent for each class of the Fund. FIIOC receives account fees and asset-based fees that vary according to the account size and type of account of the shareholders of the respective classes of the Fund, except for Class K and Class Z. FIIOC receives an asset-based fee of Class K's and Class Z's average net assets. FIIOC pays for typesetting, printing and mailing of shareholder reports, except proxy statements.
For the period, transfer agent fees for each class were as follows:
| | Amount | % of Class-Level Average Net Assets |
| Class A | $570 | .25 |
| Class M | 79 | .24 |
| Class C | 74 | .28 |
| International Discovery | 11,513 | .16 |
| Class K | 1,059 | .05 |
| Class I | 1,178 | .19 |
| Class Z | 54 | .05 |
| | $14,527 | |
Accounting and Security Lending Fees. Fidelity Service Company, Inc. (FSC), an affiliate of the investment adviser, maintains the Fund's accounting records. The accounting fee is based on the level of average net assets for each month. Under a separate contract, FSC administers the security lending program. The security lending fee is based on the number and duration of lending transactions. For the period, the fees were equivalent to an annual rate of .02%.
Brokerage Commissions. The Fund placed a portion of its portfolio transactions with brokerage firms which are affiliates of the investment adviser. Brokerage commissions are included in net realized gain (loss) and change in net unrealized appreciation (depreciation) in the Statement of Operations. The commissions paid to these affiliated firms were $19 for the period.
Interfund Trades. The Fund may purchase from or sell securities to other Fidelity Funds under procedures adopted by the Board. The procedures have been designed to ensure these interfund trades are executed in accordance with Rule 17a-7 of the 1940 Act. Interfund trades are included within the respective purchases and sales amounts shown in the Purchases and Sales of Investments note.
7. Committed Line of Credit.
The Fund participates with other funds managed by the investment adviser or an affiliate in a $4.25 billion credit facility (the "line of credit") to be utilized for temporary or emergency purposes to fund shareholder redemptions or for other short-term liquidity purposes. The Fund has agreed to pay commitment fees on its pro-rata portion of the line of credit, which amounted to $29 and is reflected in Miscellaneous expenses on the Statement of Operations. During the period, the Fund did not borrow on this line of credit.
8. Security Lending.
The Fund lends portfolio securities through a lending agent from time to time in order to earn additional income. For equity securities, a lending agent is used and may loan securities to certain qualified borrowers, including Fidelity Capital Markets (FCM), a broker-dealer affiliated with the Fund. On the settlement date of the loan, the Fund receives collateral (in the form of U.S. Treasury obligations, letters of credit and/or cash) against the loaned securities and maintains collateral in an amount not less than 100% of the market value of the loaned securities during the period of the loan. The market value of the loaned securities is determined at the close of business of the Fund and any additional required collateral is delivered to the Fund on the next business day. The Fund or borrower may terminate the loan at any time, and if the borrower defaults on its obligation to return the securities loaned because of insolvency or other reasons, the Fund may apply collateral received from the borrower against the obligation. The Fund may experience delays and costs in recovering the securities loaned. Any cash collateral received is invested in the Fidelity Securities Lending Cash Central Fund. The value of loaned securities and cash collateral at period end are disclosed on the Fund's Statement of Assets and Liabilities. At period end, there were no security loans outstanding with FCM. Security lending income represents the income earned on investing cash collateral, less rebates paid to borrowers and any lending agent fees associated with the loan, plus any premium payments received for lending certain types of securities. Security lending income is presented in the Statement of Operations as a component of income from Fidelity Central Funds. Total security lending income during the period amounted to $3,292, including less than five hundred dollars from securities loaned to FCM.
9. Expense Reductions.
Commissions paid to certain brokers with whom the investment adviser, or its affiliates, places trades on behalf of the Fund include an amount in addition to trade execution, which may be rebated back to the Fund to offset certain expenses. This amount totaled $1,174 for the period. In addition, through arrangements with the Fund's custodian, credits realized as a result of certain uninvested cash balances were used to reduce the Fund's expenses. During the period, these credits reduced the Fund's custody expenses by $1.
In addition, during the period the investment adviser reimbursed and/or waived a portion of fund-level operating expenses in the amount of $108.
10. Distributions to Shareholders.
Distributions to shareholders of each class were as follows:
| | Year ended
October 31, 2018 | Year ended
October 31, 2017 |
| Distributions to shareholders | | |
| Class A | $11,257 | $– |
| Class M | 1,557 | – |
| Class C | 1,132 | – |
| International Discovery | 368,791 | – |
| Class K | 115,669 | – |
| Class I | 32,390 | – |
| Class Z | 5,145 | – |
| Total | $535,941 | $– |
| From net investment income | | |
| Class A | $– | $2,894 |
| Class M | – | 333 |
| Class C | – | 92 |
| International Discovery | – | 102,284 |
| Class K | – | 32,411 |
| Class I | – | 11,493 |
| Class Z | – | 667 |
| Total | $– | $150,174 |
| From net realized gain | | |
| Class A | $– | $302 |
| Class M | – | 44 |
| Class C | – | 33 |
| International Discovery | – | 8,190 |
| Class K | – | 2,392 |
| Class I | – | 929 |
| Class Z | – | 49 |
| Total | $– | $11,939 |
11. Share Transactions.
Share transactions for each class were as follows and may contain automatic conversions between classes or exchanges between affiliated funds:
| | Shares | Shares | Dollars | Dollars |
| | Year ended October 31, 2018 | Year ended October 31, 2017 | Year ended October 31, 2018 | Year ended October 31, 2017 |
| Class A | | | | |
| Shares sold | 601 | 712 | $27,288 | $29,106 |
| Reinvestment of distributions | 252 | 87 | 11,177 | 3,152 |
| Shares redeemed | (1,390) | (1,774) | (62,507) | (71,253) |
| Net increase (decrease) | (537) | (975) | $(24,042) | $(38,995) |
| Class M | | | | |
| Shares sold | 91 | 80 | $4,077 | $3,246 |
| Reinvestment of distributions | 35 | 10 | 1,549 | 365 |
| Shares redeemed | (177) | (274) | (7,916) | (10,830) |
| Net increase (decrease) | (51) | (184) | $(2,290) | $(7,219) |
| Class C | | | | |
| Shares sold | 57 | 83 | $2,552 | $3,499 |
| Reinvestment of distributions | 25 | 3 | 1,083 | 116 |
| Shares redeemed | (152) | (174) | (6,753) | (6,878) |
| Net increase (decrease) | (70) | (88) | $(3,118) | $(3,263) |
| International Discovery | | | | |
| Shares sold | 18,511 | 19,989 | $834,070 | $812,564 |
| Reinvestment of distributions | 7,869 | 2,884 | 351,491 | 105,223 |
| Shares redeemed | (21,100) | (35,967) | (952,137) | (1,442,640) |
| Net increase (decrease) | 5,280 | (13,094) | $233,424 | $(524,853) |
| Class K | | | | |
| Shares sold | 15,085 | 10,877 | $683,626 | $448,875 |
| Reinvestment of distributions | 2,597 | 957 | 115,669 | 34,802 |
| Shares redeemed | (13,867)(a) | (14,039) | (624,849)(a) | (560,342) |
| Net increase (decrease) | 3,815 | (2,205) | $174,446 | $(76,665) |
| Class I | | | | |
| Shares sold | 3,244 | 3,202 | $143,374 | $130,302 |
| Reinvestment of distributions | 224 | 82 | 9,992 | 2,985 |
| Shares redeemed | (3,099) | (8,961) | (138,824) | (349,072) |
| Net increase (decrease) | 369 | (5,677) | $14,542 | $(215,785) |
| Class Z | | | | |
| Shares sold | 1,231 | 1,483 | $55,218 | $58,502 |
| Reinvestment of distributions | 67 | 20 | 2,993 | 716 |
| Shares redeemed | (517) | (351) | (23,246) | (14,440) |
| Net increase (decrease) | 781 | 1,152 | $34,965 | $44,778 |
(a) Amount includes in-kind redemptions (see the Redemptions In-Kind note for additional details).
12. Other.
The Fund's organizational documents provide former and current trustees and officers with a limited indemnification against liabilities arising in connection with the performance of their duties to the Fund. In the normal course of business, the Fund may also enter into contracts that provide general indemnifications. The Fund's maximum exposure under these arrangements is unknown as this would be dependent on future claims that may be made against the Fund. The risk of material loss from such claims is considered remote.
At the end of the period, Strategic Advisers International Fund was the owner of record of approximately 11% of the total outstanding shares of the Fund. Mutual funds managed by the investment adviser or its affiliates were the owners of record, in the aggregate, of approximately 22% of the total outstanding shares of the Fund.
Report of Independent Registered Public Accounting Firm
To the Board of Trustees of Fidelity Investment Trust and Shareholders of Fidelity International Discovery Fund:
Opinion on the Financial Statements
We have audited the accompanying statement of assets and liabilities, including the schedule of investments, of Fidelity International Discovery Fund (one of the funds constituting Fidelity Investment Trust, referred to hereafter as the "Fund") as of October 31, 2018, the related statement of operations for the year ended October 31, 2018, the statement of changes in net assets for each of the two years in the period ended October 31, 2018, including the related notes, and the financial highlights for each of the five years in the period ended October 31, 2018 (collectively referred to as the “financial statements”). In our opinion, the financial statements present fairly, in all material respects, the financial position of the Fund as of October 31, 2018, the results of its operations for the year then ended, the changes in its net assets for each of the two years in the period ended October 31, 2018 and the financial highlights for each of the five years in the period ended October 31, 2018 in conformity with accounting principles generally accepted in the United States of America.
Basis for Opinion
These financial statements are the responsibility of the Fund’s management. Our responsibility is to express an opinion on the Fund’s financial statements based on our audits. We are a public accounting firm registered with the Public Company Accounting Oversight Board (United States) (“PCAOB”) and are required to be independent with respect to the Fund in accordance with the U.S. federal securities laws and the applicable rules and regulations of the Securities and Exchange Commission and the PCAOB.
We conducted our audits of these financial statements in accordance with the standards of the PCAOB. Those standards require that we plan and perform the audit to obtain reasonable assurance about whether the financial statements are free of material misstatement, whether due to error or fraud.
Our audits included performing procedures to assess the risks of material misstatement of the financial statements, whether due to error or fraud, and performing procedures that respond to those risks. Such procedures included examining, on a test basis, evidence regarding the amounts and disclosures in the financial statements. Our audits also included evaluating the accounting principles used and significant estimates made by management, as well as evaluating the overall presentation of the financial statements. Our procedures included confirmation of securities owned as of October 31, 2018 by correspondence with the custodian, and brokers; when replies were not received from brokers, we performed other auditing procedures. We believe that our audits provide a reasonable basis for our opinion.
PricewaterhouseCoopers LLP
Boston, Massachusetts
December 12, 2018
We have served as the auditor of one or more investment companies in the Fidelity group of funds since 1932.
Trustees and Officers
The Trustees, Members of the Advisory Board (if any), and officers of the trust and fund, as applicable, are listed below. The Board of Trustees governs the fund and is responsible for protecting the interests of shareholders. The Trustees are experienced executives who meet periodically throughout the year to oversee the fund's activities, review contractual arrangements with companies that provide services to the fund, oversee management of the risks associated with such activities and contractual arrangements, and review the fund's performance. Except for Jonathan Chiel, each of the Trustees oversees 283 funds. Mr. Chiel oversees 154 funds.
The Trustees hold office without limit in time except that (a) any Trustee may resign; (b) any Trustee may be removed by written instrument, signed by at least two-thirds of the number of Trustees prior to such removal; (c) any Trustee who requests to be retired or who has become incapacitated by illness or injury may be retired by written instrument signed by a majority of the other Trustees; and (d) any Trustee may be removed at any special meeting of shareholders by a two-thirds vote of the outstanding voting securities of the trust. Each Trustee who is not an interested person (as defined in the 1940 Act) of the trust and the fund is referred to herein as an Independent Trustee. Each Independent Trustee shall retire not later than the last day of the calendar year in which his or her 75th birthday occurs. The Independent Trustees may waive this mandatory retirement age policy with respect to individual Trustees. Officers and Advisory Board Members hold office without limit in time, except that any officer or Advisory Board Member may resign or may be removed by a vote of a majority of the Trustees at any regular meeting or any special meeting of the Trustees. Except as indicated, each individual has held the office shown or other offices in the same company for the past five years.
The fund’s Statement of Additional Information (SAI) includes more information about the Trustees. To request a free copy, call Fidelity at 1-877-208-0098.
Experience, Skills, Attributes, and Qualifications of the Trustees. The Governance and Nominating Committee has adopted a statement of policy that describes the experience, qualifications, attributes, and skills that are necessary and desirable for potential Independent Trustee candidates (Statement of Policy). The Board believes that each Trustee satisfied at the time he or she was initially elected or appointed a Trustee, and continues to satisfy, the standards contemplated by the Statement of Policy. The Governance and Nominating Committee also engages professional search firms to help identify potential Independent Trustee candidates who have the experience, qualifications, attributes, and skills consistent with the Statement of Policy. From time to time, additional criteria based on the composition and skills of the current Independent Trustees, as well as experience or skills that may be appropriate in light of future changes to board composition, business conditions, and regulatory or other developments, have also been considered by the professional search firms and the Governance and Nominating Committee. In addition, the Board takes into account the Trustees' commitment and participation in Board and committee meetings, as well as their leadership of standing and ad hoc committees throughout their tenure.
In determining that a particular Trustee was and continues to be qualified to serve as a Trustee, the Board has considered a variety of criteria, none of which, in isolation, was controlling. The Board believes that, collectively, the Trustees have balanced and diverse experience, qualifications, attributes, and skills, which allow the Board to operate effectively in governing the fund and protecting the interests of shareholders. Information about the specific experience, skills, attributes, and qualifications of each Trustee, which in each case led to the Board's conclusion that the Trustee should serve (or continue to serve) as a trustee of the fund, is provided below.
Board Structure and Oversight Function. James C. Curvey is an interested person and currently serves as Chairman. The Trustees have determined that an interested Chairman is appropriate and benefits shareholders because an interested Chairman has a personal and professional stake in the quality and continuity of services provided to the fund. Independent Trustees exercise their informed business judgment to appoint an individual of their choosing to serve as Chairman, regardless of whether the Trustee happens to be independent or a member of management. The Independent Trustees have determined that they can act independently and effectively without having an Independent Trustee serve as Chairman and that a key structural component for assuring that they are in a position to do so is for the Independent Trustees to constitute a substantial majority for the Board. The Independent Trustees also regularly meet in executive session. Ned C. Lautenbach serves as Chairman of the Independent Trustees and as such (i) acts as a liaison between the Independent Trustees and management with respect to matters important to the Independent Trustees and (ii) with management prepares agendas for Board meetings.
Fidelity® funds are overseen by different Boards of Trustees. The fund's Board oversees Fidelity's high income and certain equity funds, and other Boards oversee Fidelity's investment-grade bond, money market, asset allocation, and other equity funds. The asset allocation funds may invest in Fidelity® funds overseen by the fund's Board. The use of separate Boards, each with its own committee structure, allows the Trustees of each group of Fidelity® funds to focus on the unique issues of the funds they oversee, including common research, investment, and operational issues. On occasion, the separate Boards establish joint committees to address issues of overlapping consequences for the Fidelity® funds overseen by each Board.
The Trustees operate using a system of committees to facilitate the timely and efficient consideration of all matters of importance to the Trustees, the fund, and fund shareholders and to facilitate compliance with legal and regulatory requirements and oversight of the fund's activities and associated risks. The Board, acting through its committees, has charged FMR and its affiliates with (i) identifying events or circumstances the occurrence of which could have demonstrably adverse effects on the fund's business and/or reputation; (ii) implementing processes and controls to lessen the possibility that such events or circumstances occur or to mitigate the effects of such events or circumstances if they do occur; and (iii) creating and maintaining a system designed to evaluate continuously business and market conditions in order to facilitate the identification and implementation processes described in (i) and (ii) above. Because the day-to-day operations and activities of the fund are carried out by or through FMR, its affiliates, and other service providers, the fund's exposure to risks is mitigated but not eliminated by the processes overseen by the Trustees. While each of the Board's committees has responsibility for overseeing different aspects of the fund's activities, oversight is exercised primarily through the Operations, Audit, and Compliance Committees. In addition, the Independent Trustees have worked with Fidelity to enhance the Board's oversight of investment and financial risks, legal and regulatory risks, technology risks, and operational risks, including the development of additional risk reporting to the Board. Appropriate personnel, including but not limited to the fund's Chief Compliance Officer (CCO), FMR's internal auditor, the independent accountants, the fund's Treasurer and portfolio management personnel, make periodic reports to the Board's committees, as appropriate, including an annual review of Fidelity's risk management program for the Fidelity® funds. The responsibilities of each standing committee, including their oversight responsibilities, are described further under "Standing Committees of the Trustees."
Interested Trustees*:
Correspondence intended for a Trustee who is an interested person may be sent to Fidelity Investments, 245 Summer Street, Boston, Massachusetts 02210.
Name, Year of Birth; Principal Occupations and Other Relevant Experience+
Jonathan Chiel (1957)
Year of Election or Appointment: 2016
Trustee
Mr. Chiel also serves as Trustee of other Fidelity® funds. Mr. Chiel is Executive Vice President and General Counsel for FMR LLC (diversified financial services company, 2012-present). Previously, Mr. Chiel served as general counsel (2004-2012) and senior vice president and deputy general counsel (2000-2004) for John Hancock Financial Services; a partner with Choate, Hall & Stewart (1996-2000) (law firm); and an Assistant United States Attorney for the United States Attorney’s Office of the District of Massachusetts (1986-95), including Chief of the Criminal Division (1993-1995). Mr. Chiel is a director on the boards of the Boston Bar Foundation and the Maimonides School.
James C. Curvey (1935)
Year of Election or Appointment: 2007
Trustee
Chairman of the Board of Trustees
Mr. Curvey also serves as Trustee of other Fidelity® funds. Mr. Curvey is Vice Chairman (2007-present) and Director of FMR LLC (diversified financial services company). In addition, Mr. Curvey is an Overseer Emeritus for the Boston Symphony Orchestra, a Director of Artis-Naples, and a Trustee of Brewster Academy in Wolfeboro, New Hampshire. Previously, Mr. Curvey served as a Director of Fidelity Research & Analysis Co. (investment adviser firm, 2009-2018), Director of Fidelity Investments Money Management, Inc. (investment adviser firm, 2009-2014) and a Director of FMR and FMR Co., Inc. (investment adviser firms, 2007-2014).
Charles S. Morrison (1960)
Year of Election or Appointment: 2014
Trustee
Mr. Morrison also serves as Trustee of other funds. He serves as President of Fidelity SelectCo, LLC (investment adviser firm, 2017-present) and Fidelity Management & Research Company (FMR) (investment adviser firm, 2016-present), a Director of Fidelity Investments Money Management, Inc. (FIMM) (investment adviser firm, 2014-present), Director of Fidelity SelectCo, LLC (investment adviser firm, 2014-present), President, Asset Management (2014-present), and is an employee of Fidelity Investments. Previously, Mr. Morrison served as Vice President of Fidelity's Fixed Income and Asset Allocation Funds (2012-2014), President, Fixed Income (2011-2014), Vice President of Fidelity's Money Market Funds (2005-2009), President, Money Market Group Leader of FMR (investment adviser firm, 2009), and Senior Vice President, Money Market Group of FMR (2004-2009). Mr. Morrison also served as Vice President of Fidelity's Bond Funds (2002-2005), certain Balanced Funds (2002-2005), and certain Asset Allocation Funds (2002-2007), and as Senior Vice President (2002-2005) of Fidelity's Bond Division.
* Determined to be an “Interested Trustee” by virtue of, among other things, his or her affiliation with the trust or various entities under common control with FMR.
+ The information includes the Trustee's principal occupation during the last five years and other information relating to the experience, attributes, and skills relevant to the Trustee's qualifications to serve as a Trustee, which led to the conclusion that the Trustee should serve as a Trustee for the fund.
Independent Trustees:
Correspondence intended for an Independent Trustee may be sent to Fidelity Investments, P.O. Box 55235, Boston, Massachusetts 02205-5235.
Name, Year of Birth; Principal Occupations and Other Relevant Experience+
Dennis J. Dirks (1948)
Year of Election or Appointment: 2005
Trustee
Mr. Dirks also serves as Trustee of other Fidelity® funds. Prior to his retirement in May 2003, Mr. Dirks was Chief Operating Officer and a member of the Board of The Depository Trust & Clearing Corporation (DTCC). He also served as President, Chief Operating Officer, and Board member of The Depository Trust Company (DTC) and President and Board member of the National Securities Clearing Corporation (NSCC). In addition, Mr. Dirks served as Chief Executive Officer and Board member of the Government Securities Clearing Corporation, Chief Executive Officer and Board member of the Mortgage-Backed Securities Clearing Corporation, as a Trustee and a member of the Finance Committee of Manhattan College (2005-2008), as a Trustee and a member of the Finance Committee of AHRC of Nassau County (2006-2008), as a member of the Independent Directors Council (IDC) Governing Council (2010-2015), and as a member of the Board of Directors for The Brookville Center for Children’s Services, Inc. (2009-2017). Mr. Dirks is a member of the Finance Committee (2016-present), Board of Directors (2017-present) and Board of Trustees (2018-present) and is Treasurer (2018-present) of the Asolo Repertory Theatre.
Donald F. Donahue (1950)
Year of Election or Appointment: 2018
Trustee
Mr. Donahue also serves as a Trustee of other Fidelity® funds. Mr. Donahue is President and Chief Executive Officer of Miranda Partners, LLC (risk consulting for the financial services industry, 2012-present). Previously, Mr. Donahue served as a Member of the Advisory Board of certain Fidelity® funds (2015-2018) and Chief Executive Officer (2006-2012), Chief Operating Officer (2003-2006), and Managing Director, Customer Marketing and Development (1999-2003) of The Depository Trust & Clearing Corporation (financial markets infrastructure). Mr. Donahue serves as a Member (2007-present) and Co-Chairman (2016-present) of the Board of Directors of United Way of New York, Member of the Board of Directors of NYC Leadership Academy (2012-present) and Member of the Board of Advisors of Ripple Labs, Inc. (financial services, 2015-present). He also served as Chairman (2010-2012) and Member of the Board of Directors (2012-2013) of Omgeo, LLC (financial services), Treasurer of United Way of New York (2012-2016), and Member of the Board of Directors of XBRL US (financial services non-profit, 2009-2012) and the International Securities Services Association (2009-2012).
Alan J. Lacy (1953)
Year of Election or Appointment: 2008
Trustee
Mr. Lacy also serves as Trustee of other Fidelity® funds. Mr. Lacy serves as a Director of Bristol-Myers Squibb Company (global pharmaceuticals, 2008-present). He is a Trustee of the California Chapter of The Nature Conservancy (2015-present) and a Director of the Center for Advanced Study in the Behavioral Sciences at Stanford University (2015-present). In addition, Mr. Lacy served as Senior Adviser (2007-2014) of Oak Hill Capital Partners, L.P. (private equity) and also served as Chief Executive Officer (2005) and Vice Chairman (2005-2006) of Sears Holdings Corporation (retail) and Chief Executive Officer and Chairman of the Board of Sears, Roebuck and Co. (retail, 2000-2005). Previously, Mr. Lacy served as Chairman (2014-2017) and a member (2010-2017) of the Board of Directors of Dave & Buster’s Entertainment, Inc. (restaurant and entertainment complexes), as Chairman (2008-2011) and a member (2006-2015) of the Board of Trustees of the National Parks Conservation Association, and as a member of the Board of Directors for The Hillman Companies, Inc. (hardware wholesalers, 2010-2014), Earth Fare, Inc. (retail grocery, 2010-2014), and The Western Union Company (global money transfer, 2006-2011).
Ned C. Lautenbach (1944)
Year of Election or Appointment: 2000
Trustee
Chairman of the Independent Trustees
Mr. Lautenbach also serves as Trustee of other Fidelity® funds. Mr. Lautenbach currently serves as Vice Chair of the Board of Governors, State University System of Florida (2013-present) and is a member of the Council on Foreign Relations (1994-present). He is also a member and has most recently served as Chairman of the Board of Directors of Artis-Naples (2012-present). Previously, Mr. Lautenbach served as a member and then Lead Director of the Board of Directors of Eaton Corporation (diversified industrial, 1997-2016). He was also a Partner and Advisory Partner at Clayton, Dubilier & Rice, LLC (private equity investment, 1998-2010), as well as a Director of Sony Corporation (2006-2007). In addition, Mr. Lautenbach also had a 30-year career with IBM (technology company) during which time he served as Senior Vice President and a member of the Corporate Executive Committee (1968-1998).
Joseph Mauriello (1944)
Year of Election or Appointment: 2008
Trustee
Mr. Mauriello also serves as Trustee of other Fidelity® funds. Prior to his retirement in January 2006, Mr. Mauriello served in numerous senior management positions including Deputy Chairman and Chief Operating Officer (2004-2005), and Vice Chairman of Financial Services (2002-2004) of KPMG LLP US (professional services, 1965-2005). Mr. Mauriello currently serves as a member of the Independent Directors Council (IDC) Governing Council (2015-present). Previously, Mr. Mauriello served as a member of the Board of Directors of XL Group plc. (global insurance and re-insurance, 2006-2018).
Cornelia M. Small (1944)
Year of Election or Appointment: 2005
Trustee
Ms. Small also serves as Trustee of other Fidelity® funds. Ms. Small is a member of the Board of Directors (2009-present) and Chair of the Investment Committee (2010-present) of the Teagle Foundation. Ms. Small also serves on the Investment Committee of the Berkshire Taconic Community Foundation (2008-present). Previously, Ms. Small served as Chairperson (2002-2008) and a member of the Investment Committee and Chairperson (2008-2012) and a member of the Board of Trustees of Smith College. In addition, Ms. Small served as Chief Investment Officer, Director of Global Equity Investments, and a member of the Board of Directors of Scudder, Stevens & Clark and Scudder Kemper Investments.
Garnett A. Smith (1947)
Year of Election or Appointment: 2018
Trustee
Mr. Smith also serves as Trustee of other Fidelity® funds. Prior to Mr. Smith's retirement, he served as Chairman and Chief Executive Officer of Inbrand Corp. (manufacturer of personal absorbent products, 1990-1997). He also served as President (1986-1990) of Inbrand Corp. Prior to his employment with Inbrand Corp., he was employed by a retail fabric chain and North Carolina National Bank. In addition, Mr. Smith served as a Member of the Advisory Board of certain Fidelity® funds (2012-2013) and as a board member of the Jackson Hole Land Trust (2009-2012).
David M. Thomas (1949)
Year of Election or Appointment: 2008
Trustee
Mr. Thomas also serves as Trustee of other Fidelity® funds. Mr. Thomas serves as Non-Executive Chairman of the Board of Directors of Fortune Brands Home and Security (home and security products, 2011-present), as a member of the Board of Directors (2004-present) and Presiding Director (2013-present) of Interpublic Group of Companies, Inc. (marketing communication), and as a member of the Board of Trustees of the University of Florida (2013-present). Previously, Mr. Thomas served as Executive Chairman (2005-2006) and Chairman and Chief Executive Officer (2000-2005) of IMS Health, Inc. (pharmaceutical and healthcare information solutions), and a Director of Fortune Brands, Inc. (consumer products, 2000-2011).
+ The information includes the Trustee's principal occupation during the last five years and other information relating to the experience, attributes, and skills relevant to the Trustee's qualifications to serve as a Trustee, which led to the conclusion that the Trustee should serve as a Trustee for the fund.
Advisory Board Members and Officers:
Correspondence intended for a Member of the Advisory Board (if any) may be sent to Fidelity Investments, P.O. Box 55235, Boston, Massachusetts 02205-5235. Correspondence intended for an officer or Peter S. Lynch may be sent to Fidelity Investments, 245 Summer Street, Boston, Massachusetts 02210. Officers appear below in alphabetical order.
Name, Year of Birth; Principal Occupation
Vicki L. Fuller (1957)
Year of Election or Appointment: 2018
Member of the Advisory Board
Ms. Fuller also serves as Member of the Advisory Board of other Fidelity® funds. Ms. Fuller serves as a member of the Board of Directors, Audit Committee, and Nominating and Governance Committee of The Williams Companies, Inc. (natural gas infrastructure, 2018-present). Previously, Ms. Fuller served as the Chief Investment Officer of the New York State Common Retirement Fund (2012-2018) and held a variety of positions at AllianceBernstein L.P. (global asset management, 1985-2012), including Managing Director (2006-2012) and Senior Vice President and Senior Portfolio Manager (2001-2006).
Peter S. Lynch (1944)
Year of Election or Appointment: 2003
Member of the Advisory Board
Mr. Lynch also serves as Member of the Advisory Board of other Fidelity® funds. Mr. Lynch is Vice Chairman and a Director of FMR (investment adviser firm) and FMR Co., Inc. (investment adviser firm). In addition, Mr. Lynch serves as a Trustee of Boston College and as the Chairman of the Inner-City Scholarship Fund. Previously, Mr. Lynch served on the Special Olympics International Board of Directors (1997-2006).
William S. Stavropoulos (1939)
Year of Election or Appointment: 2018
Member of the Advisory Board
Mr. Stavropoulos also serves as Member of the Advisory Board of other Fidelity® funds. Mr. Stavropoulos serves as President and Founder of the Michigan Baseball Foundation, the Great Lakes Loons (2007-present). Mr. Stavropoulos is Chairman Emeritus of the Board of Directors of The Dow Chemical Company, where he previously served in numerous senior management positions, including President, CEO (1995-2000; 2002-2004), Chairman of the Executive Committee (2000-2006), and as a member of the Board of Directors (1990-2006). Currently, Mr. Stavropoulos is Chairman of the Board of Directors of Univar Inc. (global distributor of commodity and specialty chemicals), a Director of Teradata Corporation (data warehousing and technology solutions), and a member of the Advisory Board for Metalmark Capital LLC (private equity investment, 2005-present). Mr. Stavropoulos is an operating advisor to Clayton, Dubilier & Rice, LLC (private equity investment). In addition, Mr. Stavropoulos is a member of the University of Notre Dame Advisory Council for the College of Science, a Trustee of the Rollin L. Gerstacker Foundation, and a Director of Artis-Naples in Naples, Florida. Previously, Mr. Stavropoulos served as Trustee of certain Fidelity® funds (2001-2018) and as a Director of Chemical Financial Corporation (bank holding company, 1993-2012) and Tyco International, Ltd. (multinational manufacturing and services, 2007-2012).
Carol B. Tomé (1957)
Year of Election or Appointment: 2018
Member of the Advisory Board
Ms. Tomé also serves as Member of the Advisory Board of other Fidelity® funds. Ms. Tomé is Chief Financial Officer (2001-present) and Executive Vice President of Corporate Services (2007-present) of The Home Depot, Inc. (home improvement retailer) and a Director (2003-present) and Chair of the Audit Committee (2004-present) of United Parcel Service, Inc. (package delivery and supply chain management). Previously, Ms. Tomé served as Trustee of certain Fidelity® funds (2017), Senior Vice President of Finance and Accounting/Treasurer (2000-2007) and Vice President and Treasurer (1995-2000) of The Home Depot, Inc. and Chair of the Board (2010-2012), Vice Chair of the Board (2009 and 2013), and a Director (2008-2013) of the Federal Reserve Bank of Atlanta. Ms. Tomé is also a director or trustee of many community and professional organizations.
Michael E. Wiley (1950)
Year of Election or Appointment: 2018
Member of the Advisory Board
Mr. Wiley also serves as Trustee or Member of the Advisory Board of other Fidelity® funds. Mr. Wiley serves as a Director of High Point Resources (exploration and production, 2005-present). Previously, Mr. Wiley served as a Director of Andeavor Corporation (independent oil refiner and marketer, 2005-2018), a Director of Andeavor Logistics LP (natural resources logistics, 2015-2018), a Director of Post Oak Bank (privately-held bank, 2004-2018), a Director of Asia Pacific Exploration Consolidated (international oil and gas exploration and production, 2008-2013), a member of the Board of Trustees of the University of Tulsa (2000-2006; 2007-2010), a Senior Energy Advisor of Katzenbach Partners, LLC (consulting, 2006-2007), an Advisory Director of Riverstone Holdings (private investment), a Director of Spinnaker Exploration Company (exploration and production, 2001-2005) and Chairman, President, and CEO of Baker Hughes, Inc. (oilfield services, 2000-2004).
Elizabeth Paige Baumann (1968)
Year of Election or Appointment: 2017
Anti-Money Laundering (AML) Officer
Ms. Baumann also serves as AML Officer of other funds. She is Chief AML Officer (2012-present) and Senior Vice President (2014-present) of FMR LLC (diversified financial services company) and is an employee of Fidelity Investments. Previously, Ms. Baumann served as AML Officer of the funds (2012-2016), and Vice President (2007-2014) and Deputy Anti-Money Laundering Officer (2007-2012) of FMR LLC.
John J. Burke III (1964)
Year of Election or Appointment: 2018
Chief Financial Officer
Mr. Burke also serves as Chief Financial Officer of other funds. Mr. Burke serves as Head of Investment Operations for Fidelity Fund and Investment Operations (2018-present) and is an employee of Fidelity Investments (1998-present). Previously Mr. Burke served as head of Asset Management Investment Operations (2012-2018).
William C. Coffey (1969)
Year of Election or Appointment: 2018
Secretary and Chief Legal Officer (CLO)
Mr. Coffey also serves as Secretary and CLO of other funds. Mr. Coffey serves as CLO, Secretary, and Senior Vice President of Fidelity Management & Research Company and FMR Co., Inc. (investment adviser firms, 2018-present); Secretary of Fidelity SelectCo, LLC and Fidelity Investments Money Management, Inc. (investment adviser firms, 2018-present); and CLO of Fidelity Management & Research (Hong Kong) Limited, FMR Investment Management (UK) Limited, and Fidelity Management & Research (Japan) Limited (investment adviser firms, 2018-present). He is Senior Vice President and Deputy General Counsel of FMR LLC (diversified financial services company, 2010-present), and is an employee of Fidelity Investments. Previously, Mr. Coffey served as Assistant Secretary of certain funds (2009-2018) and as Vice President and Associate General Counsel of FMR LLC (2005-2009).
Timothy M. Cohen (1969)
Year of Election or Appointment: 2018
Vice President
Mr. Cohen also serves as Vice President of other funds. Mr. Cohen serves as Co-Head of Global Equity Research (2016-present), a Director of Fidelity Management & Research (Japan) Limited (investment adviser firm, 2016-present), and is an employee of Fidelity Investments. Previously, Mr. Cohen served as Chief Investment Officer - Equity and a Director of Fidelity Management & Research (U.K.) Inc. (investment adviser firm, 2013-2015) and as a Director of Fidelity Management & Research (Hong Kong) Limited (investment adviser firm, 2017).
Jonathan Davis (1968)
Year of Election or Appointment: 2010
Assistant Treasurer
Mr. Davis also serves as Assistant Treasurer of other funds. Mr. Davis serves as Assistant Treasurer of FMR Capital, Inc. (2017-present) and is an employee of Fidelity Investments. Previously, Mr. Davis served as Vice President and Associate General Counsel of FMR LLC (diversified financial services company, 2003-2010).
Adrien E. Deberghes (1967)
Year of Election or Appointment: 2016
Assistant Treasurer
Mr. Deberghes also serves as an officer of other funds. He serves as Assistant Treasurer of FMR Capital, Inc. (2017-present), Executive Vice President of Fidelity Investments Money Management, Inc. (FIMM) (investment adviser firm, 2016-present), and is an employee of Fidelity Investments (2008-present). Previously, Mr. Deberghes served as President and Treasurer of certain Fidelity® funds (2013-2018). Prior to joining Fidelity Investments, Mr. Deberghes was Senior Vice President of Mutual Fund Administration at State Street Corporation (2007-2008), Senior Director of Mutual Fund Administration at Investors Bank & Trust (2005-2007), and Director of Finance for Dunkin' Brands (2000-2005). Previously, Mr. Deberghes served in other fund officer roles.
Laura M. Del Prato (1964)
Year of Election or Appointment: 2018
Assistant Treasurer
Ms. Del Prato also serves as an officer of other funds. Ms. Del Prato is an employee of Fidelity Investments (2017-present). Prior to joining Fidelity Investments, Ms. Del Prato served as a Managing Director and Treasurer of the JPMorgan Mutual Funds (2014-2017). Prior to JPMorgan, Ms. Del Prato served as a partner at Cohen Fund Audit Services (accounting firm, 2012-2013) and KPMG LLP (accounting firm, 2004-2012).
Colm A. Hogan (1973)
Year of Election or Appointment: 2016
Deputy Treasurer
Mr. Hogan also serves as an officer of other funds. Mr. Hogan serves as Assistant Treasurer of FMR Capital, Inc. (2017-present) and is an employee of Fidelity Investments (2005-present). Previously, Mr. Hogan served as Assistant Treasurer of certain Fidelity® funds (2016-2018).
Pamela R. Holding (1964)
Year of Election or Appointment: 2018
Vice President
Ms. Holding also serves as Vice President of other funds. Ms. Holding serves as Co-Head of Global Equity Research (2018-present) and is an employee of Fidelity Investments (2013-present).
Chris Maher (1972)
Year of Election or Appointment: 2013
Assistant Treasurer
Mr. Maher serves as Assistant Treasurer of other funds. Mr. Maher is Vice President of Valuation Oversight, serves as Assistant Treasurer of FMR Capital, Inc. (2017-present), and is an employee of Fidelity Investments. Previously, Mr. Maher served as Vice President of Asset Management Compliance (2013), Vice President of the Program Management Group of FMR (investment adviser firm, 2010-2013), and Vice President of Valuation Oversight (2008-2010).
Rieco E. Mello (1969)
Year of Election or Appointment: 2017
Assistant Treasurer
Mr. Mello also serves as Assistant Treasurer of other funds. Mr. Mello serves as Assistant Treasurer of FMR Capital, Inc. (2017-present) and is an employee of Fidelity Investments (1995-present).
Kenneth B. Robins (1969)
Year of Election or Appointment: 2016
Chief Compliance Officer
Mr. Robins also serves as an officer of other funds. Mr. Robins serves as Compliance Officer of Fidelity Management & Research Company and FMR Co., Inc. (investment adviser firms, 2016-present) and is an employee of Fidelity Investments (2004-present). Previously, Mr. Robins served as Executive Vice President of Fidelity Investments Money Management, Inc. (investment adviser firm, 2013-2016) and served in other fund officer roles.
Stacie M. Smith (1974)
Year of Election or Appointment: 2016
President and Treasurer
Ms. Smith also serves as an officer of other funds. Ms. Smith serves as Assistant Treasurer of FMR Capital, Inc. (2017-present), is an employee of Fidelity Investments (2009-present), and has served in other fund officer roles. Prior to joining Fidelity Investments, Ms. Smith served as Senior Audit Manager of Ernst & Young LLP (accounting firm, 1996-2009). Previously, Ms. Smith served as Assistant Treasurer (2013-2018) and Deputy Treasurer (2013-2016) of certain Fidelity® funds.
Marc L. Spector (1972)
Year of Election or Appointment: 2016
Assistant Treasurer
Mr. Spector also serves as an officer of other funds. Mr. Spector serves as Assistant Treasurer of FMR Capital, Inc. (2017-present) and is an employee of Fidelity Investments (2016-present). Prior to joining Fidelity Investments, Mr. Spector served as Director at the Siegfried Group (accounting firm, 2013-2016), and prior to Siegfried Group as audit senior manager at Deloitte & Touche (accounting firm, 2005-2013).
Shareholder Expense Example
As a shareholder of a Fund, you incur two types of costs: (1) transaction costs, including sales charges (loads) on purchase payments or redemption proceeds, and (2) ongoing costs, including distribution and/or service (12b-1) fees and other Fund expenses. This Example is intended to help you understand your ongoing costs (in dollars) of investing in the Funds and to compare these costs with the ongoing costs of investing in other mutual funds.
The Example is based on an investment of $1,000 invested at the beginning of the period and held for the entire period (May 1, 2018 to October 31, 2018).
Actual Expenses
The first line of the accompanying table for each class of the Fund provides information about actual account values and actual expenses. You may use the information in this line, together with the amount you invested, to estimate the expenses that you paid over the period. Simply divide your account value by $1,000.00 (for example, an $8,600 account value divided by $1,000.00 = 8.6), then multiply the result by the number in the first line for a class of the Fund under the heading entitled "Expenses Paid During Period" to estimate the expenses you paid on your account during this period. A small balance maintenance fee of $12.00 that is charged once a year may apply for certain accounts with a value of less than $2,000. This fee, which was eliminated effective August 1, 2018, is not included in the table below. If it was, the estimate of expenses you paid during the period would be higher, and your ending account value lower, by this amount. In addition, the Fund, as a shareholder in the underlying Fidelity Central Funds, will indirectly bear its pro-rata share of the fees and expenses incurred by the underlying Fidelity Central Funds. These fees and expenses are not included in the Fund's annualized expense ratio used to calculate the expense estimate in the table below.
Hypothetical Example for Comparison Purposes
The second line of the accompanying table for each class of the Fund provides information about hypothetical account values and hypothetical expenses based on a Class' actual expense ratio and an assumed rate of return of 5% per year before expenses, which is not the Class' actual return. The hypothetical account values and expenses may not be used to estimate the actual ending account balance or expenses you paid for the period. You may use this information to compare the ongoing costs of investing in the Fund and other funds. To do so, compare this 5% hypothetical example with the 5% hypothetical examples that appear in the shareholder reports of the other funds. A small balance maintenance fee of $12.00 that is charged once a year may apply for certain accounts with a value of less than $2,000. This fee, which was eliminated effective August 1, 2018, is not included in the table below. If it was, the estimate of expenses you paid during the period would be higher, and your ending account value lower, by this amount. In addition, the Fund, as a shareholder in the underlying Fidelity Central Funds, will indirectly bear its pro-rata share of the fees and expenses incurred by the underlying Fidelity Central Funds. These fees and expenses are not included in the Fund's annualized expense ratio used to calculate the expense estimate in the table below.
Please note that the expenses shown in the table are meant to highlight your ongoing costs only and do not reflect any transaction costs. Therefore, the second line of the table is useful in comparing ongoing costs only, and will not help you determine the relative total costs of owning different funds. In addition, if these transactional costs were included, your costs would have been higher.
| | Annualized Expense Ratio-A | Beginning
Account Value
May 1, 2018 | Ending
Account Value
October 31, 2018 | Expenses Paid
During Period-B
May 1, 2018
to October 31, 2018 |
| Class A | 1.16% | | | |
| Actual | | $1,000.00 | $886.50 | $5.52 |
| Hypothetical-C | | $1,000.00 | $1,019.36 | $5.90 |
| Class M | 1.41% | | | |
| Actual | | $1,000.00 | $885.40 | $6.70 |
| Hypothetical-C | | $1,000.00 | $1,018.10 | $7.17 |
| Class C | 1.95% | | | |
| Actual | | $1,000.00 | $883.20 | $9.26 |
| Hypothetical-C | | $1,000.00 | $1,015.38 | $9.91 |
| International Discovery | .83% | | | |
| Actual | | $1,000.00 | $888.10 | $3.95 |
| Hypothetical-C | | $1,000.00 | $1,021.02 | $4.23 |
| Class K | .72% | | | |
| Actual | | $1,000.00 | $888.70 | $3.43 |
| Hypothetical-C | | $1,000.00 | $1,021.58 | $3.67 |
| Class I | .86% | | | |
| Actual | | $1,000.00 | $888.10 | $4.09 |
| Hypothetical-C | | $1,000.00 | $1,020.87 | $4.38 |
| Class Z | .73% | | | |
| Actual | | $1,000.00 | $888.60 | $3.48 |
| Hypothetical-C | | $1,000.00 | $1,021.53 | $3.72 |
A Annualized expense ratio reflects expenses net of applicable fee waivers.
B Expenses are equal to each Class' annualized expense ratio, multiplied by the average account value over the period, multiplied by 184/365 (to reflect the one-half year period).
C 5% return per year before expenses
Distributions (Unaudited)
The Board of Trustees of Fidelity International Discovery fund voted to pay to shareholders of record at the opening of business on record date, the following distributions per share derived from capital gains realized from sales of portfolio securities, and dividends derived from net investment income:
| | Pay Date | Record Date | Dividends | Capital Gains |
| Fidelity International Discovery Fund | | | | |
| Class A | 12/10/18 | 12/07/18 | $0.327 | $0.913 |
| Class M | 12/10/18 | 12/07/18 | $0.222 | $0.913 |
| Class C | 12/10/18 | 12/07/18 | $0.000 | $0.913 |
| International Discovery | 12/10/18 | 12/07/18 | $0.491 | $0.913 |
| Class K | 12/10/18 | 12/07/18 | $0.541 | $0.913 |
| Class I | 12/10/18 | 12/07/18 | $0.481 | $0.913 |
| Class Z | 12/10/18 | 12/07/18 | $0.542 | $0.913 |
|
The fund hereby designates as a capital gain dividend with respect to the taxable year ended October 31, 2017, $245,764,979, or, if subsequently determined to be different, the net capital gain of such year.
Class A designates 2%; Class M designates 3%; Class C designates 9%; International Discovery designates 2%; Class K designates 1%; Class I designates 2% and Class Z designates 1% of the dividends distributed during the fiscal year as qualifying for the dividends–received deduction for corporate shareholders.
Class A, Class M, Class C, International Discovery, Class K, Class I and Class Z designate 100% of the dividends distributed during the fiscal year as amounts which may be taken into account as a dividend for purposes of the maximum rate under section 1(h)(11) of the Internal Revenue Code.
The amounts per share which represent income derived from sources within, and taxes paid to, foreign countries or possessions of the United States are as follows:
| | Pay Date | Income | Taxes |
| Fidelity International Discovery Fund | | | |
| Class A | 12/11/17 | $0.4263 | $0.0563 |
| Class M | 12/11/17 | $0.3263 | $0.0563 |
| Class C | 12/11/17 | $0.1083 | $0.0563 |
| International Discovery | 12/11/17 | $0.5883 | $0.0563 |
| Class K | 12/11/17 | $0.6403 | $0.0563 |
| Class I | 12/11/17 | $0.5763 | $0.0563 |
| Class Z | 12/11/17 | $0.6413 | $0.0563 |
|
The fund will notify shareholders in January 2019 of amounts for use in preparing 2018 income tax returns.
Board Approval of Investment Advisory Contracts
Fidelity International Discovery Fund
At its July 2018 meeting, the Board of Trustees, including the Independent Trustees (together, the Board), voted to continue the management contract with Fidelity Management & Research Company (FMR) and the sub-advisory agreements (together, the Advisory Contracts) for the fund for six months through January 31, 2019, in connection with the reunification of the Fidelity Equity High Income Funds Board, which oversees the fund, and the Sector Portfolios Board.
The Board considered that the approval of the fund's Advisory Contracts will not result in any changes in (i) the investment process or strategies employed in the management of the fund's assets; (ii) the fees and expenses paid by shareholders; (iii) the nature, extent or quality of services provided under the fund's Advisory Contracts; or (iv) the day-to-day management of the fund or the persons primarily responsible for such management. The Board concluded that the fund's Advisory Contracts are fair and reasonable, and that the fund's Advisory Contracts should be renewed, without modification, through January 31, 2019, with the understanding that the Board will consider the annual renewal for a full one year period in January 2019.
In connection with its consideration of future renewals of the fund's Advisory Contracts, the Board will consider: (i) the nature, extent and quality of services provided to the fund, including shareholder and administrative services and investment performance; (ii) the competitiveness of the management fee and total expenses for the fund; (iii) the costs of the services and profitability, including the revenues earned and the expenses incurred in conducting the business of developing, marketing, distributing, managing, administering, and servicing the fund and its shareholders, to the extent applicable, as well as potential fall-out benefits from Fidelity's non-fund businesses; and (iv) whether there have been economies of scale in respect of the Fidelity funds, whether the Fidelity funds (including the fund) have appropriately benefited from any such economies of scale, and whether there is the potential for realization of any further economies.
Based on its evaluation of all of the conclusions noted above, and after considering all factors it believed relevant, the Board ultimately concluded that the fund's management fee structure is fair and reasonable, and that the continuation of the fund's Advisory Contracts should be approved.
AID-ANN-1218
1.806659.113
Fidelity® International Discovery Fund
Annual Report October 31, 2018 |
|
Contents
To view a fund's proxy voting guidelines and proxy voting record for the 12-month period ended June 30, visit http://www.fidelity.com/proxyvotingresults or visit the Securities and Exchange Commission's (SEC) web site at http://www.sec.gov.
You may also call 1-800-544-8544 to request a free copy of the proxy voting guidelines.
Standard & Poor's, S&P and S&P 500 are registered service marks of The McGraw-Hill Companies, Inc. and have been licensed for use by Fidelity Distributors Corporation.
Other third-party marks appearing herein are the property of their respective owners.
All other marks appearing herein are registered or unregistered trademarks or service marks of FMR LLC or an affiliated company. © 2018 FMR LLC. All rights reserved.
This report and the financial statements contained herein are submitted for the general information of the shareholders of the Fund. This report is not authorized for distribution to prospective investors in the Fund unless preceded or accompanied by an effective prospectus.
A fund files its complete schedule of portfolio holdings with the SEC for the first and third quarters of each fiscal year on Form N-Q. Forms N-Q are available on the SEC’s web site at http://www.sec.gov. A fund's Forms N-Q may be reviewed and copied at the SEC’s Public Reference Room in Washington, DC. Information regarding the operation of the SEC's Public Reference Room may be obtained by calling 1-800-SEC-0330.
For a complete list of a fund's portfolio holdings, view the most recent holdings listing, semiannual report, or annual report on Fidelity's web site at http://www.fidelity.com, http://www.institutional.fidelity.com, or http://www.401k.com, as applicable.
NOT FDIC INSURED •MAY LOSE VALUE •NO BANK GUARANTEE
Neither the Fund nor Fidelity Distributors Corporation is a bank.
Performance: The Bottom Line
Average annual total return reflects the change in the value of an investment, assuming reinvestment of distributions from dividend income and capital gains (the profits earned upon the sale of securities that have grown in value, if any) and assuming a constant rate of performance each year. The hypothetical investment and the average annual total returns do not reflect the deduction of taxes that a shareholder would pay on fund distributions or the redemption of fund shares. During periods of reimbursement by Fidelity, a fund’s total return will be greater than it would be had the reimbursement not occurred. How a fund did yesterday is no guarantee of how it will do tomorrow.
Average Annual Total Returns
| For the periods ended October 31, 2018 | Past 1 year | Past 5 years | Past 10 years |
| Fidelity® International Discovery Fund | (9.81)% | 2.39% | 7.35% |
$10,000 Over 10 Years
Let's say hypothetically that $10,000 was invested in Fidelity® International Discovery Fund, a class of the fund, on October 31, 2008.
The chart shows how the value of your investment would have changed, and also shows how the MSCI EAFE Index performed over the same period.

| Period Ending Values |
| $20,330 | Fidelity® International Discovery Fund |
| $19,780 | MSCI EAFE Index |
Management's Discussion of Fund Performance
Market Recap: International equities returned -8.08% for the 12 months ending October 31, 2018, according to the MSCI ACWI (All Country World Index) ex USA Index. A modestly positive first half of the period gave way to a confluence of overwhelmingly negative factors – including escalating trade tensions, a surging U.S. dollar, tepid economic growth in Europe, global central bank tightening, concerns about Italy’s budget stalemate with the EU, and weakness in China’s stock market – that yielded a -11% second-half return. The index lost 8% in October alone, its largest monthly drop in more than six years. Among sectors, new-media-infused communications services (-15%) was hit the hardest, while economically sensitive consumer discretionary (-13%), information technology (-12%), financials (-10%), industrials (-9%) and materials (-7%) stocks also fared poorly. Even the more defensive real estate (-9%), utilities (-6%) and consumer staples (-5%) sectors weren’t spared this period. Conversely, elevated crude-oil prices fueled a positive return for energy (+7%), the top-performing sector, followed by the relatively stable-growing health care segment (+2%). Regionally, emerging markets (-12%) fared the worst, hampered by the impact of foreign exchange and concerns about economic weakness in China, India and South Korea. Sluggish growth also pressured shares in continental Europe (-9%). Stocks in Japan (-3%) and the U.K. (-4%) held up better, followed by Canada (-5%) and Asia-Pacific ex Japan (-6%).
Comments from Portfolio Manager William Kennedy: For the fiscal year, the fund’s share classes (excluding sales charges, if applicable) returned roughly -10% to -11%, lagging the -6.65% return of the MSCI EAFE Index. Security selection, notably in the consumer staples and industrials sectors, detracted from relative performance. Geographically, positioning in emerging markets and stock picks in the U.K. and Japan caused the fund to lag the index. Individual disappointments included software company Micro Focus International and food and alcoholic drinks distributor Conviviality, both based in the U.K. Micro Focus’s shares returned -53% for the period because synergies from a recent acquisition have not materialized as fast as investors expected. Conviviality, a non-benchmark position, faced financial distress and went into bankruptcy. In Japan, an average overweighting in semiconductor manufacturer Renesas Electronics hurt, as excess industry capacity and weakening demand from end markets pressured the stock. We no longer owned Renesas at period end. Conversely, security selection in Europe Ex U.K., the U.S. and materials aided relative performance. Individual contributors included Norway-based exploration and production company Equinor (formerly Statoil), a top holding that gained from higher oil prices.
The views expressed above reflect those of the portfolio manager(s) only through the end of the period as stated on the cover of this report and do not necessarily represent the views of Fidelity or any other person in the Fidelity organization. Any such views are subject to change at any time based upon market or other conditions and Fidelity disclaims any responsibility to update such views. These views may not be relied on as investment advice and, because investment decisions for a Fidelity fund are based on numerous factors, may not be relied on as an indication of trading intent on behalf of any Fidelity fund.
Investment Summary (Unaudited)
Geographic Diversification (% of fund's net assets)
| As of October 31, 2018 |
| | Japan | 17.6% |
| | United Kingdom | 10.7% |
| | Germany | 10.2% |
| | United States of America* | 10.1% |
| | France | 8.7% |
| | Switzerland | 8.5% |
| | Netherlands | 5.2% |
| | Spain | 4.0% |
| | India | 3.1% |
| | Other | 21.9% |

* Includes Short-Term investments and Net Other Assets (Liabilities).
Percentages are based on country or territory of incorporation and are adjusted for the effect of futures contracts, if applicable.
Asset Allocation as of October 31, 2018
| | % of fund's net assets |
| Stocks and Equity Futures | 90.7 |
| Short-Term Investments and Net Other Assets (Liabilities) | 9.3 |
Top Ten Stocks as of October 31, 2018
| | % of fund's net assets |
| Total SA (France, Oil, Gas & Consumable Fuels) | 2.9 |
| Equinor ASA (Norway, Oil, Gas & Consumable Fuels) | 2.6 |
| Nestle SA (Reg. S) (Switzerland, Food Products) | 2.5 |
| Roche Holding AG (participation certificate) (Switzerland, Pharmaceuticals) | 2.1 |
| AstraZeneca PLC (United Kingdom) (United Kingdom, Pharmaceuticals) | 1.9 |
| SAP SE (Germany, Software) | 1.8 |
| ORIX Corp. (Japan, Diversified Financial Services) | 1.5 |
| Unilever NV (Certificaten Van Aandelen) (Bearer) (Netherlands, Personal Products) | 1.4 |
| Sony Corp. (Japan, Household Durables) | 1.4 |
| HDFC Bank Ltd. (India, Banks) | 1.4 |
| | 19.5 |
Top Market Sectors as of October 31, 2018
| | % of fund's net assets |
| Financials | 18.8 |
| Health Care | 13.3 |
| Industrials | 12.4 |
| Information Technology | 9.7 |
| Consumer Discretionary | 9.5 |
| Consumer Staples | 8.8 |
| Energy | 6.6 |
| Materials | 3.9 |
| Real Estate | 2.7 |
| Communication Services | 1.4 |
Schedule of Investments October 31, 2018
Showing Percentage of Net Assets
| Common Stocks - 87.1% | | | |
| | | Shares | Value (000s) |
| Australia - 1.2% | | | |
| Bapcor Ltd. | | 8,839,382 | $42,753 |
| Blue Sky Alternative Investments Ltd. (a) | | 3,155,936 | 2,704 |
| Inghams Group Ltd. (b) | | 7,274,630 | 20,091 |
| Magellan Financial Group Ltd. | | 1,192,618 | 22,499 |
| National Storage (REIT) unit | | 20,935,348 | 25,277 |
| Rio Tinto Ltd. | | 4,010 | 217 |
|
| TOTAL AUSTRALIA | | | 113,541 |
|
| Austria - 1.4% | | | |
| Erste Group Bank AG | | 1,778,600 | 72,523 |
| Wienerberger AG | | 2,708,000 | 62,326 |
|
| TOTAL AUSTRIA | | | 134,849 |
|
| Bailiwick of Jersey - 0.3% | | | |
| Glencore Xstrata PLC | | 6,935,113 | 28,264 |
| Belgium - 1.0% | | | |
| KBC Groep NV | | 1,403,659 | 96,822 |
| Bermuda - 0.6% | | | |
| Hiscox Ltd. | | 2,788,120 | 58,018 |
| Canada - 2.1% | | | |
| Alimentation Couche-Tard, Inc. Class B (sub. vtg.) | | 1,074,800 | 51,329 |
| Cenovus Energy, Inc. (Canada) | | 3,258,400 | 27,573 |
| Constellation Software, Inc. | | 74,900 | 51,548 |
| Suncor Energy, Inc. | | 2,122,800 | 71,209 |
|
| TOTAL CANADA | | | 201,659 |
|
| Cayman Islands - 1.1% | | | |
| Alibaba Group Holding Ltd. sponsored ADR (a) | | 284,700 | 40,507 |
| ENN Energy Holdings Ltd. | | 3,407,500 | 28,961 |
| Meituan Dianping Class B | | 5,958,244 | 34,669 |
|
| TOTAL CAYMAN ISLANDS | | | 104,137 |
|
| China - 0.3% | | | |
| Qingdao Port International Co. Ltd. (a)(c) | | 11,047,000 | 6,480 |
| Shanghai International Airport Co. Ltd. (A Shares) | | 2,634,600 | 18,714 |
|
| TOTAL CHINA | | | 25,194 |
|
| Denmark - 1.0% | | | |
| Netcompany Group A/S | | 916,278 | 30,304 |
| Novo Nordisk A/S Series B | | 953,445 | 41,176 |
| Novozymes A/S Series B | | 389,400 | 19,243 |
|
| TOTAL DENMARK | | | 90,723 |
|
| Finland - 0.4% | | | |
| Sampo Oyj (A Shares) | | 917,500 | 42,254 |
| France - 8.7% | | | |
| ALTEN | | 343,360 | 33,115 |
| Capgemini SA | | 751,250 | 91,898 |
| Cegedim SA (a) | | 577,424 | 14,454 |
| Elis SA | | 1,912,711 | 38,627 |
| LVMH Moet Hennessy - Louis Vuitton SA | | 246,433 | 74,769 |
| Sartorius Stedim Biotech | | 312,490 | 38,792 |
| SMCP S.A.S. (c) | | 1,005,880 | 23,812 |
| Societe Generale Series A | | 1,519,483 | 55,701 |
| Thales SA | | 447,762 | 57,309 |
| Total SA | | 4,726,358 | 277,323 |
| VINCI SA (b) | | 1,340,505 | 119,304 |
|
| TOTAL FRANCE | | | 825,104 |
|
| Germany - 10.2% | | | |
| adidas AG | | 458,206 | 107,949 |
| Akasol AG | | 280,077 | 12,927 |
| Allianz SE | | 392,900 | 81,849 |
| Aumann AG (c) | | 118,851 | 5,869 |
| Deutsche Borse AG | | 162,981 | 20,596 |
| Deutsche Post AG | | 2,286,440 | 72,195 |
| Fresenius SE & Co. KGaA | | 1,181,000 | 75,059 |
| Instone Real Estate Group BV (c) | | 1,005,000 | 23,574 |
| JOST Werke AG (c) | | 218,300 | 7,616 |
| Linde PLC | | 600,446 | 98,512 |
| MTU Aero Engines Holdings AG | | 390,800 | 83,128 |
| Muenchener Rueckversicherungs AG | | 212,900 | 45,805 |
| Nexus AG | | 598,705 | 16,343 |
| Rational AG | | 36,405 | 21,112 |
| Rheinmetall AG | | 300,500 | 26,051 |
| SAP SE | | 1,631,171 | 174,655 |
| Vonovia SE | | 959,200 | 43,914 |
| Wirecard AG | | 274,800 | 51,481 |
|
| TOTAL GERMANY | | | 968,635 |
|
| Hong Kong - 1.8% | | | |
| AIA Group Ltd. | | 16,381,000 | 123,976 |
| Techtronic Industries Co. Ltd. | | 10,497,500 | 49,128 |
|
| TOTAL HONG KONG | | | 173,104 |
|
| India - 3.1% | | | |
| Avenue Supermarts Ltd. (a)(c) | | 595,148 | 10,766 |
| HDFC Bank Ltd. | | 1,783,391 | 46,297 |
| HDFC Bank Ltd. sponsored ADR | | 955,784 | 84,979 |
| Housing Development Finance Corp. Ltd. | | 4,738,215 | 113,346 |
| Sunteck Realty Ltd. (a) | | 3,638,783 | 15,948 |
| TCNS Clothing Co. Ltd. (a) | | 2,290,991 | 19,143 |
|
| TOTAL INDIA | | | 290,479 |
|
| Ireland - 3.0% | | | |
| Cairn Homes PLC (a) | | 24,761,863 | 39,770 |
| CRH PLC | | 1,072,547 | 31,992 |
| Dalata Hotel Group PLC | | 6,380,738 | 39,532 |
| DCC PLC (United Kingdom) | | 234,900 | 20,162 |
| Glenveagh Properties PLC (c) | | 18,258,476 | 17,289 |
| Green REIT PLC | | 9,492,200 | 15,675 |
| Kerry Group PLC Class A | | 575,200 | 58,961 |
| Ryanair Holdings PLC sponsored ADR (a) | | 340,266 | 28,174 |
| United Drug PLC (United Kingdom) | | 3,890,900 | 31,432 |
|
| TOTAL IRELAND | | | 282,987 |
|
| Italy - 0.7% | | | |
| Prada SpA | | 4,817,375 | 17,016 |
| Recordati SpA | | 1,498,900 | 50,796 |
|
| TOTAL ITALY | | | 67,812 |
|
| Japan - 14.0% | | | |
| AEON Financial Service Co. Ltd. | | 1,567,500 | 30,785 |
| Hoya Corp. | | 1,803,500 | 102,518 |
| Keyence Corp. | | 161,620 | 79,209 |
| Mercari, Inc. (a)(b) | | 186,200 | 4,713 |
| Minebea Mitsumi, Inc. | | 3,146,200 | 48,131 |
| Misumi Group, Inc. | | 1,127,900 | 22,651 |
| Mitsubishi UFJ Financial Group, Inc. | | 13,512,400 | 81,784 |
| Monex Group, Inc. (b) | | 3,474,649 | 13,703 |
| Morinaga & Co. Ltd. | | 572,700 | 23,018 |
| Murata Manufacturing Co. Ltd. | | 203,800 | 31,003 |
| Nidec Corp. | | 355,700 | 45,678 |
| Nitori Holdings Co. Ltd. | | 503,400 | 65,738 |
| ORIX Corp. | | 8,623,800 | 140,705 |
| Panasonic Corp. | | 6,347,500 | 68,118 |
| Recruit Holdings Co. Ltd. | | 942,500 | 25,296 |
| Relo Group, Inc. | | 2,647,500 | 62,554 |
| Shiseido Co. Ltd. | | 236,100 | 14,897 |
| SMC Corp. | | 232,200 | 74,392 |
| SoftBank Corp. | | 837,600 | 66,287 |
| Sony Corp. | | 2,455,200 | 132,867 |
| Takeda Pharmaceutical Co. Ltd. | | 1,170,300 | 48,520 |
| Tsuruha Holdings, Inc. | | 481,100 | 50,142 |
| VT Holdings Co. Ltd. | | 496,700 | 2,069 |
| Welcia Holdings Co. Ltd. | | 1,710,100 | 87,297 |
| Zozo, Inc. | | 494,200 | 11,909 |
|
| TOTAL JAPAN | | | 1,333,984 |
|
| Korea (South) - 0.5% | | | |
| Cafe24 Corp. (a) | | 223,645 | 21,659 |
| Hyundai Fire & Marine Insurance Co. Ltd. | | 331,774 | 12,154 |
| KB Financial Group, Inc. | | 437,375 | 18,191 |
|
| TOTAL KOREA (SOUTH) | | | 52,004 |
|
| Netherlands - 5.2% | | | |
| Adyen BV (c) | | 113,603 | 73,485 |
| ASML Holding NV (Netherlands) | | 579,200 | 99,764 |
| Basic-Fit NV (a)(c) | | 573,600 | 16,535 |
| IMCD Group BV | | 777,945 | 52,824 |
| Koninklijke Philips Electronics NV | | 2,812,269 | 104,886 |
| Unilever NV (Certificaten Van Aandelen) (Bearer) | | 2,572,632 | 138,240 |
| Van Lanschot NV (Bearer) | | 221,500 | 5,432 |
|
| TOTAL NETHERLANDS | | | 491,166 |
|
| New Zealand - 1.3% | | | |
| EBOS Group Ltd. | | 3,124,713 | 42,493 |
| Fisher & Paykel Healthcare Corp. | | 3,760,394 | 33,372 |
| Ryman Healthcare Group Ltd. | | 6,308,132 | 49,808 |
|
| TOTAL NEW ZEALAND | | | 125,673 |
|
| Norway - 2.6% | | | |
| Equinor ASA | | 9,619,813 | 250,258 |
| Spain - 4.0% | | | |
| Aedas Homes SAU (c) | | 402,926 | 10,424 |
| Amadeus IT Holding SA Class A | | 810,800 | 65,368 |
| CaixaBank SA (b) | | 32,146,733 | 130,089 |
| Grifols SA ADR | | 2,966,058 | 60,567 |
| Masmovil Ibercom SA (a) | | 536,548 | 69,645 |
| Neinor Homes SLU (a)(c) | | 732,900 | 11,788 |
| Prosegur Cash SA (c) | | 4,229,512 | 8,383 |
| Zardoya Otis SA | | 3,001,173 | 20,566 |
|
| TOTAL SPAIN | | | 376,830 |
|
| Sweden - 2.6% | | | |
| ASSA ABLOY AB (B Shares) | | 3,408,900 | 67,806 |
| HEXPOL AB (B Shares) | | 1,854,700 | 17,166 |
| Indutrade AB | | 2,158,900 | 51,807 |
| Saab AB (B Shares) | | 783,100 | 30,687 |
| Svenska Cellulosa AB (SCA) (B Shares) | | 4,064,100 | 38,469 |
| Telefonaktiebolaget LM Ericsson (B Shares) | | 4,514,200 | 39,304 |
|
| TOTAL SWEDEN | | | 245,239 |
|
| Switzerland - 8.5% | | | |
| Credit Suisse Group AG | | 2,446,505 | 31,985 |
| Forbo Holding AG (Reg.) | | 19,930 | 29,267 |
| Julius Baer Group Ltd. | | 857,090 | 39,087 |
| Kaba Holding AG (B Shares) (Reg.) | | 41,000 | 29,595 |
| Lonza Group AG | | 259,158 | 81,493 |
| Nestle SA (Reg. S) | | 2,839,470 | 239,717 |
| Partners Group Holding AG | | 106,960 | 76,199 |
| Roche Holding AG (participation certificate) | | 801,468 | 195,047 |
| Schindler Holding AG (participation certificate) | | 168,047 | 35,440 |
| UBS Group AG | | 3,674,380 | 51,404 |
|
| TOTAL SWITZERLAND | | | 809,234 |
|
| United Kingdom - 10.7% | | | |
| Anglo American PLC (United Kingdom) | | 1,430,245 | 30,625 |
| AstraZeneca PLC (United Kingdom) | | 2,369,091 | 181,211 |
| Beazley PLC | | 4,167,000 | 28,096 |
| BHP Billiton PLC | | 3,499,778 | 69,816 |
| Big Yellow Group PLC | | 2,523,600 | 27,821 |
| British American Tobacco PLC: | | | |
| (United Kingdom) | | 1,513,778 | 65,623 |
| sponsored ADR | | 419,000 | 18,185 |
| Bunzl PLC | | 2,743,559 | 81,043 |
| Compass Group PLC | | 2,420,296 | 47,642 |
| Conviviality PLC (d) | | 5,464,968 | 0 |
| Cranswick PLC | | 1,414,158 | 52,239 |
| Dechra Pharmaceuticals PLC | | 1,370,476 | 40,045 |
| JTC PLC | | 3,846,100 | 16,469 |
| Keywords Studios PLC | | 627,800 | 10,994 |
| LivaNova PLC (a) | | 363,102 | 40,664 |
| London Stock Exchange Group PLC | | 1,209,936 | 66,733 |
| Melrose Industries PLC | | 11,062,816 | 23,848 |
| Micro Focus International PLC | | 3,041,005 | 47,142 |
| Moneysupermarket.com Group PLC | | 835 | 3 |
| NCC Group Ltd. | | 9,063,500 | 22,776 |
| Reckitt Benckiser Group PLC | | 449,822 | 36,374 |
| Rio Tinto PLC | | 936,125 | 45,450 |
| Senior Engineering Group PLC | | 7,063,700 | 24,649 |
| St. James's Place Capital PLC | | 2,486,954 | 32,217 |
| Standard Chartered PLC (United Kingdom) | | 63,290 | 445 |
| The Weir Group PLC | | 585,500 | 11,869 |
|
| TOTAL UNITED KINGDOM | | | 1,021,979 |
|
| United States of America - 0.8% | | | |
| International Flavors & Fragrances, Inc. (Israel) | | 209,161 | 30,200 |
| Marsh & McLennan Companies, Inc. | | 516,900 | 43,807 |
|
| TOTAL UNITED STATES OF AMERICA | | | 74,007 |
|
| TOTAL COMMON STOCKS | | | |
| (Cost $7,415,622) | | | 8,283,956 |
| | | Principal Amount (000s) | Value (000s) |
|
| Government Obligations - 0.1% | | | |
| United States of America - 0.1% | | | |
| U.S. Treasury Bills, yield at date of purchase 1.99% to 2.3% 11/1/18 to 1/31/19(e) | | | |
| (Cost $13,725) | | 13,770 | 13,725 |
| | | Shares | Value (000s) |
|
| Money Market Funds - 14.7% | | | |
| Fidelity Cash Central Fund, 2.23% (f) | | 1,172,025,582 | 1,172,260 |
| Fidelity Securities Lending Cash Central Fund 2.23% (f)(g) | | 225,820,857 | 225,843 |
| TOTAL MONEY MARKET FUNDS | | | |
| (Cost $1,398,103) | | | 1,398,103 |
| TOTAL INVESTMENT IN SECURITIES - 101.9% | | | |
| (Cost $8,827,450) | | | 9,695,784 |
| NET OTHER ASSETS (LIABILITIES) - (1.9)% | | | (180,375) |
| NET ASSETS - 100% | | | $9,515,409 |
| Futures Contracts | | | | | |
| | Number of contracts | Expiration Date | Notional Amount (000s) | Value (000s) | Unrealized Appreciation/(Depreciation) (000s) |
| Purchased | | | | | |
| Equity Index Contracts | | | | | |
| TSE TOPIX Index Contracts (Japan) | 2,383 | Dec. 2018 | $346,568 | $(7,547) | $(7,547) |
The notional amount of futures purchased as a percentage of Net Assets is 3.6%
Categorizations in the Schedule of Investments are based on country or territory of incorporation.
Values shown as $0 in the Schedule of Investments may reflect amounts less than $500.
Legend
(a) Non-income producing
(b) Security or a portion of the security is on loan at period end.
(c) Security exempt from registration under Rule 144A of the Securities Act of 1933. These securities may be resold in transactions exempt from registration, normally to qualified institutional buyers. At the end of the period, the value of these securities amounted to $216,021,000 or 2.3% of net assets.
(d) Level 3 security
(e) Security or a portion of the security was pledged to cover margin requirements for futures contracts. At period end, the value of securities pledged amounted to $13,725,000.
(f) Affiliated fund that is generally available only to investment companies and other accounts managed by Fidelity Investments. The rate quoted is the annualized seven-day yield of the fund at period end. A complete unaudited listing of the fund's holdings as of its most recent quarter end is available upon request. In addition, each Fidelity Central Fund's financial statements, which are not covered by the Fund's Report of Independent Registered Public Accounting Firm, are available on the SEC's website or upon request.
(g) Includes investment made with cash collateral received from securities on loan.
Affiliated Central Funds
Information regarding fiscal year to date income earned by the Fund from investments in Fidelity Central Funds is as follows:
| Fund | Income earned |
| | (Amounts in thousands) |
| Fidelity Cash Central Fund | $11,311 |
| Fidelity Securities Lending Cash Central Fund | 3,292 |
| Total | $14,603 |
Amounts in the income column in the above table include any capital gain distributions from underlying funds, which are presented in the corresponding line-item in the Statement of Operations if applicable.
Other Affiliated Issuers
An affiliated company is a company in which the Fund has ownership of at least 5% of the voting securities. Fiscal year to date transactions with companies which are or were affiliates are as follows:
| Affiliate (Amounts in thousands) | Value, beginning of period | Purchases | Sales Proceeds(a),(b) | Dividend Income | Realized Gain (loss) | Change in Unrealized appreciation (depreciation) | Value, end of period |
| Rex Bionics PLC | $30 | $-- | $0 | $-- | $(3,941) | $3,911 | $-- |
| Total | $30 | $-- | $0 | $-- | $(3,941) | $3,911 | $-- |
(a) Values shown as $0 may reflect amounts less than $500.
(b) Includes the value of securities delivered through in-kind transactions, if applicable.
Investment Valuation
The following is a summary of the inputs used, as of October 31, 2018, involving the Fund's assets and liabilities carried at fair value. The inputs or methodology used for valuing securities may not be an indication of the risk associated with investing in those securities. For more information on valuation inputs, and their aggregation into the levels used below, please refer to the Investment Valuation section in the accompanying Notes to Financial Statements.
| | Valuation Inputs at Reporting Date: |
| Description | Total | Level 1 | Level 2 | Level 3 |
| (Amounts in thousands) | | | | |
| Investments in Securities: | | | | |
| Equities: | | | | |
| Communication Services | $135,932 | $69,645 | $66,287 | $-- |
| Consumer Discretionary | 911,006 | 600,583 | 310,423 | -- |
| Consumer Staples | 856,113 | 361,262 | 494,851 | 0 |
| Energy | 626,363 | 349,040 | 277,323 | -- |
| Financials | 1,793,549 | 1,287,970 | 505,579 | -- |
| Health Care | 1,248,676 | 602,777 | 645,899 | -- |
| Industrials | 1,143,407 | 810,675 | 332,732 | -- |
| Information Technology | 923,705 | 562,840 | 360,865 | -- |
| Materials | 373,768 | 226,510 | 147,258 | -- |
| Real Estate | 242,476 | 242,476 | -- | -- |
| Utilities | 28,961 | 28,961 | -- | -- |
| Government Obligations | 13,725 | -- | 13,725 | -- |
| Money Market Funds | 1,398,103 | 1,398,103 | -- | -- |
| Total Investments in Securities: | $9,695,784 | $6,540,842 | $3,154,942 | $0 |
| Derivative Instruments: | | | | |
| Liabilities | | | | |
| Futures Contracts | $(7,547) | $(7,547) | $-- | $-- |
| Total Liabilities | $(7,547) | $(7,547) | $-- | $-- |
| Total Derivative Instruments: | $(7,547) | $(7,547) | $-- | $-- |
The following is a summary of transfers between Level 1 and Level 2 for the period ended October 31, 2018. Transfers are assumed to have occurred at the beginning of the period, and are primarily attributable to the valuation techniques used for foreign equity securities, as discussed in the accompanying Notes to Financial Statements:
| Transfers | Total (000s) |
| Level 1 to Level 2 | $465,253 |
| Level 2 to Level 1 | $999,772 |
Value of Derivative Instruments
The following table is a summary of the Fund's value of derivative instruments by primary risk exposure as of October 31, 2018. For additional information on derivative instruments, please refer to the Derivative Instruments section in the accompanying Notes to Financial Statements.
| Primary Risk Exposure / Derivative Type | Value |
| | Asset | Liability |
| (Amounts in thousands) | | |
| Equity Risk | | |
| Futures Contracts(a) | $0 | $(7,547) |
| Total Equity Risk | 0 | (7,547) |
| Total Value of Derivatives | $0 | $(7,547) |
(a) Reflects gross cumulative appreciation (depreciation) on futures contracts as presented in the Schedule of Investments. In the Statement of Assets and Liabilities, the period end daily variation margin is included in receivable or payable for daily variation margin on futures contracts, and the net cumulative appreciation (depreciation) is included in net unrealized appreciation (depreciation).
See accompanying notes which are an integral part of the financial statements.
Financial Statements
Statement of Assets and Liabilities
| Amounts in thousands (except per-share amounts) | | October 31, 2018 |
| Assets | | |
Investment in securities, at value (including securities loaned of $215,012) — See accompanying schedule:
Unaffiliated issuers (cost $7,429,347) | $8,297,681 | |
| Fidelity Central Funds (cost $1,398,103) | 1,398,103 | |
| Total Investment in Securities (cost $8,827,450) | | $9,695,784 |
| Foreign currency held at value (cost $821) | | 818 |
| Receivable for investments sold | | 7,222 |
| Receivable for fund shares sold | | 17,779 |
| Dividends receivable | | 22,808 |
| Distributions receivable from Fidelity Central Funds | | 2,215 |
| Receivable for daily variation margin on futures contracts | | 6,547 |
| Prepaid expenses | | 20 |
| Other receivables | | 4,016 |
| Total assets | | 9,757,209 |
| Liabilities | | |
| Payable for investments purchased | $31 | |
| Payable for fund shares redeemed | 8,363 | |
| Accrued management fee | 4,872 | |
| Distribution and service plan fees payable | 72 | |
| Other affiliated payables | 1,317 | |
| Other payables and accrued expenses | 1,304 | |
| Collateral on securities loaned | 225,841 | |
| Total liabilities | | 241,800 |
| Net Assets | | $9,515,409 |
| Net Assets consist of: | | |
| Paid in capital | | $8,369,714 |
| Total distributable earnings (loss) | | 1,145,695 |
| Net Assets | | $9,515,409 |
| Net Asset Value and Maximum Offering Price | | |
| Class A: | | |
| Net Asset Value and redemption price per share ($190,720 ÷ 4,769.1 shares) | | $39.99 |
| Maximum offering price per share (100/94.25 of $39.99) | | $42.43 |
| Class M: | | |
| Net Asset Value and redemption price per share ($27,840 ÷ 701.0 shares) | | $39.71 |
| Maximum offering price per share (100/96.50 of $39.71) | | $41.15 |
| Class C: | | |
| Net Asset Value and offering price per share ($21,537 ÷ 547.8 shares)(a) | | $39.32 |
| International Discovery: | | |
| Net Asset Value, offering price and redemption price per share ($6,514,516 ÷ 161,559.9 shares) | | $40.32 |
| Class K: | | |
| Net Asset Value, offering price and redemption price per share ($2,063,585 ÷ 51,271.1 shares) | | $40.25 |
| Class I: | | |
| Net Asset Value, offering price and redemption price per share ($579,134 ÷ 14,400.3 shares) | | $40.22 |
| Class Z: | | |
| Net Asset Value, offering price and redemption price per share ($118,077 ÷ 2,935.8 shares) | | $40.22 |
(a) Redemption price per share is equal to net asset value less any applicable contingent deferred sales charge.
See accompanying notes which are an integral part of the financial statements.
Statement of Operations
| Amounts in thousands | | Year ended October 31, 2018 |
| Investment Income | | |
| Dividends | | $225,604 |
| Interest | | 143 |
| Income from Fidelity Central Funds | | 14,603 |
| Income before foreign taxes withheld | | 240,350 |
| Less foreign taxes withheld | | (22,110) |
| Total income | | 218,240 |
| Expenses | | |
| Management fee | | |
| Basic fee | $71,011 | |
| Performance adjustment | 2,254 | |
| Transfer agent fees | 14,527 | |
| Distribution and service plan fees | 1,011 | |
| Accounting and security lending fees | 1,828 | |
| Custodian fees and expenses | 1,634 | |
| Independent trustees' fees and expenses | 53 | |
| Registration fees | 184 | |
| Audit | 115 | |
| Legal | 30 | |
| Miscellaneous | 74 | |
| Total expenses before reductions | 92,721 | |
| Expense reductions | (1,283) | |
| Total expenses after reductions | | 91,438 |
| Net investment income (loss) | | 126,802 |
| Realized and Unrealized Gain (Loss) | | |
| Net realized gain (loss) on: | | |
| Investment securities: | | |
| Unaffiliated issuers | 278,786 | |
| Fidelity Central Funds | 25 | |
| Other affiliated issuers | (3,941) | |
| Foreign currency transactions | (1,188) | |
| Futures contracts | 4,030 | |
| Total net realized gain (loss) | | 277,712 |
| Change in net unrealized appreciation (depreciation) on: | | |
| Investment securities: | | |
| Unaffiliated issuers | (1,409,375) | |
| Fidelity Central Funds | 8 | |
| Other affiliated issuers | 3,911 | |
| Assets and liabilities in foreign currencies | (510) | |
| Futures contracts | (24,387) | |
| Total change in net unrealized appreciation (depreciation) | | (1,430,353) |
| Net gain (loss) | | (1,152,641) |
| Net increase (decrease) in net assets resulting from operations | | $(1,025,839) |
See accompanying notes which are an integral part of the financial statements.
Statement of Changes in Net Assets
| Amounts in thousands | Year ended October 31, 2018 | Year ended October 31, 2017 |
| Increase (Decrease) in Net Assets | | |
| Operations | | |
| Net investment income (loss) | $126,802 | $118,923 |
| Net realized gain (loss) | 277,712 | 1,030,476 |
| Change in net unrealized appreciation (depreciation) | (1,430,353) | 1,102,421 |
| Net increase (decrease) in net assets resulting from operations | (1,025,839) | 2,251,820 |
| Distributions to shareholders | (535,941) | – |
| Distributions to shareholders from net investment income | – | (150,174) |
| Distributions to shareholders from net realized gain | – | (11,939) |
| Total distributions | (535,941) | (162,113) |
| Share transactions - net increase (decrease) | 427,927 | (822,002) |
| Redemption fees | – | 9 |
| Total increase (decrease) in net assets | (1,133,853) | 1,267,714 |
| Net Assets | | |
| Beginning of period | 10,649,262 | 9,381,548 |
| End of period | $9,515,409 | $10,649,262 |
| Other Information | | |
| Undistributed net investment income end of period | | $108,446 |
See accompanying notes which are an integral part of the financial statements.
Financial Highlights
Fidelity International Discovery Fund Class A
| Years ended October 31, | 2018 | 2017 | 2016 | 2015 | 2014 |
| Selected Per–Share Data | | | | | |
| Net asset value, beginning of period | $46.66 | $37.60 | $39.78 | $38.70 | $39.49 |
| Income from Investment Operations | | | | | |
| Net investment income (loss)A | .37 | .36 | .47B | .40C | .53D |
| Net realized and unrealized gain (loss) | (4.87) | 9.22 | (2.38) | .79 | (.67) |
| Total from investment operations | (4.50) | 9.58 | (1.91) | 1.19 | (.14) |
| Distributions from net investment income | (.34) | (.47) | (.27) | (.11) | (.33) |
| Distributions from net realized gain | (1.83) | (.05) | (.01) | – | (.31) |
| Total distributions | (2.17) | (.52) | (.27)E | (.11) | (.65)F |
| Redemption fees added to paid in capitalA | – | –G | –G | –G | –G |
| Net asset value, end of period | $39.99 | $46.66 | $37.60 | $39.78 | $38.70 |
| Total ReturnH,I | (10.11)% | 25.87% | (4.83)% | 3.09% | (.36)% |
| Ratios to Average Net AssetsJ,K | | | | | |
| Expenses before reductions | 1.22% | 1.29% | 1.35% | 1.33% | 1.28% |
| Expenses net of fee waivers, if any | 1.22% | 1.29% | 1.35% | 1.33% | 1.28% |
| Expenses net of all reductions | 1.21% | 1.27% | 1.34% | 1.32% | 1.28% |
| Net investment income (loss) | .83% | .88% | 1.26%B | 1.00%C | 1.35%D |
| Supplemental Data | | | | | |
| Net assets, end of period (in millions) | $191 | $248 | $236 | $283 | $297 |
| Portfolio turnover rateL | 45%M | 42% | 50%M | 60%M | 57% |
A Calculated based on average shares outstanding during the period.
B Net investment income per share reflects a large, non-recurring dividend which amounted to $.14 per share. Excluding this non-recurring dividend, the ratio of net investment income (loss) to average net assets would have been .88%.
C Net investment income per share reflects a large, non-recurring dividend which amounted to $.12 per share. Excluding this non-recurring dividend, the ratio of net investment income (loss) to average net assets would have been .69%.
D Net investment income per share reflects a large, non-recurring dividend which amounted to $.22 per share. Excluding this non-recurring dividend, the ratio of net investment income (loss) to average net assets would have been .80%.
E Total distributions of $.27 per share is comprised of distributions from net investment income of $.269 and distributions from net realized gain of $.005 per share.
F Total distributions of $.65 per share is comprised of distributions from net investment income of $.334 and distributions from net realized gain of $.311 per share.
G Amount represents less than $.005 per share.
H Total returns would have been lower if certain expenses had not been reduced during the applicable periods shown.
I Total returns do not include the effect of the sales charges.
J Fees and expenses of any underlying Fidelity Central Funds are not included in the Fund's expense ratio. The Fund indirectly bears its proportionate share of the expenses of any underlying Fidelity Central Funds.
K Expense ratios reflect operating expenses of the class. Expenses before reductions do not reflect amounts reimbursed by the investment adviser or reductions from brokerage service arrangements or reductions from other expense offset arrangements and do not represent the amount paid by the class during periods when reimbursements or reductions occur. Expenses net of fee waivers reflect expenses after reimbursement by the investment adviser but prior to reductions from brokerage service arrangements or other expense offset arrangements. Expenses net of all reductions represent the net expenses paid by the class.
L Amount does not include the portfolio activity of any underlying Fidelity Central Funds.
M Portfolio turnover rate excludes securities received or delivered in-kind.
See accompanying notes which are an integral part of the financial statements.
Fidelity International Discovery Fund Class M
| Years ended October 31, | 2018 | 2017 | 2016 | 2015 | 2014 |
| Selected Per–Share Data | | | | | |
| Net asset value, beginning of period | $46.35 | $37.34 | $39.51 | $38.43 | $39.23 |
| Income from Investment Operations | | | | | |
| Net investment income (loss)A | .27 | .26 | .38B | .30C | .44D |
| Net realized and unrealized gain (loss) | (4.84) | 9.17 | (2.37) | .80 | (.68) |
| Total from investment operations | (4.57) | 9.43 | (1.99) | 1.10 | (.24) |
| Distributions from net investment income | (.24) | (.37) | (.17) | (.02) | (.25) |
| Distributions from net realized gain | (1.83) | (.05) | (.01) | – | (.31) |
| Total distributions | (2.07) | (.42) | (.18) | (.02) | (.56) |
| Redemption fees added to paid in capitalA | – | –E | –E | –E | –E |
| Net asset value, end of period | $39.71 | $46.35 | $37.34 | $39.51 | $38.43 |
| Total ReturnF,G | (10.31)% | 25.57% | (5.07)% | 2.86% | (.60)% |
| Ratios to Average Net AssetsH,I | | | | | |
| Expenses before reductions | 1.46% | 1.53% | 1.58% | 1.57% | 1.51% |
| Expenses net of fee waivers, if any | 1.46% | 1.52% | 1.58% | 1.57% | 1.51% |
| Expenses net of all reductions | 1.45% | 1.51% | 1.57% | 1.56% | 1.51% |
| Net investment income (loss) | .59% | .64% | 1.02%B | .76%C | 1.11%D |
| Supplemental Data | | | | | |
| Net assets, end of period (in millions) | $28 | $35 | $35 | $43 | $49 |
| Portfolio turnover rateJ | 45%K | 42% | 50%K | 60%K | 57% |
A Calculated based on average shares outstanding during the period.
B Net investment income per share reflects a large, non-recurring dividend which amounted to $.14 per share. Excluding this non-recurring dividend, the ratio of net investment income (loss) to average net assets would have been .64%.
C Net investment income per share reflects a large, non-recurring dividend which amounted to $.12 per share. Excluding this non-recurring dividend, the ratio of net investment income (loss) to average net assets would have been .45%.
D Net investment income per share reflects a large, non-recurring dividend which amounted to $.21 per share. Excluding this non-recurring dividend, the ratio of net investment income (loss) to average net assets would have been .56%.
E Amount represents less than $.005 per share.
F Total returns would have been lower if certain expenses had not been reduced during the applicable periods shown.
G Total returns do not include the effect of the sales charges.
H Fees and expenses of any underlying Fidelity Central Funds are not included in the Fund's expense ratio. The Fund indirectly bears its proportionate share of the expenses of any underlying Fidelity Central Funds.
I Expense ratios reflect operating expenses of the class. Expenses before reductions do not reflect amounts reimbursed by the investment adviser or reductions from brokerage service arrangements or reductions from other expense offset arrangements and do not represent the amount paid by the class during periods when reimbursements or reductions occur. Expenses net of fee waivers reflect expenses after reimbursement by the investment adviser but prior to reductions from brokerage service arrangements or other expense offset arrangements. Expenses net of all reductions represent the net expenses paid by the class.
J Amount does not include the portfolio activity of any underlying Fidelity Central Funds.
K Portfolio turnover rate excludes securities received or delivered in-kind.
See accompanying notes which are an integral part of the financial statements.
Fidelity International Discovery Fund Class C
| Years ended October 31, | 2018 | 2017 | 2016 | 2015 | 2014 |
| Selected Per–Share Data | | | | | |
| Net asset value, beginning of period | $45.94 | $36.96 | $39.14 | $38.25 | $39.07 |
| Income from Investment Operations | | | | | |
| Net investment income (loss)A | .02 | .04 | .19B | .10C | .23D |
| Net realized and unrealized gain (loss) | (4.79) | 9.12 | (2.37) | .79 | (.66) |
| Total from investment operations | (4.77) | 9.16 | (2.18) | .89 | (.43) |
| Distributions from net investment income | (.02) | (.13) | – | – | (.08) |
| Distributions from net realized gain | (1.83) | (.05) | – | – | (.31) |
| Total distributions | (1.85) | (.18) | – | – | (.39) |
| Redemption fees added to paid in capitalA | – | –E | –E | –E | –E |
| Net asset value, end of period | $39.32 | $45.94 | $36.96 | $39.14 | $38.25 |
| Total ReturnF,G | (10.80)% | 24.93% | (5.57)% | 2.33% | (1.10)% |
| Ratios to Average Net AssetsH,I | | | | | |
| Expenses before reductions | 2.00% | 2.05% | 2.10% | 2.09% | 2.03% |
| Expenses net of fee waivers, if any | 2.00% | 2.05% | 2.10% | 2.09% | 2.03% |
| Expenses net of all reductions | 1.99% | 2.04% | 2.09% | 2.08% | 2.02% |
| Net investment income (loss) | .05% | .11% | .50%B | .24%C | .60%D |
| Supplemental Data | | | | | |
| Net assets, end of period (in millions) | $22 | $28 | $26 | $32 | $35 |
| Portfolio turnover rateJ | 45%K | 42% | 50%K | 60%K | 57% |
A Calculated based on average shares outstanding during the period.
B Net investment income per share reflects a large, non-recurring dividend which amounted to $.14 per share. Excluding this non-recurring dividend, the ratio of net investment income (loss) to average net assets would have been .13%.
C Net investment income per share reflects a large, non-recurring dividend which amounted to $.12 per share. Excluding this non-recurring dividend, the ratio of net investment income (loss) to average net assets would have been (.06) %.
D Net investment income per share reflects a large, non-recurring dividend which amounted to $.21 per share. Excluding this non-recurring dividend, the ratio of net investment income (loss) to average net assets would have been .05%.
E Amount represents less than $.005 per share.
F Total returns would have been lower if certain expenses had not been reduced during the applicable periods shown.
G Total returns do not include the effect of the contingent deferred sales charge.
H Fees and expenses of any underlying Fidelity Central Funds are not included in the Fund's expense ratio. The Fund indirectly bears its proportionate share of the expenses of any underlying Fidelity Central Funds.
I Expense ratios reflect operating expenses of the class. Expenses before reductions do not reflect amounts reimbursed by the investment adviser or reductions from brokerage service arrangements or reductions from other expense offset arrangements and do not represent the amount paid by the class during periods when reimbursements or reductions occur. Expenses net of fee waivers reflect expenses after reimbursement by the investment adviser but prior to reductions from brokerage service arrangements or other expense offset arrangements. Expenses net of all reductions represent the net expenses paid by the class.
J Amount does not include the portfolio activity of any underlying Fidelity Central Funds.
K Portfolio turnover rate excludes securities received or delivered in-kind.
See accompanying notes which are an integral part of the financial statements.
Fidelity International Discovery Fund
| Years ended October 31, | 2018 | 2017 | 2016 | 2015 | 2014 |
| Selected Per–Share Data | | | | | |
| Net asset value, beginning of period | $47.04 | $37.91 | $40.12 | $39.03 | $39.82 |
| Income from Investment Operations | | | | | |
| Net investment income (loss)A | .53 | .50 | .61B | .54C | .67D |
| Net realized and unrealized gain (loss) | (4.92) | 9.29 | (2.41) | .81 | (.68) |
| Total from investment operations | (4.39) | 9.79 | (1.80) | 1.35 | (.01) |
| Distributions from net investment income | (.50) | (.61) | (.41) | (.26) | (.47) |
| Distributions from net realized gain | (1.83) | (.05) | (.01) | – | (.31) |
| Total distributions | (2.33) | (.66) | (.41)E | (.26) | (.78) |
| Redemption fees added to paid in capitalA | – | –F | –F | –F | –F |
| Net asset value, end of period | $40.32 | $47.04 | $37.91 | $40.12 | $39.03 |
| Total ReturnG | (9.81)% | 26.33% | (4.53)% | 3.47% | (.01)% |
| Ratios to Average Net AssetsH,I | | | | | |
| Expenses before reductions | .88% | .94% | 1.00% | .99% | .93% |
| Expenses net of fee waivers, if any | .88% | .94% | 1.00% | .99% | .93% |
| Expenses net of all reductions | .87% | .92% | .99% | .98% | .93% |
| Net investment income (loss) | 1.17% | 1.22% | 1.61%B | 1.34%C | 1.69%D |
| Supplemental Data | | | | | |
| Net assets, end of period (in millions) | $6,515 | $7,351 | $6,421 | $7,209 | $7,464 |
| Portfolio turnover rateJ | 45%K | 42% | 50%K | 60%K | 57% |
A Calculated based on average shares outstanding during the period.
B Net investment income per share reflects a large, non-recurring dividend which amounted to $.14 per share. Excluding this non-recurring dividend, the ratio of net investment income (loss) to average net assets would have been 1.23%.
C Net investment income per share reflects a large, non-recurring dividend which amounted to $.12 per share. Excluding this non-recurring dividend, the ratio of net investment income (loss) to average net assets would have been 1.03%.
D Net investment income per share reflects a large, non-recurring dividend which amounted to $.22 per share. Excluding this non-recurring dividend, the ratio of net investment income (loss) to average net assets would have been 1.15%.
E Total distributions of $.41 per share is comprised of distributions from net investment income of $.409 and distributions from net realized gain of $.005 per share.
F Amount represents less than $.005 per share.
G Total returns would have been lower if certain expenses had not been reduced during the applicable periods shown.
H Fees and expenses of any underlying Fidelity Central Funds are not included in the Fund's expense ratio. The Fund indirectly bears its proportionate share of the expenses of any underlying Fidelity Central Funds.
I Expense ratios reflect operating expenses of the class. Expenses before reductions do not reflect amounts reimbursed by the investment adviser or reductions from brokerage service arrangements or reductions from other expense offset arrangements and do not represent the amount paid by the class during periods when reimbursements or reductions occur. Expenses net of fee waivers reflect expenses after reimbursement by the investment adviser but prior to reductions from brokerage service arrangements or other expense offset arrangements. Expenses net of all reductions represent the net expenses paid by the class.
J Amount does not include the portfolio activity of any underlying Fidelity Central Funds.
K Portfolio turnover rate excludes securities received or delivered in-kind.
See accompanying notes which are an integral part of the financial statements.
Fidelity International Discovery Fund Class K
| Years ended October 31, | 2018 | 2017 | 2016 | 2015 | 2014 |
| Selected Per–Share Data | | | | | |
| Net asset value, beginning of period | $46.96 | $37.86 | $40.06 | $38.97 | $39.76 |
| Income from Investment Operations | | | | | |
| Net investment income (loss)A | .58 | .55 | .66B | .59C | .72D |
| Net realized and unrealized gain (loss) | (4.90) | 9.26 | (2.39) | .81 | (.67) |
| Total from investment operations | (4.32) | 9.81 | (1.73) | 1.40 | .05 |
| Distributions from net investment income | (.55) | (.66) | (.46) | (.31) | (.53) |
| Distributions from net realized gain | (1.83) | (.05) | (.01) | – | (.31) |
| Total distributions | (2.39)E | (.71) | (.47) | (.31) | (.84) |
| Redemption fees added to paid in capitalA | – | –F | –F | –F | –F |
| Net asset value, end of period | $40.25 | $46.96 | $37.86 | $40.06 | $38.97 |
| Total ReturnG | (9.70)% | 26.47% | (4.38)% | 3.61% | .13% |
| Ratios to Average Net AssetsH,I | | | | | |
| Expenses before reductions | .77% | .82% | .86% | .86% | .80% |
| Expenses net of fee waivers, if any | .77% | .82% | .86% | .86% | .80% |
| Expenses net of all reductions | .76% | .80% | .85% | .85% | .79% |
| Net investment income (loss) | 1.29% | 1.35% | 1.74%B | 1.47%C | 1.83%D |
| Supplemental Data | | | | | |
| Net assets, end of period (in millions) | $2,064 | $2,228 | $1,880 | $2,308 | $2,464 |
| Portfolio turnover rateJ | 45%K | 42% | 50%K | 60%K | 57% |
A Calculated based on average shares outstanding during the period.
B Net investment income per share reflects a large, non-recurring dividend which amounted to $.14 per share. Excluding this non-recurring dividend, the ratio of net investment income (loss) to average net assets would have been 1.36%.
C Net investment income per share reflects a large, non-recurring dividend which amounted to $.12 per share. Excluding this non-recurring dividend, the ratio of net investment income (loss) to average net assets would have been 1.16%.
D Net investment income per share reflects a large, non-recurring dividend which amounted to $.22 per share. Excluding this non-recurring dividend, the ratio of net investment income (loss) to average net assets would have been 1.28%.
E Total distributions of $2.39 per share is comprised of distributions from net investment income of $.554 and distributions from net realized gain of $1.832 per share.
F Amount represents less than $.005 per share.
G Total returns would have been lower if certain expenses had not been reduced during the applicable periods shown.
H Fees and expenses of any underlying Fidelity Central Funds are not included in the Fund's expense ratio. The Fund indirectly bears its proportionate share of the expenses of any underlying Fidelity Central Funds.
I Expense ratios reflect operating expenses of the class. Expenses before reductions do not reflect amounts reimbursed by the investment adviser or reductions from brokerage service arrangements or reductions from other expense offset arrangements and do not represent the amount paid by the class during periods when reimbursements or reductions occur. Expenses net of fee waivers reflect expenses after reimbursement by the investment adviser but prior to reductions from brokerage service arrangements or other expense offset arrangements. Expenses net of all reductions represent the net expenses paid by the class.
J Amount does not include the portfolio activity of any underlying Fidelity Central Funds.
K Portfolio turnover rate excludes securities received or delivered in-kind.
See accompanying notes which are an integral part of the financial statements.
Fidelity International Discovery Fund Class I
| Years ended October 31, | 2018 | 2017 | 2016 | 2015 | 2014 |
| Selected Per–Share Data | | | | | |
| Net asset value, beginning of period | $46.92 | $37.82 | $40.03 | $38.96 | $39.76 |
| Income from Investment Operations | | | | | |
| Net investment income (loss)A | .52 | .49 | .61B | .53C | .67D |
| Net realized and unrealized gain (loss) | (4.90) | 9.27 | (2.40) | .80 | (.68) |
| Total from investment operations | (4.38) | 9.76 | (1.79) | 1.33 | (.01) |
| Distributions from net investment income | (.49) | (.61) | (.42) | (.26) | (.48) |
| Distributions from net realized gain | (1.83) | (.05) | (.01) | – | (.31) |
| Total distributions | (2.32) | (.66) | (.42)E | (.26) | (.79) |
| Redemption fees added to paid in capitalA | – | –F | –F | –F | –F |
| Net asset value, end of period | $40.22 | $46.92 | $37.82 | $40.03 | $38.96 |
| Total ReturnG | (9.81)% | 26.29% | (4.52)% | 3.44% | (.01)% |
| Ratios to Average Net AssetsH,I | | | | | |
| Expenses before reductions | .91% | .96% | 1.00% | 1.00% | .93% |
| Expenses net of fee waivers, if any | .91% | .96% | 1.00% | .99% | .93% |
| Expenses net of all reductions | .90% | .94% | .99% | .98% | .93% |
| Net investment income (loss) | 1.15% | 1.21% | 1.60%B | 1.33%C | 1.69%D |
| Supplemental Data | | | | | |
| Net assets, end of period (in millions) | $579 | $658 | $745 | $1,061 | $650 |
| Portfolio turnover rateJ | 45%K | 42% | 50%K | 60%K | 57% |
A Calculated based on average shares outstanding during the period.
B Net investment income per share reflects a large, non-recurring dividend which amounted to $.14 per share. Excluding this non-recurring dividend, the ratio of net investment income (loss) to average net assets would have been 1.22%.
C Net investment income per share reflects a large, non-recurring dividend which amounted to $.12 per share. Excluding this non-recurring dividend, the ratio of net investment income (loss) to average net assets would have been 1.03%.
D Net investment income per share reflects a large, non-recurring dividend which amounted to $.22 per share. Excluding this non-recurring dividend, the ratio of net investment income (loss) to average net assets would have been 1.14%.
E Total distributions of $.42 per share is comprised of distributions from net investment income of $.418 and distributions from net realized gain of $.005 per share.
F Amount represents less than $.005 per share.
G Total returns would have been lower if certain expenses had not been reduced during the applicable periods shown.
H Fees and expenses of any underlying Fidelity Central Funds are not included in the Fund's expense ratio. The Fund indirectly bears its proportionate share of the expenses of any underlying Fidelity Central Funds.
I Expense ratios reflect operating expenses of the class. Expenses before reductions do not reflect amounts reimbursed by the investment adviser or reductions from brokerage service arrangements or reductions from other expense offset arrangements and do not represent the amount paid by the class during periods when reimbursements or reductions occur. Expenses net of fee waivers reflect expenses after reimbursement by the investment adviser but prior to reductions from brokerage service arrangements or other expense offset arrangements. Expenses net of all reductions represent the net expenses paid by the class.
J Amount does not include the portfolio activity of any underlying Fidelity Central Funds.
K Portfolio turnover rate excludes securities received or delivered in-kind.
See accompanying notes which are an integral part of the financial statements.
Fidelity International Discovery Fund Class Z
| Years ended October 31, | 2018 | 2017 | 2016 | 2015 | 2014 |
| Selected Per–Share Data | | | | | |
| Net asset value, beginning of period | $46.92 | $37.84 | $40.03 | $38.96 | $39.77 |
| Income from Investment Operations | | | | | |
| Net investment income (loss)A | .58 | .56 | .66B | .59C | .72D |
| Net realized and unrealized gain (loss) | (4.89) | 9.24 | (2.38) | .80 | (.68) |
| Total from investment operations | (4.31) | 9.80 | (1.72) | 1.39 | .04 |
| Distributions from net investment income | (.56) | (.67) | (.46) | (.32) | (.54) |
| Distributions from net realized gain | (1.83) | (.05) | (.01) | – | (.31) |
| Total distributions | (2.39) | (.72) | (.47) | (.32) | (.85) |
| Redemption fees added to paid in capitalA | – | –E | –E | –E | –E |
| Net asset value, end of period | $40.22 | $46.92 | $37.84 | $40.03 | $38.96 |
| Total ReturnF | (9.68)% | 26.44% | (4.36)% | 3.58% | .12% |
| Ratios to Average Net AssetsG,H | | | | | |
| Expenses before reductions | .77% | .82% | .86% | .86% | .80% |
| Expenses net of fee waivers, if any | .77% | .82% | .86% | .86% | .80% |
| Expenses net of all reductions | .76% | .80% | .85% | .85% | .79% |
| Net investment income (loss) | 1.29% | 1.35% | 1.74%B | 1.47%C | 1.83%D |
| Supplemental Data | | | | | |
| Net assets, end of period (in millions) | $118 | $101 | $38 | $30 | $35 |
| Portfolio turnover rateI | 45%J | 42% | 50%J | 60%J | 57% |
A Calculated based on average shares outstanding during the period.
B Net investment income per share reflects a large, non-recurring dividend which amounted to $.14 per share. Excluding this non-recurring dividend, the ratio of net investment income (loss) to average net assets would have been 1.36%.
C Net investment income per share reflects a large, non-recurring dividend which amounted to $.12 per share. Excluding this non-recurring dividend, the ratio of net investment income (loss) to average net assets would have been 1.16%.
D Net investment income per share reflects a large, non-recurring dividend which amounted to $.21 per share. Excluding this non-recurring dividend, the ratio of net investment income (loss) to average net assets would have been 1.28%.
E Amount represents less than $.005 per share.
F Total returns would have been lower if certain expenses had not been reduced during the applicable periods shown.
G Fees and expenses of any underlying Fidelity Central Funds are not included in the Fund's expense ratio. The Fund indirectly bears its proportionate share of the expenses of any underlying Fidelity Central Funds.
H Expense ratios reflect operating expenses of the class. Expenses before reductions do not reflect amounts reimbursed by the investment adviser or reductions from brokerage service arrangements or reductions from other expense offset arrangements and do not represent the amount paid by the class during periods when reimbursements or reductions occur. Expenses net of fee waivers reflect expenses after reimbursement by the investment adviser but prior to reductions from brokerage service arrangements or other expense offset arrangements. Expenses net of all reductions represent the net expenses paid by the class.
I Amount does not include the portfolio activity of any underlying Fidelity Central Funds.
J Portfolio turnover rate excludes securities received or delivered in-kind.
See accompanying notes which are an integral part of the financial statements.
Notes to Financial Statements
For the period ended October 31, 2018
(Amounts in thousands except percentages)
1. Organization.
Fidelity International Discovery Fund (the Fund) is a fund of Fidelity Investment Trust (the Trust) and is authorized to issue an unlimited number of shares. The Trust is registered under the Investment Company Act of 1940, as amended (the 1940 Act), as an open-end management investment company organized as a Massachusetts business trust. The Fund offers Class A, Class M, Class C, International Discovery, Class K, Class I and Class Z shares, each of which has equal rights as to assets and voting privileges. Each class has exclusive voting rights with respect to matters that affect that class.
2. Investments in Fidelity Central Funds.
The Fund invests in Fidelity Central Funds, which are open-end investment companies generally available only to other investment companies and accounts managed by the investment adviser and its affiliates. The Fund's Schedule of Investments lists each of the Fidelity Central Funds held as of period end, if any, as an investment of the Fund, but does not include the underlying holdings of each Fidelity Central Fund. As an Investing Fund, the Fund indirectly bears its proportionate share of the expenses of the underlying Fidelity Central Funds.
The Money Market Central Funds seek preservation of capital and current income and are managed by Fidelity Investments Money Management, Inc. (FIMM), an affiliate of the investment adviser. Annualized expenses of the Money Market Central Funds as of their most recent shareholder report date are less than .005%.
A complete unaudited list of holdings for each Fidelity Central Fund is available upon request or at the Securities and Exchange Commission (the SEC) website at www.sec.gov. In addition, the financial statements of the Fidelity Central Funds, which are not covered by the Fund's Report of Independent Registered Public Accounting Firm, are available on the SEC website or upon request.
3. Significant Accounting Policies.
The Fund is an investment company and applies the accounting and reporting guidance of the Financial Accounting Standards Board (FASB) Accounting Standards Codification Topic 946 Financial Services – Investments Companies. The financial statements have been prepared in conformity with accounting principles generally accepted in the United States of America (GAAP), which require management to make certain estimates and assumptions at the date of the financial statements. Actual results could differ from those estimates. Subsequent events, if any, through the date that the financial statements were issued have been evaluated in the preparation of the financial statements. The following summarizes the significant accounting policies of the Fund:
Investment Valuation. Investments are valued as of 4:00 p.m. Eastern time on the last calendar day of the period. The Board of Trustees (the Board) has delegated the day to day responsibility for the valuation of the Fund's investments to the Fair Value Committee (the Committee) established by the Fund's investment adviser. In accordance with valuation policies and procedures approved by the Board, the Fund attempts to obtain prices from one or more third party pricing vendors or brokers to value its investments. When current market prices, quotations or currency exchange rates are not readily available or reliable, investments will be fair valued in good faith by the Committee, in accordance with procedures adopted by the Board. Factors used in determining fair value vary by investment type and may include market or investment specific events, changes in interest rates and credit quality. The frequency with which these procedures are used cannot be predicted and they may be utilized to a significant extent. The Committee oversees the Fund's valuation policies and procedures and reports to the Board on the Committee's activities and fair value determinations. The Board monitors the appropriateness of the procedures used in valuing the Fund's investments and ratifies the fair value determinations of the Committee.
The Fund categorizes the inputs to valuation techniques used to value its investments into a disclosure hierarchy consisting of three levels as shown below:
- Level 1 – quoted prices in active markets for identical investments
- Level 2 – other significant observable inputs (including quoted prices for similar investments, interest rates, prepayment speeds, etc.)
- Level 3 – unobservable inputs (including the Fund's own assumptions based on the best information available)
Valuation techniques used to value the Fund's investments by major category are as follows:
Equity securities, including restricted securities, for which market quotations are readily available, are valued at the last reported sale price or official closing price as reported by a third party pricing vendor on the primary market or exchange on which they are traded and are categorized as Level 1 in the hierarchy. In the event there were no sales during the day or closing prices are not available, securities are valued at the last quoted bid price or may be valued using the last available price and are generally categorized as Level 2 in the hierarchy. For foreign equity securities, when market or security specific events arise, comparisons to the valuation of American Depositary Receipts (ADRs), futures contracts, Exchange-Traded Funds (ETFs) and certain indexes as well as quoted prices for similar securities may be used and would be categorized as Level 2 in the hierarchy. Utilizing these techniques may result in transfers between Level 1 and Level 2. For equity securities, including restricted securities, where observable inputs are limited, assumptions about market activity and risk are used and these securities may be categorized as Level 3 in the hierarchy.
Debt securities, including restricted securities, are valued based on evaluated prices received from third party pricing vendors or from brokers who make markets in such securities. U.S. government and government agency obligations are valued by pricing vendors who utilize matrix pricing which considers yield or price of bonds of comparable quality, coupon, maturity and type or by broker-supplied prices. When independent prices are unavailable or unreliable, debt securities may be valued utilizing pricing methodologies which consider similar factors that would be used by third party pricing vendors. Debt securities are generally categorized as Level 2 in the hierarchy but may be Level 3 depending on the circumstances.
Futures contracts are valued at the settlement price established each day by the board of trade or exchange on which they are traded and are categorized as Level 1 in the hierarchy. Investments in open-end mutual funds, including the Fidelity Central Funds, are valued at their closing net asset value (NAV) each business day and are categorized as Level 1 in the hierarchy.
Changes in valuation techniques may result in transfers in or out of an assigned level within the disclosure hierarchy. The aggregate value of investments by input level as of October 31, 2018, including information on transfers between Levels 1 and 2, is included at the end of the Fund's Schedule of Investments.
Foreign Currency. The Fund may use foreign currency contracts to facilitate transactions in foreign-denominated securities. Gains and losses from these transactions may arise from changes in the value of the foreign currency or if the counterparties do not perform under the contracts' terms.
Foreign-denominated assets, including investment securities, and liabilities are translated into U.S. dollars at the exchange rates at period end. Purchases and sales of investment securities, income and dividends received and expenses denominated in foreign currencies are translated into U.S. dollars at the exchange rate in effect on the transaction date.
The effects of exchange rate fluctuations on investments are included with the net realized and unrealized gain (loss) on investment securities. Other foreign currency transactions resulting in realized and unrealized gain (loss) are disclosed separately.
Investment Transactions and Income. For financial reporting purposes, the Fund's investment holdings and NAV include trades executed through the end of the last business day of the period. The NAV per share for processing shareholder transactions is calculated as of the close of business of the New York Stock Exchange (NYSE), normally 4:00 p.m. Eastern time and includes trades executed through the end of the prior business day. Gains and losses on securities sold are determined on the basis of identified cost and include proceeds received from litigation. Dividend income is recorded on the ex-dividend date, except for certain dividends from foreign securities where the ex-dividend date may have passed, which are recorded as soon as the Fund is informed of the ex-dividend date. Non-cash dividends included in dividend income, if any, are recorded at the fair market value of the securities received. Income and capital gain distributions from Fidelity Central Funds, if any, are recorded on the ex-dividend date. Certain distributions received by the Fund represent a return of capital or capital gain. The Fund determines the components of these distributions subsequent to the ex-dividend date, based upon receipt of tax filings or other correspondence relating to the underlying investment. These distributions are recorded as a reduction of cost of investments and/or as a realized gain. Interest income is accrued as earned and includes coupon interest and amortization of premium and accretion of discount on debt securities as applicable. Investment income is recorded net of foreign taxes withheld where recovery of such taxes is uncertain.
Class Allocations and Expenses. Investment income, realized and unrealized capital gains and losses, common expenses of the Fund, and certain fund-level expense reductions, if any, are allocated daily on a pro-rata basis to each class based on the relative net assets of each class to the total net assets of the Fund. Each class differs with respect to transfer agent and distribution and service plan fees incurred. Certain expense reductions may also differ by class. For the reporting period, the allocated portion of income and expenses to each class as a percent of its average net assets may vary due to the timing of recording these transactions in relation to fluctuating net assets of the classes. Expenses directly attributable to a fund are charged to that fund. Expenses attributable to more than one fund are allocated among the respective funds on the basis of relative net assets or other appropriate methods. Expense estimates are accrued in the period to which they relate and adjustments are made when actual amounts are known.
Deferred Trustee Compensation. Under a Deferred Compensation Plan (the Plan) for the Fund, certain independent Trustees have elected to defer receipt of a portion of their annual compensation. Deferred amounts are invested in a cross-section of Fidelity funds, are marked-to-market and remain in the Fund until distributed in accordance with the Plan. The investment of deferred amounts and the offsetting payable to the Trustees of $533 are included in the accompanying Statement of Assets and Liabilities in other receivables and other payables and accrued expenses, respectively.
Income Tax Information and Distributions to Shareholders. Each year, the Fund intends to qualify as a regulated investment company under Subchapter M of the Internal Revenue Code, including distributing substantially all of its taxable income and realized gains. As a result, no provision for U.S. Federal income taxes is required. As of October 31, 2018, the Fund did not have any unrecognized tax benefits in the financial statements; nor is the Fund aware of any tax positions for which it is reasonably possible that the total amounts of unrecognized tax benefits will significantly change in the next twelve months. The Fund files a U.S. federal tax return, in addition to state and local tax returns as required. The Fund's federal income tax returns are subject to examination by the Internal Revenue Service (IRS) for a period of three fiscal years after they are filed. State and local tax returns may be subject to examination for an additional fiscal year depending on the jurisdiction. Foreign taxes are provided for based on the Fund's understanding of the tax rules and rates that exist in the foreign markets in which it invests.
Distributions are declared and recorded on the ex-dividend date. Income and capital gain distributions are declared separately for each class. Income and capital gain distributions are determined in accordance with income tax regulations, which may differ from GAAP. In addition, the Fund claimed a portion of the payment made to redeeming shareholders as a distribution for income tax purposes.
Capital accounts within the financial statements are adjusted for permanent book-tax differences. These adjustments have no impact on net assets or the results of operations. Capital accounts are not adjusted for temporary book-tax differences which will reverse in a subsequent period.
Book-tax differences are primarily due to foreign currency transactions, passive foreign investment companies (PFIC), market discount, redemptions in kind, deferred trustees compensation and losses deferred due to wash sales.
As of period end, the cost and unrealized appreciation (depreciation) in securities, and derivatives if applicable, for federal income tax purposes were as follows:
| Gross unrealized appreciation | $1,387,775 |
| Gross unrealized depreciation | (552,589) |
| Net unrealized appreciation (depreciation) | $835,186 |
| Tax Cost | $8,853,051 |
The tax-based components of distributable earnings as of period end were as follows:
| Undistributed ordinary income | $100,442 |
| Undistributed long-term capital gain | $212,907 |
| Net unrealized appreciation (depreciation) on securities and other investments | $832,878 |
The tax character of distributions paid was as follows:
| | October 31, 2018 | October 31, 2017 |
| Ordinary Income | $123,038 | $ 162,113 |
| Long-term Capital Gains | 412,903 | – |
| Total | $535,941 | $ 162,113 |
Restricted Securities. The Fund may invest in securities that are subject to legal or contractual restrictions on resale. These securities generally may be resold in transactions exempt from registration or to the public if the securities are registered. Disposal of these securities may involve time-consuming negotiations and expense, and prompt sale at an acceptable price may be difficult. Information regarding restricted securities is included at the end of the Fund's Schedule of Investments.
New Rule Issuance. During August 2018, the U.S. Securities and Exchange Commission issued Final Rule Release No. 33-10532, Disclosure Update and Simplification. This Final Rule includes amendments specific to registered investment companies that are intended to eliminate overlap in disclosure requirements between Regulation S-X and GAAP. In accordance with these amendments, certain line-items in the Fund's financial statements have been combined or removed for the current period as outlined in the table below.
| Financial Statement | Current Line-Item Presentation | Prior Line-Item Presentation |
| Statement of Assets and Liabilities | Total distributable earnings (loss) | Undistributed/Distributions in excess of/Accumulated net investment income (loss)
Accumulated/Undistributed net realized gain (loss)
Net unrealized appreciation (depreciation) |
| Statement of Changes in Net Assets | N/A - removed | Undistributed/Distributions in excess of/Accumulated net investment income (loss) end of period |
| Statement of Changes in Net Assets | Distributions to shareholders | Distributions to shareholders from net investment income
Distributions to shareholders from net realized gain |
| Distributions to Shareholders Note to Financial Statements | Distributions to shareholders | Distributions to shareholders from net investment income
Distributions to shareholders from net realized gain |
4. Derivative Instruments.
Risk Exposures and the Use of Derivative Instruments. The Fund's investment objective allows the Fund to enter into various types of derivative contracts, including futures contracts. Derivatives are investments whose value is primarily derived from underlying assets, indices or reference rates and may be transacted on an exchange or over-the-counter (OTC). Derivatives may involve a future commitment to buy or sell a specified asset based on specified terms, to exchange future cash flows at periodic intervals based on a notional principal amount, or for one party to make one or more payments upon the occurrence of specified events in exchange for periodic payments from the other party.
The Fund used derivatives to increase returns and to manage exposure to certain risks as defined below. The success of any strategy involving derivatives depends on analysis of numerous economic factors, and if the strategies for investment do not work as intended, the Fund may not achieve its objectives.
The Fund's use of derivatives increased or decreased its exposure to the following risk:
| Equity Risk | Equity risk relates to the fluctuations in the value of financial instruments as a result of changes in market prices (other than those arising from interest rate risk or foreign exchange risk), whether caused by factors specific to an individual investment, its issuer, or all factors affecting all instruments traded in a market or market segment.
|
The Fund is also exposed to additional risks from investing in derivatives, such as liquidity risk and counterparty credit risk. Liquidity risk is the risk that the Fund will be unable to close out the derivative in the open market in a timely manner. Counterparty credit risk is the risk that the counterparty will not be able to fulfill its obligation to the Fund. Counterparty credit risk related to exchange-traded futures contracts may be mitigated by the protection provided by the exchange on which they trade.
Investing in derivatives may involve greater risks than investing in the underlying assets directly and, to varying degrees, may involve risk of loss in excess of any initial investment and collateral received and amounts recognized in the Statement of Assets and Liabilities. In addition, there may be the risk that the change in value of the derivative contract does not correspond to the change in value of the underlying instrument.
Futures Contracts. A futures contract is an agreement between two parties to buy or sell a specified underlying instrument for a fixed price at a specified future date. The Fund used futures contracts to manage its exposure to the stock market.
Upon entering into a futures contract, a fund is required to deposit either cash or securities (initial margin) with a clearing broker in an amount equal to a certain percentage of the face value of the contract. Futures contracts are marked-to-market daily and subsequent daily payments (variation margin) are made or received by a fund depending on the daily fluctuations in the value of the futures contracts and are recorded as unrealized appreciation or (depreciation). This receivable and/or payable, if any, is included in daily variation margin on futures contracts in the Statement of Assets and Liabilities. Realized gain or (loss) is recorded upon the expiration or closing of a futures contract. The net realized gain (loss) and change in net unrealized appreciation (depreciation) on futures contracts during the period is presented in the Statement of Operations.
Any open futures contracts at period end are presented in the Schedule of Investments under the caption "Futures Contracts". The notional amount at value reflects each contract's exposure to the underlying instrument or index at period end and is representative of volume of activity during the period. Securities deposited to meet initial margin requirements are identified in the Schedule of Investments.
5. Purchases and Sales of Investments.
Purchases and sales of securities, other than short-term securities and in-kind transactions, aggregated $4,496,106 and $5,146,595, respectively.
Redemptions In-Kind. During the period, 2,145 shares of the Fund held by unaffiliated entities were redeemed in-kind for investments and cash with a value of $96,039. The net realized gain of $24,574 on investments delivered through the in-kind redemptions is included in the accompanying Statement of Operations. The amount of the redemptions is included in share transactions activity shown in the accompanying Statement of Changes in Net Assets as well as the Notes to Financial Statements. The Fund recognized no gain or loss for federal income tax purposes.
6. Fees and Other Transactions with Affiliates.
Management Fee. Fidelity Management & Research Company (the investment adviser) and its affiliates provide the Fund with investment management related services for which the Fund pays a monthly management fee. The management fee is the sum of an individual fund fee rate that is based on an annual rate of .424% of the Fund's average net assets and an annualized group fee rate that averaged .24% during the period. The group fee rate is based upon the average net assets of all the mutual funds advised by the investment adviser, including any mutual funds previously advised by the investment adviser that are currently advised by Fidelity SelectCo, LLC, an affiliate of the investment adviser. The group fee rate decreases as assets under management increase and increases as assets under management decrease. In addition, the management fee is subject to a performance adjustment (up to a maximum of +/- .20% of the Fund's average net assets over a 36 month performance period). The upward or downward adjustment to the management fee is based on the relative investment performance of International Discovery as compared to its benchmark index, the MSCI EAFE Index, over the same 36 month performance period. For the reporting period, the total annual management fee rate, including the performance adjustment, was .69% of the Fund's average net assets. The performance adjustment included in the management fee rate may be higher or lower than the maximum performance adjustment rate due to the difference between the average net assets for the reporting and performance periods.
Distribution and Service Plan Fees. In accordance with Rule 12b-1 of the 1940 Act, the Fund has adopted separate Distribution and Service Plans for each class of shares. Certain classes pay Fidelity Distributors Corporation (FDC), an affiliate of the investment adviser, separate Distribution and Service Fees, each of which is based on an annual percentage of each class' average net assets. In addition, FDC may pay financial intermediaries for selling shares of the Fund and providing shareholder support services. For the period, the Distribution and Service Fee rates, total fees and amounts retained by FDC were as follows:
| | Distribution Fee | Service Fee | Total Fees | Retained by FDC |
| Class A | -% | .25% | $579 | $12 |
| Class M | .25% | .25% | 167 | 1 |
| Class C | .75% | .25% | 265 | 24 |
| | | | $1,011 | $37 |
Sales Load. FDC may receive a front-end sales charge of up to 5.75% for selling Class A shares and 3.50% for selling Class M shares, some of which is paid to financial intermediaries for selling shares of the Fund. Depending on the holding period, FDC may receive contingent deferred sales charges levied on Class A, Class M and Class C redemptions. The deferred sales charges are 1.00% for Class C shares, 1.00% for certain purchases of Class A shares and .25% for certain purchases of Class M shares.
For the period, sales charge amounts retained by FDC were as follows:
| | Retained by FDC |
| Class A | $38 |
| Class M | 3 |
| Class C(a) | 4 |
| | $45 |
(a) When Class C shares are initially sold, FDC pays commissions from its own resources to financial intermediaries through which the sales are made.
Transfer Agent Fees. Fidelity Investments Institutional Operations Company, Inc., (FIIOC), an affiliate of the investment adviser, is the transfer, dividend disbursing and shareholder servicing agent for each class of the Fund. FIIOC receives account fees and asset-based fees that vary according to the account size and type of account of the shareholders of the respective classes of the Fund, except for Class K and Class Z. FIIOC receives an asset-based fee of Class K's and Class Z's average net assets. FIIOC pays for typesetting, printing and mailing of shareholder reports, except proxy statements.
For the period, transfer agent fees for each class were as follows:
| | Amount | % of Class-Level Average Net Assets |
| Class A | $570 | .25 |
| Class M | 79 | .24 |
| Class C | 74 | .28 |
| International Discovery | 11,513 | .16 |
| Class K | 1,059 | .05 |
| Class I | 1,178 | .19 |
| Class Z | 54 | .05 |
| | $14,527 | |
Accounting and Security Lending Fees. Fidelity Service Company, Inc. (FSC), an affiliate of the investment adviser, maintains the Fund's accounting records. The accounting fee is based on the level of average net assets for each month. Under a separate contract, FSC administers the security lending program. The security lending fee is based on the number and duration of lending transactions. For the period, the fees were equivalent to an annual rate of .02%.
Brokerage Commissions. The Fund placed a portion of its portfolio transactions with brokerage firms which are affiliates of the investment adviser. Brokerage commissions are included in net realized gain (loss) and change in net unrealized appreciation (depreciation) in the Statement of Operations. The commissions paid to these affiliated firms were $19 for the period.
Interfund Trades. The Fund may purchase from or sell securities to other Fidelity Funds under procedures adopted by the Board. The procedures have been designed to ensure these interfund trades are executed in accordance with Rule 17a-7 of the 1940 Act. Interfund trades are included within the respective purchases and sales amounts shown in the Purchases and Sales of Investments note.
7. Committed Line of Credit.
The Fund participates with other funds managed by the investment adviser or an affiliate in a $4.25 billion credit facility (the "line of credit") to be utilized for temporary or emergency purposes to fund shareholder redemptions or for other short-term liquidity purposes. The Fund has agreed to pay commitment fees on its pro-rata portion of the line of credit, which amounted to $29 and is reflected in Miscellaneous expenses on the Statement of Operations. During the period, the Fund did not borrow on this line of credit.
8. Security Lending.
The Fund lends portfolio securities through a lending agent from time to time in order to earn additional income. For equity securities, a lending agent is used and may loan securities to certain qualified borrowers, including Fidelity Capital Markets (FCM), a broker-dealer affiliated with the Fund. On the settlement date of the loan, the Fund receives collateral (in the form of U.S. Treasury obligations, letters of credit and/or cash) against the loaned securities and maintains collateral in an amount not less than 100% of the market value of the loaned securities during the period of the loan. The market value of the loaned securities is determined at the close of business of the Fund and any additional required collateral is delivered to the Fund on the next business day. The Fund or borrower may terminate the loan at any time, and if the borrower defaults on its obligation to return the securities loaned because of insolvency or other reasons, the Fund may apply collateral received from the borrower against the obligation. The Fund may experience delays and costs in recovering the securities loaned. Any cash collateral received is invested in the Fidelity Securities Lending Cash Central Fund. The value of loaned securities and cash collateral at period end are disclosed on the Fund's Statement of Assets and Liabilities. At period end, there were no security loans outstanding with FCM. Security lending income represents the income earned on investing cash collateral, less rebates paid to borrowers and any lending agent fees associated with the loan, plus any premium payments received for lending certain types of securities. Security lending income is presented in the Statement of Operations as a component of income from Fidelity Central Funds. Total security lending income during the period amounted to $3,292, including less than five hundred dollars from securities loaned to FCM.
9. Expense Reductions.
Commissions paid to certain brokers with whom the investment adviser, or its affiliates, places trades on behalf of the Fund include an amount in addition to trade execution, which may be rebated back to the Fund to offset certain expenses. This amount totaled $1,174 for the period. In addition, through arrangements with the Fund's custodian, credits realized as a result of certain uninvested cash balances were used to reduce the Fund's expenses. During the period, these credits reduced the Fund's custody expenses by $1.
In addition, during the period the investment adviser reimbursed and/or waived a portion of fund-level operating expenses in the amount of $108.
10. Distributions to Shareholders.
Distributions to shareholders of each class were as follows:
| | Year ended
October 31, 2018 | Year ended
October 31, 2017 |
| Distributions to shareholders | | |
| Class A | $11,257 | $– |
| Class M | 1,557 | – |
| Class C | 1,132 | – |
| International Discovery | 368,791 | – |
| Class K | 115,669 | – |
| Class I | 32,390 | – |
| Class Z | 5,145 | – |
| Total | $535,941 | $– |
| From net investment income | | |
| Class A | $– | $2,894 |
| Class M | – | 333 |
| Class C | – | 92 |
| International Discovery | – | 102,284 |
| Class K | – | 32,411 |
| Class I | – | 11,493 |
| Class Z | – | 667 |
| Total | $– | $150,174 |
| From net realized gain | | |
| Class A | $– | $302 |
| Class M | – | 44 |
| Class C | – | 33 |
| International Discovery | – | 8,190 |
| Class K | – | 2,392 |
| Class I | – | 929 |
| Class Z | – | 49 |
| Total | $– | $11,939 |
11. Share Transactions.
Share transactions for each class were as follows and may contain automatic conversions between classes or exchanges between affiliated funds:
| | Shares | Shares | Dollars | Dollars |
| | Year ended October 31, 2018 | Year ended October 31, 2017 | Year ended October 31, 2018 | Year ended October 31, 2017 |
| Class A | | | | |
| Shares sold | 601 | 712 | $27,288 | $29,106 |
| Reinvestment of distributions | 252 | 87 | 11,177 | 3,152 |
| Shares redeemed | (1,390) | (1,774) | (62,507) | (71,253) |
| Net increase (decrease) | (537) | (975) | $(24,042) | $(38,995) |
| Class M | | | | |
| Shares sold | 91 | 80 | $4,077 | $3,246 |
| Reinvestment of distributions | 35 | 10 | 1,549 | 365 |
| Shares redeemed | (177) | (274) | (7,916) | (10,830) |
| Net increase (decrease) | (51) | (184) | $(2,290) | $(7,219) |
| Class C | | | | |
| Shares sold | 57 | 83 | $2,552 | $3,499 |
| Reinvestment of distributions | 25 | 3 | 1,083 | 116 |
| Shares redeemed | (152) | (174) | (6,753) | (6,878) |
| Net increase (decrease) | (70) | (88) | $(3,118) | $(3,263) |
| International Discovery | | | | |
| Shares sold | 18,511 | 19,989 | $834,070 | $812,564 |
| Reinvestment of distributions | 7,869 | 2,884 | 351,491 | 105,223 |
| Shares redeemed | (21,100) | (35,967) | (952,137) | (1,442,640) |
| Net increase (decrease) | 5,280 | (13,094) | $233,424 | $(524,853) |
| Class K | | | | |
| Shares sold | 15,085 | 10,877 | $683,626 | $448,875 |
| Reinvestment of distributions | 2,597 | 957 | 115,669 | 34,802 |
| Shares redeemed | (13,867)(a) | (14,039) | (624,849)(a) | (560,342) |
| Net increase (decrease) | 3,815 | (2,205) | $174,446 | $(76,665) |
| Class I | | | | |
| Shares sold | 3,244 | 3,202 | $143,374 | $130,302 |
| Reinvestment of distributions | 224 | 82 | 9,992 | 2,985 |
| Shares redeemed | (3,099) | (8,961) | (138,824) | (349,072) |
| Net increase (decrease) | 369 | (5,677) | $14,542 | $(215,785) |
| Class Z | | | | |
| Shares sold | 1,231 | 1,483 | $55,218 | $58,502 |
| Reinvestment of distributions | 67 | 20 | 2,993 | 716 |
| Shares redeemed | (517) | (351) | (23,246) | (14,440) |
| Net increase (decrease) | 781 | 1,152 | $34,965 | $44,778 |
(a) Amount includes in-kind redemptions (see the Redemptions In-Kind note for additional details).
12. Other.
The Fund's organizational documents provide former and current trustees and officers with a limited indemnification against liabilities arising in connection with the performance of their duties to the Fund. In the normal course of business, the Fund may also enter into contracts that provide general indemnifications. The Fund's maximum exposure under these arrangements is unknown as this would be dependent on future claims that may be made against the Fund. The risk of material loss from such claims is considered remote.
At the end of the period, Strategic Advisers International Fund was the owner of record of approximately 11% of the total outstanding shares of the Fund. Mutual funds managed by the investment adviser or its affiliates were the owners of record, in the aggregate, of approximately 22% of the total outstanding shares of the Fund.
Report of Independent Registered Public Accounting Firm
To the Board of Trustees of Fidelity Investment Trust and Shareholders of Fidelity International Discovery Fund:
Opinion on the Financial Statements
We have audited the accompanying statement of assets and liabilities, including the schedule of investments, of Fidelity International Discovery Fund (one of the funds constituting Fidelity Investment Trust, referred to hereafter as the "Fund") as of October 31, 2018, the related statement of operations for the year ended October 31, 2018, the statement of changes in net assets for each of the two years in the period ended October 31, 2018, including the related notes, and the financial highlights for each of the five years in the period ended October 31, 2018 (collectively referred to as the “financial statements”). In our opinion, the financial statements present fairly, in all material respects, the financial position of the Fund as of October 31, 2018, the results of its operations for the year then ended, the changes in its net assets for each of the two years in the period ended October 31, 2018 and the financial highlights for each of the five years in the period ended October 31, 2018 in conformity with accounting principles generally accepted in the United States of America.
Basis for Opinion
These financial statements are the responsibility of the Fund’s management. Our responsibility is to express an opinion on the Fund’s financial statements based on our audits. We are a public accounting firm registered with the Public Company Accounting Oversight Board (United States) (“PCAOB”) and are required to be independent with respect to the Fund in accordance with the U.S. federal securities laws and the applicable rules and regulations of the Securities and Exchange Commission and the PCAOB.
We conducted our audits of these financial statements in accordance with the standards of the PCAOB. Those standards require that we plan and perform the audit to obtain reasonable assurance about whether the financial statements are free of material misstatement, whether due to error or fraud.
Our audits included performing procedures to assess the risks of material misstatement of the financial statements, whether due to error or fraud, and performing procedures that respond to those risks. Such procedures included examining, on a test basis, evidence regarding the amounts and disclosures in the financial statements. Our audits also included evaluating the accounting principles used and significant estimates made by management, as well as evaluating the overall presentation of the financial statements. Our procedures included confirmation of securities owned as of October 31, 2018 by correspondence with the custodian, and brokers; when replies were not received from brokers, we performed other auditing procedures. We believe that our audits provide a reasonable basis for our opinion.
PricewaterhouseCoopers LLP
Boston, Massachusetts
December 12, 2018
We have served as the auditor of one or more investment companies in the Fidelity group of funds since 1932.
Trustees and Officers
The Trustees, Members of the Advisory Board (if any), and officers of the trust and fund, as applicable, are listed below. The Board of Trustees governs the fund and is responsible for protecting the interests of shareholders. The Trustees are experienced executives who meet periodically throughout the year to oversee the fund's activities, review contractual arrangements with companies that provide services to the fund, oversee management of the risks associated with such activities and contractual arrangements, and review the fund's performance. Except for Jonathan Chiel, each of the Trustees oversees 283 funds. Mr. Chiel oversees 154 funds.
The Trustees hold office without limit in time except that (a) any Trustee may resign; (b) any Trustee may be removed by written instrument, signed by at least two-thirds of the number of Trustees prior to such removal; (c) any Trustee who requests to be retired or who has become incapacitated by illness or injury may be retired by written instrument signed by a majority of the other Trustees; and (d) any Trustee may be removed at any special meeting of shareholders by a two-thirds vote of the outstanding voting securities of the trust. Each Trustee who is not an interested person (as defined in the 1940 Act) of the trust and the fund is referred to herein as an Independent Trustee. Each Independent Trustee shall retire not later than the last day of the calendar year in which his or her 75th birthday occurs. The Independent Trustees may waive this mandatory retirement age policy with respect to individual Trustees. Officers and Advisory Board Members hold office without limit in time, except that any officer or Advisory Board Member may resign or may be removed by a vote of a majority of the Trustees at any regular meeting or any special meeting of the Trustees. Except as indicated, each individual has held the office shown or other offices in the same company for the past five years.
The fund’s Statement of Additional Information (SAI) includes more information about the Trustees. To request a free copy, call Fidelity at 1-800-544-8544.
Experience, Skills, Attributes, and Qualifications of the Trustees. The Governance and Nominating Committee has adopted a statement of policy that describes the experience, qualifications, attributes, and skills that are necessary and desirable for potential Independent Trustee candidates (Statement of Policy). The Board believes that each Trustee satisfied at the time he or she was initially elected or appointed a Trustee, and continues to satisfy, the standards contemplated by the Statement of Policy. The Governance and Nominating Committee also engages professional search firms to help identify potential Independent Trustee candidates who have the experience, qualifications, attributes, and skills consistent with the Statement of Policy. From time to time, additional criteria based on the composition and skills of the current Independent Trustees, as well as experience or skills that may be appropriate in light of future changes to board composition, business conditions, and regulatory or other developments, have also been considered by the professional search firms and the Governance and Nominating Committee. In addition, the Board takes into account the Trustees' commitment and participation in Board and committee meetings, as well as their leadership of standing and ad hoc committees throughout their tenure.
In determining that a particular Trustee was and continues to be qualified to serve as a Trustee, the Board has considered a variety of criteria, none of which, in isolation, was controlling. The Board believes that, collectively, the Trustees have balanced and diverse experience, qualifications, attributes, and skills, which allow the Board to operate effectively in governing the fund and protecting the interests of shareholders. Information about the specific experience, skills, attributes, and qualifications of each Trustee, which in each case led to the Board's conclusion that the Trustee should serve (or continue to serve) as a trustee of the fund, is provided below.
Board Structure and Oversight Function. James C. Curvey is an interested person and currently serves as Chairman. The Trustees have determined that an interested Chairman is appropriate and benefits shareholders because an interested Chairman has a personal and professional stake in the quality and continuity of services provided to the fund. Independent Trustees exercise their informed business judgment to appoint an individual of their choosing to serve as Chairman, regardless of whether the Trustee happens to be independent or a member of management. The Independent Trustees have determined that they can act independently and effectively without having an Independent Trustee serve as Chairman and that a key structural component for assuring that they are in a position to do so is for the Independent Trustees to constitute a substantial majority for the Board. The Independent Trustees also regularly meet in executive session. Ned C. Lautenbach serves as Chairman of the Independent Trustees and as such (i) acts as a liaison between the Independent Trustees and management with respect to matters important to the Independent Trustees and (ii) with management prepares agendas for Board meetings.
Fidelity® funds are overseen by different Boards of Trustees. The fund's Board oversees Fidelity's high income and certain equity funds, and other Boards oversee Fidelity's investment-grade bond, money market, asset allocation, and other equity funds. The asset allocation funds may invest in Fidelity® funds overseen by the fund's Board. The use of separate Boards, each with its own committee structure, allows the Trustees of each group of Fidelity® funds to focus on the unique issues of the funds they oversee, including common research, investment, and operational issues. On occasion, the separate Boards establish joint committees to address issues of overlapping consequences for the Fidelity® funds overseen by each Board.
The Trustees operate using a system of committees to facilitate the timely and efficient consideration of all matters of importance to the Trustees, the fund, and fund shareholders and to facilitate compliance with legal and regulatory requirements and oversight of the fund's activities and associated risks. The Board, acting through its committees, has charged FMR and its affiliates with (i) identifying events or circumstances the occurrence of which could have demonstrably adverse effects on the fund's business and/or reputation; (ii) implementing processes and controls to lessen the possibility that such events or circumstances occur or to mitigate the effects of such events or circumstances if they do occur; and (iii) creating and maintaining a system designed to evaluate continuously business and market conditions in order to facilitate the identification and implementation processes described in (i) and (ii) above. Because the day-to-day operations and activities of the fund are carried out by or through FMR, its affiliates, and other service providers, the fund's exposure to risks is mitigated but not eliminated by the processes overseen by the Trustees. While each of the Board's committees has responsibility for overseeing different aspects of the fund's activities, oversight is exercised primarily through the Operations, Audit, and Compliance Committees. In addition, the Independent Trustees have worked with Fidelity to enhance the Board's oversight of investment and financial risks, legal and regulatory risks, technology risks, and operational risks, including the development of additional risk reporting to the Board. Appropriate personnel, including but not limited to the fund's Chief Compliance Officer (CCO), FMR's internal auditor, the independent accountants, the fund's Treasurer and portfolio management personnel, make periodic reports to the Board's committees, as appropriate, including an annual review of Fidelity's risk management program for the Fidelity® funds. The responsibilities of each standing committee, including their oversight responsibilities, are described further under "Standing Committees of the Trustees."
Interested Trustees*:
Correspondence intended for a Trustee who is an interested person may be sent to Fidelity Investments, 245 Summer Street, Boston, Massachusetts 02210.
Name, Year of Birth; Principal Occupations and Other Relevant Experience+
Jonathan Chiel (1957)
Year of Election or Appointment: 2016
Trustee
Mr. Chiel also serves as Trustee of other Fidelity® funds. Mr. Chiel is Executive Vice President and General Counsel for FMR LLC (diversified financial services company, 2012-present). Previously, Mr. Chiel served as general counsel (2004-2012) and senior vice president and deputy general counsel (2000-2004) for John Hancock Financial Services; a partner with Choate, Hall & Stewart (1996-2000) (law firm); and an Assistant United States Attorney for the United States Attorney’s Office of the District of Massachusetts (1986-95), including Chief of the Criminal Division (1993-1995). Mr. Chiel is a director on the boards of the Boston Bar Foundation and the Maimonides School.
James C. Curvey (1935)
Year of Election or Appointment: 2007
Trustee
Chairman of the Board of Trustees
Mr. Curvey also serves as Trustee of other Fidelity® funds. Mr. Curvey is Vice Chairman (2007-present) and Director of FMR LLC (diversified financial services company). In addition, Mr. Curvey is an Overseer Emeritus for the Boston Symphony Orchestra, a Director of Artis-Naples, and a Trustee of Brewster Academy in Wolfeboro, New Hampshire. Previously, Mr. Curvey served as a Director of Fidelity Research & Analysis Co. (investment adviser firm, 2009-2018), Director of Fidelity Investments Money Management, Inc. (investment adviser firm, 2009-2014) and a Director of FMR and FMR Co., Inc. (investment adviser firms, 2007-2014).
Charles S. Morrison (1960)
Year of Election or Appointment: 2014
Trustee
Mr. Morrison also serves as Trustee of other funds. He serves as President of Fidelity SelectCo, LLC (investment adviser firm, 2017-present) and Fidelity Management & Research Company (FMR) (investment adviser firm, 2016-present), a Director of Fidelity Investments Money Management, Inc. (FIMM) (investment adviser firm, 2014-present), Director of Fidelity SelectCo, LLC (investment adviser firm, 2014-present), President, Asset Management (2014-present), and is an employee of Fidelity Investments. Previously, Mr. Morrison served as Vice President of Fidelity's Fixed Income and Asset Allocation Funds (2012-2014), President, Fixed Income (2011-2014), Vice President of Fidelity's Money Market Funds (2005-2009), President, Money Market Group Leader of FMR (investment adviser firm, 2009), and Senior Vice President, Money Market Group of FMR (2004-2009). Mr. Morrison also served as Vice President of Fidelity's Bond Funds (2002-2005), certain Balanced Funds (2002-2005), and certain Asset Allocation Funds (2002-2007), and as Senior Vice President (2002-2005) of Fidelity's Bond Division.
* Determined to be an “Interested Trustee” by virtue of, among other things, his or her affiliation with the trust or various entities under common control with FMR.
+ The information includes the Trustee's principal occupation during the last five years and other information relating to the experience, attributes, and skills relevant to the Trustee's qualifications to serve as a Trustee, which led to the conclusion that the Trustee should serve as a Trustee for the fund.
Independent Trustees:
Correspondence intended for an Independent Trustee may be sent to Fidelity Investments, P.O. Box 55235, Boston, Massachusetts 02205-5235.
Name, Year of Birth; Principal Occupations and Other Relevant Experience+
Dennis J. Dirks (1948)
Year of Election or Appointment: 2005
Trustee
Mr. Dirks also serves as Trustee of other Fidelity® funds. Prior to his retirement in May 2003, Mr. Dirks was Chief Operating Officer and a member of the Board of The Depository Trust & Clearing Corporation (DTCC). He also served as President, Chief Operating Officer, and Board member of The Depository Trust Company (DTC) and President and Board member of the National Securities Clearing Corporation (NSCC). In addition, Mr. Dirks served as Chief Executive Officer and Board member of the Government Securities Clearing Corporation, Chief Executive Officer and Board member of the Mortgage-Backed Securities Clearing Corporation, as a Trustee and a member of the Finance Committee of Manhattan College (2005-2008), as a Trustee and a member of the Finance Committee of AHRC of Nassau County (2006-2008), as a member of the Independent Directors Council (IDC) Governing Council (2010-2015), and as a member of the Board of Directors for The Brookville Center for Children’s Services, Inc. (2009-2017). Mr. Dirks is a member of the Finance Committee (2016-present), Board of Directors (2017-present) and Board of Trustees (2018-present) and is Treasurer (2018-present) of the Asolo Repertory Theatre.
Donald F. Donahue (1950)
Year of Election or Appointment: 2018
Trustee
Mr. Donahue also serves as a Trustee of other Fidelity® funds. Mr. Donahue is President and Chief Executive Officer of Miranda Partners, LLC (risk consulting for the financial services industry, 2012-present). Previously, Mr. Donahue served as a Member of the Advisory Board of certain Fidelity® funds (2015-2018) and Chief Executive Officer (2006-2012), Chief Operating Officer (2003-2006), and Managing Director, Customer Marketing and Development (1999-2003) of The Depository Trust & Clearing Corporation (financial markets infrastructure). Mr. Donahue serves as a Member (2007-present) and Co-Chairman (2016-present) of the Board of Directors of United Way of New York, Member of the Board of Directors of NYC Leadership Academy (2012-present) and Member of the Board of Advisors of Ripple Labs, Inc. (financial services, 2015-present). He also served as Chairman (2010-2012) and Member of the Board of Directors (2012-2013) of Omgeo, LLC (financial services), Treasurer of United Way of New York (2012-2016), and Member of the Board of Directors of XBRL US (financial services non-profit, 2009-2012) and the International Securities Services Association (2009-2012).
Alan J. Lacy (1953)
Year of Election or Appointment: 2008
Trustee
Mr. Lacy also serves as Trustee of other Fidelity® funds. Mr. Lacy serves as a Director of Bristol-Myers Squibb Company (global pharmaceuticals, 2008-present). He is a Trustee of the California Chapter of The Nature Conservancy (2015-present) and a Director of the Center for Advanced Study in the Behavioral Sciences at Stanford University (2015-present). In addition, Mr. Lacy served as Senior Adviser (2007-2014) of Oak Hill Capital Partners, L.P. (private equity) and also served as Chief Executive Officer (2005) and Vice Chairman (2005-2006) of Sears Holdings Corporation (retail) and Chief Executive Officer and Chairman of the Board of Sears, Roebuck and Co. (retail, 2000-2005). Previously, Mr. Lacy served as Chairman (2014-2017) and a member (2010-2017) of the Board of Directors of Dave & Buster’s Entertainment, Inc. (restaurant and entertainment complexes), as Chairman (2008-2011) and a member (2006-2015) of the Board of Trustees of the National Parks Conservation Association, and as a member of the Board of Directors for The Hillman Companies, Inc. (hardware wholesalers, 2010-2014), Earth Fare, Inc. (retail grocery, 2010-2014), and The Western Union Company (global money transfer, 2006-2011).
Ned C. Lautenbach (1944)
Year of Election or Appointment: 2000
Trustee
Chairman of the Independent Trustees
Mr. Lautenbach also serves as Trustee of other Fidelity® funds. Mr. Lautenbach currently serves as Vice Chair of the Board of Governors, State University System of Florida (2013-present) and is a member of the Council on Foreign Relations (1994-present). He is also a member and has most recently served as Chairman of the Board of Directors of Artis-Naples (2012-present). Previously, Mr. Lautenbach served as a member and then Lead Director of the Board of Directors of Eaton Corporation (diversified industrial, 1997-2016). He was also a Partner and Advisory Partner at Clayton, Dubilier & Rice, LLC (private equity investment, 1998-2010), as well as a Director of Sony Corporation (2006-2007). In addition, Mr. Lautenbach also had a 30-year career with IBM (technology company) during which time he served as Senior Vice President and a member of the Corporate Executive Committee (1968-1998).
Joseph Mauriello (1944)
Year of Election or Appointment: 2008
Trustee
Mr. Mauriello also serves as Trustee of other Fidelity® funds. Prior to his retirement in January 2006, Mr. Mauriello served in numerous senior management positions including Deputy Chairman and Chief Operating Officer (2004-2005), and Vice Chairman of Financial Services (2002-2004) of KPMG LLP US (professional services, 1965-2005). Mr. Mauriello currently serves as a member of the Independent Directors Council (IDC) Governing Council (2015-present). Previously, Mr. Mauriello served as a member of the Board of Directors of XL Group plc. (global insurance and re-insurance, 2006-2018).
Cornelia M. Small (1944)
Year of Election or Appointment: 2005
Trustee
Ms. Small also serves as Trustee of other Fidelity® funds. Ms. Small is a member of the Board of Directors (2009-present) and Chair of the Investment Committee (2010-present) of the Teagle Foundation. Ms. Small also serves on the Investment Committee of the Berkshire Taconic Community Foundation (2008-present). Previously, Ms. Small served as Chairperson (2002-2008) and a member of the Investment Committee and Chairperson (2008-2012) and a member of the Board of Trustees of Smith College. In addition, Ms. Small served as Chief Investment Officer, Director of Global Equity Investments, and a member of the Board of Directors of Scudder, Stevens & Clark and Scudder Kemper Investments.
Garnett A. Smith (1947)
Year of Election or Appointment: 2018
Trustee
Mr. Smith also serves as Trustee of other Fidelity® funds. Prior to Mr. Smith's retirement, he served as Chairman and Chief Executive Officer of Inbrand Corp. (manufacturer of personal absorbent products, 1990-1997). He also served as President (1986-1990) of Inbrand Corp. Prior to his employment with Inbrand Corp., he was employed by a retail fabric chain and North Carolina National Bank. In addition, Mr. Smith served as a Member of the Advisory Board of certain Fidelity® funds (2012-2013) and as a board member of the Jackson Hole Land Trust (2009-2012).
David M. Thomas (1949)
Year of Election or Appointment: 2008
Trustee
Mr. Thomas also serves as Trustee of other Fidelity® funds. Mr. Thomas serves as Non-Executive Chairman of the Board of Directors of Fortune Brands Home and Security (home and security products, 2011-present), as a member of the Board of Directors (2004-present) and Presiding Director (2013-present) of Interpublic Group of Companies, Inc. (marketing communication), and as a member of the Board of Trustees of the University of Florida (2013-present). Previously, Mr. Thomas served as Executive Chairman (2005-2006) and Chairman and Chief Executive Officer (2000-2005) of IMS Health, Inc. (pharmaceutical and healthcare information solutions), and a Director of Fortune Brands, Inc. (consumer products, 2000-2011).
+ The information includes the Trustee's principal occupation during the last five years and other information relating to the experience, attributes, and skills relevant to the Trustee's qualifications to serve as a Trustee, which led to the conclusion that the Trustee should serve as a Trustee for the fund.
Advisory Board Members and Officers:
Correspondence intended for a Member of the Advisory Board (if any) may be sent to Fidelity Investments, P.O. Box 55235, Boston, Massachusetts 02205-5235. Correspondence intended for an officer or Peter S. Lynch may be sent to Fidelity Investments, 245 Summer Street, Boston, Massachusetts 02210. Officers appear below in alphabetical order.
Name, Year of Birth; Principal Occupation
Vicki L. Fuller (1957)
Year of Election or Appointment: 2018
Member of the Advisory Board
Ms. Fuller also serves as Member of the Advisory Board of other Fidelity® funds. Ms. Fuller serves as a member of the Board of Directors, Audit Committee, and Nominating and Governance Committee of The Williams Companies, Inc. (natural gas infrastructure, 2018-present). Previously, Ms. Fuller served as the Chief Investment Officer of the New York State Common Retirement Fund (2012-2018) and held a variety of positions at AllianceBernstein L.P. (global asset management, 1985-2012), including Managing Director (2006-2012) and Senior Vice President and Senior Portfolio Manager (2001-2006).
Peter S. Lynch (1944)
Year of Election or Appointment: 2003
Member of the Advisory Board
Mr. Lynch also serves as Member of the Advisory Board of other Fidelity® funds. Mr. Lynch is Vice Chairman and a Director of FMR (investment adviser firm) and FMR Co., Inc. (investment adviser firm). In addition, Mr. Lynch serves as a Trustee of Boston College and as the Chairman of the Inner-City Scholarship Fund. Previously, Mr. Lynch served on the Special Olympics International Board of Directors (1997-2006).
William S. Stavropoulos (1939)
Year of Election or Appointment: 2018
Member of the Advisory Board
Mr. Stavropoulos also serves as Member of the Advisory Board of other Fidelity® funds. Mr. Stavropoulos serves as President and Founder of the Michigan Baseball Foundation, the Great Lakes Loons (2007-present). Mr. Stavropoulos is Chairman Emeritus of the Board of Directors of The Dow Chemical Company, where he previously served in numerous senior management positions, including President, CEO (1995-2000; 2002-2004), Chairman of the Executive Committee (2000-2006), and as a member of the Board of Directors (1990-2006). Currently, Mr. Stavropoulos is Chairman of the Board of Directors of Univar Inc. (global distributor of commodity and specialty chemicals), a Director of Teradata Corporation (data warehousing and technology solutions), and a member of the Advisory Board for Metalmark Capital LLC (private equity investment, 2005-present). Mr. Stavropoulos is an operating advisor to Clayton, Dubilier & Rice, LLC (private equity investment). In addition, Mr. Stavropoulos is a member of the University of Notre Dame Advisory Council for the College of Science, a Trustee of the Rollin L. Gerstacker Foundation, and a Director of Artis-Naples in Naples, Florida. Previously, Mr. Stavropoulos served as Trustee of certain Fidelity® funds (2001-2018) and as a Director of Chemical Financial Corporation (bank holding company, 1993-2012) and Tyco International, Ltd. (multinational manufacturing and services, 2007-2012).
Carol B. Tomé (1957)
Year of Election or Appointment: 2018
Member of the Advisory Board
Ms. Tomé also serves as Member of the Advisory Board of other Fidelity® funds. Ms. Tomé is Chief Financial Officer (2001-present) and Executive Vice President of Corporate Services (2007-present) of The Home Depot, Inc. (home improvement retailer) and a Director (2003-present) and Chair of the Audit Committee (2004-present) of United Parcel Service, Inc. (package delivery and supply chain management). Previously, Ms. Tomé served as Trustee of certain Fidelity® funds (2017), Senior Vice President of Finance and Accounting/Treasurer (2000-2007) and Vice President and Treasurer (1995-2000) of The Home Depot, Inc. and Chair of the Board (2010-2012), Vice Chair of the Board (2009 and 2013), and a Director (2008-2013) of the Federal Reserve Bank of Atlanta. Ms. Tomé is also a director or trustee of many community and professional organizations.
Michael E. Wiley (1950)
Year of Election or Appointment: 2018
Member of the Advisory Board
Mr. Wiley also serves as Trustee or Member of the Advisory Board of other Fidelity® funds. Mr. Wiley serves as a Director of High Point Resources (exploration and production, 2005-present). Previously, Mr. Wiley served as a Director of Andeavor Corporation (independent oil refiner and marketer, 2005-2018), a Director of Andeavor Logistics LP (natural resources logistics, 2015-2018), a Director of Post Oak Bank (privately-held bank, 2004-2018), a Director of Asia Pacific Exploration Consolidated (international oil and gas exploration and production, 2008-2013), a member of the Board of Trustees of the University of Tulsa (2000-2006; 2007-2010), a Senior Energy Advisor of Katzenbach Partners, LLC (consulting, 2006-2007), an Advisory Director of Riverstone Holdings (private investment), a Director of Spinnaker Exploration Company (exploration and production, 2001-2005) and Chairman, President, and CEO of Baker Hughes, Inc. (oilfield services, 2000-2004).
Elizabeth Paige Baumann (1968)
Year of Election or Appointment: 2017
Anti-Money Laundering (AML) Officer
Ms. Baumann also serves as AML Officer of other funds. She is Chief AML Officer (2012-present) and Senior Vice President (2014-present) of FMR LLC (diversified financial services company) and is an employee of Fidelity Investments. Previously, Ms. Baumann served as AML Officer of the funds (2012-2016), and Vice President (2007-2014) and Deputy Anti-Money Laundering Officer (2007-2012) of FMR LLC.
John J. Burke III (1964)
Year of Election or Appointment: 2018
Chief Financial Officer
Mr. Burke also serves as Chief Financial Officer of other funds. Mr. Burke serves as Head of Investment Operations for Fidelity Fund and Investment Operations (2018-present) and is an employee of Fidelity Investments (1998-present). Previously Mr. Burke served as head of Asset Management Investment Operations (2012-2018).
William C. Coffey (1969)
Year of Election or Appointment: 2018
Secretary and Chief Legal Officer (CLO)
Mr. Coffey also serves as Secretary and CLO of other funds. Mr. Coffey serves as CLO, Secretary, and Senior Vice President of Fidelity Management & Research Company and FMR Co., Inc. (investment adviser firms, 2018-present); Secretary of Fidelity SelectCo, LLC and Fidelity Investments Money Management, Inc. (investment adviser firms, 2018-present); and CLO of Fidelity Management & Research (Hong Kong) Limited, FMR Investment Management (UK) Limited, and Fidelity Management & Research (Japan) Limited (investment adviser firms, 2018-present). He is Senior Vice President and Deputy General Counsel of FMR LLC (diversified financial services company, 2010-present), and is an employee of Fidelity Investments. Previously, Mr. Coffey served as Assistant Secretary of certain funds (2009-2018) and as Vice President and Associate General Counsel of FMR LLC (2005-2009).
Timothy M. Cohen (1969)
Year of Election or Appointment: 2018
Vice President
Mr. Cohen also serves as Vice President of other funds. Mr. Cohen serves as Co-Head of Global Equity Research (2016-present), a Director of Fidelity Management & Research (Japan) Limited (investment adviser firm, 2016-present), and is an employee of Fidelity Investments. Previously, Mr. Cohen served as Chief Investment Officer - Equity and a Director of Fidelity Management & Research (U.K.) Inc. (investment adviser firm, 2013-2015) and as a Director of Fidelity Management & Research (Hong Kong) Limited (investment adviser firm, 2017).
Jonathan Davis (1968)
Year of Election or Appointment: 2010
Assistant Treasurer
Mr. Davis also serves as Assistant Treasurer of other funds. Mr. Davis serves as Assistant Treasurer of FMR Capital, Inc. (2017-present) and is an employee of Fidelity Investments. Previously, Mr. Davis served as Vice President and Associate General Counsel of FMR LLC (diversified financial services company, 2003-2010).
Adrien E. Deberghes (1967)
Year of Election or Appointment: 2016
Assistant Treasurer
Mr. Deberghes also serves as an officer of other funds. He serves as Assistant Treasurer of FMR Capital, Inc. (2017-present), Executive Vice President of Fidelity Investments Money Management, Inc. (FIMM) (investment adviser firm, 2016-present), and is an employee of Fidelity Investments (2008-present). Previously, Mr. Deberghes served as President and Treasurer of certain Fidelity® funds (2013-2018). Prior to joining Fidelity Investments, Mr. Deberghes was Senior Vice President of Mutual Fund Administration at State Street Corporation (2007-2008), Senior Director of Mutual Fund Administration at Investors Bank & Trust (2005-2007), and Director of Finance for Dunkin' Brands (2000-2005). Previously, Mr. Deberghes served in other fund officer roles.
Laura M. Del Prato (1964)
Year of Election or Appointment: 2018
Assistant Treasurer
Ms. Del Prato also serves as an officer of other funds. Ms. Del Prato is an employee of Fidelity Investments (2017-present). Prior to joining Fidelity Investments, Ms. Del Prato served as a Managing Director and Treasurer of the JPMorgan Mutual Funds (2014-2017). Prior to JPMorgan, Ms. Del Prato served as a partner at Cohen Fund Audit Services (accounting firm, 2012-2013) and KPMG LLP (accounting firm, 2004-2012).
Colm A. Hogan (1973)
Year of Election or Appointment: 2016
Deputy Treasurer
Mr. Hogan also serves as an officer of other funds. Mr. Hogan serves as Assistant Treasurer of FMR Capital, Inc. (2017-present) and is an employee of Fidelity Investments (2005-present). Previously, Mr. Hogan served as Assistant Treasurer of certain Fidelity® funds (2016-2018).
Pamela R. Holding (1964)
Year of Election or Appointment: 2018
Vice President
Ms. Holding also serves as Vice President of other funds. Ms. Holding serves as Co-Head of Global Equity Research (2018-present) and is an employee of Fidelity Investments (2013-present).
Chris Maher (1972)
Year of Election or Appointment: 2013
Assistant Treasurer
Mr. Maher serves as Assistant Treasurer of other funds. Mr. Maher is Vice President of Valuation Oversight, serves as Assistant Treasurer of FMR Capital, Inc. (2017-present), and is an employee of Fidelity Investments. Previously, Mr. Maher served as Vice President of Asset Management Compliance (2013), Vice President of the Program Management Group of FMR (investment adviser firm, 2010-2013), and Vice President of Valuation Oversight (2008-2010).
Rieco E. Mello (1969)
Year of Election or Appointment: 2017
Assistant Treasurer
Mr. Mello also serves as Assistant Treasurer of other funds. Mr. Mello serves as Assistant Treasurer of FMR Capital, Inc. (2017-present) and is an employee of Fidelity Investments (1995-present).
Kenneth B. Robins (1969)
Year of Election or Appointment: 2016
Chief Compliance Officer
Mr. Robins also serves as an officer of other funds. Mr. Robins serves as Compliance Officer of Fidelity Management & Research Company and FMR Co., Inc. (investment adviser firms, 2016-present) and is an employee of Fidelity Investments (2004-present). Previously, Mr. Robins served as Executive Vice President of Fidelity Investments Money Management, Inc. (investment adviser firm, 2013-2016) and served in other fund officer roles.
Stacie M. Smith (1974)
Year of Election or Appointment: 2016
President and Treasurer
Ms. Smith also serves as an officer of other funds. Ms. Smith serves as Assistant Treasurer of FMR Capital, Inc. (2017-present), is an employee of Fidelity Investments (2009-present), and has served in other fund officer roles. Prior to joining Fidelity Investments, Ms. Smith served as Senior Audit Manager of Ernst & Young LLP (accounting firm, 1996-2009). Previously, Ms. Smith served as Assistant Treasurer (2013-2018) and Deputy Treasurer (2013-2016) of certain Fidelity® funds.
Marc L. Spector (1972)
Year of Election or Appointment: 2016
Assistant Treasurer
Mr. Spector also serves as an officer of other funds. Mr. Spector serves as Assistant Treasurer of FMR Capital, Inc. (2017-present) and is an employee of Fidelity Investments (2016-present). Prior to joining Fidelity Investments, Mr. Spector served as Director at the Siegfried Group (accounting firm, 2013-2016), and prior to Siegfried Group as audit senior manager at Deloitte & Touche (accounting firm, 2005-2013).
Shareholder Expense Example
As a shareholder of a Fund, you incur two types of costs: (1) transaction costs, including sales charges (loads) on purchase payments or redemption proceeds, and (2) ongoing costs, including distribution and/or service (12b-1) fees and other Fund expenses. This Example is intended to help you understand your ongoing costs (in dollars) of investing in the Funds and to compare these costs with the ongoing costs of investing in other mutual funds.
The Example is based on an investment of $1,000 invested at the beginning of the period and held for the entire period (May 1, 2018 to October 31, 2018).
Actual Expenses
The first line of the accompanying table for each class of the Fund provides information about actual account values and actual expenses. You may use the information in this line, together with the amount you invested, to estimate the expenses that you paid over the period. Simply divide your account value by $1,000.00 (for example, an $8,600 account value divided by $1,000.00 = 8.6), then multiply the result by the number in the first line for a class of the Fund under the heading entitled "Expenses Paid During Period" to estimate the expenses you paid on your account during this period. A small balance maintenance fee of $12.00 that is charged once a year may apply for certain accounts with a value of less than $2,000. This fee, which was eliminated effective August 1, 2018, is not included in the table below. If it was, the estimate of expenses you paid during the period would be higher, and your ending account value lower, by this amount. In addition, the Fund, as a shareholder in the underlying Fidelity Central Funds, will indirectly bear its pro-rata share of the fees and expenses incurred by the underlying Fidelity Central Funds. These fees and expenses are not included in the Fund's annualized expense ratio used to calculate the expense estimate in the table below.
Hypothetical Example for Comparison Purposes
The second line of the accompanying table for each class of the Fund provides information about hypothetical account values and hypothetical expenses based on a Class' actual expense ratio and an assumed rate of return of 5% per year before expenses, which is not the Class' actual return. The hypothetical account values and expenses may not be used to estimate the actual ending account balance or expenses you paid for the period. You may use this information to compare the ongoing costs of investing in the Fund and other funds. To do so, compare this 5% hypothetical example with the 5% hypothetical examples that appear in the shareholder reports of the other funds. A small balance maintenance fee of $12.00 that is charged once a year may apply for certain accounts with a value of less than $2,000. This fee, which was eliminated effective August 1, 2018, is not included in the table below. If it was, the estimate of expenses you paid during the period would be higher, and your ending account value lower, by this amount. In addition, the Fund, as a shareholder in the underlying Fidelity Central Funds, will indirectly bear its pro-rata share of the fees and expenses incurred by the underlying Fidelity Central Funds. These fees and expenses are not included in the Fund's annualized expense ratio used to calculate the expense estimate in the table below.
Please note that the expenses shown in the table are meant to highlight your ongoing costs only and do not reflect any transaction costs. Therefore, the second line of the table is useful in comparing ongoing costs only, and will not help you determine the relative total costs of owning different funds. In addition, if these transactional costs were included, your costs would have been higher.
| | Annualized Expense Ratio-A | Beginning
Account Value
May 1, 2018 | Ending
Account Value
October 31, 2018 | Expenses Paid
During Period-B
May 1, 2018
to October 31, 2018 |
| Class A | 1.16% | | | |
| Actual | | $1,000.00 | $886.50 | $5.52 |
| Hypothetical-C | | $1,000.00 | $1,019.36 | $5.90 |
| Class M | 1.41% | | | |
| Actual | | $1,000.00 | $885.40 | $6.70 |
| Hypothetical-C | | $1,000.00 | $1,018.10 | $7.17 |
| Class C | 1.95% | | | |
| Actual | | $1,000.00 | $883.20 | $9.26 |
| Hypothetical-C | | $1,000.00 | $1,015.38 | $9.91 |
| International Discovery | .83% | | | |
| Actual | | $1,000.00 | $888.10 | $3.95 |
| Hypothetical-C | | $1,000.00 | $1,021.02 | $4.23 |
| Class K | .72% | | | |
| Actual | | $1,000.00 | $888.70 | $3.43 |
| Hypothetical-C | | $1,000.00 | $1,021.58 | $3.67 |
| Class I | .86% | | | |
| Actual | | $1,000.00 | $888.10 | $4.09 |
| Hypothetical-C | | $1,000.00 | $1,020.87 | $4.38 |
| Class Z | .73% | | | |
| Actual | | $1,000.00 | $888.60 | $3.48 |
| Hypothetical-C | | $1,000.00 | $1,021.53 | $3.72 |
A Annualized expense ratio reflects expenses net of applicable fee waivers.
B Expenses are equal to each Class' annualized expense ratio, multiplied by the average account value over the period, multiplied by 184/365 (to reflect the one-half year period).
C 5% return per year before expenses
Distributions (Unaudited)
The Board of Trustees of Fidelity International Discovery fund voted to pay to shareholders of record at the opening of business on record date, the following distributions per share derived from capital gains realized from sales of portfolio securities, and dividends derived from net investment income:
| | Pay Date | Record Date | Dividends | Capital Gains |
| Fidelity International Discovery Fund | | | | |
| Class A | 12/10/18 | 12/07/18 | $0.327 | $0.913 |
| Class M | 12/10/18 | 12/07/18 | $0.222 | $0.913 |
| Class C | 12/10/18 | 12/07/18 | $0.000 | $0.913 |
| International Discovery | 12/10/18 | 12/07/18 | $0.491 | $0.913 |
| Class K | 12/10/18 | 12/07/18 | $0.541 | $0.913 |
| Class I | 12/10/18 | 12/07/18 | $0.481 | $0.913 |
| Class Z | 12/10/18 | 12/07/18 | $0.542 | $0.913 |
|
The fund hereby designates as a capital gain dividend with respect to the taxable year ended October 31, 2017, $245,764,979, or, if subsequently determined to be different, the net capital gain of such year.
Class A designates 2%; Class M designates 3%; Class C designates 9%; International Discovery designates 2%; Class K designates 1%; Class I designates 2% and Class Z designates 1% of the dividends distributed during the fiscal year as qualifying for the dividends–received deduction for corporate shareholders.
Class A, Class M, Class C, International Discovery, Class K, Class I and Class Z designate 100% of the dividends distributed during the fiscal year as amounts which may be taken into account as a dividend for purposes of the maximum rate under section 1(h)(11) of the Internal Revenue Code.
The amounts per share which represent income derived from sources within, and taxes paid to, foreign countries or possessions of the United States are as follows:
| | Pay Date | Income | Taxes |
| Fidelity International Discovery Fund | | | |
| Class A | 12/11/17 | $0.4263 | $0.0563 |
| Class M | 12/11/17 | $0.3263 | $0.0563 |
| Class C | 12/11/17 | $0.1083 | $0.0563 |
| International Discovery | 12/11/17 | $0.5883 | $0.0563 |
| Class K | 12/11/17 | $0.6403 | $0.0563 |
| Class I | 12/11/17 | $0.5763 | $0.0563 |
| Class Z | 12/11/17 | $0.6413 | $0.0563 |
|
The fund will notify shareholders in January 2019 of amounts for use in preparing 2018 income tax returns.
Board Approval of Investment Advisory Contracts
Fidelity International Discovery Fund
At its July 2018 meeting, the Board of Trustees, including the Independent Trustees (together, the Board), voted to continue the management contract with Fidelity Management & Research Company (FMR) and the sub-advisory agreements (together, the Advisory Contracts) for the fund for six months through January 31, 2019, in connection with the reunification of the Fidelity Equity High Income Funds Board, which oversees the fund, and the Sector Portfolios Board.
The Board considered that the approval of the fund's Advisory Contracts will not result in any changes in (i) the investment process or strategies employed in the management of the fund's assets; (ii) the fees and expenses paid by shareholders; (iii) the nature, extent or quality of services provided under the fund's Advisory Contracts; or (iv) the day-to-day management of the fund or the persons primarily responsible for such management. The Board concluded that the fund's Advisory Contracts are fair and reasonable, and that the fund's Advisory Contracts should be renewed, without modification, through January 31, 2019, with the understanding that the Board will consider the annual renewal for a full one year period in January 2019.
In connection with its consideration of future renewals of the fund's Advisory Contracts, the Board will consider: (i) the nature, extent and quality of services provided to the fund, including shareholder and administrative services and investment performance; (ii) the competitiveness of the management fee and total expenses for the fund; (iii) the costs of the services and profitability, including the revenues earned and the expenses incurred in conducting the business of developing, marketing, distributing, managing, administering, and servicing the fund and its shareholders, to the extent applicable, as well as potential fall-out benefits from Fidelity's non-fund businesses; and (iv) whether there have been economies of scale in respect of the Fidelity funds, whether the Fidelity funds (including the fund) have appropriately benefited from any such economies of scale, and whether there is the potential for realization of any further economies.
Based on its evaluation of all of the conclusions noted above, and after considering all factors it believed relevant, the Board ultimately concluded that the fund's management fee structure is fair and reasonable, and that the continuation of the fund's Advisory Contracts should be approved.
Corporate Headquarters
245 Summer St.
Boston, MA 02210
www.fidelity.com
IGI-ANN-1218
1.807258.114
Fidelity® International Discovery Fund Class K
Annual Report October 31, 2018 |
|
Contents
To view a fund's proxy voting guidelines and proxy voting record for the 12-month period ended June 30, visit http://www.fidelity.com/proxyvotingresults or visit the Securities and Exchange Commission's (SEC) web site at http://www.sec.gov.
You may also call 1-800-835-5092 to request a free copy of the proxy voting guidelines.
Standard & Poor's, S&P and S&P 500 are registered service marks of The McGraw-Hill Companies, Inc. and have been licensed for use by Fidelity Distributors Corporation.
Other third-party marks appearing herein are the property of their respective owners.
All other marks appearing herein are registered or unregistered trademarks or service marks of FMR LLC or an affiliated company. © 2018 FMR LLC. All rights reserved.
This report and the financial statements contained herein are submitted for the general information of the shareholders of the Fund. This report is not authorized for distribution to prospective investors in the Fund unless preceded or accompanied by an effective prospectus.
A fund files its complete schedule of portfolio holdings with the SEC for the first and third quarters of each fiscal year on Form N-Q. Forms N-Q are available on the SEC’s web site at http://www.sec.gov. A fund's Forms N-Q may be reviewed and copied at the SEC’s Public Reference Room in Washington, DC. Information regarding the operation of the SEC's Public Reference Room may be obtained by calling 1-800-SEC-0330.
For a complete list of a fund's portfolio holdings, view the most recent holdings listing, semiannual report, or annual report on Fidelity's web site at http://www.fidelity.com, http://www.institutional.fidelity.com, or http://www.401k.com, as applicable.
NOT FDIC INSURED •MAY LOSE VALUE •NO BANK GUARANTEE
Neither the Fund nor Fidelity Distributors Corporation is a bank.
Performance: The Bottom Line
Average annual total return reflects the change in the value of an investment, assuming reinvestment of distributions from dividend income and capital gains (the profits earned upon the sale of securities that have grown in value, if any) and assuming a constant rate of performance each year. The hypothetical investment and the average annual total returns do not reflect the deduction of taxes that a shareholder would pay on fund distributions or the redemption of fund shares. During periods of reimbursement by Fidelity, a fund’s total return will be greater than it would be had the reimbursement not occurred. How a fund did yesterday is no guarantee of how it will do tomorrow.
Average Annual Total Returns
| For the periods ended October 31, 2018 | Past 1 year | Past 5 years | Past 10 years |
| Class K | (9.70)% | 2.53% | 7.53% |
$10,000 Over 10 Years
Let's say hypothetically that $10,000 was invested in Fidelity® International Discovery Fund - Class K on October 31, 2008.
The chart shows how the value of your investment would have changed, and also shows how the MSCI EAFE Index performed over the same period.
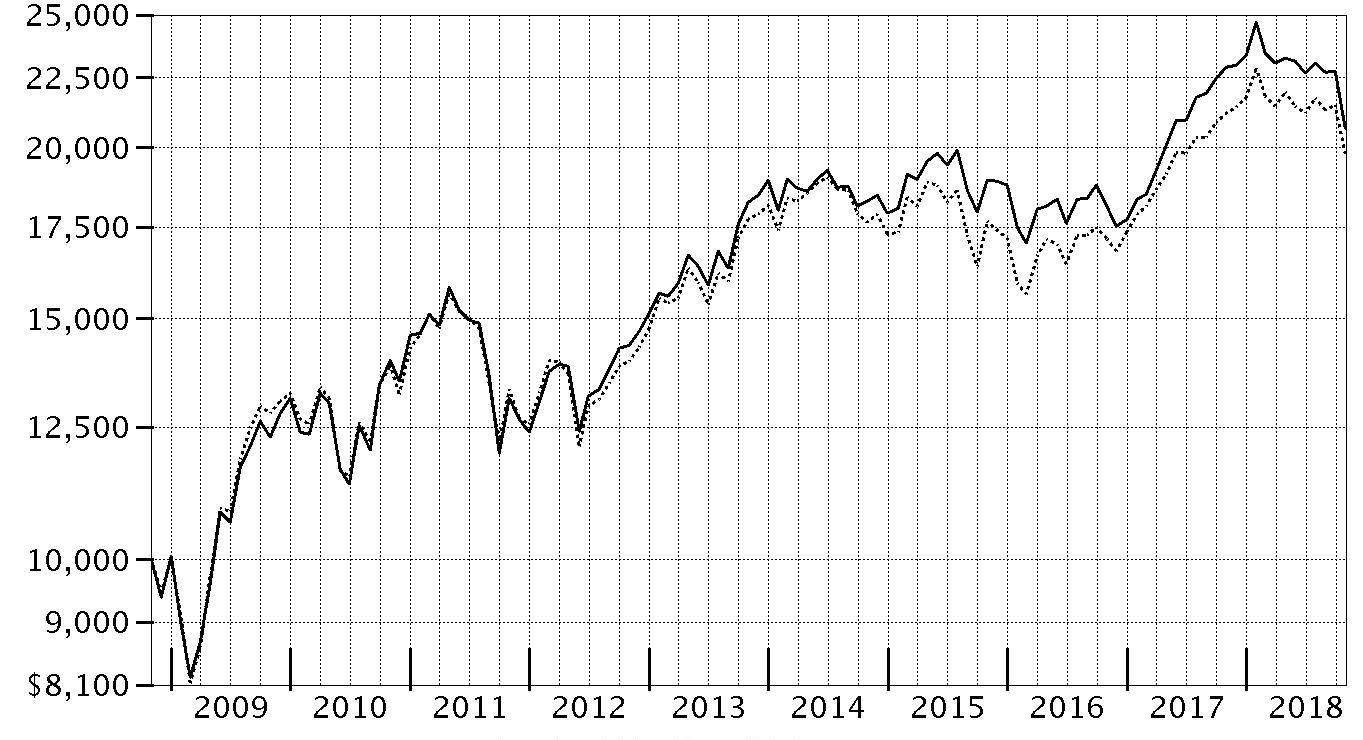
| Period Ending Values |
| $20,661 | Fidelity® International Discovery Fund - Class K |
| $19,780 | MSCI EAFE Index |
Management's Discussion of Fund Performance
Market Recap: International equities returned -8.08% for the 12 months ending October 31, 2018, according to the MSCI ACWI (All Country World Index) ex USA Index. A modestly positive first half of the period gave way to a confluence of overwhelmingly negative factors – including escalating trade tensions, a surging U.S. dollar, tepid economic growth in Europe, global central bank tightening, concerns about Italy’s budget stalemate with the EU, and weakness in China’s stock market – that yielded a -11% second-half return. The index lost 8% in October alone, its largest monthly drop in more than six years. Among sectors, new-media-infused communications services (-15%) was hit the hardest, while economically sensitive consumer discretionary (-13%), information technology (-12%), financials (-10%), industrials (-9%) and materials (-7%) stocks also fared poorly. Even the more defensive real estate (-9%), utilities (-6%) and consumer staples (-5%) sectors weren’t spared this period. Conversely, elevated crude-oil prices fueled a positive return for energy (+7%), the top-performing sector, followed by the relatively stable-growing health care segment (+2%). Regionally, emerging markets (-12%) fared the worst, hampered by the impact of foreign exchange and concerns about economic weakness in China, India and South Korea. Sluggish growth also pressured shares in continental Europe (-9%). Stocks in Japan (-3%) and the U.K. (-4%) held up better, followed by Canada (-5%) and Asia-Pacific ex Japan (-6%).
Comments from Portfolio Manager William Kennedy: For the fiscal year, the fund’s share classes (excluding sales charges, if applicable) returned roughly -10% to -11%, lagging the -6.65% return of the MSCI EAFE Index. Security selection, notably in the consumer staples and industrials sectors, detracted from relative performance. Geographically, positioning in emerging markets and stock picks in the U.K. and Japan caused the fund to lag the index. Individual disappointments included software company Micro Focus International and food and alcoholic drinks distributor Conviviality, both based in the U.K. Micro Focus’s shares returned -53% for the period because synergies from a recent acquisition have not materialized as fast as investors expected. Conviviality, a non-benchmark position, faced financial distress and went into bankruptcy. In Japan, an average overweighting in semiconductor manufacturer Renesas Electronics hurt, as excess industry capacity and weakening demand from end markets pressured the stock. We no longer owned Renesas at period end. Conversely, security selection in Europe Ex U.K., the U.S. and materials aided relative performance. Individual contributors included Norway-based exploration and production company Equinor (formerly Statoil), a top holding that gained from higher oil prices.
The views expressed above reflect those of the portfolio manager(s) only through the end of the period as stated on the cover of this report and do not necessarily represent the views of Fidelity or any other person in the Fidelity organization. Any such views are subject to change at any time based upon market or other conditions and Fidelity disclaims any responsibility to update such views. These views may not be relied on as investment advice and, because investment decisions for a Fidelity fund are based on numerous factors, may not be relied on as an indication of trading intent on behalf of any Fidelity fund.
Investment Summary (Unaudited)
Geographic Diversification (% of fund's net assets)
| As of October 31, 2018 |
| | Japan | 17.6% |
| | United Kingdom | 10.7% |
| | Germany | 10.2% |
| | United States of America* | 10.1% |
| | France | 8.7% |
| | Switzerland | 8.5% |
| | Netherlands | 5.2% |
| | Spain | 4.0% |
| | India | 3.1% |
| | Other | 21.9% |

* Includes Short-Term investments and Net Other Assets (Liabilities).
Percentages are based on country or territory of incorporation and are adjusted for the effect of futures contracts, if applicable.
Asset Allocation as of October 31, 2018
| | % of fund's net assets |
| Stocks and Equity Futures | 90.7 |
| Short-Term Investments and Net Other Assets (Liabilities) | 9.3 |
Top Ten Stocks as of October 31, 2018
| | % of fund's net assets |
| Total SA (France, Oil, Gas & Consumable Fuels) | 2.9 |
| Equinor ASA (Norway, Oil, Gas & Consumable Fuels) | 2.6 |
| Nestle SA (Reg. S) (Switzerland, Food Products) | 2.5 |
| Roche Holding AG (participation certificate) (Switzerland, Pharmaceuticals) | 2.1 |
| AstraZeneca PLC (United Kingdom) (United Kingdom, Pharmaceuticals) | 1.9 |
| SAP SE (Germany, Software) | 1.8 |
| ORIX Corp. (Japan, Diversified Financial Services) | 1.5 |
| Unilever NV (Certificaten Van Aandelen) (Bearer) (Netherlands, Personal Products) | 1.4 |
| Sony Corp. (Japan, Household Durables) | 1.4 |
| HDFC Bank Ltd. (India, Banks) | 1.4 |
| | 19.5 |
Top Market Sectors as of October 31, 2018
| | % of fund's net assets |
| Financials | 18.8 |
| Health Care | 13.3 |
| Industrials | 12.4 |
| Information Technology | 9.7 |
| Consumer Discretionary | 9.5 |
| Consumer Staples | 8.8 |
| Energy | 6.6 |
| Materials | 3.9 |
| Real Estate | 2.7 |
| Communication Services | 1.4 |
Schedule of Investments October 31, 2018
Showing Percentage of Net Assets
| Common Stocks - 87.1% | | | |
| | | Shares | Value (000s) |
| Australia - 1.2% | | | |
| Bapcor Ltd. | | 8,839,382 | $42,753 |
| Blue Sky Alternative Investments Ltd. (a) | | 3,155,936 | 2,704 |
| Inghams Group Ltd. (b) | | 7,274,630 | 20,091 |
| Magellan Financial Group Ltd. | | 1,192,618 | 22,499 |
| National Storage (REIT) unit | | 20,935,348 | 25,277 |
| Rio Tinto Ltd. | | 4,010 | 217 |
|
| TOTAL AUSTRALIA | | | 113,541 |
|
| Austria - 1.4% | | | |
| Erste Group Bank AG | | 1,778,600 | 72,523 |
| Wienerberger AG | | 2,708,000 | 62,326 |
|
| TOTAL AUSTRIA | | | 134,849 |
|
| Bailiwick of Jersey - 0.3% | | | |
| Glencore Xstrata PLC | | 6,935,113 | 28,264 |
| Belgium - 1.0% | | | |
| KBC Groep NV | | 1,403,659 | 96,822 |
| Bermuda - 0.6% | | | |
| Hiscox Ltd. | | 2,788,120 | 58,018 |
| Canada - 2.1% | | | |
| Alimentation Couche-Tard, Inc. Class B (sub. vtg.) | | 1,074,800 | 51,329 |
| Cenovus Energy, Inc. (Canada) | | 3,258,400 | 27,573 |
| Constellation Software, Inc. | | 74,900 | 51,548 |
| Suncor Energy, Inc. | | 2,122,800 | 71,209 |
|
| TOTAL CANADA | | | 201,659 |
|
| Cayman Islands - 1.1% | | | |
| Alibaba Group Holding Ltd. sponsored ADR (a) | | 284,700 | 40,507 |
| ENN Energy Holdings Ltd. | | 3,407,500 | 28,961 |
| Meituan Dianping Class B | | 5,958,244 | 34,669 |
|
| TOTAL CAYMAN ISLANDS | | | 104,137 |
|
| China - 0.3% | | | |
| Qingdao Port International Co. Ltd. (a)(c) | | 11,047,000 | 6,480 |
| Shanghai International Airport Co. Ltd. (A Shares) | | 2,634,600 | 18,714 |
|
| TOTAL CHINA | | | 25,194 |
|
| Denmark - 1.0% | | | |
| Netcompany Group A/S | | 916,278 | 30,304 |
| Novo Nordisk A/S Series B | | 953,445 | 41,176 |
| Novozymes A/S Series B | | 389,400 | 19,243 |
|
| TOTAL DENMARK | | | 90,723 |
|
| Finland - 0.4% | | | |
| Sampo Oyj (A Shares) | | 917,500 | 42,254 |
| France - 8.7% | | | |
| ALTEN | | 343,360 | 33,115 |
| Capgemini SA | | 751,250 | 91,898 |
| Cegedim SA (a) | | 577,424 | 14,454 |
| Elis SA | | 1,912,711 | 38,627 |
| LVMH Moet Hennessy - Louis Vuitton SA | | 246,433 | 74,769 |
| Sartorius Stedim Biotech | | 312,490 | 38,792 |
| SMCP S.A.S. (c) | | 1,005,880 | 23,812 |
| Societe Generale Series A | | 1,519,483 | 55,701 |
| Thales SA | | 447,762 | 57,309 |
| Total SA | | 4,726,358 | 277,323 |
| VINCI SA (b) | | 1,340,505 | 119,304 |
|
| TOTAL FRANCE | | | 825,104 |
|
| Germany - 10.2% | | | |
| adidas AG | | 458,206 | 107,949 |
| Akasol AG | | 280,077 | 12,927 |
| Allianz SE | | 392,900 | 81,849 |
| Aumann AG (c) | | 118,851 | 5,869 |
| Deutsche Borse AG | | 162,981 | 20,596 |
| Deutsche Post AG | | 2,286,440 | 72,195 |
| Fresenius SE & Co. KGaA | | 1,181,000 | 75,059 |
| Instone Real Estate Group BV (c) | | 1,005,000 | 23,574 |
| JOST Werke AG (c) | | 218,300 | 7,616 |
| Linde PLC | | 600,446 | 98,512 |
| MTU Aero Engines Holdings AG | | 390,800 | 83,128 |
| Muenchener Rueckversicherungs AG | | 212,900 | 45,805 |
| Nexus AG | | 598,705 | 16,343 |
| Rational AG | | 36,405 | 21,112 |
| Rheinmetall AG | | 300,500 | 26,051 |
| SAP SE | | 1,631,171 | 174,655 |
| Vonovia SE | | 959,200 | 43,914 |
| Wirecard AG | | 274,800 | 51,481 |
|
| TOTAL GERMANY | | | 968,635 |
|
| Hong Kong - 1.8% | | | |
| AIA Group Ltd. | | 16,381,000 | 123,976 |
| Techtronic Industries Co. Ltd. | | 10,497,500 | 49,128 |
|
| TOTAL HONG KONG | | | 173,104 |
|
| India - 3.1% | | | |
| Avenue Supermarts Ltd. (a)(c) | | 595,148 | 10,766 |
| HDFC Bank Ltd. | | 1,783,391 | 46,297 |
| HDFC Bank Ltd. sponsored ADR | | 955,784 | 84,979 |
| Housing Development Finance Corp. Ltd. | | 4,738,215 | 113,346 |
| Sunteck Realty Ltd. (a) | | 3,638,783 | 15,948 |
| TCNS Clothing Co. Ltd. (a) | | 2,290,991 | 19,143 |
|
| TOTAL INDIA | | | 290,479 |
|
| Ireland - 3.0% | | | |
| Cairn Homes PLC (a) | | 24,761,863 | 39,770 |
| CRH PLC | | 1,072,547 | 31,992 |
| Dalata Hotel Group PLC | | 6,380,738 | 39,532 |
| DCC PLC (United Kingdom) | | 234,900 | 20,162 |
| Glenveagh Properties PLC (c) | | 18,258,476 | 17,289 |
| Green REIT PLC | | 9,492,200 | 15,675 |
| Kerry Group PLC Class A | | 575,200 | 58,961 |
| Ryanair Holdings PLC sponsored ADR (a) | | 340,266 | 28,174 |
| United Drug PLC (United Kingdom) | | 3,890,900 | 31,432 |
|
| TOTAL IRELAND | | | 282,987 |
|
| Italy - 0.7% | | | |
| Prada SpA | | 4,817,375 | 17,016 |
| Recordati SpA | | 1,498,900 | 50,796 |
|
| TOTAL ITALY | | | 67,812 |
|
| Japan - 14.0% | | | |
| AEON Financial Service Co. Ltd. | | 1,567,500 | 30,785 |
| Hoya Corp. | | 1,803,500 | 102,518 |
| Keyence Corp. | | 161,620 | 79,209 |
| Mercari, Inc. (a)(b) | | 186,200 | 4,713 |
| Minebea Mitsumi, Inc. | | 3,146,200 | 48,131 |
| Misumi Group, Inc. | | 1,127,900 | 22,651 |
| Mitsubishi UFJ Financial Group, Inc. | | 13,512,400 | 81,784 |
| Monex Group, Inc. (b) | | 3,474,649 | 13,703 |
| Morinaga & Co. Ltd. | | 572,700 | 23,018 |
| Murata Manufacturing Co. Ltd. | | 203,800 | 31,003 |
| Nidec Corp. | | 355,700 | 45,678 |
| Nitori Holdings Co. Ltd. | | 503,400 | 65,738 |
| ORIX Corp. | | 8,623,800 | 140,705 |
| Panasonic Corp. | | 6,347,500 | 68,118 |
| Recruit Holdings Co. Ltd. | | 942,500 | 25,296 |
| Relo Group, Inc. | | 2,647,500 | 62,554 |
| Shiseido Co. Ltd. | | 236,100 | 14,897 |
| SMC Corp. | | 232,200 | 74,392 |
| SoftBank Corp. | | 837,600 | 66,287 |
| Sony Corp. | | 2,455,200 | 132,867 |
| Takeda Pharmaceutical Co. Ltd. | | 1,170,300 | 48,520 |
| Tsuruha Holdings, Inc. | | 481,100 | 50,142 |
| VT Holdings Co. Ltd. | | 496,700 | 2,069 |
| Welcia Holdings Co. Ltd. | | 1,710,100 | 87,297 |
| Zozo, Inc. | | 494,200 | 11,909 |
|
| TOTAL JAPAN | | | 1,333,984 |
|
| Korea (South) - 0.5% | | | |
| Cafe24 Corp. (a) | | 223,645 | 21,659 |
| Hyundai Fire & Marine Insurance Co. Ltd. | | 331,774 | 12,154 |
| KB Financial Group, Inc. | | 437,375 | 18,191 |
|
| TOTAL KOREA (SOUTH) | | | 52,004 |
|
| Netherlands - 5.2% | | | |
| Adyen BV (c) | | 113,603 | 73,485 |
| ASML Holding NV (Netherlands) | | 579,200 | 99,764 |
| Basic-Fit NV (a)(c) | | 573,600 | 16,535 |
| IMCD Group BV | | 777,945 | 52,824 |
| Koninklijke Philips Electronics NV | | 2,812,269 | 104,886 |
| Unilever NV (Certificaten Van Aandelen) (Bearer) | | 2,572,632 | 138,240 |
| Van Lanschot NV (Bearer) | | 221,500 | 5,432 |
|
| TOTAL NETHERLANDS | | | 491,166 |
|
| New Zealand - 1.3% | | | |
| EBOS Group Ltd. | | 3,124,713 | 42,493 |
| Fisher & Paykel Healthcare Corp. | | 3,760,394 | 33,372 |
| Ryman Healthcare Group Ltd. | | 6,308,132 | 49,808 |
|
| TOTAL NEW ZEALAND | | | 125,673 |
|
| Norway - 2.6% | | | |
| Equinor ASA | | 9,619,813 | 250,258 |
| Spain - 4.0% | | | |
| Aedas Homes SAU (c) | | 402,926 | 10,424 |
| Amadeus IT Holding SA Class A | | 810,800 | 65,368 |
| CaixaBank SA (b) | | 32,146,733 | 130,089 |
| Grifols SA ADR | | 2,966,058 | 60,567 |
| Masmovil Ibercom SA (a) | | 536,548 | 69,645 |
| Neinor Homes SLU (a)(c) | | 732,900 | 11,788 |
| Prosegur Cash SA (c) | | 4,229,512 | 8,383 |
| Zardoya Otis SA | | 3,001,173 | 20,566 |
|
| TOTAL SPAIN | | | 376,830 |
|
| Sweden - 2.6% | | | |
| ASSA ABLOY AB (B Shares) | | 3,408,900 | 67,806 |
| HEXPOL AB (B Shares) | | 1,854,700 | 17,166 |
| Indutrade AB | | 2,158,900 | 51,807 |
| Saab AB (B Shares) | | 783,100 | 30,687 |
| Svenska Cellulosa AB (SCA) (B Shares) | | 4,064,100 | 38,469 |
| Telefonaktiebolaget LM Ericsson (B Shares) | | 4,514,200 | 39,304 |
|
| TOTAL SWEDEN | | | 245,239 |
|
| Switzerland - 8.5% | | | |
| Credit Suisse Group AG | | 2,446,505 | 31,985 |
| Forbo Holding AG (Reg.) | | 19,930 | 29,267 |
| Julius Baer Group Ltd. | | 857,090 | 39,087 |
| Kaba Holding AG (B Shares) (Reg.) | | 41,000 | 29,595 |
| Lonza Group AG | | 259,158 | 81,493 |
| Nestle SA (Reg. S) | | 2,839,470 | 239,717 |
| Partners Group Holding AG | | 106,960 | 76,199 |
| Roche Holding AG (participation certificate) | | 801,468 | 195,047 |
| Schindler Holding AG (participation certificate) | | 168,047 | 35,440 |
| UBS Group AG | | 3,674,380 | 51,404 |
|
| TOTAL SWITZERLAND | | | 809,234 |
|
| United Kingdom - 10.7% | | | |
| Anglo American PLC (United Kingdom) | | 1,430,245 | 30,625 |
| AstraZeneca PLC (United Kingdom) | | 2,369,091 | 181,211 |
| Beazley PLC | | 4,167,000 | 28,096 |
| BHP Billiton PLC | | 3,499,778 | 69,816 |
| Big Yellow Group PLC | | 2,523,600 | 27,821 |
| British American Tobacco PLC: | | | |
| (United Kingdom) | | 1,513,778 | 65,623 |
| sponsored ADR | | 419,000 | 18,185 |
| Bunzl PLC | | 2,743,559 | 81,043 |
| Compass Group PLC | | 2,420,296 | 47,642 |
| Conviviality PLC (d) | | 5,464,968 | 0 |
| Cranswick PLC | | 1,414,158 | 52,239 |
| Dechra Pharmaceuticals PLC | | 1,370,476 | 40,045 |
| JTC PLC | | 3,846,100 | 16,469 |
| Keywords Studios PLC | | 627,800 | 10,994 |
| LivaNova PLC (a) | | 363,102 | 40,664 |
| London Stock Exchange Group PLC | | 1,209,936 | 66,733 |
| Melrose Industries PLC | | 11,062,816 | 23,848 |
| Micro Focus International PLC | | 3,041,005 | 47,142 |
| Moneysupermarket.com Group PLC | | 835 | 3 |
| NCC Group Ltd. | | 9,063,500 | 22,776 |
| Reckitt Benckiser Group PLC | | 449,822 | 36,374 |
| Rio Tinto PLC | | 936,125 | 45,450 |
| Senior Engineering Group PLC | | 7,063,700 | 24,649 |
| St. James's Place Capital PLC | | 2,486,954 | 32,217 |
| Standard Chartered PLC (United Kingdom) | | 63,290 | 445 |
| The Weir Group PLC | | 585,500 | 11,869 |
|
| TOTAL UNITED KINGDOM | | | 1,021,979 |
|
| United States of America - 0.8% | | | |
| International Flavors & Fragrances, Inc. (Israel) | | 209,161 | 30,200 |
| Marsh & McLennan Companies, Inc. | | 516,900 | 43,807 |
|
| TOTAL UNITED STATES OF AMERICA | | | 74,007 |
|
| TOTAL COMMON STOCKS | | | |
| (Cost $7,415,622) | | | 8,283,956 |
| | | Principal Amount (000s) | Value (000s) |
|
| Government Obligations - 0.1% | | | |
| United States of America - 0.1% | | | |
| U.S. Treasury Bills, yield at date of purchase 1.99% to 2.3% 11/1/18 to 1/31/19(e) | | | |
| (Cost $13,725) | | 13,770 | 13,725 |
| | | Shares | Value (000s) |
|
| Money Market Funds - 14.7% | | | |
| Fidelity Cash Central Fund, 2.23% (f) | | 1,172,025,582 | 1,172,260 |
| Fidelity Securities Lending Cash Central Fund 2.23% (f)(g) | | 225,820,857 | 225,843 |
| TOTAL MONEY MARKET FUNDS | | | |
| (Cost $1,398,103) | | | 1,398,103 |
| TOTAL INVESTMENT IN SECURITIES - 101.9% | | | |
| (Cost $8,827,450) | | | 9,695,784 |
| NET OTHER ASSETS (LIABILITIES) - (1.9)% | | | (180,375) |
| NET ASSETS - 100% | | | $9,515,409 |
| Futures Contracts | | | | | |
| | Number of contracts | Expiration Date | Notional Amount (000s) | Value (000s) | Unrealized Appreciation/(Depreciation) (000s) |
| Purchased | | | | | |
| Equity Index Contracts | | | | | |
| TSE TOPIX Index Contracts (Japan) | 2,383 | Dec. 2018 | $346,568 | $(7,547) | $(7,547) |
The notional amount of futures purchased as a percentage of Net Assets is 3.6%
Categorizations in the Schedule of Investments are based on country or territory of incorporation.
Values shown as $0 in the Schedule of Investments may reflect amounts less than $500.
Legend
(a) Non-income producing
(b) Security or a portion of the security is on loan at period end.
(c) Security exempt from registration under Rule 144A of the Securities Act of 1933. These securities may be resold in transactions exempt from registration, normally to qualified institutional buyers. At the end of the period, the value of these securities amounted to $216,021,000 or 2.3% of net assets.
(d) Level 3 security
(e) Security or a portion of the security was pledged to cover margin requirements for futures contracts. At period end, the value of securities pledged amounted to $13,725,000.
(f) Affiliated fund that is generally available only to investment companies and other accounts managed by Fidelity Investments. The rate quoted is the annualized seven-day yield of the fund at period end. A complete unaudited listing of the fund's holdings as of its most recent quarter end is available upon request. In addition, each Fidelity Central Fund's financial statements, which are not covered by the Fund's Report of Independent Registered Public Accounting Firm, are available on the SEC's website or upon request.
(g) Includes investment made with cash collateral received from securities on loan.
Affiliated Central Funds
Information regarding fiscal year to date income earned by the Fund from investments in Fidelity Central Funds is as follows:
| Fund | Income earned |
| | (Amounts in thousands) |
| Fidelity Cash Central Fund | $11,311 |
| Fidelity Securities Lending Cash Central Fund | 3,292 |
| Total | $14,603 |
Amounts in the income column in the above table include any capital gain distributions from underlying funds, which are presented in the corresponding line-item in the Statement of Operations if applicable.
Other Affiliated Issuers
An affiliated company is a company in which the Fund has ownership of at least 5% of the voting securities. Fiscal year to date transactions with companies which are or were affiliates are as follows:
| Affiliate (Amounts in thousands) | Value, beginning of period | Purchases | Sales Proceeds(a),(b) | Dividend Income | Realized Gain (loss) | Change in Unrealized appreciation (depreciation) | Value, end of period |
| Rex Bionics PLC | $30 | $-- | $0 | $-- | $(3,941) | $3,911 | $-- |
| Total | $30 | $-- | $0 | $-- | $(3,941) | $3,911 | $-- |
(a) Values shown as $0 may reflect amounts less than $500.
(b) Includes the value of securities delivered through in-kind transactions, if applicable.
Investment Valuation
The following is a summary of the inputs used, as of October 31, 2018, involving the Fund's assets and liabilities carried at fair value. The inputs or methodology used for valuing securities may not be an indication of the risk associated with investing in those securities. For more information on valuation inputs, and their aggregation into the levels used below, please refer to the Investment Valuation section in the accompanying Notes to Financial Statements.
| | Valuation Inputs at Reporting Date: |
| Description | Total | Level 1 | Level 2 | Level 3 |
| (Amounts in thousands) | | | | |
| Investments in Securities: | | | | |
| Equities: | | | | |
| Communication Services | $135,932 | $69,645 | $66,287 | $-- |
| Consumer Discretionary | 911,006 | 600,583 | 310,423 | -- |
| Consumer Staples | 856,113 | 361,262 | 494,851 | 0 |
| Energy | 626,363 | 349,040 | 277,323 | -- |
| Financials | 1,793,549 | 1,287,970 | 505,579 | -- |
| Health Care | 1,248,676 | 602,777 | 645,899 | -- |
| Industrials | 1,143,407 | 810,675 | 332,732 | -- |
| Information Technology | 923,705 | 562,840 | 360,865 | -- |
| Materials | 373,768 | 226,510 | 147,258 | -- |
| Real Estate | 242,476 | 242,476 | -- | -- |
| Utilities | 28,961 | 28,961 | -- | -- |
| Government Obligations | 13,725 | -- | 13,725 | -- |
| Money Market Funds | 1,398,103 | 1,398,103 | -- | -- |
| Total Investments in Securities: | $9,695,784 | $6,540,842 | $3,154,942 | $0 |
| Derivative Instruments: | | | | |
| Liabilities | | | | |
| Futures Contracts | $(7,547) | $(7,547) | $-- | $-- |
| Total Liabilities | $(7,547) | $(7,547) | $-- | $-- |
| Total Derivative Instruments: | $(7,547) | $(7,547) | $-- | $-- |
The following is a summary of transfers between Level 1 and Level 2 for the period ended October 31, 2018. Transfers are assumed to have occurred at the beginning of the period, and are primarily attributable to the valuation techniques used for foreign equity securities, as discussed in the accompanying Notes to Financial Statements:
| Transfers | Total (000s) |
| Level 1 to Level 2 | $465,253 |
| Level 2 to Level 1 | $999,772 |
Value of Derivative Instruments
The following table is a summary of the Fund's value of derivative instruments by primary risk exposure as of October 31, 2018. For additional information on derivative instruments, please refer to the Derivative Instruments section in the accompanying Notes to Financial Statements.
| Primary Risk Exposure / Derivative Type | Value |
| | Asset | Liability |
| (Amounts in thousands) | | |
| Equity Risk | | |
| Futures Contracts(a) | $0 | $(7,547) |
| Total Equity Risk | 0 | (7,547) |
| Total Value of Derivatives | $0 | $(7,547) |
(a) Reflects gross cumulative appreciation (depreciation) on futures contracts as presented in the Schedule of Investments. In the Statement of Assets and Liabilities, the period end daily variation margin is included in receivable or payable for daily variation margin on futures contracts, and the net cumulative appreciation (depreciation) is included in net unrealized appreciation (depreciation).
See accompanying notes which are an integral part of the financial statements.
Financial Statements
Statement of Assets and Liabilities
| Amounts in thousands (except per-share amounts) | | October 31, 2018 |
| Assets | | |
Investment in securities, at value (including securities loaned of $215,012) — See accompanying schedule:
Unaffiliated issuers (cost $7,429,347) | $8,297,681 | |
| Fidelity Central Funds (cost $1,398,103) | 1,398,103 | |
| Total Investment in Securities (cost $8,827,450) | | $9,695,784 |
| Foreign currency held at value (cost $821) | | 818 |
| Receivable for investments sold | | 7,222 |
| Receivable for fund shares sold | | 17,779 |
| Dividends receivable | | 22,808 |
| Distributions receivable from Fidelity Central Funds | | 2,215 |
| Receivable for daily variation margin on futures contracts | | 6,547 |
| Prepaid expenses | | 20 |
| Other receivables | | 4,016 |
| Total assets | | 9,757,209 |
| Liabilities | | |
| Payable for investments purchased | $31 | |
| Payable for fund shares redeemed | 8,363 | |
| Accrued management fee | 4,872 | |
| Distribution and service plan fees payable | 72 | |
| Other affiliated payables | 1,317 | |
| Other payables and accrued expenses | 1,304 | |
| Collateral on securities loaned | 225,841 | |
| Total liabilities | | 241,800 |
| Net Assets | | $9,515,409 |
| Net Assets consist of: | | |
| Paid in capital | | $8,369,714 |
| Total distributable earnings (loss) | | 1,145,695 |
| Net Assets | | $9,515,409 |
| Net Asset Value and Maximum Offering Price | | |
| Class A: | | |
| Net Asset Value and redemption price per share ($190,720 ÷ 4,769.1 shares) | | $39.99 |
| Maximum offering price per share (100/94.25 of $39.99) | | $42.43 |
| Class M: | | |
| Net Asset Value and redemption price per share ($27,840 ÷ 701.0 shares) | | $39.71 |
| Maximum offering price per share (100/96.50 of $39.71) | | $41.15 |
| Class C: | | |
| Net Asset Value and offering price per share ($21,537 ÷ 547.8 shares)(a) | | $39.32 |
| International Discovery: | | |
| Net Asset Value, offering price and redemption price per share ($6,514,516 ÷ 161,559.9 shares) | | $40.32 |
| Class K: | | |
| Net Asset Value, offering price and redemption price per share ($2,063,585 ÷ 51,271.1 shares) | | $40.25 |
| Class I: | | |
| Net Asset Value, offering price and redemption price per share ($579,134 ÷ 14,400.3 shares) | | $40.22 |
| Class Z: | | |
| Net Asset Value, offering price and redemption price per share ($118,077 ÷ 2,935.8 shares) | | $40.22 |
(a) Redemption price per share is equal to net asset value less any applicable contingent deferred sales charge.
See accompanying notes which are an integral part of the financial statements.
Statement of Operations
| Amounts in thousands | | Year ended October 31, 2018 |
| Investment Income | | |
| Dividends | | $225,604 |
| Interest | | 143 |
| Income from Fidelity Central Funds | | 14,603 |
| Income before foreign taxes withheld | | 240,350 |
| Less foreign taxes withheld | | (22,110) |
| Total income | | 218,240 |
| Expenses | | |
| Management fee | | |
| Basic fee | $71,011 | |
| Performance adjustment | 2,254 | |
| Transfer agent fees | 14,527 | |
| Distribution and service plan fees | 1,011 | |
| Accounting and security lending fees | 1,828 | |
| Custodian fees and expenses | 1,634 | |
| Independent trustees' fees and expenses | 53 | |
| Registration fees | 184 | |
| Audit | 115 | |
| Legal | 30 | |
| Miscellaneous | 74 | |
| Total expenses before reductions | 92,721 | |
| Expense reductions | (1,283) | |
| Total expenses after reductions | | 91,438 |
| Net investment income (loss) | | 126,802 |
| Realized and Unrealized Gain (Loss) | | |
| Net realized gain (loss) on: | | |
| Investment securities: | | |
| Unaffiliated issuers | 278,786 | |
| Fidelity Central Funds | 25 | |
| Other affiliated issuers | (3,941) | |
| Foreign currency transactions | (1,188) | |
| Futures contracts | 4,030 | |
| Total net realized gain (loss) | | 277,712 |
| Change in net unrealized appreciation (depreciation) on: | | |
| Investment securities: | | |
| Unaffiliated issuers | (1,409,375) | |
| Fidelity Central Funds | 8 | |
| Other affiliated issuers | 3,911 | |
| Assets and liabilities in foreign currencies | (510) | |
| Futures contracts | (24,387) | |
| Total change in net unrealized appreciation (depreciation) | | (1,430,353) |
| Net gain (loss) | | (1,152,641) |
| Net increase (decrease) in net assets resulting from operations | | $(1,025,839) |
See accompanying notes which are an integral part of the financial statements.
Statement of Changes in Net Assets
| Amounts in thousands | Year ended October 31, 2018 | Year ended October 31, 2017 |
| Increase (Decrease) in Net Assets | | |
| Operations | | |
| Net investment income (loss) | $126,802 | $118,923 |
| Net realized gain (loss) | 277,712 | 1,030,476 |
| Change in net unrealized appreciation (depreciation) | (1,430,353) | 1,102,421 |
| Net increase (decrease) in net assets resulting from operations | (1,025,839) | 2,251,820 |
| Distributions to shareholders | (535,941) | – |
| Distributions to shareholders from net investment income | – | (150,174) |
| Distributions to shareholders from net realized gain | – | (11,939) |
| Total distributions | (535,941) | (162,113) |
| Share transactions - net increase (decrease) | 427,927 | (822,002) |
| Redemption fees | – | 9 |
| Total increase (decrease) in net assets | (1,133,853) | 1,267,714 |
| Net Assets | | |
| Beginning of period | 10,649,262 | 9,381,548 |
| End of period | $9,515,409 | $10,649,262 |
| Other Information | | |
| Undistributed net investment income end of period | | $108,446 |
See accompanying notes which are an integral part of the financial statements.
Financial Highlights
Fidelity International Discovery Fund Class A
| Years ended October 31, | 2018 | 2017 | 2016 | 2015 | 2014 |
| Selected Per–Share Data | | | | | |
| Net asset value, beginning of period | $46.66 | $37.60 | $39.78 | $38.70 | $39.49 |
| Income from Investment Operations | | | | | |
| Net investment income (loss)A | .37 | .36 | .47B | .40C | .53D |
| Net realized and unrealized gain (loss) | (4.87) | 9.22 | (2.38) | .79 | (.67) |
| Total from investment operations | (4.50) | 9.58 | (1.91) | 1.19 | (.14) |
| Distributions from net investment income | (.34) | (.47) | (.27) | (.11) | (.33) |
| Distributions from net realized gain | (1.83) | (.05) | (.01) | – | (.31) |
| Total distributions | (2.17) | (.52) | (.27)E | (.11) | (.65)F |
| Redemption fees added to paid in capitalA | – | –G | –G | –G | –G |
| Net asset value, end of period | $39.99 | $46.66 | $37.60 | $39.78 | $38.70 |
| Total ReturnH,I | (10.11)% | 25.87% | (4.83)% | 3.09% | (.36)% |
| Ratios to Average Net AssetsJ,K | | | | | |
| Expenses before reductions | 1.22% | 1.29% | 1.35% | 1.33% | 1.28% |
| Expenses net of fee waivers, if any | 1.22% | 1.29% | 1.35% | 1.33% | 1.28% |
| Expenses net of all reductions | 1.21% | 1.27% | 1.34% | 1.32% | 1.28% |
| Net investment income (loss) | .83% | .88% | 1.26%B | 1.00%C | 1.35%D |
| Supplemental Data | | | | | |
| Net assets, end of period (in millions) | $191 | $248 | $236 | $283 | $297 |
| Portfolio turnover rateL | 45%M | 42% | 50%M | 60%M | 57% |
A Calculated based on average shares outstanding during the period.
B Net investment income per share reflects a large, non-recurring dividend which amounted to $.14 per share. Excluding this non-recurring dividend, the ratio of net investment income (loss) to average net assets would have been .88%.
C Net investment income per share reflects a large, non-recurring dividend which amounted to $.12 per share. Excluding this non-recurring dividend, the ratio of net investment income (loss) to average net assets would have been .69%.
D Net investment income per share reflects a large, non-recurring dividend which amounted to $.22 per share. Excluding this non-recurring dividend, the ratio of net investment income (loss) to average net assets would have been .80%.
E Total distributions of $.27 per share is comprised of distributions from net investment income of $.269 and distributions from net realized gain of $.005 per share.
F Total distributions of $.65 per share is comprised of distributions from net investment income of $.334 and distributions from net realized gain of $.311 per share.
G Amount represents less than $.005 per share.
H Total returns would have been lower if certain expenses had not been reduced during the applicable periods shown.
I Total returns do not include the effect of the sales charges.
J Fees and expenses of any underlying Fidelity Central Funds are not included in the Fund's expense ratio. The Fund indirectly bears its proportionate share of the expenses of any underlying Fidelity Central Funds.
K Expense ratios reflect operating expenses of the class. Expenses before reductions do not reflect amounts reimbursed by the investment adviser or reductions from brokerage service arrangements or reductions from other expense offset arrangements and do not represent the amount paid by the class during periods when reimbursements or reductions occur. Expenses net of fee waivers reflect expenses after reimbursement by the investment adviser but prior to reductions from brokerage service arrangements or other expense offset arrangements. Expenses net of all reductions represent the net expenses paid by the class.
L Amount does not include the portfolio activity of any underlying Fidelity Central Funds.
M Portfolio turnover rate excludes securities received or delivered in-kind.
See accompanying notes which are an integral part of the financial statements.
Fidelity International Discovery Fund Class M
| Years ended October 31, | 2018 | 2017 | 2016 | 2015 | 2014 |
| Selected Per–Share Data | | | | | |
| Net asset value, beginning of period | $46.35 | $37.34 | $39.51 | $38.43 | $39.23 |
| Income from Investment Operations | | | | | |
| Net investment income (loss)A | .27 | .26 | .38B | .30C | .44D |
| Net realized and unrealized gain (loss) | (4.84) | 9.17 | (2.37) | .80 | (.68) |
| Total from investment operations | (4.57) | 9.43 | (1.99) | 1.10 | (.24) |
| Distributions from net investment income | (.24) | (.37) | (.17) | (.02) | (.25) |
| Distributions from net realized gain | (1.83) | (.05) | (.01) | – | (.31) |
| Total distributions | (2.07) | (.42) | (.18) | (.02) | (.56) |
| Redemption fees added to paid in capitalA | – | –E | –E | –E | –E |
| Net asset value, end of period | $39.71 | $46.35 | $37.34 | $39.51 | $38.43 |
| Total ReturnF,G | (10.31)% | 25.57% | (5.07)% | 2.86% | (.60)% |
| Ratios to Average Net AssetsH,I | | | | | |
| Expenses before reductions | 1.46% | 1.53% | 1.58% | 1.57% | 1.51% |
| Expenses net of fee waivers, if any | 1.46% | 1.52% | 1.58% | 1.57% | 1.51% |
| Expenses net of all reductions | 1.45% | 1.51% | 1.57% | 1.56% | 1.51% |
| Net investment income (loss) | .59% | .64% | 1.02%B | .76%C | 1.11%D |
| Supplemental Data | | | | | |
| Net assets, end of period (in millions) | $28 | $35 | $35 | $43 | $49 |
| Portfolio turnover rateJ | 45%K | 42% | 50%K | 60%K | 57% |
A Calculated based on average shares outstanding during the period.
B Net investment income per share reflects a large, non-recurring dividend which amounted to $.14 per share. Excluding this non-recurring dividend, the ratio of net investment income (loss) to average net assets would have been .64%.
C Net investment income per share reflects a large, non-recurring dividend which amounted to $.12 per share. Excluding this non-recurring dividend, the ratio of net investment income (loss) to average net assets would have been .45%.
D Net investment income per share reflects a large, non-recurring dividend which amounted to $.21 per share. Excluding this non-recurring dividend, the ratio of net investment income (loss) to average net assets would have been .56%.
E Amount represents less than $.005 per share.
F Total returns would have been lower if certain expenses had not been reduced during the applicable periods shown.
G Total returns do not include the effect of the sales charges.
H Fees and expenses of any underlying Fidelity Central Funds are not included in the Fund's expense ratio. The Fund indirectly bears its proportionate share of the expenses of any underlying Fidelity Central Funds.
I Expense ratios reflect operating expenses of the class. Expenses before reductions do not reflect amounts reimbursed by the investment adviser or reductions from brokerage service arrangements or reductions from other expense offset arrangements and do not represent the amount paid by the class during periods when reimbursements or reductions occur. Expenses net of fee waivers reflect expenses after reimbursement by the investment adviser but prior to reductions from brokerage service arrangements or other expense offset arrangements. Expenses net of all reductions represent the net expenses paid by the class.
J Amount does not include the portfolio activity of any underlying Fidelity Central Funds.
K Portfolio turnover rate excludes securities received or delivered in-kind.
See accompanying notes which are an integral part of the financial statements.
Fidelity International Discovery Fund Class C
| Years ended October 31, | 2018 | 2017 | 2016 | 2015 | 2014 |
| Selected Per–Share Data | | | | | |
| Net asset value, beginning of period | $45.94 | $36.96 | $39.14 | $38.25 | $39.07 |
| Income from Investment Operations | | | | | |
| Net investment income (loss)A | .02 | .04 | .19B | .10C | .23D |
| Net realized and unrealized gain (loss) | (4.79) | 9.12 | (2.37) | .79 | (.66) |
| Total from investment operations | (4.77) | 9.16 | (2.18) | .89 | (.43) |
| Distributions from net investment income | (.02) | (.13) | – | – | (.08) |
| Distributions from net realized gain | (1.83) | (.05) | – | – | (.31) |
| Total distributions | (1.85) | (.18) | – | – | (.39) |
| Redemption fees added to paid in capitalA | – | –E | –E | –E | –E |
| Net asset value, end of period | $39.32 | $45.94 | $36.96 | $39.14 | $38.25 |
| Total ReturnF,G | (10.80)% | 24.93% | (5.57)% | 2.33% | (1.10)% |
| Ratios to Average Net AssetsH,I | | | | | |
| Expenses before reductions | 2.00% | 2.05% | 2.10% | 2.09% | 2.03% |
| Expenses net of fee waivers, if any | 2.00% | 2.05% | 2.10% | 2.09% | 2.03% |
| Expenses net of all reductions | 1.99% | 2.04% | 2.09% | 2.08% | 2.02% |
| Net investment income (loss) | .05% | .11% | .50%B | .24%C | .60%D |
| Supplemental Data | | | | | |
| Net assets, end of period (in millions) | $22 | $28 | $26 | $32 | $35 |
| Portfolio turnover rateJ | 45%K | 42% | 50%K | 60%K | 57% |
A Calculated based on average shares outstanding during the period.
B Net investment income per share reflects a large, non-recurring dividend which amounted to $.14 per share. Excluding this non-recurring dividend, the ratio of net investment income (loss) to average net assets would have been .13%.
C Net investment income per share reflects a large, non-recurring dividend which amounted to $.12 per share. Excluding this non-recurring dividend, the ratio of net investment income (loss) to average net assets would have been (.06) %.
D Net investment income per share reflects a large, non-recurring dividend which amounted to $.21 per share. Excluding this non-recurring dividend, the ratio of net investment income (loss) to average net assets would have been .05%.
E Amount represents less than $.005 per share.
F Total returns would have been lower if certain expenses had not been reduced during the applicable periods shown.
G Total returns do not include the effect of the contingent deferred sales charge.
H Fees and expenses of any underlying Fidelity Central Funds are not included in the Fund's expense ratio. The Fund indirectly bears its proportionate share of the expenses of any underlying Fidelity Central Funds.
I Expense ratios reflect operating expenses of the class. Expenses before reductions do not reflect amounts reimbursed by the investment adviser or reductions from brokerage service arrangements or reductions from other expense offset arrangements and do not represent the amount paid by the class during periods when reimbursements or reductions occur. Expenses net of fee waivers reflect expenses after reimbursement by the investment adviser but prior to reductions from brokerage service arrangements or other expense offset arrangements. Expenses net of all reductions represent the net expenses paid by the class.
J Amount does not include the portfolio activity of any underlying Fidelity Central Funds.
K Portfolio turnover rate excludes securities received or delivered in-kind.
See accompanying notes which are an integral part of the financial statements.
Fidelity International Discovery Fund
| Years ended October 31, | 2018 | 2017 | 2016 | 2015 | 2014 |
| Selected Per–Share Data | | | | | |
| Net asset value, beginning of period | $47.04 | $37.91 | $40.12 | $39.03 | $39.82 |
| Income from Investment Operations | | | | | |
| Net investment income (loss)A | .53 | .50 | .61B | .54C | .67D |
| Net realized and unrealized gain (loss) | (4.92) | 9.29 | (2.41) | .81 | (.68) |
| Total from investment operations | (4.39) | 9.79 | (1.80) | 1.35 | (.01) |
| Distributions from net investment income | (.50) | (.61) | (.41) | (.26) | (.47) |
| Distributions from net realized gain | (1.83) | (.05) | (.01) | – | (.31) |
| Total distributions | (2.33) | (.66) | (.41)E | (.26) | (.78) |
| Redemption fees added to paid in capitalA | – | –F | –F | –F | –F |
| Net asset value, end of period | $40.32 | $47.04 | $37.91 | $40.12 | $39.03 |
| Total ReturnG | (9.81)% | 26.33% | (4.53)% | 3.47% | (.01)% |
| Ratios to Average Net AssetsH,I | | | | | |
| Expenses before reductions | .88% | .94% | 1.00% | .99% | .93% |
| Expenses net of fee waivers, if any | .88% | .94% | 1.00% | .99% | .93% |
| Expenses net of all reductions | .87% | .92% | .99% | .98% | .93% |
| Net investment income (loss) | 1.17% | 1.22% | 1.61%B | 1.34%C | 1.69%D |
| Supplemental Data | | | | | |
| Net assets, end of period (in millions) | $6,515 | $7,351 | $6,421 | $7,209 | $7,464 |
| Portfolio turnover rateJ | 45%K | 42% | 50%K | 60%K | 57% |
A Calculated based on average shares outstanding during the period.
B Net investment income per share reflects a large, non-recurring dividend which amounted to $.14 per share. Excluding this non-recurring dividend, the ratio of net investment income (loss) to average net assets would have been 1.23%.
C Net investment income per share reflects a large, non-recurring dividend which amounted to $.12 per share. Excluding this non-recurring dividend, the ratio of net investment income (loss) to average net assets would have been 1.03%.
D Net investment income per share reflects a large, non-recurring dividend which amounted to $.22 per share. Excluding this non-recurring dividend, the ratio of net investment income (loss) to average net assets would have been 1.15%.
E Total distributions of $.41 per share is comprised of distributions from net investment income of $.409 and distributions from net realized gain of $.005 per share.
F Amount represents less than $.005 per share.
G Total returns would have been lower if certain expenses had not been reduced during the applicable periods shown.
H Fees and expenses of any underlying Fidelity Central Funds are not included in the Fund's expense ratio. The Fund indirectly bears its proportionate share of the expenses of any underlying Fidelity Central Funds.
I Expense ratios reflect operating expenses of the class. Expenses before reductions do not reflect amounts reimbursed by the investment adviser or reductions from brokerage service arrangements or reductions from other expense offset arrangements and do not represent the amount paid by the class during periods when reimbursements or reductions occur. Expenses net of fee waivers reflect expenses after reimbursement by the investment adviser but prior to reductions from brokerage service arrangements or other expense offset arrangements. Expenses net of all reductions represent the net expenses paid by the class.
J Amount does not include the portfolio activity of any underlying Fidelity Central Funds.
K Portfolio turnover rate excludes securities received or delivered in-kind.
See accompanying notes which are an integral part of the financial statements.
Fidelity International Discovery Fund Class K
| Years ended October 31, | 2018 | 2017 | 2016 | 2015 | 2014 |
| Selected Per–Share Data | | | | | |
| Net asset value, beginning of period | $46.96 | $37.86 | $40.06 | $38.97 | $39.76 |
| Income from Investment Operations | | | | | |
| Net investment income (loss)A | .58 | .55 | .66B | .59C | .72D |
| Net realized and unrealized gain (loss) | (4.90) | 9.26 | (2.39) | .81 | (.67) |
| Total from investment operations | (4.32) | 9.81 | (1.73) | 1.40 | .05 |
| Distributions from net investment income | (.55) | (.66) | (.46) | (.31) | (.53) |
| Distributions from net realized gain | (1.83) | (.05) | (.01) | – | (.31) |
| Total distributions | (2.39)E | (.71) | (.47) | (.31) | (.84) |
| Redemption fees added to paid in capitalA | – | –F | –F | –F | –F |
| Net asset value, end of period | $40.25 | $46.96 | $37.86 | $40.06 | $38.97 |
| Total ReturnG | (9.70)% | 26.47% | (4.38)% | 3.61% | .13% |
| Ratios to Average Net AssetsH,I | | | | | |
| Expenses before reductions | .77% | .82% | .86% | .86% | .80% |
| Expenses net of fee waivers, if any | .77% | .82% | .86% | .86% | .80% |
| Expenses net of all reductions | .76% | .80% | .85% | .85% | .79% |
| Net investment income (loss) | 1.29% | 1.35% | 1.74%B | 1.47%C | 1.83%D |
| Supplemental Data | | | | | |
| Net assets, end of period (in millions) | $2,064 | $2,228 | $1,880 | $2,308 | $2,464 |
| Portfolio turnover rateJ | 45%K | 42% | 50%K | 60%K | 57% |
A Calculated based on average shares outstanding during the period.
B Net investment income per share reflects a large, non-recurring dividend which amounted to $.14 per share. Excluding this non-recurring dividend, the ratio of net investment income (loss) to average net assets would have been 1.36%.
C Net investment income per share reflects a large, non-recurring dividend which amounted to $.12 per share. Excluding this non-recurring dividend, the ratio of net investment income (loss) to average net assets would have been 1.16%.
D Net investment income per share reflects a large, non-recurring dividend which amounted to $.22 per share. Excluding this non-recurring dividend, the ratio of net investment income (loss) to average net assets would have been 1.28%.
E Total distributions of $2.39 per share is comprised of distributions from net investment income of $.554 and distributions from net realized gain of $1.832 per share.
F Amount represents less than $.005 per share.
G Total returns would have been lower if certain expenses had not been reduced during the applicable periods shown.
H Fees and expenses of any underlying Fidelity Central Funds are not included in the Fund's expense ratio. The Fund indirectly bears its proportionate share of the expenses of any underlying Fidelity Central Funds.
I Expense ratios reflect operating expenses of the class. Expenses before reductions do not reflect amounts reimbursed by the investment adviser or reductions from brokerage service arrangements or reductions from other expense offset arrangements and do not represent the amount paid by the class during periods when reimbursements or reductions occur. Expenses net of fee waivers reflect expenses after reimbursement by the investment adviser but prior to reductions from brokerage service arrangements or other expense offset arrangements. Expenses net of all reductions represent the net expenses paid by the class.
J Amount does not include the portfolio activity of any underlying Fidelity Central Funds.
K Portfolio turnover rate excludes securities received or delivered in-kind.
See accompanying notes which are an integral part of the financial statements.
Fidelity International Discovery Fund Class I
| Years ended October 31, | 2018 | 2017 | 2016 | 2015 | 2014 |
| Selected Per–Share Data | | | | | |
| Net asset value, beginning of period | $46.92 | $37.82 | $40.03 | $38.96 | $39.76 |
| Income from Investment Operations | | | | | |
| Net investment income (loss)A | .52 | .49 | .61B | .53C | .67D |
| Net realized and unrealized gain (loss) | (4.90) | 9.27 | (2.40) | .80 | (.68) |
| Total from investment operations | (4.38) | 9.76 | (1.79) | 1.33 | (.01) |
| Distributions from net investment income | (.49) | (.61) | (.42) | (.26) | (.48) |
| Distributions from net realized gain | (1.83) | (.05) | (.01) | – | (.31) |
| Total distributions | (2.32) | (.66) | (.42)E | (.26) | (.79) |
| Redemption fees added to paid in capitalA | – | –F | –F | –F | –F |
| Net asset value, end of period | $40.22 | $46.92 | $37.82 | $40.03 | $38.96 |
| Total ReturnG | (9.81)% | 26.29% | (4.52)% | 3.44% | (.01)% |
| Ratios to Average Net AssetsH,I | | | | | |
| Expenses before reductions | .91% | .96% | 1.00% | 1.00% | .93% |
| Expenses net of fee waivers, if any | .91% | .96% | 1.00% | .99% | .93% |
| Expenses net of all reductions | .90% | .94% | .99% | .98% | .93% |
| Net investment income (loss) | 1.15% | 1.21% | 1.60%B | 1.33%C | 1.69%D |
| Supplemental Data | | | | | |
| Net assets, end of period (in millions) | $579 | $658 | $745 | $1,061 | $650 |
| Portfolio turnover rateJ | 45%K | 42% | 50%K | 60%K | 57% |
A Calculated based on average shares outstanding during the period.
B Net investment income per share reflects a large, non-recurring dividend which amounted to $.14 per share. Excluding this non-recurring dividend, the ratio of net investment income (loss) to average net assets would have been 1.22%.
C Net investment income per share reflects a large, non-recurring dividend which amounted to $.12 per share. Excluding this non-recurring dividend, the ratio of net investment income (loss) to average net assets would have been 1.03%.
D Net investment income per share reflects a large, non-recurring dividend which amounted to $.22 per share. Excluding this non-recurring dividend, the ratio of net investment income (loss) to average net assets would have been 1.14%.
E Total distributions of $.42 per share is comprised of distributions from net investment income of $.418 and distributions from net realized gain of $.005 per share.
F Amount represents less than $.005 per share.
G Total returns would have been lower if certain expenses had not been reduced during the applicable periods shown.
H Fees and expenses of any underlying Fidelity Central Funds are not included in the Fund's expense ratio. The Fund indirectly bears its proportionate share of the expenses of any underlying Fidelity Central Funds.
I Expense ratios reflect operating expenses of the class. Expenses before reductions do not reflect amounts reimbursed by the investment adviser or reductions from brokerage service arrangements or reductions from other expense offset arrangements and do not represent the amount paid by the class during periods when reimbursements or reductions occur. Expenses net of fee waivers reflect expenses after reimbursement by the investment adviser but prior to reductions from brokerage service arrangements or other expense offset arrangements. Expenses net of all reductions represent the net expenses paid by the class.
J Amount does not include the portfolio activity of any underlying Fidelity Central Funds.
K Portfolio turnover rate excludes securities received or delivered in-kind.
See accompanying notes which are an integral part of the financial statements.
Fidelity International Discovery Fund Class Z
| Years ended October 31, | 2018 | 2017 | 2016 | 2015 | 2014 |
| Selected Per–Share Data | | | | | |
| Net asset value, beginning of period | $46.92 | $37.84 | $40.03 | $38.96 | $39.77 |
| Income from Investment Operations | | | | | |
| Net investment income (loss)A | .58 | .56 | .66B | .59C | .72D |
| Net realized and unrealized gain (loss) | (4.89) | 9.24 | (2.38) | .80 | (.68) |
| Total from investment operations | (4.31) | 9.80 | (1.72) | 1.39 | .04 |
| Distributions from net investment income | (.56) | (.67) | (.46) | (.32) | (.54) |
| Distributions from net realized gain | (1.83) | (.05) | (.01) | – | (.31) |
| Total distributions | (2.39) | (.72) | (.47) | (.32) | (.85) |
| Redemption fees added to paid in capitalA | – | –E | –E | –E | –E |
| Net asset value, end of period | $40.22 | $46.92 | $37.84 | $40.03 | $38.96 |
| Total ReturnF | (9.68)% | 26.44% | (4.36)% | 3.58% | .12% |
| Ratios to Average Net AssetsG,H | | | | | |
| Expenses before reductions | .77% | .82% | .86% | .86% | .80% |
| Expenses net of fee waivers, if any | .77% | .82% | .86% | .86% | .80% |
| Expenses net of all reductions | .76% | .80% | .85% | .85% | .79% |
| Net investment income (loss) | 1.29% | 1.35% | 1.74%B | 1.47%C | 1.83%D |
| Supplemental Data | | | | | |
| Net assets, end of period (in millions) | $118 | $101 | $38 | $30 | $35 |
| Portfolio turnover rateI | 45%J | 42% | 50%J | 60%J | 57% |
A Calculated based on average shares outstanding during the period.
B Net investment income per share reflects a large, non-recurring dividend which amounted to $.14 per share. Excluding this non-recurring dividend, the ratio of net investment income (loss) to average net assets would have been 1.36%.
C Net investment income per share reflects a large, non-recurring dividend which amounted to $.12 per share. Excluding this non-recurring dividend, the ratio of net investment income (loss) to average net assets would have been 1.16%.
D Net investment income per share reflects a large, non-recurring dividend which amounted to $.21 per share. Excluding this non-recurring dividend, the ratio of net investment income (loss) to average net assets would have been 1.28%.
E Amount represents less than $.005 per share.
F Total returns would have been lower if certain expenses had not been reduced during the applicable periods shown.
G Fees and expenses of any underlying Fidelity Central Funds are not included in the Fund's expense ratio. The Fund indirectly bears its proportionate share of the expenses of any underlying Fidelity Central Funds.
H Expense ratios reflect operating expenses of the class. Expenses before reductions do not reflect amounts reimbursed by the investment adviser or reductions from brokerage service arrangements or reductions from other expense offset arrangements and do not represent the amount paid by the class during periods when reimbursements or reductions occur. Expenses net of fee waivers reflect expenses after reimbursement by the investment adviser but prior to reductions from brokerage service arrangements or other expense offset arrangements. Expenses net of all reductions represent the net expenses paid by the class.
I Amount does not include the portfolio activity of any underlying Fidelity Central Funds.
J Portfolio turnover rate excludes securities received or delivered in-kind.
See accompanying notes which are an integral part of the financial statements.
Notes to Financial Statements
For the period ended October 31, 2018
(Amounts in thousands except percentages)
1. Organization.
Fidelity International Discovery Fund (the Fund) is a fund of Fidelity Investment Trust (the Trust) and is authorized to issue an unlimited number of shares. The Trust is registered under the Investment Company Act of 1940, as amended (the 1940 Act), as an open-end management investment company organized as a Massachusetts business trust. The Fund offers Class A, Class M, Class C, International Discovery, Class K, Class I and Class Z shares, each of which has equal rights as to assets and voting privileges. Each class has exclusive voting rights with respect to matters that affect that class.
2. Investments in Fidelity Central Funds.
The Fund invests in Fidelity Central Funds, which are open-end investment companies generally available only to other investment companies and accounts managed by the investment adviser and its affiliates. The Fund's Schedule of Investments lists each of the Fidelity Central Funds held as of period end, if any, as an investment of the Fund, but does not include the underlying holdings of each Fidelity Central Fund. As an Investing Fund, the Fund indirectly bears its proportionate share of the expenses of the underlying Fidelity Central Funds.
The Money Market Central Funds seek preservation of capital and current income and are managed by Fidelity Investments Money Management, Inc. (FIMM), an affiliate of the investment adviser. Annualized expenses of the Money Market Central Funds as of their most recent shareholder report date are less than .005%.
A complete unaudited list of holdings for each Fidelity Central Fund is available upon request or at the Securities and Exchange Commission (the SEC) website at www.sec.gov. In addition, the financial statements of the Fidelity Central Funds, which are not covered by the Fund's Report of Independent Registered Public Accounting Firm, are available on the SEC website or upon request.
3. Significant Accounting Policies.
The Fund is an investment company and applies the accounting and reporting guidance of the Financial Accounting Standards Board (FASB) Accounting Standards Codification Topic 946 Financial Services – Investments Companies. The financial statements have been prepared in conformity with accounting principles generally accepted in the United States of America (GAAP), which require management to make certain estimates and assumptions at the date of the financial statements. Actual results could differ from those estimates. Subsequent events, if any, through the date that the financial statements were issued have been evaluated in the preparation of the financial statements. The following summarizes the significant accounting policies of the Fund:
Investment Valuation. Investments are valued as of 4:00 p.m. Eastern time on the last calendar day of the period. The Board of Trustees (the Board) has delegated the day to day responsibility for the valuation of the Fund's investments to the Fair Value Committee (the Committee) established by the Fund's investment adviser. In accordance with valuation policies and procedures approved by the Board, the Fund attempts to obtain prices from one or more third party pricing vendors or brokers to value its investments. When current market prices, quotations or currency exchange rates are not readily available or reliable, investments will be fair valued in good faith by the Committee, in accordance with procedures adopted by the Board. Factors used in determining fair value vary by investment type and may include market or investment specific events, changes in interest rates and credit quality. The frequency with which these procedures are used cannot be predicted and they may be utilized to a significant extent. The Committee oversees the Fund's valuation policies and procedures and reports to the Board on the Committee's activities and fair value determinations. The Board monitors the appropriateness of the procedures used in valuing the Fund's investments and ratifies the fair value determinations of the Committee.
The Fund categorizes the inputs to valuation techniques used to value its investments into a disclosure hierarchy consisting of three levels as shown below:
- Level 1 – quoted prices in active markets for identical investments
- Level 2 – other significant observable inputs (including quoted prices for similar investments, interest rates, prepayment speeds, etc.)
- Level 3 – unobservable inputs (including the Fund's own assumptions based on the best information available)
Valuation techniques used to value the Fund's investments by major category are as follows:
Equity securities, including restricted securities, for which market quotations are readily available, are valued at the last reported sale price or official closing price as reported by a third party pricing vendor on the primary market or exchange on which they are traded and are categorized as Level 1 in the hierarchy. In the event there were no sales during the day or closing prices are not available, securities are valued at the last quoted bid price or may be valued using the last available price and are generally categorized as Level 2 in the hierarchy. For foreign equity securities, when market or security specific events arise, comparisons to the valuation of American Depositary Receipts (ADRs), futures contracts, Exchange-Traded Funds (ETFs) and certain indexes as well as quoted prices for similar securities may be used and would be categorized as Level 2 in the hierarchy. Utilizing these techniques may result in transfers between Level 1 and Level 2. For equity securities, including restricted securities, where observable inputs are limited, assumptions about market activity and risk are used and these securities may be categorized as Level 3 in the hierarchy.
Debt securities, including restricted securities, are valued based on evaluated prices received from third party pricing vendors or from brokers who make markets in such securities. U.S. government and government agency obligations are valued by pricing vendors who utilize matrix pricing which considers yield or price of bonds of comparable quality, coupon, maturity and type or by broker-supplied prices. When independent prices are unavailable or unreliable, debt securities may be valued utilizing pricing methodologies which consider similar factors that would be used by third party pricing vendors. Debt securities are generally categorized as Level 2 in the hierarchy but may be Level 3 depending on the circumstances.
Futures contracts are valued at the settlement price established each day by the board of trade or exchange on which they are traded and are categorized as Level 1 in the hierarchy. Investments in open-end mutual funds, including the Fidelity Central Funds, are valued at their closing net asset value (NAV) each business day and are categorized as Level 1 in the hierarchy.
Changes in valuation techniques may result in transfers in or out of an assigned level within the disclosure hierarchy. The aggregate value of investments by input level as of October 31, 2018, including information on transfers between Levels 1 and 2, is included at the end of the Fund's Schedule of Investments.
Foreign Currency. The Fund may use foreign currency contracts to facilitate transactions in foreign-denominated securities. Gains and losses from these transactions may arise from changes in the value of the foreign currency or if the counterparties do not perform under the contracts' terms.
Foreign-denominated assets, including investment securities, and liabilities are translated into U.S. dollars at the exchange rates at period end. Purchases and sales of investment securities, income and dividends received and expenses denominated in foreign currencies are translated into U.S. dollars at the exchange rate in effect on the transaction date.
The effects of exchange rate fluctuations on investments are included with the net realized and unrealized gain (loss) on investment securities. Other foreign currency transactions resulting in realized and unrealized gain (loss) are disclosed separately.
Investment Transactions and Income. For financial reporting purposes, the Fund's investment holdings and NAV include trades executed through the end of the last business day of the period. The NAV per share for processing shareholder transactions is calculated as of the close of business of the New York Stock Exchange (NYSE), normally 4:00 p.m. Eastern time and includes trades executed through the end of the prior business day. Gains and losses on securities sold are determined on the basis of identified cost and include proceeds received from litigation. Dividend income is recorded on the ex-dividend date, except for certain dividends from foreign securities where the ex-dividend date may have passed, which are recorded as soon as the Fund is informed of the ex-dividend date. Non-cash dividends included in dividend income, if any, are recorded at the fair market value of the securities received. Income and capital gain distributions from Fidelity Central Funds, if any, are recorded on the ex-dividend date. Certain distributions received by the Fund represent a return of capital or capital gain. The Fund determines the components of these distributions subsequent to the ex-dividend date, based upon receipt of tax filings or other correspondence relating to the underlying investment. These distributions are recorded as a reduction of cost of investments and/or as a realized gain. Interest income is accrued as earned and includes coupon interest and amortization of premium and accretion of discount on debt securities as applicable. Investment income is recorded net of foreign taxes withheld where recovery of such taxes is uncertain.
Class Allocations and Expenses. Investment income, realized and unrealized capital gains and losses, common expenses of the Fund, and certain fund-level expense reductions, if any, are allocated daily on a pro-rata basis to each class based on the relative net assets of each class to the total net assets of the Fund. Each class differs with respect to transfer agent and distribution and service plan fees incurred. Certain expense reductions may also differ by class. For the reporting period, the allocated portion of income and expenses to each class as a percent of its average net assets may vary due to the timing of recording these transactions in relation to fluctuating net assets of the classes. Expenses directly attributable to a fund are charged to that fund. Expenses attributable to more than one fund are allocated among the respective funds on the basis of relative net assets or other appropriate methods. Expense estimates are accrued in the period to which they relate and adjustments are made when actual amounts are known.
Deferred Trustee Compensation. Under a Deferred Compensation Plan (the Plan) for the Fund, certain independent Trustees have elected to defer receipt of a portion of their annual compensation. Deferred amounts are invested in a cross-section of Fidelity funds, are marked-to-market and remain in the Fund until distributed in accordance with the Plan. The investment of deferred amounts and the offsetting payable to the Trustees of $533 are included in the accompanying Statement of Assets and Liabilities in other receivables and other payables and accrued expenses, respectively.
Income Tax Information and Distributions to Shareholders. Each year, the Fund intends to qualify as a regulated investment company under Subchapter M of the Internal Revenue Code, including distributing substantially all of its taxable income and realized gains. As a result, no provision for U.S. Federal income taxes is required. As of October 31, 2018, the Fund did not have any unrecognized tax benefits in the financial statements; nor is the Fund aware of any tax positions for which it is reasonably possible that the total amounts of unrecognized tax benefits will significantly change in the next twelve months. The Fund files a U.S. federal tax return, in addition to state and local tax returns as required. The Fund's federal income tax returns are subject to examination by the Internal Revenue Service (IRS) for a period of three fiscal years after they are filed. State and local tax returns may be subject to examination for an additional fiscal year depending on the jurisdiction. Foreign taxes are provided for based on the Fund's understanding of the tax rules and rates that exist in the foreign markets in which it invests.
Distributions are declared and recorded on the ex-dividend date. Income and capital gain distributions are declared separately for each class. Income and capital gain distributions are determined in accordance with income tax regulations, which may differ from GAAP. In addition, the Fund claimed a portion of the payment made to redeeming shareholders as a distribution for income tax purposes.
Capital accounts within the financial statements are adjusted for permanent book-tax differences. These adjustments have no impact on net assets or the results of operations. Capital accounts are not adjusted for temporary book-tax differences which will reverse in a subsequent period.
Book-tax differences are primarily due to foreign currency transactions, passive foreign investment companies (PFIC), market discount, redemptions in kind, deferred trustees compensation and losses deferred due to wash sales.
As of period end, the cost and unrealized appreciation (depreciation) in securities, and derivatives if applicable, for federal income tax purposes were as follows:
| Gross unrealized appreciation | $1,387,775 |
| Gross unrealized depreciation | (552,589) |
| Net unrealized appreciation (depreciation) | $835,186 |
| Tax Cost | $8,853,051 |
The tax-based components of distributable earnings as of period end were as follows:
| Undistributed ordinary income | $100,442 |
| Undistributed long-term capital gain | $212,907 |
| Net unrealized appreciation (depreciation) on securities and other investments | $832,878 |
The tax character of distributions paid was as follows:
| | October 31, 2018 | October 31, 2017 |
| Ordinary Income | $123,038 | $ 162,113 |
| Long-term Capital Gains | 412,903 | – |
| Total | $535,941 | $ 162,113 |
Restricted Securities. The Fund may invest in securities that are subject to legal or contractual restrictions on resale. These securities generally may be resold in transactions exempt from registration or to the public if the securities are registered. Disposal of these securities may involve time-consuming negotiations and expense, and prompt sale at an acceptable price may be difficult. Information regarding restricted securities is included at the end of the Fund's Schedule of Investments.
New Rule Issuance. During August 2018, the U.S. Securities and Exchange Commission issued Final Rule Release No. 33-10532, Disclosure Update and Simplification. This Final Rule includes amendments specific to registered investment companies that are intended to eliminate overlap in disclosure requirements between Regulation S-X and GAAP. In accordance with these amendments, certain line-items in the Fund's financial statements have been combined or removed for the current period as outlined in the table below.
| Financial Statement | Current Line-Item Presentation | Prior Line-Item Presentation |
| Statement of Assets and Liabilities | Total distributable earnings (loss) | Undistributed/Distributions in excess of/Accumulated net investment income (loss)
Accumulated/Undistributed net realized gain (loss)
Net unrealized appreciation (depreciation) |
| Statement of Changes in Net Assets | N/A - removed | Undistributed/Distributions in excess of/Accumulated net investment income (loss) end of period |
| Statement of Changes in Net Assets | Distributions to shareholders | Distributions to shareholders from net investment income
Distributions to shareholders from net realized gain |
| Distributions to Shareholders Note to Financial Statements | Distributions to shareholders | Distributions to shareholders from net investment income
Distributions to shareholders from net realized gain |
4. Derivative Instruments.
Risk Exposures and the Use of Derivative Instruments. The Fund's investment objective allows the Fund to enter into various types of derivative contracts, including futures contracts. Derivatives are investments whose value is primarily derived from underlying assets, indices or reference rates and may be transacted on an exchange or over-the-counter (OTC). Derivatives may involve a future commitment to buy or sell a specified asset based on specified terms, to exchange future cash flows at periodic intervals based on a notional principal amount, or for one party to make one or more payments upon the occurrence of specified events in exchange for periodic payments from the other party.
The Fund used derivatives to increase returns and to manage exposure to certain risks as defined below. The success of any strategy involving derivatives depends on analysis of numerous economic factors, and if the strategies for investment do not work as intended, the Fund may not achieve its objectives.
The Fund's use of derivatives increased or decreased its exposure to the following risk:
| Equity Risk | Equity risk relates to the fluctuations in the value of financial instruments as a result of changes in market prices (other than those arising from interest rate risk or foreign exchange risk), whether caused by factors specific to an individual investment, its issuer, or all factors affecting all instruments traded in a market or market segment.
|
The Fund is also exposed to additional risks from investing in derivatives, such as liquidity risk and counterparty credit risk. Liquidity risk is the risk that the Fund will be unable to close out the derivative in the open market in a timely manner. Counterparty credit risk is the risk that the counterparty will not be able to fulfill its obligation to the Fund. Counterparty credit risk related to exchange-traded futures contracts may be mitigated by the protection provided by the exchange on which they trade.
Investing in derivatives may involve greater risks than investing in the underlying assets directly and, to varying degrees, may involve risk of loss in excess of any initial investment and collateral received and amounts recognized in the Statement of Assets and Liabilities. In addition, there may be the risk that the change in value of the derivative contract does not correspond to the change in value of the underlying instrument.
Futures Contracts. A futures contract is an agreement between two parties to buy or sell a specified underlying instrument for a fixed price at a specified future date. The Fund used futures contracts to manage its exposure to the stock market.
Upon entering into a futures contract, a fund is required to deposit either cash or securities (initial margin) with a clearing broker in an amount equal to a certain percentage of the face value of the contract. Futures contracts are marked-to-market daily and subsequent daily payments (variation margin) are made or received by a fund depending on the daily fluctuations in the value of the futures contracts and are recorded as unrealized appreciation or (depreciation). This receivable and/or payable, if any, is included in daily variation margin on futures contracts in the Statement of Assets and Liabilities. Realized gain or (loss) is recorded upon the expiration or closing of a futures contract. The net realized gain (loss) and change in net unrealized appreciation (depreciation) on futures contracts during the period is presented in the Statement of Operations.
Any open futures contracts at period end are presented in the Schedule of Investments under the caption "Futures Contracts". The notional amount at value reflects each contract's exposure to the underlying instrument or index at period end and is representative of volume of activity during the period. Securities deposited to meet initial margin requirements are identified in the Schedule of Investments.
5. Purchases and Sales of Investments.
Purchases and sales of securities, other than short-term securities and in-kind transactions, aggregated $4,496,106 and $5,146,595, respectively.
Redemptions In-Kind. During the period, 2,145 shares of the Fund held by unaffiliated entities were redeemed in-kind for investments and cash with a value of $96,039. The net realized gain of $24,574 on investments delivered through the in-kind redemptions is included in the accompanying Statement of Operations. The amount of the redemptions is included in share transactions activity shown in the accompanying Statement of Changes in Net Assets as well as the Notes to Financial Statements. The Fund recognized no gain or loss for federal income tax purposes.
6. Fees and Other Transactions with Affiliates.
Management Fee. Fidelity Management & Research Company (the investment adviser) and its affiliates provide the Fund with investment management related services for which the Fund pays a monthly management fee. The management fee is the sum of an individual fund fee rate that is based on an annual rate of .424% of the Fund's average net assets and an annualized group fee rate that averaged .24% during the period. The group fee rate is based upon the average net assets of all the mutual funds advised by the investment adviser, including any mutual funds previously advised by the investment adviser that are currently advised by Fidelity SelectCo, LLC, an affiliate of the investment adviser. The group fee rate decreases as assets under management increase and increases as assets under management decrease. In addition, the management fee is subject to a performance adjustment (up to a maximum of +/- .20% of the Fund's average net assets over a 36 month performance period). The upward or downward adjustment to the management fee is based on the relative investment performance of International Discovery as compared to its benchmark index, the MSCI EAFE Index, over the same 36 month performance period. For the reporting period, the total annual management fee rate, including the performance adjustment, was .69% of the Fund's average net assets. The performance adjustment included in the management fee rate may be higher or lower than the maximum performance adjustment rate due to the difference between the average net assets for the reporting and performance periods.
Distribution and Service Plan Fees. In accordance with Rule 12b-1 of the 1940 Act, the Fund has adopted separate Distribution and Service Plans for each class of shares. Certain classes pay Fidelity Distributors Corporation (FDC), an affiliate of the investment adviser, separate Distribution and Service Fees, each of which is based on an annual percentage of each class' average net assets. In addition, FDC may pay financial intermediaries for selling shares of the Fund and providing shareholder support services. For the period, the Distribution and Service Fee rates, total fees and amounts retained by FDC were as follows:
| | Distribution Fee | Service Fee | Total Fees | Retained by FDC |
| Class A | -% | .25% | $579 | $12 |
| Class M | .25% | .25% | 167 | 1 |
| Class C | .75% | .25% | 265 | 24 |
| | | | $1,011 | $37 |
Sales Load. FDC may receive a front-end sales charge of up to 5.75% for selling Class A shares and 3.50% for selling Class M shares, some of which is paid to financial intermediaries for selling shares of the Fund. Depending on the holding period, FDC may receive contingent deferred sales charges levied on Class A, Class M and Class C redemptions. The deferred sales charges are 1.00% for Class C shares, 1.00% for certain purchases of Class A shares and .25% for certain purchases of Class M shares.
For the period, sales charge amounts retained by FDC were as follows:
| | Retained by FDC |
| Class A | $38 |
| Class M | 3 |
| Class C(a) | 4 |
| | $45 |
(a) When Class C shares are initially sold, FDC pays commissions from its own resources to financial intermediaries through which the sales are made.
Transfer Agent Fees. Fidelity Investments Institutional Operations Company, Inc., (FIIOC), an affiliate of the investment adviser, is the transfer, dividend disbursing and shareholder servicing agent for each class of the Fund. FIIOC receives account fees and asset-based fees that vary according to the account size and type of account of the shareholders of the respective classes of the Fund, except for Class K and Class Z. FIIOC receives an asset-based fee of Class K's and Class Z's average net assets. FIIOC pays for typesetting, printing and mailing of shareholder reports, except proxy statements.
For the period, transfer agent fees for each class were as follows:
| | Amount | % of Class-Level Average Net Assets |
| Class A | $570 | .25 |
| Class M | 79 | .24 |
| Class C | 74 | .28 |
| International Discovery | 11,513 | .16 |
| Class K | 1,059 | .05 |
| Class I | 1,178 | .19 |
| Class Z | 54 | .05 |
| | $14,527 | |
Accounting and Security Lending Fees. Fidelity Service Company, Inc. (FSC), an affiliate of the investment adviser, maintains the Fund's accounting records. The accounting fee is based on the level of average net assets for each month. Under a separate contract, FSC administers the security lending program. The security lending fee is based on the number and duration of lending transactions. For the period, the fees were equivalent to an annual rate of .02%.
Brokerage Commissions. The Fund placed a portion of its portfolio transactions with brokerage firms which are affiliates of the investment adviser. Brokerage commissions are included in net realized gain (loss) and change in net unrealized appreciation (depreciation) in the Statement of Operations. The commissions paid to these affiliated firms were $19 for the period.
Interfund Trades. The Fund may purchase from or sell securities to other Fidelity Funds under procedures adopted by the Board. The procedures have been designed to ensure these interfund trades are executed in accordance with Rule 17a-7 of the 1940 Act. Interfund trades are included within the respective purchases and sales amounts shown in the Purchases and Sales of Investments note.
7. Committed Line of Credit.
The Fund participates with other funds managed by the investment adviser or an affiliate in a $4.25 billion credit facility (the "line of credit") to be utilized for temporary or emergency purposes to fund shareholder redemptions or for other short-term liquidity purposes. The Fund has agreed to pay commitment fees on its pro-rata portion of the line of credit, which amounted to $29 and is reflected in Miscellaneous expenses on the Statement of Operations. During the period, the Fund did not borrow on this line of credit.
8. Security Lending.
The Fund lends portfolio securities through a lending agent from time to time in order to earn additional income. For equity securities, a lending agent is used and may loan securities to certain qualified borrowers, including Fidelity Capital Markets (FCM), a broker-dealer affiliated with the Fund. On the settlement date of the loan, the Fund receives collateral (in the form of U.S. Treasury obligations, letters of credit and/or cash) against the loaned securities and maintains collateral in an amount not less than 100% of the market value of the loaned securities during the period of the loan. The market value of the loaned securities is determined at the close of business of the Fund and any additional required collateral is delivered to the Fund on the next business day. The Fund or borrower may terminate the loan at any time, and if the borrower defaults on its obligation to return the securities loaned because of insolvency or other reasons, the Fund may apply collateral received from the borrower against the obligation. The Fund may experience delays and costs in recovering the securities loaned. Any cash collateral received is invested in the Fidelity Securities Lending Cash Central Fund. The value of loaned securities and cash collateral at period end are disclosed on the Fund's Statement of Assets and Liabilities. At period end, there were no security loans outstanding with FCM. Security lending income represents the income earned on investing cash collateral, less rebates paid to borrowers and any lending agent fees associated with the loan, plus any premium payments received for lending certain types of securities. Security lending income is presented in the Statement of Operations as a component of income from Fidelity Central Funds. Total security lending income during the period amounted to $3,292, including less than five hundred dollars from securities loaned to FCM.
9. Expense Reductions.
Commissions paid to certain brokers with whom the investment adviser, or its affiliates, places trades on behalf of the Fund include an amount in addition to trade execution, which may be rebated back to the Fund to offset certain expenses. This amount totaled $1,174 for the period. In addition, through arrangements with the Fund's custodian, credits realized as a result of certain uninvested cash balances were used to reduce the Fund's expenses. During the period, these credits reduced the Fund's custody expenses by $1.
In addition, during the period the investment adviser reimbursed and/or waived a portion of fund-level operating expenses in the amount of $108.
10. Distributions to Shareholders.
Distributions to shareholders of each class were as follows:
| | Year ended
October 31, 2018 | Year ended
October 31, 2017 |
| Distributions to shareholders | | |
| Class A | $11,257 | $– |
| Class M | 1,557 | – |
| Class C | 1,132 | – |
| International Discovery | 368,791 | – |
| Class K | 115,669 | – |
| Class I | 32,390 | – |
| Class Z | 5,145 | – |
| Total | $535,941 | $– |
| From net investment income | | |
| Class A | $– | $2,894 |
| Class M | – | 333 |
| Class C | – | 92 |
| International Discovery | – | 102,284 |
| Class K | – | 32,411 |
| Class I | – | 11,493 |
| Class Z | – | 667 |
| Total | $– | $150,174 |
| From net realized gain | | |
| Class A | $– | $302 |
| Class M | – | 44 |
| Class C | – | 33 |
| International Discovery | – | 8,190 |
| Class K | – | 2,392 |
| Class I | – | 929 |
| Class Z | – | 49 |
| Total | $– | $11,939 |
11. Share Transactions.
Share transactions for each class were as follows and may contain automatic conversions between classes or exchanges between affiliated funds:
| | Shares | Shares | Dollars | Dollars |
| | Year ended October 31, 2018 | Year ended October 31, 2017 | Year ended October 31, 2018 | Year ended October 31, 2017 |
| Class A | | | | |
| Shares sold | 601 | 712 | $27,288 | $29,106 |
| Reinvestment of distributions | 252 | 87 | 11,177 | 3,152 |
| Shares redeemed | (1,390) | (1,774) | (62,507) | (71,253) |
| Net increase (decrease) | (537) | (975) | $(24,042) | $(38,995) |
| Class M | | | | |
| Shares sold | 91 | 80 | $4,077 | $3,246 |
| Reinvestment of distributions | 35 | 10 | 1,549 | 365 |
| Shares redeemed | (177) | (274) | (7,916) | (10,830) |
| Net increase (decrease) | (51) | (184) | $(2,290) | $(7,219) |
| Class C | | | | |
| Shares sold | 57 | 83 | $2,552 | $3,499 |
| Reinvestment of distributions | 25 | 3 | 1,083 | 116 |
| Shares redeemed | (152) | (174) | (6,753) | (6,878) |
| Net increase (decrease) | (70) | (88) | $(3,118) | $(3,263) |
| International Discovery | | | | |
| Shares sold | 18,511 | 19,989 | $834,070 | $812,564 |
| Reinvestment of distributions | 7,869 | 2,884 | 351,491 | 105,223 |
| Shares redeemed | (21,100) | (35,967) | (952,137) | (1,442,640) |
| Net increase (decrease) | 5,280 | (13,094) | $233,424 | $(524,853) |
| Class K | | | | |
| Shares sold | 15,085 | 10,877 | $683,626 | $448,875 |
| Reinvestment of distributions | 2,597 | 957 | 115,669 | 34,802 |
| Shares redeemed | (13,867)(a) | (14,039) | (624,849)(a) | (560,342) |
| Net increase (decrease) | 3,815 | (2,205) | $174,446 | $(76,665) |
| Class I | | | | |
| Shares sold | 3,244 | 3,202 | $143,374 | $130,302 |
| Reinvestment of distributions | 224 | 82 | 9,992 | 2,985 |
| Shares redeemed | (3,099) | (8,961) | (138,824) | (349,072) |
| Net increase (decrease) | 369 | (5,677) | $14,542 | $(215,785) |
| Class Z | | | | |
| Shares sold | 1,231 | 1,483 | $55,218 | $58,502 |
| Reinvestment of distributions | 67 | 20 | 2,993 | 716 |
| Shares redeemed | (517) | (351) | (23,246) | (14,440) |
| Net increase (decrease) | 781 | 1,152 | $34,965 | $44,778 |
(a) Amount includes in-kind redemptions (see the Redemptions In-Kind note for additional details).
12. Other.
The Fund's organizational documents provide former and current trustees and officers with a limited indemnification against liabilities arising in connection with the performance of their duties to the Fund. In the normal course of business, the Fund may also enter into contracts that provide general indemnifications. The Fund's maximum exposure under these arrangements is unknown as this would be dependent on future claims that may be made against the Fund. The risk of material loss from such claims is considered remote.
At the end of the period, Strategic Advisers International Fund was the owner of record of approximately 11% of the total outstanding shares of the Fund. Mutual funds managed by the investment adviser or its affiliates were the owners of record, in the aggregate, of approximately 22% of the total outstanding shares of the Fund.
Report of Independent Registered Public Accounting Firm
To the Board of Trustees of Fidelity Investment Trust and Shareholders of Fidelity International Discovery Fund:
Opinion on the Financial Statements
We have audited the accompanying statement of assets and liabilities, including the schedule of investments, of Fidelity International Discovery Fund (one of the funds constituting Fidelity Investment Trust, referred to hereafter as the "Fund") as of October 31, 2018, the related statement of operations for the year ended October 31, 2018, the statement of changes in net assets for each of the two years in the period ended October 31, 2018, including the related notes, and the financial highlights for each of the five years in the period ended October 31, 2018 (collectively referred to as the “financial statements”). In our opinion, the financial statements present fairly, in all material respects, the financial position of the Fund as of October 31, 2018, the results of its operations for the year then ended, the changes in its net assets for each of the two years in the period ended October 31, 2018 and the financial highlights for each of the five years in the period ended October 31, 2018 in conformity with accounting principles generally accepted in the United States of America.
Basis for Opinion
These financial statements are the responsibility of the Fund’s management. Our responsibility is to express an opinion on the Fund’s financial statements based on our audits. We are a public accounting firm registered with the Public Company Accounting Oversight Board (United States) (“PCAOB”) and are required to be independent with respect to the Fund in accordance with the U.S. federal securities laws and the applicable rules and regulations of the Securities and Exchange Commission and the PCAOB.
We conducted our audits of these financial statements in accordance with the standards of the PCAOB. Those standards require that we plan and perform the audit to obtain reasonable assurance about whether the financial statements are free of material misstatement, whether due to error or fraud.
Our audits included performing procedures to assess the risks of material misstatement of the financial statements, whether due to error or fraud, and performing procedures that respond to those risks. Such procedures included examining, on a test basis, evidence regarding the amounts and disclosures in the financial statements. Our audits also included evaluating the accounting principles used and significant estimates made by management, as well as evaluating the overall presentation of the financial statements. Our procedures included confirmation of securities owned as of October 31, 2018 by correspondence with the custodian, and brokers; when replies were not received from brokers, we performed other auditing procedures. We believe that our audits provide a reasonable basis for our opinion.
PricewaterhouseCoopers LLP
Boston, Massachusetts
December 12, 2018
We have served as the auditor of one or more investment companies in the Fidelity group of funds since 1932.
Trustees and Officers
The Trustees, Members of the Advisory Board (if any), and officers of the trust and fund, as applicable, are listed below. The Board of Trustees governs the fund and is responsible for protecting the interests of shareholders. The Trustees are experienced executives who meet periodically throughout the year to oversee the fund's activities, review contractual arrangements with companies that provide services to the fund, oversee management of the risks associated with such activities and contractual arrangements, and review the fund's performance. Except for Jonathan Chiel, each of the Trustees oversees 283 funds. Mr. Chiel oversees 154 funds.
The Trustees hold office without limit in time except that (a) any Trustee may resign; (b) any Trustee may be removed by written instrument, signed by at least two-thirds of the number of Trustees prior to such removal; (c) any Trustee who requests to be retired or who has become incapacitated by illness or injury may be retired by written instrument signed by a majority of the other Trustees; and (d) any Trustee may be removed at any special meeting of shareholders by a two-thirds vote of the outstanding voting securities of the trust. Each Trustee who is not an interested person (as defined in the 1940 Act) of the trust and the fund is referred to herein as an Independent Trustee. Each Independent Trustee shall retire not later than the last day of the calendar year in which his or her 75th birthday occurs. The Independent Trustees may waive this mandatory retirement age policy with respect to individual Trustees. Officers and Advisory Board Members hold office without limit in time, except that any officer or Advisory Board Member may resign or may be removed by a vote of a majority of the Trustees at any regular meeting or any special meeting of the Trustees. Except as indicated, each individual has held the office shown or other offices in the same company for the past five years.
The fund’s Statement of Additional Information (SAI) includes more information about the Trustees. To request a free copy, call Fidelity at 1-800-835-5092.
Experience, Skills, Attributes, and Qualifications of the Trustees. The Governance and Nominating Committee has adopted a statement of policy that describes the experience, qualifications, attributes, and skills that are necessary and desirable for potential Independent Trustee candidates (Statement of Policy). The Board believes that each Trustee satisfied at the time he or she was initially elected or appointed a Trustee, and continues to satisfy, the standards contemplated by the Statement of Policy. The Governance and Nominating Committee also engages professional search firms to help identify potential Independent Trustee candidates who have the experience, qualifications, attributes, and skills consistent with the Statement of Policy. From time to time, additional criteria based on the composition and skills of the current Independent Trustees, as well as experience or skills that may be appropriate in light of future changes to board composition, business conditions, and regulatory or other developments, have also been considered by the professional search firms and the Governance and Nominating Committee. In addition, the Board takes into account the Trustees' commitment and participation in Board and committee meetings, as well as their leadership of standing and ad hoc committees throughout their tenure.
In determining that a particular Trustee was and continues to be qualified to serve as a Trustee, the Board has considered a variety of criteria, none of which, in isolation, was controlling. The Board believes that, collectively, the Trustees have balanced and diverse experience, qualifications, attributes, and skills, which allow the Board to operate effectively in governing the fund and protecting the interests of shareholders. Information about the specific experience, skills, attributes, and qualifications of each Trustee, which in each case led to the Board's conclusion that the Trustee should serve (or continue to serve) as a trustee of the fund, is provided below.
Board Structure and Oversight Function. James C. Curvey is an interested person and currently serves as Chairman. The Trustees have determined that an interested Chairman is appropriate and benefits shareholders because an interested Chairman has a personal and professional stake in the quality and continuity of services provided to the fund. Independent Trustees exercise their informed business judgment to appoint an individual of their choosing to serve as Chairman, regardless of whether the Trustee happens to be independent or a member of management. The Independent Trustees have determined that they can act independently and effectively without having an Independent Trustee serve as Chairman and that a key structural component for assuring that they are in a position to do so is for the Independent Trustees to constitute a substantial majority for the Board. The Independent Trustees also regularly meet in executive session. Ned C. Lautenbach serves as Chairman of the Independent Trustees and as such (i) acts as a liaison between the Independent Trustees and management with respect to matters important to the Independent Trustees and (ii) with management prepares agendas for Board meetings.
Fidelity® funds are overseen by different Boards of Trustees. The fund's Board oversees Fidelity's high income and certain equity funds, and other Boards oversee Fidelity's investment-grade bond, money market, asset allocation, and other equity funds. The asset allocation funds may invest in Fidelity® funds overseen by the fund's Board. The use of separate Boards, each with its own committee structure, allows the Trustees of each group of Fidelity® funds to focus on the unique issues of the funds they oversee, including common research, investment, and operational issues. On occasion, the separate Boards establish joint committees to address issues of overlapping consequences for the Fidelity® funds overseen by each Board.
The Trustees operate using a system of committees to facilitate the timely and efficient consideration of all matters of importance to the Trustees, the fund, and fund shareholders and to facilitate compliance with legal and regulatory requirements and oversight of the fund's activities and associated risks. The Board, acting through its committees, has charged FMR and its affiliates with (i) identifying events or circumstances the occurrence of which could have demonstrably adverse effects on the fund's business and/or reputation; (ii) implementing processes and controls to lessen the possibility that such events or circumstances occur or to mitigate the effects of such events or circumstances if they do occur; and (iii) creating and maintaining a system designed to evaluate continuously business and market conditions in order to facilitate the identification and implementation processes described in (i) and (ii) above. Because the day-to-day operations and activities of the fund are carried out by or through FMR, its affiliates, and other service providers, the fund's exposure to risks is mitigated but not eliminated by the processes overseen by the Trustees. While each of the Board's committees has responsibility for overseeing different aspects of the fund's activities, oversight is exercised primarily through the Operations, Audit, and Compliance Committees. In addition, the Independent Trustees have worked with Fidelity to enhance the Board's oversight of investment and financial risks, legal and regulatory risks, technology risks, and operational risks, including the development of additional risk reporting to the Board. Appropriate personnel, including but not limited to the fund's Chief Compliance Officer (CCO), FMR's internal auditor, the independent accountants, the fund's Treasurer and portfolio management personnel, make periodic reports to the Board's committees, as appropriate, including an annual review of Fidelity's risk management program for the Fidelity® funds. The responsibilities of each standing committee, including their oversight responsibilities, are described further under "Standing Committees of the Trustees."
Interested Trustees*:
Correspondence intended for a Trustee who is an interested person may be sent to Fidelity Investments, 245 Summer Street, Boston, Massachusetts 02210.
Name, Year of Birth; Principal Occupations and Other Relevant Experience+
Jonathan Chiel (1957)
Year of Election or Appointment: 2016
Trustee
Mr. Chiel also serves as Trustee of other Fidelity® funds. Mr. Chiel is Executive Vice President and General Counsel for FMR LLC (diversified financial services company, 2012-present). Previously, Mr. Chiel served as general counsel (2004-2012) and senior vice president and deputy general counsel (2000-2004) for John Hancock Financial Services; a partner with Choate, Hall & Stewart (1996-2000) (law firm); and an Assistant United States Attorney for the United States Attorney’s Office of the District of Massachusetts (1986-95), including Chief of the Criminal Division (1993-1995). Mr. Chiel is a director on the boards of the Boston Bar Foundation and the Maimonides School.
James C. Curvey (1935)
Year of Election or Appointment: 2007
Trustee
Chairman of the Board of Trustees
Mr. Curvey also serves as Trustee of other Fidelity® funds. Mr. Curvey is Vice Chairman (2007-present) and Director of FMR LLC (diversified financial services company). In addition, Mr. Curvey is an Overseer Emeritus for the Boston Symphony Orchestra, a Director of Artis-Naples, and a Trustee of Brewster Academy in Wolfeboro, New Hampshire. Previously, Mr. Curvey served as a Director of Fidelity Research & Analysis Co. (investment adviser firm, 2009-2018), Director of Fidelity Investments Money Management, Inc. (investment adviser firm, 2009-2014) and a Director of FMR and FMR Co., Inc. (investment adviser firms, 2007-2014).
Charles S. Morrison (1960)
Year of Election or Appointment: 2014
Trustee
Mr. Morrison also serves as Trustee of other funds. He serves as President of Fidelity SelectCo, LLC (investment adviser firm, 2017-present) and Fidelity Management & Research Company (FMR) (investment adviser firm, 2016-present), a Director of Fidelity Investments Money Management, Inc. (FIMM) (investment adviser firm, 2014-present), Director of Fidelity SelectCo, LLC (investment adviser firm, 2014-present), President, Asset Management (2014-present), and is an employee of Fidelity Investments. Previously, Mr. Morrison served as Vice President of Fidelity's Fixed Income and Asset Allocation Funds (2012-2014), President, Fixed Income (2011-2014), Vice President of Fidelity's Money Market Funds (2005-2009), President, Money Market Group Leader of FMR (investment adviser firm, 2009), and Senior Vice President, Money Market Group of FMR (2004-2009). Mr. Morrison also served as Vice President of Fidelity's Bond Funds (2002-2005), certain Balanced Funds (2002-2005), and certain Asset Allocation Funds (2002-2007), and as Senior Vice President (2002-2005) of Fidelity's Bond Division.
* Determined to be an “Interested Trustee” by virtue of, among other things, his or her affiliation with the trust or various entities under common control with FMR.
+ The information includes the Trustee's principal occupation during the last five years and other information relating to the experience, attributes, and skills relevant to the Trustee's qualifications to serve as a Trustee, which led to the conclusion that the Trustee should serve as a Trustee for the fund.
Independent Trustees:
Correspondence intended for an Independent Trustee may be sent to Fidelity Investments, P.O. Box 55235, Boston, Massachusetts 02205-5235.
Name, Year of Birth; Principal Occupations and Other Relevant Experience+
Dennis J. Dirks (1948)
Year of Election or Appointment: 2005
Trustee
Mr. Dirks also serves as Trustee of other Fidelity® funds. Prior to his retirement in May 2003, Mr. Dirks was Chief Operating Officer and a member of the Board of The Depository Trust & Clearing Corporation (DTCC). He also served as President, Chief Operating Officer, and Board member of The Depository Trust Company (DTC) and President and Board member of the National Securities Clearing Corporation (NSCC). In addition, Mr. Dirks served as Chief Executive Officer and Board member of the Government Securities Clearing Corporation, Chief Executive Officer and Board member of the Mortgage-Backed Securities Clearing Corporation, as a Trustee and a member of the Finance Committee of Manhattan College (2005-2008), as a Trustee and a member of the Finance Committee of AHRC of Nassau County (2006-2008), as a member of the Independent Directors Council (IDC) Governing Council (2010-2015), and as a member of the Board of Directors for The Brookville Center for Children’s Services, Inc. (2009-2017). Mr. Dirks is a member of the Finance Committee (2016-present), Board of Directors (2017-present) and Board of Trustees (2018-present) and is Treasurer (2018-present) of the Asolo Repertory Theatre.
Donald F. Donahue (1950)
Year of Election or Appointment: 2018
Trustee
Mr. Donahue also serves as a Trustee of other Fidelity® funds. Mr. Donahue is President and Chief Executive Officer of Miranda Partners, LLC (risk consulting for the financial services industry, 2012-present). Previously, Mr. Donahue served as a Member of the Advisory Board of certain Fidelity® funds (2015-2018) and Chief Executive Officer (2006-2012), Chief Operating Officer (2003-2006), and Managing Director, Customer Marketing and Development (1999-2003) of The Depository Trust & Clearing Corporation (financial markets infrastructure). Mr. Donahue serves as a Member (2007-present) and Co-Chairman (2016-present) of the Board of Directors of United Way of New York, Member of the Board of Directors of NYC Leadership Academy (2012-present) and Member of the Board of Advisors of Ripple Labs, Inc. (financial services, 2015-present). He also served as Chairman (2010-2012) and Member of the Board of Directors (2012-2013) of Omgeo, LLC (financial services), Treasurer of United Way of New York (2012-2016), and Member of the Board of Directors of XBRL US (financial services non-profit, 2009-2012) and the International Securities Services Association (2009-2012).
Alan J. Lacy (1953)
Year of Election or Appointment: 2008
Trustee
Mr. Lacy also serves as Trustee of other Fidelity® funds. Mr. Lacy serves as a Director of Bristol-Myers Squibb Company (global pharmaceuticals, 2008-present). He is a Trustee of the California Chapter of The Nature Conservancy (2015-present) and a Director of the Center for Advanced Study in the Behavioral Sciences at Stanford University (2015-present). In addition, Mr. Lacy served as Senior Adviser (2007-2014) of Oak Hill Capital Partners, L.P. (private equity) and also served as Chief Executive Officer (2005) and Vice Chairman (2005-2006) of Sears Holdings Corporation (retail) and Chief Executive Officer and Chairman of the Board of Sears, Roebuck and Co. (retail, 2000-2005). Previously, Mr. Lacy served as Chairman (2014-2017) and a member (2010-2017) of the Board of Directors of Dave & Buster’s Entertainment, Inc. (restaurant and entertainment complexes), as Chairman (2008-2011) and a member (2006-2015) of the Board of Trustees of the National Parks Conservation Association, and as a member of the Board of Directors for The Hillman Companies, Inc. (hardware wholesalers, 2010-2014), Earth Fare, Inc. (retail grocery, 2010-2014), and The Western Union Company (global money transfer, 2006-2011).
Ned C. Lautenbach (1944)
Year of Election or Appointment: 2000
Trustee
Chairman of the Independent Trustees
Mr. Lautenbach also serves as Trustee of other Fidelity® funds. Mr. Lautenbach currently serves as Vice Chair of the Board of Governors, State University System of Florida (2013-present) and is a member of the Council on Foreign Relations (1994-present). He is also a member and has most recently served as Chairman of the Board of Directors of Artis-Naples (2012-present). Previously, Mr. Lautenbach served as a member and then Lead Director of the Board of Directors of Eaton Corporation (diversified industrial, 1997-2016). He was also a Partner and Advisory Partner at Clayton, Dubilier & Rice, LLC (private equity investment, 1998-2010), as well as a Director of Sony Corporation (2006-2007). In addition, Mr. Lautenbach also had a 30-year career with IBM (technology company) during which time he served as Senior Vice President and a member of the Corporate Executive Committee (1968-1998).
Joseph Mauriello (1944)
Year of Election or Appointment: 2008
Trustee
Mr. Mauriello also serves as Trustee of other Fidelity® funds. Prior to his retirement in January 2006, Mr. Mauriello served in numerous senior management positions including Deputy Chairman and Chief Operating Officer (2004-2005), and Vice Chairman of Financial Services (2002-2004) of KPMG LLP US (professional services, 1965-2005). Mr. Mauriello currently serves as a member of the Independent Directors Council (IDC) Governing Council (2015-present). Previously, Mr. Mauriello served as a member of the Board of Directors of XL Group plc. (global insurance and re-insurance, 2006-2018).
Cornelia M. Small (1944)
Year of Election or Appointment: 2005
Trustee
Ms. Small also serves as Trustee of other Fidelity® funds. Ms. Small is a member of the Board of Directors (2009-present) and Chair of the Investment Committee (2010-present) of the Teagle Foundation. Ms. Small also serves on the Investment Committee of the Berkshire Taconic Community Foundation (2008-present). Previously, Ms. Small served as Chairperson (2002-2008) and a member of the Investment Committee and Chairperson (2008-2012) and a member of the Board of Trustees of Smith College. In addition, Ms. Small served as Chief Investment Officer, Director of Global Equity Investments, and a member of the Board of Directors of Scudder, Stevens & Clark and Scudder Kemper Investments.
Garnett A. Smith (1947)
Year of Election or Appointment: 2018
Trustee
Mr. Smith also serves as Trustee of other Fidelity® funds. Prior to Mr. Smith's retirement, he served as Chairman and Chief Executive Officer of Inbrand Corp. (manufacturer of personal absorbent products, 1990-1997). He also served as President (1986-1990) of Inbrand Corp. Prior to his employment with Inbrand Corp., he was employed by a retail fabric chain and North Carolina National Bank. In addition, Mr. Smith served as a Member of the Advisory Board of certain Fidelity® funds (2012-2013) and as a board member of the Jackson Hole Land Trust (2009-2012).
David M. Thomas (1949)
Year of Election or Appointment: 2008
Trustee
Mr. Thomas also serves as Trustee of other Fidelity® funds. Mr. Thomas serves as Non-Executive Chairman of the Board of Directors of Fortune Brands Home and Security (home and security products, 2011-present), as a member of the Board of Directors (2004-present) and Presiding Director (2013-present) of Interpublic Group of Companies, Inc. (marketing communication), and as a member of the Board of Trustees of the University of Florida (2013-present). Previously, Mr. Thomas served as Executive Chairman (2005-2006) and Chairman and Chief Executive Officer (2000-2005) of IMS Health, Inc. (pharmaceutical and healthcare information solutions), and a Director of Fortune Brands, Inc. (consumer products, 2000-2011).
+ The information includes the Trustee's principal occupation during the last five years and other information relating to the experience, attributes, and skills relevant to the Trustee's qualifications to serve as a Trustee, which led to the conclusion that the Trustee should serve as a Trustee for the fund.
Advisory Board Members and Officers:
Correspondence intended for a Member of the Advisory Board (if any) may be sent to Fidelity Investments, P.O. Box 55235, Boston, Massachusetts 02205-5235. Correspondence intended for an officer or Peter S. Lynch may be sent to Fidelity Investments, 245 Summer Street, Boston, Massachusetts 02210. Officers appear below in alphabetical order.
Name, Year of Birth; Principal Occupation
Vicki L. Fuller (1957)
Year of Election or Appointment: 2018
Member of the Advisory Board
Ms. Fuller also serves as Member of the Advisory Board of other Fidelity® funds. Ms. Fuller serves as a member of the Board of Directors, Audit Committee, and Nominating and Governance Committee of The Williams Companies, Inc. (natural gas infrastructure, 2018-present). Previously, Ms. Fuller served as the Chief Investment Officer of the New York State Common Retirement Fund (2012-2018) and held a variety of positions at AllianceBernstein L.P. (global asset management, 1985-2012), including Managing Director (2006-2012) and Senior Vice President and Senior Portfolio Manager (2001-2006).
Peter S. Lynch (1944)
Year of Election or Appointment: 2003
Member of the Advisory Board
Mr. Lynch also serves as Member of the Advisory Board of other Fidelity® funds. Mr. Lynch is Vice Chairman and a Director of FMR (investment adviser firm) and FMR Co., Inc. (investment adviser firm). In addition, Mr. Lynch serves as a Trustee of Boston College and as the Chairman of the Inner-City Scholarship Fund. Previously, Mr. Lynch served on the Special Olympics International Board of Directors (1997-2006).
William S. Stavropoulos (1939)
Year of Election or Appointment: 2018
Member of the Advisory Board
Mr. Stavropoulos also serves as Member of the Advisory Board of other Fidelity® funds. Mr. Stavropoulos serves as President and Founder of the Michigan Baseball Foundation, the Great Lakes Loons (2007-present). Mr. Stavropoulos is Chairman Emeritus of the Board of Directors of The Dow Chemical Company, where he previously served in numerous senior management positions, including President, CEO (1995-2000; 2002-2004), Chairman of the Executive Committee (2000-2006), and as a member of the Board of Directors (1990-2006). Currently, Mr. Stavropoulos is Chairman of the Board of Directors of Univar Inc. (global distributor of commodity and specialty chemicals), a Director of Teradata Corporation (data warehousing and technology solutions), and a member of the Advisory Board for Metalmark Capital LLC (private equity investment, 2005-present). Mr. Stavropoulos is an operating advisor to Clayton, Dubilier & Rice, LLC (private equity investment). In addition, Mr. Stavropoulos is a member of the University of Notre Dame Advisory Council for the College of Science, a Trustee of the Rollin L. Gerstacker Foundation, and a Director of Artis-Naples in Naples, Florida. Previously, Mr. Stavropoulos served as Trustee of certain Fidelity® funds (2001-2018) and as a Director of Chemical Financial Corporation (bank holding company, 1993-2012) and Tyco International, Ltd. (multinational manufacturing and services, 2007-2012).
Carol B. Tomé (1957)
Year of Election or Appointment: 2018
Member of the Advisory Board
Ms. Tomé also serves as Member of the Advisory Board of other Fidelity® funds. Ms. Tomé is Chief Financial Officer (2001-present) and Executive Vice President of Corporate Services (2007-present) of The Home Depot, Inc. (home improvement retailer) and a Director (2003-present) and Chair of the Audit Committee (2004-present) of United Parcel Service, Inc. (package delivery and supply chain management). Previously, Ms. Tomé served as Trustee of certain Fidelity® funds (2017), Senior Vice President of Finance and Accounting/Treasurer (2000-2007) and Vice President and Treasurer (1995-2000) of The Home Depot, Inc. and Chair of the Board (2010-2012), Vice Chair of the Board (2009 and 2013), and a Director (2008-2013) of the Federal Reserve Bank of Atlanta. Ms. Tomé is also a director or trustee of many community and professional organizations.
Michael E. Wiley (1950)
Year of Election or Appointment: 2018
Member of the Advisory Board
Mr. Wiley also serves as Trustee or Member of the Advisory Board of other Fidelity® funds. Mr. Wiley serves as a Director of High Point Resources (exploration and production, 2005-present). Previously, Mr. Wiley served as a Director of Andeavor Corporation (independent oil refiner and marketer, 2005-2018), a Director of Andeavor Logistics LP (natural resources logistics, 2015-2018), a Director of Post Oak Bank (privately-held bank, 2004-2018), a Director of Asia Pacific Exploration Consolidated (international oil and gas exploration and production, 2008-2013), a member of the Board of Trustees of the University of Tulsa (2000-2006; 2007-2010), a Senior Energy Advisor of Katzenbach Partners, LLC (consulting, 2006-2007), an Advisory Director of Riverstone Holdings (private investment), a Director of Spinnaker Exploration Company (exploration and production, 2001-2005) and Chairman, President, and CEO of Baker Hughes, Inc. (oilfield services, 2000-2004).
Elizabeth Paige Baumann (1968)
Year of Election or Appointment: 2017
Anti-Money Laundering (AML) Officer
Ms. Baumann also serves as AML Officer of other funds. She is Chief AML Officer (2012-present) and Senior Vice President (2014-present) of FMR LLC (diversified financial services company) and is an employee of Fidelity Investments. Previously, Ms. Baumann served as AML Officer of the funds (2012-2016), and Vice President (2007-2014) and Deputy Anti-Money Laundering Officer (2007-2012) of FMR LLC.
John J. Burke III (1964)
Year of Election or Appointment: 2018
Chief Financial Officer
Mr. Burke also serves as Chief Financial Officer of other funds. Mr. Burke serves as Head of Investment Operations for Fidelity Fund and Investment Operations (2018-present) and is an employee of Fidelity Investments (1998-present). Previously Mr. Burke served as head of Asset Management Investment Operations (2012-2018).
William C. Coffey (1969)
Year of Election or Appointment: 2018
Secretary and Chief Legal Officer (CLO)
Mr. Coffey also serves as Secretary and CLO of other funds. Mr. Coffey serves as CLO, Secretary, and Senior Vice President of Fidelity Management & Research Company and FMR Co., Inc. (investment adviser firms, 2018-present); Secretary of Fidelity SelectCo, LLC and Fidelity Investments Money Management, Inc. (investment adviser firms, 2018-present); and CLO of Fidelity Management & Research (Hong Kong) Limited, FMR Investment Management (UK) Limited, and Fidelity Management & Research (Japan) Limited (investment adviser firms, 2018-present). He is Senior Vice President and Deputy General Counsel of FMR LLC (diversified financial services company, 2010-present), and is an employee of Fidelity Investments. Previously, Mr. Coffey served as Assistant Secretary of certain funds (2009-2018) and as Vice President and Associate General Counsel of FMR LLC (2005-2009).
Timothy M. Cohen (1969)
Year of Election or Appointment: 2018
Vice President
Mr. Cohen also serves as Vice President of other funds. Mr. Cohen serves as Co-Head of Global Equity Research (2016-present), a Director of Fidelity Management & Research (Japan) Limited (investment adviser firm, 2016-present), and is an employee of Fidelity Investments. Previously, Mr. Cohen served as Chief Investment Officer - Equity and a Director of Fidelity Management & Research (U.K.) Inc. (investment adviser firm, 2013-2015) and as a Director of Fidelity Management & Research (Hong Kong) Limited (investment adviser firm, 2017).
Jonathan Davis (1968)
Year of Election or Appointment: 2010
Assistant Treasurer
Mr. Davis also serves as Assistant Treasurer of other funds. Mr. Davis serves as Assistant Treasurer of FMR Capital, Inc. (2017-present) and is an employee of Fidelity Investments. Previously, Mr. Davis served as Vice President and Associate General Counsel of FMR LLC (diversified financial services company, 2003-2010).
Adrien E. Deberghes (1967)
Year of Election or Appointment: 2016
Assistant Treasurer
Mr. Deberghes also serves as an officer of other funds. He serves as Assistant Treasurer of FMR Capital, Inc. (2017-present), Executive Vice President of Fidelity Investments Money Management, Inc. (FIMM) (investment adviser firm, 2016-present), and is an employee of Fidelity Investments (2008-present). Previously, Mr. Deberghes served as President and Treasurer of certain Fidelity® funds (2013-2018). Prior to joining Fidelity Investments, Mr. Deberghes was Senior Vice President of Mutual Fund Administration at State Street Corporation (2007-2008), Senior Director of Mutual Fund Administration at Investors Bank & Trust (2005-2007), and Director of Finance for Dunkin' Brands (2000-2005). Previously, Mr. Deberghes served in other fund officer roles.
Laura M. Del Prato (1964)
Year of Election or Appointment: 2018
Assistant Treasurer
Ms. Del Prato also serves as an officer of other funds. Ms. Del Prato is an employee of Fidelity Investments (2017-present). Prior to joining Fidelity Investments, Ms. Del Prato served as a Managing Director and Treasurer of the JPMorgan Mutual Funds (2014-2017). Prior to JPMorgan, Ms. Del Prato served as a partner at Cohen Fund Audit Services (accounting firm, 2012-2013) and KPMG LLP (accounting firm, 2004-2012).
Colm A. Hogan (1973)
Year of Election or Appointment: 2016
Deputy Treasurer
Mr. Hogan also serves as an officer of other funds. Mr. Hogan serves as Assistant Treasurer of FMR Capital, Inc. (2017-present) and is an employee of Fidelity Investments (2005-present). Previously, Mr. Hogan served as Assistant Treasurer of certain Fidelity® funds (2016-2018).
Pamela R. Holding (1964)
Year of Election or Appointment: 2018
Vice President
Ms. Holding also serves as Vice President of other funds. Ms. Holding serves as Co-Head of Global Equity Research (2018-present) and is an employee of Fidelity Investments (2013-present).
Chris Maher (1972)
Year of Election or Appointment: 2013
Assistant Treasurer
Mr. Maher serves as Assistant Treasurer of other funds. Mr. Maher is Vice President of Valuation Oversight, serves as Assistant Treasurer of FMR Capital, Inc. (2017-present), and is an employee of Fidelity Investments. Previously, Mr. Maher served as Vice President of Asset Management Compliance (2013), Vice President of the Program Management Group of FMR (investment adviser firm, 2010-2013), and Vice President of Valuation Oversight (2008-2010).
Rieco E. Mello (1969)
Year of Election or Appointment: 2017
Assistant Treasurer
Mr. Mello also serves as Assistant Treasurer of other funds. Mr. Mello serves as Assistant Treasurer of FMR Capital, Inc. (2017-present) and is an employee of Fidelity Investments (1995-present).
Kenneth B. Robins (1969)
Year of Election or Appointment: 2016
Chief Compliance Officer
Mr. Robins also serves as an officer of other funds. Mr. Robins serves as Compliance Officer of Fidelity Management & Research Company and FMR Co., Inc. (investment adviser firms, 2016-present) and is an employee of Fidelity Investments (2004-present). Previously, Mr. Robins served as Executive Vice President of Fidelity Investments Money Management, Inc. (investment adviser firm, 2013-2016) and served in other fund officer roles.
Stacie M. Smith (1974)
Year of Election or Appointment: 2016
President and Treasurer
Ms. Smith also serves as an officer of other funds. Ms. Smith serves as Assistant Treasurer of FMR Capital, Inc. (2017-present), is an employee of Fidelity Investments (2009-present), and has served in other fund officer roles. Prior to joining Fidelity Investments, Ms. Smith served as Senior Audit Manager of Ernst & Young LLP (accounting firm, 1996-2009). Previously, Ms. Smith served as Assistant Treasurer (2013-2018) and Deputy Treasurer (2013-2016) of certain Fidelity® funds.
Marc L. Spector (1972)
Year of Election or Appointment: 2016
Assistant Treasurer
Mr. Spector also serves as an officer of other funds. Mr. Spector serves as Assistant Treasurer of FMR Capital, Inc. (2017-present) and is an employee of Fidelity Investments (2016-present). Prior to joining Fidelity Investments, Mr. Spector served as Director at the Siegfried Group (accounting firm, 2013-2016), and prior to Siegfried Group as audit senior manager at Deloitte & Touche (accounting firm, 2005-2013).
Shareholder Expense Example
As a shareholder of a Fund, you incur two types of costs: (1) transaction costs, including sales charges (loads) on purchase payments or redemption proceeds, and (2) ongoing costs, including distribution and/or service (12b-1) fees and other Fund expenses. This Example is intended to help you understand your ongoing costs (in dollars) of investing in the Funds and to compare these costs with the ongoing costs of investing in other mutual funds.
The Example is based on an investment of $1,000 invested at the beginning of the period and held for the entire period (May 1, 2018 to October 31, 2018).
Actual Expenses
The first line of the accompanying table for each class of the Fund provides information about actual account values and actual expenses. You may use the information in this line, together with the amount you invested, to estimate the expenses that you paid over the period. Simply divide your account value by $1,000.00 (for example, an $8,600 account value divided by $1,000.00 = 8.6), then multiply the result by the number in the first line for a class of the Fund under the heading entitled "Expenses Paid During Period" to estimate the expenses you paid on your account during this period. A small balance maintenance fee of $12.00 that is charged once a year may apply for certain accounts with a value of less than $2,000. This fee, which was eliminated effective August 1, 2018, is not included in the table below. If it was, the estimate of expenses you paid during the period would be higher, and your ending account value lower, by this amount. In addition, the Fund, as a shareholder in the underlying Fidelity Central Funds, will indirectly bear its pro-rata share of the fees and expenses incurred by the underlying Fidelity Central Funds. These fees and expenses are not included in the Fund's annualized expense ratio used to calculate the expense estimate in the table below.
Hypothetical Example for Comparison Purposes
The second line of the accompanying table for each class of the Fund provides information about hypothetical account values and hypothetical expenses based on a Class' actual expense ratio and an assumed rate of return of 5% per year before expenses, which is not the Class' actual return. The hypothetical account values and expenses may not be used to estimate the actual ending account balance or expenses you paid for the period. You may use this information to compare the ongoing costs of investing in the Fund and other funds. To do so, compare this 5% hypothetical example with the 5% hypothetical examples that appear in the shareholder reports of the other funds. A small balance maintenance fee of $12.00 that is charged once a year may apply for certain accounts with a value of less than $2,000. This fee, which was eliminated effective August 1, 2018, is not included in the table below. If it was, the estimate of expenses you paid during the period would be higher, and your ending account value lower, by this amount. In addition, the Fund, as a shareholder in the underlying Fidelity Central Funds, will indirectly bear its pro-rata share of the fees and expenses incurred by the underlying Fidelity Central Funds. These fees and expenses are not included in the Fund's annualized expense ratio used to calculate the expense estimate in the table below.
Please note that the expenses shown in the table are meant to highlight your ongoing costs only and do not reflect any transaction costs. Therefore, the second line of the table is useful in comparing ongoing costs only, and will not help you determine the relative total costs of owning different funds. In addition, if these transactional costs were included, your costs would have been higher.
| | Annualized Expense Ratio-A | Beginning
Account Value
May 1, 2018 | Ending
Account Value
October 31, 2018 | Expenses Paid
During Period-B
May 1, 2018
to October 31, 2018 |
| Class A | 1.16% | | | |
| Actual | | $1,000.00 | $886.50 | $5.52 |
| Hypothetical-C | | $1,000.00 | $1,019.36 | $5.90 |
| Class M | 1.41% | | | |
| Actual | | $1,000.00 | $885.40 | $6.70 |
| Hypothetical-C | | $1,000.00 | $1,018.10 | $7.17 |
| Class C | 1.95% | | | |
| Actual | | $1,000.00 | $883.20 | $9.26 |
| Hypothetical-C | | $1,000.00 | $1,015.38 | $9.91 |
| International Discovery | .83% | | | |
| Actual | | $1,000.00 | $888.10 | $3.95 |
| Hypothetical-C | | $1,000.00 | $1,021.02 | $4.23 |
| Class K | .72% | | | |
| Actual | | $1,000.00 | $888.70 | $3.43 |
| Hypothetical-C | | $1,000.00 | $1,021.58 | $3.67 |
| Class I | .86% | | | |
| Actual | | $1,000.00 | $888.10 | $4.09 |
| Hypothetical-C | | $1,000.00 | $1,020.87 | $4.38 |
| Class Z | .73% | | | |
| Actual | | $1,000.00 | $888.60 | $3.48 |
| Hypothetical-C | | $1,000.00 | $1,021.53 | $3.72 |
A Annualized expense ratio reflects expenses net of applicable fee waivers.
B Expenses are equal to each Class' annualized expense ratio, multiplied by the average account value over the period, multiplied by 184/365 (to reflect the one-half year period).
C 5% return per year before expenses
Distributions (Unaudited)
The Board of Trustees of Fidelity International Discovery fund voted to pay to shareholders of record at the opening of business on record date, the following distributions per share derived from capital gains realized from sales of portfolio securities, and dividends derived from net investment income:
| | Pay Date | Record Date | Dividends | Capital Gains |
| Fidelity International Discovery Fund | | | | |
| Class A | 12/10/18 | 12/07/18 | $0.327 | $0.913 |
| Class M | 12/10/18 | 12/07/18 | $0.222 | $0.913 |
| Class C | 12/10/18 | 12/07/18 | $0.000 | $0.913 |
| International Discovery | 12/10/18 | 12/07/18 | $0.491 | $0.913 |
| Class K | 12/10/18 | 12/07/18 | $0.541 | $0.913 |
| Class I | 12/10/18 | 12/07/18 | $0.481 | $0.913 |
| Class Z | 12/10/18 | 12/07/18 | $0.542 | $0.913 |
|
The fund hereby designates as a capital gain dividend with respect to the taxable year ended October 31, 2017, $245,764,979, or, if subsequently determined to be different, the net capital gain of such year.
Class A designates 2%; Class M designates 3%; Class C designates 9%; International Discovery designates 2%; Class K designates 1%; Class I designates 2% and Class Z designates 1% of the dividends distributed during the fiscal year as qualifying for the dividends–received deduction for corporate shareholders.
Class A, Class M, Class C, International Discovery, Class K, Class I and Class Z designate 100% of the dividends distributed during the fiscal year as amounts which may be taken into account as a dividend for purposes of the maximum rate under section 1(h)(11) of the Internal Revenue Code.
The amounts per share which represent income derived from sources within, and taxes paid to, foreign countries or possessions of the United States are as follows:
| | Pay Date | Income | Taxes |
| Fidelity International Discovery Fund | | | |
| Class A | 12/11/17 | $0.4263 | $0.0563 |
| Class M | 12/11/17 | $0.3263 | $0.0563 |
| Class C | 12/11/17 | $0.1083 | $0.0563 |
| International Discovery | 12/11/17 | $0.5883 | $0.0563 |
| Class K | 12/11/17 | $0.6403 | $0.0563 |
| Class I | 12/11/17 | $0.5763 | $0.0563 |
| Class Z | 12/11/17 | $0.6413 | $0.0563 |
|
The fund will notify shareholders in January 2019 of amounts for use in preparing 2018 income tax returns.
Board Approval of Investment Advisory Contracts
Fidelity International Discovery Fund
At its July 2018 meeting, the Board of Trustees, including the Independent Trustees (together, the Board), voted to continue the management contract with Fidelity Management & Research Company (FMR) and the sub-advisory agreements (together, the Advisory Contracts) for the fund for six months through January 31, 2019, in connection with the reunification of the Fidelity Equity High Income Funds Board, which oversees the fund, and the Sector Portfolios Board.
The Board considered that the approval of the fund's Advisory Contracts will not result in any changes in (i) the investment process or strategies employed in the management of the fund's assets; (ii) the fees and expenses paid by shareholders; (iii) the nature, extent or quality of services provided under the fund's Advisory Contracts; or (iv) the day-to-day management of the fund or the persons primarily responsible for such management. The Board concluded that the fund's Advisory Contracts are fair and reasonable, and that the fund's Advisory Contracts should be renewed, without modification, through January 31, 2019, with the understanding that the Board will consider the annual renewal for a full one year period in January 2019.
In connection with its consideration of future renewals of the fund's Advisory Contracts, the Board will consider: (i) the nature, extent and quality of services provided to the fund, including shareholder and administrative services and investment performance; (ii) the competitiveness of the management fee and total expenses for the fund; (iii) the costs of the services and profitability, including the revenues earned and the expenses incurred in conducting the business of developing, marketing, distributing, managing, administering, and servicing the fund and its shareholders, to the extent applicable, as well as potential fall-out benefits from Fidelity's non-fund businesses; and (iv) whether there have been economies of scale in respect of the Fidelity funds, whether the Fidelity funds (including the fund) have appropriately benefited from any such economies of scale, and whether there is the potential for realization of any further economies.
Based on its evaluation of all of the conclusions noted above, and after considering all factors it believed relevant, the Board ultimately concluded that the fund's management fee structure is fair and reasonable, and that the continuation of the fund's Advisory Contracts should be approved.
Corporate Headquarters
245 Summer St.
Boston, MA 02210
www.fidelity.com
IGI-K-ANN-1218
1.863307.110
Fidelity® Diversified International K6 Fund
Annual Report October 31, 2018 |
|
Contents
To view a fund's proxy voting guidelines and proxy voting record for the 12-month period ended June 30, visit http://www.fidelity.com/proxyvotingresults or visit the Securities and Exchange Commission's (SEC) web site at http://www.sec.gov.
You may also call 1-800-835-5092 to request a free copy of the proxy voting guidelines.
Standard & Poor's, S&P and S&P 500 are registered service marks of The McGraw-Hill Companies, Inc. and have been licensed for use by Fidelity Distributors Corporation.
Other third-party marks appearing herein are the property of their respective owners.
All other marks appearing herein are registered or unregistered trademarks or service marks of FMR LLC or an affiliated company. © 2018 FMR LLC. All rights reserved.
This report and the financial statements contained herein are submitted for the general information of the shareholders of the Fund. This report is not authorized for distribution to prospective investors in the Fund unless preceded or accompanied by an effective prospectus.
A fund files its complete schedule of portfolio holdings with the SEC for the first and third quarters of each fiscal year on Form N-Q. Forms N-Q are available on the SEC’s web site at http://www.sec.gov. A fund's Forms N-Q may be reviewed and copied at the SEC’s Public Reference Room in Washington, DC. Information regarding the operation of the SEC's Public Reference Room may be obtained by calling 1-800-SEC-0330.
For a complete list of a fund's portfolio holdings, view the most recent holdings listing, semiannual report, or annual report on Fidelity's web site at http://www.fidelity.com, http://www.institutional.fidelity.com, or http://www.401k.com, as applicable.
NOT FDIC INSURED •MAY LOSE VALUE •NO BANK GUARANTEE
Neither the Fund nor Fidelity Distributors Corporation is a bank.
Performance: The Bottom Line
Average annual total return reflects the change in the value of an investment, assuming reinvestment of distributions from dividend income and capital gains (the profits earned upon the sale of securities that have grown in value, if any) and assuming a constant rate of performance each year. The hypothetical investment and the average annual total returns do not reflect the deduction of taxes that a shareholder would pay on fund distributions or the redemption of fund shares. During periods of reimbursement by Fidelity, a fund’s total return will be greater than it would be had the reimbursement not occurred. How a fund did yesterday is no guarantee of how it will do tomorrow.
Average Annual Total Returns
| For the periods ended October 31, 2018 | Past 1 year | Life of fundA |
| Fidelity® Diversified International K6 Fund | (8.83)% | (2.04)% |
A From May 25, 2017
$10,000 Over Life of Fund
Let's say hypothetically that $10,000 was invested in Fidelity® Diversified International K6 Fund on May 25, 2017, when the fund started.
The chart shows how the value of your investment would have changed, and also shows how the MSCI EAFE Index performed over the same period.
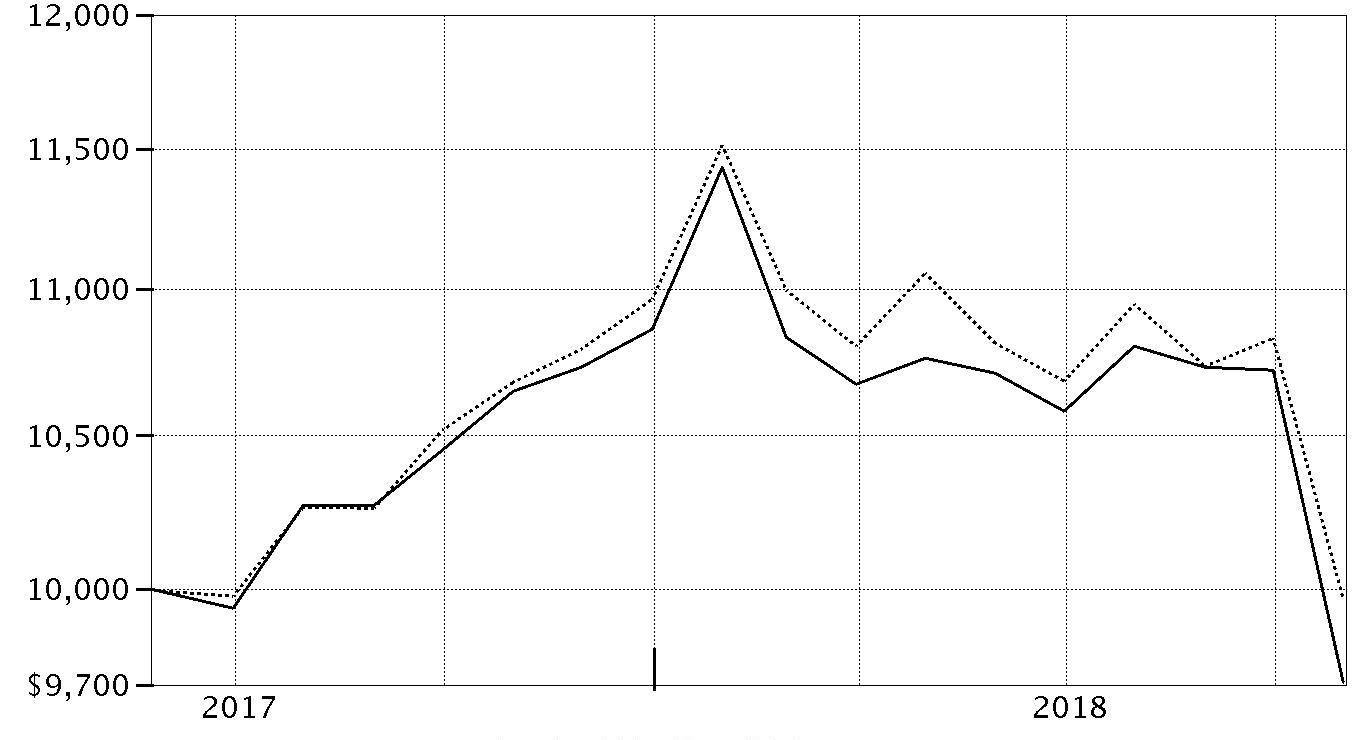
| Period Ending Values |
| $9,709 | Fidelity® Diversified International K6 Fund |
| $9,968 | MSCI EAFE Index |
Management's Discussion of Fund Performance
Market Recap: International equities returned -8.08% for the 12 months ending October 31, 2018, according to the MSCI ACWI (All Country World Index) ex USA Index. A modestly positive first half of the period gave way to a confluence of overwhelmingly negative factors – including escalating trade tensions, a surging U.S. dollar, tepid economic growth in Europe, global central bank tightening, concerns about Italy’s budget stalemate with the EU, and weakness in China’s stock market – that yielded a -11% second-half return. The index lost 8% in October alone, its largest monthly drop in more than six years. Among sectors, new-media-infused communications services (-15%) was hit the hardest, while economically sensitive consumer discretionary (-13%), information technology (-12%), financials (-10%), industrials (-9%) and materials (-7%) stocks also fared poorly. Even the more defensive real estate (-9%), utilities (-6%) and consumer staples (-5%) sectors weren’t spared this period. Conversely, elevated crude-oil prices fueled a positive return for energy (+7%), the top-performing sector, followed by the relatively stable-growing health care segment (+2%). Regionally, emerging markets (-12%) fared the worst, hampered by the impact of foreign exchange and concerns about economic weakness in China, India and South Korea. Sluggish growth also pressured shares in continental Europe (-9%). Stocks in Japan (-3%) and the U.K. (-4%) held up better, followed by Canada (-5%) and Asia-Pacific ex Japan (-6%).
Comments from Portfolio Manager William Bower: For the fiscal year, the fund returned -8.83%, trailing the -6.65% return of the benchmark MSCI EAFE Index. Versus the benchmark, security selection – notably in the consumer staples and health care sectors – detracted from performance, as did positioning in financials and energy. Geographically, stock picks in the U.K. and Japan held back the fund's performance versus the index. Individual disappointments included U.K.-based software company Micro Focus International. Shares of the company returned -54% for the period, largely because a recent acquisition proved challenging, with revenue declining faster than anticipated amid heavy sales-force attrition. In Japan, an average overweighting in semiconductor manufacturer Renesas Electronics hurt, as excess industry capacity and weakening end-market demand pressured the stock, which returned roughly -58%. Not owning index heavyweight Royal Dutch Shell was another notable detractor, as shares of the Anglo-Dutch multinational oil and gas giant advanced about 8% on higher oil prices and solid quarterly financial results. Conversely, security selection in information technology and materials added modest value. Top individual contributors included Norway-based exploration and production company Equinor (formerly Statoil), a top holding that benefited from higher crude-oil prices. By region, non-index exposure to the U.S. was helpful, led by stakes in payment-processing firms Mastercard and Visa, which returned about 34% and 26%, respectively.
The views expressed above reflect those of the portfolio manager(s) only through the end of the period as stated on the cover of this report and do not necessarily represent the views of Fidelity or any other person in the Fidelity organization. Any such views are subject to change at any time based upon market or other conditions and Fidelity disclaims any responsibility to update such views. These views may not be relied on as investment advice and, because investment decisions for a Fidelity fund are based on numerous factors, may not be relied on as an indication of trading intent on behalf of any Fidelity fund.
Investment Summary (Unaudited)
Geographic Diversification (% of fund's net assets)
| As of October 31, 2018 |
| | Japan | 17.0% |
| | United Kingdom | 15.9% |
| | United States of America* | 14.0% |
| | Germany | 8.3% |
| | France | 7.3% |
| | Switzerland | 4.7% |
| | Netherlands | 4.4% |
| | Canada | 3.3% |
| | India | 3.1% |
| | Other | 22.0% |

* Includes Short-Term investments and Net Other Assets (Liabilities).
Percentages are based on country or territory of incorporation and are adjusted for the effect of futures contracts, if applicable.
Asset Allocation as of October 31, 2018
| | % of fund's net assets |
| Stocks | 92.8 |
| Short-Term Investments and Net Other Assets (Liabilities) | 7.2 |
Top Ten Stocks as of October 31, 2018
| | % of fund's net assets |
| Roche Holding AG (participation certificate) (Switzerland, Pharmaceuticals) | 1.4 |
| Prudential PLC (United Kingdom, Insurance) | 1.4 |
| ORIX Corp. (Japan, Diversified Financial Services) | 1.4 |
| SAP SE (Germany, Software) | 1.3 |
| British American Tobacco PLC sponsored ADR (United Kingdom, Tobacco) | 1.3 |
| Keyence Corp. (Japan, Electronic Equipment & Components) | 1.3 |
| Hoya Corp. (Japan, Health Care Equipment & Supplies) | 1.3 |
| Unilever NV (Certificaten Van Aandelen) (Bearer) (Netherlands, Personal Products) | 1.3 |
| Equinor ASA (Norway, Oil, Gas & Consumable Fuels) | 1.2 |
| AstraZeneca PLC (United Kingdom) (United Kingdom, Pharmaceuticals) | 1.2 |
| | 13.1 |
Top Market Sectors as of October 31, 2018
| | % of fund's net assets |
| Financials | 24.0 |
| Industrials | 14.5 |
| Health Care | 12.7 |
| Information Technology | 11.2 |
| Consumer Staples | 10.3 |
| Consumer Discretionary | 7.9 |
| Energy | 4.4 |
| Materials | 4.0 |
| Communication Services | 3.1 |
| Real Estate | 0.4 |
Schedule of Investments October 31, 2018
Showing Percentage of Net Assets
| Common Stocks - 92.1% | | | |
| | | Shares | Value |
| Australia - 0.8% | | | |
| CSL Ltd. | | 84,569 | $11,258,857 |
| Magellan Financial Group Ltd. | | 358,006 | 6,753,825 |
|
| TOTAL AUSTRALIA | | | 18,012,682 |
|
| Bailiwick of Jersey - 1.8% | | | |
| Ferguson PLC | | 284,098 | 19,184,373 |
| Glencore Xstrata PLC | | 1,204,432 | 4,908,712 |
| Shire PLC | | 250,574 | 15,122,376 |
|
| TOTAL BAILIWICK OF JERSEY | | | 39,215,461 |
|
| Belgium - 1.1% | | | |
| KBC Groep NV | | 295,075 | 20,353,797 |
| Umicore SA | | 73,469 | 3,460,898 |
|
| TOTAL BELGIUM | | | 23,814,695 |
|
| Bermuda - 1.4% | | | |
| Credicorp Ltd. (United States) | | 47,093 | 10,629,361 |
| Hiscox Ltd. | | 558,135 | 11,614,285 |
| IHS Markit Ltd. (a) | | 166,850 | 8,764,631 |
|
| TOTAL BERMUDA | | | 31,008,277 |
|
| Canada - 3.3% | | | |
| Alimentation Couche-Tard, Inc. Class B (sub. vtg.) | | 525,580 | 25,100,243 |
| CCL Industries, Inc. Class B | | 49,382 | 2,077,386 |
| Cenovus Energy, Inc. (Canada) | | 1,184,044 | 10,019,560 |
| Constellation Software, Inc. | | 9,078 | 6,247,680 |
| Fairfax India Holdings Corp. (a)(b) | | 603,642 | 7,660,217 |
| PrairieSky Royalty Ltd. | | 19,851 | 301,584 |
| Suncor Energy, Inc. | | 622,371 | 20,877,286 |
|
| TOTAL CANADA | | | 72,283,956 |
|
| Cayman Islands - 0.7% | | | |
| Alibaba Group Holding Ltd. sponsored ADR (a) | | 61,188 | 8,705,829 |
| ENN Energy Holdings Ltd. | | 427,777 | 3,635,746 |
| Shenzhou International Group Holdings Ltd. | | 104,000 | 1,148,490 |
| Zai Lab Ltd. ADR (a) | | 76,628 | 1,253,634 |
|
| TOTAL CAYMAN ISLANDS | | | 14,743,699 |
|
| China - 0.7% | | | |
| Kweichow Moutai Co. Ltd. (A Shares) | | 64,477 | 5,073,567 |
| Ping An Insurance (Group) Co. of China Ltd. (H Shares) | | 564,945 | 5,320,257 |
| Shanghai International Airport Co. Ltd. (A Shares) | | 582,647 | 4,138,705 |
| Tonghua Dongbao Pharmaceutical Co. Ltd. Class A | | 601,909 | 1,154,522 |
|
| TOTAL CHINA | | | 15,687,051 |
|
| Denmark - 0.6% | | | |
| DONG Energy A/S (b) | | 17,353 | 1,102,526 |
| Netcompany Group A/S | | 84,800 | 2,804,609 |
| NNIT A/S (b) | | 45,405 | 1,282,140 |
| Novozymes A/S Series B | | 151,313 | 7,477,323 |
| SimCorp A/S | | 3,619 | 278,833 |
|
| TOTAL DENMARK | | | 12,945,431 |
|
| Finland - 0.8% | | | |
| Nordea Bank ABP (a) | | 1,129,878 | 9,826,851 |
| Sampo Oyj (A Shares) | | 190,937 | 8,793,326 |
|
| TOTAL FINLAND | | | 18,620,177 |
|
| France - 7.3% | | | |
| Aeroports de Paris | | 31,986 | 6,698,732 |
| Amundi SA (b) | | 245,668 | 14,630,693 |
| BNP Paribas SA | | 344,596 | 18,004,846 |
| Capgemini SA | | 128,849 | 15,761,609 |
| Danone SA | | 45,846 | 3,246,511 |
| Eiffage SA | | 43,399 | 4,248,051 |
| Elis SA | | 341,877 | 6,904,257 |
| Kering SA | | 11,921 | 5,314,513 |
| LVMH Moet Hennessy - Louis Vuitton SA | | 65,974 | 20,016,870 |
| Maisons du Monde SA (b) | | 42,353 | 1,062,081 |
| Sanofi SA | | 291,789 | 26,074,432 |
| Societe Generale Series A | | 257,793 | 9,450,112 |
| SR Teleperformance SA | | 36,534 | 6,024,962 |
| Thales SA | | 58,004 | 7,423,900 |
| VINCI SA (c) | | 170,039 | 15,133,364 |
|
| TOTAL FRANCE | | | 159,994,933 |
|
| Germany - 7.6% | | | |
| adidas AG | | 61,476 | 14,483,205 |
| Allianz SE | | 31,180 | 6,495,416 |
| Aumann AG (b) | | 40,285 | 1,989,416 |
| Axel Springer Verlag AG | | 10,766 | 715,794 |
| Bayer AG | | 226,273 | 17,344,382 |
| Deutsche Borse AG | | 45,274 | 5,721,392 |
| Deutsche Post AG | | 345,349 | 10,904,488 |
| Fresenius SE & Co. KGaA | | 258,573 | 16,433,821 |
| Hannover Reuck SE | | 64,735 | 8,732,662 |
| Linde PLC | | 116,454 | 19,105,950 |
| Merck KGaA | | 12,696 | 1,360,647 |
| Morphosys AG (a) | | 18,700 | 1,732,569 |
| Morphosys AG sponsored ADR | | 118,700 | 2,732,474 |
| MTU Aero Engines Holdings AG | | 10,857 | 2,309,411 |
| Rational AG | | 2,690 | 1,559,976 |
| SAP SE | | 272,936 | 29,224,211 |
| Scout24 AG (b) | | 109,644 | 4,552,742 |
| Symrise AG | | 127,384 | 10,699,915 |
| Vonovia SE | | 148,846 | 6,814,425 |
| Wirecard AG | | 22,669 | 4,246,817 |
|
| TOTAL GERMANY | | | 167,159,713 |
|
| Hong Kong - 1.8% | | | |
| AIA Group Ltd. | | 3,551,446 | 26,878,305 |
| BOC Hong Kong (Holdings) Ltd. | | 1,437,016 | 5,369,145 |
| Techtronic Industries Co. Ltd. | | 1,664,093 | 7,787,886 |
|
| TOTAL HONG KONG | | | 40,035,336 |
|
| India - 3.1% | | | |
| Adani Ports & Special Economic Zone Ltd. | | 840,675 | 3,624,246 |
| Axis Bank Ltd. (a) | | 543,679 | 4,281,215 |
| Godrej Consumer Products Ltd. | | 188,398 | 1,846,407 |
| HDFC Bank Ltd. | | 696,930 | 18,092,487 |
| Housing Development Finance Corp. Ltd. | | 719,763 | 17,217,965 |
| Kotak Mahindra Bank Ltd. | | 318,258 | 4,815,825 |
| LIC Housing Finance Ltd. | | 415,058 | 2,307,063 |
| Reliance Industries Ltd. | | 1,202,871 | 17,259,963 |
|
| TOTAL INDIA | | | 69,445,171 |
|
| Indonesia - 0.9% | | | |
| PT Bank Central Asia Tbk | | 6,274,412 | 9,760,884 |
| PT Bank Rakyat Indonesia Tbk | | 44,979,275 | 9,319,830 |
|
| TOTAL INDONESIA | | | 19,080,714 |
|
| Ireland - 2.4% | | | |
| CRH PLC | | 319,588 | 9,543,059 |
| DCC PLC (United Kingdom) | | 58,664 | 5,035,197 |
| Kerry Group PLC Class A | | 131,431 | 13,472,312 |
| Kingspan Group PLC (Ireland) | | 258,809 | 11,256,577 |
| Ryanair Holdings PLC sponsored ADR (a) | | 172,456 | 14,279,357 |
|
| TOTAL IRELAND | | | 53,586,502 |
|
| Israel - 0.5% | | | |
| Check Point Software Technologies Ltd. (a) | | 92,884 | 10,310,124 |
| Italy - 0.7% | | | |
| FinecoBank SpA | | 133,852 | 1,401,763 |
| Intesa Sanpaolo SpA | | 3,069,110 | 6,798,308 |
| Prada SpA | | 1,305,491 | 4,611,366 |
| Recordati SpA | | 85,489 | 2,897,127 |
|
| TOTAL ITALY | | | 15,708,564 |
|
| Japan - 17.0% | | | |
| Bandai Namco Holdings, Inc. | | 97,919 | 3,484,245 |
| Daikin Industries Ltd. | | 142,971 | 16,572,044 |
| GMO Internet, Inc. | | 126,499 | 1,807,209 |
| Hoya Corp. | | 498,930 | 28,361,209 |
| Iriso Electronics Co. Ltd. | | 19,677 | 832,700 |
| Itochu Corp. | | 244,226 | 4,529,408 |
| Kao Corp. | | 175,680 | 11,686,625 |
| Keyence Corp. | | 58,393 | 28,618,185 |
| Minebea Mitsumi, Inc. | | 1,132,618 | 17,326,819 |
| Misumi Group, Inc. | | 223,904 | 4,496,534 |
| Mitsubishi UFJ Financial Group, Inc. | | 3,659,282 | 22,147,778 |
| Morinaga & Co. Ltd. | | 81,916 | 3,292,321 |
| Nabtesco Corp. | | 97,555 | 2,151,078 |
| Nidec Corp. | | 100,530 | 12,909,821 |
| Nintendo Co. Ltd. | | 5,900 | 1,841,997 |
| Nissan Chemical Corp. | | 59,435 | 2,802,437 |
| Nitori Holdings Co. Ltd. | | 120,676 | 15,758,948 |
| NOF Corp. | | 15,538 | 441,346 |
| Olympus Corp. | | 188,690 | 6,289,377 |
| ORIX Corp. | | 1,840,812 | 30,034,430 |
| Outsourcing, Inc. | | 196,078 | 2,484,970 |
| PALTAC Corp. | | 67,650 | 3,453,397 |
| Panasonic Corp. | | 202,845 | 2,176,822 |
| Recruit Holdings Co. Ltd. | | 721,306 | 19,359,559 |
| Renesas Electronics Corp. (a) | | 821,985 | 4,356,335 |
| Seria Co. Ltd. | | 27,439 | 925,293 |
| Shin-Etsu Chemical Co. Ltd. | | 89,103 | 7,445,493 |
| Shiseido Co. Ltd. | | 160,682 | 10,138,311 |
| SMC Corp. | | 32,317 | 10,353,698 |
| SoftBank Corp. | | 228,063 | 18,048,636 |
| Sony Corp. | | 442,874 | 23,966,903 |
| Subaru Corp. | | 124,371 | 3,354,870 |
| Sundrug Co. Ltd. | | 76,099 | 2,765,152 |
| Suzuki Motor Corp. | | 190,163 | 9,482,805 |
| Temp Holdings Co., Ltd. | | 153,857 | 2,928,921 |
| Tsubaki Nakashima Co. Ltd. | | 83,010 | 1,530,206 |
| Tsuruha Holdings, Inc. | | 155,066 | 16,161,441 |
| Welcia Holdings Co. Ltd. | | 229,372 | 11,708,980 |
| Yahoo! Japan Corp. | | 1,054,159 | 3,288,764 |
| Zozo, Inc. | | 271,360 | 6,538,998 |
|
| TOTAL JAPAN | | | 375,854,065 |
|
| Korea (South) - 0.3% | | | |
| Cafe24 Corp. (a) | | 13,944 | 1,350,405 |
| LG Chemical Ltd. | | 16,289 | 4,953,798 |
|
| TOTAL KOREA (SOUTH) | | | 6,304,203 |
|
| Luxembourg - 0.8% | | | |
| B&M European Value Retail S.A. | | 2,664,577 | 14,195,634 |
| Samsonite International SA | | 1,282,631 | 3,680,105 |
|
| TOTAL LUXEMBOURG | | | 17,875,739 |
|
| Netherlands - 4.4% | | | |
| Adyen BV (b) | | 7,705 | 4,984,029 |
| ASML Holding NV | | 119,052 | 20,519,803 |
| Heineken NV (Bearer) | | 57,154 | 5,152,944 |
| ING Groep NV (Certificaten Van Aandelen) | | 548,630 | 6,490,839 |
| Koninklijke Philips Electronics NV | | 373,792 | 13,940,893 |
| LyondellBasell Industries NV Class A | | 13,117 | 1,170,955 |
| Unilever NV (Certificaten Van Aandelen) (Bearer) | | 522,485 | 28,075,732 |
| Wolters Kluwer NV | | 287,148 | 16,313,947 |
|
| TOTAL NETHERLANDS | | | 96,649,142 |
|
| New Zealand - 0.3% | | | |
| Ryman Healthcare Group Ltd. | | 752,615 | 5,942,539 |
| Norway - 1.6% | | | |
| Equinor ASA | | 1,077,612 | 28,033,917 |
| Schibsted ASA (A Shares) | | 239,590 | 8,302,005 |
|
| TOTAL NORWAY | | | 36,335,922 |
|
| South Africa - 0.1% | | | |
| Capitec Bank Holdings Ltd. | | 41,319 | 2,774,682 |
| Spain - 2.0% | | | |
| Aedas Homes SAU (b) | | 15,825 | 409,388 |
| Amadeus IT Holding SA Class A | | 233,436 | 18,820,083 |
| CaixaBank SA | | 3,642,340 | 14,739,498 |
| Masmovil Ibercom SA (a) | | 27,797 | 3,608,098 |
| Neinor Homes SLU (a)(b) | | 39,852 | 640,965 |
| Prosegur Cash SA (b) | | 2,576,177 | 5,106,337 |
|
| TOTAL SPAIN | | | 43,324,369 |
|
| Sweden - 1.8% | | | |
| Alfa Laval AB | | 203,932 | 5,207,969 |
| ASSA ABLOY AB (B Shares) | | 687,900 | 13,682,857 |
| Coor Service Management Holding AB (b) | | 631,800 | 4,453,112 |
| HEXPOL AB (B Shares) | | 547,567 | 5,068,098 |
| Indutrade AB | | 121,550 | 2,916,833 |
| Swedbank AB (A Shares) | | 242,478 | 5,461,031 |
| Telefonaktiebolaget LM Ericsson (B Shares) | | 298,492 | 2,598,898 |
|
| TOTAL SWEDEN | | | 39,388,798 |
|
| Switzerland - 4.7% | | | |
| Credit Suisse Group AG | | 1,006,896 | 13,163,823 |
| Julius Baer Group Ltd. | | 194,481 | 8,869,264 |
| Lonza Group AG | | 34,767 | 10,932,541 |
| Roche Holding AG (participation certificate) | | 126,802 | 30,858,836 |
| Sig Combibloc Group AG (a) | | 209,400 | 2,321,561 |
| Sika AG | | 137,066 | 17,583,207 |
| Swatch Group AG (Bearer) | | 19,210 | 6,500,291 |
| TE Connectivity Ltd. | | 27,934 | 2,106,782 |
| UBS Group AG | | 803,383 | 11,239,305 |
|
| TOTAL SWITZERLAND | | | 103,575,610 |
|
| Taiwan - 0.9% | | | |
| Taiwan Semiconductor Manufacturing Co. Ltd. sponsored ADR | | 544,798 | 20,756,804 |
| United Kingdom - 15.9% | | | |
| Admiral Group PLC | | 247,633 | 6,371,638 |
| Aon PLC | | 36,960 | 5,772,413 |
| Ascential PLC | | 1,216,314 | 5,858,082 |
| Ashtead Group PLC | | 1,905 | 47,129 |
| AstraZeneca PLC (United Kingdom) | | 354,785 | 27,137,387 |
| Beazley PLC | | 654,576 | 4,413,482 |
| Big Yellow Group PLC | | 145,641 | 1,605,616 |
| BP PLC sponsored ADR | | 342,444 | 14,851,796 |
| British American Tobacco PLC sponsored ADR | | 672,247 | 29,175,520 |
| Bunzl PLC | | 460,909 | 13,614,884 |
| Coca-Cola European Partners PLC | | 162,591 | 7,396,265 |
| Compass Group PLC | | 695,189 | 13,684,295 |
| Cranswick PLC | | 56,198 | 2,075,953 |
| DS Smith PLC | | 470,353 | 2,362,135 |
| Halma PLC | | 281,092 | 4,771,395 |
| Hastings Group Holdings PLC (b) | | 1,996,877 | 4,724,508 |
| Indivior PLC (a) | | 1,027,028 | 2,472,559 |
| Informa PLC | | 427,472 | 3,899,073 |
| InterContinental Hotel Group PLC | | 82,655 | 4,342,199 |
| ITV PLC | | 1,920,059 | 3,655,560 |
| John Wood Group PLC | | 626,744 | 5,721,486 |
| LivaNova PLC (a) | | 25,904 | 2,900,989 |
| Lloyds Banking Group PLC | | 20,708,651 | 15,111,932 |
| London Stock Exchange Group PLC | | 285,533 | 15,748,381 |
| Melrose Industries PLC | | 3,382,641 | 7,291,906 |
| Micro Focus International PLC | | 494,824 | 7,670,869 |
| Ocado Group PLC (a) | | 34,933 | 381,858 |
| Prudential PLC | | 1,507,239 | 30,180,388 |
| Reckitt Benckiser Group PLC | | 282,772 | 22,866,107 |
| RELX PLC | | 775,147 | 15,338,140 |
| Rentokil Initial PLC | | 592,170 | 2,393,355 |
| Smith & Nephew PLC | | 467,990 | 7,607,110 |
| Spectris PLC | | 203,839 | 5,586,128 |
| St. James's Place Capital PLC | | 1,198,961 | 15,532,009 |
| Standard Chartered PLC (United Kingdom) | | 882,563 | 6,198,866 |
| Standard Life PLC | | 2,583,029 | 8,930,903 |
| Tesco PLC | | 5,618,928 | 15,302,732 |
| The Weir Group PLC | | 436,995 | 8,858,873 |
|
| TOTAL UNITED KINGDOM | | | 351,853,921 |
|
| United States of America - 6.8% | | | |
| Alphabet, Inc. Class C (a) | | 15,512 | 16,702,856 |
| Amgen, Inc. | | 81,194 | 15,653,391 |
| Becton, Dickinson & Co. | | 32,066 | 7,391,213 |
| Boston Scientific Corp. (a) | | 332,213 | 12,006,178 |
| Citigroup, Inc. | | 188,161 | 12,317,019 |
| Coty, Inc. Class A | | 670,719 | 7,076,085 |
| DowDuPont, Inc. | | 56,667 | 3,055,485 |
| FleetCor Technologies, Inc. (a) | | 18,541 | 3,708,756 |
| International Flavors & Fragrances, Inc. | | 46,270 | 6,693,418 |
| International Flavors & Fragrances, Inc. (Israel) | | 4,567 | 659,418 |
| Marsh & McLennan Companies, Inc. | | 22,476 | 1,904,841 |
| MasterCard, Inc. Class A | | 112,466 | 22,231,154 |
| Microsoft Corp. | | 20,984 | 2,241,301 |
| Oceaneering International, Inc. (a) | | 44,428 | 841,466 |
| Quintiles Transnational Holdings, Inc. (a) | | 55,970 | 6,880,392 |
| S&P Global, Inc. | | 49,944 | 9,105,790 |
| Visa, Inc. Class A | | 160,142 | 22,075,575 |
|
| TOTAL UNITED STATES OF AMERICA | | | 150,544,338 |
|
| TOTAL COMMON STOCKS | | | |
| (Cost $2,220,722,154) | | | 2,032,832,618 |
|
| Nonconvertible Preferred Stocks - 0.7% | | | |
| Germany - 0.7% | | | |
| Henkel AG & Co. KGaA | | 97,059 | 10,617,414 |
| Jungheinrich AG | | 74,948 | 2,487,273 |
| Sartorius AG (non-vtg.) | | 20,983 | 3,042,099 |
|
| TOTAL GERMANY | | | |
|
| TOTAL NONCONVERTIBLE PREFERRED STOCKS | | | |
| (Cost $18,034,415) | | | 16,146,786 |
|
| Money Market Funds - 7.8% | | | |
| Fidelity Cash Central Fund, 2.23% (d) | | 156,225,533 | 156,256,778 |
| Fidelity Securities Lending Cash Central Fund 2.23% (d)(e) | | 15,765,861 | 15,767,438 |
| TOTAL MONEY MARKET FUNDS | | | |
| (Cost $172,024,216) | | | 172,024,216 |
| TOTAL INVESTMENT IN SECURITIES - 100.6% | | | |
| (Cost $2,410,780,785) | | | 2,221,003,620 |
| NET OTHER ASSETS (LIABILITIES) - (0.6)% | | | (13,648,849) |
| NET ASSETS - 100% | | | $2,207,354,771 |
Categorizations in the Schedule of Investments are based on country or territory of incorporation.
Legend
(a) Non-income producing
(b) Security exempt from registration under Rule 144A of the Securities Act of 1933. These securities may be resold in transactions exempt from registration, normally to qualified institutional buyers. At the end of the period, the value of these securities amounted to $52,598,154 or 2.4% of net assets.
(c) Security or a portion of the security is on loan at period end.
(d) Affiliated fund that is generally available only to investment companies and other accounts managed by Fidelity Investments. The rate quoted is the annualized seven-day yield of the fund at period end. A complete unaudited listing of the fund's holdings as of its most recent quarter end is available upon request. In addition, each Fidelity Central Fund's financial statements, which are not covered by the Fund's Report of Independent Registered Public Accounting Firm, are available on the SEC's website or upon request.
(e) Investment made with cash collateral received from securities on loan.
Affiliated Central Funds
Information regarding fiscal year to date income earned by the Fund from investments in Fidelity Central Funds is as follows:
| Fund | Income earned |
| Fidelity Cash Central Fund | $1,064,350 |
| Fidelity Securities Lending Cash Central Fund | 339,405 |
| Total | $1,403,755 |
Amounts in the income column in the above table include any capital gain distributions from underlying funds, which are presented in the corresponding line-item in the Statement of Operations if applicable.
Investment Valuation
The following is a summary of the inputs used, as of October 31, 2018, involving the Fund's assets and liabilities carried at fair value. The inputs or methodology used for valuing securities may not be an indication of the risk associated with investing in those securities. For more information on valuation inputs, and their aggregation into the levels used below, please refer to the Investment Valuation section in the accompanying Notes to Financial Statements.
| | Valuation Inputs at Reporting Date: |
| Description | Total | Level 1 | Level 2 | Level 3 |
| Investments in Securities: | | | | |
| Equities: | | | | |
| Communication Services | $65,920,865 | $42,741,468 | $23,179,397 | $-- |
| Consumer Discretionary | 175,697,868 | 116,699,598 | 58,998,270 | -- |
| Consumer Staples | 232,230,622 | 140,914,604 | 91,316,018 | -- |
| Energy | 97,907,058 | 97,907,058 | -- | -- |
| Financials | 525,674,937 | 368,413,700 | 157,261,237 | -- |
| Health Care | 280,063,694 | 119,255,080 | 160,808,614 | -- |
| Industrials | 316,728,979 | 219,220,440 | 97,508,539 | -- |
| Information Technology | 248,463,036 | 208,969,058 | 39,493,978 | -- |
| Materials | 92,724,644 | 72,933,655 | 19,790,989 | -- |
| Real Estate | 8,829,429 | 8,829,429 | -- | -- |
| Utilities | 4,738,272 | 4,738,272 | -- | -- |
| Money Market Funds | 172,024,216 | 172,024,216 | -- | -- |
| Total Investments in Securities: | $2,221,003,620 | $1,572,646,578 | $648,357,042 | $-- |
The following is a summary of transfers between Level 1 and Level 2 for the period ended October 31, 2018. Transfers are assumed to have occurred at the beginning of the period, and are primarily attributable to the valuation techniques used for foreign equity securities, as discussed in the accompanying Notes to Financial Statements:
| Transfers | Total |
| Level 1 to Level 2 | $10,474,936 |
| Level 2 to Level 1 | $31,142,856 |
See accompanying notes which are an integral part of the financial statements.
Financial Statements
Statement of Assets and Liabilities
| | | October 31, 2018 |
| Assets | | |
Investment in securities, at value (including securities loaned of $15,031,614) — See accompanying schedule:
Unaffiliated issuers (cost $2,238,756,569) | $2,048,979,404 | |
| Fidelity Central Funds (cost $172,024,216) | 172,024,216 | |
| Total Investment in Securities (cost $2,410,780,785) | | $2,221,003,620 |
| Foreign currency held at value (cost $1,763,982) | | 1,763,982 |
| Receivable for investments sold | | 9,285,955 |
| Receivable for fund shares sold | | 743,389 |
| Dividends receivable | | 5,211,718 |
| Distributions receivable from Fidelity Central Funds | | 227,985 |
| Other receivables | | 81,279 |
| Total assets | | 2,238,317,928 |
| Liabilities | | |
| Payable to custodian bank | $219,281 | |
| Payable for investments purchased | 11,136,321 | |
| Payable for fund shares redeemed | 2,710,280 | |
| Accrued management fee | 1,129,685 | |
| Other payables and accrued expenses | 152 | |
| Collateral on securities loaned | 15,767,438 | |
| Total liabilities | | 30,963,157 |
| Net Assets | | $2,207,354,771 |
| Net Assets consist of: | | |
| Paid in capital | | $2,446,224,679 |
| Total distributable earnings (loss) | | (238,869,908) |
| Net Assets, for 227,855,078 shares outstanding | | $2,207,354,771 |
| Net Asset Value, offering price and redemption price per share ($2,207,354,771 ÷ 227,855,078 shares) | | $9.69 |
See accompanying notes which are an integral part of the financial statements.
Statement of Operations
| | | Year ended October 31, 2018 |
| Investment Income | | |
| Dividends | | $37,689,604 |
| Income from Fidelity Central Funds | | 1,403,755 |
| Total income | | 39,093,359 |
| Expenses | | |
| Management fee | $10,336,187 | |
| Independent trustees' fees and expenses | 7,797 | |
| Interest | 2,103 | |
| Commitment fees | 2,962 | |
| Total expenses before reductions | 10,349,049 | |
| Expense reductions | (261,030) | |
| Total expenses after reductions | | 10,088,019 |
| Net investment income (loss) | | 29,005,340 |
| Realized and Unrealized Gain (Loss) | | |
| Net realized gain (loss) on: | | |
| Investment securities: | | |
| Unaffiliated issuers (net of foreign taxes of $13,786) | (75,608,293) | |
| Fidelity Central Funds | (38) | |
| Foreign currency transactions | (593,725) | |
| Total net realized gain (loss) | | (76,202,056) |
| Change in net unrealized appreciation (depreciation) on: | | |
| Investment securities: | | |
| Unaffiliated issuers | (195,588,821) | |
| Assets and liabilities in foreign currencies | (63,984) | |
| Total change in net unrealized appreciation (depreciation) | | (195,652,805) |
| Net gain (loss) | | (271,854,861) |
| Net increase (decrease) in net assets resulting from operations | | $(242,849,521) |
See accompanying notes which are an integral part of the financial statements.
Statement of Changes in Net Assets
| | Year ended October 31, 2018 | For the period
May 25, 2017 (commencement of operations) to October 31, 2017 |
| Increase (Decrease) in Net Assets | | |
| Operations | | |
| Net investment income (loss) | $29,005,340 | $305,203 |
| Net realized gain (loss) | (76,202,056) | (717,555) |
| Change in net unrealized appreciation (depreciation) | (195,652,805) | 5,813,105 |
| Net increase (decrease) in net assets resulting from operations | (242,849,521) | 5,400,753 |
| Distributions to shareholders | (1,421,142) | – |
| Total distributions | (1,421,142) | – |
| Share transactions | | |
| Proceeds from sales of shares | 2,562,853,883 | 299,172,907 |
| Reinvestment of distributions | 1,421,142 | – |
| Cost of shares redeemed | (408,795,237) | (8,428,014) |
| Net increase (decrease) in net assets resulting from share transactions | 2,155,479,788 | 290,744,893 |
| Total increase (decrease) in net assets | 1,911,209,125 | 296,145,646 |
| Net Assets | | |
| Beginning of period | 296,145,646 | – |
| End of period | $2,207,354,771 | $296,145,646 |
| Other Information | | |
| Undistributed net investment income end of period | | $303,449 |
| Shares | | |
| Sold | 238,286,615 | 28,621,106 |
| Issued in reinvestment of distributions | 133,315 | – |
| Redeemed | (38,373,698) | (812,260) |
| Net increase (decrease) | 200,046,232 | 27,808,846 |
See accompanying notes which are an integral part of the financial statements.
Financial Highlights
Fidelity Diversified International K6 Fund
| | | |
| Years ended October 31, | 2018 | 2017 A |
| Selected Per–Share Data | | |
| Net asset value, beginning of period | $10.65 | $10.00 |
| Income from Investment Operations | | |
| Net investment income (loss)B | .18 | .03C |
| Net realized and unrealized gain (loss) | (1.12) | .62 |
| Total from investment operations | (.94) | .65 |
| Distributions from net investment income | (.02) | – |
| Distributions from net realized gain | (.01) | – |
| Total distributions | (.02)D | – |
| Net asset value, end of period | $9.69 | $10.65 |
| Total ReturnE,F | (8.83)% | 6.50% |
| Ratios to Average Net AssetsG,H | | |
| Expenses before reductions | .60% | .60%I |
| Expenses net of fee waivers, if any | .60% | .60%I |
| Expenses net of all reductions | .58% | .60%I |
| Net investment income (loss) | 1.67% | .64%C,I |
| Supplemental Data | | |
| Net assets, end of period (000 omitted) | $2,207,355 | $296,146 |
| Portfolio turnover rateJ | 48%K | 27%K,L |
A For the period May 25, 2017 (commencement of operations) to October 31, 2017.
B Calculated based on average shares outstanding during the period.
C Net investment income per share reflects a large, non-recurring dividend which amounted to $.01 per share. Excluding this non-recurring dividend, the ratio of net investment income (loss) to average net assets would have been .58%.
D Total distributions of $.02 per share is comprised of distributions from net investment income of $.016 and distributions from net realized gain of $.005 per share.
E Total returns for periods of less than one year are not annualized.
F Total returns would have been lower if certain expenses had not been reduced during the applicable periods shown.
G Fees and expenses of any underlying Fidelity Central Funds are not included in the Fund's expense ratio. The Fund indirectly bears its proportionate share of the expenses of any underlying Fidelity Central Funds.
H Expense ratios reflect operating expenses of the Fund. Expenses before reductions do not reflect amounts reimbursed by the investment adviser or reductions from brokerage service arrangements or reductions from other expense offset arrangements and do not represent the amount paid by the Fund during periods when reimbursements or reductions occur. Expense ratios before reductions for start-up periods may not be representative of longer term operating periods. Expenses net of fee waivers reflect expenses after reimbursement by the investment adviser but prior to reductions from brokerage service arrangements or other expense offset arrangements. Expenses net of all reductions represent the net expenses paid by the Fund.
I Annualized
J Amount does not include the portfolio activity of any underlying Fidelity Central Funds.
K Portfolio turnover rate excludes securities received or delivered in-kind.
L Amount not annualized.
See accompanying notes which are an integral part of the financial statements.
Notes to Financial Statements
For the period ended October 31, 2018
1. Organization.
Fidelity Diversified International K6 Fund (the Fund) is a fund of Fidelity Investment Trust (the Trust) and is authorized to issue an unlimited number of shares. Share transactions on the Statement of Changes in Net Assets may contain exchanges between affiliated funds. The Trust is registered under the Investment Company Act of 1940, as amended (the 1940 Act), as an open-end management investment company organized as a Massachusetts business trust. Shares generally are available only to employer-sponsored retirement plans that are recordkept by Fidelity, or to certain employer-sponsored retirement plans that are not recordkept by Fidelity. The Fund's investments in emerging markets can be subject to social, economic, regulatory, and political uncertainties and can be extremely volatile.
2. Investments in Fidelity Central Funds.
The Fund invests in Fidelity Central Funds, which are open-end investment companies generally available only to other investment companies and accounts managed by the investment adviser and its affiliates. The Fund's Schedule of Investments lists each of the Fidelity Central Funds held as of period end, if any, as an investment of the Fund, but does not include the underlying holdings of each Fidelity Central Fund. As an Investing Fund, the Fund indirectly bears its proportionate share of the expenses of the underlying Fidelity Central Funds.
The Money Market Central Funds seek preservation of capital and current income and are managed by Fidelity Investments Money Management, Inc. (FIMM), an affiliate of the investment adviser. Annualized expenses of the Money Market Central Funds as of their most recent shareholder report date are less than .005%.
A complete unaudited list of holdings for each Fidelity Central Fund is available upon request or at the Securities and Exchange Commission (the SEC) website at www.sec.gov. In addition, the financial statements of the Fidelity Central Funds, which are not covered by the Fund's Report of Independent Registered Public Accounting Firm, are available on the SEC website or upon request.
3. Significant Accounting Policies.
The Fund is an investment company and applies the accounting and reporting guidance of the Financial Accounting Standards Board (FASB) Accounting Standards Codification Topic 946 Financial Services – Investments Companies. The financial statements have been prepared in conformity with accounting principles generally accepted in the United States of America (GAAP), which require management to make certain estimates and assumptions at the date of the financial statements. Actual results could differ from those estimates. Subsequent events, if any, through the date that the financial statements were issued have been evaluated in the preparation of the financial statements. The following summarizes the significant accounting policies of the Fund:
Investment Valuation. Investments are valued as of 4:00 p.m. Eastern time on the last calendar day of the period. The Board of Trustees (the Board) has delegated the day to day responsibility for the valuation of the Fund's investments to the Fair Value Committee (the Committee) established by the Fund's investment adviser. In accordance with valuation policies and procedures approved by the Board, the Fund attempts to obtain prices from one or more third party pricing vendors or brokers to value its investments. When current market prices, quotations or currency exchange rates are not readily available or reliable, investments will be fair valued in good faith by the Committee, in accordance with procedures adopted by the Board. Factors used in determining fair value vary by investment type and may include market or investment specific events. The frequency with which these procedures are used cannot be predicted and they may be utilized to a significant extent. The Committee oversees the Fund's valuation policies and procedures and reports to the Board on the Committee's activities and fair value determinations. The Board monitors the appropriateness of the procedures used in valuing the Fund's investments and ratifies the fair value determinations of the Committee.
The Fund categorizes the inputs to valuation techniques used to value its investments into a disclosure hierarchy consisting of three levels as shown below:
- Level 1 – quoted prices in active markets for identical investments
- Level 2 – other significant observable inputs (including quoted prices for similar investments, interest rates, prepayment speeds, etc.)
- Level 3 – unobservable inputs (including the Fund's own assumptions based on the best information available)
Valuation techniques used to value the Fund's investments by major category are as follows:
Equity securities, including restricted securities, for which market quotations are readily available, are valued at the last reported sale price or official closing price as reported by a third party pricing vendor on the primary market or exchange on which they are traded and are categorized as Level 1 in the hierarchy. In the event there were no sales during the day or closing prices are not available, securities are valued at the last quoted bid price or may be valued using the last available price and are generally categorized as Level 2 in the hierarchy. For foreign equity securities, when market or security specific events arise, comparisons to the valuation of American Depositary Receipts (ADRs), futures contracts, Exchange-Traded Funds (ETFs) and certain indexes as well as quoted prices for similar securities may be used and would be categorized as Level 2 in the hierarchy. Utilizing these techniques may result in transfers between Level 1 and Level 2. For equity securities, including restricted securities, where observable inputs are limited, assumptions about market activity and risk are used and these securities may be categorized as Level 3 in the hierarchy.
Investments in open-end mutual funds, including the Fidelity Central Funds, are valued at their closing net asset value (NAV) each business day and are categorized as Level 1 in the hierarchy.
Changes in valuation techniques may result in transfers in or out of an assigned level within the disclosure hierarchy. The aggregate value of investments by input level as of October 31, 2018, including information on transfers between Levels 1 and 2 is included at the end of the Fund's Schedule of Investments.
Foreign Currency. The Fund may use foreign currency contracts to facilitate transactions in foreign-denominated securities. Gains and losses from these transactions may arise from changes in the value of the foreign currency or if the counterparties do not perform under the contracts' terms.
Foreign-denominated assets, including investment securities, and liabilities are translated into U.S. dollars at the exchange rates at period end. Purchases and sales of investment securities, income and dividends received and expenses denominated in foreign currencies are translated into U.S. dollars at the exchange rate in effect on the transaction date.
The effects of exchange rate fluctuations on investments are included with the net realized and unrealized gain (loss) on investment securities. Other foreign currency transactions resulting in realized and unrealized gain (loss) are disclosed separately.
Investment Transactions and Income. For financial reporting purposes, the Fund's investment holdings and NAV include trades executed through the end of the last business day of the period. The NAV per share for processing shareholder transactions is calculated as of the close of business of the New York Stock Exchange (NYSE), normally 4:00 p.m. Eastern time and includes trades executed through the end of the prior business day. Gains and losses on securities sold are determined on the basis of identified cost. Dividend income is recorded on the ex-dividend date, except for certain dividends from foreign securities where the ex-dividend date may have passed, which are recorded as soon as the Fund is informed of the ex-dividend date. Non-cash dividends included in dividend income, if any, are recorded at the fair market value of the securities received. Income and capital gain distributions from Fidelity Central Funds, if any, are recorded on the ex-dividend date. Certain distributions received by the Fund represent a return of capital or capital gain. The Fund determines the components of these distributions subsequent to the ex-dividend date, based upon receipt of tax filings or other correspondence relating to the underlying investment. These distributions are recorded as a reduction of cost of investments and/or as a realized gain. Investment income is recorded net of foreign taxes withheld where recovery of such taxes is uncertain.
Expenses. Expenses directly attributable to a fund are charged to that fund. Expenses attributable to more than one fund are allocated among the respective funds on the basis of relative net assets or other appropriate methods. Expense estimates are accrued in the period to which they relate and adjustments are made when actual amounts are known.
Income Tax Information and Distributions to Shareholders. Each year, the Fund intends to qualify as a regulated investment company under Subchapter M of the Internal Revenue Code, including distributing substantially all of its taxable income and realized gains. As a result, no provision for U.S. Federal income taxes is required. As of October 31, 2018, the Fund did not have any unrecognized tax benefits in the financial statements; nor is the Fund aware of any tax positions for which it is reasonably possible that the total amounts of unrecognized tax benefits will significantly change in the next twelve months. The Fund files a U.S. federal tax return, in addition to state and local tax returns as required. The Fund's federal income tax returns are subject to examination by the Internal Revenue Service (IRS) for a period of three fiscal years after they are filed. State and local tax returns may be subject to examination for an additional fiscal year depending on the jurisdiction. Foreign taxes are provided for based on the Fund's understanding of the tax rules and rates that exist in the foreign markets in which it invests. The Fund is subject to a tax imposed on capital gains by certain countries in which it invests.
Distributions are declared and recorded on the ex-dividend date. Income and capital gain distributions are determined in accordance with income tax regulations, which may differ from GAAP.
Capital accounts within the financial statements are adjusted for permanent book-tax differences. These adjustments have no impact on net assets or the results of operations. Capital accounts are not adjusted for temporary book-tax differences which will reverse in a subsequent period.
Book-tax differences are primarily due to foreign currency transactions, passive foreign investment companies (PFIC), certain foreign taxes, capital loss carryforwards and losses deferred due to wash sales.
As of period end, the cost and unrealized appreciation (depreciation) in securities, and derivatives if applicable, for federal income tax purposes were as follows:
| Gross unrealized appreciation | $60,429,288 |
| Gross unrealized depreciation | (253,034,769) |
| Net unrealized appreciation (depreciation) | $(192,605,481) |
| Tax Cost | $2,413,609,101 |
The tax-based components of distributable earnings as of period end were as follows:
| Undistributed ordinary income | $27,584,234 |
| Capital loss carryforward | $(73,784,640) |
| Net unrealized appreciation (depreciation) on securities and other investments | $(192,669,502) |
Capital loss carryforwards are only available to offset future capital gains of the Fund to the extent provided by regulations and may be limited. Under the Regulated Investment Company Modernization Act of 2010 (the Act), the Fund is permitted to carry forward capital losses incurred in taxable years beginning after December 22, 2010 for an unlimited period and such capital losses are required to be used prior to any losses that expire. The capital loss carryforward information presented below, including any applicable limitation, is estimated as of fiscal period end and is subject to adjustment.
| No expiration | |
| Short-term | $(73,286,177) |
| Long-term | (498,463) |
| Total capital loss carryforward | $(73,784,640) |
Due to large subscriptions in a prior period, $154,447 of the Fund's capital losses are subject to limitation. Due to this limitation, the Fund will only be permitted to use approximately $41,863 of those $154,447 of capital losses per year to offset capital gains. The remainder of the Fund's capital losses are not subject to this limitation.
The tax character of distributions paid was as follows:
| | October 31, 2018 | October 31, 2017(a) |
| Ordinary Income | $1,421,142 | $ - |
(a) For the period May 25, 2017 (commencement of operations) to October 31, 2017.
Restricted Securities. The Fund may invest in securities that are subject to legal or contractual restrictions on resale. These securities generally may be resold in transactions exempt from registration or to the public if the securities are registered. Disposal of these securities may involve time-consuming negotiations and expense, and prompt sale at an acceptable price may be difficult. Information regarding restricted securities is included at the end of the Fund's Schedule of Investments.
New Rule Issuance. During August 2018, the U.S. Securities and Exchange Commission issued Final Rule Release No. 33-10532, Disclosure Update and Simplification. This Final Rule includes amendments specific to registered investment companies that are intended to eliminate overlap in disclosure requirements between Regulation S-X and GAAP. In accordance with these amendments, certain line-items in the Fund's financial statements have been combined or removed for the current period as outlined in the table below.
| Financial Statement | Current Line-Item Presentation | Prior Line-Item Presentation |
Statement of Assets and Liabilities
| Total distributable earnings (loss) | Undistributed/Distributions in excess of/Accumulated net investment income (loss)
Accumulated/Undistributed net realized gain (loss)
Net unrealized appreciation (depreciation) |
| Statement of Changes in Net Assets | N/A – removed | Undistributed/Distributions in excess of/Accumulated net investment income (loss) end of period |
| Statement of Changes in Net Assets | Distributions to shareholders | Distributions to shareholders from net investment income
Distributions to shareholders from net realized gain |
4. Purchases and Sales of Investments.
Purchases and sales of securities, other than short-term securities and in-kind transactions, aggregated $876,854,568 and $710,940,285, respectively.
Exchanges In-Kind. Investments and cash received in-kind through subscriptions totaled $1,914,771,242 in exchange for 177,875,328 shares of the Fund. The amount of in-kind exchanges is included in share transactions in the accompanying Statement of Changes in Net Assets. The Fund recognized no gain or loss for federal income tax purposes.
5. Fees and Other Transactions with Affiliates.
Management Fee. Fidelity Management & Research Company (the investment adviser) and its affiliates provide the Fund with investment management related services for which the Fund pays a monthly management fee that is based on an annual rate of .60% of average net assets. Under the management contract, the investment adviser or an affiliate pays all other expenses of the Fund, excluding fees and expenses of the independent Trustees, and certain miscellaneous expenses such as proxy and shareholder meeting expenses.
Brokerage Commissions. The Fund placed a portion of its portfolio transactions with brokerage firms which are affiliates of the investment adviser. Brokerage commissions are included in net realized gain (loss) and change in net unrealized appreciation (depreciation) in the Statement of Operations. The commissions paid to these affiliated firms were $4,160 for the period.
Interfund Lending Program. Pursuant to an Exemptive Order issued by the SEC, the Fund, along with other registered investment companies having management contracts with Fidelity Management & Research Company (FMR) or other affiliated entities of FMR, may participate in an interfund lending program. This program provides an alternative credit facility allowing the funds to borrow from, or lend money to, other participating affiliated funds. At period end, there were no interfund loans outstanding. The Fund's activity in this program during the period for which loans were outstanding was as follows:
| Borrower or Lender | Average Loan Balance | Weighted Average Interest Rate | Interest Expense |
| Borrower | $11,508,000 | 1.65% | $2,103 |
Interfund Trades. The Fund may purchase from or sell securities to other Fidelity Funds under procedures adopted by the Board. The procedures have been designed to ensure these interfund trades are executed in accordance with Rule 17a-7 of the 1940 Act. Interfund trades are included within the respective purchases and sales amounts shown in the Purchases and Sales of Investments note.
Prior Fiscal Year Exchanges In-Kind. During the prior period, an affiliated entity completed an exchange in-kind with the Fund. The affiliated entity delivered investments and cash, including accrued interest, valued at $252,875,067 in exchange for 24,179,719 shares of the Fund. The amount of in-kind exchanges is included in share transactions in the accompanying Statement of Changes in Net Assets. The Fund recognized no gain or loss for federal income tax purposes.
Other. During the period, the investment adviser reimbursed the Fund for certain losses in the amount of $5,524.
6. Committed Line of Credit.
The Fund participates with other funds managed by the investment adviser or an affiliate in a $4.25 billion credit facility (the "line of credit") to be utilized for temporary or emergency purposes to fund shareholder redemptions or for other short-term liquidity purposes. The Fund has agreed to pay commitment fees on its pro-rata portion of the line of credit, which amounted to $2,962 and is reflected in Commitment fees on the Statement of Operations. During the period, the Fund did not borrow on this line of credit.
7. Security Lending.
The Fund lends portfolio securities through a lending agent from time to time in order to earn additional income. For equity securities, a lending agent is used and may loan securities to certain qualified borrowers, including Fidelity Capital Markets (FCM), a broker-dealer affiliated with the Fund. On the settlement date of the loan, the Fund receives collateral (in the form of U.S. Treasury obligations, letters of credit and/or cash) against the loaned securities and maintains collateral in an amount not less than 100% of the market value of the loaned securities during the period of the loan. The market value of the loaned securities is determined at the close of business of the Fund and any additional required collateral is delivered to the Fund on the next business day. The Fund or borrower may terminate the loan at any time, and if the borrower defaults on its obligation to return the securities loaned because of insolvency or other reasons, the Fund may apply collateral received from the borrower against the obligation. The Fund may experience delays and costs in recovering the securities loaned. Any cash collateral received is invested in the Fidelity Securities Lending Cash Central Fund. The value of loaned securities and cash collateral at period end are disclosed on the Fund's Statement of Assets and Liabilities. Security lending income represents the income earned on investing cash collateral, less rebates paid to borrowers and any lending agent fees associated with the loan, plus any premium payments received for lending certain types of securities. Security lending income is presented in the Statement of Operations as a component of income from Fidelity Central Funds. Total security lending income during the period amounted to $339,405. During the period, there were no securities loaned to FCM.
8. Expense Reductions.
Commissions paid to certain brokers with whom the investment adviser, or its affiliates, places trades on behalf of the Fund include an amount in addition to trade execution, which may be rebated back to the Fund to offset certain expenses. This amount totaled $260,586 for the period. In addition, through arrangements with the Fund's custodian, credits realized as a result of certain uninvested cash balances were used to reduce the Fund's expenses. During the period, these credits reduced the Fund's custody expenses by $444.
9. Other.
The Fund's organizational documents provide former and current trustees and officers with a limited indemnification against liabilities arising in connection with the performance of their duties to the Fund. In the normal course of business, the Fund may also enter into contracts that provide general indemnifications. The Fund's maximum exposure under these arrangements is unknown as this would be dependent on future claims that may be made against the Fund. The risk of material loss from such claims is considered remote.
Report of Independent Registered Public Accounting Firm
To the Trustees of Fidelity Investment Trust and Shareholders of Fidelity Diversified International K6 Fund:
Opinion on the Financial Statements and Financial Highlights
We have audited the accompanying statement of assets and liabilities of Fidelity Diversified International K6 Fund (the "Fund"), a fund of Fidelity Investment Trust, including the schedule of investments, as of October 31, 2018, the related statement of operations for the year then ended, the statement of changes in net assets and the financial highlights for the year then ended and for the period from May 25, 2017 (commencement of operations) to October 31, 2017, and the related notes. In our opinion, the financial statements and financial highlights present fairly, in all material respects, the financial position of the Fund as of October 31, 2018, the results of its operations for the year then ended, and the changes in its net assets and the financial highlights for the year then ended and for the period from May 25, 2017 (commencement of operations) to October 31, 2017, in conformity with accounting principles generally accepted in the United States of America.
Basis for Opinion
These financial statements and financial highlights are the responsibility of the Fund's management. Our responsibility is to express an opinion on the Fund's financial statements and financial highlights based on our audits. We are a public accounting firm registered with the Public Company Accounting Oversight Board (United States) (PCAOB) and are required to be independent with respect to the Fund in accordance with the U.S. federal securities laws and the applicable rules and regulations of the Securities and Exchange Commission and the PCAOB.
We conducted our audits in accordance with the standards of the PCAOB. Those standards require that we plan and perform the audit to obtain reasonable assurance about whether the financial statements and financial highlights are free of material misstatement, whether due to error or fraud. The Fund is not required to have, nor were we engaged to perform, an audit of its internal control over financial reporting. As part of our audits we are required to obtain an understanding of internal control over financial reporting but not for the purpose of expressing an opinion on the effectiveness of the Fund’s internal control over financial reporting. Accordingly, we express no such opinion.
Our audits included performing procedures to assess the risks of material misstatement of the financial statements and financial highlights, whether due to error or fraud, and performing procedures that respond to those risks. Such procedures included examining, on a test basis, evidence regarding the amounts and disclosures in the financial statements and financial highlights. Our audits also included evaluating the accounting principles used and significant estimates made by management, as well as evaluating the overall presentation of the financial statements and financial highlights. Our procedures included confirmation of securities owned as of October 31, 2018, by correspondence with the custodians and brokers; when replies were not received from brokers, we performed other auditing procedures. We believe that our audits provide a reasonable basis for our opinion.
/s/ Deloitte & Touche LLP
Boston, Massachusetts
December 13, 2018
We have served as the auditor of one or more of the Fidelity investment companies since 1999.
Trustees and Officers
The Trustees, Members of the Advisory Board (if any), and officers of the trust and fund, as applicable, are listed below. The Board of Trustees governs the fund and is responsible for protecting the interests of shareholders. The Trustees are experienced executives who meet periodically throughout the year to oversee the fund's activities, review contractual arrangements with companies that provide services to the fund, oversee management of the risks associated with such activities and contractual arrangements, and review the fund's performance. Except for Jonathan Chiel, each of the Trustees oversees 283 funds. Mr. Chiel oversees 154 funds.
The Trustees hold office without limit in time except that (a) any Trustee may resign; (b) any Trustee may be removed by written instrument, signed by at least two-thirds of the number of Trustees prior to such removal; (c) any Trustee who requests to be retired or who has become incapacitated by illness or injury may be retired by written instrument signed by a majority of the other Trustees; and (d) any Trustee may be removed at any special meeting of shareholders by a two-thirds vote of the outstanding voting securities of the trust. Each Trustee who is not an interested person (as defined in the 1940 Act) of the trust and the fund is referred to herein as an Independent Trustee. Each Independent Trustee shall retire not later than the last day of the calendar year in which his or her 75th birthday occurs. The Independent Trustees may waive this mandatory retirement age policy with respect to individual Trustees. Officers and Advisory Board Members hold office without limit in time, except that any officer or Advisory Board Member may resign or may be removed by a vote of a majority of the Trustees at any regular meeting or any special meeting of the Trustees. Except as indicated, each individual has held the office shown or other offices in the same company for the past five years.
The fund’s Statement of Additional Information (SAI) includes more information about the Trustees. To request a free copy, call Fidelity at 1-800-835-5092.
Experience, Skills, Attributes, and Qualifications of the Trustees. The Governance and Nominating Committee has adopted a statement of policy that describes the experience, qualifications, attributes, and skills that are necessary and desirable for potential Independent Trustee candidates (Statement of Policy). The Board believes that each Trustee satisfied at the time he or she was initially elected or appointed a Trustee, and continues to satisfy, the standards contemplated by the Statement of Policy. The Governance and Nominating Committee also engages professional search firms to help identify potential Independent Trustee candidates who have the experience, qualifications, attributes, and skills consistent with the Statement of Policy. From time to time, additional criteria based on the composition and skills of the current Independent Trustees, as well as experience or skills that may be appropriate in light of future changes to board composition, business conditions, and regulatory or other developments, have also been considered by the professional search firms and the Governance and Nominating Committee. In addition, the Board takes into account the Trustees' commitment and participation in Board and committee meetings, as well as their leadership of standing and ad hoc committees throughout their tenure.
In determining that a particular Trustee was and continues to be qualified to serve as a Trustee, the Board has considered a variety of criteria, none of which, in isolation, was controlling. The Board believes that, collectively, the Trustees have balanced and diverse experience, qualifications, attributes, and skills, which allow the Board to operate effectively in governing the fund and protecting the interests of shareholders. Information about the specific experience, skills, attributes, and qualifications of each Trustee, which in each case led to the Board's conclusion that the Trustee should serve (or continue to serve) as a trustee of the fund, is provided below.
Board Structure and Oversight Function. James C. Curvey is an interested person and currently serves as Chairman. The Trustees have determined that an interested Chairman is appropriate and benefits shareholders because an interested Chairman has a personal and professional stake in the quality and continuity of services provided to the fund. Independent Trustees exercise their informed business judgment to appoint an individual of their choosing to serve as Chairman, regardless of whether the Trustee happens to be independent or a member of management. The Independent Trustees have determined that they can act independently and effectively without having an Independent Trustee serve as Chairman and that a key structural component for assuring that they are in a position to do so is for the Independent Trustees to constitute a substantial majority for the Board. The Independent Trustees also regularly meet in executive session. Ned C. Lautenbach serves as Chairman of the Independent Trustees and as such (i) acts as a liaison between the Independent Trustees and management with respect to matters important to the Independent Trustees and (ii) with management prepares agendas for Board meetings.
Fidelity® funds are overseen by different Boards of Trustees. The fund's Board oversees Fidelity's high income and certain equity funds, and other Boards oversee Fidelity's investment-grade bond, money market, asset allocation, and other equity funds. The asset allocation funds may invest in Fidelity® funds overseen by the fund's Board. The use of separate Boards, each with its own committee structure, allows the Trustees of each group of Fidelity® funds to focus on the unique issues of the funds they oversee, including common research, investment, and operational issues. On occasion, the separate Boards establish joint committees to address issues of overlapping consequences for the Fidelity® funds overseen by each Board.
The Trustees operate using a system of committees to facilitate the timely and efficient consideration of all matters of importance to the Trustees, the fund, and fund shareholders and to facilitate compliance with legal and regulatory requirements and oversight of the fund's activities and associated risks. The Board, acting through its committees, has charged FMR and its affiliates with (i) identifying events or circumstances the occurrence of which could have demonstrably adverse effects on the fund's business and/or reputation; (ii) implementing processes and controls to lessen the possibility that such events or circumstances occur or to mitigate the effects of such events or circumstances if they do occur; and (iii) creating and maintaining a system designed to evaluate continuously business and market conditions in order to facilitate the identification and implementation processes described in (i) and (ii) above. Because the day-to-day operations and activities of the fund are carried out by or through FMR, its affiliates, and other service providers, the fund's exposure to risks is mitigated but not eliminated by the processes overseen by the Trustees. While each of the Board's committees has responsibility for overseeing different aspects of the fund's activities, oversight is exercised primarily through the Operations, Audit, and Compliance Committees. In addition, the Independent Trustees have worked with Fidelity to enhance the Board's oversight of investment and financial risks, legal and regulatory risks, technology risks, and operational risks, including the development of additional risk reporting to the Board. Appropriate personnel, including but not limited to the fund's Chief Compliance Officer (CCO), FMR's internal auditor, the independent accountants, the fund's Treasurer and portfolio management personnel, make periodic reports to the Board's committees, as appropriate, including an annual review of Fidelity's risk management program for the Fidelity® funds. The responsibilities of each standing committee, including their oversight responsibilities, are described further under "Standing Committees of the Trustees."
Interested Trustees*:
Correspondence intended for a Trustee who is an interested person may be sent to Fidelity Investments, 245 Summer Street, Boston, Massachusetts 02210.
Name, Year of Birth; Principal Occupations and Other Relevant Experience+
Jonathan Chiel (1957)
Year of Election or Appointment: 2016
Trustee
Mr. Chiel also serves as Trustee of other Fidelity® funds. Mr. Chiel is Executive Vice President and General Counsel for FMR LLC (diversified financial services company, 2012-present). Previously, Mr. Chiel served as general counsel (2004-2012) and senior vice president and deputy general counsel (2000-2004) for John Hancock Financial Services; a partner with Choate, Hall & Stewart (1996-2000) (law firm); and an Assistant United States Attorney for the United States Attorney’s Office of the District of Massachusetts (1986-95), including Chief of the Criminal Division (1993-1995). Mr. Chiel is a director on the boards of the Boston Bar Foundation and the Maimonides School.
James C. Curvey (1935)
Year of Election or Appointment: 2007
Trustee
Chairman of the Board of Trustees
Mr. Curvey also serves as Trustee of other Fidelity® funds. Mr. Curvey is Vice Chairman (2007-present) and Director of FMR LLC (diversified financial services company). In addition, Mr. Curvey is an Overseer Emeritus for the Boston Symphony Orchestra, a Director of Artis-Naples, and a Trustee of Brewster Academy in Wolfeboro, New Hampshire. Previously, Mr. Curvey served as a Director of Fidelity Research & Analysis Co. (investment adviser firm, 2009-2018), Director of Fidelity Investments Money Management, Inc. (investment adviser firm, 2009-2014) and a Director of FMR and FMR Co., Inc. (investment adviser firms, 2007-2014).
Charles S. Morrison (1960)
Year of Election or Appointment: 2014
Trustee
Mr. Morrison also serves as Trustee of other funds. He serves as President of Fidelity SelectCo, LLC (investment adviser firm, 2017-present) and Fidelity Management & Research Company (FMR) (investment adviser firm, 2016-present), a Director of Fidelity Investments Money Management, Inc. (FIMM) (investment adviser firm, 2014-present), Director of Fidelity SelectCo, LLC (investment adviser firm, 2014-present), President, Asset Management (2014-present), and is an employee of Fidelity Investments. Previously, Mr. Morrison served as Vice President of Fidelity's Fixed Income and Asset Allocation Funds (2012-2014), President, Fixed Income (2011-2014), Vice President of Fidelity's Money Market Funds (2005-2009), President, Money Market Group Leader of FMR (investment adviser firm, 2009), and Senior Vice President, Money Market Group of FMR (2004-2009). Mr. Morrison also served as Vice President of Fidelity's Bond Funds (2002-2005), certain Balanced Funds (2002-2005), and certain Asset Allocation Funds (2002-2007), and as Senior Vice President (2002-2005) of Fidelity's Bond Division.
* Determined to be an “Interested Trustee” by virtue of, among other things, his or her affiliation with the trust or various entities under common control with FMR.
+ The information includes the Trustee's principal occupation during the last five years and other information relating to the experience, attributes, and skills relevant to the Trustee's qualifications to serve as a Trustee, which led to the conclusion that the Trustee should serve as a Trustee for the fund.
Independent Trustees:
Correspondence intended for an Independent Trustee may be sent to Fidelity Investments, P.O. Box 55235, Boston, Massachusetts 02205-5235.
Name, Year of Birth; Principal Occupations and Other Relevant Experience+
Dennis J. Dirks (1948)
Year of Election or Appointment: 2005
Trustee
Mr. Dirks also serves as Trustee of other Fidelity® funds. Prior to his retirement in May 2003, Mr. Dirks was Chief Operating Officer and a member of the Board of The Depository Trust & Clearing Corporation (DTCC). He also served as President, Chief Operating Officer, and Board member of The Depository Trust Company (DTC) and President and Board member of the National Securities Clearing Corporation (NSCC). In addition, Mr. Dirks served as Chief Executive Officer and Board member of the Government Securities Clearing Corporation, Chief Executive Officer and Board member of the Mortgage-Backed Securities Clearing Corporation, as a Trustee and a member of the Finance Committee of Manhattan College (2005-2008), as a Trustee and a member of the Finance Committee of AHRC of Nassau County (2006-2008), as a member of the Independent Directors Council (IDC) Governing Council (2010-2015), and as a member of the Board of Directors for The Brookville Center for Children’s Services, Inc. (2009-2017). Mr. Dirks is a member of the Finance Committee (2016-present), Board of Directors (2017-present) and Board of Trustees (2018-present) and is Treasurer (2018-present) of the Asolo Repertory Theatre.
Donald F. Donahue (1950)
Year of Election or Appointment: 2018
Trustee
Mr. Donahue also serves as a Trustee of other Fidelity® funds. Mr. Donahue is President and Chief Executive Officer of Miranda Partners, LLC (risk consulting for the financial services industry, 2012-present). Previously, Mr. Donahue served as a Member of the Advisory Board of certain Fidelity® funds (2015-2018) and Chief Executive Officer (2006-2012), Chief Operating Officer (2003-2006), and Managing Director, Customer Marketing and Development (1999-2003) of The Depository Trust & Clearing Corporation (financial markets infrastructure). Mr. Donahue serves as a Member (2007-present) and Co-Chairman (2016-present) of the Board of Directors of United Way of New York, Member of the Board of Directors of NYC Leadership Academy (2012-present) and Member of the Board of Advisors of Ripple Labs, Inc. (financial services, 2015-present). He also served as Chairman (2010-2012) and Member of the Board of Directors (2012-2013) of Omgeo, LLC (financial services), Treasurer of United Way of New York (2012-2016), and Member of the Board of Directors of XBRL US (financial services non-profit, 2009-2012) and the International Securities Services Association (2009-2012).
Alan J. Lacy (1953)
Year of Election or Appointment: 2008
Trustee
Mr. Lacy also serves as Trustee of other Fidelity® funds. Mr. Lacy serves as a Director of Bristol-Myers Squibb Company (global pharmaceuticals, 2008-present). He is a Trustee of the California Chapter of The Nature Conservancy (2015-present) and a Director of the Center for Advanced Study in the Behavioral Sciences at Stanford University (2015-present). In addition, Mr. Lacy served as Senior Adviser (2007-2014) of Oak Hill Capital Partners, L.P. (private equity) and also served as Chief Executive Officer (2005) and Vice Chairman (2005-2006) of Sears Holdings Corporation (retail) and Chief Executive Officer and Chairman of the Board of Sears, Roebuck and Co. (retail, 2000-2005). Previously, Mr. Lacy served as Chairman (2014-2017) and a member (2010-2017) of the Board of Directors of Dave & Buster’s Entertainment, Inc. (restaurant and entertainment complexes), as Chairman (2008-2011) and a member (2006-2015) of the Board of Trustees of the National Parks Conservation Association, and as a member of the Board of Directors for The Hillman Companies, Inc. (hardware wholesalers, 2010-2014), Earth Fare, Inc. (retail grocery, 2010-2014), and The Western Union Company (global money transfer, 2006-2011).
Ned C. Lautenbach (1944)
Year of Election or Appointment: 2000
Trustee
Chairman of the Independent Trustees
Mr. Lautenbach also serves as Trustee of other Fidelity® funds. Mr. Lautenbach currently serves as Vice Chair of the Board of Governors, State University System of Florida (2013-present) and is a member of the Council on Foreign Relations (1994-present). He is also a member and has most recently served as Chairman of the Board of Directors of Artis-Naples (2012-present). Previously, Mr. Lautenbach served as a member and then Lead Director of the Board of Directors of Eaton Corporation (diversified industrial, 1997-2016). He was also a Partner and Advisory Partner at Clayton, Dubilier & Rice, LLC (private equity investment, 1998-2010), as well as a Director of Sony Corporation (2006-2007). In addition, Mr. Lautenbach also had a 30-year career with IBM (technology company) during which time he served as Senior Vice President and a member of the Corporate Executive Committee (1968-1998).
Joseph Mauriello (1944)
Year of Election or Appointment: 2008
Trustee
Mr. Mauriello also serves as Trustee of other Fidelity® funds. Prior to his retirement in January 2006, Mr. Mauriello served in numerous senior management positions including Deputy Chairman and Chief Operating Officer (2004-2005), and Vice Chairman of Financial Services (2002-2004) of KPMG LLP US (professional services, 1965-2005). Mr. Mauriello currently serves as a member of the Independent Directors Council (IDC) Governing Council (2015-present). Previously, Mr. Mauriello served as a member of the Board of Directors of XL Group plc. (global insurance and re-insurance, 2006-2018).
Cornelia M. Small (1944)
Year of Election or Appointment: 2005
Trustee
Ms. Small also serves as Trustee of other Fidelity® funds. Ms. Small is a member of the Board of Directors (2009-present) and Chair of the Investment Committee (2010-present) of the Teagle Foundation. Ms. Small also serves on the Investment Committee of the Berkshire Taconic Community Foundation (2008-present). Previously, Ms. Small served as Chairperson (2002-2008) and a member of the Investment Committee and Chairperson (2008-2012) and a member of the Board of Trustees of Smith College. In addition, Ms. Small served as Chief Investment Officer, Director of Global Equity Investments, and a member of the Board of Directors of Scudder, Stevens & Clark and Scudder Kemper Investments.
Garnett A. Smith (1947)
Year of Election or Appointment: 2018
Trustee
Mr. Smith also serves as Trustee of other Fidelity® funds. Prior to Mr. Smith's retirement, he served as Chairman and Chief Executive Officer of Inbrand Corp. (manufacturer of personal absorbent products, 1990-1997). He also served as President (1986-1990) of Inbrand Corp. Prior to his employment with Inbrand Corp., he was employed by a retail fabric chain and North Carolina National Bank. In addition, Mr. Smith served as a Member of the Advisory Board of certain Fidelity® funds (2012-2013) and as a board member of the Jackson Hole Land Trust (2009-2012).
David M. Thomas (1949)
Year of Election or Appointment: 2008
Trustee
Mr. Thomas also serves as Trustee of other Fidelity® funds. Mr. Thomas serves as Non-Executive Chairman of the Board of Directors of Fortune Brands Home and Security (home and security products, 2011-present), as a member of the Board of Directors (2004-present) and Presiding Director (2013-present) of Interpublic Group of Companies, Inc. (marketing communication), and as a member of the Board of Trustees of the University of Florida (2013-present). Previously, Mr. Thomas served as Executive Chairman (2005-2006) and Chairman and Chief Executive Officer (2000-2005) of IMS Health, Inc. (pharmaceutical and healthcare information solutions), and a Director of Fortune Brands, Inc. (consumer products, 2000-2011).
+ The information includes the Trustee's principal occupation during the last five years and other information relating to the experience, attributes, and skills relevant to the Trustee's qualifications to serve as a Trustee, which led to the conclusion that the Trustee should serve as a Trustee for the fund.
Advisory Board Members and Officers:
Correspondence intended for a Member of the Advisory Board (if any) may be sent to Fidelity Investments, P.O. Box 55235, Boston, Massachusetts 02205-5235. Correspondence intended for an officer or Peter S. Lynch may be sent to Fidelity Investments, 245 Summer Street, Boston, Massachusetts 02210. Officers appear below in alphabetical order.
Name, Year of Birth; Principal Occupation
Vicki L. Fuller (1957)
Year of Election or Appointment: 2018
Member of the Advisory Board
Ms. Fuller also serves as Member of the Advisory Board of other Fidelity® funds. Ms. Fuller serves as a member of the Board of Directors, Audit Committee, and Nominating and Governance Committee of The Williams Companies, Inc. (natural gas infrastructure, 2018-present). Previously, Ms. Fuller served as the Chief Investment Officer of the New York State Common Retirement Fund (2012-2018) and held a variety of positions at AllianceBernstein L.P. (global asset management, 1985-2012), including Managing Director (2006-2012) and Senior Vice President and Senior Portfolio Manager (2001-2006).
Peter S. Lynch (1944)
Year of Election or Appointment: 2003
Member of the Advisory Board
Mr. Lynch also serves as Member of the Advisory Board of other Fidelity® funds. Mr. Lynch is Vice Chairman and a Director of FMR (investment adviser firm) and FMR Co., Inc. (investment adviser firm). In addition, Mr. Lynch serves as a Trustee of Boston College and as the Chairman of the Inner-City Scholarship Fund. Previously, Mr. Lynch served on the Special Olympics International Board of Directors (1997-2006).
William S. Stavropoulos (1939)
Year of Election or Appointment: 2018
Member of the Advisory Board
Mr. Stavropoulos also serves as Member of the Advisory Board of other Fidelity® funds. Mr. Stavropoulos serves as President and Founder of the Michigan Baseball Foundation, the Great Lakes Loons (2007-present). Mr. Stavropoulos is Chairman Emeritus of the Board of Directors of The Dow Chemical Company, where he previously served in numerous senior management positions, including President, CEO (1995-2000; 2002-2004), Chairman of the Executive Committee (2000-2006), and as a member of the Board of Directors (1990-2006). Currently, Mr. Stavropoulos is Chairman of the Board of Directors of Univar Inc. (global distributor of commodity and specialty chemicals), a Director of Teradata Corporation (data warehousing and technology solutions), and a member of the Advisory Board for Metalmark Capital LLC (private equity investment, 2005-present). Mr. Stavropoulos is an operating advisor to Clayton, Dubilier & Rice, LLC (private equity investment). In addition, Mr. Stavropoulos is a member of the University of Notre Dame Advisory Council for the College of Science, a Trustee of the Rollin L. Gerstacker Foundation, and a Director of Artis-Naples in Naples, Florida. Previously, Mr. Stavropoulos served as Trustee of certain Fidelity® funds (2001-2018) and as a Director of Chemical Financial Corporation (bank holding company, 1993-2012) and Tyco International, Ltd. (multinational manufacturing and services, 2007-2012).
Carol B. Tomé (1957)
Year of Election or Appointment: 2018
Member of the Advisory Board
Ms. Tomé also serves as Member of the Advisory Board of other Fidelity® funds. Ms. Tomé is Chief Financial Officer (2001-present) and Executive Vice President of Corporate Services (2007-present) of The Home Depot, Inc. (home improvement retailer) and a Director (2003-present) and Chair of the Audit Committee (2004-present) of United Parcel Service, Inc. (package delivery and supply chain management). Previously, Ms. Tomé served as Trustee of certain Fidelity® funds (2017), Senior Vice President of Finance and Accounting/Treasurer (2000-2007) and Vice President and Treasurer (1995-2000) of The Home Depot, Inc. and Chair of the Board (2010-2012), Vice Chair of the Board (2009 and 2013), and a Director (2008-2013) of the Federal Reserve Bank of Atlanta. Ms. Tomé is also a director or trustee of many community and professional organizations.
Michael E. Wiley (1950)
Year of Election or Appointment: 2018
Member of the Advisory Board
Mr. Wiley also serves as Trustee or Member of the Advisory Board of other Fidelity® funds. Mr. Wiley serves as a Director of High Point Resources (exploration and production, 2005-present). Previously, Mr. Wiley served as a Director of Andeavor Corporation (independent oil refiner and marketer, 2005-2018), a Director of Andeavor Logistics LP (natural resources logistics, 2015-2018), a Director of Post Oak Bank (privately-held bank, 2004-2018), a Director of Asia Pacific Exploration Consolidated (international oil and gas exploration and production, 2008-2013), a member of the Board of Trustees of the University of Tulsa (2000-2006; 2007-2010), a Senior Energy Advisor of Katzenbach Partners, LLC (consulting, 2006-2007), an Advisory Director of Riverstone Holdings (private investment), a Director of Spinnaker Exploration Company (exploration and production, 2001-2005) and Chairman, President, and CEO of Baker Hughes, Inc. (oilfield services, 2000-2004).
Elizabeth Paige Baumann (1968)
Year of Election or Appointment: 2017
Anti-Money Laundering (AML) Officer
Ms. Baumann also serves as AML Officer of other funds. She is Chief AML Officer (2012-present) and Senior Vice President (2014-present) of FMR LLC (diversified financial services company) and is an employee of Fidelity Investments. Previously, Ms. Baumann served as AML Officer of the funds (2012-2016), and Vice President (2007-2014) and Deputy Anti-Money Laundering Officer (2007-2012) of FMR LLC.
John J. Burke III (1964)
Year of Election or Appointment: 2018
Chief Financial Officer
Mr. Burke also serves as Chief Financial Officer of other funds. Mr. Burke serves as Head of Investment Operations for Fidelity Fund and Investment Operations (2018-present) and is an employee of Fidelity Investments (1998-present). Previously Mr. Burke served as head of Asset Management Investment Operations (2012-2018).
William C. Coffey (1969)
Year of Election or Appointment: 2018
Secretary and Chief Legal Officer (CLO)
Mr. Coffey also serves as Secretary and CLO of other funds. Mr. Coffey serves as CLO, Secretary, and Senior Vice President of Fidelity Management & Research Company and FMR Co., Inc. (investment adviser firms, 2018-present); Secretary of Fidelity SelectCo, LLC and Fidelity Investments Money Management, Inc. (investment adviser firms, 2018-present); and CLO of Fidelity Management & Research (Hong Kong) Limited, FMR Investment Management (UK) Limited, and Fidelity Management & Research (Japan) Limited (investment adviser firms, 2018-present). He is Senior Vice President and Deputy General Counsel of FMR LLC (diversified financial services company, 2010-present), and is an employee of Fidelity Investments. Previously, Mr. Coffey served as Assistant Secretary of certain funds (2009-2018) and as Vice President and Associate General Counsel of FMR LLC (2005-2009).
Timothy M. Cohen (1969)
Year of Election or Appointment: 2018
Vice President
Mr. Cohen also serves as Vice President of other funds. Mr. Cohen serves as Co-Head of Global Equity Research (2016-present), a Director of Fidelity Management & Research (Japan) Limited (investment adviser firm, 2016-present), and is an employee of Fidelity Investments. Previously, Mr. Cohen served as Chief Investment Officer - Equity and a Director of Fidelity Management & Research (U.K.) Inc. (investment adviser firm, 2013-2015) and as a Director of Fidelity Management & Research (Hong Kong) Limited (investment adviser firm, 2017).
Jonathan Davis (1968)
Year of Election or Appointment: 2010
Assistant Treasurer
Mr. Davis also serves as Assistant Treasurer of other funds. Mr. Davis serves as Assistant Treasurer of FMR Capital, Inc. (2017-present) and is an employee of Fidelity Investments. Previously, Mr. Davis served as Vice President and Associate General Counsel of FMR LLC (diversified financial services company, 2003-2010).
Adrien E. Deberghes (1967)
Year of Election or Appointment: 2016
Assistant Treasurer
Mr. Deberghes also serves as an officer of other funds. He serves as Assistant Treasurer of FMR Capital, Inc. (2017-present), Executive Vice President of Fidelity Investments Money Management, Inc. (FIMM) (investment adviser firm, 2016-present), and is an employee of Fidelity Investments (2008-present). Previously, Mr. Deberghes served as President and Treasurer of certain Fidelity® funds (2013-2018). Prior to joining Fidelity Investments, Mr. Deberghes was Senior Vice President of Mutual Fund Administration at State Street Corporation (2007-2008), Senior Director of Mutual Fund Administration at Investors Bank & Trust (2005-2007), and Director of Finance for Dunkin' Brands (2000-2005). Previously, Mr. Deberghes served in other fund officer roles.
Laura M. Del Prato (1964)
Year of Election or Appointment: 2018
Assistant Treasurer
Ms. Del Prato also serves as an officer of other funds. Ms. Del Prato is an employee of Fidelity Investments (2017-present). Prior to joining Fidelity Investments, Ms. Del Prato served as a Managing Director and Treasurer of the JPMorgan Mutual Funds (2014-2017). Prior to JPMorgan, Ms. Del Prato served as a partner at Cohen Fund Audit Services (accounting firm, 2012-2013) and KPMG LLP (accounting firm, 2004-2012).
Colm A. Hogan (1973)
Year of Election or Appointment: 2016
Deputy Treasurer
Mr. Hogan also serves as an officer of other funds. Mr. Hogan serves as Assistant Treasurer of FMR Capital, Inc. (2017-present) and is an employee of Fidelity Investments (2005-present). Previously, Mr. Hogan served as Assistant Treasurer of certain Fidelity® funds (2016-2018).
Pamela R. Holding (1964)
Year of Election or Appointment: 2018
Vice President
Ms. Holding also serves as Vice President of other funds. Ms. Holding serves as Co-Head of Global Equity Research (2018-present) and is an employee of Fidelity Investments (2013-present).
Chris Maher (1972)
Year of Election or Appointment: 2013
Assistant Treasurer
Mr. Maher serves as Assistant Treasurer of other funds. Mr. Maher is Vice President of Valuation Oversight, serves as Assistant Treasurer of FMR Capital, Inc. (2017-present), and is an employee of Fidelity Investments. Previously, Mr. Maher served as Vice President of Asset Management Compliance (2013), Vice President of the Program Management Group of FMR (investment adviser firm, 2010-2013), and Vice President of Valuation Oversight (2008-2010).
Rieco E. Mello (1969)
Year of Election or Appointment: 2017
Assistant Treasurer
Mr. Mello also serves as Assistant Treasurer of other funds. Mr. Mello serves as Assistant Treasurer of FMR Capital, Inc. (2017-present) and is an employee of Fidelity Investments (1995-present).
Kenneth B. Robins (1969)
Year of Election or Appointment: 2016
Chief Compliance Officer
Mr. Robins also serves as an officer of other funds. Mr. Robins serves as Compliance Officer of Fidelity Management & Research Company and FMR Co., Inc. (investment adviser firms, 2016-present) and is an employee of Fidelity Investments (2004-present). Previously, Mr. Robins served as Executive Vice President of Fidelity Investments Money Management, Inc. (investment adviser firm, 2013-2016) and served in other fund officer roles.
Stacie M. Smith (1974)
Year of Election or Appointment: 2016
President and Treasurer
Ms. Smith also serves as an officer of other funds. Ms. Smith serves as Assistant Treasurer of FMR Capital, Inc. (2017-present), is an employee of Fidelity Investments (2009-present), and has served in other fund officer roles. Prior to joining Fidelity Investments, Ms. Smith served as Senior Audit Manager of Ernst & Young LLP (accounting firm, 1996-2009). Previously, Ms. Smith served as Assistant Treasurer (2013-2018) and Deputy Treasurer (2013-2016) of certain Fidelity® funds.
Marc L. Spector (1972)
Year of Election or Appointment: 2016
Assistant Treasurer
Mr. Spector also serves as an officer of other funds. Mr. Spector serves as Assistant Treasurer of FMR Capital, Inc. (2017-present) and is an employee of Fidelity Investments (2016-present). Prior to joining Fidelity Investments, Mr. Spector served as Director at the Siegfried Group (accounting firm, 2013-2016), and prior to Siegfried Group as audit senior manager at Deloitte & Touche (accounting firm, 2005-2013).
Shareholder Expense Example
As a shareholder of the Fund, you incur two types of costs: (1) transaction costs and (2) ongoing costs, including management fees and other Fund expenses. This Example is intended to help you understand your ongoing costs (in dollars) of investing in the Fund and to compare these costs with the ongoing costs of investing in other mutual funds.
The Example is based on an investment of $1,000 invested at the beginning of the period and held for the entire period (May 1, 2018 to October 31, 2018).
Actual Expenses
The first line of the accompanying table provides information about actual account values and actual expenses. You may use the information in this line, together with the amount you invested, to estimate the expenses that you paid over the period. Simply divide your account value by $1,000.00 (for example, an $8,600 account value divided by $1,000.00 = 8.6), then multiply the result by the number in the first line under the heading entitled "Expenses Paid During Period" to estimate the expenses you paid on your account during this period. In addition, the Fund, as a shareholder in the underlying Fidelity Central Funds, will indirectly bear its pro-rata share of the fees and expenses incurred by the underlying Fidelity Central Funds. These fees and expenses are not included in the Fund's annualized expense ratio used to calculate the expense estimate in the table below.
Hypothetical Example for Comparison Purposes
The second line of the accompanying table provides information about hypothetical account values and hypothetical expenses based on the Fund's actual expense ratio and an assumed rate of return of 5% per year before expenses, which is not the Fund's actual return. The hypothetical account values and expenses may not be used to estimate the actual ending account balance or expenses you paid for the period. You may use this information to compare the ongoing costs of investing in the Fund and other funds. To do so, compare this 5% hypothetical example with the 5% hypothetical examples that appear in the shareholder reports of the other funds. In addition, the Fund, as a shareholder in the underlying Fidelity Central Funds, will indirectly bear its pro-rata share of the fees and expenses incurred by the underlying Fidelity Central Funds. These fees and expenses are not included in the Fund's annualized expense ratio used to calculate the expense estimate in the table below.
Please note that the expenses shown in the table are meant to highlight your ongoing costs only and do not reflect any transaction costs. Therefore, the second line of the table is useful in comparing ongoing costs only, and will not help you determine the relative total costs of owning different funds.
| | Annualized Expense Ratio-A | Beginning
Account Value
May 1, 2018 | Ending
Account Value
October 31, 2018 | Expenses Paid
During Period-B
May 1, 2018
to October 31, 2018 |
| Actual | .60% | $1,000.00 | $902.20 | $2.88 |
| Hypothetical-C | | $1,000.00 | $1,022.18 | $3.06 |
A Annualized expense ratio reflects expenses net of applicable fee waivers.
B Expenses are equal to the Fund's annualized expense ratio, multiplied by the average account value over the period, multiplied by 184/365 (to reflect the one-half year period).
C 5% return per year before expenses
Distributions (Unaudited)
The fund designates 24% of the dividend distributed during the fiscal year as qualifying for the dividends–received deduction for corporate shareholders.
The fund designates 90% of the dividend distributed during the fiscal year as amounts which may be taken into account as a dividend for the purposes of the maximum rate under section 1(h)(11) of the Internal Revenue Code.
The amounts per share which represent income derived from sources within, and taxes paid to, foreign countries or possessions of the United States are $0.0064 and $0.0005 for the dividend paid December 11, 2017.
The fund will notify shareholders in January 2019 of amounts for use in preparing 2018 income tax returns.
Board Approval of Investment Advisory Contracts
Fidelity Diversified International K6 Fund
At its July 2018 meeting, the Board of Trustees, including the Independent Trustees (together, the Board), voted to continue the management contract with Fidelity Management & Research Company (FMR) and the sub-advisory agreements (together, the Advisory Contracts) for the fund for six months through January 31, 2019, in connection with the reunification of the Fidelity Equity High Income Funds Board, which oversees the fund, and the Sector Portfolios Board.
The Board considered that the approval of the fund's Advisory Contracts will not result in any changes in (i) the investment process or strategies employed in the management of the fund's assets; (ii) the fees and expenses paid by shareholders; (iii) the nature, extent or quality of services provided under the fund's Advisory Contracts; or (iv) the day-to-day management of the fund or the persons primarily responsible for such management. The Board concluded that the fund's Advisory Contracts are fair and reasonable, and that the fund's Advisory Contracts should be renewed, without modification, through January 31, 2019, with the understanding that the Board will consider the annual renewal for a full one year period in January 2019.
In connection with its consideration of future renewals of the fund's Advisory Contracts, the Board will consider: (i) the nature, extent and quality of services provided to the fund, including shareholder and administrative services and investment performance; (ii) the competitiveness of the management fee and total expenses for the fund; (iii) the costs of the services and profitability, including the revenues earned and the expenses incurred in conducting the business of developing, marketing, distributing, managing, administering, and servicing the fund and its shareholders, to the extent applicable, as well as potential fall-out benefits from Fidelity's non-fund businesses; and (iv) whether there have been economies of scale in respect of the Fidelity funds, whether the Fidelity funds (including the fund) have appropriately benefited from any such economies of scale, and whether there is the potential for realization of any further economies.
Based on its evaluation of all of the conclusions noted above, and after considering all factors it believed relevant, the Board ultimately concluded that the fund's management fee structure is fair and reasonable, and that the continuation of the fund's Advisory Contracts should be approved.
Corporate Headquarters
245 Summer St.
Boston, MA 02210
www.fidelity.com
DIFK6-ANN-1218
1.9883987.101
Fidelity Advisor® Total International Equity Fund - Class A, Class M, Class C, Class I and Class Z
Annual Report October 31, 2018 Class A, Class M, Class C, Class I and Class Z are classes of Fidelity® Total International Equity Fund |
|
Contents
To view a fund's proxy voting guidelines and proxy voting record for the 12-month period ended June 30, visit http://www.fidelity.com/proxyvotingresults or visit the Securities and Exchange Commission's (SEC) web site at http://www.sec.gov.
You may also call 1-877-208-0098 to request a free copy of the proxy voting guidelines.
Standard & Poor's, S&P and S&P 500 are registered service marks of The McGraw-Hill Companies, Inc. and have been licensed for use by Fidelity Distributors Corporation.
Other third-party marks appearing herein are the property of their respective owners.
All other marks appearing herein are registered or unregistered trademarks or service marks of FMR LLC or an affiliated company. © 2018 FMR LLC. All rights reserved.
This report and the financial statements contained herein are submitted for the general information of the shareholders of the Fund. This report is not authorized for distribution to prospective investors in the Fund unless preceded or accompanied by an effective prospectus.
A fund files its complete schedule of portfolio holdings with the SEC for the first and third quarters of each fiscal year on Form N-Q. Forms N-Q are available on the SEC’s web site at http://www.sec.gov. A fund's Forms N-Q may be reviewed and copied at the SEC’s Public Reference Room in Washington, DC. Information regarding the operation of the SEC's Public Reference Room may be obtained by calling 1-800-SEC-0330.
For a complete list of a fund's portfolio holdings, view the most recent holdings listing, semiannual report, or annual report on Fidelity's web site at http://www.fidelity.com, http://www.institutional.fidelity.com, or http://www.401k.com, as applicable.
NOT FDIC INSURED •MAY LOSE VALUE •NO BANK GUARANTEE
Neither the Fund nor Fidelity Distributors Corporation is a bank.
Performance: The Bottom Line
Average annual total return reflects the change in the value of an investment, assuming reinvestment of distributions from dividend income and capital gains (the profits earned upon the sale of securities that have grown in value, if any) and assuming a constant rate of performance each year. The hypothetical investment and the average annual total returns do not reflect the deduction of taxes that a shareholder would pay on fund distributions or the redemption of fund shares. During periods of reimbursement by Fidelity, a fund’s total return will be greater than it would be had the reimbursement not occurred. How a fund did yesterday is no guarantee of how it will do tomorrow.
Average Annual Total Returns
| For the periods ended October 31, 2018 | Past 1 year | Past 5 years | Past 10 years |
| Class A (incl. 5.75% sales charge) | (14.27)% | 0.90% | 7.03% |
| Class M (incl. 3.50% sales charge) | (12.48)% | 1.11% | 7.03% |
| Class C (incl. contingent deferred sales charge) | (10.59)% | 1.31% | 6.87% |
| Class I | (8.86)% | 2.35% | 7.95% |
| Class Z | (8.63)% | 2.42% | 7.99% |
Class C shares' contingent deferred sales charges included in the past one year, past five years, and life of fund total return figures are 1%, 0%, and 0%, respectively.
The initial offering of Class Z shares took place on February 1, 2017. Returns prior to February 1, 2017, are those of Class I.
$10,000 Over 10 Years
Let's say hypothetically that $10,000 was invested in Fidelity Advisor® Total International Equity Fund - Class A on October 31, 2008, and the current 5.75% sales charge was paid.
The chart shows how the value of your investment would have changed, and also shows how the MSCI ACWI (All Country World Index) ex USA Index performed over the same period.
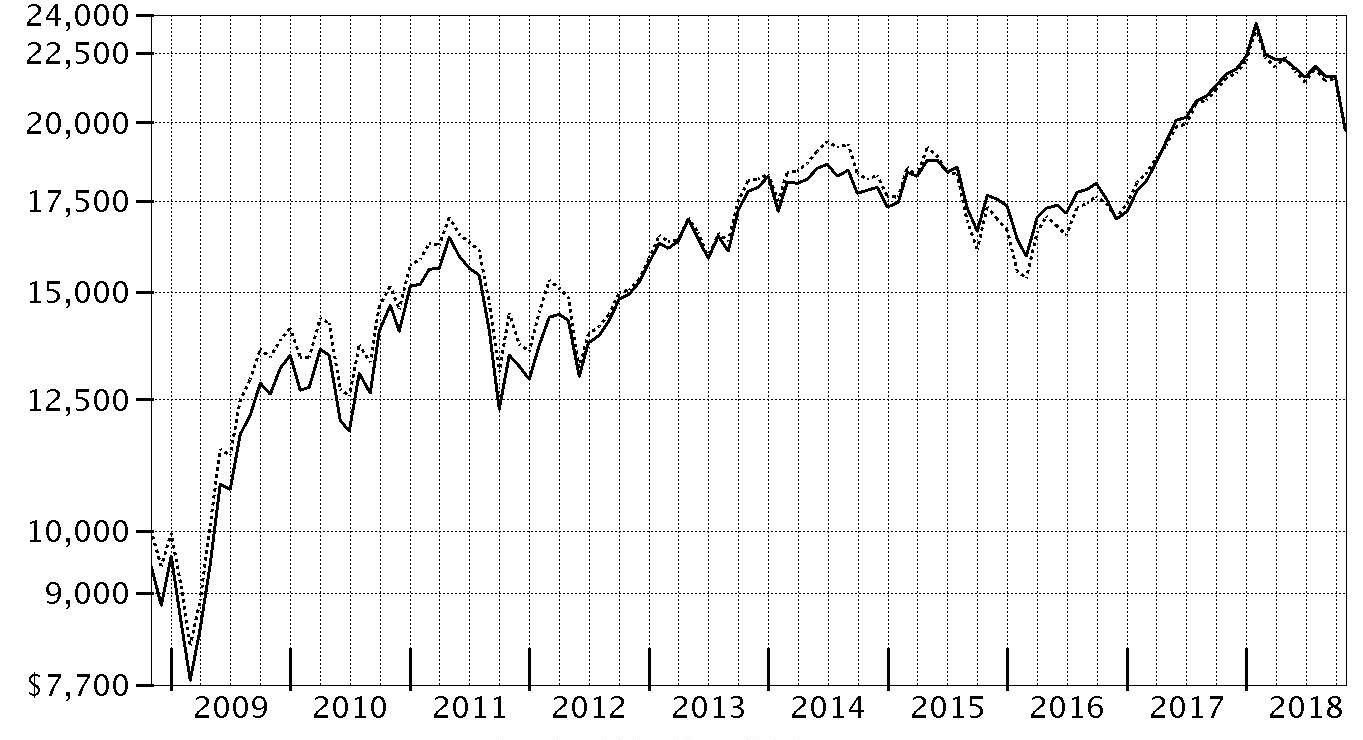
| Period Ending Values |
| $19,736 | Fidelity Advisor® Total International Equity Fund - Class A |
| $19,812 | MSCI ACWI (All Country World Index) ex USA Index |
Management's Discussion of Fund Performance
Market Recap: International equities returned -8.08% for the 12 months ending October 31, 2018, according to the MSCI ACWI (All Country World Index) ex USA Index. A modestly positive first half of the period gave way to a confluence of overwhelmingly negative factors – including escalating trade tensions, a surging U.S. dollar, tepid economic growth in Europe, global central bank tightening, concerns about Italy’s budget stalemate with the EU, and weakness in China’s stock market – that yielded a -11% second-half return. The index lost 8% in October alone, its largest monthly drop in more than six years. Among sectors, new-media-infused communications services (-15%) was hit the hardest, while economically sensitive consumer discretionary (-13%), information technology (-12%), financials (-10%), industrials (-9%) and materials (-7%) stocks also fared poorly. Even the more defensive real estate (-9%), utilities (-6%) and consumer staples (-5%) sectors weren’t spared this period. Conversely, elevated crude-oil prices fueled a positive return for energy (+7%), the top-performing sector, followed by the relatively stable-growing health care segment (+2%). Regionally, emerging markets (-12%) fared the worst, hampered by the impact of foreign exchange and concerns about economic weakness in China, India and South Korea. Sluggish growth also pressured shares in continental Europe (-9%). Stocks in Japan (-3%) and the U.K. (-4%) held up better, followed by Canada (-5%) and Asia-Pacific ex Japan (-6%).
Comments from Co-Portfolio Manager Jed Weiss: For the fiscal year, the fund’s share classes (excluding sales charges, if applicable) returned roughly -9% to -10%, trailing the benchmark MSCI ACWI (All Country World Index) ex USA Index. Versus the benchmark, unfavorable stock picks in China and India detracted most. By sector, security selection within the consumer staples and consumer discretionary sectors also weighed on relative performance. Conversely, the fund benefitted from non-benchmark exposure to the United States, as well as strong stock picks in continental Europe. The largest individual relative detractor was untimely ownership of Swiss drug manufacturer Novartis. We sold the stock in June, missing out as the stock gained due to a number of positive changes either made or anticipated by the company's new CEO. Underexposure to benchmark heavyweight Royal Dutch Shell also detracted. We established a position in April and held it through period end, which weighed on relative performance as shares of the Anglo-Dutch multinational oil and gas giant gained during the period. Turning to contributors, out-of-benchmark stakes in U.S.-based credit-card processors Mastercard and Visa were the top relative contributors, as both companies continued to maintain considerable pricing power and significant market share. A sizable overweighting in Australian global biopharmaceutical firm CSL Limited also proved beneficial, as its shares gained following the acquisition and successful turnaround of Novartis' flu business. Lastly, I'll note that the fund's small cash stake – representing about 2% of assets, on average – helped our relative result in a down market.
The views expressed above reflect those of the portfolio manager(s) only through the end of the period as stated on the cover of this report and do not necessarily represent the views of Fidelity or any other person in the Fidelity organization. Any such views are subject to change at any time based upon market or other conditions and Fidelity disclaims any responsibility to update such views. These views may not be relied on as investment advice and, because investment decisions for a Fidelity fund are based on numerous factors, may not be relied on as an indication of trading intent on behalf of any Fidelity fund.
Note to Shareholders: Following a roughly five-month leave of absence, Jed Weiss returned to Fidelity on November 29, 2017, and resumed his day-to-day responsibilities as Co-Portfolio Manager. In his stead, Vincent Montemaggiore served as interim manager of the fund's developed-growth subportfolio (transitioned off 12/4/17), while Patrick Drouot and Patrick Buchanan served as Co-Managers of the developed small-cap sleeve (transitioned off 12/30/17).
Investment Summary (Unaudited)
Geographic Diversification (% of fund's net assets)
| As of October 31, 2018 |
| | Japan | 13.9% |
| | United States of America* | 11.5% |
| | United Kingdom | 10.2% |
| | France | 6.8% |
| | Germany | 6.0% |
| | Canada | 5.8% |
| | Cayman Islands | 4.5% |
| | Switzerland | 4.4% |
| | India | 3.5% |
| | Other | 33.4% |

* Includes Short-Term investments and Net Other Assets (Liabilities).
Percentages are based on country or territory of incorporation and are adjusted for the effect of futures contracts, if applicable.
Asset Allocation as of October 31, 2018
| | % of fund's net assets |
| Stocks | 97.4 |
| Short-Term Investments and Net Other Assets (Liabilities) | 2.6 |
Top Ten Stocks as of October 31, 2018
| | % of fund's net assets |
| Taiwan Semiconductor Manufacturing Co. Ltd. (Taiwan, Semiconductors & Semiconductor Equipment) | 1.6 |
| Alibaba Group Holding Ltd. sponsored ADR (Cayman Islands, Internet & Direct Marketing Retail) | 1.4 |
| SAP SE (Germany, Software) | 1.3 |
| Samsung Electronics Co. Ltd. (Korea (South), Technology Hardware, Storage & Peripherals) | 1.3 |
| Tencent Holdings Ltd. (Cayman Islands, Interactive Media & Services) | 1.3 |
| Nestle SA (Reg. S) (Switzerland, Food Products) | 1.2 |
| Visa, Inc. Class A (United States of America, IT Services) | 1.2 |
| CSL Ltd. (Australia, Biotechnology) | 1.1 |
| MasterCard, Inc. Class A (United States of America, IT Services) | 1.1 |
| Roche Holding AG (participation certificate) (Switzerland, Pharmaceuticals) | 1.0 |
| | 12.5 |
Top Market Sectors as of October 31, 2018
| | % of fund's net assets |
| Financials | 21.8 |
| Industrials | 14.6 |
| Information Technology | 13.4 |
| Consumer Discretionary | 9.5 |
| Materials | 8.2 |
| Health Care | 7.9 |
| Consumer Staples | 7.2 |
| Communication Services | 6.8 |
| Energy | 5.9 |
| Real Estate | 1.9 |
Schedule of Investments October 31, 2018
Showing Percentage of Net Assets
| Common Stocks - 96.2% | | | |
| | | Shares | Value |
| Australia - 2.2% | | | |
| Accent Group Ltd. | | 5,879 | $5,183 |
| Adelaide Brighton Ltd. | | 4,389 | 17,623 |
| Beacon Lighting Group Ltd. | | 15,420 | 15,124 |
| Commonwealth Bank of Australia | | 10,721 | 525,599 |
| CSL Ltd. | | 8,594 | 1,144,138 |
| DuluxGroup Ltd. | | 9,164 | 48,022 |
| Imdex Ltd. (a) | | 16,011 | 13,039 |
| Insurance Australia Group Ltd. | | 43,838 | 212,030 |
| Macquarie Group Ltd. | | 3,228 | 267,908 |
|
| TOTAL AUSTRALIA | | | 2,248,666 |
|
| Austria - 0.6% | | | |
| Andritz AG | | 7,422 | 384,683 |
| Erste Group Bank AG | | 6,200 | 252,807 |
|
| TOTAL AUSTRIA | | | 637,490 |
|
| Bailiwick of Jersey - 0.7% | | | |
| Ferguson PLC | | 1,834 | 123,845 |
| Glencore Xstrata PLC | | 100,700 | 410,407 |
| Integrated Diagnostics Holdings PLC (b) | | 7,500 | 25,875 |
| WPP PLC | | 14,500 | 164,078 |
|
| TOTAL BAILIWICK OF JERSEY | | | 724,205 |
|
| Belgium - 0.9% | | | |
| KBC Ancora | | 2,011 | 93,024 |
| KBC Groep NV | | 10,212 | 704,407 |
| Umicore SA | | 3,588 | 169,020 |
|
| TOTAL BELGIUM | | | 966,451 |
|
| Bermuda - 0.3% | | | |
| Credicorp Ltd. (United States) | | 1,212 | 273,561 |
| Vostok New Ventures Ltd. (depositary receipt) (a) | | 3,360 | 25,555 |
|
| TOTAL BERMUDA | | | 299,116 |
|
| Brazil - 1.6% | | | |
| BM&F BOVESPA SA | | 35,100 | 250,317 |
| CVC Brasil Operadora e Agencia de Viagens SA | | 11,400 | 173,382 |
| IRB Brasil Resseguros SA | | 10,000 | 194,706 |
| Itau Unibanco Holding SA | | 3,500 | 39,867 |
| Localiza Rent A Car SA | | 30,800 | 237,942 |
| Lojas Renner SA | | 21,800 | 220,255 |
| Notre Dame Intermedica Participacoes SA | | 30,400 | 197,112 |
| Rumo SA (a) | | 37,500 | 167,775 |
| Suzano Papel e Celulose SA | | 17,200 | 174,935 |
|
| TOTAL BRAZIL | | | 1,656,291 |
|
| Canada - 5.8% | | | |
| Alimentation Couche-Tard, Inc. Class B (sub. vtg.) | | 15,722 | 750,839 |
| Canadian National Railway Co. | | 11,163 | 954,297 |
| Canadian Pacific Railway Ltd. | | 3,453 | 708,121 |
| CCL Industries, Inc. Class B | | 12,290 | 517,012 |
| Constellation Software, Inc. | | 957 | 658,629 |
| Franco-Nevada Corp. | | 8,559 | 534,560 |
| McCoy Global, Inc. (a) | | 7,000 | 6,115 |
| New Look Vision Group, Inc. | | 1,300 | 31,847 |
| Nutrien Ltd. | | 15,665 | 829,271 |
| Pason Systems, Inc. | | 19,991 | 301,737 |
| PrairieSky Royalty Ltd. | | 16,273 | 247,225 |
| ShawCor Ltd. Class A | | 800 | 14,512 |
| Suncor Energy, Inc. | | 13,500 | 452,854 |
|
| TOTAL CANADA | | | 6,007,019 |
|
| Cayman Islands - 4.5% | | | |
| 58.com, Inc. ADR (a) | | 3,000 | 196,770 |
| Alibaba Group Holding Ltd. sponsored ADR (a) | | 9,982 | 1,420,239 |
| Baidu.com, Inc. sponsored ADR (a) | | 2,400 | 456,144 |
| Baozun, Inc. sponsored ADR (a) | | 4,300 | 171,183 |
| Huazhu Group Ltd. ADR | | 6,700 | 175,272 |
| New Oriental Education & Technology Group, Inc. sponsored ADR | | 4,060 | 237,551 |
| Shenzhou International Group Holdings Ltd. | | 19,000 | 209,820 |
| Sunny Optical Technology Group Co. Ltd. | | 20,200 | 175,161 |
| TAL Education Group ADR (a) | | 8,300 | 240,534 |
| Tencent Holdings Ltd. | | 38,800 | 1,329,259 |
| Value Partners Group Ltd. | | 22,000 | 16,328 |
|
| TOTAL CAYMAN ISLANDS | | | 4,628,261 |
|
| Chile - 0.4% | | | |
| Banco Santander Chile sponsored ADR | | 6,800 | 200,328 |
| Sociedad Quimica y Minera de Chile SA (PN-B) sponsored ADR | | 4,400 | 192,764 |
|
| TOTAL CHILE | | | 393,092 |
|
| China - 2.3% | | | |
| China International Travel Service Corp. Ltd. (A Shares) | | 24,400 | 187,766 |
| Gree Electric Appliances, Inc. of Zhuhai Class A (a) | | 27,200 | 148,407 |
| Hangzhou Hikvision Digital Technology Co. Ltd. Class A | | 46,600 | 161,665 |
| Inner Mongoli Yili Industries Co. Ltd. (A Shares) | | 53,082 | 168,020 |
| Jiangsu Yanghe Brewery Joint-Stock Co. Ltd. Class A | | 13,600 | 172,329 |
| Kweichow Moutai Co. Ltd. (A Shares) | | 2,394 | 188,379 |
| Midea Group Co. Ltd. Class A | | 33,600 | 178,413 |
| Ping An Insurance (Group) Co. of China Ltd. (H Shares) | | 50,000 | 470,865 |
| Shanghai International Airport Co. Ltd. (A Shares) | | 26,100 | 185,396 |
| Shenzhen Inovance Technology Co. Ltd. Class A | | 49,600 | 158,421 |
| Wuliangye Yibin Co. Ltd. Class A | | 23,500 | 162,211 |
| Yunnan Baiyao Group Co. Ltd. (c) | | 16,800 | 169,140 |
|
| TOTAL CHINA | | | 2,351,012 |
|
| Denmark - 0.4% | | | |
| A.P. Moller - Maersk A/S Series B | | 94 | 118,648 |
| Jyske Bank A/S (Reg.) | | 5,054 | 206,629 |
| Netcompany Group A/S | | 700 | 23,151 |
| Scandinavian Tobacco Group A/S (b) | | 950 | 14,415 |
| SimCorp A/S | | 420 | 32,360 |
| Spar Nord Bank A/S | | 4,931 | 40,874 |
|
| TOTAL DENMARK | | | 436,077 |
|
| Finland - 0.7% | | | |
| Nordea Bank ABP (a) | | 32,767 | 284,983 |
| Sampo Oyj (A Shares) | | 6,553 | 301,789 |
| Tikkurila Oyj | | 6,180 | 84,137 |
|
| TOTAL FINLAND | | | 670,909 |
|
| France - 6.8% | | | |
| Accor SA | | 3,400 | 155,658 |
| Atos Origin SA | | 2,197 | 188,573 |
| AXA SA | | 20,306 | 508,192 |
| Bouygues SA | | 5,379 | 196,423 |
| Capgemini SA | | 2,102 | 257,130 |
| Compagnie de St. Gobain | | 4,800 | 180,823 |
| Edenred SA | | 7,300 | 277,238 |
| Elis SA | | 10,751 | 217,118 |
| Hermes International SCA | | 286 | 163,589 |
| Kering SA | | 375 | 167,179 |
| Laurent-Perrier Group SA | | 259 | 26,578 |
| Legrand SA | | 3,600 | 235,437 |
| LVMH Moet Hennessy - Louis Vuitton SA | | 530 | 160,805 |
| Natixis SA | | 38,600 | 225,859 |
| Pernod Ricard SA | | 1,100 | 167,949 |
| Safran SA | | 4,400 | 568,602 |
| Sanofi SA | | 9,428 | 842,491 |
| Societe Generale Series A | | 7,100 | 260,270 |
| SR Teleperformance SA | | 1,200 | 197,897 |
| Thales SA | | 1,120 | 143,348 |
| Total SA (d) | | 17,660 | 1,036,208 |
| Vetoquinol SA | | 600 | 33,640 |
| VINCI SA | | 5,500 | 489,497 |
| Virbac SA (a) | | 150 | 24,091 |
| Vivendi SA | | 10,252 | 247,261 |
|
| TOTAL FRANCE | | | 6,971,856 |
|
| Germany - 5.8% | | | |
| adidas AG | | 747 | 175,987 |
| Bayer AG | | 9,247 | 708,805 |
| Brenntag AG | | 3,400 | 177,801 |
| CompuGroup Medical AG | | 2,146 | 121,533 |
| Continental AG | | 700 | 115,717 |
| CTS Eventim AG | | 1,362 | 51,155 |
| Deutsche Telekom AG | | 30,100 | 493,690 |
| Fresenius SE & Co. KGaA | | 2,300 | 146,178 |
| Hannover Reuck SE | | 2,500 | 337,247 |
| HeidelbergCement Finance AG | | 2,300 | 156,306 |
| Linde PLC | | 5,852 | 960,105 |
| MTU Aero Engines Holdings AG | | 1,400 | 297,796 |
| Nexus AG | | 1,420 | 38,762 |
| SAP SE | | 12,833 | 1,374,074 |
| Vonovia SE | | 12,770 | 584,632 |
| WashTec AG | | 550 | 42,423 |
| Wirecard AG | | 800 | 149,872 |
|
| TOTAL GERMANY | | | 5,932,083 |
|
| Greece - 0.0% | | | |
| Motor Oil (HELLAS) Corinth Refineries SA | | 900 | 21,305 |
| Hong Kong - 1.4% | | | |
| AIA Group Ltd. | | 140,600 | 1,064,099 |
| China Resources Beer Holdings Co. Ltd. | | 54,000 | 187,645 |
| Techtronic Industries Co. Ltd. | | 32,500 | 152,099 |
|
| TOTAL HONG KONG | | | 1,403,843 |
|
| India - 3.5% | | | |
| Adani Ports & Special Economic Zone Ltd. | | 18,374 | 79,212 |
| Asian Paints Ltd. | | 11,646 | 193,743 |
| Dabur India Ltd. | | 30,500 | 158,665 |
| Eicher Motors Ltd. | | 559 | 165,256 |
| Godrej Consumer Products Ltd. | | 18,787 | 184,123 |
| HDFC Bank Ltd. | | 6,357 | 165,029 |
| Hindustan Unilever Ltd. | | 11,000 | 241,194 |
| Housing Development Finance Corp. Ltd. | | 30,394 | 727,077 |
| Indraprastha Gas Ltd. | | 47,178 | 170,507 |
| IndusInd Bank Ltd. | | 8,134 | 156,730 |
| ITC Ltd. | | 59,500 | 225,337 |
| Jyothy Laboratories Ltd. | | 4,788 | 12,255 |
| Kotak Mahindra Bank Ltd. | | 10,386 | 157,159 |
| Maruti Suzuki India Ltd. | | 2,503 | 223,916 |
| Pidilite Industries Ltd. | | 11,690 | 151,554 |
| Reliance Industries Ltd. | | 28,301 | 406,090 |
| Titan Co. Ltd. | | 16,512 | 188,562 |
|
| TOTAL INDIA | | | 3,606,409 |
|
| Indonesia - 0.5% | | | |
| PT Bank Central Asia Tbk | | 161,100 | 250,618 |
| PT Bank Rakyat Indonesia Tbk | | 1,174,300 | 243,318 |
|
| TOTAL INDONESIA | | | 493,936 |
|
| Ireland - 1.3% | | | |
| Accenture PLC Class A | | 1,000 | 157,620 |
| CRH PLC | | 8,118 | 242,145 |
| CRH PLC sponsored ADR | | 18,029 | 536,904 |
| FBD Holdings PLC | | 1,972 | 24,011 |
| James Hardie Industries PLC CDI | | 30,084 | 400,302 |
|
| TOTAL IRELAND | | | 1,360,982 |
|
| Israel - 0.1% | | | |
| Azrieli Group | | 282 | 13,691 |
| Ituran Location & Control Ltd. | | 2,261 | 77,145 |
| Strauss Group Ltd. | | 2,559 | 56,156 |
|
| TOTAL ISRAEL | | | 146,992 |
|
| Italy - 0.7% | | | |
| Assicurazioni Generali SpA | | 9,800 | 158,508 |
| Interpump Group SpA | | 10,191 | 294,342 |
| Intesa Sanpaolo SpA | | 71,700 | 158,821 |
| Mediobanca SpA | | 10,834 | 95,126 |
|
| TOTAL ITALY | | | 706,797 |
|
| Japan - 13.9% | | | |
| Ai Holdings Corp. | | 1,100 | 20,999 |
| Aoki Super Co. Ltd. | | 1,000 | 23,406 |
| Artnature, Inc. | | 2,600 | 15,277 |
| Aucnet, Inc. | | 1,200 | 12,581 |
| Azbil Corp. | | 11,400 | 212,370 |
| Broadleaf Co. Ltd. | | 2,400 | 13,868 |
| Central Automotive Products Ltd. | | 2,400 | 32,649 |
| Coca-Cola West Co. Ltd. | | 800 | 20,951 |
| Daiichikosho Co. Ltd. | | 1,500 | 69,127 |
| Daikokutenbussan Co. Ltd. | | 1,300 | 48,620 |
| DENSO Corp. | | 7,800 | 347,925 |
| East Japan Railway Co. | | 4,200 | 366,819 |
| Fanuc Corp. | | 1,800 | 313,141 |
| Funai Soken Holdings, Inc. | | 1,850 | 39,235 |
| GCA Savvian Group Corp. | | 3,100 | 24,836 |
| Goldcrest Co. Ltd. | | 2,960 | 46,301 |
| Honda Motor Co. Ltd. | | 17,400 | 496,692 |
| Hoya Corp. | | 11,300 | 642,338 |
| Idemitsu Kosan Co. Ltd. | | 4,200 | 191,696 |
| INPEX Corp. | | 11,800 | 134,362 |
| Itochu Corp. | | 22,600 | 419,139 |
| Japan Tobacco, Inc. | | 11,220 | 288,302 |
| Kao Corp. | | 3,300 | 219,523 |
| Keyence Corp. | | 1,942 | 951,767 |
| Kobayashi Pharmaceutical Co. Ltd. | | 600 | 39,349 |
| Komatsu Ltd. | | 9,500 | 247,403 |
| Koshidaka Holdings Co. Ltd. | | 4,900 | 57,019 |
| Kusuri No Aoki Holdings Co. Ltd. | | 600 | 43,072 |
| Lasertec Corp. | | 2,200 | 63,172 |
| Makita Corp. | | 5,200 | 179,962 |
| Medikit Co. Ltd. | | 600 | 32,437 |
| Minebea Mitsumi, Inc. | | 7,800 | 119,325 |
| Miroku Jyoho Service Co., Ltd. | | 1,000 | 18,877 |
| Misumi Group, Inc. | | 17,400 | 349,434 |
| Mitsubishi UFJ Financial Group, Inc. | | 106,700 | 645,801 |
| Mitsuboshi Belting Ltd. | | 1,500 | 36,837 |
| Mitsui Fudosan Co. Ltd. | | 10,800 | 243,240 |
| Nabtesco Corp. | | 8,900 | 196,244 |
| Nagaileben Co. Ltd. | | 2,900 | 65,127 |
| Nakano Refrigerators Co. Ltd. | | 400 | 21,376 |
| ND Software Co. Ltd. | | 1,300 | 14,505 |
| Nihon Parkerizing Co. Ltd. | | 7,500 | 90,597 |
| Nintendo Co. Ltd. | | 1,000 | 312,203 |
| Nomura Holdings, Inc. | | 47,300 | 227,133 |
| NS Tool Co. Ltd. | | 1,000 | 23,521 |
| OBIC Co. Ltd. | | 4,600 | 419,090 |
| Oracle Corp. Japan | | 2,300 | 156,140 |
| ORIX Corp. | | 24,200 | 394,844 |
| OSG Corp. | | 13,200 | 273,043 |
| Panasonic Corp. | | 20,300 | 217,849 |
| Paramount Bed Holdings Co. Ltd. | | 1,800 | 75,854 |
| ProNexus, Inc. | | 2,400 | 23,333 |
| Recruit Holdings Co. Ltd. | | 6,800 | 182,509 |
| San-Ai Oil Co. Ltd. | | 4,900 | 52,937 |
| Shin-Etsu Chemical Co. Ltd. | | 2,900 | 242,326 |
| Shinsei Bank Ltd. | | 13,700 | 208,692 |
| SHO-BOND Holdings Co. Ltd. | | 5,240 | 373,374 |
| Shoei Co. Ltd. | | 2,000 | 78,079 |
| SK Kaken Co. Ltd. | | 20 | 8,481 |
| SoftBank Corp. | | 3,000 | 237,416 |
| Software Service, Inc. | | 500 | 37,666 |
| Sony Corp. | | 4,600 | 248,937 |
| Sony Financial Holdings, Inc. | | 13,700 | 316,052 |
| Subaru Corp. | | 6,100 | 164,546 |
| Sumitomo Mitsui Financial Group, Inc. | | 13,300 | 517,837 |
| T&D Holdings, Inc. | | 15,200 | 242,983 |
| Taiheiyo Cement Corp. | | 4,300 | 126,535 |
| Takeda Pharmaceutical Co. Ltd. | | 9,200 | 381,428 |
| Techno Medica Co. Ltd. | | 500 | 9,190 |
| The Monogatari Corp. | | 280 | 25,014 |
| TKC Corp. | | 1,000 | 38,109 |
| Tocalo Co. Ltd. | | 2,200 | 19,127 |
| Tokio Marine Holdings, Inc. | | 9,400 | 442,854 |
| USS Co. Ltd. | | 38,400 | 693,232 |
| Welcia Holdings Co. Ltd. | | 800 | 40,838 |
| Workman Co. Ltd. | | 700 | 44,295 |
| Yamada Consulting Group Co. Ltd. | | 1,800 | 41,492 |
| Yamato Kogyo Co. Ltd. | | 700 | 18,425 |
|
| TOTAL JAPAN | | | 14,331,085 |
|
| Kenya - 0.3% | | | |
| Safaricom Ltd. | | 1,587,600 | 361,525 |
| Korea (South) - 2.1% | | | |
| BGF Retail Co. Ltd. | | 1,035 | 152,846 |
| Leeno Industrial, Inc. | | 264 | 13,859 |
| LG Chemical Ltd. | | 821 | 249,682 |
| LG Household & Health Care Ltd. | | 239 | 218,682 |
| NAVER Corp. | | 1,235 | 123,933 |
| Samsung Electronics Co. Ltd. | | 36,667 | 1,362,560 |
|
| TOTAL KOREA (SOUTH) | | | 2,121,562 |
|
| Mexico - 0.7% | | | |
| Consorcio ARA S.A.B. de CV | | 41,655 | 11,053 |
| Embotelladoras Arca S.A.B. de CV | | 22,900 | 115,158 |
| Grupo Aeroportuario del Pacifico S.A.B. de CV Series B | | 19,300 | 159,667 |
| Grupo Aeroportuario del Sureste S.A.B. de CV Series B | | 11,070 | 184,002 |
| Wal-Mart de Mexico SA de CV Series V | | 94,400 | 241,097 |
|
| TOTAL MEXICO | | | 710,977 |
|
| Netherlands - 2.2% | | | |
| Aalberts Industries NV | | 2,000 | 73,509 |
| ASML Holding NV (Netherlands) | | 6,000 | 1,033,465 |
| Ferrari NV | | 1,400 | 164,121 |
| ING Groep NV (Certificaten Van Aandelen) | | 25,576 | 302,590 |
| Koninklijke Philips Electronics NV | | 6,715 | 250,442 |
| Takeaway.com Holding BV (a)(b) | | 600 | 35,339 |
| VastNed Retail NV | | 596 | 23,627 |
| Wolters Kluwer NV | | 4,100 | 232,936 |
| Yandex NV Series A (a) | | 5,897 | 177,677 |
|
| TOTAL NETHERLANDS | | | 2,293,706 |
|
| New Zealand - 0.1% | | | |
| Auckland International Airport Ltd. | | 32,937 | 150,236 |
| Norway - 0.7% | | | |
| Equinor ASA | | 18,785 | 488,689 |
| Kongsberg Gruppen ASA | | 2,800 | 46,037 |
| Schibsted ASA (B Shares) | | 5,433 | 172,081 |
| Skandiabanken ASA (b) | | 3,000 | 29,894 |
|
| TOTAL NORWAY | | | 736,701 |
|
| Philippines - 0.8% | | | |
| Ayala Corp. | | 10,760 | 185,250 |
| Ayala Land, Inc. | | 262,200 | 194,551 |
| Jollibee Food Corp. | | 7,250 | 37,446 |
| SM Investments Corp. | | 11,750 | 197,897 |
| SM Prime Holdings, Inc. | | 312,600 | 197,726 |
|
| TOTAL PHILIPPINES | | | 812,870 |
|
| Portugal - 0.2% | | | |
| Galp Energia SGPS SA Class B | | 12,492 | 217,825 |
| Russia - 0.8% | | | |
| Alrosa Co. Ltd. | | 121,400 | 184,108 |
| NOVATEK OAO GDR (Reg. S) | | 1,600 | 271,200 |
| Sberbank of Russia | | 124,490 | 357,820 |
|
| TOTAL RUSSIA | | | 813,128 |
|
| South Africa - 1.9% | | | |
| Capitec Bank Holdings Ltd. | | 2,824 | 189,639 |
| Clicks Group Ltd. | | 20,899 | 266,329 |
| Discovery Ltd. | | 17,322 | 185,437 |
| FirstRand Ltd. | | 59,250 | 258,286 |
| Mondi Ltd. | | 7,914 | 189,303 |
| Naspers Ltd. Class N | | 4,818 | 846,740 |
|
| TOTAL SOUTH AFRICA | | | 1,935,734 |
|
| Spain - 2.6% | | | |
| Amadeus IT Holding SA Class A | | 11,900 | 959,402 |
| Banco Santander SA | | 131,926 | 627,698 |
| Banco Santander SA rights (a) | | 135,826 | 5,277 |
| CaixaBank SA | | 60,006 | 242,827 |
| Grifols SA ADR | | 12,600 | 257,292 |
| Masmovil Ibercom SA (a) | | 821 | 106,567 |
| Merlin Properties Socimi SA | | 9,000 | 112,948 |
| Prosegur Compania de Seguridad SA (Reg.) | | 44,876 | 249,468 |
| Unicaja Banco SA (b) | | 60,300 | 77,246 |
|
| TOTAL SPAIN | | | 2,638,725 |
|
| Sweden - 3.0% | | | |
| Addlife AB | | 1,400 | 32,127 |
| AddTech AB (B Shares) | | 3,000 | 61,304 |
| Alfa Laval AB | | 8,600 | 219,625 |
| ASSA ABLOY AB (B Shares) | | 38,500 | 765,794 |
| Atlas Copco AB (A Shares) | | 15,300 | 378,857 |
| Epiroc AB Class A (a) | | 20,600 | 180,897 |
| Fagerhult AB | | 13,185 | 115,841 |
| Hexagon AB (B Shares) | | 3,300 | 161,770 |
| Investor AB (B Shares) | | 5,855 | 253,813 |
| Lagercrantz Group AB (B Shares) | | 4,300 | 42,337 |
| Loomis AB (B Shares) | | 4,600 | 142,255 |
| Saab AB (B Shares) | | 1,200 | 47,024 |
| Svenska Handelsbanken AB (A Shares) | | 13,145 | 142,884 |
| Swedbank AB (A Shares) | | 15,200 | 342,331 |
| Telefonaktiebolaget LM Ericsson (B Shares) | | 27,800 | 242,048 |
|
| TOTAL SWEDEN | | | 3,128,907 |
|
| Switzerland - 4.4% | | | |
| Credit Suisse Group AG | | 20,393 | 266,611 |
| Nestle SA (Reg. S) | | 15,066 | 1,271,919 |
| Roche Holding AG (participation certificate) | | 4,374 | 1,064,467 |
| Schindler Holding AG: | | | |
| (participation certificate) | | 1,599 | 337,217 |
| (Reg.) | | 280 | 58,160 |
| Sika AG | | 1,404 | 180,109 |
| Swiss Life Holding AG | | 610 | 230,276 |
| Tecan Group AG | | 220 | 49,629 |
| UBS Group AG | | 36,989 | 514,147 |
| Zurich Insurance Group AG | | 1,632 | 506,706 |
|
| TOTAL SWITZERLAND | | | 4,479,241 |
|
| Taiwan - 2.3% | | | |
| Addcn Technology Co. Ltd. | | 3,772 | 29,362 |
| E.SUN Financial Holdings Co. Ltd. | | 298,000 | 197,316 |
| Formosa Chemicals & Fibre Corp. | | 69,000 | 249,608 |
| Formosa Plastics Corp. | | 79,000 | 257,715 |
| Taiwan Semiconductor Manufacturing Co. Ltd. | | 218,035 | 1,635,946 |
|
| TOTAL TAIWAN | | | 2,369,947 |
|
| Thailand - 0.4% | | | |
| Airports of Thailand PCL (For. Reg.) | | 108,500 | 209,409 |
| C.P. ALL PCL (For. Reg.) | | 108,700 | 220,449 |
|
| TOTAL THAILAND | | | 429,858 |
|
| United Arab Emirates - 0.2% | | | |
| National Bank of Abu Dhabi PJSC | | 47,800 | 179,845 |
| United Kingdom - 10.2% | | | |
| Alliance Pharma PLC | | 29,814 | 25,456 |
| Ascential PLC | | 11,562 | 55,686 |
| AstraZeneca PLC (United Kingdom) | | 6,789 | 519,288 |
| Aviva PLC | | 60,513 | 330,697 |
| Avon Rubber PLC | | 1,400 | 21,474 |
| BAE Systems PLC | | 77,135 | 517,212 |
| BHP Billiton PLC | | 41,476 | 827,392 |
| BP PLC | | 142,345 | 1,028,260 |
| British American Tobacco PLC (United Kingdom) | | 12,279 | 532,298 |
| Bunzl PLC | | 7,268 | 214,691 |
| Cineworld Group PLC | | 6,800 | 25,606 |
| Compass Group PLC | | 5,623 | 110,685 |
| Dechra Pharmaceuticals PLC | | 3,400 | 99,347 |
| DP Poland PLC (a) | | 40,100 | 13,839 |
| Elementis PLC | | 60,535 | 158,620 |
| GlaxoSmithKline PLC | | 16,636 | 322,202 |
| Great Portland Estates PLC | | 5,506 | 49,103 |
| Hilton Food Group PLC | | 2,654 | 31,277 |
| Howden Joinery Group PLC | | 3,600 | 21,586 |
| HSBC Holdings PLC sponsored ADR | | 6,031 | 247,814 |
| Imperial Tobacco Group PLC | | 9,374 | 317,878 |
| Informa PLC | | 81,415 | 742,605 |
| InterContinental Hotel Group PLC ADR | | 10,791 | 580,124 |
| ITE Group PLC | | 34,300 | 24,990 |
| ITV PLC | | 49,300 | 93,861 |
| Melrose Industries PLC | | 66,403 | 143,144 |
| Micro Focus International PLC | | 8,258 | 128,017 |
| NMC Health PLC | | 4,062 | 183,383 |
| Prudential PLC | | 33,840 | 677,599 |
| Reckitt Benckiser Group PLC | | 4,251 | 343,753 |
| Rightmove PLC | | 23,500 | 135,815 |
| Royal Dutch Shell PLC Class B sponsored ADR | | 10,200 | 670,242 |
| RSA Insurance Group PLC | | 21,100 | 152,219 |
| Shaftesbury PLC | | 13,837 | 158,647 |
| Spectris PLC | | 10,770 | 295,148 |
| Spirax-Sarco Engineering PLC | | 1,899 | 157,046 |
| Standard Chartered PLC (United Kingdom) | | 22,838 | 160,407 |
| Standard Life PLC | | 52,168 | 180,372 |
| The Weir Group PLC | | 6,604 | 133,878 |
| Topps Tiles PLC | | 16,600 | 13,346 |
| Ultra Electronics Holdings PLC | | 2,001 | 36,779 |
|
| TOTAL UNITED KINGDOM | | | 10,481,786 |
|
| United States of America - 8.9% | | | |
| Alphabet, Inc. Class A (a) | | 590 | 643,442 |
| American Tower Corp. | | 1,200 | 186,972 |
| Amgen, Inc. | | 1,100 | 212,069 |
| Amphenol Corp. Class A | | 1,940 | 173,630 |
| Autoliv, Inc. | | 3,174 | 264,521 |
| Berkshire Hathaway, Inc. Class B (a) | | 1,716 | 352,260 |
| Black Knight, Inc. (a) | | 3,800 | 185,326 |
| ConocoPhillips Co. | | 3,800 | 265,620 |
| Constellation Brands, Inc. Class A (sub. vtg.) | | 800 | 159,384 |
| Marsh & McLennan Companies, Inc. | | 3,200 | 271,200 |
| Martin Marietta Materials, Inc. | | 1,930 | 330,570 |
| MasterCard, Inc. Class A | | 5,753 | 1,137,196 |
| MercadoLibre, Inc. | | 600 | 194,700 |
| Mohawk Industries, Inc. (a) | | 1,565 | 195,202 |
| Moody's Corp. | | 3,239 | 471,210 |
| MSCI, Inc. | | 3,751 | 564,075 |
| NVIDIA Corp. | | 700 | 147,581 |
| PayPal Holdings, Inc. (a) | | 1,800 | 151,542 |
| PriceSmart, Inc. | | 2,385 | 167,308 |
| ResMed, Inc. | | 3,510 | 371,779 |
| S&P Global, Inc. | | 3,101 | 565,374 |
| Sherwin-Williams Co. | | 1,570 | 617,748 |
| TransDigm Group, Inc. (a) | | 496 | 163,804 |
| Veoneer, Inc. (a) | | 3,874 | 130,089 |
| Visa, Inc. Class A | | 8,631 | 1,189,783 |
|
| TOTAL UNITED STATES OF AMERICA | | | 9,112,385 |
|
| TOTAL COMMON STOCKS | | | |
| (Cost $95,720,831) | | | 98,968,835 |
|
| Nonconvertible Preferred Stocks - 1.2% | | | |
| Brazil - 0.8% | | | |
| Itau Unibanco Holding SA | | 45,470 | 601,746 |
| Itausa-Investimentos Itau SA (PN) | | 86,300 | 260,651 |
|
| TOTAL BRAZIL | | | 862,397 |
|
| Germany - 0.2% | | | |
| Porsche Automobil Holding SE (Germany) | | 3,076 | 195,618 |
| Sartorius AG (non-vtg.) | | 380 | 55,092 |
|
| TOTAL GERMANY | | | 250,710 |
|
| Spain - 0.2% | | | |
| Grifols SA Class B | | 8,000 | 166,252 |
| TOTAL NONCONVERTIBLE PREFERRED STOCKS | | | |
| (Cost $1,217,620) | | | 1,279,359 |
|
| Money Market Funds - 1.8% | | | |
| Fidelity Cash Central Fund, 2.23% (e) | | 1,856,306 | 1,856,677 |
| Fidelity Securities Lending Cash Central Fund 2.23% (e)(f) | | 11,140 | 11,141 |
| TOTAL MONEY MARKET FUNDS | | | |
| (Cost $1,867,818) | | | 1,867,818 |
| TOTAL INVESTMENT IN SECURITIES - 99.2% | | | |
| (Cost $98,806,269) | | | 102,116,012 |
| NET OTHER ASSETS (LIABILITIES) - 0.8% | | | 786,878 |
| NET ASSETS - 100% | | | $102,902,890 |
Categorizations in the Schedule of Investments are based on country or territory of incorporation.
Legend
(a) Non-income producing
(b) Security exempt from registration under Rule 144A of the Securities Act of 1933. These securities may be resold in transactions exempt from registration, normally to qualified institutional buyers. At the end of the period, the value of these securities amounted to $182,769 or 0.2% of net assets.
(c) Level 3 security
(d) Security or a portion of the security is on loan at period end.
(e) Affiliated fund that is generally available only to investment companies and other accounts managed by Fidelity Investments. The rate quoted is the annualized seven-day yield of the fund at period end. A complete unaudited listing of the fund's holdings as of its most recent quarter end is available upon request. In addition, each Fidelity Central Fund's financial statements, which are not covered by the Fund's Report of Independent Registered Public Accounting Firm, are available on the SEC's website or upon request.
(f) Investment made with cash collateral received from securities on loan.
Affiliated Central Funds
Information regarding fiscal year to date income earned by the Fund from investments in Fidelity Central Funds is as follows:
| Fund | Income earned |
| Fidelity Cash Central Fund | $27,590 |
| Fidelity Securities Lending Cash Central Fund | 8,525 |
| Total | $36,115 |
Amounts in the income column in the above table include any capital gain distributions from underlying funds, which are presented in the corresponding line-item in the Statement of Operations if applicable.
Investment Valuation
The following is a summary of the inputs used, as of October 31, 2018, involving the Fund's assets and liabilities carried at fair value. The inputs or methodology used for valuing securities may not be an indication of the risk associated with investing in those securities. For more information on valuation inputs, and their aggregation into the levels used below, please refer to the Investment Valuation section in the accompanying Notes to Financial Statements.
| | Valuation Inputs at Reporting Date: |
| Description | Total | Level 1 | Level 2 | Level 3 |
| Investments in Securities: | | | | |
| Equities: | | | | |
| Communication Services | $7,096,993 | $4,313,086 | $2,783,907 | $-- |
| Consumer Discretionary | 9,448,645 | 7,616,273 | 1,832,372 | -- |
| Consumer Staples | 7,493,811 | 4,838,016 | 2,655,795 | -- |
| Energy | 5,806,877 | 3,608,047 | 2,198,830 | -- |
| Financials | 22,806,295 | 15,657,199 | 7,149,096 | -- |
| Health Care | 8,319,135 | 3,748,442 | 4,401,553 | 169,140 |
| Industrials | 14,882,148 | 10,593,236 | 4,288,912 | -- |
| Information Technology | 14,009,382 | 9,595,832 | 4,413,550 | -- |
| Materials | 8,402,963 | 6,964,565 | 1,438,398 | -- |
| Real Estate | 1,811,438 | 1,568,198 | 243,240 | -- |
| Utilities | 170,507 | 170,507 | -- | -- |
| Money Market Funds | 1,867,818 | 1,867,818 | -- | -- |
| Total Investments in Securities: | $102,116,012 | $70,541,219 | $31,405,653 | $169,140 |
The following is a summary of transfers between Level 1 and Level 2 for the period ended October 31, 2018. Transfers are assumed to have occurred at the beginning of the period, and are primarily attributable to the valuation techniques used for foreign equity securities, as discussed in the accompanying Notes to Financial Statements:
| Transfers | Total |
| Level 1 to Level 2 | $2,922,813 |
| Level 2 to Level 1 | $6,897,699 |
See accompanying notes which are an integral part of the financial statements.
Financial Statements
Statement of Assets and Liabilities
| | | October 31, 2018 |
| Assets | | |
Investment in securities, at value (including securities loaned of $10,833) — See accompanying schedule:
Unaffiliated issuers (cost $96,938,451) | $100,248,194 | |
| Fidelity Central Funds (cost $1,867,818) | 1,867,818 | |
| Total Investment in Securities (cost $98,806,269) | | $102,116,012 |
| Foreign currency held at value (cost $49,186) | | 49,040 |
| Receivable for investments sold | | 1,338,666 |
| Receivable for fund shares sold | | 56,830 |
| Dividends receivable | | 703,592 |
| Distributions receivable from Fidelity Central Funds | | 3,016 |
| Prepaid expenses | | 225 |
| Receivable from investment adviser for expense reductions | | 27,180 |
| Other receivables | | 33,436 |
| Total assets | | 104,327,997 |
| Liabilities | | |
| Payable to custodian bank | $69,044 | |
| Payable for investments purchased | 639,640 | |
| Payable for fund shares redeemed | 532,597 | |
| Accrued management fee | 53,943 | |
| Distribution and service plan fees payable | 9,122 | |
| Other affiliated payables | 22,237 | |
| Other payables and accrued expenses | 87,383 | |
| Collateral on securities loaned | 11,141 | |
| Total liabilities | | 1,425,107 |
| Net Assets | | $102,902,890 |
| Net Assets consist of: | | |
| Paid in capital | | $104,331,835 |
| Total distributable earnings (loss) | | (1,428,945) |
| Net Assets | | $102,902,890 |
| Net Asset Value and Maximum Offering Price | | |
| Class A: | | |
| Net Asset Value and redemption price per share ($7,525,893 ÷ 917,821 shares) | | $8.20 |
| Maximum offering price per share (100/94.25 of $8.20) | | $8.70 |
| Class M: | | |
| Net Asset Value and redemption price per share ($11,881,668 ÷ 1,444,790 shares) | | $8.22 |
| Maximum offering price per share (100/96.50 of $8.22) | | $8.52 |
| Class C: | | |
| Net Asset Value and offering price per share ($2,705,127 ÷ 330,913 shares)(a) | | $8.17 |
| Total International Equity: | | |
| Net Asset Value, offering price and redemption price per share ($71,169,797 ÷ 8,644,047 shares) | | $8.23 |
| Class I: | | |
| Net Asset Value, offering price and redemption price per share ($9,404,779 ÷ 1,147,697 shares) | | $8.19 |
| Class Z: | | |
| Net Asset Value, offering price and redemption price per share ($215,626 ÷ 26,231 shares) | | $8.22 |
(a) Redemption price per share is equal to net asset value less any applicable contingent deferred sales charge.
See accompanying notes which are an integral part of the financial statements.
Statement of Operations
| | | Year ended October 31, 2018 |
| Investment Income | | |
| Dividends | | $3,030,878 |
| Income from Fidelity Central Funds | | 36,115 |
| Income before foreign taxes withheld | | 3,066,993 |
| Less foreign taxes withheld | | (277,649) |
| Total income | | 2,789,344 |
| Expenses | | |
| Management fee | | |
| Basic fee | $825,140 | |
| Performance adjustment | 90,717 | |
| Transfer agent fees | 223,342 | |
| Distribution and service plan fees | 128,435 | |
| Accounting and security lending fees | 62,000 | |
| Custodian fees and expenses | 131,283 | |
| Independent trustees' fees and expenses | 598 | |
| Registration fees | 81,892 | |
| Audit | 139,052 | |
| Legal | 3,456 | |
| Miscellaneous | 871 | |
| Total expenses before reductions | 1,686,786 | |
| Expense reductions | (138,550) | |
| Total expenses after reductions | | 1,548,236 |
| Net investment income (loss) | | 1,241,108 |
| Realized and Unrealized Gain (Loss) | | |
| Net realized gain (loss) on: | | |
| Investment securities: | | |
| Unaffiliated issuers | 1,035,720 | |
| Fidelity Central Funds | 246 | |
| Foreign currency transactions | (14,087) | |
| Total net realized gain (loss) | | 1,021,879 |
| Change in net unrealized appreciation (depreciation) on: | | |
| Investment securities: | | |
| Unaffiliated issuers (net of decrease in deferred foreign taxes of $111,264) | (12,588,089) | |
| Assets and liabilities in foreign currencies | (15,037) | |
| Total change in net unrealized appreciation (depreciation) | | (12,603,126) |
| Net gain (loss) | | (11,581,247) |
| Net increase (decrease) in net assets resulting from operations | | $(10,340,139) |
See accompanying notes which are an integral part of the financial statements.
Statement of Changes in Net Assets
| | Year ended October 31, 2018 | Year ended October 31, 2017 |
| Increase (Decrease) in Net Assets | | |
| Operations | | |
| Net investment income (loss) | $1,241,108 | $2,786,915 |
| Net realized gain (loss) | 1,021,879 | 70,763,610 |
| Change in net unrealized appreciation (depreciation) | (12,603,126) | (21,931,310) |
| Net increase (decrease) in net assets resulting from operations | (10,340,139) | 51,619,215 |
| Distributions to shareholders | (4,673,480) | – |
| Distributions to shareholders from net investment income | – | (4,227,310) |
| Total distributions | (4,673,480) | (4,227,310) |
| Share transactions - net increase (decrease) | 419,996 | (237,908,011) |
| Redemption fees | 13 | 2,629 |
| Total increase (decrease) in net assets | (14,593,610) | (190,513,477) |
| Net Assets | | |
| Beginning of period | 117,496,500 | 308,009,977 |
| End of period | $102,902,890 | $117,496,500 |
| Other Information | | |
| Undistributed net investment income end of period | | $1,842,046 |
See accompanying notes which are an integral part of the financial statements.
Financial Highlights
Fidelity Total International Equity Fund Class A
| Years ended October 31, | 2018 | 2017 | 2016 | 2015 | 2014 |
| Selected Per–Share Data | | | | | |
| Net asset value, beginning of period | $9.39 | $7.67 | $7.79 | $8.00 | $8.27 |
| Income from Investment Operations | | | | | |
| Net investment income (loss)A | .08 | .09 | .08 | .07 | .13 |
| Net realized and unrealized gain (loss) | (.89) | 1.71 | (.14) | (.14) | (.12) |
| Total from investment operations | (.81) | 1.80 | (.06) | (.07) | .01 |
| Distributions from net investment income | (.15) | (.08) | (.06) | (.10) | (.10) |
| Distributions from net realized gain | (.23) | – | – | (.04) | (.18) |
| Total distributions | (.38) | (.08) | (.06) | (.14) | (.28) |
| Redemption fees added to paid in capitalA,B | – | – | – | – | – |
| Net asset value, end of period | $8.20 | $9.39 | $7.67 | $7.79 | $8.00 |
| Total ReturnC,D | (9.04)% | 23.78% | (.76)% | (.89)% | .19% |
| Ratios to Average Net AssetsE,F | | | | | |
| Expenses before reductions | 1.60% | 1.67% | 1.52% | 1.48% | 1.44% |
| Expenses net of fee waivers, if any | 1.45% | 1.45% | 1.45% | 1.45% | 1.44% |
| Expenses net of all reductions | 1.44% | 1.43% | 1.45% | 1.44% | 1.44% |
| Net investment income (loss) | .90% | 1.02% | 1.10% | .86% | 1.63% |
| Supplemental Data | | | | | |
| Net assets, end of period (000 omitted) | $7,526 | $9,292 | $8,576 | $9,163 | $9,164 |
| Portfolio turnover rateG | 52% | 66%H | 51% | 53% | 85% |
A Calculated based on average shares outstanding during the period.
B Amount represents less than $.005 per share.
C Total returns would have been lower if certain expenses had not been reduced during the applicable periods shown.
D Total returns do not include the effect of the sales charges.
E Fees and expenses of any underlying Fidelity Central Funds are not included in the Fund's expense ratio. The Fund indirectly bears its proportionate share of the expenses of any underlying Fidelity Central Funds.
F Expense ratios reflect operating expenses of the class. Expenses before reductions do not reflect amounts reimbursed by the investment adviser or reductions from brokerage service arrangements or reductions from other expense offset arrangements and do not represent the amount paid by the class during periods when reimbursements or reductions occur. Expenses net of fee waivers reflect expenses after reimbursement by the investment adviser but prior to reductions from brokerage service arrangements or other expense offset arrangements. Expenses net of all reductions represent the net expenses paid by the class.
G Amount does not include the portfolio activity of any underlying Fidelity Central Funds.
H Portfolio turnover rate excludes securities received or delivered in-kind.
See accompanying notes which are an integral part of the financial statements.
Fidelity Total International Equity Fund Class M
| Years ended October 31, | 2018 | 2017 | 2016 | 2015 | 2014 |
| Selected Per–Share Data | | | | | |
| Net asset value, beginning of period | $9.42 | $7.70 | $7.81 | $8.04 | $8.32 |
| Income from Investment Operations | | | | | |
| Net investment income (loss)A | .06 | .06 | .06 | .05 | .11 |
| Net realized and unrealized gain (loss) | (.90) | 1.73 | (.13) | (.15) | (.12) |
| Total from investment operations | (.84) | 1.79 | (.07) | (.10) | (.01) |
| Distributions from net investment income | (.13) | (.07) | (.04) | (.09) | (.09) |
| Distributions from net realized gain | (.23) | – | – | (.04) | (.18) |
| Total distributions | (.36) | (.07) | (.04) | (.13) | (.27) |
| Redemption fees added to paid in capitalA,B | – | – | – | – | – |
| Net asset value, end of period | $8.22 | $9.42 | $7.70 | $7.81 | $8.04 |
| Total ReturnC,D | (9.30)% | 23.41% | (.86)% | (1.26)% | (.06)% |
| Ratios to Average Net AssetsE,F | | | | | |
| Expenses before reductions | 1.85% | 1.90% | 1.73% | 1.70% | 1.68% |
| Expenses net of fee waivers, if any | 1.70% | 1.70% | 1.70% | 1.70% | 1.68% |
| Expenses net of all reductions | 1.69% | 1.68% | 1.69% | 1.69% | 1.68% |
| Net investment income (loss) | .65% | .77% | .85% | .61% | 1.38% |
| Supplemental Data | | | | | |
| Net assets, end of period (000 omitted) | $11,882 | $15,894 | $13,893 | $13,962 | $10,282 |
| Portfolio turnover rateG | 52% | 66%H | 51% | 53% | 85% |
A Calculated based on average shares outstanding during the period.
B Amount represents less than $.005 per share.
C Total returns would have been lower if certain expenses had not been reduced during the applicable periods shown.
D Total returns do not include the effect of the sales charges.
E Fees and expenses of any underlying Fidelity Central Funds are not included in the Fund's expense ratio. The Fund indirectly bears its proportionate share of the expenses of any underlying Fidelity Central Funds.
F Expense ratios reflect operating expenses of the class. Expenses before reductions do not reflect amounts reimbursed by the investment adviser or reductions from brokerage service arrangements or reductions from other expense offset arrangements and do not represent the amount paid by the class during periods when reimbursements or reductions occur. Expenses net of fee waivers reflect expenses after reimbursement by the investment adviser but prior to reductions from brokerage service arrangements or other expense offset arrangements. Expenses net of all reductions represent the net expenses paid by the class.
G Amount does not include the portfolio activity of any underlying Fidelity Central Funds.
H Portfolio turnover rate excludes securities received or delivered in-kind.
See accompanying notes which are an integral part of the financial statements.
Fidelity Total International Equity Fund Class C
| Years ended October 31, | 2018 | 2017 | 2016 | 2015 | 2014 |
| Selected Per–Share Data | | | | | |
| Net asset value, beginning of period | $9.37 | $7.66 | $7.77 | $8.00 | $8.28 |
| Income from Investment Operations | | | | | |
| Net investment income (loss)A | .01 | .02 | .03 | .01 | .07 |
| Net realized and unrealized gain (loss) | (.89) | 1.71 | (.14) | (.15) | (.12) |
| Total from investment operations | (.88) | 1.73 | (.11) | (.14) | (.05) |
| Distributions from net investment income | (.10) | (.02) | – | (.05) | (.05) |
| Distributions from net realized gain | (.23) | – | – | (.04) | (.18) |
| Total distributions | (.32)B | (.02) | – | (.09) | (.23) |
| Redemption fees added to paid in capitalA,C | – | – | – | – | – |
| Net asset value, end of period | $8.17 | $9.37 | $7.66 | $7.77 | $8.00 |
| Total ReturnD,E | (9.72)% | 22.70% | (1.42)% | (1.73)% | (.57)% |
| Ratios to Average Net AssetsF,G | | | | | |
| Expenses before reductions | 2.43% | 2.48% | 2.30% | 2.26% | 2.22% |
| Expenses net of fee waivers, if any | 2.20% | 2.20% | 2.20% | 2.20% | 2.20% |
| Expenses net of all reductions | 2.19% | 2.18% | 2.20% | 2.19% | 2.20% |
| Net investment income (loss) | .14% | .27% | .35% | .11% | .87% |
| Supplemental Data | | | | | |
| Net assets, end of period (000 omitted) | $2,705 | $3,211 | $2,713 | $3,311 | $4,028 |
| Portfolio turnover rateH | 52% | 66%I | 51% | 53% | 85% |
A Calculated based on average shares outstanding during the period.
B Total distributions of $.32 per share is comprised of distributions from net investment income of $.097 and distributions from net realized gain of $.226 per share.
C Amount represents less than $.005 per share.
D Total returns would have been lower if certain expenses had not been reduced during the applicable periods shown.
E Total returns do not include the effect of the contingent deferred sales charge.
F Fees and expenses of any underlying Fidelity Central Funds are not included in the Fund's expense ratio. The Fund indirectly bears its proportionate share of the expenses of any underlying Fidelity Central Funds.
G Expense ratios reflect operating expenses of the class. Expenses before reductions do not reflect amounts reimbursed by the investment adviser or reductions from brokerage service arrangements or reductions from other expense offset arrangements and do not represent the amount paid by the class during periods when reimbursements or reductions occur. Expenses net of fee waivers reflect expenses after reimbursement by the investment adviser but prior to reductions from brokerage service arrangements or other expense offset arrangements. Expenses net of all reductions represent the net expenses paid by the class.
H Amount does not include the portfolio activity of any underlying Fidelity Central Funds.
I Portfolio turnover rate excludes securities received or delivered in-kind.
See accompanying notes which are an integral part of the financial statements.
Fidelity Total International Equity Fund
| Years ended October 31, | 2018 | 2017 | 2016 | 2015 | 2014 |
| Selected Per–Share Data | | | | | |
| Net asset value, beginning of period | $9.40 | $7.70 | $7.82 | $8.03 | $8.29 |
| Income from Investment Operations | | | | | |
| Net investment income (loss)A | .11 | .11 | .11 | .10 | .16 |
| Net realized and unrealized gain (loss) | (.90) | 1.70 | (.13) | (.14) | (.12) |
| Total from investment operations | (.79) | 1.81 | (.02) | (.04) | .04 |
| Distributions from net investment income | (.15) | (.11) | (.10) | (.13) | (.12) |
| Distributions from net realized gain | (.23) | – | – | (.04) | (.18) |
| Total distributions | (.38) | (.11) | (.10) | (.17) | (.30) |
| Redemption fees added to paid in capitalA,B | – | – | – | – | – |
| Net asset value, end of period | $8.23 | $9.40 | $7.70 | $7.82 | $8.03 |
| Total ReturnC | (8.84)% | 23.86% | (.32)% | (.51)% | .55% |
| Ratios to Average Net AssetsD,E | | | | | |
| Expenses before reductions | 1.29% | 1.15% | 1.11% | 1.07% | 1.04% |
| Expenses net of fee waivers, if any | 1.20% | 1.14% | 1.11% | 1.07% | 1.04% |
| Expenses net of all reductions | 1.19% | 1.13% | 1.10% | 1.06% | 1.04% |
| Net investment income (loss) | 1.15% | 1.33% | 1.44% | 1.24% | 2.03% |
| Supplemental Data | | | | | |
| Net assets, end of period (000 omitted) | $71,170 | $82,077 | $280,672 | $307,035 | $324,438 |
| Portfolio turnover rateF | 52% | 66%G | 51% | 53% | 85% |
A Calculated based on average shares outstanding during the period.
B Amount represents less than $.005 per share.
C Total returns would have been lower if certain expenses had not been reduced during the applicable periods shown.
D Fees and expenses of any underlying Fidelity Central Funds are not included in the Fund's expense ratio. The Fund indirectly bears its proportionate share of the expenses of any underlying Fidelity Central Funds.
E Expense ratios reflect operating expenses of the class. Expenses before reductions do not reflect amounts reimbursed by the investment adviser or reductions from brokerage service arrangements or reductions from other expense offset arrangements and do not represent the amount paid by the class during periods when reimbursements or reductions occur. Expenses net of fee waivers reflect expenses after reimbursement by the investment adviser but prior to reductions from brokerage service arrangements or other expense offset arrangements. Expenses net of all reductions represent the net expenses paid by the class.
F Amount does not include the portfolio activity of any underlying Fidelity Central Funds.
G Portfolio turnover rate excludes securities received or delivered in-kind.
See accompanying notes which are an integral part of the financial statements.
Fidelity Total International Equity Fund Class I
| Years ended October 31, | 2018 | 2017 | 2016 | 2015 | 2014 |
| Selected Per–Share Data | | | | | |
| Net asset value, beginning of period | $9.38 | $7.66 | $7.78 | $7.99 | $8.26 |
| Income from Investment Operations | | | | | |
| Net investment income (loss)A | .10 | .11 | .10 | .09 | .15 |
| Net realized and unrealized gain (loss) | (.89) | 1.71 | (.13) | (.14) | (.12) |
| Total from investment operations | (.79) | 1.82 | (.03) | (.05) | .03 |
| Distributions from net investment income | (.17) | (.10) | (.09) | (.12) | (.12) |
| Distributions from net realized gain | (.23) | – | – | (.04) | (.18) |
| Total distributions | (.40) | (.10) | (.09) | (.16) | (.30) |
| Redemption fees added to paid in capitalA,B | – | – | – | – | – |
| Net asset value, end of period | $8.19 | $9.38 | $7.66 | $7.78 | $7.99 |
| Total ReturnC | (8.86)% | 24.08% | (.43)% | (.64)% | .37% |
| Ratios to Average Net AssetsD,E | | | | | |
| Expenses before reductions | 1.29% | 1.42% | 1.22% | 1.17% | 1.15% |
| Expenses net of fee waivers, if any | 1.20% | 1.20% | 1.20% | 1.17% | 1.15% |
| Expenses net of all reductions | 1.19% | 1.18% | 1.20% | 1.16% | 1.15% |
| Net investment income (loss) | 1.15% | 1.28% | 1.35% | 1.14% | 1.91% |
| Supplemental Data | | | | | |
| Net assets, end of period (000 omitted) | $9,405 | $6,776 | $2,156 | $2,602 | $2,240 |
| Portfolio turnover rateF | 52% | 66%G | 51% | 53% | 85% |
A Calculated based on average shares outstanding during the period.
B Amount represents less than $.005 per share.
C Total returns would have been lower if certain expenses had not been reduced during the applicable periods shown.
D Fees and expenses of any underlying Fidelity Central Funds are not included in the Fund's expense ratio. The Fund indirectly bears its proportionate share of the expenses of any underlying Fidelity Central Funds.
E Expense ratios reflect operating expenses of the class. Expenses before reductions do not reflect amounts reimbursed by the investment adviser or reductions from brokerage service arrangements or reductions from other expense offset arrangements and do not represent the amount paid by the class during periods when reimbursements or reductions occur. Expenses net of fee waivers reflect expenses after reimbursement by the investment adviser but prior to reductions from brokerage service arrangements or other expense offset arrangements. Expenses net of all reductions represent the net expenses paid by the class.
F Amount does not include the portfolio activity of any underlying Fidelity Central Funds.
G Portfolio turnover rate excludes securities received or delivered in-kind.
See accompanying notes which are an integral part of the financial statements.
Fidelity Total International Equity Fund Class Z
| Years ended October 31, | 2018 | 2017 A |
| Selected Per–Share Data | | |
| Net asset value, beginning of period | $9.39 | $7.73 |
| Income from Investment Operations | | |
| Net investment income (loss)B | .12 | .08 |
| Net realized and unrealized gain (loss) | (.89) | 1.58 |
| Total from investment operations | (.77) | 1.66 |
| Distributions from net investment income | (.17) | – |
| Distributions from net realized gain | (.23) | – |
| Total distributions | (.40) | – |
| Redemption fees added to paid in capitalB,C | – | – |
| Net asset value, end of period | $8.22 | $9.39 |
| Total ReturnD,E | (8.63)% | 21.47% |
| Ratios to Average Net AssetsF,G | | |
| Expenses before reductions | 1.16% | 1.32%H |
| Expenses net of fee waivers, if any | 1.05% | 1.05%H |
| Expenses net of all reductions | 1.04% | 1.04%H |
| Net investment income (loss) | 1.30% | 1.27%H |
| Supplemental Data | | |
| Net assets, end of period (000 omitted) | $216 | $246 |
| Portfolio turnover rateI | 52% | 66%J |
A For the period February 1, 2017 (commencement of sale of shares) to October 31, 2017.
B Calculated based on average shares outstanding during the period.
C Amount represents less than $.005 per share.
D Total returns for periods of less than one year are not annualized.
E Total returns would have been lower if certain expenses had not been reduced during the applicable periods shown.
F Fees and expenses of any underlying Fidelity Central Funds are not included in the Fund's expense ratio. The Fund indirectly bears its proportionate share of the expenses of any underlying Fidelity Central Funds.
G Expense ratios reflect operating expenses of the class. Expenses before reductions do not reflect amounts reimbursed by the investment adviser or reductions from brokerage service arrangements or reductions from other expense offset arrangements and do not represent the amount paid by the class during periods when reimbursements or reductions occur. Expense ratios before reductions for start-up periods may not be representative of longer-term operating periods. Expenses net of fee waivers reflect expenses after reimbursement by the investment adviser but prior to reductions from brokerage service arrangements or other expense offset arrangements. Expenses net of all reductions represent the net expenses paid by the class.
H Annualized
I Amount does not include the portfolio activity of any underlying Fidelity Central Funds.
J Portfolio turnover rate excludes securities received or delivered in-kind.
See accompanying notes which are an integral part of the financial statements.
Notes to Financial Statements
For the period ended October 31, 2018
1. Organization.
Fidelity Total International Equity Fund (the Fund) is a fund of Fidelity Investment Trust (the Trust) and is authorized to issue an unlimited number of shares. The Trust is registered under the Investment Company Act of 1940, as amended (the 1940 Act), as an open-end management investment company organized as a Massachusetts business trust. The Fund offers Class A, Class M, Class C, Total International Equity, Class I and Class Z shares, each of which has equal rights as to assets and voting privileges. Each class has exclusive voting rights with respect to matters that affect that class. The Fund's investments in emerging markets can be subject to social, economic, regulatory, and political uncertainties and can be extremely volatile.
2. Investments in Fidelity Central Funds.
The Fund invests in Fidelity Central Funds, which are open-end investment companies generally available only to other investment companies and accounts managed by the investment adviser and its affiliates. The Fund's Schedule of Investments lists each of the Fidelity Central Funds held as of period end, if any, as an investment of the Fund, but does not include the underlying holdings of each Fidelity Central Fund. As an Investing Fund, the Fund indirectly bears its proportionate share of the expenses of the underlying Fidelity Central Funds.
The Money Market Central Funds seek preservation of capital and current income and are managed by Fidelity Investments Money Management, Inc. (FIMM), an affiliate of the investment adviser. Annualized expenses of the Money Market Central Funds as of their most recent shareholder report date are less than .005%.
A complete unaudited list of holdings for each Fidelity Central Fund is available upon request or at the Securities and Exchange Commission (the SEC) website at www.sec.gov. In addition, the financial statements of the Fidelity Central Funds, which are not covered by the Fund's Report of Independent Registered Public Accounting Firm, are available on the SEC website or upon request.
3. Significant Accounting Policies.
The Fund is an investment company and applies the accounting and reporting guidance of the Financial Accounting Standards Board (FASB) Accounting Standards Codification Topic 946 Financial Services – Investments Companies. The financial statements have been prepared in conformity with accounting principles generally accepted in the United States of America (GAAP), which require management to make certain estimates and assumptions at the date of the financial statements. Actual results could differ from those estimates. Subsequent events, if any, through the date that the financial statements were issued have been evaluated in the preparation of the financial statements. The following summarizes the significant accounting policies of the Fund:
Investment Valuation. Investments are valued as of 4:00 p.m. Eastern time on the last calendar day of the period. The Board of Trustees (the Board) has delegated the day to day responsibility for the valuation of the Fund's investments to the Fair Value Committee (the Committee) established by the Fund's investment adviser. In accordance with valuation policies and procedures approved by the Board, the Fund attempts to obtain prices from one or more third party pricing vendors or brokers to value its investments. When current market prices, quotations or currency exchange rates are not readily available or reliable, investments will be fair valued in good faith by the Committee, in accordance with procedures adopted by the Board. Factors used in determining fair value vary by investment type and may include market or investment specific events. The frequency with which these procedures are used cannot be predicted and they may be utilized to a significant extent. The Committee oversees the Fund's valuation policies and procedures and reports to the Board on the Committee's activities and fair value determinations. The Board monitors the appropriateness of the procedures used in valuing the Fund's investments and ratifies the fair value determinations of the Committee.
The Fund categorizes the inputs to valuation techniques used to value its investments into a disclosure hierarchy consisting of three levels as shown below:
- Level 1 – quoted prices in active markets for identical investments
- Level 2 – other significant observable inputs (including quoted prices for similar investments, interest rates, prepayment speeds, etc.)
- Level 3 – unobservable inputs (including the Fund's own assumptions based on the best information available)
Valuation techniques used to value the Fund's investments by major category are as follows:
Equity securities, including restricted securities, for which market quotations are readily available, are valued at the last reported sale price or official closing price as reported by a third party pricing vendor on the primary market or exchange on which they are traded and are categorized as Level 1 in the hierarchy. In the event there were no sales during the day or closing prices are not available, securities are valued at the last quoted bid price or may be valued using the last available price and are generally categorized as Level 2 in the hierarchy. For foreign equity securities, when market or security specific events arise, comparisons to the valuation of American Depositary Receipts (ADRs), futures contracts, Exchange-Traded Funds (ETFs) and certain indexes as well as quoted prices for similar securities may be used and would be categorized as Level 2 in the hierarchy. Utilizing these techniques may result in transfers between Level 1 and Level 2. For equity securities, including restricted securities, where observable inputs are limited, assumptions about market activity and risk are used and these securities may be categorized as Level 3 in the hierarchy.
Investments in open-end mutual funds, including Fidelity Central Funds, are valued at their closing net asset value (NAV) each business day and are categorized as Level 1 in the hierarchy.
Changes in valuation techniques may result in transfers in or out of an assigned level within the disclosure hierarchy. The aggregate value of investments by input level as of October 31, 2018, including information on transfers between Levels 1 and 2, is included at the end of the Fund's Schedule of Investments.
Foreign Currency. The Fund may use foreign currency contracts to facilitate transactions in foreign-denominated securities. Gains and losses from these transactions may arise from changes in the value of the foreign currency or if the counterparties do not perform under the contracts' terms.
Foreign-denominated assets, including investment securities, and liabilities are translated into U.S. dollars at the exchange rates at period end. Purchases and sales of investment securities, income and dividends received and expenses denominated in foreign currencies are translated into U.S. dollars at the exchange rate in effect on the transaction date.
The effects of exchange rate fluctuations on investments are included with the net realized and unrealized gain (loss) on investment securities. Other foreign currency transactions resulting in realized and unrealized gain (loss) are disclosed separately.
Investment Transactions and Income. For financial reporting purposes, the Fund's investment holdings and NAV include trades executed through the end of the last business day of the period. The NAV per share for processing shareholder transactions is calculated as of the close of business of the New York Stock Exchange (NYSE), normally 4:00 p.m. Eastern time and includes trades executed through the end of the prior business day. Gains and losses on securities sold are determined on the basis of identified cost and include proceeds received from litigation. Dividend income is recorded on the ex-dividend date, except for certain dividends from foreign securities where the ex-dividend date may have passed, which are recorded as soon as the Fund is informed of the ex-dividend date. Non-cash dividends included in dividend income, if any, are recorded at the fair market value of the securities received. Income and capital gain distributions from Fidelity Central Funds, if any, are recorded on the ex-dividend date. Certain distributions received by the Fund represent a return of capital or capital gain. The Fund determines the components of these distributions subsequent to the ex-dividend date, based upon receipt of tax filings or other correspondence relating to the underlying investment. These distributions are recorded as a reduction of cost of investments and/or as a realized gain. Investment income is recorded net of foreign taxes withheld where recovery of such taxes is uncertain.
Class Allocations and Expenses. Investment income, realized and unrealized capital gains and losses, common expenses of the Fund, and certain fund-level expense reductions, if any, are allocated daily on a pro-rata basis to each class based on the relative net assets of each class to the total net assets of the Fund. Each class differs with respect to transfer agent and distribution and service plan fees incurred. Certain expense reductions may also differ by class. For the reporting period, the allocated portion of income and expenses to each class as a percent of its average net assets may vary due to the timing of recording these transactions in relation to fluctuating net assets of the classes. Expenses directly attributable to a fund are charged to that fund. Expenses attributable to more than one fund are allocated among the respective funds on the basis of relative net assets or other appropriate methods. Expense estimates are accrued in the period to which they relate and adjustments are made when actual amounts are known.
Income Tax Information and Distributions to Shareholders. Each year, the Fund intends to qualify as a regulated investment company under Subchapter M of the Internal Revenue Code, including distributing substantially all of its taxable income and realized gains. As a result, no provision for U.S. Federal income taxes is required. As of October 31, 2018, the Fund did not have any unrecognized tax benefits in the financial statements; nor is the Fund aware of any tax positions for which it is reasonably possible that the total amounts of unrecognized tax benefits will significantly change in the next twelve months. The Fund files a U.S. federal tax return, in addition to state and local tax returns as required. The Fund's federal income tax returns are subject to examination by the Internal Revenue Service (IRS) for a period of three fiscal years after they are filed. State and local tax returns may be subject to examination for an additional fiscal year depending on the jurisdiction. Foreign taxes are provided for based on the Fund's understanding of the tax rules and rates that exist in the foreign markets in which it invests.
Distributions are declared and recorded on the ex-dividend date. Income and capital gain distributions are declared separately for each class. Income and capital gain distributions are determined in accordance with income tax regulations, which may differ from GAAP. In addition, the Fund claimed a portion of the payment made to redeeming shareholders as a distribution for income tax purposes.
Capital accounts within the financial statements are adjusted for permanent book-tax differences. These adjustments have no impact on net assets or the results of operations. Capital accounts are not adjusted for temporary book-tax differences which will reverse in a subsequent period.
Book-tax differences are primarily due to foreign currency transactions, certain foreign taxes, passive foreign investment companies (PFIC), capital loss carryforwards and losses deferred due to wash sales.
As of period end, the cost and unrealized appreciation (depreciation) in securities, and derivatives if applicable, for federal income tax purposes were as follows:
| Gross unrealized appreciation | $10,915,083 |
| Gross unrealized depreciation | (8,544,527) |
| Net unrealized appreciation (depreciation) | $2,370,556 |
| Tax Cost | $99,745,456 |
The tax-based components of distributable earnings as of period end were as follows:
| Undistributed ordinary income | $ 686,540 |
| Capital loss carryforward | $(4,471,369) |
| Net unrealized appreciation (depreciation) on securities and other investments | $2,355,885 |
Capital loss carryforwards are only available to offset future capital gains of the Fund to the extent provided by regulations and may be limited. Under the Regulated Investment Company Modernization Act of 2010 (the Act), the Fund is permitted to carry forward capital losses incurred in taxable years beginning after December 22, 2010 for an unlimited period and such capital losses are required to be used prior to any losses that expire. The capital loss carryforward information presented below, including any applicable limitation, is estimated as of fiscal period end and is subject to adjustment.
| Fiscal year of expiration | |
| 2019 | $(4,471,369) |
The tax character of distributions paid was as follows:
| | October 31, 2018 | October 31, 2017 |
| Ordinary Income | $3,308,669 | $ 4,227,310 |
| Long-term Capital Gains | 1,364,811 | – |
| Total | $4,673,480 | $ 4,227,310 |
Short-Term Trading (Redemption) Fees. During the period, shares held by investors in the Fund less than 30 days may have been subject to a redemption fee equal to 1.00% of the NAV of shares redeemed. All redemption fees, which reduce the proceeds of the shareholder redemption, are retained by the Fund and accounted for as an addition to paid in capital. In November 2017, the Board of Trustees approved the elimination of these redemption fees effective December 18, 2017.
Restricted Securities. The Fund may invest in securities that are subject to legal or contractual restrictions on resale. These securities generally may be resold in transactions exempt from registration or to the public if the securities are registered. Disposal of these securities may involve time-consuming negotiations and expense, and prompt sale at an acceptable price may be difficult. Information regarding restricted securities is included at the end of the Fund's Schedule of Investments.
New Rule Issuance. During August 2018, the U.S. Securities and Exchange Commission issued Final Rule Release No. 33-10532, Disclosure Update and Simplification. This Final Rule includes amendments specific to registered investment companies that are intended to eliminate overlap in disclosure requirements between Regulation S-X and GAAP. In accordance with these amendments, certain line-items in the Fund's financial statements have been combined or removed for the current period as outlined in the table below.
| Financial Statement | Current Line-Item Presentation | Prior Line-Item Presentation |
| Statement of Assets and Liabilities | Total distributable earnings (loss) | Undistributed/Distributions in excess of/Accumulated net investment income (loss)
Accumulated/Undistributed net realized gain (loss)
Net unrealized appreciation (depreciation) |
| Statement of Changes in Net Assets | N/A - removed | Undistributed/Distributions in excess of/Accumulated net investment income (loss) end of period |
| Statement of Changes in Net Assets | Distributions to shareholders | Distributions to shareholders from net investment income
Distributions to shareholders from net realized gain |
| Distributions to Shareholders Note to Financial Statements | Distributions to shareholders | Distributions to shareholders from net investment income
Distributions to shareholders from net realized gain |
4. Purchases and Sales of Investments.
Purchases and sales of securities, other than short-term securities, aggregated $61,126,834 and $64,345,798, respectively.
5. Fees and Other Transactions with Affiliates.
Management Fee. Fidelity Management & Research Company Fidelity SelectCo, LLC (the investment adviser) and its affiliates provide the Fund with investment management related services for which the Fund pays a monthly management fee. The management fee is the sum of an individual fund fee rate that is based on an annual rate of .45% of the Fund's average net assets and an annualized group fee rate that averaged .24% during the period. The group fee rate is based upon the average net assets of all the mutual funds advised by the investment adviser, including any mutual funds previously advised by the investment adviser that are currently advised by Fidelity SelectCo, LLC, an affiliate of the investment adviser. The group fee rate decreases as assets under management increase and increases as assets under management decrease. In addition, the management fee is subject to a performance adjustment (up to a maximum of +/- .20% of the Fund's average net assets over a 36 month performance period). The upward or downward adjustment to the management fee is based on the relative investment performance of Total International Equity as compared to its benchmark index, the MSCI All Country World ex USA Index, over the same 36 month performance period. For the reporting period, the total annual management fee rate, including the performance adjustment, was .77% of the Fund's average net assets. The performance adjustment included in the management fee rate may be higher or lower than the maximum performance adjustment rate due to the difference between the average net assets for the reporting and performance periods.
Distribution and Service Plan Fees. In accordance with Rule 12b-1 of the 1940 Act, the Fund has adopted separate Distribution and Service Plans for each class of shares. Certain classes pay Fidelity Distributors Corporation (FDC), an affiliate of the investment adviser, separate Distribution and Service Fees, each of which is based on an annual percentage of each class' average net assets. In addition, FDC may pay financial intermediaries for selling shares of the Fund and providing shareholder support services. For the period, the Distribution and Service Fee rates, total fees and amounts retained by FDC were as follows:
| | Distribution Fee | Service Fee | Total Fees | Retained by FDC |
| Class A | -% | .25% | $22,059 | $1,370 |
| Class M | .25% | .25% | 74,500 | 239 |
| Class C | .75% | .25% | 31,876 | 4,987 |
| | | | $128,435 | $6,596 |
Sales Load. FDC may receive a front-end sales charge of up to 5.75% for selling Class A shares and 3.50% for selling Class M shares, some of which is paid to financial intermediaries for selling shares of the Fund. Depending on the holding period, FDC may receive contingent deferred sales charges levied on Class A, Class M and Class C redemptions. The deferred sales charges are 1.00% for Class C shares, 1.00% for certain purchases of Class A shares and .25% for certain purchases of Class M shares.
For the period, sales charge amounts retained by FDC were as follows:
| | Retained by FDC |
| Class A | $4,042 |
| Class M | 1,612 |
| Class C(a) | 911 |
| | $6,565 |
(a) When Class C shares are initially sold, FDC pays commissions from its own resources to financial intermediaries through which the sales are made.
Transfer Agent Fees. Fidelity Investments Institutional Operations Company, Inc., (FIIOC), an affiliate of the investment adviser, is the transfer, dividend disbursing and shareholder servicing agent for each class of the Fund. FIIOC receives account fees and asset-based fees that vary according to the account size and type of account of the shareholders of the respective classes of the Fund, except for Class Z. FIIOC receives an asset-based fee of Class Z's average net assets. FIIOC pays for typesetting, printing and mailing of shareholder reports, except proxy statements.
For the period, transfer agent fees for each class were as follows:
| | Amount | % of Class-Level Average Net Assets |
| Class A | $20,487 | .23 |
| Class M | 33,726 | .23 |
| Class C | 9,795 | .31 |
| Total International Equity | 142,672 | .17 |
| Class I | 16,533 | .18 |
| Class Z | 129 | .05 |
| | $223,342 | |
Accounting and Security Lending Fees. Fidelity Service Company, Inc. (FSC), an affiliate of the investment adviser, maintains the Fund's accounting records. The accounting fee is based on the level of average net assets for each month. Under a separate contract, FSC administers the security lending program. The security lending fee is based on the number and duration of lending transactions. For the period, the fees were equivalent to an annual rate of .05%.
Brokerage Commissions. The Fund placed a portion of its portfolio transactions with brokerage firms which are affiliates of the investment adviser. Brokerage commissions are included in net realized gain (loss) and change in net unrealized appreciation (depreciation) in the Statement of Operations. The commissions paid to these affiliated firms were $305 for the period.
Interfund Trades. The Fund may purchase from or sell securities to other Fidelity Funds under procedures adopted by the Board. The procedures have been designed to ensure these interfund trades are executed in accordance with Rule 17a-7 of the 1940 Act. Interfund trades are included within the respective purchases and sales amounts shown in the Purchases and Sales of Investments note.
Prior Fiscal Year Redemptions In-Kind. During the prior period, 30,358,599 shares of the Fund held by an affiliated entity were redeemed in-kind for investments and cash with a value of $259,566,026. The Fund had a net realized gain of $51,686,661 on investments delivered through the in-kind redemptions. The amount of the redemptions is included in share transactions activity shown in the accompanying Statement of Changes in Net Assets as well as the Notes to Financial Statements. The Fund recognized no gain or loss for federal income tax purposes.
Other. During the period, the investment adviser reimbursed the Fund for certain losses in the amount of $6,498.
6. Committed Line of Credit.
The Fund participates with other funds managed by the investment adviser or an affiliate in a $4.25 billion credit facility (the "line of credit") to be utilized for temporary or emergency purposes to fund shareholder redemptions or for other short-term liquidity purposes. The Fund has agreed to pay commitment fees on its pro-rata portion of the line of credit, which amounted to $329 and is reflected in Miscellaneous expenses on the Statement of Operations. During the period, the Fund did not borrow on this line of credit.
7. Security Lending.
The Fund lends portfolio securities through a lending agent from time to time in order to earn additional income. For equity securities, a lending agent is used and may loan securities to certain qualified borrowers, including Fidelity Capital Markets (FCM), a broker-dealer affiliated with the Fund. On the settlement date of the loan, the Fund receives collateral (in the form of U.S. Treasury obligations, letters of credit and/or cash) against the loaned securities and maintains collateral in an amount not less than 100% of the market value of the loaned securities during the period of the loan. The market value of the loaned securities is determined at the close of business of the Fund and any additional required collateral is delivered to the Fund on the next business day. The Fund or borrower may terminate the loan at any time, and if the borrower defaults on its obligation to return the securities loaned because of insolvency or other reasons, the Fund may apply collateral received from the borrower against the obligation. The Fund may experience delays and costs in recovering the securities loaned. Any cash collateral received is invested the Fidelity Securities Lending Cash Central Fund. The value of loaned securities and cash collateral at period end are disclosed on the Fund's Statement of Assets and Liabilities. Security lending income represents the income earned on investing cash collateral, less rebates paid to borrowers and any lending agent fees associated with the loan, plus any premium payments received for lending certain types of securities. Security lending income is presented in the Statement of Operations as a component of income from Fidelity Central Funds. Total security lending income during the period amounted to $8,525. During the period, there were no securities loaned to FCM.
8. Expense Reductions.
The investment adviser contractually agreed to reimburse each class to the extent annual operating expenses exceeded certain levels of class-level average net assets as noted in the table below. This reimbursement will remain in place through February 29, 2020. Some expenses, for example the compensation of the independent Trustees, and certain miscellaneous expenses such as proxy and shareholder meeting expenses, are excluded from this reimbursement.
The following classes were in reimbursement during the period:
| | Expense Limitations | Reimbursement |
| Class A | 1.45% | $13,422 |
| Class M | 1.70% | 21,663 |
| Class C | 2.20% | 7,157 |
| Total International Equity | 1.20% | 72,940 |
| Class I | 1.20% | 8,178 |
| Class Z | 1.05% | 295 |
| | | $123,655 |
Commissions paid to certain brokers with whom the investment adviser, or its affiliates, places trades on behalf of the Fund include an amount in addition to trade execution, which may be rebated back to the Fund to offset certain expenses. This amount totaled $13,703 for the period.
In addition, during the period the investment adviser reimbursed and/or waived a portion of fund-level operating expenses in the amount of $1,192.
9. Distributions to Shareholders.
Distributions to shareholders of each class were as follows:
| | Year ended
October 31, 2018 | Year ended
October 31, 2017 |
| Distributions to shareholders | | |
| Class A | $376,652 | $– |
| Class M | 591,842 | – |
| Class C | 110,403 | – |
| Total International Equity | 3,248,285 | – |
| Class I | 335,651 | – |
| Class Z | 10,647 | – |
| Total | $4,673,480 | $– |
| From net investment income | | |
| Class A | $– | $92,173 |
| Class M | – | 119,902 |
| Class C | – | 8,223 |
| Total International Equity | – | 3,979,536 |
| Class I | – | 27,476 |
| Total | $– | $4,227,310 |
10. Share Transactions.
Share transactions for each class were as follows and may contain automatic conversions between classes or exchanges between affiliated funds:
| | Shares | Shares | Dollars | Dollars |
| | Year ended October 31, 2018 | Year ended October 31, 2017(a) | Year ended October 31, 2018 | Year ended October 31, 2017(a) |
| Class A | | | | |
| Shares sold | 173,804 | 192,334 | $1,606,034 | $1,631,763 |
| Reinvestment of distributions | 41,465 | 12,257 | 376,502 | 91,682 |
| Shares redeemed | (286,968) | (332,738) | (2,649,748) | (2,778,571) |
| Net increase (decrease) | (71,699) | (128,147) | $(667,212) | $(1,055,126) |
| Class M | | | | |
| Shares sold | 87,344 | 238,813 | $814,151 | $1,896,741 |
| Reinvestment of distributions | 64,894 | 15,944 | 591,835 | 119,902 |
| Shares redeemed | (394,904) | (372,174) | (3,617,064) | (3,041,931) |
| Net increase (decrease) | (242,666) | (117,417) | $(2,211,078) | $(1,025,288) |
| Class C | | | | |
| Shares sold | 70,398 | 96,785 | $654,074 | $808,355 |
| Reinvestment of distributions | 12,119 | 1,070 | 110,403 | 8,046 |
| Shares redeemed | (94,138) | (109,698) | (860,312) | (920,097) |
| Net increase (decrease) | (11,621) | (11,843) | $(95,835) | $(103,696) |
| Total International Equity | | | | |
| Shares sold | 1,403,656 | 6,763,065 | $13,127,907 | $53,465,510 |
| Reinvestment of distributions | 329,975 | 523,250 | 3,002,772 | 3,913,907 |
| Shares redeemed | (1,820,863) | (35,028,420)(b) | (16,667,911) | (297,076,095)(b) |
| Net increase (decrease) | (87,232) | (27,742,105) | $(537,232) | $(239,696,678) |
| Class I | | | | |
| Shares sold | 551,397 | 604,657 | $5,085,051 | $5,121,757 |
| Reinvestment of distributions | 36,520 | 3,621 | 330,507 | 27,016 |
| Shares redeemed | (162,650) | (167,386) | (1,487,088) | (1,392,556) |
| Net increase (decrease) | 425,267 | 440,892 | $3,928,470 | $3,756,217 |
| Class Z | | | | |
| Shares sold | 15,939 | 26,796 | $147,844 | $221,657 |
| Reinvestment of distributions | 1,174 | – | 10,647 | – |
| Shares redeemed | (17,109) | (569) | (155,608) | (5,097) |
| Net increase (decrease) | 4 | 26,227 | $2,883 | $216,560 |
(a) Share transactions for Class Z are for the period February 1, 2017 (commencement of sale of shares) to October 31, 2017.
(b) Amounts include in-kind redemption (see the Prior Fiscal Year Redemptions In-Kind note for additional details).
11. Other.
The Fund's organizational documents provide former and current trustees and officers with a limited indemnification against liabilities arising in connection with the performance of their duties to the Fund. In the normal course of business, the Fund may also enter into contracts that provide general indemnifications. The Fund's maximum exposure under these arrangements is unknown as this would be dependent on future claims that may be made against the Fund. The risk of material loss from such claims is considered remote.
Report of Independent Registered Public Accounting Firm
To the Trustees of Fidelity Investment Trust and Shareholders of Fidelity Total International Equity Fund:
Opinion on the Financial Statements and Financial Highlights
We have audited the accompanying statement of assets and liabilities of Fidelity Total International Equity Fund (the "Fund"), a fund of Fidelity Investment Trust, including the schedule of investments, as of October 31, 2018, and the related statement of operations for the year then ended, the statement of changes in net assets for each of the two years in the period then ended, the financial highlights for each of the five years in the period then ended, and the related notes. In our opinion, the financial statements and financial highlights present fairly, in all material respects, the financial position of the Fund as of October 31, 2018, and the results of its operations for the year then ended, the changes in its net assets for each of the two years in the period then ended, and the financial highlights for each of the five years in the period then ended, in conformity with accounting principles generally accepted in the United States of America.
Basis for Opinion
These financial statements and financial highlights are the responsibility of the Fund's management. Our responsibility is to express an opinion on the Fund's financial statements and financial highlights based on our audits. We are a public accounting firm registered with the Public Company Accounting Oversight Board (United States) (PCAOB) and are required to be independent with respect to the Fund in accordance with the U.S. federal securities laws and the applicable rules and regulations of the Securities and Exchange Commission and the PCAOB.
We conducted our audits in accordance with the standards of the PCAOB. Those standards require that we plan and perform the audit to obtain reasonable assurance about whether the financial statements and financial highlights are free of material misstatement, whether due to error or fraud. The Fund is not required to have, nor were we engaged to perform, an audit of its internal control over financial reporting. As part of our audits we are required to obtain an understanding of internal control over financial reporting but not for the purpose of expressing an opinion on the effectiveness of the Fund’s internal control over financial reporting. Accordingly, we express no such opinion.
Our audits included performing procedures to assess the risks of material misstatement of the financial statements and financial highlights, whether due to error or fraud, and performing procedures that respond to those risks. Such procedures included examining, on a test basis, evidence regarding the amounts and disclosures in the financial statements and financial highlights. Our audits also included evaluating the accounting principles used and significant estimates made by management, as well as evaluating the overall presentation of the financial statements and financial highlights. Our procedures included confirmation of securities owned as of October 31, 2018, by correspondence with the custodians and brokers; when replies were not received from brokers, we performed other auditing procedures. We believe that our audits provide a reasonable basis for our opinion.
/s/ Deloitte & Touche LLP
Boston, Massachusetts
December 14, 2018
We have served as the auditor of one or more of the Fidelity investment companies since 1999.
Trustees and Officers
The Trustees, Members of the Advisory Board (if any), and officers of the trust and fund, as applicable, are listed below. The Board of Trustees governs the fund and is responsible for protecting the interests of shareholders. The Trustees are experienced executives who meet periodically throughout the year to oversee the fund's activities, review contractual arrangements with companies that provide services to the fund, oversee management of the risks associated with such activities and contractual arrangements, and review the fund's performance. Except for Jonathan Chiel, each of the Trustees oversees 283 funds. Mr. Chiel oversees 154 funds.
The Trustees hold office without limit in time except that (a) any Trustee may resign; (b) any Trustee may be removed by written instrument, signed by at least two-thirds of the number of Trustees prior to such removal; (c) any Trustee who requests to be retired or who has become incapacitated by illness or injury may be retired by written instrument signed by a majority of the other Trustees; and (d) any Trustee may be removed at any special meeting of shareholders by a two-thirds vote of the outstanding voting securities of the trust. Each Trustee who is not an interested person (as defined in the 1940 Act) of the trust and the fund is referred to herein as an Independent Trustee. Each Independent Trustee shall retire not later than the last day of the calendar year in which his or her 75th birthday occurs. The Independent Trustees may waive this mandatory retirement age policy with respect to individual Trustees. Officers and Advisory Board Members hold office without limit in time, except that any officer or Advisory Board Member may resign or may be removed by a vote of a majority of the Trustees at any regular meeting or any special meeting of the Trustees. Except as indicated, each individual has held the office shown or other offices in the same company for the past five years.
The fund’s Statement of Additional Information (SAI) includes more information about the Trustees. To request a free copy, call Fidelity at 1-800-544-8544.
Experience, Skills, Attributes, and Qualifications of the Trustees. The Governance and Nominating Committee has adopted a statement of policy that describes the experience, qualifications, attributes, and skills that are necessary and desirable for potential Independent Trustee candidates (Statement of Policy). The Board believes that each Trustee satisfied at the time he or she was initially elected or appointed a Trustee, and continues to satisfy, the standards contemplated by the Statement of Policy. The Governance and Nominating Committee also engages professional search firms to help identify potential Independent Trustee candidates who have the experience, qualifications, attributes, and skills consistent with the Statement of Policy. From time to time, additional criteria based on the composition and skills of the current Independent Trustees, as well as experience or skills that may be appropriate in light of future changes to board composition, business conditions, and regulatory or other developments, have also been considered by the professional search firms and the Governance and Nominating Committee. In addition, the Board takes into account the Trustees' commitment and participation in Board and committee meetings, as well as their leadership of standing and ad hoc committees throughout their tenure.
In determining that a particular Trustee was and continues to be qualified to serve as a Trustee, the Board has considered a variety of criteria, none of which, in isolation, was controlling. The Board believes that, collectively, the Trustees have balanced and diverse experience, qualifications, attributes, and skills, which allow the Board to operate effectively in governing the fund and protecting the interests of shareholders. Information about the specific experience, skills, attributes, and qualifications of each Trustee, which in each case led to the Board's conclusion that the Trustee should serve (or continue to serve) as a trustee of the fund, is provided below.
Board Structure and Oversight Function. James C. Curvey is an interested person and currently serves as Chairman. The Trustees have determined that an interested Chairman is appropriate and benefits shareholders because an interested Chairman has a personal and professional stake in the quality and continuity of services provided to the fund. Independent Trustees exercise their informed business judgment to appoint an individual of their choosing to serve as Chairman, regardless of whether the Trustee happens to be independent or a member of management. The Independent Trustees have determined that they can act independently and effectively without having an Independent Trustee serve as Chairman and that a key structural component for assuring that they are in a position to do so is for the Independent Trustees to constitute a substantial majority for the Board. The Independent Trustees also regularly meet in executive session. Ned C. Lautenbach serves as Chairman of the Independent Trustees and as such (i) acts as a liaison between the Independent Trustees and management with respect to matters important to the Independent Trustees and (ii) with management prepares agendas for Board meetings.
Fidelity® funds are overseen by different Boards of Trustees. The fund's Board oversees Fidelity's high income and certain equity funds, and other Boards oversee Fidelity's investment-grade bond, money market, asset allocation, and other equity funds. The asset allocation funds may invest in Fidelity® funds overseen by the fund's Board. The use of separate Boards, each with its own committee structure, allows the Trustees of each group of Fidelity® funds to focus on the unique issues of the funds they oversee, including common research, investment, and operational issues. On occasion, the separate Boards establish joint committees to address issues of overlapping consequences for the Fidelity® funds overseen by each Board.
The Trustees operate using a system of committees to facilitate the timely and efficient consideration of all matters of importance to the Trustees, the fund, and fund shareholders and to facilitate compliance with legal and regulatory requirements and oversight of the fund's activities and associated risks. The Board, acting through its committees, has charged FMR and its affiliates with (i) identifying events or circumstances the occurrence of which could have demonstrably adverse effects on the fund's business and/or reputation; (ii) implementing processes and controls to lessen the possibility that such events or circumstances occur or to mitigate the effects of such events or circumstances if they do occur; and (iii) creating and maintaining a system designed to evaluate continuously business and market conditions in order to facilitate the identification and implementation processes described in (i) and (ii) above. Because the day-to-day operations and activities of the fund are carried out by or through FMR, its affiliates, and other service providers, the fund's exposure to risks is mitigated but not eliminated by the processes overseen by the Trustees. While each of the Board's committees has responsibility for overseeing different aspects of the fund's activities, oversight is exercised primarily through the Operations, Audit, and Compliance Committees. In addition, the Independent Trustees have worked with Fidelity to enhance the Board's oversight of investment and financial risks, legal and regulatory risks, technology risks, and operational risks, including the development of additional risk reporting to the Board. Appropriate personnel, including but not limited to the fund's Chief Compliance Officer (CCO), FMR's internal auditor, the independent accountants, the fund's Treasurer and portfolio management personnel, make periodic reports to the Board's committees, as appropriate, including an annual review of Fidelity's risk management program for the Fidelity® funds. The responsibilities of each standing committee, including their oversight responsibilities, are described further under "Standing Committees of the Trustees."
Interested Trustees*:
Correspondence intended for a Trustee who is an interested person may be sent to Fidelity Investments, 245 Summer Street, Boston, Massachusetts 02210.
Name, Year of Birth; Principal Occupations and Other Relevant Experience+
Jonathan Chiel (1957)
Year of Election or Appointment: 2016
Trustee
Mr. Chiel also serves as Trustee of other Fidelity® funds. Mr. Chiel is Executive Vice President and General Counsel for FMR LLC (diversified financial services company, 2012-present). Previously, Mr. Chiel served as general counsel (2004-2012) and senior vice president and deputy general counsel (2000-2004) for John Hancock Financial Services; a partner with Choate, Hall & Stewart (1996-2000) (law firm); and an Assistant United States Attorney for the United States Attorney’s Office of the District of Massachusetts (1986-95), including Chief of the Criminal Division (1993-1995). Mr. Chiel is a director on the boards of the Boston Bar Foundation and the Maimonides School.
James C. Curvey (1935)
Year of Election or Appointment: 2007
Trustee
Chairman of the Board of Trustees
Mr. Curvey also serves as Trustee of other Fidelity® funds. Mr. Curvey is Vice Chairman (2007-present) and Director of FMR LLC (diversified financial services company). In addition, Mr. Curvey is an Overseer Emeritus for the Boston Symphony Orchestra, a Director of Artis-Naples, and a Trustee of Brewster Academy in Wolfeboro, New Hampshire. Previously, Mr. Curvey served as a Director of Fidelity Research & Analysis Co. (investment adviser firm, 2009-2018), Director of Fidelity Investments Money Management, Inc. (investment adviser firm, 2009-2014) and a Director of FMR and FMR Co., Inc. (investment adviser firms, 2007-2014).
Charles S. Morrison (1960)
Year of Election or Appointment: 2014
Trustee
Mr. Morrison also serves as Trustee of other funds. He serves as President of Fidelity SelectCo, LLC (investment adviser firm, 2017-present) and Fidelity Management & Research Company (FMR) (investment adviser firm, 2016-present), a Director of Fidelity Investments Money Management, Inc. (FIMM) (investment adviser firm, 2014-present), Director of Fidelity SelectCo, LLC (investment adviser firm, 2014-present), President, Asset Management (2014-present), and is an employee of Fidelity Investments. Previously, Mr. Morrison served as Vice President of Fidelity's Fixed Income and Asset Allocation Funds (2012-2014), President, Fixed Income (2011-2014), Vice President of Fidelity's Money Market Funds (2005-2009), President, Money Market Group Leader of FMR (investment adviser firm, 2009), and Senior Vice President, Money Market Group of FMR (2004-2009). Mr. Morrison also served as Vice President of Fidelity's Bond Funds (2002-2005), certain Balanced Funds (2002-2005), and certain Asset Allocation Funds (2002-2007), and as Senior Vice President (2002-2005) of Fidelity's Bond Division.
* Determined to be an “Interested Trustee” by virtue of, among other things, his or her affiliation with the trust or various entities under common control with FMR.
+ The information includes the Trustee's principal occupation during the last five years and other information relating to the experience, attributes, and skills relevant to the Trustee's qualifications to serve as a Trustee, which led to the conclusion that the Trustee should serve as a Trustee for the fund.
Independent Trustees:
Correspondence intended for an Independent Trustee may be sent to Fidelity Investments, P.O. Box 55235, Boston, Massachusetts 02205-5235.
Name, Year of Birth; Principal Occupations and Other Relevant Experience+
Dennis J. Dirks (1948)
Year of Election or Appointment: 2005
Trustee
Mr. Dirks also serves as Trustee of other Fidelity® funds. Prior to his retirement in May 2003, Mr. Dirks was Chief Operating Officer and a member of the Board of The Depository Trust & Clearing Corporation (DTCC). He also served as President, Chief Operating Officer, and Board member of The Depository Trust Company (DTC) and President and Board member of the National Securities Clearing Corporation (NSCC). In addition, Mr. Dirks served as Chief Executive Officer and Board member of the Government Securities Clearing Corporation, Chief Executive Officer and Board member of the Mortgage-Backed Securities Clearing Corporation, as a Trustee and a member of the Finance Committee of Manhattan College (2005-2008), as a Trustee and a member of the Finance Committee of AHRC of Nassau County (2006-2008), as a member of the Independent Directors Council (IDC) Governing Council (2010-2015), and as a member of the Board of Directors for The Brookville Center for Children’s Services, Inc. (2009-2017). Mr. Dirks is a member of the Finance Committee (2016-present), Board of Directors (2017-present) and Board of Trustees (2018-present) and is Treasurer (2018-present) of the Asolo Repertory Theatre.
Donald F. Donahue (1950)
Year of Election or Appointment: 2018
Trustee
Mr. Donahue also serves as a Trustee of other Fidelity® funds. Mr. Donahue is President and Chief Executive Officer of Miranda Partners, LLC (risk consulting for the financial services industry, 2012-present). Previously, Mr. Donahue served as a Member of the Advisory Board of certain Fidelity® funds (2015-2018) and Chief Executive Officer (2006-2012), Chief Operating Officer (2003-2006), and Managing Director, Customer Marketing and Development (1999-2003) of The Depository Trust & Clearing Corporation (financial markets infrastructure). Mr. Donahue serves as a Member (2007-present) and Co-Chairman (2016-present) of the Board of Directors of United Way of New York, Member of the Board of Directors of NYC Leadership Academy (2012-present) and Member of the Board of Advisors of Ripple Labs, Inc. (financial services, 2015-present). He also served as Chairman (2010-2012) and Member of the Board of Directors (2012-2013) of Omgeo, LLC (financial services), Treasurer of United Way of New York (2012-2016), and Member of the Board of Directors of XBRL US (financial services non-profit, 2009-2012) and the International Securities Services Association (2009-2012).
Alan J. Lacy (1953)
Year of Election or Appointment: 2008
Trustee
Mr. Lacy also serves as Trustee of other Fidelity® funds. Mr. Lacy serves as a Director of Bristol-Myers Squibb Company (global pharmaceuticals, 2008-present). He is a Trustee of the California Chapter of The Nature Conservancy (2015-present) and a Director of the Center for Advanced Study in the Behavioral Sciences at Stanford University (2015-present). In addition, Mr. Lacy served as Senior Adviser (2007-2014) of Oak Hill Capital Partners, L.P. (private equity) and also served as Chief Executive Officer (2005) and Vice Chairman (2005-2006) of Sears Holdings Corporation (retail) and Chief Executive Officer and Chairman of the Board of Sears, Roebuck and Co. (retail, 2000-2005). Previously, Mr. Lacy served as Chairman (2014-2017) and a member (2010-2017) of the Board of Directors of Dave & Buster’s Entertainment, Inc. (restaurant and entertainment complexes), as Chairman (2008-2011) and a member (2006-2015) of the Board of Trustees of the National Parks Conservation Association, and as a member of the Board of Directors for The Hillman Companies, Inc. (hardware wholesalers, 2010-2014), Earth Fare, Inc. (retail grocery, 2010-2014), and The Western Union Company (global money transfer, 2006-2011).
Ned C. Lautenbach (1944)
Year of Election or Appointment: 2000
Trustee
Chairman of the Independent Trustees
Mr. Lautenbach also serves as Trustee of other Fidelity® funds. Mr. Lautenbach currently serves as Vice Chair of the Board of Governors, State University System of Florida (2013-present) and is a member of the Council on Foreign Relations (1994-present). He is also a member and has most recently served as Chairman of the Board of Directors of Artis-Naples (2012-present). Previously, Mr. Lautenbach served as a member and then Lead Director of the Board of Directors of Eaton Corporation (diversified industrial, 1997-2016). He was also a Partner and Advisory Partner at Clayton, Dubilier & Rice, LLC (private equity investment, 1998-2010), as well as a Director of Sony Corporation (2006-2007). In addition, Mr. Lautenbach also had a 30-year career with IBM (technology company) during which time he served as Senior Vice President and a member of the Corporate Executive Committee (1968-1998).
Joseph Mauriello (1944)
Year of Election or Appointment: 2008
Trustee
Mr. Mauriello also serves as Trustee of other Fidelity® funds. Prior to his retirement in January 2006, Mr. Mauriello served in numerous senior management positions including Deputy Chairman and Chief Operating Officer (2004-2005), and Vice Chairman of Financial Services (2002-2004) of KPMG LLP US (professional services, 1965-2005). Mr. Mauriello currently serves as a member of the Independent Directors Council (IDC) Governing Council (2015-present). Previously, Mr. Mauriello served as a member of the Board of Directors of XL Group plc. (global insurance and re-insurance, 2006-2018).
Cornelia M. Small (1944)
Year of Election or Appointment: 2005
Trustee
Ms. Small also serves as Trustee of other Fidelity® funds. Ms. Small is a member of the Board of Directors (2009-present) and Chair of the Investment Committee (2010-present) of the Teagle Foundation. Ms. Small also serves on the Investment Committee of the Berkshire Taconic Community Foundation (2008-present). Previously, Ms. Small served as Chairperson (2002-2008) and a member of the Investment Committee and Chairperson (2008-2012) and a member of the Board of Trustees of Smith College. In addition, Ms. Small served as Chief Investment Officer, Director of Global Equity Investments, and a member of the Board of Directors of Scudder, Stevens & Clark and Scudder Kemper Investments.
Garnett A. Smith (1947)
Year of Election or Appointment: 2018
Trustee
Mr. Smith also serves as Trustee of other Fidelity® funds. Prior to Mr. Smith's retirement, he served as Chairman and Chief Executive Officer of Inbrand Corp. (manufacturer of personal absorbent products, 1990-1997). He also served as President (1986-1990) of Inbrand Corp. Prior to his employment with Inbrand Corp., he was employed by a retail fabric chain and North Carolina National Bank. In addition, Mr. Smith served as a Member of the Advisory Board of certain Fidelity® funds (2012-2013) and as a board member of the Jackson Hole Land Trust (2009-2012).
David M. Thomas (1949)
Year of Election or Appointment: 2008
Trustee
Mr. Thomas also serves as Trustee of other Fidelity® funds. Mr. Thomas serves as Non-Executive Chairman of the Board of Directors of Fortune Brands Home and Security (home and security products, 2011-present), as a member of the Board of Directors (2004-present) and Presiding Director (2013-present) of Interpublic Group of Companies, Inc. (marketing communication), and as a member of the Board of Trustees of the University of Florida (2013-present). Previously, Mr. Thomas served as Executive Chairman (2005-2006) and Chairman and Chief Executive Officer (2000-2005) of IMS Health, Inc. (pharmaceutical and healthcare information solutions), and a Director of Fortune Brands, Inc. (consumer products, 2000-2011).
+ The information includes the Trustee's principal occupation during the last five years and other information relating to the experience, attributes, and skills relevant to the Trustee's qualifications to serve as a Trustee, which led to the conclusion that the Trustee should serve as a Trustee for the fund.
Advisory Board Members and Officers:
Correspondence intended for a Member of the Advisory Board (if any) may be sent to Fidelity Investments, P.O. Box 55235, Boston, Massachusetts 02205-5235. Correspondence intended for an officer or Peter S. Lynch may be sent to Fidelity Investments, 245 Summer Street, Boston, Massachusetts 02210. Officers appear below in alphabetical order.
Name, Year of Birth; Principal Occupation
Vicki L. Fuller (1957)
Year of Election or Appointment: 2018
Member of the Advisory Board
Ms. Fuller also serves as Member of the Advisory Board of other Fidelity® funds. Ms. Fuller serves as a member of the Board of Directors, Audit Committee, and Nominating and Governance Committee of The Williams Companies, Inc. (natural gas infrastructure, 2018-present). Previously, Ms. Fuller served as the Chief Investment Officer of the New York State Common Retirement Fund (2012-2018) and held a variety of positions at AllianceBernstein L.P. (global asset management, 1985-2012), including Managing Director (2006-2012) and Senior Vice President and Senior Portfolio Manager (2001-2006).
Peter S. Lynch (1944)
Year of Election or Appointment: 2003
Member of the Advisory Board
Mr. Lynch also serves as Member of the Advisory Board of other Fidelity® funds. Mr. Lynch is Vice Chairman and a Director of FMR (investment adviser firm) and FMR Co., Inc. (investment adviser firm). In addition, Mr. Lynch serves as a Trustee of Boston College and as the Chairman of the Inner-City Scholarship Fund. Previously, Mr. Lynch served on the Special Olympics International Board of Directors (1997-2006).
William S. Stavropoulos (1939)
Year of Election or Appointment: 2018
Member of the Advisory Board
Mr. Stavropoulos also serves as Member of the Advisory Board of other Fidelity® funds. Mr. Stavropoulos serves as President and Founder of the Michigan Baseball Foundation, the Great Lakes Loons (2007-present). Mr. Stavropoulos is Chairman Emeritus of the Board of Directors of The Dow Chemical Company, where he previously served in numerous senior management positions, including President, CEO (1995-2000; 2002-2004), Chairman of the Executive Committee (2000-2006), and as a member of the Board of Directors (1990-2006). Currently, Mr. Stavropoulos is Chairman of the Board of Directors of Univar Inc. (global distributor of commodity and specialty chemicals), a Director of Teradata Corporation (data warehousing and technology solutions), and a member of the Advisory Board for Metalmark Capital LLC (private equity investment, 2005-present). Mr. Stavropoulos is an operating advisor to Clayton, Dubilier & Rice, LLC (private equity investment). In addition, Mr. Stavropoulos is a member of the University of Notre Dame Advisory Council for the College of Science, a Trustee of the Rollin L. Gerstacker Foundation, and a Director of Artis-Naples in Naples, Florida. Previously, Mr. Stavropoulos served as Trustee of certain Fidelity® funds (2001-2018) and as a Director of Chemical Financial Corporation (bank holding company, 1993-2012) and Tyco International, Ltd. (multinational manufacturing and services, 2007-2012).
Carol B. Tomé (1957)
Year of Election or Appointment: 2018
Member of the Advisory Board
Ms. Tomé also serves as Member of the Advisory Board of other Fidelity® funds. Ms. Tomé is Chief Financial Officer (2001-present) and Executive Vice President of Corporate Services (2007-present) of The Home Depot, Inc. (home improvement retailer) and a Director (2003-present) and Chair of the Audit Committee (2004-present) of United Parcel Service, Inc. (package delivery and supply chain management). Previously, Ms. Tomé served as Trustee of certain Fidelity® funds (2017), Senior Vice President of Finance and Accounting/Treasurer (2000-2007) and Vice President and Treasurer (1995-2000) of The Home Depot, Inc. and Chair of the Board (2010-2012), Vice Chair of the Board (2009 and 2013), and a Director (2008-2013) of the Federal Reserve Bank of Atlanta. Ms. Tomé is also a director or trustee of many community and professional organizations.
Michael E. Wiley (1950)
Year of Election or Appointment: 2018
Member of the Advisory Board
Mr. Wiley also serves as Trustee or Member of the Advisory Board of other Fidelity® funds. Mr. Wiley serves as a Director of High Point Resources (exploration and production, 2005-present). Previously, Mr. Wiley served as a Director of Andeavor Corporation (independent oil refiner and marketer, 2005-2018), a Director of Andeavor Logistics LP (natural resources logistics, 2015-2018), a Director of Post Oak Bank (privately-held bank, 2004-2018), a Director of Asia Pacific Exploration Consolidated (international oil and gas exploration and production, 2008-2013), a member of the Board of Trustees of the University of Tulsa (2000-2006; 2007-2010), a Senior Energy Advisor of Katzenbach Partners, LLC (consulting, 2006-2007), an Advisory Director of Riverstone Holdings (private investment), a Director of Spinnaker Exploration Company (exploration and production, 2001-2005) and Chairman, President, and CEO of Baker Hughes, Inc. (oilfield services, 2000-2004).
Elizabeth Paige Baumann (1968)
Year of Election or Appointment: 2017
Anti-Money Laundering (AML) Officer
Ms. Baumann also serves as AML Officer of other funds. She is Chief AML Officer (2012-present) and Senior Vice President (2014-present) of FMR LLC (diversified financial services company) and is an employee of Fidelity Investments. Previously, Ms. Baumann served as AML Officer of the funds (2012-2016), and Vice President (2007-2014) and Deputy Anti-Money Laundering Officer (2007-2012) of FMR LLC.
John J. Burke III (1964)
Year of Election or Appointment: 2018
Chief Financial Officer
Mr. Burke also serves as Chief Financial Officer of other funds. Mr. Burke serves as Head of Investment Operations for Fidelity Fund and Investment Operations (2018-present) and is an employee of Fidelity Investments (1998-present). Previously Mr. Burke served as head of Asset Management Investment Operations (2012-2018).
William C. Coffey (1969)
Year of Election or Appointment: 2018
Secretary and Chief Legal Officer (CLO)
Mr. Coffey also serves as Secretary and CLO of other funds. Mr. Coffey serves as CLO, Secretary, and Senior Vice President of Fidelity Management & Research Company and FMR Co., Inc. (investment adviser firms, 2018-present); Secretary of Fidelity SelectCo, LLC and Fidelity Investments Money Management, Inc. (investment adviser firms, 2018-present); and CLO of Fidelity Management & Research (Hong Kong) Limited, FMR Investment Management (UK) Limited, and Fidelity Management & Research (Japan) Limited (investment adviser firms, 2018-present). He is Senior Vice President and Deputy General Counsel of FMR LLC (diversified financial services company, 2010-present), and is an employee of Fidelity Investments. Previously, Mr. Coffey served as Assistant Secretary of certain funds (2009-2018) and as Vice President and Associate General Counsel of FMR LLC (2005-2009).
Timothy M. Cohen (1969)
Year of Election or Appointment: 2018
Vice President
Mr. Cohen also serves as Vice President of other funds. Mr. Cohen serves as Co-Head of Global Equity Research (2016-present), a Director of Fidelity Management & Research (Japan) Limited (investment adviser firm, 2016-present), and is an employee of Fidelity Investments. Previously, Mr. Cohen served as Chief Investment Officer - Equity and a Director of Fidelity Management & Research (U.K.) Inc. (investment adviser firm, 2013-2015) and as a Director of Fidelity Management & Research (Hong Kong) Limited (investment adviser firm, 2017).
Jonathan Davis (1968)
Year of Election or Appointment: 2010
Assistant Treasurer
Mr. Davis also serves as Assistant Treasurer of other funds. Mr. Davis serves as Assistant Treasurer of FMR Capital, Inc. (2017-present) and is an employee of Fidelity Investments. Previously, Mr. Davis served as Vice President and Associate General Counsel of FMR LLC (diversified financial services company, 2003-2010).
Adrien E. Deberghes (1967)
Year of Election or Appointment: 2016
Assistant Treasurer
Mr. Deberghes also serves as an officer of other funds. He serves as Assistant Treasurer of FMR Capital, Inc. (2017-present), Executive Vice President of Fidelity Investments Money Management, Inc. (FIMM) (investment adviser firm, 2016-present), and is an employee of Fidelity Investments (2008-present). Previously, Mr. Deberghes served as President and Treasurer of certain Fidelity® funds (2013-2018). Prior to joining Fidelity Investments, Mr. Deberghes was Senior Vice President of Mutual Fund Administration at State Street Corporation (2007-2008), Senior Director of Mutual Fund Administration at Investors Bank & Trust (2005-2007), and Director of Finance for Dunkin' Brands (2000-2005). Previously, Mr. Deberghes served in other fund officer roles.
Laura M. Del Prato (1964)
Year of Election or Appointment: 2018
Assistant Treasurer
Ms. Del Prato also serves as an officer of other funds. Ms. Del Prato is an employee of Fidelity Investments (2017-present). Prior to joining Fidelity Investments, Ms. Del Prato served as a Managing Director and Treasurer of the JPMorgan Mutual Funds (2014-2017). Prior to JPMorgan, Ms. Del Prato served as a partner at Cohen Fund Audit Services (accounting firm, 2012-2013) and KPMG LLP (accounting firm, 2004-2012).
Colm A. Hogan (1973)
Year of Election or Appointment: 2016
Deputy Treasurer
Mr. Hogan also serves as an officer of other funds. Mr. Hogan serves as Assistant Treasurer of FMR Capital, Inc. (2017-present) and is an employee of Fidelity Investments (2005-present). Previously, Mr. Hogan served as Assistant Treasurer of certain Fidelity® funds (2016-2018).
Pamela R. Holding (1964)
Year of Election or Appointment: 2018
Vice President
Ms. Holding also serves as Vice President of other funds. Ms. Holding serves as Co-Head of Global Equity Research (2018-present) and is an employee of Fidelity Investments (2013-present).
Chris Maher (1972)
Year of Election or Appointment: 2013
Assistant Treasurer
Mr. Maher serves as Assistant Treasurer of other funds. Mr. Maher is Vice President of Valuation Oversight, serves as Assistant Treasurer of FMR Capital, Inc. (2017-present), and is an employee of Fidelity Investments. Previously, Mr. Maher served as Vice President of Asset Management Compliance (2013), Vice President of the Program Management Group of FMR (investment adviser firm, 2010-2013), and Vice President of Valuation Oversight (2008-2010).
Rieco E. Mello (1969)
Year of Election or Appointment: 2017
Assistant Treasurer
Mr. Mello also serves as Assistant Treasurer of other funds. Mr. Mello serves as Assistant Treasurer of FMR Capital, Inc. (2017-present) and is an employee of Fidelity Investments (1995-present).
Kenneth B. Robins (1969)
Year of Election or Appointment: 2016
Chief Compliance Officer
Mr. Robins also serves as an officer of other funds. Mr. Robins serves as Compliance Officer of Fidelity Management & Research Company and FMR Co., Inc. (investment adviser firms, 2016-present) and is an employee of Fidelity Investments (2004-present). Previously, Mr. Robins served as Executive Vice President of Fidelity Investments Money Management, Inc. (investment adviser firm, 2013-2016) and served in other fund officer roles.
Stacie M. Smith (1974)
Year of Election or Appointment: 2016
President and Treasurer
Ms. Smith also serves as an officer of other funds. Ms. Smith serves as Assistant Treasurer of FMR Capital, Inc. (2017-present), is an employee of Fidelity Investments (2009-present), and has served in other fund officer roles. Prior to joining Fidelity Investments, Ms. Smith served as Senior Audit Manager of Ernst & Young LLP (accounting firm, 1996-2009). Previously, Ms. Smith served as Assistant Treasurer (2013-2018) and Deputy Treasurer (2013-2016) of certain Fidelity® funds.
Marc L. Spector (1972)
Year of Election or Appointment: 2016
Assistant Treasurer
Mr. Spector also serves as an officer of other funds. Mr. Spector serves as Assistant Treasurer of FMR Capital, Inc. (2017-present) and is an employee of Fidelity Investments (2016-present). Prior to joining Fidelity Investments, Mr. Spector served as Director at the Siegfried Group (accounting firm, 2013-2016), and prior to Siegfried Group as audit senior manager at Deloitte & Touche (accounting firm, 2005-2013).
Shareholder Expense Example
As a shareholder of the Fund, you incur two types of costs: (1) transaction costs, including sales charges (loads) on purchase payments or redemption proceeds and (2) ongoing costs, including management fees, distribution and/or service (12b-1) fees and other Fund expenses. This Example is intended to help you understand your ongoing costs (in dollars) of investing in the Fund and to compare these costs with the ongoing costs of investing in other mutual funds.
The Example is based on an investment of $1,000 invested at the beginning of the period and held for the entire period (May 1, 2018 to October 31, 2018).
Actual Expenses
The first line of the accompanying table for each class of the Fund provides information about actual account values and actual expenses. You may use the information in this line, together with the amount you invested, to estimate the expenses that you paid over the period. Simply divide your account value by $1,000.00 (for example, an $8,600 account value divided by $1,000.00 = 8.6), then multiply the result by the number in the first line for a class of the Fund under the heading entitled "Expenses Paid During Period" to estimate the expenses you paid on your account during this period. A small balance maintenance fee of $12.00 that is charged once a year may apply for certain accounts with a value of less than $2,000. This fee, which was eliminated effective August 1, 2018, is not included in the table below. If it was, the estimate of expenses you paid during the period would be higher, and your ending account value lower, by this amount. In addition, the Fund, as a shareholder in the underlying Fidelity Central Funds, will indirectly bear its pro-rata share of the fees and expenses incurred by the underlying Fidelity Central Funds. These fees and expenses are not included in the Fund's annualized expense ratio used to calculate the expense estimate in the table below.
Hypothetical Example for Comparison Purposes
The second line of the accompanying table for each class of the Fund provides information about hypothetical account values and hypothetical expenses based on a Class' actual expense ratio and an assumed rate of return of 5% per year before expenses, which is not the Class' actual return. The hypothetical account values and expenses may not be used to estimate the actual ending account balance or expenses you paid for the period. You may use this information to compare the ongoing costs of investing in the Fund and other funds. To do so, compare this 5% hypothetical example with the 5% hypothetical examples that appear in the shareholder reports of the other funds. A small balance maintenance fee of $12.00 that is charged once a year may apply for certain accounts with a value of less than $2,000. This fee, which was eliminated effective August 1, 2018, is not included in the table below. If it was, the estimate of expenses you paid during the period would be higher, and your ending account value lower, by this amount. In addition, the Fund, as a shareholder in the underlying Fidelity Central Funds, will indirectly bear its pro-rata share of the fees and expenses incurred by the underlying Fidelity Central Funds. These fees and expenses are not included in the Fund's annualized expense ratio used to calculate the expense estimate in the table below.
Please note that the expenses shown in the table are meant to highlight your ongoing costs only and do not reflect any transaction costs. Therefore, the second line of the table is useful in comparing ongoing costs only, and will not help you determine the relative total costs of owning different funds. In addition, if these transactional costs were included, your costs would have been higher.
| | Annualized Expense Ratio-A | Beginning
Account Value
May 1, 2018 | Ending
Account Value
October 31, 2018 | Expenses Paid
During Period-B
May 1, 2018
to October 31, 2018 |
| Class A | 1.45% | | | |
| Actual | | $1,000.00 | $887.40 | $6.90 |
| Hypothetical-C | | $1,000.00 | $1,017.90 | $7.38 |
| Class M | 1.70% | | | |
| Actual | | $1,000.00 | $886.70 | $8.08 |
| Hypothetical-C | | $1,000.00 | $1,016.64 | $8.64 |
| Class C | 2.20% | | | |
| Actual | | $1,000.00 | $884.20 | $10.45 |
| Hypothetical-C | | $1,000.00 | $1,014.12 | $11.17 |
| Total International Equity | 1.20% | | | |
| Actual | | $1,000.00 | $888.80 | $5.71 |
| Hypothetical-C | | $1,000.00 | $1,019.16 | $6.11 |
| Class I | 1.20% | | | |
| Actual | | $1,000.00 | $888.30 | $5.71 |
| Hypothetical-C | | $1,000.00 | $1,019.16 | $6.11 |
| Class Z | 1.05% | | | |
| Actual | | $1,000.00 | $889.60 | $5.00 |
| Hypothetical-C | | $1,000.00 | $1,019.91 | $5.35 |
A Annualized expense ratio reflects expenses net of applicable fee waivers.
B Expenses are equal to each Class' annualized expense ratio, multiplied by the average account value over the period, multiplied by 184/365 (to reflect the one-half year period).
C 5% return per year before expenses
Distributions (Unaudited)
Class A designates 4%, Class M designates 5%, Class C designates 5%, Total International Equity designates 4%, Class I designates 4%, and Class Z designates 4% of the dividend distributed during the fiscal year as qualifying for the dividends–received deduction for corporate shareholders.
Class A designates 93%, Class M designates 100%, Class C designates 100%, Total International Equity designates 94%, Class I designates 88%, and Class Z designates 88% of the dividends distributed during the fiscal year as amounts which may be taken into account as a dividend for purposes of the maximum rate under section 1(h)(11) of the Internal Revenue Code.
The amounts per share which represent income derived from sources within, and taxes paid to, foreign countries or possessions of the United States are as follows:
| | Pay Date | Income | Taxes |
| Fidelity Total International Equity Fund | | | |
| Class A | 12/11/17 | $0.3036 | $0.0346 |
| Class M | 12/11/17 | $0.2846 | $0.0346 |
| Class C | 12/11/17 | $0.2486 | $0.0346 |
| Total International Equity | 12/11/17 | $0.3006 | $0.0346 |
| Class I | 12/11/17 | $0.3226 | $0.0346 |
| Class Z | 12/11/17 | $0.3226 | $0.0346 |
The fund will notify shareholders in January 2019 of amounts for use in preparing 2018 income tax returns.
Board Approval of Investment Advisory Contracts
Fidelity Total International Equity Fund
At its July 2018 meeting, the Board of Trustees, including the Independent Trustees (together, the Board), voted to continue the management contract with Fidelity Management & Research Company (FMR) and the sub-advisory agreements (together, the Advisory Contracts) for the fund for six months through January 31, 2019, in connection with the reunification of the Fidelity Equity High Income Funds Board, which oversees the fund, and the Sector Portfolios Board.
The Board considered that the approval of the fund's Advisory Contracts will not result in any changes in (i) the investment process or strategies employed in the management of the fund's assets; (ii) the fees and expenses paid by shareholders, including the expense cap arrangement currently in place for the fund; (iii) the nature, extent or quality of services provided under the fund's Advisory Contracts; or (iv) the day-to-day management of the fund or the persons primarily responsible for such management. The Board concluded that the fund's Advisory Contracts are fair and reasonable, and that the fund's Advisory Contracts should be renewed, without modification, through January 31, 2019, with the understanding that the Board will consider the annual renewal for a full one year period in January 2019.
In connection with its consideration of future renewals of the fund's Advisory Contracts, the Board will consider: (i) the nature, extent and quality of services provided to the fund, including shareholder and administrative services and investment performance; (ii) the competitiveness of the management fee and total expenses for the fund; (iii) the costs of the services and profitability, including the revenues earned and the expenses incurred in conducting the business of developing, marketing, distributing, managing, administering, and servicing the fund and its shareholders, to the extent applicable, as well as potential fall-out benefits from Fidelity's non-fund businesses; and (iv) whether there have been economies of scale in respect of the Fidelity funds, whether the Fidelity funds (including the fund) have appropriately benefited from any such economies of scale, and whether there is the potential for realization of any further economies.
Based on its evaluation of all of the conclusions noted above, and after considering all factors it believed relevant, the Board ultimately concluded that the fund's management fee structure is fair and reasonable, and that the continuation of the fund's Advisory Contracts should be approved.
ATIE-ANN-1218
1.853364.110
Fidelity® Total International Equity Fund
Annual Report October 31, 2018 |
|
Contents
To view a fund's proxy voting guidelines and proxy voting record for the 12-month period ended June 30, visit http://www.fidelity.com/proxyvotingresults or visit the Securities and Exchange Commission's (SEC) web site at http://www.sec.gov.
You may also call 1-800-544-8544 to request a free copy of the proxy voting guidelines.
Standard & Poor's, S&P and S&P 500 are registered service marks of The McGraw-Hill Companies, Inc. and have been licensed for use by Fidelity Distributors Corporation.
Other third-party marks appearing herein are the property of their respective owners.
All other marks appearing herein are registered or unregistered trademarks or service marks of FMR LLC or an affiliated company. © 2018 FMR LLC. All rights reserved.
This report and the financial statements contained herein are submitted for the general information of the shareholders of the Fund. This report is not authorized for distribution to prospective investors in the Fund unless preceded or accompanied by an effective prospectus.
A fund files its complete schedule of portfolio holdings with the SEC for the first and third quarters of each fiscal year on Form N-Q. Forms N-Q are available on the SEC’s web site at http://www.sec.gov. A fund's Forms N-Q may be reviewed and copied at the SEC’s Public Reference Room in Washington, DC. Information regarding the operation of the SEC's Public Reference Room may be obtained by calling 1-800-SEC-0330.
For a complete list of a fund's portfolio holdings, view the most recent holdings listing, semiannual report, or annual report on Fidelity's web site at http://www.fidelity.com, http://www.institutional.fidelity.com, or http://www.401k.com, as applicable.
NOT FDIC INSURED •MAY LOSE VALUE •NO BANK GUARANTEE
Neither the Fund nor Fidelity Distributors Corporation is a bank.
Performance: The Bottom Line
Average annual total return reflects the change in the value of an investment, assuming reinvestment of distributions from dividend income and capital gains (the profits earned upon the sale of securities that have grown in value, if any) and assuming a constant rate of performance each year. The hypothetical investment and the average annual total returns do not reflect the deduction of taxes that a shareholder would pay on fund distributions or the redemption of fund shares. During periods of reimbursement by Fidelity, a fund’s total return will be greater than it would be had the reimbursement not occurred. How a fund did yesterday is no guarantee of how it will do tomorrow.
Average Annual Total Returns
| For the periods ended October 31, 2018 | Past 1 year | Past 5 years | Past 10 years |
| Fidelity® Total International Equity Fund | (8.84)% | 2.40% | 7.98% |
$10,000 Over 10 Years
Let's say hypothetically that $10,000 was invested in Fidelity® Total International Equity Fund, a class of the fund, on October 31, 2008.
The chart shows how the value of your investment would have changed, and also shows how the MSCI ACWI (All Country World Index) ex USA Index performed over the same period.
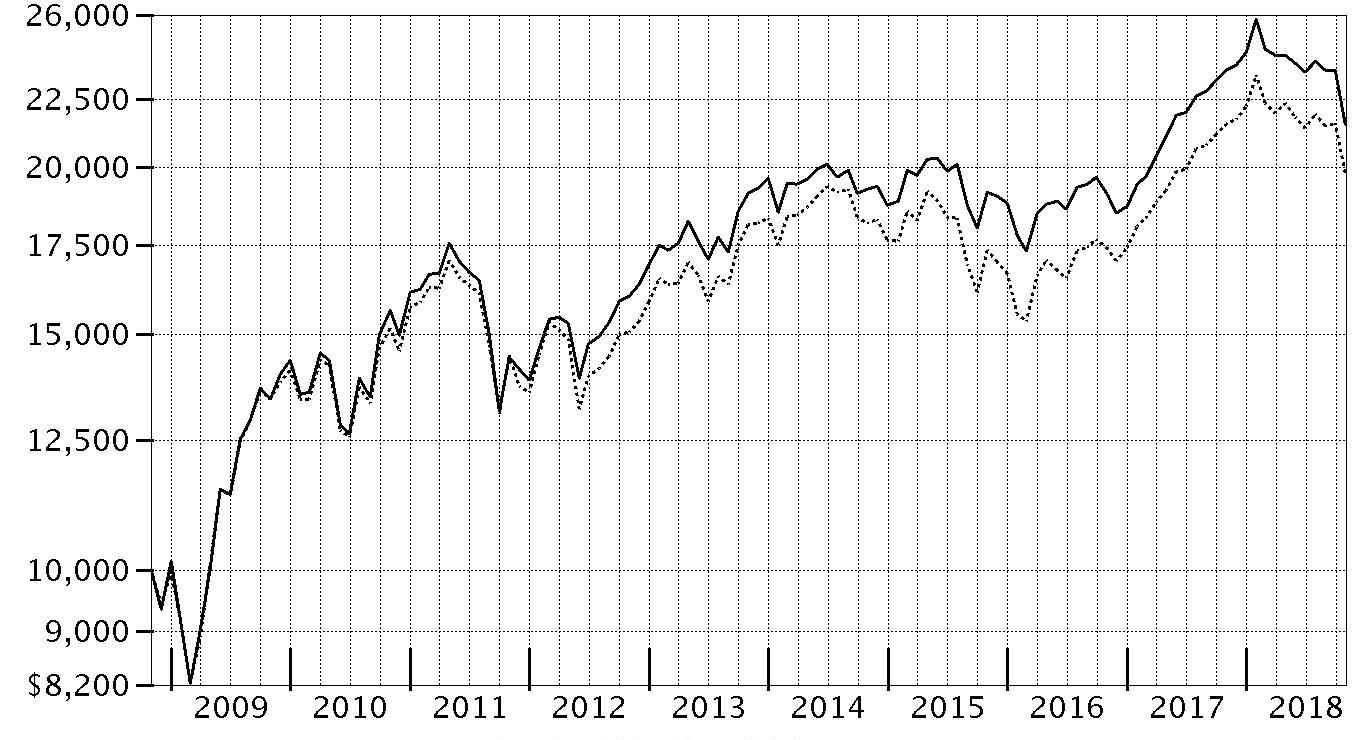
| Period Ending Values |
| $21,549 | Fidelity® Total International Equity Fund |
| $19,812 | MSCI ACWI (All Country World Index) ex USA Index |
Management's Discussion of Fund Performance
Market Recap: International equities returned -8.08% for the 12 months ending October 31, 2018, according to the MSCI ACWI (All Country World Index) ex USA Index. A modestly positive first half of the period gave way to a confluence of overwhelmingly negative factors – including escalating trade tensions, a surging U.S. dollar, tepid economic growth in Europe, global central bank tightening, concerns about Italy’s budget stalemate with the EU, and weakness in China’s stock market – that yielded a -11% second-half return. The index lost 8% in October alone, its largest monthly drop in more than six years. Among sectors, new-media-infused communications services (-15%) was hit the hardest, while economically sensitive consumer discretionary (-13%), information technology (-12%), financials (-10%), industrials (-9%) and materials (-7%) stocks also fared poorly. Even the more defensive real estate (-9%), utilities (-6%) and consumer staples (-5%) sectors weren’t spared this period. Conversely, elevated crude-oil prices fueled a positive return for energy (+7%), the top-performing sector, followed by the relatively stable-growing health care segment (+2%). Regionally, emerging markets (-12%) fared the worst, hampered by the impact of foreign exchange and concerns about economic weakness in China, India and South Korea. Sluggish growth also pressured shares in continental Europe (-9%). Stocks in Japan (-3%) and the U.K. (-4%) held up better, followed by Canada (-5%) and Asia-Pacific ex Japan (-6%).
Comments from Co-Portfolio Manager Jed Weiss: For the fiscal year, the fund’s share classes (excluding sales charges, if applicable) returned roughly -9% to -10%, trailing the benchmark MSCI ACWI (All Country World Index) ex USA Index. Versus the benchmark, unfavorable stock picks in China and India detracted most. By sector, security selection within the consumer staples and consumer discretionary sectors also weighed on relative performance. Conversely, the fund benefitted from non-benchmark exposure to the United States, as well as strong stock picks in continental Europe. The largest individual relative detractor was untimely ownership of Swiss drug manufacturer Novartis. We sold the stock in June, missing out as the stock gained due to a number of positive changes either made or anticipated by the company's new CEO. Underexposure to benchmark heavyweight Royal Dutch Shell also detracted. We established a position in April and held it through period end, which weighed on relative performance as shares of the Anglo-Dutch multinational oil and gas giant gained during the period. Turning to contributors, out-of-benchmark stakes in U.S.-based credit-card processors Mastercard and Visa were the top relative contributors, as both companies continued to maintain considerable pricing power and significant market share. A sizable overweighting in Australian global biopharmaceutical firm CSL Limited also proved beneficial, as its shares gained following the acquisition and successful turnaround of Novartis' flu business. Lastly, I'll note that the fund's small cash stake – representing about 2% of assets, on average – helped our relative result in a down market.
The views expressed above reflect those of the portfolio manager(s) only through the end of the period as stated on the cover of this report and do not necessarily represent the views of Fidelity or any other person in the Fidelity organization. Any such views are subject to change at any time based upon market or other conditions and Fidelity disclaims any responsibility to update such views. These views may not be relied on as investment advice and, because investment decisions for a Fidelity fund are based on numerous factors, may not be relied on as an indication of trading intent on behalf of any Fidelity fund.
Note to Shareholders: Following a roughly five-month leave of absence, Jed Weiss returned to Fidelity on November 29, 2017, and resumed his day-to-day responsibilities as Co-Portfolio Manager. In his stead, Vincent Montemaggiore served as interim manager of the fund's developed-growth subportfolio (transitioned off 12/4/17), while Patrick Drouot and Patrick Buchanan served as Co-Managers of the developed small-cap sleeve (transitioned off 12/30/17).
Investment Summary (Unaudited)
Geographic Diversification (% of fund's net assets)
| As of October 31, 2018 |
| | Japan | 13.9% |
| | United States of America* | 11.5% |
| | United Kingdom | 10.2% |
| | France | 6.8% |
| | Germany | 6.0% |
| | Canada | 5.8% |
| | Cayman Islands | 4.5% |
| | Switzerland | 4.4% |
| | India | 3.5% |
| | Other | 33.4% |
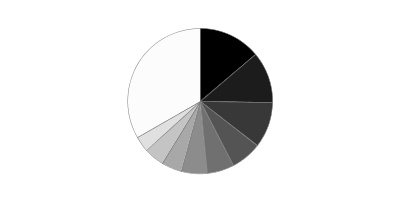
* Includes Short-Term investments and Net Other Assets (Liabilities).
Percentages are based on country or territory of incorporation and are adjusted for the effect of futures contracts, if applicable.
Asset Allocation as of October 31, 2018
| | % of fund's net assets |
| Stocks | 97.4 |
| Short-Term Investments and Net Other Assets (Liabilities) | 2.6 |
Top Ten Stocks as of October 31, 2018
| | % of fund's net assets |
| Taiwan Semiconductor Manufacturing Co. Ltd. (Taiwan, Semiconductors & Semiconductor Equipment) | 1.6 |
| Alibaba Group Holding Ltd. sponsored ADR (Cayman Islands, Internet & Direct Marketing Retail) | 1.4 |
| SAP SE (Germany, Software) | 1.3 |
| Samsung Electronics Co. Ltd. (Korea (South), Technology Hardware, Storage & Peripherals) | 1.3 |
| Tencent Holdings Ltd. (Cayman Islands, Interactive Media & Services) | 1.3 |
| Nestle SA (Reg. S) (Switzerland, Food Products) | 1.2 |
| Visa, Inc. Class A (United States of America, IT Services) | 1.2 |
| CSL Ltd. (Australia, Biotechnology) | 1.1 |
| MasterCard, Inc. Class A (United States of America, IT Services) | 1.1 |
| Roche Holding AG (participation certificate) (Switzerland, Pharmaceuticals) | 1.0 |
| | 12.5 |
Top Market Sectors as of October 31, 2018
| | % of fund's net assets |
| Financials | 21.8 |
| Industrials | 14.6 |
| Information Technology | 13.4 |
| Consumer Discretionary | 9.5 |
| Materials | 8.2 |
| Health Care | 7.9 |
| Consumer Staples | 7.2 |
| Communication Services | 6.8 |
| Energy | 5.9 |
| Real Estate | 1.9 |
Schedule of Investments October 31, 2018
Showing Percentage of Net Assets
| Common Stocks - 96.2% | | | |
| | | Shares | Value |
| Australia - 2.2% | | | |
| Accent Group Ltd. | | 5,879 | $5,183 |
| Adelaide Brighton Ltd. | | 4,389 | 17,623 |
| Beacon Lighting Group Ltd. | | 15,420 | 15,124 |
| Commonwealth Bank of Australia | | 10,721 | 525,599 |
| CSL Ltd. | | 8,594 | 1,144,138 |
| DuluxGroup Ltd. | | 9,164 | 48,022 |
| Imdex Ltd. (a) | | 16,011 | 13,039 |
| Insurance Australia Group Ltd. | | 43,838 | 212,030 |
| Macquarie Group Ltd. | | 3,228 | 267,908 |
|
| TOTAL AUSTRALIA | | | 2,248,666 |
|
| Austria - 0.6% | | | |
| Andritz AG | | 7,422 | 384,683 |
| Erste Group Bank AG | | 6,200 | 252,807 |
|
| TOTAL AUSTRIA | | | 637,490 |
|
| Bailiwick of Jersey - 0.7% | | | |
| Ferguson PLC | | 1,834 | 123,845 |
| Glencore Xstrata PLC | | 100,700 | 410,407 |
| Integrated Diagnostics Holdings PLC (b) | | 7,500 | 25,875 |
| WPP PLC | | 14,500 | 164,078 |
|
| TOTAL BAILIWICK OF JERSEY | | | 724,205 |
|
| Belgium - 0.9% | | | |
| KBC Ancora | | 2,011 | 93,024 |
| KBC Groep NV | | 10,212 | 704,407 |
| Umicore SA | | 3,588 | 169,020 |
|
| TOTAL BELGIUM | | | 966,451 |
|
| Bermuda - 0.3% | | | |
| Credicorp Ltd. (United States) | | 1,212 | 273,561 |
| Vostok New Ventures Ltd. (depositary receipt) (a) | | 3,360 | 25,555 |
|
| TOTAL BERMUDA | | | 299,116 |
|
| Brazil - 1.6% | | | |
| BM&F BOVESPA SA | | 35,100 | 250,317 |
| CVC Brasil Operadora e Agencia de Viagens SA | | 11,400 | 173,382 |
| IRB Brasil Resseguros SA | | 10,000 | 194,706 |
| Itau Unibanco Holding SA | | 3,500 | 39,867 |
| Localiza Rent A Car SA | | 30,800 | 237,942 |
| Lojas Renner SA | | 21,800 | 220,255 |
| Notre Dame Intermedica Participacoes SA | | 30,400 | 197,112 |
| Rumo SA (a) | | 37,500 | 167,775 |
| Suzano Papel e Celulose SA | | 17,200 | 174,935 |
|
| TOTAL BRAZIL | | | 1,656,291 |
|
| Canada - 5.8% | | | |
| Alimentation Couche-Tard, Inc. Class B (sub. vtg.) | | 15,722 | 750,839 |
| Canadian National Railway Co. | | 11,163 | 954,297 |
| Canadian Pacific Railway Ltd. | | 3,453 | 708,121 |
| CCL Industries, Inc. Class B | | 12,290 | 517,012 |
| Constellation Software, Inc. | | 957 | 658,629 |
| Franco-Nevada Corp. | | 8,559 | 534,560 |
| McCoy Global, Inc. (a) | | 7,000 | 6,115 |
| New Look Vision Group, Inc. | | 1,300 | 31,847 |
| Nutrien Ltd. | | 15,665 | 829,271 |
| Pason Systems, Inc. | | 19,991 | 301,737 |
| PrairieSky Royalty Ltd. | | 16,273 | 247,225 |
| ShawCor Ltd. Class A | | 800 | 14,512 |
| Suncor Energy, Inc. | | 13,500 | 452,854 |
|
| TOTAL CANADA | | | 6,007,019 |
|
| Cayman Islands - 4.5% | | | |
| 58.com, Inc. ADR (a) | | 3,000 | 196,770 |
| Alibaba Group Holding Ltd. sponsored ADR (a) | | 9,982 | 1,420,239 |
| Baidu.com, Inc. sponsored ADR (a) | | 2,400 | 456,144 |
| Baozun, Inc. sponsored ADR (a) | | 4,300 | 171,183 |
| Huazhu Group Ltd. ADR | | 6,700 | 175,272 |
| New Oriental Education & Technology Group, Inc. sponsored ADR | | 4,060 | 237,551 |
| Shenzhou International Group Holdings Ltd. | | 19,000 | 209,820 |
| Sunny Optical Technology Group Co. Ltd. | | 20,200 | 175,161 |
| TAL Education Group ADR (a) | | 8,300 | 240,534 |
| Tencent Holdings Ltd. | | 38,800 | 1,329,259 |
| Value Partners Group Ltd. | | 22,000 | 16,328 |
|
| TOTAL CAYMAN ISLANDS | | | 4,628,261 |
|
| Chile - 0.4% | | | |
| Banco Santander Chile sponsored ADR | | 6,800 | 200,328 |
| Sociedad Quimica y Minera de Chile SA (PN-B) sponsored ADR | | 4,400 | 192,764 |
|
| TOTAL CHILE | | | 393,092 |
|
| China - 2.3% | | | |
| China International Travel Service Corp. Ltd. (A Shares) | | 24,400 | 187,766 |
| Gree Electric Appliances, Inc. of Zhuhai Class A (a) | | 27,200 | 148,407 |
| Hangzhou Hikvision Digital Technology Co. Ltd. Class A | | 46,600 | 161,665 |
| Inner Mongoli Yili Industries Co. Ltd. (A Shares) | | 53,082 | 168,020 |
| Jiangsu Yanghe Brewery Joint-Stock Co. Ltd. Class A | | 13,600 | 172,329 |
| Kweichow Moutai Co. Ltd. (A Shares) | | 2,394 | 188,379 |
| Midea Group Co. Ltd. Class A | | 33,600 | 178,413 |
| Ping An Insurance (Group) Co. of China Ltd. (H Shares) | | 50,000 | 470,865 |
| Shanghai International Airport Co. Ltd. (A Shares) | | 26,100 | 185,396 |
| Shenzhen Inovance Technology Co. Ltd. Class A | | 49,600 | 158,421 |
| Wuliangye Yibin Co. Ltd. Class A | | 23,500 | 162,211 |
| Yunnan Baiyao Group Co. Ltd. (c) | | 16,800 | 169,140 |
|
| TOTAL CHINA | | | 2,351,012 |
|
| Denmark - 0.4% | | | |
| A.P. Moller - Maersk A/S Series B | | 94 | 118,648 |
| Jyske Bank A/S (Reg.) | | 5,054 | 206,629 |
| Netcompany Group A/S | | 700 | 23,151 |
| Scandinavian Tobacco Group A/S (b) | | 950 | 14,415 |
| SimCorp A/S | | 420 | 32,360 |
| Spar Nord Bank A/S | | 4,931 | 40,874 |
|
| TOTAL DENMARK | | | 436,077 |
|
| Finland - 0.7% | | | |
| Nordea Bank ABP (a) | | 32,767 | 284,983 |
| Sampo Oyj (A Shares) | | 6,553 | 301,789 |
| Tikkurila Oyj | | 6,180 | 84,137 |
|
| TOTAL FINLAND | | | 670,909 |
|
| France - 6.8% | | | |
| Accor SA | | 3,400 | 155,658 |
| Atos Origin SA | | 2,197 | 188,573 |
| AXA SA | | 20,306 | 508,192 |
| Bouygues SA | | 5,379 | 196,423 |
| Capgemini SA | | 2,102 | 257,130 |
| Compagnie de St. Gobain | | 4,800 | 180,823 |
| Edenred SA | | 7,300 | 277,238 |
| Elis SA | | 10,751 | 217,118 |
| Hermes International SCA | | 286 | 163,589 |
| Kering SA | | 375 | 167,179 |
| Laurent-Perrier Group SA | | 259 | 26,578 |
| Legrand SA | | 3,600 | 235,437 |
| LVMH Moet Hennessy - Louis Vuitton SA | | 530 | 160,805 |
| Natixis SA | | 38,600 | 225,859 |
| Pernod Ricard SA | | 1,100 | 167,949 |
| Safran SA | | 4,400 | 568,602 |
| Sanofi SA | | 9,428 | 842,491 |
| Societe Generale Series A | | 7,100 | 260,270 |
| SR Teleperformance SA | | 1,200 | 197,897 |
| Thales SA | | 1,120 | 143,348 |
| Total SA (d) | | 17,660 | 1,036,208 |
| Vetoquinol SA | | 600 | 33,640 |
| VINCI SA | | 5,500 | 489,497 |
| Virbac SA (a) | | 150 | 24,091 |
| Vivendi SA | | 10,252 | 247,261 |
|
| TOTAL FRANCE | | | 6,971,856 |
|
| Germany - 5.8% | | | |
| adidas AG | | 747 | 175,987 |
| Bayer AG | | 9,247 | 708,805 |
| Brenntag AG | | 3,400 | 177,801 |
| CompuGroup Medical AG | | 2,146 | 121,533 |
| Continental AG | | 700 | 115,717 |
| CTS Eventim AG | | 1,362 | 51,155 |
| Deutsche Telekom AG | | 30,100 | 493,690 |
| Fresenius SE & Co. KGaA | | 2,300 | 146,178 |
| Hannover Reuck SE | | 2,500 | 337,247 |
| HeidelbergCement Finance AG | | 2,300 | 156,306 |
| Linde PLC | | 5,852 | 960,105 |
| MTU Aero Engines Holdings AG | | 1,400 | 297,796 |
| Nexus AG | | 1,420 | 38,762 |
| SAP SE | | 12,833 | 1,374,074 |
| Vonovia SE | | 12,770 | 584,632 |
| WashTec AG | | 550 | 42,423 |
| Wirecard AG | | 800 | 149,872 |
|
| TOTAL GERMANY | | | 5,932,083 |
|
| Greece - 0.0% | | | |
| Motor Oil (HELLAS) Corinth Refineries SA | | 900 | 21,305 |
| Hong Kong - 1.4% | | | |
| AIA Group Ltd. | | 140,600 | 1,064,099 |
| China Resources Beer Holdings Co. Ltd. | | 54,000 | 187,645 |
| Techtronic Industries Co. Ltd. | | 32,500 | 152,099 |
|
| TOTAL HONG KONG | | | 1,403,843 |
|
| India - 3.5% | | | |
| Adani Ports & Special Economic Zone Ltd. | | 18,374 | 79,212 |
| Asian Paints Ltd. | | 11,646 | 193,743 |
| Dabur India Ltd. | | 30,500 | 158,665 |
| Eicher Motors Ltd. | | 559 | 165,256 |
| Godrej Consumer Products Ltd. | | 18,787 | 184,123 |
| HDFC Bank Ltd. | | 6,357 | 165,029 |
| Hindustan Unilever Ltd. | | 11,000 | 241,194 |
| Housing Development Finance Corp. Ltd. | | 30,394 | 727,077 |
| Indraprastha Gas Ltd. | | 47,178 | 170,507 |
| IndusInd Bank Ltd. | | 8,134 | 156,730 |
| ITC Ltd. | | 59,500 | 225,337 |
| Jyothy Laboratories Ltd. | | 4,788 | 12,255 |
| Kotak Mahindra Bank Ltd. | | 10,386 | 157,159 |
| Maruti Suzuki India Ltd. | | 2,503 | 223,916 |
| Pidilite Industries Ltd. | | 11,690 | 151,554 |
| Reliance Industries Ltd. | | 28,301 | 406,090 |
| Titan Co. Ltd. | | 16,512 | 188,562 |
|
| TOTAL INDIA | | | 3,606,409 |
|
| Indonesia - 0.5% | | | |
| PT Bank Central Asia Tbk | | 161,100 | 250,618 |
| PT Bank Rakyat Indonesia Tbk | | 1,174,300 | 243,318 |
|
| TOTAL INDONESIA | | | 493,936 |
|
| Ireland - 1.3% | | | |
| Accenture PLC Class A | | 1,000 | 157,620 |
| CRH PLC | | 8,118 | 242,145 |
| CRH PLC sponsored ADR | | 18,029 | 536,904 |
| FBD Holdings PLC | | 1,972 | 24,011 |
| James Hardie Industries PLC CDI | | 30,084 | 400,302 |
|
| TOTAL IRELAND | | | 1,360,982 |
|
| Israel - 0.1% | | | |
| Azrieli Group | | 282 | 13,691 |
| Ituran Location & Control Ltd. | | 2,261 | 77,145 |
| Strauss Group Ltd. | | 2,559 | 56,156 |
|
| TOTAL ISRAEL | | | 146,992 |
|
| Italy - 0.7% | | | |
| Assicurazioni Generali SpA | | 9,800 | 158,508 |
| Interpump Group SpA | | 10,191 | 294,342 |
| Intesa Sanpaolo SpA | | 71,700 | 158,821 |
| Mediobanca SpA | | 10,834 | 95,126 |
|
| TOTAL ITALY | | | 706,797 |
|
| Japan - 13.9% | | | |
| Ai Holdings Corp. | | 1,100 | 20,999 |
| Aoki Super Co. Ltd. | | 1,000 | 23,406 |
| Artnature, Inc. | | 2,600 | 15,277 |
| Aucnet, Inc. | | 1,200 | 12,581 |
| Azbil Corp. | | 11,400 | 212,370 |
| Broadleaf Co. Ltd. | | 2,400 | 13,868 |
| Central Automotive Products Ltd. | | 2,400 | 32,649 |
| Coca-Cola West Co. Ltd. | | 800 | 20,951 |
| Daiichikosho Co. Ltd. | | 1,500 | 69,127 |
| Daikokutenbussan Co. Ltd. | | 1,300 | 48,620 |
| DENSO Corp. | | 7,800 | 347,925 |
| East Japan Railway Co. | | 4,200 | 366,819 |
| Fanuc Corp. | | 1,800 | 313,141 |
| Funai Soken Holdings, Inc. | | 1,850 | 39,235 |
| GCA Savvian Group Corp. | | 3,100 | 24,836 |
| Goldcrest Co. Ltd. | | 2,960 | 46,301 |
| Honda Motor Co. Ltd. | | 17,400 | 496,692 |
| Hoya Corp. | | 11,300 | 642,338 |
| Idemitsu Kosan Co. Ltd. | | 4,200 | 191,696 |
| INPEX Corp. | | 11,800 | 134,362 |
| Itochu Corp. | | 22,600 | 419,139 |
| Japan Tobacco, Inc. | | 11,220 | 288,302 |
| Kao Corp. | | 3,300 | 219,523 |
| Keyence Corp. | | 1,942 | 951,767 |
| Kobayashi Pharmaceutical Co. Ltd. | | 600 | 39,349 |
| Komatsu Ltd. | | 9,500 | 247,403 |
| Koshidaka Holdings Co. Ltd. | | 4,900 | 57,019 |
| Kusuri No Aoki Holdings Co. Ltd. | | 600 | 43,072 |
| Lasertec Corp. | | 2,200 | 63,172 |
| Makita Corp. | | 5,200 | 179,962 |
| Medikit Co. Ltd. | | 600 | 32,437 |
| Minebea Mitsumi, Inc. | | 7,800 | 119,325 |
| Miroku Jyoho Service Co., Ltd. | | 1,000 | 18,877 |
| Misumi Group, Inc. | | 17,400 | 349,434 |
| Mitsubishi UFJ Financial Group, Inc. | | 106,700 | 645,801 |
| Mitsuboshi Belting Ltd. | | 1,500 | 36,837 |
| Mitsui Fudosan Co. Ltd. | | 10,800 | 243,240 |
| Nabtesco Corp. | | 8,900 | 196,244 |
| Nagaileben Co. Ltd. | | 2,900 | 65,127 |
| Nakano Refrigerators Co. Ltd. | | 400 | 21,376 |
| ND Software Co. Ltd. | | 1,300 | 14,505 |
| Nihon Parkerizing Co. Ltd. | | 7,500 | 90,597 |
| Nintendo Co. Ltd. | | 1,000 | 312,203 |
| Nomura Holdings, Inc. | | 47,300 | 227,133 |
| NS Tool Co. Ltd. | | 1,000 | 23,521 |
| OBIC Co. Ltd. | | 4,600 | 419,090 |
| Oracle Corp. Japan | | 2,300 | 156,140 |
| ORIX Corp. | | 24,200 | 394,844 |
| OSG Corp. | | 13,200 | 273,043 |
| Panasonic Corp. | | 20,300 | 217,849 |
| Paramount Bed Holdings Co. Ltd. | | 1,800 | 75,854 |
| ProNexus, Inc. | | 2,400 | 23,333 |
| Recruit Holdings Co. Ltd. | | 6,800 | 182,509 |
| San-Ai Oil Co. Ltd. | | 4,900 | 52,937 |
| Shin-Etsu Chemical Co. Ltd. | | 2,900 | 242,326 |
| Shinsei Bank Ltd. | | 13,700 | 208,692 |
| SHO-BOND Holdings Co. Ltd. | | 5,240 | 373,374 |
| Shoei Co. Ltd. | | 2,000 | 78,079 |
| SK Kaken Co. Ltd. | | 20 | 8,481 |
| SoftBank Corp. | | 3,000 | 237,416 |
| Software Service, Inc. | | 500 | 37,666 |
| Sony Corp. | | 4,600 | 248,937 |
| Sony Financial Holdings, Inc. | | 13,700 | 316,052 |
| Subaru Corp. | | 6,100 | 164,546 |
| Sumitomo Mitsui Financial Group, Inc. | | 13,300 | 517,837 |
| T&D Holdings, Inc. | | 15,200 | 242,983 |
| Taiheiyo Cement Corp. | | 4,300 | 126,535 |
| Takeda Pharmaceutical Co. Ltd. | | 9,200 | 381,428 |
| Techno Medica Co. Ltd. | | 500 | 9,190 |
| The Monogatari Corp. | | 280 | 25,014 |
| TKC Corp. | | 1,000 | 38,109 |
| Tocalo Co. Ltd. | | 2,200 | 19,127 |
| Tokio Marine Holdings, Inc. | | 9,400 | 442,854 |
| USS Co. Ltd. | | 38,400 | 693,232 |
| Welcia Holdings Co. Ltd. | | 800 | 40,838 |
| Workman Co. Ltd. | | 700 | 44,295 |
| Yamada Consulting Group Co. Ltd. | | 1,800 | 41,492 |
| Yamato Kogyo Co. Ltd. | | 700 | 18,425 |
|
| TOTAL JAPAN | | | 14,331,085 |
|
| Kenya - 0.3% | | | |
| Safaricom Ltd. | | 1,587,600 | 361,525 |
| Korea (South) - 2.1% | | | |
| BGF Retail Co. Ltd. | | 1,035 | 152,846 |
| Leeno Industrial, Inc. | | 264 | 13,859 |
| LG Chemical Ltd. | | 821 | 249,682 |
| LG Household & Health Care Ltd. | | 239 | 218,682 |
| NAVER Corp. | | 1,235 | 123,933 |
| Samsung Electronics Co. Ltd. | | 36,667 | 1,362,560 |
|
| TOTAL KOREA (SOUTH) | | | 2,121,562 |
|
| Mexico - 0.7% | | | |
| Consorcio ARA S.A.B. de CV | | 41,655 | 11,053 |
| Embotelladoras Arca S.A.B. de CV | | 22,900 | 115,158 |
| Grupo Aeroportuario del Pacifico S.A.B. de CV Series B | | 19,300 | 159,667 |
| Grupo Aeroportuario del Sureste S.A.B. de CV Series B | | 11,070 | 184,002 |
| Wal-Mart de Mexico SA de CV Series V | | 94,400 | 241,097 |
|
| TOTAL MEXICO | | | 710,977 |
|
| Netherlands - 2.2% | | | |
| Aalberts Industries NV | | 2,000 | 73,509 |
| ASML Holding NV (Netherlands) | | 6,000 | 1,033,465 |
| Ferrari NV | | 1,400 | 164,121 |
| ING Groep NV (Certificaten Van Aandelen) | | 25,576 | 302,590 |
| Koninklijke Philips Electronics NV | | 6,715 | 250,442 |
| Takeaway.com Holding BV (a)(b) | | 600 | 35,339 |
| VastNed Retail NV | | 596 | 23,627 |
| Wolters Kluwer NV | | 4,100 | 232,936 |
| Yandex NV Series A (a) | | 5,897 | 177,677 |
|
| TOTAL NETHERLANDS | | | 2,293,706 |
|
| New Zealand - 0.1% | | | |
| Auckland International Airport Ltd. | | 32,937 | 150,236 |
| Norway - 0.7% | | | |
| Equinor ASA | | 18,785 | 488,689 |
| Kongsberg Gruppen ASA | | 2,800 | 46,037 |
| Schibsted ASA (B Shares) | | 5,433 | 172,081 |
| Skandiabanken ASA (b) | | 3,000 | 29,894 |
|
| TOTAL NORWAY | | | 736,701 |
|
| Philippines - 0.8% | | | |
| Ayala Corp. | | 10,760 | 185,250 |
| Ayala Land, Inc. | | 262,200 | 194,551 |
| Jollibee Food Corp. | | 7,250 | 37,446 |
| SM Investments Corp. | | 11,750 | 197,897 |
| SM Prime Holdings, Inc. | | 312,600 | 197,726 |
|
| TOTAL PHILIPPINES | | | 812,870 |
|
| Portugal - 0.2% | | | |
| Galp Energia SGPS SA Class B | | 12,492 | 217,825 |
| Russia - 0.8% | | | |
| Alrosa Co. Ltd. | | 121,400 | 184,108 |
| NOVATEK OAO GDR (Reg. S) | | 1,600 | 271,200 |
| Sberbank of Russia | | 124,490 | 357,820 |
|
| TOTAL RUSSIA | | | 813,128 |
|
| South Africa - 1.9% | | | |
| Capitec Bank Holdings Ltd. | | 2,824 | 189,639 |
| Clicks Group Ltd. | | 20,899 | 266,329 |
| Discovery Ltd. | | 17,322 | 185,437 |
| FirstRand Ltd. | | 59,250 | 258,286 |
| Mondi Ltd. | | 7,914 | 189,303 |
| Naspers Ltd. Class N | | 4,818 | 846,740 |
|
| TOTAL SOUTH AFRICA | | | 1,935,734 |
|
| Spain - 2.6% | | | |
| Amadeus IT Holding SA Class A | | 11,900 | 959,402 |
| Banco Santander SA | | 131,926 | 627,698 |
| Banco Santander SA rights (a) | | 135,826 | 5,277 |
| CaixaBank SA | | 60,006 | 242,827 |
| Grifols SA ADR | | 12,600 | 257,292 |
| Masmovil Ibercom SA (a) | | 821 | 106,567 |
| Merlin Properties Socimi SA | | 9,000 | 112,948 |
| Prosegur Compania de Seguridad SA (Reg.) | | 44,876 | 249,468 |
| Unicaja Banco SA (b) | | 60,300 | 77,246 |
|
| TOTAL SPAIN | | | 2,638,725 |
|
| Sweden - 3.0% | | | |
| Addlife AB | | 1,400 | 32,127 |
| AddTech AB (B Shares) | | 3,000 | 61,304 |
| Alfa Laval AB | | 8,600 | 219,625 |
| ASSA ABLOY AB (B Shares) | | 38,500 | 765,794 |
| Atlas Copco AB (A Shares) | | 15,300 | 378,857 |
| Epiroc AB Class A (a) | | 20,600 | 180,897 |
| Fagerhult AB | | 13,185 | 115,841 |
| Hexagon AB (B Shares) | | 3,300 | 161,770 |
| Investor AB (B Shares) | | 5,855 | 253,813 |
| Lagercrantz Group AB (B Shares) | | 4,300 | 42,337 |
| Loomis AB (B Shares) | | 4,600 | 142,255 |
| Saab AB (B Shares) | | 1,200 | 47,024 |
| Svenska Handelsbanken AB (A Shares) | | 13,145 | 142,884 |
| Swedbank AB (A Shares) | | 15,200 | 342,331 |
| Telefonaktiebolaget LM Ericsson (B Shares) | | 27,800 | 242,048 |
|
| TOTAL SWEDEN | | | 3,128,907 |
|
| Switzerland - 4.4% | | | |
| Credit Suisse Group AG | | 20,393 | 266,611 |
| Nestle SA (Reg. S) | | 15,066 | 1,271,919 |
| Roche Holding AG (participation certificate) | | 4,374 | 1,064,467 |
| Schindler Holding AG: | | | |
| (participation certificate) | | 1,599 | 337,217 |
| (Reg.) | | 280 | 58,160 |
| Sika AG | | 1,404 | 180,109 |
| Swiss Life Holding AG | | 610 | 230,276 |
| Tecan Group AG | | 220 | 49,629 |
| UBS Group AG | | 36,989 | 514,147 |
| Zurich Insurance Group AG | | 1,632 | 506,706 |
|
| TOTAL SWITZERLAND | | | 4,479,241 |
|
| Taiwan - 2.3% | | | |
| Addcn Technology Co. Ltd. | | 3,772 | 29,362 |
| E.SUN Financial Holdings Co. Ltd. | | 298,000 | 197,316 |
| Formosa Chemicals & Fibre Corp. | | 69,000 | 249,608 |
| Formosa Plastics Corp. | | 79,000 | 257,715 |
| Taiwan Semiconductor Manufacturing Co. Ltd. | | 218,035 | 1,635,946 |
|
| TOTAL TAIWAN | | | 2,369,947 |
|
| Thailand - 0.4% | | | |
| Airports of Thailand PCL (For. Reg.) | | 108,500 | 209,409 |
| C.P. ALL PCL (For. Reg.) | | 108,700 | 220,449 |
|
| TOTAL THAILAND | | | 429,858 |
|
| United Arab Emirates - 0.2% | | | |
| National Bank of Abu Dhabi PJSC | | 47,800 | 179,845 |
| United Kingdom - 10.2% | | | |
| Alliance Pharma PLC | | 29,814 | 25,456 |
| Ascential PLC | | 11,562 | 55,686 |
| AstraZeneca PLC (United Kingdom) | | 6,789 | 519,288 |
| Aviva PLC | | 60,513 | 330,697 |
| Avon Rubber PLC | | 1,400 | 21,474 |
| BAE Systems PLC | | 77,135 | 517,212 |
| BHP Billiton PLC | | 41,476 | 827,392 |
| BP PLC | | 142,345 | 1,028,260 |
| British American Tobacco PLC (United Kingdom) | | 12,279 | 532,298 |
| Bunzl PLC | | 7,268 | 214,691 |
| Cineworld Group PLC | | 6,800 | 25,606 |
| Compass Group PLC | | 5,623 | 110,685 |
| Dechra Pharmaceuticals PLC | | 3,400 | 99,347 |
| DP Poland PLC (a) | | 40,100 | 13,839 |
| Elementis PLC | | 60,535 | 158,620 |
| GlaxoSmithKline PLC | | 16,636 | 322,202 |
| Great Portland Estates PLC | | 5,506 | 49,103 |
| Hilton Food Group PLC | | 2,654 | 31,277 |
| Howden Joinery Group PLC | | 3,600 | 21,586 |
| HSBC Holdings PLC sponsored ADR | | 6,031 | 247,814 |
| Imperial Tobacco Group PLC | | 9,374 | 317,878 |
| Informa PLC | | 81,415 | 742,605 |
| InterContinental Hotel Group PLC ADR | | 10,791 | 580,124 |
| ITE Group PLC | | 34,300 | 24,990 |
| ITV PLC | | 49,300 | 93,861 |
| Melrose Industries PLC | | 66,403 | 143,144 |
| Micro Focus International PLC | | 8,258 | 128,017 |
| NMC Health PLC | | 4,062 | 183,383 |
| Prudential PLC | | 33,840 | 677,599 |
| Reckitt Benckiser Group PLC | | 4,251 | 343,753 |
| Rightmove PLC | | 23,500 | 135,815 |
| Royal Dutch Shell PLC Class B sponsored ADR | | 10,200 | 670,242 |
| RSA Insurance Group PLC | | 21,100 | 152,219 |
| Shaftesbury PLC | | 13,837 | 158,647 |
| Spectris PLC | | 10,770 | 295,148 |
| Spirax-Sarco Engineering PLC | | 1,899 | 157,046 |
| Standard Chartered PLC (United Kingdom) | | 22,838 | 160,407 |
| Standard Life PLC | | 52,168 | 180,372 |
| The Weir Group PLC | | 6,604 | 133,878 |
| Topps Tiles PLC | | 16,600 | 13,346 |
| Ultra Electronics Holdings PLC | | 2,001 | 36,779 |
|
| TOTAL UNITED KINGDOM | | | 10,481,786 |
|
| United States of America - 8.9% | | | |
| Alphabet, Inc. Class A (a) | | 590 | 643,442 |
| American Tower Corp. | | 1,200 | 186,972 |
| Amgen, Inc. | | 1,100 | 212,069 |
| Amphenol Corp. Class A | | 1,940 | 173,630 |
| Autoliv, Inc. | | 3,174 | 264,521 |
| Berkshire Hathaway, Inc. Class B (a) | | 1,716 | 352,260 |
| Black Knight, Inc. (a) | | 3,800 | 185,326 |
| ConocoPhillips Co. | | 3,800 | 265,620 |
| Constellation Brands, Inc. Class A (sub. vtg.) | | 800 | 159,384 |
| Marsh & McLennan Companies, Inc. | | 3,200 | 271,200 |
| Martin Marietta Materials, Inc. | | 1,930 | 330,570 |
| MasterCard, Inc. Class A | | 5,753 | 1,137,196 |
| MercadoLibre, Inc. | | 600 | 194,700 |
| Mohawk Industries, Inc. (a) | | 1,565 | 195,202 |
| Moody's Corp. | | 3,239 | 471,210 |
| MSCI, Inc. | | 3,751 | 564,075 |
| NVIDIA Corp. | | 700 | 147,581 |
| PayPal Holdings, Inc. (a) | | 1,800 | 151,542 |
| PriceSmart, Inc. | | 2,385 | 167,308 |
| ResMed, Inc. | | 3,510 | 371,779 |
| S&P Global, Inc. | | 3,101 | 565,374 |
| Sherwin-Williams Co. | | 1,570 | 617,748 |
| TransDigm Group, Inc. (a) | | 496 | 163,804 |
| Veoneer, Inc. (a) | | 3,874 | 130,089 |
| Visa, Inc. Class A | | 8,631 | 1,189,783 |
|
| TOTAL UNITED STATES OF AMERICA | | | 9,112,385 |
|
| TOTAL COMMON STOCKS | | | |
| (Cost $95,720,831) | | | 98,968,835 |
|
| Nonconvertible Preferred Stocks - 1.2% | | | |
| Brazil - 0.8% | | | |
| Itau Unibanco Holding SA | | 45,470 | 601,746 |
| Itausa-Investimentos Itau SA (PN) | | 86,300 | 260,651 |
|
| TOTAL BRAZIL | | | 862,397 |
|
| Germany - 0.2% | | | |
| Porsche Automobil Holding SE (Germany) | | 3,076 | 195,618 |
| Sartorius AG (non-vtg.) | | 380 | 55,092 |
|
| TOTAL GERMANY | | | 250,710 |
|
| Spain - 0.2% | | | |
| Grifols SA Class B | | 8,000 | 166,252 |
| TOTAL NONCONVERTIBLE PREFERRED STOCKS | | | |
| (Cost $1,217,620) | | | 1,279,359 |
|
| Money Market Funds - 1.8% | | | |
| Fidelity Cash Central Fund, 2.23% (e) | | 1,856,306 | 1,856,677 |
| Fidelity Securities Lending Cash Central Fund 2.23% (e)(f) | | 11,140 | 11,141 |
| TOTAL MONEY MARKET FUNDS | | | |
| (Cost $1,867,818) | | | 1,867,818 |
| TOTAL INVESTMENT IN SECURITIES - 99.2% | | | |
| (Cost $98,806,269) | | | 102,116,012 |
| NET OTHER ASSETS (LIABILITIES) - 0.8% | | | 786,878 |
| NET ASSETS - 100% | | | $102,902,890 |
Categorizations in the Schedule of Investments are based on country or territory of incorporation.
Legend
(a) Non-income producing
(b) Security exempt from registration under Rule 144A of the Securities Act of 1933. These securities may be resold in transactions exempt from registration, normally to qualified institutional buyers. At the end of the period, the value of these securities amounted to $182,769 or 0.2% of net assets.
(c) Level 3 security
(d) Security or a portion of the security is on loan at period end.
(e) Affiliated fund that is generally available only to investment companies and other accounts managed by Fidelity Investments. The rate quoted is the annualized seven-day yield of the fund at period end. A complete unaudited listing of the fund's holdings as of its most recent quarter end is available upon request. In addition, each Fidelity Central Fund's financial statements, which are not covered by the Fund's Report of Independent Registered Public Accounting Firm, are available on the SEC's website or upon request.
(f) Investment made with cash collateral received from securities on loan.
Affiliated Central Funds
Information regarding fiscal year to date income earned by the Fund from investments in Fidelity Central Funds is as follows:
| Fund | Income earned |
| Fidelity Cash Central Fund | $27,590 |
| Fidelity Securities Lending Cash Central Fund | 8,525 |
| Total | $36,115 |
Amounts in the income column in the above table include any capital gain distributions from underlying funds, which are presented in the corresponding line-item in the Statement of Operations if applicable.
Investment Valuation
The following is a summary of the inputs used, as of October 31, 2018, involving the Fund's assets and liabilities carried at fair value. The inputs or methodology used for valuing securities may not be an indication of the risk associated with investing in those securities. For more information on valuation inputs, and their aggregation into the levels used below, please refer to the Investment Valuation section in the accompanying Notes to Financial Statements.
| | Valuation Inputs at Reporting Date: |
| Description | Total | Level 1 | Level 2 | Level 3 |
| Investments in Securities: | | | | |
| Equities: | | | | |
| Communication Services | $7,096,993 | $4,313,086 | $2,783,907 | $-- |
| Consumer Discretionary | 9,448,645 | 7,616,273 | 1,832,372 | -- |
| Consumer Staples | 7,493,811 | 4,838,016 | 2,655,795 | -- |
| Energy | 5,806,877 | 3,608,047 | 2,198,830 | -- |
| Financials | 22,806,295 | 15,657,199 | 7,149,096 | -- |
| Health Care | 8,319,135 | 3,748,442 | 4,401,553 | 169,140 |
| Industrials | 14,882,148 | 10,593,236 | 4,288,912 | -- |
| Information Technology | 14,009,382 | 9,595,832 | 4,413,550 | -- |
| Materials | 8,402,963 | 6,964,565 | 1,438,398 | -- |
| Real Estate | 1,811,438 | 1,568,198 | 243,240 | -- |
| Utilities | 170,507 | 170,507 | -- | -- |
| Money Market Funds | 1,867,818 | 1,867,818 | -- | -- |
| Total Investments in Securities: | $102,116,012 | $70,541,219 | $31,405,653 | $169,140 |
The following is a summary of transfers between Level 1 and Level 2 for the period ended October 31, 2018. Transfers are assumed to have occurred at the beginning of the period, and are primarily attributable to the valuation techniques used for foreign equity securities, as discussed in the accompanying Notes to Financial Statements:
| Transfers | Total |
| Level 1 to Level 2 | $2,922,813 |
| Level 2 to Level 1 | $6,897,699 |
See accompanying notes which are an integral part of the financial statements.
Financial Statements
Statement of Assets and Liabilities
| | | October 31, 2018 |
| Assets | | |
Investment in securities, at value (including securities loaned of $10,833) — See accompanying schedule:
Unaffiliated issuers (cost $96,938,451) | $100,248,194 | |
| Fidelity Central Funds (cost $1,867,818) | 1,867,818 | |
| Total Investment in Securities (cost $98,806,269) | | $102,116,012 |
| Foreign currency held at value (cost $49,186) | | 49,040 |
| Receivable for investments sold | | 1,338,666 |
| Receivable for fund shares sold | | 56,830 |
| Dividends receivable | | 703,592 |
| Distributions receivable from Fidelity Central Funds | | 3,016 |
| Prepaid expenses | | 225 |
| Receivable from investment adviser for expense reductions | | 27,180 |
| Other receivables | | 33,436 |
| Total assets | | 104,327,997 |
| Liabilities | | |
| Payable to custodian bank | $69,044 | |
| Payable for investments purchased | 639,640 | |
| Payable for fund shares redeemed | 532,597 | |
| Accrued management fee | 53,943 | |
| Distribution and service plan fees payable | 9,122 | |
| Other affiliated payables | 22,237 | |
| Other payables and accrued expenses | 87,383 | |
| Collateral on securities loaned | 11,141 | |
| Total liabilities | | 1,425,107 |
| Net Assets | | $102,902,890 |
| Net Assets consist of: | | |
| Paid in capital | | $104,331,835 |
| Total distributable earnings (loss) | | (1,428,945) |
| Net Assets | | $102,902,890 |
| Net Asset Value and Maximum Offering Price | | |
| Class A: | | |
| Net Asset Value and redemption price per share ($7,525,893 ÷ 917,821 shares) | | $8.20 |
| Maximum offering price per share (100/94.25 of $8.20) | | $8.70 |
| Class M: | | |
| Net Asset Value and redemption price per share ($11,881,668 ÷ 1,444,790 shares) | | $8.22 |
| Maximum offering price per share (100/96.50 of $8.22) | | $8.52 |
| Class C: | | |
| Net Asset Value and offering price per share ($2,705,127 ÷ 330,913 shares)(a) | | $8.17 |
| Total International Equity: | | |
| Net Asset Value, offering price and redemption price per share ($71,169,797 ÷ 8,644,047 shares) | | $8.23 |
| Class I: | | |
| Net Asset Value, offering price and redemption price per share ($9,404,779 ÷ 1,147,697 shares) | | $8.19 |
| Class Z: | | |
| Net Asset Value, offering price and redemption price per share ($215,626 ÷ 26,231 shares) | | $8.22 |
(a) Redemption price per share is equal to net asset value less any applicable contingent deferred sales charge.
See accompanying notes which are an integral part of the financial statements.
Statement of Operations
| | | Year ended October 31, 2018 |
| Investment Income | | |
| Dividends | | $3,030,878 |
| Income from Fidelity Central Funds | | 36,115 |
| Income before foreign taxes withheld | | 3,066,993 |
| Less foreign taxes withheld | | (277,649) |
| Total income | | 2,789,344 |
| Expenses | | |
| Management fee | | |
| Basic fee | $825,140 | |
| Performance adjustment | 90,717 | |
| Transfer agent fees | 223,342 | |
| Distribution and service plan fees | 128,435 | |
| Accounting and security lending fees | 62,000 | |
| Custodian fees and expenses | 131,283 | |
| Independent trustees' fees and expenses | 598 | |
| Registration fees | 81,892 | |
| Audit | 139,052 | |
| Legal | 3,456 | |
| Miscellaneous | 871 | |
| Total expenses before reductions | 1,686,786 | |
| Expense reductions | (138,550) | |
| Total expenses after reductions | | 1,548,236 |
| Net investment income (loss) | | 1,241,108 |
| Realized and Unrealized Gain (Loss) | | |
| Net realized gain (loss) on: | | |
| Investment securities: | | |
| Unaffiliated issuers | 1,035,720 | |
| Fidelity Central Funds | 246 | |
| Foreign currency transactions | (14,087) | |
| Total net realized gain (loss) | | 1,021,879 |
| Change in net unrealized appreciation (depreciation) on: | | |
| Investment securities: | | |
| Unaffiliated issuers (net of decrease in deferred foreign taxes of $111,264) | (12,588,089) | |
| Assets and liabilities in foreign currencies | (15,037) | |
| Total change in net unrealized appreciation (depreciation) | | (12,603,126) |
| Net gain (loss) | | (11,581,247) |
| Net increase (decrease) in net assets resulting from operations | | $(10,340,139) |
See accompanying notes which are an integral part of the financial statements.
Statement of Changes in Net Assets
| | Year ended October 31, 2018 | Year ended October 31, 2017 |
| Increase (Decrease) in Net Assets | | |
| Operations | | |
| Net investment income (loss) | $1,241,108 | $2,786,915 |
| Net realized gain (loss) | 1,021,879 | 70,763,610 |
| Change in net unrealized appreciation (depreciation) | (12,603,126) | (21,931,310) |
| Net increase (decrease) in net assets resulting from operations | (10,340,139) | 51,619,215 |
| Distributions to shareholders | (4,673,480) | – |
| Distributions to shareholders from net investment income | – | (4,227,310) |
| Total distributions | (4,673,480) | (4,227,310) |
| Share transactions - net increase (decrease) | 419,996 | (237,908,011) |
| Redemption fees | 13 | 2,629 |
| Total increase (decrease) in net assets | (14,593,610) | (190,513,477) |
| Net Assets | | |
| Beginning of period | 117,496,500 | 308,009,977 |
| End of period | $102,902,890 | $117,496,500 |
| Other Information | | |
| Undistributed net investment income end of period | | $1,842,046 |
See accompanying notes which are an integral part of the financial statements.
Financial Highlights
Fidelity Total International Equity Fund Class A
| Years ended October 31, | 2018 | 2017 | 2016 | 2015 | 2014 |
| Selected Per–Share Data | | | | | |
| Net asset value, beginning of period | $9.39 | $7.67 | $7.79 | $8.00 | $8.27 |
| Income from Investment Operations | | | | | |
| Net investment income (loss)A | .08 | .09 | .08 | .07 | .13 |
| Net realized and unrealized gain (loss) | (.89) | 1.71 | (.14) | (.14) | (.12) |
| Total from investment operations | (.81) | 1.80 | (.06) | (.07) | .01 |
| Distributions from net investment income | (.15) | (.08) | (.06) | (.10) | (.10) |
| Distributions from net realized gain | (.23) | – | – | (.04) | (.18) |
| Total distributions | (.38) | (.08) | (.06) | (.14) | (.28) |
| Redemption fees added to paid in capitalA,B | – | – | – | – | – |
| Net asset value, end of period | $8.20 | $9.39 | $7.67 | $7.79 | $8.00 |
| Total ReturnC,D | (9.04)% | 23.78% | (.76)% | (.89)% | .19% |
| Ratios to Average Net AssetsE,F | | | | | |
| Expenses before reductions | 1.60% | 1.67% | 1.52% | 1.48% | 1.44% |
| Expenses net of fee waivers, if any | 1.45% | 1.45% | 1.45% | 1.45% | 1.44% |
| Expenses net of all reductions | 1.44% | 1.43% | 1.45% | 1.44% | 1.44% |
| Net investment income (loss) | .90% | 1.02% | 1.10% | .86% | 1.63% |
| Supplemental Data | | | | | |
| Net assets, end of period (000 omitted) | $7,526 | $9,292 | $8,576 | $9,163 | $9,164 |
| Portfolio turnover rateG | 52% | 66%H | 51% | 53% | 85% |
A Calculated based on average shares outstanding during the period.
B Amount represents less than $.005 per share.
C Total returns would have been lower if certain expenses had not been reduced during the applicable periods shown.
D Total returns do not include the effect of the sales charges.
E Fees and expenses of any underlying Fidelity Central Funds are not included in the Fund's expense ratio. The Fund indirectly bears its proportionate share of the expenses of any underlying Fidelity Central Funds.
F Expense ratios reflect operating expenses of the class. Expenses before reductions do not reflect amounts reimbursed by the investment adviser or reductions from brokerage service arrangements or reductions from other expense offset arrangements and do not represent the amount paid by the class during periods when reimbursements or reductions occur. Expenses net of fee waivers reflect expenses after reimbursement by the investment adviser but prior to reductions from brokerage service arrangements or other expense offset arrangements. Expenses net of all reductions represent the net expenses paid by the class.
G Amount does not include the portfolio activity of any underlying Fidelity Central Funds.
H Portfolio turnover rate excludes securities received or delivered in-kind.
See accompanying notes which are an integral part of the financial statements.
Fidelity Total International Equity Fund Class M
| Years ended October 31, | 2018 | 2017 | 2016 | 2015 | 2014 |
| Selected Per–Share Data | | | | | |
| Net asset value, beginning of period | $9.42 | $7.70 | $7.81 | $8.04 | $8.32 |
| Income from Investment Operations | | | | | |
| Net investment income (loss)A | .06 | .06 | .06 | .05 | .11 |
| Net realized and unrealized gain (loss) | (.90) | 1.73 | (.13) | (.15) | (.12) |
| Total from investment operations | (.84) | 1.79 | (.07) | (.10) | (.01) |
| Distributions from net investment income | (.13) | (.07) | (.04) | (.09) | (.09) |
| Distributions from net realized gain | (.23) | – | – | (.04) | (.18) |
| Total distributions | (.36) | (.07) | (.04) | (.13) | (.27) |
| Redemption fees added to paid in capitalA,B | – | – | – | – | – |
| Net asset value, end of period | $8.22 | $9.42 | $7.70 | $7.81 | $8.04 |
| Total ReturnC,D | (9.30)% | 23.41% | (.86)% | (1.26)% | (.06)% |
| Ratios to Average Net AssetsE,F | | | | | |
| Expenses before reductions | 1.85% | 1.90% | 1.73% | 1.70% | 1.68% |
| Expenses net of fee waivers, if any | 1.70% | 1.70% | 1.70% | 1.70% | 1.68% |
| Expenses net of all reductions | 1.69% | 1.68% | 1.69% | 1.69% | 1.68% |
| Net investment income (loss) | .65% | .77% | .85% | .61% | 1.38% |
| Supplemental Data | | | | | |
| Net assets, end of period (000 omitted) | $11,882 | $15,894 | $13,893 | $13,962 | $10,282 |
| Portfolio turnover rateG | 52% | 66%H | 51% | 53% | 85% |
A Calculated based on average shares outstanding during the period.
B Amount represents less than $.005 per share.
C Total returns would have been lower if certain expenses had not been reduced during the applicable periods shown.
D Total returns do not include the effect of the sales charges.
E Fees and expenses of any underlying Fidelity Central Funds are not included in the Fund's expense ratio. The Fund indirectly bears its proportionate share of the expenses of any underlying Fidelity Central Funds.
F Expense ratios reflect operating expenses of the class. Expenses before reductions do not reflect amounts reimbursed by the investment adviser or reductions from brokerage service arrangements or reductions from other expense offset arrangements and do not represent the amount paid by the class during periods when reimbursements or reductions occur. Expenses net of fee waivers reflect expenses after reimbursement by the investment adviser but prior to reductions from brokerage service arrangements or other expense offset arrangements. Expenses net of all reductions represent the net expenses paid by the class.
G Amount does not include the portfolio activity of any underlying Fidelity Central Funds.
H Portfolio turnover rate excludes securities received or delivered in-kind.
See accompanying notes which are an integral part of the financial statements.
Fidelity Total International Equity Fund Class C
| Years ended October 31, | 2018 | 2017 | 2016 | 2015 | 2014 |
| Selected Per–Share Data | | | | | |
| Net asset value, beginning of period | $9.37 | $7.66 | $7.77 | $8.00 | $8.28 |
| Income from Investment Operations | | | | | |
| Net investment income (loss)A | .01 | .02 | .03 | .01 | .07 |
| Net realized and unrealized gain (loss) | (.89) | 1.71 | (.14) | (.15) | (.12) |
| Total from investment operations | (.88) | 1.73 | (.11) | (.14) | (.05) |
| Distributions from net investment income | (.10) | (.02) | – | (.05) | (.05) |
| Distributions from net realized gain | (.23) | – | – | (.04) | (.18) |
| Total distributions | (.32)B | (.02) | – | (.09) | (.23) |
| Redemption fees added to paid in capitalA,C | – | – | – | – | – |
| Net asset value, end of period | $8.17 | $9.37 | $7.66 | $7.77 | $8.00 |
| Total ReturnD,E | (9.72)% | 22.70% | (1.42)% | (1.73)% | (.57)% |
| Ratios to Average Net AssetsF,G | | | | | |
| Expenses before reductions | 2.43% | 2.48% | 2.30% | 2.26% | 2.22% |
| Expenses net of fee waivers, if any | 2.20% | 2.20% | 2.20% | 2.20% | 2.20% |
| Expenses net of all reductions | 2.19% | 2.18% | 2.20% | 2.19% | 2.20% |
| Net investment income (loss) | .14% | .27% | .35% | .11% | .87% |
| Supplemental Data | | | | | |
| Net assets, end of period (000 omitted) | $2,705 | $3,211 | $2,713 | $3,311 | $4,028 |
| Portfolio turnover rateH | 52% | 66%I | 51% | 53% | 85% |
A Calculated based on average shares outstanding during the period.
B Total distributions of $.32 per share is comprised of distributions from net investment income of $.097 and distributions from net realized gain of $.226 per share.
C Amount represents less than $.005 per share.
D Total returns would have been lower if certain expenses had not been reduced during the applicable periods shown.
E Total returns do not include the effect of the contingent deferred sales charge.
F Fees and expenses of any underlying Fidelity Central Funds are not included in the Fund's expense ratio. The Fund indirectly bears its proportionate share of the expenses of any underlying Fidelity Central Funds.
G Expense ratios reflect operating expenses of the class. Expenses before reductions do not reflect amounts reimbursed by the investment adviser or reductions from brokerage service arrangements or reductions from other expense offset arrangements and do not represent the amount paid by the class during periods when reimbursements or reductions occur. Expenses net of fee waivers reflect expenses after reimbursement by the investment adviser but prior to reductions from brokerage service arrangements or other expense offset arrangements. Expenses net of all reductions represent the net expenses paid by the class.
H Amount does not include the portfolio activity of any underlying Fidelity Central Funds.
I Portfolio turnover rate excludes securities received or delivered in-kind.
See accompanying notes which are an integral part of the financial statements.
Fidelity Total International Equity Fund
| Years ended October 31, | 2018 | 2017 | 2016 | 2015 | 2014 |
| Selected Per–Share Data | | | | | |
| Net asset value, beginning of period | $9.40 | $7.70 | $7.82 | $8.03 | $8.29 |
| Income from Investment Operations | | | | | |
| Net investment income (loss)A | .11 | .11 | .11 | .10 | .16 |
| Net realized and unrealized gain (loss) | (.90) | 1.70 | (.13) | (.14) | (.12) |
| Total from investment operations | (.79) | 1.81 | (.02) | (.04) | .04 |
| Distributions from net investment income | (.15) | (.11) | (.10) | (.13) | (.12) |
| Distributions from net realized gain | (.23) | – | – | (.04) | (.18) |
| Total distributions | (.38) | (.11) | (.10) | (.17) | (.30) |
| Redemption fees added to paid in capitalA,B | – | – | – | – | – |
| Net asset value, end of period | $8.23 | $9.40 | $7.70 | $7.82 | $8.03 |
| Total ReturnC | (8.84)% | 23.86% | (.32)% | (.51)% | .55% |
| Ratios to Average Net AssetsD,E | | | | | |
| Expenses before reductions | 1.29% | 1.15% | 1.11% | 1.07% | 1.04% |
| Expenses net of fee waivers, if any | 1.20% | 1.14% | 1.11% | 1.07% | 1.04% |
| Expenses net of all reductions | 1.19% | 1.13% | 1.10% | 1.06% | 1.04% |
| Net investment income (loss) | 1.15% | 1.33% | 1.44% | 1.24% | 2.03% |
| Supplemental Data | | | | | |
| Net assets, end of period (000 omitted) | $71,170 | $82,077 | $280,672 | $307,035 | $324,438 |
| Portfolio turnover rateF | 52% | 66%G | 51% | 53% | 85% |
A Calculated based on average shares outstanding during the period.
B Amount represents less than $.005 per share.
C Total returns would have been lower if certain expenses had not been reduced during the applicable periods shown.
D Fees and expenses of any underlying Fidelity Central Funds are not included in the Fund's expense ratio. The Fund indirectly bears its proportionate share of the expenses of any underlying Fidelity Central Funds.
E Expense ratios reflect operating expenses of the class. Expenses before reductions do not reflect amounts reimbursed by the investment adviser or reductions from brokerage service arrangements or reductions from other expense offset arrangements and do not represent the amount paid by the class during periods when reimbursements or reductions occur. Expenses net of fee waivers reflect expenses after reimbursement by the investment adviser but prior to reductions from brokerage service arrangements or other expense offset arrangements. Expenses net of all reductions represent the net expenses paid by the class.
F Amount does not include the portfolio activity of any underlying Fidelity Central Funds.
G Portfolio turnover rate excludes securities received or delivered in-kind.
See accompanying notes which are an integral part of the financial statements.
Fidelity Total International Equity Fund Class I
| Years ended October 31, | 2018 | 2017 | 2016 | 2015 | 2014 |
| Selected Per–Share Data | | | | | |
| Net asset value, beginning of period | $9.38 | $7.66 | $7.78 | $7.99 | $8.26 |
| Income from Investment Operations | | | | | |
| Net investment income (loss)A | .10 | .11 | .10 | .09 | .15 |
| Net realized and unrealized gain (loss) | (.89) | 1.71 | (.13) | (.14) | (.12) |
| Total from investment operations | (.79) | 1.82 | (.03) | (.05) | .03 |
| Distributions from net investment income | (.17) | (.10) | (.09) | (.12) | (.12) |
| Distributions from net realized gain | (.23) | – | – | (.04) | (.18) |
| Total distributions | (.40) | (.10) | (.09) | (.16) | (.30) |
| Redemption fees added to paid in capitalA,B | – | – | – | – | – |
| Net asset value, end of period | $8.19 | $9.38 | $7.66 | $7.78 | $7.99 |
| Total ReturnC | (8.86)% | 24.08% | (.43)% | (.64)% | .37% |
| Ratios to Average Net AssetsD,E | | | | | |
| Expenses before reductions | 1.29% | 1.42% | 1.22% | 1.17% | 1.15% |
| Expenses net of fee waivers, if any | 1.20% | 1.20% | 1.20% | 1.17% | 1.15% |
| Expenses net of all reductions | 1.19% | 1.18% | 1.20% | 1.16% | 1.15% |
| Net investment income (loss) | 1.15% | 1.28% | 1.35% | 1.14% | 1.91% |
| Supplemental Data | | | | | |
| Net assets, end of period (000 omitted) | $9,405 | $6,776 | $2,156 | $2,602 | $2,240 |
| Portfolio turnover rateF | 52% | 66%G | 51% | 53% | 85% |
A Calculated based on average shares outstanding during the period.
B Amount represents less than $.005 per share.
C Total returns would have been lower if certain expenses had not been reduced during the applicable periods shown.
D Fees and expenses of any underlying Fidelity Central Funds are not included in the Fund's expense ratio. The Fund indirectly bears its proportionate share of the expenses of any underlying Fidelity Central Funds.
E Expense ratios reflect operating expenses of the class. Expenses before reductions do not reflect amounts reimbursed by the investment adviser or reductions from brokerage service arrangements or reductions from other expense offset arrangements and do not represent the amount paid by the class during periods when reimbursements or reductions occur. Expenses net of fee waivers reflect expenses after reimbursement by the investment adviser but prior to reductions from brokerage service arrangements or other expense offset arrangements. Expenses net of all reductions represent the net expenses paid by the class.
F Amount does not include the portfolio activity of any underlying Fidelity Central Funds.
G Portfolio turnover rate excludes securities received or delivered in-kind.
See accompanying notes which are an integral part of the financial statements.
Fidelity Total International Equity Fund Class Z
| Years ended October 31, | 2018 | 2017 A |
| Selected Per–Share Data | | |
| Net asset value, beginning of period | $9.39 | $7.73 |
| Income from Investment Operations | | |
| Net investment income (loss)B | .12 | .08 |
| Net realized and unrealized gain (loss) | (.89) | 1.58 |
| Total from investment operations | (.77) | 1.66 |
| Distributions from net investment income | (.17) | – |
| Distributions from net realized gain | (.23) | – |
| Total distributions | (.40) | – |
| Redemption fees added to paid in capitalB,C | – | – |
| Net asset value, end of period | $8.22 | $9.39 |
| Total ReturnD,E | (8.63)% | 21.47% |
| Ratios to Average Net AssetsF,G | | |
| Expenses before reductions | 1.16% | 1.32%H |
| Expenses net of fee waivers, if any | 1.05% | 1.05%H |
| Expenses net of all reductions | 1.04% | 1.04%H |
| Net investment income (loss) | 1.30% | 1.27%H |
| Supplemental Data | | |
| Net assets, end of period (000 omitted) | $216 | $246 |
| Portfolio turnover rateI | 52% | 66%J |
A For the period February 1, 2017 (commencement of sale of shares) to October 31, 2017.
B Calculated based on average shares outstanding during the period.
C Amount represents less than $.005 per share.
D Total returns for periods of less than one year are not annualized.
E Total returns would have been lower if certain expenses had not been reduced during the applicable periods shown.
F Fees and expenses of any underlying Fidelity Central Funds are not included in the Fund's expense ratio. The Fund indirectly bears its proportionate share of the expenses of any underlying Fidelity Central Funds.
G Expense ratios reflect operating expenses of the class. Expenses before reductions do not reflect amounts reimbursed by the investment adviser or reductions from brokerage service arrangements or reductions from other expense offset arrangements and do not represent the amount paid by the class during periods when reimbursements or reductions occur. Expense ratios before reductions for start-up periods may not be representative of longer-term operating periods. Expenses net of fee waivers reflect expenses after reimbursement by the investment adviser but prior to reductions from brokerage service arrangements or other expense offset arrangements. Expenses net of all reductions represent the net expenses paid by the class.
H Annualized
I Amount does not include the portfolio activity of any underlying Fidelity Central Funds.
J Portfolio turnover rate excludes securities received or delivered in-kind.
See accompanying notes which are an integral part of the financial statements.
Notes to Financial Statements
For the period ended October 31, 2018
1. Organization.
Fidelity Total International Equity Fund (the Fund) is a fund of Fidelity Investment Trust (the Trust) and is authorized to issue an unlimited number of shares. The Trust is registered under the Investment Company Act of 1940, as amended (the 1940 Act), as an open-end management investment company organized as a Massachusetts business trust. The Fund offers Class A, Class M, Class C, Total International Equity, Class I and Class Z shares, each of which has equal rights as to assets and voting privileges. Each class has exclusive voting rights with respect to matters that affect that class. The Fund's investments in emerging markets can be subject to social, economic, regulatory, and political uncertainties and can be extremely volatile.
2. Investments in Fidelity Central Funds.
The Fund invests in Fidelity Central Funds, which are open-end investment companies generally available only to other investment companies and accounts managed by the investment adviser and its affiliates. The Fund's Schedule of Investments lists each of the Fidelity Central Funds held as of period end, if any, as an investment of the Fund, but does not include the underlying holdings of each Fidelity Central Fund. As an Investing Fund, the Fund indirectly bears its proportionate share of the expenses of the underlying Fidelity Central Funds.
The Money Market Central Funds seek preservation of capital and current income and are managed by Fidelity Investments Money Management, Inc. (FIMM), an affiliate of the investment adviser. Annualized expenses of the Money Market Central Funds as of their most recent shareholder report date are less than .005%.
A complete unaudited list of holdings for each Fidelity Central Fund is available upon request or at the Securities and Exchange Commission (the SEC) website at www.sec.gov. In addition, the financial statements of the Fidelity Central Funds, which are not covered by the Fund's Report of Independent Registered Public Accounting Firm, are available on the SEC website or upon request.
3. Significant Accounting Policies.
The Fund is an investment company and applies the accounting and reporting guidance of the Financial Accounting Standards Board (FASB) Accounting Standards Codification Topic 946 Financial Services – Investments Companies. The financial statements have been prepared in conformity with accounting principles generally accepted in the United States of America (GAAP), which require management to make certain estimates and assumptions at the date of the financial statements. Actual results could differ from those estimates. Subsequent events, if any, through the date that the financial statements were issued have been evaluated in the preparation of the financial statements. The following summarizes the significant accounting policies of the Fund:
Investment Valuation. Investments are valued as of 4:00 p.m. Eastern time on the last calendar day of the period. The Board of Trustees (the Board) has delegated the day to day responsibility for the valuation of the Fund's investments to the Fair Value Committee (the Committee) established by the Fund's investment adviser. In accordance with valuation policies and procedures approved by the Board, the Fund attempts to obtain prices from one or more third party pricing vendors or brokers to value its investments. When current market prices, quotations or currency exchange rates are not readily available or reliable, investments will be fair valued in good faith by the Committee, in accordance with procedures adopted by the Board. Factors used in determining fair value vary by investment type and may include market or investment specific events. The frequency with which these procedures are used cannot be predicted and they may be utilized to a significant extent. The Committee oversees the Fund's valuation policies and procedures and reports to the Board on the Committee's activities and fair value determinations. The Board monitors the appropriateness of the procedures used in valuing the Fund's investments and ratifies the fair value determinations of the Committee.
The Fund categorizes the inputs to valuation techniques used to value its investments into a disclosure hierarchy consisting of three levels as shown below:
- Level 1 – quoted prices in active markets for identical investments
- Level 2 – other significant observable inputs (including quoted prices for similar investments, interest rates, prepayment speeds, etc.)
- Level 3 – unobservable inputs (including the Fund's own assumptions based on the best information available)
Valuation techniques used to value the Fund's investments by major category are as follows:
Equity securities, including restricted securities, for which market quotations are readily available, are valued at the last reported sale price or official closing price as reported by a third party pricing vendor on the primary market or exchange on which they are traded and are categorized as Level 1 in the hierarchy. In the event there were no sales during the day or closing prices are not available, securities are valued at the last quoted bid price or may be valued using the last available price and are generally categorized as Level 2 in the hierarchy. For foreign equity securities, when market or security specific events arise, comparisons to the valuation of American Depositary Receipts (ADRs), futures contracts, Exchange-Traded Funds (ETFs) and certain indexes as well as quoted prices for similar securities may be used and would be categorized as Level 2 in the hierarchy. Utilizing these techniques may result in transfers between Level 1 and Level 2. For equity securities, including restricted securities, where observable inputs are limited, assumptions about market activity and risk are used and these securities may be categorized as Level 3 in the hierarchy.
Investments in open-end mutual funds, including Fidelity Central Funds, are valued at their closing net asset value (NAV) each business day and are categorized as Level 1 in the hierarchy.
Changes in valuation techniques may result in transfers in or out of an assigned level within the disclosure hierarchy. The aggregate value of investments by input level as of October 31, 2018, including information on transfers between Levels 1 and 2, is included at the end of the Fund's Schedule of Investments.
Foreign Currency. The Fund may use foreign currency contracts to facilitate transactions in foreign-denominated securities. Gains and losses from these transactions may arise from changes in the value of the foreign currency or if the counterparties do not perform under the contracts' terms.
Foreign-denominated assets, including investment securities, and liabilities are translated into U.S. dollars at the exchange rates at period end. Purchases and sales of investment securities, income and dividends received and expenses denominated in foreign currencies are translated into U.S. dollars at the exchange rate in effect on the transaction date.
The effects of exchange rate fluctuations on investments are included with the net realized and unrealized gain (loss) on investment securities. Other foreign currency transactions resulting in realized and unrealized gain (loss) are disclosed separately.
Investment Transactions and Income. For financial reporting purposes, the Fund's investment holdings and NAV include trades executed through the end of the last business day of the period. The NAV per share for processing shareholder transactions is calculated as of the close of business of the New York Stock Exchange (NYSE), normally 4:00 p.m. Eastern time and includes trades executed through the end of the prior business day. Gains and losses on securities sold are determined on the basis of identified cost and include proceeds received from litigation. Dividend income is recorded on the ex-dividend date, except for certain dividends from foreign securities where the ex-dividend date may have passed, which are recorded as soon as the Fund is informed of the ex-dividend date. Non-cash dividends included in dividend income, if any, are recorded at the fair market value of the securities received. Income and capital gain distributions from Fidelity Central Funds, if any, are recorded on the ex-dividend date. Certain distributions received by the Fund represent a return of capital or capital gain. The Fund determines the components of these distributions subsequent to the ex-dividend date, based upon receipt of tax filings or other correspondence relating to the underlying investment. These distributions are recorded as a reduction of cost of investments and/or as a realized gain. Investment income is recorded net of foreign taxes withheld where recovery of such taxes is uncertain.
Class Allocations and Expenses. Investment income, realized and unrealized capital gains and losses, common expenses of the Fund, and certain fund-level expense reductions, if any, are allocated daily on a pro-rata basis to each class based on the relative net assets of each class to the total net assets of the Fund. Each class differs with respect to transfer agent and distribution and service plan fees incurred. Certain expense reductions may also differ by class. For the reporting period, the allocated portion of income and expenses to each class as a percent of its average net assets may vary due to the timing of recording these transactions in relation to fluctuating net assets of the classes. Expenses directly attributable to a fund are charged to that fund. Expenses attributable to more than one fund are allocated among the respective funds on the basis of relative net assets or other appropriate methods. Expense estimates are accrued in the period to which they relate and adjustments are made when actual amounts are known.
Income Tax Information and Distributions to Shareholders. Each year, the Fund intends to qualify as a regulated investment company under Subchapter M of the Internal Revenue Code, including distributing substantially all of its taxable income and realized gains. As a result, no provision for U.S. Federal income taxes is required. As of October 31, 2018, the Fund did not have any unrecognized tax benefits in the financial statements; nor is the Fund aware of any tax positions for which it is reasonably possible that the total amounts of unrecognized tax benefits will significantly change in the next twelve months. The Fund files a U.S. federal tax return, in addition to state and local tax returns as required. The Fund's federal income tax returns are subject to examination by the Internal Revenue Service (IRS) for a period of three fiscal years after they are filed. State and local tax returns may be subject to examination for an additional fiscal year depending on the jurisdiction. Foreign taxes are provided for based on the Fund's understanding of the tax rules and rates that exist in the foreign markets in which it invests.
Distributions are declared and recorded on the ex-dividend date. Income and capital gain distributions are declared separately for each class. Income and capital gain distributions are determined in accordance with income tax regulations, which may differ from GAAP. In addition, the Fund claimed a portion of the payment made to redeeming shareholders as a distribution for income tax purposes.
Capital accounts within the financial statements are adjusted for permanent book-tax differences. These adjustments have no impact on net assets or the results of operations. Capital accounts are not adjusted for temporary book-tax differences which will reverse in a subsequent period.
Book-tax differences are primarily due to foreign currency transactions, certain foreign taxes, passive foreign investment companies (PFIC), capital loss carryforwards and losses deferred due to wash sales.
As of period end, the cost and unrealized appreciation (depreciation) in securities, and derivatives if applicable, for federal income tax purposes were as follows:
| Gross unrealized appreciation | $10,915,083 |
| Gross unrealized depreciation | (8,544,527) |
| Net unrealized appreciation (depreciation) | $2,370,556 |
| Tax Cost | $99,745,456 |
The tax-based components of distributable earnings as of period end were as follows:
| Undistributed ordinary income | $ 686,540 |
| Capital loss carryforward | $(4,471,369) |
| Net unrealized appreciation (depreciation) on securities and other investments | $2,355,885 |
Capital loss carryforwards are only available to offset future capital gains of the Fund to the extent provided by regulations and may be limited. Under the Regulated Investment Company Modernization Act of 2010 (the Act), the Fund is permitted to carry forward capital losses incurred in taxable years beginning after December 22, 2010 for an unlimited period and such capital losses are required to be used prior to any losses that expire. The capital loss carryforward information presented below, including any applicable limitation, is estimated as of fiscal period end and is subject to adjustment.
| Fiscal year of expiration | |
| 2019 | $(4,471,369) |
The tax character of distributions paid was as follows:
| | October 31, 2018 | October 31, 2017 |
| Ordinary Income | $3,308,669 | $ 4,227,310 |
| Long-term Capital Gains | 1,364,811 | – |
| Total | $4,673,480 | $ 4,227,310 |
Short-Term Trading (Redemption) Fees. During the period, shares held by investors in the Fund less than 30 days may have been subject to a redemption fee equal to 1.00% of the NAV of shares redeemed. All redemption fees, which reduce the proceeds of the shareholder redemption, are retained by the Fund and accounted for as an addition to paid in capital. In November 2017, the Board of Trustees approved the elimination of these redemption fees effective December 18, 2017.
Restricted Securities. The Fund may invest in securities that are subject to legal or contractual restrictions on resale. These securities generally may be resold in transactions exempt from registration or to the public if the securities are registered. Disposal of these securities may involve time-consuming negotiations and expense, and prompt sale at an acceptable price may be difficult. Information regarding restricted securities is included at the end of the Fund's Schedule of Investments.
New Rule Issuance. During August 2018, the U.S. Securities and Exchange Commission issued Final Rule Release No. 33-10532, Disclosure Update and Simplification. This Final Rule includes amendments specific to registered investment companies that are intended to eliminate overlap in disclosure requirements between Regulation S-X and GAAP. In accordance with these amendments, certain line-items in the Fund's financial statements have been combined or removed for the current period as outlined in the table below.
| Financial Statement | Current Line-Item Presentation | Prior Line-Item Presentation |
| Statement of Assets and Liabilities | Total distributable earnings (loss) | Undistributed/Distributions in excess of/Accumulated net investment income (loss)
Accumulated/Undistributed net realized gain (loss)
Net unrealized appreciation (depreciation) |
| Statement of Changes in Net Assets | N/A - removed | Undistributed/Distributions in excess of/Accumulated net investment income (loss) end of period |
| Statement of Changes in Net Assets | Distributions to shareholders | Distributions to shareholders from net investment income
Distributions to shareholders from net realized gain |
| Distributions to Shareholders Note to Financial Statements | Distributions to shareholders | Distributions to shareholders from net investment income
Distributions to shareholders from net realized gain |
4. Purchases and Sales of Investments.
Purchases and sales of securities, other than short-term securities, aggregated $61,126,834 and $64,345,798, respectively.
5. Fees and Other Transactions with Affiliates.
Management Fee. Fidelity Management & Research Company Fidelity SelectCo, LLC (the investment adviser) and its affiliates provide the Fund with investment management related services for which the Fund pays a monthly management fee. The management fee is the sum of an individual fund fee rate that is based on an annual rate of .45% of the Fund's average net assets and an annualized group fee rate that averaged .24% during the period. The group fee rate is based upon the average net assets of all the mutual funds advised by the investment adviser, including any mutual funds previously advised by the investment adviser that are currently advised by Fidelity SelectCo, LLC, an affiliate of the investment adviser. The group fee rate decreases as assets under management increase and increases as assets under management decrease. In addition, the management fee is subject to a performance adjustment (up to a maximum of +/- .20% of the Fund's average net assets over a 36 month performance period). The upward or downward adjustment to the management fee is based on the relative investment performance of Total International Equity as compared to its benchmark index, the MSCI All Country World ex USA Index, over the same 36 month performance period. For the reporting period, the total annual management fee rate, including the performance adjustment, was .77% of the Fund's average net assets. The performance adjustment included in the management fee rate may be higher or lower than the maximum performance adjustment rate due to the difference between the average net assets for the reporting and performance periods.
Distribution and Service Plan Fees. In accordance with Rule 12b-1 of the 1940 Act, the Fund has adopted separate Distribution and Service Plans for each class of shares. Certain classes pay Fidelity Distributors Corporation (FDC), an affiliate of the investment adviser, separate Distribution and Service Fees, each of which is based on an annual percentage of each class' average net assets. In addition, FDC may pay financial intermediaries for selling shares of the Fund and providing shareholder support services. For the period, the Distribution and Service Fee rates, total fees and amounts retained by FDC were as follows:
| | Distribution Fee | Service Fee | Total Fees | Retained by FDC |
| Class A | -% | .25% | $22,059 | $1,370 |
| Class M | .25% | .25% | 74,500 | 239 |
| Class C | .75% | .25% | 31,876 | 4,987 |
| | | | $128,435 | $6,596 |
Sales Load. FDC may receive a front-end sales charge of up to 5.75% for selling Class A shares and 3.50% for selling Class M shares, some of which is paid to financial intermediaries for selling shares of the Fund. Depending on the holding period, FDC may receive contingent deferred sales charges levied on Class A, Class M and Class C redemptions. The deferred sales charges are 1.00% for Class C shares, 1.00% for certain purchases of Class A shares and .25% for certain purchases of Class M shares.
For the period, sales charge amounts retained by FDC were as follows:
| | Retained by FDC |
| Class A | $4,042 |
| Class M | 1,612 |
| Class C(a) | 911 |
| | $6,565 |
(a) When Class C shares are initially sold, FDC pays commissions from its own resources to financial intermediaries through which the sales are made.
Transfer Agent Fees. Fidelity Investments Institutional Operations Company, Inc., (FIIOC), an affiliate of the investment adviser, is the transfer, dividend disbursing and shareholder servicing agent for each class of the Fund. FIIOC receives account fees and asset-based fees that vary according to the account size and type of account of the shareholders of the respective classes of the Fund, except for Class Z. FIIOC receives an asset-based fee of Class Z's average net assets. FIIOC pays for typesetting, printing and mailing of shareholder reports, except proxy statements.
For the period, transfer agent fees for each class were as follows:
| | Amount | % of Class-Level Average Net Assets |
| Class A | $20,487 | .23 |
| Class M | 33,726 | .23 |
| Class C | 9,795 | .31 |
| Total International Equity | 142,672 | .17 |
| Class I | 16,533 | .18 |
| Class Z | 129 | .05 |
| | $223,342 | |
Accounting and Security Lending Fees. Fidelity Service Company, Inc. (FSC), an affiliate of the investment adviser, maintains the Fund's accounting records. The accounting fee is based on the level of average net assets for each month. Under a separate contract, FSC administers the security lending program. The security lending fee is based on the number and duration of lending transactions. For the period, the fees were equivalent to an annual rate of .05%.
Brokerage Commissions. The Fund placed a portion of its portfolio transactions with brokerage firms which are affiliates of the investment adviser. Brokerage commissions are included in net realized gain (loss) and change in net unrealized appreciation (depreciation) in the Statement of Operations. The commissions paid to these affiliated firms were $305 for the period.
Interfund Trades. The Fund may purchase from or sell securities to other Fidelity Funds under procedures adopted by the Board. The procedures have been designed to ensure these interfund trades are executed in accordance with Rule 17a-7 of the 1940 Act. Interfund trades are included within the respective purchases and sales amounts shown in the Purchases and Sales of Investments note.
Prior Fiscal Year Redemptions In-Kind. During the prior period, 30,358,599 shares of the Fund held by an affiliated entity were redeemed in-kind for investments and cash with a value of $259,566,026. The Fund had a net realized gain of $51,686,661 on investments delivered through the in-kind redemptions. The amount of the redemptions is included in share transactions activity shown in the accompanying Statement of Changes in Net Assets as well as the Notes to Financial Statements. The Fund recognized no gain or loss for federal income tax purposes.
Other. During the period, the investment adviser reimbursed the Fund for certain losses in the amount of $6,498.
6. Committed Line of Credit.
The Fund participates with other funds managed by the investment adviser or an affiliate in a $4.25 billion credit facility (the "line of credit") to be utilized for temporary or emergency purposes to fund shareholder redemptions or for other short-term liquidity purposes. The Fund has agreed to pay commitment fees on its pro-rata portion of the line of credit, which amounted to $329 and is reflected in Miscellaneous expenses on the Statement of Operations. During the period, the Fund did not borrow on this line of credit.
7. Security Lending.
The Fund lends portfolio securities through a lending agent from time to time in order to earn additional income. For equity securities, a lending agent is used and may loan securities to certain qualified borrowers, including Fidelity Capital Markets (FCM), a broker-dealer affiliated with the Fund. On the settlement date of the loan, the Fund receives collateral (in the form of U.S. Treasury obligations, letters of credit and/or cash) against the loaned securities and maintains collateral in an amount not less than 100% of the market value of the loaned securities during the period of the loan. The market value of the loaned securities is determined at the close of business of the Fund and any additional required collateral is delivered to the Fund on the next business day. The Fund or borrower may terminate the loan at any time, and if the borrower defaults on its obligation to return the securities loaned because of insolvency or other reasons, the Fund may apply collateral received from the borrower against the obligation. The Fund may experience delays and costs in recovering the securities loaned. Any cash collateral received is invested the Fidelity Securities Lending Cash Central Fund. The value of loaned securities and cash collateral at period end are disclosed on the Fund's Statement of Assets and Liabilities. Security lending income represents the income earned on investing cash collateral, less rebates paid to borrowers and any lending agent fees associated with the loan, plus any premium payments received for lending certain types of securities. Security lending income is presented in the Statement of Operations as a component of income from Fidelity Central Funds. Total security lending income during the period amounted to $8,525. During the period, there were no securities loaned to FCM.
8. Expense Reductions.
The investment adviser contractually agreed to reimburse each class to the extent annual operating expenses exceeded certain levels of class-level average net assets as noted in the table below. This reimbursement will remain in place through February 29, 2020. Some expenses, for example the compensation of the independent Trustees, and certain miscellaneous expenses such as proxy and shareholder meeting expenses, are excluded from this reimbursement.
The following classes were in reimbursement during the period:
| | Expense Limitations | Reimbursement |
| Class A | 1.45% | $13,422 |
| Class M | 1.70% | 21,663 |
| Class C | 2.20% | 7,157 |
| Total International Equity | 1.20% | 72,940 |
| Class I | 1.20% | 8,178 |
| Class Z | 1.05% | 295 |
| | | $123,655 |
Commissions paid to certain brokers with whom the investment adviser, or its affiliates, places trades on behalf of the Fund include an amount in addition to trade execution, which may be rebated back to the Fund to offset certain expenses. This amount totaled $13,703 for the period.
In addition, during the period the investment adviser reimbursed and/or waived a portion of fund-level operating expenses in the amount of $1,192.
9. Distributions to Shareholders.
Distributions to shareholders of each class were as follows:
| | Year ended
October 31, 2018 | Year ended
October 31, 2017 |
| Distributions to shareholders | | |
| Class A | $376,652 | $– |
| Class M | 591,842 | – |
| Class C | 110,403 | – |
| Total International Equity | 3,248,285 | – |
| Class I | 335,651 | – |
| Class Z | 10,647 | – |
| Total | $4,673,480 | $– |
| From net investment income | | |
| Class A | $– | $92,173 |
| Class M | – | 119,902 |
| Class C | – | 8,223 |
| Total International Equity | – | 3,979,536 |
| Class I | – | 27,476 |
| Total | $– | $4,227,310 |
10. Share Transactions.
Share transactions for each class were as follows and may contain automatic conversions between classes or exchanges between affiliated funds:
| | Shares | Shares | Dollars | Dollars |
| | Year ended October 31, 2018 | Year ended October 31, 2017(a) | Year ended October 31, 2018 | Year ended October 31, 2017(a) |
| Class A | | | | |
| Shares sold | 173,804 | 192,334 | $1,606,034 | $1,631,763 |
| Reinvestment of distributions | 41,465 | 12,257 | 376,502 | 91,682 |
| Shares redeemed | (286,968) | (332,738) | (2,649,748) | (2,778,571) |
| Net increase (decrease) | (71,699) | (128,147) | $(667,212) | $(1,055,126) |
| Class M | | | | |
| Shares sold | 87,344 | 238,813 | $814,151 | $1,896,741 |
| Reinvestment of distributions | 64,894 | 15,944 | 591,835 | 119,902 |
| Shares redeemed | (394,904) | (372,174) | (3,617,064) | (3,041,931) |
| Net increase (decrease) | (242,666) | (117,417) | $(2,211,078) | $(1,025,288) |
| Class C | | | | |
| Shares sold | 70,398 | 96,785 | $654,074 | $808,355 |
| Reinvestment of distributions | 12,119 | 1,070 | 110,403 | 8,046 |
| Shares redeemed | (94,138) | (109,698) | (860,312) | (920,097) |
| Net increase (decrease) | (11,621) | (11,843) | $(95,835) | $(103,696) |
| Total International Equity | | | | |
| Shares sold | 1,403,656 | 6,763,065 | $13,127,907 | $53,465,510 |
| Reinvestment of distributions | 329,975 | 523,250 | 3,002,772 | 3,913,907 |
| Shares redeemed | (1,820,863) | (35,028,420)(b) | (16,667,911) | (297,076,095)(b) |
| Net increase (decrease) | (87,232) | (27,742,105) | $(537,232) | $(239,696,678) |
| Class I | | | | |
| Shares sold | 551,397 | 604,657 | $5,085,051 | $5,121,757 |
| Reinvestment of distributions | 36,520 | 3,621 | 330,507 | 27,016 |
| Shares redeemed | (162,650) | (167,386) | (1,487,088) | (1,392,556) |
| Net increase (decrease) | 425,267 | 440,892 | $3,928,470 | $3,756,217 |
| Class Z | | | | |
| Shares sold | 15,939 | 26,796 | $147,844 | $221,657 |
| Reinvestment of distributions | 1,174 | – | 10,647 | – |
| Shares redeemed | (17,109) | (569) | (155,608) | (5,097) |
| Net increase (decrease) | 4 | 26,227 | $2,883 | $216,560 |
(a) Share transactions for Class Z are for the period February 1, 2017 (commencement of sale of shares) to October 31, 2017.
(b) Amounts include in-kind redemption (see the Prior Fiscal Year Redemptions In-Kind note for additional details).
11. Other.
The Fund's organizational documents provide former and current trustees and officers with a limited indemnification against liabilities arising in connection with the performance of their duties to the Fund. In the normal course of business, the Fund may also enter into contracts that provide general indemnifications. The Fund's maximum exposure under these arrangements is unknown as this would be dependent on future claims that may be made against the Fund. The risk of material loss from such claims is considered remote.
Report of Independent Registered Public Accounting Firm
To the Trustees of Fidelity Investment Trust and Shareholders of Fidelity Total International Equity Fund:
Opinion on the Financial Statements and Financial Highlights
We have audited the accompanying statement of assets and liabilities of Fidelity Total International Equity Fund (the "Fund"), a fund of Fidelity Investment Trust, including the schedule of investments, as of October 31, 2018, and the related statement of operations for the year then ended, the statement of changes in net assets for each of the two years in the period then ended, the financial highlights for each of the five years in the period then ended, and the related notes. In our opinion, the financial statements and financial highlights present fairly, in all material respects, the financial position of the Fund as of October 31, 2018, and the results of its operations for the year then ended, the changes in its net assets for each of the two years in the period then ended, and the financial highlights for each of the five years in the period then ended, in conformity with accounting principles generally accepted in the United States of America.
Basis for Opinion
These financial statements and financial highlights are the responsibility of the Fund's management. Our responsibility is to express an opinion on the Fund's financial statements and financial highlights based on our audits. We are a public accounting firm registered with the Public Company Accounting Oversight Board (United States) (PCAOB) and are required to be independent with respect to the Fund in accordance with the U.S. federal securities laws and the applicable rules and regulations of the Securities and Exchange Commission and the PCAOB.
We conducted our audits in accordance with the standards of the PCAOB. Those standards require that we plan and perform the audit to obtain reasonable assurance about whether the financial statements and financial highlights are free of material misstatement, whether due to error or fraud. The Fund is not required to have, nor were we engaged to perform, an audit of its internal control over financial reporting. As part of our audits we are required to obtain an understanding of internal control over financial reporting but not for the purpose of expressing an opinion on the effectiveness of the Fund’s internal control over financial reporting. Accordingly, we express no such opinion.
Our audits included performing procedures to assess the risks of material misstatement of the financial statements and financial highlights, whether due to error or fraud, and performing procedures that respond to those risks. Such procedures included examining, on a test basis, evidence regarding the amounts and disclosures in the financial statements and financial highlights. Our audits also included evaluating the accounting principles used and significant estimates made by management, as well as evaluating the overall presentation of the financial statements and financial highlights. Our procedures included confirmation of securities owned as of October 31, 2018, by correspondence with the custodians and brokers; when replies were not received from brokers, we performed other auditing procedures. We believe that our audits provide a reasonable basis for our opinion.
/s/ Deloitte & Touche LLP
Boston, Massachusetts
December 14, 2018
We have served as the auditor of one or more of the Fidelity investment companies since 1999.
Trustees and Officers
The Trustees, Members of the Advisory Board (if any), and officers of the trust and fund, as applicable, are listed below. The Board of Trustees governs the fund and is responsible for protecting the interests of shareholders. The Trustees are experienced executives who meet periodically throughout the year to oversee the fund's activities, review contractual arrangements with companies that provide services to the fund, oversee management of the risks associated with such activities and contractual arrangements, and review the fund's performance. Except for Jonathan Chiel, each of the Trustees oversees 283 funds. Mr. Chiel oversees 154 funds.
The Trustees hold office without limit in time except that (a) any Trustee may resign; (b) any Trustee may be removed by written instrument, signed by at least two-thirds of the number of Trustees prior to such removal; (c) any Trustee who requests to be retired or who has become incapacitated by illness or injury may be retired by written instrument signed by a majority of the other Trustees; and (d) any Trustee may be removed at any special meeting of shareholders by a two-thirds vote of the outstanding voting securities of the trust. Each Trustee who is not an interested person (as defined in the 1940 Act) of the trust and the fund is referred to herein as an Independent Trustee. Each Independent Trustee shall retire not later than the last day of the calendar year in which his or her 75th birthday occurs. The Independent Trustees may waive this mandatory retirement age policy with respect to individual Trustees. Officers and Advisory Board Members hold office without limit in time, except that any officer or Advisory Board Member may resign or may be removed by a vote of a majority of the Trustees at any regular meeting or any special meeting of the Trustees. Except as indicated, each individual has held the office shown or other offices in the same company for the past five years.
The fund’s Statement of Additional Information (SAI) includes more information about the Trustees. To request a free copy, call Fidelity at 1-800-544-8544.
Experience, Skills, Attributes, and Qualifications of the Trustees. The Governance and Nominating Committee has adopted a statement of policy that describes the experience, qualifications, attributes, and skills that are necessary and desirable for potential Independent Trustee candidates (Statement of Policy). The Board believes that each Trustee satisfied at the time he or she was initially elected or appointed a Trustee, and continues to satisfy, the standards contemplated by the Statement of Policy. The Governance and Nominating Committee also engages professional search firms to help identify potential Independent Trustee candidates who have the experience, qualifications, attributes, and skills consistent with the Statement of Policy. From time to time, additional criteria based on the composition and skills of the current Independent Trustees, as well as experience or skills that may be appropriate in light of future changes to board composition, business conditions, and regulatory or other developments, have also been considered by the professional search firms and the Governance and Nominating Committee. In addition, the Board takes into account the Trustees' commitment and participation in Board and committee meetings, as well as their leadership of standing and ad hoc committees throughout their tenure.
In determining that a particular Trustee was and continues to be qualified to serve as a Trustee, the Board has considered a variety of criteria, none of which, in isolation, was controlling. The Board believes that, collectively, the Trustees have balanced and diverse experience, qualifications, attributes, and skills, which allow the Board to operate effectively in governing the fund and protecting the interests of shareholders. Information about the specific experience, skills, attributes, and qualifications of each Trustee, which in each case led to the Board's conclusion that the Trustee should serve (or continue to serve) as a trustee of the fund, is provided below.
Board Structure and Oversight Function. James C. Curvey is an interested person and currently serves as Chairman. The Trustees have determined that an interested Chairman is appropriate and benefits shareholders because an interested Chairman has a personal and professional stake in the quality and continuity of services provided to the fund. Independent Trustees exercise their informed business judgment to appoint an individual of their choosing to serve as Chairman, regardless of whether the Trustee happens to be independent or a member of management. The Independent Trustees have determined that they can act independently and effectively without having an Independent Trustee serve as Chairman and that a key structural component for assuring that they are in a position to do so is for the Independent Trustees to constitute a substantial majority for the Board. The Independent Trustees also regularly meet in executive session. Ned C. Lautenbach serves as Chairman of the Independent Trustees and as such (i) acts as a liaison between the Independent Trustees and management with respect to matters important to the Independent Trustees and (ii) with management prepares agendas for Board meetings.
Fidelity® funds are overseen by different Boards of Trustees. The fund's Board oversees Fidelity's high income and certain equity funds, and other Boards oversee Fidelity's investment-grade bond, money market, asset allocation, and other equity funds. The asset allocation funds may invest in Fidelity® funds overseen by the fund's Board. The use of separate Boards, each with its own committee structure, allows the Trustees of each group of Fidelity® funds to focus on the unique issues of the funds they oversee, including common research, investment, and operational issues. On occasion, the separate Boards establish joint committees to address issues of overlapping consequences for the Fidelity® funds overseen by each Board.
The Trustees operate using a system of committees to facilitate the timely and efficient consideration of all matters of importance to the Trustees, the fund, and fund shareholders and to facilitate compliance with legal and regulatory requirements and oversight of the fund's activities and associated risks. The Board, acting through its committees, has charged FMR and its affiliates with (i) identifying events or circumstances the occurrence of which could have demonstrably adverse effects on the fund's business and/or reputation; (ii) implementing processes and controls to lessen the possibility that such events or circumstances occur or to mitigate the effects of such events or circumstances if they do occur; and (iii) creating and maintaining a system designed to evaluate continuously business and market conditions in order to facilitate the identification and implementation processes described in (i) and (ii) above. Because the day-to-day operations and activities of the fund are carried out by or through FMR, its affiliates, and other service providers, the fund's exposure to risks is mitigated but not eliminated by the processes overseen by the Trustees. While each of the Board's committees has responsibility for overseeing different aspects of the fund's activities, oversight is exercised primarily through the Operations, Audit, and Compliance Committees. In addition, the Independent Trustees have worked with Fidelity to enhance the Board's oversight of investment and financial risks, legal and regulatory risks, technology risks, and operational risks, including the development of additional risk reporting to the Board. Appropriate personnel, including but not limited to the fund's Chief Compliance Officer (CCO), FMR's internal auditor, the independent accountants, the fund's Treasurer and portfolio management personnel, make periodic reports to the Board's committees, as appropriate, including an annual review of Fidelity's risk management program for the Fidelity® funds. The responsibilities of each standing committee, including their oversight responsibilities, are described further under "Standing Committees of the Trustees."
Interested Trustees*:
Correspondence intended for a Trustee who is an interested person may be sent to Fidelity Investments, 245 Summer Street, Boston, Massachusetts 02210.
Name, Year of Birth; Principal Occupations and Other Relevant Experience+
Jonathan Chiel (1957)
Year of Election or Appointment: 2016
Trustee
Mr. Chiel also serves as Trustee of other Fidelity® funds. Mr. Chiel is Executive Vice President and General Counsel for FMR LLC (diversified financial services company, 2012-present). Previously, Mr. Chiel served as general counsel (2004-2012) and senior vice president and deputy general counsel (2000-2004) for John Hancock Financial Services; a partner with Choate, Hall & Stewart (1996-2000) (law firm); and an Assistant United States Attorney for the United States Attorney’s Office of the District of Massachusetts (1986-95), including Chief of the Criminal Division (1993-1995). Mr. Chiel is a director on the boards of the Boston Bar Foundation and the Maimonides School.
James C. Curvey (1935)
Year of Election or Appointment: 2007
Trustee
Chairman of the Board of Trustees
Mr. Curvey also serves as Trustee of other Fidelity® funds. Mr. Curvey is Vice Chairman (2007-present) and Director of FMR LLC (diversified financial services company). In addition, Mr. Curvey is an Overseer Emeritus for the Boston Symphony Orchestra, a Director of Artis-Naples, and a Trustee of Brewster Academy in Wolfeboro, New Hampshire. Previously, Mr. Curvey served as a Director of Fidelity Research & Analysis Co. (investment adviser firm, 2009-2018), Director of Fidelity Investments Money Management, Inc. (investment adviser firm, 2009-2014) and a Director of FMR and FMR Co., Inc. (investment adviser firms, 2007-2014).
Charles S. Morrison (1960)
Year of Election or Appointment: 2014
Trustee
Mr. Morrison also serves as Trustee of other funds. He serves as President of Fidelity SelectCo, LLC (investment adviser firm, 2017-present) and Fidelity Management & Research Company (FMR) (investment adviser firm, 2016-present), a Director of Fidelity Investments Money Management, Inc. (FIMM) (investment adviser firm, 2014-present), Director of Fidelity SelectCo, LLC (investment adviser firm, 2014-present), President, Asset Management (2014-present), and is an employee of Fidelity Investments. Previously, Mr. Morrison served as Vice President of Fidelity's Fixed Income and Asset Allocation Funds (2012-2014), President, Fixed Income (2011-2014), Vice President of Fidelity's Money Market Funds (2005-2009), President, Money Market Group Leader of FMR (investment adviser firm, 2009), and Senior Vice President, Money Market Group of FMR (2004-2009). Mr. Morrison also served as Vice President of Fidelity's Bond Funds (2002-2005), certain Balanced Funds (2002-2005), and certain Asset Allocation Funds (2002-2007), and as Senior Vice President (2002-2005) of Fidelity's Bond Division.
* Determined to be an “Interested Trustee” by virtue of, among other things, his or her affiliation with the trust or various entities under common control with FMR.
+ The information includes the Trustee's principal occupation during the last five years and other information relating to the experience, attributes, and skills relevant to the Trustee's qualifications to serve as a Trustee, which led to the conclusion that the Trustee should serve as a Trustee for the fund.
Independent Trustees:
Correspondence intended for an Independent Trustee may be sent to Fidelity Investments, P.O. Box 55235, Boston, Massachusetts 02205-5235.
Name, Year of Birth; Principal Occupations and Other Relevant Experience+
Dennis J. Dirks (1948)
Year of Election or Appointment: 2005
Trustee
Mr. Dirks also serves as Trustee of other Fidelity® funds. Prior to his retirement in May 2003, Mr. Dirks was Chief Operating Officer and a member of the Board of The Depository Trust & Clearing Corporation (DTCC). He also served as President, Chief Operating Officer, and Board member of The Depository Trust Company (DTC) and President and Board member of the National Securities Clearing Corporation (NSCC). In addition, Mr. Dirks served as Chief Executive Officer and Board member of the Government Securities Clearing Corporation, Chief Executive Officer and Board member of the Mortgage-Backed Securities Clearing Corporation, as a Trustee and a member of the Finance Committee of Manhattan College (2005-2008), as a Trustee and a member of the Finance Committee of AHRC of Nassau County (2006-2008), as a member of the Independent Directors Council (IDC) Governing Council (2010-2015), and as a member of the Board of Directors for The Brookville Center for Children’s Services, Inc. (2009-2017). Mr. Dirks is a member of the Finance Committee (2016-present), Board of Directors (2017-present) and Board of Trustees (2018-present) and is Treasurer (2018-present) of the Asolo Repertory Theatre.
Donald F. Donahue (1950)
Year of Election or Appointment: 2018
Trustee
Mr. Donahue also serves as a Trustee of other Fidelity® funds. Mr. Donahue is President and Chief Executive Officer of Miranda Partners, LLC (risk consulting for the financial services industry, 2012-present). Previously, Mr. Donahue served as a Member of the Advisory Board of certain Fidelity® funds (2015-2018) and Chief Executive Officer (2006-2012), Chief Operating Officer (2003-2006), and Managing Director, Customer Marketing and Development (1999-2003) of The Depository Trust & Clearing Corporation (financial markets infrastructure). Mr. Donahue serves as a Member (2007-present) and Co-Chairman (2016-present) of the Board of Directors of United Way of New York, Member of the Board of Directors of NYC Leadership Academy (2012-present) and Member of the Board of Advisors of Ripple Labs, Inc. (financial services, 2015-present). He also served as Chairman (2010-2012) and Member of the Board of Directors (2012-2013) of Omgeo, LLC (financial services), Treasurer of United Way of New York (2012-2016), and Member of the Board of Directors of XBRL US (financial services non-profit, 2009-2012) and the International Securities Services Association (2009-2012).
Alan J. Lacy (1953)
Year of Election or Appointment: 2008
Trustee
Mr. Lacy also serves as Trustee of other Fidelity® funds. Mr. Lacy serves as a Director of Bristol-Myers Squibb Company (global pharmaceuticals, 2008-present). He is a Trustee of the California Chapter of The Nature Conservancy (2015-present) and a Director of the Center for Advanced Study in the Behavioral Sciences at Stanford University (2015-present). In addition, Mr. Lacy served as Senior Adviser (2007-2014) of Oak Hill Capital Partners, L.P. (private equity) and also served as Chief Executive Officer (2005) and Vice Chairman (2005-2006) of Sears Holdings Corporation (retail) and Chief Executive Officer and Chairman of the Board of Sears, Roebuck and Co. (retail, 2000-2005). Previously, Mr. Lacy served as Chairman (2014-2017) and a member (2010-2017) of the Board of Directors of Dave & Buster’s Entertainment, Inc. (restaurant and entertainment complexes), as Chairman (2008-2011) and a member (2006-2015) of the Board of Trustees of the National Parks Conservation Association, and as a member of the Board of Directors for The Hillman Companies, Inc. (hardware wholesalers, 2010-2014), Earth Fare, Inc. (retail grocery, 2010-2014), and The Western Union Company (global money transfer, 2006-2011).
Ned C. Lautenbach (1944)
Year of Election or Appointment: 2000
Trustee
Chairman of the Independent Trustees
Mr. Lautenbach also serves as Trustee of other Fidelity® funds. Mr. Lautenbach currently serves as Vice Chair of the Board of Governors, State University System of Florida (2013-present) and is a member of the Council on Foreign Relations (1994-present). He is also a member and has most recently served as Chairman of the Board of Directors of Artis-Naples (2012-present). Previously, Mr. Lautenbach served as a member and then Lead Director of the Board of Directors of Eaton Corporation (diversified industrial, 1997-2016). He was also a Partner and Advisory Partner at Clayton, Dubilier & Rice, LLC (private equity investment, 1998-2010), as well as a Director of Sony Corporation (2006-2007). In addition, Mr. Lautenbach also had a 30-year career with IBM (technology company) during which time he served as Senior Vice President and a member of the Corporate Executive Committee (1968-1998).
Joseph Mauriello (1944)
Year of Election or Appointment: 2008
Trustee
Mr. Mauriello also serves as Trustee of other Fidelity® funds. Prior to his retirement in January 2006, Mr. Mauriello served in numerous senior management positions including Deputy Chairman and Chief Operating Officer (2004-2005), and Vice Chairman of Financial Services (2002-2004) of KPMG LLP US (professional services, 1965-2005). Mr. Mauriello currently serves as a member of the Independent Directors Council (IDC) Governing Council (2015-present). Previously, Mr. Mauriello served as a member of the Board of Directors of XL Group plc. (global insurance and re-insurance, 2006-2018).
Cornelia M. Small (1944)
Year of Election or Appointment: 2005
Trustee
Ms. Small also serves as Trustee of other Fidelity® funds. Ms. Small is a member of the Board of Directors (2009-present) and Chair of the Investment Committee (2010-present) of the Teagle Foundation. Ms. Small also serves on the Investment Committee of the Berkshire Taconic Community Foundation (2008-present). Previously, Ms. Small served as Chairperson (2002-2008) and a member of the Investment Committee and Chairperson (2008-2012) and a member of the Board of Trustees of Smith College. In addition, Ms. Small served as Chief Investment Officer, Director of Global Equity Investments, and a member of the Board of Directors of Scudder, Stevens & Clark and Scudder Kemper Investments.
Garnett A. Smith (1947)
Year of Election or Appointment: 2018
Trustee
Mr. Smith also serves as Trustee of other Fidelity® funds. Prior to Mr. Smith's retirement, he served as Chairman and Chief Executive Officer of Inbrand Corp. (manufacturer of personal absorbent products, 1990-1997). He also served as President (1986-1990) of Inbrand Corp. Prior to his employment with Inbrand Corp., he was employed by a retail fabric chain and North Carolina National Bank. In addition, Mr. Smith served as a Member of the Advisory Board of certain Fidelity® funds (2012-2013) and as a board member of the Jackson Hole Land Trust (2009-2012).
David M. Thomas (1949)
Year of Election or Appointment: 2008
Trustee
Mr. Thomas also serves as Trustee of other Fidelity® funds. Mr. Thomas serves as Non-Executive Chairman of the Board of Directors of Fortune Brands Home and Security (home and security products, 2011-present), as a member of the Board of Directors (2004-present) and Presiding Director (2013-present) of Interpublic Group of Companies, Inc. (marketing communication), and as a member of the Board of Trustees of the University of Florida (2013-present). Previously, Mr. Thomas served as Executive Chairman (2005-2006) and Chairman and Chief Executive Officer (2000-2005) of IMS Health, Inc. (pharmaceutical and healthcare information solutions), and a Director of Fortune Brands, Inc. (consumer products, 2000-2011).
+ The information includes the Trustee's principal occupation during the last five years and other information relating to the experience, attributes, and skills relevant to the Trustee's qualifications to serve as a Trustee, which led to the conclusion that the Trustee should serve as a Trustee for the fund.
Advisory Board Members and Officers:
Correspondence intended for a Member of the Advisory Board (if any) may be sent to Fidelity Investments, P.O. Box 55235, Boston, Massachusetts 02205-5235. Correspondence intended for an officer or Peter S. Lynch may be sent to Fidelity Investments, 245 Summer Street, Boston, Massachusetts 02210. Officers appear below in alphabetical order.
Name, Year of Birth; Principal Occupation
Vicki L. Fuller (1957)
Year of Election or Appointment: 2018
Member of the Advisory Board
Ms. Fuller also serves as Member of the Advisory Board of other Fidelity® funds. Ms. Fuller serves as a member of the Board of Directors, Audit Committee, and Nominating and Governance Committee of The Williams Companies, Inc. (natural gas infrastructure, 2018-present). Previously, Ms. Fuller served as the Chief Investment Officer of the New York State Common Retirement Fund (2012-2018) and held a variety of positions at AllianceBernstein L.P. (global asset management, 1985-2012), including Managing Director (2006-2012) and Senior Vice President and Senior Portfolio Manager (2001-2006).
Peter S. Lynch (1944)
Year of Election or Appointment: 2003
Member of the Advisory Board
Mr. Lynch also serves as Member of the Advisory Board of other Fidelity® funds. Mr. Lynch is Vice Chairman and a Director of FMR (investment adviser firm) and FMR Co., Inc. (investment adviser firm). In addition, Mr. Lynch serves as a Trustee of Boston College and as the Chairman of the Inner-City Scholarship Fund. Previously, Mr. Lynch served on the Special Olympics International Board of Directors (1997-2006).
William S. Stavropoulos (1939)
Year of Election or Appointment: 2018
Member of the Advisory Board
Mr. Stavropoulos also serves as Member of the Advisory Board of other Fidelity® funds. Mr. Stavropoulos serves as President and Founder of the Michigan Baseball Foundation, the Great Lakes Loons (2007-present). Mr. Stavropoulos is Chairman Emeritus of the Board of Directors of The Dow Chemical Company, where he previously served in numerous senior management positions, including President, CEO (1995-2000; 2002-2004), Chairman of the Executive Committee (2000-2006), and as a member of the Board of Directors (1990-2006). Currently, Mr. Stavropoulos is Chairman of the Board of Directors of Univar Inc. (global distributor of commodity and specialty chemicals), a Director of Teradata Corporation (data warehousing and technology solutions), and a member of the Advisory Board for Metalmark Capital LLC (private equity investment, 2005-present). Mr. Stavropoulos is an operating advisor to Clayton, Dubilier & Rice, LLC (private equity investment). In addition, Mr. Stavropoulos is a member of the University of Notre Dame Advisory Council for the College of Science, a Trustee of the Rollin L. Gerstacker Foundation, and a Director of Artis-Naples in Naples, Florida. Previously, Mr. Stavropoulos served as Trustee of certain Fidelity® funds (2001-2018) and as a Director of Chemical Financial Corporation (bank holding company, 1993-2012) and Tyco International, Ltd. (multinational manufacturing and services, 2007-2012).
Carol B. Tomé (1957)
Year of Election or Appointment: 2018
Member of the Advisory Board
Ms. Tomé also serves as Member of the Advisory Board of other Fidelity® funds. Ms. Tomé is Chief Financial Officer (2001-present) and Executive Vice President of Corporate Services (2007-present) of The Home Depot, Inc. (home improvement retailer) and a Director (2003-present) and Chair of the Audit Committee (2004-present) of United Parcel Service, Inc. (package delivery and supply chain management). Previously, Ms. Tomé served as Trustee of certain Fidelity® funds (2017), Senior Vice President of Finance and Accounting/Treasurer (2000-2007) and Vice President and Treasurer (1995-2000) of The Home Depot, Inc. and Chair of the Board (2010-2012), Vice Chair of the Board (2009 and 2013), and a Director (2008-2013) of the Federal Reserve Bank of Atlanta. Ms. Tomé is also a director or trustee of many community and professional organizations.
Michael E. Wiley (1950)
Year of Election or Appointment: 2018
Member of the Advisory Board
Mr. Wiley also serves as Trustee or Member of the Advisory Board of other Fidelity® funds. Mr. Wiley serves as a Director of High Point Resources (exploration and production, 2005-present). Previously, Mr. Wiley served as a Director of Andeavor Corporation (independent oil refiner and marketer, 2005-2018), a Director of Andeavor Logistics LP (natural resources logistics, 2015-2018), a Director of Post Oak Bank (privately-held bank, 2004-2018), a Director of Asia Pacific Exploration Consolidated (international oil and gas exploration and production, 2008-2013), a member of the Board of Trustees of the University of Tulsa (2000-2006; 2007-2010), a Senior Energy Advisor of Katzenbach Partners, LLC (consulting, 2006-2007), an Advisory Director of Riverstone Holdings (private investment), a Director of Spinnaker Exploration Company (exploration and production, 2001-2005) and Chairman, President, and CEO of Baker Hughes, Inc. (oilfield services, 2000-2004).
Elizabeth Paige Baumann (1968)
Year of Election or Appointment: 2017
Anti-Money Laundering (AML) Officer
Ms. Baumann also serves as AML Officer of other funds. She is Chief AML Officer (2012-present) and Senior Vice President (2014-present) of FMR LLC (diversified financial services company) and is an employee of Fidelity Investments. Previously, Ms. Baumann served as AML Officer of the funds (2012-2016), and Vice President (2007-2014) and Deputy Anti-Money Laundering Officer (2007-2012) of FMR LLC.
John J. Burke III (1964)
Year of Election or Appointment: 2018
Chief Financial Officer
Mr. Burke also serves as Chief Financial Officer of other funds. Mr. Burke serves as Head of Investment Operations for Fidelity Fund and Investment Operations (2018-present) and is an employee of Fidelity Investments (1998-present). Previously Mr. Burke served as head of Asset Management Investment Operations (2012-2018).
William C. Coffey (1969)
Year of Election or Appointment: 2018
Secretary and Chief Legal Officer (CLO)
Mr. Coffey also serves as Secretary and CLO of other funds. Mr. Coffey serves as CLO, Secretary, and Senior Vice President of Fidelity Management & Research Company and FMR Co., Inc. (investment adviser firms, 2018-present); Secretary of Fidelity SelectCo, LLC and Fidelity Investments Money Management, Inc. (investment adviser firms, 2018-present); and CLO of Fidelity Management & Research (Hong Kong) Limited, FMR Investment Management (UK) Limited, and Fidelity Management & Research (Japan) Limited (investment adviser firms, 2018-present). He is Senior Vice President and Deputy General Counsel of FMR LLC (diversified financial services company, 2010-present), and is an employee of Fidelity Investments. Previously, Mr. Coffey served as Assistant Secretary of certain funds (2009-2018) and as Vice President and Associate General Counsel of FMR LLC (2005-2009).
Timothy M. Cohen (1969)
Year of Election or Appointment: 2018
Vice President
Mr. Cohen also serves as Vice President of other funds. Mr. Cohen serves as Co-Head of Global Equity Research (2016-present), a Director of Fidelity Management & Research (Japan) Limited (investment adviser firm, 2016-present), and is an employee of Fidelity Investments. Previously, Mr. Cohen served as Chief Investment Officer - Equity and a Director of Fidelity Management & Research (U.K.) Inc. (investment adviser firm, 2013-2015) and as a Director of Fidelity Management & Research (Hong Kong) Limited (investment adviser firm, 2017).
Jonathan Davis (1968)
Year of Election or Appointment: 2010
Assistant Treasurer
Mr. Davis also serves as Assistant Treasurer of other funds. Mr. Davis serves as Assistant Treasurer of FMR Capital, Inc. (2017-present) and is an employee of Fidelity Investments. Previously, Mr. Davis served as Vice President and Associate General Counsel of FMR LLC (diversified financial services company, 2003-2010).
Adrien E. Deberghes (1967)
Year of Election or Appointment: 2016
Assistant Treasurer
Mr. Deberghes also serves as an officer of other funds. He serves as Assistant Treasurer of FMR Capital, Inc. (2017-present), Executive Vice President of Fidelity Investments Money Management, Inc. (FIMM) (investment adviser firm, 2016-present), and is an employee of Fidelity Investments (2008-present). Previously, Mr. Deberghes served as President and Treasurer of certain Fidelity® funds (2013-2018). Prior to joining Fidelity Investments, Mr. Deberghes was Senior Vice President of Mutual Fund Administration at State Street Corporation (2007-2008), Senior Director of Mutual Fund Administration at Investors Bank & Trust (2005-2007), and Director of Finance for Dunkin' Brands (2000-2005). Previously, Mr. Deberghes served in other fund officer roles.
Laura M. Del Prato (1964)
Year of Election or Appointment: 2018
Assistant Treasurer
Ms. Del Prato also serves as an officer of other funds. Ms. Del Prato is an employee of Fidelity Investments (2017-present). Prior to joining Fidelity Investments, Ms. Del Prato served as a Managing Director and Treasurer of the JPMorgan Mutual Funds (2014-2017). Prior to JPMorgan, Ms. Del Prato served as a partner at Cohen Fund Audit Services (accounting firm, 2012-2013) and KPMG LLP (accounting firm, 2004-2012).
Colm A. Hogan (1973)
Year of Election or Appointment: 2016
Deputy Treasurer
Mr. Hogan also serves as an officer of other funds. Mr. Hogan serves as Assistant Treasurer of FMR Capital, Inc. (2017-present) and is an employee of Fidelity Investments (2005-present). Previously, Mr. Hogan served as Assistant Treasurer of certain Fidelity® funds (2016-2018).
Pamela R. Holding (1964)
Year of Election or Appointment: 2018
Vice President
Ms. Holding also serves as Vice President of other funds. Ms. Holding serves as Co-Head of Global Equity Research (2018-present) and is an employee of Fidelity Investments (2013-present).
Chris Maher (1972)
Year of Election or Appointment: 2013
Assistant Treasurer
Mr. Maher serves as Assistant Treasurer of other funds. Mr. Maher is Vice President of Valuation Oversight, serves as Assistant Treasurer of FMR Capital, Inc. (2017-present), and is an employee of Fidelity Investments. Previously, Mr. Maher served as Vice President of Asset Management Compliance (2013), Vice President of the Program Management Group of FMR (investment adviser firm, 2010-2013), and Vice President of Valuation Oversight (2008-2010).
Rieco E. Mello (1969)
Year of Election or Appointment: 2017
Assistant Treasurer
Mr. Mello also serves as Assistant Treasurer of other funds. Mr. Mello serves as Assistant Treasurer of FMR Capital, Inc. (2017-present) and is an employee of Fidelity Investments (1995-present).
Kenneth B. Robins (1969)
Year of Election or Appointment: 2016
Chief Compliance Officer
Mr. Robins also serves as an officer of other funds. Mr. Robins serves as Compliance Officer of Fidelity Management & Research Company and FMR Co., Inc. (investment adviser firms, 2016-present) and is an employee of Fidelity Investments (2004-present). Previously, Mr. Robins served as Executive Vice President of Fidelity Investments Money Management, Inc. (investment adviser firm, 2013-2016) and served in other fund officer roles.
Stacie M. Smith (1974)
Year of Election or Appointment: 2016
President and Treasurer
Ms. Smith also serves as an officer of other funds. Ms. Smith serves as Assistant Treasurer of FMR Capital, Inc. (2017-present), is an employee of Fidelity Investments (2009-present), and has served in other fund officer roles. Prior to joining Fidelity Investments, Ms. Smith served as Senior Audit Manager of Ernst & Young LLP (accounting firm, 1996-2009). Previously, Ms. Smith served as Assistant Treasurer (2013-2018) and Deputy Treasurer (2013-2016) of certain Fidelity® funds.
Marc L. Spector (1972)
Year of Election or Appointment: 2016
Assistant Treasurer
Mr. Spector also serves as an officer of other funds. Mr. Spector serves as Assistant Treasurer of FMR Capital, Inc. (2017-present) and is an employee of Fidelity Investments (2016-present). Prior to joining Fidelity Investments, Mr. Spector served as Director at the Siegfried Group (accounting firm, 2013-2016), and prior to Siegfried Group as audit senior manager at Deloitte & Touche (accounting firm, 2005-2013).
Shareholder Expense Example
As a shareholder of the Fund, you incur two types of costs: (1) transaction costs, including sales charges (loads) on purchase payments or redemption proceeds and (2) ongoing costs, including management fees, distribution and/or service (12b-1) fees and other Fund expenses. This Example is intended to help you understand your ongoing costs (in dollars) of investing in the Fund and to compare these costs with the ongoing costs of investing in other mutual funds.
The Example is based on an investment of $1,000 invested at the beginning of the period and held for the entire period (May 1, 2018 to October 31, 2018).
Actual Expenses
The first line of the accompanying table for each class of the Fund provides information about actual account values and actual expenses. You may use the information in this line, together with the amount you invested, to estimate the expenses that you paid over the period. Simply divide your account value by $1,000.00 (for example, an $8,600 account value divided by $1,000.00 = 8.6), then multiply the result by the number in the first line for a class of the Fund under the heading entitled "Expenses Paid During Period" to estimate the expenses you paid on your account during this period. A small balance maintenance fee of $12.00 that is charged once a year may apply for certain accounts with a value of less than $2,000. This fee, which was eliminated effective August 1, 2018, is not included in the table below. If it was, the estimate of expenses you paid during the period would be higher, and your ending account value lower, by this amount. In addition, the Fund, as a shareholder in the underlying Fidelity Central Funds, will indirectly bear its pro-rata share of the fees and expenses incurred by the underlying Fidelity Central Funds. These fees and expenses are not included in the Fund's annualized expense ratio used to calculate the expense estimate in the table below.
Hypothetical Example for Comparison Purposes
The second line of the accompanying table for each class of the Fund provides information about hypothetical account values and hypothetical expenses based on a Class' actual expense ratio and an assumed rate of return of 5% per year before expenses, which is not the Class' actual return. The hypothetical account values and expenses may not be used to estimate the actual ending account balance or expenses you paid for the period. You may use this information to compare the ongoing costs of investing in the Fund and other funds. To do so, compare this 5% hypothetical example with the 5% hypothetical examples that appear in the shareholder reports of the other funds. A small balance maintenance fee of $12.00 that is charged once a year may apply for certain accounts with a value of less than $2,000. This fee, which was eliminated effective August 1, 2018, is not included in the table below. If it was, the estimate of expenses you paid during the period would be higher, and your ending account value lower, by this amount. In addition, the Fund, as a shareholder in the underlying Fidelity Central Funds, will indirectly bear its pro-rata share of the fees and expenses incurred by the underlying Fidelity Central Funds. These fees and expenses are not included in the Fund's annualized expense ratio used to calculate the expense estimate in the table below.
Please note that the expenses shown in the table are meant to highlight your ongoing costs only and do not reflect any transaction costs. Therefore, the second line of the table is useful in comparing ongoing costs only, and will not help you determine the relative total costs of owning different funds. In addition, if these transactional costs were included, your costs would have been higher.
| | Annualized Expense Ratio-A | Beginning
Account Value
May 1, 2018 | Ending
Account Value
October 31, 2018 | Expenses Paid
During Period-B
May 1, 2018
to October 31, 2018 |
| Class A | 1.45% | | | |
| Actual | | $1,000.00 | $887.40 | $6.90 |
| Hypothetical-C | | $1,000.00 | $1,017.90 | $7.38 |
| Class M | 1.70% | | | |
| Actual | | $1,000.00 | $886.70 | $8.08 |
| Hypothetical-C | | $1,000.00 | $1,016.64 | $8.64 |
| Class C | 2.20% | | | |
| Actual | | $1,000.00 | $884.20 | $10.45 |
| Hypothetical-C | | $1,000.00 | $1,014.12 | $11.17 |
| Total International Equity | 1.20% | | | |
| Actual | | $1,000.00 | $888.80 | $5.71 |
| Hypothetical-C | | $1,000.00 | $1,019.16 | $6.11 |
| Class I | 1.20% | | | |
| Actual | | $1,000.00 | $888.30 | $5.71 |
| Hypothetical-C | | $1,000.00 | $1,019.16 | $6.11 |
| Class Z | 1.05% | | | |
| Actual | | $1,000.00 | $889.60 | $5.00 |
| Hypothetical-C | | $1,000.00 | $1,019.91 | $5.35 |
A Annualized expense ratio reflects expenses net of applicable fee waivers.
B Expenses are equal to each Class' annualized expense ratio, multiplied by the average account value over the period, multiplied by 184/365 (to reflect the one-half year period).
C 5% return per year before expenses
Distributions (Unaudited)
Class A designates 4%, Class M designates 5%, Class C designates 5%, Total International Equity designates 4%, Class I designates 4%, and Class Z designates 4% of the dividend distributed during the fiscal year as qualifying for the dividends–received deduction for corporate shareholders.
Class A designates 93%, Class M designates 100%, Class C designates 100%, Total International Equity designates 94%, Class I designates 88%, and Class Z designates 88% of the dividends distributed during the fiscal year as amounts which may be taken into account as a dividend for purposes of the maximum rate under section 1(h)(11) of the Internal Revenue Code.
The amounts per share which represent income derived from sources within, and taxes paid to, foreign countries or possessions of the United States are as follows:
| | Pay Date | Income | Taxes |
| Fidelity Total International Equity Fund | | | |
| Class A | 12/11/17 | $0.3036 | $0.0346 |
| Class M | 12/11/17 | $0.2846 | $0.0346 |
| Class C | 12/11/17 | $0.2486 | $0.0346 |
| Total International Equity | 12/11/17 | $0.3006 | $0.0346 |
| Class I | 12/11/17 | $0.3226 | $0.0346 |
| Class Z | 12/11/17 | $0.3226 | $0.0346 |
The fund will notify shareholders in January 2019 of amounts for use in preparing 2018 income tax returns.
Board Approval of Investment Advisory Contracts
Fidelity Total International Equity Fund
At its July 2018 meeting, the Board of Trustees, including the Independent Trustees (together, the Board), voted to continue the management contract with Fidelity Management & Research Company (FMR) and the sub-advisory agreements (together, the Advisory Contracts) for the fund for six months through January 31, 2019, in connection with the reunification of the Fidelity Equity High Income Funds Board, which oversees the fund, and the Sector Portfolios Board.
The Board considered that the approval of the fund's Advisory Contracts will not result in any changes in (i) the investment process or strategies employed in the management of the fund's assets; (ii) the fees and expenses paid by shareholders, including the expense cap arrangement currently in place for the fund; (iii) the nature, extent or quality of services provided under the fund's Advisory Contracts; or (iv) the day-to-day management of the fund or the persons primarily responsible for such management. The Board concluded that the fund's Advisory Contracts are fair and reasonable, and that the fund's Advisory Contracts should be renewed, without modification, through January 31, 2019, with the understanding that the Board will consider the annual renewal for a full one year period in January 2019.
In connection with its consideration of future renewals of the fund's Advisory Contracts, the Board will consider: (i) the nature, extent and quality of services provided to the fund, including shareholder and administrative services and investment performance; (ii) the competitiveness of the management fee and total expenses for the fund; (iii) the costs of the services and profitability, including the revenues earned and the expenses incurred in conducting the business of developing, marketing, distributing, managing, administering, and servicing the fund and its shareholders, to the extent applicable, as well as potential fall-out benefits from Fidelity's non-fund businesses; and (iv) whether there have been economies of scale in respect of the Fidelity funds, whether the Fidelity funds (including the fund) have appropriately benefited from any such economies of scale, and whether there is the potential for realization of any further economies.
Based on its evaluation of all of the conclusions noted above, and after considering all factors it believed relevant, the Board ultimately concluded that the fund's management fee structure is fair and reasonable, and that the continuation of the fund's Advisory Contracts should be approved.
Corporate Headquarters
245 Summer St.
Boston, MA 02210
www.fidelity.com
TIE-ANN-1218
1.912358.108
Fidelity Advisor® International Growth Fund - Class A, Class M, Class C, Class I and Class Z
Annual Report October 31, 2018 Class A, Class M, Class C, Class I and Class Z are classes of Fidelity® International Growth Fund |
|
Contents
To view a fund's proxy voting guidelines and proxy voting record for the 12-month period ended June 30, visit http://www.fidelity.com/proxyvotingresults or visit the Securities and Exchange Commission's (SEC) web site at http://www.sec.gov.
You may also call 1-877-208-0098 to request a free copy of the proxy voting guidelines.
Standard & Poor's, S&P and S&P 500 are registered service marks of The McGraw-Hill Companies, Inc. and have been licensed for use by Fidelity Distributors Corporation.
Other third-party marks appearing herein are the property of their respective owners.
All other marks appearing herein are registered or unregistered trademarks or service marks of FMR LLC or an affiliated company. © 2018 FMR LLC. All rights reserved.
This report and the financial statements contained herein are submitted for the general information of the shareholders of the Fund. This report is not authorized for distribution to prospective investors in the Fund unless preceded or accompanied by an effective prospectus.
A fund files its complete schedule of portfolio holdings with the SEC for the first and third quarters of each fiscal year on Form N-Q. Forms N-Q are available on the SEC’s web site at http://www.sec.gov. A fund's Forms N-Q may be reviewed and copied at the SEC’s Public Reference Room in Washington, DC. Information regarding the operation of the SEC's Public Reference Room may be obtained by calling 1-800-SEC-0330.
For a complete list of a fund's portfolio holdings, view the most recent holdings listing, semiannual report, or annual report on Fidelity's web site at http://www.fidelity.com, http://www.institutional.fidelity.com, or http://www.401k.com, as applicable.
NOT FDIC INSURED •MAY LOSE VALUE •NO BANK GUARANTEE
Neither the Fund nor Fidelity Distributors Corporation is a bank.
Performance: The Bottom Line
Average annual total return reflects the change in the value of an investment, assuming reinvestment of distributions from dividend income and capital gains (the profits earned upon the sale of securities that have grown in value, if any) and assuming a constant rate of performance each year. The hypothetical investment and the average annual total returns do not reflect the deduction of taxes that a shareholder would pay on fund distributions or the redemption of fund shares. During periods of reimbursement by Fidelity, a fund’s total return will be greater than it would be had the reimbursement not occurred. How a fund did yesterday is no guarantee of how it will do tomorrow.
Average Annual Total Returns
| For the periods ended October 31, 2018 | Past 1 year | Past 5 years | Past 10 years |
| Class A (incl. 5.75% sales charge) | (11.52)% | 2.33% | 8.77% |
| Class M (incl. 3.50% sales charge) | (9.68)% | 2.49% | 8.71% |
| Class C (incl. contingent deferred sales charge) | (7.80)% | 2.74% | 8.58% |
| Class I | (5.83)% | 3.86% | 9.71% |
| Class Z | (5.71)% | 4.00% | 9.78% |
Class C shares' contingent deferred sales charges included in the past one year, past five years, and life of fund total return figures are 1%, 0%, and 0%, respectively.
The initial offering of Class Z shares took place on August 13, 2013. Returns prior to August 13, 2013, are those of Class I.
$10,000 Over 10 Years
Let's say hypothetically that $10,000 was invested in Fidelity Advisor® International Growth Fund - Class A on October 31, 2008, and the current 5.75% sales charge was paid.
The chart shows how the value of your investment would have changed, and also shows how the MSCI EAFE Growth Index performed over the same period.
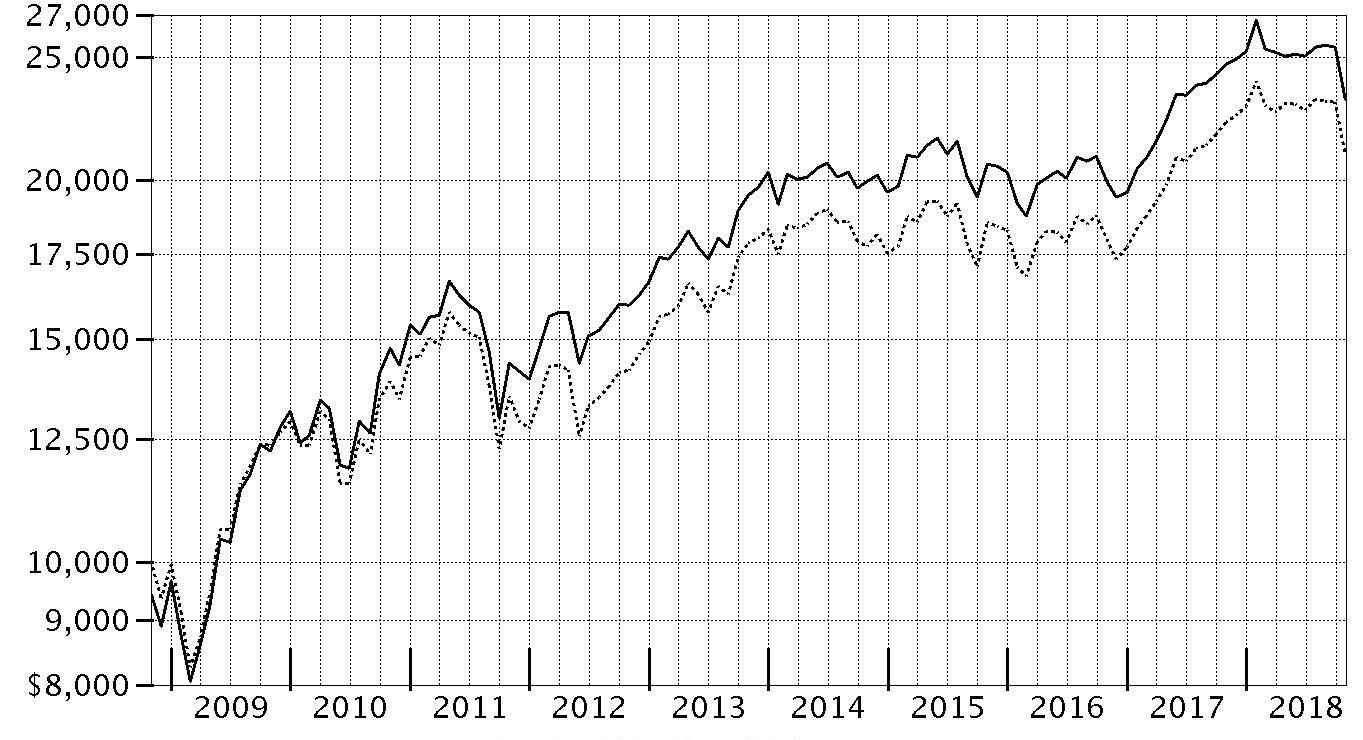
| Period Ending Values |
| $23,180 | Fidelity Advisor® International Growth Fund - Class A |
| $20,925 | MSCI EAFE Growth Index |
Management's Discussion of Fund Performance
Market Recap: International equities returned -8.08% for the 12 months ending October 31, 2018, according to the MSCI ACWI (All Country World Index) ex USA Index. A modestly positive first half of the period gave way to a confluence of overwhelmingly negative factors – including escalating trade tensions, a surging U.S. dollar, tepid economic growth in Europe, global central bank tightening, concerns about Italy’s budget stalemate with the EU, and weakness in China’s stock market – that yielded a -11% second-half return. The index lost 8% in October alone, its largest monthly drop in more than six years. Among sectors, new-media-infused communications services (-15%) was hit the hardest, while economically sensitive consumer discretionary (-13%), information technology (-12%), financials (-10%), industrials (-9%) and materials (-7%) stocks also fared poorly. Even the more defensive real estate (-9%), utilities (-6%) and consumer staples (-5%) sectors weren’t spared this period. Conversely, elevated crude-oil prices fueled a positive return for energy (+7%), the top-performing sector, followed by the relatively stable-growing health care segment (+2%). Regionally, emerging markets (-12%) fared the worst, hampered by the impact of foreign exchange and concerns about economic weakness in China, India and South Korea. Sluggish growth also pressured shares in continental Europe (-9%). Stocks in Japan (-3%) and the U.K. (-4%) held up better, followed by Canada (-5%) and Asia-Pacific ex Japan (-6%).
Comments from Portfolio Manager Jed Weiss: For the fiscal year, the fund’s share classes (excluding sales charges, if applicable) returned roughly -6% to -7%, compared with -5.86% for the benchmark MSCI EAFE Growth Index. Versus the benchmark, the fund benefited from sizable out-of-benchmark exposure to the U.S., as well as strong security selection in continental Europe. By sector, investment choices within the information technology sector also helped the fund's relative result. Conversely, stock picks in Japan and the U.K. detracted, as did investment choices within the consumer discretionary and consumer staples sectors. The biggest individual relative contributors were notable out-of-benchmark stakes in U.S.-based credit-card processors Mastercard and Visa, as both companies continued to maintain considerable pricing power and significant market share. A sizable overweighting in Australian global biopharmaceutical firm CSL Limited also proved beneficial, as its shares gained following the acquisition and successful turnaround of Novartis' flu business. I'll note that the fund's stake in cash – representing 3% of assets, on average – helped our relative result in a down market. Turning to detractors, a non-benchmark investment in U.S. flooring manufacturer Mohawk Industries hurt most, due to signs of softening in the U.S. housing market. The decision to not own consumer electronics conglomerate and benchmark component Sony also detracted from relative performance, given the stock's notable gain of during the period.
The views expressed above reflect those of the portfolio manager(s) only through the end of the period as stated on the cover of this report and do not necessarily represent the views of Fidelity or any other person in the Fidelity organization. Any such views are subject to change at any time based upon market or other conditions and Fidelity disclaims any responsibility to update such views. These views may not be relied on as investment advice and, because investment decisions for a Fidelity fund are based on numerous factors, may not be relied on as an indication of trading intent on behalf of any Fidelity fund.
Note to Shareholders: Following a roughly five-month leave of absence, Jed Weiss returned to Fidelity on November 29, 2017, and resumed his day-to-day responsibilities as Portfolio Manager. In his stead, Vincent Montemaggiore served as interim manager of the fund until December 4, 2017.
Investment Summary (Unaudited)
Geographic Diversification (% of fund's net assets)
| As of October 31, 2018 |
| | United States of America* | 25.3% |
| | Japan | 13.0% |
| | United Kingdom | 8.7% |
| | Switzerland | 8.3% |
| | Germany | 7.4% |
| | Sweden | 5.0% |
| | Spain | 3.9% |
| | France | 3.7% |
| | Australia | 3.4% |
| | Other | 21.3% |
* Includes Short-Term investments and Net Other Assets (Liabilities).
Percentages are based on country or territory of incorporation and are adjusted for the effect of futures contracts, if applicable.
Asset Allocation as of October 31, 2018
| | % of fund's net assets |
| Stocks | 94.3 |
| Short-Term Investments and Net Other Assets (Liabilities) | 5.7 |
Top Ten Stocks as of October 31, 2018
| | % of fund's net assets |
| Nestle SA (Reg. S) (Switzerland, Food Products) | 3.9 |
| SAP SE (Germany, Software) | 3.4 |
| CSL Ltd. (Australia, Biotechnology) | 3.4 |
| Roche Holding AG (participation certificate) (Switzerland, Pharmaceuticals) | 3.2 |
| Visa, Inc. Class A (United States of America, IT Services) | 3.0 |
| MasterCard, Inc. Class A (United States of America, IT Services) | 2.9 |
| AIA Group Ltd. (Hong Kong, Insurance) | 2.7 |
| ASML Holding NV (Netherlands) (Netherlands, Semiconductors & Semiconductor Equipment) | 2.6 |
| Keyence Corp. (Japan, Electronic Equipment & Components) | 2.5 |
| Amadeus IT Holding SA Class A (Spain, IT Services) | 2.4 |
| | 30.0 |
Top Market Sectors as of October 31, 2018
| | % of fund's net assets |
| Industrials | 21.1 |
| Information Technology | 19.8 |
| Financials | 15.4 |
| Health Care | 10.3 |
| Consumer Discretionary | 6.9 |
| Consumer Staples | 6.9 |
| Communication Services | 6.4 |
| Materials | 6.0 |
| Real Estate | 1.1 |
| Energy | 0.4 |
Schedule of Investments October 31, 2018
Showing Percentage of Net Assets
| Common Stocks - 93.9% | | | |
| | | Shares | Value |
| Australia - 3.4% | | | |
| CSL Ltd. | | 578,755 | $77,050,926 |
| Austria - 1.1% | | | |
| Andritz AG | | 483,421 | 25,055,741 |
| Belgium - 1.0% | | | |
| KBC Groep NV | | 335,808 | 23,163,493 |
| Brazil - 0.1% | | | |
| Itau Unibanco Holding SA | | 230,900 | 2,630,082 |
| Canada - 2.5% | | | |
| Alimentation Couche-Tard, Inc. Class B (sub. vtg.) | | 254,900 | 12,173,317 |
| Canadian National Railway Co. | | 125,100 | 10,694,484 |
| Canadian Pacific Railway Ltd. | | 53,500 | 10,971,473 |
| Franco-Nevada Corp. | | 188,300 | 11,760,436 |
| Pason Systems, Inc. | | 335,200 | 5,059,382 |
| PrairieSky Royalty Ltd. (a) | | 346,900 | 5,270,234 |
|
| TOTAL CANADA | | | 55,929,326 |
|
| Cayman Islands - 0.8% | | | |
| Alibaba Group Holding Ltd. sponsored ADR (b) | | 133,100 | 18,937,468 |
| Denmark - 0.5% | | | |
| Jyske Bank A/S (Reg.) | | 276,400 | 11,300,387 |
| Finland - 0.2% | | | |
| Tikkurila Oyj | | 278,900 | 3,797,071 |
| France - 3.7% | | | |
| Edenred SA | | 489,400 | 18,586,313 |
| Elis SA | | 460,836 | 9,306,652 |
| Legrand SA | | 251,300 | 16,434,822 |
| Safran SA | | 308,200 | 39,828,014 |
|
| TOTAL FRANCE | | | 84,155,801 |
|
| Germany - 7.4% | | | |
| Bayer AG | | 163,490 | 12,531,911 |
| Linde PLC | | 255,179 | 41,865,777 |
| MTU Aero Engines Holdings AG | | 99,000 | 21,058,455 |
| SAP SE | | 723,501 | 77,467,779 |
| Vonovia SE | | 286,600 | 13,121,039 |
|
| TOTAL GERMANY | | | 166,044,961 |
|
| Hong Kong - 2.7% | | | |
| AIA Group Ltd. | | 7,973,000 | 60,341,822 |
| India - 1.0% | | | |
| Housing Development Finance Corp. Ltd. | | 967,878 | 23,153,301 |
| Ireland - 2.8% | | | |
| CRH PLC sponsored ADR (a) | | 1,266,766 | 37,724,291 |
| James Hardie Industries PLC CDI | | 1,910,089 | 25,415,909 |
|
| TOTAL IRELAND | | | 63,140,200 |
|
| Italy - 0.7% | | | |
| Interpump Group SpA | | 556,726 | 16,079,680 |
| Japan - 13.0% | | | |
| Azbil Corp. | | 325,000 | 6,054,416 |
| DENSO Corp. | | 532,900 | 23,770,415 |
| East Japan Railway Co. | | 289,000 | 25,240,608 |
| Fanuc Corp. | | 125,600 | 21,850,263 |
| Hoya Corp. | | 472,500 | 26,858,820 |
| Keyence Corp. | | 117,124 | 57,402,022 |
| Komatsu Ltd. | | 662,300 | 17,247,919 |
| Misumi Group, Inc. | | 1,031,700 | 20,719,034 |
| Nabtesco Corp. | | 443,500 | 9,779,129 |
| Nintendo Co. Ltd. | | 46,700 | 14,579,875 |
| OSG Corp. | | 610,300 | 12,624,099 |
| SHO-BOND Holdings Co. Ltd. | | 237,400 | 16,915,815 |
| USS Co. Ltd. | | 2,169,400 | 39,163,981 |
|
| TOTAL JAPAN | | | 292,206,396 |
|
| Kenya - 0.7% | | | |
| Safaricom Ltd. | | 67,029,800 | 15,263,887 |
| Korea (South) - 0.7% | | | |
| BGF Retail Co. Ltd. | | 53,972 | 7,970,449 |
| NAVER Corp. | | 85,970 | 8,627,138 |
|
| TOTAL KOREA (SOUTH) | | | 16,597,587 |
|
| Netherlands - 2.6% | | | |
| ASML Holding NV (Netherlands) | | 343,700 | 59,200,308 |
| New Zealand - 0.5% | | | |
| Auckland International Airport Ltd. | | 2,215,940 | 10,107,621 |
| Norway - 0.5% | | | |
| Schibsted ASA (B Shares) | | 364,600 | 11,548,103 |
| South Africa - 1.4% | | | |
| Clicks Group Ltd. | | 1,116,838 | 14,232,540 |
| Naspers Ltd. Class N | | 91,700 | 16,115,828 |
|
| TOTAL SOUTH AFRICA | | | 30,348,368 |
|
| Spain - 3.9% | | | |
| Amadeus IT Holding SA Class A | | 663,800 | 53,516,901 |
| Grifols SA ADR | | 838,200 | 17,116,044 |
| Merlin Properties Socimi SA | | 430,900 | 5,407,692 |
| Prosegur Compania de Seguridad SA (Reg.) | | 2,209,449 | 12,282,429 |
|
| TOTAL SPAIN | | | 88,323,066 |
|
| Sweden - 5.0% | | | |
| ASSA ABLOY AB (B Shares) | | 2,592,283 | 51,562,489 |
| Atlas Copco AB (A Shares) | | 1,081,900 | 26,789,916 |
| Epiroc AB Class A (b) | | 1,437,600 | 12,624,155 |
| Fagerhult AB | | 552,394 | 4,853,213 |
| Loomis AB (B Shares) | | 202,100 | 6,249,958 |
| Svenska Handelsbanken AB (A Shares) | | 939,120 | 10,208,086 |
|
| TOTAL SWEDEN | | | 112,287,817 |
|
| Switzerland - 8.3% | | | |
| Nestle SA (Reg. S) | | 1,044,349 | 88,167,194 |
| Roche Holding AG (participation certificate) | | 297,183 | 72,323,171 |
| Schindler Holding AG: | | | |
| (participation certificate) | | 105,958 | 22,345,707 |
| (Reg.) | | 18,350 | 3,811,567 |
|
| TOTAL SWITZERLAND | | | 186,647,639 |
|
| Taiwan - 1.1% | | | |
| Taiwan Semiconductor Manufacturing Co. Ltd. | | 3,330,000 | 24,985,452 |
| United Kingdom - 8.7% | | | |
| BAE Systems PLC | | 2,619,600 | 17,565,170 |
| Elementis PLC | | 2,360,662 | 6,185,666 |
| Informa PLC | | 3,032,666 | 27,661,660 |
| InterContinental Hotel Group PLC ADR (a) | | 721,022 | 38,762,143 |
| Melrose Industries PLC | | 4,857,279 | 10,470,760 |
| Prudential PLC | | 2,322,865 | 46,512,176 |
| Reckitt Benckiser Group PLC | | 294,345 | 23,801,948 |
| Rightmove PLC | | 1,065,700 | 6,159,087 |
| Shaftesbury PLC | | 542,533 | 6,220,387 |
| Spectris PLC | | 447,057 | 12,251,422 |
|
| TOTAL UNITED KINGDOM | | | 195,590,419 |
|
| United States of America - 19.6% | | | |
| Alphabet, Inc. Class A (b) | | 41,436 | 45,189,273 |
| Autoliv, Inc. (a) | | 202,169 | 16,848,764 |
| Berkshire Hathaway, Inc. Class B (b) | | 116,084 | 23,829,724 |
| Black Knight, Inc. (b) | | 262,400 | 12,797,248 |
| Marsh & McLennan Companies, Inc. | | 227,551 | 19,284,947 |
| Martin Marietta Materials, Inc. | | 119,400 | 20,450,832 |
| MasterCard, Inc. Class A | | 332,400 | 65,705,508 |
| Mohawk Industries, Inc. (b) | | 101,300 | 12,635,149 |
| Moody's Corp. | | 162,100 | 23,582,308 |
| MSCI, Inc. | | 179,600 | 27,008,248 |
| PayPal Holdings, Inc. (b) | | 128,600 | 10,826,834 |
| PriceSmart, Inc. | | 127,800 | 8,965,170 |
| ResMed, Inc. | | 228,600 | 24,213,312 |
| S&P Global, Inc. | | 146,700 | 26,746,344 |
| Sherwin-Williams Co. | | 75,300 | 29,628,291 |
| Veoneer, Inc. (a)(b) | | 231,469 | 7,772,729 |
| Visa, Inc. Class A | | 486,760 | 67,099,866 |
|
| TOTAL UNITED STATES OF AMERICA | | | 442,584,547 |
|
| TOTAL COMMON STOCKS | | | |
| (Cost $1,776,108,879) | | | 2,116,471,469 |
|
| Nonconvertible Preferred Stocks - 0.4% | | | |
| Brazil - 0.4% | | | |
| Itau Unibanco Holding SA | | | |
| (Cost $8,721,522) | | 707,900 | 9,368,286 |
|
| Money Market Funds - 7.4% | | | |
| Fidelity Cash Central Fund, 2.23% (c) | | 120,911,580 | 120,935,762 |
| Fidelity Securities Lending Cash Central Fund 2.23% (c)(d) | | 45,794,861 | 45,799,441 |
| TOTAL MONEY MARKET FUNDS | | | |
| (Cost $166,735,203) | | | 166,735,203 |
| TOTAL INVESTMENT IN SECURITIES - 101.7% | | | |
| (Cost $1,951,565,604) | | | 2,292,574,958 |
| NET OTHER ASSETS (LIABILITIES) - (1.7)% | | | (38,184,935) |
| NET ASSETS - 100% | | | $2,254,390,023 |
Categorizations in the Schedule of Investments are based on country or territory of incorporation.
Legend
(a) Security or a portion of the security is on loan at period end.
(b) Non-income producing
(c) Affiliated fund that is generally available only to investment companies and other accounts managed by Fidelity Investments. The rate quoted is the annualized seven-day yield of the fund at period end. A complete unaudited listing of the fund's holdings as of its most recent quarter end is available upon request. In addition, each Fidelity Central Fund's financial statements, which are not covered by the Fund's Report of Independent Registered Public Accounting Firm, are available on the SEC's website or upon request.
(d) Investment made with cash collateral received from securities on loan.
Affiliated Central Funds
Information regarding fiscal year to date income earned by the Fund from investments in Fidelity Central Funds is as follows:
| Fund | Income earned |
| Fidelity Cash Central Fund | $1,284,956 |
| Fidelity Securities Lending Cash Central Fund | 462,892 |
| Total | $1,747,848 |
Amounts in the income column in the above table include any capital gain distributions from underlying funds, which are presented in the corresponding line-item in the Statement of Operations if applicable.
Investment Valuation
The following is a summary of the inputs used, as of October 31, 2018, involving the Fund's assets and liabilities carried at fair value. The inputs or methodology used for valuing securities may not be an indication of the risk associated with investing in those securities. For more information on valuation inputs, and their aggregation into the levels used below, please refer to the Investment Valuation section in the accompanying Notes to Financial Statements.
| | Valuation Inputs at Reporting Date: |
| Description | Total | Level 1 | Level 2 | Level 3 |
| Investments in Securities: | | | | |
| Equities: | | | | |
| Communication Services | $145,144,851 | $130,564,976 | $14,579,875 | $-- |
| Consumer Discretionary | 157,890,649 | 134,120,234 | 23,770,415 | -- |
| Consumer Staples | 155,310,618 | 43,341,476 | 111,969,142 | -- |
| Energy | 10,329,616 | 10,329,616 | -- | -- |
| Financials | 348,994,981 | 292,274,719 | 56,720,262 | -- |
| Health Care | 230,094,184 | 145,239,102 | 84,855,082 | -- |
| Industrials | 471,055,486 | 297,761,023 | 173,294,463 | -- |
| Information Technology | 447,307,756 | 285,654,217 | 161,653,539 | -- |
| Materials | 134,962,496 | 134,962,496 | -- | -- |
| Real Estate | 24,749,118 | 24,749,118 | -- | -- |
| Money Market Funds | 166,735,203 | 166,735,203 | -- | -- |
| Total Investments in Securities: | $2,292,574,958 | $1,665,732,180 | $626,842,778 | $-- |
The following is a summary of transfers between Level 1 and Level 2 for the period ended October 31, 2018. Transfers are assumed to have occurred at the beginning of the period, and are primarily attributable to the valuation techniques used for foreign equity securities, as discussed in the accompanying Notes to Financial Statements:
| Transfers | Total |
| Level 1 to Level 2 | $17,963,771 |
| Level 2 to Level 1 | $174,714,963 |
See accompanying notes which are an integral part of the financial statements.
Financial Statements
Statement of Assets and Liabilities
| | | October 31, 2018 |
| Assets | | |
Investment in securities, at value (including securities loaned of $45,731,621) — See accompanying schedule:
Unaffiliated issuers (cost $1,784,830,401) | $2,125,839,755 | |
| Fidelity Central Funds (cost $166,735,203) | 166,735,203 | |
| Total Investment in Securities (cost $1,951,565,604) | | $2,292,574,958 |
| Foreign currency held at value (cost $15,231) | | 14,808 |
| Receivable for investments sold | | 7,160,194 |
| Receivable for fund shares sold | | 5,172,093 |
| Dividends receivable | | 8,730,685 |
| Distributions receivable from Fidelity Central Funds | | 269,240 |
| Prepaid expenses | | 4,666 |
| Other receivables | | 175,049 |
| Total assets | | 2,314,101,693 |
| Liabilities | | |
| Payable for investments purchased | $5,398,186 | |
| Payable for fund shares redeemed | 6,537,082 | |
| Accrued management fee | 1,345,676 | |
| Distribution and service plan fees payable | 93,811 | |
| Other affiliated payables | 390,515 | |
| Other payables and accrued expenses | 154,700 | |
| Collateral on securities loaned | 45,791,700 | |
| Total liabilities | | 59,711,670 |
| Net Assets | | $2,254,390,023 |
| Net Assets consist of: | | |
| Paid in capital | | $1,982,928,446 |
| Total distributable earnings (loss) | | 271,461,577 |
| Net Assets | | $2,254,390,023 |
| Net Asset Value and Maximum Offering Price | | |
| Class A: | | |
| Net Asset Value and redemption price per share ($138,801,944 ÷ 11,129,084 shares) | | $12.47 |
| Maximum offering price per share (100/94.25 of $12.47) | | $13.23 |
| Class M: | | |
| Net Asset Value and redemption price per share ($26,479,092 ÷ 2,130,561 shares) | | $12.43 |
| Maximum offering price per share (100/96.50 of $12.43) | | $12.88 |
| Class C: | | |
| Net Asset Value and offering price per share ($60,489,203 ÷ 4,957,617 shares)(a) | | $12.20 |
| International Growth: | | |
| Net Asset Value, offering price and redemption price per share ($811,100,687 ÷ 64,509,100 shares) | | $12.57 |
| Class I: | | |
| Net Asset Value, offering price and redemption price per share ($660,960,682 ÷ 52,676,208 shares) | | $12.55 |
| Class Z: | | |
| Net Asset Value, offering price and redemption price per share ($556,558,415 ÷ 44,269,920 shares) | | $12.57 |
(a) Redemption price per share is equal to net asset value less any applicable contingent deferred sales charge.
See accompanying notes which are an integral part of the financial statements.
Statement of Operations
| | | Year ended October 31, 2018 |
| Investment Income | | |
| Dividends | | $48,714,625 |
| Income from Fidelity Central Funds | | 1,747,848 |
| Income before foreign taxes withheld | | 50,462,473 |
| Less foreign taxes withheld | | (4,506,698) |
| Total income | | 45,955,775 |
| Expenses | | |
| Management fee | | |
| Basic fee | $17,002,946 | |
| Performance adjustment | (55,145) | |
| Transfer agent fees | 4,013,844 | |
| Distribution and service plan fees | 1,261,740 | |
| Accounting and security lending fees | 1,084,753 | |
| Custodian fees and expenses | 302,250 | |
| Independent trustees' fees and expenses | 12,196 | |
| Registration fees | 171,109 | |
| Audit | 75,340 | |
| Legal | 7,141 | |
| Interest | 12,804 | |
| Miscellaneous | 16,040 | |
| Total expenses before reductions | 23,905,018 | |
| Expense reductions | (271,447) | |
| Total expenses after reductions | | 23,633,571 |
| Net investment income (loss) | | 22,322,204 |
| Realized and Unrealized Gain (Loss) | | |
| Net realized gain (loss) on: | | |
| Investment securities: | | |
| Unaffiliated issuers | 6,254,679 | |
| Fidelity Central Funds | 875 | |
| Foreign currency transactions | (452,401) | |
| Total net realized gain (loss) | | 5,803,153 |
| Change in net unrealized appreciation (depreciation) on: | | |
| Investment securities: | | |
| Unaffiliated issuers (net of decrease in deferred foreign taxes of $43,591) | (175,443,626) | |
| Assets and liabilities in foreign currencies | (68,126) | |
| Total change in net unrealized appreciation (depreciation) | | (175,511,752) |
| Net gain (loss) | | (169,708,599) |
| Net increase (decrease) in net assets resulting from operations | | $(147,386,395) |
See accompanying notes which are an integral part of the financial statements.
Statement of Changes in Net Assets
| | Year ended October 31, 2018 | Year ended October 31, 2017 |
| Increase (Decrease) in Net Assets | | |
| Operations | | |
| Net investment income (loss) | $22,322,204 | $16,277,855 |
| Net realized gain (loss) | 5,803,153 | (12,551,371) |
| Change in net unrealized appreciation (depreciation) | (175,511,752) | 409,389,366 |
| Net increase (decrease) in net assets resulting from operations | (147,386,395) | 413,115,850 |
| Distributions to shareholders | (16,636,167) | – |
| Distributions to shareholders from net investment income | – | (18,629,181) |
| Total distributions | (16,636,167) | (18,629,181) |
| Share transactions - net increase (decrease) | 95,038,479 | 210,891,938 |
| Redemption fees | – | 6,903 |
| Total increase (decrease) in net assets | (68,984,084) | 605,385,510 |
| Net Assets | | |
| Beginning of period | 2,323,374,107 | 1,717,988,597 |
| End of period | $2,254,390,023 | $2,323,374,107 |
| Other Information | | |
| Undistributed net investment income end of period | | $13,559,706 |
See accompanying notes which are an integral part of the financial statements.
Financial Highlights
Fidelity International Growth Fund Class A
| Years ended October 31, | 2018 | 2017 | 2016 | 2015 | 2014 |
| Selected Per–Share Data | | | | | |
| Net asset value, beginning of period | $13.34 | $10.88 | $11.30 | $11.01 | $10.78 |
| Income from Investment Operations | | | | | |
| Net investment income (loss)A | .09 | .07 | .12B | .07 | .09 |
| Net realized and unrealized gain (loss) | (.90) | 2.49 | (.48) | .28 | .18 |
| Total from investment operations | (.81) | 2.56 | (.36) | .35 | .27 |
| Distributions from net investment income | (.04) | (.10) | (.05) | (.06) | (.03) |
| Distributions from net realized gain | (.02) | – | (.01) | – | (.01) |
| Total distributions | (.06) | (.10) | (.06) | (.06) | (.04) |
| Redemption fees added to paid in capitalA | – | –C | –C | –C | –C |
| Net asset value, end of period | $12.47 | $13.34 | $10.88 | $11.30 | $11.01 |
| Total ReturnD,E | (6.12)% | 23.80% | (3.22)% | 3.20% | 2.54% |
| Ratios to Average Net AssetsF,G | | | | | |
| Expenses before reductions | 1.24% | 1.28% | 1.27% | 1.26% | 1.35% |
| Expenses net of fee waivers, if any | 1.23% | 1.28% | 1.27% | 1.26% | 1.35% |
| Expenses net of all reductions | 1.22% | 1.27% | 1.27% | 1.25% | 1.34% |
| Net investment income (loss) | .64% | .62% | 1.05%B | .66% | .84% |
| Supplemental Data | | | | | |
| Net assets, end of period (000 omitted) | $138,802 | $156,988 | $221,861 | $184,878 | $119,017 |
| Portfolio turnover rateH | 34% | 22% | 29% | 26% | 27% |
A Calculated based on average shares outstanding during the period.
B Net investment income per share reflects a large, non-recurring dividend which amounted to $.04 per share. Excluding this non-recurring dividend, the ratio of net investment income (loss) to average net assets would have been .68%.
C Amount represents less than $.005 per share.
D Total returns would have been lower if certain expenses had not been reduced during the applicable periods shown.
E Total returns do not include the effect of the sales charges.
F Fees and expenses of any underlying Fidelity Central Funds are not included in the Fund's expense ratio. The Fund indirectly bears its proportionate share of the expenses of any underlying Fidelity Central Funds.
G Expense ratios reflect operating expenses of the class. Expenses before reductions do not reflect amounts reimbursed by the investment adviser or reductions from brokerage service arrangements or reductions from other expense offset arrangements and do not represent the amount paid by the class during periods when reimbursements or reductions occur. Expenses net of fee waivers reflect expenses after reimbursement by the investment adviser but prior to reductions from brokerage service arrangements or other expense offset arrangements. Expenses net of all reductions represent the net expenses paid by the class.
H Amount does not include the portfolio activity of any underlying Fidelity Central Funds.
See accompanying notes which are an integral part of the financial statements.
Fidelity International Growth Fund Class M
| Years ended October 31, | 2018 | 2017 | 2016 | 2015 | 2014 |
| Selected Per–Share Data | | | | | |
| Net asset value, beginning of period | $13.30 | $10.84 | $11.26 | $10.96 | $10.75 |
| Income from Investment Operations | | | | | |
| Net investment income (loss)A | .05 | .04 | .08B | .04 | .06 |
| Net realized and unrealized gain (loss) | (.90) | 2.49 | (.48) | .27 | .18 |
| Total from investment operations | (.85) | 2.53 | (.40) | .31 | .24 |
| Distributions from net investment income | (.01) | (.07) | (.01) | (.01) | (.02) |
| Distributions from net realized gain | (.02) | – | (.01) | – | (.01) |
| Total distributions | (.02)C | (.07) | (.02) | (.01) | (.03) |
| Redemption fees added to paid in capitalA | – | –D | –D | –D | –D |
| Net asset value, end of period | $12.43 | $13.30 | $10.84 | $11.26 | $10.96 |
| Total ReturnE,F | (6.40)% | 23.51% | (3.58)% | 2.85% | 2.21% |
| Ratios to Average Net AssetsG,H | | | | | |
| Expenses before reductions | 1.54% | 1.59% | 1.61% | 1.58% | 1.65% |
| Expenses net of fee waivers, if any | 1.53% | 1.59% | 1.61% | 1.58% | 1.65% |
| Expenses net of all reductions | 1.52% | 1.58% | 1.61% | 1.58% | 1.65% |
| Net investment income (loss) | .34% | .31% | .71%B | .33% | .53% |
| Supplemental Data | | | | | |
| Net assets, end of period (000 omitted) | $26,479 | $33,597 | $27,966 | $28,833 | $26,369 |
| Portfolio turnover rateI | 34% | 22% | 29% | 26% | 27% |
A Calculated based on average shares outstanding during the period.
B Net investment income per share reflects a large, non-recurring dividend which amounted to $.04 per share. Excluding this non-recurring dividend, the ratio of net investment income (loss) to average net assets would have been .34%.
C Total distributions of $.02 per share is comprised of distributions from net investment income of $.005 and distributions from net realized gain of $.015 per share.
D Amount represents less than $.005 per share.
E Total returns would have been lower if certain expenses had not been reduced during the applicable periods shown.
F Total returns do not include the effect of the sales charges.
G Fees and expenses of any underlying Fidelity Central Funds are not included in the Fund's expense ratio. The Fund indirectly bears its proportionate share of the expenses of any underlying Fidelity Central Funds.
H Expense ratios reflect operating expenses of the class. Expenses before reductions do not reflect amounts reimbursed by the investment adviser or reductions from brokerage service arrangements or reductions from other expense offset arrangements and do not represent the amount paid by the class during periods when reimbursements or reductions occur. Expenses net of fee waivers reflect expenses after reimbursement by the investment adviser but prior to reductions from brokerage service arrangements or other expense offset arrangements. Expenses net of all reductions represent the net expenses paid by the class.
I Amount does not include the portfolio activity of any underlying Fidelity Central Funds.
See accompanying notes which are an integral part of the financial statements.
Fidelity International Growth Fund Class C
| Years ended October 31, | 2018 | 2017 | 2016 | 2015 | 2014 |
| Selected Per–Share Data | | | | | |
| Net asset value, beginning of period | $13.10 | $10.67 | $11.12 | $10.87 | $10.69 |
| Income from Investment Operations | | | | | |
| Net investment income (loss)A | (.01) | (.02) | .03B | (.02) | .01 |
| Net realized and unrealized gain (loss) | (.89) | 2.47 | (.47) | .27 | .18 |
| Total from investment operations | (.90) | 2.45 | (.44) | .25 | .19 |
| Distributions from net investment income | – | (.02) | – | – | – |
| Distributions from net realized gain | – | – | (.01) | – | (.01) |
| Total distributions | – | (.02) | (.01) | – | (.01) |
| Redemption fees added to paid in capitalA | – | –C | –C | –C | –C |
| Net asset value, end of period | $12.20 | $13.10 | $10.67 | $11.12 | $10.87 |
| Total ReturnD,E | (6.87)% | 22.96% | (3.98)% | 2.30% | 1.77% |
| Ratios to Average Net AssetsF,G | | | | | |
| Expenses before reductions | 1.99% | 2.04% | 2.07% | 2.06% | 2.12% |
| Expenses net of fee waivers, if any | 1.99% | 2.04% | 2.07% | 2.06% | 2.12% |
| Expenses net of all reductions | 1.98% | 2.04% | 2.06% | 2.05% | 2.12% |
| Net investment income (loss) | (.11)% | (.15)% | .26%B | (.15)% | .06% |
| Supplemental Data | | | | | |
| Net assets, end of period (000 omitted) | $60,489 | $68,908 | $52,738 | $52,378 | $32,737 |
| Portfolio turnover rateH | 34% | 22% | 29% | 26% | 27% |
A Calculated based on average shares outstanding during the period.
B Net investment income per share reflects a large, non-recurring dividend which amounted to $.04 per share. Excluding this non-recurring dividend, the ratio of net investment income (loss) to average net assets would have been (.12) %.
C Amount represents less than $.005 per share.
D Total returns would have been lower if certain expenses had not been reduced during the applicable periods shown.
E Total returns do not include the effect of the contingent deferred sales charge.
F Fees and expenses of any underlying Fidelity Central Funds are not included in the Fund's expense ratio. The Fund indirectly bears its proportionate share of the expenses of any underlying Fidelity Central Funds.
G Expense ratios reflect operating expenses of the class. Expenses before reductions do not reflect amounts reimbursed by the investment adviser or reductions from brokerage service arrangements or reductions from other expense offset arrangements and do not represent the amount paid by the class during periods when reimbursements or reductions occur. Expenses net of fee waivers reflect expenses after reimbursement by the investment adviser but prior to reductions from brokerage service arrangements or other expense offset arrangements. Expenses net of all reductions represent the net expenses paid by the class.
H Amount does not include the portfolio activity of any underlying Fidelity Central Funds.
See accompanying notes which are an integral part of the financial statements.
Fidelity International Growth Fund
| Years ended October 31, | 2018 | 2017 | 2016 | 2015 | 2014 |
| Selected Per–Share Data | | | | | |
| Net asset value, beginning of period | $13.45 | $10.97 | $11.38 | $11.10 | $10.84 |
| Income from Investment Operations | | | | | |
| Net investment income (loss)A | .13 | .10 | .15B | .11 | .13 |
| Net realized and unrealized gain (loss) | (.92) | 2.51 | (.47) | .26 | .19 |
| Total from investment operations | (.79) | 2.61 | (.32) | .37 | .32 |
| Distributions from net investment income | (.08) | (.13) | (.08) | (.09) | (.05) |
| Distributions from net realized gain | (.02) | – | (.01) | – | (.01) |
| Total distributions | (.09)C | (.13) | (.09) | (.09) | (.06) |
| Redemption fees added to paid in capitalA | – | –D | –D | –D | –D |
| Net asset value, end of period | $12.57 | $13.45 | $10.97 | $11.38 | $11.10 |
| Total ReturnE | (5.89)% | 24.14% | (2.87)% | 3.36% | 2.96% |
| Ratios to Average Net AssetsF,G | | | | | |
| Expenses before reductions | .95% | 1.03% | .99% | .97% | 1.04% |
| Expenses net of fee waivers, if any | .95% | 1.03% | .99% | .97% | 1.04% |
| Expenses net of all reductions | .94% | 1.03% | .98% | .96% | 1.04% |
| Net investment income (loss) | .93% | .87% | 1.34%B | .94% | 1.14% |
| Supplemental Data | | | | | |
| Net assets, end of period (000 omitted) | $811,101 | $961,775 | $1,038,771 | $938,348 | $635,607 |
| Portfolio turnover rateH | 34% | 22% | 29% | 26% | 27% |
A Calculated based on average shares outstanding during the period.
B Net investment income per share reflects a large, non-recurring dividend which amounted to $.04 per share. Excluding this non-recurring dividend, the ratio of net investment income (loss) to average net assets would have been .96%.
C Total distributions of $.09 per share is comprised of distributions from net investment income of $.079 and distributions from net realized gain of $.015 per share.
D Amount represents less than $.005 per share.
E Total returns would have been lower if certain expenses had not been reduced during the applicable periods shown.
F Fees and expenses of any underlying Fidelity Central Funds are not included in the Fund's expense ratio. The Fund indirectly bears its proportionate share of the expenses of any underlying Fidelity Central Funds.
G Expense ratios reflect operating expenses of the class. Expenses before reductions do not reflect amounts reimbursed by the investment adviser or reductions from brokerage service arrangements or reductions from other expense offset arrangements and do not represent the amount paid by the class during periods when reimbursements or reductions occur. Expenses net of fee waivers reflect expenses after reimbursement by the investment adviser but prior to reductions from brokerage service arrangements or other expense offset arrangements. Expenses net of all reductions represent the net expenses paid by the class.
H Amount does not include the portfolio activity of any underlying Fidelity Central Funds.
See accompanying notes which are an integral part of the financial statements.
Fidelity International Growth Fund Class I
| Years ended October 31, | 2018 | 2017 | 2016 | 2015 | 2014 |
| Selected Per–Share Data | | | | | |
| Net asset value, beginning of period | $13.43 | $10.95 | $11.36 | $11.08 | $10.84 |
| Income from Investment Operations | | | | | |
| Net investment income (loss)A | .13 | .11 | .15B | .11 | .13 |
| Net realized and unrealized gain (loss) | (.91) | 2.51 | (.47) | .27 | .18 |
| Total from investment operations | (.78) | 2.62 | (.32) | .38 | .31 |
| Distributions from net investment income | (.09) | (.14) | (.08) | (.10) | (.06) |
| Distributions from net realized gain | (.02) | – | (.01) | – | (.01) |
| Total distributions | (.10)C | (.14) | (.09) | (.10) | (.07) |
| Redemption fees added to paid in capitalA | – | –D | –D | –D | –D |
| Net asset value, end of period | $12.55 | $13.43 | $10.95 | $11.36 | $11.08 |
| Total ReturnE | (5.83)% | 24.23% | (2.87)% | 3.41% | 2.84% |
| Ratios to Average Net AssetsF,G | | | | | |
| Expenses before reductions | .93% | .98% | .98% | .98% | 1.04% |
| Expenses net of fee waivers, if any | .93% | .98% | .98% | .98% | 1.04% |
| Expenses net of all reductions | .92% | .97% | .98% | .97% | 1.04% |
| Net investment income (loss) | .94% | .92% | 1.34%B | .94% | 1.14% |
| Supplemental Data | | | | | |
| Net assets, end of period (000 omitted) | $660,961 | $728,227 | $359,676 | $267,745 | $121,554 |
| Portfolio turnover rateH | 34% | 22% | 29% | 26% | 27% |
A Calculated based on average shares outstanding during the period.
B Net investment income per share reflects a large, non-recurring dividend which amounted to $.04 per share. Excluding this non-recurring dividend, the ratio of net investment income (loss) to average net assets would have been .97%.
C Total distributions of $.10 per share is comprised of distributions from net investment income of $.089 and distributions from net realized gain of $.015 per share.
D Amount represents less than $.005 per share.
E Total returns would have been lower if certain expenses had not been reduced during the applicable periods shown.
F Fees and expenses of any underlying Fidelity Central Funds are not included in the Fund's expense ratio. The Fund indirectly bears its proportionate share of the expenses of any underlying Fidelity Central Funds.
G Expense ratios reflect operating expenses of the class. Expenses before reductions do not reflect amounts reimbursed by the investment adviser or reductions from brokerage service arrangements or reductions from other expense offset arrangements and do not represent the amount paid by the class during periods when reimbursements or reductions occur. Expenses net of fee waivers reflect expenses after reimbursement by the investment adviser but prior to reductions from brokerage service arrangements or other expense offset arrangements. Expenses net of all reductions represent the net expenses paid by the class.
H Amount does not include the portfolio activity of any underlying Fidelity Central Funds.
See accompanying notes which are an integral part of the financial statements.
Fidelity International Growth Fund Class Z
| Years ended October 31, | 2018 | 2017 | 2016 | 2015 | 2014 |
| Selected Per–Share Data | | | | | |
| Net asset value, beginning of period | $13.45 | $10.97 | $11.38 | $11.10 | $10.84 |
| Income from Investment Operations | | | | | |
| Net investment income (loss)A | .15 | .13 | .16B | .12 | .14 |
| Net realized and unrealized gain (loss) | (.91) | 2.50 | (.47) | .27 | .19 |
| Total from investment operations | (.76) | 2.63 | (.31) | .39 | .33 |
| Distributions from net investment income | (.10) | (.15) | (.09) | (.11) | (.06) |
| Distributions from net realized gain | (.02) | – | (.01) | – | (.01) |
| Total distributions | (.12) | (.15) | (.10) | (.11) | (.07) |
| Redemption fees added to paid in capitalA | – | – | – | – | – |
| Net asset value, end of period | $12.57 | $13.45 | $10.97 | $11.38 | $11.10 |
| Total ReturnC | (5.71)% | 24.33% | (2.73)% | 3.52% | 3.07% |
| Ratios to Average Net AssetsD,E | | | | | |
| Expenses before reductions | .80% | .84% | .85% | .84% | .88% |
| Expenses net of fee waivers, if any | .80% | .84% | .85% | .84% | .88% |
| Expenses net of all reductions | .79% | .84% | .84% | .83% | .88% |
| Net investment income (loss) | 1.08% | 1.05% | 1.48%B | 1.07% | 1.30% |
| Supplemental Data | | | | | |
| Net assets, end of period (000 omitted) | $556,558 | $373,878 | $16,977 | $897 | $104 |
| Portfolio turnover rateF | 34% | 22% | 29% | 26% | 27% |
A Calculated based on average shares outstanding during the period.
B Net investment income per share reflects a large, non-recurring dividend which amounted to $.04 per share. Excluding this non-recurring dividend, the ratio of net investment income (loss) to average net assets would have been 1.10%.
C Total returns would have been lower if certain expenses had not been reduced during the applicable periods shown.
D Fees and expenses of any underlying Fidelity Central Funds are not included in the Fund's expense ratio. The Fund indirectly bears its proportionate share of the expenses of any underlying Fidelity Central Funds.
E Amount represents less than $.005 per share.
F Amount does not include the portfolio activity of any underlying Fidelity Central Funds.
See accompanying notes which are an integral part of the financial statements.
Notes to Financial Statements
For the period ended October 31, 2018
1. Organization.
Fidelity International Growth Fund (the Fund) is a fund of Fidelity Investment Trust (the Trust) and is authorized to issue an unlimited number of shares. The Trust is registered under the Investment Company Act of 1940, as amended (the 1940 Act), as an open-end management investment company organized as a Massachusetts business trust. The Fund offers Class A, Class M, Class C, International Growth, Class I and Class Z shares, each of which has equal rights as to assets and voting privileges. Each class has exclusive voting rights with respect to matters that affect that class.
2. Investments in Fidelity Central Funds.
The Fund invests in Fidelity Central Funds, which are open-end investment companies generally available only to other investment companies and accounts managed by the investment adviser and its affiliates. The Fund's Schedule of Investments lists each of the Fidelity Central Funds held as of period end, if any, as an investment of the Fund, but does not include the underlying holdings of each Fidelity Central Fund. As an Investing Fund, the Fund indirectly bears its proportionate share of the expenses of the underlying Fidelity Central Funds.
The Money Market Central Funds seek preservation of capital and current income and are managed by Fidelity Investments Money Management, Inc. (FIMM), an affiliate of the investment adviser. Annualized expenses of the Money Market Central Funds as of their most recent shareholder report date are less than .005%.
A complete unaudited list of holdings for each Fidelity Central Fund is available upon request or at the Securities and Exchange Commission (the SEC) website at www.sec.gov. In addition, the financial statements of the Fidelity Central Funds, which are not covered by the Fund's Report of Independent Registered Public Accounting Firm, are available on the SEC website or upon request.
3. Significant Accounting Policies.
The Fund is an investment company and applies the accounting and reporting guidance of the Financial Accounting Standards Board (FASB) Accounting Standards Codification Topic 946 Financial Services – Investments Companies. The financial statements have been prepared in conformity with accounting principles generally accepted in the United States of America (GAAP), which require management to make certain estimates and assumptions at the date of the financial statements. Actual results could differ from those estimates. Subsequent events, if any, through the date that the financial statements were issued have been evaluated in the preparation of the financial statements. The following summarizes the significant accounting policies of the Fund:
Investment Valuation. Investments are valued as of 4:00 p.m. Eastern time on the last calendar day of the period. The Board of Trustees (the Board) has delegated the day to day responsibility for the valuation of the Fund's investments to the Fair Value Committee (the Committee) established by the Fund's investment adviser. In accordance with valuation policies and procedures approved by the Board, the Fund attempts to obtain prices from one or more third party pricing vendors or brokers to value its investments. When current market prices, quotations or currency exchange rates are not readily available or reliable, investments will be fair valued in good faith by the Committee, in accordance with procedures adopted by the Board. Factors used in determining fair value vary by investment type and may include market or investment specific events. The frequency with which these procedures are used cannot be predicted and they may be utilized to a significant extent. The Committee oversees the Fund's valuation policies and procedures and reports to the Board on the Committee's activities and fair value determinations. The Board monitors the appropriateness of the procedures used in valuing the Fund's investments and ratifies the fair value determinations of the Committee.
The Fund categorizes the inputs to valuation techniques used to value its investments into a disclosure hierarchy consisting of three levels as shown below:
- Level 1 – quoted prices in active markets for identical investments
- Level 2 – other significant observable inputs (including quoted prices for similar investments, interest rates, prepayment speeds, etc.)
- Level 3– unobservable inputs (including the Fund's own assumptions based on the best information available)
Valuation techniques used to value the Fund's investments by major category are as follows:
Equity securities, including restricted securities, for which market quotations are readily available, are valued at the last reported sale price or official closing price as reported by a third party pricing vendor on the primary market or exchange on which they are traded and are categorized as Level 1 in the hierarchy. In the event there were no sales during the day or closing prices are not available, securities are valued at the last quoted bid price or may be valued using the last available price and are generally categorized as Level 2 in the hierarchy. For foreign equity securities, when market or security specific events arise, comparisons to the valuation of American Depositary Receipts (ADRs), futures contracts, Exchange-Traded Funds (ETFs) and certain indexes as well as quoted prices for similar securities may be used and would be categorized as Level 2 in the hierarchy. Utilizing these techniques may result in transfers between Level 1 and Level 2. For equity securities, including restricted securities, where observable inputs are limited, assumptions about market activity and risk are used and these securities may be categorized as Level 3 in the hierarchy.
Investments in open-end mutual funds, including the Fidelity Central Funds, are valued at their closing net asset value (NAV) each business day and are categorized as Level 1 in the hierarchy.
Changes in valuation techniques may result in transfers in or out of an assigned level within the disclosure hierarchy. The aggregate value of investments by input level as of October 31, 2018, including information on transfers between Levels 1 and 2 is included at the end of the Fund's Schedule of Investments.
Foreign Currency. The Fund may use foreign currency contracts to facilitate transactions in foreign-denominated securities. Gains and losses from these transactions may arise from changes in the value of the foreign currency or if the counterparties do not perform under the contracts' terms.
Foreign-denominated assets, including investment securities, and liabilities are translated into U.S. dollars at the exchange rates at period end. Purchases and sales of investment securities, income and dividends received and expenses denominated in foreign currencies are translated into U.S. dollars at the exchange rate in effect on the transaction date.
The effects of exchange rate fluctuations on investments are included with the net realized and unrealized gain (loss) on investment securities. Other foreign currency transactions resulting in realized and unrealized gain (loss) are disclosed separately.
Investment Transactions and Income. For financial reporting purposes, the Fund's investment holdings and NAV include trades executed through the end of the last business day of the period. The NAV per share for processing shareholder transactions is calculated as of the close of business of the New York Stock Exchange (NYSE), normally 4:00 p.m. Eastern time and includes trades executed through the end of the prior business day. Gains and losses on securities sold are determined on the basis of identified cost and include proceeds received from litigation. Dividend income is recorded on the ex-dividend date, except for certain dividends from foreign securities where the ex-dividend date may have passed, which are recorded as soon as the Fund is informed of the ex-dividend date. Non-cash dividends included in dividend income, if any, are recorded at the fair market value of the securities received. Income and capital gain distributions from Fidelity Central Funds, if any, are recorded on the ex-dividend date. Certain distributions received by the Fund represent a return of capital or capital gain. The Fund determines the components of these distributions subsequent to the ex-dividend date, based upon receipt of tax filings or other correspondence relating to the underlying investment. These distributions are recorded as a reduction of cost of investments and/or as a realized gain. Investment income is recorded net of foreign taxes withheld where recovery of such taxes is uncertain.
Class Allocations and Expenses. Investment income, realized and unrealized capital gains and losses, common expenses of the Fund, and certain fund-level expense reductions, if any, are allocated daily on a pro-rata basis to each class based on the relative net assets of each class to the total net assets of the Fund. Each class differs with respect to transfer agent and distribution and service plan fees incurred. Certain expense reductions may also differ by class. For the reporting period, the allocated portion of income and expenses to each class as a percent of its average net assets may vary due to the timing of recording these transactions in relation to fluctuating net assets of the classes. Expenses directly attributable to a fund are charged to that fund. Expenses attributable to more than one fund are allocated among the respective funds on the basis of relative net assets or other appropriate methods. Expense estimates are accrued in the period to which they relate and adjustments are made when actual amounts are known.
Income Tax Information and Distributions to Shareholders. Each year, the Fund intends to qualify as a regulated investment company under Subchapter M of the Internal Revenue Code, including distributing substantially all of its taxable income and realized gains. As a result, no provision for U.S. Federal income taxes is required. As of October 31, 2018, the Fund did not have any unrecognized tax benefits in the financial statements; nor is the Fund aware of any tax positions for which it is reasonably possible that the total amounts of unrecognized tax benefits will significantly change in the next twelve months. The Fund files a U.S. federal tax return, in addition to state and local tax returns as required. The Fund's federal income tax returns are subject to examination by the Internal Revenue Service (IRS) for a period of three fiscal years after they are filed. State and local tax returns may be subject to examination for an additional fiscal year depending on the jurisdiction. Foreign taxes are provided for based on the Fund's understanding of the tax rules and rates that exist in the foreign markets in which it invests.
Distributions are declared and recorded on the ex-dividend date. Income and capital gain distributions are declared separately for each class. Income and capital gain distributions are determined in accordance with income tax regulations, which may differ from GAAP. In addition, the Fund claimed a portion of the payment made to redeeming shareholders as a distribution for income tax purposes.
Capital accounts within the financial statements are adjusted for permanent book-tax differences. These adjustments have no impact on net assets or the results of operations. Capital accounts are not adjusted for temporary book-tax differences which will reverse in a subsequent period.
Book-tax differences are primarily due to foreign currency transactions, certain foreign taxes, passive foreign investment companies (PFIC), capital loss carryforwards and losses deferred due to wash sales.
As of period end, the cost and unrealized appreciation (depreciation) in securities, and derivatives if applicable, for federal income tax purposes were as follows:
| Gross unrealized appreciation | $441,942,392 |
| Gross unrealized depreciation | (105,336,047) |
| Net unrealized appreciation (depreciation) | $336,606,345 |
| Tax Cost | $1,955,968,613 |
The tax-based components of distributable earnings as of period end were as follows:
| Undistributed ordinary income | $19,275,635 |
| Capital loss carryforward | $(84,264,210) |
| Net unrealized appreciation (depreciation) on securities and other investments | $336,450,152 |
Capital loss carryforwards are only available to offset future capital gains of the Fund to the extent provided by regulations and may be limited. Under the Regulated Investment Company Modernization Act of 2010 (the Act), the Fund is permitted to carry forward capital losses incurred in taxable years beginning after December 22, 2010 for an unlimited period and such capital losses are required to be used prior to any losses that expire. The capital loss carryforward information presented below, including any applicable limitation, is estimated as of fiscal period end and is subject to adjustment.
| No expiration | |
| Short-term | $(75,102,155) |
| Long-term | (9,162,055) |
| Total no expiration | $(84,264,210) |
The tax character of distributions paid was as follows:
| | October 31, 2018 | October 31, 2017 |
| Ordinary Income | $16,636,167 | $ 18,629,181 |
New Rule Issuance. During August 2018, the U.S. Securities and Exchange Commission issued Final Rule Release No. 33-10532, Disclosure Update and Simplification. This Final Rule includes amendments specific to registered investment companies that are intended to eliminate overlap in disclosure requirements between Regulation S-X and GAAP. In accordance with these amendments, certain line-items in the Fund's financial statements have been combined or removed for the current period as outlined in the table below.
| Financial Statement | Current Line-Item Presentation | Prior Line-Item Presentation |
| Statement of Assets and Liabilities | Total distributable earnings (loss) | Undistributed/Distributions in excess of/Accumulated net investment income (loss)
Accumulated/Undistributed net realized gain (loss)
Net unrealized appreciation (depreciation) |
| Statement of Changes in Net Assets | N/A - removed | Undistributed/Distributions in excess of/Accumulated net investment income (loss) end of period |
| Statement of Changes in Net Assets | Distributions to shareholders | Distributions to shareholders from net investment income
Distributions to shareholders from net realized gain |
| Distributions to Shareholders Note to Financial Statements | Distributions to shareholders | Distributions to shareholders from net investment income
Distributions to shareholders from net realized gain |
4. Purchases and Sales of Investments.
Purchases and sales of securities, other than short-term securities, aggregated $817,415,801 and $799,943,289, respectively.
5. Fees and Other Transactions with Affiliates.
Management Fee. Fidelity Management & Research Company (the investment adviser) and its affiliates provide the Fund with investment management related services for which the Fund pays a monthly management fee. The management fee is the sum of an individual fund fee rate that is based on an annual rate of .45% of the Fund's average net assets and an annualized group fee rate that averaged .24% during the period. The group fee rate is based upon the average net assets of all the mutual funds advised by the investment adviser, including any mutual funds previously advised by the investment adviser that are currently advised by Fidelity SelectCo, LLC, an affiliate of the investment adviser. The group fee rate decreases as assets under management increase and increases as assets under management decrease. In addition, the management fee is subject to a performance adjustment (up to a maximum of +/- .20% of the Fund's average net assets over a 36 month performance period). The upward or downward adjustment to the management fee is based on the relative investment performance of International Growth as compared to its benchmark index, the MSCI EAFE Growth Index, over the same 36 month performance period. For the reporting period, the total annual management fee rate, including the performance adjustment, was .69% of the Fund's average net assets. The performance adjustment included in the management fee rate may be higher or lower than the maximum performance adjustment rate due to the difference between the average net assets for the reporting and performance periods.
Distribution and Service Plan Fees. In accordance with Rule 12b-1 of the 1940 Act, the Fund has adopted separate Distribution and Service Plans for each class of shares. Certain classes pay Fidelity Distributors Corporation (FDC), an affiliate of the investment adviser, separate Distribution and Service Fees, each of which is based on an annual percentage of each class' average net assets. In addition, FDC may pay financial intermediaries for selling shares of the Fund and providing shareholder support services. For the period, the Distribution and Service Fee rates, total fees and amounts retained by FDC were as follows:
| | Distribution Fee | Service Fee | Total Fees | Retained by FDC |
| Class A | -% | .25% | $396,877 | $14,365 |
| Class M | .25% | .25% | 159,678 | 3,547 |
| Class C | .75% | .25% | 705,185 | 143,829 |
| | | | $1,261,740 | $161,741 |
Sales Load. FDC may receive a front-end sales charge of up to 5.75% for selling Class A shares and 3.50% for selling Class M shares, some of which is paid to financial intermediaries for selling shares of the Fund. Depending on the holding period, FDC may receive contingent deferred sales charges levied on Class A, Class M and Class C redemptions. The deferred sales charges are 1.00% for Class C shares, 1.00% for certain purchases of Class A shares and .25% for certain purchases of Class M shares.
For the period, sales charge amounts retained by FDC were as follows:
| | Retained by FDC |
| Class A | $90,521 |
| Class M | 8,492 |
| Class CA | 10,189 |
| | $109,202 |
A When Class C shares are initially sold, FDC pays commissions from its own resources to financial intermediaries through which the sales are made.
Transfer Agent Fees. Fidelity Investments Institutional Operations Company, Inc., (FIIOC), an affiliate of the investment adviser, is the transfer, dividend disbursing and shareholder servicing agent for each class of the Fund. FIIOC receives account fees and asset-based fees that vary according to the account size and type of account of the shareholders of the respective classes of the Fund, except for Class Z. FIIOC receives an asset-based fee of Class Z's average net assets. FIIOC pays for typesetting, printing and mailing of shareholder reports, except proxy statements.
For the period, transfer agent fees for each class were as follows:
| | Amount | % of Class-Level Average Net Assets |
| Class A | $363,270 | .23 |
| Class M | 88,795 | .28 |
| Class C | 162,658 | .23 |
| International Growth | 1,837,674 | .19 |
| Class I | 1,336,626 | .18 |
| Class Z | 224,821 | .05 |
| | $4,013,844 | |
Accounting and Security Lending Fees. Fidelity Service Company, Inc. (FSC), an affiliate of the investment adviser, maintains the Fund's accounting records. The accounting fee is based on the level of average net assets for each month. Under a separate contract, FSC administers the security lending program. The security lending fee is based on the number and duration of lending transactions. For the period, the fees were equivalent to an annual rate of .04%.
Brokerage Commissions. The Fund placed a portion of its portfolio transactions with brokerage firms which are affiliates of the investment adviser. Brokerage commissions are included in net realized gain (loss) and change in net unrealized appreciation (depreciation) in the Statement of Operations. The commissions paid to these affiliated firms were $3,788 for the period.
Interfund Lending Program. Pursuant to an Exemptive Order issued by the SEC, the Fund, along with other registered investment companies having management contracts with Fidelity Management & Research Company (FMR) or other affiliated entities of FMR, may participate in an interfund lending program. This program provides an alternative credit facility allowing the funds to borrow from, or lend money to, other participating affiliated funds. At period end, there were no interfund loans outstanding. The Fund's activity in this program during the period for which loans were outstanding was as follows:
| Borrower or Lender | Average Loan Balance | Weighted Average Interest Rate | Interest Expense |
| Borrower | $40,450,167 | 1.90% | $12,804 |
Interfund Trades. The Fund may purchase from or sell securities to other Fidelity Funds under procedures adopted by the Board. The procedures have been designed to ensure these interfund trades are executed in accordance with Rule 17a-7 of the 1940 Act. Interfund trades are included within the respective purchases and sales amounts shown in the Purchases and Sales of Investments note.
Other. During the period, the investment adviser reimbursed the Fund for certain losses in the amount of $113,811.
6. Committed Line of Credit.
The Fund participates with other funds managed by the investment adviser or an affiliate in a $4.25 billion credit facility (the "line of credit") to be utilized for temporary or emergency purposes to fund shareholder redemptions or for other short-term liquidity purposes. The Fund has agreed to pay commitment fees on its pro-rata portion of the line of credit, which amounted to $6,672 and is reflected in Miscellaneous expenses on the Statement of Operations. During the period, the Fund did not borrow on this line of credit.
7. Security Lending.
The Fund lends portfolio securities through a lending agent from time to time in order to earn additional income. For equity securities, a lending agent is used and may loan securities to certain qualified borrowers, including Fidelity Capital Markets (FCM), a broker-dealer affiliated with the Fund. On the settlement date of the loan, the Fund receives collateral (in the form of U.S. Treasury obligations, letters of credit and/or cash) against the loaned securities and maintains collateral in an amount not less than 100% of the market value of the loaned securities during the period of the loan. The market value of the loaned securities is determined at the close of business of the Fund and any additional required collateral is delivered to the Fund on the next business day. The Fund or borrower may terminate the loan at any time, and if the borrower defaults on its obligation to return the securities loaned because of insolvency or other reasons, the Fund may apply collateral received from the borrower against the obligation. The Fund may experience delays and costs in recovering the securities loaned. Any cash collateral received is invested in the Fidelity Securities Lending Cash Central Fund. The value of loaned securities and cash collateral at period end are disclosed on the Fund's Statement of Assets and Liabilities. At period end, there were no security loans outstanding with FCM. Security lending income represents the income earned on investing cash collateral, less rebates paid to borrowers and any lending agent fees associated with the loan, plus any premium payments received for lending certain types of securities. Security lending income is presented in the Statement of Operations as a component of income from Fidelity Central Funds. Total security lending income during the period amounted to $462,892, including $670 from securities loaned to FCM.
8. Expense Reductions.
Commissions paid to certain brokers with whom the investment adviser, or its affiliates, places trades on behalf of the Fund include an amount in addition to trade execution, which may be rebated back to the Fund to offset certain expenses. This amount totaled $246,329 for the period. Through arrangements with the Fund's custodian credits realized as a result of certain uninvested cash balances were used to reduce the Fund's expenses. During the period, these credits reduced the Fund's expenses by $1,271.
In addition, during the period the investment adviser reimbursed and/or waived a portion of fund-level operating expenses in the amount of $23,847.
9. Distributions to Shareholders.
Distributions to shareholders of each class were as follows:
| | Year ended
October 31, 2018 | Year ended
October 31, 2017 |
| Distributions to shareholders | | |
| Class A | $667,281 | $– |
| Class M | 48,590 | – |
| International Growth | 6,746,881 | – |
| Class I | 5,822,889 | – |
| Class Z | 3,350,526 | – |
| Total | $16,636,167 | $– |
| From net investment income | | |
| Class A | $– | $1,997,030 |
| Class M | – | 186,824 |
| Class C | – | 77,926 |
| International Growth | – | 11,653,320 |
| Class I | – | 4,492,180 |
| Class Z | – | 221,901 |
| Total | $– | $18,629,181 |
10. Share Transactions.
Share transactions for each class were as follows and may contain automatic conversions between classes or exchanges between affiliated funds:
| | Shares | Shares | Dollars | Dollars |
| | Year ended October 31, 2018 | Year ended October 31, 2017 | Year ended October 31, 2018 | Year ended October 31, 2017 |
| Class A | | | | |
| Shares sold | 2,575,636 | 4,137,031 | $35,129,838 | $48,223,768 |
| Reinvestment of distributions | 49,581 | 187,295 | 663,775 | 1,972,221 |
| Shares redeemed | (3,261,091) | (12,953,360) | (44,291,373) | (147,524,032) |
| Net increase (decrease) | (635,874) | (8,629,034) | $(8,497,760) | $(97,328,043) |
| Class M | | | | |
| Shares sold | 349,635 | 634,763 | $4,771,254 | $7,389,758 |
| Reinvestment of distributions | 3,624 | 17,518 | 48,527 | 184,470 |
| Shares redeemed | (748,765) | (705,137) | (10,142,042) | (8,346,528) |
| Net increase (decrease) | (395,506) | (52,856) | $(5,322,261) | $(772,300) |
| Class C | | | | |
| Shares sold | 1,082,980 | 1,572,029 | $14,574,249 | $18,704,209 |
| Reinvestment of distributions | – | 7,327 | – | 76,279 |
| Shares redeemed | (1,386,849) | (1,259,133) | (18,440,770) | (14,766,822) |
| Net increase (decrease) | (303,869) | 320,223 | $(3,866,521) | $4,013,666 |
| International Growth | | | | |
| Shares sold | 19,748,706 | 28,743,527 | $271,435,270 | $341,195,764 |
| Reinvestment of distributions | 469,327 | 929,056 | 6,314,733 | 9,838,706 |
| Shares redeemed | (27,217,331) | (52,869,764) | (371,174,329) | (601,819,958) |
| Net increase (decrease) | (6,999,298) | (23,197,181) | $(93,424,326) | $(250,785,488) |
| Class I | | | | |
| Shares sold | 23,675,678 | 38,959,806 | $322,195,941 | $465,525,076 |
| Reinvestment of distributions | 352,717 | 415,087 | 4,735,014 | 4,387,467 |
| Shares redeemed | (25,574,189) | (17,997,694) | (351,174,190) | (214,014,368) |
| Net increase (decrease) | (1,545,794) | 21,377,199 | $(24,243,235) | $255,898,175 |
| Class Z | | | | |
| Shares sold | 27,518,013 | 35,134,319 | $376,275,009 | $405,268,628 |
| Reinvestment of distributions | 140,992 | 20,974 | 1,894,059 | 221,901 |
| Shares redeemed | (11,179,068) | (8,913,102) | (147,776,486) | (105,624,601) |
| Net increase (decrease) | 16,479,937 | 26,242,191 | $230,392,582 | $299,865,928 |
11. Other.
The Fund's organizational documents provide former and current trustees and officers with a limited indemnification against liabilities arising in connection with the performance of their duties to the Fund. In the normal course of business, the Fund may also enter into contracts that provide general indemnifications. The Fund's maximum exposure under these arrangements is unknown as this would be dependent on future claims that may be made against the Fund. The risk of material loss from such claims is considered remote.
Report of Independent Registered Public Accounting Firm
To the Board of Trustees of Fidelity Investment Trust and Shareholders of Fidelity International Growth Fund:
Opinion on the Financial Statements
We have audited the accompanying statement of assets and liabilities, including the schedule of investments, of Fidelity International Growth Fund (one of the funds constituting Fidelity Investment Trust, referred to hereafter as the "Fund") as of October 31, 2018, the related statement of operations for the year ended October 31, 2018, the statement of changes in net assets for each of the two years in the period ended October 31, 2018, including the related notes, and the financial highlights for each of the five years in the period ended October 31, 2018 (collectively referred to as the “financial statements”). In our opinion, the financial statements present fairly, in all material respects, the financial position of the Fund as of October 31, 2018, the results of its operations for the year then ended, the changes in its net assets for each of the two years in the period ended October 31, 2018 and the financial highlights for each of the five years in the period ended October 31, 2018 in conformity with accounting principles generally accepted in the United States of America.
Basis for Opinion
These financial statements are the responsibility of the Fund’s management. Our responsibility is to express an opinion on the Fund’s financial statements based on our audits. We are a public accounting firm registered with the Public Company Accounting Oversight Board (United States) (“PCAOB”) and are required to be independent with respect to the Fund in accordance with the U.S. federal securities laws and the applicable rules and regulations of the Securities and Exchange Commission and the PCAOB.
We conducted our audits of these financial statements in accordance with the standards of the PCAOB. Those standards require that we plan and perform the audit to obtain reasonable assurance about whether the financial statements are free of material misstatement, whether due to error or fraud.
Our audits included performing procedures to assess the risks of material misstatement of the financial statements, whether due to error or fraud, and performing procedures that respond to those risks. Such procedures included examining, on a test basis, evidence regarding the amounts and disclosures in the financial statements. Our audits also included evaluating the accounting principles used and significant estimates made by management, as well as evaluating the overall presentation of the financial statements. Our procedures included confirmation of securities owned as of October 31, 2018 by correspondence with the custodian and brokers; when replies were not received from brokers, we performed other auditing procedures. We believe that our audits provide a reasonable basis for our opinion.
PricewaterhouseCoopers LLP
Boston, Massachusetts
December 18, 2018
We have served as the auditor of one or more investment companies in the Fidelity group of funds since 1932.
Trustees and Officers
The Trustees, Members of the Advisory Board (if any), and officers of the trust and fund, as applicable, are listed below. The Board of Trustees governs the fund and is responsible for protecting the interests of shareholders. The Trustees are experienced executives who meet periodically throughout the year to oversee the fund's activities, review contractual arrangements with companies that provide services to the fund, oversee management of the risks associated with such activities and contractual arrangements, and review the fund's performance. Except for Jonathan Chiel, each of the Trustees oversees 283 funds. Mr. Chiel oversees 154 funds.
The Trustees hold office without limit in time except that (a) any Trustee may resign; (b) any Trustee may be removed by written instrument, signed by at least two-thirds of the number of Trustees prior to such removal; (c) any Trustee who requests to be retired or who has become incapacitated by illness or injury may be retired by written instrument signed by a majority of the other Trustees; and (d) any Trustee may be removed at any special meeting of shareholders by a two-thirds vote of the outstanding voting securities of the trust. Each Trustee who is not an interested person (as defined in the 1940 Act) of the trust and the fund is referred to herein as an Independent Trustee. Each Independent Trustee shall retire not later than the last day of the calendar year in which his or her 75th birthday occurs. The Independent Trustees may waive this mandatory retirement age policy with respect to individual Trustees. Officers and Advisory Board Members hold office without limit in time, except that any officer or Advisory Board Member may resign or may be removed by a vote of a majority of the Trustees at any regular meeting or any special meeting of the Trustees. Except as indicated, each individual has held the office shown or other offices in the same company for the past five years.
The fund’s Statement of Additional Information (SAI) includes more information about the Trustees. To request a free copy, call Fidelity at 1-877-208-0098.
Experience, Skills, Attributes, and Qualifications of the Trustees. The Governance and Nominating Committee has adopted a statement of policy that describes the experience, qualifications, attributes, and skills that are necessary and desirable for potential Independent Trustee candidates (Statement of Policy). The Board believes that each Trustee satisfied at the time he or she was initially elected or appointed a Trustee, and continues to satisfy, the standards contemplated by the Statement of Policy. The Governance and Nominating Committee also engages professional search firms to help identify potential Independent Trustee candidates who have the experience, qualifications, attributes, and skills consistent with the Statement of Policy. From time to time, additional criteria based on the composition and skills of the current Independent Trustees, as well as experience or skills that may be appropriate in light of future changes to board composition, business conditions, and regulatory or other developments, have also been considered by the professional search firms and the Governance and Nominating Committee. In addition, the Board takes into account the Trustees' commitment and participation in Board and committee meetings, as well as their leadership of standing and ad hoc committees throughout their tenure.
In determining that a particular Trustee was and continues to be qualified to serve as a Trustee, the Board has considered a variety of criteria, none of which, in isolation, was controlling. The Board believes that, collectively, the Trustees have balanced and diverse experience, qualifications, attributes, and skills, which allow the Board to operate effectively in governing the fund and protecting the interests of shareholders. Information about the specific experience, skills, attributes, and qualifications of each Trustee, which in each case led to the Board's conclusion that the Trustee should serve (or continue to serve) as a trustee of the fund, is provided below.
Board Structure and Oversight Function. James C. Curvey is an interested person and currently serves as Chairman. The Trustees have determined that an interested Chairman is appropriate and benefits shareholders because an interested Chairman has a personal and professional stake in the quality and continuity of services provided to the fund. Independent Trustees exercise their informed business judgment to appoint an individual of their choosing to serve as Chairman, regardless of whether the Trustee happens to be independent or a member of management. The Independent Trustees have determined that they can act independently and effectively without having an Independent Trustee serve as Chairman and that a key structural component for assuring that they are in a position to do so is for the Independent Trustees to constitute a substantial majority for the Board. The Independent Trustees also regularly meet in executive session. Ned C. Lautenbach serves as Chairman of the Independent Trustees and as such (i) acts as a liaison between the Independent Trustees and management with respect to matters important to the Independent Trustees and (ii) with management prepares agendas for Board meetings.
Fidelity® funds are overseen by different Boards of Trustees. The fund's Board oversees Fidelity's high income and certain equity funds, and other Boards oversee Fidelity's investment-grade bond, money market, asset allocation, and other equity funds. The asset allocation funds may invest in Fidelity® funds overseen by the fund's Board. The use of separate Boards, each with its own committee structure, allows the Trustees of each group of Fidelity® funds to focus on the unique issues of the funds they oversee, including common research, investment, and operational issues. On occasion, the separate Boards establish joint committees to address issues of overlapping consequences for the Fidelity® funds overseen by each Board.
The Trustees operate using a system of committees to facilitate the timely and efficient consideration of all matters of importance to the Trustees, the fund, and fund shareholders and to facilitate compliance with legal and regulatory requirements and oversight of the fund's activities and associated risks. The Board, acting through its committees, has charged FMR and its affiliates with (i) identifying events or circumstances the occurrence of which could have demonstrably adverse effects on the fund's business and/or reputation; (ii) implementing processes and controls to lessen the possibility that such events or circumstances occur or to mitigate the effects of such events or circumstances if they do occur; and (iii) creating and maintaining a system designed to evaluate continuously business and market conditions in order to facilitate the identification and implementation processes described in (i) and (ii) above. Because the day-to-day operations and activities of the fund are carried out by or through FMR, its affiliates, and other service providers, the fund's exposure to risks is mitigated but not eliminated by the processes overseen by the Trustees. While each of the Board's committees has responsibility for overseeing different aspects of the fund's activities, oversight is exercised primarily through the Operations, Audit, and Compliance Committees. In addition, the Independent Trustees have worked with Fidelity to enhance the Board's oversight of investment and financial risks, legal and regulatory risks, technology risks, and operational risks, including the development of additional risk reporting to the Board. Appropriate personnel, including but not limited to the fund's Chief Compliance Officer (CCO), FMR's internal auditor, the independent accountants, the fund's Treasurer and portfolio management personnel, make periodic reports to the Board's committees, as appropriate, including an annual review of Fidelity's risk management program for the Fidelity® funds. The responsibilities of each standing committee, including their oversight responsibilities, are described further under "Standing Committees of the Trustees."
Interested Trustees*:
Correspondence intended for a Trustee who is an interested person may be sent to Fidelity Investments, 245 Summer Street, Boston, Massachusetts 02210.
Name, Year of Birth; Principal Occupations and Other Relevant Experience+
Jonathan Chiel (1957)
Year of Election or Appointment: 2016
Trustee
Mr. Chiel also serves as Trustee of other Fidelity® funds. Mr. Chiel is Executive Vice President and General Counsel for FMR LLC (diversified financial services company, 2012-present). Previously, Mr. Chiel served as general counsel (2004-2012) and senior vice president and deputy general counsel (2000-2004) for John Hancock Financial Services; a partner with Choate, Hall & Stewart (1996-2000) (law firm); and an Assistant United States Attorney for the United States Attorney’s Office of the District of Massachusetts (1986-95), including Chief of the Criminal Division (1993-1995). Mr. Chiel is a director on the boards of the Boston Bar Foundation and the Maimonides School.
James C. Curvey (1935)
Year of Election or Appointment: 2007
Trustee
Chairman of the Board of Trustees
Mr. Curvey also serves as Trustee of other Fidelity® funds. Mr. Curvey is Vice Chairman (2007-present) and Director of FMR LLC (diversified financial services company). In addition, Mr. Curvey is an Overseer Emeritus for the Boston Symphony Orchestra, a Director of Artis-Naples, and a Trustee of Brewster Academy in Wolfeboro, New Hampshire. Previously, Mr. Curvey served as a Director of Fidelity Research & Analysis Co. (investment adviser firm, 2009-2018), Director of Fidelity Investments Money Management, Inc. (investment adviser firm, 2009-2014) and a Director of FMR and FMR Co., Inc. (investment adviser firms, 2007-2014).
Charles S. Morrison (1960)
Year of Election or Appointment: 2014
Trustee
Mr. Morrison also serves as Trustee of other funds. He serves as President of Fidelity SelectCo, LLC (investment adviser firm, 2017-present) and Fidelity Management & Research Company (FMR) (investment adviser firm, 2016-present), a Director of Fidelity Investments Money Management, Inc. (FIMM) (investment adviser firm, 2014-present), Director of Fidelity SelectCo, LLC (investment adviser firm, 2014-present), President, Asset Management (2014-present), and is an employee of Fidelity Investments. Previously, Mr. Morrison served as Vice President of Fidelity's Fixed Income and Asset Allocation Funds (2012-2014), President, Fixed Income (2011-2014), Vice President of Fidelity's Money Market Funds (2005-2009), President, Money Market Group Leader of FMR (investment adviser firm, 2009), and Senior Vice President, Money Market Group of FMR (2004-2009). Mr. Morrison also served as Vice President of Fidelity's Bond Funds (2002-2005), certain Balanced Funds (2002-2005), and certain Asset Allocation Funds (2002-2007), and as Senior Vice President (2002-2005) of Fidelity's Bond Division.
* Determined to be an “Interested Trustee” by virtue of, among other things, his or her affiliation with the trust or various entities under common control with FMR.
+ The information includes the Trustee's principal occupation during the last five years and other information relating to the experience, attributes, and skills relevant to the Trustee's qualifications to serve as a Trustee, which led to the conclusion that the Trustee should serve as a Trustee for the fund.
Independent Trustees:
Correspondence intended for an Independent Trustee may be sent to Fidelity Investments, P.O. Box 55235, Boston, Massachusetts 02205-5235.
Name, Year of Birth; Principal Occupations and Other Relevant Experience+
Dennis J. Dirks (1948)
Year of Election or Appointment: 2005
Trustee
Mr. Dirks also serves as Trustee of other Fidelity® funds. Prior to his retirement in May 2003, Mr. Dirks was Chief Operating Officer and a member of the Board of The Depository Trust & Clearing Corporation (DTCC). He also served as President, Chief Operating Officer, and Board member of The Depository Trust Company (DTC) and President and Board member of the National Securities Clearing Corporation (NSCC). In addition, Mr. Dirks served as Chief Executive Officer and Board member of the Government Securities Clearing Corporation, Chief Executive Officer and Board member of the Mortgage-Backed Securities Clearing Corporation, as a Trustee and a member of the Finance Committee of Manhattan College (2005-2008), as a Trustee and a member of the Finance Committee of AHRC of Nassau County (2006-2008), as a member of the Independent Directors Council (IDC) Governing Council (2010-2015), and as a member of the Board of Directors for The Brookville Center for Children’s Services, Inc. (2009-2017). Mr. Dirks is a member of the Finance Committee (2016-present), Board of Directors (2017-present) and Board of Trustees (2018-present) and is Treasurer (2018-present) of the Asolo Repertory Theatre.
Donald F. Donahue (1950)
Year of Election or Appointment: 2018
Trustee
Mr. Donahue also serves as a Trustee of other Fidelity® funds. Mr. Donahue is President and Chief Executive Officer of Miranda Partners, LLC (risk consulting for the financial services industry, 2012-present). Previously, Mr. Donahue served as a Member of the Advisory Board of certain Fidelity® funds (2015-2018) and Chief Executive Officer (2006-2012), Chief Operating Officer (2003-2006), and Managing Director, Customer Marketing and Development (1999-2003) of The Depository Trust & Clearing Corporation (financial markets infrastructure). Mr. Donahue serves as a Member (2007-present) and Co-Chairman (2016-present) of the Board of Directors of United Way of New York, Member of the Board of Directors of NYC Leadership Academy (2012-present) and Member of the Board of Advisors of Ripple Labs, Inc. (financial services, 2015-present). He also served as Chairman (2010-2012) and Member of the Board of Directors (2012-2013) of Omgeo, LLC (financial services), Treasurer of United Way of New York (2012-2016), and Member of the Board of Directors of XBRL US (financial services non-profit, 2009-2012) and the International Securities Services Association (2009-2012).
Alan J. Lacy (1953)
Year of Election or Appointment: 2008
Trustee
Mr. Lacy also serves as Trustee of other Fidelity® funds. Mr. Lacy serves as a Director of Bristol-Myers Squibb Company (global pharmaceuticals, 2008-present). He is a Trustee of the California Chapter of The Nature Conservancy (2015-present) and a Director of the Center for Advanced Study in the Behavioral Sciences at Stanford University (2015-present). In addition, Mr. Lacy served as Senior Adviser (2007-2014) of Oak Hill Capital Partners, L.P. (private equity) and also served as Chief Executive Officer (2005) and Vice Chairman (2005-2006) of Sears Holdings Corporation (retail) and Chief Executive Officer and Chairman of the Board of Sears, Roebuck and Co. (retail, 2000-2005). Previously, Mr. Lacy served as Chairman (2014-2017) and a member (2010-2017) of the Board of Directors of Dave & Buster’s Entertainment, Inc. (restaurant and entertainment complexes), as Chairman (2008-2011) and a member (2006-2015) of the Board of Trustees of the National Parks Conservation Association, and as a member of the Board of Directors for The Hillman Companies, Inc. (hardware wholesalers, 2010-2014), Earth Fare, Inc. (retail grocery, 2010-2014), and The Western Union Company (global money transfer, 2006-2011).
Ned C. Lautenbach (1944)
Year of Election or Appointment: 2000
Trustee
Chairman of the Independent Trustees
Mr. Lautenbach also serves as Trustee of other Fidelity® funds. Mr. Lautenbach currently serves as Vice Chair of the Board of Governors, State University System of Florida (2013-present) and is a member of the Council on Foreign Relations (1994-present). He is also a member and has most recently served as Chairman of the Board of Directors of Artis-Naples (2012-present). Previously, Mr. Lautenbach served as a member and then Lead Director of the Board of Directors of Eaton Corporation (diversified industrial, 1997-2016). He was also a Partner and Advisory Partner at Clayton, Dubilier & Rice, LLC (private equity investment, 1998-2010), as well as a Director of Sony Corporation (2006-2007). In addition, Mr. Lautenbach also had a 30-year career with IBM (technology company) during which time he served as Senior Vice President and a member of the Corporate Executive Committee (1968-1998).
Joseph Mauriello (1944)
Year of Election or Appointment: 2008
Trustee
Mr. Mauriello also serves as Trustee of other Fidelity® funds. Prior to his retirement in January 2006, Mr. Mauriello served in numerous senior management positions including Deputy Chairman and Chief Operating Officer (2004-2005), and Vice Chairman of Financial Services (2002-2004) of KPMG LLP US (professional services, 1965-2005). Mr. Mauriello currently serves as a member of the Independent Directors Council (IDC) Governing Council (2015-present). Previously, Mr. Mauriello served as a member of the Board of Directors of XL Group plc. (global insurance and re-insurance, 2006-2018).
Cornelia M. Small (1944)
Year of Election or Appointment: 2005
Trustee
Ms. Small also serves as Trustee of other Fidelity® funds. Ms. Small is a member of the Board of Directors (2009-present) and Chair of the Investment Committee (2010-present) of the Teagle Foundation. Ms. Small also serves on the Investment Committee of the Berkshire Taconic Community Foundation (2008-present). Previously, Ms. Small served as Chairperson (2002-2008) and a member of the Investment Committee and Chairperson (2008-2012) and a member of the Board of Trustees of Smith College. In addition, Ms. Small served as Chief Investment Officer, Director of Global Equity Investments, and a member of the Board of Directors of Scudder, Stevens & Clark and Scudder Kemper Investments.
Garnett A. Smith (1947)
Year of Election or Appointment: 2018
Trustee
Mr. Smith also serves as Trustee of other Fidelity® funds. Prior to Mr. Smith's retirement, he served as Chairman and Chief Executive Officer of Inbrand Corp. (manufacturer of personal absorbent products, 1990-1997). He also served as President (1986-1990) of Inbrand Corp. Prior to his employment with Inbrand Corp., he was employed by a retail fabric chain and North Carolina National Bank. In addition, Mr. Smith served as a Member of the Advisory Board of certain Fidelity® funds (2012-2013) and as a board member of the Jackson Hole Land Trust (2009-2012).
David M. Thomas (1949)
Year of Election or Appointment: 2008
Trustee
Mr. Thomas also serves as Trustee of other Fidelity® funds. Mr. Thomas serves as Non-Executive Chairman of the Board of Directors of Fortune Brands Home and Security (home and security products, 2011-present), as a member of the Board of Directors (2004-present) and Presiding Director (2013-present) of Interpublic Group of Companies, Inc. (marketing communication), and as a member of the Board of Trustees of the University of Florida (2013-present). Previously, Mr. Thomas served as Executive Chairman (2005-2006) and Chairman and Chief Executive Officer (2000-2005) of IMS Health, Inc. (pharmaceutical and healthcare information solutions), and a Director of Fortune Brands, Inc. (consumer products, 2000-2011).
+ The information includes the Trustee's principal occupation during the last five years and other information relating to the experience, attributes, and skills relevant to the Trustee's qualifications to serve as a Trustee, which led to the conclusion that the Trustee should serve as a Trustee for the fund.
Advisory Board Members and Officers:
Correspondence intended for a Member of the Advisory Board (if any) may be sent to Fidelity Investments, P.O. Box 55235, Boston, Massachusetts 02205-5235. Correspondence intended for an officer or Peter S. Lynch may be sent to Fidelity Investments, 245 Summer Street, Boston, Massachusetts 02210. Officers appear below in alphabetical order.
Name, Year of Birth; Principal Occupation
Vicki L. Fuller (1957)
Year of Election or Appointment: 2018
Member of the Advisory Board
Ms. Fuller also serves as Member of the Advisory Board of other Fidelity® funds. Ms. Fuller serves as a member of the Board of Directors, Audit Committee, and Nominating and Governance Committee of The Williams Companies, Inc. (natural gas infrastructure, 2018-present). Previously, Ms. Fuller served as the Chief Investment Officer of the New York State Common Retirement Fund (2012-2018) and held a variety of positions at AllianceBernstein L.P. (global asset management, 1985-2012), including Managing Director (2006-2012) and Senior Vice President and Senior Portfolio Manager (2001-2006).
Peter S. Lynch (1944)
Year of Election or Appointment: 2003
Member of the Advisory Board
Mr. Lynch also serves as Member of the Advisory Board of other Fidelity® funds. Mr. Lynch is Vice Chairman and a Director of FMR (investment adviser firm) and FMR Co., Inc. (investment adviser firm). In addition, Mr. Lynch serves as a Trustee of Boston College and as the Chairman of the Inner-City Scholarship Fund. Previously, Mr. Lynch served on the Special Olympics International Board of Directors (1997-2006).
William S. Stavropoulos (1939)
Year of Election or Appointment: 2018
Member of the Advisory Board
Mr. Stavropoulos also serves as Member of the Advisory Board of other Fidelity® funds. Mr. Stavropoulos serves as President and Founder of the Michigan Baseball Foundation, the Great Lakes Loons (2007-present). Mr. Stavropoulos is Chairman Emeritus of the Board of Directors of The Dow Chemical Company, where he previously served in numerous senior management positions, including President, CEO (1995-2000; 2002-2004), Chairman of the Executive Committee (2000-2006), and as a member of the Board of Directors (1990-2006). Currently, Mr. Stavropoulos is Chairman of the Board of Directors of Univar Inc. (global distributor of commodity and specialty chemicals), a Director of Teradata Corporation (data warehousing and technology solutions), and a member of the Advisory Board for Metalmark Capital LLC (private equity investment, 2005-present). Mr. Stavropoulos is an operating advisor to Clayton, Dubilier & Rice, LLC (private equity investment). In addition, Mr. Stavropoulos is a member of the University of Notre Dame Advisory Council for the College of Science, a Trustee of the Rollin L. Gerstacker Foundation, and a Director of Artis-Naples in Naples, Florida. Previously, Mr. Stavropoulos served as Trustee of certain Fidelity® funds (2001-2018) and as a Director of Chemical Financial Corporation (bank holding company, 1993-2012) and Tyco International, Ltd. (multinational manufacturing and services, 2007-2012).
Carol B. Tomé (1957)
Year of Election or Appointment: 2018
Member of the Advisory Board
Ms. Tomé also serves as Member of the Advisory Board of other Fidelity® funds. Ms. Tomé is Chief Financial Officer (2001-present) and Executive Vice President of Corporate Services (2007-present) of The Home Depot, Inc. (home improvement retailer) and a Director (2003-present) and Chair of the Audit Committee (2004-present) of United Parcel Service, Inc. (package delivery and supply chain management). Previously, Ms. Tomé served as Trustee of certain Fidelity® funds (2017), Senior Vice President of Finance and Accounting/Treasurer (2000-2007) and Vice President and Treasurer (1995-2000) of The Home Depot, Inc. and Chair of the Board (2010-2012), Vice Chair of the Board (2009 and 2013), and a Director (2008-2013) of the Federal Reserve Bank of Atlanta. Ms. Tomé is also a director or trustee of many community and professional organizations.
Michael E. Wiley (1950)
Year of Election or Appointment: 2018
Member of the Advisory Board
Mr. Wiley also serves as Trustee or Member of the Advisory Board of other Fidelity® funds. Mr. Wiley serves as a Director of High Point Resources (exploration and production, 2005-present). Previously, Mr. Wiley served as a Director of Andeavor Corporation (independent oil refiner and marketer, 2005-2018), a Director of Andeavor Logistics LP (natural resources logistics, 2015-2018), a Director of Post Oak Bank (privately-held bank, 2004-2018), a Director of Asia Pacific Exploration Consolidated (international oil and gas exploration and production, 2008-2013), a member of the Board of Trustees of the University of Tulsa (2000-2006; 2007-2010), a Senior Energy Advisor of Katzenbach Partners, LLC (consulting, 2006-2007), an Advisory Director of Riverstone Holdings (private investment), a Director of Spinnaker Exploration Company (exploration and production, 2001-2005) and Chairman, President, and CEO of Baker Hughes, Inc. (oilfield services, 2000-2004).
Elizabeth Paige Baumann (1968)
Year of Election or Appointment: 2017
Anti-Money Laundering (AML) Officer
Ms. Baumann also serves as AML Officer of other funds. She is Chief AML Officer (2012-present) and Senior Vice President (2014-present) of FMR LLC (diversified financial services company) and is an employee of Fidelity Investments. Previously, Ms. Baumann served as AML Officer of the funds (2012-2016), and Vice President (2007-2014) and Deputy Anti-Money Laundering Officer (2007-2012) of FMR LLC.
John J. Burke III (1964)
Year of Election or Appointment: 2018
Chief Financial Officer
Mr. Burke also serves as Chief Financial Officer of other funds. Mr. Burke serves as Head of Investment Operations for Fidelity Fund and Investment Operations (2018-present) and is an employee of Fidelity Investments (1998-present). Previously Mr. Burke served as head of Asset Management Investment Operations (2012-2018).
William C. Coffey (1969)
Year of Election or Appointment: 2018
Secretary and Chief Legal Officer (CLO)
Mr. Coffey also serves as Secretary and CLO of other funds. Mr. Coffey serves as CLO, Secretary, and Senior Vice President of Fidelity Management & Research Company and FMR Co., Inc. (investment adviser firms, 2018-present); Secretary of Fidelity SelectCo, LLC and Fidelity Investments Money Management, Inc. (investment adviser firms, 2018-present); and CLO of Fidelity Management & Research (Hong Kong) Limited, FMR Investment Management (UK) Limited, and Fidelity Management & Research (Japan) Limited (investment adviser firms, 2018-present). He is Senior Vice President and Deputy General Counsel of FMR LLC (diversified financial services company, 2010-present), and is an employee of Fidelity Investments. Previously, Mr. Coffey served as Assistant Secretary of certain funds (2009-2018) and as Vice President and Associate General Counsel of FMR LLC (2005-2009).
Timothy M. Cohen (1969)
Year of Election or Appointment: 2018
Vice President
Mr. Cohen also serves as Vice President of other funds. Mr. Cohen serves as Co-Head of Global Equity Research (2016-present), a Director of Fidelity Management & Research (Japan) Limited (investment adviser firm, 2016-present), and is an employee of Fidelity Investments. Previously, Mr. Cohen served as Chief Investment Officer - Equity and a Director of Fidelity Management & Research (U.K.) Inc. (investment adviser firm, 2013-2015) and as a Director of Fidelity Management & Research (Hong Kong) Limited (investment adviser firm, 2017).
Jonathan Davis (1968)
Year of Election or Appointment: 2010
Assistant Treasurer
Mr. Davis also serves as Assistant Treasurer of other funds. Mr. Davis serves as Assistant Treasurer of FMR Capital, Inc. (2017-present) and is an employee of Fidelity Investments. Previously, Mr. Davis served as Vice President and Associate General Counsel of FMR LLC (diversified financial services company, 2003-2010).
Adrien E. Deberghes (1967)
Year of Election or Appointment: 2016
Assistant Treasurer
Mr. Deberghes also serves as an officer of other funds. He serves as Assistant Treasurer of FMR Capital, Inc. (2017-present), Executive Vice President of Fidelity Investments Money Management, Inc. (FIMM) (investment adviser firm, 2016-present), and is an employee of Fidelity Investments (2008-present). Previously, Mr. Deberghes served as President and Treasurer of certain Fidelity® funds (2013-2018). Prior to joining Fidelity Investments, Mr. Deberghes was Senior Vice President of Mutual Fund Administration at State Street Corporation (2007-2008), Senior Director of Mutual Fund Administration at Investors Bank & Trust (2005-2007), and Director of Finance for Dunkin' Brands (2000-2005). Previously, Mr. Deberghes served in other fund officer roles.
Laura M. Del Prato (1964)
Year of Election or Appointment: 2018
Assistant Treasurer
Ms. Del Prato also serves as an officer of other funds. Ms. Del Prato is an employee of Fidelity Investments (2017-present). Prior to joining Fidelity Investments, Ms. Del Prato served as a Managing Director and Treasurer of the JPMorgan Mutual Funds (2014-2017). Prior to JPMorgan, Ms. Del Prato served as a partner at Cohen Fund Audit Services (accounting firm, 2012-2013) and KPMG LLP (accounting firm, 2004-2012).
Colm A. Hogan (1973)
Year of Election or Appointment: 2016
Deputy Treasurer
Mr. Hogan also serves as an officer of other funds. Mr. Hogan serves as Assistant Treasurer of FMR Capital, Inc. (2017-present) and is an employee of Fidelity Investments (2005-present). Previously, Mr. Hogan served as Assistant Treasurer of certain Fidelity® funds (2016-2018).
Pamela R. Holding (1964)
Year of Election or Appointment: 2018
Vice President
Ms. Holding also serves as Vice President of other funds. Ms. Holding serves as Co-Head of Global Equity Research (2018-present) and is an employee of Fidelity Investments (2013-present).
Chris Maher (1972)
Year of Election or Appointment: 2013
Assistant Treasurer
Mr. Maher serves as Assistant Treasurer of other funds. Mr. Maher is Vice President of Valuation Oversight, serves as Assistant Treasurer of FMR Capital, Inc. (2017-present), and is an employee of Fidelity Investments. Previously, Mr. Maher served as Vice President of Asset Management Compliance (2013), Vice President of the Program Management Group of FMR (investment adviser firm, 2010-2013), and Vice President of Valuation Oversight (2008-2010).
Rieco E. Mello (1969)
Year of Election or Appointment: 2017
Assistant Treasurer
Mr. Mello also serves as Assistant Treasurer of other funds. Mr. Mello serves as Assistant Treasurer of FMR Capital, Inc. (2017-present) and is an employee of Fidelity Investments (1995-present).
Kenneth B. Robins (1969)
Year of Election or Appointment: 2016
Chief Compliance Officer
Mr. Robins also serves as an officer of other funds. Mr. Robins serves as Compliance Officer of Fidelity Management & Research Company and FMR Co., Inc. (investment adviser firms, 2016-present) and is an employee of Fidelity Investments (2004-present). Previously, Mr. Robins served as Executive Vice President of Fidelity Investments Money Management, Inc. (investment adviser firm, 2013-2016) and served in other fund officer roles.
Stacie M. Smith (1974)
Year of Election or Appointment: 2016
President and Treasurer
Ms. Smith also serves as an officer of other funds. Ms. Smith serves as Assistant Treasurer of FMR Capital, Inc. (2017-present), is an employee of Fidelity Investments (2009-present), and has served in other fund officer roles. Prior to joining Fidelity Investments, Ms. Smith served as Senior Audit Manager of Ernst & Young LLP (accounting firm, 1996-2009). Previously, Ms. Smith served as Assistant Treasurer (2013-2018) and Deputy Treasurer (2013-2016) of certain Fidelity® funds.
Marc L. Spector (1972)
Year of Election or Appointment: 2016
Assistant Treasurer
Mr. Spector also serves as an officer of other funds. Mr. Spector serves as Assistant Treasurer of FMR Capital, Inc. (2017-present) and is an employee of Fidelity Investments (2016-present). Prior to joining Fidelity Investments, Mr. Spector served as Director at the Siegfried Group (accounting firm, 2013-2016), and prior to Siegfried Group as audit senior manager at Deloitte & Touche (accounting firm, 2005-2013).
Shareholder Expense Example
As a shareholder of the Fund, you incur two types of costs: (1) transaction costs, including sales charges (loads) on purchase payments or redemption proceeds, and (2) ongoing costs, including management fees, distribution and/or service (12b-1) fees and other Fund expenses. This Example is intended to help you understand your ongoing costs (in dollars) of investing in the Fund and to compare these costs with the ongoing costs of investing in other mutual funds.
The Example is based on an investment of $1,000 invested at the beginning of the period and held for the entire period (May 1, 2018 to October 31, 2018).
Actual Expenses
The first line of the accompanying table for each class of the Fund provides information about actual account values and actual expenses. You may use the information in this line, together with the amount you invested, to estimate the expenses that you paid over the period. Simply divide your account value by $1,000.00 (for example, an $8,600 account value divided by $1,000.00 = 8.6), then multiply the result by the number in the first line for a class of the Fund under the heading entitled "Expenses Paid During Period" to estimate the expenses you paid on your account during this period. A small balance maintenance fee of $12.00 that is charged once a year may apply for certain accounts with a value of less than $2,000. This fee, which was eliminated effective August 1, 2018, is not included in the table below. If it was, the estimate of expenses you paid during the period would be higher, and your ending account value lower, by this amount. In addition, the Fund, as a shareholder in the underlying Fidelity Central Funds, will indirectly bear its pro-rata share of the fees and expenses incurred by the underlying Fidelity Central Funds. These fees and expenses are not included in the Fund's annualized expense ratio used to calculate the expense estimate in the table below.
Hypothetical Example for Comparison Purposes
The second line of the accompanying table for each class of the Fund provides information about hypothetical account values and hypothetical expenses based on a Class' actual expense ratio and an assumed rate of return of 5% per year before expenses, which is not the Class' actual return. The hypothetical account values and expenses may not be used to estimate the actual ending account balance or expenses you paid for the period. You may use this information to compare the ongoing costs of investing in the Fund and other funds. To do so, compare this 5% hypothetical example with the 5% hypothetical examples that appear in the shareholder reports of the other funds. A small balance maintenance fee of $12.00 that is charged once a year may apply for certain accounts with a value of less than $2,000. This fee, which was eliminated effective August 1, 2018, is not included in the table below. If it was, the estimate of expenses you paid during the period would be higher, and your ending account value lower, by this amount. In addition, the Fund, as a shareholder in the underlying Fidelity Central Funds, will indirectly bear its pro-rata share of the fees and expenses incurred by the underlying Fidelity Central Funds. These fees and expenses are not included in the Fund's annualized expense ratio used to calculate the expense estimate in the table below.
Please note that the expenses shown in the table are meant to highlight your ongoing costs only and do not reflect any transaction costs. Therefore, the second line of the table is useful in comparing ongoing costs only, and will not help you determine the relative total costs of owning different funds. In addition, if these transactional costs were included, your costs would have been higher.
| | Annualized Expense Ratio-A | Beginning
Account Value
May 1, 2018 | Ending
Account Value
October 31, 2018 | Expenses Paid
During Period-B
May 1, 2018
to October 31, 2018 |
| Class A | 1.22% | | | |
| Actual | | $1,000.00 | $925.10 | $5.92 |
| Hypothetical-C | | $1,000.00 | $1,019.06 | $6.21 |
| Class M | 1.52% | | | |
| Actual | | $1,000.00 | $924.20 | $7.37 |
| Hypothetical-C | | $1,000.00 | $1,017.54 | $7.73 |
| Class C | 1.97% | | | |
| Actual | | $1,000.00 | $921.50 | $9.54 |
| Hypothetical-C | | $1,000.00 | $1,015.27 | $10.01 |
| International Growth | .91% | | | |
| Actual | | $1,000.00 | $926.30 | $4.42 |
| Hypothetical-C | | $1,000.00 | $1,020.62 | $4.63 |
| Class I | .91% | | | |
| Actual | | $1,000.00 | $926.90 | $4.42 |
| Hypothetical-C | | $1,000.00 | $1,020.62 | $4.63 |
| Class Z | .79% | | | |
| Actual | | $1,000.00 | $927.00 | $3.84 |
| Hypothetical-C | | $1,000.00 | $1,021.22 | $4.02 |
A Annualized expense ratio reflects expenses net of applicable fee waivers.
B Expenses are equal to each Class' annualized expense ratio, multiplied by the average account value over the period, multiplied by 184/365 (to reflect the one-half year period).
C 5% return per year before expenses
Distributions (Unaudited)
Class A designates 25% and 93%; Class M designates 49% and 93%; International Growth designates 16% and 93%; Class I designates 15% and 93%; and Class Z designates 13% and 93% of the dividends distributed on December 8, 2017 and December 28, 2017, respectively, during the fiscal year as qualifying for the dividends–received deduction for corporate shareholders.
Class A, Class M, International Growth, Class I, and Class Z designate 100% of the dividends distributed during the fiscal year as amounts which may be taken into account as a dividend for purposes of the maximum rate under section 1(h)(11) of the Internal Revenue Code.
The amounts per share which represent income derived from sources within, and taxes paid to, foreign countries or possessions of the United States are as follows:
| | Pay Date | Income | Taxes |
| Fidelity International Growth Fund | | | |
| Class A | 12/11/17 | $0.0746 | $0.0196 |
| Class A | 12/29/17 | $0.0020 | $0.0000 |
| Class M | 12/11/17 | $0.0376 | $0.0196 |
| Class M | 12/29/17 | $0.0020 | $0.0000 |
| International Growth | 12/11/17 | $0.1116 | $0.0196 |
| International Growth | 12/29/17 | $0.0020 | $0.0000 |
| Class I | 12/11/17 | $0.1216 | $0.0196 |
| Class I | 12/29/17 | $0.0020 | $0.0000 |
| Class Z | 12/11/17 | $0.1366 | $0.0196 |
| Class Z | 12/29/17 | $0.0020 | $0.0000 |
|
The fund will notify shareholders in January 2019 of amounts for use in preparing 2018 income tax returns.
Board Approval of Investment Advisory Contracts
Fidelity International Growth Fund
At its July 2018 meeting, the Board of Trustees, including the Independent Trustees (together, the Board), voted to continue the management contract with Fidelity Management & Research Company (FMR) and the sub-advisory agreements (together, the Advisory Contracts) for the fund for six months through January 31, 2019, in connection with the reunification of the Fidelity Equity High Income Funds Board, which oversees the fund, and the Sector Portfolios Board.
The Board considered that the approval of the fund's Advisory Contracts will not result in any changes in (i) the investment process or strategies employed in the management of the fund's assets; (ii) the fees and expenses paid by shareholders; (iii) the nature, extent or quality of services provided under the fund's Advisory Contracts; or (iv) the day-to-day management of the fund or the persons primarily responsible for such management. The Board concluded that the fund's Advisory Contracts are fair and reasonable, and that the fund's Advisory Contracts should be renewed, without modification, through January 31, 2019, with the understanding that the Board will consider the annual renewal for a full one year period in January 2019.
In connection with its consideration of future renewals of the fund's Advisory Contracts, the Board will consider: (i) the nature, extent and quality of services provided to the fund, including shareholder and administrative services and investment performance; (ii) the competitiveness of the management fee and total expenses for the fund; (iii) the costs of the services and profitability, including the revenues earned and the expenses incurred in conducting the business of developing, marketing, distributing, managing, administering, and servicing the fund and its shareholders, to the extent applicable, as well as potential fall-out benefits from Fidelity's non-fund businesses; and (iv) whether there have been economies of scale in respect of the Fidelity funds, whether the Fidelity funds (including the fund) have appropriately benefited from any such economies of scale, and whether there is the potential for realization of any further economies.
Based on its evaluation of all of the conclusions noted above, and after considering all factors it believed relevant, the Board ultimately concluded that the fund's management fee structure is fair and reasonable, and that the continuation of the fund's Advisory Contracts should be approved.
AIGF-ANN-1218
1.853349.110
Fidelity® International Growth Fund
Annual Report October 31, 2018 |
|
Contents
To view a fund's proxy voting guidelines and proxy voting record for the 12-month period ended June 30, visit http://www.fidelity.com/proxyvotingresults or visit the Securities and Exchange Commission's (SEC) web site at http://www.sec.gov.
You may also call 1-800-544-8544 to request a free copy of the proxy voting guidelines.
Standard & Poor's, S&P and S&P 500 are registered service marks of The McGraw-Hill Companies, Inc. and have been licensed for use by Fidelity Distributors Corporation.
Other third-party marks appearing herein are the property of their respective owners.
All other marks appearing herein are registered or unregistered trademarks or service marks of FMR LLC or an affiliated company. © 2018 FMR LLC. All rights reserved.
This report and the financial statements contained herein are submitted for the general information of the shareholders of the Fund. This report is not authorized for distribution to prospective investors in the Fund unless preceded or accompanied by an effective prospectus.
A fund files its complete schedule of portfolio holdings with the SEC for the first and third quarters of each fiscal year on Form N-Q. Forms N-Q are available on the SEC’s web site at http://www.sec.gov. A fund's Forms N-Q may be reviewed and copied at the SEC’s Public Reference Room in Washington, DC. Information regarding the operation of the SEC's Public Reference Room may be obtained by calling 1-800-SEC-0330.
For a complete list of a fund's portfolio holdings, view the most recent holdings listing, semiannual report, or annual report on Fidelity's web site at http://www.fidelity.com, http://www.institutional.fidelity.com, or http://www.401k.com, as applicable.
NOT FDIC INSURED •MAY LOSE VALUE •NO BANK GUARANTEE
Neither the Fund nor Fidelity Distributors Corporation is a bank.
Performance: The Bottom Line
Average annual total return reflects the change in the value of an investment, assuming reinvestment of distributions from dividend income and capital gains (the profits earned upon the sale of securities that have grown in value, if any) and assuming a constant rate of performance each year. The hypothetical investment and the average annual total returns do not reflect the deduction of taxes that a shareholder would pay on fund distributions or the redemption of fund shares. During periods of reimbursement by Fidelity, a fund’s total return will be greater than it would be had the reimbursement not occurred. How a fund did yesterday is no guarantee of how it will do tomorrow.
Average Annual Total Returns
| For the periods ended October 31, 2018 | Past 1 year | Past 5 years | Past 10 years |
| Fidelity® International Growth Fund | (5.89)% | 3.84% | 9.70% |
$10,000 Over 10 Years
Let's say hypothetically that $10,000 was invested in Fidelity® International Growth Fund, a class of the fund, on October 31, 2008.
The chart shows how the value of your investment would have changed, and also shows how the MSCI EAFE Growth Index performed over the same period.
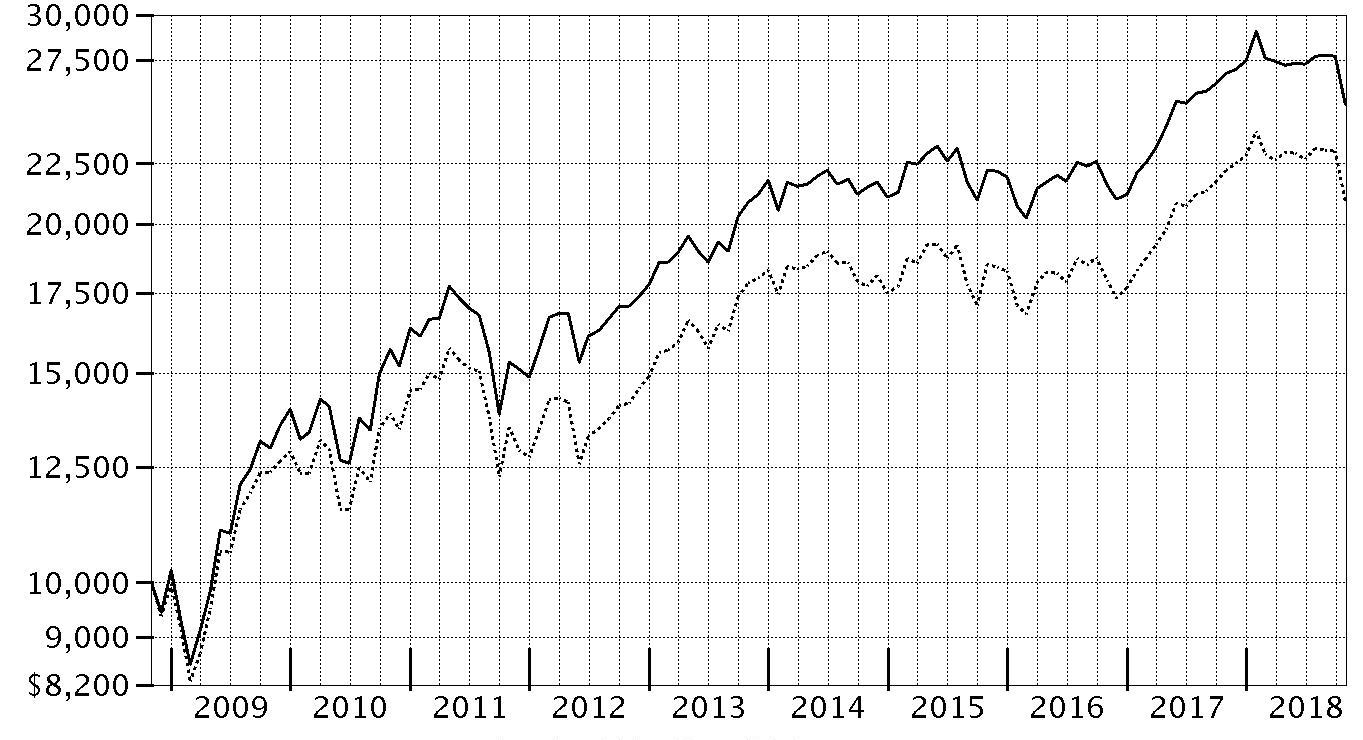
| Period Ending Values |
| $25,227 | Fidelity® International Growth Fund |
| $20,925 | MSCI EAFE Growth Index |
Management's Discussion of Fund Performance
Market Recap: International equities returned -8.08% for the 12 months ending October 31, 2018, according to the MSCI ACWI (All Country World Index) ex USA Index. A modestly positive first half of the period gave way to a confluence of overwhelmingly negative factors – including escalating trade tensions, a surging U.S. dollar, tepid economic growth in Europe, global central bank tightening, concerns about Italy’s budget stalemate with the EU, and weakness in China’s stock market – that yielded a -11% second-half return. The index lost 8% in October alone, its largest monthly drop in more than six years. Among sectors, new-media-infused communications services (-15%) was hit the hardest, while economically sensitive consumer discretionary (-13%), information technology (-12%), financials (-10%), industrials (-9%) and materials (-7%) stocks also fared poorly. Even the more defensive real estate (-9%), utilities (-6%) and consumer staples (-5%) sectors weren’t spared this period. Conversely, elevated crude-oil prices fueled a positive return for energy (+7%), the top-performing sector, followed by the relatively stable-growing health care segment (+2%). Regionally, emerging markets (-12%) fared the worst, hampered by the impact of foreign exchange and concerns about economic weakness in China, India and South Korea. Sluggish growth also pressured shares in continental Europe (-9%). Stocks in Japan (-3%) and the U.K. (-4%) held up better, followed by Canada (-5%) and Asia-Pacific ex Japan (-6%).
Comments from Portfolio Manager Jed Weiss: For the fiscal year, the fund’s share classes (excluding sales charges, if applicable) returned roughly -6% to -7%, compared with -5.86% for the benchmark MSCI EAFE Growth Index. Versus the benchmark, the fund benefited from sizable out-of-benchmark exposure to the U.S., as well as strong security selection in continental Europe. By sector, investment choices within the information technology sector also helped the fund's relative result. Conversely, stock picks in Japan and the U.K. detracted, as did investment choices within the consumer discretionary and consumer staples sectors. The biggest individual relative contributors were notable out-of-benchmark stakes in U.S.-based credit-card processors Mastercard and Visa, as both companies continued to maintain considerable pricing power and significant market share. A sizable overweighting in Australian global biopharmaceutical firm CSL Limited also proved beneficial, as its shares gained following the acquisition and successful turnaround of Novartis' flu business. I'll note that the fund's stake in cash – representing 3% of assets, on average – helped our relative result in a down market. Turning to detractors, a non-benchmark investment in U.S. flooring manufacturer Mohawk Industries hurt most, due to signs of softening in the U.S. housing market. The decision to not own consumer electronics conglomerate and benchmark component Sony also detracted from relative performance, given the stock's notable gain of during the period.
The views expressed above reflect those of the portfolio manager(s) only through the end of the period as stated on the cover of this report and do not necessarily represent the views of Fidelity or any other person in the Fidelity organization. Any such views are subject to change at any time based upon market or other conditions and Fidelity disclaims any responsibility to update such views. These views may not be relied on as investment advice and, because investment decisions for a Fidelity fund are based on numerous factors, may not be relied on as an indication of trading intent on behalf of any Fidelity fund.
Note to Shareholders: Following a roughly five-month leave of absence, Jed Weiss returned to Fidelity on November 29, 2017, and resumed his day-to-day responsibilities as Portfolio Manager. In his stead, Vincent Montemaggiore served as interim manager of the fund until December 4, 2017.
Investment Summary (Unaudited)
Geographic Diversification (% of fund's net assets)
| As of October 31, 2018 |
| | United States of America* | 25.3% |
| | Japan | 13.0% |
| | United Kingdom | 8.7% |
| | Switzerland | 8.3% |
| | Germany | 7.4% |
| | Sweden | 5.0% |
| | Spain | 3.9% |
| | France | 3.7% |
| | Australia | 3.4% |
| | Other | 21.3% |

* Includes Short-Term investments and Net Other Assets (Liabilities).
Percentages are based on country or territory of incorporation and are adjusted for the effect of futures contracts, if applicable.
Asset Allocation as of October 31, 2018
| | % of fund's net assets |
| Stocks | 94.3 |
| Short-Term Investments and Net Other Assets (Liabilities) | 5.7 |
Top Ten Stocks as of October 31, 2018
| | % of fund's net assets |
| Nestle SA (Reg. S) (Switzerland, Food Products) | 3.9 |
| SAP SE (Germany, Software) | 3.4 |
| CSL Ltd. (Australia, Biotechnology) | 3.4 |
| Roche Holding AG (participation certificate) (Switzerland, Pharmaceuticals) | 3.2 |
| Visa, Inc. Class A (United States of America, IT Services) | 3.0 |
| MasterCard, Inc. Class A (United States of America, IT Services) | 2.9 |
| AIA Group Ltd. (Hong Kong, Insurance) | 2.7 |
| ASML Holding NV (Netherlands) (Netherlands, Semiconductors & Semiconductor Equipment) | 2.6 |
| Keyence Corp. (Japan, Electronic Equipment & Components) | 2.5 |
| Amadeus IT Holding SA Class A (Spain, IT Services) | 2.4 |
| | 30.0 |
Top Market Sectors as of October 31, 2018
| | % of fund's net assets |
| Industrials | 21.1 |
| Information Technology | 19.8 |
| Financials | 15.4 |
| Health Care | 10.3 |
| Consumer Discretionary | 6.9 |
| Consumer Staples | 6.9 |
| Communication Services | 6.4 |
| Materials | 6.0 |
| Real Estate | 1.1 |
| Energy | 0.4 |
Schedule of Investments October 31, 2018
Showing Percentage of Net Assets
| Common Stocks - 93.9% | | | |
| | | Shares | Value |
| Australia - 3.4% | | | |
| CSL Ltd. | | 578,755 | $77,050,926 |
| Austria - 1.1% | | | |
| Andritz AG | | 483,421 | 25,055,741 |
| Belgium - 1.0% | | | |
| KBC Groep NV | | 335,808 | 23,163,493 |
| Brazil - 0.1% | | | |
| Itau Unibanco Holding SA | | 230,900 | 2,630,082 |
| Canada - 2.5% | | | |
| Alimentation Couche-Tard, Inc. Class B (sub. vtg.) | | 254,900 | 12,173,317 |
| Canadian National Railway Co. | | 125,100 | 10,694,484 |
| Canadian Pacific Railway Ltd. | | 53,500 | 10,971,473 |
| Franco-Nevada Corp. | | 188,300 | 11,760,436 |
| Pason Systems, Inc. | | 335,200 | 5,059,382 |
| PrairieSky Royalty Ltd. (a) | | 346,900 | 5,270,234 |
|
| TOTAL CANADA | | | 55,929,326 |
|
| Cayman Islands - 0.8% | | | |
| Alibaba Group Holding Ltd. sponsored ADR (b) | | 133,100 | 18,937,468 |
| Denmark - 0.5% | | | |
| Jyske Bank A/S (Reg.) | | 276,400 | 11,300,387 |
| Finland - 0.2% | | | |
| Tikkurila Oyj | | 278,900 | 3,797,071 |
| France - 3.7% | | | |
| Edenred SA | | 489,400 | 18,586,313 |
| Elis SA | | 460,836 | 9,306,652 |
| Legrand SA | | 251,300 | 16,434,822 |
| Safran SA | | 308,200 | 39,828,014 |
|
| TOTAL FRANCE | | | 84,155,801 |
|
| Germany - 7.4% | | | |
| Bayer AG | | 163,490 | 12,531,911 |
| Linde PLC | | 255,179 | 41,865,777 |
| MTU Aero Engines Holdings AG | | 99,000 | 21,058,455 |
| SAP SE | | 723,501 | 77,467,779 |
| Vonovia SE | | 286,600 | 13,121,039 |
|
| TOTAL GERMANY | | | 166,044,961 |
|
| Hong Kong - 2.7% | | | |
| AIA Group Ltd. | | 7,973,000 | 60,341,822 |
| India - 1.0% | | | |
| Housing Development Finance Corp. Ltd. | | 967,878 | 23,153,301 |
| Ireland - 2.8% | | | |
| CRH PLC sponsored ADR (a) | | 1,266,766 | 37,724,291 |
| James Hardie Industries PLC CDI | | 1,910,089 | 25,415,909 |
|
| TOTAL IRELAND | | | 63,140,200 |
|
| Italy - 0.7% | | | |
| Interpump Group SpA | | 556,726 | 16,079,680 |
| Japan - 13.0% | | | |
| Azbil Corp. | | 325,000 | 6,054,416 |
| DENSO Corp. | | 532,900 | 23,770,415 |
| East Japan Railway Co. | | 289,000 | 25,240,608 |
| Fanuc Corp. | | 125,600 | 21,850,263 |
| Hoya Corp. | | 472,500 | 26,858,820 |
| Keyence Corp. | | 117,124 | 57,402,022 |
| Komatsu Ltd. | | 662,300 | 17,247,919 |
| Misumi Group, Inc. | | 1,031,700 | 20,719,034 |
| Nabtesco Corp. | | 443,500 | 9,779,129 |
| Nintendo Co. Ltd. | | 46,700 | 14,579,875 |
| OSG Corp. | | 610,300 | 12,624,099 |
| SHO-BOND Holdings Co. Ltd. | | 237,400 | 16,915,815 |
| USS Co. Ltd. | | 2,169,400 | 39,163,981 |
|
| TOTAL JAPAN | | | 292,206,396 |
|
| Kenya - 0.7% | | | |
| Safaricom Ltd. | | 67,029,800 | 15,263,887 |
| Korea (South) - 0.7% | | | |
| BGF Retail Co. Ltd. | | 53,972 | 7,970,449 |
| NAVER Corp. | | 85,970 | 8,627,138 |
|
| TOTAL KOREA (SOUTH) | | | 16,597,587 |
|
| Netherlands - 2.6% | | | |
| ASML Holding NV (Netherlands) | | 343,700 | 59,200,308 |
| New Zealand - 0.5% | | | |
| Auckland International Airport Ltd. | | 2,215,940 | 10,107,621 |
| Norway - 0.5% | | | |
| Schibsted ASA (B Shares) | | 364,600 | 11,548,103 |
| South Africa - 1.4% | | | |
| Clicks Group Ltd. | | 1,116,838 | 14,232,540 |
| Naspers Ltd. Class N | | 91,700 | 16,115,828 |
|
| TOTAL SOUTH AFRICA | | | 30,348,368 |
|
| Spain - 3.9% | | | |
| Amadeus IT Holding SA Class A | | 663,800 | 53,516,901 |
| Grifols SA ADR | | 838,200 | 17,116,044 |
| Merlin Properties Socimi SA | | 430,900 | 5,407,692 |
| Prosegur Compania de Seguridad SA (Reg.) | | 2,209,449 | 12,282,429 |
|
| TOTAL SPAIN | | | 88,323,066 |
|
| Sweden - 5.0% | | | |
| ASSA ABLOY AB (B Shares) | | 2,592,283 | 51,562,489 |
| Atlas Copco AB (A Shares) | | 1,081,900 | 26,789,916 |
| Epiroc AB Class A (b) | | 1,437,600 | 12,624,155 |
| Fagerhult AB | | 552,394 | 4,853,213 |
| Loomis AB (B Shares) | | 202,100 | 6,249,958 |
| Svenska Handelsbanken AB (A Shares) | | 939,120 | 10,208,086 |
|
| TOTAL SWEDEN | | | 112,287,817 |
|
| Switzerland - 8.3% | | | |
| Nestle SA (Reg. S) | | 1,044,349 | 88,167,194 |
| Roche Holding AG (participation certificate) | | 297,183 | 72,323,171 |
| Schindler Holding AG: | | | |
| (participation certificate) | | 105,958 | 22,345,707 |
| (Reg.) | | 18,350 | 3,811,567 |
|
| TOTAL SWITZERLAND | | | 186,647,639 |
|
| Taiwan - 1.1% | | | |
| Taiwan Semiconductor Manufacturing Co. Ltd. | | 3,330,000 | 24,985,452 |
| United Kingdom - 8.7% | | | |
| BAE Systems PLC | | 2,619,600 | 17,565,170 |
| Elementis PLC | | 2,360,662 | 6,185,666 |
| Informa PLC | | 3,032,666 | 27,661,660 |
| InterContinental Hotel Group PLC ADR (a) | | 721,022 | 38,762,143 |
| Melrose Industries PLC | | 4,857,279 | 10,470,760 |
| Prudential PLC | | 2,322,865 | 46,512,176 |
| Reckitt Benckiser Group PLC | | 294,345 | 23,801,948 |
| Rightmove PLC | | 1,065,700 | 6,159,087 |
| Shaftesbury PLC | | 542,533 | 6,220,387 |
| Spectris PLC | | 447,057 | 12,251,422 |
|
| TOTAL UNITED KINGDOM | | | 195,590,419 |
|
| United States of America - 19.6% | | | |
| Alphabet, Inc. Class A (b) | | 41,436 | 45,189,273 |
| Autoliv, Inc. (a) | | 202,169 | 16,848,764 |
| Berkshire Hathaway, Inc. Class B (b) | | 116,084 | 23,829,724 |
| Black Knight, Inc. (b) | | 262,400 | 12,797,248 |
| Marsh & McLennan Companies, Inc. | | 227,551 | 19,284,947 |
| Martin Marietta Materials, Inc. | | 119,400 | 20,450,832 |
| MasterCard, Inc. Class A | | 332,400 | 65,705,508 |
| Mohawk Industries, Inc. (b) | | 101,300 | 12,635,149 |
| Moody's Corp. | | 162,100 | 23,582,308 |
| MSCI, Inc. | | 179,600 | 27,008,248 |
| PayPal Holdings, Inc. (b) | | 128,600 | 10,826,834 |
| PriceSmart, Inc. | | 127,800 | 8,965,170 |
| ResMed, Inc. | | 228,600 | 24,213,312 |
| S&P Global, Inc. | | 146,700 | 26,746,344 |
| Sherwin-Williams Co. | | 75,300 | 29,628,291 |
| Veoneer, Inc. (a)(b) | | 231,469 | 7,772,729 |
| Visa, Inc. Class A | | 486,760 | 67,099,866 |
|
| TOTAL UNITED STATES OF AMERICA | | | 442,584,547 |
|
| TOTAL COMMON STOCKS | | | |
| (Cost $1,776,108,879) | | | 2,116,471,469 |
|
| Nonconvertible Preferred Stocks - 0.4% | | | |
| Brazil - 0.4% | | | |
| Itau Unibanco Holding SA | | | |
| (Cost $8,721,522) | | 707,900 | 9,368,286 |
|
| Money Market Funds - 7.4% | | | |
| Fidelity Cash Central Fund, 2.23% (c) | | 120,911,580 | 120,935,762 |
| Fidelity Securities Lending Cash Central Fund 2.23% (c)(d) | | 45,794,861 | 45,799,441 |
| TOTAL MONEY MARKET FUNDS | | | |
| (Cost $166,735,203) | | | 166,735,203 |
| TOTAL INVESTMENT IN SECURITIES - 101.7% | | | |
| (Cost $1,951,565,604) | | | 2,292,574,958 |
| NET OTHER ASSETS (LIABILITIES) - (1.7)% | | | (38,184,935) |
| NET ASSETS - 100% | | | $2,254,390,023 |
Categorizations in the Schedule of Investments are based on country or territory of incorporation.
Legend
(a) Security or a portion of the security is on loan at period end.
(b) Non-income producing
(c) Affiliated fund that is generally available only to investment companies and other accounts managed by Fidelity Investments. The rate quoted is the annualized seven-day yield of the fund at period end. A complete unaudited listing of the fund's holdings as of its most recent quarter end is available upon request. In addition, each Fidelity Central Fund's financial statements, which are not covered by the Fund's Report of Independent Registered Public Accounting Firm, are available on the SEC's website or upon request.
(d) Investment made with cash collateral received from securities on loan.
Affiliated Central Funds
Information regarding fiscal year to date income earned by the Fund from investments in Fidelity Central Funds is as follows:
| Fund | Income earned |
| Fidelity Cash Central Fund | $1,284,956 |
| Fidelity Securities Lending Cash Central Fund | 462,892 |
| Total | $1,747,848 |
Amounts in the income column in the above table include any capital gain distributions from underlying funds, which are presented in the corresponding line-item in the Statement of Operations if applicable.
Investment Valuation
The following is a summary of the inputs used, as of October 31, 2018, involving the Fund's assets and liabilities carried at fair value. The inputs or methodology used for valuing securities may not be an indication of the risk associated with investing in those securities. For more information on valuation inputs, and their aggregation into the levels used below, please refer to the Investment Valuation section in the accompanying Notes to Financial Statements.
| | Valuation Inputs at Reporting Date: |
| Description | Total | Level 1 | Level 2 | Level 3 |
| Investments in Securities: | | | | |
| Equities: | | | | |
| Communication Services | $145,144,851 | $130,564,976 | $14,579,875 | $-- |
| Consumer Discretionary | 157,890,649 | 134,120,234 | 23,770,415 | -- |
| Consumer Staples | 155,310,618 | 43,341,476 | 111,969,142 | -- |
| Energy | 10,329,616 | 10,329,616 | -- | -- |
| Financials | 348,994,981 | 292,274,719 | 56,720,262 | -- |
| Health Care | 230,094,184 | 145,239,102 | 84,855,082 | -- |
| Industrials | 471,055,486 | 297,761,023 | 173,294,463 | -- |
| Information Technology | 447,307,756 | 285,654,217 | 161,653,539 | -- |
| Materials | 134,962,496 | 134,962,496 | -- | -- |
| Real Estate | 24,749,118 | 24,749,118 | -- | -- |
| Money Market Funds | 166,735,203 | 166,735,203 | -- | -- |
| Total Investments in Securities: | $2,292,574,958 | $1,665,732,180 | $626,842,778 | $-- |
The following is a summary of transfers between Level 1 and Level 2 for the period ended October 31, 2018. Transfers are assumed to have occurred at the beginning of the period, and are primarily attributable to the valuation techniques used for foreign equity securities, as discussed in the accompanying Notes to Financial Statements:
| Transfers | Total |
| Level 1 to Level 2 | $17,963,771 |
| Level 2 to Level 1 | $174,714,963 |
See accompanying notes which are an integral part of the financial statements.
Financial Statements
Statement of Assets and Liabilities
| | | October 31, 2018 |
| Assets | | |
Investment in securities, at value (including securities loaned of $45,731,621) — See accompanying schedule:
Unaffiliated issuers (cost $1,784,830,401) | $2,125,839,755 | |
| Fidelity Central Funds (cost $166,735,203) | 166,735,203 | |
| Total Investment in Securities (cost $1,951,565,604) | | $2,292,574,958 |
| Foreign currency held at value (cost $15,231) | | 14,808 |
| Receivable for investments sold | | 7,160,194 |
| Receivable for fund shares sold | | 5,172,093 |
| Dividends receivable | | 8,730,685 |
| Distributions receivable from Fidelity Central Funds | | 269,240 |
| Prepaid expenses | | 4,666 |
| Other receivables | | 175,049 |
| Total assets | | 2,314,101,693 |
| Liabilities | | |
| Payable for investments purchased | $5,398,186 | |
| Payable for fund shares redeemed | 6,537,082 | |
| Accrued management fee | 1,345,676 | |
| Distribution and service plan fees payable | 93,811 | |
| Other affiliated payables | 390,515 | |
| Other payables and accrued expenses | 154,700 | |
| Collateral on securities loaned | 45,791,700 | |
| Total liabilities | | 59,711,670 |
| Net Assets | | $2,254,390,023 |
| Net Assets consist of: | | |
| Paid in capital | | $1,982,928,446 |
| Total distributable earnings (loss) | | 271,461,577 |
| Net Assets | | $2,254,390,023 |
| Net Asset Value and Maximum Offering Price | | |
| Class A: | | |
| Net Asset Value and redemption price per share ($138,801,944 ÷ 11,129,084 shares) | | $12.47 |
| Maximum offering price per share (100/94.25 of $12.47) | | $13.23 |
| Class M: | | |
| Net Asset Value and redemption price per share ($26,479,092 ÷ 2,130,561 shares) | | $12.43 |
| Maximum offering price per share (100/96.50 of $12.43) | | $12.88 |
| Class C: | | |
| Net Asset Value and offering price per share ($60,489,203 ÷ 4,957,617 shares)(a) | | $12.20 |
| International Growth: | | |
| Net Asset Value, offering price and redemption price per share ($811,100,687 ÷ 64,509,100 shares) | | $12.57 |
| Class I: | | |
| Net Asset Value, offering price and redemption price per share ($660,960,682 ÷ 52,676,208 shares) | | $12.55 |
| Class Z: | | |
| Net Asset Value, offering price and redemption price per share ($556,558,415 ÷ 44,269,920 shares) | | $12.57 |
(a) Redemption price per share is equal to net asset value less any applicable contingent deferred sales charge.
See accompanying notes which are an integral part of the financial statements.
Statement of Operations
| | | Year ended October 31, 2018 |
| Investment Income | | |
| Dividends | | $48,714,625 |
| Income from Fidelity Central Funds | | 1,747,848 |
| Income before foreign taxes withheld | | 50,462,473 |
| Less foreign taxes withheld | | (4,506,698) |
| Total income | | 45,955,775 |
| Expenses | | |
| Management fee | | |
| Basic fee | $17,002,946 | |
| Performance adjustment | (55,145) | |
| Transfer agent fees | 4,013,844 | |
| Distribution and service plan fees | 1,261,740 | |
| Accounting and security lending fees | 1,084,753 | |
| Custodian fees and expenses | 302,250 | |
| Independent trustees' fees and expenses | 12,196 | |
| Registration fees | 171,109 | |
| Audit | 75,340 | |
| Legal | 7,141 | |
| Interest | 12,804 | |
| Miscellaneous | 16,040 | |
| Total expenses before reductions | 23,905,018 | |
| Expense reductions | (271,447) | |
| Total expenses after reductions | | 23,633,571 |
| Net investment income (loss) | | 22,322,204 |
| Realized and Unrealized Gain (Loss) | | |
| Net realized gain (loss) on: | | |
| Investment securities: | | |
| Unaffiliated issuers | 6,254,679 | |
| Fidelity Central Funds | 875 | |
| Foreign currency transactions | (452,401) | |
| Total net realized gain (loss) | | 5,803,153 |
| Change in net unrealized appreciation (depreciation) on: | | |
| Investment securities: | | |
| Unaffiliated issuers (net of decrease in deferred foreign taxes of $43,591) | (175,443,626) | |
| Assets and liabilities in foreign currencies | (68,126) | |
| Total change in net unrealized appreciation (depreciation) | | (175,511,752) |
| Net gain (loss) | | (169,708,599) |
| Net increase (decrease) in net assets resulting from operations | | $(147,386,395) |
See accompanying notes which are an integral part of the financial statements.
Statement of Changes in Net Assets
| | Year ended October 31, 2018 | Year ended October 31, 2017 |
| Increase (Decrease) in Net Assets | | |
| Operations | | |
| Net investment income (loss) | $22,322,204 | $16,277,855 |
| Net realized gain (loss) | 5,803,153 | (12,551,371) |
| Change in net unrealized appreciation (depreciation) | (175,511,752) | 409,389,366 |
| Net increase (decrease) in net assets resulting from operations | (147,386,395) | 413,115,850 |
| Distributions to shareholders | (16,636,167) | – |
| Distributions to shareholders from net investment income | – | (18,629,181) |
| Total distributions | (16,636,167) | (18,629,181) |
| Share transactions - net increase (decrease) | 95,038,479 | 210,891,938 |
| Redemption fees | – | 6,903 |
| Total increase (decrease) in net assets | (68,984,084) | 605,385,510 |
| Net Assets | | |
| Beginning of period | 2,323,374,107 | 1,717,988,597 |
| End of period | $2,254,390,023 | $2,323,374,107 |
| Other Information | | |
| Undistributed net investment income end of period | | $13,559,706 |
See accompanying notes which are an integral part of the financial statements.
Financial Highlights
Fidelity International Growth Fund Class A
| Years ended October 31, | 2018 | 2017 | 2016 | 2015 | 2014 |
| Selected Per–Share Data | | | | | |
| Net asset value, beginning of period | $13.34 | $10.88 | $11.30 | $11.01 | $10.78 |
| Income from Investment Operations | | | | | |
| Net investment income (loss)A | .09 | .07 | .12B | .07 | .09 |
| Net realized and unrealized gain (loss) | (.90) | 2.49 | (.48) | .28 | .18 |
| Total from investment operations | (.81) | 2.56 | (.36) | .35 | .27 |
| Distributions from net investment income | (.04) | (.10) | (.05) | (.06) | (.03) |
| Distributions from net realized gain | (.02) | – | (.01) | – | (.01) |
| Total distributions | (.06) | (.10) | (.06) | (.06) | (.04) |
| Redemption fees added to paid in capitalA | – | –C | –C | –C | –C |
| Net asset value, end of period | $12.47 | $13.34 | $10.88 | $11.30 | $11.01 |
| Total ReturnD,E | (6.12)% | 23.80% | (3.22)% | 3.20% | 2.54% |
| Ratios to Average Net AssetsF,G | | | | | |
| Expenses before reductions | 1.24% | 1.28% | 1.27% | 1.26% | 1.35% |
| Expenses net of fee waivers, if any | 1.23% | 1.28% | 1.27% | 1.26% | 1.35% |
| Expenses net of all reductions | 1.22% | 1.27% | 1.27% | 1.25% | 1.34% |
| Net investment income (loss) | .64% | .62% | 1.05%B | .66% | .84% |
| Supplemental Data | | | | | |
| Net assets, end of period (000 omitted) | $138,802 | $156,988 | $221,861 | $184,878 | $119,017 |
| Portfolio turnover rateH | 34% | 22% | 29% | 26% | 27% |
A Calculated based on average shares outstanding during the period.
B Net investment income per share reflects a large, non-recurring dividend which amounted to $.04 per share. Excluding this non-recurring dividend, the ratio of net investment income (loss) to average net assets would have been .68%.
C Amount represents less than $.005 per share.
D Total returns would have been lower if certain expenses had not been reduced during the applicable periods shown.
E Total returns do not include the effect of the sales charges.
F Fees and expenses of any underlying Fidelity Central Funds are not included in the Fund's expense ratio. The Fund indirectly bears its proportionate share of the expenses of any underlying Fidelity Central Funds.
G Expense ratios reflect operating expenses of the class. Expenses before reductions do not reflect amounts reimbursed by the investment adviser or reductions from brokerage service arrangements or reductions from other expense offset arrangements and do not represent the amount paid by the class during periods when reimbursements or reductions occur. Expenses net of fee waivers reflect expenses after reimbursement by the investment adviser but prior to reductions from brokerage service arrangements or other expense offset arrangements. Expenses net of all reductions represent the net expenses paid by the class.
H Amount does not include the portfolio activity of any underlying Fidelity Central Funds.
See accompanying notes which are an integral part of the financial statements.
Fidelity International Growth Fund Class M
| Years ended October 31, | 2018 | 2017 | 2016 | 2015 | 2014 |
| Selected Per–Share Data | | | | | |
| Net asset value, beginning of period | $13.30 | $10.84 | $11.26 | $10.96 | $10.75 |
| Income from Investment Operations | | | | | |
| Net investment income (loss)A | .05 | .04 | .08B | .04 | .06 |
| Net realized and unrealized gain (loss) | (.90) | 2.49 | (.48) | .27 | .18 |
| Total from investment operations | (.85) | 2.53 | (.40) | .31 | .24 |
| Distributions from net investment income | (.01) | (.07) | (.01) | (.01) | (.02) |
| Distributions from net realized gain | (.02) | – | (.01) | – | (.01) |
| Total distributions | (.02)C | (.07) | (.02) | (.01) | (.03) |
| Redemption fees added to paid in capitalA | – | –D | –D | –D | –D |
| Net asset value, end of period | $12.43 | $13.30 | $10.84 | $11.26 | $10.96 |
| Total ReturnE,F | (6.40)% | 23.51% | (3.58)% | 2.85% | 2.21% |
| Ratios to Average Net AssetsG,H | | | | | |
| Expenses before reductions | 1.54% | 1.59% | 1.61% | 1.58% | 1.65% |
| Expenses net of fee waivers, if any | 1.53% | 1.59% | 1.61% | 1.58% | 1.65% |
| Expenses net of all reductions | 1.52% | 1.58% | 1.61% | 1.58% | 1.65% |
| Net investment income (loss) | .34% | .31% | .71%B | .33% | .53% |
| Supplemental Data | | | | | |
| Net assets, end of period (000 omitted) | $26,479 | $33,597 | $27,966 | $28,833 | $26,369 |
| Portfolio turnover rateI | 34% | 22% | 29% | 26% | 27% |
A Calculated based on average shares outstanding during the period.
B Net investment income per share reflects a large, non-recurring dividend which amounted to $.04 per share. Excluding this non-recurring dividend, the ratio of net investment income (loss) to average net assets would have been .34%.
C Total distributions of $.02 per share is comprised of distributions from net investment income of $.005 and distributions from net realized gain of $.015 per share.
D Amount represents less than $.005 per share.
E Total returns would have been lower if certain expenses had not been reduced during the applicable periods shown.
F Total returns do not include the effect of the sales charges.
G Fees and expenses of any underlying Fidelity Central Funds are not included in the Fund's expense ratio. The Fund indirectly bears its proportionate share of the expenses of any underlying Fidelity Central Funds.
H Expense ratios reflect operating expenses of the class. Expenses before reductions do not reflect amounts reimbursed by the investment adviser or reductions from brokerage service arrangements or reductions from other expense offset arrangements and do not represent the amount paid by the class during periods when reimbursements or reductions occur. Expenses net of fee waivers reflect expenses after reimbursement by the investment adviser but prior to reductions from brokerage service arrangements or other expense offset arrangements. Expenses net of all reductions represent the net expenses paid by the class.
I Amount does not include the portfolio activity of any underlying Fidelity Central Funds.
See accompanying notes which are an integral part of the financial statements.
Fidelity International Growth Fund Class C
| Years ended October 31, | 2018 | 2017 | 2016 | 2015 | 2014 |
| Selected Per–Share Data | | | | | |
| Net asset value, beginning of period | $13.10 | $10.67 | $11.12 | $10.87 | $10.69 |
| Income from Investment Operations | | | | | |
| Net investment income (loss)A | (.01) | (.02) | .03B | (.02) | .01 |
| Net realized and unrealized gain (loss) | (.89) | 2.47 | (.47) | .27 | .18 |
| Total from investment operations | (.90) | 2.45 | (.44) | .25 | .19 |
| Distributions from net investment income | – | (.02) | – | – | – |
| Distributions from net realized gain | – | – | (.01) | – | (.01) |
| Total distributions | – | (.02) | (.01) | – | (.01) |
| Redemption fees added to paid in capitalA | – | –C | –C | –C | –C |
| Net asset value, end of period | $12.20 | $13.10 | $10.67 | $11.12 | $10.87 |
| Total ReturnD,E | (6.87)% | 22.96% | (3.98)% | 2.30% | 1.77% |
| Ratios to Average Net AssetsF,G | | | | | |
| Expenses before reductions | 1.99% | 2.04% | 2.07% | 2.06% | 2.12% |
| Expenses net of fee waivers, if any | 1.99% | 2.04% | 2.07% | 2.06% | 2.12% |
| Expenses net of all reductions | 1.98% | 2.04% | 2.06% | 2.05% | 2.12% |
| Net investment income (loss) | (.11)% | (.15)% | .26%B | (.15)% | .06% |
| Supplemental Data | | | | | |
| Net assets, end of period (000 omitted) | $60,489 | $68,908 | $52,738 | $52,378 | $32,737 |
| Portfolio turnover rateH | 34% | 22% | 29% | 26% | 27% |
A Calculated based on average shares outstanding during the period.
B Net investment income per share reflects a large, non-recurring dividend which amounted to $.04 per share. Excluding this non-recurring dividend, the ratio of net investment income (loss) to average net assets would have been (.12) %.
C Amount represents less than $.005 per share.
D Total returns would have been lower if certain expenses had not been reduced during the applicable periods shown.
E Total returns do not include the effect of the contingent deferred sales charge.
F Fees and expenses of any underlying Fidelity Central Funds are not included in the Fund's expense ratio. The Fund indirectly bears its proportionate share of the expenses of any underlying Fidelity Central Funds.
G Expense ratios reflect operating expenses of the class. Expenses before reductions do not reflect amounts reimbursed by the investment adviser or reductions from brokerage service arrangements or reductions from other expense offset arrangements and do not represent the amount paid by the class during periods when reimbursements or reductions occur. Expenses net of fee waivers reflect expenses after reimbursement by the investment adviser but prior to reductions from brokerage service arrangements or other expense offset arrangements. Expenses net of all reductions represent the net expenses paid by the class.
H Amount does not include the portfolio activity of any underlying Fidelity Central Funds.
See accompanying notes which are an integral part of the financial statements.
Fidelity International Growth Fund
| Years ended October 31, | 2018 | 2017 | 2016 | 2015 | 2014 |
| Selected Per–Share Data | | | | | |
| Net asset value, beginning of period | $13.45 | $10.97 | $11.38 | $11.10 | $10.84 |
| Income from Investment Operations | | | | | |
| Net investment income (loss)A | .13 | .10 | .15B | .11 | .13 |
| Net realized and unrealized gain (loss) | (.92) | 2.51 | (.47) | .26 | .19 |
| Total from investment operations | (.79) | 2.61 | (.32) | .37 | .32 |
| Distributions from net investment income | (.08) | (.13) | (.08) | (.09) | (.05) |
| Distributions from net realized gain | (.02) | – | (.01) | – | (.01) |
| Total distributions | (.09)C | (.13) | (.09) | (.09) | (.06) |
| Redemption fees added to paid in capitalA | – | –D | –D | –D | –D |
| Net asset value, end of period | $12.57 | $13.45 | $10.97 | $11.38 | $11.10 |
| Total ReturnE | (5.89)% | 24.14% | (2.87)% | 3.36% | 2.96% |
| Ratios to Average Net AssetsF,G | | | | | |
| Expenses before reductions | .95% | 1.03% | .99% | .97% | 1.04% |
| Expenses net of fee waivers, if any | .95% | 1.03% | .99% | .97% | 1.04% |
| Expenses net of all reductions | .94% | 1.03% | .98% | .96% | 1.04% |
| Net investment income (loss) | .93% | .87% | 1.34%B | .94% | 1.14% |
| Supplemental Data | | | | | |
| Net assets, end of period (000 omitted) | $811,101 | $961,775 | $1,038,771 | $938,348 | $635,607 |
| Portfolio turnover rateH | 34% | 22% | 29% | 26% | 27% |
A Calculated based on average shares outstanding during the period.
B Net investment income per share reflects a large, non-recurring dividend which amounted to $.04 per share. Excluding this non-recurring dividend, the ratio of net investment income (loss) to average net assets would have been .96%.
C Total distributions of $.09 per share is comprised of distributions from net investment income of $.079 and distributions from net realized gain of $.015 per share.
D Amount represents less than $.005 per share.
E Total returns would have been lower if certain expenses had not been reduced during the applicable periods shown.
F Fees and expenses of any underlying Fidelity Central Funds are not included in the Fund's expense ratio. The Fund indirectly bears its proportionate share of the expenses of any underlying Fidelity Central Funds.
G Expense ratios reflect operating expenses of the class. Expenses before reductions do not reflect amounts reimbursed by the investment adviser or reductions from brokerage service arrangements or reductions from other expense offset arrangements and do not represent the amount paid by the class during periods when reimbursements or reductions occur. Expenses net of fee waivers reflect expenses after reimbursement by the investment adviser but prior to reductions from brokerage service arrangements or other expense offset arrangements. Expenses net of all reductions represent the net expenses paid by the class.
H Amount does not include the portfolio activity of any underlying Fidelity Central Funds.
See accompanying notes which are an integral part of the financial statements.
Fidelity International Growth Fund Class I
| Years ended October 31, | 2018 | 2017 | 2016 | 2015 | 2014 |
| Selected Per–Share Data | | | | | |
| Net asset value, beginning of period | $13.43 | $10.95 | $11.36 | $11.08 | $10.84 |
| Income from Investment Operations | | | | | |
| Net investment income (loss)A | .13 | .11 | .15B | .11 | .13 |
| Net realized and unrealized gain (loss) | (.91) | 2.51 | (.47) | .27 | .18 |
| Total from investment operations | (.78) | 2.62 | (.32) | .38 | .31 |
| Distributions from net investment income | (.09) | (.14) | (.08) | (.10) | (.06) |
| Distributions from net realized gain | (.02) | – | (.01) | – | (.01) |
| Total distributions | (.10)C | (.14) | (.09) | (.10) | (.07) |
| Redemption fees added to paid in capitalA | – | –D | –D | –D | –D |
| Net asset value, end of period | $12.55 | $13.43 | $10.95 | $11.36 | $11.08 |
| Total ReturnE | (5.83)% | 24.23% | (2.87)% | 3.41% | 2.84% |
| Ratios to Average Net AssetsF,G | | | | | |
| Expenses before reductions | .93% | .98% | .98% | .98% | 1.04% |
| Expenses net of fee waivers, if any | .93% | .98% | .98% | .98% | 1.04% |
| Expenses net of all reductions | .92% | .97% | .98% | .97% | 1.04% |
| Net investment income (loss) | .94% | .92% | 1.34%B | .94% | 1.14% |
| Supplemental Data | | | | | |
| Net assets, end of period (000 omitted) | $660,961 | $728,227 | $359,676 | $267,745 | $121,554 |
| Portfolio turnover rateH | 34% | 22% | 29% | 26% | 27% |
A Calculated based on average shares outstanding during the period.
B Net investment income per share reflects a large, non-recurring dividend which amounted to $.04 per share. Excluding this non-recurring dividend, the ratio of net investment income (loss) to average net assets would have been .97%.
C Total distributions of $.10 per share is comprised of distributions from net investment income of $.089 and distributions from net realized gain of $.015 per share.
D Amount represents less than $.005 per share.
E Total returns would have been lower if certain expenses had not been reduced during the applicable periods shown.
F Fees and expenses of any underlying Fidelity Central Funds are not included in the Fund's expense ratio. The Fund indirectly bears its proportionate share of the expenses of any underlying Fidelity Central Funds.
G Expense ratios reflect operating expenses of the class. Expenses before reductions do not reflect amounts reimbursed by the investment adviser or reductions from brokerage service arrangements or reductions from other expense offset arrangements and do not represent the amount paid by the class during periods when reimbursements or reductions occur. Expenses net of fee waivers reflect expenses after reimbursement by the investment adviser but prior to reductions from brokerage service arrangements or other expense offset arrangements. Expenses net of all reductions represent the net expenses paid by the class.
H Amount does not include the portfolio activity of any underlying Fidelity Central Funds.
See accompanying notes which are an integral part of the financial statements.
Fidelity International Growth Fund Class Z
| Years ended October 31, | 2018 | 2017 | 2016 | 2015 | 2014 |
| Selected Per–Share Data | | | | | |
| Net asset value, beginning of period | $13.45 | $10.97 | $11.38 | $11.10 | $10.84 |
| Income from Investment Operations | | | | | |
| Net investment income (loss)A | .15 | .13 | .16B | .12 | .14 |
| Net realized and unrealized gain (loss) | (.91) | 2.50 | (.47) | .27 | .19 |
| Total from investment operations | (.76) | 2.63 | (.31) | .39 | .33 |
| Distributions from net investment income | (.10) | (.15) | (.09) | (.11) | (.06) |
| Distributions from net realized gain | (.02) | – | (.01) | – | (.01) |
| Total distributions | (.12) | (.15) | (.10) | (.11) | (.07) |
| Redemption fees added to paid in capitalA | – | – | – | – | – |
| Net asset value, end of period | $12.57 | $13.45 | $10.97 | $11.38 | $11.10 |
| Total ReturnC | (5.71)% | 24.33% | (2.73)% | 3.52% | 3.07% |
| Ratios to Average Net AssetsD,E | | | | | |
| Expenses before reductions | .80% | .84% | .85% | .84% | .88% |
| Expenses net of fee waivers, if any | .80% | .84% | .85% | .84% | .88% |
| Expenses net of all reductions | .79% | .84% | .84% | .83% | .88% |
| Net investment income (loss) | 1.08% | 1.05% | 1.48%B | 1.07% | 1.30% |
| Supplemental Data | | | | | |
| Net assets, end of period (000 omitted) | $556,558 | $373,878 | $16,977 | $897 | $104 |
| Portfolio turnover rateF | 34% | 22% | 29% | 26% | 27% |
A Calculated based on average shares outstanding during the period.
B Net investment income per share reflects a large, non-recurring dividend which amounted to $.04 per share. Excluding this non-recurring dividend, the ratio of net investment income (loss) to average net assets would have been 1.10%.
C Total returns would have been lower if certain expenses had not been reduced during the applicable periods shown.
D Fees and expenses of any underlying Fidelity Central Funds are not included in the Fund's expense ratio. The Fund indirectly bears its proportionate share of the expenses of any underlying Fidelity Central Funds.
E Amount represents less than $.005 per share.
F Amount does not include the portfolio activity of any underlying Fidelity Central Funds.
See accompanying notes which are an integral part of the financial statements.
Notes to Financial Statements
For the period ended October 31, 2018
1. Organization.
Fidelity International Growth Fund (the Fund) is a fund of Fidelity Investment Trust (the Trust) and is authorized to issue an unlimited number of shares. The Trust is registered under the Investment Company Act of 1940, as amended (the 1940 Act), as an open-end management investment company organized as a Massachusetts business trust. The Fund offers Class A, Class M, Class C, International Growth, Class I and Class Z shares, each of which has equal rights as to assets and voting privileges. Each class has exclusive voting rights with respect to matters that affect that class.
2. Investments in Fidelity Central Funds.
The Fund invests in Fidelity Central Funds, which are open-end investment companies generally available only to other investment companies and accounts managed by the investment adviser and its affiliates. The Fund's Schedule of Investments lists each of the Fidelity Central Funds held as of period end, if any, as an investment of the Fund, but does not include the underlying holdings of each Fidelity Central Fund. As an Investing Fund, the Fund indirectly bears its proportionate share of the expenses of the underlying Fidelity Central Funds.
The Money Market Central Funds seek preservation of capital and current income and are managed by Fidelity Investments Money Management, Inc. (FIMM), an affiliate of the investment adviser. Annualized expenses of the Money Market Central Funds as of their most recent shareholder report date are less than .005%.
A complete unaudited list of holdings for each Fidelity Central Fund is available upon request or at the Securities and Exchange Commission (the SEC) website at www.sec.gov. In addition, the financial statements of the Fidelity Central Funds, which are not covered by the Fund's Report of Independent Registered Public Accounting Firm, are available on the SEC website or upon request.
3. Significant Accounting Policies.
The Fund is an investment company and applies the accounting and reporting guidance of the Financial Accounting Standards Board (FASB) Accounting Standards Codification Topic 946 Financial Services – Investments Companies. The financial statements have been prepared in conformity with accounting principles generally accepted in the United States of America (GAAP), which require management to make certain estimates and assumptions at the date of the financial statements. Actual results could differ from those estimates. Subsequent events, if any, through the date that the financial statements were issued have been evaluated in the preparation of the financial statements. The following summarizes the significant accounting policies of the Fund:
Investment Valuation. Investments are valued as of 4:00 p.m. Eastern time on the last calendar day of the period. The Board of Trustees (the Board) has delegated the day to day responsibility for the valuation of the Fund's investments to the Fair Value Committee (the Committee) established by the Fund's investment adviser. In accordance with valuation policies and procedures approved by the Board, the Fund attempts to obtain prices from one or more third party pricing vendors or brokers to value its investments. When current market prices, quotations or currency exchange rates are not readily available or reliable, investments will be fair valued in good faith by the Committee, in accordance with procedures adopted by the Board. Factors used in determining fair value vary by investment type and may include market or investment specific events. The frequency with which these procedures are used cannot be predicted and they may be utilized to a significant extent. The Committee oversees the Fund's valuation policies and procedures and reports to the Board on the Committee's activities and fair value determinations. The Board monitors the appropriateness of the procedures used in valuing the Fund's investments and ratifies the fair value determinations of the Committee.
The Fund categorizes the inputs to valuation techniques used to value its investments into a disclosure hierarchy consisting of three levels as shown below:
- Level 1 – quoted prices in active markets for identical investments
- Level 2 – other significant observable inputs (including quoted prices for similar investments, interest rates, prepayment speeds, etc.)
- Level 3– unobservable inputs (including the Fund's own assumptions based on the best information available)
Valuation techniques used to value the Fund's investments by major category are as follows:
Equity securities, including restricted securities, for which market quotations are readily available, are valued at the last reported sale price or official closing price as reported by a third party pricing vendor on the primary market or exchange on which they are traded and are categorized as Level 1 in the hierarchy. In the event there were no sales during the day or closing prices are not available, securities are valued at the last quoted bid price or may be valued using the last available price and are generally categorized as Level 2 in the hierarchy. For foreign equity securities, when market or security specific events arise, comparisons to the valuation of American Depositary Receipts (ADRs), futures contracts, Exchange-Traded Funds (ETFs) and certain indexes as well as quoted prices for similar securities may be used and would be categorized as Level 2 in the hierarchy. Utilizing these techniques may result in transfers between Level 1 and Level 2. For equity securities, including restricted securities, where observable inputs are limited, assumptions about market activity and risk are used and these securities may be categorized as Level 3 in the hierarchy.
Investments in open-end mutual funds, including the Fidelity Central Funds, are valued at their closing net asset value (NAV) each business day and are categorized as Level 1 in the hierarchy.
Changes in valuation techniques may result in transfers in or out of an assigned level within the disclosure hierarchy. The aggregate value of investments by input level as of October 31, 2018, including information on transfers between Levels 1 and 2 is included at the end of the Fund's Schedule of Investments.
Foreign Currency. The Fund may use foreign currency contracts to facilitate transactions in foreign-denominated securities. Gains and losses from these transactions may arise from changes in the value of the foreign currency or if the counterparties do not perform under the contracts' terms.
Foreign-denominated assets, including investment securities, and liabilities are translated into U.S. dollars at the exchange rates at period end. Purchases and sales of investment securities, income and dividends received and expenses denominated in foreign currencies are translated into U.S. dollars at the exchange rate in effect on the transaction date.
The effects of exchange rate fluctuations on investments are included with the net realized and unrealized gain (loss) on investment securities. Other foreign currency transactions resulting in realized and unrealized gain (loss) are disclosed separately.
Investment Transactions and Income. For financial reporting purposes, the Fund's investment holdings and NAV include trades executed through the end of the last business day of the period. The NAV per share for processing shareholder transactions is calculated as of the close of business of the New York Stock Exchange (NYSE), normally 4:00 p.m. Eastern time and includes trades executed through the end of the prior business day. Gains and losses on securities sold are determined on the basis of identified cost and include proceeds received from litigation. Dividend income is recorded on the ex-dividend date, except for certain dividends from foreign securities where the ex-dividend date may have passed, which are recorded as soon as the Fund is informed of the ex-dividend date. Non-cash dividends included in dividend income, if any, are recorded at the fair market value of the securities received. Income and capital gain distributions from Fidelity Central Funds, if any, are recorded on the ex-dividend date. Certain distributions received by the Fund represent a return of capital or capital gain. The Fund determines the components of these distributions subsequent to the ex-dividend date, based upon receipt of tax filings or other correspondence relating to the underlying investment. These distributions are recorded as a reduction of cost of investments and/or as a realized gain. Investment income is recorded net of foreign taxes withheld where recovery of such taxes is uncertain.
Class Allocations and Expenses. Investment income, realized and unrealized capital gains and losses, common expenses of the Fund, and certain fund-level expense reductions, if any, are allocated daily on a pro-rata basis to each class based on the relative net assets of each class to the total net assets of the Fund. Each class differs with respect to transfer agent and distribution and service plan fees incurred. Certain expense reductions may also differ by class. For the reporting period, the allocated portion of income and expenses to each class as a percent of its average net assets may vary due to the timing of recording these transactions in relation to fluctuating net assets of the classes. Expenses directly attributable to a fund are charged to that fund. Expenses attributable to more than one fund are allocated among the respective funds on the basis of relative net assets or other appropriate methods. Expense estimates are accrued in the period to which they relate and adjustments are made when actual amounts are known.
Income Tax Information and Distributions to Shareholders. Each year, the Fund intends to qualify as a regulated investment company under Subchapter M of the Internal Revenue Code, including distributing substantially all of its taxable income and realized gains. As a result, no provision for U.S. Federal income taxes is required. As of October 31, 2018, the Fund did not have any unrecognized tax benefits in the financial statements; nor is the Fund aware of any tax positions for which it is reasonably possible that the total amounts of unrecognized tax benefits will significantly change in the next twelve months. The Fund files a U.S. federal tax return, in addition to state and local tax returns as required. The Fund's federal income tax returns are subject to examination by the Internal Revenue Service (IRS) for a period of three fiscal years after they are filed. State and local tax returns may be subject to examination for an additional fiscal year depending on the jurisdiction. Foreign taxes are provided for based on the Fund's understanding of the tax rules and rates that exist in the foreign markets in which it invests.
Distributions are declared and recorded on the ex-dividend date. Income and capital gain distributions are declared separately for each class. Income and capital gain distributions are determined in accordance with income tax regulations, which may differ from GAAP. In addition, the Fund claimed a portion of the payment made to redeeming shareholders as a distribution for income tax purposes.
Capital accounts within the financial statements are adjusted for permanent book-tax differences. These adjustments have no impact on net assets or the results of operations. Capital accounts are not adjusted for temporary book-tax differences which will reverse in a subsequent period.
Book-tax differences are primarily due to foreign currency transactions, certain foreign taxes, passive foreign investment companies (PFIC), capital loss carryforwards and losses deferred due to wash sales.
As of period end, the cost and unrealized appreciation (depreciation) in securities, and derivatives if applicable, for federal income tax purposes were as follows:
| Gross unrealized appreciation | $441,942,392 |
| Gross unrealized depreciation | (105,336,047) |
| Net unrealized appreciation (depreciation) | $336,606,345 |
| Tax Cost | $1,955,968,613 |
The tax-based components of distributable earnings as of period end were as follows:
| Undistributed ordinary income | $19,275,635 |
| Capital loss carryforward | $(84,264,210) |
| Net unrealized appreciation (depreciation) on securities and other investments | $336,450,152 |
Capital loss carryforwards are only available to offset future capital gains of the Fund to the extent provided by regulations and may be limited. Under the Regulated Investment Company Modernization Act of 2010 (the Act), the Fund is permitted to carry forward capital losses incurred in taxable years beginning after December 22, 2010 for an unlimited period and such capital losses are required to be used prior to any losses that expire. The capital loss carryforward information presented below, including any applicable limitation, is estimated as of fiscal period end and is subject to adjustment.
| No expiration | |
| Short-term | $(75,102,155) |
| Long-term | (9,162,055) |
| Total no expiration | $(84,264,210) |
The tax character of distributions paid was as follows:
| | October 31, 2018 | October 31, 2017 |
| Ordinary Income | $16,636,167 | $ 18,629,181 |
New Rule Issuance. During August 2018, the U.S. Securities and Exchange Commission issued Final Rule Release No. 33-10532, Disclosure Update and Simplification. This Final Rule includes amendments specific to registered investment companies that are intended to eliminate overlap in disclosure requirements between Regulation S-X and GAAP. In accordance with these amendments, certain line-items in the Fund's financial statements have been combined or removed for the current period as outlined in the table below.
| Financial Statement | Current Line-Item Presentation | Prior Line-Item Presentation |
| Statement of Assets and Liabilities | Total distributable earnings (loss) | Undistributed/Distributions in excess of/Accumulated net investment income (loss)
Accumulated/Undistributed net realized gain (loss)
Net unrealized appreciation (depreciation) |
| Statement of Changes in Net Assets | N/A - removed | Undistributed/Distributions in excess of/Accumulated net investment income (loss) end of period |
| Statement of Changes in Net Assets | Distributions to shareholders | Distributions to shareholders from net investment income
Distributions to shareholders from net realized gain |
| Distributions to Shareholders Note to Financial Statements | Distributions to shareholders | Distributions to shareholders from net investment income
Distributions to shareholders from net realized gain |
4. Purchases and Sales of Investments.
Purchases and sales of securities, other than short-term securities, aggregated $817,415,801 and $799,943,289, respectively.
5. Fees and Other Transactions with Affiliates.
Management Fee. Fidelity Management & Research Company (the investment adviser) and its affiliates provide the Fund with investment management related services for which the Fund pays a monthly management fee. The management fee is the sum of an individual fund fee rate that is based on an annual rate of .45% of the Fund's average net assets and an annualized group fee rate that averaged .24% during the period. The group fee rate is based upon the average net assets of all the mutual funds advised by the investment adviser, including any mutual funds previously advised by the investment adviser that are currently advised by Fidelity SelectCo, LLC, an affiliate of the investment adviser. The group fee rate decreases as assets under management increase and increases as assets under management decrease. In addition, the management fee is subject to a performance adjustment (up to a maximum of +/- .20% of the Fund's average net assets over a 36 month performance period). The upward or downward adjustment to the management fee is based on the relative investment performance of International Growth as compared to its benchmark index, the MSCI EAFE Growth Index, over the same 36 month performance period. For the reporting period, the total annual management fee rate, including the performance adjustment, was .69% of the Fund's average net assets. The performance adjustment included in the management fee rate may be higher or lower than the maximum performance adjustment rate due to the difference between the average net assets for the reporting and performance periods.
Distribution and Service Plan Fees. In accordance with Rule 12b-1 of the 1940 Act, the Fund has adopted separate Distribution and Service Plans for each class of shares. Certain classes pay Fidelity Distributors Corporation (FDC), an affiliate of the investment adviser, separate Distribution and Service Fees, each of which is based on an annual percentage of each class' average net assets. In addition, FDC may pay financial intermediaries for selling shares of the Fund and providing shareholder support services. For the period, the Distribution and Service Fee rates, total fees and amounts retained by FDC were as follows:
| | Distribution Fee | Service Fee | Total Fees | Retained by FDC |
| Class A | -% | .25% | $396,877 | $14,365 |
| Class M | .25% | .25% | 159,678 | 3,547 |
| Class C | .75% | .25% | 705,185 | 143,829 |
| | | | $1,261,740 | $161,741 |
Sales Load. FDC may receive a front-end sales charge of up to 5.75% for selling Class A shares and 3.50% for selling Class M shares, some of which is paid to financial intermediaries for selling shares of the Fund. Depending on the holding period, FDC may receive contingent deferred sales charges levied on Class A, Class M and Class C redemptions. The deferred sales charges are 1.00% for Class C shares, 1.00% for certain purchases of Class A shares and .25% for certain purchases of Class M shares.
For the period, sales charge amounts retained by FDC were as follows:
| | Retained by FDC |
| Class A | $90,521 |
| Class M | 8,492 |
| Class CA | 10,189 |
| | $109,202 |
A When Class C shares are initially sold, FDC pays commissions from its own resources to financial intermediaries through which the sales are made.
Transfer Agent Fees. Fidelity Investments Institutional Operations Company, Inc., (FIIOC), an affiliate of the investment adviser, is the transfer, dividend disbursing and shareholder servicing agent for each class of the Fund. FIIOC receives account fees and asset-based fees that vary according to the account size and type of account of the shareholders of the respective classes of the Fund, except for Class Z. FIIOC receives an asset-based fee of Class Z's average net assets. FIIOC pays for typesetting, printing and mailing of shareholder reports, except proxy statements.
For the period, transfer agent fees for each class were as follows:
| | Amount | % of Class-Level Average Net Assets |
| Class A | $363,270 | .23 |
| Class M | 88,795 | .28 |
| Class C | 162,658 | .23 |
| International Growth | 1,837,674 | .19 |
| Class I | 1,336,626 | .18 |
| Class Z | 224,821 | .05 |
| | $4,013,844 | |
Accounting and Security Lending Fees. Fidelity Service Company, Inc. (FSC), an affiliate of the investment adviser, maintains the Fund's accounting records. The accounting fee is based on the level of average net assets for each month. Under a separate contract, FSC administers the security lending program. The security lending fee is based on the number and duration of lending transactions. For the period, the fees were equivalent to an annual rate of .04%.
Brokerage Commissions. The Fund placed a portion of its portfolio transactions with brokerage firms which are affiliates of the investment adviser. Brokerage commissions are included in net realized gain (loss) and change in net unrealized appreciation (depreciation) in the Statement of Operations. The commissions paid to these affiliated firms were $3,788 for the period.
Interfund Lending Program. Pursuant to an Exemptive Order issued by the SEC, the Fund, along with other registered investment companies having management contracts with Fidelity Management & Research Company (FMR) or other affiliated entities of FMR, may participate in an interfund lending program. This program provides an alternative credit facility allowing the funds to borrow from, or lend money to, other participating affiliated funds. At period end, there were no interfund loans outstanding. The Fund's activity in this program during the period for which loans were outstanding was as follows:
| Borrower or Lender | Average Loan Balance | Weighted Average Interest Rate | Interest Expense |
| Borrower | $40,450,167 | 1.90% | $12,804 |
Interfund Trades. The Fund may purchase from or sell securities to other Fidelity Funds under procedures adopted by the Board. The procedures have been designed to ensure these interfund trades are executed in accordance with Rule 17a-7 of the 1940 Act. Interfund trades are included within the respective purchases and sales amounts shown in the Purchases and Sales of Investments note.
Other. During the period, the investment adviser reimbursed the Fund for certain losses in the amount of $113,811.
6. Committed Line of Credit.
The Fund participates with other funds managed by the investment adviser or an affiliate in a $4.25 billion credit facility (the "line of credit") to be utilized for temporary or emergency purposes to fund shareholder redemptions or for other short-term liquidity purposes. The Fund has agreed to pay commitment fees on its pro-rata portion of the line of credit, which amounted to $6,672 and is reflected in Miscellaneous expenses on the Statement of Operations. During the period, the Fund did not borrow on this line of credit.
7. Security Lending.
The Fund lends portfolio securities through a lending agent from time to time in order to earn additional income. For equity securities, a lending agent is used and may loan securities to certain qualified borrowers, including Fidelity Capital Markets (FCM), a broker-dealer affiliated with the Fund. On the settlement date of the loan, the Fund receives collateral (in the form of U.S. Treasury obligations, letters of credit and/or cash) against the loaned securities and maintains collateral in an amount not less than 100% of the market value of the loaned securities during the period of the loan. The market value of the loaned securities is determined at the close of business of the Fund and any additional required collateral is delivered to the Fund on the next business day. The Fund or borrower may terminate the loan at any time, and if the borrower defaults on its obligation to return the securities loaned because of insolvency or other reasons, the Fund may apply collateral received from the borrower against the obligation. The Fund may experience delays and costs in recovering the securities loaned. Any cash collateral received is invested in the Fidelity Securities Lending Cash Central Fund. The value of loaned securities and cash collateral at period end are disclosed on the Fund's Statement of Assets and Liabilities. At period end, there were no security loans outstanding with FCM. Security lending income represents the income earned on investing cash collateral, less rebates paid to borrowers and any lending agent fees associated with the loan, plus any premium payments received for lending certain types of securities. Security lending income is presented in the Statement of Operations as a component of income from Fidelity Central Funds. Total security lending income during the period amounted to $462,892, including $670 from securities loaned to FCM.
8. Expense Reductions.
Commissions paid to certain brokers with whom the investment adviser, or its affiliates, places trades on behalf of the Fund include an amount in addition to trade execution, which may be rebated back to the Fund to offset certain expenses. This amount totaled $246,329 for the period. Through arrangements with the Fund's custodian credits realized as a result of certain uninvested cash balances were used to reduce the Fund's expenses. During the period, these credits reduced the Fund's expenses by $1,271.
In addition, during the period the investment adviser reimbursed and/or waived a portion of fund-level operating expenses in the amount of $23,847.
9. Distributions to Shareholders.
Distributions to shareholders of each class were as follows:
| | Year ended
October 31, 2018 | Year ended
October 31, 2017 |
| Distributions to shareholders | | |
| Class A | $667,281 | $– |
| Class M | 48,590 | – |
| International Growth | 6,746,881 | – |
| Class I | 5,822,889 | – |
| Class Z | 3,350,526 | – |
| Total | $16,636,167 | $– |
| From net investment income | | |
| Class A | $– | $1,997,030 |
| Class M | – | 186,824 |
| Class C | – | 77,926 |
| International Growth | – | 11,653,320 |
| Class I | – | 4,492,180 |
| Class Z | – | 221,901 |
| Total | $– | $18,629,181 |
10. Share Transactions.
Share transactions for each class were as follows and may contain automatic conversions between classes or exchanges between affiliated funds:
| | Shares | Shares | Dollars | Dollars |
| | Year ended October 31, 2018 | Year ended October 31, 2017 | Year ended October 31, 2018 | Year ended October 31, 2017 |
| Class A | | | | |
| Shares sold | 2,575,636 | 4,137,031 | $35,129,838 | $48,223,768 |
| Reinvestment of distributions | 49,581 | 187,295 | 663,775 | 1,972,221 |
| Shares redeemed | (3,261,091) | (12,953,360) | (44,291,373) | (147,524,032) |
| Net increase (decrease) | (635,874) | (8,629,034) | $(8,497,760) | $(97,328,043) |
| Class M | | | | |
| Shares sold | 349,635 | 634,763 | $4,771,254 | $7,389,758 |
| Reinvestment of distributions | 3,624 | 17,518 | 48,527 | 184,470 |
| Shares redeemed | (748,765) | (705,137) | (10,142,042) | (8,346,528) |
| Net increase (decrease) | (395,506) | (52,856) | $(5,322,261) | $(772,300) |
| Class C | | | | |
| Shares sold | 1,082,980 | 1,572,029 | $14,574,249 | $18,704,209 |
| Reinvestment of distributions | – | 7,327 | – | 76,279 |
| Shares redeemed | (1,386,849) | (1,259,133) | (18,440,770) | (14,766,822) |
| Net increase (decrease) | (303,869) | 320,223 | $(3,866,521) | $4,013,666 |
| International Growth | | | | |
| Shares sold | 19,748,706 | 28,743,527 | $271,435,270 | $341,195,764 |
| Reinvestment of distributions | 469,327 | 929,056 | 6,314,733 | 9,838,706 |
| Shares redeemed | (27,217,331) | (52,869,764) | (371,174,329) | (601,819,958) |
| Net increase (decrease) | (6,999,298) | (23,197,181) | $(93,424,326) | $(250,785,488) |
| Class I | | | | |
| Shares sold | 23,675,678 | 38,959,806 | $322,195,941 | $465,525,076 |
| Reinvestment of distributions | 352,717 | 415,087 | 4,735,014 | 4,387,467 |
| Shares redeemed | (25,574,189) | (17,997,694) | (351,174,190) | (214,014,368) |
| Net increase (decrease) | (1,545,794) | 21,377,199 | $(24,243,235) | $255,898,175 |
| Class Z | | | | |
| Shares sold | 27,518,013 | 35,134,319 | $376,275,009 | $405,268,628 |
| Reinvestment of distributions | 140,992 | 20,974 | 1,894,059 | 221,901 |
| Shares redeemed | (11,179,068) | (8,913,102) | (147,776,486) | (105,624,601) |
| Net increase (decrease) | 16,479,937 | 26,242,191 | $230,392,582 | $299,865,928 |
11. Other.
The Fund's organizational documents provide former and current trustees and officers with a limited indemnification against liabilities arising in connection with the performance of their duties to the Fund. In the normal course of business, the Fund may also enter into contracts that provide general indemnifications. The Fund's maximum exposure under these arrangements is unknown as this would be dependent on future claims that may be made against the Fund. The risk of material loss from such claims is considered remote.
Report of Independent Registered Public Accounting Firm
To the Board of Trustees of Fidelity Investment Trust and Shareholders of Fidelity International Growth Fund:
Opinion on the Financial Statements
We have audited the accompanying statement of assets and liabilities, including the schedule of investments, of Fidelity International Growth Fund (one of the funds constituting Fidelity Investment Trust, referred to hereafter as the "Fund") as of October 31, 2018, the related statement of operations for the year ended October 31, 2018, the statement of changes in net assets for each of the two years in the period ended October 31, 2018, including the related notes, and the financial highlights for each of the five years in the period ended October 31, 2018 (collectively referred to as the “financial statements”). In our opinion, the financial statements present fairly, in all material respects, the financial position of the Fund as of October 31, 2018, the results of its operations for the year then ended, the changes in its net assets for each of the two years in the period ended October 31, 2018 and the financial highlights for each of the five years in the period ended October 31, 2018 in conformity with accounting principles generally accepted in the United States of America.
Basis for Opinion
These financial statements are the responsibility of the Fund’s management. Our responsibility is to express an opinion on the Fund’s financial statements based on our audits. We are a public accounting firm registered with the Public Company Accounting Oversight Board (United States) (“PCAOB”) and are required to be independent with respect to the Fund in accordance with the U.S. federal securities laws and the applicable rules and regulations of the Securities and Exchange Commission and the PCAOB.
We conducted our audits of these financial statements in accordance with the standards of the PCAOB. Those standards require that we plan and perform the audit to obtain reasonable assurance about whether the financial statements are free of material misstatement, whether due to error or fraud.
Our audits included performing procedures to assess the risks of material misstatement of the financial statements, whether due to error or fraud, and performing procedures that respond to those risks. Such procedures included examining, on a test basis, evidence regarding the amounts and disclosures in the financial statements. Our audits also included evaluating the accounting principles used and significant estimates made by management, as well as evaluating the overall presentation of the financial statements. Our procedures included confirmation of securities owned as of October 31, 2018 by correspondence with the custodian and brokers; when replies were not received from brokers, we performed other auditing procedures. We believe that our audits provide a reasonable basis for our opinion.
PricewaterhouseCoopers LLP
Boston, Massachusetts
December 18, 2018
We have served as the auditor of one or more investment companies in the Fidelity group of funds since 1932.
Trustees and Officers
The Trustees, Members of the Advisory Board (if any), and officers of the trust and fund, as applicable, are listed below. The Board of Trustees governs the fund and is responsible for protecting the interests of shareholders. The Trustees are experienced executives who meet periodically throughout the year to oversee the fund's activities, review contractual arrangements with companies that provide services to the fund, oversee management of the risks associated with such activities and contractual arrangements, and review the fund's performance. Except for Jonathan Chiel, each of the Trustees oversees 283 funds. Mr. Chiel oversees 154 funds.
The Trustees hold office without limit in time except that (a) any Trustee may resign; (b) any Trustee may be removed by written instrument, signed by at least two-thirds of the number of Trustees prior to such removal; (c) any Trustee who requests to be retired or who has become incapacitated by illness or injury may be retired by written instrument signed by a majority of the other Trustees; and (d) any Trustee may be removed at any special meeting of shareholders by a two-thirds vote of the outstanding voting securities of the trust. Each Trustee who is not an interested person (as defined in the 1940 Act) of the trust and the fund is referred to herein as an Independent Trustee. Each Independent Trustee shall retire not later than the last day of the calendar year in which his or her 75th birthday occurs. The Independent Trustees may waive this mandatory retirement age policy with respect to individual Trustees. Officers and Advisory Board Members hold office without limit in time, except that any officer or Advisory Board Member may resign or may be removed by a vote of a majority of the Trustees at any regular meeting or any special meeting of the Trustees. Except as indicated, each individual has held the office shown or other offices in the same company for the past five years.
The fund’s Statement of Additional Information (SAI) includes more information about the Trustees. To request a free copy, call Fidelity at 1-800-544-8544.
Experience, Skills, Attributes, and Qualifications of the Trustees. The Governance and Nominating Committee has adopted a statement of policy that describes the experience, qualifications, attributes, and skills that are necessary and desirable for potential Independent Trustee candidates (Statement of Policy). The Board believes that each Trustee satisfied at the time he or she was initially elected or appointed a Trustee, and continues to satisfy, the standards contemplated by the Statement of Policy. The Governance and Nominating Committee also engages professional search firms to help identify potential Independent Trustee candidates who have the experience, qualifications, attributes, and skills consistent with the Statement of Policy. From time to time, additional criteria based on the composition and skills of the current Independent Trustees, as well as experience or skills that may be appropriate in light of future changes to board composition, business conditions, and regulatory or other developments, have also been considered by the professional search firms and the Governance and Nominating Committee. In addition, the Board takes into account the Trustees' commitment and participation in Board and committee meetings, as well as their leadership of standing and ad hoc committees throughout their tenure.
In determining that a particular Trustee was and continues to be qualified to serve as a Trustee, the Board has considered a variety of criteria, none of which, in isolation, was controlling. The Board believes that, collectively, the Trustees have balanced and diverse experience, qualifications, attributes, and skills, which allow the Board to operate effectively in governing the fund and protecting the interests of shareholders. Information about the specific experience, skills, attributes, and qualifications of each Trustee, which in each case led to the Board's conclusion that the Trustee should serve (or continue to serve) as a trustee of the fund, is provided below.
Board Structure and Oversight Function. James C. Curvey is an interested person and currently serves as Chairman. The Trustees have determined that an interested Chairman is appropriate and benefits shareholders because an interested Chairman has a personal and professional stake in the quality and continuity of services provided to the fund. Independent Trustees exercise their informed business judgment to appoint an individual of their choosing to serve as Chairman, regardless of whether the Trustee happens to be independent or a member of management. The Independent Trustees have determined that they can act independently and effectively without having an Independent Trustee serve as Chairman and that a key structural component for assuring that they are in a position to do so is for the Independent Trustees to constitute a substantial majority for the Board. The Independent Trustees also regularly meet in executive session. Ned C. Lautenbach serves as Chairman of the Independent Trustees and as such (i) acts as a liaison between the Independent Trustees and management with respect to matters important to the Independent Trustees and (ii) with management prepares agendas for Board meetings.
Fidelity® funds are overseen by different Boards of Trustees. The fund's Board oversees Fidelity's high income and certain equity funds, and other Boards oversee Fidelity's investment-grade bond, money market, asset allocation, and other equity funds. The asset allocation funds may invest in Fidelity® funds overseen by the fund's Board. The use of separate Boards, each with its own committee structure, allows the Trustees of each group of Fidelity® funds to focus on the unique issues of the funds they oversee, including common research, investment, and operational issues. On occasion, the separate Boards establish joint committees to address issues of overlapping consequences for the Fidelity® funds overseen by each Board.
The Trustees operate using a system of committees to facilitate the timely and efficient consideration of all matters of importance to the Trustees, the fund, and fund shareholders and to facilitate compliance with legal and regulatory requirements and oversight of the fund's activities and associated risks. The Board, acting through its committees, has charged FMR and its affiliates with (i) identifying events or circumstances the occurrence of which could have demonstrably adverse effects on the fund's business and/or reputation; (ii) implementing processes and controls to lessen the possibility that such events or circumstances occur or to mitigate the effects of such events or circumstances if they do occur; and (iii) creating and maintaining a system designed to evaluate continuously business and market conditions in order to facilitate the identification and implementation processes described in (i) and (ii) above. Because the day-to-day operations and activities of the fund are carried out by or through FMR, its affiliates, and other service providers, the fund's exposure to risks is mitigated but not eliminated by the processes overseen by the Trustees. While each of the Board's committees has responsibility for overseeing different aspects of the fund's activities, oversight is exercised primarily through the Operations, Audit, and Compliance Committees. In addition, the Independent Trustees have worked with Fidelity to enhance the Board's oversight of investment and financial risks, legal and regulatory risks, technology risks, and operational risks, including the development of additional risk reporting to the Board. Appropriate personnel, including but not limited to the fund's Chief Compliance Officer (CCO), FMR's internal auditor, the independent accountants, the fund's Treasurer and portfolio management personnel, make periodic reports to the Board's committees, as appropriate, including an annual review of Fidelity's risk management program for the Fidelity® funds. The responsibilities of each standing committee, including their oversight responsibilities, are described further under "Standing Committees of the Trustees."
Interested Trustees*:
Correspondence intended for a Trustee who is an interested person may be sent to Fidelity Investments, 245 Summer Street, Boston, Massachusetts 02210.
Name, Year of Birth; Principal Occupations and Other Relevant Experience+
Jonathan Chiel (1957)
Year of Election or Appointment: 2016
Trustee
Mr. Chiel also serves as Trustee of other Fidelity® funds. Mr. Chiel is Executive Vice President and General Counsel for FMR LLC (diversified financial services company, 2012-present). Previously, Mr. Chiel served as general counsel (2004-2012) and senior vice president and deputy general counsel (2000-2004) for John Hancock Financial Services; a partner with Choate, Hall & Stewart (1996-2000) (law firm); and an Assistant United States Attorney for the United States Attorney’s Office of the District of Massachusetts (1986-95), including Chief of the Criminal Division (1993-1995). Mr. Chiel is a director on the boards of the Boston Bar Foundation and the Maimonides School.
James C. Curvey (1935)
Year of Election or Appointment: 2007
Trustee
Chairman of the Board of Trustees
Mr. Curvey also serves as Trustee of other Fidelity® funds. Mr. Curvey is Vice Chairman (2007-present) and Director of FMR LLC (diversified financial services company). In addition, Mr. Curvey is an Overseer Emeritus for the Boston Symphony Orchestra, a Director of Artis-Naples, and a Trustee of Brewster Academy in Wolfeboro, New Hampshire. Previously, Mr. Curvey served as a Director of Fidelity Research & Analysis Co. (investment adviser firm, 2009-2018), Director of Fidelity Investments Money Management, Inc. (investment adviser firm, 2009-2014) and a Director of FMR and FMR Co., Inc. (investment adviser firms, 2007-2014).
Charles S. Morrison (1960)
Year of Election or Appointment: 2014
Trustee
Mr. Morrison also serves as Trustee of other funds. He serves as President of Fidelity SelectCo, LLC (investment adviser firm, 2017-present) and Fidelity Management & Research Company (FMR) (investment adviser firm, 2016-present), a Director of Fidelity Investments Money Management, Inc. (FIMM) (investment adviser firm, 2014-present), Director of Fidelity SelectCo, LLC (investment adviser firm, 2014-present), President, Asset Management (2014-present), and is an employee of Fidelity Investments. Previously, Mr. Morrison served as Vice President of Fidelity's Fixed Income and Asset Allocation Funds (2012-2014), President, Fixed Income (2011-2014), Vice President of Fidelity's Money Market Funds (2005-2009), President, Money Market Group Leader of FMR (investment adviser firm, 2009), and Senior Vice President, Money Market Group of FMR (2004-2009). Mr. Morrison also served as Vice President of Fidelity's Bond Funds (2002-2005), certain Balanced Funds (2002-2005), and certain Asset Allocation Funds (2002-2007), and as Senior Vice President (2002-2005) of Fidelity's Bond Division.
* Determined to be an “Interested Trustee” by virtue of, among other things, his or her affiliation with the trust or various entities under common control with FMR.
+ The information includes the Trustee's principal occupation during the last five years and other information relating to the experience, attributes, and skills relevant to the Trustee's qualifications to serve as a Trustee, which led to the conclusion that the Trustee should serve as a Trustee for the fund.
Independent Trustees:
Correspondence intended for an Independent Trustee may be sent to Fidelity Investments, P.O. Box 55235, Boston, Massachusetts 02205-5235.
Name, Year of Birth; Principal Occupations and Other Relevant Experience+
Dennis J. Dirks (1948)
Year of Election or Appointment: 2005
Trustee
Mr. Dirks also serves as Trustee of other Fidelity® funds. Prior to his retirement in May 2003, Mr. Dirks was Chief Operating Officer and a member of the Board of The Depository Trust & Clearing Corporation (DTCC). He also served as President, Chief Operating Officer, and Board member of The Depository Trust Company (DTC) and President and Board member of the National Securities Clearing Corporation (NSCC). In addition, Mr. Dirks served as Chief Executive Officer and Board member of the Government Securities Clearing Corporation, Chief Executive Officer and Board member of the Mortgage-Backed Securities Clearing Corporation, as a Trustee and a member of the Finance Committee of Manhattan College (2005-2008), as a Trustee and a member of the Finance Committee of AHRC of Nassau County (2006-2008), as a member of the Independent Directors Council (IDC) Governing Council (2010-2015), and as a member of the Board of Directors for The Brookville Center for Children’s Services, Inc. (2009-2017). Mr. Dirks is a member of the Finance Committee (2016-present), Board of Directors (2017-present) and Board of Trustees (2018-present) and is Treasurer (2018-present) of the Asolo Repertory Theatre.
Donald F. Donahue (1950)
Year of Election or Appointment: 2018
Trustee
Mr. Donahue also serves as a Trustee of other Fidelity® funds. Mr. Donahue is President and Chief Executive Officer of Miranda Partners, LLC (risk consulting for the financial services industry, 2012-present). Previously, Mr. Donahue served as a Member of the Advisory Board of certain Fidelity® funds (2015-2018) and Chief Executive Officer (2006-2012), Chief Operating Officer (2003-2006), and Managing Director, Customer Marketing and Development (1999-2003) of The Depository Trust & Clearing Corporation (financial markets infrastructure). Mr. Donahue serves as a Member (2007-present) and Co-Chairman (2016-present) of the Board of Directors of United Way of New York, Member of the Board of Directors of NYC Leadership Academy (2012-present) and Member of the Board of Advisors of Ripple Labs, Inc. (financial services, 2015-present). He also served as Chairman (2010-2012) and Member of the Board of Directors (2012-2013) of Omgeo, LLC (financial services), Treasurer of United Way of New York (2012-2016), and Member of the Board of Directors of XBRL US (financial services non-profit, 2009-2012) and the International Securities Services Association (2009-2012).
Alan J. Lacy (1953)
Year of Election or Appointment: 2008
Trustee
Mr. Lacy also serves as Trustee of other Fidelity® funds. Mr. Lacy serves as a Director of Bristol-Myers Squibb Company (global pharmaceuticals, 2008-present). He is a Trustee of the California Chapter of The Nature Conservancy (2015-present) and a Director of the Center for Advanced Study in the Behavioral Sciences at Stanford University (2015-present). In addition, Mr. Lacy served as Senior Adviser (2007-2014) of Oak Hill Capital Partners, L.P. (private equity) and also served as Chief Executive Officer (2005) and Vice Chairman (2005-2006) of Sears Holdings Corporation (retail) and Chief Executive Officer and Chairman of the Board of Sears, Roebuck and Co. (retail, 2000-2005). Previously, Mr. Lacy served as Chairman (2014-2017) and a member (2010-2017) of the Board of Directors of Dave & Buster’s Entertainment, Inc. (restaurant and entertainment complexes), as Chairman (2008-2011) and a member (2006-2015) of the Board of Trustees of the National Parks Conservation Association, and as a member of the Board of Directors for The Hillman Companies, Inc. (hardware wholesalers, 2010-2014), Earth Fare, Inc. (retail grocery, 2010-2014), and The Western Union Company (global money transfer, 2006-2011).
Ned C. Lautenbach (1944)
Year of Election or Appointment: 2000
Trustee
Chairman of the Independent Trustees
Mr. Lautenbach also serves as Trustee of other Fidelity® funds. Mr. Lautenbach currently serves as Vice Chair of the Board of Governors, State University System of Florida (2013-present) and is a member of the Council on Foreign Relations (1994-present). He is also a member and has most recently served as Chairman of the Board of Directors of Artis-Naples (2012-present). Previously, Mr. Lautenbach served as a member and then Lead Director of the Board of Directors of Eaton Corporation (diversified industrial, 1997-2016). He was also a Partner and Advisory Partner at Clayton, Dubilier & Rice, LLC (private equity investment, 1998-2010), as well as a Director of Sony Corporation (2006-2007). In addition, Mr. Lautenbach also had a 30-year career with IBM (technology company) during which time he served as Senior Vice President and a member of the Corporate Executive Committee (1968-1998).
Joseph Mauriello (1944)
Year of Election or Appointment: 2008
Trustee
Mr. Mauriello also serves as Trustee of other Fidelity® funds. Prior to his retirement in January 2006, Mr. Mauriello served in numerous senior management positions including Deputy Chairman and Chief Operating Officer (2004-2005), and Vice Chairman of Financial Services (2002-2004) of KPMG LLP US (professional services, 1965-2005). Mr. Mauriello currently serves as a member of the Independent Directors Council (IDC) Governing Council (2015-present). Previously, Mr. Mauriello served as a member of the Board of Directors of XL Group plc. (global insurance and re-insurance, 2006-2018).
Cornelia M. Small (1944)
Year of Election or Appointment: 2005
Trustee
Ms. Small also serves as Trustee of other Fidelity® funds. Ms. Small is a member of the Board of Directors (2009-present) and Chair of the Investment Committee (2010-present) of the Teagle Foundation. Ms. Small also serves on the Investment Committee of the Berkshire Taconic Community Foundation (2008-present). Previously, Ms. Small served as Chairperson (2002-2008) and a member of the Investment Committee and Chairperson (2008-2012) and a member of the Board of Trustees of Smith College. In addition, Ms. Small served as Chief Investment Officer, Director of Global Equity Investments, and a member of the Board of Directors of Scudder, Stevens & Clark and Scudder Kemper Investments.
Garnett A. Smith (1947)
Year of Election or Appointment: 2018
Trustee
Mr. Smith also serves as Trustee of other Fidelity® funds. Prior to Mr. Smith's retirement, he served as Chairman and Chief Executive Officer of Inbrand Corp. (manufacturer of personal absorbent products, 1990-1997). He also served as President (1986-1990) of Inbrand Corp. Prior to his employment with Inbrand Corp., he was employed by a retail fabric chain and North Carolina National Bank. In addition, Mr. Smith served as a Member of the Advisory Board of certain Fidelity® funds (2012-2013) and as a board member of the Jackson Hole Land Trust (2009-2012).
David M. Thomas (1949)
Year of Election or Appointment: 2008
Trustee
Mr. Thomas also serves as Trustee of other Fidelity® funds. Mr. Thomas serves as Non-Executive Chairman of the Board of Directors of Fortune Brands Home and Security (home and security products, 2011-present), as a member of the Board of Directors (2004-present) and Presiding Director (2013-present) of Interpublic Group of Companies, Inc. (marketing communication), and as a member of the Board of Trustees of the University of Florida (2013-present). Previously, Mr. Thomas served as Executive Chairman (2005-2006) and Chairman and Chief Executive Officer (2000-2005) of IMS Health, Inc. (pharmaceutical and healthcare information solutions), and a Director of Fortune Brands, Inc. (consumer products, 2000-2011).
+ The information includes the Trustee's principal occupation during the last five years and other information relating to the experience, attributes, and skills relevant to the Trustee's qualifications to serve as a Trustee, which led to the conclusion that the Trustee should serve as a Trustee for the fund.
Advisory Board Members and Officers:
Correspondence intended for a Member of the Advisory Board (if any) may be sent to Fidelity Investments, P.O. Box 55235, Boston, Massachusetts 02205-5235. Correspondence intended for an officer or Peter S. Lynch may be sent to Fidelity Investments, 245 Summer Street, Boston, Massachusetts 02210. Officers appear below in alphabetical order.
Name, Year of Birth; Principal Occupation
Vicki L. Fuller (1957)
Year of Election or Appointment: 2018
Member of the Advisory Board
Ms. Fuller also serves as Member of the Advisory Board of other Fidelity® funds. Ms. Fuller serves as a member of the Board of Directors, Audit Committee, and Nominating and Governance Committee of The Williams Companies, Inc. (natural gas infrastructure, 2018-present). Previously, Ms. Fuller served as the Chief Investment Officer of the New York State Common Retirement Fund (2012-2018) and held a variety of positions at AllianceBernstein L.P. (global asset management, 1985-2012), including Managing Director (2006-2012) and Senior Vice President and Senior Portfolio Manager (2001-2006).
Peter S. Lynch (1944)
Year of Election or Appointment: 2003
Member of the Advisory Board
Mr. Lynch also serves as Member of the Advisory Board of other Fidelity® funds. Mr. Lynch is Vice Chairman and a Director of FMR (investment adviser firm) and FMR Co., Inc. (investment adviser firm). In addition, Mr. Lynch serves as a Trustee of Boston College and as the Chairman of the Inner-City Scholarship Fund. Previously, Mr. Lynch served on the Special Olympics International Board of Directors (1997-2006).
William S. Stavropoulos (1939)
Year of Election or Appointment: 2018
Member of the Advisory Board
Mr. Stavropoulos also serves as Member of the Advisory Board of other Fidelity® funds. Mr. Stavropoulos serves as President and Founder of the Michigan Baseball Foundation, the Great Lakes Loons (2007-present). Mr. Stavropoulos is Chairman Emeritus of the Board of Directors of The Dow Chemical Company, where he previously served in numerous senior management positions, including President, CEO (1995-2000; 2002-2004), Chairman of the Executive Committee (2000-2006), and as a member of the Board of Directors (1990-2006). Currently, Mr. Stavropoulos is Chairman of the Board of Directors of Univar Inc. (global distributor of commodity and specialty chemicals), a Director of Teradata Corporation (data warehousing and technology solutions), and a member of the Advisory Board for Metalmark Capital LLC (private equity investment, 2005-present). Mr. Stavropoulos is an operating advisor to Clayton, Dubilier & Rice, LLC (private equity investment). In addition, Mr. Stavropoulos is a member of the University of Notre Dame Advisory Council for the College of Science, a Trustee of the Rollin L. Gerstacker Foundation, and a Director of Artis-Naples in Naples, Florida. Previously, Mr. Stavropoulos served as Trustee of certain Fidelity® funds (2001-2018) and as a Director of Chemical Financial Corporation (bank holding company, 1993-2012) and Tyco International, Ltd. (multinational manufacturing and services, 2007-2012).
Carol B. Tomé (1957)
Year of Election or Appointment: 2018
Member of the Advisory Board
Ms. Tomé also serves as Member of the Advisory Board of other Fidelity® funds. Ms. Tomé is Chief Financial Officer (2001-present) and Executive Vice President of Corporate Services (2007-present) of The Home Depot, Inc. (home improvement retailer) and a Director (2003-present) and Chair of the Audit Committee (2004-present) of United Parcel Service, Inc. (package delivery and supply chain management). Previously, Ms. Tomé served as Trustee of certain Fidelity® funds (2017), Senior Vice President of Finance and Accounting/Treasurer (2000-2007) and Vice President and Treasurer (1995-2000) of The Home Depot, Inc. and Chair of the Board (2010-2012), Vice Chair of the Board (2009 and 2013), and a Director (2008-2013) of the Federal Reserve Bank of Atlanta. Ms. Tomé is also a director or trustee of many community and professional organizations.
Michael E. Wiley (1950)
Year of Election or Appointment: 2018
Member of the Advisory Board
Mr. Wiley also serves as Trustee or Member of the Advisory Board of other Fidelity® funds. Mr. Wiley serves as a Director of High Point Resources (exploration and production, 2005-present). Previously, Mr. Wiley served as a Director of Andeavor Corporation (independent oil refiner and marketer, 2005-2018), a Director of Andeavor Logistics LP (natural resources logistics, 2015-2018), a Director of Post Oak Bank (privately-held bank, 2004-2018), a Director of Asia Pacific Exploration Consolidated (international oil and gas exploration and production, 2008-2013), a member of the Board of Trustees of the University of Tulsa (2000-2006; 2007-2010), a Senior Energy Advisor of Katzenbach Partners, LLC (consulting, 2006-2007), an Advisory Director of Riverstone Holdings (private investment), a Director of Spinnaker Exploration Company (exploration and production, 2001-2005) and Chairman, President, and CEO of Baker Hughes, Inc. (oilfield services, 2000-2004).
Elizabeth Paige Baumann (1968)
Year of Election or Appointment: 2017
Anti-Money Laundering (AML) Officer
Ms. Baumann also serves as AML Officer of other funds. She is Chief AML Officer (2012-present) and Senior Vice President (2014-present) of FMR LLC (diversified financial services company) and is an employee of Fidelity Investments. Previously, Ms. Baumann served as AML Officer of the funds (2012-2016), and Vice President (2007-2014) and Deputy Anti-Money Laundering Officer (2007-2012) of FMR LLC.
John J. Burke III (1964)
Year of Election or Appointment: 2018
Chief Financial Officer
Mr. Burke also serves as Chief Financial Officer of other funds. Mr. Burke serves as Head of Investment Operations for Fidelity Fund and Investment Operations (2018-present) and is an employee of Fidelity Investments (1998-present). Previously Mr. Burke served as head of Asset Management Investment Operations (2012-2018).
William C. Coffey (1969)
Year of Election or Appointment: 2018
Secretary and Chief Legal Officer (CLO)
Mr. Coffey also serves as Secretary and CLO of other funds. Mr. Coffey serves as CLO, Secretary, and Senior Vice President of Fidelity Management & Research Company and FMR Co., Inc. (investment adviser firms, 2018-present); Secretary of Fidelity SelectCo, LLC and Fidelity Investments Money Management, Inc. (investment adviser firms, 2018-present); and CLO of Fidelity Management & Research (Hong Kong) Limited, FMR Investment Management (UK) Limited, and Fidelity Management & Research (Japan) Limited (investment adviser firms, 2018-present). He is Senior Vice President and Deputy General Counsel of FMR LLC (diversified financial services company, 2010-present), and is an employee of Fidelity Investments. Previously, Mr. Coffey served as Assistant Secretary of certain funds (2009-2018) and as Vice President and Associate General Counsel of FMR LLC (2005-2009).
Timothy M. Cohen (1969)
Year of Election or Appointment: 2018
Vice President
Mr. Cohen also serves as Vice President of other funds. Mr. Cohen serves as Co-Head of Global Equity Research (2016-present), a Director of Fidelity Management & Research (Japan) Limited (investment adviser firm, 2016-present), and is an employee of Fidelity Investments. Previously, Mr. Cohen served as Chief Investment Officer - Equity and a Director of Fidelity Management & Research (U.K.) Inc. (investment adviser firm, 2013-2015) and as a Director of Fidelity Management & Research (Hong Kong) Limited (investment adviser firm, 2017).
Jonathan Davis (1968)
Year of Election or Appointment: 2010
Assistant Treasurer
Mr. Davis also serves as Assistant Treasurer of other funds. Mr. Davis serves as Assistant Treasurer of FMR Capital, Inc. (2017-present) and is an employee of Fidelity Investments. Previously, Mr. Davis served as Vice President and Associate General Counsel of FMR LLC (diversified financial services company, 2003-2010).
Adrien E. Deberghes (1967)
Year of Election or Appointment: 2016
Assistant Treasurer
Mr. Deberghes also serves as an officer of other funds. He serves as Assistant Treasurer of FMR Capital, Inc. (2017-present), Executive Vice President of Fidelity Investments Money Management, Inc. (FIMM) (investment adviser firm, 2016-present), and is an employee of Fidelity Investments (2008-present). Previously, Mr. Deberghes served as President and Treasurer of certain Fidelity® funds (2013-2018). Prior to joining Fidelity Investments, Mr. Deberghes was Senior Vice President of Mutual Fund Administration at State Street Corporation (2007-2008), Senior Director of Mutual Fund Administration at Investors Bank & Trust (2005-2007), and Director of Finance for Dunkin' Brands (2000-2005). Previously, Mr. Deberghes served in other fund officer roles.
Laura M. Del Prato (1964)
Year of Election or Appointment: 2018
Assistant Treasurer
Ms. Del Prato also serves as an officer of other funds. Ms. Del Prato is an employee of Fidelity Investments (2017-present). Prior to joining Fidelity Investments, Ms. Del Prato served as a Managing Director and Treasurer of the JPMorgan Mutual Funds (2014-2017). Prior to JPMorgan, Ms. Del Prato served as a partner at Cohen Fund Audit Services (accounting firm, 2012-2013) and KPMG LLP (accounting firm, 2004-2012).
Colm A. Hogan (1973)
Year of Election or Appointment: 2016
Deputy Treasurer
Mr. Hogan also serves as an officer of other funds. Mr. Hogan serves as Assistant Treasurer of FMR Capital, Inc. (2017-present) and is an employee of Fidelity Investments (2005-present). Previously, Mr. Hogan served as Assistant Treasurer of certain Fidelity® funds (2016-2018).
Pamela R. Holding (1964)
Year of Election or Appointment: 2018
Vice President
Ms. Holding also serves as Vice President of other funds. Ms. Holding serves as Co-Head of Global Equity Research (2018-present) and is an employee of Fidelity Investments (2013-present).
Chris Maher (1972)
Year of Election or Appointment: 2013
Assistant Treasurer
Mr. Maher serves as Assistant Treasurer of other funds. Mr. Maher is Vice President of Valuation Oversight, serves as Assistant Treasurer of FMR Capital, Inc. (2017-present), and is an employee of Fidelity Investments. Previously, Mr. Maher served as Vice President of Asset Management Compliance (2013), Vice President of the Program Management Group of FMR (investment adviser firm, 2010-2013), and Vice President of Valuation Oversight (2008-2010).
Rieco E. Mello (1969)
Year of Election or Appointment: 2017
Assistant Treasurer
Mr. Mello also serves as Assistant Treasurer of other funds. Mr. Mello serves as Assistant Treasurer of FMR Capital, Inc. (2017-present) and is an employee of Fidelity Investments (1995-present).
Kenneth B. Robins (1969)
Year of Election or Appointment: 2016
Chief Compliance Officer
Mr. Robins also serves as an officer of other funds. Mr. Robins serves as Compliance Officer of Fidelity Management & Research Company and FMR Co., Inc. (investment adviser firms, 2016-present) and is an employee of Fidelity Investments (2004-present). Previously, Mr. Robins served as Executive Vice President of Fidelity Investments Money Management, Inc. (investment adviser firm, 2013-2016) and served in other fund officer roles.
Stacie M. Smith (1974)
Year of Election or Appointment: 2016
President and Treasurer
Ms. Smith also serves as an officer of other funds. Ms. Smith serves as Assistant Treasurer of FMR Capital, Inc. (2017-present), is an employee of Fidelity Investments (2009-present), and has served in other fund officer roles. Prior to joining Fidelity Investments, Ms. Smith served as Senior Audit Manager of Ernst & Young LLP (accounting firm, 1996-2009). Previously, Ms. Smith served as Assistant Treasurer (2013-2018) and Deputy Treasurer (2013-2016) of certain Fidelity® funds.
Marc L. Spector (1972)
Year of Election or Appointment: 2016
Assistant Treasurer
Mr. Spector also serves as an officer of other funds. Mr. Spector serves as Assistant Treasurer of FMR Capital, Inc. (2017-present) and is an employee of Fidelity Investments (2016-present). Prior to joining Fidelity Investments, Mr. Spector served as Director at the Siegfried Group (accounting firm, 2013-2016), and prior to Siegfried Group as audit senior manager at Deloitte & Touche (accounting firm, 2005-2013).
Shareholder Expense Example
As a shareholder of the Fund, you incur two types of costs: (1) transaction costs, including sales charges (loads) on purchase payments or redemption proceeds, and (2) ongoing costs, including management fees, distribution and/or service (12b-1) fees and other Fund expenses. This Example is intended to help you understand your ongoing costs (in dollars) of investing in the Fund and to compare these costs with the ongoing costs of investing in other mutual funds.
The Example is based on an investment of $1,000 invested at the beginning of the period and held for the entire period (May 1, 2018 to October 31, 2018).
Actual Expenses
The first line of the accompanying table for each class of the Fund provides information about actual account values and actual expenses. You may use the information in this line, together with the amount you invested, to estimate the expenses that you paid over the period. Simply divide your account value by $1,000.00 (for example, an $8,600 account value divided by $1,000.00 = 8.6), then multiply the result by the number in the first line for a class of the Fund under the heading entitled "Expenses Paid During Period" to estimate the expenses you paid on your account during this period. A small balance maintenance fee of $12.00 that is charged once a year may apply for certain accounts with a value of less than $2,000. This fee, which was eliminated effective August 1, 2018, is not included in the table below. If it was, the estimate of expenses you paid during the period would be higher, and your ending account value lower, by this amount. In addition, the Fund, as a shareholder in the underlying Fidelity Central Funds, will indirectly bear its pro-rata share of the fees and expenses incurred by the underlying Fidelity Central Funds. These fees and expenses are not included in the Fund's annualized expense ratio used to calculate the expense estimate in the table below.
Hypothetical Example for Comparison Purposes
The second line of the accompanying table for each class of the Fund provides information about hypothetical account values and hypothetical expenses based on a Class' actual expense ratio and an assumed rate of return of 5% per year before expenses, which is not the Class' actual return. The hypothetical account values and expenses may not be used to estimate the actual ending account balance or expenses you paid for the period. You may use this information to compare the ongoing costs of investing in the Fund and other funds. To do so, compare this 5% hypothetical example with the 5% hypothetical examples that appear in the shareholder reports of the other funds. A small balance maintenance fee of $12.00 that is charged once a year may apply for certain accounts with a value of less than $2,000. This fee, which was eliminated effective August 1, 2018, is not included in the table below. If it was, the estimate of expenses you paid during the period would be higher, and your ending account value lower, by this amount. In addition, the Fund, as a shareholder in the underlying Fidelity Central Funds, will indirectly bear its pro-rata share of the fees and expenses incurred by the underlying Fidelity Central Funds. These fees and expenses are not included in the Fund's annualized expense ratio used to calculate the expense estimate in the table below.
Please note that the expenses shown in the table are meant to highlight your ongoing costs only and do not reflect any transaction costs. Therefore, the second line of the table is useful in comparing ongoing costs only, and will not help you determine the relative total costs of owning different funds. In addition, if these transactional costs were included, your costs would have been higher.
| | Annualized Expense Ratio-A | Beginning
Account Value
May 1, 2018 | Ending
Account Value
October 31, 2018 | Expenses Paid
During Period-B
May 1, 2018
to October 31, 2018 |
| Class A | 1.22% | | | |
| Actual | | $1,000.00 | $925.10 | $5.92 |
| Hypothetical-C | | $1,000.00 | $1,019.06 | $6.21 |
| Class M | 1.52% | | | |
| Actual | | $1,000.00 | $924.20 | $7.37 |
| Hypothetical-C | | $1,000.00 | $1,017.54 | $7.73 |
| Class C | 1.97% | | | |
| Actual | | $1,000.00 | $921.50 | $9.54 |
| Hypothetical-C | | $1,000.00 | $1,015.27 | $10.01 |
| International Growth | .91% | | | |
| Actual | | $1,000.00 | $926.30 | $4.42 |
| Hypothetical-C | | $1,000.00 | $1,020.62 | $4.63 |
| Class I | .91% | | | |
| Actual | | $1,000.00 | $926.90 | $4.42 |
| Hypothetical-C | | $1,000.00 | $1,020.62 | $4.63 |
| Class Z | .79% | | | |
| Actual | | $1,000.00 | $927.00 | $3.84 |
| Hypothetical-C | | $1,000.00 | $1,021.22 | $4.02 |
A Annualized expense ratio reflects expenses net of applicable fee waivers.
B Expenses are equal to each Class' annualized expense ratio, multiplied by the average account value over the period, multiplied by 184/365 (to reflect the one-half year period).
C 5% return per year before expenses
Distributions (Unaudited)
Class A designates 25% and 93%; Class M designates 49% and 93%; International Growth designates 16% and 93%; Class I designates 15% and 93%; and Class Z designates 13% and 93% of the dividends distributed on December 8, 2017 and December 28, 2017, respectively, during the fiscal year as qualifying for the dividends–received deduction for corporate shareholders.
Class A, Class M, International Growth, Class I, and Class Z designate 100% of the dividends distributed during the fiscal year as amounts which may be taken into account as a dividend for purposes of the maximum rate under section 1(h)(11) of the Internal Revenue Code.
The amounts per share which represent income derived from sources within, and taxes paid to, foreign countries or possessions of the United States are as follows:
| | Pay Date | Income | Taxes |
| Fidelity International Growth Fund | | | |
| Class A | 12/11/17 | $0.0746 | $0.0196 |
| Class A | 12/29/17 | $0.0020 | $0.0000 |
| Class M | 12/11/17 | $0.0376 | $0.0196 |
| Class M | 12/29/17 | $0.0020 | $0.0000 |
| International Growth | 12/11/17 | $0.1116 | $0.0196 |
| International Growth | 12/29/17 | $0.0020 | $0.0000 |
| Class I | 12/11/17 | $0.1216 | $0.0196 |
| Class I | 12/29/17 | $0.0020 | $0.0000 |
| Class Z | 12/11/17 | $0.1366 | $0.0196 |
| Class Z | 12/29/17 | $0.0020 | $0.0000 |
|
The fund will notify shareholders in January 2019 of amounts for use in preparing 2018 income tax returns.
Board Approval of Investment Advisory Contracts
Fidelity International Growth Fund
At its July 2018 meeting, the Board of Trustees, including the Independent Trustees (together, the Board), voted to continue the management contract with Fidelity Management & Research Company (FMR) and the sub-advisory agreements (together, the Advisory Contracts) for the fund for six months through January 31, 2019, in connection with the reunification of the Fidelity Equity High Income Funds Board, which oversees the fund, and the Sector Portfolios Board.
The Board considered that the approval of the fund's Advisory Contracts will not result in any changes in (i) the investment process or strategies employed in the management of the fund's assets; (ii) the fees and expenses paid by shareholders; (iii) the nature, extent or quality of services provided under the fund's Advisory Contracts; or (iv) the day-to-day management of the fund or the persons primarily responsible for such management. The Board concluded that the fund's Advisory Contracts are fair and reasonable, and that the fund's Advisory Contracts should be renewed, without modification, through January 31, 2019, with the understanding that the Board will consider the annual renewal for a full one year period in January 2019.
In connection with its consideration of future renewals of the fund's Advisory Contracts, the Board will consider: (i) the nature, extent and quality of services provided to the fund, including shareholder and administrative services and investment performance; (ii) the competitiveness of the management fee and total expenses for the fund; (iii) the costs of the services and profitability, including the revenues earned and the expenses incurred in conducting the business of developing, marketing, distributing, managing, administering, and servicing the fund and its shareholders, to the extent applicable, as well as potential fall-out benefits from Fidelity's non-fund businesses; and (iv) whether there have been economies of scale in respect of the Fidelity funds, whether the Fidelity funds (including the fund) have appropriately benefited from any such economies of scale, and whether there is the potential for realization of any further economies.
Based on its evaluation of all of the conclusions noted above, and after considering all factors it believed relevant, the Board ultimately concluded that the fund's management fee structure is fair and reasonable, and that the continuation of the fund's Advisory Contracts should be approved.
Corporate Headquarters
245 Summer St.
Boston, MA 02210
www.fidelity.com
IGF-ANN-1218
1.912350.108
Fidelity Advisor® Emerging Europe, Middle East, Africa (EMEA) Fund - Class A, Class M, Class C and Class I
Annual Report October 31, 2018 Class A, Class M, Class C and Class I are classes of Fidelity® Emerging Europe, Middle East, Africa (EMEA) Fund |
|
Contents
To view a fund's proxy voting guidelines and proxy voting record for the 12-month period ended June 30, visit http://www.fidelity.com/proxyvotingresults or visit the Securities and Exchange Commission's (SEC) web site at http://www.sec.gov.
You may also call 1-877-208-0098 to request a free copy of the proxy voting guidelines.
Standard & Poor's, S&P and S&P 500 are registered service marks of The McGraw-Hill Companies, Inc. and have been licensed for use by Fidelity Distributors Corporation.
Other third-party marks appearing herein are the property of their respective owners.
All other marks appearing herein are registered or unregistered trademarks or service marks of FMR LLC or an affiliated company. © 2018 FMR LLC. All rights reserved.
This report and the financial statements contained herein are submitted for the general information of the shareholders of the Fund. This report is not authorized for distribution to prospective investors in the Fund unless preceded or accompanied by an effective prospectus.
A fund files its complete schedule of portfolio holdings with the SEC for the first and third quarters of each fiscal year on Form N-Q. Forms N-Q are available on the SEC’s web site at http://www.sec.gov. A fund's Forms N-Q may be reviewed and copied at the SEC’s Public Reference Room in Washington, DC. Information regarding the operation of the SEC's Public Reference Room may be obtained by calling 1-800-SEC-0330.
For a complete list of a fund's portfolio holdings, view the most recent holdings listing, semiannual report, or annual report on Fidelity's web site at http://www.fidelity.com, http://www.institutional.fidelity.com, or http://www.401k.com, as applicable.
NOT FDIC INSURED •MAY LOSE VALUE •NO BANK GUARANTEE
Neither the Fund nor Fidelity Distributors Corporation is a bank.
Performance: The Bottom Line
Average annual total return reflects the change in the value of an investment, assuming reinvestment of distributions from dividend income and capital gains (the profits earned upon the sale of securities that have grown in value, if any) and assuming a constant rate of performance each year. The hypothetical investment and the average annual total returns do not reflect the deduction of taxes that a shareholder would pay on fund distributions or the redemption of fund shares. During periods of reimbursement by Fidelity, a fund’s total return will be greater than it would be had the reimbursement not occurred. How a fund did yesterday is no guarantee of how it will do tomorrow.
Average Annual Total Returns
| For the periods ended October 31, 2018 | Past 1 year | Past 5 years | Past 10 years |
| Class A (incl. 5.75% sales charge) | (9.68)% | (1.05)% | 7.34% |
| Class M (incl. 3.50% sales charge) | (7.85)% | (0.88)% | 7.28% |
| Class C (incl. contingent deferred sales charge) | (5.87)% | (0.65)% | 7.16% |
| Class I | (3.80)% | 0.47% | 8.32% |
Class C shares' contingent deferred sales charges included in the past one year, past five years and past ten years total return figures are 1%, 0% and 0%, respectively.
$10,000 Over 10 Years
Let's say hypothetically that $10,000 was invested in Fidelity Advisor® Emerging Europe, Middle East, Africa (EMEA) Fund - Class A on October 31, 2008, and the current 5.75% sales charge was paid.
The chart shows how the value of your investment would have changed, and also shows how the MSCI EM (Emerging Markets) Europe, Middle East and Africa Index performed over the same period.
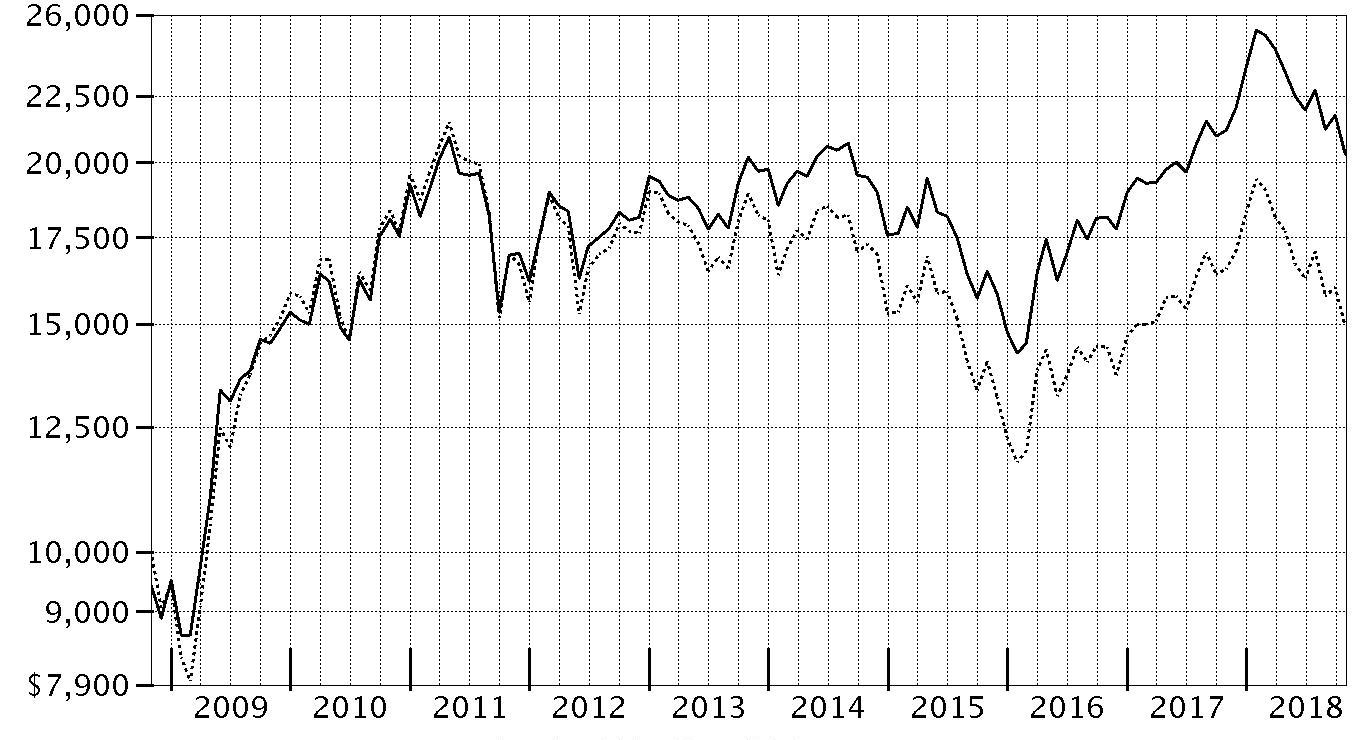
| Period Ending Values |
| $20,305 | Fidelity Advisor® Emerging Europe, Middle East, Africa (EMEA) Fund - Class A |
| $14,947 | MSCI EM (Emerging Markets) Europe, Middle East and Africa Index |
Management's Discussion of Fund Performance
Market Recap: International equities returned -8.08% for the 12 months ending October 31, 2018, according to the MSCI ACWI (All Country World Index) ex USA Index. A modestly positive first half of the period gave way to a confluence of overwhelmingly negative factors – including escalating trade tensions, a surging U.S. dollar, tepid economic growth in Europe, global central bank tightening, concerns about Italy’s budget stalemate with the EU, and weakness in China’s stock market. The index lost 8% in October alone, its largest monthly drop in more than six years. Among sectors, communications services (-15%) was hit the hardest, while economically sensitive consumer discretionary (-13%), information technology (-12%), financials (-10%), industrials (-9%) and materials (-7%) stocks also fared poorly. Even the more defensive real estate (-9%), utilities (-6%) and consumer staples (-5%) sectors weren’t spared this period. Conversely, elevated crude-oil prices fueled a positive return for energy (+7%), the top-performing sector, followed by the relatively stable-growing health care segment (+2%). Regionally, emerging markets (-12%) fared the worst, hampered by the impact of foreign exchange and concerns about economic weakness in China, India and South Korea. Sluggish growth also pressured shares in continental Europe (-9%). Stocks in Japan (-3%) and the U.K. (-4%) held up better, followed by Canada (-5%) and Asia-Pacific ex Japan (-6%).
Comments from Portfolio Manager Adam Kutas: For the year, the fund's share classes (excluding sales charges, if applicable) returned roughly -4% to -5% outpacing the -9.68% decline of the benchmark, the MSCI EM (Emerging Markets) Europe, Middle East and Africa Index. After making strong gains in the first four months of this 12-month period, emerging EMEA equities pulled back sharply beginning in roughly February, ending the period in negative territory. Versus the MSCI index, stock selection drove the fund's relative outperformance the past 12 months, especially within the consumer discretionary and financials sectors. Avoiding poor-performing index component South African private-equity investor Steinhoff International Holdings, which faced a financial accounting investigation, notably helped the fund's relative result. Not owning index holding Magnit, a Russia-based retailer that faced increased competition, also added value. Conversely, avoiding strong-performing index component Qatar Bank detracted more than any other fund position. Choices in materials also hurt, mainly due to untimely ownership of South African integrated energy and chemical company Sasol. However, I maintain conviction in this company's longer-term outlook and continued to hold a sizable stake in Sasol as of October 31.
The views expressed above reflect those of the portfolio manager(s) only through the end of the period as stated on the cover of this report and do not necessarily represent the views of Fidelity or any other person in the Fidelity organization. Any such views are subject to change at any time based upon market or other conditions and Fidelity disclaims any responsibility to update such views. These views may not be relied on as investment advice and, because investment decisions for a Fidelity fund are based on numerous factors, may not be relied on as an indication of trading intent on behalf of any Fidelity fund.
Investment Summary (Unaudited)
Geographic Diversification (% of fund's net assets)
| As of October 31, 2018 |
| | South Africa | 40.3% |
| | Russia | 29.0% |
| | United Arab Emirates | 5.1% |
| | Saudi Arabia | 4.4% |
| | Romania | 2.7% |
| | Poland | 2.6% |
| | Nigeria | 2.3% |
| | Qatar | 2.1% |
| | Hungary | 1.7% |
| | Other* | 9.8% |

* Includes Short-Term investments and Net Other Assets (Liabilities).
Percentages are based on country or territory of incorporation and are adjusted for the effect of futures contracts, if applicable.
Asset Allocation as of October 31, 2018
| | % of fund's net assets |
| Stocks | 98.6 |
| Short-Term Investments and Net Other Assets (Liabilities) | 1.4 |
Top Ten Stocks as of October 31, 2018
| | % of fund's net assets |
| Naspers Ltd. Class N (South Africa, Media) | 6.4 |
| Lukoil PJSC sponsored ADR (Russia, Oil, Gas & Consumable Fuels) | 6.4 |
| Sberbank of Russia (Russia, Banks) | 5.5 |
| Gazprom OAO (Russia, Oil, Gas & Consumable Fuels) | 4.9 |
| Tatneft PAO (Russia, Oil, Gas & Consumable Fuels) | 4.3 |
| NOVATEK OAO (Russia, Oil, Gas & Consumable Fuels) | 3.8 |
| FirstRand Ltd. (South Africa, Diversified Financial Services) | 3.6 |
| Standard Bank Group Ltd. (South Africa, Banks) | 3.4 |
| Sasol Ltd. (South Africa, Chemicals) | 3.1 |
| PSG Group Ltd. (South Africa, Diversified Financial Services) | 2.4 |
| | 43.8 |
Top Market Sectors as of October 31, 2018
| | % of fund's net assets |
| Financials | 32.6 |
| Energy | 21.3 |
| Materials | 13.8 |
| Communication Services | 9.1 |
| Consumer Discretionary | 8.8 |
| Consumer Staples | 7.5 |
| Industrials | 3.1 |
| Real Estate | 1.4 |
| Health Care | 1.0 |
Market Sectors may include more than one industry category.
The Fund may invest up to 35% of its total assets in any industry that represents more than 20% of the emerging Europe, Middle East and Africa markets. As of October 31, 2018, the Fund did not have more than 25% of its total assets invested in any one industry.
Schedule of Investments October 31, 2018
Showing Percentage of Net Assets
| Common Stocks - 96.8% | | | |
| | | Shares | Value |
| Bermuda - 0.9% | | | |
| Central European Media Enterprises Ltd. Class A (a) | | 245,000 | $828,100 |
| Botswana - 0.3% | | | |
| First National Bank of Botswana Ltd. | | 1,242,331 | 267,862 |
| Canada - 0.3% | | | |
| First Quantum Minerals Ltd. | | 30,500 | 304,432 |
| Cyprus - 0.5% | | | |
| Globaltrans Investment PLC GDR (Reg. S) | | 47,900 | 469,420 |
| Greece - 1.7% | | | |
| Fourlis Holdings SA | | 71,700 | 351,644 |
| Jumbo SA | | 26,536 | 387,121 |
| Mytilineos Holdings SA | | 51,000 | 451,146 |
| Sarantis SA | | 55,600 | 442,087 |
|
| TOTAL GREECE | | | 1,631,998 |
|
| Hungary - 1.7% | | | |
| OTP Bank PLC | | 46,100 | 1,656,475 |
| Israel - 0.2% | | | |
| Bank Hapoalim BM (Reg.) | | 30,000 | 203,234 |
| Kenya - 0.7% | | | |
| Safaricom Ltd. | | 2,927,644 | 666,677 |
| Kuwait - 0.6% | | | |
| National Bank of Kuwait | | 220,000 | 595,358 |
| Morocco - 0.5% | | | |
| Attijariwafa Bank | | 11,725 | 510,654 |
| Netherlands - 1.1% | | | |
| X5 Retail Group NV GDR (Reg. S) | | 47,200 | 1,109,200 |
| Nigeria - 2.3% | | | |
| Dangote Cement PLC | | 1,107,463 | 637,630 |
| Guaranty Trust Bank PLC | | 5,263,598 | 543,760 |
| Nigerian Breweries PLC | | 2,160,122 | 490,342 |
| Zenith Bank PLC | | 8,351,272 | 540,647 |
|
| TOTAL NIGERIA | | | 2,212,379 |
|
| Poland - 2.6% | | | |
| Globe Trade Centre SA | | 283,900 | 597,077 |
| Inter Cars SA | | 9,700 | 606,700 |
| LPP SA | | 470 | 961,521 |
| Orbis SA | | 21,900 | 384,676 |
|
| TOTAL POLAND | | | 2,549,974 |
|
| Qatar - 2.1% | | | |
| Qatar Islamic Bank (a) | | 48,700 | 2,046,443 |
| Romania - 2.7% | | | |
| Banca Transilvania SA | | 956,231 | 538,774 |
| BRD-Groupe Societe Generale | | 451,735 | 1,430,597 |
| Fondul Propietatea SA GDR | | 56,500 | 649,750 |
|
| TOTAL ROMANIA | | | 2,619,121 |
|
| Russia - 27.2% | | | |
| Alrosa Co. Ltd. | | 769,200 | 1,166,521 |
| Gazprom OAO | | 2,037,813 | 4,809,485 |
| Lukoil PJSC | | 28,600 | 2,146,940 |
| Lukoil PJSC sponsored ADR | | 54,795 | 4,093,187 |
| MMC Norilsk Nickel PJSC | | 12,800 | 2,137,422 |
| NOVATEK OAO | | 231,000 | 3,681,342 |
| Novolipetsk Steel OJSC GDR (Reg. S) | | 30,400 | 734,464 |
| Sberbank of Russia | | 1,882,650 | 5,411,274 |
| Tatneft PAO | | 197,500 | 2,351,756 |
|
| TOTAL RUSSIA | | | 26,532,391 |
|
| Saudi Arabia - 4.4% | | | |
| Abdullah Al Othaim Markets Co. | | 34,800 | 663,317 |
| Al Rajhi Bank | | 34,800 | 811,751 |
| Aldrees Petroleum and Transport Services Co. | | 86,625 | 738,973 |
| Mouwasat Medical Services Co. | | 24,700 | 507,018 |
| SABIC | | 3,000 | 101,409 |
| Saudi Co. for Hardware CJSC | | 28,300 | 648,060 |
| United International Transportation Co. | | 106,984 | 792,865 |
|
| TOTAL SAUDI ARABIA | | | 4,263,393 |
|
| South Africa - 40.3% | | | |
| African Rainbow Minerals Ltd. | | 86,000 | 728,049 |
| Anglo American Platinum Ltd. | | 42,200 | 1,378,576 |
| AVI Ltd. | | 97,400 | 660,227 |
| Barloworld Ltd. | | 79,000 | 642,603 |
| Cashbuild Ltd. | | 47,900 | 875,691 |
| City Lodge Hotels Ltd. | | 73,400 | 651,781 |
| Clicks Group Ltd. | | 91,883 | 1,170,920 |
| DRDGOLD Ltd. | | 3,567,414 | 901,705 |
| FirstRand Ltd. | | 794,000 | 3,461,253 |
| Imperial Holdings Ltd. | | 91,100 | 1,006,006 |
| KAP Industrial Holdings Ltd. | | 1,145,700 | 605,759 |
| Kumba Iron Ore Ltd. | | 41,600 | 814,940 |
| Mr Price Group Ltd. | | 105,800 | 1,656,440 |
| MTN Group Ltd. | | 186,950 | 1,083,493 |
| Nampak Ltd. (a) | | 1,094,500 | 1,101,734 |
| Naspers Ltd. Class N | | 35,600 | 6,256,525 |
| Pretoria Portland Cement Co. Ltd. (a) | | 1,192,249 | 480,051 |
| PSG Group Ltd. | | 159,700 | 2,381,454 |
| RMB Holdings Ltd. | | 272,900 | 1,377,403 |
| Sanlam Ltd. | | 458,800 | 2,309,472 |
| Sasol Ltd. | | 93,500 | 3,055,577 |
| Shoprite Holdings Ltd. | | 136,300 | 1,665,812 |
| Spar Group Ltd. | | 98,100 | 1,169,220 |
| Spur Corp. Ltd. | | 69,702 | 110,796 |
| Standard Bank Group Ltd. | | 295,086 | 3,266,999 |
| Steinhoff Africa Retail Ltd. (a)(b) | | 390,000 | 482,461 |
|
| TOTAL SOUTH AFRICA | | | 39,294,947 |
|
| United Arab Emirates - 5.1% | | | |
| Abu Dhabi National Oil Co. for Distribution PJSC (a) | | 937,731 | 566,751 |
| Aldar Properties PJSC | | 1,661,768 | 782,668 |
| Dubai Financial Market PJSC | | 2,241,002 | 528,960 |
| Dubai Islamic Bank Pakistan Ltd. (a) | | 539,253 | 772,218 |
| Dubai Parks and Resorts PJSC (a) | | 4,523,254 | 432,235 |
| National Bank of Abu Dhabi PJSC | | 509,140 | 1,915,608 |
|
| TOTAL UNITED ARAB EMIRATES | | | 4,998,440 |
|
| United Kingdom - 1.6% | | | |
| ASA International (a) | | 55,100 | 327,318 |
| Bank of Georgia Group PLC | | 11,500 | 229,221 |
| NMC Health PLC | | 10,849 | 489,789 |
| Tullow Oil PLC (a) | | 184,500 | 532,499 |
|
| TOTAL UNITED KINGDOM | | | 1,578,827 |
|
| TOTAL COMMON STOCKS | | | |
| (Cost $80,490,347) | | | 94,339,325 |
|
| Nonconvertible Preferred Stocks - 1.8% | | | |
| Russia - 1.8% | | | |
| Tatneft PAO | | | |
| (Cost $660,593) | | 226,800 | 1,810,991 |
|
| Money Market Funds - 1.0% | | | |
| Fidelity Cash Central Fund, 2.23% (c) | | | |
| (Cost $970,908) | | 970,714 | 970,908 |
| TOTAL INVESTMENT IN SECURITIES - 99.6% | | | |
| (Cost $82,121,848) | | | 97,121,224 |
| NET OTHER ASSETS (LIABILITIES) - 0.4% | | | 378,730 |
| NET ASSETS - 100% | | | $97,499,954 |
Categorizations in the Schedule of Investments are based on country or territory of incorporation.
Legend
(a) Non-income producing
(b) Security exempt from registration under Rule 144A of the Securities Act of 1933. These securities may be resold in transactions exempt from registration, normally to qualified institutional buyers. At the end of the period, the value of these securities amounted to $482,461 or 0.5% of net assets.
(c) Affiliated fund that is generally available only to investment companies and other accounts managed by Fidelity Investments. The rate quoted is the annualized seven-day yield of the fund at period end. A complete unaudited listing of the fund's holdings as of its most recent quarter end is available upon request. In addition, each Fidelity Central Fund's financial statements, which are not covered by the Fund's Report of Independent Registered Public Accounting Firm, are available on the SEC's website or upon request.
Affiliated Central Funds
Information regarding fiscal year to date income earned by the Fund from investments in Fidelity Central Funds is as follows:
| Fund | Income earned |
| Fidelity Cash Central Fund | $20,290 |
| Fidelity Securities Lending Cash Central Fund | 2,267 |
| Total | $22,557 |
Amounts in the income column in the above table include any capital gain distributions from underlying funds, which are presented in the corresponding line-item in the Statement of Operations if applicable.
Investment Valuation
The following is a summary of the inputs used, as of October 31, 2018, involving the Fund's assets and liabilities carried at fair value. The inputs or methodology used for valuing securities may not be an indication of the risk associated with investing in those securities. For more information on valuation inputs, and their aggregation into the levels used below, please refer to the Investment Valuation section in the accompanying Notes to Financial Statements.
| | Valuation Inputs at Reporting Date: |
| Description | Total | Level 1 | Level 2 | Level 3 |
| Investments in Securities: | | | | |
| Equities: | | | | |
| Communication Services | $8,834,795 | $8,834,795 | $-- | $-- |
| Consumer Discretionary | 8,555,132 | 8,555,132 | -- | -- |
| Consumer Staples | 7,371,125 | 7,371,125 | -- | -- |
| Energy | 20,731,924 | 20,731,924 | -- | -- |
| Financials | 31,776,485 | 26,365,211 | 5,411,274 | -- |
| Health Care | 996,807 | 996,807 | -- | -- |
| Industrials | 2,961,793 | 2,961,793 | -- | -- |
| Materials | 13,542,510 | 9,585,228 | 3,957,282 | -- |
| Real Estate | 1,379,745 | 1,379,745 | -- | -- |
| Money Market Funds | 970,908 | 970,908 | -- | -- |
| Total Investments in Securities: | $97,121,224 | $87,752,668 | $9,368,556 | $-- |
See accompanying notes which are an integral part of the financial statements.
Financial Statements
Statement of Assets and Liabilities
| | | October 31, 2018 |
| Assets | | |
Investment in securities, at value — See accompanying schedule:
Unaffiliated issuers (cost $81,150,940) | $96,150,316 | |
| Fidelity Central Funds (cost $970,908) | 970,908 | |
| Total Investment in Securities (cost $82,121,848) | | $97,121,224 |
| Receivable for investments sold | | 166,147 |
| Receivable for fund shares sold | | 176,020 |
| Dividends receivable | | 401,654 |
| Distributions receivable from Fidelity Central Funds | | 607 |
| Prepaid expenses | | 191 |
| Receivable from investment adviser for expense reductions | | 60 |
| Other receivables | | 2,162 |
| Total assets | | 97,868,065 |
| Liabilities | | |
| Payable to custodian bank | $73,715 | |
| Payable for fund shares redeemed | 110,947 | |
| Accrued management fee | 65,329 | |
| Transfer agent fee payable | 22,243 | |
| Distribution and service plan fees payable | 4,438 | |
| Accrued custody fee | 39,004 | |
| Accrued audit fee | 46,852 | |
| Other affiliated payables | 4,293 | |
| Other payables and accrued expenses | 1,290 | |
| Total liabilities | | 368,111 |
| Net Assets | | $97,499,954 |
| Net Assets consist of: | | |
| Paid in capital | | $96,292,270 |
| Total distributable earnings (loss) | | 1,207,684 |
| Net Assets | | $97,499,954 |
| Net Asset Value and Maximum Offering Price | | |
| Class A: | | |
| Net Asset Value and redemption price per share ($5,034,042 ÷ 567,844 shares) | | $8.87 |
| Maximum offering price per share (100/94.25 of $8.87) | | $9.41 |
| Class M: | | |
| Net Asset Value and redemption price per share ($2,152,906 ÷ 244,074 shares) | | $8.82 |
| Maximum offering price per share (100/96.50 of $8.82) | | $9.14 |
| Class C: | | |
| Net Asset Value and offering price per share ($2,845,273 ÷ 323,510 shares)(a) | | $8.80 |
| Emerging Europe, Middle East, Africa (EMEA): | | |
| Net Asset Value, offering price and redemption price per share ($82,387,408 ÷ 9,275,606 shares) | | $8.88 |
| Class I: | | |
| Net Asset Value, offering price and redemption price per share ($5,080,325 ÷ 572,375 shares) | | $8.88 |
(a) Redemption price per share is equal to net asset value less any applicable contingent deferred sales charge.
See accompanying notes which are an integral part of the financial statements.
Statement of Operations
| | | Year ended October 31, 2018 |
| Investment Income | | |
| Dividends | | $4,943,485 |
| Income from Fidelity Central Funds | | 22,557 |
| Income before foreign taxes withheld | | 4,966,042 |
| Less foreign taxes withheld | | (509,839) |
| Total income | | 4,456,203 |
| Expenses | | |
| Management fee | $867,811 | |
| Transfer agent fees | 270,080 | |
| Distribution and service plan fees | 71,040 | |
| Accounting and security lending fees | 57,000 | |
| Custodian fees and expenses | 111,236 | |
| Independent trustees' fees and expenses | 548 | |
| Registration fees | 78,338 | |
| Audit | 77,322 | |
| Legal | 1,956 | |
| Miscellaneous | 727 | |
| Total expenses before reductions | 1,536,058 | |
| Expense reductions | (15,572) | |
| Total expenses after reductions | | 1,520,486 |
| Net investment income (loss) | | 2,935,717 |
| Realized and Unrealized Gain (Loss) | | |
| Net realized gain (loss) on: | | |
| Investment securities: | | |
| Unaffiliated issuers | 2,394,010 | |
| Fidelity Central Funds | (11) | |
| Foreign currency transactions | (54,667) | |
| Total net realized gain (loss) | | 2,339,332 |
| Change in net unrealized appreciation (depreciation) on: | | |
| Investment securities: | | |
| Unaffiliated issuers (net of increase in deferred foreign taxes of $186,350) | (10,844,818) | |
| Assets and liabilities in foreign currencies | (8,646) | |
| Total change in net unrealized appreciation (depreciation) | | (10,853,464) |
| Net gain (loss) | | (8,514,132) |
| Net increase (decrease) in net assets resulting from operations | | $(5,578,415) |
See accompanying notes which are an integral part of the financial statements.
Statement of Changes in Net Assets
| | Year ended October 31, 2018 | Year ended October 31, 2017 |
| Increase (Decrease) in Net Assets | | |
| Operations | | |
| Net investment income (loss) | $2,935,717 | $1,644,538 |
| Net realized gain (loss) | 2,339,332 | 3,966,888 |
| Change in net unrealized appreciation (depreciation) | (10,853,464) | 10,350,803 |
| Net increase (decrease) in net assets resulting from operations | (5,578,415) | 15,962,229 |
| Distributions to shareholders | (1,645,681) | – |
| Distributions to shareholders from net investment income | – | (1,167,439) |
| Total distributions | (1,645,681) | (1,167,439) |
| Share transactions - net increase (decrease) | 5,076,428 | (13,935,496) |
| Redemption fees | 823 | 71,905 |
| Total increase (decrease) in net assets | (2,146,845) | 931,199 |
| Net Assets | | |
| Beginning of period | 99,646,799 | 98,715,600 |
| End of period | $97,499,954 | $99,646,799 |
| Other Information | | |
| Undistributed net investment income end of period | | $1,355,176 |
See accompanying notes which are an integral part of the financial statements.
Financial Highlights
Fidelity Emerging Europe, Middle East, Africa (EMEA) Fund Class A
| Years ended October 31, | 2018 | 2017 | 2016 | 2015 | 2014 |
| Selected Per–Share Data | | | | | |
| Net asset value, beginning of period | $9.39 | $8.13 | $7.49 | $9.04 | $9.49 |
| Income from Investment Operations | | | | | |
| Net investment income (loss)A | .25 | .12 | .14 | .12 | .13 |
| Net realized and unrealized gain (loss) | (.63) | 1.22 | .61 | (1.50) | (.46) |
| Total from investment operations | (.38) | 1.34 | .75 | (1.38) | (.33) |
| Distributions from net investment income | (.13) | (.09) | (.11) | (.14) | (.12) |
| Distributions from net realized gain | (.01) | – | – | (.04) | – |
| Total distributions | (.14) | (.09) | (.11) | (.17)B | (.12) |
| Redemption fees added to paid in capitalA | –C | .01 | –C | –C | –C |
| Net asset value, end of period | $8.87 | $9.39 | $8.13 | $7.49 | $9.04 |
| Total ReturnD,E | (4.17)% | 16.69% | 10.22% | (15.42)% | (3.48)% |
| Ratios to Average Net AssetsF,G | | | | | |
| Expenses before reductions | 1.59% | 1.63% | 1.69% | 1.61% | 1.60% |
| Expenses net of fee waivers, if any | 1.59% | 1.62% | 1.65% | 1.61% | 1.60% |
| Expenses net of all reductions | 1.57% | 1.61% | 1.64% | 1.60% | 1.60% |
| Net investment income (loss) | 2.49% | 1.41% | 1.90% | 1.51% | 1.45% |
| Supplemental Data | | | | | |
| Net assets, end of period (000 omitted) | $5,034 | $5,538 | $7,867 | $5,788 | $7,889 |
| Portfolio turnover rateH | 39% | 47% | 54% | 50% | 38% |
A Calculated based on average shares outstanding during the period.
B Total distributions of $.17 per share is comprised of distributions from net investment income of $.135 and distributions from net realized gain of $.039 per share.
C Amount represents less than $.005 per share.
D Total returns would have been lower if certain expenses had not been reduced during the applicable periods shown.
E Total returns do not include the effect of the sales charges.
F Fees and expenses of any underlying Fidelity Central Funds are not included in the Fund's expense ratio. The Fund indirectly bears its proportionate share of the expenses of any underlying Fidelity Central Funds.
G Expense ratios reflect operating expenses of the class. Expenses before reductions do not reflect amounts reimbursed by the investment adviser or reductions from brokerage service arrangements or reductions from other expense offset arrangements and do not represent the amount paid by the class during periods when reimbursements or reductions occur. Expenses net of fee waivers reflect expenses after reimbursement by the investment adviser but prior to reductions from brokerage service arrangements or other expense offset arrangements. Expenses net of all reductions represent the net expenses paid by the class.
H Amount does not include the portfolio activity of any underlying Fidelity Central Funds.
See accompanying notes which are an integral part of the financial statements.
Fidelity Emerging Europe, Middle East, Africa (EMEA) Fund Class M
| Years ended October 31, | 2018 | 2017 | 2016 | 2015 | 2014 |
| Selected Per–Share Data | | | | | |
| Net asset value, beginning of period | $9.35 | $8.10 | $7.44 | $9.01 | $9.46 |
| Income from Investment Operations | | | | | |
| Net investment income (loss)A | .22 | .10 | .12 | .10 | .11 |
| Net realized and unrealized gain (loss) | (.63) | 1.21 | .61 | (1.51) | (.46) |
| Total from investment operations | (.41) | 1.31 | .73 | (1.41) | (.35) |
| Distributions from net investment income | (.11) | (.07) | (.07) | (.13) | (.10) |
| Distributions from net realized gain | (.01) | – | – | (.04) | – |
| Total distributions | (.12) | (.07) | (.07) | (.16)B | (.10) |
| Redemption fees added to paid in capitalA | –C | .01 | –C | –C | –C |
| Net asset value, end of period | $8.82 | $9.35 | $8.10 | $7.44 | $9.01 |
| Total ReturnD,E | (4.51)% | 16.40% | 9.98% | (15.80)% | (3.67)% |
| Ratios to Average Net AssetsF,G | | | | | |
| Expenses before reductions | 1.92% | 1.95% | 2.00% | 1.92% | 1.92% |
| Expenses net of fee waivers, if any | 1.90% | 1.90% | 1.90% | 1.90% | 1.90% |
| Expenses net of all reductions | 1.88% | 1.88% | 1.89% | 1.89% | 1.90% |
| Net investment income (loss) | 2.18% | 1.14% | 1.65% | 1.22% | 1.15% |
| Supplemental Data | | | | | |
| Net assets, end of period (000 omitted) | $2,153 | $2,490 | $2,580 | $2,003 | $2,465 |
| Portfolio turnover rateH | 39% | 47% | 54% | 50% | 38% |
A Calculated based on average shares outstanding during the period.
B Total distributions of $.16 per share is comprised of distributions from net investment income of $.125 and distributions from net realized gain of $.039 per share.
C Amount represents less than $.005 per share.
D Total returns would have been lower if certain expenses had not been reduced during the applicable periods shown.
E Total returns do not include the effect of the sales charges.
F Fees and expenses of any underlying Fidelity Central Funds are not included in the Fund's expense ratio. The Fund indirectly bears its proportionate share of the expenses of any underlying Fidelity Central Funds.
G Expense ratios reflect operating expenses of the class. Expenses before reductions do not reflect amounts reimbursed by the investment adviser or reductions from brokerage service arrangements or reductions from other expense offset arrangements and do not represent the amount paid by the class during periods when reimbursements or reductions occur. Expenses net of fee waivers reflect expenses after reimbursement by the investment adviser but prior to reductions from brokerage service arrangements or other expense offset arrangements. Expenses net of all reductions represent the net expenses paid by the class.
H Amount does not include the portfolio activity of any underlying Fidelity Central Funds.
See accompanying notes which are an integral part of the financial statements.
Fidelity Emerging Europe, Middle East, Africa (EMEA) Fund Class C
| Years ended October 31, | 2018 | 2017 | 2016 | 2015 | 2014 |
| Selected Per–Share Data | | | | | |
| Net asset value, beginning of period | $9.30 | $8.06 | $7.39 | $8.93 | $9.39 |
| Income from Investment Operations | | | | | |
| Net investment income (loss)A | .17 | .06 | .09 | .06 | .06 |
| Net realized and unrealized gain (loss) | (.62) | 1.20 | .60 | (1.48) | (.46) |
| Total from investment operations | (.45) | 1.26 | .69 | (1.42) | (.40) |
| Distributions from net investment income | (.04) | (.03) | (.02) | (.08) | (.06) |
| Distributions from net realized gain | (.01) | – | – | (.04) | – |
| Total distributions | (.05) | (.03) | (.02) | (.12) | (.06) |
| Redemption fees added to paid in capitalA | –B | .01 | –B | –B | –B |
| Net asset value, end of period | $8.80 | $9.30 | $8.06 | $7.39 | $8.93 |
| Total ReturnC,D | (4.92)% | 15.85% | 9.33% | (16.08)% | (4.24)% |
| Ratios to Average Net AssetsE,F | | | | | |
| Expenses before reductions | 2.38% | 2.42% | 2.47% | 2.41% | 2.40% |
| Expenses net of fee waivers, if any | 2.38% | 2.39% | 2.40% | 2.40% | 2.40% |
| Expenses net of all reductions | 2.37% | 2.37% | 2.39% | 2.39% | 2.40% |
| Net investment income (loss) | 1.69% | .65% | 1.15% | .72% | .65% |
| Supplemental Data | | | | | |
| Net assets, end of period (000 omitted) | $2,845 | $4,336 | $6,269 | $4,104 | $6,662 |
| Portfolio turnover rateG | 39% | 47% | 54% | 50% | 38% |
A Calculated based on average shares outstanding during the period.
B Amount represents less than $.005 per share.
C Total returns would have been lower if certain expenses had not been reduced during the applicable periods shown.
D Total returns do not include the effect of the contingent deferred sales charge.
E Fees and expenses of any underlying Fidelity Central Funds are not included in the Fund's expense ratio. The Fund indirectly bears its proportionate share of the expenses of any underlying Fidelity Central Funds.
F Expense ratios reflect operating expenses of the class. Expenses before reductions do not reflect amounts reimbursed by the investment adviser or reductions from brokerage service arrangements or reductions from other expense offset arrangements and do not represent the amount paid by the class during periods when reimbursements or reductions occur. Expenses net of fee waivers reflect expenses after reimbursement by the investment adviser but prior to reductions from brokerage service arrangements or other expense offset arrangements. Expenses net of all reductions represent the net expenses paid by the class.
G Amount does not include the portfolio activity of any underlying Fidelity Central Funds.
See accompanying notes which are an integral part of the financial statements.
Fidelity Emerging Europe, Middle East, Africa (EMEA) Fund
| Years ended October 31, | 2018 | 2017 | 2016 | 2015 | 2014 |
| Selected Per–Share Data | | | | | |
| Net asset value, beginning of period | $9.41 | $8.14 | $7.50 | $9.08 | $9.52 |
| Income from Investment Operations | | | | | |
| Net investment income (loss)A | .27 | .15 | .16 | .14 | .16 |
| Net realized and unrealized gain (loss) | (.63) | 1.21 | .61 | (1.51) | (.47) |
| Total from investment operations | (.36) | 1.36 | .77 | (1.37) | (.31) |
| Distributions from net investment income | (.16) | (.10) | (.13) | (.17) | (.13) |
| Distributions from net realized gain | (.01) | – | – | (.04) | – |
| Total distributions | (.17) | (.10) | (.13) | (.21) | (.13) |
| Redemption fees added to paid in capitalA | –B | .01 | –B | –B | –B |
| Net asset value, end of period | $8.88 | $9.41 | $8.14 | $7.50 | $9.08 |
| Total ReturnC | (4.00)% | 17.04% | 10.54% | (15.33)% | (3.21)% |
| Ratios to Average Net AssetsD,E | | | | | |
| Expenses before reductions | 1.34% | 1.38% | 1.46% | 1.39% | 1.37% |
| Expenses net of fee waivers, if any | 1.34% | 1.38% | 1.40% | 1.38% | 1.37% |
| Expenses net of all reductions | 1.32% | 1.37% | 1.39% | 1.38% | 1.37% |
| Net investment income (loss) | 2.74% | 1.66% | 2.15% | 1.74% | 1.68% |
| Supplemental Data | | | | | |
| Net assets, end of period (000 omitted) | $82,387 | $80,392 | $76,193 | $67,521 | $96,784 |
| Portfolio turnover rateF | 39% | 47% | 54% | 50% | 38% |
A Calculated based on average shares outstanding during the period.
B Amount represents less than $.005 per share.
C Total returns would have been lower if certain expenses had not been reduced during the applicable periods shown.
D Fees and expenses of any underlying Fidelity Central Funds are not included in the Fund's expense ratio. The Fund indirectly bears its proportionate share of the expenses of any underlying Fidelity Central Funds.
E Expense ratios reflect operating expenses of the class. Expenses before reductions do not reflect amounts reimbursed by the investment adviser or reductions from brokerage service arrangements or reductions from other expense offset arrangements and do not represent the amount paid by the class during periods when reimbursements or reductions occur. Expenses net of fee waivers reflect expenses after reimbursement by the investment adviser but prior to reductions from brokerage service arrangements or other expense offset arrangements. Expenses net of all reductions represent the net expenses paid by the class.
F Amount does not include the portfolio activity of any underlying Fidelity Central Funds.
See accompanying notes which are an integral part of the financial statements.
Fidelity Emerging Europe, Middle East, Africa (EMEA) Fund Class I
| Years ended October 31, | 2018 | 2017 | 2016 | 2015 | 2014 |
| Selected Per–Share Data | | | | | |
| Net asset value, beginning of period | $9.40 | $8.14 | $7.50 | $9.08 | $9.52 |
| Income from Investment Operations | | | | | |
| Net investment income (loss)A | .28 | .16 | .17 | .15 | .16 |
| Net realized and unrealized gain (loss) | (.62) | 1.20 | .61 | (1.51) | (.46) |
| Total from investment operations | (.34) | 1.36 | .78 | (1.36) | (.30) |
| Distributions from net investment income | (.17) | (.11) | (.14) | (.18) | (.14) |
| Distributions from net realized gain | (.01) | – | – | (.04) | – |
| Total distributions | (.18) | (.11) | (.14) | (.22) | (.14) |
| Redemption fees added to paid in capitalA | –B | .01 | –B | –B | –B |
| Net asset value, end of period | $8.88 | $9.40 | $8.14 | $7.50 | $9.08 |
| Total ReturnC | (3.80)% | 17.01% | 10.69% | (15.23)% | (3.09)% |
| Ratios to Average Net AssetsD,E | | | | | |
| Expenses before reductions | 1.24% | 1.27% | 1.31% | 1.25% | 1.26% |
| Expenses net of fee waivers, if any | 1.24% | 1.27% | 1.31% | 1.25% | 1.26% |
| Expenses net of all reductions | 1.23% | 1.26% | 1.30% | 1.24% | 1.26% |
| Net investment income (loss) | 2.83% | 1.77% | 2.24% | 1.88% | 1.79% |
| Supplemental Data | | | | | |
| Net assets, end of period (000 omitted) | $5,080 | $6,891 | $5,807 | $3,478 | $5,596 |
| Portfolio turnover rateF | 39% | 47% | 54% | 50% | 38% |
A Calculated based on average shares outstanding during the period.
B Amount represents less than $.005 per share.
C Total returns would have been lower if certain expenses had not been reduced during the applicable periods shown.
D Fees and expenses of any underlying Fidelity Central Funds are not included in the Fund's expense ratio. The Fund indirectly bears its proportionate share of the expenses of any underlying Fidelity Central Funds.
E Expense ratios reflect operating expenses of the class. Expenses before reductions do not reflect amounts reimbursed by the investment adviser or reductions from brokerage service arrangements or reductions from other expense offset arrangements and do not represent the amount paid by the class during periods when reimbursements or reductions occur. Expenses net of fee waivers reflect expenses after reimbursement by the investment adviser but prior to reductions from brokerage service arrangements or other expense offset arrangements. Expenses net of all reductions represent the net expenses paid by the class.
F Amount does not include the portfolio activity of any underlying Fidelity Central Funds.
See accompanying notes which are an integral part of the financial statements.
Notes to Financial Statements
For the period ended October 31, 2018
1. Organization.
Fidelity Emerging Europe, Middle East, Africa (EMEA) Fund (the Fund) is a non-diversified fund of Fidelity Investment Trust (the Trust) and is authorized to issue an unlimited number of shares. The Trust is registered under the Investment Company Act of 1940, as amended (the 1940 Act), as an open-end management investment company organized as a Massachusetts business trust. The Fund offers Class A, Class M, Class C, Emerging Europe, Middle East, Africa (EMEA), and Class I shares, each of which has equal rights as to assets and voting privileges. Each class has exclusive voting rights with respect to matters that affect that class. The Fund's investments in emerging markets can be subject to social, economic, regulatory, and political uncertainties and can be extremely volatile.
2. Investments in Fidelity Central Funds.
The Fund invests in Fidelity Central Funds, which are open-end investment companies generally available only to other investment companies and accounts managed by the investment adviser and its affiliates. The Fund's Schedule of Investments lists each of the Fidelity Central Funds held as of period end, if any, as an investment of the Fund, but does not include the underlying holdings of each Fidelity Central Fund. As an Investing Fund, the Fund indirectly bears its proportionate share of the expenses of the underlying Fidelity Central Funds.
The Money Market Central Funds seek preservation of capital and current income and are managed by Fidelity Investments Money Management, Inc. (FIMM), an affiliate of the investment adviser. Annualized expenses of the Money Market Central Funds as of their most recent shareholder report date are less than .005%.
A complete unaudited list of holdings for each Fidelity Central Fund is available upon request or at the Securities and Exchange Commission (the SEC) website at www.sec.gov. In addition, the financial statements of the Fidelity Central Funds, which are not covered by the Fund's Report of Independent Registered Public Accounting Firm, are available on the SEC website or upon request.
3. Significant Accounting Policies.
The Fund is an investment company and applies the accounting and reporting guidance of the Financial Accounting Standards Board (FASB) Accounting Standards Codification Topic 946 Financial Services – Investments Companies. The financial statements have been prepared in conformity with accounting principles generally accepted in the United States of America (GAAP), which require management to make certain estimates and assumptions at the date of the financial statements. Actual results could differ from those estimates. Subsequent events, if any, through the date that the financial statements were issued have been evaluated in the preparation of the financial statements. The following summarizes the significant accounting policies of the Fund:
Investment Valuation. Investments are valued as of 4:00 p.m. Eastern time on the last calendar day of the period. The Board of Trustees (the Board) has delegated the day to day responsibility for the valuation of the Fund's investments to the Fair Value Committee (the Committee) established by the Fund's investment adviser. In accordance with valuation policies and procedures approved by the Board, the Fund attempts to obtain prices from one or more third party pricing vendors or brokers to value its investments. When current market prices, quotations or currency exchange rates are not readily available or reliable, investments will be fair valued in good faith by the Committee, in accordance with procedures adopted by the Board. Factors used in determining fair value vary by investment type and may include market or investment specific events. The frequency with which these procedures are used cannot be predicted and they may be utilized to a significant extent. The Committee oversees the Fund's valuation policies and procedures and reports to the Board on the Committee's activities and fair value determinations. The Board monitors the appropriateness of the procedures used in valuing the Fund's investments and ratifies the fair value determinations of the Committee.
The Fund categorizes the inputs to valuation techniques used to value its investments into a disclosure hierarchy consisting of three levels as shown below:
- Level 1 – quoted prices in active markets for identical investments
- Level 2 – other significant observable inputs (including quoted prices for similar investments, interest rates, prepayment speeds, etc.)
- Level 3 – unobservable inputs (including the Fund's own assumptions based on the best information available)
Valuation techniques used to value the Fund's investments by major category are as follows:
Equity securities, including restricted securities, for which market quotations are readily available, are valued at the last reported sale price or official closing price as reported by a third party pricing vendor on the primary market or exchange on which they are traded and are categorized as Level 1 in the hierarchy. In the event there were no sales during the day or closing prices are not available, securities are valued at the last quoted bid price or may be valued using the last available price and are generally categorized as Level 2 in the hierarchy. For foreign equity securities, when market or security specific events arise, comparisons to the valuation of American Depositary Receipts (ADRs), futures contracts, Exchange-Traded Funds (ETFs) and certain indexes as well as quoted prices for similar securities may be used and would be categorized as Level 2 in the hierarchy. Utilizing these techniques may result in transfers between Level 1 and Level 2. For equity securities, including restricted securities, where observable inputs are limited, assumptions about market activity and risk are used and these securities may be categorized as Level 3 in the hierarchy.
Investments in open-end mutual funds, including the Fidelity Central Funds, are valued at their closing net asset value (NAV) each business day and are categorized as Level 1 in the hierarchy.
Changes in valuation techniques may result in transfers in or out of an assigned level within the disclosure hierarchy. The aggregate value of investments by input level as of October 31, 2018, is included at the end of the Fund's Schedule of Investments.
Foreign Currency. The Fund may use foreign currency contracts to facilitate transactions in foreign-denominated securities. Gains and losses from these transactions may arise from changes in the value of the foreign currency or if the counterparties do not perform under the contracts' terms.
Foreign-denominated assets, including investment securities, and liabilities are translated into U.S. dollars at the exchange rates at period end. Purchases and sales of investment securities, income and dividends received and expenses denominated in foreign currencies are translated into U.S. dollars at the exchange rate in effect on the transaction date.
The effects of exchange rate fluctuations on investments are included with the net realized and unrealized gain (loss) on investment securities. Other foreign currency transactions resulting in realized and unrealized gain (loss) are disclosed separately.
Investment Transactions and Income. For financial reporting purposes, the Fund's investment holdings and NAV include trades executed through the end of the last business day of the period. The NAV per share for processing shareholder transactions is calculated as of the close of business of the New York Stock Exchange (NYSE), normally 4:00 p.m. Eastern time and includes trades executed through the end of the prior business day. Gains and losses on securities sold are determined on the basis of identified cost and include proceeds received from litigation. Dividend income is recorded on the ex-dividend date, except for certain dividends from foreign securities where the ex-dividend date may have passed, which are recorded as soon as the Fund is informed of the ex-dividend date. Non-cash dividends included in dividend income, if any, are recorded at the fair market value of the securities received. Income and capital gain distributions from Fidelity Central Funds, if any, are recorded on the ex-dividend date. Investment income is recorded net of foreign taxes withheld where recovery of such taxes is uncertain.
Class Allocations and Expenses. Investment income, realized and unrealized capital gains and losses, common expenses of the Fund, and certain fund-level expense reductions, if any, are allocated daily on a pro-rata basis to each class based on the relative net assets of each class to the total net assets of the Fund. Each class differs with respect to transfer agent and distribution and service plan fees incurred. Certain expense reductions may also differ by class. For the reporting period, the allocated portion of income and expenses to each class as a percent of its average net assets may vary due to the timing of recording these transactions in relation to fluctuating net assets of the classes. Expenses directly attributable to a fund are charged to that fund. Expenses attributable to more than one fund are allocated among the respective funds on the basis of relative net assets or other appropriate methods. Expense estimates are accrued in the period to which they relate and adjustments are made when actual amounts are known.
Income Tax Information and Distributions to Shareholders. Each year, the Fund intends to qualify as a regulated investment company under Subchapter M of the Internal Revenue Code, including distributing substantially all of its taxable income and realized gains. As a result, no provision for U.S. Federal income taxes is required. As of October 31, 2018, the Fund did not have any unrecognized tax benefits in the financial statements; nor is the Fund aware of any tax positions for which it is reasonably possible that the total amounts of unrecognized tax benefits will significantly change in the next twelve months. The Fund files a U.S. federal tax return, in addition to state and local tax returns as required. The Fund's federal income tax returns are subject to examination by the Internal Revenue Service (IRS) for a period of three fiscal years after they are filed. State and local tax returns may be subject to examination for an additional fiscal year depending on the jurisdiction. Foreign taxes are provided for based on the Fund's understanding of the tax rules and rates that exist in the foreign markets in which it invests.
Distributions are declared and recorded on the ex-dividend date. Income and capital gain distributions are declared separately for each class. Income and capital gain distributions are determined in accordance with income tax regulations, which may differ from GAAP. In addition, the Fund claimed a portion of the payment made to redeeming shareholders as a distribution for income tax purposes.
Capital accounts within the financial statements are adjusted for permanent book-tax differences. These adjustments have no impact on net assets or the results of operations. Capital accounts are not adjusted for temporary book-tax differences which will reverse in a subsequent period.
Book-tax differences are primarily due to foreign currency transactions, passive foreign investment companies (PFIC), capital loss carryforwards, expiring capital loss carryforwards and losses deferred due to wash sales.
As of period end, the cost and unrealized appreciation (depreciation) in securities, and derivatives if applicable, for federal income tax purposes were as follows:
| Gross unrealized appreciation | $23,749,635 |
| Gross unrealized depreciation | (8,913,179) |
| Net unrealized appreciation (depreciation) | $14,836,456 |
| Tax Cost | $82,284,768 |
The tax-based components of distributable earnings as of period end were as follows:
| Undistributed ordinary income | $2,329,516 |
| Capital loss carryforward | $(15,761,417) |
| Net unrealized appreciation (depreciation) on securities and other investments | $14,825,933 |
Capital loss carryforwards are only available to offset future capital gains of the Fund to the extent provided by regulations and may be limited. Under the Regulated Investment Company Modernization Act of 2010 (the Act), the Fund is permitted to carry forward capital losses incurred in taxable years beginning after December 22, 2010 for an unlimited period and such capital losses are required to be used prior to any losses that expire. The capital loss carryforward information presented below, including any applicable limitation, is estimated as of fiscal period end and is subject to adjustment.
| Fiscal year of expiration | |
| No expiration | |
| Short-term | $(3,664,835) |
| Long-term | (12,096,582) |
| Total capital loss carryforward | $(15,761,417) |
The tax character of distributions paid was as follows:
| | October 31, 2018 | October 31, 2017 |
| Ordinary Income | $1,645,681 | $ 1,167,439 |
Short-Term Trading (Redemption) Fees. Shares held by investors in the Fund less than 90 days may have been subject to a redemption fee equal to 1.50% of the NAV of shares redeemed. All redemption fees, which reduce the proceeds of the shareholder redemption, are retained by the Fund and accounted for as an addition to paid in capital. In November 2017, the Board of Trustees approved the elimination of these redemption fees effective December 18, 2017.
Restricted Securities. The Fund may invest in securities that are subject to legal or contractual restrictions on resale. These securities generally may be resold in transactions exempt from registration or to the public if the securities are registered. Disposal of these securities may involve time-consuming negotiations and expense, and prompt sale at an acceptable price may be difficult. Information regarding restricted securities is included at the end of the Fund's Schedule of Investments.
New Rule Issuance. During August 2018, the U.S. Securities and Exchange Commission issued Final Rule Release No. 33-10532, Disclosure Update and Simplification. This Final Rule includes amendments specific to registered investment companies that are intended to eliminate overlap in disclosure requirements between Regulation S-X and GAAP. In accordance with these amendments, certain line-items in the Fund financial statements have been combined or removed for the current period as outlined in the table below.
| Financial Statement | Current Line-Item Presentation | Prior Line-Item Presentation |
| Statement of Assets and Liabilities | Total distributable earnings (loss) | Undistributed/Distributions in excess of/Accumulated net investment income (loss)
Accumulated/Undistributed net realized gain (loss)
Net unrealized appreciation (depreciation) |
| Statement of Changes in Net Assets | N/A - removed | Undistributed/Distributions in excess of/Accumulated net investment income (loss) end of period |
| Statement of Changes in Net Assets | Distributions to shareholders | Distributions to shareholders from net investment income
Distributions to shareholders from net realized gain |
| Distributions to Shareholders Note to Financial Statements | Distributions to shareholders | Distributions to shareholders from net investment income
Distributions to shareholders from net realized gain |
4. Purchases and Sales of Investments.
Purchases and sales of securities, other than short-term securities, aggregated $47,495,865 and $42,107,592, respectively.
5. Fees and Other Transactions with Affiliates.
Management Fee. Fidelity Management & Research Company (the investment adviser) and its affiliates provide the Fund with investment management related services for which the Fund pays a monthly management fee. The management fee is the sum of an individual fund fee rate that is based on an annual rate of .55% of the Fund's average net assets and an annualized group fee rate that averaged .24% during the period. The group fee rate is based upon the average net assets of all the mutual funds advised by the investment adviser, including any mutual funds previously advised by the investment adviser that are currently advised by Fidelity SelectCo, LLC, an affiliate of the investment adviser. The group fee rate decreases as assets under management increase and increases as assets under management decrease. For the reporting period, the total annual management fee rate was .79% of the Fund's average net assets.
Distribution and Service Plan Fees. In accordance with Rule 12b-1 of the 1940 Act, the Fund has adopted separate Distribution and Service Plans for each class of shares. Certain classes pay Fidelity Distributors Corporation (FDC), an affiliate of the investment adviser, separate Distribution and Service Fees, each of which is based on an annual percentage of each class' average net assets. In addition, FDC may pay financial intermediaries for selling shares of the Fund and providing shareholder support services. For the period, the Distribution and Service Fee rates, total fees and amounts retained by FDC were as follows:
| | Distribution Fee | Service Fee | Total Fees | Retained by FDC |
| Class A | -% | .25% | $15,611 | $151 |
| Class M | .25% | .25% | 13,152 | 280 |
| Class C | .75% | .25% | 42,277 | 2,474 |
| | | | $71,040 | $2,905 |
Sales Load. FDC may receive a front-end sales charge of up to 5.75% for selling Class A shares and 3.50% for selling Class M shares, some of which is paid to financial intermediaries for selling shares of the Fund. Depending on the holding period, FDC may receive contingent deferred sales charges levied on Class A, Class M and Class C redemptions. The deferred sales charges are 1.00% for Class C shares, 1.00% for certain purchases of Class A shares and .25% for certain purchases of Class M shares.
For the period, sales charge amounts retained by FDC were as follows:
| | Retained by FDC |
| Class A | $3,563 |
| Class M | 1,023 |
| Class C(a) | 426 |
| | $5,012 |
(a) When Class C shares are initially sold, FDC pays commissions from its own resources to financial intermediaries through which the sales are made.
Transfer Agent Fees. Fidelity Investments Institutional Operations Company, Inc., (FIIOC), an affiliate of the investment adviser, is the transfer, dividend disbursing and shareholder servicing agent for each class of the Fund. FIIOC receives account fees and asset-based fees that vary according to the account size and type of account of the shareholders of the respective classes of the Fund. FIIOC pays for typesetting, printing and mailing of shareholder reports, except proxy statements.
For the period, transfer agent fees for each class were as follows:
| | Amount | % of Class-Level Average Net Assets |
| Class A | $15,412 | .25 |
| Class M | 8,649 | .33 |
| Class C | 12,288 | .29 |
| Emerging Europe, Middle East, Africa (EMEA) | 222,934 | .25 |
| Class I | 10,797 | .15 |
| | $270,080 | |
Accounting and Security Lending Fees. Fidelity Service Company, Inc. (FSC), an affiliate of the investment adviser, maintains the Fund's accounting records. The accounting fee is based on the level of average net assets for each month. Under a separate contract, FSC administers the security lending program. The security lending fee is based on the number and duration of lending transactions. For the period, the fees were equivalent to an annual rate of .05%.
Brokerage Commissions. The Fund placed a portion of its portfolio transactions with brokerage firms which are affiliates of the investment adviser. Brokerage commissions are included in net realized gain (loss) and change in net unrealized appreciation (depreciation) in the Statement of Operations. The commissions paid to these affiliated firms were $15 for the period.
Interfund Trades. The Fund may purchase from or sell securities to other Fidelity Funds under procedures adopted by the Board. The procedures have been designed to ensure these interfund trades are executed in accordance with Rule 17a-7 of the 1940 Act. Interfund trades are included within the respective purchases and sales amounts shown in the Purchases and Sales of Investments note.
Other. During the period, the investment adviser reimbursed the Fund for certain losses in the amount of $8,941.
6. Committed Line of Credit.
The Fund participates with other funds managed by the investment adviser or an affiliate in a $4.25 billion credit facility (the "line of credit") to be utilized for temporary or emergency purposes to fund shareholder redemptions or for other short-term liquidity purposes. The Fund has agreed to pay commitment fees on its pro-rata portion of the line of credit, which amounted to $303 and is reflected in Miscellaneous expenses on the Statement of Operations. During the period, the Fund did not borrow on this line of credit.
7. Security Lending.
The Fund lends portfolio securities through a lending agent from time to time in order to earn additional income. For equity securities, a lending agent is used and may loan securities to certain qualified borrowers, including Fidelity Capital Markets (FCM), a broker-dealer affiliated with the Fund. On the settlement date of the loan, the Fund receives collateral (in the form of U.S. Treasury obligations, letters of credit and/or cash) against the loaned securities and maintains collateral in an amount not less than 100% of the market value of the loaned securities during the period of the loan. The market value of the loaned securities is determined at the close of business of the Fund and any additional required collateral is delivered to the Fund on the next business day. The Fund or borrower may terminate the loan at any time, and if the borrower defaults on its obligation to return the securities loaned because of insolvency or other reasons, the Fund may apply collateral received from the borrower against the obligation. The Fund may experience delays and costs in recovering the securities loaned. Any cash collateral received is invested in the Fidelity Securities Lending Cash Central Fund. At period end, there were no security loans outstanding. Security lending income represents the income earned on investing cash collateral, less rebates paid to borrowers and any lending agent fees associated with the loan, plus any premium payments received for lending certain types of securities. Security lending income is presented in the Statement of Operations as a component of income from Fidelity Central Funds. Total security lending income during the period amounted to $2,267. During the period, there were no securities loaned to FCM.
8. Expense Reductions.
The investment adviser contractually agreed to reimburse each class to the extent annual operating expenses exceeded certain levels of class-level average net assets as noted in the table below. This reimbursement will remain in place through February 29, 2020. Some expenses, for example the compensation of the independent Trustees, and certain miscellaneous expenses such as proxy and shareholder meeting expenses, are excluded from this reimbursement.
The following classes were in reimbursement during the period:
| | Expense Limitations | Reimbursement |
| Class M | 1.90% | $568 |
Commissions paid to certain brokers with whom the investment adviser, or its affiliates, places trades on behalf of the Fund include an amount in addition to trade execution, which may be rebated back to the Fund to offset certain expenses. This amount totaled $13,962 for the period.
In addition, during the period the investment adviser reimbursed and/or waived a portion of fund-level operating expenses in the amount of $1,042.
9. Distributions to Shareholders.
Distributions to shareholders of each class were as follows:
| | Year ended
October 31, 2018 | Year ended
October 31, 2017 |
| Distributions to shareholders | | |
| Class A | $80,590 | $– |
| Class M | 31,578 | – |
| Class C | 21,185 | – |
| Emerging Europe, Middle East, Africa (EMEA) | 1,390,507 | – |
| Class I | 121,821 | – |
| Total | $1,645,681 | $– |
| From net investment income | | |
| Class A | $– | $82,211 |
| Class M | – | 22,957 |
| Class C | – | 25,148 |
| Emerging Europe, Middle East, Africa (EMEA) | – | 957,314 |
| Class I | – | 79,809 |
| Total | $– | $1,167,439 |
10. Share Transactions.
Share transactions for each class were as follows and may contain automatic conversions between classes or exchanges between affiliated funds:
| | Shares | Shares | Dollars | Dollars |
| | Year ended October 31, 2018 | Year ended October 31, 2017 | Year ended October 31, 2018 | Year ended October 31, 2017 |
| Class A | | | | |
| Shares sold | 177,927 | 288,036 | $1,897,467 | $2,454,533 |
| Reinvestment of distributions | 8,201 | 9,506 | 78,321 | 78,136 |
| Shares redeemed | (208,116) | (675,335) | (2,037,720) | (5,836,992) |
| Net increase (decrease) | (21,988) | (377,793) | $(61,932) | $(3,304,323) |
| Class M | | | | |
| Shares sold | 44,576 | 66,562 | $452,127 | $565,838 |
| Reinvestment of distributions | 3,314 | 2,795 | 31,578 | 22,945 |
| Shares redeemed | (70,074) | (121,397) | (697,760) | (1,049,817) |
| Net increase (decrease) | (22,184) | (52,040) | $(214,055) | $(461,034) |
| Class C | | | | |
| Shares sold | 63,115 | 157,368 | $657,000 | $1,360,245 |
| Reinvestment of distributions | 2,063 | 2,631 | 19,680 | 21,571 |
| Shares redeemed | (207,873) | (471,197) | (2,030,610) | (4,103,204) |
| Net increase (decrease) | (142,695) | (311,198) | $(1,353,930) | $(2,721,388) |
| Emerging Europe, Middle East, Africa (EMEA) | | | | |
| Shares sold | 5,006,638 | 3,934,827 | $50,740,861 | $34,220,494 |
| Reinvestment of distributions | 134,990 | 108,986 | 1,287,802 | 895,866 |
| Shares redeemed | (4,409,321) | (4,855,547) | (43,865,965) | (42,616,730) |
| Net increase (decrease) | 732,307 | (811,734) | $8,162,698 | $(7,500,370) |
| Class I | | | | |
| Shares sold | 579,144 | 791,073 | $6,006,521 | $6,865,207 |
| Reinvestment of distributions | 11,175 | 9,024 | 106,495 | 74,090 |
| Shares redeemed | (750,732) | (780,970) | (7,569,369) | (6,887,678) |
| Net increase (decrease) | (160,413) | 19,127 | $(1,456,353) | $51,619 |
11. Other.
The Fund's organizational documents provide former and current trustees and officers with a limited indemnification against liabilities arising in connection with the performance of their duties to the Fund. In the normal course of business, the Fund may also enter into contracts that provide general indemnifications. The Fund's maximum exposure under these arrangements is unknown as this would be dependent on future claims that may be made against the Fund. The risk of material loss from such claims is considered remote.
Report of Independent Registered Public Accounting Firm
To the Trustees of Fidelity Investment Trust and Shareholders of Fidelity Emerging Europe, Middle East, Africa (EMEA) Fund:
Opinion on the Financial Statements and Financial Highlights
We have audited the accompanying statement of assets and liabilities of Fidelity Emerging Europe, Middle East, Africa (EMEA) Fund (the "Fund"), a fund of Fidelity Investment Trust, including the schedule of investments, as of October 31, 2018, and the related statement of operations for the year then ended, the statement of changes in net assets for each of the two years in the period then ended, the financial highlights for each of the five years in the period then ended, and the related notes. In our opinion, the financial statements and financial highlights present fairly, in all material respects, the financial position of the Fund as of October 31, 2018, and the results of its operations for the year then ended, the changes in its net assets for each of the two years in the period then ended, and the financial highlights for each of the five years in the period then ended, in conformity with accounting principles generally accepted in the United States of America.
Basis for Opinion
These financial statements and financial highlights are the responsibility of the Fund's management. Our responsibility is to express an opinion on the Fund's financial statements and financial highlights based on our audits. We are a public accounting firm registered with the Public Company Accounting Oversight Board (United States) (PCAOB) and are required to be independent with respect to the Fund in accordance with the U.S. federal securities laws and the applicable rules and regulations of the Securities and Exchange Commission and the PCAOB.
We conducted our audits in accordance with the standards of the PCAOB. Those standards require that we plan and perform the audit to obtain reasonable assurance about whether the financial statements and financial highlights are free of material misstatement, whether due to error or fraud. The Fund is not required to have, nor were we engaged to perform, an audit of its internal control over financial reporting. As part of our audits we are required to obtain an understanding of internal control over financial reporting but not for the purpose of expressing an opinion on the effectiveness of the Fund’s internal control over financial reporting. Accordingly, we express no such opinion.
Our audits included performing procedures to assess the risks of material misstatement of the financial statements and financial highlights, whether due to error or fraud, and performing procedures that respond to those risks. Such procedures included examining, on a test basis, evidence regarding the amounts and disclosures in the financial statements and financial highlights. Our audits also included evaluating the accounting principles used and significant estimates made by management, as well as evaluating the overall presentation of the financial statements and financial highlights. Our procedures included confirmation of securities owned as of October 31, 2018, by correspondence with the custodians and brokers; when replies were not received from brokers, we performed other auditing procedures. We believe that our audits provide a reasonable basis for our opinion.
/s/ Deloitte & Touche LLP
Boston, Massachusetts
December 13, 2018
We have served as the auditor of one or more of the Fidelity investment companies since 1999.
Trustees and Officers
The Trustees, Members of the Advisory Board (if any), and officers of the trust and fund, as applicable, are listed below. The Board of Trustees governs the fund and is responsible for protecting the interests of shareholders. The Trustees are experienced executives who meet periodically throughout the year to oversee the fund's activities, review contractual arrangements with companies that provide services to the fund, oversee management of the risks associated with such activities and contractual arrangements, and review the fund's performance. Except for Jonathan Chiel each of the Trustees oversees 283 funds. Mr. Chiel oversees 154 funds.
The Trustees hold office without limit in time except that (a) any Trustee may resign; (b) any Trustee may be removed by written instrument, signed by at least two-thirds of the number of Trustees prior to such removal; (c) any Trustee who requests to be retired or who has become incapacitated by illness or injury may be retired by written instrument signed by a majority of the other Trustees; and (d) any Trustee may be removed at any special meeting of shareholders by a two-thirds vote of the outstanding voting securities of the trust. Each Trustee who is not an interested person (as defined in the 1940 Act) of the trust and the fund is referred to herein as an Independent Trustee. Each Independent Trustee shall retire not later than the last day of the calendar year in which his or her 75th birthday occurs. The Independent Trustees may waive this mandatory retirement age policy with respect to individual Trustees. Officers and Advisory Board Members hold office without limit in time, except that any officer or Advisory Board Member may resign or may be removed by a vote of a majority of the Trustees at any regular meeting or any special meeting of the Trustees. Except as indicated, each individual has held the office shown or other offices in the same company for the past five years.
The fund’s Statement of Additional Information (SAI) includes more information about the Trustees. To request a free copy, call Fidelity at 1-800-544-8544.
Experience, Skills, Attributes, and Qualifications of the Trustees. The Governance and Nominating Committee has adopted a statement of policy that describes the experience, qualifications, attributes, and skills that are necessary and desirable for potential Independent Trustee candidates (Statement of Policy). The Board believes that each Trustee satisfied at the time he or she was initially elected or appointed a Trustee, and continues to satisfy, the standards contemplated by the Statement of Policy. The Governance and Nominating Committee also engages professional search firms to help identify potential Independent Trustee candidates who have the experience, qualifications, attributes, and skills consistent with the Statement of Policy. From time to time, additional criteria based on the composition and skills of the current Independent Trustees, as well as experience or skills that may be appropriate in light of future changes to board composition, business conditions, and regulatory or other developments, have also been considered by the professional search firms and the Governance and Nominating Committee. In addition, the Board takes into account the Trustees' commitment and participation in Board and committee meetings, as well as their leadership of standing and ad hoc committees throughout their tenure.
In determining that a particular Trustee was and continues to be qualified to serve as a Trustee, the Board has considered a variety of criteria, none of which, in isolation, was controlling. The Board believes that, collectively, the Trustees have balanced and diverse experience, qualifications, attributes, and skills, which allow the Board to operate effectively in governing the fund and protecting the interests of shareholders. Information about the specific experience, skills, attributes, and qualifications of each Trustee, which in each case led to the Board's conclusion that the Trustee should serve (or continue to serve) as a trustee of the fund, is provided below.
Board Structure and Oversight Function. James C. Curvey is an interested person and currently serves as Chairman. The Trustees have determined that an interested Chairman is appropriate and benefits shareholders because an interested Chairman has a personal and professional stake in the quality and continuity of services provided to the fund. Independent Trustees exercise their informed business judgment to appoint an individual of their choosing to serve as Chairman, regardless of whether the Trustee happens to be independent or a member of management. The Independent Trustees have determined that they can act independently and effectively without having an Independent Trustee serve as Chairman and that a key structural component for assuring that they are in a position to do so is for the Independent Trustees to constitute a substantial majority for the Board. The Independent Trustees also regularly meet in executive session. Ned C. Lautenbach serves as Chairman of the Independent Trustees and as such (i) acts as a liaison between the Independent Trustees and management with respect to matters important to the Independent Trustees and (ii) with management prepares agendas for Board meetings.
Fidelity® funds are overseen by different Boards of Trustees. The fund's Board oversees Fidelity's high income and certain equity funds, and other Boards oversee Fidelity's investment-grade bond, money market, asset allocation, and other equity funds. The asset allocation funds may invest in Fidelity® funds overseen by the fund's Board. The use of separate Boards, each with its own committee structure, allows the Trustees of each group of Fidelity® funds to focus on the unique issues of the funds they oversee, including common research, investment, and operational issues. On occasion, the separate Boards establish joint committees to address issues of overlapping consequences for the Fidelity® funds overseen by each Board.
The Trustees operate using a system of committees to facilitate the timely and efficient consideration of all matters of importance to the Trustees, the fund, and fund shareholders and to facilitate compliance with legal and regulatory requirements and oversight of the fund's activities and associated risks. The Board, acting through its committees, has charged FMR and its affiliates with (i) identifying events or circumstances the occurrence of which could have demonstrably adverse effects on the fund's business and/or reputation; (ii) implementing processes and controls to lessen the possibility that such events or circumstances occur or to mitigate the effects of such events or circumstances if they do occur; and (iii) creating and maintaining a system designed to evaluate continuously business and market conditions in order to facilitate the identification and implementation processes described in (i) and (ii) above. Because the day-to-day operations and activities of the fund are carried out by or through FMR, its affiliates, and other service providers, the fund's exposure to risks is mitigated but not eliminated by the processes overseen by the Trustees. While each of the Board's committees has responsibility for overseeing different aspects of the fund's activities, oversight is exercised primarily through the Operations, Audit, and Compliance Committees. In addition, the Independent Trustees have worked with Fidelity to enhance the Board's oversight of investment and financial risks, legal and regulatory risks, technology risks, and operational risks, including the development of additional risk reporting to the Board. Appropriate personnel, including but not limited to the fund's Chief Compliance Officer (CCO), FMR's internal auditor, the independent accountants, the fund's Treasurer and portfolio management personnel, make periodic reports to the Board's committees, as appropriate, including an annual review of Fidelity's risk management program for the Fidelity® funds. The responsibilities of each standing committee, including their oversight responsibilities, are described further under "Standing Committees of the Trustees."
Interested Trustees*:
Correspondence intended for a Trustee who is an interested person may be sent to Fidelity Investments, 245 Summer Street, Boston, Massachusetts 02210.
Name, Year of Birth; Principal Occupations and Other Relevant Experience+
Jonathan Chiel (1957)
Year of Election or Appointment: 2016
Trustee
Mr. Chiel also serves as Trustee of other Fidelity® funds. Mr. Chiel is Executive Vice President and General Counsel for FMR LLC (diversified financial services company, 2012-present). Previously, Mr. Chiel served as general counsel (2004-2012) and senior vice president and deputy general counsel (2000-2004) for John Hancock Financial Services; a partner with Choate, Hall & Stewart (1996-2000) (law firm); and an Assistant United States Attorney for the United States Attorney’s Office of the District of Massachusetts (1986-95), including Chief of the Criminal Division (1993-1995). Mr. Chiel is a director on the boards of the Boston Bar Foundation and the Maimonides School.
James C. Curvey (1935)
Year of Election or Appointment: 2007
Trustee
Chairman of the Board of Trustees
Mr. Curvey also serves as Trustee of other Fidelity® funds. Mr. Curvey is Vice Chairman (2007-present) and Director of FMR LLC (diversified financial services company). In addition, Mr. Curvey is an Overseer Emeritus for the Boston Symphony Orchestra, a Director of Artis-Naples, and a Trustee of Brewster Academy in Wolfeboro, New Hampshire. Previously, Mr. Curvey served as a Director of Fidelity Research & Analysis Co. (investment adviser firm, 2009-2018), Director of Fidelity Investments Money Management, Inc. (investment adviser firm, 2009-2014) and a Director of FMR and FMR Co., Inc. (investment adviser firms, 2007-2014).
Charles S. Morrison (1960)
Year of Election or Appointment: 2014
Trustee
Mr. Morrison also serves as Trustee of other funds. He serves as President of Fidelity SelectCo, LLC (investment adviser firm, 2017-present) and Fidelity Management & Research Company (FMR) (investment adviser firm, 2016-present), a Director of Fidelity Investments Money Management, Inc. (FIMM) (investment adviser firm, 2014-present), Director of Fidelity SelectCo, LLC (investment adviser firm, 2014-present), President, Asset Management (2014-present), and is an employee of Fidelity Investments. Previously, Mr. Morrison served as Vice President of Fidelity's Fixed Income and Asset Allocation Funds (2012-2014), President, Fixed Income (2011-2014), Vice President of Fidelity's Money Market Funds (2005-2009), President, Money Market Group Leader of FMR (investment adviser firm, 2009), and Senior Vice President, Money Market Group of FMR (2004-2009). Mr. Morrison also served as Vice President of Fidelity's Bond Funds (2002-2005), certain Balanced Funds (2002-2005), and certain Asset Allocation Funds (2002-2007), and as Senior Vice President (2002-2005) of Fidelity's Bond Division.
* Determined to be an “Interested Trustee” by virtue of, among other things, his or her affiliation with the trust or various entities under common control with FMR.
+ The information includes the Trustee's principal occupation during the last five years and other information relating to the experience, attributes, and skills relevant to the Trustee's qualifications to serve as a Trustee, which led to the conclusion that the Trustee should serve as a Trustee for the fund.
Independent Trustees:
Correspondence intended for an Independent Trustee may be sent to Fidelity Investments, P.O. Box 55235, Boston, Massachusetts 02205-5235.
Name, Year of Birth; Principal Occupations and Other Relevant Experience+
Dennis J. Dirks (1948)
Year of Election or Appointment: 2005
Trustee
Mr. Dirks also serves as Trustee of other Fidelity® funds. Prior to his retirement in May 2003, Mr. Dirks was Chief Operating Officer and a member of the Board of The Depository Trust & Clearing Corporation (DTCC). He also served as President, Chief Operating Officer, and Board member of The Depository Trust Company (DTC) and President and Board member of the National Securities Clearing Corporation (NSCC). In addition, Mr. Dirks served as Chief Executive Officer and Board member of the Government Securities Clearing Corporation, Chief Executive Officer and Board member of the Mortgage-Backed Securities Clearing Corporation, as a Trustee and a member of the Finance Committee of Manhattan College (2005-2008), as a Trustee and a member of the Finance Committee of AHRC of Nassau County (2006-2008), as a member of the Independent Directors Council (IDC) Governing Council (2010-2015), and as a member of the Board of Directors for The Brookville Center for Children’s Services, Inc. (2009-2017). Mr. Dirks is a member of the Finance Committee (2016-present), Board of Directors (2017-present) and Board of Trustees (2018-present) and is Treasurer (2018-present) of the Asolo Repertory Theatre.
Donald F. Donahue (1950)
Year of Election or Appointment: 2018
Trustee
Mr. Donahue also serves as a Trustee of other Fidelity® funds. Mr. Donahue is President and Chief Executive Officer of Miranda Partners, LLC (risk consulting for the financial services industry, 2012-present). Previously, Mr. Donahue served as a Member of the Advisory Board of certain Fidelity® funds (2015-2018) and Chief Executive Officer (2006-2012), Chief Operating Officer (2003-2006), and Managing Director, Customer Marketing and Development (1999-2003) of The Depository Trust & Clearing Corporation (financial markets infrastructure). Mr. Donahue serves as a Member (2007-present) and Co-Chairman (2016-present) of the Board of Directors of United Way of New York, Member of the Board of Directors of NYC Leadership Academy (2012-present) and Member of the Board of Advisors of Ripple Labs, Inc. (financial services, 2015-present). He also served as Chairman (2010-2012) and Member of the Board of Directors (2012-2013) of Omgeo, LLC (financial services), Treasurer of United Way of New York (2012-2016), and Member of the Board of Directors of XBRL US (financial services non-profit, 2009-2012) and the International Securities Services Association (2009-2012).
Alan J. Lacy (1953)
Year of Election or Appointment: 2008
Trustee
Mr. Lacy also serves as Trustee of other Fidelity® funds. Mr. Lacy serves as a Director of Bristol-Myers Squibb Company (global pharmaceuticals, 2008-present). He is a Trustee of the California Chapter of The Nature Conservancy (2015-present) and a Director of the Center for Advanced Study in the Behavioral Sciences at Stanford University (2015-present). In addition, Mr. Lacy served as Senior Adviser (2007-2014) of Oak Hill Capital Partners, L.P. (private equity) and also served as Chief Executive Officer (2005) and Vice Chairman (2005-2006) of Sears Holdings Corporation (retail) and Chief Executive Officer and Chairman of the Board of Sears, Roebuck and Co. (retail, 2000-2005). Previously, Mr. Lacy served as Chairman (2014-2017) and a member (2010-2017) of the Board of Directors of Dave & Buster’s Entertainment, Inc. (restaurant and entertainment complexes), as Chairman (2008-2011) and a member (2006-2015) of the Board of Trustees of the National Parks Conservation Association, and as a member of the Board of Directors for The Hillman Companies, Inc. (hardware wholesalers, 2010-2014), Earth Fare, Inc. (retail grocery, 2010-2014), and The Western Union Company (global money transfer, 2006-2011).
Ned C. Lautenbach (1944)
Year of Election or Appointment: 2000
Trustee
Chairman of the Independent Trustees
Mr. Lautenbach also serves as Trustee of other Fidelity® funds. Mr. Lautenbach currently serves as Vice Chair of the Board of Governors, State University System of Florida (2013-present) and is a member of the Council on Foreign Relations (1994-present). He is also a member and has most recently served as Chairman of the Board of Directors of Artis-Naples (2012-present). Previously, Mr. Lautenbach served as a member and then Lead Director of the Board of Directors of Eaton Corporation (diversified industrial, 1997-2016). He was also a Partner and Advisory Partner at Clayton, Dubilier & Rice, LLC (private equity investment, 1998-2010), as well as a Director of Sony Corporation (2006-2007). In addition, Mr. Lautenbach also had a 30-year career with IBM (technology company) during which time he served as Senior Vice President and a member of the Corporate Executive Committee (1968-1998).
Joseph Mauriello (1944)
Year of Election or Appointment: 2008
Trustee
Mr. Mauriello also serves as Trustee of other Fidelity® funds. Prior to his retirement in January 2006, Mr. Mauriello served in numerous senior management positions including Deputy Chairman and Chief Operating Officer (2004-2005), and Vice Chairman of Financial Services (2002-2004) of KPMG LLP US (professional services, 1965-2005). Mr. Mauriello currently serves as a member of the Independent Directors Council (IDC) Governing Council (2015-present). Previously, Mr. Mauriello served as a member of the Board of Directors of XL Group plc. (global insurance and re-insurance, 2006-2018).
Cornelia M. Small (1944)
Year of Election or Appointment: 2005
Trustee
Ms. Small also serves as Trustee of other Fidelity® funds. Ms. Small is a member of the Board of Directors (2009-present) and Chair of the Investment Committee (2010-present) of the Teagle Foundation. Ms. Small also serves on the Investment Committee of the Berkshire Taconic Community Foundation (2008-present). Previously, Ms. Small served as Chairperson (2002-2008) and a member of the Investment Committee and Chairperson (2008-2012) and a member of the Board of Trustees of Smith College. In addition, Ms. Small served as Chief Investment Officer, Director of Global Equity Investments, and a member of the Board of Directors of Scudder, Stevens & Clark and Scudder Kemper Investments.
Garnett A. Smith (1947)
Year of Election or Appointment: 2018
Trustee
Mr. Smith also serves as Trustee of other Fidelity® funds. Prior to Mr. Smith's retirement, he served as Chairman and Chief Executive Officer of Inbrand Corp. (manufacturer of personal absorbent products, 1990-1997). He also served as President (1986-1990) of Inbrand Corp. Prior to his employment with Inbrand Corp., he was employed by a retail fabric chain and North Carolina National Bank. In addition, Mr. Smith served as a Member of the Advisory Board of certain Fidelity® funds (2012-2013) and as a board member of the Jackson Hole Land Trust (2009-2012).
David M. Thomas (1949)
Year of Election or Appointment: 2008
Trustee
Mr. Thomas also serves as Trustee of other Fidelity® funds. Mr. Thomas serves as Non-Executive Chairman of the Board of Directors of Fortune Brands Home and Security (home and security products, 2011-present), as a member of the Board of Directors (2004-present) and Presiding Director (2013-present) of Interpublic Group of Companies, Inc. (marketing communication), and as a member of the Board of Trustees of the University of Florida (2013-present). Previously, Mr. Thomas served as Executive Chairman (2005-2006) and Chairman and Chief Executive Officer (2000-2005) of IMS Health, Inc. (pharmaceutical and healthcare information solutions), and a Director of Fortune Brands, Inc. (consumer products, 2000-2011).
+ The information includes the Trustee's principal occupation during the last five years and other information relating to the experience, attributes, and skills relevant to the Trustee's qualifications to serve as a Trustee, which led to the conclusion that the Trustee should serve as a Trustee for the fund.
Advisory Board Members and Officers:
Correspondence intended for a Member of the Advisory Board (if any) may be sent to Fidelity Investments, P.O. Box 55235, Boston, Massachusetts 02205-5235. Correspondence intended for an officer or Peter S. Lynch may be sent to Fidelity Investments, 245 Summer Street, Boston, Massachusetts 02210. Officers appear below in alphabetical order.
Name, Year of Birth; Principal Occupation
Vicki L. Fuller (1957)
Year of Election or Appointment: 2018
Member of the Advisory Board
Ms. Fuller also serves as Member of the Advisory Board of other Fidelity® funds. Ms. Fuller serves as a member of the Board of Directors, Audit Committee, and Nominating and Governance Committee of The Williams Companies, Inc. (natural gas infrastructure, 2018-present). Previously, Ms. Fuller served as the Chief Investment Officer of the New York State Common Retirement Fund (2012-2018) and held a variety of positions at AllianceBernstein L.P. (global asset management, 1985-2012), including Managing Director (2006-2012) and Senior Vice President and Senior Portfolio Manager (2001-2006).
Peter S. Lynch (1944)
Year of Election or Appointment: 2003
Member of the Advisory Board
Mr. Lynch also serves as Member of the Advisory Board of other Fidelity® funds. Mr. Lynch is Vice Chairman and a Director of FMR (investment adviser firm) and FMR Co., Inc. (investment adviser firm). In addition, Mr. Lynch serves as a Trustee of Boston College and as the Chairman of the Inner-City Scholarship Fund. Previously, Mr. Lynch served on the Special Olympics International Board of Directors (1997-2006).
William S. Stavropoulos (1939)
Year of Election or Appointment: 2018
Member of the Advisory Board
Mr. Stavropoulos also serves as Member of the Advisory Board of other Fidelity® funds. Mr. Stavropoulos serves as President and Founder of the Michigan Baseball Foundation, the Great Lakes Loons (2007-present). Mr. Stavropoulos is Chairman Emeritus of the Board of Directors of The Dow Chemical Company, where he previously served in numerous senior management positions, including President, CEO (1995-2000; 2002-2004), Chairman of the Executive Committee (2000-2006), and as a member of the Board of Directors (1990-2006). Currently, Mr. Stavropoulos is Chairman of the Board of Directors of Univar Inc. (global distributor of commodity and specialty chemicals), a Director of Teradata Corporation (data warehousing and technology solutions), and a member of the Advisory Board for Metalmark Capital LLC (private equity investment, 2005-present). Mr. Stavropoulos is an operating advisor to Clayton, Dubilier & Rice, LLC (private equity investment). In addition, Mr. Stavropoulos is a member of the University of Notre Dame Advisory Council for the College of Science, a Trustee of the Rollin L. Gerstacker Foundation, and a Director of Artis-Naples in Naples, Florida. Previously, Mr. Stavropoulos served as Trustee of certain Fidelity® funds (2001-2018) and as a Director of Chemical Financial Corporation (bank holding company, 1993-2012) and Tyco International, Ltd. (multinational manufacturing and services, 2007-2012).
Carol B. Tomé (1957)
Year of Election or Appointment: 2018
Member of the Advisory Board
Ms. Tomé also serves as Member of the Advisory Board of other Fidelity® funds. Ms. Tomé is Chief Financial Officer (2001-present) and Executive Vice President of Corporate Services (2007-present) of The Home Depot, Inc. (home improvement retailer) and a Director (2003-present) and Chair of the Audit Committee (2004-present) of United Parcel Service, Inc. (package delivery and supply chain management). Previously, Ms. Tomé served as Trustee of certain Fidelity® funds (2017), Senior Vice President of Finance and Accounting/Treasurer (2000-2007) and Vice President and Treasurer (1995-2000) of The Home Depot, Inc. and Chair of the Board (2010-2012), Vice Chair of the Board (2009 and 2013), and a Director (2008-2013) of the Federal Reserve Bank of Atlanta. Ms. Tomé is also a director or trustee of many community and professional organizations.
Michael E. Wiley (1950)
Year of Election or Appointment: 2018
Member of the Advisory Board
Mr. Wiley also serves as Trustee or Member of the Advisory Board of other Fidelity® funds. Mr. Wiley serves as a Director of High Point Resources (exploration and production, 2005-present). Previously, Mr. Wiley served as a Director of Andeavor Corporation (independent oil refiner and marketer, 2005-2018), a Director of Andeavor Logistics LP (natural resources logistics, 2015-2018), a Director of Post Oak Bank (privately-held bank, 2004-2018), a Director of Asia Pacific Exploration Consolidated (international oil and gas exploration and production, 2008-2013), a member of the Board of Trustees of the University of Tulsa (2000-2006; 2007-2010), a Senior Energy Advisor of Katzenbach Partners, LLC (consulting, 2006-2007), an Advisory Director of Riverstone Holdings (private investment), a Director of Spinnaker Exploration Company (exploration and production, 2001-2005) and Chairman, President, and CEO of Baker Hughes, Inc. (oilfield services, 2000-2004).
Elizabeth Paige Baumann (1968)
Year of Election or Appointment: 2017
Anti-Money Laundering (AML) Officer
Ms. Baumann also serves as AML Officer of other funds. She is Chief AML Officer (2012-present) and Senior Vice President (2014-present) of FMR LLC (diversified financial services company) and is an employee of Fidelity Investments. Previously, Ms. Baumann served as AML Officer of the funds (2012-2016), and Vice President (2007-2014) and Deputy Anti-Money Laundering Officer (2007-2012) of FMR LLC.
John J. Burke III (1964)
Year of Election or Appointment: 2018
Chief Financial Officer
Mr. Burke also serves as Chief Financial Officer of other funds. Mr. Burke serves as Head of Investment Operations for Fidelity Fund and Investment Operations (2018-present) and is an employee of Fidelity Investments (1998-present). Previously Mr. Burke served as head of Asset Management Investment Operations (2012-2018).
William C. Coffey (1969)
Year of Election or Appointment: 2018
Secretary and Chief Legal Officer (CLO)
Mr. Coffey also serves as Secretary and CLO of other funds. Mr. Coffey serves as CLO, Secretary, and Senior Vice President of Fidelity Management & Research Company and FMR Co., Inc. (investment adviser firms, 2018-present); Secretary of Fidelity SelectCo, LLC and Fidelity Investments Money Management, Inc. (investment adviser firms, 2018-present); and CLO of Fidelity Management & Research (Hong Kong) Limited, FMR Investment Management (UK) Limited, and Fidelity Management & Research (Japan) Limited (investment adviser firms, 2018-present). He is Senior Vice President and Deputy General Counsel of FMR LLC (diversified financial services company, 2010-present), and is an employee of Fidelity Investments. Previously, Mr. Coffey served as Assistant Secretary of certain funds (2009-2018) and as Vice President and Associate General Counsel of FMR LLC (2005-2009).
Timothy M. Cohen (1969)
Year of Election or Appointment: 2018
Vice President
Mr. Cohen also serves as Vice President of other funds. Mr. Cohen serves as Co-Head of Global Equity Research (2016-present), a Director of Fidelity Management & Research (Japan) Limited (investment adviser firm, 2016-present), and is an employee of Fidelity Investments. Previously, Mr. Cohen served as Chief Investment Officer - Equity and a Director of Fidelity Management & Research (U.K.) Inc. (investment adviser firm, 2013-2015) and as a Director of Fidelity Management & Research (Hong Kong) Limited (investment adviser firm, 2017).
Jonathan Davis (1968)
Year of Election or Appointment: 2010
Assistant Treasurer
Mr. Davis also serves as Assistant Treasurer of other funds. Mr. Davis serves as Assistant Treasurer of FMR Capital, Inc. (2017-present) and is an employee of Fidelity Investments. Previously, Mr. Davis served as Vice President and Associate General Counsel of FMR LLC (diversified financial services company, 2003-2010).
Adrien E. Deberghes (1967)
Year of Election or Appointment: 2016
Assistant Treasurer
Mr. Deberghes also serves as an officer of other funds. He serves as Assistant Treasurer of FMR Capital, Inc. (2017-present), Executive Vice President of Fidelity Investments Money Management, Inc. (FIMM) (investment adviser firm, 2016-present), and is an employee of Fidelity Investments (2008-present). Previously, Mr. Deberghes served as President and Treasurer of certain Fidelity® funds (2013-2018). Prior to joining Fidelity Investments, Mr. Deberghes was Senior Vice President of Mutual Fund Administration at State Street Corporation (2007-2008), Senior Director of Mutual Fund Administration at Investors Bank & Trust (2005-2007), and Director of Finance for Dunkin' Brands (2000-2005). Previously, Mr. Deberghes served in other fund officer roles.
Laura M. Del Prato (1964)
Year of Election or Appointment: 2018
Assistant Treasurer
Ms. Del Prato also serves as an officer of other funds. Ms. Del Prato is an employee of Fidelity Investments (2017-present). Prior to joining Fidelity Investments, Ms. Del Prato served as a Managing Director and Treasurer of the JPMorgan Mutual Funds (2014-2017). Prior to JPMorgan, Ms. Del Prato served as a partner at Cohen Fund Audit Services (accounting firm, 2012-2013) and KPMG LLP (accounting firm, 2004-2012).
Colm A. Hogan (1973)
Year of Election or Appointment: 2016
Deputy Treasurer
Mr. Hogan also serves as an officer of other funds. Mr. Hogan serves as Assistant Treasurer of FMR Capital, Inc. (2017-present) and is an employee of Fidelity Investments (2005-present). Previously, Mr. Hogan served as Assistant Treasurer of certain Fidelity® funds (2016-2018).
Pamela R. Holding (1964)
Year of Election or Appointment: 2018
Vice President
Ms. Holding also serves as Vice President of other funds. Ms. Holding serves as Co-Head of Global Equity Research (2018-present) and is an employee of Fidelity Investments (2013-present).
Chris Maher (1972)
Year of Election or Appointment: 2013
Assistant Treasurer
Mr. Maher serves as Assistant Treasurer of other funds. Mr. Maher is Vice President of Valuation Oversight, serves as Assistant Treasurer of FMR Capital, Inc. (2017-present), and is an employee of Fidelity Investments. Previously, Mr. Maher served as Vice President of Asset Management Compliance (2013), Vice President of the Program Management Group of FMR (investment adviser firm, 2010-2013), and Vice President of Valuation Oversight (2008-2010).
Rieco E. Mello (1969)
Year of Election or Appointment: 2017
Assistant Treasurer
Mr. Mello also serves as Assistant Treasurer of other funds. Mr. Mello serves as Assistant Treasurer of FMR Capital, Inc. (2017-present) and is an employee of Fidelity Investments (1995-present).
Kenneth B. Robins (1969)
Year of Election or Appointment: 2016
Chief Compliance Officer
Mr. Robins also serves as an officer of other funds. Mr. Robins serves as Compliance Officer of Fidelity Management & Research Company and FMR Co., Inc. (investment adviser firms, 2016-present) and is an employee of Fidelity Investments (2004-present). Previously, Mr. Robins served as Executive Vice President of Fidelity Investments Money Management, Inc. (investment adviser firm, 2013-2016) and served in other fund officer roles.
Stacie M. Smith (1974)
Year of Election or Appointment: 2016
President and Treasurer
Ms. Smith also serves as an officer of other funds. Ms. Smith serves as Assistant Treasurer of FMR Capital, Inc. (2017-present), is an employee of Fidelity Investments (2009-present), and has served in other fund officer roles. Prior to joining Fidelity Investments, Ms. Smith served as Senior Audit Manager of Ernst & Young LLP (accounting firm, 1996-2009). Previously, Ms. Smith served as Assistant Treasurer (2013-2018) and Deputy Treasurer (2013-2016) of certain Fidelity® funds.
Marc L. Spector (1972)
Year of Election or Appointment: 2016
Assistant Treasurer
Mr. Spector also serves as an officer of other funds. Mr. Spector serves as Assistant Treasurer of FMR Capital, Inc. (2017-present) and is an employee of Fidelity Investments (2016-present). Prior to joining Fidelity Investments, Mr. Spector served as Director at the Siegfried Group (accounting firm, 2013-2016), and prior to Siegfried Group as audit senior manager at Deloitte & Touche (accounting firm, 2005-2013).
Shareholder Expense Example
As a shareholder of the Fund, you incur two types of costs: (1) transaction costs, including sales charges (loads) on purchase payments or redemption proceeds, redemption fees and (2) ongoing costs, including management fees, distribution and/or service (12b-1) fees and other Fund expenses. This Example is intended to help you understand your ongoing costs (in dollars) of investing in the Fund and to compare these costs with the ongoing costs of investing in other mutual funds.
The Example is based on an investment of $1,000 invested at the beginning of the period and held for the entire period (May 1, 2018 to October 31, 2018).
Actual Expenses
The first line of the accompanying table for each class of the Fund provides information about actual account values and actual expenses. You may use the information in this line, together with the amount you invested, to estimate the expenses that you paid over the period. Simply divide your account value by $1,000.00 (for example, an $8,600 account value divided by $1,000.00 = 8.6), then multiply the result by the number in the first line for a class of the Fund under the heading entitled "Expenses Paid During Period" to estimate the expenses you paid on your account during this period. A small balance maintenance fee of $12.00 that is charged once a year may apply for certain accounts with a value of less than $2,000. This fee, which was eliminated effective August 1, 2018, is not included in the table below. If it was, the estimate of expenses you paid during the period would be higher, and your ending account value lower, by this amount. In addition, the Fund, as a shareholder in the underlying Fidelity Central Funds, will indirectly bear its pro-rata share of the fees and expenses incurred by the underlying Fidelity Central Funds. These fees and expenses are not included in the Fund's annualized expense ratio used to calculate the expense estimate in the table below.
Hypothetical Example for Comparison Purposes
The second line of the accompanying table for each class of the Fund provides information about hypothetical account values and hypothetical expenses based on a Class' actual expense ratio and an assumed rate of return of 5% per year before expenses, which is not the Class' actual return. The hypothetical account values and expenses may not be used to estimate the actual ending account balance or expenses you paid for the period. You may use this information to compare the ongoing costs of investing in the Fund and other funds. To do so, compare this 5% hypothetical example with the 5% hypothetical examples that appear in the shareholder reports of the other funds. A small balance maintenance fee of $12.00 that is charged once a year may apply for certain accounts with a value of less than $2,000. This fee, which was eliminated effective August 1, 2018, is not included in the table below. If it was, the estimate of expenses you paid during the period would be higher, and your ending account value lower, by this amount. In addition, the Fund, as a shareholder in the underlying Fidelity Central Funds, will indirectly bear its pro-rata share of the fees and expenses incurred by the underlying Fidelity Central Funds. These fees and expenses are not included in the Fund's annualized expense ratio used to calculate the expense estimate in the table below.
Please note that the expenses shown in the table are meant to highlight your ongoing costs only and do not reflect any transaction costs. Therefore, the second line of the table is useful in comparing ongoing costs only, and will not help you determine the relative total costs of owning different funds. In addition, if these transactional costs were included, your costs would have been higher.
| | Annualized Expense Ratio-A | Beginning
Account Value
May 1, 2018 | Ending
Account Value
October 31, 2018 | Expenses Paid
During Period-B
May 1, 2018
to October 31, 2018 |
| Class A | 1.54% | | | |
| Actual | | $1,000.00 | $864.50 | $7.24 |
| Hypothetical-C | | $1,000.00 | $1,017.44 | $7.83 |
| Class M | 1.88% | | | |
| Actual | | $1,000.00 | $863.00 | $8.83 |
| Hypothetical-C | | $1,000.00 | $1,015.73 | $9.55 |
| Class C | 2.34% | | | |
| Actual | | $1,000.00 | $860.10 | $10.97 |
| Hypothetical-C | | $1,000.00 | $1,013.41 | $11.88 |
| Emerging Europe, Middle East, Africa (EMEA) | 1.31% | | | |
| Actual | | $1,000.00 | $864.70 | $6.16 |
| Hypothetical-C | | $1,000.00 | $1,018.60 | $6.67 |
| Class I | 1.18% | | | |
| Actual | | $1,000.00 | $866.30 | $5.55 |
| Hypothetical-C | | $1,000.00 | $1,019.26 | $6.01 |
A Annualized expense ratio reflects expenses net of applicable fee waivers.
B Expenses are equal to each Class' annualized expense ratio, multiplied by the average account value over the period, multiplied by 184/365 (to reflect the one-half year period).
C 5% return per year before expenses
Distributions (Unaudited)
The Board of Trustees of Fidelity Advisor Emerging Europe, Middle East, Africa (EMEA) Fund voted to pay to shareholders of record at the opening of business on record date, the following distributions per share derived from capital gains realized from sales of portfolio securities, and dividends derived from net investment income:
| | Pay Date | Record Date | Dividends | Capital Gains |
| Fidelity Advisor Emerging Europe, Middle East, Africa (EMEA) Fund | | | | |
| Class A | 12/10/18 | 12/07/18 | $0.184 | $0.003 |
| Class M | 12/10/18 | 12/07/18 | $0.161 | $0.003 |
| Class C | 12/10/18 | 12/07/18 | $0.091 | $0.003 |
| Emerging Europe, Middle East, Africa (EMEA) | 12/10/18 | 12/07/18 | $0.213 | $0.003 |
| Class I | 12/10/18 | 12/07/18 | $0.222 | $0.003 |
|
Class A, Class M, Class C, Emerging Europe, Middle East, Africa (EMEA), and Class I designate 100% of the dividends distributed during the fiscal year as amounts which may be taken into account as a dividend for purposes of the maximum rate under section 1(h)(11) of the Internal Revenue Code.
The amounts per share which represent income derived from sources within, and taxes paid to, foreign countries or possessions of the United States are as follows:
| | Pay Date | Income | Taxes |
| Fidelity Advisor Emerging Europe, Middle East, Africa (EMEA) Fund | | | |
| Class A | 12/11/17 | $0.1760 | $0.0380 |
| Class M | 12/11/17 | $0.1550 | $0.0380 |
| Class C | 12/11/17 | $0.0840 | $0.0380 |
| Emerging Europe, Middle East, Africa (EMEA) | 12/11/17 | $0.2030 | $0.0380 |
| Class I | 12/11/17 | $0.2130 | $0.0380 |
|
The fund will notify shareholders in January 2019 of amounts for use in preparing 2018 income tax returns.
Board Approval of Investment Advisory Contracts
Fidelity Emerging Europe, Middle East, Africa (EMEA) Fund
At its July 2018 meeting, the Board of Trustees, including the Independent Trustees (together, the Board), voted to continue the management contract with Fidelity Management & Research Company (FMR) and the sub-advisory agreements (together, the Advisory Contracts) for the fund for six months through January 31, 2019, in connection with the reunification of the Fidelity Equity High Income Funds Board, which oversees the fund, and the Sector Portfolios Board.
The Board considered that the approval of the fund's Advisory Contracts will not result in any changes in (i) the investment process or strategies employed in the management of the fund's assets; (ii) the fees and expenses paid by shareholders; (iii) the nature, extent or quality of services provided under the fund's Advisory Contracts; or (iv) the day-to-day management of the fund or the persons primarily responsible for such management. The Board concluded that the fund's Advisory Contracts are fair and reasonable, and that the fund's Advisory Contracts should be renewed, without modification, through January 31, 2019, with the understanding that the Board will consider the annual renewal for a full one year period in January 2019.
In connection with its consideration of future renewals of the fund's Advisory Contracts, the Board will consider: (i) the nature, extent and quality of services provided to the fund, including shareholder and administrative services and investment performance; (ii) the competitiveness of the management fee and total expenses for the fund; (iii) the costs of the services and profitability, including the revenues earned and the expenses incurred in conducting the business of developing, marketing, distributing, managing, administering, and servicing the fund and its shareholders, to the extent applicable, as well as potential fall-out benefits from Fidelity's non-fund businesses; and (iv) whether there have been economies of scale in respect of the Fidelity funds, whether the Fidelity funds (including the fund) have appropriately benefited from any such economies of scale, and whether there is the potential for realization of any further economies.
Based on its evaluation of all of the conclusions noted above, and after considering all factors it believed relevant, the Board ultimately concluded that the fund's management fee structure is fair and reasonable, and that the continuation of the fund's Advisory Contracts should be approved.
AEME-ANN-1218
1.861989.110
Fidelity® Emerging Europe, Middle East, Africa (EMEA) Fund
Annual Report October 31, 2018 |
|
Contents
To view a fund's proxy voting guidelines and proxy voting record for the 12-month period ended June 30, visit http://www.fidelity.com/proxyvotingresults or visit the Securities and Exchange Commission's (SEC) web site at http://www.sec.gov.
You may also call 1-800-544-8544 to request a free copy of the proxy voting guidelines.
Standard & Poor's, S&P and S&P 500 are registered service marks of The McGraw-Hill Companies, Inc. and have been licensed for use by Fidelity Distributors Corporation.
Other third-party marks appearing herein are the property of their respective owners.
All other marks appearing herein are registered or unregistered trademarks or service marks of FMR LLC or an affiliated company. © 2018 FMR LLC. All rights reserved.
This report and the financial statements contained herein are submitted for the general information of the shareholders of the Fund. This report is not authorized for distribution to prospective investors in the Fund unless preceded or accompanied by an effective prospectus.
A fund files its complete schedule of portfolio holdings with the SEC for the first and third quarters of each fiscal year on Form N-Q. Forms N-Q are available on the SEC’s web site at http://www.sec.gov. A fund's Forms N-Q may be reviewed and copied at the SEC’s Public Reference Room in Washington, DC. Information regarding the operation of the SEC's Public Reference Room may be obtained by calling 1-800-SEC-0330.
For a complete list of a fund's portfolio holdings, view the most recent holdings listing, semiannual report, or annual report on Fidelity's web site at http://www.fidelity.com, http://www.institutional.fidelity.com, or http://www.401k.com, as applicable.
NOT FDIC INSURED •MAY LOSE VALUE •NO BANK GUARANTEE
Neither the Fund nor Fidelity Distributors Corporation is a bank.
Performance: The Bottom Line
Average annual total return reflects the change in the value of an investment, assuming reinvestment of distributions from dividend income and capital gains (the profits earned upon the sale of securities that have grown in value, if any) and assuming a constant rate of performance each year. The hypothetical investment and the average annual total returns do not reflect the deduction of taxes that a shareholder would pay on fund distributions or the redemption of fund shares. During periods of reimbursement by Fidelity, a fund’s total return will be greater than it would be had the reimbursement not occurred. How a fund did yesterday is no guarantee of how it will do tomorrow.
Average Annual Total Returns
| For the periods ended October 31, 2018 | Past 1 year | Past 5 years | Past 10 years |
| Fidelity® Emerging Europe, Middle East, Africa (EMEA) Fund | (4.00)% | 0.35% | 8.22% |
$10,000 Over 10 Years
Let's say hypothetically that $10,000 was invested in Fidelity® Emerging Europe, Middle East, Africa (EMEA) Fund, a class of the fund, on October 31, 2008.
The chart shows how the value of your investment would have changed, and also shows how the MSCI EM (Emerging Markets) Europe, Middle East and Africa Index performed over the same period.
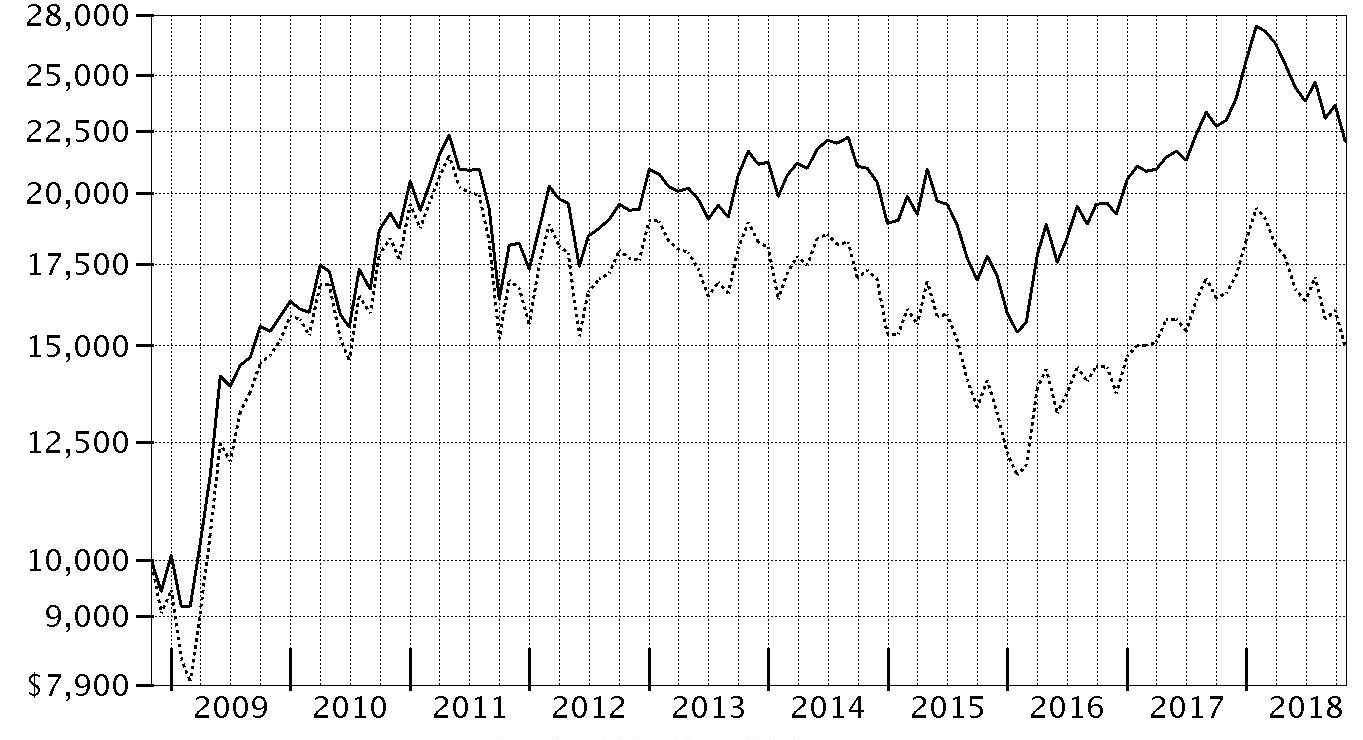
| Period Ending Values |
| $22,040 | Fidelity® Emerging Europe, Middle East, Africa (EMEA) Fund |
| $14,947 | MSCI EM (Emerging Markets) Europe, Middle East and Africa Index |
Management's Discussion of Fund Performance
Market Recap: International equities returned -8.08% for the 12 months ending October 31, 2018, according to the MSCI ACWI (All Country World Index) ex USA Index. A modestly positive first half of the period gave way to a confluence of overwhelmingly negative factors – including escalating trade tensions, a surging U.S. dollar, tepid economic growth in Europe, global central bank tightening, concerns about Italy’s budget stalemate with the EU, and weakness in China’s stock market. The index lost 8% in October alone, its largest monthly drop in more than six years. Among sectors, communications services (-15%) was hit the hardest, while economically sensitive consumer discretionary (-13%), information technology (-12%), financials (-10%), industrials (-9%) and materials (-7%) stocks also fared poorly. Even the more defensive real estate (-9%), utilities (-6%) and consumer staples (-5%) sectors weren’t spared this period. Conversely, elevated crude-oil prices fueled a positive return for energy (+7%), the top-performing sector, followed by the relatively stable-growing health care segment (+2%). Regionally, emerging markets (-12%) fared the worst, hampered by the impact of foreign exchange and concerns about economic weakness in China, India and South Korea. Sluggish growth also pressured shares in continental Europe (-9%). Stocks in Japan (-3%) and the U.K. (-4%) held up better, followed by Canada (-5%) and Asia-Pacific ex Japan (-6%).
Comments from Portfolio Manager Adam Kutas: For the year, the fund's share classes (excluding sales charges, if applicable) returned roughly -4% to -5% outpacing the -9.68% decline of the benchmark, the MSCI EM (Emerging Markets) Europe, Middle East and Africa Index. After making strong gains in the first four months of this 12-month period, emerging EMEA equities pulled back sharply beginning in roughly February, ending the period in negative territory. Versus the MSCI index, stock selection drove the fund's relative outperformance the past 12 months, especially within the consumer discretionary and financials sectors. Avoiding poor-performing index component South African private-equity investor Steinhoff International Holdings, which faced a financial accounting investigation, notably helped the fund's relative result. Not owning index holding Magnit, a Russia-based retailer that faced increased competition, also added value. Conversely, avoiding strong-performing index component Qatar Bank detracted more than any other fund position. Choices in materials also hurt, mainly due to untimely ownership of South African integrated energy and chemical company Sasol. However, I maintain conviction in this company's longer-term outlook and continued to hold a sizable stake in Sasol as of October 31.
The views expressed above reflect those of the portfolio manager(s) only through the end of the period as stated on the cover of this report and do not necessarily represent the views of Fidelity or any other person in the Fidelity organization. Any such views are subject to change at any time based upon market or other conditions and Fidelity disclaims any responsibility to update such views. These views may not be relied on as investment advice and, because investment decisions for a Fidelity fund are based on numerous factors, may not be relied on as an indication of trading intent on behalf of any Fidelity fund.
Investment Summary (Unaudited)
Geographic Diversification (% of fund's net assets)
| As of October 31, 2018 |
| | South Africa | 40.3% |
| | Russia | 29.0% |
| | United Arab Emirates | 5.1% |
| | Saudi Arabia | 4.4% |
| | Romania | 2.7% |
| | Poland | 2.6% |
| | Nigeria | 2.3% |
| | Qatar | 2.1% |
| | Hungary | 1.7% |
| | Other* | 9.8% |
* Includes Short-Term investments and Net Other Assets (Liabilities).
Percentages are based on country or territory of incorporation and are adjusted for the effect of futures contracts, if applicable.
Asset Allocation as of October 31, 2018
| | % of fund's net assets |
| Stocks | 98.6 |
| Short-Term Investments and Net Other Assets (Liabilities) | 1.4 |
Top Ten Stocks as of October 31, 2018
| | % of fund's net assets |
| Naspers Ltd. Class N (South Africa, Media) | 6.4 |
| Lukoil PJSC sponsored ADR (Russia, Oil, Gas & Consumable Fuels) | 6.4 |
| Sberbank of Russia (Russia, Banks) | 5.5 |
| Gazprom OAO (Russia, Oil, Gas & Consumable Fuels) | 4.9 |
| Tatneft PAO (Russia, Oil, Gas & Consumable Fuels) | 4.3 |
| NOVATEK OAO (Russia, Oil, Gas & Consumable Fuels) | 3.8 |
| FirstRand Ltd. (South Africa, Diversified Financial Services) | 3.6 |
| Standard Bank Group Ltd. (South Africa, Banks) | 3.4 |
| Sasol Ltd. (South Africa, Chemicals) | 3.1 |
| PSG Group Ltd. (South Africa, Diversified Financial Services) | 2.4 |
| | 43.8 |
Top Market Sectors as of October 31, 2018
| | % of fund's net assets |
| Financials | 32.6 |
| Energy | 21.3 |
| Materials | 13.8 |
| Communication Services | 9.1 |
| Consumer Discretionary | 8.8 |
| Consumer Staples | 7.5 |
| Industrials | 3.1 |
| Real Estate | 1.4 |
| Health Care | 1.0 |
Market Sectors may include more than one industry category.
The Fund may invest up to 35% of its total assets in any industry that represents more than 20% of the emerging Europe, Middle East and Africa markets. As of October 31, 2018, the Fund did not have more than 25% of its total assets invested in any one industry.
Schedule of Investments October 31, 2018
Showing Percentage of Net Assets
| Common Stocks - 96.8% | | | |
| | | Shares | Value |
| Bermuda - 0.9% | | | |
| Central European Media Enterprises Ltd. Class A (a) | | 245,000 | $828,100 |
| Botswana - 0.3% | | | |
| First National Bank of Botswana Ltd. | | 1,242,331 | 267,862 |
| Canada - 0.3% | | | |
| First Quantum Minerals Ltd. | | 30,500 | 304,432 |
| Cyprus - 0.5% | | | |
| Globaltrans Investment PLC GDR (Reg. S) | | 47,900 | 469,420 |
| Greece - 1.7% | | | |
| Fourlis Holdings SA | | 71,700 | 351,644 |
| Jumbo SA | | 26,536 | 387,121 |
| Mytilineos Holdings SA | | 51,000 | 451,146 |
| Sarantis SA | | 55,600 | 442,087 |
|
| TOTAL GREECE | | | 1,631,998 |
|
| Hungary - 1.7% | | | |
| OTP Bank PLC | | 46,100 | 1,656,475 |
| Israel - 0.2% | | | |
| Bank Hapoalim BM (Reg.) | | 30,000 | 203,234 |
| Kenya - 0.7% | | | |
| Safaricom Ltd. | | 2,927,644 | 666,677 |
| Kuwait - 0.6% | | | |
| National Bank of Kuwait | | 220,000 | 595,358 |
| Morocco - 0.5% | | | |
| Attijariwafa Bank | | 11,725 | 510,654 |
| Netherlands - 1.1% | | | |
| X5 Retail Group NV GDR (Reg. S) | | 47,200 | 1,109,200 |
| Nigeria - 2.3% | | | |
| Dangote Cement PLC | | 1,107,463 | 637,630 |
| Guaranty Trust Bank PLC | | 5,263,598 | 543,760 |
| Nigerian Breweries PLC | | 2,160,122 | 490,342 |
| Zenith Bank PLC | | 8,351,272 | 540,647 |
|
| TOTAL NIGERIA | | | 2,212,379 |
|
| Poland - 2.6% | | | |
| Globe Trade Centre SA | | 283,900 | 597,077 |
| Inter Cars SA | | 9,700 | 606,700 |
| LPP SA | | 470 | 961,521 |
| Orbis SA | | 21,900 | 384,676 |
|
| TOTAL POLAND | | | 2,549,974 |
|
| Qatar - 2.1% | | | |
| Qatar Islamic Bank (a) | | 48,700 | 2,046,443 |
| Romania - 2.7% | | | |
| Banca Transilvania SA | | 956,231 | 538,774 |
| BRD-Groupe Societe Generale | | 451,735 | 1,430,597 |
| Fondul Propietatea SA GDR | | 56,500 | 649,750 |
|
| TOTAL ROMANIA | | | 2,619,121 |
|
| Russia - 27.2% | | | |
| Alrosa Co. Ltd. | | 769,200 | 1,166,521 |
| Gazprom OAO | | 2,037,813 | 4,809,485 |
| Lukoil PJSC | | 28,600 | 2,146,940 |
| Lukoil PJSC sponsored ADR | | 54,795 | 4,093,187 |
| MMC Norilsk Nickel PJSC | | 12,800 | 2,137,422 |
| NOVATEK OAO | | 231,000 | 3,681,342 |
| Novolipetsk Steel OJSC GDR (Reg. S) | | 30,400 | 734,464 |
| Sberbank of Russia | | 1,882,650 | 5,411,274 |
| Tatneft PAO | | 197,500 | 2,351,756 |
|
| TOTAL RUSSIA | | | 26,532,391 |
|
| Saudi Arabia - 4.4% | | | |
| Abdullah Al Othaim Markets Co. | | 34,800 | 663,317 |
| Al Rajhi Bank | | 34,800 | 811,751 |
| Aldrees Petroleum and Transport Services Co. | | 86,625 | 738,973 |
| Mouwasat Medical Services Co. | | 24,700 | 507,018 |
| SABIC | | 3,000 | 101,409 |
| Saudi Co. for Hardware CJSC | | 28,300 | 648,060 |
| United International Transportation Co. | | 106,984 | 792,865 |
|
| TOTAL SAUDI ARABIA | | | 4,263,393 |
|
| South Africa - 40.3% | | | |
| African Rainbow Minerals Ltd. | | 86,000 | 728,049 |
| Anglo American Platinum Ltd. | | 42,200 | 1,378,576 |
| AVI Ltd. | | 97,400 | 660,227 |
| Barloworld Ltd. | | 79,000 | 642,603 |
| Cashbuild Ltd. | | 47,900 | 875,691 |
| City Lodge Hotels Ltd. | | 73,400 | 651,781 |
| Clicks Group Ltd. | | 91,883 | 1,170,920 |
| DRDGOLD Ltd. | | 3,567,414 | 901,705 |
| FirstRand Ltd. | | 794,000 | 3,461,253 |
| Imperial Holdings Ltd. | | 91,100 | 1,006,006 |
| KAP Industrial Holdings Ltd. | | 1,145,700 | 605,759 |
| Kumba Iron Ore Ltd. | | 41,600 | 814,940 |
| Mr Price Group Ltd. | | 105,800 | 1,656,440 |
| MTN Group Ltd. | | 186,950 | 1,083,493 |
| Nampak Ltd. (a) | | 1,094,500 | 1,101,734 |
| Naspers Ltd. Class N | | 35,600 | 6,256,525 |
| Pretoria Portland Cement Co. Ltd. (a) | | 1,192,249 | 480,051 |
| PSG Group Ltd. | | 159,700 | 2,381,454 |
| RMB Holdings Ltd. | | 272,900 | 1,377,403 |
| Sanlam Ltd. | | 458,800 | 2,309,472 |
| Sasol Ltd. | | 93,500 | 3,055,577 |
| Shoprite Holdings Ltd. | | 136,300 | 1,665,812 |
| Spar Group Ltd. | | 98,100 | 1,169,220 |
| Spur Corp. Ltd. | | 69,702 | 110,796 |
| Standard Bank Group Ltd. | | 295,086 | 3,266,999 |
| Steinhoff Africa Retail Ltd. (a)(b) | | 390,000 | 482,461 |
|
| TOTAL SOUTH AFRICA | | | 39,294,947 |
|
| United Arab Emirates - 5.1% | | | |
| Abu Dhabi National Oil Co. for Distribution PJSC (a) | | 937,731 | 566,751 |
| Aldar Properties PJSC | | 1,661,768 | 782,668 |
| Dubai Financial Market PJSC | | 2,241,002 | 528,960 |
| Dubai Islamic Bank Pakistan Ltd. (a) | | 539,253 | 772,218 |
| Dubai Parks and Resorts PJSC (a) | | 4,523,254 | 432,235 |
| National Bank of Abu Dhabi PJSC | | 509,140 | 1,915,608 |
|
| TOTAL UNITED ARAB EMIRATES | | | 4,998,440 |
|
| United Kingdom - 1.6% | | | |
| ASA International (a) | | 55,100 | 327,318 |
| Bank of Georgia Group PLC | | 11,500 | 229,221 |
| NMC Health PLC | | 10,849 | 489,789 |
| Tullow Oil PLC (a) | | 184,500 | 532,499 |
|
| TOTAL UNITED KINGDOM | | | 1,578,827 |
|
| TOTAL COMMON STOCKS | | | |
| (Cost $80,490,347) | | | 94,339,325 |
|
| Nonconvertible Preferred Stocks - 1.8% | | | |
| Russia - 1.8% | | | |
| Tatneft PAO | | | |
| (Cost $660,593) | | 226,800 | 1,810,991 |
|
| Money Market Funds - 1.0% | | | |
| Fidelity Cash Central Fund, 2.23% (c) | | | |
| (Cost $970,908) | | 970,714 | 970,908 |
| TOTAL INVESTMENT IN SECURITIES - 99.6% | | | |
| (Cost $82,121,848) | | | 97,121,224 |
| NET OTHER ASSETS (LIABILITIES) - 0.4% | | | 378,730 |
| NET ASSETS - 100% | | | $97,499,954 |
Categorizations in the Schedule of Investments are based on country or territory of incorporation.
Legend
(a) Non-income producing
(b) Security exempt from registration under Rule 144A of the Securities Act of 1933. These securities may be resold in transactions exempt from registration, normally to qualified institutional buyers. At the end of the period, the value of these securities amounted to $482,461 or 0.5% of net assets.
(c) Affiliated fund that is generally available only to investment companies and other accounts managed by Fidelity Investments. The rate quoted is the annualized seven-day yield of the fund at period end. A complete unaudited listing of the fund's holdings as of its most recent quarter end is available upon request. In addition, each Fidelity Central Fund's financial statements, which are not covered by the Fund's Report of Independent Registered Public Accounting Firm, are available on the SEC's website or upon request.
Affiliated Central Funds
Information regarding fiscal year to date income earned by the Fund from investments in Fidelity Central Funds is as follows:
| Fund | Income earned |
| Fidelity Cash Central Fund | $20,290 |
| Fidelity Securities Lending Cash Central Fund | 2,267 |
| Total | $22,557 |
Amounts in the income column in the above table include any capital gain distributions from underlying funds, which are presented in the corresponding line-item in the Statement of Operations if applicable.
Investment Valuation
The following is a summary of the inputs used, as of October 31, 2018, involving the Fund's assets and liabilities carried at fair value. The inputs or methodology used for valuing securities may not be an indication of the risk associated with investing in those securities. For more information on valuation inputs, and their aggregation into the levels used below, please refer to the Investment Valuation section in the accompanying Notes to Financial Statements.
| | Valuation Inputs at Reporting Date: |
| Description | Total | Level 1 | Level 2 | Level 3 |
| Investments in Securities: | | | | |
| Equities: | | | | |
| Communication Services | $8,834,795 | $8,834,795 | $-- | $-- |
| Consumer Discretionary | 8,555,132 | 8,555,132 | -- | -- |
| Consumer Staples | 7,371,125 | 7,371,125 | -- | -- |
| Energy | 20,731,924 | 20,731,924 | -- | -- |
| Financials | 31,776,485 | 26,365,211 | 5,411,274 | -- |
| Health Care | 996,807 | 996,807 | -- | -- |
| Industrials | 2,961,793 | 2,961,793 | -- | -- |
| Materials | 13,542,510 | 9,585,228 | 3,957,282 | -- |
| Real Estate | 1,379,745 | 1,379,745 | -- | -- |
| Money Market Funds | 970,908 | 970,908 | -- | -- |
| Total Investments in Securities: | $97,121,224 | $87,752,668 | $9,368,556 | $-- |
See accompanying notes which are an integral part of the financial statements.
Financial Statements
Statement of Assets and Liabilities
| | | October 31, 2018 |
| Assets | | |
Investment in securities, at value — See accompanying schedule:
Unaffiliated issuers (cost $81,150,940) | $96,150,316 | |
| Fidelity Central Funds (cost $970,908) | 970,908 | |
| Total Investment in Securities (cost $82,121,848) | | $97,121,224 |
| Receivable for investments sold | | 166,147 |
| Receivable for fund shares sold | | 176,020 |
| Dividends receivable | | 401,654 |
| Distributions receivable from Fidelity Central Funds | | 607 |
| Prepaid expenses | | 191 |
| Receivable from investment adviser for expense reductions | | 60 |
| Other receivables | | 2,162 |
| Total assets | | 97,868,065 |
| Liabilities | | |
| Payable to custodian bank | $73,715 | |
| Payable for fund shares redeemed | 110,947 | |
| Accrued management fee | 65,329 | |
| Transfer agent fee payable | 22,243 | |
| Distribution and service plan fees payable | 4,438 | |
| Accrued custody fee | 39,004 | |
| Accrued audit fee | 46,852 | |
| Other affiliated payables | 4,293 | |
| Other payables and accrued expenses | 1,290 | |
| Total liabilities | | 368,111 |
| Net Assets | | $97,499,954 |
| Net Assets consist of: | | |
| Paid in capital | | $96,292,270 |
| Total distributable earnings (loss) | | 1,207,684 |
| Net Assets | | $97,499,954 |
| Net Asset Value and Maximum Offering Price | | |
| Class A: | | |
| Net Asset Value and redemption price per share ($5,034,042 ÷ 567,844 shares) | | $8.87 |
| Maximum offering price per share (100/94.25 of $8.87) | | $9.41 |
| Class M: | | |
| Net Asset Value and redemption price per share ($2,152,906 ÷ 244,074 shares) | | $8.82 |
| Maximum offering price per share (100/96.50 of $8.82) | | $9.14 |
| Class C: | | |
| Net Asset Value and offering price per share ($2,845,273 ÷ 323,510 shares)(a) | | $8.80 |
| Emerging Europe, Middle East, Africa (EMEA): | | |
| Net Asset Value, offering price and redemption price per share ($82,387,408 ÷ 9,275,606 shares) | | $8.88 |
| Class I: | | |
| Net Asset Value, offering price and redemption price per share ($5,080,325 ÷ 572,375 shares) | | $8.88 |
(a) Redemption price per share is equal to net asset value less any applicable contingent deferred sales charge.
See accompanying notes which are an integral part of the financial statements.
Statement of Operations
| | | Year ended October 31, 2018 |
| Investment Income | | |
| Dividends | | $4,943,485 |
| Income from Fidelity Central Funds | | 22,557 |
| Income before foreign taxes withheld | | 4,966,042 |
| Less foreign taxes withheld | | (509,839) |
| Total income | | 4,456,203 |
| Expenses | | |
| Management fee | $867,811 | |
| Transfer agent fees | 270,080 | |
| Distribution and service plan fees | 71,040 | |
| Accounting and security lending fees | 57,000 | |
| Custodian fees and expenses | 111,236 | |
| Independent trustees' fees and expenses | 548 | |
| Registration fees | 78,338 | |
| Audit | 77,322 | |
| Legal | 1,956 | |
| Miscellaneous | 727 | |
| Total expenses before reductions | 1,536,058 | |
| Expense reductions | (15,572) | |
| Total expenses after reductions | | 1,520,486 |
| Net investment income (loss) | | 2,935,717 |
| Realized and Unrealized Gain (Loss) | | |
| Net realized gain (loss) on: | | |
| Investment securities: | | |
| Unaffiliated issuers | 2,394,010 | |
| Fidelity Central Funds | (11) | |
| Foreign currency transactions | (54,667) | |
| Total net realized gain (loss) | | 2,339,332 |
| Change in net unrealized appreciation (depreciation) on: | | |
| Investment securities: | | |
| Unaffiliated issuers (net of increase in deferred foreign taxes of $186,350) | (10,844,818) | |
| Assets and liabilities in foreign currencies | (8,646) | |
| Total change in net unrealized appreciation (depreciation) | | (10,853,464) |
| Net gain (loss) | | (8,514,132) |
| Net increase (decrease) in net assets resulting from operations | | $(5,578,415) |
See accompanying notes which are an integral part of the financial statements.
Statement of Changes in Net Assets
| | Year ended October 31, 2018 | Year ended October 31, 2017 |
| Increase (Decrease) in Net Assets | | |
| Operations | | |
| Net investment income (loss) | $2,935,717 | $1,644,538 |
| Net realized gain (loss) | 2,339,332 | 3,966,888 |
| Change in net unrealized appreciation (depreciation) | (10,853,464) | 10,350,803 |
| Net increase (decrease) in net assets resulting from operations | (5,578,415) | 15,962,229 |
| Distributions to shareholders | (1,645,681) | – |
| Distributions to shareholders from net investment income | – | (1,167,439) |
| Total distributions | (1,645,681) | (1,167,439) |
| Share transactions - net increase (decrease) | 5,076,428 | (13,935,496) |
| Redemption fees | 823 | 71,905 |
| Total increase (decrease) in net assets | (2,146,845) | 931,199 |
| Net Assets | | |
| Beginning of period | 99,646,799 | 98,715,600 |
| End of period | $97,499,954 | $99,646,799 |
| Other Information | | |
| Undistributed net investment income end of period | | $1,355,176 |
See accompanying notes which are an integral part of the financial statements.
Financial Highlights
Fidelity Emerging Europe, Middle East, Africa (EMEA) Fund Class A
| Years ended October 31, | 2018 | 2017 | 2016 | 2015 | 2014 |
| Selected Per–Share Data | | | | | |
| Net asset value, beginning of period | $9.39 | $8.13 | $7.49 | $9.04 | $9.49 |
| Income from Investment Operations | | | | | |
| Net investment income (loss)A | .25 | .12 | .14 | .12 | .13 |
| Net realized and unrealized gain (loss) | (.63) | 1.22 | .61 | (1.50) | (.46) |
| Total from investment operations | (.38) | 1.34 | .75 | (1.38) | (.33) |
| Distributions from net investment income | (.13) | (.09) | (.11) | (.14) | (.12) |
| Distributions from net realized gain | (.01) | – | – | (.04) | – |
| Total distributions | (.14) | (.09) | (.11) | (.17)B | (.12) |
| Redemption fees added to paid in capitalA | –C | .01 | –C | –C | –C |
| Net asset value, end of period | $8.87 | $9.39 | $8.13 | $7.49 | $9.04 |
| Total ReturnD,E | (4.17)% | 16.69% | 10.22% | (15.42)% | (3.48)% |
| Ratios to Average Net AssetsF,G | | | | | |
| Expenses before reductions | 1.59% | 1.63% | 1.69% | 1.61% | 1.60% |
| Expenses net of fee waivers, if any | 1.59% | 1.62% | 1.65% | 1.61% | 1.60% |
| Expenses net of all reductions | 1.57% | 1.61% | 1.64% | 1.60% | 1.60% |
| Net investment income (loss) | 2.49% | 1.41% | 1.90% | 1.51% | 1.45% |
| Supplemental Data | | | | | |
| Net assets, end of period (000 omitted) | $5,034 | $5,538 | $7,867 | $5,788 | $7,889 |
| Portfolio turnover rateH | 39% | 47% | 54% | 50% | 38% |
A Calculated based on average shares outstanding during the period.
B Total distributions of $.17 per share is comprised of distributions from net investment income of $.135 and distributions from net realized gain of $.039 per share.
C Amount represents less than $.005 per share.
D Total returns would have been lower if certain expenses had not been reduced during the applicable periods shown.
E Total returns do not include the effect of the sales charges.
F Fees and expenses of any underlying Fidelity Central Funds are not included in the Fund's expense ratio. The Fund indirectly bears its proportionate share of the expenses of any underlying Fidelity Central Funds.
G Expense ratios reflect operating expenses of the class. Expenses before reductions do not reflect amounts reimbursed by the investment adviser or reductions from brokerage service arrangements or reductions from other expense offset arrangements and do not represent the amount paid by the class during periods when reimbursements or reductions occur. Expenses net of fee waivers reflect expenses after reimbursement by the investment adviser but prior to reductions from brokerage service arrangements or other expense offset arrangements. Expenses net of all reductions represent the net expenses paid by the class.
H Amount does not include the portfolio activity of any underlying Fidelity Central Funds.
See accompanying notes which are an integral part of the financial statements.
Fidelity Emerging Europe, Middle East, Africa (EMEA) Fund Class M
| Years ended October 31, | 2018 | 2017 | 2016 | 2015 | 2014 |
| Selected Per–Share Data | | | | | |
| Net asset value, beginning of period | $9.35 | $8.10 | $7.44 | $9.01 | $9.46 |
| Income from Investment Operations | | | | | |
| Net investment income (loss)A | .22 | .10 | .12 | .10 | .11 |
| Net realized and unrealized gain (loss) | (.63) | 1.21 | .61 | (1.51) | (.46) |
| Total from investment operations | (.41) | 1.31 | .73 | (1.41) | (.35) |
| Distributions from net investment income | (.11) | (.07) | (.07) | (.13) | (.10) |
| Distributions from net realized gain | (.01) | – | – | (.04) | – |
| Total distributions | (.12) | (.07) | (.07) | (.16)B | (.10) |
| Redemption fees added to paid in capitalA | –C | .01 | –C | –C | –C |
| Net asset value, end of period | $8.82 | $9.35 | $8.10 | $7.44 | $9.01 |
| Total ReturnD,E | (4.51)% | 16.40% | 9.98% | (15.80)% | (3.67)% |
| Ratios to Average Net AssetsF,G | | | | | |
| Expenses before reductions | 1.92% | 1.95% | 2.00% | 1.92% | 1.92% |
| Expenses net of fee waivers, if any | 1.90% | 1.90% | 1.90% | 1.90% | 1.90% |
| Expenses net of all reductions | 1.88% | 1.88% | 1.89% | 1.89% | 1.90% |
| Net investment income (loss) | 2.18% | 1.14% | 1.65% | 1.22% | 1.15% |
| Supplemental Data | | | | | |
| Net assets, end of period (000 omitted) | $2,153 | $2,490 | $2,580 | $2,003 | $2,465 |
| Portfolio turnover rateH | 39% | 47% | 54% | 50% | 38% |
A Calculated based on average shares outstanding during the period.
B Total distributions of $.16 per share is comprised of distributions from net investment income of $.125 and distributions from net realized gain of $.039 per share.
C Amount represents less than $.005 per share.
D Total returns would have been lower if certain expenses had not been reduced during the applicable periods shown.
E Total returns do not include the effect of the sales charges.
F Fees and expenses of any underlying Fidelity Central Funds are not included in the Fund's expense ratio. The Fund indirectly bears its proportionate share of the expenses of any underlying Fidelity Central Funds.
G Expense ratios reflect operating expenses of the class. Expenses before reductions do not reflect amounts reimbursed by the investment adviser or reductions from brokerage service arrangements or reductions from other expense offset arrangements and do not represent the amount paid by the class during periods when reimbursements or reductions occur. Expenses net of fee waivers reflect expenses after reimbursement by the investment adviser but prior to reductions from brokerage service arrangements or other expense offset arrangements. Expenses net of all reductions represent the net expenses paid by the class.
H Amount does not include the portfolio activity of any underlying Fidelity Central Funds.
See accompanying notes which are an integral part of the financial statements.
Fidelity Emerging Europe, Middle East, Africa (EMEA) Fund Class C
| Years ended October 31, | 2018 | 2017 | 2016 | 2015 | 2014 |
| Selected Per–Share Data | | | | | |
| Net asset value, beginning of period | $9.30 | $8.06 | $7.39 | $8.93 | $9.39 |
| Income from Investment Operations | | | | | |
| Net investment income (loss)A | .17 | .06 | .09 | .06 | .06 |
| Net realized and unrealized gain (loss) | (.62) | 1.20 | .60 | (1.48) | (.46) |
| Total from investment operations | (.45) | 1.26 | .69 | (1.42) | (.40) |
| Distributions from net investment income | (.04) | (.03) | (.02) | (.08) | (.06) |
| Distributions from net realized gain | (.01) | – | – | (.04) | – |
| Total distributions | (.05) | (.03) | (.02) | (.12) | (.06) |
| Redemption fees added to paid in capitalA | –B | .01 | –B | –B | –B |
| Net asset value, end of period | $8.80 | $9.30 | $8.06 | $7.39 | $8.93 |
| Total ReturnC,D | (4.92)% | 15.85% | 9.33% | (16.08)% | (4.24)% |
| Ratios to Average Net AssetsE,F | | | | | |
| Expenses before reductions | 2.38% | 2.42% | 2.47% | 2.41% | 2.40% |
| Expenses net of fee waivers, if any | 2.38% | 2.39% | 2.40% | 2.40% | 2.40% |
| Expenses net of all reductions | 2.37% | 2.37% | 2.39% | 2.39% | 2.40% |
| Net investment income (loss) | 1.69% | .65% | 1.15% | .72% | .65% |
| Supplemental Data | | | | | |
| Net assets, end of period (000 omitted) | $2,845 | $4,336 | $6,269 | $4,104 | $6,662 |
| Portfolio turnover rateG | 39% | 47% | 54% | 50% | 38% |
A Calculated based on average shares outstanding during the period.
B Amount represents less than $.005 per share.
C Total returns would have been lower if certain expenses had not been reduced during the applicable periods shown.
D Total returns do not include the effect of the contingent deferred sales charge.
E Fees and expenses of any underlying Fidelity Central Funds are not included in the Fund's expense ratio. The Fund indirectly bears its proportionate share of the expenses of any underlying Fidelity Central Funds.
F Expense ratios reflect operating expenses of the class. Expenses before reductions do not reflect amounts reimbursed by the investment adviser or reductions from brokerage service arrangements or reductions from other expense offset arrangements and do not represent the amount paid by the class during periods when reimbursements or reductions occur. Expenses net of fee waivers reflect expenses after reimbursement by the investment adviser but prior to reductions from brokerage service arrangements or other expense offset arrangements. Expenses net of all reductions represent the net expenses paid by the class.
G Amount does not include the portfolio activity of any underlying Fidelity Central Funds.
See accompanying notes which are an integral part of the financial statements.
Fidelity Emerging Europe, Middle East, Africa (EMEA) Fund
| Years ended October 31, | 2018 | 2017 | 2016 | 2015 | 2014 |
| Selected Per–Share Data | | | | | |
| Net asset value, beginning of period | $9.41 | $8.14 | $7.50 | $9.08 | $9.52 |
| Income from Investment Operations | | | | | |
| Net investment income (loss)A | .27 | .15 | .16 | .14 | .16 |
| Net realized and unrealized gain (loss) | (.63) | 1.21 | .61 | (1.51) | (.47) |
| Total from investment operations | (.36) | 1.36 | .77 | (1.37) | (.31) |
| Distributions from net investment income | (.16) | (.10) | (.13) | (.17) | (.13) |
| Distributions from net realized gain | (.01) | – | – | (.04) | – |
| Total distributions | (.17) | (.10) | (.13) | (.21) | (.13) |
| Redemption fees added to paid in capitalA | –B | .01 | –B | –B | –B |
| Net asset value, end of period | $8.88 | $9.41 | $8.14 | $7.50 | $9.08 |
| Total ReturnC | (4.00)% | 17.04% | 10.54% | (15.33)% | (3.21)% |
| Ratios to Average Net AssetsD,E | | | | | |
| Expenses before reductions | 1.34% | 1.38% | 1.46% | 1.39% | 1.37% |
| Expenses net of fee waivers, if any | 1.34% | 1.38% | 1.40% | 1.38% | 1.37% |
| Expenses net of all reductions | 1.32% | 1.37% | 1.39% | 1.38% | 1.37% |
| Net investment income (loss) | 2.74% | 1.66% | 2.15% | 1.74% | 1.68% |
| Supplemental Data | | | | | |
| Net assets, end of period (000 omitted) | $82,387 | $80,392 | $76,193 | $67,521 | $96,784 |
| Portfolio turnover rateF | 39% | 47% | 54% | 50% | 38% |
A Calculated based on average shares outstanding during the period.
B Amount represents less than $.005 per share.
C Total returns would have been lower if certain expenses had not been reduced during the applicable periods shown.
D Fees and expenses of any underlying Fidelity Central Funds are not included in the Fund's expense ratio. The Fund indirectly bears its proportionate share of the expenses of any underlying Fidelity Central Funds.
E Expense ratios reflect operating expenses of the class. Expenses before reductions do not reflect amounts reimbursed by the investment adviser or reductions from brokerage service arrangements or reductions from other expense offset arrangements and do not represent the amount paid by the class during periods when reimbursements or reductions occur. Expenses net of fee waivers reflect expenses after reimbursement by the investment adviser but prior to reductions from brokerage service arrangements or other expense offset arrangements. Expenses net of all reductions represent the net expenses paid by the class.
F Amount does not include the portfolio activity of any underlying Fidelity Central Funds.
See accompanying notes which are an integral part of the financial statements.
Fidelity Emerging Europe, Middle East, Africa (EMEA) Fund Class I
| Years ended October 31, | 2018 | 2017 | 2016 | 2015 | 2014 |
| Selected Per–Share Data | | | | | |
| Net asset value, beginning of period | $9.40 | $8.14 | $7.50 | $9.08 | $9.52 |
| Income from Investment Operations | | | | | |
| Net investment income (loss)A | .28 | .16 | .17 | .15 | .16 |
| Net realized and unrealized gain (loss) | (.62) | 1.20 | .61 | (1.51) | (.46) |
| Total from investment operations | (.34) | 1.36 | .78 | (1.36) | (.30) |
| Distributions from net investment income | (.17) | (.11) | (.14) | (.18) | (.14) |
| Distributions from net realized gain | (.01) | – | – | (.04) | – |
| Total distributions | (.18) | (.11) | (.14) | (.22) | (.14) |
| Redemption fees added to paid in capitalA | –B | .01 | –B | –B | –B |
| Net asset value, end of period | $8.88 | $9.40 | $8.14 | $7.50 | $9.08 |
| Total ReturnC | (3.80)% | 17.01% | 10.69% | (15.23)% | (3.09)% |
| Ratios to Average Net AssetsD,E | | | | | |
| Expenses before reductions | 1.24% | 1.27% | 1.31% | 1.25% | 1.26% |
| Expenses net of fee waivers, if any | 1.24% | 1.27% | 1.31% | 1.25% | 1.26% |
| Expenses net of all reductions | 1.23% | 1.26% | 1.30% | 1.24% | 1.26% |
| Net investment income (loss) | 2.83% | 1.77% | 2.24% | 1.88% | 1.79% |
| Supplemental Data | | | | | |
| Net assets, end of period (000 omitted) | $5,080 | $6,891 | $5,807 | $3,478 | $5,596 |
| Portfolio turnover rateF | 39% | 47% | 54% | 50% | 38% |
A Calculated based on average shares outstanding during the period.
B Amount represents less than $.005 per share.
C Total returns would have been lower if certain expenses had not been reduced during the applicable periods shown.
D Fees and expenses of any underlying Fidelity Central Funds are not included in the Fund's expense ratio. The Fund indirectly bears its proportionate share of the expenses of any underlying Fidelity Central Funds.
E Expense ratios reflect operating expenses of the class. Expenses before reductions do not reflect amounts reimbursed by the investment adviser or reductions from brokerage service arrangements or reductions from other expense offset arrangements and do not represent the amount paid by the class during periods when reimbursements or reductions occur. Expenses net of fee waivers reflect expenses after reimbursement by the investment adviser but prior to reductions from brokerage service arrangements or other expense offset arrangements. Expenses net of all reductions represent the net expenses paid by the class.
F Amount does not include the portfolio activity of any underlying Fidelity Central Funds.
See accompanying notes which are an integral part of the financial statements.
Notes to Financial Statements
For the period ended October 31, 2018
1. Organization.
Fidelity Emerging Europe, Middle East, Africa (EMEA) Fund (the Fund) is a non-diversified fund of Fidelity Investment Trust (the Trust) and is authorized to issue an unlimited number of shares. The Trust is registered under the Investment Company Act of 1940, as amended (the 1940 Act), as an open-end management investment company organized as a Massachusetts business trust. The Fund offers Class A, Class M, Class C, Emerging Europe, Middle East, Africa (EMEA), and Class I shares, each of which has equal rights as to assets and voting privileges. Each class has exclusive voting rights with respect to matters that affect that class. The Fund's investments in emerging markets can be subject to social, economic, regulatory, and political uncertainties and can be extremely volatile.
2. Investments in Fidelity Central Funds.
The Fund invests in Fidelity Central Funds, which are open-end investment companies generally available only to other investment companies and accounts managed by the investment adviser and its affiliates. The Fund's Schedule of Investments lists each of the Fidelity Central Funds held as of period end, if any, as an investment of the Fund, but does not include the underlying holdings of each Fidelity Central Fund. As an Investing Fund, the Fund indirectly bears its proportionate share of the expenses of the underlying Fidelity Central Funds.
The Money Market Central Funds seek preservation of capital and current income and are managed by Fidelity Investments Money Management, Inc. (FIMM), an affiliate of the investment adviser. Annualized expenses of the Money Market Central Funds as of their most recent shareholder report date are less than .005%.
A complete unaudited list of holdings for each Fidelity Central Fund is available upon request or at the Securities and Exchange Commission (the SEC) website at www.sec.gov. In addition, the financial statements of the Fidelity Central Funds, which are not covered by the Fund's Report of Independent Registered Public Accounting Firm, are available on the SEC website or upon request.
3. Significant Accounting Policies.
The Fund is an investment company and applies the accounting and reporting guidance of the Financial Accounting Standards Board (FASB) Accounting Standards Codification Topic 946 Financial Services – Investments Companies. The financial statements have been prepared in conformity with accounting principles generally accepted in the United States of America (GAAP), which require management to make certain estimates and assumptions at the date of the financial statements. Actual results could differ from those estimates. Subsequent events, if any, through the date that the financial statements were issued have been evaluated in the preparation of the financial statements. The following summarizes the significant accounting policies of the Fund:
Investment Valuation. Investments are valued as of 4:00 p.m. Eastern time on the last calendar day of the period. The Board of Trustees (the Board) has delegated the day to day responsibility for the valuation of the Fund's investments to the Fair Value Committee (the Committee) established by the Fund's investment adviser. In accordance with valuation policies and procedures approved by the Board, the Fund attempts to obtain prices from one or more third party pricing vendors or brokers to value its investments. When current market prices, quotations or currency exchange rates are not readily available or reliable, investments will be fair valued in good faith by the Committee, in accordance with procedures adopted by the Board. Factors used in determining fair value vary by investment type and may include market or investment specific events. The frequency with which these procedures are used cannot be predicted and they may be utilized to a significant extent. The Committee oversees the Fund's valuation policies and procedures and reports to the Board on the Committee's activities and fair value determinations. The Board monitors the appropriateness of the procedures used in valuing the Fund's investments and ratifies the fair value determinations of the Committee.
The Fund categorizes the inputs to valuation techniques used to value its investments into a disclosure hierarchy consisting of three levels as shown below:
- Level 1 – quoted prices in active markets for identical investments
- Level 2 – other significant observable inputs (including quoted prices for similar investments, interest rates, prepayment speeds, etc.)
- Level 3 – unobservable inputs (including the Fund's own assumptions based on the best information available)
Valuation techniques used to value the Fund's investments by major category are as follows:
Equity securities, including restricted securities, for which market quotations are readily available, are valued at the last reported sale price or official closing price as reported by a third party pricing vendor on the primary market or exchange on which they are traded and are categorized as Level 1 in the hierarchy. In the event there were no sales during the day or closing prices are not available, securities are valued at the last quoted bid price or may be valued using the last available price and are generally categorized as Level 2 in the hierarchy. For foreign equity securities, when market or security specific events arise, comparisons to the valuation of American Depositary Receipts (ADRs), futures contracts, Exchange-Traded Funds (ETFs) and certain indexes as well as quoted prices for similar securities may be used and would be categorized as Level 2 in the hierarchy. Utilizing these techniques may result in transfers between Level 1 and Level 2. For equity securities, including restricted securities, where observable inputs are limited, assumptions about market activity and risk are used and these securities may be categorized as Level 3 in the hierarchy.
Investments in open-end mutual funds, including the Fidelity Central Funds, are valued at their closing net asset value (NAV) each business day and are categorized as Level 1 in the hierarchy.
Changes in valuation techniques may result in transfers in or out of an assigned level within the disclosure hierarchy. The aggregate value of investments by input level as of October 31, 2018, is included at the end of the Fund's Schedule of Investments.
Foreign Currency. The Fund may use foreign currency contracts to facilitate transactions in foreign-denominated securities. Gains and losses from these transactions may arise from changes in the value of the foreign currency or if the counterparties do not perform under the contracts' terms.
Foreign-denominated assets, including investment securities, and liabilities are translated into U.S. dollars at the exchange rates at period end. Purchases and sales of investment securities, income and dividends received and expenses denominated in foreign currencies are translated into U.S. dollars at the exchange rate in effect on the transaction date.
The effects of exchange rate fluctuations on investments are included with the net realized and unrealized gain (loss) on investment securities. Other foreign currency transactions resulting in realized and unrealized gain (loss) are disclosed separately.
Investment Transactions and Income. For financial reporting purposes, the Fund's investment holdings and NAV include trades executed through the end of the last business day of the period. The NAV per share for processing shareholder transactions is calculated as of the close of business of the New York Stock Exchange (NYSE), normally 4:00 p.m. Eastern time and includes trades executed through the end of the prior business day. Gains and losses on securities sold are determined on the basis of identified cost and include proceeds received from litigation. Dividend income is recorded on the ex-dividend date, except for certain dividends from foreign securities where the ex-dividend date may have passed, which are recorded as soon as the Fund is informed of the ex-dividend date. Non-cash dividends included in dividend income, if any, are recorded at the fair market value of the securities received. Income and capital gain distributions from Fidelity Central Funds, if any, are recorded on the ex-dividend date. Investment income is recorded net of foreign taxes withheld where recovery of such taxes is uncertain.
Class Allocations and Expenses. Investment income, realized and unrealized capital gains and losses, common expenses of the Fund, and certain fund-level expense reductions, if any, are allocated daily on a pro-rata basis to each class based on the relative net assets of each class to the total net assets of the Fund. Each class differs with respect to transfer agent and distribution and service plan fees incurred. Certain expense reductions may also differ by class. For the reporting period, the allocated portion of income and expenses to each class as a percent of its average net assets may vary due to the timing of recording these transactions in relation to fluctuating net assets of the classes. Expenses directly attributable to a fund are charged to that fund. Expenses attributable to more than one fund are allocated among the respective funds on the basis of relative net assets or other appropriate methods. Expense estimates are accrued in the period to which they relate and adjustments are made when actual amounts are known.
Income Tax Information and Distributions to Shareholders. Each year, the Fund intends to qualify as a regulated investment company under Subchapter M of the Internal Revenue Code, including distributing substantially all of its taxable income and realized gains. As a result, no provision for U.S. Federal income taxes is required. As of October 31, 2018, the Fund did not have any unrecognized tax benefits in the financial statements; nor is the Fund aware of any tax positions for which it is reasonably possible that the total amounts of unrecognized tax benefits will significantly change in the next twelve months. The Fund files a U.S. federal tax return, in addition to state and local tax returns as required. The Fund's federal income tax returns are subject to examination by the Internal Revenue Service (IRS) for a period of three fiscal years after they are filed. State and local tax returns may be subject to examination for an additional fiscal year depending on the jurisdiction. Foreign taxes are provided for based on the Fund's understanding of the tax rules and rates that exist in the foreign markets in which it invests.
Distributions are declared and recorded on the ex-dividend date. Income and capital gain distributions are declared separately for each class. Income and capital gain distributions are determined in accordance with income tax regulations, which may differ from GAAP. In addition, the Fund claimed a portion of the payment made to redeeming shareholders as a distribution for income tax purposes.
Capital accounts within the financial statements are adjusted for permanent book-tax differences. These adjustments have no impact on net assets or the results of operations. Capital accounts are not adjusted for temporary book-tax differences which will reverse in a subsequent period.
Book-tax differences are primarily due to foreign currency transactions, passive foreign investment companies (PFIC), capital loss carryforwards, expiring capital loss carryforwards and losses deferred due to wash sales.
As of period end, the cost and unrealized appreciation (depreciation) in securities, and derivatives if applicable, for federal income tax purposes were as follows:
| Gross unrealized appreciation | $23,749,635 |
| Gross unrealized depreciation | (8,913,179) |
| Net unrealized appreciation (depreciation) | $14,836,456 |
| Tax Cost | $82,284,768 |
The tax-based components of distributable earnings as of period end were as follows:
| Undistributed ordinary income | $2,329,516 |
| Capital loss carryforward | $(15,761,417) |
| Net unrealized appreciation (depreciation) on securities and other investments | $14,825,933 |
Capital loss carryforwards are only available to offset future capital gains of the Fund to the extent provided by regulations and may be limited. Under the Regulated Investment Company Modernization Act of 2010 (the Act), the Fund is permitted to carry forward capital losses incurred in taxable years beginning after December 22, 2010 for an unlimited period and such capital losses are required to be used prior to any losses that expire. The capital loss carryforward information presented below, including any applicable limitation, is estimated as of fiscal period end and is subject to adjustment.
| Fiscal year of expiration | |
| No expiration | |
| Short-term | $(3,664,835) |
| Long-term | (12,096,582) |
| Total capital loss carryforward | $(15,761,417) |
The tax character of distributions paid was as follows:
| | October 31, 2018 | October 31, 2017 |
| Ordinary Income | $1,645,681 | $ 1,167,439 |
Short-Term Trading (Redemption) Fees. Shares held by investors in the Fund less than 90 days may have been subject to a redemption fee equal to 1.50% of the NAV of shares redeemed. All redemption fees, which reduce the proceeds of the shareholder redemption, are retained by the Fund and accounted for as an addition to paid in capital. In November 2017, the Board of Trustees approved the elimination of these redemption fees effective December 18, 2017.
Restricted Securities. The Fund may invest in securities that are subject to legal or contractual restrictions on resale. These securities generally may be resold in transactions exempt from registration or to the public if the securities are registered. Disposal of these securities may involve time-consuming negotiations and expense, and prompt sale at an acceptable price may be difficult. Information regarding restricted securities is included at the end of the Fund's Schedule of Investments.
New Rule Issuance. During August 2018, the U.S. Securities and Exchange Commission issued Final Rule Release No. 33-10532, Disclosure Update and Simplification. This Final Rule includes amendments specific to registered investment companies that are intended to eliminate overlap in disclosure requirements between Regulation S-X and GAAP. In accordance with these amendments, certain line-items in the Fund financial statements have been combined or removed for the current period as outlined in the table below.
| Financial Statement | Current Line-Item Presentation | Prior Line-Item Presentation |
| Statement of Assets and Liabilities | Total distributable earnings (loss) | Undistributed/Distributions in excess of/Accumulated net investment income (loss)
Accumulated/Undistributed net realized gain (loss)
Net unrealized appreciation (depreciation) |
| Statement of Changes in Net Assets | N/A - removed | Undistributed/Distributions in excess of/Accumulated net investment income (loss) end of period |
| Statement of Changes in Net Assets | Distributions to shareholders | Distributions to shareholders from net investment income
Distributions to shareholders from net realized gain |
| Distributions to Shareholders Note to Financial Statements | Distributions to shareholders | Distributions to shareholders from net investment income
Distributions to shareholders from net realized gain |
4. Purchases and Sales of Investments.
Purchases and sales of securities, other than short-term securities, aggregated $47,495,865 and $42,107,592, respectively.
5. Fees and Other Transactions with Affiliates.
Management Fee. Fidelity Management & Research Company (the investment adviser) and its affiliates provide the Fund with investment management related services for which the Fund pays a monthly management fee. The management fee is the sum of an individual fund fee rate that is based on an annual rate of .55% of the Fund's average net assets and an annualized group fee rate that averaged .24% during the period. The group fee rate is based upon the average net assets of all the mutual funds advised by the investment adviser, including any mutual funds previously advised by the investment adviser that are currently advised by Fidelity SelectCo, LLC, an affiliate of the investment adviser. The group fee rate decreases as assets under management increase and increases as assets under management decrease. For the reporting period, the total annual management fee rate was .79% of the Fund's average net assets.
Distribution and Service Plan Fees. In accordance with Rule 12b-1 of the 1940 Act, the Fund has adopted separate Distribution and Service Plans for each class of shares. Certain classes pay Fidelity Distributors Corporation (FDC), an affiliate of the investment adviser, separate Distribution and Service Fees, each of which is based on an annual percentage of each class' average net assets. In addition, FDC may pay financial intermediaries for selling shares of the Fund and providing shareholder support services. For the period, the Distribution and Service Fee rates, total fees and amounts retained by FDC were as follows:
| | Distribution Fee | Service Fee | Total Fees | Retained by FDC |
| Class A | -% | .25% | $15,611 | $151 |
| Class M | .25% | .25% | 13,152 | 280 |
| Class C | .75% | .25% | 42,277 | 2,474 |
| | | | $71,040 | $2,905 |
Sales Load. FDC may receive a front-end sales charge of up to 5.75% for selling Class A shares and 3.50% for selling Class M shares, some of which is paid to financial intermediaries for selling shares of the Fund. Depending on the holding period, FDC may receive contingent deferred sales charges levied on Class A, Class M and Class C redemptions. The deferred sales charges are 1.00% for Class C shares, 1.00% for certain purchases of Class A shares and .25% for certain purchases of Class M shares.
For the period, sales charge amounts retained by FDC were as follows:
| | Retained by FDC |
| Class A | $3,563 |
| Class M | 1,023 |
| Class C(a) | 426 |
| | $5,012 |
(a) When Class C shares are initially sold, FDC pays commissions from its own resources to financial intermediaries through which the sales are made.
Transfer Agent Fees. Fidelity Investments Institutional Operations Company, Inc., (FIIOC), an affiliate of the investment adviser, is the transfer, dividend disbursing and shareholder servicing agent for each class of the Fund. FIIOC receives account fees and asset-based fees that vary according to the account size and type of account of the shareholders of the respective classes of the Fund. FIIOC pays for typesetting, printing and mailing of shareholder reports, except proxy statements.
For the period, transfer agent fees for each class were as follows:
| | Amount | % of Class-Level Average Net Assets |
| Class A | $15,412 | .25 |
| Class M | 8,649 | .33 |
| Class C | 12,288 | .29 |
| Emerging Europe, Middle East, Africa (EMEA) | 222,934 | .25 |
| Class I | 10,797 | .15 |
| | $270,080 | |
Accounting and Security Lending Fees. Fidelity Service Company, Inc. (FSC), an affiliate of the investment adviser, maintains the Fund's accounting records. The accounting fee is based on the level of average net assets for each month. Under a separate contract, FSC administers the security lending program. The security lending fee is based on the number and duration of lending transactions. For the period, the fees were equivalent to an annual rate of .05%.
Brokerage Commissions. The Fund placed a portion of its portfolio transactions with brokerage firms which are affiliates of the investment adviser. Brokerage commissions are included in net realized gain (loss) and change in net unrealized appreciation (depreciation) in the Statement of Operations. The commissions paid to these affiliated firms were $15 for the period.
Interfund Trades. The Fund may purchase from or sell securities to other Fidelity Funds under procedures adopted by the Board. The procedures have been designed to ensure these interfund trades are executed in accordance with Rule 17a-7 of the 1940 Act. Interfund trades are included within the respective purchases and sales amounts shown in the Purchases and Sales of Investments note.
Other. During the period, the investment adviser reimbursed the Fund for certain losses in the amount of $8,941.
6. Committed Line of Credit.
The Fund participates with other funds managed by the investment adviser or an affiliate in a $4.25 billion credit facility (the "line of credit") to be utilized for temporary or emergency purposes to fund shareholder redemptions or for other short-term liquidity purposes. The Fund has agreed to pay commitment fees on its pro-rata portion of the line of credit, which amounted to $303 and is reflected in Miscellaneous expenses on the Statement of Operations. During the period, the Fund did not borrow on this line of credit.
7. Security Lending.
The Fund lends portfolio securities through a lending agent from time to time in order to earn additional income. For equity securities, a lending agent is used and may loan securities to certain qualified borrowers, including Fidelity Capital Markets (FCM), a broker-dealer affiliated with the Fund. On the settlement date of the loan, the Fund receives collateral (in the form of U.S. Treasury obligations, letters of credit and/or cash) against the loaned securities and maintains collateral in an amount not less than 100% of the market value of the loaned securities during the period of the loan. The market value of the loaned securities is determined at the close of business of the Fund and any additional required collateral is delivered to the Fund on the next business day. The Fund or borrower may terminate the loan at any time, and if the borrower defaults on its obligation to return the securities loaned because of insolvency or other reasons, the Fund may apply collateral received from the borrower against the obligation. The Fund may experience delays and costs in recovering the securities loaned. Any cash collateral received is invested in the Fidelity Securities Lending Cash Central Fund. At period end, there were no security loans outstanding. Security lending income represents the income earned on investing cash collateral, less rebates paid to borrowers and any lending agent fees associated with the loan, plus any premium payments received for lending certain types of securities. Security lending income is presented in the Statement of Operations as a component of income from Fidelity Central Funds. Total security lending income during the period amounted to $2,267. During the period, there were no securities loaned to FCM.
8. Expense Reductions.
The investment adviser contractually agreed to reimburse each class to the extent annual operating expenses exceeded certain levels of class-level average net assets as noted in the table below. This reimbursement will remain in place through February 29, 2020. Some expenses, for example the compensation of the independent Trustees, and certain miscellaneous expenses such as proxy and shareholder meeting expenses, are excluded from this reimbursement.
The following classes were in reimbursement during the period:
| | Expense Limitations | Reimbursement |
| Class M | 1.90% | $568 |
Commissions paid to certain brokers with whom the investment adviser, or its affiliates, places trades on behalf of the Fund include an amount in addition to trade execution, which may be rebated back to the Fund to offset certain expenses. This amount totaled $13,962 for the period.
In addition, during the period the investment adviser reimbursed and/or waived a portion of fund-level operating expenses in the amount of $1,042.
9. Distributions to Shareholders.
Distributions to shareholders of each class were as follows:
| | Year ended
October 31, 2018 | Year ended
October 31, 2017 |
| Distributions to shareholders | | |
| Class A | $80,590 | $– |
| Class M | 31,578 | – |
| Class C | 21,185 | – |
| Emerging Europe, Middle East, Africa (EMEA) | 1,390,507 | – |
| Class I | 121,821 | – |
| Total | $1,645,681 | $– |
| From net investment income | | |
| Class A | $– | $82,211 |
| Class M | – | 22,957 |
| Class C | – | 25,148 |
| Emerging Europe, Middle East, Africa (EMEA) | – | 957,314 |
| Class I | – | 79,809 |
| Total | $– | $1,167,439 |
10. Share Transactions.
Share transactions for each class were as follows and may contain automatic conversions between classes or exchanges between affiliated funds:
| | Shares | Shares | Dollars | Dollars |
| | Year ended October 31, 2018 | Year ended October 31, 2017 | Year ended October 31, 2018 | Year ended October 31, 2017 |
| Class A | | | | |
| Shares sold | 177,927 | 288,036 | $1,897,467 | $2,454,533 |
| Reinvestment of distributions | 8,201 | 9,506 | 78,321 | 78,136 |
| Shares redeemed | (208,116) | (675,335) | (2,037,720) | (5,836,992) |
| Net increase (decrease) | (21,988) | (377,793) | $(61,932) | $(3,304,323) |
| Class M | | | | |
| Shares sold | 44,576 | 66,562 | $452,127 | $565,838 |
| Reinvestment of distributions | 3,314 | 2,795 | 31,578 | 22,945 |
| Shares redeemed | (70,074) | (121,397) | (697,760) | (1,049,817) |
| Net increase (decrease) | (22,184) | (52,040) | $(214,055) | $(461,034) |
| Class C | | | | |
| Shares sold | 63,115 | 157,368 | $657,000 | $1,360,245 |
| Reinvestment of distributions | 2,063 | 2,631 | 19,680 | 21,571 |
| Shares redeemed | (207,873) | (471,197) | (2,030,610) | (4,103,204) |
| Net increase (decrease) | (142,695) | (311,198) | $(1,353,930) | $(2,721,388) |
| Emerging Europe, Middle East, Africa (EMEA) | | | | |
| Shares sold | 5,006,638 | 3,934,827 | $50,740,861 | $34,220,494 |
| Reinvestment of distributions | 134,990 | 108,986 | 1,287,802 | 895,866 |
| Shares redeemed | (4,409,321) | (4,855,547) | (43,865,965) | (42,616,730) |
| Net increase (decrease) | 732,307 | (811,734) | $8,162,698 | $(7,500,370) |
| Class I | | | | |
| Shares sold | 579,144 | 791,073 | $6,006,521 | $6,865,207 |
| Reinvestment of distributions | 11,175 | 9,024 | 106,495 | 74,090 |
| Shares redeemed | (750,732) | (780,970) | (7,569,369) | (6,887,678) |
| Net increase (decrease) | (160,413) | 19,127 | $(1,456,353) | $51,619 |
11. Other.
The Fund's organizational documents provide former and current trustees and officers with a limited indemnification against liabilities arising in connection with the performance of their duties to the Fund. In the normal course of business, the Fund may also enter into contracts that provide general indemnifications. The Fund's maximum exposure under these arrangements is unknown as this would be dependent on future claims that may be made against the Fund. The risk of material loss from such claims is considered remote.
Report of Independent Registered Public Accounting Firm
To the Trustees of Fidelity Investment Trust and Shareholders of Fidelity Emerging Europe, Middle East, Africa (EMEA) Fund:
Opinion on the Financial Statements and Financial Highlights
We have audited the accompanying statement of assets and liabilities of Fidelity Emerging Europe, Middle East, Africa (EMEA) Fund (the "Fund"), a fund of Fidelity Investment Trust, including the schedule of investments, as of October 31, 2018, and the related statement of operations for the year then ended, the statement of changes in net assets for each of the two years in the period then ended, the financial highlights for each of the five years in the period then ended, and the related notes. In our opinion, the financial statements and financial highlights present fairly, in all material respects, the financial position of the Fund as of October 31, 2018, and the results of its operations for the year then ended, the changes in its net assets for each of the two years in the period then ended, and the financial highlights for each of the five years in the period then ended, in conformity with accounting principles generally accepted in the United States of America.
Basis for Opinion
These financial statements and financial highlights are the responsibility of the Fund's management. Our responsibility is to express an opinion on the Fund's financial statements and financial highlights based on our audits. We are a public accounting firm registered with the Public Company Accounting Oversight Board (United States) (PCAOB) and are required to be independent with respect to the Fund in accordance with the U.S. federal securities laws and the applicable rules and regulations of the Securities and Exchange Commission and the PCAOB.
We conducted our audits in accordance with the standards of the PCAOB. Those standards require that we plan and perform the audit to obtain reasonable assurance about whether the financial statements and financial highlights are free of material misstatement, whether due to error or fraud. The Fund is not required to have, nor were we engaged to perform, an audit of its internal control over financial reporting. As part of our audits we are required to obtain an understanding of internal control over financial reporting but not for the purpose of expressing an opinion on the effectiveness of the Fund’s internal control over financial reporting. Accordingly, we express no such opinion.
Our audits included performing procedures to assess the risks of material misstatement of the financial statements and financial highlights, whether due to error or fraud, and performing procedures that respond to those risks. Such procedures included examining, on a test basis, evidence regarding the amounts and disclosures in the financial statements and financial highlights. Our audits also included evaluating the accounting principles used and significant estimates made by management, as well as evaluating the overall presentation of the financial statements and financial highlights. Our procedures included confirmation of securities owned as of October 31, 2018, by correspondence with the custodians and brokers; when replies were not received from brokers, we performed other auditing procedures. We believe that our audits provide a reasonable basis for our opinion.
/s/ Deloitte & Touche LLP
Boston, Massachusetts
December 13, 2018
We have served as the auditor of one or more of the Fidelity investment companies since 1999.
Trustees and Officers
The Trustees, Members of the Advisory Board (if any), and officers of the trust and fund, as applicable, are listed below. The Board of Trustees governs the fund and is responsible for protecting the interests of shareholders. The Trustees are experienced executives who meet periodically throughout the year to oversee the fund's activities, review contractual arrangements with companies that provide services to the fund, oversee management of the risks associated with such activities and contractual arrangements, and review the fund's performance. Except for Jonathan Chiel each of the Trustees oversees 283 funds. Mr. Chiel oversees 154 funds.
The Trustees hold office without limit in time except that (a) any Trustee may resign; (b) any Trustee may be removed by written instrument, signed by at least two-thirds of the number of Trustees prior to such removal; (c) any Trustee who requests to be retired or who has become incapacitated by illness or injury may be retired by written instrument signed by a majority of the other Trustees; and (d) any Trustee may be removed at any special meeting of shareholders by a two-thirds vote of the outstanding voting securities of the trust. Each Trustee who is not an interested person (as defined in the 1940 Act) of the trust and the fund is referred to herein as an Independent Trustee. Each Independent Trustee shall retire not later than the last day of the calendar year in which his or her 75th birthday occurs. The Independent Trustees may waive this mandatory retirement age policy with respect to individual Trustees. Officers and Advisory Board Members hold office without limit in time, except that any officer or Advisory Board Member may resign or may be removed by a vote of a majority of the Trustees at any regular meeting or any special meeting of the Trustees. Except as indicated, each individual has held the office shown or other offices in the same company for the past five years.
The fund’s Statement of Additional Information (SAI) includes more information about the Trustees. To request a free copy, call Fidelity at 1-800-544-8544.
Experience, Skills, Attributes, and Qualifications of the Trustees. The Governance and Nominating Committee has adopted a statement of policy that describes the experience, qualifications, attributes, and skills that are necessary and desirable for potential Independent Trustee candidates (Statement of Policy). The Board believes that each Trustee satisfied at the time he or she was initially elected or appointed a Trustee, and continues to satisfy, the standards contemplated by the Statement of Policy. The Governance and Nominating Committee also engages professional search firms to help identify potential Independent Trustee candidates who have the experience, qualifications, attributes, and skills consistent with the Statement of Policy. From time to time, additional criteria based on the composition and skills of the current Independent Trustees, as well as experience or skills that may be appropriate in light of future changes to board composition, business conditions, and regulatory or other developments, have also been considered by the professional search firms and the Governance and Nominating Committee. In addition, the Board takes into account the Trustees' commitment and participation in Board and committee meetings, as well as their leadership of standing and ad hoc committees throughout their tenure.
In determining that a particular Trustee was and continues to be qualified to serve as a Trustee, the Board has considered a variety of criteria, none of which, in isolation, was controlling. The Board believes that, collectively, the Trustees have balanced and diverse experience, qualifications, attributes, and skills, which allow the Board to operate effectively in governing the fund and protecting the interests of shareholders. Information about the specific experience, skills, attributes, and qualifications of each Trustee, which in each case led to the Board's conclusion that the Trustee should serve (or continue to serve) as a trustee of the fund, is provided below.
Board Structure and Oversight Function. James C. Curvey is an interested person and currently serves as Chairman. The Trustees have determined that an interested Chairman is appropriate and benefits shareholders because an interested Chairman has a personal and professional stake in the quality and continuity of services provided to the fund. Independent Trustees exercise their informed business judgment to appoint an individual of their choosing to serve as Chairman, regardless of whether the Trustee happens to be independent or a member of management. The Independent Trustees have determined that they can act independently and effectively without having an Independent Trustee serve as Chairman and that a key structural component for assuring that they are in a position to do so is for the Independent Trustees to constitute a substantial majority for the Board. The Independent Trustees also regularly meet in executive session. Ned C. Lautenbach serves as Chairman of the Independent Trustees and as such (i) acts as a liaison between the Independent Trustees and management with respect to matters important to the Independent Trustees and (ii) with management prepares agendas for Board meetings.
Fidelity® funds are overseen by different Boards of Trustees. The fund's Board oversees Fidelity's high income and certain equity funds, and other Boards oversee Fidelity's investment-grade bond, money market, asset allocation, and other equity funds. The asset allocation funds may invest in Fidelity® funds overseen by the fund's Board. The use of separate Boards, each with its own committee structure, allows the Trustees of each group of Fidelity® funds to focus on the unique issues of the funds they oversee, including common research, investment, and operational issues. On occasion, the separate Boards establish joint committees to address issues of overlapping consequences for the Fidelity® funds overseen by each Board.
The Trustees operate using a system of committees to facilitate the timely and efficient consideration of all matters of importance to the Trustees, the fund, and fund shareholders and to facilitate compliance with legal and regulatory requirements and oversight of the fund's activities and associated risks. The Board, acting through its committees, has charged FMR and its affiliates with (i) identifying events or circumstances the occurrence of which could have demonstrably adverse effects on the fund's business and/or reputation; (ii) implementing processes and controls to lessen the possibility that such events or circumstances occur or to mitigate the effects of such events or circumstances if they do occur; and (iii) creating and maintaining a system designed to evaluate continuously business and market conditions in order to facilitate the identification and implementation processes described in (i) and (ii) above. Because the day-to-day operations and activities of the fund are carried out by or through FMR, its affiliates, and other service providers, the fund's exposure to risks is mitigated but not eliminated by the processes overseen by the Trustees. While each of the Board's committees has responsibility for overseeing different aspects of the fund's activities, oversight is exercised primarily through the Operations, Audit, and Compliance Committees. In addition, the Independent Trustees have worked with Fidelity to enhance the Board's oversight of investment and financial risks, legal and regulatory risks, technology risks, and operational risks, including the development of additional risk reporting to the Board. Appropriate personnel, including but not limited to the fund's Chief Compliance Officer (CCO), FMR's internal auditor, the independent accountants, the fund's Treasurer and portfolio management personnel, make periodic reports to the Board's committees, as appropriate, including an annual review of Fidelity's risk management program for the Fidelity® funds. The responsibilities of each standing committee, including their oversight responsibilities, are described further under "Standing Committees of the Trustees."
Interested Trustees*:
Correspondence intended for a Trustee who is an interested person may be sent to Fidelity Investments, 245 Summer Street, Boston, Massachusetts 02210.
Name, Year of Birth; Principal Occupations and Other Relevant Experience+
Jonathan Chiel (1957)
Year of Election or Appointment: 2016
Trustee
Mr. Chiel also serves as Trustee of other Fidelity® funds. Mr. Chiel is Executive Vice President and General Counsel for FMR LLC (diversified financial services company, 2012-present). Previously, Mr. Chiel served as general counsel (2004-2012) and senior vice president and deputy general counsel (2000-2004) for John Hancock Financial Services; a partner with Choate, Hall & Stewart (1996-2000) (law firm); and an Assistant United States Attorney for the United States Attorney’s Office of the District of Massachusetts (1986-95), including Chief of the Criminal Division (1993-1995). Mr. Chiel is a director on the boards of the Boston Bar Foundation and the Maimonides School.
James C. Curvey (1935)
Year of Election or Appointment: 2007
Trustee
Chairman of the Board of Trustees
Mr. Curvey also serves as Trustee of other Fidelity® funds. Mr. Curvey is Vice Chairman (2007-present) and Director of FMR LLC (diversified financial services company). In addition, Mr. Curvey is an Overseer Emeritus for the Boston Symphony Orchestra, a Director of Artis-Naples, and a Trustee of Brewster Academy in Wolfeboro, New Hampshire. Previously, Mr. Curvey served as a Director of Fidelity Research & Analysis Co. (investment adviser firm, 2009-2018), Director of Fidelity Investments Money Management, Inc. (investment adviser firm, 2009-2014) and a Director of FMR and FMR Co., Inc. (investment adviser firms, 2007-2014).
Charles S. Morrison (1960)
Year of Election or Appointment: 2014
Trustee
Mr. Morrison also serves as Trustee of other funds. He serves as President of Fidelity SelectCo, LLC (investment adviser firm, 2017-present) and Fidelity Management & Research Company (FMR) (investment adviser firm, 2016-present), a Director of Fidelity Investments Money Management, Inc. (FIMM) (investment adviser firm, 2014-present), Director of Fidelity SelectCo, LLC (investment adviser firm, 2014-present), President, Asset Management (2014-present), and is an employee of Fidelity Investments. Previously, Mr. Morrison served as Vice President of Fidelity's Fixed Income and Asset Allocation Funds (2012-2014), President, Fixed Income (2011-2014), Vice President of Fidelity's Money Market Funds (2005-2009), President, Money Market Group Leader of FMR (investment adviser firm, 2009), and Senior Vice President, Money Market Group of FMR (2004-2009). Mr. Morrison also served as Vice President of Fidelity's Bond Funds (2002-2005), certain Balanced Funds (2002-2005), and certain Asset Allocation Funds (2002-2007), and as Senior Vice President (2002-2005) of Fidelity's Bond Division.
* Determined to be an “Interested Trustee” by virtue of, among other things, his or her affiliation with the trust or various entities under common control with FMR.
+ The information includes the Trustee's principal occupation during the last five years and other information relating to the experience, attributes, and skills relevant to the Trustee's qualifications to serve as a Trustee, which led to the conclusion that the Trustee should serve as a Trustee for the fund.
Independent Trustees:
Correspondence intended for an Independent Trustee may be sent to Fidelity Investments, P.O. Box 55235, Boston, Massachusetts 02205-5235.
Name, Year of Birth; Principal Occupations and Other Relevant Experience+
Dennis J. Dirks (1948)
Year of Election or Appointment: 2005
Trustee
Mr. Dirks also serves as Trustee of other Fidelity® funds. Prior to his retirement in May 2003, Mr. Dirks was Chief Operating Officer and a member of the Board of The Depository Trust & Clearing Corporation (DTCC). He also served as President, Chief Operating Officer, and Board member of The Depository Trust Company (DTC) and President and Board member of the National Securities Clearing Corporation (NSCC). In addition, Mr. Dirks served as Chief Executive Officer and Board member of the Government Securities Clearing Corporation, Chief Executive Officer and Board member of the Mortgage-Backed Securities Clearing Corporation, as a Trustee and a member of the Finance Committee of Manhattan College (2005-2008), as a Trustee and a member of the Finance Committee of AHRC of Nassau County (2006-2008), as a member of the Independent Directors Council (IDC) Governing Council (2010-2015), and as a member of the Board of Directors for The Brookville Center for Children’s Services, Inc. (2009-2017). Mr. Dirks is a member of the Finance Committee (2016-present), Board of Directors (2017-present) and Board of Trustees (2018-present) and is Treasurer (2018-present) of the Asolo Repertory Theatre.
Donald F. Donahue (1950)
Year of Election or Appointment: 2018
Trustee
Mr. Donahue also serves as a Trustee of other Fidelity® funds. Mr. Donahue is President and Chief Executive Officer of Miranda Partners, LLC (risk consulting for the financial services industry, 2012-present). Previously, Mr. Donahue served as a Member of the Advisory Board of certain Fidelity® funds (2015-2018) and Chief Executive Officer (2006-2012), Chief Operating Officer (2003-2006), and Managing Director, Customer Marketing and Development (1999-2003) of The Depository Trust & Clearing Corporation (financial markets infrastructure). Mr. Donahue serves as a Member (2007-present) and Co-Chairman (2016-present) of the Board of Directors of United Way of New York, Member of the Board of Directors of NYC Leadership Academy (2012-present) and Member of the Board of Advisors of Ripple Labs, Inc. (financial services, 2015-present). He also served as Chairman (2010-2012) and Member of the Board of Directors (2012-2013) of Omgeo, LLC (financial services), Treasurer of United Way of New York (2012-2016), and Member of the Board of Directors of XBRL US (financial services non-profit, 2009-2012) and the International Securities Services Association (2009-2012).
Alan J. Lacy (1953)
Year of Election or Appointment: 2008
Trustee
Mr. Lacy also serves as Trustee of other Fidelity® funds. Mr. Lacy serves as a Director of Bristol-Myers Squibb Company (global pharmaceuticals, 2008-present). He is a Trustee of the California Chapter of The Nature Conservancy (2015-present) and a Director of the Center for Advanced Study in the Behavioral Sciences at Stanford University (2015-present). In addition, Mr. Lacy served as Senior Adviser (2007-2014) of Oak Hill Capital Partners, L.P. (private equity) and also served as Chief Executive Officer (2005) and Vice Chairman (2005-2006) of Sears Holdings Corporation (retail) and Chief Executive Officer and Chairman of the Board of Sears, Roebuck and Co. (retail, 2000-2005). Previously, Mr. Lacy served as Chairman (2014-2017) and a member (2010-2017) of the Board of Directors of Dave & Buster’s Entertainment, Inc. (restaurant and entertainment complexes), as Chairman (2008-2011) and a member (2006-2015) of the Board of Trustees of the National Parks Conservation Association, and as a member of the Board of Directors for The Hillman Companies, Inc. (hardware wholesalers, 2010-2014), Earth Fare, Inc. (retail grocery, 2010-2014), and The Western Union Company (global money transfer, 2006-2011).
Ned C. Lautenbach (1944)
Year of Election or Appointment: 2000
Trustee
Chairman of the Independent Trustees
Mr. Lautenbach also serves as Trustee of other Fidelity® funds. Mr. Lautenbach currently serves as Vice Chair of the Board of Governors, State University System of Florida (2013-present) and is a member of the Council on Foreign Relations (1994-present). He is also a member and has most recently served as Chairman of the Board of Directors of Artis-Naples (2012-present). Previously, Mr. Lautenbach served as a member and then Lead Director of the Board of Directors of Eaton Corporation (diversified industrial, 1997-2016). He was also a Partner and Advisory Partner at Clayton, Dubilier & Rice, LLC (private equity investment, 1998-2010), as well as a Director of Sony Corporation (2006-2007). In addition, Mr. Lautenbach also had a 30-year career with IBM (technology company) during which time he served as Senior Vice President and a member of the Corporate Executive Committee (1968-1998).
Joseph Mauriello (1944)
Year of Election or Appointment: 2008
Trustee
Mr. Mauriello also serves as Trustee of other Fidelity® funds. Prior to his retirement in January 2006, Mr. Mauriello served in numerous senior management positions including Deputy Chairman and Chief Operating Officer (2004-2005), and Vice Chairman of Financial Services (2002-2004) of KPMG LLP US (professional services, 1965-2005). Mr. Mauriello currently serves as a member of the Independent Directors Council (IDC) Governing Council (2015-present). Previously, Mr. Mauriello served as a member of the Board of Directors of XL Group plc. (global insurance and re-insurance, 2006-2018).
Cornelia M. Small (1944)
Year of Election or Appointment: 2005
Trustee
Ms. Small also serves as Trustee of other Fidelity® funds. Ms. Small is a member of the Board of Directors (2009-present) and Chair of the Investment Committee (2010-present) of the Teagle Foundation. Ms. Small also serves on the Investment Committee of the Berkshire Taconic Community Foundation (2008-present). Previously, Ms. Small served as Chairperson (2002-2008) and a member of the Investment Committee and Chairperson (2008-2012) and a member of the Board of Trustees of Smith College. In addition, Ms. Small served as Chief Investment Officer, Director of Global Equity Investments, and a member of the Board of Directors of Scudder, Stevens & Clark and Scudder Kemper Investments.
Garnett A. Smith (1947)
Year of Election or Appointment: 2018
Trustee
Mr. Smith also serves as Trustee of other Fidelity® funds. Prior to Mr. Smith's retirement, he served as Chairman and Chief Executive Officer of Inbrand Corp. (manufacturer of personal absorbent products, 1990-1997). He also served as President (1986-1990) of Inbrand Corp. Prior to his employment with Inbrand Corp., he was employed by a retail fabric chain and North Carolina National Bank. In addition, Mr. Smith served as a Member of the Advisory Board of certain Fidelity® funds (2012-2013) and as a board member of the Jackson Hole Land Trust (2009-2012).
David M. Thomas (1949)
Year of Election or Appointment: 2008
Trustee
Mr. Thomas also serves as Trustee of other Fidelity® funds. Mr. Thomas serves as Non-Executive Chairman of the Board of Directors of Fortune Brands Home and Security (home and security products, 2011-present), as a member of the Board of Directors (2004-present) and Presiding Director (2013-present) of Interpublic Group of Companies, Inc. (marketing communication), and as a member of the Board of Trustees of the University of Florida (2013-present). Previously, Mr. Thomas served as Executive Chairman (2005-2006) and Chairman and Chief Executive Officer (2000-2005) of IMS Health, Inc. (pharmaceutical and healthcare information solutions), and a Director of Fortune Brands, Inc. (consumer products, 2000-2011).
+ The information includes the Trustee's principal occupation during the last five years and other information relating to the experience, attributes, and skills relevant to the Trustee's qualifications to serve as a Trustee, which led to the conclusion that the Trustee should serve as a Trustee for the fund.
Advisory Board Members and Officers:
Correspondence intended for a Member of the Advisory Board (if any) may be sent to Fidelity Investments, P.O. Box 55235, Boston, Massachusetts 02205-5235. Correspondence intended for an officer or Peter S. Lynch may be sent to Fidelity Investments, 245 Summer Street, Boston, Massachusetts 02210. Officers appear below in alphabetical order.
Name, Year of Birth; Principal Occupation
Vicki L. Fuller (1957)
Year of Election or Appointment: 2018
Member of the Advisory Board
Ms. Fuller also serves as Member of the Advisory Board of other Fidelity® funds. Ms. Fuller serves as a member of the Board of Directors, Audit Committee, and Nominating and Governance Committee of The Williams Companies, Inc. (natural gas infrastructure, 2018-present). Previously, Ms. Fuller served as the Chief Investment Officer of the New York State Common Retirement Fund (2012-2018) and held a variety of positions at AllianceBernstein L.P. (global asset management, 1985-2012), including Managing Director (2006-2012) and Senior Vice President and Senior Portfolio Manager (2001-2006).
Peter S. Lynch (1944)
Year of Election or Appointment: 2003
Member of the Advisory Board
Mr. Lynch also serves as Member of the Advisory Board of other Fidelity® funds. Mr. Lynch is Vice Chairman and a Director of FMR (investment adviser firm) and FMR Co., Inc. (investment adviser firm). In addition, Mr. Lynch serves as a Trustee of Boston College and as the Chairman of the Inner-City Scholarship Fund. Previously, Mr. Lynch served on the Special Olympics International Board of Directors (1997-2006).
William S. Stavropoulos (1939)
Year of Election or Appointment: 2018
Member of the Advisory Board
Mr. Stavropoulos also serves as Member of the Advisory Board of other Fidelity® funds. Mr. Stavropoulos serves as President and Founder of the Michigan Baseball Foundation, the Great Lakes Loons (2007-present). Mr. Stavropoulos is Chairman Emeritus of the Board of Directors of The Dow Chemical Company, where he previously served in numerous senior management positions, including President, CEO (1995-2000; 2002-2004), Chairman of the Executive Committee (2000-2006), and as a member of the Board of Directors (1990-2006). Currently, Mr. Stavropoulos is Chairman of the Board of Directors of Univar Inc. (global distributor of commodity and specialty chemicals), a Director of Teradata Corporation (data warehousing and technology solutions), and a member of the Advisory Board for Metalmark Capital LLC (private equity investment, 2005-present). Mr. Stavropoulos is an operating advisor to Clayton, Dubilier & Rice, LLC (private equity investment). In addition, Mr. Stavropoulos is a member of the University of Notre Dame Advisory Council for the College of Science, a Trustee of the Rollin L. Gerstacker Foundation, and a Director of Artis-Naples in Naples, Florida. Previously, Mr. Stavropoulos served as Trustee of certain Fidelity® funds (2001-2018) and as a Director of Chemical Financial Corporation (bank holding company, 1993-2012) and Tyco International, Ltd. (multinational manufacturing and services, 2007-2012).
Carol B. Tomé (1957)
Year of Election or Appointment: 2018
Member of the Advisory Board
Ms. Tomé also serves as Member of the Advisory Board of other Fidelity® funds. Ms. Tomé is Chief Financial Officer (2001-present) and Executive Vice President of Corporate Services (2007-present) of The Home Depot, Inc. (home improvement retailer) and a Director (2003-present) and Chair of the Audit Committee (2004-present) of United Parcel Service, Inc. (package delivery and supply chain management). Previously, Ms. Tomé served as Trustee of certain Fidelity® funds (2017), Senior Vice President of Finance and Accounting/Treasurer (2000-2007) and Vice President and Treasurer (1995-2000) of The Home Depot, Inc. and Chair of the Board (2010-2012), Vice Chair of the Board (2009 and 2013), and a Director (2008-2013) of the Federal Reserve Bank of Atlanta. Ms. Tomé is also a director or trustee of many community and professional organizations.
Michael E. Wiley (1950)
Year of Election or Appointment: 2018
Member of the Advisory Board
Mr. Wiley also serves as Trustee or Member of the Advisory Board of other Fidelity® funds. Mr. Wiley serves as a Director of High Point Resources (exploration and production, 2005-present). Previously, Mr. Wiley served as a Director of Andeavor Corporation (independent oil refiner and marketer, 2005-2018), a Director of Andeavor Logistics LP (natural resources logistics, 2015-2018), a Director of Post Oak Bank (privately-held bank, 2004-2018), a Director of Asia Pacific Exploration Consolidated (international oil and gas exploration and production, 2008-2013), a member of the Board of Trustees of the University of Tulsa (2000-2006; 2007-2010), a Senior Energy Advisor of Katzenbach Partners, LLC (consulting, 2006-2007), an Advisory Director of Riverstone Holdings (private investment), a Director of Spinnaker Exploration Company (exploration and production, 2001-2005) and Chairman, President, and CEO of Baker Hughes, Inc. (oilfield services, 2000-2004).
Elizabeth Paige Baumann (1968)
Year of Election or Appointment: 2017
Anti-Money Laundering (AML) Officer
Ms. Baumann also serves as AML Officer of other funds. She is Chief AML Officer (2012-present) and Senior Vice President (2014-present) of FMR LLC (diversified financial services company) and is an employee of Fidelity Investments. Previously, Ms. Baumann served as AML Officer of the funds (2012-2016), and Vice President (2007-2014) and Deputy Anti-Money Laundering Officer (2007-2012) of FMR LLC.
John J. Burke III (1964)
Year of Election or Appointment: 2018
Chief Financial Officer
Mr. Burke also serves as Chief Financial Officer of other funds. Mr. Burke serves as Head of Investment Operations for Fidelity Fund and Investment Operations (2018-present) and is an employee of Fidelity Investments (1998-present). Previously Mr. Burke served as head of Asset Management Investment Operations (2012-2018).
William C. Coffey (1969)
Year of Election or Appointment: 2018
Secretary and Chief Legal Officer (CLO)
Mr. Coffey also serves as Secretary and CLO of other funds. Mr. Coffey serves as CLO, Secretary, and Senior Vice President of Fidelity Management & Research Company and FMR Co., Inc. (investment adviser firms, 2018-present); Secretary of Fidelity SelectCo, LLC and Fidelity Investments Money Management, Inc. (investment adviser firms, 2018-present); and CLO of Fidelity Management & Research (Hong Kong) Limited, FMR Investment Management (UK) Limited, and Fidelity Management & Research (Japan) Limited (investment adviser firms, 2018-present). He is Senior Vice President and Deputy General Counsel of FMR LLC (diversified financial services company, 2010-present), and is an employee of Fidelity Investments. Previously, Mr. Coffey served as Assistant Secretary of certain funds (2009-2018) and as Vice President and Associate General Counsel of FMR LLC (2005-2009).
Timothy M. Cohen (1969)
Year of Election or Appointment: 2018
Vice President
Mr. Cohen also serves as Vice President of other funds. Mr. Cohen serves as Co-Head of Global Equity Research (2016-present), a Director of Fidelity Management & Research (Japan) Limited (investment adviser firm, 2016-present), and is an employee of Fidelity Investments. Previously, Mr. Cohen served as Chief Investment Officer - Equity and a Director of Fidelity Management & Research (U.K.) Inc. (investment adviser firm, 2013-2015) and as a Director of Fidelity Management & Research (Hong Kong) Limited (investment adviser firm, 2017).
Jonathan Davis (1968)
Year of Election or Appointment: 2010
Assistant Treasurer
Mr. Davis also serves as Assistant Treasurer of other funds. Mr. Davis serves as Assistant Treasurer of FMR Capital, Inc. (2017-present) and is an employee of Fidelity Investments. Previously, Mr. Davis served as Vice President and Associate General Counsel of FMR LLC (diversified financial services company, 2003-2010).
Adrien E. Deberghes (1967)
Year of Election or Appointment: 2016
Assistant Treasurer
Mr. Deberghes also serves as an officer of other funds. He serves as Assistant Treasurer of FMR Capital, Inc. (2017-present), Executive Vice President of Fidelity Investments Money Management, Inc. (FIMM) (investment adviser firm, 2016-present), and is an employee of Fidelity Investments (2008-present). Previously, Mr. Deberghes served as President and Treasurer of certain Fidelity® funds (2013-2018). Prior to joining Fidelity Investments, Mr. Deberghes was Senior Vice President of Mutual Fund Administration at State Street Corporation (2007-2008), Senior Director of Mutual Fund Administration at Investors Bank & Trust (2005-2007), and Director of Finance for Dunkin' Brands (2000-2005). Previously, Mr. Deberghes served in other fund officer roles.
Laura M. Del Prato (1964)
Year of Election or Appointment: 2018
Assistant Treasurer
Ms. Del Prato also serves as an officer of other funds. Ms. Del Prato is an employee of Fidelity Investments (2017-present). Prior to joining Fidelity Investments, Ms. Del Prato served as a Managing Director and Treasurer of the JPMorgan Mutual Funds (2014-2017). Prior to JPMorgan, Ms. Del Prato served as a partner at Cohen Fund Audit Services (accounting firm, 2012-2013) and KPMG LLP (accounting firm, 2004-2012).
Colm A. Hogan (1973)
Year of Election or Appointment: 2016
Deputy Treasurer
Mr. Hogan also serves as an officer of other funds. Mr. Hogan serves as Assistant Treasurer of FMR Capital, Inc. (2017-present) and is an employee of Fidelity Investments (2005-present). Previously, Mr. Hogan served as Assistant Treasurer of certain Fidelity® funds (2016-2018).
Pamela R. Holding (1964)
Year of Election or Appointment: 2018
Vice President
Ms. Holding also serves as Vice President of other funds. Ms. Holding serves as Co-Head of Global Equity Research (2018-present) and is an employee of Fidelity Investments (2013-present).
Chris Maher (1972)
Year of Election or Appointment: 2013
Assistant Treasurer
Mr. Maher serves as Assistant Treasurer of other funds. Mr. Maher is Vice President of Valuation Oversight, serves as Assistant Treasurer of FMR Capital, Inc. (2017-present), and is an employee of Fidelity Investments. Previously, Mr. Maher served as Vice President of Asset Management Compliance (2013), Vice President of the Program Management Group of FMR (investment adviser firm, 2010-2013), and Vice President of Valuation Oversight (2008-2010).
Rieco E. Mello (1969)
Year of Election or Appointment: 2017
Assistant Treasurer
Mr. Mello also serves as Assistant Treasurer of other funds. Mr. Mello serves as Assistant Treasurer of FMR Capital, Inc. (2017-present) and is an employee of Fidelity Investments (1995-present).
Kenneth B. Robins (1969)
Year of Election or Appointment: 2016
Chief Compliance Officer
Mr. Robins also serves as an officer of other funds. Mr. Robins serves as Compliance Officer of Fidelity Management & Research Company and FMR Co., Inc. (investment adviser firms, 2016-present) and is an employee of Fidelity Investments (2004-present). Previously, Mr. Robins served as Executive Vice President of Fidelity Investments Money Management, Inc. (investment adviser firm, 2013-2016) and served in other fund officer roles.
Stacie M. Smith (1974)
Year of Election or Appointment: 2016
President and Treasurer
Ms. Smith also serves as an officer of other funds. Ms. Smith serves as Assistant Treasurer of FMR Capital, Inc. (2017-present), is an employee of Fidelity Investments (2009-present), and has served in other fund officer roles. Prior to joining Fidelity Investments, Ms. Smith served as Senior Audit Manager of Ernst & Young LLP (accounting firm, 1996-2009). Previously, Ms. Smith served as Assistant Treasurer (2013-2018) and Deputy Treasurer (2013-2016) of certain Fidelity® funds.
Marc L. Spector (1972)
Year of Election or Appointment: 2016
Assistant Treasurer
Mr. Spector also serves as an officer of other funds. Mr. Spector serves as Assistant Treasurer of FMR Capital, Inc. (2017-present) and is an employee of Fidelity Investments (2016-present). Prior to joining Fidelity Investments, Mr. Spector served as Director at the Siegfried Group (accounting firm, 2013-2016), and prior to Siegfried Group as audit senior manager at Deloitte & Touche (accounting firm, 2005-2013).
Shareholder Expense Example
As a shareholder of the Fund, you incur two types of costs: (1) transaction costs, including sales charges (loads) on purchase payments or redemption proceeds, redemption fees and (2) ongoing costs, including management fees, distribution and/or service (12b-1) fees and other Fund expenses. This Example is intended to help you understand your ongoing costs (in dollars) of investing in the Fund and to compare these costs with the ongoing costs of investing in other mutual funds.
The Example is based on an investment of $1,000 invested at the beginning of the period and held for the entire period (May 1, 2018 to October 31, 2018).
Actual Expenses
The first line of the accompanying table for each class of the Fund provides information about actual account values and actual expenses. You may use the information in this line, together with the amount you invested, to estimate the expenses that you paid over the period. Simply divide your account value by $1,000.00 (for example, an $8,600 account value divided by $1,000.00 = 8.6), then multiply the result by the number in the first line for a class of the Fund under the heading entitled "Expenses Paid During Period" to estimate the expenses you paid on your account during this period. A small balance maintenance fee of $12.00 that is charged once a year may apply for certain accounts with a value of less than $2,000. This fee, which was eliminated effective August 1, 2018, is not included in the table below. If it was, the estimate of expenses you paid during the period would be higher, and your ending account value lower, by this amount. In addition, the Fund, as a shareholder in the underlying Fidelity Central Funds, will indirectly bear its pro-rata share of the fees and expenses incurred by the underlying Fidelity Central Funds. These fees and expenses are not included in the Fund's annualized expense ratio used to calculate the expense estimate in the table below.
Hypothetical Example for Comparison Purposes
The second line of the accompanying table for each class of the Fund provides information about hypothetical account values and hypothetical expenses based on a Class' actual expense ratio and an assumed rate of return of 5% per year before expenses, which is not the Class' actual return. The hypothetical account values and expenses may not be used to estimate the actual ending account balance or expenses you paid for the period. You may use this information to compare the ongoing costs of investing in the Fund and other funds. To do so, compare this 5% hypothetical example with the 5% hypothetical examples that appear in the shareholder reports of the other funds. A small balance maintenance fee of $12.00 that is charged once a year may apply for certain accounts with a value of less than $2,000. This fee, which was eliminated effective August 1, 2018, is not included in the table below. If it was, the estimate of expenses you paid during the period would be higher, and your ending account value lower, by this amount. In addition, the Fund, as a shareholder in the underlying Fidelity Central Funds, will indirectly bear its pro-rata share of the fees and expenses incurred by the underlying Fidelity Central Funds. These fees and expenses are not included in the Fund's annualized expense ratio used to calculate the expense estimate in the table below.
Please note that the expenses shown in the table are meant to highlight your ongoing costs only and do not reflect any transaction costs. Therefore, the second line of the table is useful in comparing ongoing costs only, and will not help you determine the relative total costs of owning different funds. In addition, if these transactional costs were included, your costs would have been higher.
| | Annualized Expense Ratio-A | Beginning
Account Value
May 1, 2018 | Ending
Account Value
October 31, 2018 | Expenses Paid
During Period-B
May 1, 2018
to October 31, 2018 |
| Class A | 1.54% | | | |
| Actual | | $1,000.00 | $864.50 | $7.24 |
| Hypothetical-C | | $1,000.00 | $1,017.44 | $7.83 |
| Class M | 1.88% | | | |
| Actual | | $1,000.00 | $863.00 | $8.83 |
| Hypothetical-C | | $1,000.00 | $1,015.73 | $9.55 |
| Class C | 2.34% | | | |
| Actual | | $1,000.00 | $860.10 | $10.97 |
| Hypothetical-C | | $1,000.00 | $1,013.41 | $11.88 |
| Emerging Europe, Middle East, Africa (EMEA) | 1.31% | | | |
| Actual | | $1,000.00 | $864.70 | $6.16 |
| Hypothetical-C | | $1,000.00 | $1,018.60 | $6.67 |
| Class I | 1.18% | | | |
| Actual | | $1,000.00 | $866.30 | $5.55 |
| Hypothetical-C | | $1,000.00 | $1,019.26 | $6.01 |
A Annualized expense ratio reflects expenses net of applicable fee waivers.
B Expenses are equal to each Class' annualized expense ratio, multiplied by the average account value over the period, multiplied by 184/365 (to reflect the one-half year period).
C 5% return per year before expenses
Distributions (Unaudited)
The Board of Trustees of Fidelity Advisor Emerging Europe, Middle East, Africa (EMEA) Fund voted to pay to shareholders of record at the opening of business on record date, the following distributions per share derived from capital gains realized from sales of portfolio securities, and dividends derived from net investment income:
| | Pay Date | Record Date | Dividends | Capital Gains |
| Fidelity Advisor Emerging Europe, Middle East, Africa (EMEA) Fund | | | | |
| Class A | 12/10/18 | 12/07/18 | $0.184 | $0.003 |
| Class M | 12/10/18 | 12/07/18 | $0.161 | $0.003 |
| Class C | 12/10/18 | 12/07/18 | $0.091 | $0.003 |
| Emerging Europe, Middle East, Africa (EMEA) | 12/10/18 | 12/07/18 | $0.213 | $0.003 |
| Class I | 12/10/18 | 12/07/18 | $0.222 | $0.003 |
|
Class A, Class M, Class C, Emerging Europe, Middle East, Africa (EMEA), and Class I designate 100% of the dividends distributed during the fiscal year as amounts which may be taken into account as a dividend for purposes of the maximum rate under section 1(h)(11) of the Internal Revenue Code.
The amounts per share which represent income derived from sources within, and taxes paid to, foreign countries or possessions of the United States are as follows:
| | Pay Date | Income | Taxes |
| Fidelity Advisor Emerging Europe, Middle East, Africa (EMEA) Fund | | | |
| Class A | 12/11/17 | $0.1760 | $0.0380 |
| Class M | 12/11/17 | $0.1550 | $0.0380 |
| Class C | 12/11/17 | $0.0840 | $0.0380 |
| Emerging Europe, Middle East, Africa (EMEA) | 12/11/17 | $0.2030 | $0.0380 |
| Class I | 12/11/17 | $0.2130 | $0.0380 |
|
The fund will notify shareholders in January 2019 of amounts for use in preparing 2018 income tax returns.
Board Approval of Investment Advisory Contracts
Fidelity Emerging Europe, Middle East, Africa (EMEA) Fund
At its July 2018 meeting, the Board of Trustees, including the Independent Trustees (together, the Board), voted to continue the management contract with Fidelity Management & Research Company (FMR) and the sub-advisory agreements (together, the Advisory Contracts) for the fund for six months through January 31, 2019, in connection with the reunification of the Fidelity Equity High Income Funds Board, which oversees the fund, and the Sector Portfolios Board.
The Board considered that the approval of the fund's Advisory Contracts will not result in any changes in (i) the investment process or strategies employed in the management of the fund's assets; (ii) the fees and expenses paid by shareholders; (iii) the nature, extent or quality of services provided under the fund's Advisory Contracts; or (iv) the day-to-day management of the fund or the persons primarily responsible for such management. The Board concluded that the fund's Advisory Contracts are fair and reasonable, and that the fund's Advisory Contracts should be renewed, without modification, through January 31, 2019, with the understanding that the Board will consider the annual renewal for a full one year period in January 2019.
In connection with its consideration of future renewals of the fund's Advisory Contracts, the Board will consider: (i) the nature, extent and quality of services provided to the fund, including shareholder and administrative services and investment performance; (ii) the competitiveness of the management fee and total expenses for the fund; (iii) the costs of the services and profitability, including the revenues earned and the expenses incurred in conducting the business of developing, marketing, distributing, managing, administering, and servicing the fund and its shareholders, to the extent applicable, as well as potential fall-out benefits from Fidelity's non-fund businesses; and (iv) whether there have been economies of scale in respect of the Fidelity funds, whether the Fidelity funds (including the fund) have appropriately benefited from any such economies of scale, and whether there is the potential for realization of any further economies.
Based on its evaluation of all of the conclusions noted above, and after considering all factors it believed relevant, the Board ultimately concluded that the fund's management fee structure is fair and reasonable, and that the continuation of the fund's Advisory Contracts should be approved.
Corporate Headquarters
245 Summer St.
Boston, MA 02210
www.fidelity.com
EME-ANN-1218
1.861972.110
Fidelity® Series Emerging Markets Fund
Fidelity® Series Emerging Markets Opportunities Fund (formerly Fidelity® Series Emerging Markets Fund)
Fidelity® Series International Growth Fund
Fidelity® Series International Small Cap Fund
Fidelity® Series International Value Fund
Annual Report October 31, 2018 |
|
Contents
To view a fund's proxy voting guidelines and proxy voting record for the 12-month period ended June 30, visit http://www.fidelity.com/proxyvotingresults or visit the Securities and Exchange Commission's (SEC) web site at http://www.sec.gov.
You may also call 1-800-544-8544 to request a free copy of the proxy voting guidelines.
Standard & Poor's, S&P and S&P 500 are registered service marks of The McGraw-Hill Companies, Inc. and have been licensed for use by Fidelity Distributors Corporation.
Other third-party marks appearing herein are the property of their respective owners.
All other marks appearing herein are registered or unregistered trademarks or service marks of FMR LLC or an affiliated company. © 2018 FMR LLC. All rights reserved.
This report and the financial statements contained herein are submitted for the general information of the shareholders of the Funds. This report is not authorized for distribution to prospective investors in the Funds unless preceded or accompanied by an effective prospectus.
A fund files its complete schedule of portfolio holdings with the SEC for the first and third quarters of each fiscal year on Form N-Q. Forms N-Q are available on the SEC’s web site at http://www.sec.gov. A fund's Forms N-Q may be reviewed and copied at the SEC’s Public Reference Room in Washington, DC. Information regarding the operation of the SEC's Public Reference Room may be obtained by calling 1-800-SEC-0330.
For a complete list of a fund's portfolio holdings, view the most recent holdings listing, semiannual report, or annual report on Fidelity's web site at http://www.fidelity.com, http://www.institutional.fidelity.com, or http://www.401k.com, as applicable.
NOT FDIC INSURED •MAY LOSE VALUE •NO BANK GUARANTEE
Neither the Funds nor Fidelity Distributors Corporation is a bank.
Fidelity® Series Emerging Markets Fund
Investment Summary (Unaudited)
Geographic Diversification (% of fund's net assets)
| As of October 31, 2018 |
| | United States of America* | 20.0% |
| | Cayman Islands | 12.0% |
| | Taiwan | 7.6% |
| | Korea (South) | 7.6% |
| | India | 7.1% |
| | United Kingdom | 6.8% |
| | Brazil | 6.4% |
| | Hong Kong | 6.2% |
| | South Africa | 4.6% |
| | Other | 21.7% |
* Includes Short-Term Investments and Net Other Assets (Liabilities).
Percentages are based on country or territory of incorporation and are adjusted for the effect of futures contracts, if applicable.
Asset Allocation as of October 31, 2018
| | % of fund's net assets |
| Stocks | 86.5 |
| Short-Term Investments and Net Other Assets (Liabilities) | 13.5 |
Top Ten Stocks as of October 31, 2018
| | % of fund's net assets |
| Tencent Holdings Ltd. (Cayman Islands, Interactive Media & Services) | 5.8 |
| Taiwan Semiconductor Manufacturing Co. Ltd. (Taiwan, Semiconductors & Semiconductor Equipment) | 5.2 |
| HDFC Bank Ltd. sponsored ADR (India, Banks) | 5.2 |
| Hyundai Fire & Marine Insurance Co. Ltd. (Korea (South), Insurance) | 3.6 |
| British American Tobacco PLC (South Africa) (United Kingdom, Tobacco) | 3.2 |
| SITC International Holdings Co. Ltd. (Cayman Islands, Marine) | 3.0 |
| NMC Health PLC (United Kingdom, Health Care Providers & Services) | 2.7 |
| Pilipinas Shell Petroleum Corp. (Philippines, Oil, Gas & Consumable Fuels) | 2.4 |
| Far East Horizon Ltd. (Hong Kong, Diversified Financial Services) | 2.4 |
| Dairy Farm International Holdings Ltd. (Bermuda, Food & Staples Retailing) | 2.2 |
| | 35.7 |
Top Market Sectors as of October 31, 2018
| | % of fund's net assets |
| Financials | 29.9 |
| Information Technology | 9.9 |
| Consumer Staples | 9.7 |
| Industrials | 8.7 |
| Communication Services | 7.5 |
| Energy | 6.1 |
| Health Care | 5.0 |
| Consumer Discretionary | 2.9 |
| Utilities | 2.2 |
| Real Estate | 0.0 |
Fidelity® Series Emerging Markets Fund
Schedule of Investments October 31, 2018
Showing Percentage of Net Assets
| Common Stocks - 80.7% | | | |
| | | Shares | Value |
| Bermuda - 2.2% | | | |
| Dairy Farm International Holdings Ltd. | | 3,529,800 | $31,874,094 |
| Brazil - 5.2% | | | |
| Ambev SA | | 106,000 | 465,414 |
| Equatorial Energia SA | | 1,725,361 | 31,521,509 |
| Instituto Hermes Pardini SA | | 2,480,600 | 10,151,696 |
| Ultrapar Participacoes SA | | 2,667,800 | 31,721,121 |
|
| TOTAL BRAZIL | | | 73,859,740 |
|
| Cayman Islands - 12.0% | | | |
| Best Pacific International Holdings Ltd. | | 41,954,000 | 10,699,890 |
| Greatview Aseptic Pack Co. Ltd. | | 262,000 | 173,732 |
| Pico Far East Holdings Ltd. | | 29,891,200 | 10,101,018 |
| SITC International Holdings Co. Ltd. | | 57,928,000 | 42,548,764 |
| Tencent Holdings Ltd. | | 2,413,400 | 82,681,308 |
| TK Group Holdings Ltd. | | 27,320,000 | 14,492,722 |
| Vinda International Holdings Ltd. | | 7,869,000 | 11,218,564 |
|
| TOTAL CAYMAN ISLANDS | | | 171,915,998 |
|
| Chile - 2.0% | | | |
| Compania Cervecerias Unidas SA | | 1,777,600 | 22,168,760 |
| Quinenco SA | | 2,345,659 | 6,164,051 |
|
| TOTAL CHILE | | | 28,332,811 |
|
| China - 2.6% | | | |
| Shanghai International Airport Co. Ltd. (A Shares) | | 3,690,896 | 26,217,470 |
| Shenzhen Expressway Co. (H Shares) | | 11,192,332 | 10,290,389 |
|
| TOTAL CHINA | | | 36,507,859 |
|
| Hong Kong - 6.2% | | | |
| AIA Group Ltd. | | 4,074,400 | 30,836,162 |
| China Resources Pharmaceutical Group Ltd. (a) | | 15,355,149 | 22,517,896 |
| Far East Horizon Ltd. | | 35,736,779 | 34,634,182 |
|
| TOTAL HONG KONG | | | 87,988,240 |
|
| India - 7.1% | | | |
| Axis Bank Ltd. GDR (Reg. S) (b) | | 623,475 | 24,564,915 |
| CCL Products (India) Ltd. | | 24,131 | 82,595 |
| Cyient Ltd. | | 80,000 | 671,985 |
| HDFC Bank Ltd. sponsored ADR | | 837,130 | 74,429,228 |
| Lupin Ltd. (b) | | 17,884 | 214,107 |
| Redington India Ltd. | | 170,962 | 191,627 |
| Sunteck Realty Ltd. (b) | | 81,076 | 355,338 |
| Tata Communications Ltd. (b) | | 140,303 | 932,192 |
| Zensar Technologies Ltd. | | 33,789 | 117,183 |
|
| TOTAL INDIA | | | 101,559,170 |
|
| Kenya - 0.0% | | | |
| KCB Group Ltd. | | 222,900 | 83,506 |
| Korea (South) - 7.6% | | | |
| Hyundai Fire & Marine Insurance Co. Ltd. | | 1,398,022 | 51,215,880 |
| KB Financial Group, Inc. | | 521,201 | 21,677,428 |
| Leeno Industrial, Inc. | | 63,701 | 3,344,163 |
| Nice Information & Telecom, Inc. | | 156,942 | 2,606,530 |
| Samsung Electronics Co. Ltd. | | 804,146 | 29,882,375 |
|
| TOTAL KOREA (SOUTH) | | | 108,726,376 |
|
| Mexico - 1.8% | | | |
| Regional S.A.B. de CV | | 5,338,168 | 25,998,054 |
| Nigeria - 1.9% | | | |
| Guaranty Trust Bank PLC | | 266,800,148 | 27,561,999 |
| Papua New Guinea - 1.5% | | | |
| Oil Search Ltd. ADR | | 3,905,887 | 21,491,462 |
| Philippines - 3.6% | | | |
| Ayala Corp. | | 969,465 | 16,690,828 |
| Pilipinas Shell Petroleum Corp. | | 38,302,010 | 34,799,158 |
|
| TOTAL PHILIPPINES | | | 51,489,986 |
|
| Singapore - 2.3% | | | |
| Delfi Ltd. | | 27,497,700 | 25,410,285 |
| Hour Glass Ltd. | | 16,721,600 | 7,665,752 |
|
| TOTAL SINGAPORE | | | 33,076,037 |
|
| South Africa - 4.6% | | | |
| Capitec Bank Holdings Ltd. | | 338,700 | 22,744,615 |
| City Lodge Hotels Ltd. | | 1,869,819 | 16,603,714 |
| Pinnacle Technology Holdings Ltd. | | 2,291,845 | 2,741,980 |
| Remgro Ltd. | | 1,884,436 | 24,292,970 |
|
| TOTAL SOUTH AFRICA | | | 66,383,279 |
|
| Spain - 1.6% | | | |
| Prosegur Cash SA (a) | | 11,742,022 | 23,274,302 |
| Taiwan - 7.6% | | | |
| King's Town Bank | | 1,937,000 | 1,848,754 |
| Poya International Co. Ltd. | | 940,000 | 8,182,361 |
| Taiwan Semiconductor Manufacturing Co. Ltd. | | 9,997,000 | 75,008,878 |
| Voltronic Power Technology Corp. | | 1,491,000 | 24,054,989 |
|
| TOTAL TAIWAN | | | 109,094,982 |
|
| Thailand - 2.2% | | | |
| Kasikornbank PCL (For. Reg.) | | 5,177,400 | 31,148,712 |
| United Kingdom - 6.8% | | | |
| British American Tobacco PLC (South Africa) | | 1,038,168 | 45,298,678 |
| ITE Group PLC | | 18,626,000 | 13,570,419 |
| NMC Health PLC | | 843,887 | 38,098,143 |
|
| TOTAL UNITED KINGDOM | | | 96,967,240 |
|
| United States of America - 1.9% | | | |
| Cognizant Technology Solutions Corp. Class A | | 390,600 | 26,963,118 |
| TOTAL COMMON STOCKS | | | |
| (Cost $1,223,369,835) | | | 1,154,296,965 |
|
| Nonconvertible Preferred Stocks - 1.2% | | | |
| Brazil - 1.2% | | | |
| Banco Bradesco SA (PN) | | | |
| (Cost $16,043,252) | | 1,804,700 | 16,633,403 |
|
| Investment Companies - 4.6% | | | |
| United States of America - 4.6% | | | |
| iShares MSCI India ETF | | 1,615,560 | 48,773,756 |
| WisdomTree India Earnings ETF | | 789,180 | 17,724,983 |
|
| TOTAL UNITED STATES OF AMERICA | | | |
|
| (Cost $71,265,931) | | | 66,498,739 |
|
| Money Market Funds - 7.4% | | | |
| Fidelity Cash Central Fund, 2.23% (c) | | | |
| (Cost $106,553,021) | | 106,531,714 | 106,553,021 |
| TOTAL INVESTMENT IN SECURITIES - 93.9% | | | |
| (Cost $1,417,232,039) | | | 1,343,982,128 |
| NET OTHER ASSETS (LIABILITIES) - 6.1% | | | 87,035,019 |
| NET ASSETS - 100% | | | $1,431,017,147 |
Security Type Abbreviations
ETF – Exchange-Traded Fund
Categorizations in the Schedule of Investments are based on country or territory of incorporation.
Legend
(a) Security exempt from registration under Rule 144A of the Securities Act of 1933. These securities may be resold in transactions exempt from registration, normally to qualified institutional buyers. At the end of the period, the value of these securities amounted to $45,792,198 or 3.2% of net assets.
(b) Non-income producing
(c) Affiliated fund that is generally available only to investment companies and other accounts managed by Fidelity Investments. The rate quoted is the annualized seven-day yield of the fund at period end. A complete unaudited listing of the fund's holdings as of its most recent quarter end is available upon request. In addition, each Fidelity Central Fund's financial statements, which are not covered by the Fund's Report of Independent Registered Public Accounting Firm, are available on the SEC's website or upon request.
Affiliated Central Funds
Information regarding fiscal year to date income earned by the Fund from investments in Fidelity Central Funds is as follows:
| Fund | Income earned |
| Fidelity Cash Central Fund | $106,365 |
| Total | $106,365 |
Amounts in the income column in the above table include any capital gain distributions from underlying funds, which are presented in the corresponding line-item in the Statement of Operations if applicable.
Investment Valuation
The following is a summary of the inputs used, as of October 31, 2018, involving the Fund's assets and liabilities carried at fair value. The inputs or methodology used for valuing securities may not be an indication of the risk associated with investing in those securities. For more information on valuation inputs, and their aggregation into the levels used below, please refer to the Investment Valuation section in the accompanying Notes to Financial Statements.
| | Valuation Inputs at Reporting Date: |
| Description | Total | Level 1 | Level 2 | Level 3 |
| Investments in Securities: | | | | |
| Equities: | | | | |
| Communication Services | $107,284,937 | $24,603,629 | $82,681,308 | $-- |
| Consumer Discretionary | 43,151,717 | 43,151,717 | -- | -- |
| Consumer Staples | 136,518,390 | 136,518,390 | -- | -- |
| Energy | 88,011,741 | 88,011,741 | -- | -- |
| Financials | 427,634,938 | 405,957,510 | 21,677,428 | -- |
| Health Care | 70,981,842 | 70,981,842 | -- | -- |
| Industrials | 123,768,385 | 123,768,385 | -- | -- |
| Information Technology | 141,527,839 | 66,518,961 | 75,008,878 | -- |
| Materials | 173,732 | 173,732 | -- | -- |
| Real Estate | 355,338 | 355,338 | -- | -- |
| Utilities | 31,521,509 | 31,521,509 | -- | -- |
| Investment Companies | 66,498,739 | 66,498,739 | -- | -- |
| Money Market Funds | 106,553,021 | 106,553,021 | -- | -- |
| Total Investments in Securities: | $1,343,982,128 | $1,164,614,514 | $179,367,614 | $-- |
See accompanying notes which are an integral part of the financial statements.
Fidelity® Series Emerging Markets Fund
Financial Statements
Statement of Assets and Liabilities
| | | October 31, 2018 |
| Assets | | |
Investment in securities, at value — See accompanying schedule:
Unaffiliated issuers (cost $1,310,679,018) | $1,237,429,107 | |
| Fidelity Central Funds (cost $106,553,021) | 106,553,021 | |
| Total Investment in Securities (cost $1,417,232,039) | | $1,343,982,128 |
| Foreign currency held at value (cost $1,520,118) | | 1,520,118 |
| Receivable for investments sold | | 3,117,272 |
| Receivable for fund shares sold | | 97,751,012 |
| Dividends receivable | | 542,193 |
| Distributions receivable from Fidelity Central Funds | | 58,708 |
| Receivable from investment adviser for expense reductions | | 26,652 |
| Total assets | | 1,446,998,083 |
| Liabilities | | |
| Payable for investments purchased | $15,722,997 | |
| Payable for fund shares redeemed | 195,327 | |
| Other payables and accrued expenses | 62,612 | |
| Total liabilities | | 15,980,936 |
| Net Assets | | $1,431,017,147 |
| Net Assets consist of: | | |
| Paid in capital | | $1,515,711,943 |
| Total distributable earnings (loss) | | (84,694,796) |
| Net Assets, for 161,391,865 shares outstanding | | $1,431,017,147 |
| Net Asset Value, offering price and redemption price per share ($1,431,017,147 ÷ 161,391,865 shares) | | $8.87 |
See accompanying notes which are an integral part of the financial statements.
Statement of Operations
| | | For the period
August 29, 2018 (commencement of operations) to
October 31, 2018 |
| Investment Income | | |
| Dividends | | $744,564 |
| Interest | | 22 |
| Income from Fidelity Central Funds | | 106,365 |
| Income before foreign taxes withheld | | 850,951 |
| Less foreign taxes withheld | | (43,940) |
| Total income | | 807,011 |
| Expenses | | |
| Custodian fees and expenses | $48,575 | |
| Independent trustees' fees and expenses | 91 | |
| Total expenses before reductions | 48,666 | |
| Expense reductions | (31,938) | |
| Total expenses after reductions | | 16,728 |
| Net investment income (loss) | | 790,283 |
| Realized and Unrealized Gain (Loss) | | |
| Net realized gain (loss) on: | | |
| Investment securities: | | |
| Unaffiliated issuers | (11,595,222) | |
| Foreign currency transactions | (580,869) | |
| Futures contracts | (66,151) | |
| Total net realized gain (loss) | | (12,242,242) |
| Change in net unrealized appreciation (depreciation) on: | | |
| Investment securities: | | |
| Unaffiliated issuers (net of increase in deferred foreign taxes of $14,036) | (73,263,947) | |
| Assets and liabilities in foreign currencies | 21,110 | |
| Total change in net unrealized appreciation (depreciation) | | (73,242,837) |
| Net gain (loss) | | (85,485,079) |
| Net increase (decrease) in net assets resulting from operations | | $(84,694,796) |
See accompanying notes which are an integral part of the financial statements.
Statement of Changes in Net Assets
| | For the period
August 29, 2018 (commencement of operations) to
October 31, 2018 |
| Increase (Decrease) in Net Assets | |
| Operations | |
| Net investment income (loss) | $790,283 |
| Net realized gain (loss) | (12,242,242) |
| Change in net unrealized appreciation (depreciation) | (73,242,837) |
| Net increase (decrease) in net assets resulting from operations | (84,694,796) |
| Share transactions | |
| Proceeds from sales of shares | 2,047,094,795 |
| Cost of shares redeemed | (531,382,852) |
| Net increase (decrease) in net assets resulting from share transactions | 1,515,711,943 |
| Total increase (decrease) in net assets | 1,431,017,147 |
| Net Assets | |
| Beginning of period | – |
| End of period | $1,431,017,147 |
| Other Information | |
| Shares | |
| Sold | 219,660,453 |
| Redeemed | (58,268,588) |
| Net increase (decrease) | 161,391,865 |
See accompanying notes which are an integral part of the financial statements.
Financial Highlights
Fidelity Series Emerging Markets Fund
| | |
| Years ended October 31, | 2018 A |
| Selected Per–Share Data | |
| Net asset value, beginning of period | $10.00 |
| Income from Investment Operations | |
| Net investment income (loss)B | .01 |
| Net realized and unrealized gain (loss) | (1.14) |
| Total from investment operations | (1.13) |
| Net asset value, end of period | $8.87 |
| Total ReturnC,D | (11.30)% |
| Ratios to Average Net AssetsE,F | |
| Expenses before reductions | .04%G |
| Expenses net of fee waivers, if any | .01%G |
| Expenses net of all reductions | .01%G |
| Net investment income (loss) | .65%G |
| Supplemental Data | |
| Net assets, end of period (000 omitted) | $1,431,017 |
| Portfolio turnover rateH | 15%I,J |
A For the period August 29, 2018 (commencement of operations) to October 31, 2018.
B Calculated based on average shares outstanding during the period.
C Total returns for periods of less than one year are not annualized.
D Total returns would have been lower if certain expenses had not been reduced during the applicable periods shown.
E Fees and expenses of any underlying Fidelity Central Funds are not included in the Fund's expense ratio. The Fund indirectly bears its proportionate share of the expenses of any underlying Fidelity Central Funds.
F Expense ratios reflect operating expenses of the Fund. Expenses before reductions do not reflect amounts reimbursed by the investment adviser or reductions from expense offset arrangements and do not represent the amount paid by the Fund during periods when reimbursements or reductions occur. Expense ratios before reductions for start-up periods may not be representative of longer term operating periods. Expenses net of fee waivers reflect expenses after reimbursement by the investment adviser but prior to reductions from expense offset arrangements. Expenses net of all reductions represent the net expenses paid by the Fund.
G Annualized
H Amount does not include the portfolio activity of any underlying Fidelity Central Funds.
I Portfolio turnover rate excludes securities received or delivered in-kind.
J Not annualized
See accompanying notes which are an integral part of the financial statements.
Fidelity® Series Emerging Markets Opportunities Fund
Performance: The Bottom Line
Average annual total return reflects the change in the value of an investment, assuming reinvestment of distributions from dividend income and capital gains (the profits earned upon the sale of securities that have grown in value, if any) and assuming a constant rate of performance each year. The hypothetical investment and the average annual total returns do not reflect the deduction of taxes that a shareholder would pay on fund distributions or the redemption of fund shares. During periods of reimbursement by Fidelity, a fund’s total return will be greater than it would be had the reimbursement not occurred. How a fund did yesterday is no guarantee of how it will do tomorrow.
Average Annual Total Returns
| For the periods ended October 31, 2018 | Past 1 year | Past 5 years | Life of fundA |
| Fidelity® Series Emerging Markets Opportunities Fund | (14.82)% | 1.61% | 8.89% |
A From December 9, 2008
$10,000 Over Life of Fund
Let's say hypothetically that $10,000 was invested in Fidelity® Series Emerging Markets Opportunities Fund on December 9, 2008, when the fund started.
The chart shows how the value of your investment would have changed, and also shows how the MSCI Emerging Markets Index performed over the same period.
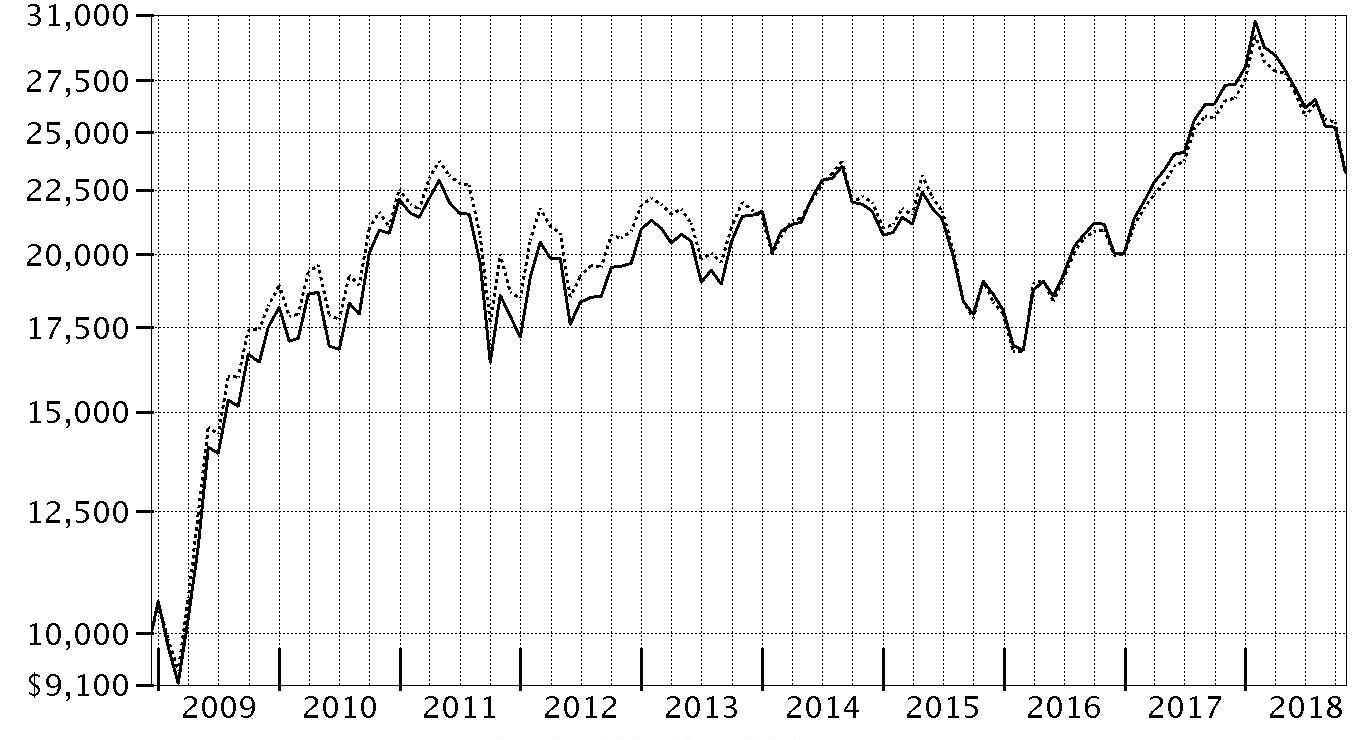
| Period Ending Values |
| $23,234 | Fidelity® Series Emerging Markets Opportunities Fund |
| $23,275 | MSCI Emerging Markets Index |
Fidelity® Series Emerging Markets Opportunities Fund
Management's Discussion of Fund Performance
Market Recap: International equities returned -8.08% for the 12 months ending October 31, 2018, according to the MSCI ACWI (All Country World Index) ex USA Index. A modestly positive first half of the period gave way to a confluence of overwhelmingly negative factors – including escalating trade tension, a surging U.S. dollar, tepid economic growth in Europe, global central bank tightening, concerns about Italy’s budget stalemate with the EU, and weakness in China’s stock market – that yielded a -11% second-half return. The index lost 8% in October alone, its largest monthly drop in more than six years. Among sectors, new-media-infused communications services (-15%) was hit the hardest, while economically sensitive consumer discretionary (-13%), information technology (-12%), financials (-10%), industrials (-9%) and materials (-7%) stocks also fared poorly. Even the more defensive real estate (-9%), utilities (-6%) and consumer staples (-5%) sectors weren’t spared this period. Conversely, elevated crude-oil prices fueled a positive return for energy (+7%), the top-performing sector, followed by the relatively stable-growing health care segment (+2%). Regionally, emerging markets (-12%) fared the worst, hampered by the impact of foreign exchange and concerns about economic weakness in China, India and South Korea. Sluggish growth also pressured shares in continental Europe (-9%). Stocks in Japan (-3%) and the U.K. (-4%) held up better, followed by Canada (-5%) and Asia-Pacific ex Japan (-6%).
Comments from Co-Portfolio Manager James Hayes: For the fiscal year, the fund returned -14.82%, trailing the -12.49% result of the benchmark MSCI Emerging Markets Index. Heightened concerns related to a number of geopolitical and macroeconomic factors weighed heavily on emerging-markets stocks the past 12 months.This made for a challenging environment for security selection, which was the primary detractor from the fund’s performance versus the benchmark. Geographically, our choices in China and India hurt most. By sector, picks among financials and communication services were the biggest negatives versus the benchmark. Timely ownership of online publishing and e-book company China Literature was by far the fund’s biggest relative detractor. The stock, which we avoided early on but bought later, fell amid fresh U.S. tariffs and the corresponding depreciation of the Chinese yuan versus the dollar. Conversely, our cash position of about 2%, on average, this period was a positive. Among active investments, timely positioning in Hon Hai Precision Industry was our biggest individual contributor. We sold our stake in Hon Hai this period, which turned out to be a good call because shares of the electronics contract manufacturer returned about -42% amid technical setbacks for Apples iPhone
® X device, which it helped assemble. The fund also benefited from underweighting large index component Samsung Electronics, which returned roughly -22% the past 12 months.
The views expressed above reflect those of the portfolio manager(s) only through the end of the period as stated on the cover of this report and do not necessarily represent the views of Fidelity or any other person in the Fidelity organization. Any such views are subject to change at any time based upon market or other conditions and Fidelity disclaims any responsibility to update such views. These views may not be relied on as investment advice and, because investment decisions for a Fidelity fund are based on numerous factors, may not be relied on as an indication of trading intent on behalf of any Fidelity fund.
Notes to shareholders: On May 23, 2018, the Board of Trustees approved the fund's name change from Series Emerging Markets Fund to Series Emerging Markets Opportunities Fund. On June 30, 2018, Jane Wu assumed portfolio management responsibilities for the fund's health care sleeve, replacing Tim Gannon. On December 1, 2018, Xiaoting Zhao assumed portfolio management responsibilities for the fund's telecommunication services subportfolio, succeeding James Hayes.
Fidelity® Series Emerging Markets Opportunities Fund
Investment Summary (Unaudited)
Geographic Diversification (% of fund's net assets)
| As of October 31, 2018 |
| | Cayman Islands | 17.4% |
| | Korea (South) | 12.6% |
| | India | 9.5% |
| | Brazil | 9.3% |
| | China | 9.1% |
| | Taiwan | 5.6% |
| | Russia | 5.4% |
| | South Africa | 5.1% |
| | United States of America* | 4.8% |
| | Other | 21.2% |

* Includes Short-Term Investments and Net Other Assets (Liabilities).
Percentages are based on country or territory of incorporation and are adjusted for the effect of futures contracts, if applicable.
Asset Allocation as of October 31, 2018
| | % of fund's net assets |
| Stocks and Equity Futures | 96.3 |
| Short-Term Investments and Net Other Assets (Liabilities) | 3.7 |
Top Ten Stocks as of October 31, 2018
| | % of fund's net assets |
| Tencent Holdings Ltd. (Cayman Islands, Interactive Media & Services) | 4.8 |
| Alibaba Group Holding Ltd. sponsored ADR (Cayman Islands, Internet & Direct Marketing Retail) | 4.1 |
| Taiwan Semiconductor Manufacturing Co. Ltd. (Taiwan, Semiconductors & Semiconductor Equipment) | 3.7 |
| Industrial & Commercial Bank of China Ltd. (H Shares) (China, Banks) | 2.7 |
| Sberbank of Russia (Russia, Banks) | 2.3 |
| Naspers Ltd. Class N (South Africa, Media) | 2.2 |
| Samsung Electronics Co. Ltd. (Korea, Technology Hardware, Storage & Peripherals) | 1.8 |
| Itau Unibanco Holding SA sponsored ADR (Brazil, Banks) | 1.8 |
| ICICI Bank Ltd. sponsored ADR (India, Banks) | 1.6 |
| Reliance Industries Ltd. (India, Oil, Gas & Consumable Fuels) | 1.5 |
| | 26.5 |
Top Market Sectors as of October 31, 2018
| | % of fund's net assets |
| Financials | 24.0 |
| Consumer Discretionary | 15.2 |
| Communication Services | 13.9 |
| Information Technology | 8.7 |
| Energy | 7.9 |
| Materials | 7.8 |
| Consumer Staples | 5.7 |
| Industrials | 4.4 |
| Real Estate | 3.2 |
| Health Care | 2.5 |
Fidelity® Series Emerging Markets Opportunities Fund
Schedule of Investments October 31, 2018
Showing Percentage of Net Assets
| Common Stocks - 88.8% | | | |
| | | Shares | Value |
| Argentina - 0.3% | | | |
| Central Puerto SA sponsored ADR (a) | | 1,109,200 | $10,626,136 |
| Grupo Financiero Galicia SA sponsored ADR | | 365,000 | 8,416,900 |
| Inversiones y Representaciones SA ADR (a) | | 211,387 | 2,826,244 |
| Telecom Argentina SA Class B sponsored ADR (a) | | 624,634 | 11,312,122 |
|
| TOTAL ARGENTINA | | | 33,181,402 |
|
| Australia - 0.1% | | | |
| Frontier Digital Ventures Ltd. (b)(c) | | 16,030,591 | 6,186,874 |
| Bermuda - 1.0% | | | |
| AGTech Holdings Ltd. (b) | | 53,392,000 | 2,757,447 |
| Credicorp Ltd. (United States) | | 272,440 | 61,492,432 |
| GP Investments Ltd. Class A (depositary receipt) (b)(c) | | 7,634,637 | 10,339,533 |
| Pacific Basin Shipping Ltd. | | 89,580,000 | 19,533,636 |
| Shangri-La Asia Ltd. | | 29,262,000 | 39,926,727 |
|
| TOTAL BERMUDA | | | 134,049,775 |
|
| Brazil - 4.1% | | | |
| Azul SA sponsored ADR (b) | | 1,810,300 | 44,135,114 |
| B2W Companhia Global do Varejo (b) | | 7,277,902 | 67,469,466 |
| Banco do Brasil SA | | 6,963,100 | 79,987,243 |
| BR Malls Participacoes SA | | 7,342,600 | 25,057,375 |
| BTG Pactual Participations Ltd. unit | | 4,824,100 | 25,627,424 |
| Companhia de Saneamento de Minas Gerais | | 2,849,770 | 39,283,408 |
| Direcional Engenharia SA (c) | | 12,136,960 | 23,285,743 |
| Equatorial Energia SA | | 350,200 | 6,397,984 |
| Localiza Rent A Car SA | | 6,878,570 | 53,139,564 |
| Natura Cosmeticos SA | | 4,582,600 | 40,130,843 |
| Petrobras Distribuidora SA | | 6,874,800 | 44,298,725 |
| Vale SA sponsored ADR | | 7,375,770 | 111,374,127 |
|
| TOTAL BRAZIL | | | 560,187,016 |
|
| British Virgin Islands - 0.3% | | | |
| Despegar.com Corp. (a)(b) | | 169,016 | 2,716,087 |
| Mail.Ru Group Ltd. GDR (Reg. S) (b) | | 1,520,300 | 40,500,792 |
|
| TOTAL BRITISH VIRGIN ISLANDS | | | 43,216,879 |
|
| Canada - 0.4% | | | |
| Pan American Silver Corp. | | 3,600,900 | 52,861,212 |
| Cayman Islands - 17.4% | | | |
| Airtac International Group | | 3,444,000 | 29,645,064 |
| Alibaba Group Holding Ltd. sponsored ADR (b) | | 3,952,206 | 562,319,870 |
| Ant International Co. Ltd. Class C (d)(e) | | 6,359,848 | 35,678,747 |
| BeiGene Ltd. ADR (b) | | 87,069 | 10,965,470 |
| BizLink Holding, Inc. | | 1,154,617 | 6,153,383 |
| Chailease Holding Co. Ltd. | | 10,200,292 | 29,058,502 |
| China Biologic Products Holdings, Inc. (b) | | 397,900 | 26,436,476 |
| China Literature Ltd. (a)(b)(f) | | 24,584,201 | 132,765,564 |
| China Resources Land Ltd. | | 8,468,000 | 28,723,570 |
| E-House China Enterprise Holdings Ltd. (b) | | 1,862,100 | 3,267,363 |
| ENN Energy Holdings Ltd. | | 2,955,200 | 25,116,722 |
| Haitian International Holdings Ltd. | | 15,285,000 | 29,821,728 |
| JD.com, Inc. sponsored ADR (b) | | 8,317,304 | 195,622,990 |
| Kingsoft Corp. Ltd. (c) | | 72,064,000 | 102,004,017 |
| LexinFintech Holdings Ltd. ADR (a) | | 883,200 | 8,637,696 |
| Meituan Dianping: | | | |
| Class B | | 1,411,900 | 9,128,256 |
| Class B | | 7,577,282 | 44,089,975 |
| Momo, Inc. ADR (b) | | 1,820,500 | 61,114,185 |
| NetEase, Inc. ADR | | 752,900 | 156,490,265 |
| PPDAI Group, Inc. ADR (a)(b) | | 1,478,100 | 8,439,951 |
| Shenzhou International Group Holdings Ltd. | | 7,937,000 | 87,649,653 |
| Shimao Property Holdings Ltd. | | 6,032,500 | 11,800,451 |
| TAL Education Group ADR (b) | | 456,410 | 13,226,762 |
| Tencent Holdings Ltd. | | 18,984,999 | 650,412,087 |
| Uni-President China Holdings Ltd. | | 67,893,000 | 65,884,854 |
| Wise Talent Information Technology Co. Ltd. (b) | | 5,960,803 | 19,497,012 |
| Zai Lab Ltd. ADR (a)(b) | | 689,300 | 11,276,948 |
|
| TOTAL CAYMAN ISLANDS | | | 2,365,227,561 |
|
| Chile - 0.6% | | | |
| Compania Cervecerias Unidas SA sponsored ADR | | 755,200 | 18,932,864 |
| Vina Concha y Toro SA | | 34,096,719 | 64,175,835 |
|
| TOTAL CHILE | | | 83,108,699 |
|
| China - 9.1% | | | |
| BBMG Corp. (H Shares) (a) | | 92,390,500 | 25,448,196 |
| China International Travel Service Corp. Ltd. (A Shares) | | 8,423,532 | 64,821,945 |
| China Life Insurance Co. Ltd. (H Shares) | | 38,001,900 | 76,148,148 |
| China Longyuan Power Grid Corp. Ltd. (H Shares) | | 77,344,810 | 58,783,219 |
| China Oilfield Services Ltd. (H Shares) | | 53,054,000 | 49,725,757 |
| China Pacific Insurance (Group) Co. Ltd. (H Shares) | | 13,591,494 | 50,608,793 |
| China Petroleum & Chemical Corp. (H Shares) | | 123,670,000 | 100,738,647 |
| China Telecom Corp. Ltd. (H Shares) | | 71,426,882 | 33,700,733 |
| China Tower Corp. Ltd. Class H | | 73,152,000 | 11,100,668 |
| Hangzhou Tigermed Consulting Co. Ltd. Class A | | 4,275,800 | 26,118,260 |
| Industrial & Commercial Bank of China Ltd. (H Shares) | | 548,990,400 | 372,475,196 |
| PICC Property & Casualty Co. Ltd. (H Shares) | | 40,523,750 | 39,273,459 |
| Ping An Insurance (Group) Co. of China Ltd. (H Shares) | | 14,837,000 | 139,724,488 |
| Qingdao Haier Co. Ltd. | | 18,099,223 | 32,848,002 |
| Shanghai International Airport Co. Ltd. (A Shares) | | 6,141,632 | 43,625,736 |
| Sinopec Engineering Group Co. Ltd. (H Shares) | | 25,663,000 | 23,856,728 |
| Sinopharm Group Co. Ltd. (H Shares) | | 6,823,200 | 32,889,391 |
| Tonghua Dongbao Pharmaceutical Co. Ltd. Class A | | 6,065,388 | 11,634,026 |
| Tsingtao Brewery Co. Ltd. (H Shares) | | 9,260,000 | 36,546,650 |
| Zhengzhou Yutong Bus Co. Ltd. | | 7,390,951 | 11,294,652 |
|
| TOTAL CHINA | | | 1,241,362,694 |
|
| Egypt - 0.0% | | | |
| Six of October Development & Investment Co. (b) | | 3,754,600 | 3,121,849 |
| Greece - 0.5% | | | |
| Titan Cement Co. SA (Reg.) | | 3,321,900 | 73,143,973 |
| Hong Kong - 3.2% | | | |
| AIA Group Ltd. | | 2,714,800 | 20,546,341 |
| China Everbright International Ltd. | | 23,265,000 | 18,542,104 |
| China Overseas Land and Investment Ltd. | | 26,547,000 | 83,108,009 |
| China Resources Beer Holdings Co. Ltd. | | 17,888,666 | 62,161,344 |
| China Resources Power Holdings Co. Ltd. | | 11,086,397 | 19,481,194 |
| China Unicom Ltd. | | 22,293,000 | 23,317,339 |
| China Unicom Ltd. sponsored ADR | | 4,658,200 | 48,585,026 |
| CNOOC Ltd. | | 69,036,000 | 117,566,923 |
| Far East Horizon Ltd. | | 46,183,750 | 44,758,829 |
|
| TOTAL HONG KONG | | | 438,067,109 |
|
| India - 9.5% | | | |
| Adani Ports & Special Economic Zone Ltd. (b) | | 11,152,681 | 48,080,480 |
| Axis Bank Ltd. (b) | | 10,548,664 | 83,065,737 |
| Axis Bank Ltd. GDR (Reg. S) (b) | | 109,427 | 4,311,424 |
| Bharat Petroleum Corp. Ltd. | | 58,400 | 217,223 |
| Bharti Airtel Ltd. | | 3,008,392 | 11,891,609 |
| Bharti Infratel Ltd. | | 2,443,382 | 8,895,087 |
| Federal Bank Ltd. | | 30,186,626 | 33,774,247 |
| Future Retail Ltd. | | 1,592,165 | 10,530,118 |
| GAIL India Ltd. | | 1,171,500 | 5,927,986 |
| ICICI Bank Ltd. | | 8,134,528 | 39,007,914 |
| ICICI Bank Ltd. sponsored ADR | | 18,911,806 | 179,473,039 |
| IndoStar Capital Finance Ltd. | | 2,148,896 | 8,764,393 |
| Indraprastha Gas Ltd. | | 9,878,923 | 35,703,571 |
| ITC Ltd. | | 21,174,454 | 80,191,517 |
| JK Cement Ltd. (b) | | 2,645,731 | 24,062,344 |
| Larsen & Toubro Ltd. | | 3,660,044 | 64,209,128 |
| LIC Housing Finance Ltd. | | 14,197,776 | 78,917,059 |
| Lupin Ltd. (b) | | 3,837,754 | 45,945,637 |
| Manappuram General Finance & Leasing Ltd. | | 28,123,319 | 30,382,006 |
| NTPC Ltd. | | 4,906,473 | 10,591,109 |
| Oberoi Realty Ltd. | | 4,467,941 | 25,574,673 |
| Petronet LNG Ltd. | | 8,807,580 | 26,877,647 |
| Phoenix Mills Ltd. | | 3,624,338 | 27,118,830 |
| Power Grid Corp. of India Ltd. | | 13,879,646 | 34,896,162 |
| Reliance Industries Ltd. | | 14,066,221 | 201,835,817 |
| SREI Infrastructure Finance Ltd. (c) | | 34,355,610 | 15,352,257 |
| State Bank of India (b) | | 15,769,044 | 59,997,417 |
| Sun Pharmaceutical Industries Ltd. | | 7,240,084 | 56,801,768 |
| Tejas Networks Ltd. (b)(f) | | 950,220 | 3,258,191 |
| Torrent Pharmaceuticals Ltd. | | 1,808,625 | 40,779,652 |
|
| TOTAL INDIA | | | 1,296,434,042 |
|
| Indonesia - 2.3% | | | |
| PT Astra International Tbk | | 137,178,700 | 71,285,100 |
| PT Bank Mandiri (Persero) Tbk | | 128,175,800 | 57,592,157 |
| PT Bank Rakyat Indonesia Tbk | | 497,698,600 | 103,124,525 |
| PT Media Nusantara Citra Tbk | | 500,345,100 | 25,671,382 |
| PT Semen Gresik (Persero) Tbk | | 16,060,200 | 9,507,765 |
| PT Telekomunikasi Indonesia Tbk: | | | |
| Series B | | 141,981,800 | 35,967,433 |
| sponsored ADR (a) | | 401,000 | 10,105,200 |
|
| TOTAL INDONESIA | | | 313,253,562 |
|
| Israel - 0.3% | | | |
| Bezeq The Israel Telecommunication Corp. Ltd. | | 30,805,199 | 35,427,407 |
| Italy - 0.4% | | | |
| Prada SpA | | 14,282,911 | 50,451,308 |
| Japan - 0.4% | | | |
| GMO Internet, Inc. | | 197,300 | 2,818,696 |
| LINE Corp. (a)(b) | | 537,600 | 17,139,723 |
| Panasonic Corp. | | 1,646,900 | 17,673,635 |
| SoftBank Corp. | | 195,700 | 15,487,467 |
| Yume No Machi Souzou Iinkai Co. Ltd. | | 228,100 | 4,750,609 |
|
| TOTAL JAPAN | | | 57,870,130 |
|
| Korea (South) - 10.9% | | | |
| AMOREPACIFIC Group, Inc. | | 854,869 | 46,527,051 |
| BS Financial Group, Inc. | | 15,231,581 | 101,321,385 |
| Cafe24 Corp. (b) | | 70,100 | 6,788,826 |
| Daou Technology, Inc. | | 2,206,663 | 38,679,457 |
| Hanon Systems | | 3,422,898 | 32,849,021 |
| Hyundai Fire & Marine Insurance Co. Ltd. | | 898,985 | 32,933,894 |
| Hyundai Mobis | | 936,072 | 155,875,267 |
| Iljin Materials Co. Ltd. | | 475,383 | 18,936,159 |
| InterPark INT Corp. | | 1,389,788 | 5,925,783 |
| KB Financial Group, Inc. | | 3,222,425 | 134,024,853 |
| KEPCO Plant Service & Engineering Co. Ltd. | | 200,565 | 4,833,950 |
| Korea Electric Power Corp. | | 609,185 | 14,532,782 |
| Korea Electric Power Corp. sponsored ADR | | 110,500 | 1,321,580 |
| LG Chemical Ltd. | | 294,328 | 89,510,794 |
| LG Corp. | | 893,210 | 51,901,685 |
| NAVER Corp. | | 247,660 | 24,852,822 |
| NCSOFT Corp. | | 126,943 | 47,784,416 |
| POSCO | | 330,176 | 75,478,923 |
| S-Oil Corp. | | 410,560 | 44,618,265 |
| Samsung Biologics Co. Ltd. (b)(f) | | 115,100 | 39,089,614 |
| Samsung Electronics Co. Ltd. | | 4,412,468 | 163,969,012 |
| Samsung Life Insurance Co. Ltd. | | 423,955 | 34,183,926 |
| Samsung SDI Co. Ltd. | | 486,424 | 100,396,890 |
| Shinhan Financial Group Co. Ltd. | | 3,260,685 | 121,292,604 |
| SK Hynix, Inc. | | 1,173,934 | 70,168,535 |
| SK Telecom Co. Ltd. | | 59,220 | 13,896,682 |
| SK Telecom Co. Ltd. sponsored ADR | | 540,989 | 14,017,025 |
|
| TOTAL KOREA (SOUTH) | | | 1,485,711,201 |
|
| Luxembourg - 0.7% | | | |
| Samsonite International SA | | 34,041,900 | 97,672,486 |
| Malaysia - 0.1% | | | |
| British American Tobacco (Malaysia) Bhd | | 909,600 | 6,760,320 |
| Mauritius - 0.1% | | | |
| MakeMyTrip Ltd. (a)(b) | | 459,196 | 11,383,469 |
| Mexico - 2.8% | | | |
| America Movil S.A.B. de CV Series L sponsored ADR | | 4,185,500 | 60,229,345 |
| Fibra Uno Administracion SA de CV | | 34,479,000 | 37,053,478 |
| Gruma S.A.B. de CV Series B | | 5,544,700 | 57,867,471 |
| Grupo Aeroportuario del Pacifico S.A.B. de CV Series B | | 3,750,900 | 31,030,916 |
| Grupo Financiero Banorte S.A.B. de CV Series O | | 13,176,418 | 72,494,381 |
| Macquarie Mexican (REIT) (c)(f) | | 39,842,248 | 38,796,336 |
| Wal-Mart de Mexico SA de CV Series V | | 31,550,400 | 80,579,659 |
|
| TOTAL MEXICO | | | 378,051,586 |
|
| Netherlands - 0.6% | | | |
| VEON Ltd. sponsored ADR (a) | | 8,438,220 | 23,711,398 |
| Yandex NV Series A (b) | | 2,026,912 | 61,070,859 |
|
| TOTAL NETHERLANDS | | | 84,782,257 |
|
| Nigeria - 0.5% | | | |
| Guaranty Trust Bank PLC | | 99,017,561 | 10,229,087 |
| Guaranty Trust Bank PLC GDR (Reg. S) | | 3,878,704 | 19,781,390 |
| Transnational Corp. of Nigeria PLC | | 1,097,537,662 | 3,991,046 |
| Zenith Bank PLC | | 542,385,593 | 35,113,117 |
|
| TOTAL NIGERIA | | | 69,114,640 |
|
| Pakistan - 0.1% | | | |
| Habib Bank Ltd. | | 14,401,100 | 15,845,290 |
| Panama - 0.3% | | | |
| Copa Holdings SA Class A | | 525,500 | 38,061,965 |
| Peru - 0.7% | | | |
| Compania de Minas Buenaventura SA sponsored ADR | | 7,155,600 | 99,033,504 |
| Philippines - 0.8% | | | |
| Metro Pacific Investments Corp. | | 262,848,000 | 23,610,427 |
| Metropolitan Bank & Trust Co. | | 42,016,022 | 51,540,136 |
| Robinsons Land Corp. | | 64,584,431 | 25,320,355 |
|
| TOTAL PHILIPPINES | | | 100,470,918 |
|
| Russia - 5.4% | | | |
| Lukoil PJSC sponsored ADR | | 2,011,400 | 150,251,580 |
| MMC Norilsk Nickel PJSC sponsored ADR | | 4,233,400 | 70,189,772 |
| Mobile TeleSystems OJSC | | 4,306,020 | 16,888,802 |
| Mobile TeleSystems OJSC sponsored ADR | | 2,435,600 | 19,509,156 |
| NOVATEK OAO GDR (Reg. S) | | 535,100 | 90,699,450 |
| RusHydro PJSC | | 100 | 1 |
| Sberbank of Russia | | 45,971,150 | 132,134,209 |
| Sberbank of Russia sponsored ADR | | 15,297,494 | 180,510,429 |
| Tatneft PAO | | 4,072,700 | 48,496,190 |
| Unipro PJSC | | 692,252,196 | 28,457,754 |
|
| TOTAL RUSSIA | | | 737,137,343 |
|
| Singapore - 0.3% | | | |
| Ascendas Real Estate Investment Trust | | 7,710,900 | 14,028,421 |
| First Resources Ltd. | | 26,689,700 | 30,444,158 |
|
| TOTAL SINGAPORE | | | 44,472,579 |
|
| South Africa - 5.1% | | | |
| Barclays Africa Group Ltd. | | 10,244,153 | 103,542,156 |
| Bidvest Group Ltd. | | 3,655,145 | 45,531,672 |
| FirstRand Ltd. | | 14,065,100 | 61,313,444 |
| Impala Platinum Holdings Ltd. (b) | | 465,800 | 858,821 |
| Imperial Holdings Ltd. | | 5,676,900 | 62,689,292 |
| Mondi Ltd. | | 246,600 | 5,898,675 |
| Mr Price Group Ltd. | | 2,257,500 | 35,344,164 |
| MTN Group Ltd. | | 3,096,700 | 17,947,321 |
| Naspers Ltd. Class N | | 1,682,900 | 295,761,476 |
| Sasol Ltd. | | 2,039,000 | 66,634,450 |
|
| TOTAL SOUTH AFRICA | | | 695,521,471 |
|
| Taiwan - 5.6% | | | |
| Chroma ATE, Inc. | | 3,542,000 | 12,412,816 |
| King's Town Bank | | 24,223,000 | 23,119,447 |
| LandMark Optoelectronics Corp. | | 2,234,446 | 14,831,112 |
| Largan Precision Co. Ltd. | | 363,900 | 39,374,849 |
| Nanya Technology Corp. | | 8,074,000 | 13,404,293 |
| PChome Online, Inc. (b) | | 1,432,613 | 6,524,392 |
| Taiwan Semiconductor Manufacturing Co. Ltd. | | 57,749,284 | 433,300,888 |
| Taiwan Semiconductor Manufacturing Co. Ltd. sponsored ADR | | 1,888,801 | 71,963,318 |
| Unified-President Enterprises Corp. | | 53,480,000 | 129,379,435 |
| United Microelectronics Corp. | | 55,020,000 | 20,955,259 |
|
| TOTAL TAIWAN | | | 765,265,809 |
|
| Thailand - 1.4% | | | |
| PTT Global Chemical PCL (For. Reg.) | | 31,026,800 | 72,280,467 |
| Siam Cement PCL (For. Reg.) | | 7,183,500 | 90,551,960 |
| Total Access Communication PCL (For. Reg.) | | 21,853,100 | 31,303,445 |
|
| TOTAL THAILAND | | | 194,135,872 |
|
| Turkey - 0.8% | | | |
| Aselsan A/S | | 6,197,700 | 28,008,069 |
| Tupras Turkiye Petrol Rafinerileri A/S | | 2,697,296 | 63,552,648 |
| Turkcell Iletisim Hizmet A/S | | 3,340,065 | 6,782,192 |
| Turkcell Iletisim Hizmet A/S sponsored ADR (a) | | 1,602,000 | 8,266,320 |
|
| TOTAL TURKEY | | | 106,609,229 |
|
| United Arab Emirates - 1.2% | | | |
| DP World Ltd. | | 2,352,370 | 42,319,136 |
| Emaar Properties PJSC | | 49,276,232 | 68,417,784 |
| National Bank of Abu Dhabi PJSC | | 13,254,180 | 49,868,034 |
|
| TOTAL UNITED ARAB EMIRATES | | | 160,604,954 |
|
| United Kingdom - 0.8% | | | |
| Contemporary Amperex Technology Co. Ltd. ELS (UBS Bank Warrant Program) Class A warrants 6/24/19 (b)(f) | | 1,861,600 | 19,881,903 |
| Fresnillo PLC | | 3,465,800 | 37,592,857 |
| NMC Health PLC | | 943,509 | 42,595,680 |
| Tonghua Dongbao Pharmaceutical Co. Ltd. ELS (UBS Bank Warrant Program) Class A warrants 3/26/19 (b) | | 6,531,171 | 12,527,444 |
|
| TOTAL UNITED KINGDOM | | | 112,597,884 |
|
| United States of America - 0.5% | | | |
| Arco Platform Ltd. Class A | | 1,700 | 36,227 |
| MercadoLibre, Inc. | | 175,050 | 56,803,725 |
| Uxin Ltd. ADR (a)(b) | | 1,727,419 | 9,397,159 |
|
| TOTAL UNITED STATES OF AMERICA | | | 66,237,111 |
|
| Vietnam - 0.2% | | | |
| Vietnam Technological & Commercial Joint Stock Bank (b) | | 16,417,800 | 18,917,514 |
| TOTAL COMMON STOCKS | | | |
| (Cost $11,265,874,481) | | | 12,075,538,894 |
|
| Nonconvertible Preferred Stocks - 6.9% | | | |
| Brazil - 5.2% | | | |
| Ambev SA sponsored ADR | | 12,080,200 | 52,307,266 |
| Banco do Estado Rio Grande do Sul SA | | 6,006,886 | 32,056,095 |
| Companhia Paranaense de Energia-Copel: | | | |
| (PN-B) | | 95,800 | 675,221 |
| (PN-B) sponsored ADR (a) | | 6,054,839 | 42,444,421 |
| Fibria Celulose SA sponsored ADR | | 4,726,500 | 90,796,065 |
| Itau Unibanco Holding SA sponsored ADR | | 18,158,144 | 239,142,756 |
| Metalurgica Gerdau SA (PN) | | 24,975,622 | 53,286,696 |
| Petroleo Brasileiro SA - Petrobras (PN) sponsored ADR (non-vtg.) | | 10,930,400 | 161,988,528 |
| Telefonica Brasil SA | | 2,270,500 | 26,368,671 |
| TIM Participacoes SA sponsored ADR | | 902,400 | 13,960,128 |
|
| TOTAL BRAZIL | | | 713,025,847 |
|
| Korea (South) - 1.7% | | | |
| Hyundai Motor Co. Series 2 | | 1,636,131 | 101,523,291 |
| Samsung Electronics Co. Ltd. | | 2,716,322 | 85,108,248 |
| Samsung Fire & Marine Insurance Co. Ltd. | | 252,851 | 39,445,642 |
|
| TOTAL KOREA (SOUTH) | | | 226,077,181 |
|
| TOTAL NONCONVERTIBLE PREFERRED STOCKS | | | |
| (Cost $699,823,855) | | | 939,103,028 |
| | | Principal Amount | Value |
|
| Government Obligations - 0.1% | | | |
| United States of America - 0.1% | | | |
| U.S. Treasury Bills, yield at date of purchase 2.07% to 2.17% 11/23/18 to 12/27/18(g) | | | |
| (Cost $15,114,679) | | 15,150,000 | 15,113,762 |
| | | Shares | Value |
|
| Money Market Funds - 4.7% | | | |
| Fidelity Cash Central Fund, 2.23% (h) | | 578,551,332 | 578,667,042 |
| Fidelity Securities Lending Cash Central Fund 2.23% (h)(i) | | 50,631,834 | 50,636,897 |
| TOTAL MONEY MARKET FUNDS | | | |
| (Cost $629,303,939) | | | 629,303,939 |
| TOTAL INVESTMENT IN SECURITIES - 100.5% | | | |
| (Cost $12,610,116,954) | | | 13,659,059,623 |
| NET OTHER ASSETS (LIABILITIES) - (0.5)% | | | (61,250,237) |
| NET ASSETS - 100% | | | $13,597,809,386 |
| Futures Contracts | | | | | |
| | Number of contracts | Expiration Date | Notional Amount | Value | Unrealized Appreciation/(Depreciation) |
| Purchased | | | | | |
| Equity Index Contracts | | | | | |
| ICE E-mini MSCI Emerging Markets Index Contracts (United States) | 1,590 | Dec. 2018 | $76,057,650 | $(5,261,593) | $(5,261,593) |
The notional amount of futures purchased as a percentage of Net Assets is 0.6%
Security Type Abbreviations
ELS – Equity-Linked Security
Categorizations in the Schedule of Investments are based on country or territory of incorporation.
Legend
(a) Security or a portion of the security is on loan at period end.
(b) Non-income producing
(c) Affiliated company
(d) Restricted securities - Investment in securities not registered under the Securities Act of 1933 (excluding 144A issues). At the end of the period, the value of restricted securities (excluding 144A issues) amounted to $35,678,747 or 0.3% of net assets.
(e) Level 3 security
(f) Security exempt from registration under Rule 144A of the Securities Act of 1933. These securities may be resold in transactions exempt from registration, normally to qualified institutional buyers. At the end of the period, the value of these securities amounted to $233,791,608 or 1.7% of net assets.
(g) Security or a portion of the security was pledged to cover margin requirements for futures contracts. At period end, the value of securities pledged amounted to $4,361,230.
(h) Affiliated fund that is generally available only to investment companies and other accounts managed by Fidelity Investments. The rate quoted is the annualized seven-day yield of the fund at period end. A complete unaudited listing of the fund's holdings as of its most recent quarter end is available upon request. In addition, each Fidelity Central Fund's financial statements, which are not covered by the Fund's Report of Independent Registered Public Accounting Firm, are available on the SEC's website or upon request.
(i) Investment made with cash collateral received from securities on loan.
Additional information on each restricted holding is as follows:
| Security | Acquisition Date | Acquisition Cost |
| Ant International Co. Ltd. Class C | 5/16/18 | $35,678,747 |
Affiliated Central Funds
Information regarding fiscal year to date income earned by the Fund from investments in Fidelity Central Funds is as follows:
| Fund | Income earned |
| Fidelity Cash Central Fund | $6,283,884 |
| Fidelity Securities Lending Cash Central Fund | 1,830,805 |
| Total | $8,114,689 |
Amounts in the income column in the above table include any capital gain distributions from underlying funds, which are presented in the corresponding line-item in the Statement of Operations if applicable.
Other Affiliated Issuers
An affiliated company is a company in which the Fund has ownership of at least 5% of the voting securities. Fiscal year to date transactions with companies which are or were affiliates are as follows:
| Affiliate | Value, beginning of period | Purchases | Sales Proceeds | Dividend Income | Realized Gain (loss) | Change in Unrealized appreciation (depreciation) | Value, end of period |
| B2W Companhia Global do Varejo | $176,861,949 | $5,410,142 | $138,685,217 | $-- | $59,076,734 | $(35,194,142) | $-- |
| Daou Technology, Inc. | 49,992,717 | -- | 19,013,095 | 709,232 | 1,242,085 | 6,457,750 | -- |
| Direcional Engenharia SA | 24,131,764 | 1,655,732 | 3,964,177 | 1,863,421 | (755,012) | 2,217,436 | 23,285,743 |
| Frontier Digital Ventures Ltd. | 7,489,111 | 1,210,272 | 822,054 | -- | 252,722 | (1,943,177) | 6,186,874 |
| GP Investments Ltd. Class A (depositary receipt) | 13,652,868 | -- | -- | -- | -- | (3,313,335) | 10,339,533 |
| InterPark INT Corp. | 25,671,882 | -- | 10,389,787 | 358,643 | (19,724,072) | 10,367,760 | -- |
| Kingsoft Corp. Ltd. | -- | 187,856,005 | -- | 508,628 | -- | (85,851,988) | 102,004,017 |
| Macquarie Mexican (REIT) | 73,579,884 | 1,754,187 | 25,588,649 | 3,721,540 | (14,770,594) | 3,821,508 | 38,796,336 |
| SREI Infrastructure Finance Ltd. | 60,858,509 | -- | -- | 249,932 | -- | (45,506,252) | 15,352,257 |
| Total | $432,238,684 | $197,886,338 | $198,462,979 | $7,411,396 | $25,321,863 | $(148,944,440) | $195,964,760 |
Investment Valuation
The following is a summary of the inputs used, as of October 31, 2018, involving the Fund's assets and liabilities carried at fair value. The inputs or methodology used for valuing securities may not be an indication of the risk associated with investing in those securities. For more information on valuation inputs, and their aggregation into the levels used below, please refer to the Investment Valuation section in the accompanying Notes to Financial Statements.
| | Valuation Inputs at Reporting Date: |
| Description | Total | Level 1 | Level 2 | Level 3 |
| Investments in Securities: | | | | |
| Equities: | | | | |
| Communication Services | $1,868,367,915 | $1,095,258,382 | $773,109,533 | $-- |
| Consumer Discretionary | 2,062,033,385 | 2,000,269,775 | 61,763,610 | -- |
| Consumer Staples | 771,889,267 | 771,889,267 | -- | -- |
| Energy | 1,056,568,675 | 838,263,105 | 218,305,570 | -- |
| Financials | 3,272,806,130 | 2,307,721,702 | 965,084,428 | -- |
| Health Care | 344,532,922 | 344,532,922 | -- | -- |
| Industrials | 633,724,710 | 633,724,710 | -- | -- |
| Information Technology | 1,188,084,536 | 733,828,389 | 454,256,147 | -- |
| Materials | 1,048,510,601 | 906,397,228 | 142,113,373 | -- |
| Real Estate | 429,893,485 | 394,214,738 | -- | 35,678,747 |
| Utilities | 338,230,296 | 323,697,514 | 14,532,782 | -- |
| Government Obligations | 15,113,762 | -- | 15,113,762 | -- |
| Money Market Funds | 629,303,939 | 629,303,939 | -- | -- |
| Total Investments in Securities: | $13,659,059,623 | $10,979,101,671 | $2,644,279,205 | $35,678,747 |
| Derivative Instruments: | | | | |
| Liabilities | | | | |
| Futures Contracts | $(5,261,593) | $(5,261,593) | $-- | $-- |
| Total Liabilities | $(5,261,593) | $(5,261,593) | $-- | $-- |
| Total Derivative Instruments: | $(5,261,593) | $(5,261,593) | $-- | $-- |
The following is a summary of transfers between Level 1 and Level 2 for the period ended October 31, 2018. Transfers are assumed to have occurred at the beginning of the period, and are primarily attributable to the valuation techniques used for foreign equity securities, as discussed in the accompanying Notes to Financial Statements:
| Transfers | Total |
| Level 1 to Level 2 | $348,334,799 |
| Level 2 to Level 1 | $959,514 |
Value of Derivative Instruments
The following table is a summary of the Fund's value of derivative instruments by primary risk exposure as of October 31, 2018. For additional information on derivative instruments, please refer to the Derivative Instruments section in the accompanying Notes to Financial Statements.
| Primary Risk Exposure / Derivative Type | Value |
| | Asset | Liability |
| Equity Risk | | |
| Futures Contracts(a) | $0 | $(5,261,593) |
| Total Equity Risk | 0 | (5,261,593) |
| Total Value of Derivatives | $0 | $(5,261,593) |
(a) Reflects gross cumulative appreciation (depreciation) on futures contracts as presented in the Schedule of Investments. In the Statement of Assets and Liabilities, the period end daily variation margin is included in receivable or payable for daily variation margin on futures contracts, and the net cumulative appreciation (depreciation) is included in net unrealized appreciation (depreciation).
See accompanying notes which are an integral part of the financial statements.
Fidelity® Series Emerging Markets Opportunities Fund
Financial Statements
Statement of Assets and Liabilities
| | | October 31, 2018 |
| Assets | | |
Investment in securities, at value (including securities loaned of $49,450,924) — See accompanying schedule:
Unaffiliated issuers (cost $11,666,264,865) | $12,833,790,924 | |
| Fidelity Central Funds (cost $629,303,939) | 629,303,939 | |
| Other affiliated issuers (cost $314,548,150) | 195,964,760 | |
| Total Investment in Securities (cost $12,610,116,954) | | $13,659,059,623 |
| Foreign currency held at value (cost $8,375,646) | | 8,372,278 |
| Receivable for investments sold | | 99,556,543 |
| Receivable for fund shares sold | | 182,981,115 |
| Dividends receivable | | 9,455,574 |
| Distributions receivable from Fidelity Central Funds | | 1,021,110 |
| Receivable for daily variation margin on futures contracts | | 874,500 |
| Receivable from investment adviser for expense reductions | | 654,990 |
| Other receivables | | 2,740,525 |
| Total assets | | 13,964,716,258 |
| Liabilities | | |
| Payable to custodian bank | $1,704,805 | |
| Payable for investments purchased | 306,407,882 | |
| Payable for fund shares redeemed | 4,994,779 | |
| Other payables and accrued expenses | 3,174,232 | |
| Collateral on securities loaned | 50,625,174 | |
| Total liabilities | | 366,906,872 |
| Net Assets | | $13,597,809,386 |
| Net Assets consist of: | | |
| Paid in capital | | $11,573,566,996 |
| Total distributable earnings (loss) | | 2,024,242,390 |
| Net Assets | | $13,597,809,386 |
| Net Asset Value and Maximum Offering Price | | |
| Net Asset Value, offering price and redemption price per share ($13,597,809,386 ÷ 770,093,403 shares) | | $17.66 |
See accompanying notes which are an integral part of the financial statements.
Statement of Operations
| | | Year ended October 31, 2018 |
| Investment Income | | |
| Dividends (including $7,411,396 earned from other affiliated issuers) | | $355,409,522 |
| Interest | | 185,861 |
| Income from Fidelity Central Funds | | 8,114,689 |
| Income before foreign taxes withheld | | 363,710,072 |
| Less foreign taxes withheld | | (40,246,635) |
| Total income | | 323,463,437 |
| Expenses | | |
| Custodian fees and expenses | $7,693,665 | |
| Independent trustees' fees and expenses | 74,745 | |
| Interest | 15,870 | |
| Commitment fees | 41,401 | |
| Total expenses before reductions | 7,825,681 | |
| Expense reductions | (5,609,850) | |
| Total expenses after reductions | | 2,215,831 |
| Net investment income (loss) | | 321,247,606 |
| Realized and Unrealized Gain (Loss) | | |
| Net realized gain (loss) on: | | |
| Investment securities: | | |
| Unaffiliated issuers | 843,046,463 | |
| Fidelity Central Funds | 27 | |
| Other affiliated issuers | 25,321,863 | |
| Foreign currency transactions | (9,310,355) | |
| Futures contracts | (31,377,745) | |
| Total net realized gain (loss) | | 827,680,253 |
| Change in net unrealized appreciation (depreciation) on: | | |
| Investment securities: | | |
| Unaffiliated issuers (net of decrease in deferred foreign taxes of $30,988,222) | (3,176,732,055) | |
| Fidelity Central Funds | (474) | |
| Other affiliated issuers | (148,944,440) | |
| Assets and liabilities in foreign currencies | (807,892) | |
| Futures contracts | (5,261,593) | |
| Total change in net unrealized appreciation (depreciation) | | (3,331,746,454) |
| Net gain (loss) | | (2,504,066,201) |
| Net increase (decrease) in net assets resulting from operations | | $(2,182,818,595) |
See accompanying notes which are an integral part of the financial statements.
Statement of Changes in Net Assets
| | Year ended October 31, 2018 | Year ended October 31, 2017 |
| Increase (Decrease) in Net Assets | | |
| Operations | | |
| Net investment income (loss) | $321,247,606 | $267,130,789 |
| Net realized gain (loss) | 827,680,253 | 1,483,007,190 |
| Change in net unrealized appreciation (depreciation) | (3,331,746,454) | 2,448,297,246 |
| Net increase (decrease) in net assets resulting from operations | (2,182,818,595) | 4,198,435,225 |
| Distributions to shareholders | (442,387,354) | – |
| Distributions to shareholders from net investment income | – | (193,538,453) |
| Distributions to shareholders from net realized gain | – | (33,641,199) |
| Total distributions | (442,387,354) | (227,179,652) |
| Share transactions - net increase (decrease) | 475,568,607 | (3,684,478,975) |
| Total increase (decrease) in net assets | (2,149,637,342) | 286,776,598 |
| Net Assets | | |
| Beginning of period | 15,747,446,728 | 15,460,670,130 |
| End of period | $13,597,809,386 | $15,747,446,728 |
| Other Information | | |
| Undistributed net investment income end of period | | $225,392,623 |
See accompanying notes which are an integral part of the financial statements.
Financial Highlights
Fidelity Series Emerging Markets Opportunities Fund
| Years ended October 31, | 2018 | 2017 | 2016 | 2015 | 2014 |
| Selected Per–Share Data | | | | | |
| Net asset value, beginning of period | $21.35 | $16.79 | $15.31 | $17.77 | $17.56 |
| Income from Investment Operations | | | | | |
| Net investment income (loss)A | .45 | .30 | .19 | .21B | .21 |
| Net realized and unrealized gain (loss) | (3.52) | 4.49 | 1.47 | (2.53) | .17 |
| Total from investment operations | (3.07) | 4.79 | 1.66 | (2.32) | .38 |
| Distributions from net investment income | (.39) | (.19) | (.18) | (.14) | (.17) |
| Distributions from net realized gain | (.23) | (.04) | – | – | (.01) |
| Total distributions | (.62) | (.23) | (.18) | (.14) | (.17)C |
| Net asset value, end of period | $17.66 | $21.35 | $16.79 | $15.31 | $17.77 |
| Total ReturnD | (14.82)% | 29.04% | 11.02% | (13.14)% | 2.20% |
| Ratios to Average Net AssetsE,F | | | | | |
| Expenses before reductions | .05% | .59% | 1.03% | 1.04% | 1.06% |
| Expenses net of fee waivers, if any | .01% | .57% | 1.03% | 1.04% | 1.06% |
| Expenses net of all reductions | .01% | .56% | 1.03% | 1.03% | 1.06% |
| Net investment income (loss) | 2.16% | 1.63% | 1.24% | 1.29%B | 1.18% |
| Supplemental Data | | | | | |
| Net assets, end of period (000 omitted) | $13,597,809 | $15,747,447 | $6,998,219 | $5,571,493 | $4,837,497 |
| Portfolio turnover rateG | 64% | 56% | 45% | 64% | 93% |
A Calculated based on average shares outstanding during the period.
B Net investment income per share reflects a large, non-recurring dividend which amounted to $.05 per share. Excluding this non-recurring dividend, the ratio of net investment income (loss) to average net assets would have been 1.00%.
C Total distributions of $.17 per share is comprised of distributions from net investment income of $.166 and distributions from net realized gain of $.006 per share.
D Total returns would have been lower if certain expenses had not been reduced during the applicable periods shown.
E Fees and expenses of any underlying Fidelity Central Funds are not included in the Fund's expense ratio. The Fund indirectly bears its proportionate share of the expenses of any underlying Fidelity Central Funds.
F Expense ratios reflect operating expenses of the Fund. Expenses before reductions do not reflect amounts reimbursed by the investment adviser or reductions from brokerage service arrangements or reductions from other expense offset arrangements and do not represent the amount paid by the Fund during periods when reimbursements or reductions occur. Expenses net of fee waivers reflect expenses after reimbursement by the investment adviser but prior to reductions from brokerage service arrangements or other expense offset arrangements. Expenses net of all reductions represent the net expenses paid by the Fund.
G Amount does not include the portfolio activity of any underlying Fidelity Central Funds.
See accompanying notes which are an integral part of the financial statements.
Fidelity® Series International Growth Fund
Performance: The Bottom Line
Average annual total return reflects the change in the value of an investment, assuming reinvestment of distributions from dividend income and capital gains (the profits earned upon the sale of securities that have grown in value, if any) and assuming a constant rate of performance each year. The hypothetical investment and the average annual total returns do not reflect the deduction of taxes that a shareholder would pay on fund distributions or the redemption of fund shares. During periods of reimbursement by Fidelity, a fund’s total return will be greater than it would be had the reimbursement not occurred. How a fund did yesterday is no guarantee of how it will do tomorrow.
Average Annual Total Returns
| For the periods ended October 31, 2018 | Past 1 year | Past 5 years | Life of fundA |
| Fidelity® Series International Growth Fund | (4.82)% | 4.07% | 6.55% |
A From December 3, 2009
$10,000 Over Life of Fund
Let's say hypothetically that $10,000 was invested in Fidelity® Series International Growth Fund on December 3, 2009, when the fund started.
The chart shows how the value of your investment would have changed, and also shows how the MSCI EAFE Growth Index performed over the same period.
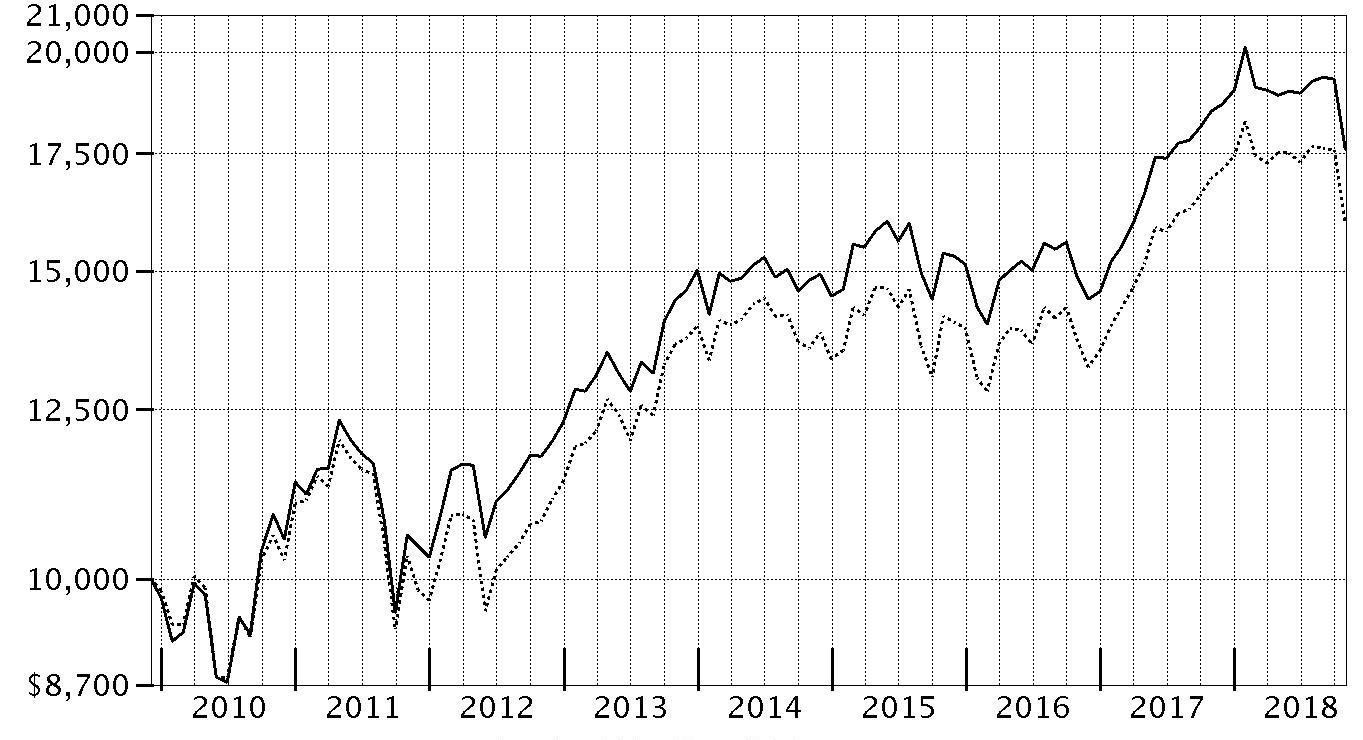
| Period Ending Values |
| $17,611 | Fidelity® Series International Growth Fund |
| $15,956 | MSCI EAFE Growth Index |
Fidelity® Series International Growth Fund
Management's Discussion of Fund Performance
Market Recap: International equities returned -8.08% for the 12 months ending October 31, 2018, according to the MSCI ACWI (All Country World Index) ex USA Index. A modestly positive first half of the period gave way to a confluence of overwhelmingly negative factors – including escalating trade tensions, a surging U.S. dollar, tepid economic growth in Europe, global central bank tightening, concerns about Italy’s budget stalemate with the EU, and weakness in China’s stock market – that yielded a -11% second-half return. The index lost 8% in October alone, its largest monthly drop in more than six years. Among sectors, new-media-infused communications services (-15%) was hit the hardest, while economically sensitive consumer discretionary (-13%), information technology (-12%), financials (-10%), industrials (-9%) and materials (-7%) stocks also fared poorly. Even the more defensive real estate (-9%), utilities (-6%) and consumer staples (-5%) sectors weren’t spared this period. Conversely, elevated crude-oil prices fueled a positive return for energy (+7%), the top-performing sector, followed by the relatively stable-growing health care segment (+2%). Regionally, emerging markets (-12%) fared the worst, hampered by the impact of foreign exchange and concerns about economic weakness in China, India and South Korea. Sluggish growth also pressured shares in continental Europe (-9%). Stocks in Japan (-3%) and the U.K. (-4%) held up better, followed by Canada (-5%) and Asia-Pacific ex Japan (-6%).
Comments from Portfolio Manager Jed Weiss: For the fiscal year, the fund returned -4.82% compared with -5.86% for the benchmark MSCI EAFE Growth Index. Versus the benchmark, the fund benefited from sizable out-of-benchmark exposure to the U.S., as well as strong security selection in continental Europe. By sector, investment choices within the information technology sector helped the fund's relative result. Conversely, stock picks in Japan and the U.K. detracted, as did investment choices within the consumer discretionary and consumer staples sectors. The biggest individual relative contributors were notable out-of-benchmark stakes in U.S.-based credit-card processors Mastercard and Visa, as both companies continued to maintain considerable pricing power and significant market share. A sizable overweighting in Australian global biopharmaceutical firm CSL Limited also proved beneficial, as its shares gained following the acquisition and successful turnaround of Novartis' flu business. I'll note that the fund's stake in cash – representing 3% of assets, on average – helped our relative result in a down market. Turning to detractors, a non-benchmark investment in U.S. flooring manufacturer Mohawk Industries hurt most, due to signs of softening in the U.S. housing market. The decision to not own consumer electronics conglomerate and benchmark component Sony also detracted from relative performance, given the stock's notable gain during the period.
The views expressed above reflect those of the portfolio manager(s) only through the end of the period as stated on the cover of this report and do not necessarily represent the views of Fidelity or any other person in the Fidelity organization. Any such views are subject to change at any time based upon market or other conditions and Fidelity disclaims any responsibility to update such views. These views may not be relied on as investment advice and, because investment decisions for a Fidelity fund are based on numerous factors, may not be relied on as an indication of trading intent on behalf of any Fidelity fund.
Note to Shareholders: Following a roughly five-month leave of absence, Jed Weiss returned to Fidelity on November 29, 2017, and resumed his day-to-day responsibilities as Portfolio Manager. In his stead, Vincent Montemaggiore served as interim manager of the fund.
Fidelity® Series International Growth Fund
Investment Summary (Unaudited)
Geographic Diversification (% of fund's net assets)
| As of October 31, 2018 |
| | United States of America* | 24.7% |
| | Japan | 13.0% |
| | United Kingdom | 8.9% |
| | Switzerland | 8.5% |
| | Germany | 7.5% |
| | Sweden | 4.9% |
| | France | 3.9% |
| | Spain | 3.8% |
| | Australia | 3.4% |
| | Other | 21.4% |

* Includes Short-Term Investments and Net Other Assets (Liabilities).
Percentages are based on country or territory of incorporation and are adjusted for the effect of futures contracts, if applicable.
Asset Allocation as of October 31, 2018
| | % of fund's net assets |
| Stocks | 95.5 |
| Short-Term Investments and Net Other Assets (Liabilities) | 4.5 |
Top Ten Stocks as of October 31, 2018
| | % of fund's net assets |
| Nestle SA (Reg. S) (Switzerland, Food Products) | 4.1 |
| SAP SE (Germany, Software) | 3.6 |
| CSL Ltd. (Australia, Biotechnology) | 3.4 |
| Roche Holding AG (participation certificate) (Switzerland, Pharmaceuticals) | 3.2 |
| Visa, Inc. Class A (United States of America, IT Services) | 3.1 |
| MasterCard, Inc. Class A (United States of America, IT Services) | 3.1 |
| ASML Holding NV (Netherlands) (Netherlands, Semiconductors & Semiconductor Equipment) | 2.7 |
| AIA Group Ltd. (Hong Kong, Insurance) | 2.7 |
| Keyence Corp. (Japan, Electronic Equipment & Components) | 2.6 |
| Amadeus IT Holding SA Class A (Spain, IT Services) | 2.3 |
| | 30.8 |
Top Market Sectors as of October 31, 2018
| | % of fund's net assets |
| Industrials | 20.9 |
| Information Technology | 20.5 |
| Financials | 15.6 |
| Health Care | 10.1 |
| Consumer Staples | 7.2 |
| Consumer Discretionary | 7.0 |
| Communication Services | 6.6 |
| Materials | 6.0 |
| Real Estate | 1.2 |
| Energy | 0.4 |
Fidelity® Series International Growth Fund
Schedule of Investments October 31, 2018
Showing Percentage of Net Assets
| Common Stocks - 95.1% | | | |
| | | Shares | Value |
| Australia - 3.4% | | | |
| CSL Ltd. | | 3,606,038 | $480,079,772 |
| Austria - 1.0% | | | |
| Andritz AG | | 2,856,165 | 148,035,215 |
| Belgium - 1.1% | | | |
| KBC Groep NV | | 2,200,451 | 151,783,556 |
| Brazil - 0.1% | | | |
| Itau Unibanco Holding SA | | 1,513,000 | 17,233,930 |
| Canada - 2.6% | | | |
| Alimentation Couche-Tard, Inc. Class B (sub. vtg.) | | 1,670,300 | 79,768,894 |
| Canadian National Railway Co. | | 819,800 | 70,082,640 |
| Canadian Pacific Railway Ltd. | | 350,600 | 71,899,033 |
| Franco-Nevada Corp. | | 1,233,900 | 77,064,270 |
| Pason Systems, Inc. | | 1,959,269 | 29,572,468 |
| PrairieSky Royalty Ltd. (a) | | 2,273,200 | 34,535,303 |
|
| TOTAL CANADA | | | 362,922,608 |
|
| Cayman Islands - 0.9% | | | |
| Alibaba Group Holding Ltd. sponsored ADR (b) | | 872,200 | 124,096,616 |
| Denmark - 0.5% | | | |
| Jyske Bank A/S (Reg.) | | 1,606,900 | 65,696,788 |
| Finland - 0.2% | | | |
| Tikkurila Oyj (a) | | 1,776,208 | 24,182,100 |
| France - 3.9% | | | |
| Edenred SA | | 3,206,900 | 121,790,861 |
| Elis SA | | 2,780,973 | 56,162,165 |
| Legrand SA | | 1,646,700 | 107,692,881 |
| Safran SA | | 2,019,600 | 260,988,506 |
|
| TOTAL FRANCE | | | 546,634,413 |
|
| Germany - 7.5% | | | |
| Bayer AG | | 1,071,360 | 82,122,379 |
| Linde PLC | | 1,513,512 | 248,313,366 |
| MTU Aero Engines Holdings AG | | 647,176 | 137,661,888 |
| SAP SE | | 4,740,984 | 507,633,718 |
| Vonovia SE | | 1,878,000 | 85,978,057 |
|
| TOTAL GERMANY | | | 1,061,709,408 |
|
| Hong Kong - 2.7% | | | |
| AIA Group Ltd. | | 49,798,200 | 376,886,255 |
| India - 1.0% | | | |
| Housing Development Finance Corp. Ltd. | | 6,145,666 | 147,014,867 |
| Ireland - 2.7% | | | |
| CRH PLC sponsored ADR | | 7,678,111 | 228,654,146 |
| James Hardie Industries PLC CDI | | 11,278,401 | 150,071,966 |
|
| TOTAL IRELAND | | | 378,726,112 |
|
| Italy - 0.7% | | | |
| Interpump Group SpA | | 3,294,593 | 95,156,329 |
| Japan - 13.0% | | | |
| Azbil Corp. | | 1,968,700 | 36,674,856 |
| DENSO Corp. | | 3,426,400 | 152,837,211 |
| East Japan Railway Co. | | 1,822,000 | 159,129,368 |
| Fanuc Corp. | | 823,000 | 143,174,894 |
| Hoya Corp. | | 2,951,224 | 167,759,567 |
| Keyence Corp. | | 751,000 | 368,062,215 |
| Komatsu Ltd. | | 4,339,900 | 113,021,657 |
| Misumi Group, Inc. | | 6,334,300 | 127,208,081 |
| Nabtesco Corp. | | 2,718,300 | 59,938,232 |
| Nintendo Co. Ltd. | | 306,000 | 95,534,082 |
| OSG Corp. | | 3,590,300 | 74,265,611 |
| SHO-BOND Holdings Co. Ltd. (c) | | 1,459,200 | 103,974,547 |
| USS Co. Ltd. | | 12,704,900 | 229,360,405 |
|
| TOTAL JAPAN | | | 1,830,940,726 |
|
| Kenya - 0.6% | | | |
| Safaricom Ltd. | | 396,524,900 | 90,295,827 |
| Korea (South) - 0.8% | | | |
| BGF Retail Co. Ltd. | | 333,987 | 49,322,357 |
| NAVER Corp. | | 563,343 | 56,531,791 |
|
| TOTAL KOREA (SOUTH) | | | 105,854,148 |
|
| Netherlands - 2.7% | | | |
| ASML Holding NV (Netherlands) | | 2,252,200 | 387,928,232 |
| New Zealand - 0.4% | | | |
| Auckland International Airport Ltd. | | 13,553,531 | 61,822,053 |
| Norway - 0.5% | | | |
| Schibsted ASA (B Shares) | | 2,389,191 | 75,673,681 |
| South Africa - 1.3% | | | |
| Clicks Group Ltd. | | 7,173,219 | 91,412,654 |
| Naspers Ltd. Class N | | 537,710 | 94,499,913 |
|
| TOTAL SOUTH AFRICA | | | 185,912,567 |
|
| Spain - 3.8% | | | |
| Amadeus IT Holding SA Class A | | 4,035,601 | 325,358,332 |
| Grifols SA ADR | | 4,966,844 | 101,422,954 |
| Merlin Properties Socimi SA | | 2,823,600 | 35,435,508 |
| Prosegur Compania de Seguridad SA (Reg.) | | 13,452,091 | 74,780,795 |
|
| TOTAL SPAIN | | | 536,997,589 |
|
| Sweden - 4.9% | | | |
| ASSA ABLOY AB (B Shares) | | 15,884,027 | 315,945,432 |
| Atlas Copco AB (A Shares) | | 6,761,800 | 167,435,118 |
| Epiroc AB Class A (b) | | 8,502,700 | 74,665,695 |
| Fagerhult AB | | 3,151,109 | 27,684,954 |
| Loomis AB (B Shares) | | 1,266,200 | 39,157,330 |
| Svenska Handelsbanken AB (A Shares) | | 5,620,413 | 61,093,002 |
|
| TOTAL SWEDEN | | | 685,981,531 |
|
| Switzerland - 8.5% | | | |
| Nestle SA (Reg. S) | | 6,843,345 | 577,736,457 |
| Roche Holding AG (participation certificate) | | 1,823,681 | 443,815,403 |
| Schindler Holding AG: | | | |
| (participation certificate) | | 694,326 | 146,427,883 |
| (Reg.) | | 154,309 | 32,052,269 |
|
| TOTAL SWITZERLAND | | | 1,200,032,012 |
|
| Taiwan - 1.2% | | | |
| Taiwan Semiconductor Manufacturing Co. Ltd. | | 21,821,000 | 163,725,990 |
| United Kingdom - 8.9% | | | |
| BAE Systems PLC | | 17,165,700 | 115,100,943 |
| Elementis PLC | | 14,180,183 | 37,156,475 |
| Informa PLC | | 19,872,388 | 181,260,725 |
| InterContinental Hotel Group PLC ADR (a) | | 4,584,339 | 246,454,065 |
| Melrose Industries PLC | | 29,384,463 | 63,343,626 |
| Prudential PLC | | 15,221,238 | 304,784,354 |
| Reckitt Benckiser Group PLC | | 1,928,787 | 155,969,653 |
| Rightmove PLC | | 6,983,300 | 40,359,153 |
| Shaftesbury PLC | | 3,555,100 | 40,760,836 |
| Spectris PLC | | 2,682,000 | 73,499,159 |
|
| TOTAL UNITED KINGDOM | | | 1,258,688,989 |
|
| United States of America - 20.2% | | | |
| Alphabet, Inc. Class A (b) | | 271,494 | 296,085,927 |
| Autoliv, Inc. (a) | | 1,324,727 | 110,402,748 |
| Berkshire Hathaway, Inc. Class B (b) | | 760,650 | 156,146,232 |
| Black Knight, Inc. (b) | | 1,719,500 | 83,860,015 |
| Marsh & McLennan Companies, Inc. | | 1,491,073 | 126,368,437 |
| Martin Marietta Materials, Inc. | | 782,366 | 134,003,648 |
| MasterCard, Inc. Class A | | 2,178,110 | 430,547,004 |
| Mohawk Industries, Inc. (b) | | 663,815 | 82,797,645 |
| Moody's Corp. | | 1,062,200 | 154,528,856 |
| MSCI, Inc. | | 1,136,392 | 170,890,629 |
| PayPal Holdings, Inc. (b) | | 842,700 | 70,946,913 |
| PriceSmart, Inc. | | 762,375 | 53,480,606 |
| ResMed, Inc. | | 1,355,290 | 143,552,317 |
| S&P Global, Inc. | | 961,271 | 175,258,929 |
| Sherwin-Williams Co. | | 453,200 | 178,320,604 |
| Veoneer, Inc. (a)(b) | | 1,371,238 | 46,046,172 |
| Visa, Inc. Class A | | 3,189,596 | 439,685,809 |
|
| TOTAL UNITED STATES OF AMERICA | | | 2,852,922,491 |
|
| TOTAL COMMON STOCKS | | | |
| (Cost $10,050,033,589) | | | 13,416,933,805 |
|
| Nonconvertible Preferred Stocks - 0.4% | | | |
| Brazil - 0.4% | | | |
| Itau Unibanco Holding SA | | | |
| (Cost $57,698,850) | | 4,638,700 | 61,388,143 |
|
| Money Market Funds - 7.3% | | | |
| Fidelity Cash Central Fund, 2.23% (d) | | 911,040,330 | 911,222,538 |
| Fidelity Securities Lending Cash Central Fund 2.23% (d)(e) | | 124,970,068 | 124,982,565 |
| TOTAL MONEY MARKET FUNDS | | | |
| (Cost $1,036,205,103) | | | 1,036,205,103 |
| TOTAL INVESTMENT IN SECURITIES - 102.8% | | | |
| (Cost $11,143,937,542) | | | 14,514,527,051 |
| NET OTHER ASSETS (LIABILITIES) - (2.8)% | | | (400,927,033) |
| NET ASSETS - 100% | | | $14,113,600,018 |
Categorizations in the Schedule of Investments are based on country or territory of incorporation.
Legend
(a) Security or a portion of the security is on loan at period end.
(b) Non-income producing
(c) Affiliated company
(d) Affiliated fund that is generally available only to investment companies and other accounts managed by Fidelity Investments. The rate quoted is the annualized seven-day yield of the fund at period end. A complete unaudited listing of the fund's holdings as of its most recent quarter end is available upon request. In addition, each Fidelity Central Fund's financial statements, which are not covered by the Fund's Report of Independent Registered Public Accounting Firm, are available on the SEC's website or upon request.
(e) Investment made with cash collateral received from securities on loan.
Affiliated Central Funds
Information regarding fiscal year to date income earned by the Fund from investments in Fidelity Central Funds is as follows:
| Fund | Income earned |
| Fidelity Cash Central Fund | $6,384,373 |
| Fidelity Securities Lending Cash Central Fund | 1,585,610 |
| Total | $7,969,983 |
Amounts in the income column in the above table include any capital gain distributions from underlying funds, which are presented in the corresponding line-item in the Statement of Operations if applicable.
Other Affiliated Issuers
An affiliated company is a company in which the Fund has ownership of at least 5% of the voting securities. Fiscal year to date transactions with companies which are or were affiliates are as follows:
| Affiliate | Value, beginning of period | Purchases | Sales Proceeds | Dividend Income | Realized Gain (loss) | Change in Unrealized appreciation (depreciation) | Value, end of period |
| SHO-BOND Holdings Co. Ltd. | $93,058,290 | $-- | $4,089,000 | $1,493,816 | $1,630,231 | $13,375,026 | $103,974,547 |
| Total | $93,058,290 | $-- | $4,089,000 | $1,493,816 | $1,630,231 | $13,375,026 | $103,974,547 |
Investment Valuation
The following is a summary of the inputs used, as of October 31, 2018, involving the Fund's assets and liabilities carried at fair value. The inputs or methodology used for valuing securities may not be an indication of the risk associated with investing in those securities. For more information on valuation inputs, and their aggregation into the levels used below, please refer to the Investment Valuation section in the accompanying Notes to Financial Statements.
| | Valuation Inputs at Reporting Date: |
| Description | Total | Level 1 | Level 2 | Level 3 |
| Investments in Securities: | | | | |
| Equities: | | | | |
| Communication Services | $930,241,099 | $834,707,017 | $95,534,082 | $-- |
| Consumer Discretionary | 991,994,862 | 839,157,651 | 152,837,211 | -- |
| Consumer Staples | 1,007,690,621 | 273,984,511 | 733,706,110 | -- |
| Energy | 64,107,771 | 64,107,771 | -- | -- |
| Financials | 2,217,387,344 | 1,851,509,988 | 365,877,356 | -- |
| Health Care | 1,418,752,392 | 892,814,610 | 525,937,782 | -- |
| Industrials | 2,968,598,006 | 1,861,237,206 | 1,107,360,800 | -- |
| Information Technology | 2,887,922,243 | 1,828,634,303 | 1,059,287,940 | -- |
| Materials | 829,453,209 | 829,453,209 | -- | -- |
| Real Estate | 162,174,401 | 162,174,401 | -- | -- |
| Money Market Funds | 1,036,205,103 | 1,036,205,103 | -- | -- |
| Total Investments in Securities: | $14,514,527,051 | $10,473,985,770 | $4,040,541,281 | $-- |
The following is a summary of transfers between Level 1 and Level 2 for the period ended October 31, 2018. Transfers are assumed to have occurred at the beginning of the period, and are primarily attributable to the valuation techniques used for foreign equity securities, as discussed in the accompanying Notes to Financial Statements:
| Transfers | Total |
| Level 1 to Level 2 | $114,948,136 |
| Level 2 to Level 1 | $1,131,349,753 |
See accompanying notes which are an integral part of the financial statements.
Fidelity® Series International Growth Fund
Financial Statements
Statement of Assets and Liabilities
| | | October 31, 2018 |
| Assets | | |
Investment in securities, at value (including securities loaned of $122,558,815) — See accompanying schedule:
Unaffiliated issuers (cost $10,065,397,399) | $13,374,347,401 | |
| Fidelity Central Funds (cost $1,036,205,103) | 1,036,205,103 | |
| Other affiliated issuers (cost $42,335,040) | 103,974,547 | |
| Total Investment in Securities (cost $11,143,937,542) | | $14,514,527,051 |
| Foreign currency held at value (cost $563) | | 556 |
| Receivable for investments sold | | 42,040,362 |
| Receivable for fund shares sold | | 542,889,285 |
| Dividends receivable | | 53,582,339 |
| Distributions receivable from Fidelity Central Funds | | 1,566,129 |
| Other receivables | | 224,604 |
| Total assets | | 15,154,830,326 |
| Liabilities | | |
| Payable for investments purchased | $915,531,587 | |
| Payable for fund shares redeemed | 204,134 | |
| Other payables and accrued expenses | 541,892 | |
| Collateral on securities loaned | 124,952,695 | |
| Total liabilities | | 1,041,230,308 |
| Net Assets | | $14,113,600,018 |
| Net Assets consist of: | | |
| Paid in capital | | $9,874,004,483 |
| Total distributable earnings (loss) | | 4,239,595,535 |
| Net Assets | | $14,113,600,018 |
| Net Asset Value and Maximum Offering Price | | |
| Net Asset Value, offering price and redemption price per share ($14,113,600,018 ÷ 943,686,367 shares) | | $14.96 |
See accompanying notes which are an integral part of the financial statements.
Statement of Operations
| | | Year ended October 31, 2018 |
| Investment Income | | |
| Dividends (including $1,493,816 earned from other affiliated issuers) | | $291,361,300 |
| Income from Fidelity Central Funds | | 7,969,983 |
| Income before foreign taxes withheld | | 299,331,283 |
| Less foreign taxes withheld | | (27,084,691) |
| Total income | | 272,246,592 |
| Expenses | | |
| Custodian fees and expenses | $1,644,627 | |
| Independent trustees' fees and expenses | 73,617 | |
| Commitment fees | 40,476 | |
| Total expenses before reductions | 1,758,720 | |
| Expense reductions | (1,064,029) | |
| Total expenses after reductions | | 694,691 |
| Net investment income (loss) | | 271,551,901 |
| Realized and Unrealized Gain (Loss) | | |
| Net realized gain (loss) on: | | |
| Investment securities: | | |
| Unaffiliated issuers | 663,975,003 | |
| Fidelity Central Funds | (3,049) | |
| Other affiliated issuers | 1,630,231 | |
| Foreign currency transactions | (2,587,508) | |
| Total net realized gain (loss) | | 663,014,677 |
| Change in net unrealized appreciation (depreciation) on: | | |
| Investment securities: | | |
| Unaffiliated issuers | (1,619,836,848) | |
| Fidelity Central Funds | (1,919) | |
| Other affiliated issuers | 13,375,026 | |
| Assets and liabilities in foreign currencies | 61,537 | |
| Total change in net unrealized appreciation (depreciation) | | (1,606,402,204) |
| Net gain (loss) | | (943,387,527) |
| Net increase (decrease) in net assets resulting from operations | | $(671,835,626) |
See accompanying notes which are an integral part of the financial statements.
Statement of Changes in Net Assets
| | Year ended October 31, 2018 | Year ended October 31, 2017 |
| Increase (Decrease) in Net Assets | | |
| Operations | | |
| Net investment income (loss) | $271,551,901 | $205,053,294 |
| Net realized gain (loss) | 663,014,677 | 232,127,473 |
| Change in net unrealized appreciation (depreciation) | (1,606,402,204) | 2,728,057,321 |
| Net increase (decrease) in net assets resulting from operations | (671,835,626) | 3,165,238,088 |
| Distributions to shareholders | (460,665,652) | – |
| Distributions to shareholders from net investment income | – | (170,410,130) |
| Distributions to shareholders from net realized gain | – | (166,389,831) |
| Total distributions | (460,665,652) | (336,799,961) |
| Share transactions - net increase (decrease) | 461,286,830 | (561,512,168) |
| Total increase (decrease) in net assets | (671,214,448) | 2,266,925,959 |
| Net Assets | | |
| Beginning of period | 14,784,814,466 | 12,517,888,507 |
| End of period | $14,113,600,018 | $14,784,814,466 |
| Other Information | | |
| Undistributed net investment income end of period | | $192,507,196 |
See accompanying notes which are an integral part of the financial statements.
Financial Highlights
Fidelity Series International Growth Fund
| Years ended October 31, | 2018 | 2017 | 2016 | 2015 | 2014 |
| Selected Per–Share Data | | | | | |
| Net asset value, beginning of period | $16.22 | $13.37 | $14.28 | $14.17 | $13.95 |
| Income from Investment Operations | | | | | |
| Net investment income (loss)A | .30 | .21 | .17B | .15 | .17 |
| Net realized and unrealized gain (loss) | (1.05) | 2.97 | (.60) | .36 | .20 |
| Total from investment operations | (.75) | 3.18 | (.43) | .51 | .37 |
| Distributions from net investment income | (.24) | (.16) | (.16) | (.19) | (.10) |
| Distributions from net realized gain | (.27) | (.17) | (.33) | (.21) | (.05) |
| Total distributions | (.51) | (.33) | (.48)C | (.40) | (.15) |
| Net asset value, end of period | $14.96 | $16.22 | $13.37 | $14.28 | $14.17 |
| Total ReturnD | (4.82)% | 24.42% | (3.10)% | 3.65% | 2.66% |
| Ratios to Average Net AssetsE,F | | | | | |
| Expenses before reductions | .01% | .51% | .94% | .92% | .97% |
| Expenses net of fee waivers, if any | .01% | .51% | .94% | .91% | .97% |
| Expenses net of all reductions | - %G | .51% | .94% | .91% | .97% |
| Net investment income (loss) | 1.84% | 1.41% | 1.27%B | 1.06% | 1.23% |
| Supplemental Data | | | | | |
| Net assets, end of period (000 omitted) | $14,113,600 | $14,784,814 | $5,618,983 | $5,563,674 | $6,049,347 |
| Portfolio turnover rateH | 33% | 23% | 26% | 24% | 33% |
A Calculated based on average shares outstanding during the period.
B Net investment income per share reflects a large, non-recurring dividend which amounted to $.05 per share. Excluding this non-recurring dividend, the ratio of net investment income (loss) to average net assets would have been .93%.
C Total distributions of $.48 per share is comprised of distributions from net investment income of $.156 and distributions from net realized gain of $.326 per share.
D Total returns would have been lower if certain expenses had not been reduced during the applicable periods shown.
E Fees and expenses of any underlying Fidelity Central Funds are not included in the Fund's expense ratio. The Fund indirectly bears its proportionate share of the expenses of any underlying Fidelity Central Funds.
F Expense ratios reflect operating expenses of the Fund. Expenses before reductions do not reflect amounts reimbursed by the investment adviser or reductions from brokerage service arrangements or reductions from other expense offset arrangements and do not represent the amount paid by the Fund during periods when reimbursements or reductions occur. Expenses net of fee waivers reflect expenses after reimbursement by the investment adviser but prior to reductions from brokerage service arrangements or other expense offset arrangements. Expenses net of all reductions represent the net expenses paid by the Fund.
G Amount represents less than .005%.
H Amount does not include the portfolio activity of any underlying Fidelity Central Funds.
See accompanying notes which are an integral part of the financial statements.
Fidelity® Series International Small Cap Fund
Performance: The Bottom Line
Average annual total return reflects the change in the value of an investment, assuming reinvestment of distributions from dividend income and capital gains (the profits earned upon the sale of securities that have grown in value, if any) and assuming a constant rate of performance each year. The hypothetical investment and the average annual total returns do not reflect the deduction of taxes that a shareholder would pay on fund distributions or the redemption of fund shares. During periods of reimbursement by Fidelity, a fund’s total return will be greater than it would be had the reimbursement not occurred. How a fund did yesterday is no guarantee of how it will do tomorrow.
Average Annual Total Returns
| For the periods ended October 31, 2018 | Past 1 year | Past 5 years | Life of fundA |
| Fidelity® Series International Small Cap Fund | (3.72)% | 5.65% | 8.95% |
A From December 3, 2009
$10,000 Over Life of Fund
Let's say hypothetically that $10,000 was invested in Fidelity® Series International Small Cap Fund on December 3, 2009, when the fund started.
The chart shows how the value of your investment would have changed, and also shows how the MSCI EAFE Small Cap Index performed over the same period.

| Period Ending Values |
| $21,464 | Fidelity® Series International Small Cap Fund |
| $19,561 | MSCI EAFE Small Cap Index |
Fidelity® Series International Small Cap Fund
Management's Discussion of Fund Performance
Market Recap: International equities returned -8.08% for the 12 months ending October 31, 2018, according to the MSCI ACWI (All Country World Index) ex USA Index. A modestly positive first half of the period gave way to a confluence of overwhelmingly negative factors – including escalating trade tensions, a surging U.S. dollar, tepid economic growth in Europe, global central bank tightening, concerns about Italy’s budget stalemate with the EU, and weakness in China’s stock market – that yielded a -11% second-half return. The index lost 8% in October alone, its largest monthly drop in more than six years. Among sectors, new-media-infused communications services (-15%) was hit the hardest, while economically sensitive consumer discretionary (-13%), information technology (-12%), financials (-10%), industrials (-9%) and materials (-7%) stocks also fared poorly. Even the more defensive real estate (-9%), utilities (-6%) and consumer staples (-5%) sectors weren’t spared this period. Conversely, elevated crude-oil prices fueled a positive return for energy (+7%), the top-performing sector, followed by the relatively stable-growing health care segment (+2%). Regionally, emerging markets (-12%) fared the worst, hampered by the impact of foreign exchange and concerns about economic weakness in China, India and South Korea. Sluggish growth also pressured shares in continental Europe (-9%). Stocks in Japan (-3%) and the U.K. (-4%) held up better, followed by Canada (-5%) and Asia-Pacific ex Japan (-6%).
Comments from Lead Manager Jed Weiss: For the fiscal year, the fund returned -3.72%, outpacing the -7.68% return of the benchmark MSCI EAFE Small Cap Index. Versus the benchmark, security selection within Japan was by far the biggest contributor, followed by Germany. My choices among emerging markets also helped our relative result, particularly South Africa. Conversely, picks in a number of Scandanavian countries, including Sweden and Denmark, hampered the portfolio's performance versus the benchmark, as did an underweighting in Australia. A number of Japanese holdings helped the fund top the benchmark this period. This included a sizable out-of-benchmark stake in technology service management company OBIC, our largest individual relative contributor, which continued to execute well. In addition, it helped to hold a non-benchmark position in Workman, the leading workwear retailer in Japan. Workman's share price benefited from strong sales trends this period. Also contributing was an overweighting in Lasertec, a Japan-based maker of semiconductor inspection systems that gained 34% for the fund the past 12 months. Lastly, I'll note that the fund's stake in cash – representing 4% of assets, on average – helped our relative result in a down market. Conversely, the fund's biggest detractor was Nabtesco, a maker of gearboxes and machinery. Our non-benchmark holdings returned -43% this period, as the company was held back by economic weakness in China, its second-largest market. Untimely ownership of gaming software company Playtech also detracted, as its shares declined amid deterioration of the firm's pricing power, as well as heightened competition. Playtech was not held at period end. Lastly, Swedish light-fixture maker Fagerhult, another non-benchmark holding, returned about -30% and weighed on the fund's relative result.
The views expressed above reflect those of the portfolio manager(s) only through the end of the period as stated on the cover of this report and do not necessarily represent the views of Fidelity or any other person in the Fidelity organization. Any such views are subject to change at any time based upon market or other conditions and Fidelity disclaims any responsibility to update such views. These views may not be relied on as investment advice and, because investment decisions for a Fidelity fund are based on numerous factors, may not be relied on as an indication of trading intent on behalf of any Fidelity fund.
Notes to Shareholders: Effective December 30, 2017, Ben Piggott is no longer a Co-Manager on the fund. Effective May 22, 2018, Elad Lachovitzki is no longer a Co-Manager on the fund. On November 1, 2018, Preeti Sayana assumed co-management responsibilities for the fund.
Fidelity® Series International Small Cap Fund
Investment Summary (Unaudited)
Geographic Diversification (% of fund's net assets)
| As of October 31, 2018 |
| | Japan | 33.3% |
| | United Kingdom | 16.3% |
| | United States of America* | 11.4% |
| | Germany | 5.0% |
| | Sweden | 4.3% |
| | France | 2.7% |
| | Denmark | 2.6% |
| | Netherlands | 2.6% |
| | Israel | 2.4% |
| | Other | 19.4% |
* Includes Short-Term Investments and Net Other Assets (Liabilities).
Percentages are based on country or territory of incorporation and are adjusted for the effect of futures contracts, if applicable.
Asset Allocation as of October 31, 2018
| | % of fund's net assets |
| Stocks | 90.6 |
| Short-Term Investments and Net Other Assets (Liabilities) | 9.4 |
Top Ten Stocks as of October 31, 2018
| | % of fund's net assets |
| Spirax-Sarco Engineering PLC (United Kingdom, Machinery) | 2.3 |
| OBIC Co. Ltd. (Japan, IT Services) | 2.2 |
| Spectris PLC (United Kingdom, Electronic Equipment & Components) | 1.9 |
| USS Co. Ltd. (Japan, Specialty Retail) | 1.9 |
| CompuGroup Medical AG (Germany, Health Care Technology) | 1.9 |
| Azbil Corp. (Japan, Electronic Equipment & Components) | 1.9 |
| Dechra Pharmaceuticals PLC (United Kingdom, Pharmaceuticals) | 1.6 |
| SHO-BOND Holdings Co. Ltd. (Japan, Construction & Engineering) | 1.5 |
| OSG Corp. (Japan, Machinery) | 1.4 |
| KBC Ancora (Belgium, Diversified Financial Services) | 1.4 |
| | 18.0 |
Top Market Sectors as of October 31, 2018
| | % of fund's net assets |
| Industrials | 21.4 |
| Health Care | 12.4 |
| Information Technology | 11.9 |
| Consumer Discretionary | 9.7 |
| Consumer Staples | 8.3 |
| Financials | 7.4 |
| Materials | 7.1 |
| Communication Services | 6.1 |
| Real Estate | 4.1 |
| Energy | 2.2 |
Fidelity® Series International Small Cap Fund
Schedule of Investments October 31, 2018
Showing Percentage of Net Assets
| Common Stocks - 89.6% | | | |
| | | Shares | Value |
| Australia - 2.0% | | | |
| Accent Group Ltd. | | 6,671,406 | $5,881,823 |
| Adelaide Brighton Ltd. | | 2,028,427 | 8,144,561 |
| Bapcor Ltd. | | 810,786 | 3,921,500 |
| Beacon Lighting Group Ltd. | | 6,633,510 | 6,506,065 |
| Domain Holdings Australia Ltd. | | 285,478 | 501,360 |
| DuluxGroup Ltd. | | 4,203,996 | 22,030,242 |
| Imdex Ltd. (a) | | 13,884,283 | 11,306,978 |
| Nanosonics Ltd. (a) | | 678,844 | 1,442,170 |
| Pact Group Holdings Ltd. (b) | | 666,667 | 1,647,630 |
| Quintis Ltd. (a)(c)(d) | | 9,242,850 | 65 |
| Reckon Ltd. (e) | | 5,931,484 | 3,045,276 |
| Sigma Healthcare Ltd. | | 2,445,948 | 900,691 |
| SomnoMed Ltd. (a) | | 305,402 | 341,707 |
|
| TOTAL AUSTRALIA | | | 65,670,068 |
|
| Austria - 0.9% | | | |
| Andritz AG | | 375,124 | 19,442,701 |
| IMMOFINANZ Immobilien Anlagen AG | | 261,944 | 6,248,310 |
| Wienerberger AG | | 149,100 | 3,431,603 |
|
| TOTAL AUSTRIA | | | 29,122,614 |
|
| Bailiwick of Jersey - 0.5% | | | |
| Integrated Diagnostics Holdings PLC (b) | | 4,317,632 | 14,895,830 |
| Belgium - 1.5% | | | |
| Barco NV | | 20,100 | 2,290,286 |
| Econocom Group SA (c) | | 642,845 | 2,012,519 |
| KBC Ancora | | 982,626 | 45,453,749 |
|
| TOTAL BELGIUM | | | 49,756,554 |
|
| Bermuda - 0.5% | | | |
| Vostok New Ventures Ltd. (depositary receipt) (a) | | 2,233,342 | 16,985,909 |
| Brazil - 0.3% | | | |
| Magnesita Refratarios SA (a) | | 148,600 | 2,240,081 |
| Sul America SA unit | | 1,159,702 | 7,728,230 |
|
| TOTAL BRAZIL | | | 9,968,311 |
|
| Canada - 1.6% | | | |
| ECN Capital Corp. | | 1,730,000 | 4,586,350 |
| McCoy Global, Inc. (a) | | 1,112,650 | 971,968 |
| New Look Vision Group, Inc. | | 597,900 | 14,647,176 |
| Pason Systems, Inc. | | 786,700 | 11,874,153 |
| PrairieSky Royalty Ltd. | | 433,900 | 6,591,971 |
| ShawCor Ltd. Class A | | 489,800 | 8,884,822 |
| Total Energy Services, Inc. | | 359,300 | 2,601,032 |
| ZCL Composites, Inc. | | 280,000 | 1,425,045 |
|
| TOTAL CANADA | | | 51,582,517 |
|
| Cayman Islands - 0.5% | | | |
| SITC International Holdings Co. Ltd. | | 2,825,000 | 2,074,994 |
| Value Partners Group Ltd. | | 17,090,000 | 12,683,554 |
|
| TOTAL CAYMAN ISLANDS | | | 14,758,548 |
|
| Denmark - 2.6% | | | |
| Jyske Bank A/S (Reg.) | | 551,419 | 22,544,313 |
| Netcompany Group A/S | | 253,541 | 8,385,418 |
| Royal Unibrew A/S | | 37,600 | 2,670,343 |
| Scandinavian Tobacco Group A/S (b) | | 621,197 | 9,426,079 |
| SimCorp A/S | | 218,300 | 16,819,331 |
| Spar Nord Bank A/S | | 2,886,999 | 23,930,854 |
|
| TOTAL DENMARK | | | 83,776,338 |
|
| Finland - 0.4% | | | |
| Olvi PLC (A Shares) | | 119,900 | 4,019,820 |
| Tikkurila Oyj (c) | | 761,264 | 10,364,193 |
|
| TOTAL FINLAND | | | 14,384,013 |
|
| France - 2.7% | | | |
| Cegedim SA (a) | | 58,251 | 1,458,114 |
| Elis SA | | 2,145,121 | 43,321,039 |
| Laurent-Perrier Group SA | | 135,868 | 13,942,515 |
| Somfy SA | | 15,000 | 1,160,400 |
| Vetoquinol SA | | 297,927 | 16,703,627 |
| Virbac SA (a) | | 66,000 | 10,600,245 |
|
| TOTAL FRANCE | | | 87,185,940 |
|
| Germany - 4.1% | | | |
| CompuGroup Medical AG | | 1,084,353 | 61,409,621 |
| CTS Eventim AG | | 703,595 | 26,426,095 |
| JOST Werke AG (b) | | 77,000 | 2,686,193 |
| MLP AG | | 522,245 | 3,016,756 |
| Nexus AG | | 618,016 | 16,869,899 |
| SMA Solar Technology AG (c) | | 81,735 | 1,907,089 |
| WashTec AG | | 261,203 | 20,147,492 |
|
| TOTAL GERMANY | | | 132,463,145 |
|
| Greece - 0.5% | | | |
| Fourlis Holdings SA | | 752,500 | 3,690,542 |
| Motor Oil (HELLAS) Corinth Refineries SA | | 387,900 | 9,182,518 |
| Mytilineos Holdings SA | | 373,300 | 3,302,210 |
|
| TOTAL GREECE | | | 16,175,270 |
|
| India - 0.2% | | | |
| Jyothy Laboratories Ltd. | | 2,343,090 | 5,997,119 |
| Ireland - 1.4% | | | |
| Cairn Homes PLC (a) | | 1,233,100 | 1,980,479 |
| FBD Holdings PLC | | 1,309,243 | 15,941,326 |
| James Hardie Industries PLC CDI | | 1,860,550 | 24,756,736 |
| Mincon Group PLC | | 1,337,028 | 1,817,262 |
| United Drug PLC (United Kingdom) | | 216,000 | 1,744,896 |
|
| TOTAL IRELAND | | | 46,240,699 |
|
| Israel - 2.4% | | | |
| Azrieli Group | | 162,479 | 7,888,411 |
| Ituran Location & Control Ltd. (e) | | 1,237,486 | 42,223,022 |
| Strauss Group Ltd. | | 1,229,855 | 26,988,471 |
|
| TOTAL ISRAEL | | | 77,099,904 |
|
| Italy - 1.2% | | | |
| Interpump Group SpA | | 1,350,776 | 39,013,889 |
| Japan - 33.3% | | | |
| Ai Holdings Corp. | | 570,600 | 10,892,652 |
| Aoki Super Co. Ltd. | | 170,900 | 4,000,061 |
| Arcland Service Holdings Co. Ltd. | | 113,200 | 2,317,472 |
| Artnature, Inc. | | 1,440,300 | 8,462,967 |
| Asante, Inc. | | 216,400 | 4,313,233 |
| Aucnet, Inc. | | 532,260 | 5,580,392 |
| Azbil Corp. | | 3,227,100 | 60,117,554 |
| Bank of Kyoto Ltd. | | 106,300 | 4,795,205 |
| Broadleaf Co. Ltd. | | 1,296,400 | 7,491,052 |
| Central Automotive Products Ltd. | | 121,079 | 1,647,151 |
| Chugoku Marine Paints Ltd. | | 275,000 | 2,210,529 |
| Coca-Cola West Co. Ltd. | | 350,450 | 9,177,824 |
| Daiichikosho Co. Ltd. | | 708,700 | 32,660,433 |
| Daikokutenbussan Co. Ltd. | | 569,400 | 21,295,414 |
| Funai Soken Holdings, Inc. | | 873,500 | 18,525,152 |
| GCA Savvian Group Corp. (c) | | 1,935,687 | 15,508,141 |
| GMO Internet, Inc. | | 403,280 | 5,761,398 |
| Goldcrest Co. Ltd. | | 1,493,510 | 23,361,946 |
| Iwatsuka Confectionary Co. Ltd. | | 118,300 | 4,618,350 |
| Kamigumi Co. Ltd. | | 203,050 | 4,200,104 |
| Kobayashi Pharmaceutical Co. Ltd. | | 301,600 | 19,779,678 |
| Koshidaka Holdings Co. Ltd. | | 2,472,900 | 28,775,803 |
| Kusuri No Aoki Holdings Co. Ltd. | | 317,500 | 22,792,130 |
| Lasertec Corp. | | 1,121,300 | 32,197,563 |
| Mandom Corp. | | 83,600 | 2,326,441 |
| Medikit Co. Ltd. | | 261,400 | 14,131,608 |
| Mirait Holdings Corp. (c) | | 260,100 | 4,199,957 |
| Miroku Jyoho Service Co., Ltd. | | 437,300 | 8,254,965 |
| Misumi Group, Inc. | | 1,224,500 | 24,590,925 |
| Mitsuboshi Belting Ltd. | | 305,500 | 7,502,464 |
| Monex Group, Inc. (c) | | 1,902,932 | 7,504,806 |
| Morinaga & Co. Ltd. | | 70,900 | 2,849,572 |
| Nabtesco Corp. | | 1,105,400 | 24,373,955 |
| Nagaileben Co. Ltd. | | 1,417,100 | 31,824,624 |
| Nakanishi, Inc. | | 94,500 | 2,213,529 |
| Nakano Refrigerators Co. Ltd. | | 199,500 | 10,661,453 |
| ND Software Co. Ltd. | | 231,036 | 2,577,873 |
| Nihon Parkerizing Co. Ltd. | | 3,675,700 | 44,400,931 |
| Nitto Kohki Co. Ltd. | | 112,400 | 2,342,933 |
| NOF Corp. | | 175,000 | 4,970,754 |
| NS Tool Co. Ltd. | | 201,400 | 4,737,144 |
| OBIC Co. Ltd. | | 788,200 | 71,810,130 |
| Okamoto Industries, Inc. | | 60,000 | 2,701,289 |
| OSG Corp. | | 2,217,400 | 45,867,077 |
| PALTAC Corp. | | 149,200 | 7,616,360 |
| Paramount Bed Holdings Co. Ltd. | | 926,160 | 39,029,475 |
| ProNexus, Inc. | | 1,226,000 | 11,919,369 |
| S Foods, Inc. | | 113,500 | 4,581,845 |
| San-Ai Oil Co. Ltd. | | 2,342,700 | 25,309,091 |
| Sekisui Jushi Corp. | | 178,500 | 3,238,264 |
| Shinko Plantech Co. Ltd. | | 138,200 | 1,287,262 |
| Shinsei Bank Ltd. | | 438,600 | 6,681,192 |
| Ship Healthcare Holdings, Inc. | | 50,200 | 1,817,406 |
| SHO-BOND Holdings Co. Ltd. | | 693,600 | 49,422,112 |
| Shoei Co. Ltd. (e) | | 911,200 | 35,572,615 |
| SK Kaken Co. Ltd. | | 44,000 | 18,659,104 |
| Software Service, Inc. | | 214,300 | 16,143,484 |
| Techno Medica Co. Ltd. | | 283,000 | 5,201,773 |
| The Monogatari Corp. | | 170,700 | 15,249,311 |
| TKC Corp. | | 466,500 | 17,777,729 |
| Tocalo Co. Ltd. | | 1,495,000 | 12,997,696 |
| Toshiba Plant Systems & Services Corp. | | 168,800 | 3,452,744 |
| Tsuruha Holdings, Inc. | | 29,870 | 3,113,140 |
| USS Co. Ltd. | | 3,404,200 | 61,455,713 |
| Welcia Holdings Co. Ltd. | | 532,985 | 27,207,813 |
| Workman Co. Ltd. (c) | | 349,300 | 22,103,089 |
| Yamato Kogyo Co. Ltd. | | 336,500 | 8,857,225 |
| Yuasa Trading Co. Ltd. | | 105,500 | 3,464,151 |
|
| TOTAL JAPAN | | | 1,072,482,597 |
|
| Korea (South) - 0.8% | | | |
| BGF Retail Co. Ltd. | | 122,508 | 18,091,672 |
| iMarketKorea, Inc. | | 108,458 | 614,057 |
| Leeno Industrial, Inc. | | 117,183 | 6,151,851 |
|
| TOTAL KOREA (SOUTH) | | | 24,857,580 |
|
| Luxembourg - 0.1% | | | |
| B&M European Value Retail S.A. | | 653,731 | 3,482,776 |
| Mexico - 0.2% | | | |
| Consorcio ARA S.A.B. de CV | | 23,015,095 | 6,106,918 |
| Genomma Lab Internacional SA de CV (a) | | 1,109,000 | 712,464 |
|
| TOTAL MEXICO | | | 6,819,382 |
|
| Netherlands - 2.6% | | | |
| Aalberts Industries NV | | 1,002,500 | 36,846,379 |
| Arcadis NV | | 159,318 | 2,156,396 |
| BinckBank NV | | 644,130 | 3,122,576 |
| Intertrust NV (b) | | 252,360 | 4,073,157 |
| PostNL NV | | 1,170,489 | 3,468,173 |
| RHI Magnesita NV | | 29,648 | 1,484,272 |
| Takeaway.com Holding BV (a)(b) | | 232,278 | 13,680,663 |
| Van Lanschot NV (Bearer) | | 227,504 | 5,578,824 |
| VastNed Retail NV | | 302,554 | 11,994,073 |
|
| TOTAL NETHERLANDS | | | 82,404,513 |
|
| New Zealand - 0.1% | | | |
| EBOS Group Ltd. | | 136,813 | 1,860,539 |
| Norway - 1.6% | | | |
| ABG Sundal Collier ASA | | 4,033,578 | 2,416,376 |
| Borregaard ASA | | 290,000 | 2,614,534 |
| Kongsberg Gruppen ASA | | 1,498,681 | 24,640,820 |
| Schibsted ASA (A Shares) | | 82,366 | 2,854,055 |
| Skandiabanken ASA (b) | | 2,035,249 | 20,280,542 |
|
| TOTAL NORWAY | | | 52,806,327 |
|
| Philippines - 0.6% | | | |
| Jollibee Food Corp. | | 3,045,490 | 15,729,836 |
| Pilipinas Shell Petroleum Corp. | | 3,653,850 | 3,319,693 |
|
| TOTAL PHILIPPINES | | | 19,049,529 |
|
| Singapore - 0.1% | | | |
| Boustead Singapore Ltd. | | 5,792,200 | 3,261,680 |
| Hour Glass Ltd. | | 1,558,300 | 714,378 |
|
| TOTAL SINGAPORE | | | 3,976,058 |
|
| South Africa - 0.8% | | | |
| Clicks Group Ltd. | | 2,079,853 | 26,504,820 |
| Spain - 1.9% | | | |
| Baron de Ley SA (a) | | 9,415 | 1,146,369 |
| Merlin Properties Socimi SA | | 1,322,300 | 16,594,550 |
| Prosegur Cash SA (b) | | 1,045,499 | 2,072,323 |
| Prosegur Compania de Seguridad SA (Reg.) | | 7,487,966 | 41,625,949 |
|
| TOTAL SPAIN | | | 61,439,191 |
|
| Sweden - 4.3% | | | |
| Addlife AB | | 677,055 | 15,537,014 |
| AddTech AB (B Shares) | | 1,415,310 | 28,921,280 |
| Fagerhult AB (c) | | 2,246,805 | 19,739,937 |
| Granges AB | | 215,000 | 2,274,250 |
| Lagercrantz Group AB (B Shares) | | 2,151,041 | 21,178,627 |
| Loomis AB (B Shares) | | 787,100 | 24,341,127 |
| MIPS AB (a) | | 250,000 | 2,491,490 |
| Saab AB (B Shares) | | 614,000 | 24,060,408 |
|
| TOTAL SWEDEN | | | 138,544,133 |
|
| Switzerland - 1.2% | | | |
| EDAG Engineering Group AG | | 175,700 | 3,486,596 |
| Tecan Group AG | | 117,663 | 26,543,249 |
| Vontobel Holdings AG | | 76,000 | 4,716,279 |
| VZ Holding AG | | 12,955 | 3,672,395 |
|
| TOTAL SWITZERLAND | | | 38,418,519 |
|
| Taiwan - 0.4% | | | |
| Addcn Technology Co. Ltd. | | 1,655,570 | 12,887,142 |
| United Kingdom - 16.3% | | | |
| Alliance Pharma PLC | | 17,315,666 | 14,784,767 |
| Ascential PLC | | 6,605,952 | 31,815,967 |
| Avon Rubber PLC | | 681,377 | 10,451,233 |
| Cineworld Group PLC | | 4,291,600 | 16,160,351 |
| Countrywide PLC (a) | | 11,278,500 | 1,510,816 |
| Dechra Pharmaceuticals PLC | | 1,723,263 | 50,353,145 |
| DP Poland PLC (a)(e) | | 7,918,000 | 2,732,613 |
| Elementis PLC | | 12,096,783 | 31,697,321 |
| GetBusy PLC (a)(c) | | 2,405,905 | 1,230,091 |
| Great Portland Estates PLC | | 2,725,172 | 24,303,088 |
| H&T Group PLC | | 1,264,806 | 4,445,856 |
| Hill & Smith Holdings PLC | | 243,120 | 3,078,038 |
| Hilton Food Group PLC | | 1,025,238 | 12,082,434 |
| Howden Joinery Group PLC | | 1,767,200 | 10,596,195 |
| Indivior PLC (a) | | 359,400 | 865,252 |
| Informa PLC | | 4,279,938 | 39,038,321 |
| InterContinental Hotel Group PLC ADR | | 187,247 | 10,066,399 |
| ITE Group PLC | | 18,973,933 | 13,823,914 |
| LivaNova PLC (a) | | 35,284 | 3,951,455 |
| LSL Property Services PLC | | 887,615 | 2,836,374 |
| Luxfer Holdings PLC sponsored | | 185,000 | 4,269,800 |
| Mears Group PLC | | 795,738 | 3,610,749 |
| Mitie Group PLC | | 1,547,603 | 2,874,246 |
| Polypipe Group PLC | | 491,600 | 2,331,227 |
| Rightmove PLC | | 3,692,470 | 21,340,192 |
| Shaftesbury PLC | | 3,009,755 | 34,508,208 |
| Sinclair Pharma PLC (a) | | 3,810,212 | 1,548,728 |
| Spectris PLC | | 2,243,861 | 61,492,131 |
| Spirax-Sarco Engineering PLC | | 910,628 | 75,308,520 |
| Topps Tiles PLC | | 9,714,845 | 7,810,617 |
| Tullett Prebon PLC | | 1,396,603 | 5,176,900 |
| Ultra Electronics Holdings PLC | | 1,104,827 | 20,307,290 |
|
| TOTAL UNITED KINGDOM | | | 526,402,238 |
|
| United States of America - 2.0% | | | |
| Autoliv, Inc. | | 72,700 | 6,058,818 |
| Martin Marietta Materials, Inc. | | 58,080 | 9,947,942 |
| Mohawk Industries, Inc. (a) | | 32,962 | 4,111,350 |
| PriceSmart, Inc. | | 278,426 | 19,531,584 |
| ResMed, Inc. | | 125,400 | 13,282,368 |
| Veoneer, Inc. (a) | | 296,600 | 9,959,828 |
|
| TOTAL UNITED STATES OF AMERICA | | | 62,891,890 |
|
| TOTAL COMMON STOCKS | | | |
| (Cost $2,197,829,818) | | | 2,889,903,902 |
|
| Nonconvertible Preferred Stocks - 1.0% | | | |
| Brazil - 0.1% | | | |
| Banco ABC Brasil SA | | 1,091,894 | 4,744,304 |
| Germany - 0.9% | | | |
| Sartorius AG (non-vtg.) | | 202,455 | 29,351,764 |
| TOTAL NONCONVERTIBLE PREFERRED STOCKS | | | |
| (Cost $9,603,379) | | | 34,096,068 |
|
| Money Market Funds - 9.5% | | | |
| Fidelity Cash Central Fund, 2.23% (f) | | 286,156,742 | 286,213,973 |
| Fidelity Securities Lending Cash Central Fund 2.23% (f)(g) | | 19,782,941 | 19,784,920 |
| TOTAL MONEY MARKET FUNDS | | | |
| (Cost $305,998,893) | | | 305,998,893 |
| TOTAL INVESTMENT IN SECURITIES - 100.1% | | | |
| (Cost $2,513,432,090) | | | 3,229,998,863 |
| NET OTHER ASSETS (LIABILITIES) - (0.1)% | | | (4,496,554) |
| NET ASSETS - 100% | | | $3,225,502,309 |
Categorizations in the Schedule of Investments are based on country or territory of incorporation.
Legend
(a) Non-income producing
(b) Security exempt from registration under Rule 144A of the Securities Act of 1933. These securities may be resold in transactions exempt from registration, normally to qualified institutional buyers. At the end of the period, the value of these securities amounted to $68,762,417 or 2.1% of net assets.
(c) Security or a portion of the security is on loan at period end.
(d) Level 3 security
(e) Affiliated company
(f) Affiliated fund that is generally available only to investment companies and other accounts managed by Fidelity Investments. The rate quoted is the annualized seven-day yield of the fund at period end. A complete unaudited listing of the fund's holdings as of its most recent quarter end is available upon request. In addition, each Fidelity Central Fund's financial statements, which are not covered by the Fund's Report of Independent Registered Public Accounting Firm, are available on the SEC's website or upon request.
(g) Investment made with cash collateral received from securities on loan.
Affiliated Central Funds
Information regarding fiscal year to date income earned by the Fund from investments in Fidelity Central Funds is as follows:
| Fund | Income earned |
| Fidelity Cash Central Fund | $2,323,503 |
| Fidelity Securities Lending Cash Central Fund | 763,165 |
| Total | $3,086,668 |
Amounts in the income column in the above table include any capital gain distributions from underlying funds, which are presented in the corresponding line-item in the Statement of Operations if applicable.
Other Affiliated Issuers
An affiliated company is a company in which the Fund has ownership of at least 5% of the voting securities. Fiscal year to date transactions with companies which are or were affiliates are as follows:
| Affiliate | Value, beginning of period | Purchases | Sales Proceeds | Dividend Income | Realized Gain (loss) | Change in Unrealized appreciation (depreciation) | Value, end of period |
| Artnature, Inc. | $11,683,496 | $-- | $2,306,735 | $359,150 | $(1,566,200) | $652,406 | $-- |
| DP Poland PLC | 3,859,020 | 471,160 | -- | -- | -- | (1,597,567) | 2,732,613 |
| Ituran Location & Control Ltd. | 34,047,553 | 9,149,051 | -- | 806,930 | -- | (973,582) | 42,223,022 |
| Reckon Ltd. | 5,651,804 | 81 | -- | 128,796 | -- | (2,606,609) | 3,045,276 |
| Shoei Co. Ltd. | 27,389,174 | 3,520,101 | -- | 713,885 | -- | 4,663,340 | 35,572,615 |
| Topps Tiles PLC | 9,904,292 | 33,470 | 897,034 | 487,359 | (1,522,294) | 292,183 | -- |
| Total | $92,535,339 | $13,173,863 | $3,203,769 | $2,496,120 | $(3,088,494) | $430,171 | $83,573,526 |
Investment Valuation
The following is a summary of the inputs used, as of October 31, 2018, involving the Fund's assets and liabilities carried at fair value. The inputs or methodology used for valuing securities may not be an indication of the risk associated with investing in those securities. For more information on valuation inputs, and their aggregation into the levels used below, please refer to the Investment Valuation section in the accompanying Notes to Financial Statements.
| | Valuation Inputs at Reporting Date: |
| Description | Total | Level 1 | Level 2 | Level 3 |
| Investments in Securities: | | | | |
| Equities: | | | | |
| Communication Services | $197,006,470 | $197,006,470 | $-- | $-- |
| Consumer Discretionary | 310,377,199 | 310,377,199 | -- | -- |
| Consumer Staples | 270,606,461 | 270,606,461 | -- | -- |
| Energy | 71,447,555 | 71,447,555 | -- | -- |
| Financials | 243,586,760 | 236,905,568 | 6,681,192 | -- |
| Health Care | 398,097,317 | 398,097,317 | -- | -- |
| Industrials | 705,274,110 | 705,274,110 | -- | -- |
| Information Technology | 381,540,044 | 381,540,044 | -- | -- |
| Materials | 216,818,278 | 216,818,213 | -- | 65 |
| Real Estate | 129,245,776 | 129,245,776 | -- | -- |
| Money Market Funds | 305,998,893 | 305,998,893 | -- | -- |
| Total Investments in Securities: | $3,229,998,863 | $3,223,317,606 | $6,681,192 | $65 |
The following is a summary of transfers between Level 1 and Level 2 for the period ended October 31, 2018. Transfers are assumed to have occurred at the beginning of the period, and are primarily attributable to the valuation techniques used for foreign equity securities, as discussed in the accompanying Notes to Financial Statements:
| Transfers | Total |
| Level 1 to Level 2 | $0 |
| Level 2 to Level 1 | $1,132,734,206 |
The following is a reconciliation of Investments in Securities and Derivative Instruments for which Level 3 inputs were used in determining value:
| Investments in Securities: | |
| Equities - Industrials | |
| Beginning Balance | $45,204,204 |
| Net Realized Gain (Loss) on Investment Securities | (5,131,681) |
| Net Unrealized Gain (Loss) on Investment Securities | (12,049,961) |
| Cost of Purchases | 11,180,539 |
| Proceeds of Sales | (39,203,101) |
| Amortization/Accretion | -- |
| Transfers into Level 3 | -- |
| Transfers out of Level 3 | -- |
| Ending Balance | $-- |
| The change in unrealized gain (loss) for the period attributable to Level 3 securities held at October 31, 2018 | $- |
| Other Investments in Securities | |
| Beginning Balance | $2,086,834 |
| Net Realized Gain (Loss) on Investment Securities | -- |
| Net Unrealized Gain (Loss) on Investment Securities | (2,086,769) |
| Cost of Purchases | -- |
| Proceeds of Sales | -- |
| Amortization/Accretion | -- |
| Transfers into Level 3 | -- |
| Transfers out of Level 3 | -- |
| Ending Balance | $65 |
| The change in unrealized gain (loss) for the period attributable to Level 3 securities held at October 31, 2018 | $(2,086,769) |
The information used in the above reconciliations represents fiscal year to date activity for any Investments in Securities identified as using Level 3 inputs at either the beginning or the end of the current fiscal period. Transfers in or out of Level 3 represent the beginning value of any Security or Instrument where a change in the pricing level occurred from the beginning to the end of the period. The cost of purchases and the proceeds of sales may include securities received or delivered through corporate actions or exchanges. Realized and unrealized gains (losses) disclosed in the reconciliations are included in Net Gain (Loss) on the Fund's Statement of Operations.
See accompanying notes which are an integral part of the financial statements.
Fidelity® Series International Small Cap Fund
Financial Statements
Statement of Assets and Liabilities
| | | October 31, 2018 |
| Assets | | |
Investment in securities, at value (including securities loaned of $19,040,369) — See accompanying schedule:
Unaffiliated issuers (cost $2,155,798,126) | $2,840,426,444 | |
| Fidelity Central Funds (cost $305,998,893) | 305,998,893 | |
| Other affiliated issuers (cost $51,635,071) | 83,573,526 | |
| Total Investment in Securities (cost $2,513,432,090) | | $3,229,998,863 |
| Cash | | 31,041 |
| Foreign currency held at value (cost $574,405) | | 574,405 |
| Receivable for investments sold | | 7,364,507 |
| Receivable for fund shares sold | | 9,800,827 |
| Dividends receivable | | 10,525,946 |
| Distributions receivable from Fidelity Central Funds | | 567,724 |
| Other receivables | | 203,767 |
| Total assets | | 3,259,067,080 |
| Liabilities | | |
| Payable for investments purchased | $9,961,702 | |
| Payable for fund shares redeemed | 3,180,874 | |
| Other payables and accrued expenses | 638,708 | |
| Collateral on securities loaned | 19,783,487 | |
| Total liabilities | | 33,564,771 |
| Net Assets | | $3,225,502,309 |
| Net Assets consist of: | | |
| Paid in capital | | $2,250,242,933 |
| Total distributable earnings (loss) | | 975,259,376 |
| Net Assets | | $3,225,502,309 |
| Net Asset Value and Maximum Offering Price | | |
| Net Asset Value, offering price and redemption price per share ($3,225,502,309 ÷ 196,286,283 shares) | | $16.43 |
See accompanying notes which are an integral part of the financial statements.
Statement of Operations
| | | Year ended October 31, 2018 |
| Investment Income | | |
| Dividends (including $2,496,120 earned from other affiliated issuers) | | $78,379,494 |
| Income from Fidelity Central Funds | | 3,086,668 |
| Income before foreign taxes withheld | | 81,466,162 |
| Less foreign taxes withheld | | (6,988,816) |
| Total income | | 74,477,346 |
| Expenses | | |
| Custodian fees and expenses | $406,419 | |
| Independent trustees' fees and expenses | 17,816 | |
| Interest | 2,458 | |
| Commitment fees | 9,794 | |
| Total expenses before reductions | 436,487 | |
| Expense reductions | (120,347) | |
| Total expenses after reductions | | 316,140 |
| Net investment income (loss) | | 74,161,206 |
| Realized and Unrealized Gain (Loss) | | |
| Net realized gain (loss) on: | | |
| Investment securities: | | |
| Unaffiliated issuers | 261,193,213 | |
| Fidelity Central Funds | 5,378 | |
| Other affiliated issuers | (3,088,494) | |
| Foreign currency transactions | (457,796) | |
| Total net realized gain (loss) | | 257,652,301 |
| Change in net unrealized appreciation (depreciation) on: | | |
| Investment securities: | | |
| Unaffiliated issuers (net of increase in deferred foreign taxes of $505,206) | (436,693,432) | |
| Fidelity Central Funds | (6,339) | |
| Other affiliated issuers | 430,171 | |
| Assets and liabilities in foreign currencies | (85,973) | |
| Total change in net unrealized appreciation (depreciation) | | (436,355,573) |
| Net gain (loss) | | (178,703,272) |
| Net increase (decrease) in net assets resulting from operations | | $(104,542,066) |
See accompanying notes which are an integral part of the financial statements.
Statement of Changes in Net Assets
| | Year ended October 31, 2018 | Year ended October 31, 2017 |
| Increase (Decrease) in Net Assets | | |
| Operations | | |
| Net investment income (loss) | $74,161,206 | $51,126,067 |
| Net realized gain (loss) | 257,652,301 | 129,673,688 |
| Change in net unrealized appreciation (depreciation) | (436,355,573) | 594,814,022 |
| Net increase (decrease) in net assets resulting from operations | (104,542,066) | 775,613,777 |
| Distributions to shareholders | (218,105,422) | – |
| Distributions to shareholders from net investment income | – | (34,157,192) |
| Distributions to shareholders from net realized gain | – | (85,456,930) |
| Total distributions | (218,105,422) | (119,614,122) |
| Share transactions - net increase (decrease) | (24,011,140) | 11,810,740 |
| Total increase (decrease) in net assets | (346,658,628) | 667,810,395 |
| Net Assets | | |
| Beginning of period | 3,572,160,937 | 2,904,350,542 |
| End of period | $3,225,502,309 | $3,572,160,937 |
| Other Information | | |
| Undistributed net investment income end of period | | $47,513,563 |
See accompanying notes which are an integral part of the financial statements.
Financial Highlights
Fidelity Series International Small Cap Fund
| Years ended October 31, | 2018 | 2017 | 2016 | 2015 | 2014 |
| Selected Per–Share Data | | | | | |
| Net asset value, beginning of period | $18.17 | $15.02 | $16.11 | $15.21 | $15.75 |
| Income from Investment Operations | | | | | |
| Net investment income (loss)A | .38 | .25 | .15 | .14 | .14 |
| Net realized and unrealized gain (loss) | (.99) | 3.47 | (.13) | 1.10 | (.11) |
| Total from investment operations | (.61) | 3.72 | .02 | 1.24 | .03 |
| Distributions from net investment income | (.29) | (.15) | (.15) | (.14) | (.13) |
| Distributions from net realized gain | (.85) | (.42) | (.96) | (.20) | (.44) |
| Total distributions | (1.13)B | (.57) | (1.11) | (.34) | (.57) |
| Net asset value, end of period | $16.43 | $18.17 | $15.02 | $16.11 | $15.21 |
| Total ReturnC | (3.72)% | 25.87% | .02% | 8.36% | .21% |
| Ratios to Average Net AssetsD,E | | | | | |
| Expenses before reductions | .01% | .56% | 1.06% | 1.10% | 1.18% |
| Expenses net of fee waivers, if any | .01% | .56% | 1.06% | 1.10% | 1.18% |
| Expenses net of all reductions | .01% | .55% | 1.05% | 1.10% | 1.18% |
| Net investment income (loss) | 2.08% | 1.52% | 1.01% | .89% | .86% |
| Supplemental Data | | | | | |
| Net assets, end of period (000 omitted) | $3,225,502 | $3,572,161 | $1,303,650 | $1,276,570 | $1,330,809 |
| Portfolio turnover rateF | 14% | 21% | 21% | 16% | 18% |
A Calculated based on average shares outstanding during the period.
B Total distributions of $1.13 per share is comprised of distributions from net investment income of $.285 and distributions from net realized gain of $.848 per share.
C Total returns would have been lower if certain expenses had not been reduced during the applicable periods shown.
D Fees and expenses of any underlying Fidelity Central Funds are not included in the Fund's expense ratio. The Fund indirectly bears its proportionate share of the expenses of any underlying Fidelity Central Funds.
E Expense ratios reflect operating expenses of the Fund. Expenses before reductions do not reflect amounts reimbursed by the investment adviser or reductions from brokerage service arrangements or reductions from other expense offset arrangements and do not represent the amount paid by the Fund during periods when reimbursements or reductions occur. Expenses net of fee waivers reflect expenses after reimbursement by the investment adviser but prior to reductions from brokerage service arrangements or other expense offset arrangements. Expenses net of all reductions represent the net expenses paid by the Fund.
F Amount does not include the portfolio activity of any underlying Fidelity Central Funds.
See accompanying notes which are an integral part of the financial statements.
Fidelity® Series International Value Fund
Performance: The Bottom Line
Average annual total return reflects the change in the value of an investment, assuming reinvestment of distributions from dividend income and capital gains (the profits earned upon the sale of securities that have grown in value, if any) and assuming a constant rate of performance each year. The hypothetical investment and the average annual total returns do not reflect the deduction of taxes that a shareholder would pay on fund distributions or the redemption of fund shares. During periods of reimbursement by Fidelity, a fund’s total return will be greater than it would be had the reimbursement not occurred. How a fund did yesterday is no guarantee of how it will do tomorrow.
Average Annual Total Returns
| For the periods ended October 31, 2018 | Past 1 year | Past 5 years | Life of fundA |
| Fidelity® Series International Value Fund | (8.11)% | 0.71% | 2.51% |
A From December 3, 2009
$10,000 Over Life of Fund
Let's say hypothetically that $10,000 was invested in Fidelity® Series International Value Fund on December 3, 2009, when the fund started.
The chart shows how the value of your investment would have changed, and also shows how the MSCI EAFE Value Index performed over the same period.
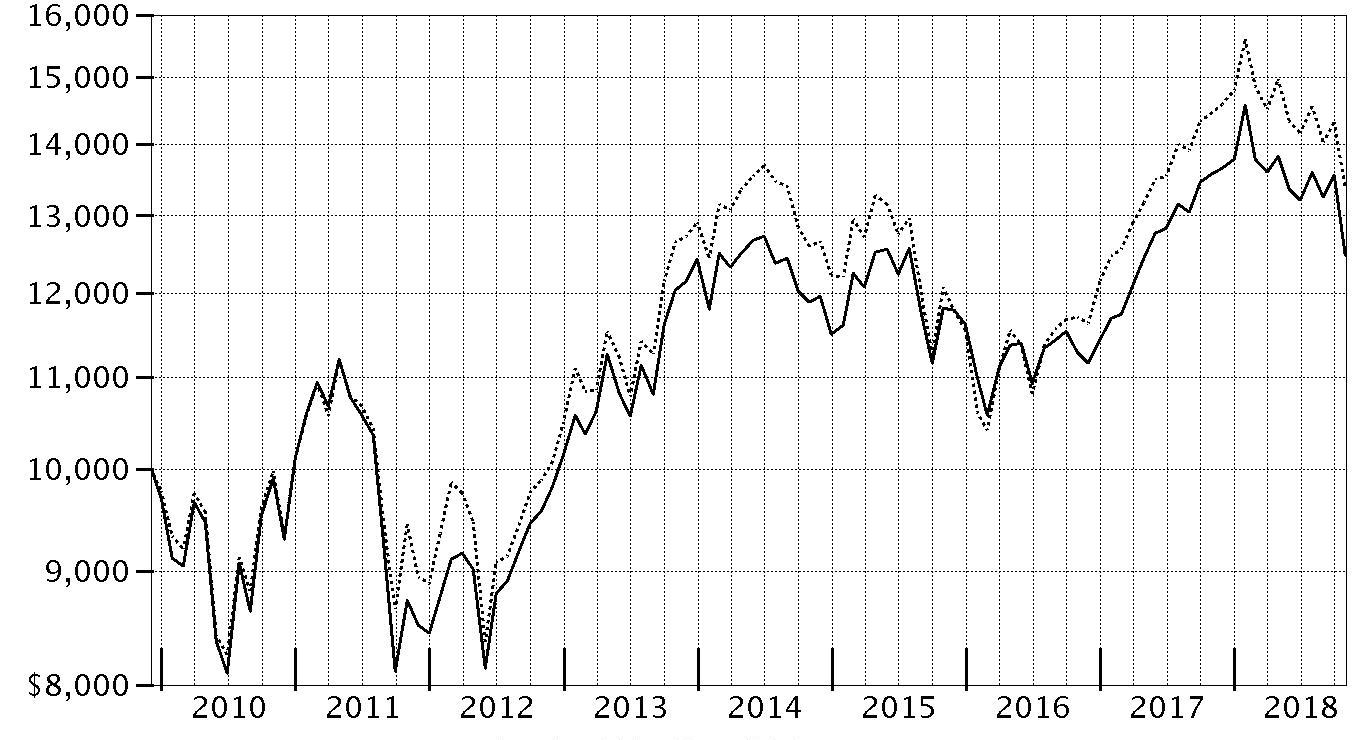
| Period Ending Values |
| $12,476 | Fidelity® Series International Value Fund |
| $13,374 | MSCI EAFE Value Index |
Fidelity® Series International Value Fund
Management's Discussion of Fund Performance
Market Recap: International equities returned -8.08% for the 12 months ending October 31, 2018, according to the MSCI ACWI (All Country World Index) ex USA Index. A modestly positive first half of the period gave way to a confluence of overwhelmingly negative factors – including escalating trade tensions, a surging U.S. dollar, tepid economic growth in Europe, global central bank tightening, concerns about Italy’s budget stalemate with the EU, and weakness in China’s stock market – that yielded a -11% second-half return. The index lost 8% in October alone, its largest monthly drop in more than six years. Among sectors, new-media-infused communications services (-15%) was hit the hardest, while economically sensitive consumer discretionary (-13%), information technology (-12%), financials (-10%), industrials (-9%) and materials (-7%) stocks also fared poorly. Even the more defensive real estate (-9%), utilities (-6%) and consumer staples (-5%) sectors weren’t spared this period. Conversely, elevated crude-oil prices fueled a positive return for energy (+7%), the top-performing sector, followed by the relatively stable-growing health care segment (+2%). Regionally, emerging markets (-12%) fared the worst, hampered by the impact of foreign exchange and concerns about economic weakness in China, India and South Korea. Sluggish growth also pressured shares in continental Europe (-9%). Stocks in Japan (-3%) and the U.K. (-4%) held up better, followed by Canada (-5%) and Asia-Pacific ex Japan (-6%).
Comments from Portfolio Manager Alexander Zavratsky: For the fiscal year, the fund returned -8.11%, trailing the -7.46% result of the benchmark MSCI EAFE Value Index. Versus the benchmark, both stock selection and sector positioning detracted from the fund’s relative result, especially stock picks within health care and, to a lesser extent, consumer staples. Regionally, the bulk of the underperformance for the period came from exposure to the U.K., where concerns about the outcome of Britain’s negotiations to exit from the European Union intensified late in the period. Among individual stocks, the largest relative detractor was untimely ownership of Swiss drug manufacturer Novartis. Despite being one of our largest holdings this period, the fund was still underweighted in the firm earlier in the period, and we eventually exited our position entirely when the stock’s valuation no longer looked attractive to us, missing out on the stock’s 10% gain for the full period. Novartis benefited from a new CEO, a promising growth outlook for 2018, and consecutive quarters of solid earnings. Underexposure to index heavyweight Royal Dutch Shell was another notable detractor because shares of the Anglo-Dutch multinational oil and gas giant advanced about 8% on higher crude-oil prices and solid quarterly financial results. Conversely, the fund’s notable overweight in diversified energy firm Equinor (formerly Statoil) was the leading contributor given the stock advanced 34% the past 12 months. An out-of-benchmark stake in exploration & production company ConocoPhillips also contributed, as the stock gained about 39%.
The views expressed above reflect those of the portfolio manager(s) only through the end of the period as stated on the cover of this report and do not necessarily represent the views of Fidelity or any other person in the Fidelity organization. Any such views are subject to change at any time based upon market or other conditions and Fidelity disclaims any responsibility to update such views. These views may not be relied on as investment advice and, because investment decisions for a Fidelity fund are based on numerous factors, may not be relied on as an indication of trading intent on behalf of any Fidelity fund.
Fidelity® Series International Value Fund
Investment Summary (Unaudited)
Geographic Diversification (% of fund's net assets)
| As of October 31, 2018 |
| | Japan | 23.5% |
| | United Kingdom | 19.4% |
| | France | 14.8% |
| | Germany | 9.6% |
| | United States of America* | 4.8% |
| | Switzerland | 4.6% |
| | Spain | 3.8% |
| | Sweden | 3.2% |
| | Australia | 3.0% |
| | Other | 13.3% |
* Includes Short-Term Investments and Net Other Assets (Liabilities).
Percentages are based on country or territory of incorporation and are adjusted for the effect of futures contracts, if applicable.
Asset Allocation as of October 31, 2018
| | % of fund's net assets |
| Stocks | 96.7 |
| Short-Term Investments and Net Other Assets (Liabilities) | 3.3 |
Top Ten Stocks as of October 31, 2018
| | % of fund's net assets |
| Total SA (France, Oil, Gas & Consumable Fuels) | 3.2 |
| BP PLC (United Kingdom, Oil, Gas & Consumable Fuels) | 3.2 |
| Sanofi SA (France, Pharmaceuticals) | 2.6 |
| BHP Billiton PLC (United Kingdom, Metals & Mining) | 2.5 |
| Royal Dutch Shell PLC Class B sponsored ADR (United Kingdom, Oil, Gas & Consumable Fuels) | 2.1 |
| Banco Santander SA (Spain, Banks) | 1.9 |
| Mitsubishi UFJ Financial Group, Inc. (Japan, Banks) | 1.9 |
| Bayer AG (Germany, Pharmaceuticals) | 1.7 |
| AstraZeneca PLC (United Kingdom) (United Kingdom, Pharmaceuticals) | 1.6 |
| AXA SA (France, Insurance) | 1.6 |
| | 22.3 |
Top Market Sectors as of October 31, 2018
| | % of fund's net assets |
| Financials | 35.4 |
| Energy | 12.5 |
| Health Care | 11.3 |
| Industrials | 10.4 |
| Materials | 6.6 |
| Communication Services | 5.2 |
| Consumer Discretionary | 5.1 |
| Information Technology | 4.6 |
| Consumer Staples | 3.7 |
| Real Estate | 1.9 |
Fidelity® Series International Value Fund
Schedule of Investments October 31, 2018
Showing Percentage of Net Assets
| Common Stocks - 95.6% | | | |
| | | Shares | Value |
| Australia - 3.0% | | | |
| Commonwealth Bank of Australia | | 4,445,867 | $217,959,628 |
| Insurance Australia Group Ltd. | | 18,525,385 | 89,601,072 |
| Macquarie Group Ltd. | | 1,383,787 | 114,847,651 |
|
| TOTAL AUSTRALIA | | | 422,408,351 |
|
| Austria - 0.8% | | | |
| Erste Group Bank AG | | 2,711,000 | 110,542,109 |
| Bailiwick of Jersey - 2.1% | | | |
| Ferguson PLC | | 790,253 | 53,363,656 |
| Glencore Xstrata PLC | | 42,043,200 | 171,348,773 |
| WPP PLC | | 6,308,800 | 71,388,690 |
|
| TOTAL BAILIWICK OF JERSEY | | | 296,101,119 |
|
| Belgium - 1.1% | | | |
| KBC Groep NV | | 2,357,100 | 162,588,951 |
| Canada - 0.6% | | | |
| Nutrien Ltd. | | 1,500,180 | 79,416,267 |
| Denmark - 0.4% | | | |
| A.P. Moller - Maersk A/S Series B | | 40,749 | 51,433,816 |
| Finland - 1.8% | | | |
| Nordea Bank ABP (a) | | 14,223,833 | 123,708,481 |
| Sampo Oyj (A Shares) | | 2,857,113 | 131,580,193 |
|
| TOTAL FINLAND | | | 255,288,674 |
|
| France - 14.8% | | | |
| Accor SA | | 1,457,400 | 66,722,268 |
| Atos Origin SA (b) | | 935,984 | 80,337,582 |
| AXA SA | | 8,838,973 | 221,210,168 |
| Bouygues SA | | 2,348,298 | 85,751,943 |
| Capgemini SA | | 895,805 | 109,580,421 |
| Compagnie de St. Gobain | | 2,017,800 | 76,013,399 |
| Natixis SA | | 16,762,700 | 98,083,082 |
| Sanofi SA | | 4,078,090 | 364,420,455 |
| Societe Generale Series A | | 3,095,700 | 113,481,401 |
| SR Teleperformance SA | | 543,100 | 89,564,706 |
| Total SA (b) | | 7,693,888 | 451,442,148 |
| VINCI SA (b) | | 2,410,937 | 214,571,875 |
| Vivendi SA | | 4,449,781 | 107,321,209 |
|
| TOTAL FRANCE | | | 2,078,500,657 |
|
| Germany - 9.0% | | | |
| Bayer AG | | 3,045,100 | 233,414,404 |
| Brenntag AG | | 1,458,000 | 76,245,309 |
| Continental AG | | 286,400 | 47,344,861 |
| Deutsche Telekom AG | | 12,592,470 | 206,537,629 |
| Fresenius SE & Co. KGaA | | 996,900 | 63,358,806 |
| Hannover Reuck SE | | 1,074,800 | 144,989,031 |
| HeidelbergCement Finance AG | | 964,800 | 65,566,843 |
| Linde PLC | | 893,200 | 146,542,280 |
| SAP SE | | 979,311 | 104,858,250 |
| Vonovia SE | | 3,683,840 | 168,652,505 |
|
| TOTAL GERMANY | | | 1,257,509,918 |
|
| Ireland - 0.7% | | | |
| CRH PLC | | 3,393,970 | 101,235,955 |
| Italy - 1.2% | | | |
| Assicurazioni Generali SpA | | 4,171,200 | 67,465,998 |
| Intesa Sanpaolo SpA | | 30,278,200 | 67,068,476 |
| Mediobanca SpA | | 4,409,872 | 38,720,011 |
|
| TOTAL ITALY | | | 173,254,485 |
|
| Japan - 23.5% | | | |
| Honda Motor Co. Ltd. | | 7,259,000 | 207,212,008 |
| Hoya Corp. | | 1,877,900 | 106,747,468 |
| Idemitsu Kosan Co. Ltd. | | 1,781,553 | 81,313,404 |
| INPEX Corp. | | 4,941,100 | 56,262,395 |
| Itochu Corp. | | 9,564,000 | 177,373,640 |
| Japan Tobacco, Inc. | | 4,647,900 | 119,429,313 |
| Kao Corp. | | 1,385,300 | 92,153,241 |
| Makita Corp. | | 2,209,600 | 76,469,961 |
| Minebea Mitsumi, Inc. | | 3,279,800 | 50,174,465 |
| Mitsubishi UFJ Financial Group, Inc. | | 45,045,500 | 272,637,566 |
| Mitsui Fudosan Co. Ltd. | | 4,545,800 | 102,381,631 |
| Nintendo Co. Ltd. | | 143,000 | 44,645,012 |
| Nomura Holdings, Inc. | | 19,194,300 | 92,170,243 |
| OBIC Co. Ltd. | | 1,250,700 | 113,946,878 |
| Oracle Corp. Japan | | 941,300 | 63,901,786 |
| ORIX Corp. | | 10,232,400 | 166,950,400 |
| Panasonic Corp. | | 8,574,909 | 92,021,258 |
| Recruit Holdings Co. Ltd. | | 2,860,900 | 76,785,389 |
| Shin-Etsu Chemical Co. Ltd. | | 1,220,300 | 101,968,903 |
| Shinsei Bank Ltd. | | 5,787,200 | 88,156,399 |
| SoftBank Corp. | | 1,282,100 | 101,463,880 |
| Sony Corp. | | 1,952,100 | 105,641,313 |
| Sony Financial Holdings, Inc. | | 5,789,600 | 133,562,953 |
| Subaru Corp. | | 2,561,500 | 69,095,685 |
| Sumitomo Mitsui Financial Group, Inc. | | 5,619,700 | 218,803,573 |
| T&D Holdings, Inc. | | 6,439,600 | 102,941,604 |
| Taiheiyo Cement Corp. | | 1,732,800 | 50,990,565 |
| Takeda Pharmaceutical Co. Ltd. (b) | | 3,842,600 | 159,312,465 |
| Tokio Marine Holdings, Inc. | | 3,812,500 | 179,615,032 |
|
| TOTAL JAPAN | | | 3,304,128,430 |
|
| Netherlands - 2.4% | | | |
| ING Groep NV (Certificaten Van Aandelen) | | 11,132,034 | 131,703,046 |
| Koninklijke Philips Electronics NV | | 2,854,332 | 106,454,760 |
| Wolters Kluwer NV | | 1,735,561 | 98,603,684 |
|
| TOTAL NETHERLANDS | | | 336,761,490 |
|
| Norway - 1.5% | | | |
| Equinor ASA | | 8,164,567 | 212,400,003 |
| Portugal - 0.7% | | | |
| Galp Energia SGPS SA Class B | | 5,412,371 | 94,376,307 |
| Spain - 3.3% | | | |
| Banco Santander SA | | 57,351,948 | 272,878,089 |
| Banco Santander SA rights (a) | | 57,351,948 | 2,228,117 |
| CaixaBank SA (b) | | 26,069,008 | 105,493,744 |
| Masmovil Ibercom SA (a) | | 309,852 | 40,219,313 |
| Unicaja Banco SA (c) | | 30,752,247 | 39,394,463 |
|
| TOTAL SPAIN | | | 460,213,726 |
|
| Sweden - 3.2% | | | |
| Alfa Laval AB | | 3,636,100 | 92,857,900 |
| Investor AB (B Shares) | | 2,486,959 | 107,809,033 |
| Swedbank AB (A Shares) | | 6,610,800 | 148,886,848 |
| Telefonaktiebolaget LM Ericsson (B Shares) | | 12,067,500 | 105,068,807 |
|
| TOTAL SWEDEN | | | 454,622,588 |
|
| Switzerland - 4.6% | | | |
| Credit Suisse Group AG | | 8,517,593 | 111,356,175 |
| Swiss Life Holding AG | | 271,770 | 102,593,411 |
| UBS Group AG(b) | | 15,434,271 | 214,536,367 |
| Zurich Insurance Group AG | | 687,735 | 213,528,934 |
|
| TOTAL SWITZERLAND | | | 642,014,887 |
|
| United Kingdom - 19.4% | | | |
| AstraZeneca PLC (United Kingdom) | | 2,935,180 | 224,510,943 |
| Aviva PLC | | 26,280,309 | 143,618,971 |
| BAE Systems PLC | | 16,646,179 | 111,617,406 |
| BHP Billiton PLC | | 17,332,186 | 345,754,424 |
| BP PLC | | 61,858,751 | 446,850,318 |
| British American Tobacco PLC (United Kingdom) | | 3,859,882 | 167,326,921 |
| Bunzl PLC | | 3,053,339 | 90,193,197 |
| Compass Group PLC | | 2,442,039 | 48,069,779 |
| GlaxoSmithKline PLC | | 6,971,847 | 135,029,070 |
| HSBC Holdings PLC sponsored ADR (b) | | 2,561,306 | 105,244,064 |
| Imperial Tobacco Group PLC | | 3,940,512 | 133,625,307 |
| Informa PLC | | 12,104,246 | 110,405,675 |
| ITV PLC | | 21,432,668 | 40,805,204 |
| Micro Focus International PLC | | 3,501,805 | 54,285,739 |
| Royal Dutch Shell PLC Class B sponsored ADR (b) | | 4,444,800 | 292,067,808 |
| RSA Insurance Group PLC | | 8,940,690 | 64,499,575 |
| Standard Chartered PLC (United Kingdom) | | 9,954,983 | 69,920,904 |
| Standard Life PLC | | 22,030,130 | 76,169,857 |
| The Weir Group PLC | | 2,776,538 | 56,286,678 |
|
| TOTAL UNITED KINGDOM | | | 2,716,281,840 |
|
| United States of America - 1.5% | | | |
| Amgen, Inc. | | 479,300 | 92,404,247 |
| ConocoPhillips Co. | | 1,638,600 | 114,538,140 |
|
| TOTAL UNITED STATES OF AMERICA | | | 206,942,387 |
|
| TOTAL COMMON STOCKS | | | |
| (Cost $12,951,164,522) | | | 13,416,021,960 |
|
| Nonconvertible Preferred Stocks - 1.1% | | | |
| Germany - 0.6% | | | |
| Porsche Automobil Holding SE (Germany) | | 1,284,424 | 81,682,920 |
| Spain - 0.5% | | | |
| Grifols SA Class B | | 3,503,738 | 72,813,122 |
| TOTAL NONCONVERTIBLE PREFERRED STOCKS | | | |
| (Cost $156,569,494) | | | 154,496,042 |
|
| Money Market Funds - 4.9% | | | |
| Fidelity Cash Central Fund, 2.23% (d) | | 168,332,451 | 168,366,117 |
| Fidelity Securities Lending Cash Central Fund 2.23% (d)(e) | | 514,818,564 | 514,870,046 |
| TOTAL MONEY MARKET FUNDS | | | |
| (Cost $683,236,163) | | | 683,236,163 |
| TOTAL INVESTMENT IN SECURITIES - 101.6% | | | |
| (Cost $13,790,970,179) | | | 14,253,754,165 |
| NET OTHER ASSETS (LIABILITIES) - (1.6)% | | | (223,077,774) |
| NET ASSETS - 100% | | | $14,030,676,391 |
Categorizations in the Schedule of Investments are based on country or territory of incorporation.
Legend
(a) Non-income producing
(b) Security or a portion of the security is on loan at period end.
(c) Security exempt from registration under Rule 144A of the Securities Act of 1933. These securities may be resold in transactions exempt from registration, normally to qualified institutional buyers. At the end of the period, the value of these securities amounted to $39,394,463 or 0.3% of net assets.
(d) Affiliated fund that is generally available only to investment companies and other accounts managed by Fidelity Investments. The rate quoted is the annualized seven-day yield of the fund at period end. A complete unaudited listing of the fund's holdings as of its most recent quarter end is available upon request. In addition, each Fidelity Central Fund's financial statements are available on the SEC's website or upon request.
(e) Investment made with cash collateral received from securities on loan.
Affiliated Central Funds
Information regarding fiscal year to date income earned by the Fund from investments in Fidelity Central Funds is as follows:
| Fund | Income earned |
| Fidelity Cash Central Fund | $1,560,536 |
| Fidelity Securities Lending Cash Central Fund | 7,302,519 |
| Total | $8,863,055 |
Amounts in the income column in the above table include any capital gain distributions from underlying funds, which are presented in the corresponding line-item in the Statement of Operations if applicable.
Investment Valuation
The following is a summary of the inputs used, as of October 31, 2018, involving the Fund's assets and liabilities carried at fair value. The inputs or methodology used for valuing securities may not be an indication of the risk associated with investing in those securities. For more information on valuation inputs, and their aggregation into the levels used below, please refer to the Investment Valuation section in the accompanying Notes to Financial Statements.
| | Valuation Inputs at Reporting Date: |
| Description | Total | Level 1 | Level 2 | Level 3 |
| Investments in Securities: | | | | |
| Equities: | | | | |
| Communication Services | $722,786,612 | $191,430,192 | $531,356,420 | $-- |
| Consumer Discretionary | 717,790,092 | 162,136,908 | 555,653,184 | -- |
| Consumer Staples | 512,534,782 | 133,625,307 | 378,909,475 | -- |
| Energy | 1,749,250,523 | 794,695,662 | 954,554,861 | -- |
| Financials | 5,013,087,900 | 2,544,861,526 | 2,468,226,374 | -- |
| Health Care | 1,558,465,740 | 199,151,715 | 1,359,314,025 | -- |
| Industrials | 1,477,307,024 | 719,337,034 | 757,969,990 | -- |
| Information Technology | 631,979,463 | 367,766,667 | 264,212,796 | -- |
| Materials | 916,281,730 | 316,331,883 | 599,949,847 | -- |
| Real Estate | 271,034,136 | 168,652,505 | 102,381,631 | -- |
| Money Market Funds | 683,236,163 | 683,236,163 | -- | -- |
| Total Investments in Securities: | $14,253,754,165 | $6,281,225,562 | $7,972,528,603 | $-- |
The following is a summary of transfers between Level 1 and Level 2 for the period ended October 31, 2018. Transfers are assumed to have occurred at the beginning of the period, and are primarily attributable to the valuation techniques used for foreign equity securities, as discussed in the accompanying Notes to Financial Statements:
| Transfers | Total |
| Level 1 to Level 2 | $1,051,927,014 |
| Level 2 to Level 1 | $790,679,523 |
See accompanying notes which are an integral part of the financial statements.
Fidelity® Series International Value Fund
Financial Statements
Statement of Assets and Liabilities
| | | October 31, 2018 |
| Assets | | |
Investment in securities, at value (including securities loaned of $492,761,612) — See accompanying schedule:
Unaffiliated issuers (cost $13,107,734,016) | $13,570,518,002 | |
| Fidelity Central Funds (cost $683,236,163) | 683,236,163 | |
| Total Investment in Securities (cost $13,790,970,179) | | $14,253,754,165 |
| Foreign currency held at value (cost $25,468,971) | | 25,468,971 |
| Receivable for fund shares sold | | 295,748,908 |
| Dividends receivable | | 74,774,590 |
| Distributions receivable from Fidelity Central Funds | | 372,022 |
| Other receivables | | 48,464 |
| Total assets | | 14,650,167,120 |
| Liabilities | | |
| Payable for investments purchased | $101,122,740 | |
| Payable for fund shares redeemed | 3,115,645 | |
| Other payables and accrued expenses | 386,626 | |
| Collateral on securities loaned | 514,865,718 | |
| Total liabilities | | 619,490,729 |
| Net Assets | | $14,030,676,391 |
| Net Assets consist of: | | |
| Paid in capital | | $13,533,480,237 |
| Total distributable earnings (loss) | | 497,196,154 |
| Net Assets | | $14,030,676,391 |
| Net Asset Value and Maximum Offering Price | | |
| Net Asset Value, offering price and redemption price per share ($14,030,676,391 ÷ 1,449,970,661 shares) | | $9.68 |
See accompanying notes which are an integral part of the financial statements.
Statement of Operations
| | | Year ended October 31, 2018 |
| Investment Income | | |
| Dividends | | $570,986,949 |
| Income from Fidelity Central Funds | | 8,863,055 |
| Income before foreign taxes withheld | | 579,850,004 |
| Less foreign taxes withheld | | (48,081,741) |
| Total income | | 531,768,263 |
| Expenses | | |
| Custodian fees and expenses | $1,244,816 | |
| Independent trustees' fees and expenses | 73,487 | |
| Interest | 7,287 | |
| Commitment fees | 40,467 | |
| Total expenses before reductions | 1,366,057 | |
| Expense reductions | (1,352,774) | |
| Total expenses after reductions | | 13,283 |
| Net investment income (loss) | | 531,754,980 |
| Realized and Unrealized Gain (Loss) | | |
| Net realized gain (loss) on: | | |
| Investment securities: | | |
| Unaffiliated issuers | 413,291,516 | |
| Fidelity Central Funds | (25,769) | |
| Foreign currency transactions | (1,583,425) | |
| Total net realized gain (loss) | | 411,682,322 |
| Change in net unrealized appreciation (depreciation) on: | | |
| Investment securities: | | |
| Unaffiliated issuers | (2,130,203,612) | |
| Fidelity Central Funds | 6,189 | |
| Assets and liabilities in foreign currencies | (793,006) | |
| Total change in net unrealized appreciation (depreciation) | | (2,130,990,429) |
| Net gain (loss) | | (1,719,308,107) |
| Net increase (decrease) in net assets resulting from operations | | $(1,187,553,127) |
See accompanying notes which are an integral part of the financial statements.
Statement of Changes in Net Assets
| | Year ended October 31, 2018 | Year ended October 31, 2017 |
| Increase (Decrease) in Net Assets | | |
| Operations | | |
| Net investment income (loss) | $531,754,980 | $412,099,973 |
| Net realized gain (loss) | 411,682,322 | 50,055,017 |
| Change in net unrealized appreciation (depreciation) | (2,130,990,429) | 2,178,152,740 |
| Net increase (decrease) in net assets resulting from operations | (1,187,553,127) | 2,640,307,730 |
| Distributions to shareholders | (460,693,678) | – |
| Distributions to shareholders from net investment income | – | (329,576,938) |
| Distributions to shareholders from net realized gain | – | (24,285,362) |
| Total distributions | (460,693,678) | (353,862,300) |
| Share transactions - net increase (decrease) | 885,789,055 | (355,425,913) |
| Total increase (decrease) in net assets | (762,457,750) | 1,931,019,517 |
| Net Assets | | |
| Beginning of period | 14,793,134,141 | 12,862,114,624 |
| End of period | $14,030,676,391 | $14,793,134,141 |
| Other Information | | |
| Undistributed net investment income end of period | | $383,332,093 |
See accompanying notes which are an integral part of the financial statements.
Financial Highlights
Fidelity Series International Value Fund
| Years ended October 31, | 2018 | 2017 | 2016 | 2015 | 2014 |
| Selected Per–Share Data | | | | | |
| Net asset value, beginning of period | $10.87 | $9.27 | $9.91 | $10.73 | $11.14 |
| Income from Investment Operations | | | | | |
| Net investment income (loss)A | .38 | .29 | .24 | .22 | .45B |
| Net realized and unrealized gain (loss) | (1.23) | 1.55 | (.68) | (.28) | (.59) |
| Total from investment operations | (.85) | 1.84 | (.44) | (.06) | (.14) |
| Distributions from net investment income | (.31) | (.22) | (.20) | (.44) | (.24) |
| Distributions from net realized gain | (.03) | (.02) | – | (.32) | (.04) |
| Total distributions | (.34) | (.24) | (.20) | (.76) | (.27)C |
| Net asset value, end of period | $9.68 | $10.87 | $9.27 | $9.91 | $10.73 |
| Total ReturnD | (8.11)% | 20.33% | (4.49)% | (.65)% | (1.25)% |
| Ratios to Average Net AssetsE,F | | | | | |
| Expenses before reductions | .01% | .48% | .96% | .89% | .82% |
| Expenses net of fee waivers, if any | .01% | .47% | .96% | .89% | .82% |
| Expenses net of all reductions | - %G | .46% | .95% | .88% | .81% |
| Net investment income (loss) | 3.60% | 2.86% | 2.58% | 2.12% | 4.05%B |
| Supplemental Data | | | | | |
| Net assets, end of period (000 omitted) | $14,030,676 | $14,793,134 | $5,774,976 | $5,556,957 | $5,971,189 |
| Portfolio turnover rateH | 43% | 51% | 45% | 44% | 70% |
A Calculated based on average shares outstanding during the period.
B Net investment income per share reflects a large, non-recurring dividend which amounted to $.18 per share. Excluding this non-recurring dividend, the ratio of net investment income (loss) to average net assets would have been 2.46%.
C Total distributions of $.27 per share is comprised of distributions from net investment income of $.237 and distributions from net realized gain of $.036 per share.
D Total returns would have been lower if certain expenses had not been reduced during the applicable periods shown.
E Fees and expenses of any underlying Fidelity Central Funds are not included in the Fund's expense ratio. The Fund indirectly bears its proportionate share of the expenses of any underlying Fidelity Central Funds.
F Expense ratios reflect operating expenses of the Fund. Expenses before reductions do not reflect amounts reimbursed by the investment adviser or reductions from brokerage service arrangements or reductions from other expense offset arrangements and do not represent the amount paid by the Fund during periods when reimbursements or reductions occur. Expenses net of fee waivers reflect expenses after reimbursement by the investment adviser but prior to reductions from brokerage service arrangements or other expense offset arrangements. Expenses net of all reductions represent the net expenses paid by the Fund.
G Amount represents less than .005%.
H Amount does not include the portfolio activity of any underlying Fidelity Central Funds.
See accompanying notes which are an integral part of the financial statements.
Notes to Financial Statements
For the period ended October 31, 2018
1. Organization.
Fidelity Series Emerging Markets Fund, Fidelity Series Emerging Markets Opportunities Fund (formerly Fidelity Series Emerging Markets Fund), Fidelity Series International Growth Fund, Fidelity Series International Small Cap Fund and Fidelity Series International Value Fund (the Funds) are funds of Fidelity Investment Trust (the Trust). The Trust is registered under the Investment Company Act of 1940, as amended (the 1940 Act), as an open-end management investment company organized as a Massachusetts business trust. Each Fund is authorized to issue an unlimited number of shares. Shares of the Funds are only available for purchase by mutual funds for which Fidelity Management & Research Company (FMR) or an affiliate serves as an investment manager. Fidelity Series Emerging Markets Fund and Fidelity Series Emerging Markets Opportunities Fund investments in emerging markets can be subject to social, economic, regulatory, and political uncertainties and can be extremely volatile. Effective August 28, 2017, the Funds no longer offered Class F, and all outstanding shares of Class F were exchanged for shares of Fidelity Series Emerging Markets Opportunities, Fidelity Series International Growth, Fidelity Series International Small Cap and Fidelity Series International Value, respectively.
2. Investments in Fidelity Central Funds.
The Funds invest in Fidelity Central Funds, which are open-end investment companies generally available only to other investment companies and accounts managed by the investment adviser and its affiliates. The Funds' Schedules of Investments list each of the Fidelity Central Funds held as of period end, if any, as an investment of each Fund, but do not include the underlying holdings of each Fidelity Central Fund. As an Investing Fund, each Fund indirectly bears its proportionate share of the expenses of the underlying Fidelity Central Funds.
The Money Market Central Funds seek preservation of capital and current income and are managed by Fidelity Investments Money Management, Inc. (FIMM), an affiliate of the investment adviser. Annualized expenses of the Money Market Central Funds as of their most recent shareholder report date are less than .005%.
A complete unaudited list of holdings for each Fidelity Central Fund is available upon request or at the Securities and Exchange Commission (the SEC) website at www.sec.gov. In addition, the financial statements of the Fidelity Central Funds, which are not covered by the Funds' Report of Independent Registered Public Accounting Firm, are available on the SEC website or upon request.
3. Significant Accounting Policies.
Each Fund is an investment company and applies the accounting and reporting guidance of the Financial Accounting Standards Board (FASB) Accounting Standards Codification Topic 946 Financial Services – Investments Companies. The financial statements have been prepared in conformity with accounting principles generally accepted in the United States of America (GAAP), which require management to make certain estimates and assumptions at the date of the financial statements. Actual results could differ from those estimates. Subsequent events, if any, through the date that the financial statements were issued have been evaluated in the preparation of the financial statements. The following summarizes the significant accounting policies of the Funds:
Investment Valuation. Investments are valued as of 4:00 p.m. Eastern time on the last calendar day of the period. The Board of Trustees (the Board) has delegated the day to day responsibility for the valuation of each Fund's investments to the Fair Value Committee (the Committee) established by each Fund's investment adviser. In accordance with valuation policies and procedures approved by the Board, each Fund attempts to obtain prices from one or more third party pricing vendors or brokers to value its investments. When current market prices, quotations or currency exchange rates are not readily available or reliable, investments will be fair valued in good faith by the Committee, in accordance with procedures adopted by the Board. Factors used in determining fair value vary by investment type and may include market or investment specific events, changes in interest rates and credit quality. The frequency with which these procedures are used cannot be predicted and they may be utilized to a significant extent. The Committee oversees each Fund's valuation policies and procedures and reports to the Board on the Committee's activities and fair value determinations. The Board monitors the appropriateness of the procedures used in valuing each Fund's investments and ratifies the fair value determinations of the Committee.
Each Fund categorizes the inputs to valuation techniques used to value its investments into a disclosure hierarchy consisting of three levels as shown below:
- Level 1 – quoted prices in active markets for identical investments
- Level 2 – other significant observable inputs (including quoted prices for similar investments, interest rates, prepayment speeds, etc.)
- Level 3 – unobservable inputs (including the Fund's own assumptions based on the best information available)
Valuation techniques used to value each Fund's investments by major category are as follows:
Equity securities, including restricted securities, for which market quotations are readily available, are valued at the last reported sale price or official closing price as reported by a third party pricing vendor on the primary market or exchange on which they are traded and are categorized as Level 1 in the hierarchy. In the event there were no sales during the day or closing prices are not available, securities are valued at the last quoted bid price or may be valued using the last available price and are generally categorized as Level 2 in the hierarchy. For foreign equity securities, when market or security specific events arise, comparisons to the valuation of American Depositary Receipts (ADRs), futures contracts, Exchange-Traded Funds (ETFs) and certain indexes as well as quoted prices for similar securities may be used and would be categorized as Level 2 in the hierarchy. Utilizing these techniques may result in transfers between Level 1 and Level 2. For equity securities, including restricted securities, where observable inputs are limited, assumptions about market activity and risk are used and these securities may be categorized as Level 3 in the hierarchy. Equity securities, including restricted securities, for which observable inputs are not available are valued using alternate valuation approaches, including the market approach and the income approach and are categorized as Level 3 in the hierarchy. The market approach generally consists of using comparable market transactions while the income approach generally consists of using the net present value of estimated future cash flows, adjusted as appropriate for liquidity, credit, market and/or other risk factors.
Debt securities, including restricted securities, are valued based on evaluated prices received from third party pricing vendors or from brokers who make markets in such securities. U.S. government and government agency obligations are valued by pricing vendors who utilize matrix pricing which considers yield or price of bonds of comparable quality, coupon, maturity and type or by broker-supplied prices. When independent prices are unavailable or unreliable, debt securities may be valued utilizing pricing methodologies which consider similar factors that would be used by third party pricing vendors. Debt securities are generally categorized as Level 2 in the hierarchy but may be Level 3 depending on the circumstances. Exchange-Traded Funds (ETFs) are valued at their last sale price or official closing price as reported by a third party pricing vendor on the primary market or exchange on which they are traded and are categorized as Level 1 in the hierarchy. In the event there were no sales during the day but the exchange reports a closing bid level, ETFs are valued at the closing bid and would be categorized as Level 1 in the hierarchy. In the event there was no closing bid, ETFs may be valued by another method that the Board believes reflects fair value in accordance with the Board's fair value pricing policies and may be categorized as Level 2 in the hierarchy.
Futures contracts are valued at the settlement price established each day by the board of trade or exchange on which they are traded and are categorized as Level 1 in the hierarchy. Investments in open-end mutual funds, including the Fidelity Central Funds, are valued at their closing net asset value (NAV) each business day and are categorized as Level 1 in the hierarchy.
Changes in valuation techniques may result in transfers in or out of an assigned level within the disclosure hierarchy. The aggregate value of investments by input level as of October 31, 2018, including information on transfers between Levels 1 and 2, as well as a roll forward of Level 3 investments, is included at the end of each applicable Fund's Schedule of Investments.
Foreign Currency. The Funds may use foreign currency contracts to facilitate transactions in foreign-denominated securities. Gains and losses from these transactions may arise from changes in the value of the foreign currency or if the counterparties do not perform under the contracts' terms.
Foreign-denominated assets, including investment securities, and liabilities are translated into U.S. dollars at the exchange rates at period end. Purchases and sales of investment securities, income and dividends received and expenses denominated in foreign currencies are translated into U.S. dollars at the exchange rate in effect on the transaction date.
The effects of exchange rate fluctuations on investments are included with the net realized and unrealized gain (loss) on investment securities. Other foreign currency transactions resulting in realized and unrealized gain (loss) are disclosed separately.
Investment Transactions and Income. For financial reporting purposes, the Funds' investment holdings and NAV include trades executed through the end of the last business day of the period. The NAV per share for processing shareholder transactions is calculated as of the close of business of the New York Stock Exchange (NYSE), normally 4:00 p.m. Eastern time and includes trades executed through the end of the prior business day. Gains and losses on securities sold are determined on the basis of identified cost and for certain Funds include proceeds received from litigation. Dividend income is recorded on the ex-dividend date, except for certain dividends from foreign securities where the ex-dividend date may have passed, which are recorded as soon as the Funds are informed of the ex-dividend date. Non-cash dividends included in dividend income, if any, are recorded at the fair market value of the securities received. Income and capital gain distributions from Fidelity Central Funds, if any, are recorded on the ex-dividend date. Certain distributions received by the Funds represent a return of capital or capital gain. The Funds determine the components of these distributions subsequent to the ex-dividend date, based upon receipt of tax filings or other correspondence relating to the underlying investment. These distributions are recorded as a reduction of cost of investments and/or as a realized gain. Interest income is accrued as earned and includes coupon interest and amortization of premium and accretion of discount on debt securities as applicable. Investment income is recorded net of foreign taxes withheld where recovery of such taxes is uncertain.
Expenses. Expenses directly attributable to a fund are charged to that fund. Expenses attributable to more than one fund are allocated among the respective funds on the basis of relative net assets or other appropriate methods. Expense estimates are accrued in the period to which they relate and adjustments are made when actual amounts are known.
Income Tax Information and Distributions to Shareholders. Each year, each Fund intends to qualify as a regulated investment company under Subchapter M of the Internal Revenue Code, including distributing substantially all of its taxable income and realized gains. As a result, no provision for U.S. Federal income taxes is required. As of October 31, 2018, each Fund did not have any unrecognized tax benefits in the financial statements; nor is each Fund aware of any tax positions for which it is reasonably possible that the total amounts of unrecognized tax benefits will significantly change in the next twelve months. Each Fund files a U.S. federal tax return, in addition to state and local tax returns as required. Each Fund's federal income tax returns are subject to examination by the Internal Revenue Service (IRS) for a period of three fiscal years after they are filed. State and local tax returns may be subject to examination for an additional fiscal year depending on the jurisdiction. Foreign taxes are provided for based on each Fund's understanding of the tax rules and rates that exist in the foreign markets in which it invests. Fidelity Series Emerging Markets Fund, Fidelity Series Emerging Markets Opportunities Fund and Fidelity Series International Small Cap Fund are subject to a tax imposed on capital gains by certain countries in which they invest. An estimated deferred tax liability for net unrealized appreciation on the applicable securities is included in Other payables and accrued expenses on Fidelity Series Emerging Markets and Fidelity Series International Small Cap Statements of Assets & Liabilities.
Distributions are declared and recorded on the ex-dividend date. Income and capital gain distributions are determined in accordance with income tax regulations, which may differ from GAAP.
Capital accounts within the financial statements are adjusted for permanent book-tax differences. These adjustments have no impact on net assets or the results of operations. Capital accounts are not adjusted for temporary book-tax differences which will reverse in a subsequent period.
Book-tax differences are primarily due to futures contracts, foreign currency transactions, certain foreign taxes, passive foreign investment companies (PFIC), market discount, capital loss carryforwards, and losses deferred due to wash sales.
As of period end, the cost and unrealized appreciation (depreciation) in securities, and derivatives if applicable, for federal income tax purposes were as follows for each Fund:
| | Tax cost | Gross unrealized appreciation | Gross unrealized depreciation | Net unrealized appreciation (depreciation) |
| Fidelity Series Emerging Markets Fund | $1,418,314,244 | $21,665,797 | $(95,997,913) | $(74,332,116) |
| Fidelity Series Emerging Markets Opportunities Fund | 12,756,355,220 | 2,360,152,297 | (1,457,447,894) | 902,704,403 |
| Fidelity Series International Growth Fund | 11,182,557,535 | 3,814,022,987 | (482,053,471) | 3,331,969,516 |
| Fidelity Series International Small Cap Fund | 2,557,471,176 | 880,542,415 | (208,014,728) | 672,527,687 |
| Fidelity Series International Value Fund | 13,883,197,617 | 1,520,247,355 | (1,149,690,807) | 370,556,548 |
The tax-based components of distributable earnings as of period end were as follows for each Fund:
| | Undistributed ordinary income | Undistributed long-term capital gain | Capital loss carryforward | Net unrealized appreciation (depreciation) on securities and other investments |
| Fidelity Series Emerging Markets Fund | $240,035 | $– | $(10,579,168) | $(74,341,627) |
| Fidelity Series Emerging Markets Opportunities Fund | 249,156,895 | 872,928,807 | – | 902,156,685 |
| Fidelity Series International Growth Fund | 248,971,060 | 659,044,392 | – | 3,331,580,082 |
| Fidelity Series International Small Cap Fund | 72,270,389 | 231,049,830 | – | 672,444,364 |
| Fidelity Series International Value Fund | 464,648,422 | – | (337,150,639) | 369,698,371 |
Capital loss carryforwards are only available to offset future capital gains of the Funds to the extent provided by regulations and may be limited. Under the Regulated Investment Company Modernization Act of 2010 (the Act), the Funds are permitted to carry forward capital losses incurred in taxable years beginning after December 22, 2010 for an unlimited period and such capital losses are required to be used prior to any losses that expire. The capital loss carryforward information presented below, including any applicable limitation, is estimated as of fiscal period end and is subject to adjustment.
| | No expiration | | | |
| | Short-term | Long-term | Total no expiration | Total capital loss carryfoward |
| Fidelity Series Emerging Markets Fund | $(10,539,477) | $(39,691) | $(10,579,168) | $(10,579,168) |
| Fidelity Series International Value Fund | (337,150,639) | – | (337,150,639) | (337,150,639) |
The tax character of distributions paid was as follows:
| October 31, 2018 | | | |
| | Ordinary Income | Long-term Capital Gains | Total |
| Fidelity Series Emerging Markets Opportunities Fund | $338,422,741 | $103,964,613 | $442,387,354 |
| Fidelity Series International Growth Fund | 236,238,796 | 224,426,856 | 460,665,652 |
| Fidelity Series International Small Cap Fund | 105,491,413 | 112,614,009 | 218,105,422 |
| Fidelity Series International Value Fund | 460,693,677 | – | 460,693,677 |
| October 31, 2017 | | | |
| | Ordinary Income | Long-term Capital Gains | Total |
| Fidelity Series Emerging Markets Opportunities Fund | $227,179,652 | $– | $227,179,652 |
| Fidelity Series International Growth Fund | 170,410,130 | 166,389,831 | 336,799,961 |
| Fidelity Series International Small Cap Fund | 38,460,779 | 81,153,343 | 119,614,122 |
| Fidelity Series International Value Fund | 353,862,300 | – | 353,862,300 |
Restricted Securities. The Funds may invest in securities that are subject to legal or contractual restrictions on resale. These securities generally may be resold in transactions exempt from registration or to the public if the securities are registered. Disposal of these securities may involve time-consuming negotiations and expense, and prompt sale at an acceptable price may be difficult. Information regarding restricted securities is included at the end of each applicable Fund's Schedule of Investments.
New Rule Issuance. During August 2018, the U.S. Securities and Exchange Commission issued Final Rule Release No. 33-10532, Disclosure Update and Simplification. This Final Rule includes amendments specific to registered investment companies that are intended to eliminate overlap in disclosure requirements between Regulation S-X and GAAP. In accordance with these amendments, certain line-items in the Funds' financial statements have been combined or removed for the current period as outlined in the table below.
| Financial Statement | Current Line-Item Presentation | Prior Line-Item Presentation |
| Statement of Assets and Liabilities | Total distributable earnings (loss) | Undistributed/Distributions in excess of/Accumulated net investment income (loss)
Accumulated/Undistributed net realized gain (loss)
Net unrealized appreciation (depreciation) |
| Statement of Changes in Net Assets | N/A - removed | Undistributed/Distributions in excess of/Accumulated net investment income (loss) end of period |
| Statement of Changes in Net Assets | Distributions to shareholders | Distributions to shareholders from net investment income
Distributions to shareholders from net realized gain |
| Distributions to Shareholders Note to Financial Statements | Distributions to shareholders | Distributions to shareholders from net investment income
Distributions to shareholders from net realized gain |
4. Derivative Instruments.
Risk Exposures and the Use of Derivative Instruments. The Funds' investment objective allows the Funds to enter into various types of derivative contracts, including futures contracts. Derivatives are investments whose value is primarily derived from underlying assets, indices or reference rates and may be transacted on an exchange or over-the-counter (OTC). Derivatives may involve a future commitment to buy or sell a specified asset based on specified terms, to exchange future cash flows at periodic intervals based on a notional principal amount, or for one party to make one or more payments upon the occurrence of specified events in exchange for periodic payments from the other party.
The Funds used derivatives to increase returns and to manage exposure to certain risks as defined below. The success of any strategy involving derivatives depends on analysis of numerous economic factors, and if the strategies for investment do not work as intended, the Funds may not achieve their objectives.
The Funds' use of derivatives increased or decreased their exposure to the following risk:
| Equity Risk | Equity risk relates to the fluctuations in the value of financial instruments as a result of changes in market prices (other than those arising from interest rate risk or foreign exchange risk), whether caused by factors specific to an individual investment, its issuer, or all factors affecting all instruments traded in a market or market segment.
|
The Funds are also exposed to additional risks from investing in derivatives, such as liquidity risk and counterparty credit risk. Liquidity risk is the risk that the Funds will be unable to close out the derivative in the open market in a timely manner. Counterparty credit risk is the risk that the counterparty will not be able to fulfill its obligation to the Funds.
Investing in derivatives may involve greater risks than investing in the underlying assets directly and, to varying degrees, may involve risk of loss in excess of any initial investment and collateral received and amounts recognized in the Statement of Assets and Liabilities. In addition, there may be the risk that the change in value of the derivative contract does not correspond to the change in value of the underlying instrument.
Net Realized Gain (Loss) and Change in Net Unrealized Appreciation (Depreciation) on Derivatives. The table below, which reflects the impacts of derivatives on the financial performance of the applicable Funds, summarizes the net realized gain (loss) and change in net unrealized appreciation (depreciation) for derivatives during the period as presented in the Statement of Operations.
| Primary Risk Exposure / Derivative Type | Net Realized Gain (Loss) | Change in Net Unrealized Appreciation (Depreciation) |
| Fidelity Series Emerging Markets Fund | | |
| Equity Risk | | |
| Futures Contracts | $(66,151) | $– |
| Total Equity Risk | (66,151) | – |
| Fidelity Series Emerging Markets Opportunities Fund | | |
| Equity Risk | | |
| Futures Contracts | $(31,377,745) | $(5,261,593) |
| Total Equity Risk | (31,377,745) | (5,261,593) |
| Totals | $(31,377,745) | $(5,261,593) |
A summary of the value of derivatives by primary risk exposure as of period end, if any, is included at the end of the Schedule of Investments.
Futures Contracts. A futures contract is an agreement between two parties to buy or sell a specified underlying instrument for a fixed price at a specified future date. The Funds used futures contracts to manage their exposure to the stock market.
Upon entering into a futures contract, a fund is required to deposit either cash or securities (initial margin) with a clearing broker in an amount equal to a certain percentage of the face value of the contract. Futures contracts are marked-to-market daily and subsequent daily payments (variation margin) are made or received by a fund depending on the daily fluctuations in the value of the futures contracts and are recorded as unrealized appreciation or (depreciation). This receivable and/or payable, if any, is included in daily variation margin on futures contracts in the Statement of Assets and Liabilities. Realized gain or (loss) is recorded upon the expiration or closing of a futures contract. The net realized gain (loss) and change in net unrealized appreciation (depreciation) on futures contracts during the period is presented in the Statement of Operations.
Any open futures contracts at period end are presented in the Schedule of Investments under the caption "Futures Contracts". The notional amount at value reflects each contract's exposure to the underlying instrument or index at period end and is representative of volume of activity during the period.
5. Purchases and Sales of Investments.
Purchases and sales of securities, other than short-term securities and in-kind transactions, are noted in the table below.
| | Purchases ($) | Sales ($) |
| Fidelity Series Emerging Markets Fund | 853,795,079 | 79,771,073 |
| Fidelity Series Emerging Markets Opportunities Fund | 9,311,260,742 | 9,390,293,178 |
| Fidelity Series International Growth Fund | 4,743,513,488 | 4,908,465,203 |
| Fidelity Series International Small Cap Fund | 473,522,430 | 862,854,676 |
| Fidelity Series International Value Fund | 6,907,546,539 | 6,304,399,750 |
6. Fees and Other Transactions with Affiliates.
Management Fee. Fidelity Management & Research Company (the investment adviser) and its affiliates provide the Funds with investment management related services for which the Funds do not pay a management fee. Under the management contract, the investment adviser or an affiliate pays all ordinary operating expenses of the Funds, except custody fees, fees and expenses of the independent Trustees, and certain miscellaneous expenses such as proxy and shareholder meeting expenses.
Brokerage Commissions. Certain Funds placed a portion of their portfolio transactions with brokerage firms which are affiliates of the investment adviser. Brokerage commissions are included in net realized gain (loss) and change in net unrealized appreciation (depreciation) in the Statement of Operations. The commissions paid to these affiliated firms were as follows:
| | Amount |
| Fidelity Series Emerging Markets Fund | $870 |
| Fidelity Series Emerging Markets Opportunities Fund | 105,267 |
| Fidelity Series International Growth Fund | 22,419 |
| Fidelity Series International Small Cap Fund | 1,321 |
| Fidelity Series International Value Fund | 10,556 |
Interfund Lending Program. Pursuant to an Exemptive Order issued by the SEC, the Funds, along with other registered investment companies having management contracts with FMR or other affiliated entities of FMR, may participate in an interfund lending program. This program provides an alternative credit facility allowing the funds to borrow from, or lend money to, other participating affiliated funds. At period end, there were no interfund loans outstanding. Each applicable fund's activity in this program during the period for which loans were outstanding was as follows:
| | Borrower or Lender | Average Loan Balance | Weighted Average Interest Rate | Interest Expense |
| Fidelity Series Emerging Markets Opportunities Fund | Borrower | $25,640,250 | 1.39% | $15,870 |
| Fidelity Series International Small Cap Fund | Borrower | $13,957,000 | 1.59% | $2,458 |
| Fidelity Series International Value Fund | Borrower | $54,406,667 | 1.61% | $7,287 |
Interfund Trades. The Funds may purchase from or sell securities to other Fidelity Funds under procedures adopted by the Board. The procedures have been designed to ensure these interfund trades are executed in accordance with Rule 17a-7 of the 1940 Act. Interfund trades are included within the respective purchases and sales amounts shown in the Purchases and Sales of Investments note.
Other. During the period, the investment adviser reimbursed the Funds for certain losses as follows:
| | Amount |
| Fidelity Series Emerging Markets Opportunities Fund | $38,322 |
| Fidelity Series International Growth Fund | 223,849 |
| Fidelity Series International Small Cap Fund | 203,770 |
| Fidelity Series International Value Fund | 48,225 |
Exchanges In-Kind. During the period, an affiliated entity completed an exchange in-kind with the Fidelity Series Emerging Markets Fund. The affiliated entity delivered investments valued at $548,241,767 in exchange for 58,062,553 shares of the Fidelity Series Emerging Markets Fund. The amount of in-kind exchanges is included in share transactions in the accompanying Statement of Changes in Net Assets. The Fidelity Series Emerging Markets Fund recognized no gain or loss for federal income tax purposes.
7. Committed Line of Credit.
Certain Funds participate with other funds managed by the investment adviser or an affiliate in a $4.25 billion credit facility (the "line of credit") to be utilized for temporary or emergency purposes to fund shareholder redemptions or for other short-term liquidity purposes. The participating funds have agreed to pay commitment fees on their pro-rata portion of the line of credit, which are reflected in Commitment fees on the Statement of Operations, and are as follows:
| Fidelity Series Emerging Markets Opportunities Fund | $41,401 |
| Fidelity Series International Growth Fund | 40,476 |
| Fidelity Series International Small Cap Fund | 9,794 |
| Fidelity Series International Value Fund | 40,467 |
During the period, the Funds did not borrow on this line of credit.
8. Security Lending.
Certain Funds lend portfolio securities through a lending agent from time to time in order to earn additional income. For equity securities, a lending agent is used and may loan securities to certain qualified borrowers, including Fidelity Capital Markets (FCM), a broker-dealer affiliated with the Funds. On the settlement date of the loan, each applicable Fund receives collateral (in the form of U.S. Treasury obligations, letters of credit and/or cash) against the loaned securities and maintains collateral in an amount not less than 100% of the market value of the loaned securities during the period of the loan. The market value of the loaned securities is determined at the close of business of the Funds and any additional required collateral is delivered to the Funds on the next business day. The Funds or borrower may terminate the loan at any time, and if the borrower defaults on its obligation to return the securities loaned because of insolvency or other reasons, the Funds may apply collateral received from the borrower against the obligation. The Funds may experience delays and costs in recovering the securities loaned. Any cash collateral received is invested in the Fidelity Securities Lending Cash Central Fund. The value of loaned securities and cash collateral at period end are disclosed on each applicable Fund's Statement of Assets and Liabilities. Security lending income represents the income earned on investing cash collateral, less rebates paid to borrowers and any lending agent fees associated with the loan, plus any premium payments received for lending certain types of securities. Security lending income is presented on each applicable Fund's Statement of Operations as a component of income from Fidelity Central Funds. FCM security lending activity was as follows:
| | Total Security Lending Income | Security Lending Income From Securities Loaned to FCM | Value of Securities Loaned to FCM at Period End |
| Fidelity Series Emerging Markets Opportunities Fund | $1,830,805 | $8,979 | $913,600 |
| Fidelity Series International Growth Fund | $1,585,610 | $11,671 | $– |
| Fidelity Series International Small Cap Fund | $763,165 | $414 | $– |
| Fidelity Series International Value Fund | $7,302,519 | $6,956 | $– |
9. Expense Reductions.
The investment adviser contractually agreed to reimburse each Fund to the extent annual operating expenses exceeded certain levels of average net assets as noted in the table below. This reimbursement will remain in place through February 28, 2022 for Fidelity Series Emerging Markets Fund and December 31, 2020 for Fidelity Series Emerging Markets Opportunities Fund, respectively. Some expenses, for example the compensation of the independent Trustees, and certain miscellaneous expenses such as proxy and shareholder meeting expenses, are excluded from this reimbursement.
The following Funds were in reimbursement during the period:
| | Expense Limitations | Reimbursement |
| Fidelity Series Emerging Markets Fund | .014% | $31,938 |
| Fidelity Series Emerging Markets Opportunities Fund | .014% | $5,609,850 |
Commissions paid to certain brokers with whom the investment adviser, or its affiliates, places trades on behalf of certain Funds include an amount in addition to trade execution, which may be rebated back to the Funds to offset certain expenses. In addition, through arrangements with each applicable Fund's custodian, credits realized as a result of certain uninvested cash balances were used to reduce the Fund's expenses. All of the applicable expense reductions are noted in the table below.
| | Brokerage Service reduction | Custody reduction |
| Fidelity Series International Growth Fund | $1,060,761 | $3,268 |
| Fidelity Series International Small Cap Fund | 120,347 | – |
| Fidelity Series International Value Fund | 1,352,774 | – |
10. Distributions to Shareholders.
Distributions to shareholders of each class for the applicable Funds were as follows:
| | Year ended
October 31, 2018 | Year ended
October 31, 2017 |
| Fidelity Series Emerging Markets Opportunities Fund | | |
| Distributions to shareholders | | |
| Series Emerging Markets Opportunities | $442,387,354 | $– |
| Total | $442,387,354 | $– |
| From net investment income | | |
| Series Emerging Markets Opportunities | $– | $82,269,688 |
| Class F | – | 111,268,765 |
| Total | $– | $193,538,453 |
| From net realized gain | | |
| Series Emerging Markets Opportunities | $– | $15,266,540 |
| Class F | – | 18,374,659 |
| Total | $– | $33,641,199 |
| Fidelity Series International Growth Fund | | |
| Distributions to shareholders | | |
| Series International Growth | $460,665,652 | $– |
| Total | $460,665,652 | $– |
| From net investment income | | |
| Series International Growth | $– | $71,631,335 |
| Class F | – | 98,778,795 |
| Total | $– | $170,410,130 |
| From net realized gain | | |
| Series International Growth | $– | $74,784,915 |
| Class F | – | 91,604,916 |
| Total | $– | $166,389,831 |
| Fidelity Series International Small Cap Fund | | |
| Distributions to shareholders | | |
| Series International Small Cap | $218,105,422 | $– |
| Total | $218,105,422 | $– |
| From net investment income | | |
| Series International Small Cap | $– | $14,167,288 |
| Class F | – | 19,989,904 |
| Total | $– | $34,157,192 |
| From net realized gain | | |
| Series International Small Cap | $– | $38,362,071 |
| Class F | – | 47,094,859 |
| Total | $– | $85,456,930 |
| Fidelity Series International Value Fund | | |
| Distributions to shareholders | | |
| Series International Value | $460,693,678 | $– |
| Total | $460,693,678 | $– |
| From net investment income | | |
| Series International Value | $– | $143,191,242 |
| Class F | – | 186,385,696 |
| Total | $– | $329,576,938 |
| From net realized gain | | |
| Series International Value | $– | $10,915,924 |
| Class F | – | 13,369,438 |
| Total | $– | $24,285,362 |
11. Share Transactions.
Transactions for each class of shares for the applicable Funds were as follows:
| | Shares | Shares | Dollars | Dollars |
| | Year ended October 31, 2018 | Year endedOctober 31, 2017 | Year ended October 31, 2018 | Year endedOctober 31, 2017 |
| Fidelity Series Emerging Markets Opportunities Fund | | | | |
| Series Emerging Markets Opportunities | | | | |
| Shares sold | 137,281,893 | 519,778,624 | $2,738,486,790 | $10,628,254,799 |
| Reinvestment of distributions | 21,392,038 | 6,260,348 | 442,387,354 | 97,536,228 |
| Shares redeemed | (126,152,959) | (205,349,586) | (2,705,305,537) | (4,080,491,417) |
| Net increase (decrease) | 32,520,972 | 320,689,386 | $475,568,607 | $6,645,299,610 |
| Class F | | | | |
| Shares sold | – | 47,966,801 | $– | $834,470,841 |
| Reinvestment of distributions | – | 8,299,835 | – | 129,643,424 |
| Shares redeemed | – | (558,565,734) | – | (11,293,892,850) |
| Net increase (decrease) | – | (502,299,098) | $– | $(10,329,778,585) |
| Fidelity Series International Growth Fund | | | | |
| Series International Growth | | | | |
| Shares sold | 126,128,565 | 616,887,379 | $2,006,174,828 | $9,472,471,861 |
| Reinvestment of distributions | 29,082,428 | 11,528,839 | 460,665,652 | 146,416,250 |
| Shares redeemed | (122,800,370) | (137,272,697) | (2,005,553,650) | (2,083,470,910) |
| Net increase (decrease) | 32,410,623 | 491,143,521 | $461,286,830 | $7,535,417,201 |
| Class F | | | | |
| Shares sold | – | 82,432,313 | $– | $1,122,218,322 |
| Reinvestment of distributions | – | 14,967,273 | – | 190,383,711 |
| Shares redeemed | – | (611,580,376) | – | (9,409,531,402) |
| Net increase (decrease) | – | (514,180,790) | $– | $(8,096,929,369) |
| Fidelity Series International Small Cap Fund | | | | |
| Series International Small Cap | | | | |
| Shares sold | 18,009,759 | 126,808,547 | $326,419,558 | $2,182,522,510 |
| Reinvestment of distributions | 12,463,167 | 3,725,486 | 218,105,422 | 52,529,358 |
| Shares redeemed | (30,732,361) | (20,793,540) | (568,536,120) | (347,551,675) |
| Net increase (decrease) | (259,435) | 109,740,493 | $(24,011,140) | $1,887,500,193 |
| Class F | | | | |
| Shares sold | – | 15,972,969 | $– | $242,899,916 |
| Reinvestment of distributions | – | 4,751,046 | – | 67,084,763 |
| Shares redeemed | – | (126,992,159) | – | (2,185,674,132) |
| Net increase (decrease) | – | (106,268,144) | $– | $(1,875,689,453) |
| Fidelity Series International Value Fund | | | | |
| Series International Value | | | | |
| Shares sold | 165,958,158 | 901,998,924 | $1,724,408,564 | $9,348,838,001 |
| Reinvestment of distributions | 43,750,587 | 16,805,580 | 460,693,677 | 154,107,166 |
| Shares redeemed | (121,273,736) | (180,222,845) | (1,299,313,186) | (1,855,842,145) |
| Net increase (decrease) | 88,435,009 | 738,581,659 | $885,789,055 | $7,647,103,022 |
| Class F | | | | |
| Shares sold | – | 100,477,660 | $– | $970,415,947 |
| Reinvestment of distributions | – | 21,759,819 | – | 199,755,135 |
| Shares redeemed | – | (884,352,197) | – | (9,172,700,017) |
| Net increase (decrease) | – | (762,114,718) | $– | $(8,002,528,935) |
12. Other.
The Funds' organizational documents provide former and current trustees and officers with a limited indemnification against liabilities arising in connection with the performance of their duties to the Funds. In the normal course of business, the Funds may also enter into contracts that provide general indemnifications. The Funds' maximum exposure under these arrangements is unknown as this would be dependent on future claims that may be made against the Funds. The risk of material loss from such claims is considered remote.
At the end of the period, mutual funds managed by the investment adviser or its affiliates were the owners of record of all of the outstanding shares of the Funds.
Report of Independent Registered Public Accounting Firm
To the Trustees of Fidelity Investment Trust and Shareholders of Fidelity Series Emerging Markets Fund, Fidelity Series Emerging Markets Opportunities Fund (formerly Fidelity Series Emerging Markets Fund), Fidelity Series International Small Cap Fund and Fidelity Series International Value Fund:
Opinion on the Financial Statements and Financial Highlights
We have audited the accompanying statements of assets and liabilities of Fidelity Series Emerging Markets Fund, Fidelity Series Emerging Markets Opportunities Fund (formerly Fidelity Series Emerging Markets Fund), Fidelity Series International Small Cap Fund and Fidelity Series International Value Fund (the "Funds"), each a fund of Fidelity Investment Trust, including the schedules of investments, as of October 31, 2018; the related statements of operations for the year then ended, the statements of changes in net assets for each of the two years in the period then ended, and the financial highlights for each of the five years in the period then ended for Fidelity Series Emerging Markets Opportunities Fund, Fidelity Series International Small Cap Fund and Fidelity Series International Value Fund; the related statements of operations, changes in net assets, and the financial highlights for the period from August 29, 2018 (commencement of operations) to October 31, 2018 for Fidelity Series Emerging Markets Fund; and the related notes. In our opinion, the financial statements and financial highlights present fairly, in all material respects, the financial position of each of the funds as of October 31, 2018, and the results of their operations for the year then ended (or for the period defined above), the changes in their net assets for each of the two years in the period then ended (or for the period defined above), and the financial highlights for each of the five years in the period then ended (or for the period defined above), in conformity with accounting principles generally accepted in the United States of America.
Basis for Opinion
These financial statements and financial highlights are the responsibility of the Funds' management. Our responsibility is to express an opinion on the Funds' financial statements and financial highlights based on our audits. We are a public accounting firm registered with the Public Company Accounting Oversight Board (United States) (PCAOB) and are required to be independent with respect to the Funds in accordance with the U.S. federal securities laws and the applicable rules and regulations of the Securities and Exchange Commission and the PCAOB.
We conducted our audits in accordance with the standards of the PCAOB. Those standards require that we plan and perform the audit to obtain reasonable assurance about whether the financial statements and financial highlights are free of material misstatement, whether due to error or fraud. The Funds are not required to have, nor were we engaged to perform, an audit of their internal control over financial reporting. As part of our audits we are required to obtain an understanding of internal control over financial reporting but not for the purpose of expressing an opinion on the effectiveness of the Funds' internal control over financial reporting. Accordingly, we express no such opinion.
Our audits included performing procedures to assess the risks of material misstatement of the financial statements and financial highlights, whether due to error or fraud, and performing procedures that respond to those risks. Such procedures included examining, on a test basis, evidence regarding the amounts and disclosures in the financial statements and financial highlights. Our audits also included evaluating the accounting principles used and significant estimates made by management, as well as evaluating the overall presentation of the financial statements and financial highlights. Our procedures included confirmation of securities owned as of October 31, 2018, by correspondence with the custodians and brokers; when replies were not received from brokers, we performed other auditing procedures. We believe that our audits provide a reasonable basis for our opinion.
/s/ Deloitte & Touche LLP
Boston, Massachusetts
December 18, 2018
We have served as the auditor of one or more of the Fidelity investment companies since 1999.
Report of Independent Registered Public Accounting Firm
To the Board of Trustees of Fidelity Investment Trust and Shareholders of Fidelity Series International Growth Fund:
Opinion on the Financial Statements
We have audited the accompanying statement of assets and liabilities, including the schedule of investments, of Fidelity Series International Growth Fund (one of the funds constituting Fidelity Investment Trust, referred to hereafter as the "Fund") as of October 31, 2018, the related statement of operations for the year ended October 31, 2018, the statement of changes in net assets for each of the two years in the period ended October 31, 2018, including the related notes, and the financial highlights for each of the five years in the period ended October 31, 2018 (collectively referred to as the “financial statements”). In our opinion, the financial statements present fairly, in all material respects, the financial position of the Fund as of October 31, 2018, the results of its operations for the year then ended, the changes in its net assets for each of the two years in the period ended October 31, 2018 and the financial highlights for each of the five years in the period ended October 31, 2018 in conformity with accounting principles generally accepted in the United States of America.
Basis for Opinion
These financial statements are the responsibility of the Fund’s management. Our responsibility is to express an opinion on the Fund’s financial statements based on our audits. We are a public accounting firm registered with the Public Company Accounting Oversight Board (United States) (“PCAOB”) and are required to be independent with respect to the Fund in accordance with the U.S. federal securities laws and the applicable rules and regulations of the Securities and Exchange Commission and the PCAOB.
We conducted our audits of these financial statements in accordance with the standards of the PCAOB. Those standards require that we plan and perform the audit to obtain reasonable assurance about whether the financial statements are free of material misstatement, whether due to error or fraud.
Our audits included performing procedures to assess the risks of material misstatement of the financial statements, whether due to error or fraud, and performing procedures that respond to those risks. Such procedures included examining, on a test basis, evidence regarding the amounts and disclosures in the financial statements. Our audits also included evaluating the accounting principles used and significant estimates made by management, as well as evaluating the overall presentation of the financial statements. Our procedures included confirmation of securities owned as of October 31, 2018 by correspondence with the custodian, and brokers; when replies were not received from brokers, we performed other auditing procedures. We believe that our audits provide a reasonable basis for our opinion.
PricewaterhouseCoopers LLP
Boston, Massachusetts
December 18, 2018
We have served as the auditor of one or more investment companies in the Fidelity group of funds since 1932.
Trustees and Officers
The Trustees, Members of the Advisory Board (if any), and officers of the trust and funds, as applicable, are listed below. The Board of Trustees governs each fund and is responsible for protecting the interests of shareholders. The Trustees are experienced executives who meet periodically throughout the year to oversee each fund's activities, review contractual arrangements with companies that provide services to each fund, oversee management of the risks associated with such activities and contractual arrangements, and review each fund's performance. Except for Jonathan Chiel, each of the Trustees oversees 283 funds. Mr. Chiel oversees 154 funds.
The Trustees hold office without limit in time except that (a) any Trustee may resign; (b) any Trustee may be removed by written instrument, signed by at least two-thirds of the number of Trustees prior to such removal; (c) any Trustee who requests to be retired or who has become incapacitated by illness or injury may be retired by written instrument signed by a majority of the other Trustees; and (d) any Trustee may be removed at any special meeting of shareholders by a two-thirds vote of the outstanding voting securities of the trust. Each Trustee who is not an interested person (as defined in the 1940 Act) of the trust and the funds is referred to herein as an Independent Trustee. Each Independent Trustee shall retire not later than the last day of the calendar year in which his or her 75th birthday occurs. The Independent Trustees may waive this mandatory retirement age policy with respect to individual Trustees. Officers and Advisory Board Members hold office without limit in time, except that any officer or Advisory Board Member may resign or may be removed by a vote of a majority of the Trustees at any regular meeting or any special meeting of the Trustees. Except as indicated, each individual has held the office shown or other offices in the same company for the past five years.
Each fund’s Statement of Additional Information (SAI) includes more information about the Trustees. To request a free copy, call Fidelity at 1-800-544-8544.
Experience, Skills, Attributes, and Qualifications of the Trustees. The Governance and Nominating Committee has adopted a statement of policy that describes the experience, qualifications, attributes, and skills that are necessary and desirable for potential Independent Trustee candidates (Statement of Policy). The Board believes that each Trustee satisfied at the time he or she was initially elected or appointed a Trustee, and continues to satisfy, the standards contemplated by the Statement of Policy. The Governance and Nominating Committee also engages professional search firms to help identify potential Independent Trustee candidates who have the experience, qualifications, attributes, and skills consistent with the Statement of Policy. From time to time, additional criteria based on the composition and skills of the current Independent Trustees, as well as experience or skills that may be appropriate in light of future changes to board composition, business conditions, and regulatory or other developments, have also been considered by the professional search firms and the Governance and Nominating Committee. In addition, the Board takes into account the Trustees' commitment and participation in Board and committee meetings, as well as their leadership of standing and ad hoc committees throughout their tenure.
In determining that a particular Trustee was and continues to be qualified to serve as a Trustee, the Board has considered a variety of criteria, none of which, in isolation, was controlling. The Board believes that, collectively, the Trustees have balanced and diverse experience, qualifications, attributes, and skills, which allow the Board to operate effectively in governing each fund and protecting the interests of shareholders. Information about the specific experience, skills, attributes, and qualifications of each Trustee, which in each case led to the Board's conclusion that the Trustee should serve (or continue to serve) as a trustee of the funds, is provided below.
Board Structure and Oversight Function. James C. Curvey is an interested person and currently serves as Chairman. The Trustees have determined that an interested Chairman is appropriate and benefits shareholders because an interested Chairman has a personal and professional stake in the quality and continuity of services provided to the funds. Independent Trustees exercise their informed business judgment to appoint an individual of their choosing to serve as Chairman, regardless of whether the Trustee happens to be independent or a member of management. The Independent Trustees have determined that they can act independently and effectively without having an Independent Trustee serve as Chairman and that a key structural component for assuring that they are in a position to do so is for the Independent Trustees to constitute a substantial majority for the Board. The Independent Trustees also regularly meet in executive session. Ned C. Lautenbach serves as Chairman of the Independent Trustees and as such (i) acts as a liaison between the Independent Trustees and management with respect to matters important to the Independent Trustees and (ii) with management prepares agendas for Board meetings.
Fidelity® funds are overseen by different Boards of Trustees. The funds' Board oversees Fidelity's high income and certain equity funds, and other Boards oversee Fidelity's investment-grade bond, money market, asset allocation, and other equity funds. The asset allocation funds may invest in Fidelity® funds overseen by the funds' Board. The use of separate Boards, each with its own committee structure, allows the Trustees of each group of Fidelity® funds to focus on the unique issues of the funds they oversee, including common research, investment, and operational issues. On occasion, the separate Boards establish joint committees to address issues of overlapping consequences for the Fidelity® funds overseen by each Board.
The Trustees operate using a system of committees to facilitate the timely and efficient consideration of all matters of importance to the Trustees, each fund, and fund shareholders and to facilitate compliance with legal and regulatory requirements and oversight of the funds' activities and associated risks. The Board, acting through its committees, has charged FMR and its affiliates with (i) identifying events or circumstances the occurrence of which could have demonstrably adverse effects on the funds' business and/or reputation; (ii) implementing processes and controls to lessen the possibility that such events or circumstances occur or to mitigate the effects of such events or circumstances if they do occur; and (iii) creating and maintaining a system designed to evaluate continuously business and market conditions in order to facilitate the identification and implementation processes described in (i) and (ii) above. Because the day-to-day operations and activities of the funds are carried out by or through FMR, its affiliates, and other service providers, the funds' exposure to risks is mitigated but not eliminated by the processes overseen by the Trustees. While each of the Board's committees has responsibility for overseeing different aspects of the funds' activities, oversight is exercised primarily through the Operations, Audit, and Compliance Committees. In addition, the Independent Trustees have worked with Fidelity to enhance the Board's oversight of investment and financial risks, legal and regulatory risks, technology risks, and operational risks, including the development of additional risk reporting to the Board. Appropriate personnel, including but not limited to the funds' Chief Compliance Officer (CCO), FMR's internal auditor, the independent accountants, the funds' Treasurer and portfolio management personnel, make periodic reports to the Board's committees, as appropriate, including an annual review of Fidelity's risk management program for the Fidelity® funds. The responsibilities of each standing committee, including their oversight responsibilities, are described further under "Standing Committees of the Trustees."
Interested Trustees*:
Correspondence intended for a Trustee who is an interested person may be sent to Fidelity Investments, 245 Summer Street, Boston, Massachusetts 02210.
Name, Year of Birth; Principal Occupations and Other Relevant Experience+
Jonathan Chiel (1957)
Year of Election or Appointment: 2016
Trustee
Mr. Chiel also serves as Trustee of other Fidelity® funds. Mr. Chiel is Executive Vice President and General Counsel for FMR LLC (diversified financial services company, 2012-present). Previously, Mr. Chiel served as general counsel (2004-2012) and senior vice president and deputy general counsel (2000-2004) for John Hancock Financial Services; a partner with Choate, Hall & Stewart (1996-2000) (law firm); and an Assistant United States Attorney for the United States Attorney’s Office of the District of Massachusetts (1986-95), including Chief of the Criminal Division (1993-1995). Mr. Chiel is a director on the boards of the Boston Bar Foundation and the Maimonides School.
James C. Curvey (1935)
Year of Election or Appointment: 2007
Trustee
Chairman of the Board of Trustees
Mr. Curvey also serves as Trustee of other Fidelity® funds. Mr. Curvey is Vice Chairman (2007-present) and Director of FMR LLC (diversified financial services company). In addition, Mr. Curvey is an Overseer Emeritus for the Boston Symphony Orchestra, a Director of Artis-Naples, and a Trustee of Brewster Academy in Wolfeboro, New Hampshire. Previously, Mr. Curvey served as a Director of Fidelity Research & Analysis Co. (investment adviser firm, 2009-2018), Director of Fidelity Investments Money Management, Inc. (investment adviser firm, 2009-2014) and a Director of FMR and FMR Co., Inc. (investment adviser firms, 2007-2014).
Charles S. Morrison (1960)
Year of Election or Appointment: 2014
Trustee
Mr. Morrison also serves as Trustee of other funds. He serves as President of Fidelity SelectCo, LLC (investment adviser firm, 2017-present) and Fidelity Management & Research Company (FMR) (investment adviser firm, 2016-present), a Director of Fidelity Investments Money Management, Inc. (FIMM) (investment adviser firm, 2014-present), Director of Fidelity SelectCo, LLC (investment adviser firm, 2014-present), President, Asset Management (2014-present), and is an employee of Fidelity Investments. Previously, Mr. Morrison served as Vice President of Fidelity's Fixed Income and Asset Allocation Funds (2012-2014), President, Fixed Income (2011-2014), Vice President of Fidelity's Money Market Funds (2005-2009), President, Money Market Group Leader of FMR (investment adviser firm, 2009), and Senior Vice President, Money Market Group of FMR (2004-2009). Mr. Morrison also served as Vice President of Fidelity's Bond Funds (2002-2005), certain Balanced Funds (2002-2005), and certain Asset Allocation Funds (2002-2007), and as Senior Vice President (2002-2005) of Fidelity's Bond Division.
* Determined to be an “Interested Trustee” by virtue of, among other things, his or her affiliation with the trust or various entities under common control with FMR.
+ The information includes the Trustee's principal occupation during the last five years and other information relating to the experience, attributes, and skills relevant to the Trustee's qualifications to serve as a Trustee, which led to the conclusion that the Trustee should serve as a Trustee for each fund.
Independent Trustees:
Correspondence intended for an Independent Trustee may be sent to Fidelity Investments, P.O. Box 55235, Boston, Massachusetts 02205-5235.
Name, Year of Birth; Principal Occupations and Other Relevant Experience+
Dennis J. Dirks (1948)
Year of Election or Appointment: 2005
Trustee
Mr. Dirks also serves as Trustee of other Fidelity® funds. Prior to his retirement in May 2003, Mr. Dirks was Chief Operating Officer and a member of the Board of The Depository Trust & Clearing Corporation (DTCC). He also served as President, Chief Operating Officer, and Board member of The Depository Trust Company (DTC) and President and Board member of the National Securities Clearing Corporation (NSCC). In addition, Mr. Dirks served as Chief Executive Officer and Board member of the Government Securities Clearing Corporation, Chief Executive Officer and Board member of the Mortgage-Backed Securities Clearing Corporation, as a Trustee and a member of the Finance Committee of Manhattan College (2005-2008), as a Trustee and a member of the Finance Committee of AHRC of Nassau County (2006-2008), as a member of the Independent Directors Council (IDC) Governing Council (2010-2015), and as a member of the Board of Directors for The Brookville Center for Children’s Services, Inc. (2009-2017). Mr. Dirks is a member of the Finance Committee (2016-present), Board of Directors (2017-present) and Board of Trustees (2018-present) and is Treasurer (2018-present) of the Asolo Repertory Theatre.
Donald F. Donahue (1950)
Year of Election or Appointment: 2018
Trustee
Mr. Donahue also serves as a Trustee of other Fidelity® funds. Mr. Donahue is President and Chief Executive Officer of Miranda Partners, LLC (risk consulting for the financial services industry, 2012-present). Previously, Mr. Donahue served as a Member of the Advisory Board of certain Fidelity® funds (2015-2018) and Chief Executive Officer (2006-2012), Chief Operating Officer (2003-2006), and Managing Director, Customer Marketing and Development (1999-2003) of The Depository Trust & Clearing Corporation (financial markets infrastructure). Mr. Donahue serves as a Member (2007-present) and Co-Chairman (2016-present) of the Board of Directors of United Way of New York, Member of the Board of Directors of NYC Leadership Academy (2012-present) and Member of the Board of Advisors of Ripple Labs, Inc. (financial services, 2015-present). He also served as Chairman (2010-2012) and Member of the Board of Directors (2012-2013) of Omgeo, LLC (financial services), Treasurer of United Way of New York (2012-2016), and Member of the Board of Directors of XBRL US (financial services non-profit, 2009-2012) and the International Securities Services Association (2009-2012).
Alan J. Lacy (1953)
Year of Election or Appointment: 2008
Trustee
Mr. Lacy also serves as Trustee of other Fidelity® funds. Mr. Lacy serves as a Director of Bristol-Myers Squibb Company (global pharmaceuticals, 2008-present). He is a Trustee of the California Chapter of The Nature Conservancy (2015-present) and a Director of the Center for Advanced Study in the Behavioral Sciences at Stanford University (2015-present). In addition, Mr. Lacy served as Senior Adviser (2007-2014) of Oak Hill Capital Partners, L.P. (private equity) and also served as Chief Executive Officer (2005) and Vice Chairman (2005-2006) of Sears Holdings Corporation (retail) and Chief Executive Officer and Chairman of the Board of Sears, Roebuck and Co. (retail, 2000-2005). Previously, Mr. Lacy served as Chairman (2014-2017) and a member (2010-2017) of the Board of Directors of Dave & Buster’s Entertainment, Inc. (restaurant and entertainment complexes), as Chairman (2008-2011) and a member (2006-2015) of the Board of Trustees of the National Parks Conservation Association, and as a member of the Board of Directors for The Hillman Companies, Inc. (hardware wholesalers, 2010-2014), Earth Fare, Inc. (retail grocery, 2010-2014), and The Western Union Company (global money transfer, 2006-2011).
Ned C. Lautenbach (1944)
Year of Election or Appointment: 2000
Trustee
Chairman of the Independent Trustees
Mr. Lautenbach also serves as Trustee of other Fidelity® funds. Mr. Lautenbach currently serves as Vice Chair of the Board of Governors, State University System of Florida (2013-present) and is a member of the Council on Foreign Relations (1994-present). He is also a member and has most recently served as Chairman of the Board of Directors of Artis-Naples (2012-present). Previously, Mr. Lautenbach served as a member and then Lead Director of the Board of Directors of Eaton Corporation (diversified industrial, 1997-2016). He was also a Partner and Advisory Partner at Clayton, Dubilier & Rice, LLC (private equity investment, 1998-2010), as well as a Director of Sony Corporation (2006-2007). In addition, Mr. Lautenbach also had a 30-year career with IBM (technology company) during which time he served as Senior Vice President and a member of the Corporate Executive Committee (1968-1998).
Joseph Mauriello (1944)
Year of Election or Appointment: 2008
Trustee
Mr. Mauriello also serves as Trustee of other Fidelity® funds. Prior to his retirement in January 2006, Mr. Mauriello served in numerous senior management positions including Deputy Chairman and Chief Operating Officer (2004-2005), and Vice Chairman of Financial Services (2002-2004) of KPMG LLP US (professional services, 1965-2005). Mr. Mauriello currently serves as a member of the Independent Directors Council (IDC) Governing Council (2015-present). Previously, Mr. Mauriello served as a member of the Board of Directors of XL Group plc. (global insurance and re-insurance, 2006-2018).
Cornelia M. Small (1944)
Year of Election or Appointment: 2005
Trustee
Ms. Small also serves as Trustee of other Fidelity® funds. Ms. Small is a member of the Board of Directors (2009-present) and Chair of the Investment Committee (2010-present) of the Teagle Foundation. Ms. Small also serves on the Investment Committee of the Berkshire Taconic Community Foundation (2008-present). Previously, Ms. Small served as Chairperson (2002-2008) and a member of the Investment Committee and Chairperson (2008-2012) and a member of the Board of Trustees of Smith College. In addition, Ms. Small served as Chief Investment Officer, Director of Global Equity Investments, and a member of the Board of Directors of Scudder, Stevens & Clark and Scudder Kemper Investments.
Garnett A. Smith (1947)
Year of Election or Appointment: 2018
Trustee
Mr. Smith also serves as Trustee of other Fidelity® funds. Prior to Mr. Smith's retirement, he served as Chairman and Chief Executive Officer of Inbrand Corp. (manufacturer of personal absorbent products, 1990-1997). He also served as President (1986-1990) of Inbrand Corp. Prior to his employment with Inbrand Corp., he was employed by a retail fabric chain and North Carolina National Bank. In addition, Mr. Smith served as a Member of the Advisory Board of certain Fidelity® funds (2012-2013) and as a board member of the Jackson Hole Land Trust (2009-2012).
David M. Thomas (1949)
Year of Election or Appointment: 2008
Trustee
Mr. Thomas also serves as Trustee of other Fidelity® funds. Mr. Thomas serves as Non-Executive Chairman of the Board of Directors of Fortune Brands Home and Security (home and security products, 2011-present), as a member of the Board of Directors (2004-present) and Presiding Director (2013-present) of Interpublic Group of Companies, Inc. (marketing communication), and as a member of the Board of Trustees of the University of Florida (2013-present). Previously, Mr. Thomas served as Executive Chairman (2005-2006) and Chairman and Chief Executive Officer (2000-2005) of IMS Health, Inc. (pharmaceutical and healthcare information solutions), and a Director of Fortune Brands, Inc. (consumer products, 2000-2011).
+ The information includes the Trustee's principal occupation during the last five years and other information relating to the experience, attributes, and skills relevant to the Trustee's qualifications to serve as a Trustee, which led to the conclusion that the Trustee should serve as a Trustee for each fund.
Advisory Board Members and Officers:
Correspondence intended for a Member of the Advisory Board (if any) may be sent to Fidelity Investments, P.O. Box 55235, Boston, Massachusetts 02205-5235. Correspondence intended for an officer or Peter S. Lynch may be sent to Fidelity Investments, 245 Summer Street, Boston, Massachusetts 02210. Officers appear below in alphabetical order.
Name, Year of Birth; Principal Occupation
Vicki L. Fuller (1957)
Year of Election or Appointment: 2018
Member of the Advisory Board
Ms. Fuller also serves as Member of the Advisory Board of other Fidelity® funds. Ms. Fuller serves as a member of the Board of Directors, Audit Committee, and Nominating and Governance Committee of The Williams Companies, Inc. (natural gas infrastructure, 2018-present). Previously, Ms. Fuller served as the Chief Investment Officer of the New York State Common Retirement Fund (2012-2018) and held a variety of positions at AllianceBernstein L.P. (global asset management, 1985-2012), including Managing Director (2006-2012) and Senior Vice President and Senior Portfolio Manager (2001-2006).
Peter S. Lynch (1944)
Year of Election or Appointment: 2003
Member of the Advisory Board
Mr. Lynch also serves as Member of the Advisory Board of other Fidelity® funds. Mr. Lynch is Vice Chairman and a Director of FMR (investment adviser firm) and FMR Co., Inc. (investment adviser firm). In addition, Mr. Lynch serves as a Trustee of Boston College and as the Chairman of the Inner-City Scholarship Fund. Previously, Mr. Lynch served on the Special Olympics International Board of Directors (1997-2006).
William S. Stavropoulos (1939)
Year of Election or Appointment: 2018
Member of the Advisory Board
Mr. Stavropoulos also serves as Member of the Advisory Board of other Fidelity® funds. Mr. Stavropoulos serves as President and Founder of the Michigan Baseball Foundation, the Great Lakes Loons (2007-present). Mr. Stavropoulos is Chairman Emeritus of the Board of Directors of The Dow Chemical Company, where he previously served in numerous senior management positions, including President, CEO (1995-2000; 2002-2004), Chairman of the Executive Committee (2000-2006), and as a member of the Board of Directors (1990-2006). Currently, Mr. Stavropoulos is Chairman of the Board of Directors of Univar Inc. (global distributor of commodity and specialty chemicals), a Director of Teradata Corporation (data warehousing and technology solutions), and a member of the Advisory Board for Metalmark Capital LLC (private equity investment, 2005-present). Mr. Stavropoulos is an operating advisor to Clayton, Dubilier & Rice, LLC (private equity investment). In addition, Mr. Stavropoulos is a member of the University of Notre Dame Advisory Council for the College of Science, a Trustee of the Rollin L. Gerstacker Foundation, and a Director of Artis-Naples in Naples, Florida. Previously, Mr. Stavropoulos served as Trustee of certain Fidelity® funds (2001-2018) and as a Director of Chemical Financial Corporation (bank holding company, 1993-2012) and Tyco International, Ltd. (multinational manufacturing and services, 2007-2012).
Carol B. Tomé (1957)
Year of Election or Appointment: 2018
Member of the Advisory Board
Ms. Tomé also serves as Member of the Advisory Board of other Fidelity® funds. Ms. Tomé is Chief Financial Officer (2001-present) and Executive Vice President of Corporate Services (2007-present) of The Home Depot, Inc. (home improvement retailer) and a Director (2003-present) and Chair of the Audit Committee (2004-present) of United Parcel Service, Inc. (package delivery and supply chain management). Previously, Ms. Tomé served as Trustee of certain Fidelity® funds (2017), Senior Vice President of Finance and Accounting/Treasurer (2000-2007) and Vice President and Treasurer (1995-2000) of The Home Depot, Inc. and Chair of the Board (2010-2012), Vice Chair of the Board (2009 and 2013), and a Director (2008-2013) of the Federal Reserve Bank of Atlanta. Ms. Tomé is also a director or trustee of many community and professional organizations.
Michael E. Wiley (1950)
Year of Election or Appointment: 2018
Member of the Advisory Board
Mr. Wiley also serves as Trustee or Member of the Advisory Board of other Fidelity® funds. Mr. Wiley serves as a Director of High Point Resources (exploration and production, 2005-present). Previously, Mr. Wiley served as a Director of Andeavor Corporation (independent oil refiner and marketer, 2005-2018), a Director of Andeavor Logistics LP (natural resources logistics, 2015-2018), a Director of Post Oak Bank (privately-held bank, 2004-2018), a Director of Asia Pacific Exploration Consolidated (international oil and gas exploration and production, 2008-2013), a member of the Board of Trustees of the University of Tulsa (2000-2006; 2007-2010), a Senior Energy Advisor of Katzenbach Partners, LLC (consulting, 2006-2007), an Advisory Director of Riverstone Holdings (private investment), a Director of Spinnaker Exploration Company (exploration and production, 2001-2005) and Chairman, President, and CEO of Baker Hughes, Inc. (oilfield services, 2000-2004).
Elizabeth Paige Baumann (1968)
Year of Election or Appointment: 2017
Anti-Money Laundering (AML) Officer
Ms. Baumann also serves as AML Officer of other funds. She is Chief AML Officer (2012-present) and Senior Vice President (2014-present) of FMR LLC (diversified financial services company) and is an employee of Fidelity Investments. Previously, Ms. Baumann served as AML Officer of the funds (2012-2016), and Vice President (2007-2014) and Deputy Anti-Money Laundering Officer (2007-2012) of FMR LLC.
John J. Burke III (1964)
Year of Election or Appointment: 2018
Chief Financial Officer
Mr. Burke also serves as Chief Financial Officer of other funds. Mr. Burke serves as Head of Investment Operations for Fidelity Fund and Investment Operations (2018-present) and is an employee of Fidelity Investments (1998-present). Previously Mr. Burke served as head of Asset Management Investment Operations (2012-2018).
William C. Coffey (1969)
Year of Election or Appointment: 2018
Secretary and Chief Legal Officer (CLO)
Mr. Coffey also serves as Secretary and CLO of other funds. Mr. Coffey serves as CLO, Secretary, and Senior Vice President of Fidelity Management & Research Company and FMR Co., Inc. (investment adviser firms, 2018-present); Secretary of Fidelity SelectCo, LLC and Fidelity Investments Money Management, Inc. (investment adviser firms, 2018-present); and CLO of Fidelity Management & Research (Hong Kong) Limited, FMR Investment Management (UK) Limited, and Fidelity Management & Research (Japan) Limited (investment adviser firms, 2018-present). He is Senior Vice President and Deputy General Counsel of FMR LLC (diversified financial services company, 2010-present), and is an employee of Fidelity Investments. Previously, Mr. Coffey served as Assistant Secretary of certain funds (2009-2018) and as Vice President and Associate General Counsel of FMR LLC (2005-2009).
Timothy M. Cohen (1969)
Year of Election or Appointment: 2018
Vice President
Mr. Cohen also serves as Vice President of other funds. Mr. Cohen serves as Co-Head of Global Equity Research (2016-present), a Director of Fidelity Management & Research (Japan) Limited (investment adviser firm, 2016-present), and is an employee of Fidelity Investments. Previously, Mr. Cohen served as Chief Investment Officer - Equity and a Director of Fidelity Management & Research (U.K.) Inc. (investment adviser firm, 2013-2015) and as a Director of Fidelity Management & Research (Hong Kong) Limited (investment adviser firm, 2017).
Jonathan Davis (1968)
Year of Election or Appointment: 2010
Assistant Treasurer
Mr. Davis also serves as Assistant Treasurer of other funds. Mr. Davis serves as Assistant Treasurer of FMR Capital, Inc. (2017-present) and is an employee of Fidelity Investments. Previously, Mr. Davis served as Vice President and Associate General Counsel of FMR LLC (diversified financial services company, 2003-2010).
Adrien E. Deberghes (1967)
Year of Election or Appointment: 2016
Assistant Treasurer
Mr. Deberghes also serves as an officer of other funds. He serves as Assistant Treasurer of FMR Capital, Inc. (2017-present), Executive Vice President of Fidelity Investments Money Management, Inc. (FIMM) (investment adviser firm, 2016-present), and is an employee of Fidelity Investments (2008-present). Previously, Mr. Deberghes served as President and Treasurer of certain Fidelity® funds (2013-2018). Prior to joining Fidelity Investments, Mr. Deberghes was Senior Vice President of Mutual Fund Administration at State Street Corporation (2007-2008), Senior Director of Mutual Fund Administration at Investors Bank & Trust (2005-2007), and Director of Finance for Dunkin' Brands (2000-2005). Previously, Mr. Deberghes served in other fund officer roles.
Laura M. Del Prato (1964)
Year of Election or Appointment: 2018
Assistant Treasurer
Ms. Del Prato also serves as an officer of other funds. Ms. Del Prato is an employee of Fidelity Investments (2017-present). Prior to joining Fidelity Investments, Ms. Del Prato served as a Managing Director and Treasurer of the JPMorgan Mutual Funds (2014-2017). Prior to JPMorgan, Ms. Del Prato served as a partner at Cohen Fund Audit Services (accounting firm, 2012-2013) and KPMG LLP (accounting firm, 2004-2012).
Colm A. Hogan (1973)
Year of Election or Appointment: 2016
Deputy Treasurer
Mr. Hogan also serves as an officer of other funds. Mr. Hogan serves as Assistant Treasurer of FMR Capital, Inc. (2017-present) and is an employee of Fidelity Investments (2005-present). Previously, Mr. Hogan served as Assistant Treasurer of certain Fidelity® funds (2016-2018).
Pamela R. Holding (1964)
Year of Election or Appointment: 2018
Vice President
Ms. Holding also serves as Vice President of other funds. Ms. Holding serves as Co-Head of Global Equity Research (2018-present) and is an employee of Fidelity Investments (2013-present).
Chris Maher (1972)
Year of Election or Appointment: 2013
Assistant Treasurer
Mr. Maher serves as Assistant Treasurer of other funds. Mr. Maher is Vice President of Valuation Oversight, serves as Assistant Treasurer of FMR Capital, Inc. (2017-present), and is an employee of Fidelity Investments. Previously, Mr. Maher served as Vice President of Asset Management Compliance (2013), Vice President of the Program Management Group of FMR (investment adviser firm, 2010-2013), and Vice President of Valuation Oversight (2008-2010).
Rieco E. Mello (1969)
Year of Election or Appointment: 2017
Assistant Treasurer
Mr. Mello also serves as Assistant Treasurer of other funds. Mr. Mello serves as Assistant Treasurer of FMR Capital, Inc. (2017-present) and is an employee of Fidelity Investments (1995-present).
Kenneth B. Robins (1969)
Year of Election or Appointment: 2016
Chief Compliance Officer
Mr. Robins also serves as an officer of other funds. Mr. Robins serves as Compliance Officer of Fidelity Management & Research Company and FMR Co., Inc. (investment adviser firms, 2016-present) and is an employee of Fidelity Investments (2004-present). Previously, Mr. Robins served as Executive Vice President of Fidelity Investments Money Management, Inc. (investment adviser firm, 2013-2016) and served in other fund officer roles.
Stacie M. Smith (1974)
Year of Election or Appointment: 2016
President and Treasurer
Ms. Smith also serves as an officer of other funds. Ms. Smith serves as Assistant Treasurer of FMR Capital, Inc. (2017-present), is an employee of Fidelity Investments (2009-present), and has served in other fund officer roles. Prior to joining Fidelity Investments, Ms. Smith served as Senior Audit Manager of Ernst & Young LLP (accounting firm, 1996-2009). Previously, Ms. Smith served as Assistant Treasurer (2013-2018) and Deputy Treasurer (2013-2016) of certain Fidelity® funds.
Marc L. Spector (1972)
Year of Election or Appointment: 2016
Assistant Treasurer
Mr. Spector also serves as an officer of other funds. Mr. Spector serves as Assistant Treasurer of FMR Capital, Inc. (2017-present) and is an employee of Fidelity Investments (2016-present). Prior to joining Fidelity Investments, Mr. Spector served as Director at the Siegfried Group (accounting firm, 2013-2016), and prior to Siegfried Group as audit senior manager at Deloitte & Touche (accounting firm, 2005-2013).
Shareholder Expense Example
As a shareholder of a Fund, you incur two types of costs: (1) transaction costs and (2) ongoing costs, including other Fund expenses. This Example is intended to help you understand your ongoing costs (in dollars) of investing in the Funds and to compare these costs with the ongoing costs of investing in other mutual funds.
The actual expense Example is based on an investment of $1,000 invested at the beginning of the period and held for the entire period (May 1, 2018 to October 31, 2018) for Fidelity Series Emerging Markets Opportunities Fund, Fidelity Series International Growth Fund, Fidelity Series International Small Cap Fund and Fidelity Series International Value Fund, and for the period (August 29, 2018 to October 31, 2018) for Fidelity Series Emerging Markets Fund. The hypothetical expense Example is based on an investment of $1,000 invested for one-half year period (May 1, 2018 to October 31, 2018).
Actual Expenses
The first line of the accompanying table for each fund provides information about actual account values and actual expenses. You may use the information in this line, together with the amount you invested, to estimate the expenses that you paid over the period. Simply divide your account value by $1,000.00 (for example, an $8,600 account value divided by $1,000.00 = 8.6), then multiply the result by the number in the first line under the heading entitled "Expenses Paid During Period" to estimate the expenses you paid on your account during this period. In addition, the Fund, as a shareholder in the underlying Fidelity Central Funds, will indirectly bear its pro-rata share of the fees and expenses incurred by the underlying Fidelity Central Funds. These fees and expenses are not included in the Fund's annualized expense ratio used to calculate the expense estimate in the table below.
The first line of the accompanying table for each fund provides information about actual account values and actual expenses. You may use the information in this line, together with the amount you invested, to estimate the expenses that you paid over the period. Simply divide your account value by $1,000.00 (for example, an $8,600 account value divided by $1,000.00 = 8.6), then multiply the result by the number in the first line for a fund under the heading entitled "Expenses Paid During Period" to estimate the expenses you paid on your account during this period. In addition, each Fund, as a shareholder in the underlying Fidelity Central Funds, will indirectly bear its pro-rata share of the fees and expenses incurred by the underlying Fidelity Central Funds. These fees and expenses are not included in the Fund's annualized expense ratio used to calculate the expense estimate in the table below.
Hypothetical Example for Comparison Purposes
The second line of the accompanying table for each fund provides information about hypothetical account values and hypothetical expenses based on the Fund's actual expense ratio and an assumed rate of return of 5% per year before expenses, which is not the Fund's actual return. The hypothetical account values and expenses may not be used to estimate the actual ending account balance or expenses you paid for the period. You may use this information to compare the ongoing costs of investing in the Fund and other funds. To do so, compare this 5% hypothetical example with the 5% hypothetical examples that appear in the shareholder reports of the other funds. In addition, the Fund, as a shareholder in the underlying Fidelity Central Funds, will indirectly bear its pro-rata share of the fees and expenses incurred by the underlying Fidelity Central Funds. These fees and expenses are not included in the Fund's annualized expense ratio used to calculate the expense estimate in the table below.
The second line of the accompanying table for each fund provides information about hypothetical account values and hypothetical expenses based on a fund's actual expense ratio and an assumed rate of return of 5% per year before expenses, which is not the Fund's actual return. The hypothetical account values and expenses may not be used to estimate the actual ending account balance or expenses you paid for the period. You may use this information to compare the ongoing costs of investing in the Fund and other funds. To do so, compare this 5% hypothetical example with the 5% hypothetical examples that appear in the shareholder reports of the other funds. In addition, each Fund, as a shareholder in the underlying Fidelity Central Funds, will indirectly bear its pro-rata share of the fees and expenses incurred by the underlying Fidelity Central Funds. These fees and expenses are not included in the Fund's annualized expense ratio used to calculate the expense estimate in the table below.
Please note that the expenses shown in the table are meant to highlight your ongoing costs only and do not reflect any transaction costs. Therefore, the second line of the table is useful in comparing ongoing costs only, and will not help you determine the relative total costs of owning different funds.
| | Annualized Expense Ratio-A | Beginning
Account Value | Ending
Account Value
October 31, 2018 | Expenses Paid
During Period |
| Fidelity Series Emerging Markets Fund | .01% | | | |
| Actual | | $1,000.00 | $887.00 | $.02-B |
| Hypothetical-C | | $1,000.00 | $1,025.16 | $.05-D |
| Fidelity Series Emerging Markets Opportunities Fund | | | | |
| Series Emerging Markets Opportunities | .01% | | | |
| Actual | | $1,000.00 | $829.50 | $.05-B |
| Hypothetical-C | | $1,000.00 | $1,025.16 | $.05-D |
| Fidelity Series International Growth Fund | | | | |
| Series International Growth | .01% | | | |
| Actual | | $1,000.00 | $931.50 | $.05-B |
| Hypothetical-C | | $1,000.00 | $1,025.16 | $.05-D |
| Fidelity Series International Small Cap Fund | | | | |
| Series International Small Cap | .01% | | | |
| Actual | | $1,000.00 | $880.50 | $.05-B |
| Hypothetical-C | | $1,000.00 | $1,025.16 | $.05-D |
| Fidelity Series International Value Fund | | | | |
| Series International Value | .01% | | | |
| Actual | | $1,000.00 | $902.10 | $.05-B |
| Hypothetical-C | | $1,000.00 | $1,025.16 | $.05-D |
A Annualized expense ratio reflects expenses net of applicable fee waivers.
B Actual expenses are equal to each Fund's annualized expense ratio, multiplied by the average account value over the period, multiplied by 184/365 (to reflect the one-half year period) for Fidelity Series Emerging Markets Opportunities Fund, Fidelity Series International Growth Fund, Fidelity Series International Small Cap Fund and Fidelity Series International Value Fund and by 64/365 (to reflect the period August 29, 2018 to October 31, 2018) for Fidelity Series Emerging Markets Fund.
C 5% return per year before expenses.
D Hypothetical expenses are equal to each Fund's annualized expense ratio, multiplied by the average account value over the period, multiplied by 184/365 (to reflect the one-half year period).
Distributions (Unaudited)
The Board of Trustees of each fund voted to pay to shareholders of record at the opening of business on record date, the following distributions per share derived from capital gains realized from sales of portfolio securities, and dividends derived from net investment income:
| | Pay Date | Record Date | Dividends | Capital Gains |
| Fidelity Series Emerging Markets Fund | 12/17/18 | 12/14/18 | $0.038 | $0.000 |
| Fidelity Series Emerging Markets Opportunities Fund | 12/17/18 | 12/14/18 | $0.406 | $1.141 |
| Fidelity Series International Growth Fund | 12/17/18 | 12/14/18 | $0.283 | $0.718 |
| Fidelity Series International Small Cap Fund | 12/17/18 | 12/14/18 | $0.365 | $1.184 |
| Fidelity Series International Value Fund | 12/17/18 | 12/14/18 | $0.348 | $0.000 |
|
The funds hereby designate as capital gain dividend the amounts noted below for the taxable year ended October 31, 2018, or, if subsequently determined to be different, the net capital gain of such year.
| Fidelity Series Emerging Markets Opportunities Fund | $873,209,403 |
| Fidelity Series International Growth Fund | $659,135,891 |
| Fidelity Series International Small Cap Fund | $231,049,830 |
|
A percentage of the dividends distributed during the fiscal year for the following funds qualify for the dividends–received deduction for corporate shareholders:
| Fidelity Series Emerging Markets Fund | |
| December, 2017 | –% |
| Fidelity Series Emerging Markets Opportunities Fund | |
| December, 2017 | 0% |
| Fidelity Series International Growth Fund | |
| December, 2017 | 11% |
| Fidelity Series International Small Cap Fund | |
| December, 2017 | 1% |
| Fidelity Series International Value Fund | |
| December, 2017 | 1% |
|
A percentage of the dividends distributed during the fiscal year for the following funds may be taken into account as a dividend for purposes of the maximum rate under section 1(h)(11) of the Internal Revenue Code.
| Fidelity Series Emerging Markets Fund | |
| December, 2017 | –% |
| Fidelity Series Emerging Markets Opportunities Fund | |
| December, 2017 | 73% |
| Fidelity Series International Growth Fund | |
| December, 2017 | 100% |
| Fidelity Series International Small Cap Fund | |
| December, 2017 | 56% |
| Fidelity Series International Value Fund | |
| December, 2017 | 76% |
|
The funds will notify shareholders in January 2019 of amounts for use in preparing 2018 income tax returns.
Board Approval of Investment Advisory Contracts
Fidelity Series Emerging Markets Opportunities Fund (formerly Fidelity Series Emerging Markets Fund) Fidelity Series International Growth Fund Fidelity Series International Small Cap Fund Fidelity Series International Value Fund At its July 2018 meeting, the Board of Trustees, including the Independent Trustees (together, the Board), voted to continue the management contracts with Fidelity Management & Research Company (FMR) and the sub-advisory agreements (together, the Advisory Contracts) for the funds for six months through January 31, 2019, in connection with the reunification of the Fidelity Equity High Income Funds Board, which oversees the funds, and the Sector Portfolios Board.
The Board considered that the approval of the funds’ Advisory Contracts will not result in any changes in (i) the investment process or strategies employed in the management of the funds’ assets; (ii) the fees and expenses paid by shareholders, including the expense cap arrangement currently in place for each fund; (iii) the nature, extent or quality of services provided under the funds’ Advisory Contracts; or (iv) the day-to-day management of each fund or the persons primarily responsible for such management. The Board concluded that the funds’ Advisory Contracts are fair and reasonable, and that the funds’ Advisory Contracts should be renewed, without modification, through January 31, 2019, with the understanding that the Board will consider the annual renewal for a full one year period in January 2019.
In connection with its consideration of future renewals of the funds’ Advisory Contracts, the Board will consider: (i) the nature, extent and quality of services provided to the funds, including shareholder and administrative services and investment performance; (ii) the competitiveness of the management fee and total expenses for each fund; (iii) the costs of the services and profitability, including the revenues earned and the expenses incurred in conducting the business of developing, marketing, distributing, managing, administering, and servicing each fund and its shareholders, to the extent applicable, as well as potential fall-out benefits from Fidelity’s non-fund businesses; and (iv) whether there have been economies of scale in respect of the Fidelity funds, whether the Fidelity funds (including the funds) have appropriately benefited from any such economies of scale, and whether there is the potential for realization of any further economies.
Based on its evaluation of all of the conclusions noted above, and after considering all factors it believed relevant, the Board ultimately concluded that the funds’ management fee structures are fair and reasonable, and that the continuation of the funds’ Advisory Contracts should be approved.
Board Approval of Investment Advisory Contracts and Management Fees
Fidelity Series Emerging Markets Fund On July 18, 2018, the Board of Trustees, including the Independent Trustees (together, the Board), voted to approve the management contract with Fidelity Management & Research Company (FMR) and the sub-advisory agreements with affiliates of FMR (together, the Advisory Contracts) for the fund.
FMR and the sub-advisers are collectively referred to herein as the Investment Advisers. The Board, assisted by the advice of fund counsel and Independent Trustees’ counsel, considered a broad range of information.
Nature, Extent, and Quality of Services Provided. The Board considered staffing as it relates to the fund, including the backgrounds of investment personnel of Fidelity, and also considered the fund's investment objective, strategies, and related investment philosophy, and the purpose of Series funds generally. The Board considered the structure of the investment personnel compensation program, and whether this structure, provides, appropriate incentives to act in the best interests of the fund.
Resources Dedicated to Investment Management and Support Services. The Board reviewed the general qualifications and capabilities of Fidelity's investment staff, including its size, education, experience, and resources, as well as Fidelity's approach to recruiting, managing, and compensating investment personnel. The Board noted that Fidelity has continued to increase the resources devoted to non-U.S. offices, including expansion of Fidelity's global investment organization. The Board also noted that Fidelity's analysts have extensive resources, tools and capabilities that allow them to conduct sophisticated quantitative and fundamental analysis, as well as credit analysis of issuers, counterparties and guarantors. Further, the Board considered that Fidelity's investment professionals have sufficient access to global information and data so as to provide competitive investment results over time, and that those professionals also have access to sophisticated tools that permit them to assess portfolio construction and risk and performance attribution characteristics continuously, as well as to transmit new information and research conclusions rapidly around the world. Additionally, in its deliberations, the Board considered Fidelity's trading, risk management, compliance, and technology and operations capabilities and resources, which are integral parts of the investment management process.
Administrative Services. The Board considered the nature, extent, quality, and cost of advisory and administrative services to be performed by the Investment Advisers and their affiliates under the Advisory Contracts and under separate agreements covering transfer agency, pricing and bookkeeping, and securities lending services for the fund. The Board also considered the nature and extent of the supervision of third party service providers, principally custodians, subcustodians, and pricing vendors.
Investment Performance. The fund is a new fund and therefore had no historical performance for the Board to review at the time it approved the fund's Advisory Contracts. The Board considered the Investment Advisers' strength in fundamental, research-driven security selection, which the Board is familiar with through its supervision of other Fidelity funds.
Based on its review, the Board concluded that the nature, extent, and quality of services to be provided to the fund under the Advisory Contracts should benefit the shareholders of the fund.
Competitiveness of Management Fee and Total Expense Ratio The Board considered that the fund will not pay FMR a management fee for investment advisory services. In reviewing the Advisory Contracts, the Board also considered the projected total expense ratio of the fund. The Board noted that FMR or an affiliate undertakes to pay all operating expenses of the fund, except transfer agent fees, 12b-1 fees, Independent Trustee fees and expenses, custodian fees and expenses, proxy and shareholder meeting expenses, interest, taxes, brokerage expenses, and extraordinary expenses (such as litigation expenses).
The Board also noted that FMR has contractually agreed to reimburse the fund to the extent that total operating expenses (excluding interest, certain taxes, certain securities lending costs, brokerage commissions, fees and expenses of the Independent Trustees, proxy and shareholder meeting expenses, extraordinary expenses, and acquired fund fees and expenses, if any), as a percentage of its average net assets exceed, 0.014% through December 31, 2019.
Based on its review, the Board considered that the fund will not pay a management fee and concluded that the fund's projected total expense ratio was reasonable in light of the services that the fund and its shareholders will receive and the other factors considered.
Costs of the Services and Profitability. The fund is a new fund and therefore no revenue, cost, or profitability data was available for the Board to review in respect of the fund at the time it approved the Advisory Contracts. In connection with its future renewal of the fund's Advisory Contracts, the Board will consider the level of Fidelity's profits in respect of all the Fidelity funds.
Economies of Scale. The Board concluded that because the fund will pay no advisory fees and FMR or an affiliate will bear all expenses of the fund, with limited exceptions, economies of scale cannot be realized by the funds.
Additional Information Requested by the Board. In order to develop fully the factual basis for consideration of the Advisory Contracts, the Board received information explaining that the fund is offered exclusively to other Fidelity funds, which use the fund to gain exposure to a specific type of investment.
The Board also noted that those Fidelity funds investing in the fund will benefit from investing in one centralized fund as the fund may deliver more uniform asset class performance and offer additional opportunities to generate returns and diversify the investing funds’ equity allocations.
Based on its evaluation of all of the conclusions noted above, and after considering all factors it believed relevant, the Board concluded that the advisory fee structures are fair and reasonable, and that the fund’s Advisory Contracts should be approved.
GSV-S-ANN-1218
1.907943.108
Fidelity Advisor® Global Commodity Stock Fund - Class A, Class M, Class C, Class I and Class Z
Annual Report October 31, 2018 Class A, Class M, Class C, Class I and Class Z are classes of Fidelity® Global Commodity Stock Fund |
|
Contents
To view a fund's proxy voting guidelines and proxy voting record for the 12-month period ended June 30, visit http://www.fidelity.com/proxyvotingresults or visit the Securities and Exchange Commission's (SEC) web site at http://www.sec.gov.
You may also call 1-877-208-0098 to request a free copy of the proxy voting guidelines.
Standard & Poor's, S&P and S&P 500 are registered service marks of The McGraw-Hill Companies, Inc. and have been licensed for use by Fidelity Distributors Corporation.
Other third-party marks appearing herein are the property of their respective owners.
All other marks appearing herein are registered or unregistered trademarks or service marks of FMR LLC or an affiliated company. © 2018 FMR LLC. All rights reserved.
This report and the financial statements contained herein are submitted for the general information of the shareholders of the Fund. This report is not authorized for distribution to prospective investors in the Fund unless preceded or accompanied by an effective prospectus.
A fund files its complete schedule of portfolio holdings with the SEC for the first and third quarters of each fiscal year on Form N-Q. Forms N-Q are available on the SEC’s web site at http://www.sec.gov. A fund's Forms N-Q may be reviewed and copied at the SEC’s Public Reference Room in Washington, DC. Information regarding the operation of the SEC's Public Reference Room may be obtained by calling 1-800-SEC-0330.
For a complete list of a fund's portfolio holdings, view the most recent holdings listing, semiannual report, or annual report on Fidelity's web site at http://www.fidelity.com, http://www.institutional.fidelity.com, or http://www.401k.com, as applicable.
NOT FDIC INSURED •MAY LOSE VALUE •NO BANK GUARANTEE
Neither the Fund nor Fidelity Distributors Corporation is a bank.
Performance: The Bottom Line
Average annual total return reflects the change in the value of an investment, assuming reinvestment of distributions from dividend income and capital gains (the profits earned upon the sale of securities that have grown in value, if any) and assuming a constant rate of performance each year. The hypothetical investment and the average annual total returns do not reflect the deduction of taxes that a shareholder would pay on fund distributions or the redemption of fund shares. During periods of reimbursement by Fidelity, a fund’s total return will be greater than it would be had the reimbursement not occurred. How a fund did yesterday is no guarantee of how it will do tomorrow.
Average Annual Total Returns
| For the periods ended October 31, 2018 | Past 1 year | Past 5 years | Life of fundA |
| Class A (incl. 5.75% sales charge) | (5.80)% | (2.37)% | 2.74% |
| Class M (incl. 3.50% sales charge) | (3.79)% | (2.18)% | 2.71% |
| Class C (incl. contingent deferred sales charge) | (1.66)% | (1.93)% | 2.60% |
| Class I | 0.30% | (0.89)% | 3.69% |
| Class Z | 0.38% | (0.87)% | 3.70% |
A From March 25, 2009
Class C shares' contingent deferred sales charges included in the past one year, past five years, and life of fund total return figures are 1%, 0%, and 0%, respectively.
The initial offering of Class Z shares took place on October 2, 2018. Returns prior to October 2, 2018, are those of Class I.
$10,000 Over Life of Fund
Let's say hypothetically that $10,000 was invested in Fidelity Advisor® Global Commodity Stock Fund - Class A on March 25, 2009, when the fund started, and the current 5.75% sales charge was paid.
The chart shows how the value of your investment would have changed, and also shows how the MSCI ACWI (All Country World Index) Index performed over the same period.
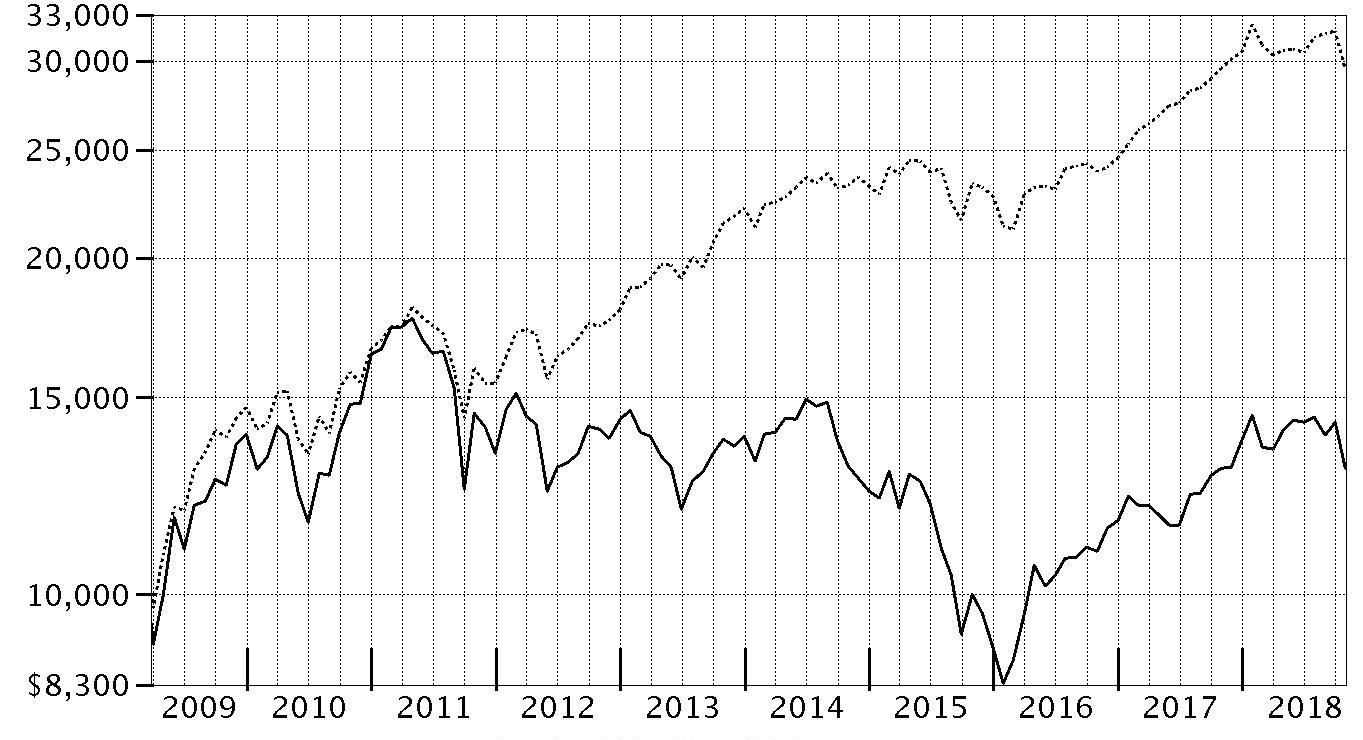
| Period Ending Values |
| $12,964 | Fidelity Advisor® Global Commodity Stock Fund - Class A |
| $29,525 | MSCI ACWI (All Country World Index) Index |
Management's Discussion of Fund Performance
Market Recap: Global equities returned -0.14% for the 12 months ending October 31, 2018, according to the MSCI ACWI (All Country World Index). A modestly positive first half of the period gave way to a confluence of negative factors – including escalating trade tensions, a surging U.S. dollar, tepid economic growth in Europe, global central bank tightening, concerns about Italy’s budget stalemate with the EU, and weakness in China’s stock market – that yielded a -4% second-half return. The index lost 7.5% in October alone, its largest monthly drop in more than six years. Among sectors, economically sensitive materials (-8%), financials (-6%) and industrials (-5%) stocks suffered from concerns about slowing growth in some key markets. Rising interest rates in the U.S. exerted pressure on real estate (-4%) and utilities (-2%). Conversely, information technology (+9%) benefited from better-than-expected earnings from some major index constituents. Stable profit growth helped health care (+8%) perform well, while elevated crude-oil prices supported energy (+5%). Regionally, emerging markets (-12%) fared the worst, hampered by the impact of foreign exchange and concerns about economic weakness in China, India and South Korea. Sluggish growth pressured shares in continental Europe (-9%). Stocks in Japan (-3%) and the U.K. (-4%) held up better, followed by Canada (-5%) and Asia-Pacific ex Japan (-6%). The U.S. (+7%) was the only region with a positive return, helped by steady economic and corporate profit growth.
Comments from Co-Manager S. Joseph Wickwire II, CFA: For the fiscal year, the fund's share classes (excluding sales charges, if applicable) posted returns that were roughly flat, lagging the 1.62% advance of the MSCI All Country World Commodity Producers Sector Capped Index, but about on par with the -0.14% return of the broader global equity market, as measured by the MSCI ACWI (All Country World Index) Index. The fund's return was largely a function of a favorable market backdrop for commodities during the first half of the period, followed by escalating concerns about trade conflicts, slowing global economic growth and uncertainty regarding the upcoming U.S. mid-term elections. Versus the commodities-focused industry index, the fund's underperformance was largely due to an overweighting in poor-performing gold stocks. Non-index stakes in the lagging diversified chemicals and commodity chemicals industries also held back the fund's relative result. Top individual detractors included non-index stakes in diversified chemicals manufacturer Chemours and gold-producer Premier Gold Mines, both of which declined in value. Conversely, the fund's positioning in the paper & forest products industry was helpful, with notable strength among paper-related stocks. A non-index stake in independent power producers & energy traders also added value. At the stock level, the timing of the fund's position in agricultural products manufacturer Monsanto worked out well, as our shares gained 5% before the company's August merger with Bayer. An out-of-benchmark stake in poly-metallic mining company Arizona Mining also contributed while held in the fund, prior to the company being acquired by South32 in August.
The views expressed above reflect those of the portfolio manager(s) only through the end of the period as stated on the cover of this report and do not necessarily represent the views of Fidelity or any other person in the Fidelity organization. Any such views are subject to change at any time based upon market or other conditions and Fidelity disclaims any responsibility to update such views. These views may not be relied on as investment advice and, because investment decisions for a Fidelity fund are based on numerous factors, may not be relied on as an indication of trading intent on behalf of any Fidelity fund.
Note to Shareholders: On September 24, 2018, Jody Simes assumed co-management responsibilities for the fund. On November 1, 2018, Jody assumed lead portfolio management responsibilities. Co-Manager Joe Wickwire plans to retire on March 31, 2019, at which point Jody will become sole portfolio manager.
Investment Summary (Unaudited)
Top Ten Stocks as of October 31, 2018
| | % of fund's net assets |
| BHP Billiton PLC | 5.7 |
| Nutrien Ltd. | 5.4 |
| Royal Dutch Shell PLC Class A (United Kingdom) | 4.0 |
| Archer Daniels Midland Co. | 3.9 |
| Chevron Corp. | 3.9 |
| Rio Tinto PLC | 3.7 |
| Exxon Mobil Corp. | 3.1 |
| BP PLC | 2.7 |
| UPM-Kymmene Corp. | 2.7 |
| Vale SA sponsored ADR | 2.6 |
| | 37.7 |
Top Sectors (% of fund's net assets)
| As of October 31, 2018 |
| | Metals | 32.4% |
| | Energy | 31.3% |
| | Agriculture | 29.8% |
| | Other | 5.5% |
| | Short-Term Investments and Net Other Assets | 1.0% |

Schedule of Investments October 31, 2018
Showing Percentage of Net Assets
| Common Stocks - 97.6% | | | |
| | | Shares | Value |
| Building Products - 0.3% | | | |
| Building Products - 0.3% | | | |
| Compagnie de St. Gobain | | 41,900 | $1,578,433 |
| Chemicals - 17.0% | | | |
| Commodity Chemicals - 1.5% | | | |
| LG Chemical Ltd. | | 10,580 | 3,217,581 |
| LyondellBasell Industries NV Class A | | 17,300 | 1,544,371 |
| Olin Corp. | | 59,000 | 1,191,800 |
| Tronox Ltd. Class A | | 17,665 | 202,264 |
| Westlake Chemical Corp. | | 24,100 | 1,718,330 |
| | | | 7,874,346 |
| Diversified Chemicals - 1.5% | | | |
| DowDuPont, Inc. | | 81,358 | 4,386,823 |
| The Chemours Co. LLC | | 116,100 | 3,832,461 |
| | | | 8,219,284 |
| Fertilizers & Agricultural Chemicals - 13.8% | | | |
| CF Industries Holdings, Inc. | | 252,360 | 12,120,851 |
| FMC Corp. | | 142,000 | 11,087,360 |
| K&S AG (a) | | 190,600 | 3,555,594 |
| Nutrien Ltd. | | 556,683 | 29,469,587 |
| The Mosaic Co. | | 358,661 | 11,096,971 |
| UPL Ltd. (b) | | 232,489 | 2,119,780 |
| Yara International ASA | | 147,900 | 6,363,535 |
| | | | 75,813,678 |
| Specialty Chemicals - 0.2% | | | |
| Platform Specialty Products Corp. (b) | | 109,600 | 1,185,872 |
|
| TOTAL CHEMICALS | | | 93,093,180 |
|
| Commercial Services & Supplies - 0.1% | | | |
| Environmental & Facility Services - 0.1% | | | |
| Clean TeQ Holdings Ltd. (a)(b) | | 1,129,700 | 335,999 |
| Construction Materials - 0.4% | | | |
| Construction Materials - 0.4% | | | |
| Buzzi Unicem SpA | | 24,700 | 474,900 |
| Dalmia Bharat Ltd. (b) | | 16,000 | 454,451 |
| Martin Marietta Materials, Inc. | | 6,500 | 1,113,320 |
| | | | 2,042,671 |
| Containers & Packaging - 0.3% | | | |
| Metal & Glass Containers - 0.3% | | | |
| Crown Holdings, Inc. (b) | | 36,600 | 1,547,814 |
| Electric Utilities - 0.3% | | | |
| Electric Utilities - 0.3% | | | |
| Vistra Energy Corp. (b) | | 71,700 | 1,622,571 |
| Food Products - 8.4% | | | |
| Agricultural Products - 8.2% | | | |
| Archer Daniels Midland Co. | | 452,600 | 21,385,350 |
| Bunge Ltd. | | 171,000 | 10,567,800 |
| Darling International, Inc. (b) | | 239,500 | 4,948,070 |
| First Resources Ltd. | | 1,713,100 | 1,954,083 |
| Ingredion, Inc. | | 52,800 | 5,342,304 |
| Wilmar International Ltd. | | 264,100 | 602,502 |
| | | | 44,800,109 |
| Packaged Foods & Meats - 0.2% | | | |
| Adecoagro SA (b) | | 149,500 | 1,196,000 |
|
| TOTAL FOOD PRODUCTS | | | 45,996,109 |
|
| Gas Utilities - 0.0% | | | |
| Gas Utilities - 0.0% | | | |
| Indraprastha Gas Ltd. | | 69,000 | 249,374 |
| Independent Power and Renewable Electricity Producers - 0.3% | | | |
| Independent Power Producers & Energy Traders - 0.3% | | | |
| NRG Energy, Inc. | | 39,800 | 1,440,362 |
| Machinery - 0.2% | | | |
| Agricultural & Farm Machinery - 0.2% | | | |
| Deere & Co. | | 7,800 | 1,056,432 |
| Industrial Machinery - 0.0% | | | |
| The Weir Group PLC | | 12,300 | 249,349 |
|
| TOTAL MACHINERY | | | 1,305,781 |
|
| Metals & Mining - 32.0% | | | |
| Aluminum - 0.3% | | | |
| Hindalco Industries Ltd. | | 160,000 | 476,798 |
| Norsk Hydro ASA | | 221,500 | 1,149,830 |
| | | | 1,626,628 |
| Copper - 1.7% | | | |
| Antofagasta PLC | | 161,200 | 1,617,048 |
| First Quantum Minerals Ltd. | | 356,624 | 3,559,603 |
| Freeport-McMoRan, Inc. | | 369,300 | 4,302,345 |
| | | | 9,478,996 |
| Diversified Metals & Mining - 15.5% | | | |
| Alcoa Corp. (b) | | 35,700 | 1,249,143 |
| Anglo American PLC (United Kingdom) | | 186,151 | 3,985,941 |
| BHP Billiton PLC | | 1,550,193 | 30,924,320 |
| Boliden AB | | 34,300 | 783,928 |
| Glencore Xstrata PLC | | 3,403,273 | 13,870,178 |
| Grupo Mexico SA de CV Series B | | 742,620 | 1,713,492 |
| Ivanhoe Mines Ltd. (b) | | 767,900 | 1,446,612 |
| Korea Zinc Co. Ltd. | | 4,260 | 1,415,022 |
| MMC Norilsk Nickel PJSC sponsored ADR | | 55,400 | 918,532 |
| Rio Tinto PLC | | 417,487 | 20,269,317 |
| South32 Ltd. | | 1,141,097 | 2,925,206 |
| Sumitomo Metal Mining Co. Ltd. | | 36,700 | 1,155,538 |
| Teck Resources Ltd. Class B (sub. vtg.) | | 220,600 | 4,559,631 |
| | | | 85,216,860 |
| Gold - 5.5% | | | |
| Agnico Eagle Mines Ltd. (Canada) | | 67,700 | 2,391,318 |
| AngloGold Ashanti Ltd. sponsored ADR | | 104,200 | 980,522 |
| B2Gold Corp. (b) | | 487,268 | 1,202,948 |
| Barrick Gold Corp. | | 313,400 | 3,925,683 |
| Continental Gold, Inc. (b) | | 499,230 | 864,632 |
| Endeavour Mining Corp. (b) | | 14,200 | 217,781 |
| Franco-Nevada Corp. | | 54,171 | 3,383,296 |
| Gold Standard Ventures Corp. (b) | | 758,844 | 1,124,043 |
| Goldcorp, Inc. | | 178,175 | 1,609,253 |
| Guyana Goldfields, Inc. (b) | | 57,588 | 77,429 |
| Kinross Gold Corp. (b) | | 254,801 | 661,946 |
| Newcrest Mining Ltd. | | 55,215 | 805,861 |
| Newmont Mining Corp. | | 239,300 | 7,399,156 |
| Premier Gold Mines Ltd. (b) | | 997,986 | 1,303,913 |
| Randgold Resources Ltd. sponsored ADR | | 32,400 | 2,544,696 |
| SEMAFO, Inc. (b) | | 264,951 | 579,634 |
| Torex Gold Resources, Inc. (b) | | 102,445 | 933,051 |
| | | | 30,005,162 |
| Precious Metals & Minerals - 0.6% | | | |
| Alrosa Co. Ltd. | | 597,900 | 906,738 |
| Fresnillo PLC | | 61,600 | 668,163 |
| Industrias Penoles SA de CV | | 59,965 | 845,162 |
| Osisko Mining, Inc. (b) | | 390,470 | 791,944 |
| | | | 3,212,007 |
| Silver - 0.3% | | | |
| MAG Silver Corp. (b) | | 48,400 | 347,802 |
| Wheaton Precious Metals Corp. | | 82,000 | 1,347,928 |
| | | | 1,695,730 |
| Steel - 8.1% | | | |
| ArcelorMittal SA Class A unit (a) | | 222,402 | 5,535,586 |
| Fortescue Metals Group Ltd. | | 195,863 | 554,802 |
| Hyundai Steel Co. | | 27,439 | 1,004,012 |
| JFE Holdings, Inc. | | 188,000 | 3,532,816 |
| Nippon Steel & Sumitomo Metal Corp. | | 141,700 | 2,613,822 |
| Nucor Corp. | | 89,092 | 5,267,119 |
| POSCO | | 23,004 | 5,258,762 |
| Steel Dynamics, Inc. | | 63,200 | 2,502,720 |
| Tata Steel Ltd. | | 80,000 | 599,081 |
| Thyssenkrupp AG | | 93,500 | 1,967,144 |
| Vale SA sponsored ADR | | 956,841 | 14,448,299 |
| Voestalpine AG | | 30,700 | 1,091,504 |
| | | | 44,375,667 |
|
| TOTAL METALS & MINING | | | 175,611,050 |
|
| Oil, Gas & Consumable Fuels - 30.3% | | | |
| Coal & Consumable Fuels - 0.2% | | | |
| China Shenhua Energy Co. Ltd. (H Shares) | | 421,000 | 953,457 |
| Integrated Oil & Gas - 20.8% | | | |
| BP PLC | | 2,041,100 | 14,744,336 |
| Cenovus Energy, Inc. (Canada) | | 259,100 | 2,192,544 |
| Chevron Corp. | | 189,200 | 21,124,180 |
| China Petroleum & Chemical Corp. (H Shares) | | 2,169,000 | 1,766,816 |
| Equinor ASA | | 74,100 | 1,927,701 |
| Exxon Mobil Corp. | | 214,300 | 17,075,424 |
| Lukoil PJSC sponsored ADR | | 45,200 | 3,376,440 |
| Occidental Petroleum Corp. | | 82,600 | 5,539,982 |
| Royal Dutch Shell PLC: | | | |
| Class A (United Kingdom) | | 689,400 | 21,962,984 |
| Class B (United Kingdom) | | 56,830 | 1,853,393 |
| Suncor Energy, Inc. | | 279,432 | 9,373,480 |
| Total SA | | 219,700 | 12,890,991 |
| | | | 113,828,271 |
| Oil & Gas Exploration & Production - 8.8% | | | |
| Anadarko Petroleum Corp. | | 96,200 | 5,117,840 |
| Berry Petroleum Corp. | | 22,800 | 319,200 |
| Cabot Oil & Gas Corp. | | 51,900 | 1,257,537 |
| Canadian Natural Resources Ltd. | | 134,600 | 3,693,078 |
| Centennial Resource Development, Inc. Class A (b) | | 11,300 | 216,508 |
| Cimarex Energy Co. | | 8,100 | 643,707 |
| CNOOC Ltd. sponsored ADR (a) | | 13,900 | 2,352,575 |
| Concho Resources, Inc. (b) | | 14,000 | 1,947,260 |
| ConocoPhillips Co. | | 122,000 | 8,527,800 |
| Devon Energy Corp. | | 76,000 | 2,462,400 |
| Diamondback Energy, Inc. | | 22,800 | 2,561,808 |
| Encana Corp. | | 118,200 | 1,206,736 |
| EOG Resources, Inc. | | 61,500 | 6,478,410 |
| EQT Corp. | | 25,601 | 869,666 |
| Newfield Exploration Co. (b) | | 21,300 | 430,260 |
| Noble Energy, Inc. | | 92,200 | 2,291,170 |
| NOVATEK OAO GDR (Reg. S) | | 6,600 | 1,118,700 |
| NuVista Energy Ltd. (b) | | 208,600 | 839,819 |
| Oasis Petroleum, Inc. (b) | | 44,800 | 450,688 |
| PDC Energy, Inc. (b) | | 18,600 | 789,570 |
| Pioneer Natural Resources Co. | | 22,910 | 3,373,956 |
| PrairieSky Royalty Ltd. | | 18,098 | 274,952 |
| Whiting Petroleum Corp. (b) | | 19,218 | 716,831 |
| Woodside Petroleum Ltd. | | 10,000 | 246,790 |
| | | | 48,187,261 |
| Oil & Gas Refining & Marketing - 0.3% | | | |
| Delek U.S. Holdings, Inc. | | 21,800 | 800,496 |
| Reliance Industries Ltd. | | 59,241 | 850,047 |
| | | | 1,650,543 |
| Oil & Gas Storage & Transport - 0.2% | | | |
| Petronet LNG Ltd. | | 427,632 | 1,304,983 |
|
| TOTAL OIL, GAS & CONSUMABLE FUELS | | | 165,924,515 |
|
| Paper & Forest Products - 7.8% | | | |
| Forest Products - 0.3% | | | |
| Quintis Ltd. (b)(c) | | 413,280 | 3 |
| Svenska Cellulosa AB (SCA) (B Shares) | | 26,200 | 247,996 |
| West Fraser Timber Co. Ltd. | | 24,800 | 1,245,981 |
| | | | 1,493,980 |
| Paper Products - 7.5% | | | |
| Fibria Celulose SA | | 130,600 | 2,521,459 |
| Lee & Man Paper Manufacturing Ltd. | | 350,000 | 299,479 |
| Mondi PLC | | 284,600 | 6,709,843 |
| Nine Dragons Paper (Holdings) Ltd. | | 1,625,000 | 1,549,997 |
| Oji Holdings Corp. | | 406,000 | 2,883,057 |
| Sappi Ltd. | | 100,606 | 565,617 |
| Stora Enso Oyj (R Shares) | | 618,100 | 9,314,710 |
| Suzano Papel e Celulose SA | | 264,700 | 2,692,166 |
| UPM-Kymmene Corp. | | 453,700 | 14,599,425 |
| | | | 41,135,753 |
|
| TOTAL PAPER & FOREST PRODUCTS | | | 42,629,733 |
|
| Trading Companies & Distributors - 0.2% | | | |
| Trading Companies & Distributors - 0.2% | | | |
| Brenntag AG | | 23,300 | 1,218,461 |
| TOTAL COMMON STOCKS | | | |
| (Cost $625,634,610) | | | 534,596,053 |
|
| Nonconvertible Preferred Stocks - 1.4% | | | |
| Metals & Mining - 0.4% | | | |
| Steel - 0.4% | | | |
| Gerdau SA | | 52,000 | 227,199 |
| Gerdau SA sponsored ADR (a) | | 421,300 | 1,832,655 |
| | | | 2,059,854 |
| Oil, Gas & Consumable Fuels - 1.0% | | | |
| Integrated Oil & Gas - 1.0% | | | |
| Petroleo Brasileiro SA - Petrobras (PN) sponsored ADR (non-vtg.) | | 381,400 | 5,652,348 |
| TOTAL NONCONVERTIBLE PREFERRED STOCKS | | | |
| (Cost $5,829,730) | | | 7,712,202 |
|
| Money Market Funds - 2.2% | | | |
| Fidelity Cash Central Fund, 2.23% (d) | | 1,775,955 | 1,776,310 |
| Fidelity Securities Lending Cash Central Fund 2.23% (d)(e) | | 10,639,731 | 10,640,795 |
| TOTAL MONEY MARKET FUNDS | | | |
| (Cost $12,417,381) | | | 12,417,105 |
| TOTAL INVESTMENT IN SECURITIES - 101.2% | | | |
| (Cost $643,881,721) | | | 554,725,360 |
| NET OTHER ASSETS (LIABILITIES) - (1.2)% | | | (6,811,684) |
| NET ASSETS - 100% | | | $547,913,676 |
Legend
(a) Security or a portion of the security is on loan at period end.
(b) Non-income producing
(c) Level 3 security
(d) Affiliated fund that is generally available only to investment companies and other accounts managed by Fidelity Investments. The rate quoted is the annualized seven-day yield of the fund at period end. A complete unaudited listing of the fund's holdings as of its most recent quarter end is available upon request. In addition, each Fidelity Central Fund's financial statements, which are not covered by the Fund's Report of Independent Registered Public Accounting Firm, are available on the SEC's website or upon request.
(e) Investment made with cash collateral received from securities on loan.
Affiliated Central Funds
Information regarding fiscal year to date income earned by the Fund from investments in Fidelity Central Funds is as follows:
| Fund | Income earned |
| Fidelity Cash Central Fund | $79,432 |
| Fidelity Securities Lending Cash Central Fund | 261,584 |
| Total | $341,016 |
Amounts in the income column in the above table include any capital gain distributions from underlying funds, which are presented in the corresponding line-item in the Statement of Operations if applicable.
Investment Valuation
The following is a summary of the inputs used, as of October 31, 2018, involving the Fund's assets and liabilities carried at fair value. The inputs or methodology used for valuing securities may not be an indication of the risk associated with investing in those securities. For more information on valuation inputs, and their aggregation into the levels used below, please refer to the Investment Valuation section in the accompanying Notes to Financial Statements.
| | Valuation Inputs at Reporting Date: |
| Description | Total | Level 1 | Level 2 | Level 3 |
| Investments in Securities: | | | | |
| Common Stocks | $534,596,053 | $413,161,465 | $121,434,585 | $3 |
| Nonconvertible Preferred Stocks | 7,712,202 | 7,712,202 | -- | -- |
| Money Market Funds | 12,417,105 | 12,417,105 | -- | -- |
| Total Investments in Securities: | $554,725,360 | $433,290,772 | $121,434,585 | $3 |
Other Information
Distribution of investments by country or territory of incorporation, as a percentage of Total Net Assets, is as follows (Unaudited):
| United States of America | 35.4% |
| United Kingdom | 18.7% |
| Canada | 14.2% |
| Brazil | 5.0% |
| Finland | 4.4% |
| Bailiwick of Jersey | 3.0% |
| France | 2.7% |
| Bermuda | 2.2% |
| Korea (South) | 2.1% |
| Japan | 1.8% |
| Norway | 1.8% |
| Germany | 1.2% |
| Luxembourg | 1.2% |
| Russia | 1.2% |
| India | 1.1% |
| Australia | 1.0% |
| Others (Individually Less Than 1%) | 3.0% |
| | 100.0% |
See accompanying notes which are an integral part of the financial statements.
Financial Statements
Statement of Assets and Liabilities
| | | October 31, 2018 |
| Assets | | |
Investment in securities, at value (including securities loaned of $10,326,508) — See accompanying schedule:
Unaffiliated issuers (cost $631,464,340) | $542,308,255 | |
| Fidelity Central Funds (cost $12,417,381) | 12,417,105 | |
| Total Investment in Securities (cost $643,881,721) | | $554,725,360 |
| Receivable for investments sold | | 2,923,535 |
| Receivable for fund shares sold | | 8,000,873 |
| Dividends receivable | | 570,218 |
| Distributions receivable from Fidelity Central Funds | | 15,035 |
| Prepaid expenses | | 1,204 |
| Other receivables | | 45,372 |
| Total assets | | 566,281,597 |
| Liabilities | | |
| Payable for investments purchased | $6,863,829 | |
| Payable for fund shares redeemed | 288,591 | |
| Accrued management fee | 327,732 | |
| Distribution and service plan fees payable | 28,186 | |
| Other affiliated payables | 152,168 | |
| Other payables and accrued expenses | 66,930 | |
| Collateral on securities loaned | 10,640,485 | |
| Total liabilities | | 18,367,921 |
| Net Assets | | $547,913,676 |
| Net Assets consist of: | | |
| Paid in capital | | $662,078,391 |
| Total distributable earnings (loss) | | (114,164,715) |
| Net Assets | | $547,913,676 |
| Net Asset Value and Maximum Offering Price | | |
| Class A: | | |
| Net Asset Value and redemption price per share ($27,258,118 ÷ 2,194,637 shares) | | $12.42 |
| Maximum offering price per share (100/94.25 of $12.42) | | $13.18 |
| Class M: | | |
| Net Asset Value and redemption price per share ($7,200,231 ÷ 581,223 shares) | | $12.39 |
| Maximum offering price per share (100/96.50 of $12.39) | | $12.84 |
| Class C: | | |
| Net Asset Value and offering price per share ($20,793,202 ÷ 1,696,531 shares)(a) | | $12.26 |
| Global Commodity Stock: | | |
| Net Asset Value, offering price and redemption price per share ($369,562,952 ÷ 29,713,079 shares) | | $12.44 |
| Class I: | | |
| Net Asset Value, offering price and redemption price per share ($117,980,993 ÷ 9,476,059 shares) | | $12.45 |
| Class Z: | | |
| Net Asset Value, offering price and redemption price per share ($5,118,180 ÷ 410,839 shares) | | $12.46 |
(a) Redemption price per share is equal to net asset value less any applicable contingent deferred sales charge.
See accompanying notes which are an integral part of the financial statements.
Statement of Operations
| | | Year ended October 31, 2018 |
| Investment Income | | |
| Dividends | | $17,421,929 |
| Income from Fidelity Central Funds | | 341,016 |
| Income before foreign taxes withheld | | 17,762,945 |
| Less foreign taxes withheld | | (997,166) |
| Total income | | 16,765,779 |
| Expenses | | |
| Management fee | $4,109,654 | |
| Transfer agent fees | 1,570,545 | |
| Distribution and service plan fees | 340,640 | |
| Accounting and security lending fees | 301,304 | |
| Custodian fees and expenses | 70,739 | |
| Independent trustees' fees and expenses | 2,902 | |
| Registration fees | 90,758 | |
| Audit | 58,396 | |
| Legal | 2,576 | |
| Interest | 1,921 | |
| Miscellaneous | 3,275 | |
| Total expenses before reductions | 6,552,710 | |
| Expense reductions | (105,626) | |
| Total expenses after reductions | | 6,447,084 |
| Net investment income (loss) | | 10,318,695 |
| Realized and Unrealized Gain (Loss) | | |
| Net realized gain (loss) on: | | |
| Investment securities: | | |
| Unaffiliated issuers | 33,086,644 | |
| Fidelity Central Funds | 1,613 | |
| Foreign currency transactions | (2,373) | |
| Total net realized gain (loss) | | 33,085,884 |
| Change in net unrealized appreciation (depreciation) on: | | |
| Investment securities: | | |
| Unaffiliated issuers | (46,899,059) | |
| Fidelity Central Funds | 168 | |
| Assets and liabilities in foreign currencies | 9,238 | |
| Total change in net unrealized appreciation (depreciation) | | (46,889,653) |
| Net gain (loss) | | (13,803,769) |
| Net increase (decrease) in net assets resulting from operations | | $(3,485,074) |
See accompanying notes which are an integral part of the financial statements.
Statement of Changes in Net Assets
| | Year ended October 31, 2018 | Year ended October 31, 2017 |
| Increase (Decrease) in Net Assets | | |
| Operations | | |
| Net investment income (loss) | $10,318,695 | $5,241,419 |
| Net realized gain (loss) | 33,085,884 | 30,354,449 |
| Change in net unrealized appreciation (depreciation) | (46,889,653) | 31,191,808 |
| Net increase (decrease) in net assets resulting from operations | (3,485,074) | 66,787,676 |
| Distributions to shareholders | (7,402,151) | – |
| Distributions to shareholders from net investment income | – | (3,511,036) |
| Distributions to shareholders from net realized gain | – | (2,362,260) |
| Total distributions | (7,402,151) | (5,873,296) |
| Share transactions - net increase (decrease) | 129,504,630 | 15,840,057 |
| Redemption fees | 181 | 12,604 |
| Total increase (decrease) in net assets | 118,617,586 | 76,767,041 |
| Net Assets | | |
| Beginning of period | 429,296,090 | 352,529,049 |
| End of period | $547,913,676 | $429,296,090 |
| Other Information | | |
| Undistributed net investment income end of period | | $4,378,040 |
See accompanying notes which are an integral part of the financial statements.
Financial Highlights
Fidelity Global Commodity Stock Fund Class A
| Years ended October 31, | 2018 | 2017 | 2016 | 2015 | 2014 |
| Selected Per–Share Data | | | | | |
| Net asset value, beginning of period | $12.56 | $10.73 | $10.05 | $13.25 | $14.17 |
| Income from Investment Operations | | | | | |
| Net investment income (loss)A | .21 | .12 | .11 | .22 | .15 |
| Net realized and unrealized gain (loss) | (.22) | 1.86 | .79 | (3.25) | (.91) |
| Total from investment operations | (.01) | 1.98 | .90 | (3.03) | (.76) |
| Distributions from net investment income | (.09) | (.08) | (.21) | (.14) | (.15) |
| Distributions from net realized gain | (.05) | (.07) | (.01) | (.03) | (.01) |
| Total distributions | (.13)B | (.15) | (.22) | (.17) | (.16) |
| Redemption fees added to paid in capitalA,C | – | – | – | – | – |
| Net asset value, end of period | $12.42 | $12.56 | $10.73 | $10.05 | $13.25 |
| Total ReturnD,E | (.05)% | 18.53% | 9.29% | (23.16)% | (5.41)% |
| Ratios to Average Net AssetsF,G | | | | | |
| Expenses before reductions | 1.28% | 1.33% | 1.38% | 1.34% | 1.35% |
| Expenses net of fee waivers, if any | 1.28% | 1.33% | 1.38% | 1.34% | 1.35% |
| Expenses net of all reductions | 1.27% | 1.32% | 1.37% | 1.34% | 1.35% |
| Net investment income (loss) | 1.55% | 1.07% | 1.18% | 1.85% | 1.05% |
| Supplemental Data | | | | | |
| Net assets, end of period (000 omitted) | $27,258 | $29,920 | $34,791 | $31,391 | $51,586 |
| Portfolio turnover rateH | 70% | 81% | 85% | 77% | 75% |
A Calculated based on average shares outstanding during the period.
B Total distributions of $.13 per share is comprised of distributions from net investment income of $.086 and distributions from net realized gain of $.047 per share.
C Amount represents less than $.005 per share.
D Total returns would have been lower if certain expenses had not been reduced during the applicable periods shown.
E Total returns do not include the effect of the sales charges.
F Fees and expenses of any underlying Fidelity Central Funds are not included in the Fund's expense ratio. The Fund indirectly bears its proportionate share of the expenses of any underlying Fidelity Central Funds.
G Expense ratios reflect operating expenses of the class. Expenses before reductions do not reflect amounts reimbursed by the investment adviser or reductions from brokerage service arrangements or reductions from other expense offset arrangements and do not represent the amount paid by the class during periods when reimbursements or reductions occur. Expenses net of fee waivers reflect expenses after reimbursement by the investment adviser but prior to reductions from brokerage service arrangements or other expense offset arrangements. Expenses net of all reductions represent the net expenses paid by the class.
H Amount does not include the portfolio activity of any underlying Fidelity Central Funds.
See accompanying notes which are an integral part of the financial statements.
Fidelity Global Commodity Stock Fund Class M
| Years ended October 31, | 2018 | 2017 | 2016 | 2015 | 2014 |
| Selected Per–Share Data | | | | | |
| Net asset value, beginning of period | $12.53 | $10.72 | $10.02 | $13.21 | $14.13 |
| Income from Investment Operations | | | | | |
| Net investment income (loss)A | .16 | .09 | .09 | .19 | .11 |
| Net realized and unrealized gain (loss) | (.20) | 1.84 | .79 | (3.25) | (.90) |
| Total from investment operations | (.04) | 1.93 | .88 | (3.06) | (.79) |
| Distributions from net investment income | (.06) | (.05) | (.17) | (.10) | (.11) |
| Distributions from net realized gain | (.05) | (.07) | (.01) | (.03) | (.01) |
| Total distributions | (.10)B | (.12) | (.18) | (.13) | (.13)C |
| Redemption fees added to paid in capitalA,D | – | – | – | – | – |
| Net asset value, end of period | $12.39 | $12.53 | $10.72 | $10.02 | $13.21 |
| Total ReturnE,F | (.30)% | 18.09% | 9.08% | (23.40)% | (5.65)% |
| Ratios to Average Net AssetsG,H | | | | | |
| Expenses before reductions | 1.59% | 1.62% | 1.65% | 1.63% | 1.62% |
| Expenses net of fee waivers, if any | 1.59% | 1.62% | 1.65% | 1.63% | 1.62% |
| Expenses net of all reductions | 1.58% | 1.61% | 1.64% | 1.62% | 1.62% |
| Net investment income (loss) | 1.24% | .78% | .90% | 1.57% | .78% |
| Supplemental Data | | | | | |
| Net assets, end of period (000 omitted) | $7,200 | $6,876 | $6,068 | $6,335 | $9,867 |
| Portfolio turnover rateI | 70% | 81% | 85% | 77% | 75% |
A Calculated based on average shares outstanding during the period.
B Total distributions of $.10 per share is comprised of distributions from net investment income of $.055 and distributions from net realized gain of $.047 per share.
C Total distributions of $.13 per share is comprised of distributions from net investment income of $.113 and distributions from net realized gain of $.013 per share.
D Amount represents less than $.005 per share.
E Total returns would have been lower if certain expenses had not been reduced during the applicable periods shown.
F Total returns do not include the effect of the sales charges.
G Fees and expenses of any underlying Fidelity Central Funds are not included in the Fund's expense ratio. The Fund indirectly bears its proportionate share of the expenses of any underlying Fidelity Central Funds.
H Expense ratios reflect operating expenses of the class. Expenses before reductions do not reflect amounts reimbursed by the investment adviser or reductions from brokerage service arrangements or reductions from other expense offset arrangements and do not represent the amount paid by the class during periods when reimbursements or reductions occur. Expenses net of fee waivers reflect expenses after reimbursement by the investment adviser but prior to reductions from brokerage service arrangements or other expense offset arrangements. Expenses net of all reductions represent the net expenses paid by the class.
I Amount does not include the portfolio activity of any underlying Fidelity Central Funds.
See accompanying notes which are an integral part of the financial statements.
Fidelity Global Commodity Stock Fund Class C
| Years ended October 31, | 2018 | 2017 | 2016 | 2015 | 2014 |
| Selected Per–Share Data | | | | | |
| Net asset value, beginning of period | $12.39 | $10.61 | $9.92 | $13.06 | $13.96 |
| Income from Investment Operations | | | | | |
| Net investment income (loss)A | .11 | .04 | .04 | .13 | .04 |
| Net realized and unrealized gain (loss) | (.19) | 1.82 | .78 | (3.22) | (.89) |
| Total from investment operations | (.08) | 1.86 | .82 | (3.09) | (.85) |
| Distributions from net investment income | – | (.01) | (.12) | (.03) | (.03) |
| Distributions from net realized gain | (.05) | (.07) | (.01) | (.03) | (.01) |
| Total distributions | (.05) | (.08) | (.13) | (.05)B | (.05)C |
| Redemption fees added to paid in capitalA,D | – | – | – | – | – |
| Net asset value, end of period | $12.26 | $12.39 | $10.61 | $9.92 | $13.06 |
| Total ReturnE,F | (.67)% | 17.59% | 8.46% | (23.74)% | (6.13)% |
| Ratios to Average Net AssetsG,H | | | | | |
| Expenses before reductions | 2.00% | 2.07% | 2.13% | 2.12% | 2.11% |
| Expenses net of fee waivers, if any | 1.99% | 2.07% | 2.13% | 2.12% | 2.11% |
| Expenses net of all reductions | 1.98% | 2.06% | 2.12% | 2.11% | 2.11% |
| Net investment income (loss) | .84% | .33% | .43% | 1.08% | .29% |
| Supplemental Data | | | | | |
| Net assets, end of period (000 omitted) | $20,793 | $14,289 | $12,620 | $11,274 | $17,659 |
| Portfolio turnover rateI | 70% | 81% | 85% | 77% | 75% |
A Calculated based on average shares outstanding during the period.
B Total distributions of $.05 per share is comprised of distributions from net investment income of $.025 and distributions from net realized gain of $.026 per share.
C Total distributions of $.05 per share is comprised of distributions from net investment income of $.033 and distributions from net realized gain of $.013 per share.
D Amount represents less than $.005 per share.
E Total returns would have been lower if certain expenses had not been reduced during the applicable periods shown.
F Total returns do not include the effect of the contingent deferred sales charge.
G Fees and expenses of any underlying Fidelity Central Funds are not included in the Fund's expense ratio. The Fund indirectly bears its proportionate share of the expenses of any underlying Fidelity Central Funds.
H Expense ratios reflect operating expenses of the class. Expenses before reductions do not reflect amounts reimbursed by the investment adviser or reductions from brokerage service arrangements or reductions from other expense offset arrangements and do not represent the amount paid by the class during periods when reimbursements or reductions occur. Expenses net of fee waivers reflect expenses after reimbursement by the investment adviser but prior to reductions from brokerage service arrangements or other expense offset arrangements. Expenses net of all reductions represent the net expenses paid by the class.
I Amount does not include the portfolio activity of any underlying Fidelity Central Funds.
See accompanying notes which are an integral part of the financial statements.
Fidelity Global Commodity Stock Fund
| Years ended October 31, | 2018 | 2017 | 2016 | 2015 | 2014 |
| Selected Per–Share Data | | | | | |
| Net asset value, beginning of period | $12.59 | $10.77 | $10.09 | $13.31 | $14.24 |
| Income from Investment Operations | | | | | |
| Net investment income (loss)A | .23 | .15 | .14 | .25 | .19 |
| Net realized and unrealized gain (loss) | (.20) | 1.84 | .79 | (3.27) | (.92) |
| Total from investment operations | .03 | 1.99 | .93 | (3.02) | (.73) |
| Distributions from net investment income | (.13) | (.11) | (.24) | (.18) | (.19) |
| Distributions from net realized gain | (.05) | (.07) | (.01) | (.03) | (.01) |
| Total distributions | (.18) | (.17)B | (.25) | (.20)C | (.20) |
| Redemption fees added to paid in capitalA,D | – | – | – | – | – |
| Net asset value, end of period | $12.44 | $12.59 | $10.77 | $10.09 | $13.31 |
| Total ReturnE | .23% | 18.65% | 9.62% | (22.97)% | (5.16)% |
| Ratios to Average Net AssetsF,G | | | | | |
| Expenses before reductions | 1.08% | 1.10% | 1.13% | 1.12% | 1.11% |
| Expenses net of fee waivers, if any | 1.08% | 1.10% | 1.13% | 1.12% | 1.11% |
| Expenses net of all reductions | 1.06% | 1.09% | 1.12% | 1.11% | 1.11% |
| Net investment income (loss) | 1.75% | 1.30% | 1.43% | 2.08% | 1.29% |
| Supplemental Data | | | | | |
| Net assets, end of period (000 omitted) | $369,563 | $264,557 | $228,982 | $156,320 | $223,084 |
| Portfolio turnover rateH | 70% | 81% | 85% | 77% | 75% |
A Calculated based on average shares outstanding during the period.
B Total distributions of $.17 per share is comprised of distributions from net investment income of $.105 and distributions from net realized gain of $.068 per share.
C Total distributions of $.20 per share is comprised of distributions from net investment income of $.178 and distributions from net realized gain of $.026 per share.
D Amount represents less than $.005 per share.
E Total returns would have been lower if certain expenses had not been reduced during the applicable periods shown.
F Fees and expenses of any underlying Fidelity Central Funds are not included in the Fund's expense ratio. The Fund indirectly bears its proportionate share of the expenses of any underlying Fidelity Central Funds.
G Expense ratios reflect operating expenses of the class. Expenses before reductions do not reflect amounts reimbursed by the investment adviser or reductions from brokerage service arrangements or reductions from other expense offset arrangements and do not represent the amount paid by the class during periods when reimbursements or reductions occur. Expenses net of fee waivers reflect expenses after reimbursement by the investment adviser but prior to reductions from brokerage service arrangements or other expense offset arrangements. Expenses net of all reductions represent the net expenses paid by the class.
H Amount does not include the portfolio activity of any underlying Fidelity Central Funds.
See accompanying notes which are an integral part of the financial statements.
Fidelity Global Commodity Stock Fund Class I
| Years ended October 31, | 2018 | 2017 | 2016 | 2015 | 2014 |
| Selected Per–Share Data | | | | | |
| Net asset value, beginning of period | $12.60 | $10.76 | $10.09 | $13.31 | $14.24 |
| Income from Investment Operations | | | | | |
| Net investment income (loss)A | .25 | .17 | .16 | .25 | .19 |
| Net realized and unrealized gain (loss) | (.21) | 1.86 | .77 | (3.26) | (.92) |
| Total from investment operations | .04 | 2.03 | .93 | (3.01) | (.73) |
| Distributions from net investment income | (.14) | (.12) | (.25) | (.19) | (.19) |
| Distributions from net realized gain | (.05) | (.07) | (.01) | (.03) | (.01) |
| Total distributions | (.19) | (.19) | (.26) | (.21)B | (.20) |
| Redemption fees added to paid in capitalA,C | – | – | – | – | – |
| Net asset value, end of period | $12.45 | $12.60 | $10.76 | $10.09 | $13.31 |
| Total ReturnD | .30% | 18.99% | 9.63% | (22.93)% | (5.16)% |
| Ratios to Average Net AssetsE,F | | | | | |
| Expenses before reductions | .93% | .96% | 1.01% | 1.09% | 1.06% |
| Expenses net of fee waivers, if any | .93% | .95% | 1.01% | 1.08% | 1.06% |
| Expenses net of all reductions | .91% | .94% | 1.00% | 1.08% | 1.06% |
| Net investment income (loss) | 1.90% | 1.45% | 1.55% | 2.11% | 1.34% |
| Supplemental Data | | | | | |
| Net assets, end of period (000 omitted) | $117,981 | $113,655 | $70,068 | $24,841 | $23,840 |
| Portfolio turnover rateG | 70% | 81% | 85% | 77% | 75% |
A Calculated based on average shares outstanding during the period.
B Total distributions of $.21 per share is comprised of distributions from net investment income of $.186 and distributions from net realized gain of $.026 per share.
C Amount represents less than $.005 per share.
D Total returns would have been lower if certain expenses had not been reduced during the applicable periods shown.
E Fees and expenses of any underlying Fidelity Central Funds are not included in the Fund's expense ratio. The Fund indirectly bears its proportionate share of the expenses of any underlying Fidelity Central Funds.
F Expense ratios reflect operating expenses of the class. Expenses before reductions do not reflect amounts reimbursed by the investment adviser or reductions from brokerage service arrangements or reductions from other expense offset arrangements and do not represent the amount paid by the class during periods when reimbursements or reductions occur. Expenses net of fee waivers reflect expenses after reimbursement by the investment adviser but prior to reductions from brokerage service arrangements or other expense offset arrangements. Expenses net of all reductions represent the net expenses paid by the class.
G Amount does not include the portfolio activity of any underlying Fidelity Central Funds.
See accompanying notes which are an integral part of the financial statements.
Fidelity Global Commodity Stock Fund Class Z
| Year ended October 31, | 2018 A |
| Selected Per–Share Data | |
| Net asset value, beginning of period | $13.84 |
| Income from Investment Operations | |
| Net investment income (loss)B | (.01) |
| Net realized and unrealized gain (loss) | (1.37) |
| Total from investment operations | (1.38) |
| Net asset value, end of period | $12.46 |
| Total ReturnC,D | (9.97)% |
| Ratios to Average Net AssetsE,F | |
| Expenses before reductions | .89%G |
| Expenses net of fee waivers, if any | .89%G |
| Expenses net of all reductions | .87%G |
| Net investment income (loss) | (.70)%G |
| Supplemental Data | |
| Net assets, end of period (000 omitted) | $5,118 |
| Portfolio turnover rateH | 70% |
A For the period October 2, 2018 (commencement of sale of shares) to October 31, 2018.
B Calculated based on average shares outstanding during the period.
C Total returns for periods of less than one year are not annualized.
D Total returns would have been lower if certain expenses had not been reduced during the applicable periods shown.
E Fees and expenses of any underlying Fidelity Central Funds are not included in the Fund's expense ratio. The Fund indirectly bears its proportionate share of the expenses of any underlying Fidelity Central Funds.
F Expense ratios reflect operating expenses of the class. Expenses before reductions do not reflect amounts reimbursed by the investment adviser or reductions from brokerage service arrangements or reductions from other expense offset arrangements and do not represent the amount paid by the class during periods when reimbursements or reductions occur. Expense ratios before reductions for start-up periods may not be representative of longer-term operating periods. Expenses net of fee waivers reflect expenses after reimbursement by the investment adviser but prior to reductions from brokerage service arrangements or other expense offset arrangements. Expenses net of all reductions represent the net expenses paid by the class.
G Annualized
H Amount does not include the portfolio activity of any underlying Fidelity Central Funds.
See accompanying notes which are an integral part of the financial statements.
Notes to Financial Statements
For the period ended October 31, 2018
1. Organization.
Fidelity Global Commodity Stock Fund (the Fund) is a non-diversified fund of Fidelity Investment Trust (the Trust) and is authorized to issue an unlimited number of shares. The Trust is registered under the Investment Company Act of 1940, as amended (the 1940 Act), as an open-end management investment company organized as a Massachusetts business trust. The Fund commenced sale of Class Z shares on October 2, 2018. The Fund offers Class A, Class M, Class C, Global Commodity Stock, Class I and Class Z shares, each of which has equal rights as to assets and voting privileges. Each class has exclusive voting rights with respect to matters that affect that class. The Fund's investments in emerging markets can be subject to social, economic, regulatory, and political uncertainties and can be extremely volatile.
2. Investments in Fidelity Central Funds.
The Fund invests in Fidelity Central Funds, which are open-end investment companies generally available only to other investment companies and accounts managed by the investment adviser and its affiliates. The Fund's Schedule of Investments lists each of the Fidelity Central Funds held as of period end, if any, as an investment of the Fund, but does not include the underlying holdings of each Fidelity Central Fund. As an Investing Fund, the Fund indirectly bears its proportionate share of the expenses of the underlying Fidelity Central Funds.
The Money Market Central Funds seek preservation of capital and current income and are managed by Fidelity Investments Money Management, Inc. (FIMM), an affiliate of the investment adviser. Annualized expenses of the Money Market Central Funds as of their most recent shareholder report date are less than .005%.
A complete unaudited list of holdings for each Fidelity Central Fund is available upon request or at the Securities and Exchange Commission (the SEC) website at www.sec.gov. In addition, the financial statements of the Fidelity Central Funds, which are not covered by the Fund's Report of Independent Registered Public Accounting Firm, are available on the SEC website or upon request.
3. Significant Accounting Policies.
The Fund is an investment company and applies the accounting and reporting guidance of the Financial Accounting Standards Board (FASB) Accounting Standards Codification Topic 946 Financial Services – Investments Companies. The financial statements have been prepared in conformity with accounting principles generally accepted in the United States of America (GAAP), which require management to make certain estimates and assumptions at the date of the financial statements. Actual results could differ from those estimates. Subsequent events, if any, through the date that the financial statements were issued have been evaluated in the preparation of the financial statements. The following summarizes the significant accounting policies of the Fund:
Investment Valuation. Investments are valued as of 4:00 p.m. Eastern time on the last calendar day of the period. The Board of Trustees (the Board) has delegated the day to day responsibility for the valuation of the Fund's investments to the Fair Value Committee (the Committee) established by the Fund's investment adviser. In accordance with valuation policies and procedures approved by the Board, the Fund attempts to obtain prices from one or more third party pricing vendors or brokers to value its investments. When current market prices, quotations or currency exchange rates are not readily available or reliable, investments will be fair valued in good faith by the Committee, in accordance with procedures adopted by the Board. Factors used in determining fair value vary by investment type and may include market or investment specific events. The frequency with which these procedures are used cannot be predicted and they may be utilized to a significant extent. The Committee oversees the Fund's valuation policies and procedures and reports to the Board on the Committee's activities and fair value determinations. The Board monitors the appropriateness of the procedures used in valuing the Fund's investments and ratifies the fair value determinations of the Committee.
The Fund categorizes the inputs to valuation techniques used to value its investments into a disclosure hierarchy consisting of three levels as shown below:
- Level 1 – quoted prices in active markets for identical investments
- Level 2 – other significant observable inputs (including quoted prices for similar investments, interest rates, prepayment speeds, etc.)
- Level 3 – unobservable inputs (including the Fund's own assumptions based on the best information available)
Valuation techniques used to value the Fund's investments by major category are as follows:
Equity securities, including restricted securities, for which market quotations are readily available, are valued at the last reported sale price or official closing price as reported by a third party pricing vendor on the primary market or exchange on which they are traded and are categorized as Level 1 in the hierarchy. In the event there were no sales during the day or closing prices are not available, securities are valued at the last quoted bid price or may be valued using the last available price and are generally categorized as Level 2 in the hierarchy. For foreign equity securities, when market or security specific events arise, comparisons to the valuation of American Depositary Receipts (ADRs), futures contracts, Exchange-Traded Funds (ETFs) and certain indexes as well as quoted prices for similar securities may be used and would be categorized as Level 2 in the hierarchy. Utilizing these techniques may result in transfers between Level 1 and Level 2. For equity securities, including restricted securities, where observable inputs are limited, assumptions about market activity and risk are used and these securities may be categorized as Level 3 in the hierarchy.
Investments in open-end mutual funds, including the Fidelity Central Funds, are valued at their closing net asset value (NAV) each business day and are categorized as Level 1 in the hierarchy.
Changes in valuation techniques may result in transfers in or out of an assigned level within the disclosure hierarchy. The aggregate value of investments by input level as of October 31, 2018 is included at the end of the Fund's Schedule of Investments.
Foreign Currency. The Fund may use foreign currency contracts to facilitate transactions in foreign-denominated securities. Gains and losses from these transactions may arise from changes in the value of the foreign currency or if the counterparties do not perform under the contracts' terms.
Foreign-denominated assets, including investment securities, and liabilities are translated into U.S. dollars at the exchange rates at period end. Purchases and sales of investment securities, income and dividends received and expenses denominated in foreign currencies are translated into U.S. dollars at the exchange rate in effect on the transaction date.
The effects of exchange rate fluctuations on investments are included with the net realized and unrealized gain (loss) on investment securities. Other foreign currency transactions resulting in realized and unrealized gain (loss) are disclosed separately.
Investment Transactions and Income. For financial reporting purposes, the Fund's investment holdings and NAV include trades executed through the end of the last business day of the period. The NAV per share for processing shareholder transactions is calculated as of the close of business of the New York Stock Exchange (NYSE), normally 4:00 p.m. Eastern time and includes trades executed through the end of the prior business day. Gains and losses on securities sold are determined on the basis of identified cost and include proceeds received from litigation. Dividend income is recorded on the ex-dividend date, except for certain dividends from foreign securities where the ex-dividend date may have passed, which are recorded as soon as the Fund is informed of the ex-dividend date. Non-cash dividends included in dividend income, if any, are recorded at the fair market value of the securities received. Income and capital gain distributions from Fidelity Central Funds, if any, are recorded on the ex-dividend date. Certain distributions received by the Fund represent a return of capital or capital gain. The Fund determines the components of these distributions subsequent to the ex-dividend date, based upon receipt of tax filings or other correspondence relating to the underlying investment. These distributions are recorded as a reduction of cost of investments and/or as a realized gain. Investment income is recorded net of foreign taxes withheld where recovery of such taxes is uncertain.
Class Allocations and Expenses. Investment income, realized and unrealized capital gains and losses, common expenses of the Fund, and certain fund-level expense reductions, if any, are allocated daily on a pro-rata basis to each class based on the relative net assets of each class to the total net assets of the Fund. Each class differs with respect to transfer agent and distribution and service plan fees incurred. Certain expense reductions may also differ by class. For the reporting period, the allocated portion of income and expenses to each class as a percent of its average net assets may vary due to the timing of recording these transactions in relation to fluctuating net assets of the classes. Expenses directly attributable to a fund are charged to that fund. Expenses attributable to more than one fund are allocated among the respective funds on the basis of relative net assets or other appropriate methods. Expense estimates are accrued in the period to which they relate and adjustments are made when actual amounts are known.
Income Tax Information and Distributions to Shareholders. Each year, the Fund intends to qualify as a regulated investment company under Subchapter M of the Internal Revenue Code, including distributing substantially all of its taxable income and realized gains. As a result, no provision for U.S. Federal income taxes is required. As of October 31, 2018, the Fund did not have any unrecognized tax benefits in the financial statements; nor is the Fund aware of any tax positions for which it is reasonably possible that the total amounts of unrecognized tax benefits will significantly change in the next twelve months. The Fund files a U.S. federal tax return, in addition to state and local tax returns as required. The Fund's federal income tax returns are subject to examination by the Internal Revenue Service (IRS) for a period of three fiscal years after they are filed. State and local tax returns may be subject to examination for an additional fiscal year depending on the jurisdiction. Foreign taxes are provided for based on the Fund's understanding of the tax rules and rates that exist in the foreign markets in which it invests.
Distributions are declared and recorded on the ex-dividend date. Income and capital gain distributions are declared separately for each class. Income and capital gain distributions are determined in accordance with income tax regulations, which may differ from GAAP. In addition, the Fund claimed a portion of the payment made to redeeming shareholders as a distribution for income tax purposes.
Capital accounts within the financial statements are adjusted for permanent book-tax differences. These adjustments have no impact on net assets or the results of operations. Capital accounts are not adjusted for temporary book-tax differences which will reverse in a subsequent period.
Book-tax differences are primarily due to foreign currency transactions, partnerships, passive foreign investment companies (PFIC), capital loss carryforwards and losses deferred due to wash sales.
As of period end, the cost and unrealized appreciation (depreciation) in securities, and derivatives if applicable, for federal income tax purposes were as follows:
| Gross unrealized appreciation | $20,326,078 |
| Gross unrealized depreciation | (116,185,353) |
| Net unrealized appreciation (depreciation) | $(95,859,275) |
| Tax Cost | $650,584,635 |
The tax-based components of distributable earnings as of period end were as follows:
| Undistributed ordinary income | $ 9,018,894 |
| Capital loss carryforward | $(27,311,807) |
| Net unrealized appreciation (depreciation) on securities and other investments | $(95,817,801) |
Capital loss carryforwards are only available to offset future capital gains of the Fund to the extent provided by regulations and may be limited. Under the Regulated Investment Company Modernization Act of 2010 (the Act), the Fund is permitted to carry forward capital losses incurred in taxable years beginning after December 22, 2010 for an unlimited period and such capital losses are required to be used prior to any losses that expire. The capital loss carryforward information presented below, including any applicable limitation, is estimated as of fiscal period end and is subject to adjustment.
| Fiscal year of expiration | |
| 2019 | $(6,952,413) |
| No expiration | |
| Long-term | (20,359,394) |
| Total capital loss carryforward | $(27,311,807) |
The tax character of distributions paid was as follows:
| | October 31, 2018 | October 31, 2017 |
| Ordinary Income | $7,402,151 | $ 5,873,296 |
Short-Term Trading (Redemption) Fees. During the period, shares held by investors in the Fund less than 30 days may have been subject to a redemption fee equal to 1.00% of the NAV of shares redeemed. All redemption fees, which reduce the proceeds of the shareholder redemption, are retained by the Fund and accounted for as an addition to paid in capital. In November 2017, the Board of Trustees approved the elimination of these redemption fees effective December 18, 2017.
New Rule Issuance. During August 2018, the U.S. Securities and Exchange Commission issued Final Rule Release No. 33-10532, Disclosure Update and Simplification. This Final Rule includes amendments specific to registered investment companies that are intended to eliminate overlap in disclosure requirements between Regulation S-X and GAAP. In accordance with these amendments, certain line-items in the Fund's financial statements have been combined or removed for the current period as outlined in the table below.
| Financial Statement | Current Line-Item Presentation | Prior Line-Item Presentation |
| Statement of Assets and Liabilities | Total distributable earnings (loss) | Undistributed/Distributions in excess of/Accumulated net investment income (loss)
Accumulated/Undistributed net realized gain (loss)
Net unrealized appreciation (depreciation) |
| Statement of Changes in Net Assets | N/A - removed | Undistributed/Distributions in excess of/Accumulated net investment income (loss) end of period |
| Statement of Changes in Net Assets | Distributions to shareholders | Distributions to shareholders from net investment income
Distributions to shareholders from net realized gain |
| Distributions to Shareholders Note to Financial Statements | Distributions to shareholders | Distributions to shareholders from net investment income
Distributions to shareholders from net realized gain |
4. Purchases and Sales of Investments.
Purchases and sales of securities, other than short-term securities, aggregated $538,023,671 and $405,858,910, respectively.
5. Fees and Other Transactions with Affiliates.
Management Fee. Fidelity Management & Research Company (the investment adviser) and its affiliates provide the Fund with investment management related services for which the Fund pays a monthly management fee. The management fee is the sum of an individual fund fee rate that is based on an annual rate of .45% of the Fund's average net assets and an annualized group fee rate that averaged .24% during the period. The group fee rate is based upon the average net assets of all the mutual funds advised by the investment adviser, including any mutual funds previously advised by the investment adviser that are currently advised by Fidelity SelectCo, LLC, an affiliate of the investment adviser. The group fee rate decreases as assets under management increase and increases as assets under management decrease. For the reporting period, the total annual management fee rate was .69% of the Fund's average net assets.
Distribution and Service Plan Fees. In accordance with Rule 12b-1 of the 1940 Act, the Fund has adopted separate Distribution and Service Plans for each class of shares. Certain classes pay Fidelity Distributors Corporation (FDC), an affiliate of the investment adviser, separate Distribution and Service Fees, each of which is based on an annual percentage of each class' average net assets. In addition, FDC may pay financial intermediaries for selling shares of the Fund and providing shareholder support services. For the period, the Distribution and Service Fee rates, total fees and amounts retained by FDC were as follows:
| | Distribution Fee | Service Fee | Total Fees | Retained by FDC |
| Class A | -% | .25% | $84,499 | $4,846 |
| Class M | .25% | .25% | 39,524 | 522 |
| Class C | .75% | .25% | 216,617 | 27,172 |
| | | | $340,640 | $ 32,540 |
Sales Load. FDC may receive a front-end sales charge of up to 5.75% for selling Class A shares and 3.50% for selling Class M shares, some of which is paid to financial intermediaries for selling shares of the Fund. Depending on the holding period, FDC may receive contingent deferred sales charges levied on Class A, Class M and Class C redemptions. The deferred sales charges are 1.00% for Class C shares, 1.00% for certain purchases of Class A shares and .25% for certain purchases of Class M shares.
For the period, sales charge amounts retained by FDC were as follows:
| | Retained by FDC |
| Class A | $14,981 |
| Class M | 1,529 |
| Class C(a) | 1,996 |
| | $18,506 |
(a) When Class C shares are initially sold, FDC pays commissions from its own resources to financial intermediaries through which the sales are made.
Transfer Agent Fees. Fidelity Investments Institutional Operations Company, Inc., (FIIOC), an affiliate of the investment adviser, is the transfer, dividend disbursing and shareholder servicing agent for each class of the Fund. FIIOC receives account fees and asset-based fees that vary according to the account size and type of account of the shareholders of the respective classes of the Fund, except for Class Z. FIIOC receives an asset-based fee of Class Z's average net assets. FIIOC pays for typesetting, printing and mailing of shareholder reports, except proxy statements.
For the period, transfer agent fees for each class were as follows:
| | Amount | % of Class-Level Average Net Assets |
| Class A | $86,501 | .26 |
| Class M | 24,959 | .32 |
| Class C | 47,275 | .22 |
| Global Commodity Stock | 1,222,487 | .30 |
| Class I | 189,276 | .15 |
| Class Z | 47 | .04(a) |
| | $1,570,545 | |
(a) Annualized
Accounting and Security Lending Fees. Fidelity Service Company, Inc. (FSC), an affiliate of the investment adviser, maintains the Fund's accounting records. The accounting fee is based on the level of average net assets for each month. Under a separate contract, FSC administers the security lending program. The security lending fee is based on the number and duration of lending transactions. For the period, the fees were equivalent to an annual rate of .05%.
Brokerage Commissions. The Fund placed a portion of its portfolio transactions with brokerage firms which are affiliates of the investment adviser. Brokerage commissions are included in net realized gain (loss) and change in net unrealized appreciation (depreciation) in the Statement of Operations. The commissions paid to these affiliated firms were $5,560 for the period.
Interfund Lending Program. Pursuant to an Exemptive Order issued by the SEC, the Fund, along with other registered investment companies having management contracts with Fidelity Management & Research Company (FMR) or other affiliated entities of FMR, may participate in an interfund lending program. This program provides an alternative credit facility allowing the funds to borrow from, or lend money to, other participating affiliated funds. At period end, there were no interfund loans outstanding. The Fund's activity in this program during the period for which loans were outstanding was as follows:
| Borrower or Lender | Average Loan Balance | Weighted Average Interest Rate | Interest Expense |
| Borrower | $8,883,750 | 1.95% | $1,921 |
Interfund Trades. The Fund may purchase from or sell securities to other Fidelity Funds under procedures adopted by the Board. The procedures have been designed to ensure these interfund trades are executed in accordance with Rule 17a-7 of the 1940 Act. Interfund trades are included within the respective purchases and sales amounts shown in the Purchases and Sales of Investments note.
6. Committed Line of Credit.
The Fund participates with other funds managed by the investment adviser or an affiliate in a $4.25 billion credit facility (the "line of credit") to be utilized for temporary or emergency purposes to fund shareholder redemptions or for other short-term liquidity purposes. The Fund has agreed to pay commitment fees on its pro-rata portion of the line of credit, which amounted to $1,568 and is reflected in Miscellaneous expenses on the Statement of Operations. During the period, the Fund did not borrow on this line of credit.
7. Security Lending.
The Fund lends portfolio securities through a lending agent from time to time in order to earn additional income. For equity securities, a lending agent is used and may loan securities to certain qualified borrowers, including Fidelity Capital Markets (FCM), a broker-dealer affiliated with the Fund. On the settlement date of the loan, the Fund receives collateral (in the form of U.S. Treasury obligations, letters of credit and/or cash) against the loaned securities and maintains collateral in an amount not less than 100% of the market value of the loaned securities during the period of the loan. The market value of the loaned securities is determined at the close of business of the Fund and any additional required collateral is delivered to the Fund on the next business day. The Fund or borrower may terminate the loan at any time, and if the borrower defaults on its obligation to return the securities loaned because of insolvency or other reasons, the Fund may apply collateral received from the borrower against the obligation. The Fund may experience delays and costs in recovering the securities loaned. Any cash collateral received is invested in the Fidelity Securities Lending Cash Central Fund. The value of loaned securities and cash collateral at period end are disclosed on the Fund's Statement of Assets and Liabilities. At period end, there were no security loans outstanding with FCM. Security lending income represents the income earned on investing cash collateral, less rebates paid to borrowers and any lending agent fees associated with the loan, plus any premium payments received for lending certain types of securities. Security lending income is presented in the Statement of Operations as a component of income from Fidelity Central Funds. Total security lending income during the period amounted to $261,584, including $12 from securities loaned to FCM.
8. Expense Reductions.
Commissions paid to certain brokers with whom the investment adviser, or its affiliates, places trades on behalf of the Fund include an amount in addition to trade execution, which may be rebated back to the Fund to offset certain expenses. This amount totaled $100,126 for the period.
In addition, during the period the investment adviser reimbursed and/or waived a portion of fund-level operating expenses in the amount of $5,500.
9. Distributions to Shareholders.
Distributions to shareholders of each class were as follows:
| | Year ended
October 31, 2018 | Year ended
October 31, 2017 |
| Distributions to shareholders | | |
| Class A | $309,556 | $– |
| Class M | 55,615 | – |
| Class C | 53,428 | – |
| Global Commodity Stock | 5,313,895 | – |
| Class I | 1,669,657 | – |
| Total | $7,402,151 | $– |
| From net investment income | | |
| Class A | $– | $252,767 |
| Class M | – | 29,683 |
| Class C | – | 14,849 |
| Global Commodity Stock | – | 2,329,358 |
| Class I | – | 884,379 |
| Total | $– | $3,511,036 |
| From net realized gain | | |
| Class A | $– | $220,361 |
| Class M | – | 39,578 |
| Class C | – | 84,142 |
| Global Commodity Stock | – | 1,508,537 |
| Class I | – | 509,642 |
| Total | $– | $2,362,260 |
10. Share Transactions.
Share transactions for each class were as follows and may contain automatic conversions between classes or exchanges between affiliated funds:
| | Shares | Shares | Dollars | Dollars |
| | Year ended October 31, 2018(a) | Year ended October 31, 2017 | Year ended October 31, 2018(a) | Year ended October 31, 2017 |
| Class A | | | | |
| Shares sold | 961,117 | 651,469 | $12,976,845 | $7,552,817 |
| Reinvestment of distributions | 24,771 | 39,394 | 306,172 | 455,002 |
| Shares redeemed | (1,173,857) | (1,549,520) | (15,724,822) | (18,059,878) |
| Net increase (decrease) | (187,969) | (858,657) | $(2,441,805) | $(10,052,059) |
| Class M | | | | |
| Shares sold | 228,243 | 139,490 | $3,056,866 | $1,612,955 |
| Reinvestment of distributions | 4,488 | 5,865 | 55,468 | 67,801 |
| Shares redeemed | (200,167) | (162,841) | (2,622,769) | (1,893,807) |
| Net increase (decrease) | 32,564 | (17,486) | $489,565 | $(213,051) |
| Class C | | | | |
| Shares sold | 880,029 | 316,655 | $11,853,888 | $3,641,065 |
| Reinvestment of distributions | 4,237 | 8,150 | 52,034 | 93,566 |
| Shares redeemed | (340,536) | (361,056) | (4,503,052) | (4,124,666) |
| Net increase (decrease) | 543,730 | (36,251) | $7,402,870 | $(390,035) |
| Global Commodity Stock | | | | |
| Shares sold | 17,721,753 | 7,707,102 | $231,763,153 | $89,805,053 |
| Reinvestment of distributions | 414,534 | 315,142 | 5,123,639 | 3,643,039 |
| Shares redeemed | (9,429,371) | (8,286,656) | (125,657,701) | (96,347,286) |
| Net increase (decrease) | 8,706,916 | (264,412) | $111,229,091 | $(2,899,194) |
| Class I | | | | |
| Shares sold | 3,453,489 | 4,738,302 | $46,712,238 | $54,914,110 |
| Reinvestment of distributions | 65,617 | 58,242 | 810,368 | 672,698 |
| Shares redeemed | (3,065,738) | (2,283,691) | (39,890,323) | (26,192,412) |
| Net increase (decrease) | 453,368 | 2,512,853 | $7,632,283 | $29,394,396 |
| Class Z | | | | |
| Shares sold | 412,977 | – | $5,219,125 | $– |
| Shares redeemed | (2,138) | – | (26,499) | – |
| Net increase (decrease) | 410,839 | – | $5,192,626 | $– |
(a) Share transactions for Class Z are for the period October 2, 2018 (commencement of sale of shares) to October 31, 2018.
11. Other.
The Fund's organizational documents provide former and current trustees and officers with a limited indemnification against liabilities arising in connection with the performance of their duties to the Fund. In the normal course of business, the Fund may also enter into contracts that provide general indemnifications. The Fund's maximum exposure under these arrangements is unknown as this would be dependent on future claims that may be made against the Fund. The risk of material loss from such claims is considered remote.
At the end of the period, VIP FundsManager 50% Portfolio and VIP FundsManager 60% Portfolio were the owners of record of approximately 11% and 10%, respectively, of the total outstanding shares of the Fund. Mutual funds managed by the investment adviser or its affiliates were the owners of record, in the aggregate, of approximately 26% of the total outstanding shares of the Fund.
Report of Independent Registered Public Accounting Firm
To the Board of Trustees of Fidelity Investment Trust and Shareholders of Fidelity Global Commodity Stock Fund:
Opinion on the Financial Statements
We have audited the accompanying statement of assets and liabilities, including the schedule of investments, of Fidelity Global Commodity Stock Fund (one of the funds constituting Fidelity Investment Trust, referred to hereafter as the "Fund") as of October 31, 2018, the related statement of operations for the year ended October 31, 2018, the statement of changes in net assets for each of the two years in the period ended October 31, 2018, including the related notes, and the financial highlights for each of the periods indicated therein (collectively referred to as the “financial statements”). In our opinion, the financial statements present fairly, in all material respects, the financial position of the Fund as of October 31, 2018, the results of its operations for the year then ended, the changes in its net assets for each of the two years in the period ended October 31, 2018 and the financial highlights for the periods indicated therein in conformity with accounting principles generally accepted in the United States of America.
Basis for Opinion
These financial statements are the responsibility of the Fund’s management. Our responsibility is to express an opinion on the Fund’s financial statements based on our audits. We are a public accounting firm registered with the Public Company Accounting Oversight Board (United States) (“PCAOB”) and are required to be independent with respect to the Fund in accordance with the U.S. federal securities laws and the applicable rules and regulations of the Securities and Exchange Commission and the PCAOB.
We conducted our audits of these financial statements in accordance with the standards of the PCAOB. Those standards require that we plan and perform the audit to obtain reasonable assurance about whether the financial statements are free of material misstatement, whether due to error or fraud.
Our audits included performing procedures to assess the risks of material misstatement of the financial statements, whether due to error or fraud, and performing procedures that respond to those risks. Such procedures included examining, on a test basis, evidence regarding the amounts and disclosures in the financial statements. Our audits also included evaluating the accounting principles used and significant estimates made by management, as well as evaluating the overall presentation of the financial statements. Our procedures included confirmation of securities owned as of October 31, 2018 by correspondence with the custodian and brokers; when replies were not received from brokers, we performed other auditing procedures. We believe that our audits provide a reasonable basis for our opinion.
PricewaterhouseCoopers LLP
Boston, Massachusetts
December 13, 2018
We have served as the auditor of one or more investment companies in the Fidelity group of funds since 1932.
Trustees and Officers
The Trustees, Members of the Advisory Board (if any), and officers of the trust and fund, as applicable, are listed below. The Board of Trustees governs the fund and is responsible for protecting the interests of shareholders. The Trustees are experienced executives who meet periodically throughout the year to oversee the fund's activities, review contractual arrangements with companies that provide services to the fund, oversee management of the risks associated with such activities and contractual arrangements, and review the fund's performance. Except for Jonathan Chiel, each of the Trustees oversees 283 funds. Mr. Chiel oversees 154 funds.
The Trustees hold office without limit in time except that (a) any Trustee may resign; (b) any Trustee may be removed by written instrument, signed by at least two-thirds of the number of Trustees prior to such removal; (c) any Trustee who requests to be retired or who has become incapacitated by illness or injury may be retired by written instrument signed by a majority of the other Trustees; and (d) any Trustee may be removed at any special meeting of shareholders by a two-thirds vote of the outstanding voting securities of the trust. Each Trustee who is not an interested person (as defined in the 1940 Act) of the trust and the fund is referred to herein as an Independent Trustee. Each Independent Trustee shall retire not later than the last day of the calendar year in which his or her 75th birthday occurs. The Independent Trustees may waive this mandatory retirement age policy with respect to individual Trustees. Officers and Advisory Board Members hold office without limit in time, except that any officer or Advisory Board Member may resign or may be removed by a vote of a majority of the Trustees at any regular meeting or any special meeting of the Trustees. Except as indicated, each individual has held the office shown or other offices in the same company for the past five years.
The fund’s Statement of Additional Information (SAI) includes more information about the Trustees. To request a free copy, call Fidelity at 1-877-208-0098.
Experience, Skills, Attributes, and Qualifications of the Trustees. The Governance and Nominating Committee has adopted a statement of policy that describes the experience, qualifications, attributes, and skills that are necessary and desirable for potential Independent Trustee candidates (Statement of Policy). The Board believes that each Trustee satisfied at the time he or she was initially elected or appointed a Trustee, and continues to satisfy, the standards contemplated by the Statement of Policy. The Governance and Nominating Committee also engages professional search firms to help identify potential Independent Trustee candidates who have the experience, qualifications, attributes, and skills consistent with the Statement of Policy. From time to time, additional criteria based on the composition and skills of the current Independent Trustees, as well as experience or skills that may be appropriate in light of future changes to board composition, business conditions, and regulatory or other developments, have also been considered by the professional search firms and the Governance and Nominating Committee. In addition, the Board takes into account the Trustees' commitment and participation in Board and committee meetings, as well as their leadership of standing and ad hoc committees throughout their tenure.
In determining that a particular Trustee was and continues to be qualified to serve as a Trustee, the Board has considered a variety of criteria, none of which, in isolation, was controlling. The Board believes that, collectively, the Trustees have balanced and diverse experience, qualifications, attributes, and skills, which allow the Board to operate effectively in governing the fund and protecting the interests of shareholders. Information about the specific experience, skills, attributes, and qualifications of each Trustee, which in each case led to the Board's conclusion that the Trustee should serve (or continue to serve) as a trustee of the fund, is provided below.
Board Structure and Oversight Function. James C. Curvey is an interested person and currently serves as Chairman. The Trustees have determined that an interested Chairman is appropriate and benefits shareholders because an interested Chairman has a personal and professional stake in the quality and continuity of services provided to the fund. Independent Trustees exercise their informed business judgment to appoint an individual of their choosing to serve as Chairman, regardless of whether the Trustee happens to be independent or a member of management. The Independent Trustees have determined that they can act independently and effectively without having an Independent Trustee serve as Chairman and that a key structural component for assuring that they are in a position to do so is for the Independent Trustees to constitute a substantial majority for the Board. The Independent Trustees also regularly meet in executive session. Ned C. Lautenbach serves as Chairman of the Independent Trustees and as such (i) acts as a liaison between the Independent Trustees and management with respect to matters important to the Independent Trustees and (ii) with management prepares agendas for Board meetings.
Fidelity® funds are overseen by different Boards of Trustees. The fund's Board oversees Fidelity's high income and certain equity funds, and other Boards oversee Fidelity's investment-grade bond, money market, asset allocation, and other equity funds. The asset allocation funds may invest in Fidelity® funds overseen by the fund's Board. The use of separate Boards, each with its own committee structure, allows the Trustees of each group of Fidelity® funds to focus on the unique issues of the funds they oversee, including common research, investment, and operational issues. On occasion, the separate Boards establish joint committees to address issues of overlapping consequences for the Fidelity® funds overseen by each Board.
The Trustees operate using a system of committees to facilitate the timely and efficient consideration of all matters of importance to the Trustees, the fund, and fund shareholders and to facilitate compliance with legal and regulatory requirements and oversight of the fund's activities and associated risks. The Board, acting through its committees, has charged FMR and its affiliates with (i) identifying events or circumstances the occurrence of which could have demonstrably adverse effects on the fund's business and/or reputation; (ii) implementing processes and controls to lessen the possibility that such events or circumstances occur or to mitigate the effects of such events or circumstances if they do occur; and (iii) creating and maintaining a system designed to evaluate continuously business and market conditions in order to facilitate the identification and implementation processes described in (i) and (ii) above. Because the day-to-day operations and activities of the fund are carried out by or through FMR, its affiliates, and other service providers, the fund's exposure to risks is mitigated but not eliminated by the processes overseen by the Trustees. While each of the Board's committees has responsibility for overseeing different aspects of the fund's activities, oversight is exercised primarily through the Operations, Audit, and Compliance Committees. In addition, the Independent Trustees have worked with Fidelity to enhance the Board's oversight of investment and financial risks, legal and regulatory risks, technology risks, and operational risks, including the development of additional risk reporting to the Board. Appropriate personnel, including but not limited to the fund's Chief Compliance Officer (CCO), FMR's internal auditor, the independent accountants, the fund's Treasurer and portfolio management personnel, make periodic reports to the Board's committees, as appropriate, including an annual review of Fidelity's risk management program for the Fidelity® funds. The responsibilities of each standing committee, including their oversight responsibilities, are described further under "Standing Committees of the Trustees."
Interested Trustees*:
Correspondence intended for a Trustee who is an interested person may be sent to Fidelity Investments, 245 Summer Street, Boston, Massachusetts 02210.
Name, Year of Birth; Principal Occupations and Other Relevant Experience+
Jonathan Chiel (1957)
Year of Election or Appointment: 2016
Trustee
Mr. Chiel also serves as Trustee of other Fidelity® funds. Mr. Chiel is Executive Vice President and General Counsel for FMR LLC (diversified financial services company, 2012-present). Previously, Mr. Chiel served as general counsel (2004-2012) and senior vice president and deputy general counsel (2000-2004) for John Hancock Financial Services; a partner with Choate, Hall & Stewart (1996-2000) (law firm); and an Assistant United States Attorney for the United States Attorney’s Office of the District of Massachusetts (1986-95), including Chief of the Criminal Division (1993-1995). Mr. Chiel is a director on the boards of the Boston Bar Foundation and the Maimonides School.
James C. Curvey (1935)
Year of Election or Appointment: 2007
Trustee
Chairman of the Board of Trustees
Mr. Curvey also serves as Trustee of other Fidelity® funds. Mr. Curvey is Vice Chairman (2007-present) and Director of FMR LLC (diversified financial services company). In addition, Mr. Curvey is an Overseer Emeritus for the Boston Symphony Orchestra, a Director of Artis-Naples, and a Trustee of Brewster Academy in Wolfeboro, New Hampshire. Previously, Mr. Curvey served as a Director of Fidelity Research & Analysis Co. (investment adviser firm, 2009-2018), Director of Fidelity Investments Money Management, Inc. (investment adviser firm, 2009-2014) and a Director of FMR and FMR Co., Inc. (investment adviser firms, 2007-2014).
Charles S. Morrison (1960)
Year of Election or Appointment: 2014
Trustee
Mr. Morrison also serves as Trustee of other funds. He serves as President of Fidelity SelectCo, LLC (investment adviser firm, 2017-present) and Fidelity Management & Research Company (FMR) (investment adviser firm, 2016-present), a Director of Fidelity Investments Money Management, Inc. (FIMM) (investment adviser firm, 2014-present), Director of Fidelity SelectCo, LLC (investment adviser firm, 2014-present), President, Asset Management (2014-present), and is an employee of Fidelity Investments. Previously, Mr. Morrison served as Vice President of Fidelity's Fixed Income and Asset Allocation Funds (2012-2014), President, Fixed Income (2011-2014), Vice President of Fidelity's Money Market Funds (2005-2009), President, Money Market Group Leader of FMR (investment adviser firm, 2009), and Senior Vice President, Money Market Group of FMR (2004-2009). Mr. Morrison also served as Vice President of Fidelity's Bond Funds (2002-2005), certain Balanced Funds (2002-2005), and certain Asset Allocation Funds (2002-2007), and as Senior Vice President (2002-2005) of Fidelity's Bond Division.
* Determined to be an “Interested Trustee” by virtue of, among other things, his or her affiliation with the trust or various entities under common control with FMR.
+ The information includes the Trustee's principal occupation during the last five years and other information relating to the experience, attributes, and skills relevant to the Trustee's qualifications to serve as a Trustee, which led to the conclusion that the Trustee should serve as a Trustee for the fund.
Independent Trustees:
Correspondence intended for an Independent Trustee may be sent to Fidelity Investments, P.O. Box 55235, Boston, Massachusetts 02205-5235.
Name, Year of Birth; Principal Occupations and Other Relevant Experience+
Dennis J. Dirks (1948)
Year of Election or Appointment: 2005
Trustee
Mr. Dirks also serves as Trustee of other Fidelity® funds. Prior to his retirement in May 2003, Mr. Dirks was Chief Operating Officer and a member of the Board of The Depository Trust & Clearing Corporation (DTCC). He also served as President, Chief Operating Officer, and Board member of The Depository Trust Company (DTC) and President and Board member of the National Securities Clearing Corporation (NSCC). In addition, Mr. Dirks served as Chief Executive Officer and Board member of the Government Securities Clearing Corporation, Chief Executive Officer and Board member of the Mortgage-Backed Securities Clearing Corporation, as a Trustee and a member of the Finance Committee of Manhattan College (2005-2008), as a Trustee and a member of the Finance Committee of AHRC of Nassau County (2006-2008), as a member of the Independent Directors Council (IDC) Governing Council (2010-2015), and as a member of the Board of Directors for The Brookville Center for Children’s Services, Inc. (2009-2017). Mr. Dirks is a member of the Finance Committee (2016-present), Board of Directors (2017-present) and Board of Trustees (2018-present) and is Treasurer (2018-present) of the Asolo Repertory Theatre.
Donald F. Donahue (1950)
Year of Election or Appointment: 2018
Trustee
Mr. Donahue also serves as a Trustee of other Fidelity® funds. Mr. Donahue is President and Chief Executive Officer of Miranda Partners, LLC (risk consulting for the financial services industry, 2012-present). Previously, Mr. Donahue served as a Member of the Advisory Board of certain Fidelity® funds (2015-2018) and Chief Executive Officer (2006-2012), Chief Operating Officer (2003-2006), and Managing Director, Customer Marketing and Development (1999-2003) of The Depository Trust & Clearing Corporation (financial markets infrastructure). Mr. Donahue serves as a Member (2007-present) and Co-Chairman (2016-present) of the Board of Directors of United Way of New York, Member of the Board of Directors of NYC Leadership Academy (2012-present) and Member of the Board of Advisors of Ripple Labs, Inc. (financial services, 2015-present). He also served as Chairman (2010-2012) and Member of the Board of Directors (2012-2013) of Omgeo, LLC (financial services), Treasurer of United Way of New York (2012-2016), and Member of the Board of Directors of XBRL US (financial services non-profit, 2009-2012) and the International Securities Services Association (2009-2012).
Alan J. Lacy (1953)
Year of Election or Appointment: 2008
Trustee
Mr. Lacy also serves as Trustee of other Fidelity® funds. Mr. Lacy serves as a Director of Bristol-Myers Squibb Company (global pharmaceuticals, 2008-present). He is a Trustee of the California Chapter of The Nature Conservancy (2015-present) and a Director of the Center for Advanced Study in the Behavioral Sciences at Stanford University (2015-present). In addition, Mr. Lacy served as Senior Adviser (2007-2014) of Oak Hill Capital Partners, L.P. (private equity) and also served as Chief Executive Officer (2005) and Vice Chairman (2005-2006) of Sears Holdings Corporation (retail) and Chief Executive Officer and Chairman of the Board of Sears, Roebuck and Co. (retail, 2000-2005). Previously, Mr. Lacy served as Chairman (2014-2017) and a member (2010-2017) of the Board of Directors of Dave & Buster’s Entertainment, Inc. (restaurant and entertainment complexes), as Chairman (2008-2011) and a member (2006-2015) of the Board of Trustees of the National Parks Conservation Association, and as a member of the Board of Directors for The Hillman Companies, Inc. (hardware wholesalers, 2010-2014), Earth Fare, Inc. (retail grocery, 2010-2014), and The Western Union Company (global money transfer, 2006-2011).
Ned C. Lautenbach (1944)
Year of Election or Appointment: 2000
Trustee
Chairman of the Independent Trustees
Mr. Lautenbach also serves as Trustee of other Fidelity® funds. Mr. Lautenbach currently serves as Vice Chair of the Board of Governors, State University System of Florida (2013-present) and is a member of the Council on Foreign Relations (1994-present). He is also a member and has most recently served as Chairman of the Board of Directors of Artis-Naples (2012-present). Previously, Mr. Lautenbach served as a member and then Lead Director of the Board of Directors of Eaton Corporation (diversified industrial, 1997-2016). He was also a Partner and Advisory Partner at Clayton, Dubilier & Rice, LLC (private equity investment, 1998-2010), as well as a Director of Sony Corporation (2006-2007). In addition, Mr. Lautenbach also had a 30-year career with IBM (technology company) during which time he served as Senior Vice President and a member of the Corporate Executive Committee (1968-1998).
Joseph Mauriello (1944)
Year of Election or Appointment: 2008
Trustee
Mr. Mauriello also serves as Trustee of other Fidelity® funds. Prior to his retirement in January 2006, Mr. Mauriello served in numerous senior management positions including Deputy Chairman and Chief Operating Officer (2004-2005), and Vice Chairman of Financial Services (2002-2004) of KPMG LLP US (professional services, 1965-2005). Mr. Mauriello currently serves as a member of the Independent Directors Council (IDC) Governing Council (2015-present). Previously, Mr. Mauriello served as a member of the Board of Directors of XL Group plc. (global insurance and re-insurance, 2006-2018).
Cornelia M. Small (1944)
Year of Election or Appointment: 2005
Trustee
Ms. Small also serves as Trustee of other Fidelity® funds. Ms. Small is a member of the Board of Directors (2009-present) and Chair of the Investment Committee (2010-present) of the Teagle Foundation. Ms. Small also serves on the Investment Committee of the Berkshire Taconic Community Foundation (2008-present). Previously, Ms. Small served as Chairperson (2002-2008) and a member of the Investment Committee and Chairperson (2008-2012) and a member of the Board of Trustees of Smith College. In addition, Ms. Small served as Chief Investment Officer, Director of Global Equity Investments, and a member of the Board of Directors of Scudder, Stevens & Clark and Scudder Kemper Investments.
Garnett A. Smith (1947)
Year of Election or Appointment: 2018
Trustee
Mr. Smith also serves as Trustee of other Fidelity® funds. Prior to Mr. Smith's retirement, he served as Chairman and Chief Executive Officer of Inbrand Corp. (manufacturer of personal absorbent products, 1990-1997). He also served as President (1986-1990) of Inbrand Corp. Prior to his employment with Inbrand Corp., he was employed by a retail fabric chain and North Carolina National Bank. In addition, Mr. Smith served as a Member of the Advisory Board of certain Fidelity® funds (2012-2013) and as a board member of the Jackson Hole Land Trust (2009-2012).
David M. Thomas (1949)
Year of Election or Appointment: 2008
Trustee
Mr. Thomas also serves as Trustee of other Fidelity® funds. Mr. Thomas serves as Non-Executive Chairman of the Board of Directors of Fortune Brands Home and Security (home and security products, 2011-present), as a member of the Board of Directors (2004-present) and Presiding Director (2013-present) of Interpublic Group of Companies, Inc. (marketing communication), and as a member of the Board of Trustees of the University of Florida (2013-present). Previously, Mr. Thomas served as Executive Chairman (2005-2006) and Chairman and Chief Executive Officer (2000-2005) of IMS Health, Inc. (pharmaceutical and healthcare information solutions), and a Director of Fortune Brands, Inc. (consumer products, 2000-2011).
+ The information includes the Trustee's principal occupation during the last five years and other information relating to the experience, attributes, and skills relevant to the Trustee's qualifications to serve as a Trustee, which led to the conclusion that the Trustee should serve as a Trustee for the fund.
Advisory Board Members and Officers:
Correspondence intended for a Member of the Advisory Board (if any) may be sent to Fidelity Investments, P.O. Box 55235, Boston, Massachusetts 02205-5235. Correspondence intended for an officer or Peter S. Lynch may be sent to Fidelity Investments, 245 Summer Street, Boston, Massachusetts 02210. Officers appear below in alphabetical order.
Name, Year of Birth; Principal Occupation
Vicki L. Fuller (1957)
Year of Election or Appointment: 2018
Member of the Advisory Board
Ms. Fuller also serves as Member of the Advisory Board of other Fidelity® funds. Ms. Fuller serves as a member of the Board of Directors, Audit Committee, and Nominating and Governance Committee of The Williams Companies, Inc. (natural gas infrastructure, 2018-present). Previously, Ms. Fuller served as the Chief Investment Officer of the New York State Common Retirement Fund (2012-2018) and held a variety of positions at AllianceBernstein L.P. (global asset management, 1985-2012), including Managing Director (2006-2012) and Senior Vice President and Senior Portfolio Manager (2001-2006).
Peter S. Lynch (1944)
Year of Election or Appointment: 2003
Member of the Advisory Board
Mr. Lynch also serves as Member of the Advisory Board of other Fidelity® funds. Mr. Lynch is Vice Chairman and a Director of FMR (investment adviser firm) and FMR Co., Inc. (investment adviser firm). In addition, Mr. Lynch serves as a Trustee of Boston College and as the Chairman of the Inner-City Scholarship Fund. Previously, Mr. Lynch served on the Special Olympics International Board of Directors (1997-2006).
William S. Stavropoulos (1939)
Year of Election or Appointment: 2018
Member of the Advisory Board
Mr. Stavropoulos also serves as Member of the Advisory Board of other Fidelity® funds. Mr. Stavropoulos serves as President and Founder of the Michigan Baseball Foundation, the Great Lakes Loons (2007-present). Mr. Stavropoulos is Chairman Emeritus of the Board of Directors of The Dow Chemical Company, where he previously served in numerous senior management positions, including President, CEO (1995-2000; 2002-2004), Chairman of the Executive Committee (2000-2006), and as a member of the Board of Directors (1990-2006). Currently, Mr. Stavropoulos is Chairman of the Board of Directors of Univar Inc. (global distributor of commodity and specialty chemicals), a Director of Teradata Corporation (data warehousing and technology solutions), and a member of the Advisory Board for Metalmark Capital LLC (private equity investment, 2005-present). Mr. Stavropoulos is an operating advisor to Clayton, Dubilier & Rice, LLC (private equity investment). In addition, Mr. Stavropoulos is a member of the University of Notre Dame Advisory Council for the College of Science, a Trustee of the Rollin L. Gerstacker Foundation, and a Director of Artis-Naples in Naples, Florida. Previously, Mr. Stavropoulos served as Trustee of certain Fidelity® funds (2001-2018) and as a Director of Chemical Financial Corporation (bank holding company, 1993-2012) and Tyco International, Ltd. (multinational manufacturing and services, 2007-2012).
Carol B. Tomé (1957)
Year of Election or Appointment: 2018
Member of the Advisory Board
Ms. Tomé also serves as Member of the Advisory Board of other Fidelity® funds. Ms. Tomé is Chief Financial Officer (2001-present) and Executive Vice President of Corporate Services (2007-present) of The Home Depot, Inc. (home improvement retailer) and a Director (2003-present) and Chair of the Audit Committee (2004-present) of United Parcel Service, Inc. (package delivery and supply chain management). Previously, Ms. Tomé served as Trustee of certain Fidelity® funds (2017), Senior Vice President of Finance and Accounting/Treasurer (2000-2007) and Vice President and Treasurer (1995-2000) of The Home Depot, Inc. and Chair of the Board (2010-2012), Vice Chair of the Board (2009 and 2013), and a Director (2008-2013) of the Federal Reserve Bank of Atlanta. Ms. Tomé is also a director or trustee of many community and professional organizations.
Michael E. Wiley (1950)
Year of Election or Appointment: 2018
Member of the Advisory Board [Include if document contains trusts for which the individual serves as Advisory Board Member and trusts for which he/she does not serve as Advisory Board Member:of Name(s) of Trust(s)]
Mr. Wiley also serves as Trustee or Member of the Advisory Board of other Fidelity® funds. Mr. Wiley serves as a Director of High Point Resources (exploration and production, 2005-present). Previously, Mr. Wiley served as a Director of Andeavor Corporation (independent oil refiner and marketer, 2005-2018), a Director of Andeavor Logistics LP (natural resources logistics, 2015-2018), a Director of Post Oak Bank (privately-held bank, 2004-2018), a Director of Asia Pacific Exploration Consolidated (international oil and gas exploration and production, 2008-2013), a member of the Board of Trustees of the University of Tulsa (2000-2006; 2007-2010), a Senior Energy Advisor of Katzenbach Partners, LLC (consulting, 2006-2007), an Advisory Director of Riverstone Holdings (private investment), a Director of Spinnaker Exploration Company (exploration and production, 2001-2005) and Chairman, President, and CEO of Baker Hughes, Inc. (oilfield services, 2000-2004).
Elizabeth Paige Baumann (1968)
Year of Election or Appointment: 2017
Anti-Money Laundering (AML) Officer
Ms. Baumann also serves as AML Officer of other funds. She is Chief AML Officer (2012-present) and Senior Vice President (2014-present) of FMR LLC (diversified financial services company) and is an employee of Fidelity Investments. Previously, Ms. Baumann served as AML Officer of the funds (2012-2016), and Vice President (2007-2014) and Deputy Anti-Money Laundering Officer (2007-2012) of FMR LLC.
John J. Burke III (1964)
Year of Election or Appointment: 2018
Chief Financial Officer
Mr. Burke also serves as Chief Financial Officer of other funds. Mr. Burke serves as Head of Investment Operations for Fidelity Fund and Investment Operations (2018-present) and is an employee of Fidelity Investments (1998-present). Previously Mr. Burke served as head of Asset Management Investment Operations (2012-2018).
William C. Coffey (1969)
Year of Election or Appointment: 2018
Secretary and Chief Legal Officer (CLO)
Mr. Coffey also serves as Secretary and CLO of other funds. Mr. Coffey serves as CLO, Secretary, and Senior Vice President of Fidelity Management & Research Company and FMR Co., Inc. (investment adviser firms, 2018-present); Secretary of Fidelity SelectCo, LLC and Fidelity Investments Money Management, Inc. (investment adviser firms, 2018-present); and CLO of Fidelity Management & Research (Hong Kong) Limited, FMR Investment Management (UK) Limited, and Fidelity Management & Research (Japan) Limited (investment adviser firms, 2018-present). He is Senior Vice President and Deputy General Counsel of FMR LLC (diversified financial services company, 2010-present), and is an employee of Fidelity Investments. Previously, Mr. Coffey served as Assistant Secretary of certain funds (2009-2018) and as Vice President and Associate General Counsel of FMR LLC (2005-2009).
Timothy M. Cohen (1969)
Year of Election or Appointment: 2018
Vice President
Mr. Cohen also serves as Vice President of other funds. Mr. Cohen serves as Co-Head of Global Equity Research (2016-present), a Director of Fidelity Management & Research (Japan) Limited (investment adviser firm, 2016-present), and is an employee of Fidelity Investments. Previously, Mr. Cohen served as Chief Investment Officer - Equity and a Director of Fidelity Management & Research (U.K.) Inc. (investment adviser firm, 2013-2015) and as a Director of Fidelity Management & Research (Hong Kong) Limited (investment adviser firm, 2017).
Jonathan Davis (1968)
Year of Election or Appointment: 2010
Assistant Treasurer
Mr. Davis also serves as Assistant Treasurer of other funds. Mr. Davis serves as Assistant Treasurer of FMR Capital, Inc. (2017-present) and is an employee of Fidelity Investments. Previously, Mr. Davis served as Vice President and Associate General Counsel of FMR LLC (diversified financial services company, 2003-2010).
Adrien E. Deberghes (1967)
Year of Election or Appointment: 2016
Assistant Treasurer
Mr. Deberghes also serves as an officer of other funds. He serves as Assistant Treasurer of FMR Capital, Inc. (2017-present), Executive Vice President of Fidelity Investments Money Management, Inc. (FIMM) (investment adviser firm, 2016-present), and is an employee of Fidelity Investments (2008-present). Previously, Mr. Deberghes served as President and Treasurer of certain Fidelity® funds (2013-2018). Prior to joining Fidelity Investments, Mr. Deberghes was Senior Vice President of Mutual Fund Administration at State Street Corporation (2007-2008), Senior Director of Mutual Fund Administration at Investors Bank & Trust (2005-2007), and Director of Finance for Dunkin' Brands (2000-2005). Previously, Mr. Deberghes served in other fund officer roles.
Laura M. Del Prato (1964)
Year of Election or Appointment: 2018
Assistant Treasurer
Ms. Del Prato also serves as an officer of other funds. Ms. Del Prato is an employee of Fidelity Investments (2017-present). Prior to joining Fidelity Investments, Ms. Del Prato served as a Managing Director and Treasurer of the JPMorgan Mutual Funds (2014-2017). Prior to JPMorgan, Ms. Del Prato served as a partner at Cohen Fund Audit Services (accounting firm, 2012-2013) and KPMG LLP (accounting firm, 2004-2012).
Colm A. Hogan (1973)
Year of Election or Appointment: 2016
Deputy Treasurer
Mr. Hogan also serves as an officer of other funds. Mr. Hogan serves as Assistant Treasurer of FMR Capital, Inc. (2017-present) and is an employee of Fidelity Investments (2005-present). Previously, Mr. Hogan served as Assistant Treasurer of certain Fidelity® funds (2016-2018).
Pamela R. Holding (1964)
Year of Election or Appointment: 2018
Vice President
Ms. Holding also serves as Vice President of other funds. Ms. Holding serves as Co-Head of Global Equity Research (2018-present) and is an employee of Fidelity Investments (2013-present).
Chris Maher (1972)
Year of Election or Appointment: 2013
Assistant Treasurer
Mr. Maher serves as Assistant Treasurer of other funds. Mr. Maher is Vice President of Valuation Oversight, serves as Assistant Treasurer of FMR Capital, Inc. (2017-present), and is an employee of Fidelity Investments. Previously, Mr. Maher served as Vice President of Asset Management Compliance (2013), Vice President of the Program Management Group of FMR (investment adviser firm, 2010-2013), and Vice President of Valuation Oversight (2008-2010).
Rieco E. Mello (1969)
Year of Election or Appointment: 2017
Assistant Treasurer
Mr. Mello also serves as Assistant Treasurer of other funds. Mr. Mello serves as Assistant Treasurer of FMR Capital, Inc. (2017-present) and is an employee of Fidelity Investments (1995-present).
Kenneth B. Robins (1969)
Year of Election or Appointment: 2016
Chief Compliance Officer
Mr. Robins also serves as an officer of other funds. Mr. Robins serves as Compliance Officer of Fidelity Management & Research Company and FMR Co., Inc. (investment adviser firms, 2016-present) and is an employee of Fidelity Investments (2004-present). Previously, Mr. Robins served as Executive Vice President of Fidelity Investments Money Management, Inc. (investment adviser firm, 2013-2016) and served in other fund officer roles.
Stacie M. Smith (1974)
Year of Election or Appointment: 2016
President and Treasurer
Ms. Smith also serves as an officer of other funds. Ms. Smith serves as Assistant Treasurer of FMR Capital, Inc. (2017-present), is an employee of Fidelity Investments (2009-present), and has served in other fund officer roles. Prior to joining Fidelity Investments, Ms. Smith served as Senior Audit Manager of Ernst & Young LLP (accounting firm, 1996-2009). Previously, Ms. Smith served as Assistant Treasurer (2013-2018) and Deputy Treasurer (2013-2016) of certain Fidelity® funds.
Marc L. Spector (1972)
Year of Election or Appointment: 2016
Assistant Treasurer
Mr. Spector also serves as an officer of other funds. Mr. Spector serves as Assistant Treasurer of FMR Capital, Inc. (2017-present) and is an employee of Fidelity Investments (2016-present). Prior to joining Fidelity Investments, Mr. Spector served as Director at the Siegfried Group (accounting firm, 2013-2016), and prior to Siegfried Group as audit senior manager at Deloitte & Touche (accounting firm, 2005-2013).
Shareholder Expense Example
As a shareholder of the Fund, you incur two types of costs: (1) transaction costs, including sales charges (loads) on purchase payments or redemption proceeds, redemption fees and (2) ongoing costs, including management fees, distribution and/or service (12b-1) fees and other Fund expenses. This Example is intended to help you understand your ongoing costs (in dollars) of investing in the Fund and to compare these costs with the ongoing costs of investing in other mutual funds.
The actual expense Example is based on an investment of $1,000 invested at the beginning of the period and held for the entire period (May 1, 2018 to October 31, 2018) for Class A, Class M, Class C, Global Commodity Stock and Class I and for the period (October 2, 2018 to October 31, 2018) for Class Z. The hypothetical expense Example is based on an investment of $1,000 invested for the one-half year period (May 1, 2018 to October 31, 2018).
Actual Expenses
The first line of the accompanying table for each class of the Fund provides information about actual account values and actual expenses. You may use the information in this line, together with the amount you invested, to estimate the expenses that you paid over the period. Simply divide your account value by $1,000.00 (for example, an $8,600 account value divided by $1,000.00 = 8.6), then multiply the result by the number in the first line for a class of the Fund under the heading entitled "Expenses Paid During Period" to estimate the expenses you paid on your account during this period. A small balance maintenance fee of $12.00 that is charged once a year may apply for certain accounts with a value of less than $2,000. This fee, which was eliminated effective August 1, 2018, is not included in the table below. If it was, the estimate of expenses you paid during the period would be higher, and your ending account value lower, by this amount. In addition, the Fund, as a shareholder in the underlying Fidelity Central Funds, will indirectly bear its pro-rata share of the fees and expenses incurred by the underlying Fidelity Central Funds. These fees and expenses are not included in the Fund's annualized expense ratio used to calculate the expense estimate in the table below.
Hypothetical Example for Comparison Purposes
The second line of the accompanying table for each class of the Fund provides information about hypothetical account values and hypothetical expenses based on a Class' actual expense ratio and an assumed rate of return of 5% per year before expenses, which is not the Class' actual return. The hypothetical account values and expenses may not be used to estimate the actual ending account balance or expenses you paid for the period. You may use this information to compare the ongoing costs of investing in the Fund and other funds. To do so, compare this 5% hypothetical example with the 5% hypothetical examples that appear in the shareholder reports of the other funds. A small balance maintenance fee of $12.00 that is charged once a year may apply for certain accounts with a value of less than $2,000. This fee, which was eliminated effective August 1, 2018, is not included in the table below. If it was, the estimate of expenses you paid during the period would be higher, and your ending account value lower, by this amount. In addition, the Fund, as a shareholder in the underlying Fidelity Central Funds, will indirectly bear its pro-rata share of the fees and expenses incurred by the underlying Fidelity Central Funds. These fees and expenses are not included in the Fund's annualized expense ratio used to calculate the expense estimate in the table below.
Please note that the expenses shown in the table are meant to highlight your ongoing costs only and do not reflect any transaction costs. Therefore, the second line of the table is useful in comparing ongoing costs only, and will not help you determine the relative total costs of owning different funds. In addition, if these transactional costs were included, your costs would have been higher.
| | Annualized Expense Ratio-A | Beginning
Account Value
| Ending
Account Value
October 31, 2018 | Expenses Paid
During Period
|
| Class A | 1.28% | | | |
| Actual | | $1,000.00 | $923.40 | $6.21-B |
| Hypothetical-C | | $1,000.00 | $1,018.75 | $6.51-D |
| Class M | 1.59% | | | |
| Actual | | $1,000.00 | $921.90 | $7.70-B |
| Hypothetical-C | | $1,000.00 | $1,017.19 | $8.08-D |
| Class C | 1.99% | | | |
| Actual | | $1,000.00 | $920.40 | $9.63-B |
| Hypothetical-C | | $1,000.00 | $1,015.17 | $10.11-D |
| Global Commodity Stock | 1.07% | | | |
| Actual | | $1,000.00 | $924.20 | $5.19-B |
| Hypothetical-C | | $1,000.00 | $1,019.81 | $5.45-D |
| Class I | .92% | | | |
| Actual | | $1,000.00 | $925.00 | $4.46-B |
| Hypothetical-C | | $1,000.00 | $1,020.57 | $4.69-D |
| Class Z | .89% | | | |
| Actual | | $1,000.00 | $900.30 | $.70-B |
| Hypothetical-C | | $1,000.00 | $1,020.72 | $4.53-D |
A Annualized expense ratio reflects expenses net of applicable fee waivers.
B Actual expenses are equal to each Class' annualized expense ratio, multiplied by the average account value over the period, multiplied by 184/ 365 (to reflect the one-half year period) for Class A, Class M, Class C, Global Commodity Stock and Class I, and multiplied by 30/365 (to reflect the period October 2, 2018 to October 31, 2018) for Class Z.
C 5% return per year before expenses
D Hypothetical expenses are equal to each Class' annualized expense ratio, multiplied by the average account value over the period, multiplied by 184/ 365 (to reflect the one-half year period).
Distributions (Unaudited)
The Board of Trustees of Fidelity Global Commodity Stock Fund voted to pay to shareholders of record at the opening of business on record date, the following distributions per share derived from capital gains realized from sales of portfolio securities, and dividends derived from net investment income:
| | Pay Date | Record Date | Dividends | Capital Gains |
| Fidelity Global Commodity Stock Fund | | | | |
| Class A | 12/10/18 | 12/07/18 | $0.198 | $0.018 |
| Class M | 12/10/18 | 12/07/18 | $0.158 | $0.018 |
| Class C | 12/10/18 | 12/07/18 | $0.105 | $0.018 |
| Global Commodity Stock | 12/10/18 | 12/07/18 | $0.231 | $0.018 |
| Class I | 12/10/18 | 12/07/18 | $0.252 | $0.018 |
| Class Z | 12/10/18 | 12/07/18 | $0.271 | $0.018 |
| | | | | |
Class A designates 59%, Class M designates 76%, Class C designates 100%, Global Commodity Stock designates 45%, and Class I designates 43% of the dividend distributed during the fiscal year as qualifying for the dividends–received deduction for corporate shareholders.
Class A, Class M, Class C, Global Commodity Stock, and Class I designate 100% of the dividends distributed during the fiscal year as amounts which may be taken into account as a dividend for purposes of the maximum rate under section 1(h)(11) of the Internal Revenue Code.
The amounts per share which represent income derived from sources within, and taxes paid to, foreign countries or possessions of the United States are as follows:
| | Pay Date | Income | Taxes |
| Fidelity Global Commodity Stock Fund | | | |
| Class A | 12/11/17 | $0.1107 | $0.0054 |
| Class M | 12/11/17 | $0.0859 | $0.0054 |
| Class C | 12/11/17 | $0.0419 | $0.0054 |
| Global Commodity Stock | 12/11/17 | $0.1467 | $0.0054 |
| Class I | 12/11/17 | $0.1531 | $0.0054 |
| | | | |
The fund will notify shareholders in January 2019 of amounts for use in preparing 2018 income tax returns.
Board Approval of Investment Advisory Contracts
Fidelity Global Commodity Stock Fund
At its July 2018 meeting, the Board of Trustees, including the Independent Trustees (together, the Board), voted to continue the management contract with Fidelity Management & Research Company (FMR) and the sub-advisory agreements (together, the Advisory Contracts) for the fund for six months through January 31, 2019, in connection with the reunification of the Fidelity Equity High Income Funds Board, which oversees the fund, and the Sector Portfolios Board.
The Board considered that the approval of the fund's Advisory Contracts will not result in any changes in (i) the investment process or strategies employed in the management of the fund's assets; (ii) the fees and expenses paid by shareholders; (iii) the nature, extent or quality of services provided under the fund's Advisory Contracts; or (iv) the day-to-day management of the fund or the persons primarily responsible for such management. The Board concluded that the fund's Advisory Contracts are fair and reasonable, and that the fund's Advisory Contracts should be renewed, without modification, through January 31, 2019, with the understanding that the Board will consider the annual renewal for a full one year period in January 2019.
In connection with its consideration of future renewals of the fund's Advisory Contracts, the Board will consider: (i) the nature, extent and quality of services provided to the fund, including shareholder and administrative services and investment performance; (ii) the competitiveness of the management fee and total expenses for the fund; (iii) the costs of the services and profitability, including the revenues earned and the expenses incurred in conducting the business of developing, marketing, distributing, managing, administering, and servicing the fund and its shareholders, to the extent applicable, as well as potential fall-out benefits from Fidelity's non-fund businesses; and (iv) whether there have been economies of scale in respect of the Fidelity funds, whether the Fidelity funds (including the fund) have appropriately benefited from any such economies of scale, and whether there is the potential for realization of any further economies.
Based on its evaluation of all of the conclusions noted above, and after considering all factors it believed relevant, the Board ultimately concluded that the fund's management fee structure is fair and reasonable, and that the continuation of the fund's Advisory Contracts should be approved.
AGCS-ANN-1218
1.879396.109
Fidelity® Global Commodity Stock Fund
Annual Report October 31, 2018 |
|
Contents
To view a fund's proxy voting guidelines and proxy voting record for the 12-month period ended June 30, visit http://www.fidelity.com/proxyvotingresults or visit the Securities and Exchange Commission's (SEC) web site at http://www.sec.gov.
You may also call 1-800-544-8544 to request a free copy of the proxy voting guidelines.
Standard & Poor's, S&P and S&P 500 are registered service marks of The McGraw-Hill Companies, Inc. and have been licensed for use by Fidelity Distributors Corporation.
Other third-party marks appearing herein are the property of their respective owners.
All other marks appearing herein are registered or unregistered trademarks or service marks of FMR LLC or an affiliated company. © 2018 FMR LLC. All rights reserved.
This report and the financial statements contained herein are submitted for the general information of the shareholders of the Fund. This report is not authorized for distribution to prospective investors in the Fund unless preceded or accompanied by an effective prospectus.
A fund files its complete schedule of portfolio holdings with the SEC for the first and third quarters of each fiscal year on Form N-Q. Forms N-Q are available on the SEC’s web site at http://www.sec.gov. A fund's Forms N-Q may be reviewed and copied at the SEC’s Public Reference Room in Washington, DC. Information regarding the operation of the SEC's Public Reference Room may be obtained by calling 1-800-SEC-0330.
For a complete list of a fund's portfolio holdings, view the most recent holdings listing, semiannual report, or annual report on Fidelity's web site at http://www.fidelity.com, http://www.institutional.fidelity.com, or http://www.401k.com, as applicable.
NOT FDIC INSURED •MAY LOSE VALUE •NO BANK GUARANTEE
Neither the Fund nor Fidelity Distributors Corporation is a bank.
Performance: The Bottom Line
Average annual total return reflects the change in the value of an investment, assuming reinvestment of distributions from dividend income and capital gains (the profits earned upon the sale of securities that have grown in value, if any) and assuming a constant rate of performance each year. The hypothetical investment and the average annual total returns do not reflect the deduction of taxes that a shareholder would pay on fund distributions or the redemption of fund shares. During periods of reimbursement by Fidelity, a fund’s total return will be greater than it would be had the reimbursement not occurred. How a fund did yesterday is no guarantee of how it will do tomorrow.
Average Annual Total Returns
| For the periods ended October 31, 2018 | Past 1 year | Past 5 years | Life of fundA |
| Fidelity® Global Commodity Stock Fund | 0.23% | (0.97)% | 3.62% |
A From March 25, 2009
$10,000 Over Life of Fund
Let's say hypothetically that $10,000 was invested in Fidelity® Global Commodity Stock Fund, a class of the fund, on March 25, 2009, when the fund started.
The chart shows how the value of your investment would have changed, and also shows how the MSCI ACWI (All Country World Index) Index performed over the same period.
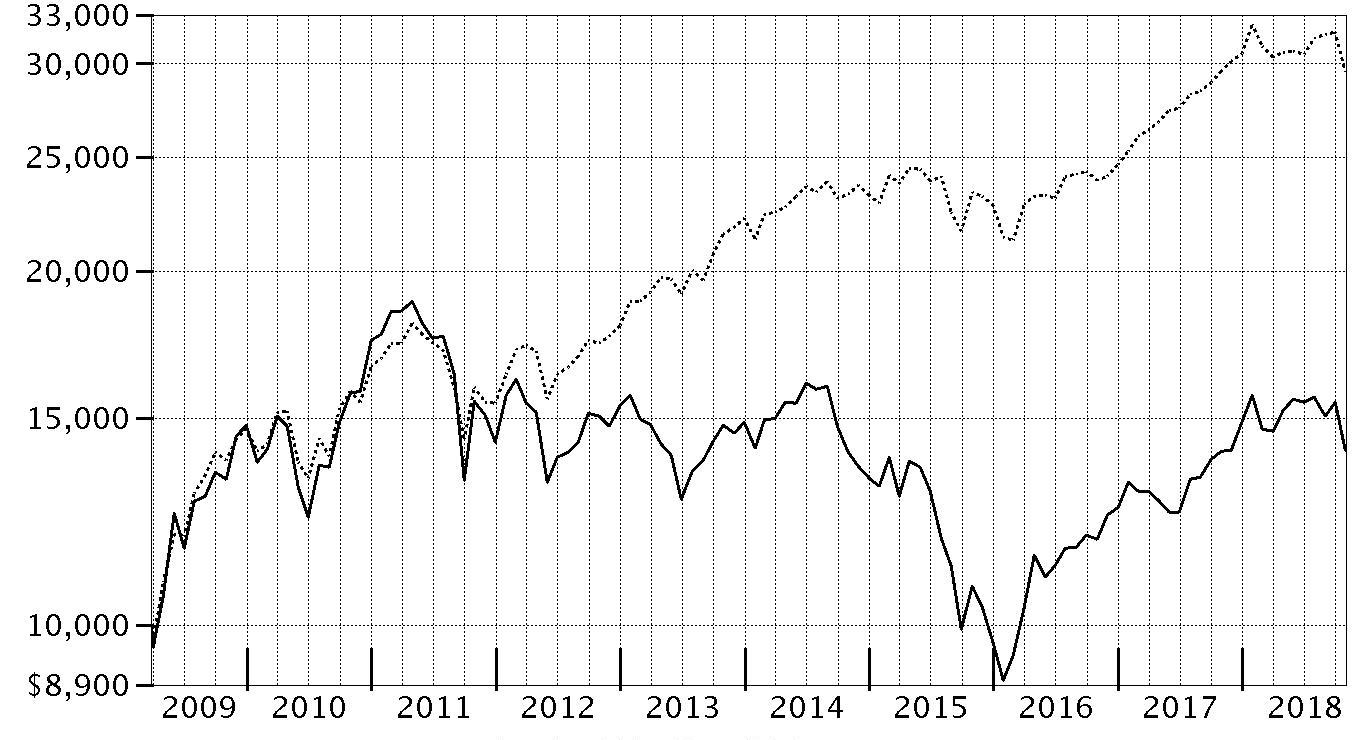
| Period Ending Values |
| $14,079 | Fidelity® Global Commodity Stock Fund |
| $29,525 | MSCI ACWI (All Country World Index) Index |
Management's Discussion of Fund Performance
Market Recap: Global equities returned -0.14% for the 12 months ending October 31, 2018, according to the MSCI ACWI (All Country World Index). A modestly positive first half of the period gave way to a confluence of negative factors – including escalating trade tensions, a surging U.S. dollar, tepid economic growth in Europe, global central bank tightening, concerns about Italy’s budget stalemate with the EU, and weakness in China’s stock market – that yielded a -4% second-half return. The index lost 7.5% in October alone, its largest monthly drop in more than six years. Among sectors, economically sensitive materials (-8%), financials (-6%) and industrials (-5%) stocks suffered from concerns about slowing growth in some key markets. Rising interest rates in the U.S. exerted pressure on real estate (-4%) and utilities (-2%). Conversely, information technology (+9%) benefited from better-than-expected earnings from some major index constituents. Stable profit growth helped health care (+8%) perform well, while elevated crude-oil prices supported energy (+5%). Regionally, emerging markets (-12%) fared the worst, hampered by the impact of foreign exchange and concerns about economic weakness in China, India and South Korea. Sluggish growth pressured shares in continental Europe (-9%). Stocks in Japan (-3%) and the U.K. (-4%) held up better, followed by Canada (-5%) and Asia-Pacific ex Japan (-6%). The U.S. (+7%) was the only region with a positive return, helped by steady economic and corporate profit growth.
Comments from Co-Manager S. Joseph Wickwire II, CFA: For the fiscal year, the fund's share classes (excluding sales charges, if applicable) posted returns that were roughly flat, lagging the 1.62% advance of the MSCI All Country World Commodity Producers Sector Capped Index, but about on par with the -0.14% return of the broader global equity market, as measured by the MSCI ACWI (All Country World Index) Index. The fund's return was largely a function of a favorable market backdrop for commodities during the first half of the period, followed by escalating concerns about trade conflicts, slowing global economic growth and uncertainty regarding the upcoming U.S. mid-term elections. Versus the commodities-focused industry index, the fund's underperformance was largely due to an overweighting in poor-performing gold stocks. Non-index stakes in the lagging diversified chemicals and commodity chemicals industries also held back the fund's relative result. Top individual detractors included non-index stakes in diversified chemicals manufacturer Chemours and gold-producer Premier Gold Mines, both of which declined in value. Conversely, the fund's positioning in the paper & forest products industry was helpful, with notable strength among paper-related stocks. A non-index stake in independent power producers & energy traders also added value. At the stock level, the timing of the fund's position in agricultural products manufacturer Monsanto worked out well, as our shares gained 5% before the company's August merger with Bayer. An out-of-benchmark stake in poly-metallic mining company Arizona Mining also contributed while held in the fund, prior to the company being acquired by South32 in August.
The views expressed above reflect those of the portfolio manager(s) only through the end of the period as stated on the cover of this report and do not necessarily represent the views of Fidelity or any other person in the Fidelity organization. Any such views are subject to change at any time based upon market or other conditions and Fidelity disclaims any responsibility to update such views. These views may not be relied on as investment advice and, because investment decisions for a Fidelity fund are based on numerous factors, may not be relied on as an indication of trading intent on behalf of any Fidelity fund.
Note to Shareholders: On September 24, 2018, Jody Simes assumed co-management responsibilities for the fund. On November 1, 2018, Jody assumed lead portfolio management responsibilities. Co-Manager Joe Wickwire plans to retire on March 31, 2019, at which point Jody will become sole portfolio manager.
Investment Summary (Unaudited)
Top Ten Stocks as of October 31, 2018
| | % of fund's net assets |
| BHP Billiton PLC | 5.7 |
| Nutrien Ltd. | 5.4 |
| Royal Dutch Shell PLC Class A (United Kingdom) | 4.0 |
| Archer Daniels Midland Co. | 3.9 |
| Chevron Corp. | 3.9 |
| Rio Tinto PLC | 3.7 |
| Exxon Mobil Corp. | 3.1 |
| BP PLC | 2.7 |
| UPM-Kymmene Corp. | 2.7 |
| Vale SA sponsored ADR | 2.6 |
| | 37.7 |
Top Sectors (% of fund's net assets)
| As of October 31, 2018 |
| | Metals | 32.4% |
| | Energy | 31.3% |
| | Agriculture | 29.8% |
| | Other | 5.5% |
| | Short-Term Investments and Net Other Assets | 1.0% |

Schedule of Investments October 31, 2018
Showing Percentage of Net Assets
| Common Stocks - 97.6% | | | |
| | | Shares | Value |
| Building Products - 0.3% | | | |
| Building Products - 0.3% | | | |
| Compagnie de St. Gobain | | 41,900 | $1,578,433 |
| Chemicals - 17.0% | | | |
| Commodity Chemicals - 1.5% | | | |
| LG Chemical Ltd. | | 10,580 | 3,217,581 |
| LyondellBasell Industries NV Class A | | 17,300 | 1,544,371 |
| Olin Corp. | | 59,000 | 1,191,800 |
| Tronox Ltd. Class A | | 17,665 | 202,264 |
| Westlake Chemical Corp. | | 24,100 | 1,718,330 |
| | | | 7,874,346 |
| Diversified Chemicals - 1.5% | | | |
| DowDuPont, Inc. | | 81,358 | 4,386,823 |
| The Chemours Co. LLC | | 116,100 | 3,832,461 |
| | | | 8,219,284 |
| Fertilizers & Agricultural Chemicals - 13.8% | | | |
| CF Industries Holdings, Inc. | | 252,360 | 12,120,851 |
| FMC Corp. | | 142,000 | 11,087,360 |
| K&S AG (a) | | 190,600 | 3,555,594 |
| Nutrien Ltd. | | 556,683 | 29,469,587 |
| The Mosaic Co. | | 358,661 | 11,096,971 |
| UPL Ltd. (b) | | 232,489 | 2,119,780 |
| Yara International ASA | | 147,900 | 6,363,535 |
| | | | 75,813,678 |
| Specialty Chemicals - 0.2% | | | |
| Platform Specialty Products Corp. (b) | | 109,600 | 1,185,872 |
|
| TOTAL CHEMICALS | | | 93,093,180 |
|
| Commercial Services & Supplies - 0.1% | | | |
| Environmental & Facility Services - 0.1% | | | |
| Clean TeQ Holdings Ltd. (a)(b) | | 1,129,700 | 335,999 |
| Construction Materials - 0.4% | | | |
| Construction Materials - 0.4% | | | |
| Buzzi Unicem SpA | | 24,700 | 474,900 |
| Dalmia Bharat Ltd. (b) | | 16,000 | 454,451 |
| Martin Marietta Materials, Inc. | | 6,500 | 1,113,320 |
| | | | 2,042,671 |
| Containers & Packaging - 0.3% | | | |
| Metal & Glass Containers - 0.3% | | | |
| Crown Holdings, Inc. (b) | | 36,600 | 1,547,814 |
| Electric Utilities - 0.3% | | | |
| Electric Utilities - 0.3% | | | |
| Vistra Energy Corp. (b) | | 71,700 | 1,622,571 |
| Food Products - 8.4% | | | |
| Agricultural Products - 8.2% | | | |
| Archer Daniels Midland Co. | | 452,600 | 21,385,350 |
| Bunge Ltd. | | 171,000 | 10,567,800 |
| Darling International, Inc. (b) | | 239,500 | 4,948,070 |
| First Resources Ltd. | | 1,713,100 | 1,954,083 |
| Ingredion, Inc. | | 52,800 | 5,342,304 |
| Wilmar International Ltd. | | 264,100 | 602,502 |
| | | | 44,800,109 |
| Packaged Foods & Meats - 0.2% | | | |
| Adecoagro SA (b) | | 149,500 | 1,196,000 |
|
| TOTAL FOOD PRODUCTS | | | 45,996,109 |
|
| Gas Utilities - 0.0% | | | |
| Gas Utilities - 0.0% | | | |
| Indraprastha Gas Ltd. | | 69,000 | 249,374 |
| Independent Power and Renewable Electricity Producers - 0.3% | | | |
| Independent Power Producers & Energy Traders - 0.3% | | | |
| NRG Energy, Inc. | | 39,800 | 1,440,362 |
| Machinery - 0.2% | | | |
| Agricultural & Farm Machinery - 0.2% | | | |
| Deere & Co. | | 7,800 | 1,056,432 |
| Industrial Machinery - 0.0% | | | |
| The Weir Group PLC | | 12,300 | 249,349 |
|
| TOTAL MACHINERY | | | 1,305,781 |
|
| Metals & Mining - 32.0% | | | |
| Aluminum - 0.3% | | | |
| Hindalco Industries Ltd. | | 160,000 | 476,798 |
| Norsk Hydro ASA | | 221,500 | 1,149,830 |
| | | | 1,626,628 |
| Copper - 1.7% | | | |
| Antofagasta PLC | | 161,200 | 1,617,048 |
| First Quantum Minerals Ltd. | | 356,624 | 3,559,603 |
| Freeport-McMoRan, Inc. | | 369,300 | 4,302,345 |
| | | | 9,478,996 |
| Diversified Metals & Mining - 15.5% | | | |
| Alcoa Corp. (b) | | 35,700 | 1,249,143 |
| Anglo American PLC (United Kingdom) | | 186,151 | 3,985,941 |
| BHP Billiton PLC | | 1,550,193 | 30,924,320 |
| Boliden AB | | 34,300 | 783,928 |
| Glencore Xstrata PLC | | 3,403,273 | 13,870,178 |
| Grupo Mexico SA de CV Series B | | 742,620 | 1,713,492 |
| Ivanhoe Mines Ltd. (b) | | 767,900 | 1,446,612 |
| Korea Zinc Co. Ltd. | | 4,260 | 1,415,022 |
| MMC Norilsk Nickel PJSC sponsored ADR | | 55,400 | 918,532 |
| Rio Tinto PLC | | 417,487 | 20,269,317 |
| South32 Ltd. | | 1,141,097 | 2,925,206 |
| Sumitomo Metal Mining Co. Ltd. | | 36,700 | 1,155,538 |
| Teck Resources Ltd. Class B (sub. vtg.) | | 220,600 | 4,559,631 |
| | | | 85,216,860 |
| Gold - 5.5% | | | |
| Agnico Eagle Mines Ltd. (Canada) | | 67,700 | 2,391,318 |
| AngloGold Ashanti Ltd. sponsored ADR | | 104,200 | 980,522 |
| B2Gold Corp. (b) | | 487,268 | 1,202,948 |
| Barrick Gold Corp. | | 313,400 | 3,925,683 |
| Continental Gold, Inc. (b) | | 499,230 | 864,632 |
| Endeavour Mining Corp. (b) | | 14,200 | 217,781 |
| Franco-Nevada Corp. | | 54,171 | 3,383,296 |
| Gold Standard Ventures Corp. (b) | | 758,844 | 1,124,043 |
| Goldcorp, Inc. | | 178,175 | 1,609,253 |
| Guyana Goldfields, Inc. (b) | | 57,588 | 77,429 |
| Kinross Gold Corp. (b) | | 254,801 | 661,946 |
| Newcrest Mining Ltd. | | 55,215 | 805,861 |
| Newmont Mining Corp. | | 239,300 | 7,399,156 |
| Premier Gold Mines Ltd. (b) | | 997,986 | 1,303,913 |
| Randgold Resources Ltd. sponsored ADR | | 32,400 | 2,544,696 |
| SEMAFO, Inc. (b) | | 264,951 | 579,634 |
| Torex Gold Resources, Inc. (b) | | 102,445 | 933,051 |
| | | | 30,005,162 |
| Precious Metals & Minerals - 0.6% | | | |
| Alrosa Co. Ltd. | | 597,900 | 906,738 |
| Fresnillo PLC | | 61,600 | 668,163 |
| Industrias Penoles SA de CV | | 59,965 | 845,162 |
| Osisko Mining, Inc. (b) | | 390,470 | 791,944 |
| | | | 3,212,007 |
| Silver - 0.3% | | | |
| MAG Silver Corp. (b) | | 48,400 | 347,802 |
| Wheaton Precious Metals Corp. | | 82,000 | 1,347,928 |
| | | | 1,695,730 |
| Steel - 8.1% | | | |
| ArcelorMittal SA Class A unit (a) | | 222,402 | 5,535,586 |
| Fortescue Metals Group Ltd. | | 195,863 | 554,802 |
| Hyundai Steel Co. | | 27,439 | 1,004,012 |
| JFE Holdings, Inc. | | 188,000 | 3,532,816 |
| Nippon Steel & Sumitomo Metal Corp. | | 141,700 | 2,613,822 |
| Nucor Corp. | | 89,092 | 5,267,119 |
| POSCO | | 23,004 | 5,258,762 |
| Steel Dynamics, Inc. | | 63,200 | 2,502,720 |
| Tata Steel Ltd. | | 80,000 | 599,081 |
| Thyssenkrupp AG | | 93,500 | 1,967,144 |
| Vale SA sponsored ADR | | 956,841 | 14,448,299 |
| Voestalpine AG | | 30,700 | 1,091,504 |
| | | | 44,375,667 |
|
| TOTAL METALS & MINING | | | 175,611,050 |
|
| Oil, Gas & Consumable Fuels - 30.3% | | | |
| Coal & Consumable Fuels - 0.2% | | | |
| China Shenhua Energy Co. Ltd. (H Shares) | | 421,000 | 953,457 |
| Integrated Oil & Gas - 20.8% | | | |
| BP PLC | | 2,041,100 | 14,744,336 |
| Cenovus Energy, Inc. (Canada) | | 259,100 | 2,192,544 |
| Chevron Corp. | | 189,200 | 21,124,180 |
| China Petroleum & Chemical Corp. (H Shares) | | 2,169,000 | 1,766,816 |
| Equinor ASA | | 74,100 | 1,927,701 |
| Exxon Mobil Corp. | | 214,300 | 17,075,424 |
| Lukoil PJSC sponsored ADR | | 45,200 | 3,376,440 |
| Occidental Petroleum Corp. | | 82,600 | 5,539,982 |
| Royal Dutch Shell PLC: | | | |
| Class A (United Kingdom) | | 689,400 | 21,962,984 |
| Class B (United Kingdom) | | 56,830 | 1,853,393 |
| Suncor Energy, Inc. | | 279,432 | 9,373,480 |
| Total SA | | 219,700 | 12,890,991 |
| | | | 113,828,271 |
| Oil & Gas Exploration & Production - 8.8% | | | |
| Anadarko Petroleum Corp. | | 96,200 | 5,117,840 |
| Berry Petroleum Corp. | | 22,800 | 319,200 |
| Cabot Oil & Gas Corp. | | 51,900 | 1,257,537 |
| Canadian Natural Resources Ltd. | | 134,600 | 3,693,078 |
| Centennial Resource Development, Inc. Class A (b) | | 11,300 | 216,508 |
| Cimarex Energy Co. | | 8,100 | 643,707 |
| CNOOC Ltd. sponsored ADR (a) | | 13,900 | 2,352,575 |
| Concho Resources, Inc. (b) | | 14,000 | 1,947,260 |
| ConocoPhillips Co. | | 122,000 | 8,527,800 |
| Devon Energy Corp. | | 76,000 | 2,462,400 |
| Diamondback Energy, Inc. | | 22,800 | 2,561,808 |
| Encana Corp. | | 118,200 | 1,206,736 |
| EOG Resources, Inc. | | 61,500 | 6,478,410 |
| EQT Corp. | | 25,601 | 869,666 |
| Newfield Exploration Co. (b) | | 21,300 | 430,260 |
| Noble Energy, Inc. | | 92,200 | 2,291,170 |
| NOVATEK OAO GDR (Reg. S) | | 6,600 | 1,118,700 |
| NuVista Energy Ltd. (b) | | 208,600 | 839,819 |
| Oasis Petroleum, Inc. (b) | | 44,800 | 450,688 |
| PDC Energy, Inc. (b) | | 18,600 | 789,570 |
| Pioneer Natural Resources Co. | | 22,910 | 3,373,956 |
| PrairieSky Royalty Ltd. | | 18,098 | 274,952 |
| Whiting Petroleum Corp. (b) | | 19,218 | 716,831 |
| Woodside Petroleum Ltd. | | 10,000 | 246,790 |
| | | | 48,187,261 |
| Oil & Gas Refining & Marketing - 0.3% | | | |
| Delek U.S. Holdings, Inc. | | 21,800 | 800,496 |
| Reliance Industries Ltd. | | 59,241 | 850,047 |
| | | | 1,650,543 |
| Oil & Gas Storage & Transport - 0.2% | | | |
| Petronet LNG Ltd. | | 427,632 | 1,304,983 |
|
| TOTAL OIL, GAS & CONSUMABLE FUELS | | | 165,924,515 |
|
| Paper & Forest Products - 7.8% | | | |
| Forest Products - 0.3% | | | |
| Quintis Ltd. (b)(c) | | 413,280 | 3 |
| Svenska Cellulosa AB (SCA) (B Shares) | | 26,200 | 247,996 |
| West Fraser Timber Co. Ltd. | | 24,800 | 1,245,981 |
| | | | 1,493,980 |
| Paper Products - 7.5% | | | |
| Fibria Celulose SA | | 130,600 | 2,521,459 |
| Lee & Man Paper Manufacturing Ltd. | | 350,000 | 299,479 |
| Mondi PLC | | 284,600 | 6,709,843 |
| Nine Dragons Paper (Holdings) Ltd. | | 1,625,000 | 1,549,997 |
| Oji Holdings Corp. | | 406,000 | 2,883,057 |
| Sappi Ltd. | | 100,606 | 565,617 |
| Stora Enso Oyj (R Shares) | | 618,100 | 9,314,710 |
| Suzano Papel e Celulose SA | | 264,700 | 2,692,166 |
| UPM-Kymmene Corp. | | 453,700 | 14,599,425 |
| | | | 41,135,753 |
|
| TOTAL PAPER & FOREST PRODUCTS | | | 42,629,733 |
|
| Trading Companies & Distributors - 0.2% | | | |
| Trading Companies & Distributors - 0.2% | | | |
| Brenntag AG | | 23,300 | 1,218,461 |
| TOTAL COMMON STOCKS | | | |
| (Cost $625,634,610) | | | 534,596,053 |
|
| Nonconvertible Preferred Stocks - 1.4% | | | |
| Metals & Mining - 0.4% | | | |
| Steel - 0.4% | | | |
| Gerdau SA | | 52,000 | 227,199 |
| Gerdau SA sponsored ADR (a) | | 421,300 | 1,832,655 |
| | | | 2,059,854 |
| Oil, Gas & Consumable Fuels - 1.0% | | | |
| Integrated Oil & Gas - 1.0% | | | |
| Petroleo Brasileiro SA - Petrobras (PN) sponsored ADR (non-vtg.) | | 381,400 | 5,652,348 |
| TOTAL NONCONVERTIBLE PREFERRED STOCKS | | | |
| (Cost $5,829,730) | | | 7,712,202 |
|
| Money Market Funds - 2.2% | | | |
| Fidelity Cash Central Fund, 2.23% (d) | | 1,775,955 | 1,776,310 |
| Fidelity Securities Lending Cash Central Fund 2.23% (d)(e) | | 10,639,731 | 10,640,795 |
| TOTAL MONEY MARKET FUNDS | | | |
| (Cost $12,417,381) | | | 12,417,105 |
| TOTAL INVESTMENT IN SECURITIES - 101.2% | | | |
| (Cost $643,881,721) | | | 554,725,360 |
| NET OTHER ASSETS (LIABILITIES) - (1.2)% | | | (6,811,684) |
| NET ASSETS - 100% | | | $547,913,676 |
Legend
(a) Security or a portion of the security is on loan at period end.
(b) Non-income producing
(c) Level 3 security
(d) Affiliated fund that is generally available only to investment companies and other accounts managed by Fidelity Investments. The rate quoted is the annualized seven-day yield of the fund at period end. A complete unaudited listing of the fund's holdings as of its most recent quarter end is available upon request. In addition, each Fidelity Central Fund's financial statements, which are not covered by the Fund's Report of Independent Registered Public Accounting Firm, are available on the SEC's website or upon request.
(e) Investment made with cash collateral received from securities on loan.
Affiliated Central Funds
Information regarding fiscal year to date income earned by the Fund from investments in Fidelity Central Funds is as follows:
| Fund | Income earned |
| Fidelity Cash Central Fund | $79,432 |
| Fidelity Securities Lending Cash Central Fund | 261,584 |
| Total | $341,016 |
Amounts in the income column in the above table include any capital gain distributions from underlying funds, which are presented in the corresponding line-item in the Statement of Operations if applicable.
Investment Valuation
The following is a summary of the inputs used, as of October 31, 2018, involving the Fund's assets and liabilities carried at fair value. The inputs or methodology used for valuing securities may not be an indication of the risk associated with investing in those securities. For more information on valuation inputs, and their aggregation into the levels used below, please refer to the Investment Valuation section in the accompanying Notes to Financial Statements.
| | Valuation Inputs at Reporting Date: |
| Description | Total | Level 1 | Level 2 | Level 3 |
| Investments in Securities: | | | | |
| Common Stocks | $534,596,053 | $413,161,465 | $121,434,585 | $3 |
| Nonconvertible Preferred Stocks | 7,712,202 | 7,712,202 | -- | -- |
| Money Market Funds | 12,417,105 | 12,417,105 | -- | -- |
| Total Investments in Securities: | $554,725,360 | $433,290,772 | $121,434,585 | $3 |
Other Information
Distribution of investments by country or territory of incorporation, as a percentage of Total Net Assets, is as follows (Unaudited):
| United States of America | 35.4% |
| United Kingdom | 18.7% |
| Canada | 14.2% |
| Brazil | 5.0% |
| Finland | 4.4% |
| Bailiwick of Jersey | 3.0% |
| France | 2.7% |
| Bermuda | 2.2% |
| Korea (South) | 2.1% |
| Japan | 1.8% |
| Norway | 1.8% |
| Germany | 1.2% |
| Luxembourg | 1.2% |
| Russia | 1.2% |
| India | 1.1% |
| Australia | 1.0% |
| Others (Individually Less Than 1%) | 3.0% |
| | 100.0% |
See accompanying notes which are an integral part of the financial statements.
Financial Statements
Statement of Assets and Liabilities
| | | October 31, 2018 |
| Assets | | |
Investment in securities, at value (including securities loaned of $10,326,508) — See accompanying schedule:
Unaffiliated issuers (cost $631,464,340) | $542,308,255 | |
| Fidelity Central Funds (cost $12,417,381) | 12,417,105 | |
| Total Investment in Securities (cost $643,881,721) | | $554,725,360 |
| Receivable for investments sold | | 2,923,535 |
| Receivable for fund shares sold | | 8,000,873 |
| Dividends receivable | | 570,218 |
| Distributions receivable from Fidelity Central Funds | | 15,035 |
| Prepaid expenses | | 1,204 |
| Other receivables | | 45,372 |
| Total assets | | 566,281,597 |
| Liabilities | | |
| Payable for investments purchased | $6,863,829 | |
| Payable for fund shares redeemed | 288,591 | |
| Accrued management fee | 327,732 | |
| Distribution and service plan fees payable | 28,186 | |
| Other affiliated payables | 152,168 | |
| Other payables and accrued expenses | 66,930 | |
| Collateral on securities loaned | 10,640,485 | |
| Total liabilities | | 18,367,921 |
| Net Assets | | $547,913,676 |
| Net Assets consist of: | | |
| Paid in capital | | $662,078,391 |
| Total distributable earnings (loss) | | (114,164,715) |
| Net Assets | | $547,913,676 |
| Net Asset Value and Maximum Offering Price | | |
| Class A: | | |
| Net Asset Value and redemption price per share ($27,258,118 ÷ 2,194,637 shares) | | $12.42 |
| Maximum offering price per share (100/94.25 of $12.42) | | $13.18 |
| Class M: | | |
| Net Asset Value and redemption price per share ($7,200,231 ÷ 581,223 shares) | | $12.39 |
| Maximum offering price per share (100/96.50 of $12.39) | | $12.84 |
| Class C: | | |
| Net Asset Value and offering price per share ($20,793,202 ÷ 1,696,531 shares)(a) | | $12.26 |
| Global Commodity Stock: | | |
| Net Asset Value, offering price and redemption price per share ($369,562,952 ÷ 29,713,079 shares) | | $12.44 |
| Class I: | | |
| Net Asset Value, offering price and redemption price per share ($117,980,993 ÷ 9,476,059 shares) | | $12.45 |
| Class Z: | | |
| Net Asset Value, offering price and redemption price per share ($5,118,180 ÷ 410,839 shares) | | $12.46 |
(a) Redemption price per share is equal to net asset value less any applicable contingent deferred sales charge.
See accompanying notes which are an integral part of the financial statements.
Statement of Operations
| | | Year ended October 31, 2018 |
| Investment Income | | |
| Dividends | | $17,421,929 |
| Income from Fidelity Central Funds | | 341,016 |
| Income before foreign taxes withheld | | 17,762,945 |
| Less foreign taxes withheld | | (997,166) |
| Total income | | 16,765,779 |
| Expenses | | |
| Management fee | $4,109,654 | |
| Transfer agent fees | 1,570,545 | |
| Distribution and service plan fees | 340,640 | |
| Accounting and security lending fees | 301,304 | |
| Custodian fees and expenses | 70,739 | |
| Independent trustees' fees and expenses | 2,902 | |
| Registration fees | 90,758 | |
| Audit | 58,396 | |
| Legal | 2,576 | |
| Interest | 1,921 | |
| Miscellaneous | 3,275 | |
| Total expenses before reductions | 6,552,710 | |
| Expense reductions | (105,626) | |
| Total expenses after reductions | | 6,447,084 |
| Net investment income (loss) | | 10,318,695 |
| Realized and Unrealized Gain (Loss) | | |
| Net realized gain (loss) on: | | |
| Investment securities: | | |
| Unaffiliated issuers | 33,086,644 | |
| Fidelity Central Funds | 1,613 | |
| Foreign currency transactions | (2,373) | |
| Total net realized gain (loss) | | 33,085,884 |
| Change in net unrealized appreciation (depreciation) on: | | |
| Investment securities: | | |
| Unaffiliated issuers | (46,899,059) | |
| Fidelity Central Funds | 168 | |
| Assets and liabilities in foreign currencies | 9,238 | |
| Total change in net unrealized appreciation (depreciation) | | (46,889,653) |
| Net gain (loss) | | (13,803,769) |
| Net increase (decrease) in net assets resulting from operations | | $(3,485,074) |
See accompanying notes which are an integral part of the financial statements.
Statement of Changes in Net Assets
| | Year ended October 31, 2018 | Year ended October 31, 2017 |
| Increase (Decrease) in Net Assets | | |
| Operations | | |
| Net investment income (loss) | $10,318,695 | $5,241,419 |
| Net realized gain (loss) | 33,085,884 | 30,354,449 |
| Change in net unrealized appreciation (depreciation) | (46,889,653) | 31,191,808 |
| Net increase (decrease) in net assets resulting from operations | (3,485,074) | 66,787,676 |
| Distributions to shareholders | (7,402,151) | – |
| Distributions to shareholders from net investment income | – | (3,511,036) |
| Distributions to shareholders from net realized gain | – | (2,362,260) |
| Total distributions | (7,402,151) | (5,873,296) |
| Share transactions - net increase (decrease) | 129,504,630 | 15,840,057 |
| Redemption fees | 181 | 12,604 |
| Total increase (decrease) in net assets | 118,617,586 | 76,767,041 |
| Net Assets | | |
| Beginning of period | 429,296,090 | 352,529,049 |
| End of period | $547,913,676 | $429,296,090 |
| Other Information | | |
| Undistributed net investment income end of period | | $4,378,040 |
See accompanying notes which are an integral part of the financial statements.
Financial Highlights
Fidelity Global Commodity Stock Fund Class A
| Years ended October 31, | 2018 | 2017 | 2016 | 2015 | 2014 |
| Selected Per–Share Data | | | | | |
| Net asset value, beginning of period | $12.56 | $10.73 | $10.05 | $13.25 | $14.17 |
| Income from Investment Operations | | | | | |
| Net investment income (loss)A | .21 | .12 | .11 | .22 | .15 |
| Net realized and unrealized gain (loss) | (.22) | 1.86 | .79 | (3.25) | (.91) |
| Total from investment operations | (.01) | 1.98 | .90 | (3.03) | (.76) |
| Distributions from net investment income | (.09) | (.08) | (.21) | (.14) | (.15) |
| Distributions from net realized gain | (.05) | (.07) | (.01) | (.03) | (.01) |
| Total distributions | (.13)B | (.15) | (.22) | (.17) | (.16) |
| Redemption fees added to paid in capitalA,C | – | – | – | – | – |
| Net asset value, end of period | $12.42 | $12.56 | $10.73 | $10.05 | $13.25 |
| Total ReturnD,E | (.05)% | 18.53% | 9.29% | (23.16)% | (5.41)% |
| Ratios to Average Net AssetsF,G | | | | | |
| Expenses before reductions | 1.28% | 1.33% | 1.38% | 1.34% | 1.35% |
| Expenses net of fee waivers, if any | 1.28% | 1.33% | 1.38% | 1.34% | 1.35% |
| Expenses net of all reductions | 1.27% | 1.32% | 1.37% | 1.34% | 1.35% |
| Net investment income (loss) | 1.55% | 1.07% | 1.18% | 1.85% | 1.05% |
| Supplemental Data | | | | | |
| Net assets, end of period (000 omitted) | $27,258 | $29,920 | $34,791 | $31,391 | $51,586 |
| Portfolio turnover rateH | 70% | 81% | 85% | 77% | 75% |
A Calculated based on average shares outstanding during the period.
B Total distributions of $.13 per share is comprised of distributions from net investment income of $.086 and distributions from net realized gain of $.047 per share.
C Amount represents less than $.005 per share.
D Total returns would have been lower if certain expenses had not been reduced during the applicable periods shown.
E Total returns do not include the effect of the sales charges.
F Fees and expenses of any underlying Fidelity Central Funds are not included in the Fund's expense ratio. The Fund indirectly bears its proportionate share of the expenses of any underlying Fidelity Central Funds.
G Expense ratios reflect operating expenses of the class. Expenses before reductions do not reflect amounts reimbursed by the investment adviser or reductions from brokerage service arrangements or reductions from other expense offset arrangements and do not represent the amount paid by the class during periods when reimbursements or reductions occur. Expenses net of fee waivers reflect expenses after reimbursement by the investment adviser but prior to reductions from brokerage service arrangements or other expense offset arrangements. Expenses net of all reductions represent the net expenses paid by the class.
H Amount does not include the portfolio activity of any underlying Fidelity Central Funds.
See accompanying notes which are an integral part of the financial statements.
Fidelity Global Commodity Stock Fund Class M
| Years ended October 31, | 2018 | 2017 | 2016 | 2015 | 2014 |
| Selected Per–Share Data | | | | | |
| Net asset value, beginning of period | $12.53 | $10.72 | $10.02 | $13.21 | $14.13 |
| Income from Investment Operations | | | | | |
| Net investment income (loss)A | .16 | .09 | .09 | .19 | .11 |
| Net realized and unrealized gain (loss) | (.20) | 1.84 | .79 | (3.25) | (.90) |
| Total from investment operations | (.04) | 1.93 | .88 | (3.06) | (.79) |
| Distributions from net investment income | (.06) | (.05) | (.17) | (.10) | (.11) |
| Distributions from net realized gain | (.05) | (.07) | (.01) | (.03) | (.01) |
| Total distributions | (.10)B | (.12) | (.18) | (.13) | (.13)C |
| Redemption fees added to paid in capitalA,D | – | – | – | – | – |
| Net asset value, end of period | $12.39 | $12.53 | $10.72 | $10.02 | $13.21 |
| Total ReturnE,F | (.30)% | 18.09% | 9.08% | (23.40)% | (5.65)% |
| Ratios to Average Net AssetsG,H | | | | | |
| Expenses before reductions | 1.59% | 1.62% | 1.65% | 1.63% | 1.62% |
| Expenses net of fee waivers, if any | 1.59% | 1.62% | 1.65% | 1.63% | 1.62% |
| Expenses net of all reductions | 1.58% | 1.61% | 1.64% | 1.62% | 1.62% |
| Net investment income (loss) | 1.24% | .78% | .90% | 1.57% | .78% |
| Supplemental Data | | | | | |
| Net assets, end of period (000 omitted) | $7,200 | $6,876 | $6,068 | $6,335 | $9,867 |
| Portfolio turnover rateI | 70% | 81% | 85% | 77% | 75% |
A Calculated based on average shares outstanding during the period.
B Total distributions of $.10 per share is comprised of distributions from net investment income of $.055 and distributions from net realized gain of $.047 per share.
C Total distributions of $.13 per share is comprised of distributions from net investment income of $.113 and distributions from net realized gain of $.013 per share.
D Amount represents less than $.005 per share.
E Total returns would have been lower if certain expenses had not been reduced during the applicable periods shown.
F Total returns do not include the effect of the sales charges.
G Fees and expenses of any underlying Fidelity Central Funds are not included in the Fund's expense ratio. The Fund indirectly bears its proportionate share of the expenses of any underlying Fidelity Central Funds.
H Expense ratios reflect operating expenses of the class. Expenses before reductions do not reflect amounts reimbursed by the investment adviser or reductions from brokerage service arrangements or reductions from other expense offset arrangements and do not represent the amount paid by the class during periods when reimbursements or reductions occur. Expenses net of fee waivers reflect expenses after reimbursement by the investment adviser but prior to reductions from brokerage service arrangements or other expense offset arrangements. Expenses net of all reductions represent the net expenses paid by the class.
I Amount does not include the portfolio activity of any underlying Fidelity Central Funds.
See accompanying notes which are an integral part of the financial statements.
Fidelity Global Commodity Stock Fund Class C
| Years ended October 31, | 2018 | 2017 | 2016 | 2015 | 2014 |
| Selected Per–Share Data | | | | | |
| Net asset value, beginning of period | $12.39 | $10.61 | $9.92 | $13.06 | $13.96 |
| Income from Investment Operations | | | | | |
| Net investment income (loss)A | .11 | .04 | .04 | .13 | .04 |
| Net realized and unrealized gain (loss) | (.19) | 1.82 | .78 | (3.22) | (.89) |
| Total from investment operations | (.08) | 1.86 | .82 | (3.09) | (.85) |
| Distributions from net investment income | – | (.01) | (.12) | (.03) | (.03) |
| Distributions from net realized gain | (.05) | (.07) | (.01) | (.03) | (.01) |
| Total distributions | (.05) | (.08) | (.13) | (.05)B | (.05)C |
| Redemption fees added to paid in capitalA,D | – | – | – | – | – |
| Net asset value, end of period | $12.26 | $12.39 | $10.61 | $9.92 | $13.06 |
| Total ReturnE,F | (.67)% | 17.59% | 8.46% | (23.74)% | (6.13)% |
| Ratios to Average Net AssetsG,H | | | | | |
| Expenses before reductions | 2.00% | 2.07% | 2.13% | 2.12% | 2.11% |
| Expenses net of fee waivers, if any | 1.99% | 2.07% | 2.13% | 2.12% | 2.11% |
| Expenses net of all reductions | 1.98% | 2.06% | 2.12% | 2.11% | 2.11% |
| Net investment income (loss) | .84% | .33% | .43% | 1.08% | .29% |
| Supplemental Data | | | | | |
| Net assets, end of period (000 omitted) | $20,793 | $14,289 | $12,620 | $11,274 | $17,659 |
| Portfolio turnover rateI | 70% | 81% | 85% | 77% | 75% |
A Calculated based on average shares outstanding during the period.
B Total distributions of $.05 per share is comprised of distributions from net investment income of $.025 and distributions from net realized gain of $.026 per share.
C Total distributions of $.05 per share is comprised of distributions from net investment income of $.033 and distributions from net realized gain of $.013 per share.
D Amount represents less than $.005 per share.
E Total returns would have been lower if certain expenses had not been reduced during the applicable periods shown.
F Total returns do not include the effect of the contingent deferred sales charge.
G Fees and expenses of any underlying Fidelity Central Funds are not included in the Fund's expense ratio. The Fund indirectly bears its proportionate share of the expenses of any underlying Fidelity Central Funds.
H Expense ratios reflect operating expenses of the class. Expenses before reductions do not reflect amounts reimbursed by the investment adviser or reductions from brokerage service arrangements or reductions from other expense offset arrangements and do not represent the amount paid by the class during periods when reimbursements or reductions occur. Expenses net of fee waivers reflect expenses after reimbursement by the investment adviser but prior to reductions from brokerage service arrangements or other expense offset arrangements. Expenses net of all reductions represent the net expenses paid by the class.
I Amount does not include the portfolio activity of any underlying Fidelity Central Funds.
See accompanying notes which are an integral part of the financial statements.
Fidelity Global Commodity Stock Fund
| Years ended October 31, | 2018 | 2017 | 2016 | 2015 | 2014 |
| Selected Per–Share Data | | | | | |
| Net asset value, beginning of period | $12.59 | $10.77 | $10.09 | $13.31 | $14.24 |
| Income from Investment Operations | | | | | |
| Net investment income (loss)A | .23 | .15 | .14 | .25 | .19 |
| Net realized and unrealized gain (loss) | (.20) | 1.84 | .79 | (3.27) | (.92) |
| Total from investment operations | .03 | 1.99 | .93 | (3.02) | (.73) |
| Distributions from net investment income | (.13) | (.11) | (.24) | (.18) | (.19) |
| Distributions from net realized gain | (.05) | (.07) | (.01) | (.03) | (.01) |
| Total distributions | (.18) | (.17)B | (.25) | (.20)C | (.20) |
| Redemption fees added to paid in capitalA,D | – | – | – | – | – |
| Net asset value, end of period | $12.44 | $12.59 | $10.77 | $10.09 | $13.31 |
| Total ReturnE | .23% | 18.65% | 9.62% | (22.97)% | (5.16)% |
| Ratios to Average Net AssetsF,G | | | | | |
| Expenses before reductions | 1.08% | 1.10% | 1.13% | 1.12% | 1.11% |
| Expenses net of fee waivers, if any | 1.08% | 1.10% | 1.13% | 1.12% | 1.11% |
| Expenses net of all reductions | 1.06% | 1.09% | 1.12% | 1.11% | 1.11% |
| Net investment income (loss) | 1.75% | 1.30% | 1.43% | 2.08% | 1.29% |
| Supplemental Data | | | | | |
| Net assets, end of period (000 omitted) | $369,563 | $264,557 | $228,982 | $156,320 | $223,084 |
| Portfolio turnover rateH | 70% | 81% | 85% | 77% | 75% |
A Calculated based on average shares outstanding during the period.
B Total distributions of $.17 per share is comprised of distributions from net investment income of $.105 and distributions from net realized gain of $.068 per share.
C Total distributions of $.20 per share is comprised of distributions from net investment income of $.178 and distributions from net realized gain of $.026 per share.
D Amount represents less than $.005 per share.
E Total returns would have been lower if certain expenses had not been reduced during the applicable periods shown.
F Fees and expenses of any underlying Fidelity Central Funds are not included in the Fund's expense ratio. The Fund indirectly bears its proportionate share of the expenses of any underlying Fidelity Central Funds.
G Expense ratios reflect operating expenses of the class. Expenses before reductions do not reflect amounts reimbursed by the investment adviser or reductions from brokerage service arrangements or reductions from other expense offset arrangements and do not represent the amount paid by the class during periods when reimbursements or reductions occur. Expenses net of fee waivers reflect expenses after reimbursement by the investment adviser but prior to reductions from brokerage service arrangements or other expense offset arrangements. Expenses net of all reductions represent the net expenses paid by the class.
H Amount does not include the portfolio activity of any underlying Fidelity Central Funds.
See accompanying notes which are an integral part of the financial statements.
Fidelity Global Commodity Stock Fund Class I
| Years ended October 31, | 2018 | 2017 | 2016 | 2015 | 2014 |
| Selected Per–Share Data | | | | | |
| Net asset value, beginning of period | $12.60 | $10.76 | $10.09 | $13.31 | $14.24 |
| Income from Investment Operations | | | | | |
| Net investment income (loss)A | .25 | .17 | .16 | .25 | .19 |
| Net realized and unrealized gain (loss) | (.21) | 1.86 | .77 | (3.26) | (.92) |
| Total from investment operations | .04 | 2.03 | .93 | (3.01) | (.73) |
| Distributions from net investment income | (.14) | (.12) | (.25) | (.19) | (.19) |
| Distributions from net realized gain | (.05) | (.07) | (.01) | (.03) | (.01) |
| Total distributions | (.19) | (.19) | (.26) | (.21)B | (.20) |
| Redemption fees added to paid in capitalA,C | – | – | – | – | – |
| Net asset value, end of period | $12.45 | $12.60 | $10.76 | $10.09 | $13.31 |
| Total ReturnD | .30% | 18.99% | 9.63% | (22.93)% | (5.16)% |
| Ratios to Average Net AssetsE,F | | | | | |
| Expenses before reductions | .93% | .96% | 1.01% | 1.09% | 1.06% |
| Expenses net of fee waivers, if any | .93% | .95% | 1.01% | 1.08% | 1.06% |
| Expenses net of all reductions | .91% | .94% | 1.00% | 1.08% | 1.06% |
| Net investment income (loss) | 1.90% | 1.45% | 1.55% | 2.11% | 1.34% |
| Supplemental Data | | | | | |
| Net assets, end of period (000 omitted) | $117,981 | $113,655 | $70,068 | $24,841 | $23,840 |
| Portfolio turnover rateG | 70% | 81% | 85% | 77% | 75% |
A Calculated based on average shares outstanding during the period.
B Total distributions of $.21 per share is comprised of distributions from net investment income of $.186 and distributions from net realized gain of $.026 per share.
C Amount represents less than $.005 per share.
D Total returns would have been lower if certain expenses had not been reduced during the applicable periods shown.
E Fees and expenses of any underlying Fidelity Central Funds are not included in the Fund's expense ratio. The Fund indirectly bears its proportionate share of the expenses of any underlying Fidelity Central Funds.
F Expense ratios reflect operating expenses of the class. Expenses before reductions do not reflect amounts reimbursed by the investment adviser or reductions from brokerage service arrangements or reductions from other expense offset arrangements and do not represent the amount paid by the class during periods when reimbursements or reductions occur. Expenses net of fee waivers reflect expenses after reimbursement by the investment adviser but prior to reductions from brokerage service arrangements or other expense offset arrangements. Expenses net of all reductions represent the net expenses paid by the class.
G Amount does not include the portfolio activity of any underlying Fidelity Central Funds.
See accompanying notes which are an integral part of the financial statements.
Fidelity Global Commodity Stock Fund Class Z
| Year ended October 31, | 2018 A |
| Selected Per–Share Data | |
| Net asset value, beginning of period | $13.84 |
| Income from Investment Operations | |
| Net investment income (loss)B | (.01) |
| Net realized and unrealized gain (loss) | (1.37) |
| Total from investment operations | (1.38) |
| Net asset value, end of period | $12.46 |
| Total ReturnC,D | (9.97)% |
| Ratios to Average Net AssetsE,F | |
| Expenses before reductions | .89%G |
| Expenses net of fee waivers, if any | .89%G |
| Expenses net of all reductions | .87%G |
| Net investment income (loss) | (.70)%G |
| Supplemental Data | |
| Net assets, end of period (000 omitted) | $5,118 |
| Portfolio turnover rateH | 70% |
A For the period October 2, 2018 (commencement of sale of shares) to October 31, 2018.
B Calculated based on average shares outstanding during the period.
C Total returns for periods of less than one year are not annualized.
D Total returns would have been lower if certain expenses had not been reduced during the applicable periods shown.
E Fees and expenses of any underlying Fidelity Central Funds are not included in the Fund's expense ratio. The Fund indirectly bears its proportionate share of the expenses of any underlying Fidelity Central Funds.
F Expense ratios reflect operating expenses of the class. Expenses before reductions do not reflect amounts reimbursed by the investment adviser or reductions from brokerage service arrangements or reductions from other expense offset arrangements and do not represent the amount paid by the class during periods when reimbursements or reductions occur. Expense ratios before reductions for start-up periods may not be representative of longer-term operating periods. Expenses net of fee waivers reflect expenses after reimbursement by the investment adviser but prior to reductions from brokerage service arrangements or other expense offset arrangements. Expenses net of all reductions represent the net expenses paid by the class.
G Annualized
H Amount does not include the portfolio activity of any underlying Fidelity Central Funds.
See accompanying notes which are an integral part of the financial statements.
Notes to Financial Statements
For the period ended October 31, 2018
1. Organization.
Fidelity Global Commodity Stock Fund (the Fund) is a non-diversified fund of Fidelity Investment Trust (the Trust) and is authorized to issue an unlimited number of shares. The Trust is registered under the Investment Company Act of 1940, as amended (the 1940 Act), as an open-end management investment company organized as a Massachusetts business trust. The Fund commenced sale of Class Z shares on October 2, 2018. The Fund offers Class A, Class M, Class C, Global Commodity Stock, Class I and Class Z shares, each of which has equal rights as to assets and voting privileges. Each class has exclusive voting rights with respect to matters that affect that class. The Fund's investments in emerging markets can be subject to social, economic, regulatory, and political uncertainties and can be extremely volatile.
2. Investments in Fidelity Central Funds.
The Fund invests in Fidelity Central Funds, which are open-end investment companies generally available only to other investment companies and accounts managed by the investment adviser and its affiliates. The Fund's Schedule of Investments lists each of the Fidelity Central Funds held as of period end, if any, as an investment of the Fund, but does not include the underlying holdings of each Fidelity Central Fund. As an Investing Fund, the Fund indirectly bears its proportionate share of the expenses of the underlying Fidelity Central Funds.
The Money Market Central Funds seek preservation of capital and current income and are managed by Fidelity Investments Money Management, Inc. (FIMM), an affiliate of the investment adviser. Annualized expenses of the Money Market Central Funds as of their most recent shareholder report date are less than .005%.
A complete unaudited list of holdings for each Fidelity Central Fund is available upon request or at the Securities and Exchange Commission (the SEC) website at www.sec.gov. In addition, the financial statements of the Fidelity Central Funds, which are not covered by the Fund's Report of Independent Registered Public Accounting Firm, are available on the SEC website or upon request.
3. Significant Accounting Policies.
The Fund is an investment company and applies the accounting and reporting guidance of the Financial Accounting Standards Board (FASB) Accounting Standards Codification Topic 946 Financial Services – Investments Companies. The financial statements have been prepared in conformity with accounting principles generally accepted in the United States of America (GAAP), which require management to make certain estimates and assumptions at the date of the financial statements. Actual results could differ from those estimates. Subsequent events, if any, through the date that the financial statements were issued have been evaluated in the preparation of the financial statements. The following summarizes the significant accounting policies of the Fund:
Investment Valuation. Investments are valued as of 4:00 p.m. Eastern time on the last calendar day of the period. The Board of Trustees (the Board) has delegated the day to day responsibility for the valuation of the Fund's investments to the Fair Value Committee (the Committee) established by the Fund's investment adviser. In accordance with valuation policies and procedures approved by the Board, the Fund attempts to obtain prices from one or more third party pricing vendors or brokers to value its investments. When current market prices, quotations or currency exchange rates are not readily available or reliable, investments will be fair valued in good faith by the Committee, in accordance with procedures adopted by the Board. Factors used in determining fair value vary by investment type and may include market or investment specific events. The frequency with which these procedures are used cannot be predicted and they may be utilized to a significant extent. The Committee oversees the Fund's valuation policies and procedures and reports to the Board on the Committee's activities and fair value determinations. The Board monitors the appropriateness of the procedures used in valuing the Fund's investments and ratifies the fair value determinations of the Committee.
The Fund categorizes the inputs to valuation techniques used to value its investments into a disclosure hierarchy consisting of three levels as shown below:
- Level 1 – quoted prices in active markets for identical investments
- Level 2 – other significant observable inputs (including quoted prices for similar investments, interest rates, prepayment speeds, etc.)
- Level 3 – unobservable inputs (including the Fund's own assumptions based on the best information available)
Valuation techniques used to value the Fund's investments by major category are as follows:
Equity securities, including restricted securities, for which market quotations are readily available, are valued at the last reported sale price or official closing price as reported by a third party pricing vendor on the primary market or exchange on which they are traded and are categorized as Level 1 in the hierarchy. In the event there were no sales during the day or closing prices are not available, securities are valued at the last quoted bid price or may be valued using the last available price and are generally categorized as Level 2 in the hierarchy. For foreign equity securities, when market or security specific events arise, comparisons to the valuation of American Depositary Receipts (ADRs), futures contracts, Exchange-Traded Funds (ETFs) and certain indexes as well as quoted prices for similar securities may be used and would be categorized as Level 2 in the hierarchy. Utilizing these techniques may result in transfers between Level 1 and Level 2. For equity securities, including restricted securities, where observable inputs are limited, assumptions about market activity and risk are used and these securities may be categorized as Level 3 in the hierarchy.
Investments in open-end mutual funds, including the Fidelity Central Funds, are valued at their closing net asset value (NAV) each business day and are categorized as Level 1 in the hierarchy.
Changes in valuation techniques may result in transfers in or out of an assigned level within the disclosure hierarchy. The aggregate value of investments by input level as of October 31, 2018 is included at the end of the Fund's Schedule of Investments.
Foreign Currency. The Fund may use foreign currency contracts to facilitate transactions in foreign-denominated securities. Gains and losses from these transactions may arise from changes in the value of the foreign currency or if the counterparties do not perform under the contracts' terms.
Foreign-denominated assets, including investment securities, and liabilities are translated into U.S. dollars at the exchange rates at period end. Purchases and sales of investment securities, income and dividends received and expenses denominated in foreign currencies are translated into U.S. dollars at the exchange rate in effect on the transaction date.
The effects of exchange rate fluctuations on investments are included with the net realized and unrealized gain (loss) on investment securities. Other foreign currency transactions resulting in realized and unrealized gain (loss) are disclosed separately.
Investment Transactions and Income. For financial reporting purposes, the Fund's investment holdings and NAV include trades executed through the end of the last business day of the period. The NAV per share for processing shareholder transactions is calculated as of the close of business of the New York Stock Exchange (NYSE), normally 4:00 p.m. Eastern time and includes trades executed through the end of the prior business day. Gains and losses on securities sold are determined on the basis of identified cost and include proceeds received from litigation. Dividend income is recorded on the ex-dividend date, except for certain dividends from foreign securities where the ex-dividend date may have passed, which are recorded as soon as the Fund is informed of the ex-dividend date. Non-cash dividends included in dividend income, if any, are recorded at the fair market value of the securities received. Income and capital gain distributions from Fidelity Central Funds, if any, are recorded on the ex-dividend date. Certain distributions received by the Fund represent a return of capital or capital gain. The Fund determines the components of these distributions subsequent to the ex-dividend date, based upon receipt of tax filings or other correspondence relating to the underlying investment. These distributions are recorded as a reduction of cost of investments and/or as a realized gain. Investment income is recorded net of foreign taxes withheld where recovery of such taxes is uncertain.
Class Allocations and Expenses. Investment income, realized and unrealized capital gains and losses, common expenses of the Fund, and certain fund-level expense reductions, if any, are allocated daily on a pro-rata basis to each class based on the relative net assets of each class to the total net assets of the Fund. Each class differs with respect to transfer agent and distribution and service plan fees incurred. Certain expense reductions may also differ by class. For the reporting period, the allocated portion of income and expenses to each class as a percent of its average net assets may vary due to the timing of recording these transactions in relation to fluctuating net assets of the classes. Expenses directly attributable to a fund are charged to that fund. Expenses attributable to more than one fund are allocated among the respective funds on the basis of relative net assets or other appropriate methods. Expense estimates are accrued in the period to which they relate and adjustments are made when actual amounts are known.
Income Tax Information and Distributions to Shareholders. Each year, the Fund intends to qualify as a regulated investment company under Subchapter M of the Internal Revenue Code, including distributing substantially all of its taxable income and realized gains. As a result, no provision for U.S. Federal income taxes is required. As of October 31, 2018, the Fund did not have any unrecognized tax benefits in the financial statements; nor is the Fund aware of any tax positions for which it is reasonably possible that the total amounts of unrecognized tax benefits will significantly change in the next twelve months. The Fund files a U.S. federal tax return, in addition to state and local tax returns as required. The Fund's federal income tax returns are subject to examination by the Internal Revenue Service (IRS) for a period of three fiscal years after they are filed. State and local tax returns may be subject to examination for an additional fiscal year depending on the jurisdiction. Foreign taxes are provided for based on the Fund's understanding of the tax rules and rates that exist in the foreign markets in which it invests.
Distributions are declared and recorded on the ex-dividend date. Income and capital gain distributions are declared separately for each class. Income and capital gain distributions are determined in accordance with income tax regulations, which may differ from GAAP. In addition, the Fund claimed a portion of the payment made to redeeming shareholders as a distribution for income tax purposes.
Capital accounts within the financial statements are adjusted for permanent book-tax differences. These adjustments have no impact on net assets or the results of operations. Capital accounts are not adjusted for temporary book-tax differences which will reverse in a subsequent period.
Book-tax differences are primarily due to foreign currency transactions, partnerships, passive foreign investment companies (PFIC), capital loss carryforwards and losses deferred due to wash sales.
As of period end, the cost and unrealized appreciation (depreciation) in securities, and derivatives if applicable, for federal income tax purposes were as follows:
| Gross unrealized appreciation | $20,326,078 |
| Gross unrealized depreciation | (116,185,353) |
| Net unrealized appreciation (depreciation) | $(95,859,275) |
| Tax Cost | $650,584,635 |
The tax-based components of distributable earnings as of period end were as follows:
| Undistributed ordinary income | $ 9,018,894 |
| Capital loss carryforward | $(27,311,807) |
| Net unrealized appreciation (depreciation) on securities and other investments | $(95,817,801) |
Capital loss carryforwards are only available to offset future capital gains of the Fund to the extent provided by regulations and may be limited. Under the Regulated Investment Company Modernization Act of 2010 (the Act), the Fund is permitted to carry forward capital losses incurred in taxable years beginning after December 22, 2010 for an unlimited period and such capital losses are required to be used prior to any losses that expire. The capital loss carryforward information presented below, including any applicable limitation, is estimated as of fiscal period end and is subject to adjustment.
| Fiscal year of expiration | |
| 2019 | $(6,952,413) |
| No expiration | |
| Long-term | (20,359,394) |
| Total capital loss carryforward | $(27,311,807) |
The tax character of distributions paid was as follows:
| | October 31, 2018 | October 31, 2017 |
| Ordinary Income | $7,402,151 | $ 5,873,296 |
Short-Term Trading (Redemption) Fees. During the period, shares held by investors in the Fund less than 30 days may have been subject to a redemption fee equal to 1.00% of the NAV of shares redeemed. All redemption fees, which reduce the proceeds of the shareholder redemption, are retained by the Fund and accounted for as an addition to paid in capital. In November 2017, the Board of Trustees approved the elimination of these redemption fees effective December 18, 2017.
New Rule Issuance. During August 2018, the U.S. Securities and Exchange Commission issued Final Rule Release No. 33-10532, Disclosure Update and Simplification. This Final Rule includes amendments specific to registered investment companies that are intended to eliminate overlap in disclosure requirements between Regulation S-X and GAAP. In accordance with these amendments, certain line-items in the Fund's financial statements have been combined or removed for the current period as outlined in the table below.
| Financial Statement | Current Line-Item Presentation | Prior Line-Item Presentation |
| Statement of Assets and Liabilities | Total distributable earnings (loss) | Undistributed/Distributions in excess of/Accumulated net investment income (loss)
Accumulated/Undistributed net realized gain (loss)
Net unrealized appreciation (depreciation) |
| Statement of Changes in Net Assets | N/A - removed | Undistributed/Distributions in excess of/Accumulated net investment income (loss) end of period |
| Statement of Changes in Net Assets | Distributions to shareholders | Distributions to shareholders from net investment income
Distributions to shareholders from net realized gain |
| Distributions to Shareholders Note to Financial Statements | Distributions to shareholders | Distributions to shareholders from net investment income
Distributions to shareholders from net realized gain |
4. Purchases and Sales of Investments.
Purchases and sales of securities, other than short-term securities, aggregated $538,023,671 and $405,858,910, respectively.
5. Fees and Other Transactions with Affiliates.
Management Fee. Fidelity Management & Research Company (the investment adviser) and its affiliates provide the Fund with investment management related services for which the Fund pays a monthly management fee. The management fee is the sum of an individual fund fee rate that is based on an annual rate of .45% of the Fund's average net assets and an annualized group fee rate that averaged .24% during the period. The group fee rate is based upon the average net assets of all the mutual funds advised by the investment adviser, including any mutual funds previously advised by the investment adviser that are currently advised by Fidelity SelectCo, LLC, an affiliate of the investment adviser. The group fee rate decreases as assets under management increase and increases as assets under management decrease. For the reporting period, the total annual management fee rate was .69% of the Fund's average net assets.
Distribution and Service Plan Fees. In accordance with Rule 12b-1 of the 1940 Act, the Fund has adopted separate Distribution and Service Plans for each class of shares. Certain classes pay Fidelity Distributors Corporation (FDC), an affiliate of the investment adviser, separate Distribution and Service Fees, each of which is based on an annual percentage of each class' average net assets. In addition, FDC may pay financial intermediaries for selling shares of the Fund and providing shareholder support services. For the period, the Distribution and Service Fee rates, total fees and amounts retained by FDC were as follows:
| | Distribution Fee | Service Fee | Total Fees | Retained by FDC |
| Class A | -% | .25% | $84,499 | $4,846 |
| Class M | .25% | .25% | 39,524 | 522 |
| Class C | .75% | .25% | 216,617 | 27,172 |
| | | | $340,640 | $ 32,540 |
Sales Load. FDC may receive a front-end sales charge of up to 5.75% for selling Class A shares and 3.50% for selling Class M shares, some of which is paid to financial intermediaries for selling shares of the Fund. Depending on the holding period, FDC may receive contingent deferred sales charges levied on Class A, Class M and Class C redemptions. The deferred sales charges are 1.00% for Class C shares, 1.00% for certain purchases of Class A shares and .25% for certain purchases of Class M shares.
For the period, sales charge amounts retained by FDC were as follows:
| | Retained by FDC |
| Class A | $14,981 |
| Class M | 1,529 |
| Class C(a) | 1,996 |
| | $18,506 |
(a) When Class C shares are initially sold, FDC pays commissions from its own resources to financial intermediaries through which the sales are made.
Transfer Agent Fees. Fidelity Investments Institutional Operations Company, Inc., (FIIOC), an affiliate of the investment adviser, is the transfer, dividend disbursing and shareholder servicing agent for each class of the Fund. FIIOC receives account fees and asset-based fees that vary according to the account size and type of account of the shareholders of the respective classes of the Fund, except for Class Z. FIIOC receives an asset-based fee of Class Z's average net assets. FIIOC pays for typesetting, printing and mailing of shareholder reports, except proxy statements.
For the period, transfer agent fees for each class were as follows:
| | Amount | % of Class-Level Average Net Assets |
| Class A | $86,501 | .26 |
| Class M | 24,959 | .32 |
| Class C | 47,275 | .22 |
| Global Commodity Stock | 1,222,487 | .30 |
| Class I | 189,276 | .15 |
| Class Z | 47 | .04(a) |
| | $1,570,545 | |
(a) Annualized
Accounting and Security Lending Fees. Fidelity Service Company, Inc. (FSC), an affiliate of the investment adviser, maintains the Fund's accounting records. The accounting fee is based on the level of average net assets for each month. Under a separate contract, FSC administers the security lending program. The security lending fee is based on the number and duration of lending transactions. For the period, the fees were equivalent to an annual rate of .05%.
Brokerage Commissions. The Fund placed a portion of its portfolio transactions with brokerage firms which are affiliates of the investment adviser. Brokerage commissions are included in net realized gain (loss) and change in net unrealized appreciation (depreciation) in the Statement of Operations. The commissions paid to these affiliated firms were $5,560 for the period.
Interfund Lending Program. Pursuant to an Exemptive Order issued by the SEC, the Fund, along with other registered investment companies having management contracts with Fidelity Management & Research Company (FMR) or other affiliated entities of FMR, may participate in an interfund lending program. This program provides an alternative credit facility allowing the funds to borrow from, or lend money to, other participating affiliated funds. At period end, there were no interfund loans outstanding. The Fund's activity in this program during the period for which loans were outstanding was as follows:
| Borrower or Lender | Average Loan Balance | Weighted Average Interest Rate | Interest Expense |
| Borrower | $8,883,750 | 1.95% | $1,921 |
Interfund Trades. The Fund may purchase from or sell securities to other Fidelity Funds under procedures adopted by the Board. The procedures have been designed to ensure these interfund trades are executed in accordance with Rule 17a-7 of the 1940 Act. Interfund trades are included within the respective purchases and sales amounts shown in the Purchases and Sales of Investments note.
6. Committed Line of Credit.
The Fund participates with other funds managed by the investment adviser or an affiliate in a $4.25 billion credit facility (the "line of credit") to be utilized for temporary or emergency purposes to fund shareholder redemptions or for other short-term liquidity purposes. The Fund has agreed to pay commitment fees on its pro-rata portion of the line of credit, which amounted to $1,568 and is reflected in Miscellaneous expenses on the Statement of Operations. During the period, the Fund did not borrow on this line of credit.
7. Security Lending.
The Fund lends portfolio securities through a lending agent from time to time in order to earn additional income. For equity securities, a lending agent is used and may loan securities to certain qualified borrowers, including Fidelity Capital Markets (FCM), a broker-dealer affiliated with the Fund. On the settlement date of the loan, the Fund receives collateral (in the form of U.S. Treasury obligations, letters of credit and/or cash) against the loaned securities and maintains collateral in an amount not less than 100% of the market value of the loaned securities during the period of the loan. The market value of the loaned securities is determined at the close of business of the Fund and any additional required collateral is delivered to the Fund on the next business day. The Fund or borrower may terminate the loan at any time, and if the borrower defaults on its obligation to return the securities loaned because of insolvency or other reasons, the Fund may apply collateral received from the borrower against the obligation. The Fund may experience delays and costs in recovering the securities loaned. Any cash collateral received is invested in the Fidelity Securities Lending Cash Central Fund. The value of loaned securities and cash collateral at period end are disclosed on the Fund's Statement of Assets and Liabilities. At period end, there were no security loans outstanding with FCM. Security lending income represents the income earned on investing cash collateral, less rebates paid to borrowers and any lending agent fees associated with the loan, plus any premium payments received for lending certain types of securities. Security lending income is presented in the Statement of Operations as a component of income from Fidelity Central Funds. Total security lending income during the period amounted to $261,584, including $12 from securities loaned to FCM.
8. Expense Reductions.
Commissions paid to certain brokers with whom the investment adviser, or its affiliates, places trades on behalf of the Fund include an amount in addition to trade execution, which may be rebated back to the Fund to offset certain expenses. This amount totaled $100,126 for the period.
In addition, during the period the investment adviser reimbursed and/or waived a portion of fund-level operating expenses in the amount of $5,500.
9. Distributions to Shareholders.
Distributions to shareholders of each class were as follows:
| | Year ended
October 31, 2018 | Year ended
October 31, 2017 |
| Distributions to shareholders | | |
| Class A | $309,556 | $– |
| Class M | 55,615 | – |
| Class C | 53,428 | – |
| Global Commodity Stock | 5,313,895 | – |
| Class I | 1,669,657 | – |
| Total | $7,402,151 | $– |
| From net investment income | | |
| Class A | $– | $252,767 |
| Class M | – | 29,683 |
| Class C | – | 14,849 |
| Global Commodity Stock | – | 2,329,358 |
| Class I | – | 884,379 |
| Total | $– | $3,511,036 |
| From net realized gain | | |
| Class A | $– | $220,361 |
| Class M | – | 39,578 |
| Class C | – | 84,142 |
| Global Commodity Stock | – | 1,508,537 |
| Class I | – | 509,642 |
| Total | $– | $2,362,260 |
10. Share Transactions.
Share transactions for each class were as follows and may contain automatic conversions between classes or exchanges between affiliated funds:
| | Shares | Shares | Dollars | Dollars |
| | Year ended October 31, 2018(a) | Year ended October 31, 2017 | Year ended October 31, 2018(a) | Year ended October 31, 2017 |
| Class A | | | | |
| Shares sold | 961,117 | 651,469 | $12,976,845 | $7,552,817 |
| Reinvestment of distributions | 24,771 | 39,394 | 306,172 | 455,002 |
| Shares redeemed | (1,173,857) | (1,549,520) | (15,724,822) | (18,059,878) |
| Net increase (decrease) | (187,969) | (858,657) | $(2,441,805) | $(10,052,059) |
| Class M | | | | |
| Shares sold | 228,243 | 139,490 | $3,056,866 | $1,612,955 |
| Reinvestment of distributions | 4,488 | 5,865 | 55,468 | 67,801 |
| Shares redeemed | (200,167) | (162,841) | (2,622,769) | (1,893,807) |
| Net increase (decrease) | 32,564 | (17,486) | $489,565 | $(213,051) |
| Class C | | | | |
| Shares sold | 880,029 | 316,655 | $11,853,888 | $3,641,065 |
| Reinvestment of distributions | 4,237 | 8,150 | 52,034 | 93,566 |
| Shares redeemed | (340,536) | (361,056) | (4,503,052) | (4,124,666) |
| Net increase (decrease) | 543,730 | (36,251) | $7,402,870 | $(390,035) |
| Global Commodity Stock | | | | |
| Shares sold | 17,721,753 | 7,707,102 | $231,763,153 | $89,805,053 |
| Reinvestment of distributions | 414,534 | 315,142 | 5,123,639 | 3,643,039 |
| Shares redeemed | (9,429,371) | (8,286,656) | (125,657,701) | (96,347,286) |
| Net increase (decrease) | 8,706,916 | (264,412) | $111,229,091 | $(2,899,194) |
| Class I | | | | |
| Shares sold | 3,453,489 | 4,738,302 | $46,712,238 | $54,914,110 |
| Reinvestment of distributions | 65,617 | 58,242 | 810,368 | 672,698 |
| Shares redeemed | (3,065,738) | (2,283,691) | (39,890,323) | (26,192,412) |
| Net increase (decrease) | 453,368 | 2,512,853 | $7,632,283 | $29,394,396 |
| Class Z | | | | |
| Shares sold | 412,977 | – | $5,219,125 | $– |
| Shares redeemed | (2,138) | – | (26,499) | – |
| Net increase (decrease) | 410,839 | – | $5,192,626 | $– |
(a) Share transactions for Class Z are for the period October 2, 2018 (commencement of sale of shares) to October 31, 2018.
11. Other.
The Fund's organizational documents provide former and current trustees and officers with a limited indemnification against liabilities arising in connection with the performance of their duties to the Fund. In the normal course of business, the Fund may also enter into contracts that provide general indemnifications. The Fund's maximum exposure under these arrangements is unknown as this would be dependent on future claims that may be made against the Fund. The risk of material loss from such claims is considered remote.
At the end of the period, VIP FundsManager 50% Portfolio and VIP FundsManager 60% Portfolio were the owners of record of approximately 11% and 10%, respectively, of the total outstanding shares of the Fund. Mutual funds managed by the investment adviser or its affiliates were the owners of record, in the aggregate, of approximately 26% of the total outstanding shares of the Fund.
Report of Independent Registered Public Accounting Firm
To the Board of Trustees of Fidelity Investment Trust and Shareholders of Fidelity Global Commodity Stock Fund:
Opinion on the Financial Statements
We have audited the accompanying statement of assets and liabilities, including the schedule of investments, of Fidelity Global Commodity Stock Fund (one of the funds constituting Fidelity Investment Trust, referred to hereafter as the "Fund") as of October 31, 2018, the related statement of operations for the year ended October 31, 2018, the statement of changes in net assets for each of the two years in the period ended October 31, 2018, including the related notes, and the financial highlights for each of the periods indicated therein (collectively referred to as the “financial statements”). In our opinion, the financial statements present fairly, in all material respects, the financial position of the Fund as of October 31, 2018, the results of its operations for the year then ended, the changes in its net assets for each of the two years in the period ended October 31, 2018 and the financial highlights for the periods indicated therein in conformity with accounting principles generally accepted in the United States of America.
Basis for Opinion
These financial statements are the responsibility of the Fund’s management. Our responsibility is to express an opinion on the Fund’s financial statements based on our audits. We are a public accounting firm registered with the Public Company Accounting Oversight Board (United States) (“PCAOB”) and are required to be independent with respect to the Fund in accordance with the U.S. federal securities laws and the applicable rules and regulations of the Securities and Exchange Commission and the PCAOB.
We conducted our audits of these financial statements in accordance with the standards of the PCAOB. Those standards require that we plan and perform the audit to obtain reasonable assurance about whether the financial statements are free of material misstatement, whether due to error or fraud.
Our audits included performing procedures to assess the risks of material misstatement of the financial statements, whether due to error or fraud, and performing procedures that respond to those risks. Such procedures included examining, on a test basis, evidence regarding the amounts and disclosures in the financial statements. Our audits also included evaluating the accounting principles used and significant estimates made by management, as well as evaluating the overall presentation of the financial statements. Our procedures included confirmation of securities owned as of October 31, 2018 by correspondence with the custodian and brokers; when replies were not received from brokers, we performed other auditing procedures. We believe that our audits provide a reasonable basis for our opinion.
PricewaterhouseCoopers LLP
Boston, Massachusetts
December 13, 2018
We have served as the auditor of one or more investment companies in the Fidelity group of funds since 1932.
Trustees and Officers
The Trustees, Members of the Advisory Board (if any), and officers of the trust and fund, as applicable, are listed below. The Board of Trustees governs the fund and is responsible for protecting the interests of shareholders. The Trustees are experienced executives who meet periodically throughout the year to oversee the fund's activities, review contractual arrangements with companies that provide services to the fund, oversee management of the risks associated with such activities and contractual arrangements, and review the fund's performance. Except for Jonathan Chiel, each of the Trustees oversees 283 funds. Mr. Chiel oversees 154 funds.
The Trustees hold office without limit in time except that (a) any Trustee may resign; (b) any Trustee may be removed by written instrument, signed by at least two-thirds of the number of Trustees prior to such removal; (c) any Trustee who requests to be retired or who has become incapacitated by illness or injury may be retired by written instrument signed by a majority of the other Trustees; and (d) any Trustee may be removed at any special meeting of shareholders by a two-thirds vote of the outstanding voting securities of the trust. Each Trustee who is not an interested person (as defined in the 1940 Act) of the trust and the fund is referred to herein as an Independent Trustee. Each Independent Trustee shall retire not later than the last day of the calendar year in which his or her 75th birthday occurs. The Independent Trustees may waive this mandatory retirement age policy with respect to individual Trustees. Officers and Advisory Board Members hold office without limit in time, except that any officer or Advisory Board Member may resign or may be removed by a vote of a majority of the Trustees at any regular meeting or any special meeting of the Trustees. Except as indicated, each individual has held the office shown or other offices in the same company for the past five years.
The fund’s Statement of Additional Information (SAI) includes more information about the Trustees. To request a free copy, call Fidelity at 1-800-544-8544.
Experience, Skills, Attributes, and Qualifications of the Trustees. The Governance and Nominating Committee has adopted a statement of policy that describes the experience, qualifications, attributes, and skills that are necessary and desirable for potential Independent Trustee candidates (Statement of Policy). The Board believes that each Trustee satisfied at the time he or she was initially elected or appointed a Trustee, and continues to satisfy, the standards contemplated by the Statement of Policy. The Governance and Nominating Committee also engages professional search firms to help identify potential Independent Trustee candidates who have the experience, qualifications, attributes, and skills consistent with the Statement of Policy. From time to time, additional criteria based on the composition and skills of the current Independent Trustees, as well as experience or skills that may be appropriate in light of future changes to board composition, business conditions, and regulatory or other developments, have also been considered by the professional search firms and the Governance and Nominating Committee. In addition, the Board takes into account the Trustees' commitment and participation in Board and committee meetings, as well as their leadership of standing and ad hoc committees throughout their tenure.
In determining that a particular Trustee was and continues to be qualified to serve as a Trustee, the Board has considered a variety of criteria, none of which, in isolation, was controlling. The Board believes that, collectively, the Trustees have balanced and diverse experience, qualifications, attributes, and skills, which allow the Board to operate effectively in governing the fund and protecting the interests of shareholders. Information about the specific experience, skills, attributes, and qualifications of each Trustee, which in each case led to the Board's conclusion that the Trustee should serve (or continue to serve) as a trustee of the fund, is provided below.
Board Structure and Oversight Function. James C. Curvey is an interested person and currently serves as Chairman. The Trustees have determined that an interested Chairman is appropriate and benefits shareholders because an interested Chairman has a personal and professional stake in the quality and continuity of services provided to the fund. Independent Trustees exercise their informed business judgment to appoint an individual of their choosing to serve as Chairman, regardless of whether the Trustee happens to be independent or a member of management. The Independent Trustees have determined that they can act independently and effectively without having an Independent Trustee serve as Chairman and that a key structural component for assuring that they are in a position to do so is for the Independent Trustees to constitute a substantial majority for the Board. The Independent Trustees also regularly meet in executive session. Ned C. Lautenbach serves as Chairman of the Independent Trustees and as such (i) acts as a liaison between the Independent Trustees and management with respect to matters important to the Independent Trustees and (ii) with management prepares agendas for Board meetings.
Fidelity® funds are overseen by different Boards of Trustees. The fund's Board oversees Fidelity's high income and certain equity funds, and other Boards oversee Fidelity's investment-grade bond, money market, asset allocation, and other equity funds. The asset allocation funds may invest in Fidelity® funds overseen by the fund's Board. The use of separate Boards, each with its own committee structure, allows the Trustees of each group of Fidelity® funds to focus on the unique issues of the funds they oversee, including common research, investment, and operational issues. On occasion, the separate Boards establish joint committees to address issues of overlapping consequences for the Fidelity® funds overseen by each Board.
The Trustees operate using a system of committees to facilitate the timely and efficient consideration of all matters of importance to the Trustees, the fund, and fund shareholders and to facilitate compliance with legal and regulatory requirements and oversight of the fund's activities and associated risks. The Board, acting through its committees, has charged FMR and its affiliates with (i) identifying events or circumstances the occurrence of which could have demonstrably adverse effects on the fund's business and/or reputation; (ii) implementing processes and controls to lessen the possibility that such events or circumstances occur or to mitigate the effects of such events or circumstances if they do occur; and (iii) creating and maintaining a system designed to evaluate continuously business and market conditions in order to facilitate the identification and implementation processes described in (i) and (ii) above. Because the day-to-day operations and activities of the fund are carried out by or through FMR, its affiliates, and other service providers, the fund's exposure to risks is mitigated but not eliminated by the processes overseen by the Trustees. While each of the Board's committees has responsibility for overseeing different aspects of the fund's activities, oversight is exercised primarily through the Operations, Audit, and Compliance Committees. In addition, the Independent Trustees have worked with Fidelity to enhance the Board's oversight of investment and financial risks, legal and regulatory risks, technology risks, and operational risks, including the development of additional risk reporting to the Board. Appropriate personnel, including but not limited to the fund's Chief Compliance Officer (CCO), FMR's internal auditor, the independent accountants, the fund's Treasurer and portfolio management personnel, make periodic reports to the Board's committees, as appropriate, including an annual review of Fidelity's risk management program for the Fidelity® funds. The responsibilities of each standing committee, including their oversight responsibilities, are described further under "Standing Committees of the Trustees."
Interested Trustees*:
Correspondence intended for a Trustee who is an interested person may be sent to Fidelity Investments, 245 Summer Street, Boston, Massachusetts 02210.
Name, Year of Birth; Principal Occupations and Other Relevant Experience+
Jonathan Chiel (1957)
Year of Election or Appointment: 2016
Trustee
Mr. Chiel also serves as Trustee of other Fidelity® funds. Mr. Chiel is Executive Vice President and General Counsel for FMR LLC (diversified financial services company, 2012-present). Previously, Mr. Chiel served as general counsel (2004-2012) and senior vice president and deputy general counsel (2000-2004) for John Hancock Financial Services; a partner with Choate, Hall & Stewart (1996-2000) (law firm); and an Assistant United States Attorney for the United States Attorney’s Office of the District of Massachusetts (1986-95), including Chief of the Criminal Division (1993-1995). Mr. Chiel is a director on the boards of the Boston Bar Foundation and the Maimonides School.
James C. Curvey (1935)
Year of Election or Appointment: 2007
Trustee
Chairman of the Board of Trustees
Mr. Curvey also serves as Trustee of other Fidelity® funds. Mr. Curvey is Vice Chairman (2007-present) and Director of FMR LLC (diversified financial services company). In addition, Mr. Curvey is an Overseer Emeritus for the Boston Symphony Orchestra, a Director of Artis-Naples, and a Trustee of Brewster Academy in Wolfeboro, New Hampshire. Previously, Mr. Curvey served as a Director of Fidelity Research & Analysis Co. (investment adviser firm, 2009-2018), Director of Fidelity Investments Money Management, Inc. (investment adviser firm, 2009-2014) and a Director of FMR and FMR Co., Inc. (investment adviser firms, 2007-2014).
Charles S. Morrison (1960)
Year of Election or Appointment: 2014
Trustee
Mr. Morrison also serves as Trustee of other funds. He serves as President of Fidelity SelectCo, LLC (investment adviser firm, 2017-present) and Fidelity Management & Research Company (FMR) (investment adviser firm, 2016-present), a Director of Fidelity Investments Money Management, Inc. (FIMM) (investment adviser firm, 2014-present), Director of Fidelity SelectCo, LLC (investment adviser firm, 2014-present), President, Asset Management (2014-present), and is an employee of Fidelity Investments. Previously, Mr. Morrison served as Vice President of Fidelity's Fixed Income and Asset Allocation Funds (2012-2014), President, Fixed Income (2011-2014), Vice President of Fidelity's Money Market Funds (2005-2009), President, Money Market Group Leader of FMR (investment adviser firm, 2009), and Senior Vice President, Money Market Group of FMR (2004-2009). Mr. Morrison also served as Vice President of Fidelity's Bond Funds (2002-2005), certain Balanced Funds (2002-2005), and certain Asset Allocation Funds (2002-2007), and as Senior Vice President (2002-2005) of Fidelity's Bond Division.
* Determined to be an “Interested Trustee” by virtue of, among other things, his or her affiliation with the trust or various entities under common control with FMR.
+ The information includes the Trustee's principal occupation during the last five years and other information relating to the experience, attributes, and skills relevant to the Trustee's qualifications to serve as a Trustee, which led to the conclusion that the Trustee should serve as a Trustee for the fund.
Independent Trustees:
Correspondence intended for an Independent Trustee may be sent to Fidelity Investments, P.O. Box 55235, Boston, Massachusetts 02205-5235.
Name, Year of Birth; Principal Occupations and Other Relevant Experience+
Dennis J. Dirks (1948)
Year of Election or Appointment: 2005
Trustee
Mr. Dirks also serves as Trustee of other Fidelity® funds. Prior to his retirement in May 2003, Mr. Dirks was Chief Operating Officer and a member of the Board of The Depository Trust & Clearing Corporation (DTCC). He also served as President, Chief Operating Officer, and Board member of The Depository Trust Company (DTC) and President and Board member of the National Securities Clearing Corporation (NSCC). In addition, Mr. Dirks served as Chief Executive Officer and Board member of the Government Securities Clearing Corporation, Chief Executive Officer and Board member of the Mortgage-Backed Securities Clearing Corporation, as a Trustee and a member of the Finance Committee of Manhattan College (2005-2008), as a Trustee and a member of the Finance Committee of AHRC of Nassau County (2006-2008), as a member of the Independent Directors Council (IDC) Governing Council (2010-2015), and as a member of the Board of Directors for The Brookville Center for Children’s Services, Inc. (2009-2017). Mr. Dirks is a member of the Finance Committee (2016-present), Board of Directors (2017-present) and Board of Trustees (2018-present) and is Treasurer (2018-present) of the Asolo Repertory Theatre.
Donald F. Donahue (1950)
Year of Election or Appointment: 2018
Trustee
Mr. Donahue also serves as a Trustee of other Fidelity® funds. Mr. Donahue is President and Chief Executive Officer of Miranda Partners, LLC (risk consulting for the financial services industry, 2012-present). Previously, Mr. Donahue served as a Member of the Advisory Board of certain Fidelity® funds (2015-2018) and Chief Executive Officer (2006-2012), Chief Operating Officer (2003-2006), and Managing Director, Customer Marketing and Development (1999-2003) of The Depository Trust & Clearing Corporation (financial markets infrastructure). Mr. Donahue serves as a Member (2007-present) and Co-Chairman (2016-present) of the Board of Directors of United Way of New York, Member of the Board of Directors of NYC Leadership Academy (2012-present) and Member of the Board of Advisors of Ripple Labs, Inc. (financial services, 2015-present). He also served as Chairman (2010-2012) and Member of the Board of Directors (2012-2013) of Omgeo, LLC (financial services), Treasurer of United Way of New York (2012-2016), and Member of the Board of Directors of XBRL US (financial services non-profit, 2009-2012) and the International Securities Services Association (2009-2012).
Alan J. Lacy (1953)
Year of Election or Appointment: 2008
Trustee
Mr. Lacy also serves as Trustee of other Fidelity® funds. Mr. Lacy serves as a Director of Bristol-Myers Squibb Company (global pharmaceuticals, 2008-present). He is a Trustee of the California Chapter of The Nature Conservancy (2015-present) and a Director of the Center for Advanced Study in the Behavioral Sciences at Stanford University (2015-present). In addition, Mr. Lacy served as Senior Adviser (2007-2014) of Oak Hill Capital Partners, L.P. (private equity) and also served as Chief Executive Officer (2005) and Vice Chairman (2005-2006) of Sears Holdings Corporation (retail) and Chief Executive Officer and Chairman of the Board of Sears, Roebuck and Co. (retail, 2000-2005). Previously, Mr. Lacy served as Chairman (2014-2017) and a member (2010-2017) of the Board of Directors of Dave & Buster’s Entertainment, Inc. (restaurant and entertainment complexes), as Chairman (2008-2011) and a member (2006-2015) of the Board of Trustees of the National Parks Conservation Association, and as a member of the Board of Directors for The Hillman Companies, Inc. (hardware wholesalers, 2010-2014), Earth Fare, Inc. (retail grocery, 2010-2014), and The Western Union Company (global money transfer, 2006-2011).
Ned C. Lautenbach (1944)
Year of Election or Appointment: 2000
Trustee
Chairman of the Independent Trustees
Mr. Lautenbach also serves as Trustee of other Fidelity® funds. Mr. Lautenbach currently serves as Vice Chair of the Board of Governors, State University System of Florida (2013-present) and is a member of the Council on Foreign Relations (1994-present). He is also a member and has most recently served as Chairman of the Board of Directors of Artis-Naples (2012-present). Previously, Mr. Lautenbach served as a member and then Lead Director of the Board of Directors of Eaton Corporation (diversified industrial, 1997-2016). He was also a Partner and Advisory Partner at Clayton, Dubilier & Rice, LLC (private equity investment, 1998-2010), as well as a Director of Sony Corporation (2006-2007). In addition, Mr. Lautenbach also had a 30-year career with IBM (technology company) during which time he served as Senior Vice President and a member of the Corporate Executive Committee (1968-1998).
Joseph Mauriello (1944)
Year of Election or Appointment: 2008
Trustee
Mr. Mauriello also serves as Trustee of other Fidelity® funds. Prior to his retirement in January 2006, Mr. Mauriello served in numerous senior management positions including Deputy Chairman and Chief Operating Officer (2004-2005), and Vice Chairman of Financial Services (2002-2004) of KPMG LLP US (professional services, 1965-2005). Mr. Mauriello currently serves as a member of the Independent Directors Council (IDC) Governing Council (2015-present). Previously, Mr. Mauriello served as a member of the Board of Directors of XL Group plc. (global insurance and re-insurance, 2006-2018).
Cornelia M. Small (1944)
Year of Election or Appointment: 2005
Trustee
Ms. Small also serves as Trustee of other Fidelity® funds. Ms. Small is a member of the Board of Directors (2009-present) and Chair of the Investment Committee (2010-present) of the Teagle Foundation. Ms. Small also serves on the Investment Committee of the Berkshire Taconic Community Foundation (2008-present). Previously, Ms. Small served as Chairperson (2002-2008) and a member of the Investment Committee and Chairperson (2008-2012) and a member of the Board of Trustees of Smith College. In addition, Ms. Small served as Chief Investment Officer, Director of Global Equity Investments, and a member of the Board of Directors of Scudder, Stevens & Clark and Scudder Kemper Investments.
Garnett A. Smith (1947)
Year of Election or Appointment: 2018
Trustee
Mr. Smith also serves as Trustee of other Fidelity® funds. Prior to Mr. Smith's retirement, he served as Chairman and Chief Executive Officer of Inbrand Corp. (manufacturer of personal absorbent products, 1990-1997). He also served as President (1986-1990) of Inbrand Corp. Prior to his employment with Inbrand Corp., he was employed by a retail fabric chain and North Carolina National Bank. In addition, Mr. Smith served as a Member of the Advisory Board of certain Fidelity® funds (2012-2013) and as a board member of the Jackson Hole Land Trust (2009-2012).
David M. Thomas (1949)
Year of Election or Appointment: 2008
Trustee
Mr. Thomas also serves as Trustee of other Fidelity® funds. Mr. Thomas serves as Non-Executive Chairman of the Board of Directors of Fortune Brands Home and Security (home and security products, 2011-present), as a member of the Board of Directors (2004-present) and Presiding Director (2013-present) of Interpublic Group of Companies, Inc. (marketing communication), and as a member of the Board of Trustees of the University of Florida (2013-present). Previously, Mr. Thomas served as Executive Chairman (2005-2006) and Chairman and Chief Executive Officer (2000-2005) of IMS Health, Inc. (pharmaceutical and healthcare information solutions), and a Director of Fortune Brands, Inc. (consumer products, 2000-2011).
+ The information includes the Trustee's principal occupation during the last five years and other information relating to the experience, attributes, and skills relevant to the Trustee's qualifications to serve as a Trustee, which led to the conclusion that the Trustee should serve as a Trustee for the fund.
Advisory Board Members and Officers:
Correspondence intended for a Member of the Advisory Board (if any) may be sent to Fidelity Investments, P.O. Box 55235, Boston, Massachusetts 02205-5235. Correspondence intended for an officer or Peter S. Lynch may be sent to Fidelity Investments, 245 Summer Street, Boston, Massachusetts 02210. Officers appear below in alphabetical order.
Name, Year of Birth; Principal Occupation
Vicki L. Fuller (1957)
Year of Election or Appointment: 2018
Member of the Advisory Board
Ms. Fuller also serves as Member of the Advisory Board of other Fidelity® funds. Ms. Fuller serves as a member of the Board of Directors, Audit Committee, and Nominating and Governance Committee of The Williams Companies, Inc. (natural gas infrastructure, 2018-present). Previously, Ms. Fuller served as the Chief Investment Officer of the New York State Common Retirement Fund (2012-2018) and held a variety of positions at AllianceBernstein L.P. (global asset management, 1985-2012), including Managing Director (2006-2012) and Senior Vice President and Senior Portfolio Manager (2001-2006).
Peter S. Lynch (1944)
Year of Election or Appointment: 2003
Member of the Advisory Board
Mr. Lynch also serves as Member of the Advisory Board of other Fidelity® funds. Mr. Lynch is Vice Chairman and a Director of FMR (investment adviser firm) and FMR Co., Inc. (investment adviser firm). In addition, Mr. Lynch serves as a Trustee of Boston College and as the Chairman of the Inner-City Scholarship Fund. Previously, Mr. Lynch served on the Special Olympics International Board of Directors (1997-2006).
William S. Stavropoulos (1939)
Year of Election or Appointment: 2018
Member of the Advisory Board
Mr. Stavropoulos also serves as Member of the Advisory Board of other Fidelity® funds. Mr. Stavropoulos serves as President and Founder of the Michigan Baseball Foundation, the Great Lakes Loons (2007-present). Mr. Stavropoulos is Chairman Emeritus of the Board of Directors of The Dow Chemical Company, where he previously served in numerous senior management positions, including President, CEO (1995-2000; 2002-2004), Chairman of the Executive Committee (2000-2006), and as a member of the Board of Directors (1990-2006). Currently, Mr. Stavropoulos is Chairman of the Board of Directors of Univar Inc. (global distributor of commodity and specialty chemicals), a Director of Teradata Corporation (data warehousing and technology solutions), and a member of the Advisory Board for Metalmark Capital LLC (private equity investment, 2005-present). Mr. Stavropoulos is an operating advisor to Clayton, Dubilier & Rice, LLC (private equity investment). In addition, Mr. Stavropoulos is a member of the University of Notre Dame Advisory Council for the College of Science, a Trustee of the Rollin L. Gerstacker Foundation, and a Director of Artis-Naples in Naples, Florida. Previously, Mr. Stavropoulos served as Trustee of certain Fidelity® funds (2001-2018) and as a Director of Chemical Financial Corporation (bank holding company, 1993-2012) and Tyco International, Ltd. (multinational manufacturing and services, 2007-2012).
Carol B. Tomé (1957)
Year of Election or Appointment: 2018
Member of the Advisory Board
Ms. Tomé also serves as Member of the Advisory Board of other Fidelity® funds. Ms. Tomé is Chief Financial Officer (2001-present) and Executive Vice President of Corporate Services (2007-present) of The Home Depot, Inc. (home improvement retailer) and a Director (2003-present) and Chair of the Audit Committee (2004-present) of United Parcel Service, Inc. (package delivery and supply chain management). Previously, Ms. Tomé served as Trustee of certain Fidelity® funds (2017), Senior Vice President of Finance and Accounting/Treasurer (2000-2007) and Vice President and Treasurer (1995-2000) of The Home Depot, Inc. and Chair of the Board (2010-2012), Vice Chair of the Board (2009 and 2013), and a Director (2008-2013) of the Federal Reserve Bank of Atlanta. Ms. Tomé is also a director or trustee of many community and professional organizations.
Michael E. Wiley (1950)
Year of Election or Appointment: 2018
Member of the Advisory Board [Include if document contains trusts for which the individual serves as Advisory Board Member and trusts for which he/she does not serve as Advisory Board Member:of Name(s) of Trust(s)]
Mr. Wiley also serves as Trustee or Member of the Advisory Board of other Fidelity® funds. Mr. Wiley serves as a Director of High Point Resources (exploration and production, 2005-present). Previously, Mr. Wiley served as a Director of Andeavor Corporation (independent oil refiner and marketer, 2005-2018), a Director of Andeavor Logistics LP (natural resources logistics, 2015-2018), a Director of Post Oak Bank (privately-held bank, 2004-2018), a Director of Asia Pacific Exploration Consolidated (international oil and gas exploration and production, 2008-2013), a member of the Board of Trustees of the University of Tulsa (2000-2006; 2007-2010), a Senior Energy Advisor of Katzenbach Partners, LLC (consulting, 2006-2007), an Advisory Director of Riverstone Holdings (private investment), a Director of Spinnaker Exploration Company (exploration and production, 2001-2005) and Chairman, President, and CEO of Baker Hughes, Inc. (oilfield services, 2000-2004).
Elizabeth Paige Baumann (1968)
Year of Election or Appointment: 2017
Anti-Money Laundering (AML) Officer
Ms. Baumann also serves as AML Officer of other funds. She is Chief AML Officer (2012-present) and Senior Vice President (2014-present) of FMR LLC (diversified financial services company) and is an employee of Fidelity Investments. Previously, Ms. Baumann served as AML Officer of the funds (2012-2016), and Vice President (2007-2014) and Deputy Anti-Money Laundering Officer (2007-2012) of FMR LLC.
John J. Burke III (1964)
Year of Election or Appointment: 2018
Chief Financial Officer
Mr. Burke also serves as Chief Financial Officer of other funds. Mr. Burke serves as Head of Investment Operations for Fidelity Fund and Investment Operations (2018-present) and is an employee of Fidelity Investments (1998-present). Previously Mr. Burke served as head of Asset Management Investment Operations (2012-2018).
William C. Coffey (1969)
Year of Election or Appointment: 2018
Secretary and Chief Legal Officer (CLO)
Mr. Coffey also serves as Secretary and CLO of other funds. Mr. Coffey serves as CLO, Secretary, and Senior Vice President of Fidelity Management & Research Company and FMR Co., Inc. (investment adviser firms, 2018-present); Secretary of Fidelity SelectCo, LLC and Fidelity Investments Money Management, Inc. (investment adviser firms, 2018-present); and CLO of Fidelity Management & Research (Hong Kong) Limited, FMR Investment Management (UK) Limited, and Fidelity Management & Research (Japan) Limited (investment adviser firms, 2018-present). He is Senior Vice President and Deputy General Counsel of FMR LLC (diversified financial services company, 2010-present), and is an employee of Fidelity Investments. Previously, Mr. Coffey served as Assistant Secretary of certain funds (2009-2018) and as Vice President and Associate General Counsel of FMR LLC (2005-2009).
Timothy M. Cohen (1969)
Year of Election or Appointment: 2018
Vice President
Mr. Cohen also serves as Vice President of other funds. Mr. Cohen serves as Co-Head of Global Equity Research (2016-present), a Director of Fidelity Management & Research (Japan) Limited (investment adviser firm, 2016-present), and is an employee of Fidelity Investments. Previously, Mr. Cohen served as Chief Investment Officer - Equity and a Director of Fidelity Management & Research (U.K.) Inc. (investment adviser firm, 2013-2015) and as a Director of Fidelity Management & Research (Hong Kong) Limited (investment adviser firm, 2017).
Jonathan Davis (1968)
Year of Election or Appointment: 2010
Assistant Treasurer
Mr. Davis also serves as Assistant Treasurer of other funds. Mr. Davis serves as Assistant Treasurer of FMR Capital, Inc. (2017-present) and is an employee of Fidelity Investments. Previously, Mr. Davis served as Vice President and Associate General Counsel of FMR LLC (diversified financial services company, 2003-2010).
Adrien E. Deberghes (1967)
Year of Election or Appointment: 2016
Assistant Treasurer
Mr. Deberghes also serves as an officer of other funds. He serves as Assistant Treasurer of FMR Capital, Inc. (2017-present), Executive Vice President of Fidelity Investments Money Management, Inc. (FIMM) (investment adviser firm, 2016-present), and is an employee of Fidelity Investments (2008-present). Previously, Mr. Deberghes served as President and Treasurer of certain Fidelity® funds (2013-2018). Prior to joining Fidelity Investments, Mr. Deberghes was Senior Vice President of Mutual Fund Administration at State Street Corporation (2007-2008), Senior Director of Mutual Fund Administration at Investors Bank & Trust (2005-2007), and Director of Finance for Dunkin' Brands (2000-2005). Previously, Mr. Deberghes served in other fund officer roles.
Laura M. Del Prato (1964)
Year of Election or Appointment: 2018
Assistant Treasurer
Ms. Del Prato also serves as an officer of other funds. Ms. Del Prato is an employee of Fidelity Investments (2017-present). Prior to joining Fidelity Investments, Ms. Del Prato served as a Managing Director and Treasurer of the JPMorgan Mutual Funds (2014-2017). Prior to JPMorgan, Ms. Del Prato served as a partner at Cohen Fund Audit Services (accounting firm, 2012-2013) and KPMG LLP (accounting firm, 2004-2012).
Colm A. Hogan (1973)
Year of Election or Appointment: 2016
Deputy Treasurer
Mr. Hogan also serves as an officer of other funds. Mr. Hogan serves as Assistant Treasurer of FMR Capital, Inc. (2017-present) and is an employee of Fidelity Investments (2005-present). Previously, Mr. Hogan served as Assistant Treasurer of certain Fidelity® funds (2016-2018).
Pamela R. Holding (1964)
Year of Election or Appointment: 2018
Vice President
Ms. Holding also serves as Vice President of other funds. Ms. Holding serves as Co-Head of Global Equity Research (2018-present) and is an employee of Fidelity Investments (2013-present).
Chris Maher (1972)
Year of Election or Appointment: 2013
Assistant Treasurer
Mr. Maher serves as Assistant Treasurer of other funds. Mr. Maher is Vice President of Valuation Oversight, serves as Assistant Treasurer of FMR Capital, Inc. (2017-present), and is an employee of Fidelity Investments. Previously, Mr. Maher served as Vice President of Asset Management Compliance (2013), Vice President of the Program Management Group of FMR (investment adviser firm, 2010-2013), and Vice President of Valuation Oversight (2008-2010).
Rieco E. Mello (1969)
Year of Election or Appointment: 2017
Assistant Treasurer
Mr. Mello also serves as Assistant Treasurer of other funds. Mr. Mello serves as Assistant Treasurer of FMR Capital, Inc. (2017-present) and is an employee of Fidelity Investments (1995-present).
Kenneth B. Robins (1969)
Year of Election or Appointment: 2016
Chief Compliance Officer
Mr. Robins also serves as an officer of other funds. Mr. Robins serves as Compliance Officer of Fidelity Management & Research Company and FMR Co., Inc. (investment adviser firms, 2016-present) and is an employee of Fidelity Investments (2004-present). Previously, Mr. Robins served as Executive Vice President of Fidelity Investments Money Management, Inc. (investment adviser firm, 2013-2016) and served in other fund officer roles.
Stacie M. Smith (1974)
Year of Election or Appointment: 2016
President and Treasurer
Ms. Smith also serves as an officer of other funds. Ms. Smith serves as Assistant Treasurer of FMR Capital, Inc. (2017-present), is an employee of Fidelity Investments (2009-present), and has served in other fund officer roles. Prior to joining Fidelity Investments, Ms. Smith served as Senior Audit Manager of Ernst & Young LLP (accounting firm, 1996-2009). Previously, Ms. Smith served as Assistant Treasurer (2013-2018) and Deputy Treasurer (2013-2016) of certain Fidelity® funds.
Marc L. Spector (1972)
Year of Election or Appointment: 2016
Assistant Treasurer
Mr. Spector also serves as an officer of other funds. Mr. Spector serves as Assistant Treasurer of FMR Capital, Inc. (2017-present) and is an employee of Fidelity Investments (2016-present). Prior to joining Fidelity Investments, Mr. Spector served as Director at the Siegfried Group (accounting firm, 2013-2016), and prior to Siegfried Group as audit senior manager at Deloitte & Touche (accounting firm, 2005-2013).
Shareholder Expense Example
As a shareholder of the Fund, you incur two types of costs: (1) transaction costs, including sales charges (loads) on purchase payments or redemption proceeds, redemption fees and (2) ongoing costs, including management fees, distribution and/or service (12b-1) fees and other Fund expenses. This Example is intended to help you understand your ongoing costs (in dollars) of investing in the Fund and to compare these costs with the ongoing costs of investing in other mutual funds.
The actual expense Example is based on an investment of $1,000 invested at the beginning of the period and held for the entire period (May 1, 2018 to October 31, 2018) for Class A, Class M, Class C, Global Commodity Stock and Class I and for the period (October 2, 2018 to October 31, 2018) for Class Z. The hypothetical expense Example is based on an investment of $1,000 invested for the one-half year period (May 1, 2018 to October 31, 2018).
Actual Expenses
The first line of the accompanying table for each class of the Fund provides information about actual account values and actual expenses. You may use the information in this line, together with the amount you invested, to estimate the expenses that you paid over the period. Simply divide your account value by $1,000.00 (for example, an $8,600 account value divided by $1,000.00 = 8.6), then multiply the result by the number in the first line for a class of the Fund under the heading entitled "Expenses Paid During Period" to estimate the expenses you paid on your account during this period. A small balance maintenance fee of $12.00 that is charged once a year may apply for certain accounts with a value of less than $2,000. This fee, which was eliminated effective August 1, 2018, is not included in the table below. If it was, the estimate of expenses you paid during the period would be higher, and your ending account value lower, by this amount. In addition, the Fund, as a shareholder in the underlying Fidelity Central Funds, will indirectly bear its pro-rata share of the fees and expenses incurred by the underlying Fidelity Central Funds. These fees and expenses are not included in the Fund's annualized expense ratio used to calculate the expense estimate in the table below.
Hypothetical Example for Comparison Purposes
The second line of the accompanying table for each class of the Fund provides information about hypothetical account values and hypothetical expenses based on a Class' actual expense ratio and an assumed rate of return of 5% per year before expenses, which is not the Class' actual return. The hypothetical account values and expenses may not be used to estimate the actual ending account balance or expenses you paid for the period. You may use this information to compare the ongoing costs of investing in the Fund and other funds. To do so, compare this 5% hypothetical example with the 5% hypothetical examples that appear in the shareholder reports of the other funds. A small balance maintenance fee of $12.00 that is charged once a year may apply for certain accounts with a value of less than $2,000. This fee, which was eliminated effective August 1, 2018, is not included in the table below. If it was, the estimate of expenses you paid during the period would be higher, and your ending account value lower, by this amount. In addition, the Fund, as a shareholder in the underlying Fidelity Central Funds, will indirectly bear its pro-rata share of the fees and expenses incurred by the underlying Fidelity Central Funds. These fees and expenses are not included in the Fund's annualized expense ratio used to calculate the expense estimate in the table below.
Please note that the expenses shown in the table are meant to highlight your ongoing costs only and do not reflect any transaction costs. Therefore, the second line of the table is useful in comparing ongoing costs only, and will not help you determine the relative total costs of owning different funds. In addition, if these transactional costs were included, your costs would have been higher.
| | Annualized Expense Ratio-A | Beginning
Account Value
| Ending
Account Value
October 31, 2018 | Expenses Paid
During Period
|
| Class A | 1.28% | | | |
| Actual | | $1,000.00 | $923.40 | $6.21-B |
| Hypothetical-C | | $1,000.00 | $1,018.75 | $6.51-D |
| Class M | 1.59% | | | |
| Actual | | $1,000.00 | $921.90 | $7.70-B |
| Hypothetical-C | | $1,000.00 | $1,017.19 | $8.08-D |
| Class C | 1.99% | | | |
| Actual | | $1,000.00 | $920.40 | $9.63-B |
| Hypothetical-C | | $1,000.00 | $1,015.17 | $10.11-D |
| Global Commodity Stock | 1.07% | | | |
| Actual | | $1,000.00 | $924.20 | $5.19-B |
| Hypothetical-C | | $1,000.00 | $1,019.81 | $5.45-D |
| Class I | .92% | | | |
| Actual | | $1,000.00 | $925.00 | $4.46-B |
| Hypothetical-C | | $1,000.00 | $1,020.57 | $4.69-D |
| Class Z | .89% | | | |
| Actual | | $1,000.00 | $900.30 | $.70-B |
| Hypothetical-C | | $1,000.00 | $1,020.72 | $4.53-D |
A Annualized expense ratio reflects expenses net of applicable fee waivers.
B Actual expenses are equal to each Class' annualized expense ratio, multiplied by the average account value over the period, multiplied by 184/ 365 (to reflect the one-half year period) for Class A, Class M, Class C, Global Commodity Stock and Class I, and multiplied by 30/365 (to reflect the period October 2, 2018 to October 31, 2018) for Class Z.
C 5% return per year before expenses
D Hypothetical expenses are equal to each Class' annualized expense ratio, multiplied by the average account value over the period, multiplied by 184/ 365 (to reflect the one-half year period).
Distributions (Unaudited)
The Board of Trustees of Fidelity Global Commodity Stock Fund voted to pay to shareholders of record at the opening of business on record date, the following distributions per share derived from capital gains realized from sales of portfolio securities, and dividends derived from net investment income:
| | Pay Date | Record Date | Dividends | Capital Gains |
| Fidelity Global Commodity Stock Fund | | | | |
| Class A | 12/10/18 | 12/07/18 | $0.198 | $0.018 |
| Class M | 12/10/18 | 12/07/18 | $0.158 | $0.018 |
| Class C | 12/10/18 | 12/07/18 | $0.105 | $0.018 |
| Global Commodity Stock | 12/10/18 | 12/07/18 | $0.231 | $0.018 |
| Class I | 12/10/18 | 12/07/18 | $0.252 | $0.018 |
| Class Z | 12/10/18 | 12/07/18 | $0.271 | $0.018 |
| | | | | |
Class A designates 59%, Class M designates 76%, Class C designates 100%, Global Commodity Stock designates 45%, and Class I designates 43% of the dividend distributed during the fiscal year as qualifying for the dividends–received deduction for corporate shareholders.
Class A, Class M, Class C, Global Commodity Stock, and Class I designate 100% of the dividends distributed during the fiscal year as amounts which may be taken into account as a dividend for purposes of the maximum rate under section 1(h)(11) of the Internal Revenue Code.
The amounts per share which represent income derived from sources within, and taxes paid to, foreign countries or possessions of the United States are as follows:
| | Pay Date | Income | Taxes |
| Fidelity Global Commodity Stock Fund | | | |
| Class A | 12/11/17 | $0.1107 | $0.0054 |
| Class M | 12/11/17 | $0.0859 | $0.0054 |
| Class C | 12/11/17 | $0.0419 | $0.0054 |
| Global Commodity Stock | 12/11/17 | $0.1467 | $0.0054 |
| Class I | 12/11/17 | $0.1531 | $0.0054 |
| | | | |
The fund will notify shareholders in January 2019 of amounts for use in preparing 2018 income tax returns.
Board Approval of Investment Advisory Contracts
Fidelity Global Commodity Stock Fund
At its July 2018 meeting, the Board of Trustees, including the Independent Trustees (together, the Board), voted to continue the management contract with Fidelity Management & Research Company (FMR) and the sub-advisory agreements (together, the Advisory Contracts) for the fund for six months through January 31, 2019, in connection with the reunification of the Fidelity Equity High Income Funds Board, which oversees the fund, and the Sector Portfolios Board.
The Board considered that the approval of the fund's Advisory Contracts will not result in any changes in (i) the investment process or strategies employed in the management of the fund's assets; (ii) the fees and expenses paid by shareholders; (iii) the nature, extent or quality of services provided under the fund's Advisory Contracts; or (iv) the day-to-day management of the fund or the persons primarily responsible for such management. The Board concluded that the fund's Advisory Contracts are fair and reasonable, and that the fund's Advisory Contracts should be renewed, without modification, through January 31, 2019, with the understanding that the Board will consider the annual renewal for a full one year period in January 2019.
In connection with its consideration of future renewals of the fund's Advisory Contracts, the Board will consider: (i) the nature, extent and quality of services provided to the fund, including shareholder and administrative services and investment performance; (ii) the competitiveness of the management fee and total expenses for the fund; (iii) the costs of the services and profitability, including the revenues earned and the expenses incurred in conducting the business of developing, marketing, distributing, managing, administering, and servicing the fund and its shareholders, to the extent applicable, as well as potential fall-out benefits from Fidelity's non-fund businesses; and (iv) whether there have been economies of scale in respect of the Fidelity funds, whether the Fidelity funds (including the fund) have appropriately benefited from any such economies of scale, and whether there is the potential for realization of any further economies.
Based on its evaluation of all of the conclusions noted above, and after considering all factors it believed relevant, the Board ultimately concluded that the fund's management fee structure is fair and reasonable, and that the continuation of the fund's Advisory Contracts should be approved.
Corporate Headquarters
245 Summer St.
Boston, MA 02210
www.fidelity.com
GCS-ANN-1218
1.879380.109
Fidelity Advisor® Total Emerging Markets Fund - Class A, Class M, Class C, Class I and Class Z
Annual Report October 31, 2018 Class A, Class M, Class C, Class I and Class Z are classes of Fidelity® Total Emerging Markets Fund |
|
Contents
To view a fund's proxy voting guidelines and proxy voting record for the 12-month period ended June 30, visit http://www.fidelity.com/proxyvotingresults or visit the Securities and Exchange Commission's (SEC) web site at http://www.sec.gov.
You may also call 1-877-208-0098 to request a free copy of the proxy voting guidelines.
Standard & Poor's, S&P and S&P 500 are registered service marks of The McGraw-Hill Companies, Inc. and have been licensed for use by Fidelity Distributors Corporation.
Other third-party marks appearing herein are the property of their respective owners.
All other marks appearing herein are registered or unregistered trademarks or service marks of FMR LLC or an affiliated company. © 2018 FMR LLC. All rights reserved.
This report and the financial statements contained herein are submitted for the general information of the shareholders of the Fund. This report is not authorized for distribution to prospective investors in the Fund unless preceded or accompanied by an effective prospectus.
A fund files its complete schedule of portfolio holdings with the SEC for the first and third quarters of each fiscal year on Form N-Q. Forms N-Q are available on the SEC’s web site at http://www.sec.gov. A fund's Forms N-Q may be reviewed and copied at the SEC’s Public Reference Room in Washington, DC. Information regarding the operation of the SEC's Public Reference Room may be obtained by calling 1-800-SEC-0330.
For a complete list of a fund's portfolio holdings, view the most recent holdings listing, semiannual report, or annual report on Fidelity's web site at http://www.fidelity.com, http://www.institutional.fidelity.com, or http://www.401k.com, as applicable.
NOT FDIC INSURED •MAY LOSE VALUE •NO BANK GUARANTEE
Neither the Fund nor Fidelity Distributors Corporation is a bank.
Performance: The Bottom Line
Average annual total return reflects the change in the value of an investment, assuming reinvestment of distributions from dividend income and capital gains (the profits earned upon the sale of securities that have grown in value, if any) and assuming a constant rate of performance each year. The hypothetical investment and the average annual total returns do not reflect the deduction of taxes that a shareholder would pay on fund distributions or the redemption of fund shares. During periods of reimbursement by Fidelity, a fund’s total return will be greater than it would be had the reimbursement not occurred. How a fund did yesterday is no guarantee of how it will do tomorrow.
Average Annual Total Returns
| For the periods ended October 31, 2018 | Past 1 year | Past 5 years | Life of fundA |
| Class A (incl. 5.75% sales charge) | (17.78)% | 0.99% | 2.81% |
| Class M (incl. 3.50% sales charge) | (16.07)% | 1.18% | 2.88% |
| Class C (incl. contingent deferred sales charge) | (14.30)% | 1.44% | 2.91% |
| Class I | (12.56)% | 2.45% | 3.95% |
| Class Z | (12.56)% | 2.45% | 3.95% |
A From November 1, 2011
Class C shares' contingent deferred sales charges included in the past one year, past five years, and life of fund total return figures are 1%, 0%, and 0%, respectively.
The initial offering of Class Z shares took place on October 2, 2018. Returns prior to October 2, 2018, are those of Class I.
$10,000 Over Life of Fund
Let's say hypothetically that $10,000 was invested in Fidelity Advisor® Total Emerging Markets Fund - Class A on November 1, 2011, when the fund started, and the current 5.75% sales charge was paid.
The chart shows how the value of your investment would have changed, and also shows how the MSCI Emerging Markets Index performed over the same period.
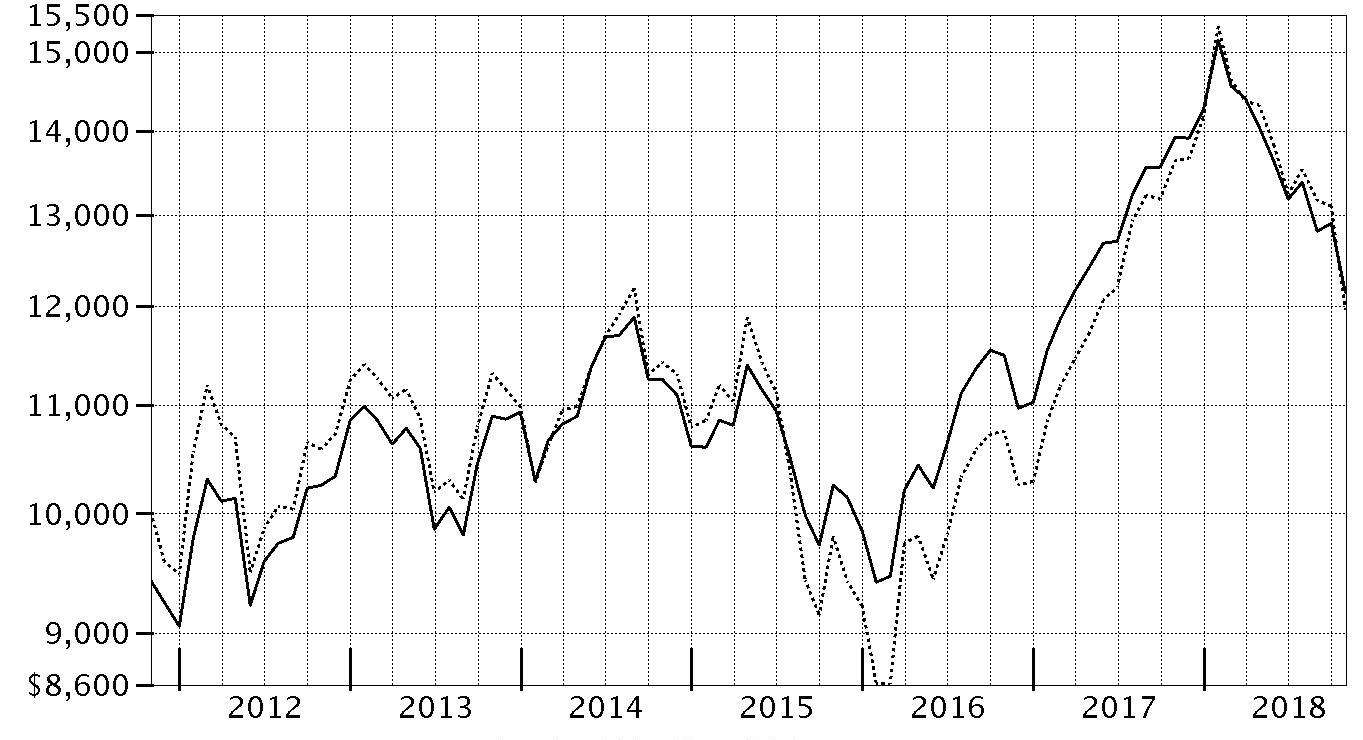
| Period Ending Values |
| $12,143 | Fidelity Advisor® Total Emerging Markets Fund - Class A |
| $11,958 | MSCI Emerging Markets Index |
Management's Discussion of Fund Performance
Market Recap: For the 12 months ending October 31, 2018, the Fidelity Total Emerging Markets Composite IndexSM – consisting of 60% equities and 40% debt – returned -9.50%. Separately, emerging-markets (EM) equities returned -12.19%, as measured by the MSCI Emerging Markets Index, while EM debt returned -5.27%, according to the J.P. Morgan Emerging Markets Bond Index Global. Early in the period, both asset classes generally benefited from synchronous expansion in global economic activity, which sustained investors' appetite for risk assets. The U.S. Federal Reserve continued its methodical pace, while central banks in Europe and Japan remained accommodative. However, sentiment shifted sharply in February, amid fear that interest rates could rise faster than expected, as well as heightened uncertainty related to the path of the Fed, increased tension about global trade – especially between the U.S. and China – and an economic slowdown in China. This downtrend continued through September and worsened considerably in October, especially for equities. Among individual countries in the EM equities index, Turkey (-43%) declined most, followed by South Korea (-20%) and China (-17%). Russia was a notable standout (+12%). Looking at debt, Venezuela (-38%) continued to grapple with a deep economic crisis, whereas Thailand gained about 5% and Russia rose 4%.
Comments from Lead Portfolio Manager John Carlson: For the fiscal year, the fund’s share classes (excluding sales charges, if applicable) returned about -13%, lagging the -9.50% result of the Fidelity Total Emerging Markets Composite Index℠. Versus the Composite index, our decision to overweight EM equities and underweight EM debt hurt, as stocks underperformed debt the past 12 months. Security selection within the EM equities subportfolio was the primary relative detractor, as our investments trailed the EM equities index. Here, a sizable position in online publishing and e-book company China Literature, which we established this period, was by far the fund’s biggest individual detractor. The stock fell amid fresh U.S. tariffs and the corresponding depreciation of the Chinese yuan versus the dollar. In August, China Literature reported a decline in user numbers. It also hurt to overweight Chinese software firm Kingsoft. Conversely, the biggest contributor versus the Composite index was security selection within the EM debt subportfolio, led by our choices in Lebanon and Ukraine, with an overweighting in the latter market also helping.
The views expressed above reflect those of the portfolio manager(s) only through the end of the period as stated on the cover of this report and do not necessarily represent the views of Fidelity or any other person in the Fidelity organization. Any such views are subject to change at any time based upon market or other conditions and Fidelity disclaims any responsibility to update such views. These views may not be relied on as investment advice and, because investment decisions for a Fidelity fund are based on numerous factors, may not be relied on as an indication of trading intent on behalf of any Fidelity fund.
Notes to shareholders: On June 30, 2018, Jane Wu assumed portfolio management responsibilities for the fund's health care sleeve, replacing Tim Gannon. On December 1, 2018, Xiaoting Zhao assumed portfolio management responsibilities for the fund's telecommunication services subportfolio, succeeding James Hayes.
Investment Summary (Unaudited)
Top Five Stocks as of October 31, 2018
| | % of fund's net assets |
| Tencent Holdings Ltd. (Cayman Islands, Interactive Media & Services) | 2.9 |
| Alibaba Group Holding Ltd. sponsored ADR (Cayman Islands, Internet & Direct Marketing Retail) | 2.5 |
| Taiwan Semiconductor Manufacturing Co. Ltd. (Taiwan, Semiconductors & Semiconductor Equipment) | 2.3 |
| Industrial & Commercial Bank of China Ltd. (H Shares) (China, Banks) | 1.7 |
| Sberbank of Russia (Russia, Banks) | 1.4 |
| | 10.8 |
Top Five Market Sectors as of October 31, 2018
| | % of fund's net assets |
| Financials | 17.1 |
| Consumer Discretionary | 9.2 |
| Energy | 8.9 |
| Communication Services | 8.7 |
| Information Technology | 5.4 |
Top Five Countries as of October 31, 2018
| (excluding cash equivalents) | % of fund's net assets |
| Cayman Islands | 10.8 |
| Korea (South) | 7.8 |
| India | 5.9 |
| Brazil | 5.9 |
| China | 5.7 |
Percentages are adjusted for the effect of futures contracts, if applicable.
Asset Allocation (% of fund's net assets)
| As of October 31, 2018 |
| | Stocks | 59.4% |
| | Bonds | 38.3% |
| | Short-Term Investments and Net Other Assets (Liabilities) | 2.3% |

Schedule of Investments October 31, 2018
Showing Percentage of Net Assets
| Common Stocks - 55.0% | | | |
| | | Shares | Value |
| Argentina - 0.2% | | | |
| Central Puerto SA sponsored ADR | | 32,760 | $313,841 |
| Grupo Financiero Galicia SA sponsored ADR | | 11,100 | 255,966 |
| Inversiones y Representaciones SA ADR | | 6,200 | 82,894 |
| Telecom Argentina SA Class B sponsored ADR | | 17,830 | 322,901 |
|
| TOTAL ARGENTINA | | | 975,602 |
|
| Australia - 0.0% | | | |
| Frontier Digital Ventures Ltd. (a) | | 458,043 | 176,778 |
| Bermuda - 0.6% | | | |
| AGTech Holdings Ltd. (a) | | 1,692,000 | 87,384 |
| Credicorp Ltd. (United States) | | 8,300 | 1,873,393 |
| GP Investments Ltd. Class A (depositary receipt) (a) | | 22,922 | 31,043 |
| Pacific Basin Shipping Ltd. | | 2,479,000 | 540,566 |
| Shangri-La Asia Ltd. | | 814,000 | 1,110,668 |
|
| TOTAL BERMUDA | | | 3,643,054 |
|
| Brazil - 2.6% | | | |
| Azul SA sponsored ADR (a) | | 50,100 | 1,221,438 |
| B2W Companhia Global do Varejo (a) | | 201,017 | 1,863,519 |
| Banco do Brasil SA | | 206,100 | 2,367,533 |
| BR Malls Participacoes SA | | 214,100 | 730,638 |
| BTG Pactual Participations Ltd. unit | | 147,300 | 782,513 |
| Companhia de Saneamento de Minas Gerais | | 79,736 | 1,099,142 |
| Direcional Engenharia SA | | 340,300 | 652,893 |
| Equatorial Energia SA | | 9,040 | 165,156 |
| Localiza Rent A Car SA | | 190,385 | 1,470,796 |
| Natura Cosmeticos SA | | 132,300 | 1,158,580 |
| Petrobras Distribuidora SA | | 193,300 | 1,245,555 |
| Vale SA sponsored ADR | | 200,068 | 3,021,027 |
|
| TOTAL BRAZIL | | | 15,778,790 |
|
| British Virgin Islands - 0.2% | | | |
| Despegar.com Corp. (a) | | 4,800 | 77,136 |
| Mail.Ru Group Ltd. GDR (Reg. S) (a) | | 41,800 | 1,113,552 |
|
| TOTAL BRITISH VIRGIN ISLANDS | | | 1,190,688 |
|
| Canada - 0.2% | | | |
| Pan American Silver Corp. | | 98,700 | 1,448,916 |
| Cayman Islands - 10.8% | | | |
| Airtac International Group | | 97,000 | 834,951 |
| Alibaba Group Holding Ltd. sponsored ADR (a) | | 108,600 | 15,451,608 |
| Ant International Co. Ltd. Class C (b)(c) | | 288,435 | 1,618,120 |
| BeiGene Ltd. ADR (a) | | 2,930 | 369,004 |
| BizLink Holding, Inc. | | 32,587 | 173,668 |
| Chailease Holding Co. Ltd. | | 311,268 | 886,738 |
| China Biologic Products Holdings, Inc. (a) | | 11,191 | 743,530 |
| China Literature Ltd. (a)(d) | | 675,639 | 3,648,750 |
| China Resources Land Ltd. | | 218,920 | 742,580 |
| E-House China Enterprise Holdings Ltd. (a) | | 47,100 | 82,645 |
| ENN Energy Holdings Ltd. | | 81,494 | 692,631 |
| Haitian International Holdings Ltd. | | 423,000 | 825,292 |
| JD.com, Inc. sponsored ADR (a) | | 228,400 | 5,371,968 |
| Kingsoft Corp. Ltd. | | 2,571,000 | 3,639,159 |
| LexinFintech Holdings Ltd. ADR | | 24,300 | 237,654 |
| Meituan Dianping Class B | | 232,600 | 1,503,812 |
| Momo, Inc. ADR (a) | | 48,900 | 1,641,573 |
| NetEase, Inc. ADR | | 17,700 | 3,678,945 |
| PPDAI Group, Inc. ADR (a) | | 42,200 | 240,962 |
| Shenzhou International Group Holdings Ltd. | | 222,000 | 2,451,584 |
| Shimao Property Holdings Ltd. | | 176,200 | 344,673 |
| TAL Education Group ADR (a) | | 12,300 | 356,454 |
| Tencent Holdings Ltd. | | 521,750 | 17,874,771 |
| Uni-President China Holdings Ltd. | | 1,954,600 | 1,896,787 |
| Wise Talent Information Technology Co. Ltd. (a) | | 163,868 | 535,991 |
| Zai Lab Ltd. ADR (a) | | 22,400 | 366,464 |
|
| TOTAL CAYMAN ISLANDS | | | 66,210,314 |
|
| Chile - 0.3% | | | |
| Compania Cervecerias Unidas SA sponsored ADR | | 22,000 | 551,540 |
| Vina Concha y Toro SA | | 567,835 | 1,068,762 |
|
| TOTAL CHILE | | | 1,620,302 |
|
| China - 5.7% | | | |
| BBMG Corp. (H Shares) | | 2,506,000 | 690,257 |
| China International Travel Service Corp. Ltd. (A Shares) | | 230,500 | 1,773,776 |
| China Life Insurance Co. Ltd. (H Shares) | | 1,132,834 | 2,269,971 |
| China Longyuan Power Grid Corp. Ltd. (H Shares) | | 2,283,060 | 1,735,160 |
| China Oilfield Services Ltd. (H Shares) | | 1,492,000 | 1,398,402 |
| China Pacific Insurance (Group) Co. Ltd. (H Shares) | | 385,106 | 1,433,967 |
| China Petroleum & Chemical Corp. (H Shares) | | 3,478,000 | 2,833,096 |
| China Telecom Corp. Ltd. (H Shares) | | 2,028,549 | 957,113 |
| China Tower Corp. Ltd. Class H | | 2,098,000 | 318,367 |
| Hangzhou Tigermed Consulting Co. Ltd. Class A | | 128,000 | 781,874 |
| Industrial & Commercial Bank of China Ltd. (H Shares) | | 15,483,160 | 10,504,907 |
| PICC Property & Casualty Co. Ltd. (H Shares) | | 1,097,870 | 1,063,997 |
| Ping An Insurance (Group) Co. of China Ltd. (H Shares) | | 426,300 | 4,014,595 |
| Qingdao Haier Co. Ltd. | | 495,251 | 898,823 |
| Shanghai International Airport Co. Ltd. (A Shares) | | 169,982 | 1,207,430 |
| Sinopec Engineering Group Co. Ltd. (H Shares) | | 710,500 | 660,492 |
| Sinopharm Group Co. Ltd. (H Shares) | | 197,607 | 952,511 |
| Tonghua Dongbao Pharmaceutical Co. Ltd. Class A | | 175,372 | 336,381 |
| Tsingtao Brewery Co. Ltd. (H Shares) | | 266,000 | 1,049,828 |
| Zhengzhou Yutong Bus Co. Ltd. | | 211,690 | 323,499 |
|
| TOTAL CHINA | | | 35,204,446 |
|
| Egypt - 0.0% | | | |
| Six of October Development & Investment Co. (a) | | 87,200 | 72,504 |
| Greece - 0.3% | | | |
| Titan Cement Co. SA (Reg.) | | 90,100 | 1,983,886 |
| Hong Kong - 2.0% | | | |
| AIA Group Ltd. | | 64,000 | 484,369 |
| China Everbright International Ltd. | | 644,000 | 513,265 |
| China Overseas Land and Investment Ltd. | | 760,460 | 2,380,695 |
| China Resources Beer Holdings Co. Ltd. | | 542,666 | 1,885,711 |
| China Resources Power Holdings Co. Ltd. | | 333,829 | 586,610 |
| China Unicom Ltd. | | 612,300 | 640,435 |
| China Unicom Ltd. sponsored ADR | | 116,520 | 1,215,304 |
| CNOOC Ltd. | | 1,941,000 | 3,305,484 |
| Far East Horizon Ltd. | | 1,297,780 | 1,257,739 |
|
| TOTAL HONG KONG | | | 12,269,612 |
|
| India - 5.9% | | | |
| Adani Ports & Special Economic Zone Ltd. | | 308,703 | 1,330,854 |
| Axis Bank Ltd. (a) | | 292,279 | 2,301,559 |
| Bharti Airtel Ltd. | | 91,812 | 362,916 |
| Bharti Infratel Ltd. | | 70,090 | 255,161 |
| Federal Bank Ltd. | | 913,406 | 1,021,963 |
| Future Retail Ltd. | | 43,774 | 289,509 |
| GAIL India Ltd. | | 32,340 | 163,646 |
| ICICI Bank Ltd. | | 277,392 | 1,330,192 |
| ICICI Bank Ltd. sponsored ADR | | 519,740 | 4,932,333 |
| IndoStar Capital Finance Ltd. | | 71,213 | 290,446 |
| Indraprastha Gas Ltd. | | 283,793 | 1,025,661 |
| ITC Ltd. | | 609,513 | 2,308,337 |
| JK Cement Ltd. (a) | | 71,774 | 652,769 |
| Larsen & Toubro Ltd. | | 101,269 | 1,776,589 |
| LIC Housing Finance Ltd. | | 434,590 | 2,415,629 |
| Lupin Ltd. (a) | | 108,444 | 1,298,293 |
| Manappuram General Finance & Leasing Ltd. | | 757,540 | 818,381 |
| NTPC Ltd. | | 135,420 | 292,318 |
| Oberoi Realty Ltd. | | 130,303 | 745,860 |
| Petronet LNG Ltd. | | 247,706 | 755,912 |
| Phoenix Mills Ltd. | | 106,792 | 799,063 |
| Power Grid Corp. of India Ltd. | | 410,102 | 1,031,077 |
| Reliance Industries Ltd. | | 393,278 | 5,643,135 |
| SREI Infrastructure Finance Ltd. | | 116,223 | 51,936 |
| State Bank of India (a) | | 408,575 | 1,554,530 |
| Sun Pharmaceutical Industries Ltd. | | 208,335 | 1,634,483 |
| Tejas Networks Ltd. (a)(d) | | 27,156 | 93,115 |
| Torrent Pharmaceuticals Ltd. | | 52,269 | 1,178,526 |
|
| TOTAL INDIA | | | 36,354,193 |
|
| Indonesia - 1.4% | | | |
| PT Astra International Tbk | | 3,753,800 | 1,950,667 |
| PT Bank Mandiri (Persero) Tbk | | 3,631,400 | 1,631,667 |
| PT Bank Rakyat Indonesia Tbk | | 14,397,800 | 2,983,264 |
| PT Media Nusantara Citra Tbk | | 14,502,700 | 744,095 |
| PT Semen Gresik (Persero) Tbk | | 448,800 | 265,693 |
| PT Telekomunikasi Indonesia Tbk: | | | |
| Series B | | 3,830,400 | 970,333 |
| sponsored ADR | | 11,160 | 281,232 |
|
| TOTAL INDONESIA | | | 8,826,951 |
|
| Israel - 0.2% | | | |
| Bezeq The Israel Telecommunication Corp. Ltd. | | 858,017 | 986,759 |
| Italy - 0.3% | | | |
| Prada SpA | | 451,200 | 1,593,767 |
| Japan - 0.3% | | | |
| GMO Internet, Inc. | | 5,662 | 80,889 |
| LINE Corp. (a) | | 14,800 | 471,852 |
| Panasonic Corp. | | 45,300 | 486,135 |
| SoftBank Corp. | | 4,882 | 386,356 |
| Yume No Machi Souzou Iinkai Co. Ltd. | | 6,400 | 133,292 |
|
| TOTAL JAPAN | | | 1,558,524 |
|
| Korea (South) - 6.7% | | | |
| AMOREPACIFIC Group, Inc. | | 24,949 | 1,357,873 |
| BS Financial Group, Inc. | | 412,942 | 2,746,915 |
| Cafe24 Corp. (a) | | 1,900 | 184,005 |
| Daou Technology, Inc. | | 59,822 | 1,048,589 |
| Hanon Systems | | 94,781 | 909,599 |
| Hyundai Fire & Marine Insurance Co. Ltd. | | 26,335 | 964,770 |
| Hyundai Mobis | | 26,944 | 4,486,731 |
| Iljin Materials Co. Ltd. | | 13,081 | 521,062 |
| KB Financial Group, Inc. | | 96,868 | 4,028,866 |
| KEPCO Plant Service & Engineering Co. Ltd. | | 6,624 | 159,649 |
| Korea Electric Power Corp. | | 13,402 | 319,720 |
| LG Chemical Ltd. | | 8,180 | 2,487,695 |
| LG Corp. | | 24,712 | 1,435,938 |
| NAVER Corp. | | 6,991 | 701,551 |
| NCSOFT Corp. | | 3,450 | 1,298,663 |
| POSCO | | 9,002 | 2,057,876 |
| S-Oil Corp. | | 11,580 | 1,258,475 |
| Samsung Biologics Co. Ltd. (a)(d) | | 3,319 | 1,127,180 |
| Samsung Electronics Co. Ltd. | | 121,238 | 4,505,251 |
| Samsung Life Insurance Co. Ltd. | | 12,955 | 1,044,575 |
| Samsung SDI Co. Ltd. | | 13,347 | 2,754,793 |
| Shinhan Financial Group Co. Ltd. | | 93,663 | 3,484,123 |
| SK Hynix, Inc. | | 28,802 | 1,721,557 |
| SK Telecom Co. Ltd. | | 1,840 | 431,778 |
| SK Telecom Co. Ltd. sponsored ADR | | 15,560 | 403,160 |
|
| TOTAL KOREA (SOUTH) | | | 41,440,394 |
|
| Luxembourg - 0.4% | | | |
| Samsonite International SA | | 931,500 | 2,672,645 |
| Malaysia - 0.0% | | | |
| British American Tobacco (Malaysia) Bhd | | 30,200 | 224,452 |
| Mauritius - 0.0% | | | |
| MakeMyTrip Ltd. (a) | | 12,600 | 312,354 |
| Mexico - 1.7% | | | |
| America Movil S.A.B. de CV Series L sponsored ADR | | 111,900 | 1,610,241 |
| Fibra Uno Administracion SA de CV | | 788,400 | 847,268 |
| Gruma S.A.B. de CV Series B | | 161,800 | 1,688,632 |
| Grupo Aeroportuario del Pacifico S.A.B. de CV Series B | | 103,800 | 858,730 |
| Grupo Financiero Banorte S.A.B. de CV Series O | | 366,929 | 2,018,780 |
| Macquarie Mexican (REIT) (d) | | 1,029,848 | 1,002,813 |
| Wal-Mart de Mexico SA de CV Series V | | 908,300 | 2,319,796 |
|
| TOTAL MEXICO | | | 10,346,260 |
|
| Netherlands - 0.4% | | | |
| VEON Ltd. sponsored ADR | | 234,960 | 660,238 |
| Yandex NV Series A (a) | | 56,739 | 1,709,546 |
|
| TOTAL NETHERLANDS | | | 2,369,784 |
|
| Nigeria - 0.4% | | | |
| Guaranty Trust Bank PLC | | 3,055,783 | 315,680 |
| Guaranty Trust Bank PLC GDR (Reg. S) | | 124,480 | 634,848 |
| Transnational Corp. of Nigeria PLC | | 41,804,033 | 152,015 |
| Zenith Bank PLC | | 16,686,236 | 1,080,238 |
|
| TOTAL NIGERIA | | | 2,182,781 |
|
| Pakistan - 0.1% | | | |
| Habib Bank Ltd. | | 440,000 | 484,125 |
| Panama - 0.2% | | | |
| Copa Holdings SA Class A | | 14,549 | 1,053,784 |
| Peru - 0.4% | | | |
| Compania de Minas Buenaventura SA sponsored ADR | | 196,200 | 2,715,408 |
| Philippines - 0.5% | | | |
| Metro Pacific Investments Corp. | | 7,261,700 | 652,285 |
| Metropolitan Bank & Trust Co. | | 1,282,492 | 1,573,205 |
| Robinsons Land Corp. | | 1,860,460 | 729,394 |
|
| TOTAL PHILIPPINES | | | 2,954,884 |
|
| Russia - 3.3% | | | |
| Lukoil PJSC sponsored ADR | | 56,600 | 4,228,020 |
| MMC Norilsk Nickel PJSC sponsored ADR | | 116,100 | 1,924,938 |
| Mobile TeleSystems OJSC | | 120,712 | 473,449 |
| Mobile TeleSystems OJSC sponsored ADR | | 59,440 | 476,114 |
| NOVATEK OAO GDR (Reg. S) | | 15,000 | 2,542,500 |
| RusHydro PJSC | | 20 | 0 |
| Sberbank of Russia | | 1,264,400 | 3,634,247 |
| Sberbank of Russia sponsored ADR | | 394,584 | 4,656,091 |
| Tatneft PAO | | 114,500 | 1,363,423 |
| Unipro PJSC | | 20,732,700 | 852,299 |
|
| TOTAL RUSSIA | | | 20,151,081 |
|
| Singapore - 0.2% | | | |
| Ascendas Real Estate Investment Trust | | 179,000 | 325,654 |
| First Resources Ltd. | | 768,900 | 877,062 |
|
| TOTAL SINGAPORE | | | 1,202,716 |
|
| South Africa - 3.2% | | | |
| Barclays Africa Group Ltd. | | 308,050 | 3,113,597 |
| Bidvest Group Ltd. | | 101,156 | 1,260,087 |
| FirstRand Ltd. | | 422,800 | 1,843,096 |
| Impala Platinum Holdings Ltd. (a) | | 13,200 | 24,338 |
| Imperial Holdings Ltd. | | 159,964 | 1,766,462 |
| Mondi Ltd. | | 7,000 | 167,440 |
| Mr Price Group Ltd. | | 61,800 | 967,561 |
| MTN Group Ltd. | | 88,800 | 514,652 |
| Naspers Ltd. Class N | | 46,000 | 8,084,276 |
| Sasol Ltd. | | 55,300 | 1,807,202 |
|
| TOTAL SOUTH AFRICA | | | 19,548,711 |
|
| Taiwan - 3.5% | | | |
| Chroma ATE, Inc. | | 97,000 | 339,933 |
| King's Town Bank | | 962,600 | 918,746 |
| LandMark Optoelectronics Corp. | | 61,000 | 404,887 |
| Largan Precision Co. Ltd. | | 10,403 | 1,125,629 |
| Nanya Technology Corp. | | 222,000 | 368,560 |
| PChome Online, Inc. (a) | | 41,032 | 186,868 |
| Taiwan Semiconductor Manufacturing Co. Ltd. | | 1,587,000 | 11,907,481 |
| Taiwan Semiconductor Manufacturing Co. Ltd. sponsored ADR | | 52,342 | 1,994,230 |
| Unified-President Enterprises Corp. | | 1,555,000 | 3,761,874 |
| United Microelectronics Corp. | | 1,512,000 | 575,870 |
|
| TOTAL TAIWAN | | | 21,584,078 |
|
| Thailand - 0.9% | | | |
| PTT Global Chemical PCL (For. Reg.) | | 841,600 | 1,960,603 |
| Siam Cement PCL (For. Reg.) | | 194,900 | 2,456,821 |
| Total Access Communication PCL (For. Reg.) | | 595,300 | 852,737 |
|
| TOTAL THAILAND | | | 5,270,161 |
|
| Turkey - 0.5% | | | |
| Aselsan A/S | | 171,500 | 775,027 |
| Tupras Turkiye Petrol Rafinerileri A/S | | 75,800 | 1,785,970 |
| Turkcell Iletisim Hizmet A/S | | 102,126 | 207,373 |
| Turkcell Iletisim Hizmet A/S sponsored ADR | | 48,900 | 252,324 |
|
| TOTAL TURKEY | | | 3,020,694 |
|
| United Arab Emirates - 0.7% | | | |
| DP World Ltd. | | 65,059 | 1,170,411 |
| Emaar Properties PJSC | | 1,273,564 | 1,768,285 |
| National Bank of Abu Dhabi PJSC | | 380,780 | 1,432,661 |
|
| TOTAL UNITED ARAB EMIRATES | | | 4,371,357 |
|
| United Kingdom - 0.5% | | | |
| Contemporary Amperex Technology Co. Ltd. ELS (UBS Bank Warrant Program) Class A warrants 6/24/19 (a)(d) | | 51,208 | 546,902 |
| Fresnillo PLC | | 95,000 | 1,030,446 |
| NMC Health PLC | | 26,586 | 1,200,252 |
| Tonghua Dongbao Pharmaceutical Co. Ltd. ELS (UBS Bank Warrant Program) Class A warrants 3/26/19 (a) | | 204,673 | 392,583 |
|
| TOTAL UNITED KINGDOM | | | 3,170,183 |
|
| United States of America - 0.3% | | | |
| Arco Platform Ltd. Class A | | 50 | 1,066 |
| MercadoLibre, Inc. | | 4,801 | 1,557,925 |
| Uxin Ltd. ADR (a) | | 43,700 | 237,728 |
|
| TOTAL UNITED STATES OF AMERICA | | | 1,796,719 |
|
| Vietnam - 0.1% | | | |
| Vietnam Technological & Commercial Joint Stock Bank (a) | | 500,000 | 576,128 |
| TOTAL COMMON STOCKS | | | |
| (Cost $343,907,741) | | | 337,343,785 |
|
| Nonconvertible Preferred Stocks - 4.4% | | | |
| Brazil - 3.3% | | | |
| Ambev SA sponsored ADR | | 347,800 | 1,505,974 |
| Banco do Estado Rio Grande do Sul SA | | 162,820 | 868,898 |
| Companhia Paranaense de Energia-Copel: | | | |
| (PN-B) | | 3,915 | 27,594 |
| (PN-B) sponsored ADR | | 169,752 | 1,189,962 |
| Fibria Celulose SA sponsored ADR | | 128,200 | 2,462,722 |
| Itau Unibanco Holding SA sponsored ADR | | 529,791 | 6,977,347 |
| Metalurgica Gerdau SA (PN) | | 677,470 | 1,445,415 |
| Petroleo Brasileiro SA - Petrobras (PN) sponsored ADR (non-vtg.) | | 307,306 | 4,554,275 |
| Telefonica Brasil SA | | 63,263 | 734,711 |
| TIM Participacoes SA sponsored ADR | | 25,100 | 388,297 |
|
| TOTAL BRAZIL | | | 20,155,195 |
|
| Korea (South) - 1.1% | | | |
| Hyundai Motor Co. Series 2 | | 48,417 | 3,004,315 |
| Samsung Electronics Co. Ltd. | | 74,628 | 2,338,257 |
| Samsung Fire & Marine Insurance Co. Ltd. | | 7,728 | 1,205,595 |
|
| TOTAL KOREA (SOUTH) | | | 6,548,167 |
|
| TOTAL NONCONVERTIBLE PREFERRED STOCKS | | | |
| (Cost $22,858,754) | | | 26,703,362 |
| | | Principal Amount(e) | Value |
|
| Nonconvertible Bonds - 8.1% | | | |
| Azerbaijan - 1.0% | | | |
| Southern Gas Corridor CJSC 6.875% 3/24/26 (d) | | 2,830,000 | 3,035,679 |
| State Oil Co. of Azerbaijan Republic 6.95% 3/18/30 (Reg. S) | | 3,225,000 | 3,419,996 |
|
| TOTAL AZERBAIJAN | | | 6,455,675 |
|
| Bahrain - 0.4% | | | |
| The Oil and Gas Holding Co.: | | | |
| 7.5% 10/25/27 (d) | | 2,155,000 | 2,084,549 |
| 7.625% 11/7/24 (d) | | 200,000 | 200,000 |
| 8.375% 11/7/28 (d) | | 225,000 | 225,000 |
|
| TOTAL BAHRAIN | | | 2,509,549 |
|
| Georgia - 1.2% | | | |
| Georgian Oil & Gas Corp. 6.75% 4/26/21 (d) | | 3,475,000 | 3,535,590 |
| JSC Georgian Railway 7.75% 7/11/22 (d) | | 3,500,000 | 3,694,600 |
|
| TOTAL GEORGIA | | | 7,230,190 |
|
| Mexico - 1.5% | | | |
| Mexico City Airport Trust 4.25% 10/31/26 (d) | | 550,000 | 459,525 |
| Pemex Project Funding Master Trust 6.625% 6/15/35 | | 4,875,000 | 4,460,625 |
| Petroleos Mexicanos 6.5% 6/2/41 | | 5,050,000 | 4,324,315 |
|
| TOTAL MEXICO | | | 9,244,465 |
|
| Mongolia - 0.1% | | | |
| Development Bank of Mongolia 7.25% 10/23/23 (d) | | 230,000 | 224,538 |
| Trade and Development Bank of Mongolia LLC 9.375% 5/19/20 (Reg. S) | | 550,000 | 576,446 |
|
| TOTAL MONGOLIA | | | 800,984 |
|
| Oman - 0.3% | | | |
| Oman Sovereign Sukuk SAOC 4.397% 6/1/24 (d) | | 2,400,000 | 2,260,517 |
| South Africa - 1.0% | | | |
| Eskom Holdings SOC Ltd.: | | | |
| 5.75% 1/26/21 (Reg. S) | | 2,700,000 | 2,585,250 |
| 6.75% 8/6/23 (d) | | 3,725,000 | 3,482,875 |
|
| TOTAL SOUTH AFRICA | | | 6,068,125 |
|
| Turkey - 0.2% | | | |
| Export Credit Bank of Turkey 5% 9/23/21 (d) | | 400,000 | 368,525 |
| Turkiye Ihracat Kredi Bankasi A/S 6.125% 5/3/24 (d) | | 805,000 | 720,475 |
|
| TOTAL TURKEY | | | 1,089,000 |
|
| United Arab Emirates - 0.4% | | | |
| Abu Dhabi Crude Oil Pipeline 4.6% 11/2/47 (d) | | 2,395,000 | 2,264,329 |
| United Kingdom - 1.7% | | | |
| Biz Finance PLC 9.625% 4/27/22 (d) | | 10,200,000 | 10,292,392 |
| Venezuela - 0.3% | | | |
| Petroleos de Venezuela SA: | | | |
| 6% 5/16/24 (d)(f) | | 4,700,000 | 806,050 |
| 6% 11/15/26 (Reg. S) (f) | | 5,500,000 | 948,750 |
|
| TOTAL VENEZUELA | | | 1,754,800 |
|
| TOTAL NONCONVERTIBLE BONDS | | | |
| (Cost $53,539,230) | | | 49,970,026 |
|
| Government Obligations - 30.2% | | | |
| Argentina - 3.6% | | | |
| Argentine Republic: | | | |
| 5.875% 1/11/28 | | 4,980,000 | 3,834,600 |
| 6.875% 4/22/21 | | 4,925,000 | 4,710,763 |
| 7.125% 7/6/36 | | 5,800,000 | 4,410,958 |
| 7.5% 4/22/26 | | 10,760,000 | 9,388,100 |
|
| TOTAL ARGENTINA | | | 22,344,421 |
|
| Armenia - 0.2% | | | |
| Republic of Armenia 7.15% 3/26/25 (d) | | 920,000 | 958,364 |
| Cameroon - 0.7% | | | |
| Cameroon Republic 9.5% 11/19/25 (d) | | 4,350,000 | 4,527,819 |
| Ecuador - 0.6% | | | |
| Ecuador Republic: | | | |
| 7.875% 1/23/28 (d) | | 600,000 | 501,420 |
| 7.95% 6/20/24 (d) | | 770,000 | 688,765 |
| 8.75% 6/2/23 (d) | | 950,000 | 907,250 |
| 8.875% 10/23/27 (d) | | 710,000 | 624,090 |
| 9.625% 6/2/27 (d) | | 200,000 | 183,750 |
| 9.65% 12/13/26 (d) | | 650,000 | 604,500 |
|
| TOTAL ECUADOR | | | 3,509,775 |
|
| Egypt - 2.5% | | | |
| Arab Republic of Egypt: | | | |
| , yield at date of purchase 0% 4/23/19 (c) | EGP | 34,000,000 | 1,733,564 |
| , yield at date of purchase 18.6494% 12/18/18 | EGP | 10,750,000 | 573,563 |
| 5.577% 2/21/23 (d) | | 1,345,000 | 1,283,641 |
| 6.125% 1/31/22 (d) | | 1,575,000 | 1,554,714 |
| 7.5% 1/31/27 (d) | | 2,600,000 | 2,542,332 |
| 7.903% 2/21/48 (d) | | 2,325,000 | 2,079,322 |
| 8.5% 1/31/47 (d) | | 5,575,000 | 5,260,849 |
|
| TOTAL EGYPT | | | 15,027,985 |
|
| El Salvador - 2.0% | | | |
| El Salvador Republic: | | | |
| 6.375% 1/18/27 (d) | | 1,550,000 | 1,385,313 |
| 7.375% 12/1/19 | | 1,375,000 | 1,372,938 |
| 7.625% 2/1/41 (d) | | 2,050,000 | 1,859,596 |
| 7.65% 6/15/35 (Reg. S) | | 3,000,000 | 2,748,750 |
| 8.625% 2/28/29 (d) | | 4,910,000 | 4,995,925 |
|
| TOTAL EL SALVADOR | | | 12,362,522 |
|
| Ethiopia - 0.5% | | | |
| Federal Democratic Republic of Ethiopia 6.625% 12/11/24 (d) | | 3,115,000 | 3,022,422 |
| Gabon - 0.1% | | | |
| Gabonese Republic 6.375% 12/12/24 (d) | | 1,000,000 | 908,540 |
| Ghana - 0.8% | | | |
| Ghana Republic: | | | |
| 7.875% 8/7/23 (Reg.S) | | 750,000 | 764,123 |
| 8.125% 1/18/26 (d) | | 1,375,000 | 1,381,399 |
| 8.627% 6/16/49 (d) | | 2,170,000 | 2,035,573 |
| 10.75% 10/14/30 (d) | | 825,000 | 988,994 |
|
| TOTAL GHANA | | | 5,170,089 |
|
| Iraq - 0.8% | | | |
| Republic of Iraq 5.8% 1/15/28 (Reg. S) | | 5,650,000 | 5,175,332 |
| Ivory Coast - 0.4% | | | |
| Ivory Coast 5.75% 12/31/32 | | 2,405,000 | 2,177,160 |
| Jordan - 1.3% | | | |
| Jordanian Kingdom: | | | |
| 6.125% 1/29/26 (d) | | 4,200,000 | 4,016,880 |
| 7.375% 10/10/47 (d) | | 4,310,000 | 3,901,240 |
|
| TOTAL JORDAN | | | 7,918,120 |
|
| Lebanon - 4.5% | | | |
| Lebanese Republic: | | | |
| 5.45% 11/28/19 | | 7,050,000 | 6,792,957 |
| 6% 5/20/19 | | 7,535,000 | 7,425,471 |
| 6.1% 10/4/22 | | 4,535,000 | 3,952,797 |
| 6.375% 3/9/20 | | 7,375,000 | 7,093,983 |
| 6.65% 11/3/28(Reg. S) | | 1,500,000 | 1,184,502 |
| 8.25% 4/12/21 (Reg.S) | | 1,445,000 | 1,382,923 |
|
| TOTAL LEBANON | | | 27,832,633 |
|
| Nigeria - 0.5% | | | |
| Republic of Nigeria, yield at date of purchase 0% 12/6/18 (c) | NGN | 1,225,000,000 | 3,331,706 |
| Oman - 0.9% | | | |
| Sultanate of Oman: | | | |
| 6.5% 3/8/47 (d) | | 780,000 | 696,150 |
| 6.75% 1/17/48 (d) | | 4,950,000 | 4,516,875 |
|
| TOTAL OMAN | | | 5,213,025 |
|
| Qatar - 1.5% | | | |
| State of Qatar: | | | |
| 4.5% 4/23/28 (d) | | 2,705,000 | 2,759,100 |
| 5.103% 4/23/48 (d) | | 1,425,000 | 1,446,375 |
| 9.75% 6/15/30 (Reg. S) | | 3,280,000 | 4,852,957 |
|
| TOTAL QATAR | | | 9,058,432 |
|
| Rwanda - 0.6% | | | |
| Rwanda Republic 6.625% 5/2/23 (d) | | 3,475,000 | 3,495,329 |
| Suriname - 0.9% | | | |
| Republic of Suriname 9.25% 10/26/26 (d) | | 5,700,000 | 5,600,250 |
| TAJIKISTAN - 0.3% | | | |
| Tajikistan Republic 7.125% 9/14/27 (d) | | 2,175,000 | 1,936,838 |
| Turkey - 2.4% | | | |
| Turkish Republic: | | | |
| 5.125% 2/17/28 | | 795,000 | 670,781 |
| 5.75% 5/11/47 | | 2,300,000 | 1,742,250 |
| 6.875% 3/17/36 | | 2,275,000 | 2,022,589 |
| 7.25% 3/5/38 | | 950,000 | 873,620 |
| 7.375% 2/5/25 | | 1,050,000 | 1,040,714 |
| 8% 2/14/34 | | 905,000 | 898,949 |
| Turkiye Ihracat Kredi Bankasi A/S 5.375% 2/8/21 (d) | | 7,675,000 | 7,268,302 |
|
| TOTAL TURKEY | | | 14,517,205 |
|
| Ukraine - 1.1% | | | |
| Ukraine Government: | | | |
| 7.75% 9/1/20 (d) | | 2,300,000 | 2,288,500 |
| 7.75% 9/1/21 (d) | | 4,455,000 | 4,382,428 |
|
| TOTAL UKRAINE | | | 6,670,928 |
|
| United States of America - 3.5% | | | |
| U.S. Treasury Bonds 3% 8/15/48 | | 23,000,000 | 21,328,900 |
| Venezuela - 0.3% | | | |
| Venezuelan Republic 9.25% 9/15/27 (f) | | 7,500,000 | 1,893,750 |
| Zambia - 0.2% | | | |
| Republic of Zambia 8.97% 7/30/27 (d) | | 1,600,000 | 1,086,400 |
| TOTAL GOVERNMENT OBLIGATIONS | | | |
| (Cost $195,180,691) | | | 185,067,945 |
| | | Shares | Value |
|
| Money Market Funds - 1.9% | | | |
| Fidelity Cash Central Fund, 2.23% (g) | | | |
| (Cost $11,923,534) | | 11,921,364 | 11,923,749 |
| TOTAL INVESTMENT IN SECURITIES - 99.6% | | | |
| (Cost $627,409,950) | | | 611,008,867 |
| NET OTHER ASSETS (LIABILITIES) - 0.4% | | | 2,666,345 |
| NET ASSETS - 100% | | | $613,675,212 |
Currency Abbreviations
EGP – Egyptian pound
NGN – Nigerian naira
Security Type Abbreviations
ELS – Equity-Linked Security
Categorizations in the Schedule of Investments are based on country or territory of incorporation.
Legend
(a) Non-income producing
(b) Restricted securities - Investment in securities not registered under the Securities Act of 1933 (excluding 144A issues). At the end of the period, the value of restricted securities (excluding 144A issues) amounted to $1,618,120 or 0.3% of net assets.
(c) Level 3 security
(d) Security exempt from registration under Rule 144A of the Securities Act of 1933. These securities may be resold in transactions exempt from registration, normally to qualified institutional buyers. At the end of the period, the value of these securities amounted to $121,762,649 or 19.8% of net assets.
(e) Amount is stated in United States dollars unless otherwise noted.
(f) Non-income producing - Security is in default.
(g) Affiliated fund that is generally available only to investment companies and other accounts managed by Fidelity Investments. The rate quoted is the annualized seven-day yield of the fund at period end. A complete unaudited listing of the fund's holdings as of its most recent quarter end is available upon request. In addition, each Fidelity Central Fund's financial statements, which are not covered by the Fund's Report of Independent Registered Public Accounting Firm, are available on the SEC's website or upon request.
Additional information on each restricted holding is as follows:
| Security | Acquisition Date | Acquisition Cost |
| Ant International Co. Ltd. Class C | 5/16/18 | $1,618,120 |
Affiliated Central Funds
Information regarding fiscal year to date income earned by the Fund from investments in Fidelity Central Funds is as follows:
| Fund | Income earned |
| Fidelity Cash Central Fund | $482,817 |
| Fidelity Securities Lending Cash Central Fund | 14,284 |
| Total | $497,101 |
Amounts in the income column in the above table include any capital gain distributions from underlying funds, which are presented in the corresponding line-item in the Statement of Operations if applicable.
Investment Valuation
The following is a summary of the inputs used, as of October 31, 2018, involving the Fund's assets and liabilities carried at fair value. The inputs or methodology used for valuing securities may not be an indication of the risk associated with investing in those securities. For more information on valuation inputs, and their aggregation into the levels used below, please refer to the Investment Valuation section in the accompanying Notes to Financial Statements.
| | Valuation Inputs at Reporting Date: |
| Description | Total | Level 1 | Level 2 | Level 3 |
| Investments in Securities: | | | | |
| Equities: | | | | |
| Communication Services | $50,702,408 | $29,453,434 | $21,248,974 | $-- |
| Consumer Discretionary | 57,313,702 | 56,827,567 | 486,135 | -- |
| Consumer Staples | 21,655,208 | 21,655,208 | -- | -- |
| Energy | 29,668,692 | 23,530,112 | 6,138,580 | -- |
| Financials | 93,280,137 | 65,456,679 | 27,823,458 | -- |
| Health Care | 9,988,498 | 9,988,498 | -- | -- |
| Industrials | 17,592,466 | 17,592,466 | -- | -- |
| Information Technology | 33,322,666 | 20,839,315 | 12,483,351 | -- |
| Materials | 28,603,452 | 24,738,374 | 3,865,078 | -- |
| Real Estate | 12,273,086 | 10,654,966 | -- | 1,618,120 |
| Utilities | 9,646,832 | 9,327,112 | 319,720 | -- |
| Corporate Bonds | 49,970,026 | -- | 49,970,026 | -- |
| Government Obligations | 185,067,945 | -- | 180,002,675 | 5,065,270 |
| Money Market Funds | 11,923,749 | 11,923,749 | -- | -- |
| Total Investments in Securities: | $611,008,867 | $301,987,480 | $302,337,997 | $6,683,390 |
The following is a summary of transfers between Level 1 and Level 2 for the period ended October 31, 2018. Transfers are assumed to have occurred at the beginning of the period, and are primarily attributable to the valuation techniques used for foreign equity securities, as discussed in the accompanying Notes to Financial Statements:
| Transfers | Total |
| Level 1 to Level 2 | $12,616,876 |
| Level 2 to Level 1 | $30,780 |
The following is a reconciliation of Investments in Securities and Derivative Instruments for which Level 3 inputs were used in determining value:
| Investments in Securities | |
| Beginning Balance | $-- |
| Net Realized Gain (Loss) on Investment Securities | -- |
| Net Unrealized Gain (Loss) on Investment Securities | (20,073) |
| Cost of Purchases | 6,605,763 |
| Proceeds of Sales | -- |
| Amortization/Accretion | 97,700 |
| Transfers into Level 3 | -- |
| Transfers out of Level 3 | -- |
| Ending Balance | $6,683,390 |
| The change in unrealized gain (loss) for the period attributable to Level 3 securities held at October 31, 2018 | $(20,073) |
The information used in the above reconciliation represents fiscal year to date activity for any Investments in Securities identified as using Level 3 inputs at either the beginning or the end of the current fiscal period. Transfers in or out of Level 3 represent the beginning value of any Security or Instrument where a change in the pricing level occurred from the beginning to the end of the period. The cost of purchases and the proceeds of sales may include securities received or delivered through corporate actions or exchanges. Realized and unrealized gains (losses) disclosed in the reconciliation are included in Net Gain (Loss) on the Fund's Statement of Operations.
Other Information
The composition of credit quality ratings as a percentage of Total Net Assets is as follows (Unaudited):
| U.S. Government and U.S. Government Agency Obligations | 3.5% |
| AAA,AA,A | 1.9% |
| BBB | 2.7% |
| BB | 2.2% |
| B | 21.3% |
| CCC,CC,C | 3.1% |
| D | 0.3% |
| Not Rated | 3.3% |
| Equities | 59.4% |
| Short-Term Investments and Net Other Assets | 2.3% |
| | 100% |
We have used ratings from Moody's Investors Service, Inc. Where Moody's® ratings are not available, we have used S&P® ratings. All ratings are as of the date indicated and do not reflect subsequent changes.
See accompanying notes which are an integral part of the financial statements.
Financial Statements
Statement of Assets and Liabilities
| | | October 31, 2018 |
| Assets | | |
Investment in securities, at value �� See accompanying schedule:
Unaffiliated issuers (cost $615,486,416) | $599,085,118 | |
| Fidelity Central Funds (cost $11,923,534) | 11,923,749 | |
| Total Investment in Securities (cost $627,409,950) | | $611,008,867 |
| Foreign currency held at value (cost $267,647) | | 267,579 |
| Receivable for investments sold | | 11,499,064 |
| Receivable for fund shares sold | | 596,476 |
| Dividends receivable | | 313,277 |
| Interest receivable | | 3,713,299 |
| Distributions receivable from Fidelity Central Funds | | 20,848 |
| Prepaid expenses | | 1,583 |
| Receivable from investment adviser for expense reductions | | 6 |
| Other receivables | | 160,185 |
| Total assets | | 627,581,184 |
| Liabilities | | |
| Payable to custodian bank | $2,012,767 | |
| Payable for investments purchased | 8,479,700 | |
| Payable for fund shares redeemed | 2,502,338 | |
| Accrued management fee | 429,574 | |
| Distribution and service plan fees payable | 43,390 | |
| Other affiliated payables | 139,654 | |
| Other payables and accrued expenses | 298,549 | |
| Total liabilities | | 13,905,972 |
| Net Assets | | $613,675,212 |
| Net Assets consist of: | | |
| Paid in capital | | $650,415,262 |
| Total distributable earnings (loss) | | (36,740,050) |
| Net Assets | | $613,675,212 |
| Net Asset Value and Maximum Offering Price | | |
| Class A: | | |
| Net Asset Value and redemption price per share ($34,616,978 ÷ 3,002,951 shares) | | $11.53 |
| Maximum offering price per share (100/94.25 of $11.53) | | $12.23 |
| Class M: | | |
| Net Asset Value and redemption price per share ($8,519,165 ÷ 740,374 shares) | | $11.51 |
| Maximum offering price per share (100/96.50 of $11.51) | | $11.93 |
| Class C: | | |
| Net Asset Value and offering price per share ($37,191,297 ÷ 3,262,408 shares)(a) | | $11.40 |
| Total Emerging Markets: | | |
| Net Asset Value, offering price and redemption price per share ($190,024,761 ÷ 16,431,469 shares) | | $11.56 |
| Class I: | | |
| Net Asset Value, offering price and redemption price per share ($341,719,745 ÷ 29,588,536 shares) | | $11.55 |
| Class Z: | | |
| Net Asset Value, offering price and redemption price per share ($1,603,266 ÷ 138,847 shares) | | $11.55 |
(a) Redemption price per share is equal to net asset value less any applicable contingent deferred sales charge.
See accompanying notes which are an integral part of the financial statements.
Statement of Operations
| | | Year ended October 31, 2018 |
| Investment Income | | |
| Dividends | | $13,893,002 |
| Interest | | 13,731,236 |
| Income from Fidelity Central Funds | | 497,101 |
| Income before foreign taxes withheld | | 28,121,339 |
| Less foreign taxes withheld | | (1,549,046) |
| Total income | | 26,572,293 |
| Expenses | | |
| Management fee | $6,374,320 | |
| Transfer agent fees | 1,512,997 | |
| Distribution and service plan fees | 582,621 | |
| Accounting and security lending fees | 386,433 | |
| Custodian fees and expenses | 569,740 | |
| Independent trustees' fees and expenses | 4,050 | |
| Registration fees | 127,543 | |
| Audit | 103,667 | |
| Legal | 10,142 | |
| Interest | 832 | |
| Miscellaneous | 4,783 | |
| Total expenses before reductions | 9,677,128 | |
| Expense reductions | (203,988) | |
| Total expenses after reductions | | 9,473,140 |
| Net investment income (loss) | | 17,099,153 |
| Realized and Unrealized Gain (Loss) | | |
| Net realized gain (loss) on: | | |
| Investment securities: | | |
| Unaffiliated issuers | (26,990,776) | |
| Fidelity Central Funds | 1,326 | |
| Foreign currency transactions | (388,008) | |
| Futures contracts | (1,298,975) | |
| Total net realized gain (loss) | | (28,676,433) |
| Change in net unrealized appreciation (depreciation) on: | | |
| Investment securities: | | |
| Unaffiliated issuers (net of decrease in deferred foreign taxes of $653,550) | (97,165,034) | |
| Fidelity Central Funds | (1,505) | |
| Assets and liabilities in foreign currencies | (30,935) | |
| Total change in net unrealized appreciation (depreciation) | | (97,197,474) |
| Net gain (loss) | | (125,873,907) |
| Net increase (decrease) in net assets resulting from operations | | $(108,774,754) |
See accompanying notes which are an integral part of the financial statements.
Statement of Changes in Net Assets
| | Year ended October 31, 2018 | Year ended October 31, 2017 |
| Increase (Decrease) in Net Assets | | |
| Operations | | |
| Net investment income (loss) | $17,099,153 | $9,051,354 |
| Net realized gain (loss) | (28,676,433) | 10,774,070 |
| Change in net unrealized appreciation (depreciation) | (97,197,474) | 71,398,614 |
| Net increase (decrease) in net assets resulting from operations | (108,774,754) | 91,224,038 |
| Distributions to shareholders | (20,273,542) | – |
| Distributions to shareholders from net investment income | – | (1,957,793) |
| Distributions to shareholders from net realized gain | – | (138,064) |
| Total distributions | (20,273,542) | (2,095,857) |
| Share transactions - net increase (decrease) | 13,246,904 | 485,742,909 |
| Redemption fees | 23,374 | 215,914 |
| Total increase (decrease) in net assets | (115,778,018) | 575,087,004 |
| Net Assets | | |
| Beginning of period | 729,453,230 | 154,366,226 |
| End of period | $613,675,212 | $729,453,230 |
| Other Information | | |
| Undistributed net investment income end of period | | $8,176,283 |
See accompanying notes which are an integral part of the financial statements.
Financial Highlights
Fidelity Total Emerging Markets Fund Class A
| Years ended October 31, | 2018 | 2017 | 2016 | 2015 | 2014 |
| Selected Per–Share Data | | | | | |
| Net asset value, beginning of period | $13.56 | $11.33 | $10.35 | $11.56 | $11.37 |
| Income from Investment Operations | | | | | |
| Net investment income (loss)A | .25 | .24 | .26 | .28 | .18 |
| Net realized and unrealized gain (loss) | (1.94) | 2.11 | .96 | (1.30) | .19 |
| Total from investment operations | (1.69) | 2.35 | 1.22 | (1.02) | .37 |
| Distributions from net investment income | (.16) | (.12) | (.24) | (.17) | (.18) |
| Distributions from net realized gain | (.19) | (.01) | – | (.02) | – |
| Total distributions | (.34)B | (.13) | (.24) | (.19) | (.18) |
| Redemption fees added to paid in capitalA | –C | .01 | –C | –C | –C |
| Net asset value, end of period | $11.53 | $13.56 | $11.33 | $10.35 | $11.56 |
| Total ReturnD,E | (12.77)% | 21.13% | 12.13% | (8.92)% | 3.30% |
| Ratios to Average Net AssetsF,G | | | | | |
| Expenses before reductions | 1.40% | 1.47% | 1.87% | 1.93% | 1.98% |
| Expenses net of fee waivers, if any | 1.40% | 1.47% | 1.65% | 1.65% | 1.65% |
| Expenses net of all reductions | 1.37% | 1.46% | 1.64% | 1.64% | 1.65% |
| Net investment income (loss) | 1.92% | 1.97% | 2.47% | 2.58% | 1.61% |
| Supplemental Data | | | | | |
| Net assets, end of period (000 omitted) | $34,617 | $42,213 | $15,206 | $10,164 | $13,627 |
| Portfolio turnover rateH | 94% | 59% | 57% | 80% | 102% |
A Calculated based on average shares outstanding during the period.
B Total distributions of $.34 per share is comprised of distributions from net investment income of $.157 and distributions from net realized gain of $.185 per share.
C Amount represents less than $.005 per share.
D Total returns would have been lower if certain expenses had not been reduced during the applicable periods shown.
E Total returns do not include the effect of the sales charges.
F Fees and expenses of any underlying Fidelity Central Funds are not included in the Fund's expense ratio. The Fund indirectly bears its proportionate share of the expenses of any underlying Fidelity Central Funds.
G Expense ratios reflect operating expenses of the class. Expenses before reductions do not reflect amounts reimbursed by the investment adviser or reductions from brokerage service arrangements or reductions from other expense offset arrangements and do not represent the amount paid by the class during periods when reimbursements or reductions occur. Expenses net of fee waivers reflect expenses after reimbursement by the investment adviser but prior to reductions from brokerage service arrangements or other expense offset arrangements. Expenses net of all reductions represent the net expenses paid by the class.
H Amount does not include the portfolio activity of any underlying Fidelity Central Funds.
See accompanying notes which are an integral part of the financial statements.
Fidelity Total Emerging Markets Fund Class M
| Years ended October 31, | 2018 | 2017 | 2016 | 2015 | 2014 |
| Selected Per–Share Data | | | | | |
| Net asset value, beginning of period | $13.55 | $11.33 | $10.33 | $11.54 | $11.34 |
| Income from Investment Operations | | | | | |
| Net investment income (loss)A | .21 | .20 | .23 | .25 | .15 |
| Net realized and unrealized gain (loss) | (1.93) | 2.11 | .97 | (1.30) | .19 |
| Total from investment operations | (1.72) | 2.31 | 1.20 | (1.05) | .34 |
| Distributions from net investment income | (.13) | (.09) | (.20) | (.14) | (.14) |
| Distributions from net realized gain | (.19) | (.01) | – | (.02) | – |
| Total distributions | (.32) | (.10) | (.20) | (.16) | (.14) |
| Redemption fees added to paid in capitalA | –B | .01 | –B | –B | –B |
| Net asset value, end of period | $11.51 | $13.55 | $11.33 | $10.33 | $11.54 |
| Total ReturnC,D | (13.03)% | 20.66% | 11.92% | (9.18)% | 3.04% |
| Ratios to Average Net AssetsE,F | | | | | |
| Expenses before reductions | 1.74% | 1.82% | 2.22% | 2.27% | 2.32% |
| Expenses net of fee waivers, if any | 1.74% | 1.82% | 1.90% | 1.90% | 1.90% |
| Expenses net of all reductions | 1.71% | 1.81% | 1.90% | 1.89% | 1.90% |
| Net investment income (loss) | 1.58% | 1.62% | 2.22% | 2.33% | 1.36% |
| Supplemental Data | | | | | |
| Net assets, end of period (000 omitted) | $8,519 | $8,751 | $3,019 | $3,331 | $5,277 |
| Portfolio turnover rateG | 94% | 59% | 57% | 80% | 102% |
A Calculated based on average shares outstanding during the period.
B Amount represents less than $.005 per share.
C Total returns would have been lower if certain expenses had not been reduced during the applicable periods shown.
D Total returns do not include the effect of the sales charges.
E Fees and expenses of any underlying Fidelity Central Funds are not included in the Fund's expense ratio. The Fund indirectly bears its proportionate share of the expenses of any underlying Fidelity Central Funds.
F Expense ratios reflect operating expenses of the class. Expenses before reductions do not reflect amounts reimbursed by the investment adviser or reductions from brokerage service arrangements or reductions from other expense offset arrangements and do not represent the amount paid by the class during periods when reimbursements or reductions occur. Expenses net of fee waivers reflect expenses after reimbursement by the investment adviser but prior to reductions from brokerage service arrangements or other expense offset arrangements. Expenses net of all reductions represent the net expenses paid by the class.
G Amount does not include the portfolio activity of any underlying Fidelity Central Funds.
See accompanying notes which are an integral part of the financial statements.
Fidelity Total Emerging Markets Fund Class C
| Years ended October 31, | 2018 | 2017 | 2016 | 2015 | 2014 |
| Selected Per–Share Data | | | | | |
| Net asset value, beginning of period | $13.45 | $11.25 | $10.25 | $11.47 | $11.29 |
| Income from Investment Operations | | | | | |
| Net investment income (loss)A | .15 | .15 | .18 | .20 | .10 |
| Net realized and unrealized gain (loss) | (1.92) | 2.11 | .97 | (1.30) | .19 |
| Total from investment operations | (1.77) | 2.26 | 1.15 | (1.10) | .29 |
| Distributions from net investment income | (.09) | (.06) | (.15) | (.10) | (.11) |
| Distributions from net realized gain | (.19) | (.01) | – | (.02) | – |
| Total distributions | (.28) | (.07) | (.15) | (.12) | (.11) |
| Redemption fees added to paid in capitalA | –B | .01 | –B | –B | –B |
| Net asset value, end of period | $11.40 | $13.45 | $11.25 | $10.25 | $11.47 |
| Total ReturnC,D | (13.45)% | 20.29% | 11.36% | (9.68)% | 2.56% |
| Ratios to Average Net AssetsE,F | | | | | |
| Expenses before reductions | 2.14% | 2.21% | 2.62% | 2.68% | 2.72% |
| Expenses net of fee waivers, if any | 2.14% | 2.21% | 2.40% | 2.40% | 2.40% |
| Expenses net of all reductions | 2.12% | 2.20% | 2.39% | 2.39% | 2.40% |
| Net investment income (loss) | 1.18% | 1.23% | 1.72% | 1.83% | .86% |
| Supplemental Data | | | | | |
| Net assets, end of period (000 omitted) | $37,191 | $34,869 | $10,710 | $7,736 | $10,104 |
| Portfolio turnover rateG | 94% | 59% | 57% | 80% | 102% |
A Calculated based on average shares outstanding during the period.
B Amount represents less than $.005 per share.
C Total returns would have been lower if certain expenses had not been reduced during the applicable periods shown.
D Total returns do not include the effect of the contingent deferred sales charge.
E Fees and expenses of any underlying Fidelity Central Funds are not included in the Fund's expense ratio. The Fund indirectly bears its proportionate share of the expenses of any underlying Fidelity Central Funds.
F Expense ratios reflect operating expenses of the class. Expenses before reductions do not reflect amounts reimbursed by the investment adviser or reductions from brokerage service arrangements or reductions from other expense offset arrangements and do not represent the amount paid by the class during periods when reimbursements or reductions occur. Expenses net of fee waivers reflect expenses after reimbursement by the investment adviser but prior to reductions from brokerage service arrangements or other expense offset arrangements. Expenses net of all reductions represent the net expenses paid by the class.
G Amount does not include the portfolio activity of any underlying Fidelity Central Funds.
See accompanying notes which are an integral part of the financial statements.
Fidelity Total Emerging Markets Fund
| Years ended October 31, | 2018 | 2017 | 2016 | 2015 | 2014 |
| Selected Per–Share Data | | | | | |
| Net asset value, beginning of period | $13.58 | $11.34 | $10.38 | $11.60 | $11.40 |
| Income from Investment Operations | | | | | |
| Net investment income (loss)A | .29 | .27 | .28 | .31 | .21 |
| Net realized and unrealized gain (loss) | (1.95) | 2.10 | .97 | (1.31) | .19 |
| Total from investment operations | (1.66) | 2.37 | 1.25 | (1.00) | .40 |
| Distributions from net investment income | (.17) | (.14) | (.29) | (.20) | (.20) |
| Distributions from net realized gain | (.19) | (.01) | – | (.02) | – |
| Total distributions | (.36) | (.14)B | (.29) | (.22) | (.20) |
| Redemption fees added to paid in capitalA | –C | .01 | –C | –C | –C |
| Net asset value, end of period | $11.56 | $13.58 | $11.34 | $10.38 | $11.60 |
| Total ReturnD | (12.56)% | 21.37% | 12.44% | (8.74)% | 3.56% |
| Ratios to Average Net AssetsE,F | | | | | |
| Expenses before reductions | 1.13% | 1.26% | 1.62% | 1.72% | 1.73% |
| Expenses net of fee waivers, if any | 1.13% | 1.26% | 1.40% | 1.40% | 1.40% |
| Expenses net of all reductions | 1.11% | 1.24% | 1.39% | 1.39% | 1.40% |
| Net investment income (loss) | 2.19% | 2.18% | 2.72% | 2.83% | 1.86% |
| Supplemental Data | | | | | |
| Net assets, end of period (000 omitted) | $190,025 | $272,002 | $104,332 | $37,918 | $45,763 |
| Portfolio turnover rateG | 94% | 59% | 57% | 80% | 102% |
A Calculated based on average shares outstanding during the period.
B Total distributions of $.14 per share is comprised of distributions from net investment income of $.135 and distributions from net realized gain of $.009 per share.
C Amount represents less than $.005 per share.
D Total returns would have been lower if certain expenses had not been reduced during the applicable periods shown.
E Fees and expenses of any underlying Fidelity Central Funds are not included in the Fund's expense ratio. The Fund indirectly bears its proportionate share of the expenses of any underlying Fidelity Central Funds.
F Expense ratios reflect operating expenses of the class. Expenses before reductions do not reflect amounts reimbursed by the investment adviser or reductions from brokerage service arrangements or reductions from other expense offset arrangements and do not represent the amount paid by the class during periods when reimbursements or reductions occur. Expenses net of fee waivers reflect expenses after reimbursement by the investment adviser but prior to reductions from brokerage service arrangements or other expense offset arrangements. Expenses net of all reductions represent the net expenses paid by the class.
G Amount does not include the portfolio activity of any underlying Fidelity Central Funds.
See accompanying notes which are an integral part of the financial statements.
Fidelity Total Emerging Markets Fund Class I
| Years ended October 31, | 2018 | 2017 | 2016 | 2015 | 2014 |
| Selected Per–Share Data | | | | | |
| Net asset value, beginning of period | $13.58 | $11.33 | $10.37 | $11.59 | $11.40 |
| Income from Investment Operations | | | | | |
| Net investment income (loss)A | .29 | .28 | .29 | .31 | .21 |
| Net realized and unrealized gain (loss) | (1.95) | 2.11 | .96 | (1.31) | .18 |
| Total from investment operations | (1.66) | 2.39 | 1.25 | (1.00) | .39 |
| Distributions from net investment income | (.19) | (.14) | (.29) | (.20) | (.20) |
| Distributions from net realized gain | (.19) | (.01) | – | (.02) | – |
| Total distributions | (.37)B | (.15) | (.29) | (.22) | (.20) |
| Redemption fees added to paid in capitalA | –C | .01 | –C | –C | –C |
| Net asset value, end of period | $11.55 | $13.58 | $11.33 | $10.37 | $11.59 |
| Total ReturnD | (12.56)% | 21.51% | 12.48% | (8.74)% | 3.51% |
| Ratios to Average Net AssetsE,F | | | | | |
| Expenses before reductions | 1.12% | 1.19% | 1.54% | 1.58% | 1.71% |
| Expenses net of fee waivers, if any | 1.12% | 1.19% | 1.40% | 1.40% | 1.40% |
| Expenses net of all reductions | 1.10% | 1.17% | 1.39% | 1.39% | 1.40% |
| Net investment income (loss) | 2.20% | 2.25% | 2.72% | 2.83% | 1.86% |
| Supplemental Data | | | | | |
| Net assets, end of period (000 omitted) | $341,720 | $371,617 | $21,099 | $6,343 | $4,773 |
| Portfolio turnover rateG | 94% | 59% | 57% | 80% | 102% |
A Calculated based on average shares outstanding during the period.
B Total distributions of $.37 per share is comprised of distributions from net investment income of $.185 and distributions from net realized gain of $.185 per share.
C Amount represents less than $.005 per share.
D Total returns would have been lower if certain expenses had not been reduced during the applicable periods shown.
E Fees and expenses of any underlying Fidelity Central Funds are not included in the Fund's expense ratio. The Fund indirectly bears its proportionate share of the expenses of any underlying Fidelity Central Funds.
F Expense ratios reflect operating expenses of the class. Expenses before reductions do not reflect amounts reimbursed by the investment adviser or reductions from brokerage service arrangements or reductions from other expense offset arrangements and do not represent the amount paid by the class during periods when reimbursements or reductions occur. Expenses net of fee waivers reflect expenses after reimbursement by the investment adviser but prior to reductions from brokerage service arrangements or other expense offset arrangements. Expenses net of all reductions represent the net expenses paid by the class.
G Amount does not include the portfolio activity of any underlying Fidelity Central Funds.
See accompanying notes which are an integral part of the financial statements.
Fidelity Total Emerging Markets Fund Class Z
| Year ended October 31, | 2018 A |
| Selected Per–Share Data | |
| Net asset value, beginning of period | $12.17 |
| Income from Investment Operations | |
| Net investment income (loss)B | .01 |
| Net realized and unrealized gain (loss) | (.63) |
| Total from investment operations | (.62) |
| Distributions from net investment income | – |
| Distributions from net realized gain | – |
| Total distributions | – |
| Net asset value, end of period | $11.55 |
| Total ReturnC,D | (5.09)% |
| Ratios to Average Net AssetsE,F | |
| Expenses before reductions | 1.07%G |
| Expenses net of fee waivers, if any | 1.04%G |
| Expenses net of all reductions | 1.02%G |
| Net investment income (loss) | 1.51%G |
| Supplemental Data | |
| Net assets, end of period (000 omitted) | $1,603 |
| Portfolio turnover rateH | 94% |
A For the period October 2, 2018 (commencement of sale of shares) to October 31, 2018.
B Calculated based on average shares outstanding during the period.
C Total returns for periods of less than one year are not annualized.
D Total returns would have been lower if certain expenses had not been reduced during the applicable periods shown.
E Fees and expenses of any underlying Fidelity Central Funds are not included in the Fund's expense ratio. The Fund indirectly bears its proportionate share of the expenses of any underlying Fidelity Central Funds.
F Expense ratios reflect operating expenses of the class. Expenses before reductions do not reflect amounts reimbursed by the investment adviser or reductions from brokerage service arrangements or reductions from other expense offset arrangements and do not represent the amount paid by the class during periods when reimbursements or reductions occur. Expense ratios before reductions for start-up periods may not be representative of longer-term operating periods. Expenses net of fee waivers reflect expenses after reimbursement by the investment adviser but prior to reductions from brokerage service arrangements or other expense offset arrangements. Expenses net of all reductions represent the net expenses paid by the class.
G Annualized
H Amount does not include the portfolio activity of any underlying Fidelity Central Funds.
See accompanying notes which are an integral part of the financial statements.
Notes to Financial Statements
For the period ended October 31, 2018
1. Organization.
Fidelity Total Emerging Markets Fund (the Fund) is a fund of Fidelity Investment Trust (the Trust) and is authorized to issue an unlimited number of shares. The Trust is registered under the Investment Company Act of 1940, as amended (the 1940 Act), as an open-end management investment company organized as a Massachusetts business trust. The Fund commenced sale of Class Z shares on October 2, 2018. The Fund offers Class A, Class M, Class C, Total Emerging Markets, Class I and Class Z shares, each of which has equal rights as to assets and voting privileges. Each class has exclusive voting rights with respect to matters that affect that class. The Fund's investments in emerging markets can be subject to social, economic, regulatory, and political uncertainties and can be extremely volatile.
2. Investments in Fidelity Central Funds.
The Fund invests in Fidelity Central Funds, which are open-end investment companies generally available only to other investment companies and accounts managed by the investment adviser and its affiliates. The Fund's Schedule of Investments lists each of the Fidelity Central Funds held as of period end, if any, as an investment of the Fund, but does not include the underlying holdings of each Fidelity Central Fund. As an Investing Fund, the Fund indirectly bears its proportionate share of the expenses of the underlying Fidelity Central Funds.
The Money Market Central Funds seek preservation of capital and current income and are managed by Fidelity Investments Money Management, Inc. (FIMM), an affiliate of the investment adviser. Annualized expenses of the Money Market Central Funds as of their most recent shareholder report date are less than .005%.
A complete unaudited list of holdings for each Fidelity Central Fund is available upon request or at the Securities and Exchange Commission (the SEC) website at www.sec.gov. In addition, the financial statements of the Fidelity Central Funds, which are not covered by the Fund's Report of Independent Registered Public Accounting Firm, are available on the SEC website or upon request.
3. Significant Accounting Policies.
The Fund is an investment company and applies the accounting and reporting guidance of the Financial Accounting Standards Board (FASB) Accounting Standards Codification Topic 946 Financial Services – Investments Companies. The financial statements have been prepared in conformity with accounting principles generally accepted in the United States of America (GAAP), which require management to make certain estimates and assumptions at the date of the financial statements. Actual results could differ from those estimates. Subsequent events, if any, through the date that the financial statements were issued have been evaluated in the preparation of the financial statements. The following summarizes the significant accounting policies of the Fund:
Investment Valuation. Investments are valued as of 4:00 p.m. Eastern time on the last calendar day of the period. The Board of Trustees (the Board) has delegated the day to day responsibility for the valuation of the Fund's investments to the Fair Value Committee (the Committee) established by the Fund's investment adviser. In accordance with valuation policies and procedures approved by the Board, the Fund attempts to obtain prices from one or more third party pricing vendors or brokers to value its investments. When current market prices, quotations or currency exchange rates are not readily available or reliable, investments will be fair valued in good faith by the Committee, in accordance with procedures adopted by the Board. Factors used in determining fair value vary by investment type and may include market or investment specific events, changes in interest rates and credit quality. The frequency with which these procedures are used cannot be predicted and they may be utilized to a significant extent. The Committee oversees the Fund's valuation policies and procedures and reports to the Board on the Committee's activities and fair value determinations. The Board monitors the appropriateness of the procedures used in valuing the Fund's investments and ratifies the fair value determinations of the Committee.
The Fund categorizes the inputs to valuation techniques used to value its investments into a disclosure hierarchy consisting of three levels as shown below:
- Level 1 – quoted prices in active markets for identical investments
- Level 2 – other significant observable inputs (including quoted prices for similar investments, interest rates, prepayment speeds, etc.)
- Level 3 – unobservable inputs (including the Fund's own assumptions based on the best information available)
Valuation techniques used to value the Fund's investments by major category are as follows:
Equity securities, including restricted securities, for which market quotations are readily available, are valued at the last reported sale price or official closing price as reported by a third party pricing vendor on the primary market or exchange on which they are traded and are categorized as Level 1 in the hierarchy. In the event there were no sales during the day or closing prices are not available, securities are valued at the last quoted bid price or may be valued using the last available price and are generally categorized as Level 2 in the hierarchy. For foreign equity securities, when market or security specific events arise, comparisons to the valuation of American Depositary Receipts (ADRs), futures contracts, Exchange-Traded Funds (ETFs) and certain indexes as well as quoted prices for similar securities may be used and would be categorized as Level 2 in the hierarchy. Utilizing these techniques may result in transfers between Level 1 and Level 2. For equity securities, including restricted securities, where observable inputs are limited, assumptions about market activity and risk are used and these securities may be categorized as Level 3 in the hierarchy.
Debt securities, including restricted securities, are valued based on evaluated prices received from third party pricing vendors or from brokers who make markets in such securities. Corporate bonds, foreign government and government agency obligations, and U.S. government and government agency obligations are valued by pricing vendors who utilize matrix pricing which considers yield or price of bonds of comparable quality, coupon, maturity and type or by broker-supplied prices. When independent prices are unavailable or unreliable, debt securities may be valued utilizing pricing methodologies which consider similar factors that would be used by third party pricing vendors. Debt securities are generally categorized as Level 2 in the hierarchy but may be Level 3 depending on the circumstances.
Investments in open-end mutual funds, including the Fidelity Central Funds, are valued at their closing net asset value (NAV) each business day and are categorized as Level 1 in the hierarchy.
Changes in valuation techniques may result in transfers in or out of an assigned level within the disclosure hierarchy. The aggregate value of investments by input level as of October 31, 2018, including information on transfers between Levels 1 and 2, as well as a roll forward of Level 3 investments, is included at the end of the Fund's Schedule of Investments.
Foreign Currency. The Fund may use foreign currency contracts to facilitate transactions in foreign-denominated securities. Gains and losses from these transactions may arise from changes in the value of the foreign currency or if the counterparties do not perform under the contracts' terms.
Foreign-denominated assets, including investment securities, and liabilities are translated into U.S. dollars at the exchange rates at period end. Purchases and sales of investment securities, income and dividends received and expenses denominated in foreign currencies are translated into U.S. dollars at the exchange rate in effect on the transaction date.
The effects of exchange rate fluctuations on investments are included with the net realized and unrealized gain (loss) on investment securities. Other foreign currency transactions resulting in realized and unrealized gain (loss) are disclosed separately.
Investment Transactions and Income. For financial reporting purposes, the Fund's investment holdings and NAV include trades executed through the end of the last business day of the period. The NAV per share for processing shareholder transactions is calculated as of the close of business of the New York Stock Exchange (NYSE), normally 4:00 p.m. Eastern time and includes trades executed through the end of the prior business day. Gains and losses on securities sold are determined on the basis of identified cost. Dividend income is recorded on the ex-dividend date, except for certain dividends from foreign securities where the ex-dividend date may have passed, which are recorded as soon as the Fund is informed of the ex-dividend date. Non-cash dividends included in dividend income, if any, are recorded at the fair market value of the securities received. Income and capital gain distributions from Fidelity Central Funds, if any, are recorded on the ex-dividend date. Certain distributions received by the Fund represent a return of capital or capital gain. The Fund determines the components of these distributions subsequent to the ex-dividend date, based upon receipt of tax filings or other correspondence relating to the underlying investment. These distributions are recorded as a reduction of cost of investments and/or as a realized gain. Interest income is accrued as earned and includes coupon interest and amortization of premium and accretion of discount on debt securities as applicable. Paid in Kind (PIK) income is recorded at the fair market value of the securities received. Investment income is recorded net of foreign taxes withheld where recovery of such taxes is uncertain. Debt obligations may be placed on non-accrual status and related interest income may be reduced by ceasing current accruals and writing off interest receivables when the collection of all or a portion of interest has become doubtful based on consistently applied procedures. A debt obligation is removed from non-accrual status when the issuer resumes interest payments or when collectability of interest is reasonably assured.
Class Allocations and Expenses. Investment income, realized and unrealized capital gains and losses, common expenses of the Fund, and certain fund-level expense reductions, if any, are allocated daily on a pro-rata basis to each class based on the relative net assets of each class to the total net assets of the Fund. Each class differs with respect to transfer agent and distribution and service plan fees incurred. Certain expense reductions may also differ by class. For the reporting period, the allocated portion of income and expenses to each class as a percent of its average net assets may vary due to the timing of recording these transactions in relation to fluctuating net assets of the classes. Expenses directly attributable to a fund are charged to that fund. Expenses attributable to more than one fund are allocated among the respective funds on the basis of relative net assets or other appropriate methods. Expense estimates are accrued in the period to which they relate and adjustments are made when actual amounts are known.
Income Tax Information and Distributions to Shareholders. Each year, the Fund intends to qualify as a regulated investment company under Subchapter M of the Internal Revenue Code, including distributing substantially all of its taxable income and realized gains. As a result, no provision for U.S. Federal income taxes is required. As of October 31, 2018, the Fund did not have any unrecognized tax benefits in the financial statements; nor is the Fund aware of any tax positions for which it is reasonably possible that the total amounts of unrecognized tax benefits will significantly change in the next twelve months. The Fund files a U.S. federal tax return, in addition to state and local tax returns as required. The Fund's federal income tax returns are subject to examination by the Internal Revenue Service (IRS) for a period of three fiscal years after they are filed. State and local tax returns may be subject to examination for an additional fiscal year depending on the jurisdiction. Foreign taxes are provided for based on the Fund's understanding of the tax rules and rates that exist in the foreign markets in which it invests. The Fund is subject to a tax imposed on capital gains by certain countries in which it invests.
Distributions are declared and recorded on the ex-dividend date. Income and capital gain distributions are declared separately for each class. Income and capital gain distributions are determined in accordance with income tax regulations, which may differ from GAAP. In addition, the Fund claimed a portion of the payment made to redeeming shareholders as a distribution for income tax purposes.
Capital accounts within the financial statements are adjusted for permanent book-tax differences. These adjustments have no impact on net assets or the results of operations. Capital accounts are not adjusted for temporary book-tax differences which will reverse in a subsequent period.
Book-tax differences are primarily due to foreign currency transactions, futures contracts, certain foreign taxes, market discount, passive foreign investment companies (PFIC), capital loss carryforwards and losses deferred due to wash sales.
As of period end, the cost and unrealized appreciation (depreciation) in securities, and derivatives if applicable, for federal income tax purposes were as follows:
| Gross unrealized appreciation | $39,191,912 |
| Gross unrealized depreciation | (61,193,625) |
| Net unrealized appreciation (depreciation) | $(22,001,713) |
| Tax Cost | $633,010,580 |
The tax-based components of distributable earnings as of period end were as follows:
| Undistributed ordinary income | $11,013,570 |
| Capital loss carryforward | $(25,726,179) |
| Net unrealized appreciation (depreciation) on securities and other investments | $(22,029,305) |
Capital loss carryforwards are only available to offset future capital gains of the Fund to the extent provided by regulations and may be limited. Under the Regulated Investment Company Modernization Act of 2010 (the Act), the Fund is permitted to carry forward capital losses incurred in taxable years beginning after December 22, 2010 for an unlimited period and such capital losses are required to be used prior to any losses that expire. The capital loss carryforward information presented below, including any applicable limitation, is estimated as of fiscal period end and is subject to adjustment.
| No expiration | |
| Short-term | $(25,726,179) |
| Long-term | - |
| Total no expiration | $(25,726,179) |
The tax character of distributions paid was as follows:
| | October 31, 2018 | October 31, 2017 |
| Ordinary Income | $16,040,300 | $ 2,095,857 |
| Long-term Capital Gains | 4,233,242 | – |
| Total | $20,273,542 | $ 2,095,857 |
Short-Term Trading (Redemption) Fees. Shares held by investors in the Fund less than 90 days may have been subject to a redemption fee equal to 1.50% of the NAV of shares redeemed. All redemption fees, which reduce the proceeds of the shareholder redemption, are retained by the Fund and accounted for as an addition to paid in capital. In November 2017, the Board of Trustees approved the elimination of these redemption fees effective December 18, 2017.
Restricted Securities. The Fund may invest in securities that are subject to legal or contractual restrictions on resale. These securities generally may be resold in transactions exempt from registration or to the public if the securities are registered. Disposal of these securities may involve time-consuming negotiations and expense, and prompt sale at an acceptable price may be difficult. Information regarding restricted securities is included at the end of the Fund's Schedule of Investments.
New Rule Issuance. During August 2018, the U.S. Securities and Exchange Commission issued Final Rule Release No. 33-10532, Disclosure Update and Simplification. This Final Rule includes amendments specific to registered investment companies that are intended to eliminate overlap in disclosure requirements between Regulation S-X and GAAP. In accordance with these amendments, certain line-items in the Fund's financial statements have been combined or removed for the current period as outlined in the table below.
| Financial Statement | Current Line-Item Presentation | Prior Line-Item Presentation |
| Statement of Assets and Liabilities | Total distributable earnings (loss) | Undistributed/Distributions in excess of/Accumulated net investment income (loss)
Accumulated/Undistributed net realized gain (loss)
Net unrealized appreciation (depreciation) |
| Statement of Changes in Net Assets | N/A - removed | Undistributed/Distributions in excess of/Accumulated net investment income (loss) end of period |
| Statement of Changes in Net Assets | Distributions to shareholders | Distributions to shareholders from net investment income
Distributions to shareholders from net realized gain |
| Distributions to Shareholders Note to Financial Statements | Distributions to shareholders | Distributions to shareholders from net investment income
Distributions to shareholders from net realized gain |
4. Derivative Instruments.
Risk Exposures and the Use of Derivative Instruments. The Fund's investment objective allows the Fund to enter into various types of derivative contracts, including futures contracts. Derivatives are investments whose value is primarily derived from underlying assets, indices or reference rates and may be transacted on an exchange or over-the-counter (OTC). Derivatives may involve a future commitment to buy or sell a specified asset based on specified terms, to exchange future cash flows at periodic intervals based on a notional principal amount, or for one party to make one or more payments upon the occurrence of specified events in exchange for periodic payments from the other party.
The Fund used derivatives to increase returns and to manage exposure to certain risks as defined below. The success of any strategy involving derivatives depends on analysis of numerous economic factors, and if the strategies for investment do not work as intended, the Fund may not achieve its objectives.
The Fund's use of derivatives increased or decreased its exposure to the following risk:
| Equity Risk | Equity risk relates to the fluctuations in the value of financial instruments as a result of changes in market prices (other than those arising from interest rate risk or foreign exchange risk), whether caused by factors specific to an individual investment, its issuer, or all factors affecting all instruments traded in a market or market segment.
|
The Fund is also exposed to additional risks from investing in derivatives, such as liquidity risk and counterparty credit risk. Liquidity risk is the risk that the Fund will be unable to close out the derivative in the open market in a timely manner. Counterparty credit risk is the risk that the counterparty will not be able to fulfill its obligation to the Fund. Counterparty credit risk related to exchange-traded futures contracts may be mitigated by the protection provided by the exchange on which they trade.
Investing in derivatives may involve greater risks than investing in the underlying assets directly and, to varying degrees, may involve risk of loss in excess of any initial investment and collateral received and amounts recognized in the Statement of Assets and Liabilities. In addition, there may be the risk that the change in value of the derivative contract does not correspond to the change in value of the underlying instrument.
Futures Contracts. A futures contract is an agreement between two parties to buy or sell a specified underlying instrument for a fixed price at a specified future date. The Fund used futures contracts to manage its exposure to the stock market.
Upon entering into a futures contract, a fund is required to deposit either cash or securities (initial margin) with a clearing broker in an amount equal to a certain percentage of the face value of the contract. Futures contracts are marked-to-market daily and subsequent daily payments (variation margin) are made or received by a fund depending on the daily fluctuations in the value of the futures contracts and are recorded as unrealized appreciation or (depreciation). This receivable and/or payable, if any, is included in daily variation margin on futures contracts in the Statement of Assets and Liabilities. Realized gain or (loss) is recorded upon the expiration or closing of a futures contract. The net realized gain (loss) and change in net unrealized appreciation (depreciation) on futures contracts during the period is presented in the Statement of Operations.
Any open futures contracts at period end are presented in the Schedule of Investments under the caption "Futures Contracts". The notional amount at value reflects each contract's exposure to the underlying instrument or index at period end.
5. Purchases and Sales of Investments.
Purchases and sales of securities, other than short-term securities and U.S. government securities, aggregated $645,392,522 and $659,169,031, respectively.
6. Fees and Other Transactions with Affiliates.
Management Fee. Fidelity Management & Research Company (the investment adviser) and its affiliates provide the Fund with investment management related services for which the Fund pays a monthly management fee. The management fee is the sum of an individual fund fee rate that is based on an annual rate of .55% of the Fund's average net assets and an annualized group fee rate that averaged .24% during the period. The group fee rate is based upon the average net assets of all the mutual funds advised by the investment adviser, including any mutual funds previously advised by the investment adviser that are currently advised by Fidelity SelectCo, LLC, an affiliate of the investment adviser. The group fee rate decreases as assets under management increase and increases as assets under management decrease. For the reporting period, the total annual management fee rate was .79% of the Fund's average net assets.
Distribution and Service Plan Fees. In accordance with Rule 12b-1 of the 1940 Act, the Fund has adopted separate Distribution and Service Plans for each class of shares. Certain classes pay Fidelity Distributors Corporation (FDC), an affiliate of the investment adviser, separate Distribution and Service Fees, each of which is based on an annual percentage of each class' average net assets. In addition, FDC may pay financial intermediaries for selling shares of the Fund and providing shareholder support services. For the period, the Distribution and Service Fee rates, total fees and amounts retained by FDC were as follows:
| | Distribution Fee | Service Fee | Total Fees | Retained by FDC |
| Class A | -% | .25% | $114,744 | $14,838 |
| Class M | .25% | .25% | 47,109 | 2,167 |
| Class C | .75% | .25% | 420,768 | 179,385 |
| | | | $582,621 | $196,390 |
Sales Load. FDC may receive a front-end sales charge of up to 5.75% for selling Class A shares and 3.50% for selling Class M shares, some of which is paid to financial intermediaries for selling shares of the Fund. Depending on the holding period, FDC may receive contingent deferred sales charges levied on Class A, Class M and Class C redemptions. The deferred sales charges are 1.00% for Class C shares, 1.00% for certain purchases of Class A shares and .25% for certain purchases of Class M shares.
For the period, sales charge amounts retained by FDC were as follows:
| | Retained by FDC |
| Class A | $53,073 |
| Class M | 6,981 |
| Class C(a) | 11,971 |
| | $72,025 |
(a) When Class C shares are initially sold, FDC pays commissions from its own resources to financial intermediaries through which the sales are made.
Transfer Agent Fees. Fidelity Investments Institutional Operations Company, Inc., (FIIOC), an affiliate of the investment adviser, is the transfer, dividend disbursing and shareholder servicing agent for each class of the Fund. FIIOC receives account fees and asset-based fees that vary according to the account size and type of account of the shareholders of the respective classes of the Fund, except for Class Z. FIIOC receives an asset-based fee of Class Z's average net assets. FIIOC pays for typesetting, printing and mailing of shareholder reports, except proxy statements.
For the period, transfer agent fees for each class were as follows:
| | Amount | % of Class-Level Average Net Assets |
| Class A | $94,707 | .21 |
| Class M | 28,184 | .30 |
| Class C | 85,269 | .20 |
| Total Emerging Markets | 534,318 | .19 |
| Class I | 770,510 | .18 |
| Class Z | 9 | .04(a) |
| | $1,512,997 | |
(a) Annualized.
Accounting and Security Lending Fees. Fidelity Service Company, Inc. (FSC), an affiliate of the investment adviser, maintains the Fund's accounting records. The accounting fee is based on the level of average net assets for each month. Under a separate contract, FSC administers the security lending program. The security lending fee is based on the number and duration of lending transactions. For the period, the fees were equivalent to an annual rate of .05%.
Brokerage Commissions. The Fund placed a portion of its portfolio transactions with brokerage firms which are affiliates of the investment adviser. Brokerage commissions are included in net realized gain (loss) and change in net unrealized appreciation (depreciation) in the Statement of Operations. The commissions paid to these affiliated firms were $4,671 for the period.
Interfund Lending Program. Pursuant to an Exemptive Order issued by the SEC, the Fund, along with other registered investment companies having management contracts with Fidelity Management & Research Company (FMR) or other affiliated entities of FMR, may participate in an interfund lending program. This program provides an alternative credit facility allowing the funds to borrow from, or lend money to, other participating affiliated funds. At period end, there were no interfund loans outstanding. The Fund's activity in this program during the period for which loans were outstanding was as follows:
| Borrower or Lender | Average Loan Balance | Weighted Average Interest Rate | Interest Expense |
| Borrower | $13,840,000 | 2.17% | $832 |
Interfund Trades. The Fund may purchase from or sell securities to other Fidelity Funds under procedures adopted by the Board. The procedures have been designed to ensure these interfund trades are executed in accordance with Rule 17a-7 of the 1940 Act. Interfund trades are included within the respective purchases and sales amounts shown in the Purchases and Sales of Investments note.
Other. During the period, the investment adviser reimbursed the Fund for certain losses in the amount of $1,966.
7. Committed Line of Credit.
The Fund participates with other funds managed by the investment adviser or an affiliate in a $4.25 billion credit facility (the "line of credit") to be utilized for temporary or emergency purposes to fund shareholder redemptions or for other short-term liquidity purposes. The Fund has agreed to pay commitment fees on its pro-rata portion of the line of credit, which amounted to $2,227 and is reflected in Miscellaneous expenses on the Statement of Operations. During the period, the Fund did not borrow on this line of credit.
8. Security Lending.
The Fund lends portfolio securities through a lending agent from time to time in order to earn additional income. For equity securities, a lending agent is used and may loan securities to certain qualified borrowers, including Fidelity Capital Markets (FCM), a broker-dealer affiliated with the Fund. On the settlement date of the loan, the Fund receives collateral (in the form of U.S. Treasury obligations, letters of credit and/or cash) against the loaned securities and maintains collateral in an amount not less than 100% of the market value of the loaned securities during the period of the loan. The market value of the loaned securities is determined at the close of business of the Fund and any additional required collateral is delivered to the Fund on the next business day. The Fund or borrower may terminate the loan at any time, and if the borrower defaults on its obligation to return the securities loaned because of insolvency or other reasons, the Fund may apply collateral received from the borrower against the obligation. The Fund may experience delays and costs in recovering the securities loaned. Any cash collateral received is invested in the Fidelity Securities Lending Cash Central Fund. At period end, there were no security loans outstanding. Security lending income represents the income earned on investing cash collateral, less rebates paid to borrowers and any lending agent fees associated with the loan, plus any premium payments received for lending certain types of securities. Security lending income is presented in the Statement of Operations as a component of income from Fidelity Central Funds. Total security lending income during the period amounted to $14,284. During the period, there were no securities loaned to FCM.
9. Expense Reductions.
The investment adviser contractually agreed to reimburse each class to the extent annual operating expenses exceeded certain levels of class-level average net assets as noted in the table below. This reimbursement will remain in place through February 29, 2020. Some expenses, for example the compensation of the independent Trustees, and certain miscellaneous expenses such as proxy and shareholder meeting expenses, are excluded from this reimbursement.
The following classes were in reimbursement during the period:
| | Expense Limitations | Reimbursement |
| Class Z | 1.25% | $6 |
Commissions paid to certain brokers with whom the investment adviser, or its affiliates, places trades on behalf of the Fund include an amount in addition to trade execution, which may be rebated back to the Fund to offset certain expenses. This amount totaled $193,897 for the period. Through arrangements with the Fund's custodian, credits realized as a result of certain uninvested cash balances were used to reduce the Fund's expenses. During the period, these credits reduced the Fund's custody expenses by $2,447.
In addition, during the period the investment adviser reimbursed and/or waived a portion of fund-level operating expenses in the amount of $7,638.
10. Distributions to Shareholders.
Distributions to shareholders of each class were as follows:
| | Year ended
October 31, 2018 | Year ended
October 31, 2017 |
| Distributions to shareholders | | |
| Class A | $1,173,252 | $– |
| Class M | 134,477 | – |
| Class C | 782,198 | – |
| Total Emerging Markets | 7,266,702 | – |
| Class I | 10,916,913 | – |
| Total | $20,273,542 | $– |
| From net investment income | | |
| Class A | $– | $195,255 |
| Class M | – | 23,027 |
| Class C | – | 57,828 |
| Total Emerging Markets | – | 1,274,142 |
| Class I | – | 407,541 |
| Total | $– | $1,957,793 |
| From net realized gain | | |
| Class A | $– | $14,644 |
| Class M | – | 2,410 |
| Class C | – | 9,294 |
| Total Emerging Markets | – | 84,943 |
| Class I | – | 26,773 |
| Total | $– | $138,064 |
11. Share Transactions.
Share transactions for each class were as follows and may contain automatic conversions between classes or exchanges between affiliated funds:
| | Shares | Shares | Dollars | Dollars |
| | Year ended October 31, 2018(a) | Year ended October 31, 2017 | Year ended October 31, 2018(a) | Year ended October 31, 2017 |
| Class A | | | | |
| Shares sold | 1,859,563 | 3,615,728 | $25,085,167 | $43,198,307 |
| Reinvestment of distributions | 88,408 | 19,523 | 1,166,980 | 207,918 |
| Shares redeemed | (2,058,546) | (1,863,978) | (26,793,915) | (21,909,724) |
| Net increase (decrease) | (110,575) | 1,771,273 | $(541,768) | $21,496,501 |
| Class M | | | | |
| Shares sold | 275,701 | 451,431 | $3,701,993 | $5,673,545 |
| Reinvestment of distributions | 15,634 | 2,361 | 206,523 | 25,216 |
| Shares redeemed | (196,678) | (74,567) | (2,571,520) | (886,466) |
| Net increase (decrease) | 94,657 | 379,225 | $1,336,996 | $4,812,295 |
| Class C | | | | |
| Shares sold | 1,470,832 | 1,907,365 | $19,647,127 | $23,252,010 |
| Reinvestment of distributions | 59,490 | 6,299 | 781,699 | 66,954 |
| Shares redeemed | (861,075) | (272,258) | (10,881,951) | (3,283,907) |
| Net increase (decrease) | 669,247 | 1,641,406 | $9,546,875 | $20,035,057 |
| Total Emerging Markets | | | | |
| Shares sold | 8,907,832 | 17,602,916 | $120,823,803 | $212,356,677 |
| Reinvestment of distributions | 522,036 | 124,771 | 6,896,099 | 1,328,813 |
| Shares redeemed | (13,024,202) | (6,900,916) | (167,212,962) | (84,713,141) |
| Net increase (decrease) | (3,594,334) | 10,826,771 | $(39,493,060) | $128,972,349 |
| Class I | | | | |
| Shares sold | 17,527,189 | 29,232,950 | $232,099,188 | $357,207,778 |
| Reinvestment of distributions | 792,863 | 38,174 | 10,457,863 | 405,784 |
| Shares redeemed | (16,103,644) | (3,761,001) | (201,759,709) | (47,186,855) |
| Net increase (decrease) | 2,216,408 | 25,510,123 | $40,797,342 | $310,426,707 |
| Class Z | | | | |
| Shares sold | 139,605 | – | $1,609,269 | $– |
| Shares redeemed | (758) | – | (8,750) | – |
| Net increase (decrease) | 138,847 | – | $1,600,519 | $– |
(a) Share transactions for Class Z are for the period October 2, 2018 (commencement of sale of shares) to October 31, 2018
12. Other.
The Fund's organizational documents provide former and current trustees and officers with a limited indemnification against liabilities arising in connection with the performance of their duties to the Fund. In the normal course of business, the Fund may also enter into contracts that provide general indemnifications. The Fund's maximum exposure under these arrangements is unknown as this would be dependent on future claims that may be made against the Fund. The risk of material loss from such claims is considered remote.
Report of Independent Registered Public Accounting Firm
To the Board of Trustees of Fidelity Investment Trust and Shareholders of Fidelity Total Emerging Markets Fund:
Opinion on the Financial Statements
We have audited the accompanying statement of assets and liabilities, including the schedule of investments, of Fidelity Total Emerging Markets Fund (one of the funds constituting Fidelity Investment Trust, referred to hereafter as the "Fund") as of October 31, 2018, the related statement of operations for the year ended October 31, 2018, the statement of changes in net assets for each of the two years in the period ended October 31, 2018, including the related notes, and the financial highlights for each of the periods indicated therein (collectively referred to as the “financial statements”). In our opinion, the financial statements present fairly, in all material respects, the financial position of the Fund as of October 31, 2018, the results of its operations for the year then ended, the changes in its net assets for each of the two years in the period ended October 31, 2018 and the financial highlights for each of the periods indicated therein in conformity with accounting principles generally accepted in the United States of America.
Basis for Opinion
These financial statements are the responsibility of the Fund’s management. Our responsibility is to express an opinion on the Fund’s financial statements based on our audits. We are a public accounting firm registered with the Public Company Accounting Oversight Board (United States) (“PCAOB”) and are required to be independent with respect to the Fund in accordance with the U.S. federal securities laws and the applicable rules and regulations of the Securities and Exchange Commission and the PCAOB.
We conducted our audits of these financial statements in accordance with the standards of the PCAOB. Those standards require that we plan and perform the audit to obtain reasonable assurance about whether the financial statements are free of material misstatement, whether due to error or fraud.
Our audits included performing procedures to assess the risks of material misstatement of the financial statements, whether due to error or fraud, and performing procedures that respond to those risks. Such procedures included examining, on a test basis, evidence regarding the amounts and disclosures in the financial statements. Our audits also included evaluating the accounting principles used and significant estimates made by management, as well as evaluating the overall presentation of the financial statements. Our procedures included confirmation of securities owned as of October 31, 2018 by correspondence with the custodian and brokers; when replies were not received from brokers, we performed other auditing procedures. We believe that our audits provide a reasonable basis for our opinion.
PricewaterhouseCoopers LLP
Boston, Massachusetts
December 14, 2018
We have served as the auditor of one or more investment companies in the Fidelity group of funds since 1932.
Trustees and Officers
The Trustees, Members of the Advisory Board (if any), and officers of the trust and fund, as applicable, are listed below. The Board of Trustees governs the fund and is responsible for protecting the interests of shareholders. The Trustees are experienced executives who meet periodically throughout the year to oversee the fund's activities, review contractual arrangements with companies that provide services to the fund, oversee management of the risks associated with such activities and contractual arrangements, and review the fund's performance. Except for Jonathan Chiel, each of the Trustees oversees 283 funds. Mr. Chiel oversees 154 funds.
The Trustees hold office without limit in time except that (a) any Trustee may resign; (b) any Trustee may be removed by written instrument, signed by at least two-thirds of the number of Trustees prior to such removal; (c) any Trustee who requests to be retired or who has become incapacitated by illness or injury may be retired by written instrument signed by a majority of the other Trustees; and (d) any Trustee may be removed at any special meeting of shareholders by a two-thirds vote of the outstanding voting securities of the trust. Each Trustee who is not an interested person (as defined in the 1940 Act) of the trust and the fund is referred to herein as an Independent Trustee. Each Independent Trustee shall retire not later than the last day of the calendar year in which his or her 75th birthday occurs. The Independent Trustees may waive this mandatory retirement age policy with respect to individual Trustees. Officers and Advisory Board Members hold office without limit in time, except that any officer or Advisory Board Member may resign or may be removed by a vote of a majority of the Trustees at any regular meeting or any special meeting of the Trustees. Except as indicated, each individual has held the office shown or other offices in the same company for the past five years.
The fund’s Statement of Additional Information (SAI) includes more information about the Trustees. To request a free copy, call Fidelity at 1-877-208-0098.
Experience, Skills, Attributes, and Qualifications of the Trustees. The Governance and Nominating Committee has adopted a statement of policy that describes the experience, qualifications, attributes, and skills that are necessary and desirable for potential Independent Trustee candidates (Statement of Policy). The Board believes that each Trustee satisfied at the time he or she was initially elected or appointed a Trustee, and continues to satisfy, the standards contemplated by the Statement of Policy. The Governance and Nominating Committee also engages professional search firms to help identify potential Independent Trustee candidates who have the experience, qualifications, attributes, and skills consistent with the Statement of Policy. From time to time, additional criteria based on the composition and skills of the current Independent Trustees, as well as experience or skills that may be appropriate in light of future changes to board composition, business conditions, and regulatory or other developments, have also been considered by the professional search firms and the Governance and Nominating Committee. In addition, the Board takes into account the Trustees' commitment and participation in Board and committee meetings, as well as their leadership of standing and ad hoc committees throughout their tenure.
In determining that a particular Trustee was and continues to be qualified to serve as a Trustee, the Board has considered a variety of criteria, none of which, in isolation, was controlling. The Board believes that, collectively, the Trustees have balanced and diverse experience, qualifications, attributes, and skills, which allow the Board to operate effectively in governing the fund and protecting the interests of shareholders. Information about the specific experience, skills, attributes, and qualifications of each Trustee, which in each case led to the Board's conclusion that the Trustee should serve (or continue to serve) as a trustee of the fund, is provided below.
Board Structure and Oversight Function. James C. Curvey is an interested person and currently serves as Chairman. The Trustees have determined that an interested Chairman is appropriate and benefits shareholders because an interested Chairman has a personal and professional stake in the quality and continuity of services provided to the fund. Independent Trustees exercise their informed business judgment to appoint an individual of their choosing to serve as Chairman, regardless of whether the Trustee happens to be independent or a member of management. The Independent Trustees have determined that they can act independently and effectively without having an Independent Trustee serve as Chairman and that a key structural component for assuring that they are in a position to do so is for the Independent Trustees to constitute a substantial majority for the Board. The Independent Trustees also regularly meet in executive session. Ned C. Lautenbach serves as Chairman of the Independent Trustees and as such (i) acts as a liaison between the Independent Trustees and management with respect to matters important to the Independent Trustees and (ii) with management prepares agendas for Board meetings.
Fidelity® funds are overseen by different Boards of Trustees. The fund's Board oversees Fidelity's high income and certain equity funds, and other Boards oversee Fidelity's investment-grade bond, money market, asset allocation, and other equity funds. The asset allocation funds may invest in Fidelity® funds overseen by the fund's Board. The use of separate Boards, each with its own committee structure, allows the Trustees of each group of Fidelity® funds to focus on the unique issues of the funds they oversee, including common research, investment, and operational issues. On occasion, the separate Boards establish joint committees to address issues of overlapping consequences for the Fidelity® funds overseen by each Board.
The Trustees operate using a system of committees to facilitate the timely and efficient consideration of all matters of importance to the Trustees, the fund, and fund shareholders and to facilitate compliance with legal and regulatory requirements and oversight of the fund's activities and associated risks. The Board, acting through its committees, has charged FMR and its affiliates with (i) identifying events or circumstances the occurrence of which could have demonstrably adverse effects on the fund's business and/or reputation; (ii) implementing processes and controls to lessen the possibility that such events or circumstances occur or to mitigate the effects of such events or circumstances if they do occur; and (iii) creating and maintaining a system designed to evaluate continuously business and market conditions in order to facilitate the identification and implementation processes described in (i) and (ii) above. Because the day-to-day operations and activities of the fund are carried out by or through FMR, its affiliates, and other service providers, the fund's exposure to risks is mitigated but not eliminated by the processes overseen by the Trustees. While each of the Board's committees has responsibility for overseeing different aspects of the fund's activities, oversight is exercised primarily through the Operations, Audit, and Compliance Committees. In addition, the Independent Trustees have worked with Fidelity to enhance the Board's oversight of investment and financial risks, legal and regulatory risks, technology risks, and operational risks, including the development of additional risk reporting to the Board. Appropriate personnel, including but not limited to the fund's Chief Compliance Officer (CCO), FMR's internal auditor, the independent accountants, the fund's Treasurer and portfolio management personnel, make periodic reports to the Board's committees, as appropriate, including an annual review of Fidelity's risk management program for the Fidelity® funds. The responsibilities of each standing committee, including their oversight responsibilities, are described further under "Standing Committees of the Trustees."
Interested Trustees*:
Correspondence intended for a Trustee who is an interested person may be sent to Fidelity Investments, 245 Summer Street, Boston, Massachusetts 02210.
Name, Year of Birth; Principal Occupations and Other Relevant Experience+
Jonathan Chiel (1957)
Year of Election or Appointment: 2016
Trustee
Mr. Chiel also serves as Trustee of other Fidelity® funds. Mr. Chiel is Executive Vice President and General Counsel for FMR LLC (diversified financial services company, 2012-present). Previously, Mr. Chiel served as general counsel (2004-2012) and senior vice president and deputy general counsel (2000-2004) for John Hancock Financial Services; a partner with Choate, Hall & Stewart (1996-2000) (law firm); and an Assistant United States Attorney for the United States Attorney’s Office of the District of Massachusetts (1986-95), including Chief of the Criminal Division (1993-1995). Mr. Chiel is a director on the boards of the Boston Bar Foundation and the Maimonides School.
James C. Curvey (1935)
Year of Election or Appointment: 2007
Trustee
Chairman of the Board of Trustees
Mr. Curvey also serves as Trustee of other Fidelity® funds. Mr. Curvey is Vice Chairman (2007-present) and Director of FMR LLC (diversified financial services company). In addition, Mr. Curvey is an Overseer Emeritus for the Boston Symphony Orchestra, a Director of Artis-Naples, and a Trustee of Brewster Academy in Wolfeboro, New Hampshire. Previously, Mr. Curvey served as a Director of Fidelity Research & Analysis Co. (investment adviser firm, 2009-2018), Director of Fidelity Investments Money Management, Inc. (investment adviser firm, 2009-2014) and a Director of FMR and FMR Co., Inc. (investment adviser firms, 2007-2014).
Charles S. Morrison (1960)
Year of Election or Appointment: 2014
Trustee
Mr. Morrison also serves as Trustee of other funds. He serves as President of Fidelity SelectCo, LLC (investment adviser firm, 2017-present) and Fidelity Management & Research Company (FMR) (investment adviser firm, 2016-present), a Director of Fidelity Investments Money Management, Inc. (FIMM) (investment adviser firm, 2014-present), Director of Fidelity SelectCo, LLC (investment adviser firm, 2014-present), President, Asset Management (2014-present), and is an employee of Fidelity Investments. Previously, Mr. Morrison served as Vice President of Fidelity's Fixed Income and Asset Allocation Funds (2012-2014), President, Fixed Income (2011-2014), Vice President of Fidelity's Money Market Funds (2005-2009), President, Money Market Group Leader of FMR (investment adviser firm, 2009), and Senior Vice President, Money Market Group of FMR (2004-2009). Mr. Morrison also served as Vice President of Fidelity's Bond Funds (2002-2005), certain Balanced Funds (2002-2005), and certain Asset Allocation Funds (2002-2007), and as Senior Vice President (2002-2005) of Fidelity's Bond Division.
* Determined to be an “Interested Trustee” by virtue of, among other things, his or her affiliation with the trust or various entities under common control with FMR.
+ The information includes the Trustee's principal occupation during the last five years and other information relating to the experience, attributes, and skills relevant to the Trustee's qualifications to serve as a Trustee, which led to the conclusion that the Trustee should serve as a Trustee for the fund.
Independent Trustees:
Correspondence intended for an Independent Trustee may be sent to Fidelity Investments, P.O. Box 55235, Boston, Massachusetts 02205-5235.
Name, Year of Birth; Principal Occupations and Other Relevant Experience+
Dennis J. Dirks (1948)
Year of Election or Appointment: 2005
Trustee
Mr. Dirks also serves as Trustee of other Fidelity® funds. Prior to his retirement in May 2003, Mr. Dirks was Chief Operating Officer and a member of the Board of The Depository Trust & Clearing Corporation (DTCC). He also served as President, Chief Operating Officer, and Board member of The Depository Trust Company (DTC) and President and Board member of the National Securities Clearing Corporation (NSCC). In addition, Mr. Dirks served as Chief Executive Officer and Board member of the Government Securities Clearing Corporation, Chief Executive Officer and Board member of the Mortgage-Backed Securities Clearing Corporation, as a Trustee and a member of the Finance Committee of Manhattan College (2005-2008), as a Trustee and a member of the Finance Committee of AHRC of Nassau County (2006-2008), as a member of the Independent Directors Council (IDC) Governing Council (2010-2015), and as a member of the Board of Directors for The Brookville Center for Children’s Services, Inc. (2009-2017). Mr. Dirks is a member of the Finance Committee (2016-present), Board of Directors (2017-present) and Board of Trustees (2018-present) and is Treasurer (2018-present) of the Asolo Repertory Theatre.
Donald F. Donahue (1950)
Year of Election or Appointment: 2018
Trustee
Mr. Donahue also serves as a Trustee of other Fidelity® funds. Mr. Donahue is President and Chief Executive Officer of Miranda Partners, LLC (risk consulting for the financial services industry, 2012-present). Previously, Mr. Donahue served as a Member of the Advisory Board of certain Fidelity® funds (2015-2018) and Chief Executive Officer (2006-2012), Chief Operating Officer (2003-2006), and Managing Director, Customer Marketing and Development (1999-2003) of The Depository Trust & Clearing Corporation (financial markets infrastructure). Mr. Donahue serves as a Member (2007-present) and Co-Chairman (2016-present) of the Board of Directors of United Way of New York, Member of the Board of Directors of NYC Leadership Academy (2012-present) and Member of the Board of Advisors of Ripple Labs, Inc. (financial services, 2015-present). He also served as Chairman (2010-2012) and Member of the Board of Directors (2012-2013) of Omgeo, LLC (financial services), Treasurer of United Way of New York (2012-2016), and Member of the Board of Directors of XBRL US (financial services non-profit, 2009-2012) and the International Securities Services Association (2009-2012).
Alan J. Lacy (1953)
Year of Election or Appointment: 2008
Trustee
Mr. Lacy also serves as Trustee of other Fidelity® funds. Mr. Lacy serves as a Director of Bristol-Myers Squibb Company (global pharmaceuticals, 2008-present). He is a Trustee of the California Chapter of The Nature Conservancy (2015-present) and a Director of the Center for Advanced Study in the Behavioral Sciences at Stanford University (2015-present). In addition, Mr. Lacy served as Senior Adviser (2007-2014) of Oak Hill Capital Partners, L.P. (private equity) and also served as Chief Executive Officer (2005) and Vice Chairman (2005-2006) of Sears Holdings Corporation (retail) and Chief Executive Officer and Chairman of the Board of Sears, Roebuck and Co. (retail, 2000-2005). Previously, Mr. Lacy served as Chairman (2014-2017) and a member (2010-2017) of the Board of Directors of Dave & Buster’s Entertainment, Inc. (restaurant and entertainment complexes), as Chairman (2008-2011) and a member (2006-2015) of the Board of Trustees of the National Parks Conservation Association, and as a member of the Board of Directors for The Hillman Companies, Inc. (hardware wholesalers, 2010-2014), Earth Fare, Inc. (retail grocery, 2010-2014), and The Western Union Company (global money transfer, 2006-2011).
Ned C. Lautenbach (1944)
Year of Election or Appointment: 2000
Trustee
Chairman of the Independent Trustees
Mr. Lautenbach also serves as Trustee of other Fidelity® funds. Mr. Lautenbach currently serves as Vice Chair of the Board of Governors, State University System of Florida (2013-present) and is a member of the Council on Foreign Relations (1994-present). He is also a member and has most recently served as Chairman of the Board of Directors of Artis-Naples (2012-present). Previously, Mr. Lautenbach served as a member and then Lead Director of the Board of Directors of Eaton Corporation (diversified industrial, 1997-2016). He was also a Partner and Advisory Partner at Clayton, Dubilier & Rice, LLC (private equity investment, 1998-2010), as well as a Director of Sony Corporation (2006-2007). In addition, Mr. Lautenbach also had a 30-year career with IBM (technology company) during which time he served as Senior Vice President and a member of the Corporate Executive Committee (1968-1998).
Joseph Mauriello (1944)
Year of Election or Appointment: 2008
Trustee
Mr. Mauriello also serves as Trustee of other Fidelity® funds. Prior to his retirement in January 2006, Mr. Mauriello served in numerous senior management positions including Deputy Chairman and Chief Operating Officer (2004-2005), and Vice Chairman of Financial Services (2002-2004) of KPMG LLP US (professional services, 1965-2005). Mr. Mauriello currently serves as a member of the Independent Directors Council (IDC) Governing Council (2015-present). Previously, Mr. Mauriello served as a member of the Board of Directors of XL Group plc. (global insurance and re-insurance, 2006-2018).
Cornelia M. Small (1944)
Year of Election or Appointment: 2005
Trustee
Ms. Small also serves as Trustee of other Fidelity® funds. Ms. Small is a member of the Board of Directors (2009-present) and Chair of the Investment Committee (2010-present) of the Teagle Foundation. Ms. Small also serves on the Investment Committee of the Berkshire Taconic Community Foundation (2008-present). Previously, Ms. Small served as Chairperson (2002-2008) and a member of the Investment Committee and Chairperson (2008-2012) and a member of the Board of Trustees of Smith College. In addition, Ms. Small served as Chief Investment Officer, Director of Global Equity Investments, and a member of the Board of Directors of Scudder, Stevens & Clark and Scudder Kemper Investments.
Garnett A. Smith (1947)
Year of Election or Appointment: 2018
Trustee
Mr. Smith also serves as Trustee of other Fidelity® funds. Prior to Mr. Smith's retirement, he served as Chairman and Chief Executive Officer of Inbrand Corp. (manufacturer of personal absorbent products, 1990-1997). He also served as President (1986-1990) of Inbrand Corp. Prior to his employment with Inbrand Corp., he was employed by a retail fabric chain and North Carolina National Bank. In addition, Mr. Smith served as a Member of the Advisory Board of certain Fidelity® funds (2012-2013) and as a board member of the Jackson Hole Land Trust (2009-2012).
David M. Thomas (1949)
Year of Election or Appointment: 2008
Trustee
Mr. Thomas also serves as Trustee of other Fidelity® funds. Mr. Thomas serves as Non-Executive Chairman of the Board of Directors of Fortune Brands Home and Security (home and security products, 2011-present), as a member of the Board of Directors (2004-present) and Presiding Director (2013-present) of Interpublic Group of Companies, Inc. (marketing communication), and as a member of the Board of Trustees of the University of Florida (2013-present). Previously, Mr. Thomas served as Executive Chairman (2005-2006) and Chairman and Chief Executive Officer (2000-2005) of IMS Health, Inc. (pharmaceutical and healthcare information solutions), and a Director of Fortune Brands, Inc. (consumer products, 2000-2011).
+ The information includes the Trustee's principal occupation during the last five years and other information relating to the experience, attributes, and skills relevant to the Trustee's qualifications to serve as a Trustee, which led to the conclusion that the Trustee should serve as a Trustee for the fund.
Advisory Board Members and Officers:
Correspondence intended for a Member of the Advisory Board (if any) may be sent to Fidelity Investments, P.O. Box 55235, Boston, Massachusetts 02205-5235. Correspondence intended for an officer or Peter S. Lynch may be sent to Fidelity Investments, 245 Summer Street, Boston, Massachusetts 02210. Officers appear below in alphabetical order.
Name, Year of Birth; Principal Occupation
Vicki L. Fuller (1957)
Year of Election or Appointment: 2018
Member of the Advisory Board
Ms. Fuller also serves as Member of the Advisory Board of other Fidelity® funds. Ms. Fuller serves as a member of the Board of Directors, Audit Committee, and Nominating and Governance Committee of The Williams Companies, Inc. (natural gas infrastructure, 2018-present). Previously, Ms. Fuller served as the Chief Investment Officer of the New York State Common Retirement Fund (2012-2018) and held a variety of positions at AllianceBernstein L.P. (global asset management, 1985-2012), including Managing Director (2006-2012) and Senior Vice President and Senior Portfolio Manager (2001-2006).
Peter S. Lynch (1944)
Year of Election or Appointment: 2003
Member of the Advisory Board
Mr. Lynch also serves as Member of the Advisory Board of other Fidelity® funds. Mr. Lynch is Vice Chairman and a Director of FMR (investment adviser firm) and FMR Co., Inc. (investment adviser firm). In addition, Mr. Lynch serves as a Trustee of Boston College and as the Chairman of the Inner-City Scholarship Fund. Previously, Mr. Lynch served on the Special Olympics International Board of Directors (1997-2006).
William S. Stavropoulos (1939)
Year of Election or Appointment: 2018
Member of the Advisory Board
Mr. Stavropoulos also serves as Member of the Advisory Board of other Fidelity® funds. Mr. Stavropoulos serves as President and Founder of the Michigan Baseball Foundation, the Great Lakes Loons (2007-present). Mr. Stavropoulos is Chairman Emeritus of the Board of Directors of The Dow Chemical Company, where he previously served in numerous senior management positions, including President, CEO (1995-2000; 2002-2004), Chairman of the Executive Committee (2000-2006), and as a member of the Board of Directors (1990-2006). Currently, Mr. Stavropoulos is Chairman of the Board of Directors of Univar Inc. (global distributor of commodity and specialty chemicals), a Director of Teradata Corporation (data warehousing and technology solutions), and a member of the Advisory Board for Metalmark Capital LLC (private equity investment, 2005-present). Mr. Stavropoulos is an operating advisor to Clayton, Dubilier & Rice, LLC (private equity investment). In addition, Mr. Stavropoulos is a member of the University of Notre Dame Advisory Council for the College of Science, a Trustee of the Rollin L. Gerstacker Foundation, and a Director of Artis-Naples in Naples, Florida. Previously, Mr. Stavropoulos served as Trustee of certain Fidelity® funds (2001-2018) and as a Director of Chemical Financial Corporation (bank holding company, 1993-2012) and Tyco International, Ltd. (multinational manufacturing and services, 2007-2012).
Carol B. Tomé (1957)
Year of Election or Appointment: 2018
Member of the Advisory Board
Ms. Tomé also serves as Member of the Advisory Board of other Fidelity® funds. Ms. Tomé is Chief Financial Officer (2001-present) and Executive Vice President of Corporate Services (2007-present) of The Home Depot, Inc. (home improvement retailer) and a Director (2003-present) and Chair of the Audit Committee (2004-present) of United Parcel Service, Inc. (package delivery and supply chain management). Previously, Ms. Tomé served as Trustee of certain Fidelity® funds (2017), Senior Vice President of Finance and Accounting/Treasurer (2000-2007) and Vice President and Treasurer (1995-2000) of The Home Depot, Inc. and Chair of the Board (2010-2012), Vice Chair of the Board (2009 and 2013), and a Director (2008-2013) of the Federal Reserve Bank of Atlanta. Ms. Tomé is also a director or trustee of many community and professional organizations.
Michael E. Wiley (1950)
Year of Election or Appointment: 2018
Member of the Advisory Board
Mr. Wiley also serves as Trustee or Member of the Advisory Board of other Fidelity® funds. Mr. Wiley serves as a Director of High Point Resources (exploration and production, 2005-present). Previously, Mr. Wiley served as a Director of Andeavor Corporation (independent oil refiner and marketer, 2005-2018), a Director of Andeavor Logistics LP (natural resources logistics, 2015-2018), a Director of Post Oak Bank (privately-held bank, 2004-2018), a Director of Asia Pacific Exploration Consolidated (international oil and gas exploration and production, 2008-2013), a member of the Board of Trustees of the University of Tulsa (2000-2006; 2007-2010), a Senior Energy Advisor of Katzenbach Partners, LLC (consulting, 2006-2007), an Advisory Director of Riverstone Holdings (private investment), a Director of Spinnaker Exploration Company (exploration and production, 2001-2005) and Chairman, President, and CEO of Baker Hughes, Inc. (oilfield services, 2000-2004).
Elizabeth Paige Baumann (1968)
Year of Election or Appointment: 2017
Anti-Money Laundering (AML) Officer
Ms. Baumann also serves as AML Officer of other funds. She is Chief AML Officer (2012-present) and Senior Vice President (2014-present) of FMR LLC (diversified financial services company) and is an employee of Fidelity Investments. Previously, Ms. Baumann served as AML Officer of the funds (2012-2016), and Vice President (2007-2014) and Deputy Anti-Money Laundering Officer (2007-2012) of FMR LLC.
John J. Burke III (1964)
Year of Election or Appointment: 2018
Chief Financial Officer
Mr. Burke also serves as Chief Financial Officer of other funds. Mr. Burke serves as Head of Investment Operations for Fidelity Fund and Investment Operations (2018-present) and is an employee of Fidelity Investments (1998-present). Previously Mr. Burke served as head of Asset Management Investment Operations (2012-2018).
William C. Coffey (1969)
Year of Election or Appointment: 2018
Secretary and Chief Legal Officer (CLO)
Mr. Coffey also serves as Secretary and CLO of other funds. Mr. Coffey serves as CLO, Secretary, and Senior Vice President of Fidelity Management & Research Company and FMR Co., Inc. (investment adviser firms, 2018-present); Secretary of Fidelity SelectCo, LLC and Fidelity Investments Money Management, Inc. (investment adviser firms, 2018-present); and CLO of Fidelity Management & Research (Hong Kong) Limited, FMR Investment Management (UK) Limited, and Fidelity Management & Research (Japan) Limited (investment adviser firms, 2018-present). He is Senior Vice President and Deputy General Counsel of FMR LLC (diversified financial services company, 2010-present), and is an employee of Fidelity Investments. Previously, Mr. Coffey served as Assistant Secretary of certain funds (2009-2018) and as Vice President and Associate General Counsel of FMR LLC (2005-2009).
Timothy M. Cohen (1969)
Year of Election or Appointment: 2018
Vice President
Mr. Cohen also serves as Vice President of other funds. Mr. Cohen serves as Co-Head of Global Equity Research (2016-present), a Director of Fidelity Management & Research (Japan) Limited (investment adviser firm, 2016-present), and is an employee of Fidelity Investments. Previously, Mr. Cohen served as Chief Investment Officer - Equity and a Director of Fidelity Management & Research (U.K.) Inc. (investment adviser firm, 2013-2015) and as a Director of Fidelity Management & Research (Hong Kong) Limited (investment adviser firm, 2017).
Jonathan Davis (1968)
Year of Election or Appointment: 2010
Assistant Treasurer
Mr. Davis also serves as Assistant Treasurer of other funds. Mr. Davis serves as Assistant Treasurer of FMR Capital, Inc. (2017-present) and is an employee of Fidelity Investments. Previously, Mr. Davis served as Vice President and Associate General Counsel of FMR LLC (diversified financial services company, 2003-2010).
Adrien E. Deberghes (1967)
Year of Election or Appointment: 2016
Assistant Treasurer
Mr. Deberghes also serves as an officer of other funds. He serves as Assistant Treasurer of FMR Capital, Inc. (2017-present), Executive Vice President of Fidelity Investments Money Management, Inc. (FIMM) (investment adviser firm, 2016-present), and is an employee of Fidelity Investments (2008-present). Previously, Mr. Deberghes served as President and Treasurer of certain Fidelity® funds (2013-2018). Prior to joining Fidelity Investments, Mr. Deberghes was Senior Vice President of Mutual Fund Administration at State Street Corporation (2007-2008), Senior Director of Mutual Fund Administration at Investors Bank & Trust (2005-2007), and Director of Finance for Dunkin' Brands (2000-2005). Previously, Mr. Deberghes served in other fund officer roles.
Laura M. Del Prato (1964)
Year of Election or Appointment: 2018
Assistant Treasurer
Ms. Del Prato also serves as an officer of other funds. Ms. Del Prato is an employee of Fidelity Investments (2017-present). Prior to joining Fidelity Investments, Ms. Del Prato served as a Managing Director and Treasurer of the JPMorgan Mutual Funds (2014-2017). Prior to JPMorgan, Ms. Del Prato served as a partner at Cohen Fund Audit Services (accounting firm, 2012-2013) and KPMG LLP (accounting firm, 2004-2012).
Colm A. Hogan (1973)
Year of Election or Appointment: 2016
Deputy Treasurer
Mr. Hogan also serves as an officer of other funds. Mr. Hogan serves as Assistant Treasurer of FMR Capital, Inc. (2017-present) and is an employee of Fidelity Investments (2005-present). Previously, Mr. Hogan served as Assistant Treasurer of certain Fidelity® funds (2016-2018).
Pamela R. Holding (1964)
Year of Election or Appointment: 2018
Vice President
Ms. Holding also serves as Vice President of other funds. Ms. Holding serves as Co-Head of Global Equity Research (2018-present) and is an employee of Fidelity Investments (2013-present).
Chris Maher (1972)
Year of Election or Appointment: 2013
Assistant Treasurer
Mr. Maher serves as Assistant Treasurer of other funds. Mr. Maher is Vice President of Valuation Oversight, serves as Assistant Treasurer of FMR Capital, Inc. (2017-present), and is an employee of Fidelity Investments. Previously, Mr. Maher served as Vice President of Asset Management Compliance (2013), Vice President of the Program Management Group of FMR (investment adviser firm, 2010-2013), and Vice President of Valuation Oversight (2008-2010).
Rieco E. Mello (1969)
Year of Election or Appointment: 2017
Assistant Treasurer
Mr. Mello also serves as Assistant Treasurer of other funds. Mr. Mello serves as Assistant Treasurer of FMR Capital, Inc. (2017-present) and is an employee of Fidelity Investments (1995-present).
Kenneth B. Robins (1969)
Year of Election or Appointment: 2016
Chief Compliance Officer
Mr. Robins also serves as an officer of other funds. Mr. Robins serves as Compliance Officer of Fidelity Management & Research Company and FMR Co., Inc. (investment adviser firms, 2016-present) and is an employee of Fidelity Investments (2004-present). Previously, Mr. Robins served as Executive Vice President of Fidelity Investments Money Management, Inc. (investment adviser firm, 2013-2016) and served in other fund officer roles.
Stacie M. Smith (1974)
Year of Election or Appointment: 2016
President and Treasurer
Ms. Smith also serves as an officer of other funds. Ms. Smith serves as Assistant Treasurer of FMR Capital, Inc. (2017-present), is an employee of Fidelity Investments (2009-present), and has served in other fund officer roles. Prior to joining Fidelity Investments, Ms. Smith served as Senior Audit Manager of Ernst & Young LLP (accounting firm, 1996-2009). Previously, Ms. Smith served as Assistant Treasurer (2013-2018) and Deputy Treasurer (2013-2016) of certain Fidelity® funds.
Marc L. Spector (1972)
Year of Election or Appointment: 2016
Assistant Treasurer
Mr. Spector also serves as an officer of other funds. Mr. Spector serves as Assistant Treasurer of FMR Capital, Inc. (2017-present) and is an employee of Fidelity Investments (2016-present). Prior to joining Fidelity Investments, Mr. Spector served as Director at the Siegfried Group (accounting firm, 2013-2016), and prior to Siegfried Group as audit senior manager at Deloitte & Touche (accounting firm, 2005-2013).
Shareholder Expense Example
As a shareholder of the Fund, you incur two types of costs: (1) transaction costs, including sales charges (loads) on purchase payments or redemption proceeds, redemption fees and (2) ongoing costs, including management fees, distribution and/or service (12b-1) fees and other Fund expenses. This Example is intended to help you understand your ongoing costs (in dollars) of investing in the Fund and to compare these costs with the ongoing costs of investing in other mutual funds.
The actual expense Example is based on an investment of $1,000 invested at the beginning of the period and held for the entire period (May 1, 2018 to October 31, 2018) for Class A, Class M, Class C, Total Emerging Markets and Class I, and for the period (October 2, 2018 to October 31, 2018) for Class Z. The hypothetical expense Example is based on an investment of $1,000 invested for one-half year period (May 1, 2018 to October 31, 2018).
Actual Expenses
The first line of the accompanying table for each class of the Fund provides information about actual account values and actual expenses. You may use the information in this line, together with the amount you invested, to estimate the expenses that you paid over the period. Simply divide your account value by $1,000.00 (for example, an $8,600 account value divided by $1,000.00 = 8.6), then multiply the result by the number in the first line for a class of the Fund under the heading entitled "Expenses Paid During Period" to estimate the expenses you paid on your account during this period. A small balance maintenance fee of $12.00 that is charged once a year may apply for certain accounts with a value of less than $2,000. This fee, which was eliminated effective August 1, 2018, is not included in the table below. If it was, the estimate of expenses you paid during the period would be higher, and your ending account value lower, by this amount. In addition, the Fund, as a shareholder in the underlying Fidelity Central Funds, will indirectly bear its pro-rata share of the fees and expenses incurred by the underlying Fidelity Central Funds. These fees and expenses are not included in the Fund's annualized expense ratio used to calculate the expense estimate in the table below.
Hypothetical Example for Comparison Purposes
The second line of the accompanying table for each class of the Fund provides information about hypothetical account values and hypothetical expenses based on a Class' actual expense ratio and an assumed rate of return of 5% per year before expenses, which is not the Class' actual return. The hypothetical account values and expenses may not be used to estimate the actual ending account balance or expenses you paid for the period. You may use this information to compare the ongoing costs of investing in the Fund and other funds. To do so, compare this 5% hypothetical example with the 5% hypothetical examples that appear in the shareholder reports of the other funds. A small balance maintenance fee of $12.00 that is charged once a year may apply for certain accounts with a value of less than $2,000. This fee, which was eliminated effective August 1, 2018, is not included in the table below. If it was, the estimate of expenses you paid during the period would be higher, and your ending account value lower, by this amount. In addition, the Fund, as a shareholder in the underlying Fidelity Central Funds, will indirectly bear its pro-rata share of the fees and expenses incurred by the underlying Fidelity Central Funds. These fees and expenses are not included in the Fund's annualized expense ratio used to calculate the expense estimate in the table below.
Please note that the expenses shown in the table are meant to highlight your ongoing costs only and do not reflect any transaction costs. Therefore, the second line of the table is useful in comparing ongoing costs only, and will not help you determine the relative total costs of owning different funds. In addition, if these transactional costs were included, your costs would have been higher.
| | Annualized Expense Ratio-A | Beginning
Account Value | Ending
Account Value October 31, 2018 | Expenses Paid
During Period |
| Class A | 1.41% | | | |
| Actual | | $1,000.00 | $865.00 | $6.63-B |
| Hypothetical-C | | $1,000.00 | $1,018.10 | $7.17-D |
| Class M | 1.75% | | | |
| Actual | | $1,000.00 | $863.50 | $8.22-B |
| Hypothetical-C | | $1,000.00 | $1,016.38 | $8.89-D |
| Class C | 2.15% | | | |
| Actual | | $1,000.00 | $861.70 | $10.09-B |
| Hypothetical-C | | $1,000.00 | $1,014.37 | $10.92-D |
| Total Emerging Markets | 1.14% | | | |
| Actual | | $1,000.00 | $865.90 | $5.36-B |
| Hypothetical-C | | $1,000.00 | $1,019.46 | $5.80-D |
| Class I | 1.13% | | | |
| Actual | | $1,000.00 | $865.80 | $5.31-B |
| Hypothetical-C | | $1,000.00 | $1,019.51 | $5.75-D |
| Class Z | 1.04% | | | |
| Actual | | $1,000.00 | $949.10 | $.83-B |
| Hypothetical-C | | $1,000.00 | $1,019.96 | $5.30-D |
A Annualized expense ratio reflects expenses net of applicable fee waivers.
B Actual expenses are equal to each Class' annualized expense ratio, multiplied by the average account value over the period, multiplied by 184/ 365 (to reflect the one-half year period) for Class A, Class M, Class C, Total Emerging Markets and Class I, and multiplied by 30/365 (to reflect the period October 2, 2018 to October 31, 2018) for Class Z.
C 5% return per year before expenses
D Hypothetical expenses are equal to each Class' annualized expense ratio, multiplied by the average account value over the period, multiplied by 184/ 365 (to reflect the one-half year period).
Distributions (Unaudited)
Class A designates 37%; Class M designates 41%; Class C designates 48%; Total Emerging Markets designates 35%; and Class I designates 34%; of the dividends distributed in December 2017, during the fiscal year as amounts which may be taken into account as a dividend for purposes of the maximum rate under section 1(h)(11) of the Internal Revenue Code.
The amounts per share which represent income derived from sources within, and taxes paid to, foreign countries or possessions of the United States are as follows:
| | Pay Date | Income | Taxes |
| Fidelity Total Emerging Markets Fund | | | |
| Class A | 12/18/17 | $0.2118 | $0.0135 |
| Class M | 12/18/17 | $0.1914 | $0.0135 |
| Class C | 12/18/17 | $0.1635 | $0.0135 |
| Total Emerging Markets | 12/18/17 | $0.2247 | $0.0135 |
| Class I | 12/18/17 | $0.2330 | $0.0135 |
|
The fund will notify shareholders in January 2019 of amounts for use in preparing 2018 income tax returns.
Board Approval of Investment Advisory Contracts
Fidelity Total Emerging Markets Fund
At its July 2018 meeting, the Board of Trustees, including the Independent Trustees (together, the Board), voted to continue the management contract with Fidelity Management & Research Company (FMR) and the sub-advisory agreements (together, the Advisory Contracts) for the fund for six months through January 31, 2019, in connection with the reunification of the Fidelity Equity High Income Funds Board, which oversees the fund, and the Sector Portfolios Board.
The Board considered that the approval of the fund's Advisory Contracts will not result in any changes in (i) the investment process or strategies employed in the management of the fund's assets; (ii) the fees and expenses paid by shareholders, including the expense cap arrangement currently in place for the fund; (iii) the nature, extent or quality of services provided under the fund's Advisory Contracts; or (iv) the day-to-day management of the fund or the persons primarily responsible for such management. The Board concluded that the fund's Advisory Contracts are fair and reasonable, and that the fund's Advisory Contracts should be renewed, without modification, through January 31, 2019, with the understanding that the Board will consider the annual renewal for a full one year period in January 2019.
In connection with its consideration of future renewals of the fund's Advisory Contracts, the Board will consider: (i) the nature, extent and quality of services provided to the fund, including shareholder and administrative services and investment performance; (ii) the competitiveness of the management fee and total expenses for the fund; (iii) the costs of the services and profitability, including the revenues earned and the expenses incurred in conducting the business of developing, marketing, distributing, managing, administering, and servicing the fund and its shareholders, to the extent applicable, as well as potential fall-out benefits from Fidelity's non-fund businesses; and (iv) whether there have been economies of scale in respect of the Fidelity funds, whether the Fidelity funds (including the fund) have appropriately benefited from any such economies of scale, and whether there is the potential for realization of any further economies.
Based on its evaluation of all of the conclusions noted above, and after considering all factors it believed relevant, the Board ultimately concluded that the fund's management fee structure is fair and reasonable, and that the continuation of the fund's Advisory Contracts should be approved.
ATEK-ANN-1218
1.931268.106
Fidelity Advisor® Emerging Markets Discovery Fund - Class A, Class M, Class C, Class I and Class Z
Annual Report October 31, 2018 Class A, Class M, Class C, Class I and Class Z are classes of Fidelity® Emerging Markets Discovery Fund |
|
Contents
To view a fund's proxy voting guidelines and proxy voting record for the 12-month period ended June 30, visit http://www.fidelity.com/proxyvotingresults or visit the Securities and Exchange Commission's (SEC) web site at http://www.sec.gov.
You may also call 1-877-208-0098 to request a free copy of the proxy voting guidelines.
Standard & Poor's, S&P and S&P 500 are registered service marks of The McGraw-Hill Companies, Inc. and have been licensed for use by Fidelity Distributors Corporation.
Other third-party marks appearing herein are the property of their respective owners.
All other marks appearing herein are registered or unregistered trademarks or service marks of FMR LLC or an affiliated company. © 2018 FMR LLC. All rights reserved.
This report and the financial statements contained herein are submitted for the general information of the shareholders of the Fund. This report is not authorized for distribution to prospective investors in the Fund unless preceded or accompanied by an effective prospectus.
A fund files its complete schedule of portfolio holdings with the SEC for the first and third quarters of each fiscal year on Form N-Q. Forms N-Q are available on the SEC’s web site at http://www.sec.gov. A fund's Forms N-Q may be reviewed and copied at the SEC’s Public Reference Room in Washington, DC. Information regarding the operation of the SEC's Public Reference Room may be obtained by calling 1-800-SEC-0330.
For a complete list of a fund's portfolio holdings, view the most recent holdings listing, semiannual report, or annual report on Fidelity's web site at http://www.fidelity.com, http://www.institutional.fidelity.com, or http://www.401k.com, as applicable.
NOT FDIC INSURED •MAY LOSE VALUE •NO BANK GUARANTEE
Neither the Fund nor Fidelity Distributors Corporation is a bank.
Performance: The Bottom Line
Average annual total return reflects the change in the value of an investment, assuming reinvestment of distributions from dividend income and capital gains (the profits earned upon the sale of securities that have grown in value, if any) and assuming a constant rate of performance each year. The hypothetical investment and the average annual total returns do not reflect the deduction of taxes that a shareholder would pay on fund distributions or the redemption of fund shares. During periods of reimbursement by Fidelity, a fund’s total return will be greater than it would be had the reimbursement not occurred. How a fund did yesterday is no guarantee of how it will do tomorrow.
Average Annual Total Returns
| For the periods ended October 31, 2018 | Past 1 year | Past 5 years | Life of fundA |
| Class A (incl. 5.75% sales charge) | (23.09)% | (0.64)% | 3.07% |
| Class M (incl. 3.50% sales charge) | (21.43)% | (0.41)% | 3.16% |
| Class C (incl. contingent deferred sales charge) | (19.76)% | (0.20)% | 3.17% |
| Class I | (18.06)% | 0.84% | 4.24% |
| Class Z | (18.06)% | 0.84% | 4.24% |
A From November 1, 2011
Class C shares' contingent deferred sales charges included in the past one year, past five years, and life of fund total return figures are 1%, 0%, and 0%, respectively.
The initial offering of Class Z shares took place on October 2, 2018. Returns prior to October 2, 2018, are those of Class I.
$10,000 Over Life of Fund
Let's say hypothetically that $10,000 was invested in Fidelity Advisor® Emerging Markets Discovery Fund - Class A on November 1, 2011, when the fund started, and the current 5.75% sales charge was paid.
The chart shows how the value of your investment would have changed, and also shows how the MSCI Emerging Markets SMID Cap Index performed over the same period.
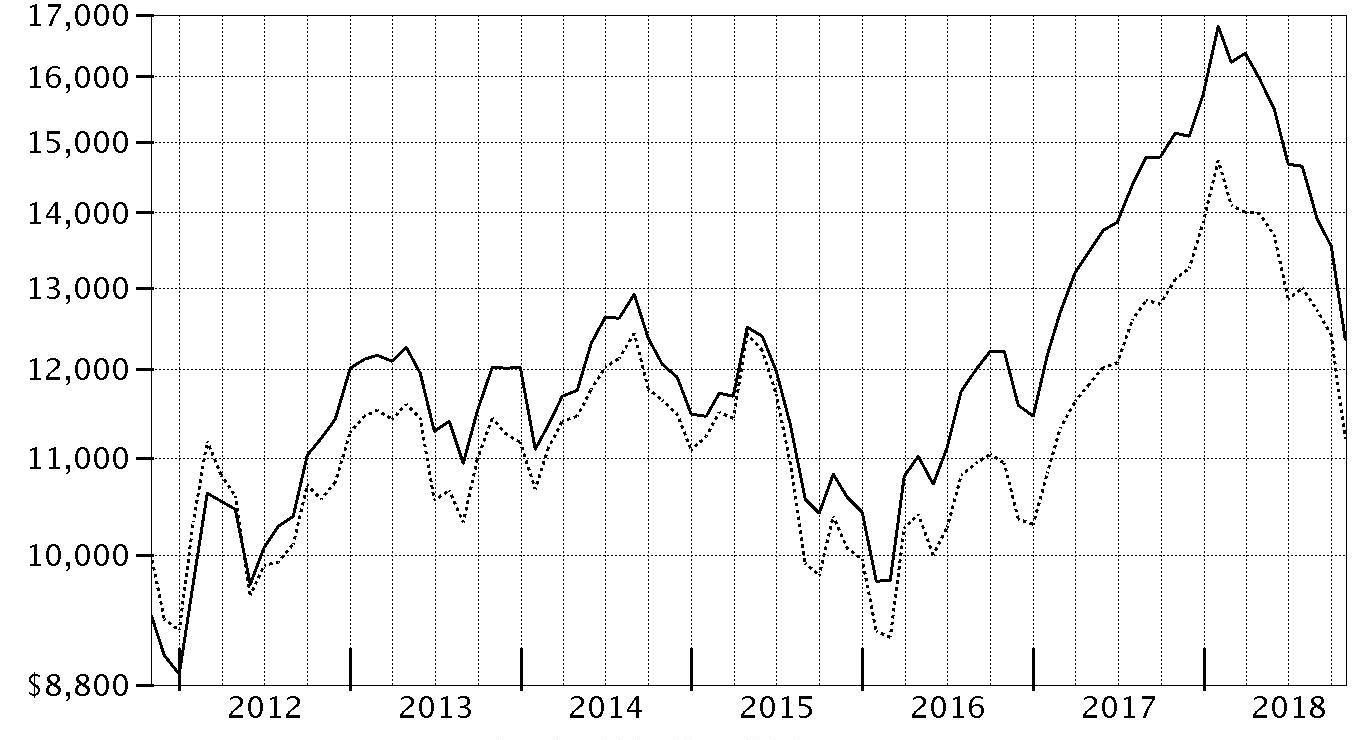
| Period Ending Values |
| $12,355 | Fidelity Advisor® Emerging Markets Discovery Fund - Class A |
| $11,209 | MSCI Emerging Markets SMID Cap Index |
Management's Discussion of Fund Performance
Market Recap: International equities returned -8.08% for the 12 months ending October 31, 2018, according to the MSCI ACWI (All Country World Index) ex USA Index. A modestly positive first half of the period gave way to a confluence of overwhelmingly negative factors – including escalating trade tension, a surging U.S. dollar, tepid economic growth in Europe, global central bank tightening, concerns about Italy’s budget stalemate with the EU, and weakness in China’s stock market – that yielded a -11% second-half return. The index lost 8% in October alone, its largest monthly drop in more than six years. Among sectors, new-media-infused communications services (-15%) was hit the hardest, while economically sensitive consumer discretionary (-13%), information technology (-12%), financials (-10%), industrials (-9%) and materials (-7%) stocks also fared poorly. Even the more defensive real estate (-9%), utilities (-6%) and consumer staples (-5%) sectors weren’t spared this period. Conversely, elevated crude-oil prices fueled a positive return for energy (+7%), the top-performing sector, followed by the relatively stable-growing health care segment (+2%). Regionally, emerging markets (-12%) fared the worst, hampered by the impact of foreign exchange and concerns about economic weakness in China, India and South Korea. Sluggish growth also pressured shares in continental Europe (-9%). Stocks in Japan (-3%) and the U.K. (-4%) held up better, followed by Canada (-5%) and Asia-Pacific ex Japan (-6%).
Comments from Co-Portfolio Manager James Hayes: For the fiscal year, the fund’s share classes (excluding sales charges, if applicable) returned about -18% to -19%, lagging the -14.51% result of the benchmark MSCI Emerging Markets SMID Cap Index. Heightened concerns related to a number of geopolitical and macro factors weighed heavily on emerging-markets equities the past 12 months. This made for a challenging environment for security selection, which was the primary detractor from the fund’s performance versus the benchmark. Our choices in South Korea, China and Taiwan hurt our relative result most. By sector, picks among consumer discretionary, information technology and materials notably hurt relative performance. Conversely, stock selection in industrials was a plus versus the benchmark. Our cash position of roughly 3%, on average, was another positive against the market’s steep decline. A position in Chinese software firm Kingsoft, which we established the past 12 months, was the largest detractor. Shares of Kingsoft plunged in July, along with other Chinese game developers, after the government called for tighter industry-wide regulations. Conversely, it helped most to own TCI, a Taiwan-based manufacturer and distributor of health foods and beauty care. The firm reported solid year-over-year sales, and also raised its revenue outlook for 2018.
The views expressed above reflect those of the portfolio manager(s) only through the end of the period as stated on the cover of this report and do not necessarily represent the views of Fidelity or any other person in the Fidelity organization. Any such views are subject to change at any time based upon market or other conditions and Fidelity disclaims any responsibility to update such views. These views may not be relied on as investment advice and, because investment decisions for a Fidelity fund are based on numerous factors, may not be relied on as an indication of trading intent on behalf of any Fidelity fund.
Notes to shareholders: On May 31, 2018, Xiaoting Zhao assumed co-management responsibilities for the fund. On June 30, 2018, Jane Wu assumed portfolio management responsibilities for the fund's health care sleeve, replacing Tim Gannon. On December 1, 2018, Xiaoting Zhao assumed portfolio management responsibilities for the fund's telecommunications services subportfolio, succeeding James Hayes.
Investment Summary (Unaudited)
Top Five Stocks as of October 31, 2018
| | % of fund's net assets |
| Fu Shou Yuan International Group Ltd. (Cayman Islands, Diversified Consumer Services) | 2.0 |
| Samsonite International SA (Luxembourg, Textiles, Apparel & Luxury Goods) | 1.7 |
| Fourlis Holdings SA (Greece, Specialty Retail) | 1.4 |
| B2W Companhia Global do Varejo (Brazil, Internet & Direct Marketing Retail) | 1.3 |
| Titan Cement Co. SA (Reg.) (Greece, Construction Materials) | 1.3 |
| | 7.7 |
Top Five Market Sectors as of October 31, 2018
| | % of fund's net assets |
| Consumer Discretionary | 16.4 |
| Industrials | 14.5 |
| Financials | 13.3 |
| Materials | 11.3 |
| Health Care | 7.9 |
Top Five Countries as of October 31, 2018
| (excluding cash equivalents) | % of fund's net assets |
| Cayman Islands | 10.6 |
| Brazil | 10.6 |
| India | 9.9 |
| Korea (South) | 7.8 |
| China | 6.7 |
Percentages are adjusted for the effect of futures contracts, if applicable.
Asset Allocation (% of fund's net assets)
| As of October 31, 2018 |
| | Stocks and Equity Futures | 95.3% |
| | Short-Term Investments and Net Other Assets (Liabilities) | 4.7% |

Schedule of Investments October 31, 2018
Showing Percentage of Net Assets
| Common Stocks - 90.0% | | | |
| | | Shares | Value |
| Argentina - 0.5% | | | |
| BBVA Banco Frances SA sponsored ADR | | 46,000 | $504,620 |
| Central Puerto SA sponsored ADR | | 43,500 | 416,730 |
| Inversiones y Representaciones SA ADR | | 24,727 | 330,600 |
|
| TOTAL ARGENTINA | | | 1,251,950 |
|
| Bangladesh - 0.3% | | | |
| BRAC Bank Ltd. | | 978,600 | 821,382 |
| Bermuda - 2.6% | | | |
| AGTech Holdings Ltd. (a) | | 13,120,000 | 677,587 |
| Cosan Ltd. Class A | | 62,500 | 521,875 |
| Joy City Property Ltd. | | 4,825,000 | 510,683 |
| Kunlun Energy Co. Ltd. | | 408,400 | 463,502 |
| Pacific Basin Shipping Ltd. | | 9,504,000 | 2,072,423 |
| Shangri-La Asia Ltd. | | 2,212,000 | 3,018,178 |
|
| TOTAL BERMUDA | | | 7,264,248 |
|
| Brazil - 8.8% | | | |
| Azul SA sponsored ADR (a) | | 95,400 | 2,325,852 |
| B2W Companhia Global do Varejo (a) | | 399,520 | 3,703,732 |
| BR Malls Participacoes SA | | 407,100 | 1,389,270 |
| BTG Pactual Participations Ltd. unit | | 145,800 | 774,544 |
| Companhia de Saneamento de Minas Gerais | | 84,620 | 1,166,467 |
| Construtora Tenda SA (a) | | 86,300 | 661,599 |
| Direcional Engenharia SA | | 527,900 | 1,012,819 |
| Equatorial Energia SA | | 67,600 | 1,235,019 |
| Fibria Celulose SA | | 107,700 | 2,079,335 |
| Localiza Rent A Car SA | | 353,385 | 2,730,033 |
| Natura Cosmeticos SA | | 143,500 | 1,256,661 |
| Notre Dame Intermedica Participacoes SA | | 302,517 | 1,961,503 |
| QGEP Participacoes SA | | 592,500 | 1,910,520 |
| Tegma Gestao Logistica SA | | 371,100 | 2,291,516 |
|
| TOTAL BRAZIL | | | 24,498,870 |
|
| British Virgin Islands - 0.4% | | | |
| Dolphin Capital Investors Ltd. (a) | | 8,361,857 | 649,304 |
| Mail.Ru Group Ltd. GDR (Reg. S) (a) | | 19,000 | 506,160 |
|
| TOTAL BRITISH VIRGIN ISLANDS | | | 1,155,464 |
|
| Canada - 0.6% | | | |
| Pan American Silver Corp. | | 121,600 | 1,785,088 |
| Cayman Islands - 10.6% | | | |
| Airtac International Group | | 171,000 | 1,471,924 |
| ASM Pacific Technology Ltd. | | 61,600 | 531,796 |
| Chailease Holding Co. Ltd. | | 426,540 | 1,215,123 |
| China Biologic Products Holdings, Inc. (a) | | 27,056 | 1,797,601 |
| China Literature Ltd. (a)(b) | | 173,200 | 935,357 |
| E-House China Enterprise Holdings Ltd. (a) | | 18,000 | 31,584 |
| ENN Energy Holdings Ltd. | | 61,800 | 525,248 |
| Fu Shou Yuan International Group Ltd. (b) | | 7,173,000 | 5,497,326 |
| GDS Holdings Ltd. ADR (a)(c) | | 14,400 | 337,968 |
| General Interface Solution Holding Ltd. | | 126,000 | 417,144 |
| Haitian International Holdings Ltd. | | 1,328,000 | 2,590,988 |
| Kingdee International Software Group Co. Ltd. | | 493,000 | 402,349 |
| Kingsoft Corp. Ltd. | | 1,720,760 | 2,435,674 |
| LexinFintech Holdings Ltd. ADR | | 11,800 | 115,404 |
| Longfor Properties Co. Ltd. | | 214,500 | 520,799 |
| Momo, Inc. ADR (a) | | 24,490 | 822,129 |
| NetEase, Inc. ADR | | 3,400 | 706,690 |
| Parade Technologies Ltd. | | 45,000 | 595,921 |
| PPDAI Group, Inc. ADR (a) | | 23,680 | 135,213 |
| Shimao Property Holdings Ltd. | | 200,000 | 391,229 |
| Silergy Corp. | | 34,000 | 432,680 |
| SITC International Holdings Co. Ltd. | | 3,609,500 | 2,651,218 |
| Sohu.Com Ltd. ADR (a)(c) | | 22,600 | 408,382 |
| TAL Education Group ADR (a) | | 14,270 | 413,545 |
| Uni-President China Holdings Ltd. | | 2,183,000 | 2,118,431 |
| Wise Talent Information Technology Co. Ltd. (a) | | 81,705 | 267,246 |
| Yuzhou Properties Co. | | 1,409,000 | 503,089 |
| YY, Inc. ADR (a) | | 9,400 | 600,660 |
| Zai Lab Ltd. ADR (a) | | 45,700 | 747,652 |
|
| TOTAL CAYMAN ISLANDS | | | 29,620,370 |
|
| Chile - 1.0% | | | |
| Compania Cervecerias Unidas SA sponsored ADR | | 21,400 | 536,498 |
| Empresas CMPC SA | | 657,727 | 2,264,228 |
|
| TOTAL CHILE | | | 2,800,726 |
|
| China - 6.7% | | | |
| BBMG Corp. (H Shares) | | 1,928,000 | 531,052 |
| China Longyuan Power Grid Corp. Ltd. (H Shares) | | 2,658,200 | 2,020,272 |
| China Oilfield Services Ltd. (H Shares) | | 2,166,000 | 2,030,120 |
| China Suntien Green Energy Corp. Ltd. (H Shares) | | 996,000 | 254,018 |
| Hangzhou Hikvision Digital Technology Co. Ltd. Class A | | 176,800 | 613,356 |
| Hangzhou Tigermed Consulting Co. Ltd. Class A | | 349,227 | 2,133,215 |
| Lens Technology Co. Ltd. Class A | | 443,629 | 492,239 |
| Luxshare Precision Industry Co. Ltd. Class A | | 387,276 | 921,603 |
| Qingdao Haier Co. Ltd. | | 1,024,896 | 1,860,068 |
| Shanghai International Airport Co. Ltd. (A Shares) | | 268,641 | 1,908,232 |
| Shenzhen Inovance Technology Co. Ltd. Class A | | 78,950 | 252,164 |
| Sinopec Engineering Group Co. Ltd. (H Shares) | | 2,603,000 | 2,419,790 |
| Tonghua Dongbao Pharmaceutical Co. Ltd. Class A | | 583,708 | 1,119,611 |
| Tsingtao Brewery Co. Ltd. (H Shares) | | 252,000 | 994,574 |
| Zhengzhou Yutong Bus Co. Ltd. | | 805,862 | 1,231,497 |
|
| TOTAL CHINA | | | 18,781,811 |
|
| Colombia - 0.2% | | | |
| Bancolombia SA sponsored ADR | | 14,600 | 539,324 |
| Cyprus - 0.9% | | | |
| Globaltrans Investment PLC GDR (Reg. S) | | 241,500 | 2,366,700 |
| Egypt - 0.8% | | | |
| Credit Agricole Egypt | | 295,880 | 662,098 |
| Egyptian Kuwaiti Holding | | 944,400 | 1,056,784 |
| Six of October Development & Investment Co. (a) | | 660,300 | 549,022 |
|
| TOTAL EGYPT | | | 2,267,904 |
|
| Greece - 3.1% | | | |
| Alpha Bank AE (a) | | 777,600 | 1,175,799 |
| Fourlis Holdings SA | | 790,000 | 3,874,456 |
| Titan Cement Co. SA (Reg.) | | 163,500 | 3,600,060 |
|
| TOTAL GREECE | | | 8,650,315 |
|
| Hong Kong - 1.4% | | | |
| China Everbright International Ltd. | | 484,000 | 385,746 |
| China Resources Beer Holdings Co. Ltd. | | 508,000 | 1,765,250 |
| Far East Horizon Ltd. | | 1,013,584 | 982,312 |
| Sun Art Retail Group Ltd. | | 758,000 | 828,373 |
|
| TOTAL HONG KONG | | | 3,961,681 |
|
| India - 9.9% | | | |
| Adani Ports & Special Economic Zone Ltd. | | 543,992 | 2,345,212 |
| CESC Ltd. GDR | | 57,246 | 537,900 |
| Deccan Cements Ltd. (a) | | 192,054 | 966,242 |
| Dr Lal Pathlabs Ltd. | | 145,424 | 1,729,417 |
| EIH Ltd. (a) | | 366,260 | 801,751 |
| Federal Bank Ltd. | | 1,142,081 | 1,277,815 |
| Future Retail Ltd. | | 92,503 | 611,788 |
| IndusInd Bank Ltd. | | 26,000 | 500,982 |
| JK Cement Ltd. (a) | | 119,271 | 1,084,744 |
| LIC Housing Finance Ltd. | | 376,564 | 2,093,097 |
| Lupin Ltd. (a) | | 200,360 | 2,398,712 |
| Manappuram General Finance & Leasing Ltd. | | 1,230,188 | 1,328,989 |
| Natco Pharma Ltd. | | 209,921 | 2,140,507 |
| Oberoi Realty Ltd. | | 299,038 | 1,711,705 |
| Phoenix Mills Ltd. | | 85,006 | 636,051 |
| Piramal Enterprises Ltd. | | 92,839 | 2,727,428 |
| Power Grid Corp. of India Ltd. | | 412,968 | 1,038,283 |
| RP-SG Business Process Services Ltd. (a)(d) | | 11,449 | 36,958 |
| RP-SG Retail Ltd. (a)(d) | | 34,347 | 110,875 |
| Solar Industries India Ltd. | | 45,145 | 612,015 |
| The Ramco Cements Ltd. (a) | | 160,611 | 1,302,196 |
| Torrent Pharmaceuticals Ltd. | | 73,711 | 1,661,986 |
|
| TOTAL INDIA | | | 27,654,653 |
|
| Indonesia - 1.0% | | | |
| PT Bank Negara Indonesia (Persero) Tbk | | 1,264,200 | 609,128 |
| PT Media Nusantara Citra Tbk | | 6,539,200 | 335,509 |
| PT Pakuwon Jati Tbk | | 33,174,700 | 1,043,085 |
| PT Semen Gresik (Persero) Tbk | | 784,800 | 464,608 |
| PT XL Axiata Tbk (a) | | 2,046,400 | 352,677 |
|
| TOTAL INDONESIA | | | 2,805,007 |
|
| Italy - 0.6% | | | |
| Prada SpA | | 474,600 | 1,676,422 |
| Korea (South) - 7.0% | | | |
| AMOREPACIFIC Group, Inc. | | 27,324 | 1,487,134 |
| BS Financial Group, Inc. | | 247,083 | 1,643,611 |
| Cafe24 Corp. (a) | | 4,890 | 473,571 |
| Daou Technology, Inc. | | 35,439 | 621,192 |
| F&F Co. Ltd. | | 21,020 | 961,651 |
| HDC Hyundai Development Co. (a) | | 19,446 | 749,890 |
| Hyundai Fire & Marine Insurance Co. Ltd. | | 26,242 | 961,363 |
| Hyundai Wia Corp. | | 36,018 | 934,385 |
| Iljin Materials Co. Ltd. | | 31,115 | 1,239,419 |
| Kakao Corp. | | 8,490 | 681,581 |
| KEPCO Plant Service & Engineering Co. Ltd. | | 17,372 | 418,694 |
| Kolon Industries, Inc. | | 6,480 | 285,097 |
| Korean Reinsurance Co. | | 84,046 | 713,765 |
| LG Chemical Ltd. | | 4,084 | 1,242,023 |
| LG Innotek Co. Ltd. | | 11,251 | 1,222,720 |
| Meerecompany, Inc. | | 2,340 | 127,152 |
| NCSOFT Corp. | | 7,457 | 2,806,995 |
| Samsung Electro-Mechanics Co. Ltd. | | 7,195 | 744,093 |
| Samsung SDI Co. Ltd. | | 5,765 | 1,189,884 |
| ViroMed Co. Ltd. (a) | | 6,761 | 1,103,921 |
|
| TOTAL KOREA (SOUTH) | | | 19,608,141 |
|
| Luxembourg - 1.7% | | | |
| Samsonite International SA | | 1,657,200 | 4,754,812 |
| Malaysia - 0.8% | | | |
| British American Tobacco (Malaysia) Bhd | | 212,500 | 1,579,340 |
| Matrix Concepts Holdings Bhd | | 1,635,700 | 723,156 |
|
| TOTAL MALAYSIA | | | 2,302,496 |
|
| Mauritius - 0.3% | | | |
| MakeMyTrip Ltd. (a)(c) | | 30,900 | 766,011 |
| Mexico - 3.3% | | | |
| Credito Real S.A.B. de CV | | 667,000 | 763,102 |
| Fibra Uno Administracion SA de CV | | 1,791,460 | 1,925,225 |
| Gruma S.A.B. de CV Series B | | 170,400 | 1,778,386 |
| Grupo Comercial Chedraui S.A.B. de CV | | 619,100 | 1,094,452 |
| Grupo GICSA SA de CV (a) | | 696,970 | 271,401 |
| Industrias Penoles SA de CV | | 137,650 | 1,940,073 |
| Macquarie Mexican (REIT) (b) | | 672,100 | 654,456 |
| Megacable Holdings S.A.B. de CV unit | | 39,900 | 176,919 |
| Qualitas Controladora S.A.B. de CV | | 339,600 | 684,274 |
|
| TOTAL MEXICO | | | 9,288,288 |
|
| Netherlands - 0.3% | | | |
| VEON Ltd. sponsored ADR | | 70,000 | 196,700 |
| Yandex NV Series A (a) | | 24,806 | 747,405 |
|
| TOTAL NETHERLANDS | | | 944,105 |
|
| Panama - 0.7% | | | |
| Copa Holdings SA Class A | | 24,900 | 1,803,507 |
| Peru - 1.0% | | | |
| Compania de Minas Buenaventura SA sponsored ADR | | 192,200 | 2,660,048 |
| Philippines - 2.1% | | | |
| Metro Pacific Investments Corp. | | 33,861,300 | 3,041,605 |
| Metropolitan Bank & Trust Co. | | 547,928 | 672,131 |
| Philippine Seven Corp. | | 578,300 | 1,136,319 |
| Pilipinas Shell Petroleum Corp. | | 197,300 | 179,256 |
| Robinsons Land Corp. | | 2,189,208 | 858,280 |
|
| TOTAL PHILIPPINES | | | 5,887,591 |
|
| Russia - 0.9% | | | |
| Bank St. Petersburg PJSC (a) | | 1,478,500 | 1,113,245 |
| LSR Group OJSC | | 77,164 | 737,391 |
| RusHydro PJSC | | 68,809,000 | 574,298 |
|
| TOTAL RUSSIA | | | 2,424,934 |
|
| Saudi Arabia - 0.4% | | | |
| Samba Financial Group | | 140,000 | 1,158,845 |
| Singapore - 0.8% | | | |
| First Resources Ltd. | | 1,492,500 | 1,702,451 |
| Yoma Strategic Holdings Ltd. | | 2,457,700 | 452,452 |
|
| TOTAL SINGAPORE | | | 2,154,903 |
|
| South Africa - 6.2% | | | |
| Barclays Africa Group Ltd. | | 110,556 | 1,117,438 |
| Bidvest Group Ltd. | | 208,900 | 2,602,241 |
| Impala Platinum Holdings Ltd. (a) | | 778,100 | 1,434,626 |
| Imperial Holdings Ltd. | | 269,400 | 2,974,950 |
| Mr Price Group Ltd. | | 106,200 | 1,662,702 |
| MTN Group Ltd. | | 56,500 | 327,453 |
| Nampak Ltd. (a) | | 1,232,738 | 1,240,885 |
| Old Mutual Ltd. | | 434,000 | 667,511 |
| Pick 'n Pay Stores Ltd. | | 313,000 | 1,445,497 |
| Redefine Properties Ltd. | | 2,169,800 | 1,410,499 |
| Reunert Ltd. | | 323,600 | 1,749,337 |
| Sanlam Ltd. | | 105,000 | 528,541 |
|
| TOTAL SOUTH AFRICA | | | 17,161,680 |
|
| Sri Lanka - 0.4% | | | |
| Dialog Axiata PLC | | 6,034,611 | 398,642 |
| Hatton National Bank PLC | | 525,633 | 613,937 |
|
| TOTAL SRI LANKA | | | 1,012,579 |
|
| Taiwan - 6.2% | | | |
| Advantech Co. Ltd. | | 79,693 | 548,267 |
| Chipbond Technology Corp. | | 375,000 | 687,973 |
| Chroma ATE, Inc. | | 248,000 | 869,107 |
| Cleanaway Co. Ltd. | | 300,000 | 1,652,105 |
| CTCI Corp. | | 1,217,000 | 1,715,801 |
| Delta Electronics, Inc. | | 73,000 | 306,520 |
| E Ink Holdings, Inc. | | 472,000 | 371,984 |
| Global Unichip Corp. | | 50,000 | 339,142 |
| Inventec Corp. | | 1,202,000 | 968,650 |
| LandMark Optoelectronics Corp. | | 92,000 | 610,649 |
| Largan Precision Co. Ltd. | | 4,080 | 441,466 |
| Lien Hwa Industrial Corp. | | 321,200 | 315,904 |
| Nan Liu Enterprise Co. Ltd. | | 440,000 | 2,231,230 |
| PChome Online, Inc. (a) | | 90,000 | 409,877 |
| Sino-American Silicon Products, Inc. | | 117,000 | 217,671 |
| Sporton International, Inc. | | 108,290 | 402,233 |
| Taiwan Fertilizer Co. Ltd. | | 1,661,000 | 2,253,258 |
| TCI Co. Ltd. | | 39,581 | 552,923 |
| United Microelectronics Corp. | | 1,945,000 | 740,785 |
| Vanguard International Semiconductor Corp. | | 494,000 | 909,481 |
| Win Semiconductors Corp. | | 146,000 | 447,990 |
| Wiwynn Corp. | | 36,027 | 259,493 |
|
| TOTAL TAIWAN | | | 17,252,509 |
|
| Thailand - 3.6% | | | |
| Bangkok Bank PCL (For. Reg.) | | 165,100 | 1,055,525 |
| Com7 PCL | | 4,304,700 | 2,687,192 |
| PTT Global Chemical PCL (For. Reg.) | | 444,800 | 1,036,212 |
| Siam Cement PCL (For. Reg.) | | 233,400 | 2,942,135 |
| Siam Commercial Bank PCL (For. Reg.) | | 129,200 | 535,736 |
| Star Petroleum Refining PCL | | 4,396,700 | 1,869,526 |
|
| TOTAL THAILAND | | | 10,126,326 |
|
| Turkey - 1.7% | | | |
| Aksa Akrilik Kimya Sanayii | | 679,300 | 1,099,840 |
| Aselsan A/S | | 349,600 | 1,579,880 |
| Tupras Turkiye Petrol Rafinerileri A/S | | 82,528 | 1,944,493 |
|
| TOTAL TURKEY | | | 4,624,213 |
|
| United Arab Emirates - 0.7% | | | |
| Aldar Properties PJSC | | 2,460,310 | 1,158,770 |
| Emaar Properties PJSC | | 585,967 | 813,588 |
|
| TOTAL UNITED ARAB EMIRATES | | | 1,972,358 |
|
| United Kingdom - 1.8% | | | |
| Bank of Georgia Group PLC | | 27,240 | 542,955 |
| Contemporary Amperex Technology Co. Ltd. ELS (UBS Bank Warrant Program) Class A warrants 6/24/19(a)(b) | | 33,300 | 355,644 |
| Georgia Capital PLC (a) | | 52,700 | 788,125 |
| NMC Health PLC | | 45,983 | 2,075,950 |
| TBC Bank Group PLC | | 28,353 | 612,470 |
| Tonghua Dongbao Pharmaceutical Co. Ltd. ELS (UBS Bank Warrant Program) Class A warrants 3/26/19 (a) | | 285,190 | 547,023 |
|
| TOTAL UNITED KINGDOM | | | 4,922,167 |
|
| United States of America - 0.6% | | | |
| MercadoLibre, Inc. | | 4,780 | 1,551,110 |
| Uxin Ltd. ADR (a) | | 22,620 | 123,053 |
|
| TOTAL UNITED STATES OF AMERICA | | | 1,674,163 |
|
| Vietnam - 0.1% | | | |
| FTP Corp. | | 217,196 | 390,284 |
| TOTAL COMMON STOCKS | | | |
| (Cost $282,444,944) | | | 250,791,875 |
|
| Nonconvertible Preferred Stocks - 3.1% | | | |
| Brazil - 1.8% | | | |
| Banco ABC Brasil SA | | 308,106 | 1,338,727 |
| Banco do Estado Rio Grande do Sul SA | | 165,600 | 883,734 |
| Companhia Paranaense de Energia-Copel (PN-B) sponsored ADR (c) | | 163,060 | 1,143,051 |
| Metalurgica Gerdau SA (PN) | | 620,400 | 1,323,653 |
| TIM Participacoes SA sponsored ADR | | 20,180 | 312,185 |
|
| TOTAL BRAZIL | | | 5,001,350 |
|
| Korea (South) - 0.8% | | | |
| Hyundai Motor Co. Series 2 | | 28,066 | 1,741,519 |
| Samsung Fire & Marine Insurance Co. Ltd. | | 3,488 | 544,140 |
|
| TOTAL KOREA (SOUTH) | | | 2,285,659 |
|
| Russia - 0.5% | | | |
| Sberbank of Russia | | 502,800 | 1,246,433 |
| TOTAL NONCONVERTIBLE PREFERRED STOCKS | | | |
| (Cost $8,895,634) | | | 8,533,442 |
| | | Principal Amount | Value |
|
| Government Obligations - 0.1% | | | |
| United States of America - 0.1% | | | |
| U.S. Treasury Bills, yield at date of purchase 2.02% to 2.09% 11/8/18 to 11/29/18 (e) | | | |
| (Cost $309,646) | | $310,000 | 309,631 |
| | | Shares | Value |
|
| Money Market Funds - 4.9% | | | |
| Fidelity Cash Central Fund, 2.23% (f) | | 11,625,158 | 11,627,483 |
| Fidelity Securities Lending Cash Central Fund 2.23% (f)(g) | | 2,041,375 | 2,041,579 |
| TOTAL MONEY MARKET FUNDS | | | |
| (Cost $13,668,902) | | | 13,669,062 |
| TOTAL INVESTMENT IN SECURITIES - 98.1% | | | |
| (Cost $305,319,126) | | | 273,304,010 |
| NET OTHER ASSETS (LIABILITIES) - 1.9% | | | 5,427,641 |
| NET ASSETS - 100% | | | $278,731,651 |
| Futures Contracts | | | | | |
| | Number of contracts | Expiration Date | Notional Amount | Value | Unrealized Appreciation/(Depreciation) |
| Purchased | | | | | |
| Equity Index Contracts | | | | | |
| ICE E-mini MSCI Emerging Markets Index Contracts (United States) | 128 | Dec. 2018 | $6,122,880 | $(16,907) | $(16,907) |
The notional amount of futures purchased as a percentage of Net Assets is 2.2%
Security Type Abbreviations
ELS – Equity-Linked Security
Categorizations in the Schedule of Investments are based on country or territory of incorporation.
Legend
(a) Non-income producing
(b) Security exempt from registration under Rule 144A of the Securities Act of 1933. These securities may be resold in transactions exempt from registration, normally to qualified institutional buyers. At the end of the period, the value of these securities amounted to $7,442,783 or 2.7% of net assets.
(c) Security or a portion of the security is on loan at period end.
(d) Level 3 security
(e) Security or a portion of the security was pledged to cover margin requirements for futures contracts. At period end, the value of securities pledged amounted to $8,996.
(f) Affiliated fund that is generally available only to investment companies and other accounts managed by Fidelity Investments. The rate quoted is the annualized seven-day yield of the fund at period end. A complete unaudited listing of the fund's holdings as of its most recent quarter end is available upon request. In addition, each Fidelity Central Fund's financial statements, which are not covered by the Fund's Report of Independent Registered Public Accounting Firm, are available on the SEC's website or upon request.
(g) Investment made with cash collateral received from securities on loan.
Affiliated Central Funds
Information regarding fiscal year to date income earned by the Fund from investments in Fidelity Central Funds is as follows:
| Fund | Income earned |
| Fidelity Cash Central Fund | $309,194 |
| Fidelity Securities Lending Cash Central Fund | 110,375 |
| Total | $419,569 |
Amounts in the income column in the above table include any capital gain distributions from underlying funds, which are presented in the corresponding line-item in the Statement of Operations if applicable.
Investment Valuation
The following is a summary of the inputs used, as of October 31, 2018, involving the Fund's assets and liabilities carried at fair value. The inputs or methodology used for valuing securities may not be an indication of the risk associated with investing in those securities. For more information on valuation inputs, and their aggregation into the levels used below, please refer to the Investment Valuation section in the accompanying Notes to Financial Statements.
| | Valuation Inputs at Reporting Date: |
| Description | Total | Level 1 | Level 2 | Level 3 |
| Investments in Securities: | | | | |
| Equities: | | | | |
| Communication Services | $8,971,705 | $8,971,705 | $-- | $-- |
| Consumer Discretionary | 45,842,320 | 45,842,320 | -- | -- |
| Consumer Staples | 18,703,068 | 18,592,193 | -- | 110,875 |
| Energy | 9,173,310 | 9,173,310 | -- | -- |
| Financials | 36,881,654 | 35,978,987 | 902,667 | -- |
| Health Care | 21,597,503 | 21,597,503 | -- | -- |
| Industrials | 40,638,586 | 40,638,586 | -- | -- |
| Information Technology | 20,540,686 | 19,762,943 | 740,785 | 36,958 |
| Materials | 31,047,578 | 31,047,578 | -- | -- |
| Real Estate | 17,271,639 | 17,271,639 | -- | -- |
| Utilities | 8,657,268 | 8,657,268 | -- | -- |
| Government Obligations | 309,631 | -- | 309,631 | -- |
| Money Market Funds | 13,669,062 | 13,669,062 | -- | -- |
| Total Investments in Securities: | $273,304,010 | $271,203,094 | $1,953,083 | $147,833 |
| Derivative Instruments: | | | | |
| Liabilities | | | | |
| Futures Contracts | $(16,907) | $(16,907) | $-- | $-- |
| Total Liabilities | $(16,907) | $(16,907) | $-- | $-- |
| Total Derivative Instruments: | $(16,907) | $(16,907) | $-- | $-- |
Value of Derivative Instruments
The following table is a summary of the Fund's value of derivative instruments by primary risk exposure as of October 31, 2018. For additional information on derivative instruments, please refer to the Derivative Instruments section in the accompanying Notes to Financial Statements.
| Primary Risk Exposure / Derivative Type | Value |
| | Asset | Liability |
| Equity Risk | | |
| Futures Contracts(a) | $0 | $(16,907) |
| Total Equity Risk | 0 | (16,907) |
| Total Value of Derivatives | $0 | $(16,907) |
(a) Reflects gross cumulative appreciation (depreciation) on futures contracts as presented in the Consolidated Schedule of Investments. In the Consolidated Statement of Assets and Liabilities, the period end daily variation margin is included in receivable or payable for daily variation margin on futures contracts, and the net cumulative appreciation (depreciation) is included in net unrealized appreciation (depreciation).
See accompanying notes which are an integral part of the financial statements.
Financial Statements
Statement of Assets and Liabilities
| | | October 31, 2018 |
| Assets | | |
Investment in securities, at value (including securities loaned of $2,080,445) — See accompanying schedule:
Unaffiliated issuers (cost $291,650,224) | $259,634,948 | |
| Fidelity Central Funds (cost $13,668,902) | 13,669,062 | |
| Total Investment in Securities (cost $305,319,126) | | $273,304,010 |
| Foreign currency held at value (cost $78,311) | | 78,159 |
| Receivable for investments sold | | 9,296,461 |
| Receivable for fund shares sold | | 188,247 |
| Dividends receivable | | 128,304 |
| Distributions receivable from Fidelity Central Funds | | 26,008 |
| Prepaid expenses | | 839 |
| Receivable from investment adviser for expense reductions | | 35 |
| Other receivables | | 131,965 |
| Total assets | | 283,154,028 |
| Liabilities | | |
| Payable to custodian bank | $771,649 | |
| Payable for investments purchased | 358,932 | |
| Payable for fund shares redeemed | 661,286 | |
| Accrued management fee | 208,323 | |
| Distribution and service plan fees payable | 15,767 | |
| Payable for daily variation margin on futures contracts | 16,907 | |
| Other affiliated payables | 70,848 | |
| Other payables and accrued expenses | 277,195 | |
| Collateral on securities loaned | 2,041,470 | |
| Total liabilities | | 4,422,377 |
| Net Assets | | $278,731,651 |
| Net Assets consist of: | | |
| Paid in capital | | $313,680,032 |
| Total distributable earnings (loss) | | (34,948,381) |
| Net Assets | | $278,731,651 |
| Net Asset Value and Maximum Offering Price | | |
| Class A: | | |
| Net Asset Value and redemption price per share ($14,471,629 ÷ 1,204,469 shares) | | $12.01 |
| Maximum offering price per share (100/94.25 of $12.01) | | $12.74 |
| Class M: | | |
| Net Asset Value and redemption price per share ($5,374,097 ÷ 450,151 shares) | | $11.94 |
| Maximum offering price per share (100/96.50 of $11.94) | | $12.37 |
| Class C: | | |
| Net Asset Value and offering price per share ($11,277,806 ÷ 967,110 shares)(a) | | $11.66 |
| Emerging Markets Discovery: | | |
| Net Asset Value, offering price and redemption price per share ($188,690,039 ÷ 15,594,899 shares) | | $12.10 |
| Class I: | | |
| Net Asset Value, offering price and redemption price per share ($57,505,607 ÷ 4,742,108 shares) | | $12.13 |
| Class Z: | | |
| Net Asset Value, offering price and redemption price per share ($1,412,473 ÷ 116,433 shares) | | $12.13 |
(a) Redemption price per share is equal to net asset value less any applicable contingent deferred sales charge.
See accompanying notes which are an integral part of the financial statements.
Statement of Operations
| | | Year ended October 31, 2018 |
| Investment Income | | |
| Dividends | | $11,976,209 |
| Interest | | 10,117 |
| Income from Fidelity Central Funds | | 419,569 |
| Income before foreign taxes withheld | | 12,405,895 |
| Less foreign taxes withheld | | (1,011,481) |
| Total income | | 11,394,414 |
| Expenses | | |
| Management fee | $3,563,125 | |
| Transfer agent fees | 819,817 | |
| Distribution and service plan fees | 251,929 | |
| Accounting and security lending fees | 221,004 | |
| Custodian fees and expenses | 397,085 | |
| Independent trustees' fees and expenses | 2,153 | |
| Registration fees | 97,487 | |
| Audit | 96,635 | |
| Legal | 855 | |
| Interest | 788 | |
| Miscellaneous | 2,416 | |
| Total expenses before reductions | 5,453,294 | |
| Expense reductions | (177,951) | |
| Total expenses after reductions | | 5,275,343 |
| Net investment income (loss) | | 6,119,071 |
| Realized and Unrealized Gain (Loss) | | |
| Net realized gain (loss) on: | | |
| Investment securities: | | |
| Unaffiliated issuers (net of foreign taxes of $86,279) | (2,365,412) | |
| Fidelity Central Funds | 433 | |
| Foreign currency transactions | (613,305) | |
| Futures contracts | (803,067) | |
| Total net realized gain (loss) | | (3,781,351) |
| Change in net unrealized appreciation (depreciation) on: | | |
| Investment securities: | | |
| Unaffiliated issuers (net of decrease in deferred foreign taxes of $567,272) | (74,718,839) | |
| Fidelity Central Funds | (851) | |
| Assets and liabilities in foreign currencies | (17,214) | |
| Futures contracts | (16,907) | |
| Total change in net unrealized appreciation (depreciation) | | (74,753,811) |
| Net gain (loss) | | (78,535,162) |
| Net increase (decrease) in net assets resulting from operations | | $(72,416,091) |
See accompanying notes which are an integral part of the financial statements.
Statement of Changes in Net Assets
| | Year ended October 31, 2018 | Year ended October 31, 2017 |
| Increase (Decrease) in Net Assets | | |
| Operations | | |
| Net investment income (loss) | $6,119,071 | $2,767,445 |
| Net realized gain (loss) | (3,781,351) | 9,091,626 |
| Change in net unrealized appreciation (depreciation) | (74,753,811) | 38,838,325 |
| Net increase (decrease) in net assets resulting from operations | (72,416,091) | 50,697,396 |
| Distributions to shareholders | (9,625,215) | – |
| Distributions to shareholders from net investment income | – | (659,806) |
| Distributions to shareholders from net realized gain | – | (485,420) |
| Total distributions | (9,625,215) | (1,145,226) |
| Share transactions - net increase (decrease) | (24,209,703) | 249,358,868 |
| Redemption fees | 66,640 | 166,495 |
| Total increase (decrease) in net assets | (106,184,369) | 299,077,533 |
| Net Assets | | |
| Beginning of period | 384,916,020 | 85,838,487 |
| End of period | $278,731,651 | $384,916,020 |
| Other Information | | |
| Undistributed net investment income end of period | | $2,568,661 |
See accompanying notes which are an integral part of the financial statements.
Financial Highlights
Fidelity Emerging Markets Discovery Fund Class A
| Years ended October 31, | 2018 | 2017 | 2016 | 2015 | 2014 |
| Selected Per–Share Data | | | | | |
| Net asset value, beginning of period | $15.03 | $12.27 | $10.92 | $12.17 | $12.49 |
| Income from Investment Operations | | | | | |
| Net investment income (loss)A | .18 | .14 | .09 | .09B | .04 |
| Net realized and unrealized gain (loss) | (2.89) | 2.74 | 1.30 | (1.34) | (.01) |
| Total from investment operations | (2.71) | 2.88 | 1.39 | (1.25) | .03 |
| Distributions from net investment income | (.08) | (.07) | (.05) | – | (.06) |
| Distributions from net realized gain | (.23) | (.06) | – | – | (.30) |
| Total distributions | (.31) | (.13) | (.05) | – | (.36) |
| Redemption fees added to paid in capitalA | –C | .01 | .01 | –C | .01 |
| Net asset value, end of period | $12.01 | $15.03 | $12.27 | $10.92 | $12.17 |
| Total ReturnD,E | (18.39)% | 23.89% | 12.93% | (10.27)% | .31% |
| Ratios to Average Net AssetsF,G | | | | | |
| Expenses before reductions | 1.52% | 1.63% | 1.89% | 1.88% | 1.82% |
| Expenses net of fee waivers, if any | 1.52% | 1.63% | 1.70% | 1.70% | 1.70% |
| Expenses net of all reductions | 1.48% | 1.62% | 1.70% | 1.69% | 1.70% |
| Net investment income (loss) | 1.22% | 1.03% | .85% | .76%B | .29% |
| Supplemental Data | | | | | |
| Net assets, end of period (000 omitted) | $14,472 | $16,062 | $5,252 | $4,660 | $4,362 |
| Portfolio turnover rateH | 98% | 58% | 60% | 103% | 148% |
A Calculated based on average shares outstanding during the period.
B Net investment income per share reflects a large, non-recurring dividend which amounted to $.06 per share. Excluding this non-recurring dividend, the ratio of net investment income (loss) to average net assets would have been .22%.
C Amount represents less than $.005 per share.
D Total returns would have been lower if certain expenses had not been reduced during the applicable periods shown.
E Total returns do not include the effect of the sales charges.
F Fees and expenses of any underlying Fidelity Central Funds are not included in the Fund's expense ratio. The Fund indirectly bears its proportionate share of the expenses of any underlying Fidelity Central Funds.
G Expense ratios reflect operating expenses of the class. Expenses before reductions do not reflect amounts reimbursed by the investment adviser or reductions from brokerage service arrangements or reductions from other expense offset arrangements and do not represent the amount paid by the class during periods when reimbursements or reductions occur. Expenses net of fee waivers reflect expenses after reimbursement by the investment adviser but prior to reductions from brokerage service arrangements or other expense offset arrangements. Expenses net of all reductions represent the net expenses paid by the class.
H Amount does not include the portfolio activity of any underlying Fidelity Central Funds.
See accompanying notes which are an integral part of the financial statements.
Fidelity Emerging Markets Discovery Fund Class M
| Years ended October 31, | 2018 | 2017 | 2016 | 2015 | 2014 |
| Selected Per–Share Data | | | | | |
| Net asset value, beginning of period | $14.94 | $12.20 | $10.86 | $12.13 | $12.44 |
| Income from Investment Operations | | | | | |
| Net investment income (loss)A | .14 | .10 | .07 | .06B | –C |
| Net realized and unrealized gain (loss) | (2.87) | 2.74 | 1.28 | (1.33) | –C |
| Total from investment operations | (2.73) | 2.84 | 1.35 | (1.27) | –C |
| Distributions from net investment income | (.04) | (.04) | (.02) | – | (.02) |
| Distributions from net realized gain | (.23) | (.06) | – | – | (.30) |
| Total distributions | (.27) | (.11)D | (.02) | – | (.32) |
| Redemption fees added to paid in capitalA | –C | .01 | .01 | –C | .01 |
| Net asset value, end of period | $11.94 | $14.94 | $12.20 | $10.86 | $12.13 |
| Total ReturnE,F | (18.58)% | 23.63% | 12.58% | (10.47)% | .05% |
| Ratios to Average Net AssetsG,H | | | | | |
| Expenses before reductions | 1.79% | 1.92% | 2.17% | 2.16% | 2.10% |
| Expenses net of fee waivers, if any | 1.79% | 1.92% | 1.95% | 1.95% | 1.95% |
| Expenses net of all reductions | 1.75% | 1.90% | 1.94% | 1.94% | 1.95% |
| Net investment income (loss) | .94% | .74% | .60% | .51%B | .04% |
| Supplemental Data | | | | | |
| Net assets, end of period (000 omitted) | $5,374 | $9,393 | $2,868 | $2,015 | $2,031 |
| Portfolio turnover rateI | 98% | 58% | 60% | 103% | 148% |
A Calculated based on average shares outstanding during the period.
B Net investment income per share reflects a large, non-recurring dividend which amounted to $.06 per share. Excluding this non-recurring dividend, the ratio of net investment income (loss) to average net assets would have been (.03) %.
C Amount represents less than $.005 per share.
D Total distributions of $.11 per share is comprised of distributions from net investment income of $.044 and distributions from net realized gain of $.064 per share.
E Total returns would have been lower if certain expenses had not been reduced during the applicable periods shown.
F Total returns do not include the effect of the sales charges.
G Fees and expenses of any underlying Fidelity Central Funds are not included in the Fund's expense ratio. The Fund indirectly bears its proportionate share of the expenses of any underlying Fidelity Central Funds.
H Expense ratios reflect operating expenses of the class. Expenses before reductions do not reflect amounts reimbursed by the investment adviser or reductions from brokerage service arrangements or reductions from other expense offset arrangements and do not represent the amount paid by the class during periods when reimbursements or reductions occur. Expenses net of fee waivers reflect expenses after reimbursement by the investment adviser but prior to reductions from brokerage service arrangements or other expense offset arrangements. Expenses net of all reductions represent the net expenses paid by the class.
I Amount does not include the portfolio activity of any underlying Fidelity Central Funds.
See accompanying notes which are an integral part of the financial statements.
Fidelity Emerging Markets Discovery Fund Class C
| Years ended October 31, | 2018 | 2017 | 2016 | 2015 | 2014 |
| Selected Per–Share Data | | | | | |
| Net asset value, beginning of period | $14.64 | $11.97 | $10.69 | $12.00 | $12.35 |
| Income from Investment Operations | | | | | |
| Net investment income (loss)A | .06 | .04 | .01 | –B,C | (.06) |
| Net realized and unrealized gain (loss) | (2.79) | 2.69 | 1.26 | (1.31) | –C |
| Total from investment operations | (2.73) | 2.73 | 1.27 | (1.31) | (.06) |
| Distributions from net investment income | (.02) | (.01) | – | – | – |
| Distributions from net realized gain | (.23) | (.06) | – | – | (.30) |
| Total distributions | (.25) | (.07) | – | – | (.30) |
| Redemption fees added to paid in capitalA | –C | .01 | .01 | –C | .01 |
| Net asset value, end of period | $11.66 | $14.64 | $11.97 | $10.69 | $12.00 |
| Total ReturnD,E | (18.97)% | 23.02% | 11.97% | (10.92)% | (.42)% |
| Ratios to Average Net AssetsF,G | | | | | |
| Expenses before reductions | 2.28% | 2.38% | 2.63% | 2.64% | 2.58% |
| Expenses net of fee waivers, if any | 2.28% | 2.38% | 2.45% | 2.45% | 2.45% |
| Expenses net of all reductions | 2.24% | 2.37% | 2.44% | 2.44% | 2.45% |
| Net investment income (loss) | .45% | .28% | .10% | .01%B | (.46)% |
| Supplemental Data | | | | | |
| Net assets, end of period (000 omitted) | $11,278 | $14,168 | $2,203 | $1,675 | $1,750 |
| Portfolio turnover rateH | 98% | 58% | 60% | 103% | 148% |
A Calculated based on average shares outstanding during the period.
B Net investment income per share reflects a large, non-recurring dividend which amounted to $.06 per share. Excluding this non-recurring dividend, the ratio of net investment income (loss) to average net assets would have been (.52) %.
C Amount represents less than $.005 per share.
D Total returns would have been lower if certain expenses had not been reduced during the applicable periods shown.
E Total returns do not include the effect of the contingent deferred sales charge.
F Fees and expenses of any underlying Fidelity Central Funds are not included in the Fund's expense ratio. The Fund indirectly bears its proportionate share of the expenses of any underlying Fidelity Central Funds.
G Expense ratios reflect operating expenses of the class. Expenses before reductions do not reflect amounts reimbursed by the investment adviser or reductions from brokerage service arrangements or reductions from other expense offset arrangements and do not represent the amount paid by the class during periods when reimbursements or reductions occur. Expenses net of fee waivers reflect expenses after reimbursement by the investment adviser but prior to reductions from brokerage service arrangements or other expense offset arrangements. Expenses net of all reductions represent the net expenses paid by the class.
H Amount does not include the portfolio activity of any underlying Fidelity Central Funds.
See accompanying notes which are an integral part of the financial statements.
Fidelity Emerging Markets Discovery Fund
| Years ended October 31, | 2018 | 2017 | 2016 | 2015 | 2014 |
| Selected Per–Share Data | | | | | |
| Net asset value, beginning of period | $15.12 | $12.33 | $10.98 | $12.21 | $12.52 |
| Income from Investment Operations | | | | | |
| Net investment income (loss)A | .23 | .18 | .12 | .12B | .07 |
| Net realized and unrealized gain (loss) | (2.91) | 2.76 | 1.31 | (1.35) | –C |
| Total from investment operations | (2.68) | 2.94 | 1.43 | (1.23) | .07 |
| Distributions from net investment income | (.11) | (.09) | (.09) | – | (.09) |
| Distributions from net realized gain | (.23) | (.06) | – | – | (.30) |
| Total distributions | (.34) | (.16)D | (.09) | – | (.39) |
| Redemption fees added to paid in capitalA | –C | .01 | .01 | –C | .01 |
| Net asset value, end of period | $12.10 | $15.12 | $12.33 | $10.98 | $12.21 |
| Total ReturnE | (18.11)% | 24.30% | 13.19% | (10.07)% | .61% |
| Ratios to Average Net AssetsF,G | | | | | |
| Expenses before reductions | 1.22% | 1.35% | 1.55% | 1.56% | 1.48% |
| Expenses net of fee waivers, if any | 1.22% | 1.35% | 1.45% | 1.45% | 1.45% |
| Expenses net of all reductions | 1.18% | 1.34% | 1.44% | 1.44% | 1.45% |
| Net investment income (loss) | 1.51% | 1.31% | 1.10% | 1.01%B | .54% |
| Supplemental Data | | | | | |
| Net assets, end of period (000 omitted) | $188,690 | $248,124 | $67,178 | $61,601 | $78,377 |
| Portfolio turnover rateH | 98% | 58% | 60% | 103% | 148% |
A Calculated based on average shares outstanding during the period.
B Net investment income per share reflects a large, non-recurring dividend which amounted to $.06 per share. Excluding this non-recurring dividend, the ratio of net investment income (loss) to average net assets would have been .48%.
C Amount represents less than $.005 per share.
D Total distributions of $.16 per share is comprised of distributions from net investment income of $.091 and distributions from net realized gain of $.064 per share.
E Total returns would have been lower if certain expenses had not been reduced during the applicable periods shown.
F Fees and expenses of any underlying Fidelity Central Funds are not included in the Fund's expense ratio. The Fund indirectly bears its proportionate share of the expenses of any underlying Fidelity Central Funds.
G Expense ratios reflect operating expenses of the class. Expenses before reductions do not reflect amounts reimbursed by the investment adviser or reductions from brokerage service arrangements or reductions from other expense offset arrangements and do not represent the amount paid by the class during periods when reimbursements or reductions occur. Expenses net of fee waivers reflect expenses after reimbursement by the investment adviser but prior to reductions from brokerage service arrangements or other expense offset arrangements. Expenses net of all reductions represent the net expenses paid by the class.
H Amount does not include the portfolio activity of any underlying Fidelity Central Funds.
See accompanying notes which are an integral part of the financial statements.
Fidelity Emerging Markets Discovery Fund Class I
| Years ended October 31, | 2018 | 2017 | 2016 | 2015 | 2014 |
| Selected Per–Share Data | | | | | |
| Net asset value, beginning of period | $15.15 | $12.37 | $11.02 | $12.25 | $12.53 |
| Income from Investment Operations | | | | | |
| Net investment income (loss)A | .23 | .19 | .13 | .12B | .07 |
| Net realized and unrealized gain (loss) | (2.90) | 2.75 | 1.30 | (1.35) | –C |
| Total from investment operations | (2.67) | 2.94 | 1.43 | (1.23) | .07 |
| Distributions from net investment income | (.12) | (.10) | (.09) | – | (.06) |
| Distributions from net realized gain | (.23) | (.06) | – | – | (.30) |
| Total distributions | (.35) | (.17)D | (.09) | – | (.36) |
| Redemption fees added to paid in capitalA | –C | .01 | .01 | –C | .01 |
| Net asset value, end of period | $12.13 | $15.15 | $12.37 | $11.02 | $12.25 |
| Total ReturnE | (18.06)% | 24.25% | 13.16% | (10.04)% | .61% |
| Ratios to Average Net AssetsF,G | | | | | |
| Expenses before reductions | 1.22% | 1.32% | 1.59% | 1.54% | 1.56% |
| Expenses net of fee waivers, if any | 1.22% | 1.32% | 1.45% | 1.45% | 1.45% |
| Expenses net of all reductions | 1.18% | 1.30% | 1.44% | 1.43% | 1.45% |
| Net investment income (loss) | 1.51% | 1.34% | 1.10% | 1.01%B | .54% |
| Supplemental Data | | | | | |
| Net assets, end of period (000 omitted) | $57,506 | $97,170 | $8,337 | $1,410 | $481 |
| Portfolio turnover rateH | 98% | 58% | 60% | 103% | 148% |
A Calculated based on average shares outstanding during the period.
B Net investment income per share reflects a large, non-recurring dividend which amounted to $.06 per share. Excluding this non-recurring dividend, the ratio of net investment income (loss) to average net assets would have been .48%.
C Amount represents less than $.005 per share.
D Total distributions of $.17 per share is comprised of distributions from net investment income of $.101 and distributions from net realized gain of $.064 per share.
E Total returns would have been lower if certain expenses had not been reduced during the applicable periods shown.
F Fees and expenses of any underlying Fidelity Central Funds are not included in the Fund's expense ratio. The Fund indirectly bears its proportionate share of the expenses of any underlying Fidelity Central Funds.
G Expense ratios reflect operating expenses of the class. Expenses before reductions do not reflect amounts reimbursed by the investment adviser or reductions from brokerage service arrangements or reductions from other expense offset arrangements and do not represent the amount paid by the class during periods when reimbursements or reductions occur. Expenses net of fee waivers reflect expenses after reimbursement by the investment adviser but prior to reductions from brokerage service arrangements or other expense offset arrangements. Expenses net of all reductions represent the net expenses paid by the class.
H Amount does not include the portfolio activity of any underlying Fidelity Central Funds.
See accompanying notes which are an integral part of the financial statements.
Fidelity Emerging Markets Discovery Fund Class Z
| Year ended October 31, | 2018 A |
| Selected Per–Share Data | |
| Net asset value, beginning of period | $13.19 |
| Income from Investment Operations | |
| Net investment income (loss)B | –C |
| Net realized and unrealized gain (loss) | (1.06) |
| Total from investment operations | (1.06) |
| Distributions from net investment income | – |
| Distributions from net realized gain | – |
| Total distributions | – |
| Net asset value, end of period | $12.13 |
| Total ReturnD,E | (8.04)% |
| Ratios to Average Net AssetsF,G | |
| Expenses before reductions | 1.17%H |
| Expenses net of fee waivers, if any | 1.02%H |
| Expenses net of all reductions | .98%H |
| Net investment income (loss) | (.12)%H |
| Supplemental Data | |
| Net assets, end of period (000 omitted) | $1,412 |
| Portfolio turnover rateI | 98% |
A For the period October 2, 2018 (commencement of sale of shares) to October 31, 2018.
B Calculated based on average shares outstanding during the period.
C Amount represents less than $.005 per share.
D Total returns for periods of less than one year are not annualized.
E Total returns would have been lower if certain expenses had not been reduced during the applicable periods shown.
F Fees and expenses of any underlying Fidelity Central Funds are not included in the Fund's expense ratio. The Fund indirectly bears its proportionate share of the expenses of any underlying Fidelity Central Funds.
G Expense ratios reflect operating expenses of the class. Expenses before reductions do not reflect amounts reimbursed by the investment adviser or reductions from brokerage service arrangements or reductions from other expense offset arrangements and do not represent the amount paid by the class during periods when reimbursements or reductions occur. Expense ratios before reductions for start-up periods may not be representative of longer-term operating periods. Expenses net of fee waivers reflect expenses after reimbursement by the investment adviser but prior to reductions from brokerage service arrangements or other expense offset arrangements. Expenses net of all reductions represent the net expenses paid by the class.
H Annualized
I Amount does not include the portfolio activity of any underlying Fidelity Central Funds.
See accompanying notes which are an integral part of the financial statements.
Notes to Financial Statements
For the period ended October 31, 2018
1. Organization.
Fidelity Emerging Markets Discovery Fund (the Fund) is a fund of Fidelity Investment Trust (the Trust) and is authorized to issue an unlimited number of shares. The Trust is registered under the Investment Company Act of 1940, as amended (the 1940 Act), as an open-end management investment company organized as a Massachusetts business trust. The Fund commenced sale of Class Z shares on October 2, 2018. The Fund offers Class A, Class M, Class C, Emerging Markets Discovery, Class I and Class Z shares, each of which has equal rights as to assets and voting privileges. Each class has exclusive voting rights with respect to matters that affect that class. The Fund's investments in emerging markets can be subject to social, economic, regulatory, and political uncertainties and can be extremely volatile.
2. Investments in Fidelity Central Funds.
The Fund invests in Fidelity Central Funds, which are open-end investment companies generally available only to other investment companies and accounts managed by the investment adviser and its affiliates. The Fund's Schedule of Investments lists each of the Fidelity Central Funds held as of period end, if any, as an investment of the Fund, but does not include the underlying holdings of each Fidelity Central Fund. As an Investing Fund, the Fund indirectly bears its proportionate share of the expenses of the underlying Fidelity Central Funds.
The Money Market Central Funds seek preservation of capital and current income and are managed by Fidelity Investments Money Management, Inc. (FIMM), an affiliate of the investment adviser. Annualized expenses of the Money Market Central Funds as of their most recent shareholder report date are less than .005%.
A complete unaudited list of holdings for each Fidelity Central Fund is available upon request or at the Securities and Exchange Commission (the SEC) website at www.sec.gov. In addition, the financial statements of the Fidelity Central Funds, which are not covered by the Fund's Report of Independent Registered Public Accounting Firm, are available on the SEC website or upon request.
3. Significant Accounting Policies.
The Fund is an investment company and applies the accounting and reporting guidance of the Financial Accounting Standards Board (FASB) Accounting Standards Codification Topic 946 Financial Services – Investments Companies. The financial statements have been prepared in conformity with accounting principles generally accepted in the United States of America (GAAP), which require management to make certain estimates and assumptions at the date of the financial statements. Actual results could differ from those estimates. Subsequent events, if any, through the date that the financial statements were issued have been evaluated in the preparation of the financial statements. The following summarizes the significant accounting policies of the Fund:
Investment Valuation. Investments are valued as of 4:00 p.m. Eastern time on the last calendar day of the period. The Board of Trustees (the Board) has delegated the day to day responsibility for the valuation of the Fund's investments to the Fair Value Committee (the Committee) established by the Fund's investment adviser. In accordance with valuation policies and procedures approved by the Board, the Fund attempts to obtain prices from one or more third party pricing vendors or brokers to value its investments. When current market prices, quotations or currency exchange rates are not readily available or reliable, investments will be fair valued in good faith by the Committee, in accordance with procedures adopted by the Board. Factors used in determining fair value vary by investment type and may include market or investment specific events, changes in interest rates and credit quality. The frequency with which these procedures are used cannot be predicted and they may be utilized to a significant extent. The Committee oversees the Fund's valuation policies and procedures and reports to the Board on the Committee's activities and fair value determinations. The Board monitors the appropriateness of the procedures used in valuing the Fund's investments and ratifies the fair value determinations of the Committee.
The Fund categorizes the inputs to valuation techniques used to value its investments into a disclosure hierarchy consisting of three levels as shown below:
- Level 1 – quoted prices in active markets for identical investments
- Level 2 – other significant observable inputs (including quoted prices for similar investments, interest rates, prepayment speeds, etc.)
- Level 3 – unobservable inputs (including the Fund's own assumptions based on the best information available)
Valuation techniques used to value the Fund's investments by major category are as follows:
Equity securities, including restricted securities, for which market quotations are readily available, are valued at the last reported sale price or official closing price as reported by a third party pricing vendor on the primary market or exchange on which they are traded and are categorized as Level 1 in the hierarchy. In the event there were no sales during the day or closing prices are not available, securities are valued at the last quoted bid price or may be valued using the last available price and are generally categorized as Level 2 in the hierarchy. For foreign equity securities, when market or security specific events arise, comparisons to the valuation of American Depositary Receipts (ADRs), futures contracts, Exchange-Traded Funds (ETFs) and certain indexes as well as quoted prices for similar securities may be used and would be categorized as Level 2 in the hierarchy. Utilizing these techniques may result in transfers between Level 1 and Level 2. For equity securities, including restricted securities, where observable inputs are limited, assumptions about market activity and risk are used and these securities may be categorized as Level 3 in the hierarchy.
Debt securities, including restricted securities, are valued based on evaluated prices received from third party pricing vendors or from brokers who make markets in such securities. U.S. government and government agency obligations are valued by pricing vendors who utilize matrix pricing which considers yield or price of bonds of comparable quality, coupon, maturity and type or by broker-supplied prices. When independent prices are unavailable or unreliable, debt securities may be valued utilizing pricing methodologies which consider similar factors that would be used by third party pricing vendors. Debt securities are generally categorized as Level 2 in the hierarchy but may be Level 3 depending on the circumstances.
Investments in open-end mutual funds, including the Fidelity Central Funds, are valued at their closing net asset value (NAV) each business day and are categorized as Level 1 in the hierarchy.
Changes in valuation techniques may result in transfers in or out of an assigned level within the disclosure hierarchy. The aggregate value of investments by input level as of October 31, 2018 is included at the end of the Fund's Schedule of Investments.
Foreign Currency. The Fund may use foreign currency contracts to facilitate transactions in foreign-denominated securities. Gains and losses from these transactions may arise from changes in the value of the foreign currency or if the counterparties do not perform under the contracts' terms.
Foreign-denominated assets, including investment securities, and liabilities are translated into U.S. dollars at the exchange rates at period end. Purchases and sales of investment securities, income and dividends received and expenses denominated in foreign currencies are translated into U.S. dollars at the exchange rate in effect on the transaction date.
The effects of exchange rate fluctuations on investments are included with the net realized and unrealized gain (loss) on investment securities. Other foreign currency transactions resulting in realized and unrealized gain (loss) are disclosed separately.
Investment Transactions and Income. For financial reporting purposes, the Fund's investment holdings and NAV include trades executed through the end of the last business day of the period. The NAV per share for processing shareholder transactions is calculated as of the close of business of the New York Stock Exchange (NYSE), normally 4:00 p.m. Eastern time and includes trades executed through the end of the prior business day. Gains and losses on securities sold are determined on the basis of identified cost. Dividend income is recorded on the ex-dividend date, except for certain dividends from foreign securities where the ex-dividend date may have passed, which are recorded as soon as the Fund is informed of the ex-dividend date. Non-cash dividends included in dividend income, if any, are recorded at the fair market value of the securities received. Income and capital gain distributions from Fidelity Central Funds, if any, are recorded on the ex-dividend date. Certain distributions received by the Fund represent a return of capital or capital gain. The Fund determines the components of these distributions subsequent to the ex-dividend date, based upon receipt of tax filings or other correspondence relating to the underlying investment. These distributions are recorded as a reduction of cost of investments and/or as a realized gain. Interest income is accrued as earned and includes coupon interest and amortization of premium and accretion of discount on debt securities as applicable. Investment income is recorded net of foreign taxes withheld where recovery of such taxes is uncertain.
Class Allocations and Expenses. Investment income, realized and unrealized capital gains and losses, common expenses of the Fund, and certain fund-level expense reductions, if any, are allocated daily on a pro-rata basis to each class based on the relative net assets of each class to the total net assets of the Fund. Each class differs with respect to transfer agent and distribution and service plan fees incurred. Certain expense reductions may also differ by class. For the reporting period, the allocated portion of income and expenses to each class as a percent of its average net assets may vary due to the timing of recording these transactions in relation to fluctuating net assets of the classes. Expenses directly attributable to a fund are charged to that fund. Expenses attributable to more than one fund are allocated among the respective funds on the basis of relative net assets or other appropriate methods. Expense estimates are accrued in the period to which they relate and adjustments are made when actual amounts are known.
Income Tax Information and Distributions to Shareholders. Each year, the Fund intends to qualify as a regulated investment company under Subchapter M of the Internal Revenue Code, including distributing substantially all of its taxable income and realized gains. As a result, no provision for U.S. Federal income taxes is required. As of October 31, 2018, the Fund did not have any unrecognized tax benefits in the financial statements; nor is the Fund aware of any tax positions for which it is reasonably possible that the total amounts of unrecognized tax benefits will significantly change in the next twelve months. The Fund files a U.S. federal tax return, in addition to state and local tax returns as required. The Fund's federal income tax returns are subject to examination by the Internal Revenue Service (IRS) for a period of three fiscal years after they are filed. State and local tax returns may be subject to examination for an additional fiscal year depending on the jurisdiction. Foreign taxes are provided for based on the Fund's understanding of the tax rules and rates that exist in the foreign markets in which it invests. The Fund is subject to a tax imposed on capital gains by certain countries in which it invests. An estimated deferred tax liability for net unrealized appreciation on the applicable securities is included in Other payables and accrued expenses on the Statement of Assets & Liabilities.
Distributions are declared and recorded on the ex-dividend date. Income and capital gain distributions are declared separately for each class. Income and capital gain distributions are determined in accordance with income tax regulations, which may differ from GAAP. In addition, the Fund claimed a portion of the payment made to redeeming shareholders as a distribution for income tax purposes.
Capital accounts within the financial statements are adjusted for permanent book-tax differences. These adjustments have no impact on net assets or the results of operations. Capital accounts are not adjusted for temporary book-tax differences which will reverse in a subsequent period.
Book-tax differences are primarily due to foreign currency transactions, futures transactions, certain foreign taxes, passive foreign investment companies (PFIC), market discount, capital loss carryforwards and losses deferred due to wash sales.
As of period end, the cost and unrealized appreciation (depreciation) in securities, and derivatives if applicable, for federal income tax purposes were as follows:
| Gross unrealized appreciation | $16,925,931 |
| Gross unrealized depreciation | (52,354,716) |
| Net unrealized appreciation (depreciation) | $(35,428,785) |
| Tax Cost | $308,732,795 |
The tax-based components of distributable earnings as of period end were as follows:
| Undistributed ordinary income | $4,482,081 |
| Capital loss carryforward | $(3,929,791) |
| Net unrealized appreciation (depreciation) on securities and other investments | $(35,445,320) |
Capital loss carryforwards are only available to offset future capital gains of the Fund to the extent provided by regulations and may be limited. Under the Regulated Investment Company Modernization Act of 2010 (the Act), the Fund is permitted to carry forward capital losses incurred in taxable years beginning after December 22, 2010 for an unlimited period and such capital losses are required to be used prior to any losses that expire. The capital loss carryforward information presented below, including any applicable limitation, is estimated as of fiscal period end and is subject to adjustment.
| No expiration | |
| Short-term | $(3,929,791) |
| Long-term | - |
| Total no expiration | $(3,929,791) |
| Total capital loss carryforward | $(3,929,791) |
The tax character of distributions paid was as follows:
| | October 31, 2018 | October 31, 2017 |
| Ordinary Income | $7,036,307 | $ 1,145,226 |
| Long-term Capital Gains | 2,588,908 | - |
| Total | $9,625,215 | $ 1,145,226 |
Short-Term Trading (Redemption) Fees. Shares held by investors in the Fund less than 90 days may have been subject to a redemption fee equal to 2.00% of the NAV of shares redeemed. All redemption fees, which reduce the proceeds of the shareholder redemption, are retained by the Fund and accounted for as an addition to paid in capital. In November 2017, the Board of Trustees approved the elimination of these redemption fees effective December 18, 2017.
Restricted Securities. The Fund may invest in securities that are subject to legal or contractual restrictions on resale. These securities generally may be resold in transactions exempt from registration or to the public if the securities are registered. Disposal of these securities may involve time-consuming negotiations and expense, and prompt sale at an acceptable price may be difficult. Information regarding restricted securities is included at the end of the Fund's Schedule of Investments.
New Rule Issuance. During August 2018, the U.S. Securities and Exchange Commission issued Final Rule Release No. 33-10532, Disclosure Update and Simplification. This Final Rule includes amendments specific to registered investment companies that are intended to eliminate overlap in disclosure requirements between Regulation S-X and GAAP. In accordance with these amendments, certain line-items in the Fund's financial statements have been combined or removed for the current period as outlined in the table below.
| Financial Statement | Current Line-Item Presentation | Prior Line-Item Presentation |
| Statement of Assets and Liabilities | Total distributable earnings (loss) | Undistributed/Distributions in excess of/Accumulated net investment income (loss)
Accumulated/Undistributed net realized gain (loss)
Net unrealized appreciation (depreciation) |
| Statement of Changes in Net Assets | N/A - removed | Undistributed/Distributions in excess of/Accumulated net investment income (loss) end of period |
| Statement of Changes in Net Assets | Distributions to shareholders | Distributions to shareholders from net investment income
Distributions to shareholders from net realized gain |
| Distributions to Shareholders Note to Financial Statements | Distributions to shareholders | Distributions to shareholders from net investment income
Distributions to shareholders from net realized gain |
4. Derivative Instruments.
Risk Exposures and the Use of Derivative Instruments. The Fund's investment objective allows the Fund to enter into various types of derivative contracts, including futures contracts. Derivatives are investments whose value is primarily derived from underlying assets, indices or reference rates and may be transacted on an exchange or over-the-counter (OTC). Derivatives may involve a future commitment to buy or sell a specified asset based on specified terms, to exchange future cash flows at periodic intervals based on a notional principal amount, or for one party to make one or more payments upon the occurrence of specified events in exchange for periodic payments from the other party.
The Fund used derivatives to increase returns and to manage exposure to certain risks as defined below. The success of any strategy involving derivatives depends on analysis of numerous economic factors, and if the strategies for investment do not work as intended, the Fund may not achieve its objectives.
The Fund's use of derivatives increased or decreased its exposure to the following risk:
| Equity Risk | Equity risk relates to the fluctuations in the value of financial instruments as a result of changes in market prices (other than those arising from interest rate risk or foreign exchange risk), whether caused by factors specific to an individual investment, its issuer, or all factors affecting all instruments traded in a market or market segment.
|
The Fund is also exposed to additional risks from investing in derivatives, such as liquidity risk and counterparty credit risk. Liquidity risk is the risk that the Fund will be unable to close out the derivative in the open market in a timely manner. Counterparty credit risk is the risk that the counterparty will not be able to fulfill its obligation to the Fund. Counterparty credit risk related to exchange-traded futures contracts may be mitigated by the protection provided by the exchange on which they trade.
Investing in derivatives may involve greater risks than investing in the underlying assets directly and, to varying degrees, may involve risk of loss in excess of any initial investment and collateral received and amounts recognized in the Statement of Assets and Liabilities. In addition, there may be the risk that the change in value of the derivative contract does not correspond to the change in value of the underlying instrument.
Futures Contracts. A futures contract is an agreement between two parties to buy or sell a specified underlying instrument for a fixed price at a specified future date. The Fund used futures contracts to manage its exposure to the stock market.
Upon entering into a futures contract, a fund is required to deposit either cash or securities (initial margin) with a clearing broker in an amount equal to a certain percentage of the face value of the contract. Futures contracts are marked-to-market daily and subsequent daily payments (variation margin) are made or received by a fund depending on the daily fluctuations in the value of the futures contracts and are recorded as unrealized appreciation or (depreciation). This receivable and/or payable, if any, is included in daily variation margin on futures contracts in the Statement of Assets and Liabilities. Realized gain or (loss) is recorded upon the expiration or closing of a futures contract. The net realized gain (loss) and change in net unrealized appreciation (depreciation) on futures contracts during the period is presented in the Statement of Operations.
Any open futures contracts at period end are presented in the Schedule of Investments under the caption "Futures Contracts". The notional amount at value reflects each contract's exposure to the underlying instrument or index at period end and is representative of volume of activity during the period. Securities deposited to meet initial margin requirements are identified in the Schedule of Investments.
5. Purchases and Sales of Investments.
Purchases and sales of securities, other than short-term securities, aggregated $389,008,799 and $430,453,965, respectively.
6. Fees and Other Transactions with Affiliates.
Management Fee. Fidelity Management & Research Company (the investment adviser) and its affiliates provide the Fund with investment management related services for which the Fund pays a monthly management fee. The management fee is the sum of an individual fund fee rate that is based on an annual rate of .60% of the Fund's average net assets and an annualized group fee rate that averaged .24% during the period. The group fee rate is based upon the average net assets of all the mutual funds advised by the investment adviser, including any mutual funds previously advised by the investment adviser that are currently advised by Fidelity SelectCo, LLC, an affiliate of the investment adviser. The group fee rate decreases as assets under management increase and increases as assets under management decrease. For the reporting period, the total annual management fee rate was .84% of the Fund's average net assets.
Distribution and Service Plan Fees. In accordance with Rule 12b-1 of the 1940 Act, the Fund has adopted separate Distribution and Service Plans for each class of shares. Certain classes pay Fidelity Distributors Corporation (FDC), an affiliate of the investment adviser, separate Distribution and Service Fees, each of which is based on an annual percentage of each class' average net assets. In addition, FDC may pay financial intermediaries for selling shares of the Fund and providing shareholder support services. For the period, the Distribution and Service Fee rates, total fees and amounts retained by FDC were as follows:
| | Distribution Fee | Service Fee | Total Fees | Retained by FDC |
| Class A | -% | .25% | $47,932 | $6,372 |
| Class M | .25% | .25% | 50,092 | 2,771 |
| Class C | .75% | .25% | 153,905 | 58,660 |
| | | | $251,929 | $67,803 |
Sales Load. FDC may receive a front-end sales charge of up to 5.75% for selling Class A shares and 3.50% for selling Class M shares, some of which is paid to financial intermediaries for selling shares of the Fund. Depending on the holding period, FDC may receive contingent deferred sales charges levied on Class A, Class M and Class C redemptions. The deferred sales charges are 1.00% for Class C shares, 1.00% for certain purchases of Class A shares and .25% for certain purchases of Class M shares.
For the period, sales charge amounts retained by FDC were as follows:
| | Retained by FDC |
| Class A | $31,977 |
| Class M | 3,633 |
| Class C(a) | 3,878 |
| | $39,488 |
(a) When Class C shares are initially sold, FDC pays commissions from its own resources to financial intermediaries through which the sales are made.
Transfer Agent Fees. Fidelity Investments Institutional Operations Company, Inc., (FIIOC), an affiliate of the investment adviser, is the transfer, dividend disbursing and shareholder servicing agent for each class of the Fund. FIIOC receives account fees and asset-based fees that vary according to the account size and type of account of the shareholders of the respective classes of the Fund, except for Class Z. FIIOC receives an asset-based fee of Class Z's average net assets. FIIOC pays for typesetting, printing and mailing of shareholder reports, except proxy statements.
For the period, transfer agent fees for each class were as follows:
| | Amount | % of Class-Level Average Net Assets |
| Class A | $44,392 | .23 |
| Class M | 25,764 | .26 |
| Class C | 37,951 | .25 |
| Emerging Markets Discovery | 532,258 | .19 |
| Class I | 179,443 | .19 |
| Class Z | 9 | .04(a) |
| | $819,817 | |
(a) Annualized.
Accounting and Security Lending Fees. Fidelity Service Company, Inc. (FSC), an affiliate of the investment adviser, maintains the Fund's accounting records. The accounting fee is based on the level of average net assets for each month. Under a separate contract, FSC administers the security lending program. The security lending fee is based on the number and duration of lending transactions. For the period, the fees were equivalent to an annual rate of .05%.
Brokerage Commissions. The Fund placed a portion of its portfolio transactions with brokerage firms which are affiliates of the investment adviser. Brokerage commissions are included in net realized gain (loss) and change in net unrealized appreciation (depreciation) in the Statement of Operations. The commissions paid to these affiliated firms were $2,074 for the period.
Interfund Lending Program. Pursuant to an Exemptive Order issued by the SEC, the Fund, along with other registered investment companies having management contracts with Fidelity Management & Research Company (FMR) or other affiliated entities of FMR, may participate in an interfund lending program. This program provides an alternative credit facility allowing the funds to borrow from, or lend money to, other participating affiliated funds. At period end, there were no interfund loans outstanding. The Fund's activity in this program during the period for which loans were outstanding was as follows:
| Borrower or Lender | Average Loan Balance | Weighted Average Interest Rate | Interest Expense |
| Borrower | $4,425,667 | 2.14% | $788 |
Interfund Trades. The Fund may purchase from or sell securities to other Fidelity Funds under procedures adopted by the Board. The procedures have been designed to ensure these interfund trades are executed in accordance with Rule 17a-7 of the 1940 Act. Interfund trades are included within the respective purchases and sales amounts shown in the Purchases and Sales of Investments note.
Other. During the period, the investment adviser reimbursed the Fund for certain losses in the amount of $7,543.
7. Committed Line of Credit.
The Fund participates with other funds managed by the investment adviser or an affiliate in a $4.25 billion credit facility (the "line of credit") to be utilized for temporary or emergency purposes to fund shareholder redemptions or for other short-term liquidity purposes. The Fund has agreed to pay commitment fees on its pro-rata portion of the line of credit, which amounted to $1,189 and is reflected in Miscellaneous expenses on the Statement of Operations. During the period, the Fund did not borrow on this line of credit.
8. Security Lending.
The Fund lends portfolio securities through a lending agent from time to time in order to earn additional income. For equity securities, a lending agent is used and may loan securities to certain qualified borrowers, including Fidelity Capital Markets (FCM), a broker-dealer affiliated with the Fund. On the settlement date of the loan, the Fund receives collateral (in the form of U.S. Treasury obligations, letters of credit and/or cash) against the loaned securities and maintains collateral in an amount not less than 100% of the market value of the loaned securities during the period of the loan. The market value of the loaned securities is determined at the close of business of the Fund and any additional required collateral is delivered to the Fund on the next business day. The Fund or borrower may terminate the loan at any time, and if the borrower defaults on its obligation to return the securities loaned because of insolvency or other reasons, the Fund may apply collateral received from the borrower against the obligation. The Fund may experience delays and costs in recovering the securities loaned. Any cash collateral received is invested in the Fidelity Securities Lending Cash Central Fund. The value of loaned securities and cash collateral at period end are disclosed on the Fund's Statement of Assets and Liabilities. At period end, there were no security loans outstanding with FCM. Security lending income represents the income earned on investing cash collateral, less rebates paid to borrowers and any lending agent fees associated with the loan, plus any premium payments received for lending certain types of securities. Security lending income is presented in the Statement of Operations as a component of income from Fidelity Central Funds. Total security lending income during the period amounted to $110,375, including $73 from securities loaned to FCM.
9. Expense Reductions.
The investment adviser contractually agreed to reimburse each class to the extent annual operating expenses exceeded certain levels of class-level average net assets as noted in the table below. This reimbursement will remain in place through February 29, 2020. Some expenses, for example the compensation of the independent Trustees, and certain miscellaneous expenses such as proxy and shareholder meeting expenses, are excluded from this reimbursement.
The following classes were in reimbursement during the period:
| | Expense Limitations | Reimbursement |
| Class Z | 1.30% | $35 |
Commissions paid to certain brokers with whom the investment adviser, or its affiliates, places trades on behalf of the Fund include an amount in addition to trade execution, which may be rebated back to the Fund to offset certain expenses. This amount totaled $173,608 for the period.
In addition, during the period the investment adviser reimbursed and/or waived a portion of fund-level operating expenses in the amount of $4,308.
10. Distributions to Shareholders.
Distributions to shareholders of each class were as follows:
| | Year ended
October 31, 2018 | Year ended
October 31, 2017 |
| Distributions to shareholders | | |
| Class A | $352,909 | $– |
| Class M | 173,255 | – |
| Class C | 250,963 | – |
| Emerging Markets Discovery | 6,626,159 | – |
| Class I | 2,221,929 | – |
| Total | $9,625,215 | $– |
| From net investment income | | |
| Class A | $– | $29,900 |
| Class M | – | 10,789 |
| Class C | – | 1,070 |
| Emerging Markets Discovery | – | 534,294 |
| Class I | – | 83,753 |
| Total | $– | $659,806 |
| From net realized gain | | |
| Class A | $– | $29,370 |
| Class M | – | 15,653 |
| Class C | – | 12,406 |
| Emerging Markets Discovery | – | 375,874 |
| Class I | – | 52,117 |
| Total | $– | $485,420 |
11. Share Transactions.
Share transactions for each class were as follows and may contain automatic conversions between classes or exchanges between affiliated funds:
| | Shares | Shares | Dollars | Dollars |
| | Year ended October 31, 2018 (a) | Year ended October 31, 2017 | Year ended October 31, 2018(a) | Year ended October 31, 2017 |
| Class A | | | | |
| Shares sold | 777,539 | 938,873 | $11,772,607 | $12,644,829 |
| Reinvestment of distributions | 23,808 | 4,936 | 349,501 | 55,853 |
| Shares redeemed | (665,814) | (303,068) | (9,435,862) | (4,070,793) |
| Net increase (decrease) | 135,533 | 640,741 | $2,686,246 | $8,629,889 |
| Class M | | | | |
| Shares sold | 210,943 | 451,879 | $3,284,695 | $5,910,208 |
| Reinvestment of distributions | 11,842 | 2,312 | 173,256 | 26,067 |
| Shares redeemed | (401,523) | (60,393) | (5,504,533) | (796,878) |
| Net increase (decrease) | (178,738) | 393,798 | $(2,046,582) | $5,139,397 |
| Class C | | | | |
| Shares sold | 347,529 | 856,704 | $5,193,330 | $11,379,958 |
| Reinvestment of distributions | 17,450 | 1,203 | 250,411 | 13,340 |
| Shares redeemed | (365,570) | (74,143) | (5,076,684) | (999,641) |
| Net increase (decrease) | (591) | 783,764 | $367,057 | $10,393,657 |
| Emerging Markets Discovery | | | | |
| Shares sold | 10,973,034 | 14,972,932 | $167,396,079 | $202,173,147 |
| Reinvestment of distributions | 427,369 | 74,929 | 6,303,689 | 850,905 |
| Shares redeemed | (12,217,890) | (4,082,672) | (179,945,966) | (56,381,917) |
| Net increase (decrease) | (817,487) | 10,965,189 | $(6,246,198) | $146,642,135 |
| Class I | | | | |
| Shares sold | 3,126,297 | 6,604,470 | $46,808,802 | $89,627,624 |
| Reinvestment of distributions | 148,725 | 11,894 | 2,198,156 | 135,413 |
| Shares redeemed | (4,945,734) | (877,747) | (69,393,677) | (11,209,247) |
| Net increase (decrease) | (1,670,712) | 5,738,617 | $(20,386,719) | $78,553,790 |
| Class Z | | | | |
| Shares sold | 117,308 | – | $1,426,892 | $– |
| Shares redeemed | (875) | – | (10,399) | – |
| Net increase (decrease) | 116,433 | – | $1,416,493 | $– |
(a) Share transactions for Class Z are for the period October 2, 2018 (commencement of sale of shares) to October 31, 2018
12. Other.
The Fund's organizational documents provide former and current trustees and officers with a limited indemnification against liabilities arising in connection with the performance of their duties to the Fund. In the normal course of business, the Fund may also enter into contracts that provide general indemnifications. The Fund's maximum exposure under these arrangements is unknown as this would be dependent on future claims that may be made against the Fund. The risk of material loss from such claims is considered remote.
Report of Independent Registered Public Accounting Firm
To the Board of Trustees of Fidelity Investment Trust and Shareholders of Fidelity Emerging Markets Discovery Fund:
Opinion on the Financial Statements
We have audited the accompanying statement of assets and liabilities, including the schedule of investments, of Fidelity Emerging Markets Discovery Fund (one of the funds constituting Fidelity Investment Trust, referred to hereafter as the "Fund") as of October 31, 2018, the related statement of operations for the year ended October 31, 2018, the statement of changes in net assets for each of the two years in the period ended October 31, 2018, including the related notes, and the financial highlights for each of the periods indicated therein (collectively referred to as the “financial statements”). In our opinion, the financial statements present fairly, in all material respects, the financial position of the Fund as of October 31, 2018, the results of its operations for the year then ended, the changes in its net assets for each of the two years in the period ended October 31, 2018 and the financial highlights for each of the periods indicated therein in conformity with accounting principles generally accepted in the United States of America.
Basis for Opinion
These financial statements are the responsibility of the Fund’s management. Our responsibility is to express an opinion on the Fund’s financial statements based on our audits. We are a public accounting firm registered with the Public Company Accounting Oversight Board (United States) (“PCAOB”) and are required to be independent with respect to the Fund in accordance with the U.S. federal securities laws and the applicable rules and regulations of the Securities and Exchange Commission and the PCAOB.
We conducted our audits of these financial statements in accordance with the standards of the PCAOB. Those standards require that we plan and perform the audit to obtain reasonable assurance about whether the financial statements are free of material misstatement, whether due to error or fraud.
Our audits included performing procedures to assess the risks of material misstatement of the financial statements, whether due to error or fraud, and performing procedures that respond to those risks. Such procedures included examining, on a test basis, evidence regarding the amounts and disclosures in the financial statements. Our audits also included evaluating the accounting principles used and significant estimates made by management, as well as evaluating the overall presentation of the financial statements. Our procedures included confirmation of securities owned as of October 31, 2018 by correspondence with the custodians and brokers; when replies were not received from brokers, we performed other auditing procedures. We believe that our audits provide a reasonable basis for our opinion.
PricewaterhouseCoopers LLP
Boston, Massachusetts
December 14, 2018
We have served as the auditor of one or more investment companies in the Fidelity group of funds since 1932.
Trustees and Officers
The Trustees, Members of the Advisory Board (if any), and officers of the trust and fund, as applicable, are listed below. The Board of Trustees governs the fund and is responsible for protecting the interests of shareholders. The Trustees are experienced executives who meet periodically throughout the year to oversee the fund's activities, review contractual arrangements with companies that provide services to the fund, oversee management of the risks associated with such activities and contractual arrangements, and review the fund's performance. Except for Jonathan Chiel, each of the Trustees oversees 283 funds. Mr. Chiel oversees 154 funds.
The Trustees hold office without limit in time except that (a) any Trustee may resign; (b) any Trustee may be removed by written instrument, signed by at least two-thirds of the number of Trustees prior to such removal; (c) any Trustee who requests to be retired or who has become incapacitated by illness or injury may be retired by written instrument signed by a majority of the other Trustees; and (d) any Trustee may be removed at any special meeting of shareholders by a two-thirds vote of the outstanding voting securities of the trust. Each Trustee who is not an interested person (as defined in the 1940 Act) of the trust and the fund is referred to herein as an Independent Trustee. Each Independent Trustee shall retire not later than the last day of the calendar year in which his or her 75th birthday occurs. The Independent Trustees may waive this mandatory retirement age policy with respect to individual Trustees. Officers and Advisory Board Members hold office without limit in time, except that any officer or Advisory Board Member may resign or may be removed by a vote of a majority of the Trustees at any regular meeting or any special meeting of the Trustees. Except as indicated, each individual has held the office shown or other offices in the same company for the past five years.
The fund’s Statement of Additional Information (SAI) includes more information about the Trustees. To request a free copy, call Fidelity at 1-877-208-0098.
Experience, Skills, Attributes, and Qualifications of the Trustees. The Governance and Nominating Committee has adopted a statement of policy that describes the experience, qualifications, attributes, and skills that are necessary and desirable for potential Independent Trustee candidates (Statement of Policy). The Board believes that each Trustee satisfied at the time he or she was initially elected or appointed a Trustee, and continues to satisfy, the standards contemplated by the Statement of Policy. The Governance and Nominating Committee also engages professional search firms to help identify potential Independent Trustee candidates who have the experience, qualifications, attributes, and skills consistent with the Statement of Policy. From time to time, additional criteria based on the composition and skills of the current Independent Trustees, as well as experience or skills that may be appropriate in light of future changes to board composition, business conditions, and regulatory or other developments, have also been considered by the professional search firms and the Governance and Nominating Committee. In addition, the Board takes into account the Trustees' commitment and participation in Board and committee meetings, as well as their leadership of standing and ad hoc committees throughout their tenure.
In determining that a particular Trustee was and continues to be qualified to serve as a Trustee, the Board has considered a variety of criteria, none of which, in isolation, was controlling. The Board believes that, collectively, the Trustees have balanced and diverse experience, qualifications, attributes, and skills, which allow the Board to operate effectively in governing the fund and protecting the interests of shareholders. Information about the specific experience, skills, attributes, and qualifications of each Trustee, which in each case led to the Board's conclusion that the Trustee should serve (or continue to serve) as a trustee of the fund, is provided below.
Board Structure and Oversight Function. James C. Curvey is an interested person and currently serves as Chairman. The Trustees have determined that an interested Chairman is appropriate and benefits shareholders because an interested Chairman has a personal and professional stake in the quality and continuity of services provided to the fund. Independent Trustees exercise their informed business judgment to appoint an individual of their choosing to serve as Chairman, regardless of whether the Trustee happens to be independent or a member of management. The Independent Trustees have determined that they can act independently and effectively without having an Independent Trustee serve as Chairman and that a key structural component for assuring that they are in a position to do so is for the Independent Trustees to constitute a substantial majority for the Board. The Independent Trustees also regularly meet in executive session. Ned C. Lautenbach serves as Chairman of the Independent Trustees and as such (i) acts as a liaison between the Independent Trustees and management with respect to matters important to the Independent Trustees and (ii) with management prepares agendas for Board meetings.
Fidelity® funds are overseen by different Boards of Trustees. The fund's Board oversees Fidelity's high income and certain equity funds, and other Boards oversee Fidelity's investment-grade bond, money market, asset allocation, and other equity funds. The asset allocation funds may invest in Fidelity® funds overseen by the fund's Board. The use of separate Boards, each with its own committee structure, allows the Trustees of each group of Fidelity® funds to focus on the unique issues of the funds they oversee, including common research, investment, and operational issues. On occasion, the separate Boards establish joint committees to address issues of overlapping consequences for the Fidelity® funds overseen by each Board.
The Trustees operate using a system of committees to facilitate the timely and efficient consideration of all matters of importance to the Trustees, the fund, and fund shareholders and to facilitate compliance with legal and regulatory requirements and oversight of the fund's activities and associated risks. The Board, acting through its committees, has charged FMR and its affiliates with (i) identifying events or circumstances the occurrence of which could have demonstrably adverse effects on the fund's business and/or reputation; (ii) implementing processes and controls to lessen the possibility that such events or circumstances occur or to mitigate the effects of such events or circumstances if they do occur; and (iii) creating and maintaining a system designed to evaluate continuously business and market conditions in order to facilitate the identification and implementation processes described in (i) and (ii) above. Because the day-to-day operations and activities of the fund are carried out by or through FMR, its affiliates, and other service providers, the fund's exposure to risks is mitigated but not eliminated by the processes overseen by the Trustees. While each of the Board's committees has responsibility for overseeing different aspects of the fund's activities, oversight is exercised primarily through the Operations, Audit, and Compliance Committees. In addition, the Independent Trustees have worked with Fidelity to enhance the Board's oversight of investment and financial risks, legal and regulatory risks, technology risks, and operational risks, including the development of additional risk reporting to the Board. Appropriate personnel, including but not limited to the fund's Chief Compliance Officer (CCO), FMR's internal auditor, the independent accountants, the fund's Treasurer and portfolio management personnel, make periodic reports to the Board's committees, as appropriate, including an annual review of Fidelity's risk management program for the Fidelity® funds. The responsibilities of each standing committee, including their oversight responsibilities, are described further under "Standing Committees of the Trustees."
Interested Trustees*:
Correspondence intended for a Trustee who is an interested person may be sent to Fidelity Investments, 245 Summer Street, Boston, Massachusetts 02210.
Name, Year of Birth; Principal Occupations and Other Relevant Experience+
Jonathan Chiel (1957)
Year of Election or Appointment: 2016
Trustee
Mr. Chiel also serves as Trustee of other Fidelity® funds. Mr. Chiel is Executive Vice President and General Counsel for FMR LLC (diversified financial services company, 2012-present). Previously, Mr. Chiel served as general counsel (2004-2012) and senior vice president and deputy general counsel (2000-2004) for John Hancock Financial Services; a partner with Choate, Hall & Stewart (1996-2000) (law firm); and an Assistant United States Attorney for the United States Attorney’s Office of the District of Massachusetts (1986-95), including Chief of the Criminal Division (1993-1995). Mr. Chiel is a director on the boards of the Boston Bar Foundation and the Maimonides School.
James C. Curvey (1935)
Year of Election or Appointment: 2007
Trustee
Chairman of the Board of Trustees
Mr. Curvey also serves as Trustee of other Fidelity® funds. Mr. Curvey is Vice Chairman (2007-present) and Director of FMR LLC (diversified financial services company). In addition, Mr. Curvey is an Overseer Emeritus for the Boston Symphony Orchestra, a Director of Artis-Naples, and a Trustee of Brewster Academy in Wolfeboro, New Hampshire. Previously, Mr. Curvey served as a Director of Fidelity Research & Analysis Co. (investment adviser firm, 2009-2018), Director of Fidelity Investments Money Management, Inc. (investment adviser firm, 2009-2014) and a Director of FMR and FMR Co., Inc. (investment adviser firms, 2007-2014).
Charles S. Morrison (1960)
Year of Election or Appointment: 2014
Trustee
Mr. Morrison also serves as Trustee of other funds. He serves as President of Fidelity SelectCo, LLC (investment adviser firm, 2017-present) and Fidelity Management & Research Company (FMR) (investment adviser firm, 2016-present), a Director of Fidelity Investments Money Management, Inc. (FIMM) (investment adviser firm, 2014-present), Director of Fidelity SelectCo, LLC (investment adviser firm, 2014-present), President, Asset Management (2014-present), and is an employee of Fidelity Investments. Previously, Mr. Morrison served as Vice President of Fidelity's Fixed Income and Asset Allocation Funds (2012-2014), President, Fixed Income (2011-2014), Vice President of Fidelity's Money Market Funds (2005-2009), President, Money Market Group Leader of FMR (investment adviser firm, 2009), and Senior Vice President, Money Market Group of FMR (2004-2009). Mr. Morrison also served as Vice President of Fidelity's Bond Funds (2002-2005), certain Balanced Funds (2002-2005), and certain Asset Allocation Funds (2002-2007), and as Senior Vice President (2002-2005) of Fidelity's Bond Division.
* Determined to be an “Interested Trustee” by virtue of, among other things, his or her affiliation with the trust or various entities under common control with FMR.
+ The information includes the Trustee's principal occupation during the last five years and other information relating to the experience, attributes, and skills relevant to the Trustee's qualifications to serve as a Trustee, which led to the conclusion that the Trustee should serve as a Trustee for the fund.
Independent Trustees:
Correspondence intended for an Independent Trustee may be sent to Fidelity Investments, P.O. Box 55235, Boston, Massachusetts 02205-5235.
Name, Year of Birth; Principal Occupations and Other Relevant Experience+
Dennis J. Dirks (1948)
Year of Election or Appointment: 2005
Trustee
Mr. Dirks also serves as Trustee of other Fidelity® funds. Prior to his retirement in May 2003, Mr. Dirks was Chief Operating Officer and a member of the Board of The Depository Trust & Clearing Corporation (DTCC). He also served as President, Chief Operating Officer, and Board member of The Depository Trust Company (DTC) and President and Board member of the National Securities Clearing Corporation (NSCC). In addition, Mr. Dirks served as Chief Executive Officer and Board member of the Government Securities Clearing Corporation, Chief Executive Officer and Board member of the Mortgage-Backed Securities Clearing Corporation, as a Trustee and a member of the Finance Committee of Manhattan College (2005-2008), as a Trustee and a member of the Finance Committee of AHRC of Nassau County (2006-2008), as a member of the Independent Directors Council (IDC) Governing Council (2010-2015), and as a member of the Board of Directors for The Brookville Center for Children’s Services, Inc. (2009-2017). Mr. Dirks is a member of the Finance Committee (2016-present), Board of Directors (2017-present) and Board of Trustees (2018-present) and is Treasurer (2018-present) of the Asolo Repertory Theatre.
Donald F. Donahue (1950)
Year of Election or Appointment: 2018
Trustee
Mr. Donahue also serves as a Trustee of other Fidelity® funds. Mr. Donahue is President and Chief Executive Officer of Miranda Partners, LLC (risk consulting for the financial services industry, 2012-present). Previously, Mr. Donahue served as a Member of the Advisory Board of certain Fidelity® funds (2015-2018) and Chief Executive Officer (2006-2012), Chief Operating Officer (2003-2006), and Managing Director, Customer Marketing and Development (1999-2003) of The Depository Trust & Clearing Corporation (financial markets infrastructure). Mr. Donahue serves as a Member (2007-present) and Co-Chairman (2016-present) of the Board of Directors of United Way of New York, Member of the Board of Directors of NYC Leadership Academy (2012-present) and Member of the Board of Advisors of Ripple Labs, Inc. (financial services, 2015-present). He also served as Chairman (2010-2012) and Member of the Board of Directors (2012-2013) of Omgeo, LLC (financial services), Treasurer of United Way of New York (2012-2016), and Member of the Board of Directors of XBRL US (financial services non-profit, 2009-2012) and the International Securities Services Association (2009-2012).
Alan J. Lacy (1953)
Year of Election or Appointment: 2008
Trustee
Mr. Lacy also serves as Trustee of other Fidelity® funds. Mr. Lacy serves as a Director of Bristol-Myers Squibb Company (global pharmaceuticals, 2008-present). He is a Trustee of the California Chapter of The Nature Conservancy (2015-present) and a Director of the Center for Advanced Study in the Behavioral Sciences at Stanford University (2015-present). In addition, Mr. Lacy served as Senior Adviser (2007-2014) of Oak Hill Capital Partners, L.P. (private equity) and also served as Chief Executive Officer (2005) and Vice Chairman (2005-2006) of Sears Holdings Corporation (retail) and Chief Executive Officer and Chairman of the Board of Sears, Roebuck and Co. (retail, 2000-2005). Previously, Mr. Lacy served as Chairman (2014-2017) and a member (2010-2017) of the Board of Directors of Dave & Buster’s Entertainment, Inc. (restaurant and entertainment complexes), as Chairman (2008-2011) and a member (2006-2015) of the Board of Trustees of the National Parks Conservation Association, and as a member of the Board of Directors for The Hillman Companies, Inc. (hardware wholesalers, 2010-2014), Earth Fare, Inc. (retail grocery, 2010-2014), and The Western Union Company (global money transfer, 2006-2011).
Ned C. Lautenbach (1944)
Year of Election or Appointment: 2000
Trustee
Chairman of the Independent Trustees
Mr. Lautenbach also serves as Trustee of other Fidelity® funds. Mr. Lautenbach currently serves as Vice Chair of the Board of Governors, State University System of Florida (2013-present) and is a member of the Council on Foreign Relations (1994-present). He is also a member and has most recently served as Chairman of the Board of Directors of Artis-Naples (2012-present). Previously, Mr. Lautenbach served as a member and then Lead Director of the Board of Directors of Eaton Corporation (diversified industrial, 1997-2016). He was also a Partner and Advisory Partner at Clayton, Dubilier & Rice, LLC (private equity investment, 1998-2010), as well as a Director of Sony Corporation (2006-2007). In addition, Mr. Lautenbach also had a 30-year career with IBM (technology company) during which time he served as Senior Vice President and a member of the Corporate Executive Committee (1968-1998).
Joseph Mauriello (1944)
Year of Election or Appointment: 2008
Trustee
Mr. Mauriello also serves as Trustee of other Fidelity® funds. Prior to his retirement in January 2006, Mr. Mauriello served in numerous senior management positions including Deputy Chairman and Chief Operating Officer (2004-2005), and Vice Chairman of Financial Services (2002-2004) of KPMG LLP US (professional services, 1965-2005). Mr. Mauriello currently serves as a member of the Independent Directors Council (IDC) Governing Council (2015-present). Previously, Mr. Mauriello served as a member of the Board of Directors of XL Group plc. (global insurance and re-insurance, 2006-2018).
Cornelia M. Small (1944)
Year of Election or Appointment: 2005
Trustee
Ms. Small also serves as Trustee of other Fidelity® funds. Ms. Small is a member of the Board of Directors (2009-present) and Chair of the Investment Committee (2010-present) of the Teagle Foundation. Ms. Small also serves on the Investment Committee of the Berkshire Taconic Community Foundation (2008-present). Previously, Ms. Small served as Chairperson (2002-2008) and a member of the Investment Committee and Chairperson (2008-2012) and a member of the Board of Trustees of Smith College. In addition, Ms. Small served as Chief Investment Officer, Director of Global Equity Investments, and a member of the Board of Directors of Scudder, Stevens & Clark and Scudder Kemper Investments.
Garnett A. Smith (1947)
Year of Election or Appointment: 2018
Trustee
Mr. Smith also serves as Trustee of other Fidelity® funds. Prior to Mr. Smith's retirement, he served as Chairman and Chief Executive Officer of Inbrand Corp. (manufacturer of personal absorbent products, 1990-1997). He also served as President (1986-1990) of Inbrand Corp. Prior to his employment with Inbrand Corp., he was employed by a retail fabric chain and North Carolina National Bank. In addition, Mr. Smith served as a Member of the Advisory Board of certain Fidelity® funds (2012-2013) and as a board member of the Jackson Hole Land Trust (2009-2012).
David M. Thomas (1949)
Year of Election or Appointment: 2008
Trustee
Mr. Thomas also serves as Trustee of other Fidelity® funds. Mr. Thomas serves as Non-Executive Chairman of the Board of Directors of Fortune Brands Home and Security (home and security products, 2011-present), as a member of the Board of Directors (2004-present) and Presiding Director (2013-present) of Interpublic Group of Companies, Inc. (marketing communication), and as a member of the Board of Trustees of the University of Florida (2013-present). Previously, Mr. Thomas served as Executive Chairman (2005-2006) and Chairman and Chief Executive Officer (2000-2005) of IMS Health, Inc. (pharmaceutical and healthcare information solutions), and a Director of Fortune Brands, Inc. (consumer products, 2000-2011).
+ The information includes the Trustee's principal occupation during the last five years and other information relating to the experience, attributes, and skills relevant to the Trustee's qualifications to serve as a Trustee, which led to the conclusion that the Trustee should serve as a Trustee for the fund.
Advisory Board Members and Officers:
Correspondence intended for a Member of the Advisory Board (if any) may be sent to Fidelity Investments, P.O. Box 55235, Boston, Massachusetts 02205-5235. Correspondence intended for an officer or Peter S. Lynch may be sent to Fidelity Investments, 245 Summer Street, Boston, Massachusetts 02210. Officers appear below in alphabetical order.
Name, Year of Birth; Principal Occupation
Vicki L. Fuller (1957)
Year of Election or Appointment: 2018
Member of the Advisory Board
Ms. Fuller also serves as Member of the Advisory Board of other Fidelity® funds. Ms. Fuller serves as a member of the Board of Directors, Audit Committee, and Nominating and Governance Committee of The Williams Companies, Inc. (natural gas infrastructure, 2018-present). Previously, Ms. Fuller served as the Chief Investment Officer of the New York State Common Retirement Fund (2012-2018) and held a variety of positions at AllianceBernstein L.P. (global asset management, 1985-2012), including Managing Director (2006-2012) and Senior Vice President and Senior Portfolio Manager (2001-2006).
Peter S. Lynch (1944)
Year of Election or Appointment: 2003
Member of the Advisory Board
Mr. Lynch also serves as Member of the Advisory Board of other Fidelity® funds. Mr. Lynch is Vice Chairman and a Director of FMR (investment adviser firm) and FMR Co., Inc. (investment adviser firm). In addition, Mr. Lynch serves as a Trustee of Boston College and as the Chairman of the Inner-City Scholarship Fund. Previously, Mr. Lynch served on the Special Olympics International Board of Directors (1997-2006).
William S. Stavropoulos (1939)
Year of Election or Appointment: 2018
Member of the Advisory Board
Mr. Stavropoulos also serves as Member of the Advisory Board of other Fidelity® funds. Mr. Stavropoulos serves as President and Founder of the Michigan Baseball Foundation, the Great Lakes Loons (2007-present). Mr. Stavropoulos is Chairman Emeritus of the Board of Directors of The Dow Chemical Company, where he previously served in numerous senior management positions, including President, CEO (1995-2000; 2002-2004), Chairman of the Executive Committee (2000-2006), and as a member of the Board of Directors (1990-2006). Currently, Mr. Stavropoulos is Chairman of the Board of Directors of Univar Inc. (global distributor of commodity and specialty chemicals), a Director of Teradata Corporation (data warehousing and technology solutions), and a member of the Advisory Board for Metalmark Capital LLC (private equity investment, 2005-present). Mr. Stavropoulos is an operating advisor to Clayton, Dubilier & Rice, LLC (private equity investment). In addition, Mr. Stavropoulos is a member of the University of Notre Dame Advisory Council for the College of Science, a Trustee of the Rollin L. Gerstacker Foundation, and a Director of Artis-Naples in Naples, Florida. Previously, Mr. Stavropoulos served as Trustee of certain Fidelity® funds (2001-2018) and as a Director of Chemical Financial Corporation (bank holding company, 1993-2012) and Tyco International, Ltd. (multinational manufacturing and services, 2007-2012).
Carol B. Tomé (1957)
Year of Election or Appointment: 2018
Member of the Advisory Board
Ms. Tomé also serves as Member of the Advisory Board of other Fidelity® funds. Ms. Tomé is Chief Financial Officer (2001-present) and Executive Vice President of Corporate Services (2007-present) of The Home Depot, Inc. (home improvement retailer) and a Director (2003-present) and Chair of the Audit Committee (2004-present) of United Parcel Service, Inc. (package delivery and supply chain management). Previously, Ms. Tomé served as Trustee of certain Fidelity® funds (2017), Senior Vice President of Finance and Accounting/Treasurer (2000-2007) and Vice President and Treasurer (1995-2000) of The Home Depot, Inc. and Chair of the Board (2010-2012), Vice Chair of the Board (2009 and 2013), and a Director (2008-2013) of the Federal Reserve Bank of Atlanta. Ms. Tomé is also a director or trustee of many community and professional organizations.
Michael E. Wiley (1950)
Year of Election or Appointment: 2018
Member of the Advisory Board
Mr. Wiley also serves as Trustee or Member of the Advisory Board of other Fidelity® funds. Mr. Wiley serves as a Director of High Point Resources (exploration and production, 2005-present). Previously, Mr. Wiley served as a Director of Andeavor Corporation (independent oil refiner and marketer, 2005-2018), a Director of Andeavor Logistics LP (natural resources logistics, 2015-2018), a Director of Post Oak Bank (privately-held bank, 2004-2018), a Director of Asia Pacific Exploration Consolidated (international oil and gas exploration and production, 2008-2013), a member of the Board of Trustees of the University of Tulsa (2000-2006; 2007-2010), a Senior Energy Advisor of Katzenbach Partners, LLC (consulting, 2006-2007), an Advisory Director of Riverstone Holdings (private investment), a Director of Spinnaker Exploration Company (exploration and production, 2001-2005) and Chairman, President, and CEO of Baker Hughes, Inc. (oilfield services, 2000-2004).
Elizabeth Paige Baumann (1968)
Year of Election or Appointment: 2017
Anti-Money Laundering (AML) Officer
Ms. Baumann also serves as AML Officer of other funds. She is Chief AML Officer (2012-present) and Senior Vice President (2014-present) of FMR LLC (diversified financial services company) and is an employee of Fidelity Investments. Previously, Ms. Baumann served as AML Officer of the funds (2012-2016), and Vice President (2007-2014) and Deputy Anti-Money Laundering Officer (2007-2012) of FMR LLC.
John J. Burke III (1964)
Year of Election or Appointment: 2018
Chief Financial Officer
Mr. Burke also serves as Chief Financial Officer of other funds. Mr. Burke serves as Head of Investment Operations for Fidelity Fund and Investment Operations (2018-present) and is an employee of Fidelity Investments (1998-present). Previously Mr. Burke served as head of Asset Management Investment Operations (2012-2018).
William C. Coffey (1969)
Year of Election or Appointment: 2018
Secretary and Chief Legal Officer (CLO)
Mr. Coffey also serves as Secretary and CLO of other funds. Mr. Coffey serves as CLO, Secretary, and Senior Vice President of Fidelity Management & Research Company and FMR Co., Inc. (investment adviser firms, 2018-present); Secretary of Fidelity SelectCo, LLC and Fidelity Investments Money Management, Inc. (investment adviser firms, 2018-present); and CLO of Fidelity Management & Research (Hong Kong) Limited, FMR Investment Management (UK) Limited, and Fidelity Management & Research (Japan) Limited (investment adviser firms, 2018-present). He is Senior Vice President and Deputy General Counsel of FMR LLC (diversified financial services company, 2010-present), and is an employee of Fidelity Investments. Previously, Mr. Coffey served as Assistant Secretary of certain funds (2009-2018) and as Vice President and Associate General Counsel of FMR LLC (2005-2009).
Timothy M. Cohen (1969)
Year of Election or Appointment: 2018
Vice President
Mr. Cohen also serves as Vice President of other funds. Mr. Cohen serves as Co-Head of Global Equity Research (2016-present), a Director of Fidelity Management & Research (Japan) Limited (investment adviser firm, 2016-present), and is an employee of Fidelity Investments. Previously, Mr. Cohen served as Chief Investment Officer - Equity and a Director of Fidelity Management & Research (U.K.) Inc. (investment adviser firm, 2013-2015) and as a Director of Fidelity Management & Research (Hong Kong) Limited (investment adviser firm, 2017).
Jonathan Davis (1968)
Year of Election or Appointment: 2010
Assistant Treasurer
Mr. Davis also serves as Assistant Treasurer of other funds. Mr. Davis serves as Assistant Treasurer of FMR Capital, Inc. (2017-present) and is an employee of Fidelity Investments. Previously, Mr. Davis served as Vice President and Associate General Counsel of FMR LLC (diversified financial services company, 2003-2010).
Adrien E. Deberghes (1967)
Year of Election or Appointment: 2016
Assistant Treasurer
Mr. Deberghes also serves as an officer of other funds. He serves as Assistant Treasurer of FMR Capital, Inc. (2017-present), Executive Vice President of Fidelity Investments Money Management, Inc. (FIMM) (investment adviser firm, 2016-present), and is an employee of Fidelity Investments (2008-present). Previously, Mr. Deberghes served as President and Treasurer of certain Fidelity® funds (2013-2018). Prior to joining Fidelity Investments, Mr. Deberghes was Senior Vice President of Mutual Fund Administration at State Street Corporation (2007-2008), Senior Director of Mutual Fund Administration at Investors Bank & Trust (2005-2007), and Director of Finance for Dunkin' Brands (2000-2005). Previously, Mr. Deberghes served in other fund officer roles.
Laura M. Del Prato (1964)
Year of Election or Appointment: 2018
Assistant Treasurer
Ms. Del Prato also serves as an officer of other funds. Ms. Del Prato is an employee of Fidelity Investments (2017-present). Prior to joining Fidelity Investments, Ms. Del Prato served as a Managing Director and Treasurer of the JPMorgan Mutual Funds (2014-2017). Prior to JPMorgan, Ms. Del Prato served as a partner at Cohen Fund Audit Services (accounting firm, 2012-2013) and KPMG LLP (accounting firm, 2004-2012).
Colm A. Hogan (1973)
Year of Election or Appointment: 2016
Deputy Treasurer
Mr. Hogan also serves as an officer of other funds. Mr. Hogan serves as Assistant Treasurer of FMR Capital, Inc. (2017-present) and is an employee of Fidelity Investments (2005-present). Previously, Mr. Hogan served as Assistant Treasurer of certain Fidelity® funds (2016-2018).
Pamela R. Holding (1964)
Year of Election or Appointment: 2018
Vice President
Ms. Holding also serves as Vice President of other funds. Ms. Holding serves as Co-Head of Global Equity Research (2018-present) and is an employee of Fidelity Investments (2013-present).
Chris Maher (1972)
Year of Election or Appointment: 2013
Assistant Treasurer
Mr. Maher serves as Assistant Treasurer of other funds. Mr. Maher is Vice President of Valuation Oversight, serves as Assistant Treasurer of FMR Capital, Inc. (2017-present), and is an employee of Fidelity Investments. Previously, Mr. Maher served as Vice President of Asset Management Compliance (2013), Vice President of the Program Management Group of FMR (investment adviser firm, 2010-2013), and Vice President of Valuation Oversight (2008-2010).
Rieco E. Mello (1969)
Year of Election or Appointment: 2017
Assistant Treasurer
Mr. Mello also serves as Assistant Treasurer of other funds. Mr. Mello serves as Assistant Treasurer of FMR Capital, Inc. (2017-present) and is an employee of Fidelity Investments (1995-present).
Kenneth B. Robins (1969)
Year of Election or Appointment: 2016
Chief Compliance Officer
Mr. Robins also serves as an officer of other funds. Mr. Robins serves as Compliance Officer of Fidelity Management & Research Company and FMR Co., Inc. (investment adviser firms, 2016-present) and is an employee of Fidelity Investments (2004-present). Previously, Mr. Robins served as Executive Vice President of Fidelity Investments Money Management, Inc. (investment adviser firm, 2013-2016) and served in other fund officer roles.
Stacie M. Smith (1974)
Year of Election or Appointment: 2016
President and Treasurer
Ms. Smith also serves as an officer of other funds. Ms. Smith serves as Assistant Treasurer of FMR Capital, Inc. (2017-present), is an employee of Fidelity Investments (2009-present), and has served in other fund officer roles. Prior to joining Fidelity Investments, Ms. Smith served as Senior Audit Manager of Ernst & Young LLP (accounting firm, 1996-2009). Previously, Ms. Smith served as Assistant Treasurer (2013-2018) and Deputy Treasurer (2013-2016) of certain Fidelity® funds.
Marc L. Spector (1972)
Year of Election or Appointment: 2016
Assistant Treasurer
Mr. Spector also serves as an officer of other funds. Mr. Spector serves as Assistant Treasurer of FMR Capital, Inc. (2017-present) and is an employee of Fidelity Investments (2016-present). Prior to joining Fidelity Investments, Mr. Spector served as Director at the Siegfried Group (accounting firm, 2013-2016), and prior to Siegfried Group as audit senior manager at Deloitte & Touche (accounting firm, 2005-2013).
Shareholder Expense Example
As a shareholder of the Fund, you incur two types of costs: (1) transaction costs, including sales charges (loads) on purchase payments or redemption proceeds, redemption fees and (2) ongoing costs, including management fees, distribution and/or service (12b-1) fees and other Fund expenses. This Example is intended to help you understand your ongoing costs (in dollars) of investing in the Fund and to compare these costs with the ongoing costs of investing in other mutual funds.
The actual expense Example is based on an investment of $1,000 invested at the beginning of the period and held for the entire period (May 1, 2018 to October 31, 2018) for Class A, Class M, Class C, Emerging Markets Discovery and Class I, and for the period (October 2, 2018 to October 31, 2018) for Class Z. The hypothetical expense Example is based on an investment of $1,000 invested for one-half year period (May 1, 2018 to October 31, 2018).
Actual Expenses
The first line of the accompanying table for each class of the Fund provides information about actual account values and actual expenses. You may use the information in this line, together with the amount you invested, to estimate the expenses that you paid over the period. Simply divide your account value by $1,000.00 (for example, an $8,600 account value divided by $1,000.00 = 8.6), then multiply the result by the number in the first line for a class of the Fund under the heading entitled "Expenses Paid During Period" to estimate the expenses you paid on your account during this period. A small balance maintenance fee of $12.00 that is charged once a year may apply for certain accounts with a value of less than $2,000. This fee, which was eliminated effective August 1, 2018, is not included in the table below. If it was, the estimate of expenses you paid during the period would be higher, and your ending account value lower, by this amount. In addition, the Fund, as a shareholder in the underlying Fidelity Central Funds, will indirectly bear its pro-rata share of the fees and expenses incurred by the underlying Fidelity Central Funds. These fees and expenses are not included in the Fund's annualized expense ratio used to calculate the expense estimate in the table below.
Hypothetical Example for Comparison Purposes
The second line of the accompanying table for each class of the Fund provides information about hypothetical account values and hypothetical expenses based on a Class' actual expense ratio and an assumed rate of return of 5% per year before expenses, which is not the Class' actual return. The hypothetical account values and expenses may not be used to estimate the actual ending account balance or expenses you paid for the period. You may use this information to compare the ongoing costs of investing in the Fund and other funds. To do so, compare this 5% hypothetical example with the 5% hypothetical examples that appear in the shareholder reports of the other funds. A small balance maintenance fee of $12.00 that is charged once a year may apply for certain accounts with a value of less than $2,000. This fee, which was eliminated effective August 1, 2018, is not included in the table below. If it was, the estimate of expenses you paid during the period would be higher, and your ending account value lower, by this amount. In addition, the Fund, as a shareholder in the underlying Fidelity Central Funds, will indirectly bear its pro-rata share of the fees and expenses incurred by the underlying Fidelity Central Funds. These fees and expenses are not included in the Fund's annualized expense ratio used to calculate the expense estimate in the table below.
Please note that the expenses shown in the table are meant to highlight your ongoing costs only and do not reflect any transaction costs. Therefore, the second line of the table is useful in comparing ongoing costs only, and will not help you determine the relative total costs of owning different funds. In addition, if these transactional costs were included, your costs would have been higher.
| | Annualized Expense Ratio-A | Beginning
Account Value | Ending
Account Value
October 31, 2018 | Expenses Paid
During Period |
| Class A | 1.54% | | | |
| Actual | | $1,000.00 | $773.30 | $6.88-B |
| Hypothetical-C | | $1,000.00 | $1,017.44 | $7.83-D |
| Class M | 1.82% | | | |
| Actual | | $1,000.00 | $772.80 | $8.13-B |
| Hypothetical-C | | $1,000.00 | $1,016.03 | $9.25-D |
| Class C | 2.32% | | | |
| Actual | | $1,000.00 | $770.70 | $10.35-B |
| Hypothetical-C | | $1,000.00 | $1,013.51 | $11.77-D |
| Emerging Markets Discovery | 1.25% | | | |
| Actual | | $1,000.00 | $774.60 | $5.59-B |
| Hypothetical-C | | $1,000.00 | $1,018.90 | $6.36-D |
| Class I | 1.24% | | | |
| Actual | | $1,000.00 | $775.10 | $5.55-B |
| Hypothetical-C | | $1,000.00 | $1,018.95 | $6.31-D |
| Class Z | 1.02% | | | |
| Actual | | $1,000.00 | $919.60 | $.80-B |
| Hypothetical-C | | $1,000.00 | $1,020.06 | $5.19-D |
A Annualized expense ratio reflects expenses net of applicable fee waivers.
B Actual expenses are equal to each Class' annualized expense ratio, multiplied by the average account value over the period, multiplied by 184/365 (to reflect the one-half year period) for Class A, Class M, Class C, Emerging Markets Discovery and Class I, and multiplied by 30/365 (to reflect the period October 2, 2018 to October 31, 2018) for Class Z.
C 5% return per year before expenses
D Hypothetical expenses are equal to each Class' annualized expense ratio, multiplied by the average account value over the period, multiplied by 184/ 365 (to reflect the one-half year period).
Distributions (Unaudited)
The Board of Trustees of Fidelity Emerging Markets Discovery Fund voted to pay to shareholders of record at the opening of business on record date, the following distributions per share derived from capital gains realized from sales of portfolio securities and dividends derived from net investment income:
| | Pay Date | Record Date | Dividends | Capital Gains |
| Fidelity Emerging Markets Discovery Fund | | | | |
| Class A | 12/17/18 | 12/14/18 | $0.180 | $0.008 |
| Class M | 12/17/18 | 12/14/18 | $0.098 | $0.008 |
| Class C | 12/17/18 | 12/14/18 | $0.051 | $0.008 |
| Emerging Markets Discovery | 12/17/18 | 12/14/18 | $0.222 | $0.008 |
| Class I | 12/17/18 | 12/14/18 | $0.218 | $0.008 |
| Class Z | 12/17/18 | 12/14/18 | $0.256 | $0.008 |
|
Class A designates 51%; Class M designates 60%; Class C designates 68%; Emerging Markets Discovery designates 45%; and Class I designates 45%; of dividends distributed during the fiscal year as amounts which may be taken into account as a dividend for purposes of the maximum rate under section 1(h)(11) of the Internal Revenue Code.
The amounts per share which represent income derived from sources within, and taxes paid to, foreign countries or possessions of the United States are as follows:
| | Pay Date | Income | Taxes |
| Fidelity Emerging Markets Discovery Fund | | | |
| Class A | 12/18/17 | $0.1720 | $0.0180 |
| Class M | 12/18/17 | $0.1447 | $0.0180 |
| Class C | 12/18/17 | $0.1274 | $0.0180 |
| Emerging Markets Discovery | 12/18/17 | $0.1950 | $0.0180 |
| Class I | 12/18/17 | $0.1965 | $0.0180 |
|
The fund will notify shareholders in January 2019 of amounts for use in preparing 2018 income tax returns.
Board Approval of Investment Advisory Contracts
Fidelity Emerging Markets Discovery Fund
At its July 2018 meeting, the Board of Trustees, including the Independent Trustees (together, the Board), voted to continue the management contract with Fidelity Management & Research Company (FMR) and the sub-advisory agreements (together, the Advisory Contracts) for the fund for six months through January 31, 2019, in connection with the reunification of the Fidelity Equity High Income Funds Board, which oversees the fund, and the Sector Portfolios Board.
The Board considered that the approval of the fund's Advisory Contracts will not result in any changes in (i) the investment process or strategies employed in the management of the fund's assets; (ii) the fees and expenses paid by shareholders, including the expense cap arrangement currently in place for the fund; (iii) the nature, extent or quality of services provided under the fund's Advisory Contracts; or (iv) the day-to-day management of the fund or the persons primarily responsible for such management. The Board concluded that the fund's Advisory Contracts are fair and reasonable, and that the fund's Advisory Contracts should be renewed, without modification, through January 31, 2019, with the understanding that the Board will consider the annual renewal for a full one year period in January 2019.
In connection with its consideration of future renewals of the fund's Advisory Contracts, the Board will consider: (i) the nature, extent and quality of services provided to the fund, including shareholder and administrative services and investment performance; (ii) the competitiveness of the management fee and total expenses for the fund; (iii) the costs of the services and profitability, including the revenues earned and the expenses incurred in conducting the business of developing, marketing, distributing, managing, administering, and servicing the fund and its shareholders, to the extent applicable, as well as potential fall-out benefits from Fidelity's non-fund businesses; and (iv) whether there have been economies of scale in respect of the Fidelity funds, whether the Fidelity funds (including the fund) have appropriately benefited from any such economies of scale, and whether there is the potential for realization of any further economies.
Based on its evaluation of all of the conclusions noted above, and after considering all factors it believed relevant, the Board ultimately concluded that the fund's management fee structure is fair and reasonable, and that the continuation of the fund's Advisory Contracts should be approved.
AEMD-ANN-1218
1.931250.106
Fidelity® Emerging Markets Discovery Fund
Fidelity® Total Emerging Markets Fund
Annual Report October 31, 2018 |
|
Contents
To view a fund's proxy voting guidelines and proxy voting record for the 12-month period ended June 30, visit http://www.fidelity.com/proxyvotingresults or visit the Securities and Exchange Commission's (SEC) web site at http://www.sec.gov.
You may also call 1-800-544-8544 to request a free copy of the proxy voting guidelines.
Standard & Poor's, S&P and S&P 500 are registered service marks of The McGraw-Hill Companies, Inc. and have been licensed for use by Fidelity Distributors Corporation.
Other third-party marks appearing herein are the property of their respective owners.
All other marks appearing herein are registered or unregistered trademarks or service marks of FMR LLC or an affiliated company. © 2018 FMR LLC. All rights reserved.
This report and the financial statements contained herein are submitted for the general information of the shareholders of the Funds. This report is not authorized for distribution to prospective investors in the Funds unless preceded or accompanied by an effective prospectus.
A fund files its complete schedule of portfolio holdings with the SEC for the first and third quarters of each fiscal year on Form N-Q. Forms N-Q are available on the SEC’s web site at http://www.sec.gov. A fund's Forms N-Q may be reviewed and copied at the SEC’s Public Reference Room in Washington, DC. Information regarding the operation of the SEC's Public Reference Room may be obtained by calling 1-800-SEC-0330.
For a complete list of a fund's portfolio holdings, view the most recent holdings listing, semiannual report, or annual report on Fidelity's web site at http://www.fidelity.com, http://www.institutional.fidelity.com, or http://www.401k.com, as applicable.
NOT FDIC INSURED •MAY LOSE VALUE •NO BANK GUARANTEE
Neither the Funds nor Fidelity Distributors Corporation is a bank.
Fidelity® Emerging Markets Discovery Fund
Performance: The Bottom Line
Average annual total return reflects the change in the value of an investment, assuming reinvestment of distributions from dividend income and capital gains (the profits earned upon the sale of securities that have grown in value, if any) and assuming a constant rate of performance each year. The hypothetical investment and the average annual total returns do not reflect the deduction of taxes that a shareholder would pay on fund distributions or the redemption of fund shares. During periods of reimbursement by Fidelity, a fund’s total return will be greater than it would be had the reimbursement not occurred. How a fund did yesterday is no guarantee of how it will do tomorrow.
Average Annual Total Returns
| For the periods ended October 31, 2018 | Past 1 year | Past 5 years | Life of fundA |
| Fidelity® Emerging Markets Discovery Fund | (18.11)% | 0.83% | 4.22% |
A From November 1, 2011
$10,000 Over Life of Fund
Let's say hypothetically that $10,000 was invested in Fidelity® Emerging Markets Discovery Fund, a class of the fund, on November 1, 2011, when the fund started.
The chart shows how the value of your investment would have changed, and also shows how the MSCI Emerging Markets SMID Cap Index performed over the same period.

| Period Ending Values |
| $13,358 | Fidelity® Emerging Markets Discovery Fund |
| $11,209 | MSCI Emerging Markets SMID Cap Index |
Fidelity® Emerging Markets Discovery Fund
Management's Discussion of Fund Performance
Market Recap: International equities returned -8.08% for the 12 months ending October 31, 2018, according to the MSCI ACWI (All Country World Index) ex USA Index. A modestly positive first half of the period gave way to a confluence of overwhelmingly negative factors – including escalating trade tension, a surging U.S. dollar, tepid economic growth in Europe, global central bank tightening, concerns about Italy’s budget stalemate with the EU, and weakness in China’s stock market – that yielded a -11% second-half return. The index lost 8% in October alone, its largest monthly drop in more than six years. Among sectors, new-media-infused communications services (-15%) was hit the hardest, while economically sensitive consumer discretionary (-13%), information technology (-12%), financials (-10%), industrials (-9%) and materials (-7%) stocks also fared poorly. Even the more defensive real estate (-9%), utilities (-6%) and consumer staples (-5%) sectors weren’t spared this period. Conversely, elevated crude-oil prices fueled a positive return for energy (+7%), the top-performing sector, followed by the relatively stable-growing health care segment (+2%). Regionally, emerging markets (-12%) fared the worst, hampered by the impact of foreign exchange and concerns about economic weakness in China, India and South Korea. Sluggish growth also pressured shares in continental Europe (-9%). Stocks in Japan (-3%) and the U.K. (-4%) held up better, followed by Canada (-5%) and Asia-Pacific ex Japan (-6%).
Comments from Co-Portfolio Manager James Hayes: For the fiscal year, the fund’s share classes (excluding sales charges, if applicable) returned about -18% to -19%, lagging the -14.51% result of the benchmark MSCI Emerging Markets SMID Cap Index. Heightened concerns related to a number of geopolitical and macro factors weighed heavily on emerging-markets equities the past 12 months. This made for a challenging environment for security selection, which was the primary detractor from the fund’s performance versus the benchmark. Our choices in South Korea, China and Taiwan hurt our relative result most. By sector, picks among consumer discretionary, information technology and materials notably hurt relative performance. Conversely, stock selection in industrials was a plus versus the benchmark. Our cash position of roughly 3%, on average, was another positive against the market’s steep decline. A position in Chinese software firm Kingsoft, which we established the past 12 months, was the largest detractor. Shares of Kingsoft plunged in July, along with other Chinese game developers, after the government called for tighter industry-wide regulations. Conversely, it helped most to own TCI, a Taiwan-based manufacturer and distributor of health foods and beauty care. The firm reported solid year-over-year sales, and also raised its revenue outlook for 2018.
The views expressed above reflect those of the portfolio manager(s) only through the end of the period as stated on the cover of this report and do not necessarily represent the views of Fidelity or any other person in the Fidelity organization. Any such views are subject to change at any time based upon market or other conditions and Fidelity disclaims any responsibility to update such views. These views may not be relied on as investment advice and, because investment decisions for a Fidelity fund are based on numerous factors, may not be relied on as an indication of trading intent on behalf of any Fidelity fund.
Notes to shareholders: On May 31, 2018, Xiaoting Zhao assumed co-management responsibilities for the fund. On June 30, 2018, Jane Wu assumed portfolio management responsibilities for the fund's health care sleeve, replacing Tim Gannon. On December 1, 2018, Xiaoting Zhao assumed portfolio management responsibilities for the fund's telecommunications services subportfolio, succeeding James Hayes.
Fidelity® Emerging Markets Discovery Fund
Investment Summary (Unaudited)
Top Five Stocks as of October 31, 2018
| | % of fund's net assets |
| Fu Shou Yuan International Group Ltd. (Cayman Islands, Diversified Consumer Services) | 2.0 |
| Samsonite International SA (Luxembourg, Textiles, Apparel & Luxury Goods) | 1.7 |
| Fourlis Holdings SA (Greece, Specialty Retail) | 1.4 |
| B2W Companhia Global do Varejo (Brazil, Internet & Direct Marketing Retail) | 1.3 |
| Titan Cement Co. SA (Reg.) (Greece, Construction Materials) | 1.3 |
| | 7.7 |
Top Five Market Sectors as of October 31, 2018
| | % of fund's net assets |
| Consumer Discretionary | 16.4 |
| Industrials | 14.5 |
| Financials | 13.3 |
| Materials | 11.3 |
| Health Care | 7.9 |
Top Five Countries as of October 31, 2018
| (excluding cash equivalents) | % of fund's net assets |
| Cayman Islands | 10.6 |
| Brazil | 10.6 |
| India | 9.9 |
| Korea (South) | 7.8 |
| China | 6.7 |
Percentages are adjusted for the effect of futures contracts, if applicable.
Asset Allocation (% of fund's net assets)
| As of October 31, 2018 |
| | Stocks and Equity Futures | 95.3% |
| | Short-Term Investments and Net Other Assets (Liabilities) | 4.7% |

Fidelity® Emerging Markets Discovery Fund
Schedule of Investments October 31, 2018
Showing Percentage of Net Assets
| Common Stocks - 90.0% | | | |
| | | Shares | Value |
| Argentina - 0.5% | | | |
| BBVA Banco Frances SA sponsored ADR | | 46,000 | $504,620 |
| Central Puerto SA sponsored ADR | | 43,500 | 416,730 |
| Inversiones y Representaciones SA ADR | | 24,727 | 330,600 |
|
| TOTAL ARGENTINA | | | 1,251,950 |
|
| Bangladesh - 0.3% | | | |
| BRAC Bank Ltd. | | 978,600 | 821,382 |
| Bermuda - 2.6% | | | |
| AGTech Holdings Ltd. (a) | | 13,120,000 | 677,587 |
| Cosan Ltd. Class A | | 62,500 | 521,875 |
| Joy City Property Ltd. | | 4,825,000 | 510,683 |
| Kunlun Energy Co. Ltd. | | 408,400 | 463,502 |
| Pacific Basin Shipping Ltd. | | 9,504,000 | 2,072,423 |
| Shangri-La Asia Ltd. | | 2,212,000 | 3,018,178 |
|
| TOTAL BERMUDA | | | 7,264,248 |
|
| Brazil - 8.8% | | | |
| Azul SA sponsored ADR (a) | | 95,400 | 2,325,852 |
| B2W Companhia Global do Varejo (a) | | 399,520 | 3,703,732 |
| BR Malls Participacoes SA | | 407,100 | 1,389,270 |
| BTG Pactual Participations Ltd. unit | | 145,800 | 774,544 |
| Companhia de Saneamento de Minas Gerais | | 84,620 | 1,166,467 |
| Construtora Tenda SA (a) | | 86,300 | 661,599 |
| Direcional Engenharia SA | | 527,900 | 1,012,819 |
| Equatorial Energia SA | | 67,600 | 1,235,019 |
| Fibria Celulose SA | | 107,700 | 2,079,335 |
| Localiza Rent A Car SA | | 353,385 | 2,730,033 |
| Natura Cosmeticos SA | | 143,500 | 1,256,661 |
| Notre Dame Intermedica Participacoes SA | | 302,517 | 1,961,503 |
| QGEP Participacoes SA | | 592,500 | 1,910,520 |
| Tegma Gestao Logistica SA | | 371,100 | 2,291,516 |
|
| TOTAL BRAZIL | | | 24,498,870 |
|
| British Virgin Islands - 0.4% | | | |
| Dolphin Capital Investors Ltd. (a) | | 8,361,857 | 649,304 |
| Mail.Ru Group Ltd. GDR (Reg. S) (a) | | 19,000 | 506,160 |
|
| TOTAL BRITISH VIRGIN ISLANDS | | | 1,155,464 |
|
| Canada - 0.6% | | | |
| Pan American Silver Corp. | | 121,600 | 1,785,088 |
| Cayman Islands - 10.6% | | | |
| Airtac International Group | | 171,000 | 1,471,924 |
| ASM Pacific Technology Ltd. | | 61,600 | 531,796 |
| Chailease Holding Co. Ltd. | | 426,540 | 1,215,123 |
| China Biologic Products Holdings, Inc. (a) | | 27,056 | 1,797,601 |
| China Literature Ltd. (a)(b) | | 173,200 | 935,357 |
| E-House China Enterprise Holdings Ltd. (a) | | 18,000 | 31,584 |
| ENN Energy Holdings Ltd. | | 61,800 | 525,248 |
| Fu Shou Yuan International Group Ltd. (b) | | 7,173,000 | 5,497,326 |
| GDS Holdings Ltd. ADR (a)(c) | | 14,400 | 337,968 |
| General Interface Solution Holding Ltd. | | 126,000 | 417,144 |
| Haitian International Holdings Ltd. | | 1,328,000 | 2,590,988 |
| Kingdee International Software Group Co. Ltd. | | 493,000 | 402,349 |
| Kingsoft Corp. Ltd. | | 1,720,760 | 2,435,674 |
| LexinFintech Holdings Ltd. ADR | | 11,800 | 115,404 |
| Longfor Properties Co. Ltd. | | 214,500 | 520,799 |
| Momo, Inc. ADR (a) | | 24,490 | 822,129 |
| NetEase, Inc. ADR | | 3,400 | 706,690 |
| Parade Technologies Ltd. | | 45,000 | 595,921 |
| PPDAI Group, Inc. ADR (a) | | 23,680 | 135,213 |
| Shimao Property Holdings Ltd. | | 200,000 | 391,229 |
| Silergy Corp. | | 34,000 | 432,680 |
| SITC International Holdings Co. Ltd. | | 3,609,500 | 2,651,218 |
| Sohu.Com Ltd. ADR (a)(c) | | 22,600 | 408,382 |
| TAL Education Group ADR (a) | | 14,270 | 413,545 |
| Uni-President China Holdings Ltd. | | 2,183,000 | 2,118,431 |
| Wise Talent Information Technology Co. Ltd. (a) | | 81,705 | 267,246 |
| Yuzhou Properties Co. | | 1,409,000 | 503,089 |
| YY, Inc. ADR (a) | | 9,400 | 600,660 |
| Zai Lab Ltd. ADR (a) | | 45,700 | 747,652 |
|
| TOTAL CAYMAN ISLANDS | | | 29,620,370 |
|
| Chile - 1.0% | | | |
| Compania Cervecerias Unidas SA sponsored ADR | | 21,400 | 536,498 |
| Empresas CMPC SA | | 657,727 | 2,264,228 |
|
| TOTAL CHILE | | | 2,800,726 |
|
| China - 6.7% | | | |
| BBMG Corp. (H Shares) | | 1,928,000 | 531,052 |
| China Longyuan Power Grid Corp. Ltd. (H Shares) | | 2,658,200 | 2,020,272 |
| China Oilfield Services Ltd. (H Shares) | | 2,166,000 | 2,030,120 |
| China Suntien Green Energy Corp. Ltd. (H Shares) | | 996,000 | 254,018 |
| Hangzhou Hikvision Digital Technology Co. Ltd. Class A | | 176,800 | 613,356 |
| Hangzhou Tigermed Consulting Co. Ltd. Class A | | 349,227 | 2,133,215 |
| Lens Technology Co. Ltd. Class A | | 443,629 | 492,239 |
| Luxshare Precision Industry Co. Ltd. Class A | | 387,276 | 921,603 |
| Qingdao Haier Co. Ltd. | | 1,024,896 | 1,860,068 |
| Shanghai International Airport Co. Ltd. (A Shares) | | 268,641 | 1,908,232 |
| Shenzhen Inovance Technology Co. Ltd. Class A | | 78,950 | 252,164 |
| Sinopec Engineering Group Co. Ltd. (H Shares) | | 2,603,000 | 2,419,790 |
| Tonghua Dongbao Pharmaceutical Co. Ltd. Class A | | 583,708 | 1,119,611 |
| Tsingtao Brewery Co. Ltd. (H Shares) | | 252,000 | 994,574 |
| Zhengzhou Yutong Bus Co. Ltd. | | 805,862 | 1,231,497 |
|
| TOTAL CHINA | | | 18,781,811 |
|
| Colombia - 0.2% | | | |
| Bancolombia SA sponsored ADR | | 14,600 | 539,324 |
| Cyprus - 0.9% | | | |
| Globaltrans Investment PLC GDR (Reg. S) | | 241,500 | 2,366,700 |
| Egypt - 0.8% | | | |
| Credit Agricole Egypt | | 295,880 | 662,098 |
| Egyptian Kuwaiti Holding | | 944,400 | 1,056,784 |
| Six of October Development & Investment Co. (a) | | 660,300 | 549,022 |
|
| TOTAL EGYPT | | | 2,267,904 |
|
| Greece - 3.1% | | | |
| Alpha Bank AE (a) | | 777,600 | 1,175,799 |
| Fourlis Holdings SA | | 790,000 | 3,874,456 |
| Titan Cement Co. SA (Reg.) | | 163,500 | 3,600,060 |
|
| TOTAL GREECE | | | 8,650,315 |
|
| Hong Kong - 1.4% | | | |
| China Everbright International Ltd. | | 484,000 | 385,746 |
| China Resources Beer Holdings Co. Ltd. | | 508,000 | 1,765,250 |
| Far East Horizon Ltd. | | 1,013,584 | 982,312 |
| Sun Art Retail Group Ltd. | | 758,000 | 828,373 |
|
| TOTAL HONG KONG | | | 3,961,681 |
|
| India - 9.9% | | | |
| Adani Ports & Special Economic Zone Ltd. | | 543,992 | 2,345,212 |
| CESC Ltd. GDR | | 57,246 | 537,900 |
| Deccan Cements Ltd. (a) | | 192,054 | 966,242 |
| Dr Lal Pathlabs Ltd. | | 145,424 | 1,729,417 |
| EIH Ltd. (a) | | 366,260 | 801,751 |
| Federal Bank Ltd. | | 1,142,081 | 1,277,815 |
| Future Retail Ltd. | | 92,503 | 611,788 |
| IndusInd Bank Ltd. | | 26,000 | 500,982 |
| JK Cement Ltd. (a) | | 119,271 | 1,084,744 |
| LIC Housing Finance Ltd. | | 376,564 | 2,093,097 |
| Lupin Ltd. (a) | | 200,360 | 2,398,712 |
| Manappuram General Finance & Leasing Ltd. | | 1,230,188 | 1,328,989 |
| Natco Pharma Ltd. | | 209,921 | 2,140,507 |
| Oberoi Realty Ltd. | | 299,038 | 1,711,705 |
| Phoenix Mills Ltd. | | 85,006 | 636,051 |
| Piramal Enterprises Ltd. | | 92,839 | 2,727,428 |
| Power Grid Corp. of India Ltd. | | 412,968 | 1,038,283 |
| RP-SG Business Process Services Ltd. (a)(d) | | 11,449 | 36,958 |
| RP-SG Retail Ltd. (a)(d) | | 34,347 | 110,875 |
| Solar Industries India Ltd. | | 45,145 | 612,015 |
| The Ramco Cements Ltd. (a) | | 160,611 | 1,302,196 |
| Torrent Pharmaceuticals Ltd. | | 73,711 | 1,661,986 |
|
| TOTAL INDIA | | | 27,654,653 |
|
| Indonesia - 1.0% | | | |
| PT Bank Negara Indonesia (Persero) Tbk | | 1,264,200 | 609,128 |
| PT Media Nusantara Citra Tbk | | 6,539,200 | 335,509 |
| PT Pakuwon Jati Tbk | | 33,174,700 | 1,043,085 |
| PT Semen Gresik (Persero) Tbk | | 784,800 | 464,608 |
| PT XL Axiata Tbk (a) | | 2,046,400 | 352,677 |
|
| TOTAL INDONESIA | | | 2,805,007 |
|
| Italy - 0.6% | | | |
| Prada SpA | | 474,600 | 1,676,422 |
| Korea (South) - 7.0% | | | |
| AMOREPACIFIC Group, Inc. | | 27,324 | 1,487,134 |
| BS Financial Group, Inc. | | 247,083 | 1,643,611 |
| Cafe24 Corp. (a) | | 4,890 | 473,571 |
| Daou Technology, Inc. | | 35,439 | 621,192 |
| F&F Co. Ltd. | | 21,020 | 961,651 |
| HDC Hyundai Development Co. (a) | | 19,446 | 749,890 |
| Hyundai Fire & Marine Insurance Co. Ltd. | | 26,242 | 961,363 |
| Hyundai Wia Corp. | | 36,018 | 934,385 |
| Iljin Materials Co. Ltd. | | 31,115 | 1,239,419 |
| Kakao Corp. | | 8,490 | 681,581 |
| KEPCO Plant Service & Engineering Co. Ltd. | | 17,372 | 418,694 |
| Kolon Industries, Inc. | | 6,480 | 285,097 |
| Korean Reinsurance Co. | | 84,046 | 713,765 |
| LG Chemical Ltd. | | 4,084 | 1,242,023 |
| LG Innotek Co. Ltd. | | 11,251 | 1,222,720 |
| Meerecompany, Inc. | | 2,340 | 127,152 |
| NCSOFT Corp. | | 7,457 | 2,806,995 |
| Samsung Electro-Mechanics Co. Ltd. | | 7,195 | 744,093 |
| Samsung SDI Co. Ltd. | | 5,765 | 1,189,884 |
| ViroMed Co. Ltd. (a) | | 6,761 | 1,103,921 |
|
| TOTAL KOREA (SOUTH) | | | 19,608,141 |
|
| Luxembourg - 1.7% | | | |
| Samsonite International SA | | 1,657,200 | 4,754,812 |
| Malaysia - 0.8% | | | |
| British American Tobacco (Malaysia) Bhd | | 212,500 | 1,579,340 |
| Matrix Concepts Holdings Bhd | | 1,635,700 | 723,156 |
|
| TOTAL MALAYSIA | | | 2,302,496 |
|
| Mauritius - 0.3% | | | |
| MakeMyTrip Ltd. (a)(c) | | 30,900 | 766,011 |
| Mexico - 3.3% | | | |
| Credito Real S.A.B. de CV | | 667,000 | 763,102 |
| Fibra Uno Administracion SA de CV | | 1,791,460 | 1,925,225 |
| Gruma S.A.B. de CV Series B | | 170,400 | 1,778,386 |
| Grupo Comercial Chedraui S.A.B. de CV | | 619,100 | 1,094,452 |
| Grupo GICSA SA de CV (a) | | 696,970 | 271,401 |
| Industrias Penoles SA de CV | | 137,650 | 1,940,073 |
| Macquarie Mexican (REIT) (b) | | 672,100 | 654,456 |
| Megacable Holdings S.A.B. de CV unit | | 39,900 | 176,919 |
| Qualitas Controladora S.A.B. de CV | | 339,600 | 684,274 |
|
| TOTAL MEXICO | | | 9,288,288 |
|
| Netherlands - 0.3% | | | |
| VEON Ltd. sponsored ADR | | 70,000 | 196,700 |
| Yandex NV Series A (a) | | 24,806 | 747,405 |
|
| TOTAL NETHERLANDS | | | 944,105 |
|
| Panama - 0.7% | | | |
| Copa Holdings SA Class A | | 24,900 | 1,803,507 |
| Peru - 1.0% | | | |
| Compania de Minas Buenaventura SA sponsored ADR | | 192,200 | 2,660,048 |
| Philippines - 2.1% | | | |
| Metro Pacific Investments Corp. | | 33,861,300 | 3,041,605 |
| Metropolitan Bank & Trust Co. | | 547,928 | 672,131 |
| Philippine Seven Corp. | | 578,300 | 1,136,319 |
| Pilipinas Shell Petroleum Corp. | | 197,300 | 179,256 |
| Robinsons Land Corp. | | 2,189,208 | 858,280 |
|
| TOTAL PHILIPPINES | | | 5,887,591 |
|
| Russia - 0.9% | | | |
| Bank St. Petersburg PJSC (a) | | 1,478,500 | 1,113,245 |
| LSR Group OJSC | | 77,164 | 737,391 |
| RusHydro PJSC | | 68,809,000 | 574,298 |
|
| TOTAL RUSSIA | | | 2,424,934 |
|
| Saudi Arabia - 0.4% | | | |
| Samba Financial Group | | 140,000 | 1,158,845 |
| Singapore - 0.8% | | | |
| First Resources Ltd. | | 1,492,500 | 1,702,451 |
| Yoma Strategic Holdings Ltd. | | 2,457,700 | 452,452 |
|
| TOTAL SINGAPORE | | | 2,154,903 |
|
| South Africa - 6.2% | | | |
| Barclays Africa Group Ltd. | | 110,556 | 1,117,438 |
| Bidvest Group Ltd. | | 208,900 | 2,602,241 |
| Impala Platinum Holdings Ltd. (a) | | 778,100 | 1,434,626 |
| Imperial Holdings Ltd. | | 269,400 | 2,974,950 |
| Mr Price Group Ltd. | | 106,200 | 1,662,702 |
| MTN Group Ltd. | | 56,500 | 327,453 |
| Nampak Ltd. (a) | | 1,232,738 | 1,240,885 |
| Old Mutual Ltd. | | 434,000 | 667,511 |
| Pick 'n Pay Stores Ltd. | | 313,000 | 1,445,497 |
| Redefine Properties Ltd. | | 2,169,800 | 1,410,499 |
| Reunert Ltd. | | 323,600 | 1,749,337 |
| Sanlam Ltd. | | 105,000 | 528,541 |
|
| TOTAL SOUTH AFRICA | | | 17,161,680 |
|
| Sri Lanka - 0.4% | | | |
| Dialog Axiata PLC | | 6,034,611 | 398,642 |
| Hatton National Bank PLC | | 525,633 | 613,937 |
|
| TOTAL SRI LANKA | | | 1,012,579 |
|
| Taiwan - 6.2% | | | |
| Advantech Co. Ltd. | | 79,693 | 548,267 |
| Chipbond Technology Corp. | | 375,000 | 687,973 |
| Chroma ATE, Inc. | | 248,000 | 869,107 |
| Cleanaway Co. Ltd. | | 300,000 | 1,652,105 |
| CTCI Corp. | | 1,217,000 | 1,715,801 |
| Delta Electronics, Inc. | | 73,000 | 306,520 |
| E Ink Holdings, Inc. | | 472,000 | 371,984 |
| Global Unichip Corp. | | 50,000 | 339,142 |
| Inventec Corp. | | 1,202,000 | 968,650 |
| LandMark Optoelectronics Corp. | | 92,000 | 610,649 |
| Largan Precision Co. Ltd. | | 4,080 | 441,466 |
| Lien Hwa Industrial Corp. | | 321,200 | 315,904 |
| Nan Liu Enterprise Co. Ltd. | | 440,000 | 2,231,230 |
| PChome Online, Inc. (a) | | 90,000 | 409,877 |
| Sino-American Silicon Products, Inc. | | 117,000 | 217,671 |
| Sporton International, Inc. | | 108,290 | 402,233 |
| Taiwan Fertilizer Co. Ltd. | | 1,661,000 | 2,253,258 |
| TCI Co. Ltd. | | 39,581 | 552,923 |
| United Microelectronics Corp. | | 1,945,000 | 740,785 |
| Vanguard International Semiconductor Corp. | | 494,000 | 909,481 |
| Win Semiconductors Corp. | | 146,000 | 447,990 |
| Wiwynn Corp. | | 36,027 | 259,493 |
|
| TOTAL TAIWAN | | | 17,252,509 |
|
| Thailand - 3.6% | | | |
| Bangkok Bank PCL (For. Reg.) | | 165,100 | 1,055,525 |
| Com7 PCL | | 4,304,700 | 2,687,192 |
| PTT Global Chemical PCL (For. Reg.) | | 444,800 | 1,036,212 |
| Siam Cement PCL (For. Reg.) | | 233,400 | 2,942,135 |
| Siam Commercial Bank PCL (For. Reg.) | | 129,200 | 535,736 |
| Star Petroleum Refining PCL | | 4,396,700 | 1,869,526 |
|
| TOTAL THAILAND | | | 10,126,326 |
|
| Turkey - 1.7% | | | |
| Aksa Akrilik Kimya Sanayii | | 679,300 | 1,099,840 |
| Aselsan A/S | | 349,600 | 1,579,880 |
| Tupras Turkiye Petrol Rafinerileri A/S | | 82,528 | 1,944,493 |
|
| TOTAL TURKEY | | | 4,624,213 |
|
| United Arab Emirates - 0.7% | | | |
| Aldar Properties PJSC | | 2,460,310 | 1,158,770 |
| Emaar Properties PJSC | | 585,967 | 813,588 |
|
| TOTAL UNITED ARAB EMIRATES | | | 1,972,358 |
|
| United Kingdom - 1.8% | | | |
| Bank of Georgia Group PLC | | 27,240 | 542,955 |
| Contemporary Amperex Technology Co. Ltd. ELS (UBS Bank Warrant Program) Class A warrants 6/24/19(a)(b) | | 33,300 | 355,644 |
| Georgia Capital PLC (a) | | 52,700 | 788,125 |
| NMC Health PLC | | 45,983 | 2,075,950 |
| TBC Bank Group PLC | | 28,353 | 612,470 |
| Tonghua Dongbao Pharmaceutical Co. Ltd. ELS (UBS Bank Warrant Program) Class A warrants 3/26/19 (a) | | 285,190 | 547,023 |
|
| TOTAL UNITED KINGDOM | | | 4,922,167 |
|
| United States of America - 0.6% | | | |
| MercadoLibre, Inc. | | 4,780 | 1,551,110 |
| Uxin Ltd. ADR (a) | | 22,620 | 123,053 |
|
| TOTAL UNITED STATES OF AMERICA | | | 1,674,163 |
|
| Vietnam - 0.1% | | | |
| FTP Corp. | | 217,196 | 390,284 |
| TOTAL COMMON STOCKS | | | |
| (Cost $282,444,944) | | | 250,791,875 |
|
| Nonconvertible Preferred Stocks - 3.1% | | | |
| Brazil - 1.8% | | | |
| Banco ABC Brasil SA | | 308,106 | 1,338,727 |
| Banco do Estado Rio Grande do Sul SA | | 165,600 | 883,734 |
| Companhia Paranaense de Energia-Copel (PN-B) sponsored ADR (c) | | 163,060 | 1,143,051 |
| Metalurgica Gerdau SA (PN) | | 620,400 | 1,323,653 |
| TIM Participacoes SA sponsored ADR | | 20,180 | 312,185 |
|
| TOTAL BRAZIL | | | 5,001,350 |
|
| Korea (South) - 0.8% | | | |
| Hyundai Motor Co. Series 2 | | 28,066 | 1,741,519 |
| Samsung Fire & Marine Insurance Co. Ltd. | | 3,488 | 544,140 |
|
| TOTAL KOREA (SOUTH) | | | 2,285,659 |
|
| Russia - 0.5% | | | |
| Sberbank of Russia | | 502,800 | 1,246,433 |
| TOTAL NONCONVERTIBLE PREFERRED STOCKS | | | |
| (Cost $8,895,634) | | | 8,533,442 |
| | | Principal Amount | Value |
|
| Government Obligations - 0.1% | | | |
| United States of America - 0.1% | | | |
| U.S. Treasury Bills, yield at date of purchase 2.02% to 2.09% 11/8/18 to 11/29/18(e) | | | |
| (Cost $309,646) | | $310,000 | 309,631 |
| | | Shares | Value |
|
| Money Market Funds - 4.9% | | | |
| Fidelity Cash Central Fund, 2.23% (f) | | 11,625,158 | 11,627,483 |
| Fidelity Securities Lending Cash Central Fund 2.23% (f)(g) | | 2,041,375 | 2,041,579 |
| TOTAL MONEY MARKET FUNDS | | | |
| (Cost $13,668,902) | | | 13,669,062 |
| TOTAL INVESTMENT IN SECURITIES - 98.1% | | | |
| (Cost $305,319,126) | | | 273,304,010 |
| NET OTHER ASSETS (LIABILITIES) - 1.9% | | | 5,427,641 |
| NET ASSETS - 100% | | | $278,731,651 |
| Futures Contracts | | | | | |
| | Number of contracts | Expiration Date | Notional Amount | Value | Unrealized Appreciation/(Depreciation) |
| Purchased | | | | | |
| Equity Index Contracts | | | | | |
| ICE E-mini MSCI Emerging Markets Index Contracts (United States) | 128 | Dec. 2018 | $6,122,880 | $(16,907) | $(16,907) |
The notional amount of futures purchased as a percentage of Net Assets is 2.2%
Security Type Abbreviations
ELS – Equity-Linked Security
Categorizations in the Schedule of Investments are based on country or territory of incorporation.
Legend
(a) Non-income producing
(b) Security exempt from registration under Rule 144A of the Securities Act of 1933. These securities may be resold in transactions exempt from registration, normally to qualified institutional buyers. At the end of the period, the value of these securities amounted to $7,442,783 or 2.7% of net assets.
(c) Security or a portion of the security is on loan at period end.
(d) Level 3 security
(e) Security or a portion of the security was pledged to cover margin requirements for futures contracts. At period end, the value of securities pledged amounted to $8,996.
(f) Affiliated fund that is generally available only to investment companies and other accounts managed by Fidelity Investments. The rate quoted is the annualized seven-day yield of the fund at period end. A complete unaudited listing of the fund's holdings as of its most recent quarter end is available upon request. In addition, each Fidelity Central Fund's financial statements, which are not covered by the Fund's Report of Independent Registered Public Accounting Firm, are available on the SEC's website or upon request.
(g) Investment made with cash collateral received from securities on loan.
Affiliated Central Funds
Information regarding fiscal year to date income earned by the Fund from investments in Fidelity Central Funds is as follows:
| Fund | Income earned |
| Fidelity Cash Central Fund | $309,194 |
| Fidelity Securities Lending Cash Central Fund | 110,375 |
| Total | $419,569 |
Amounts in the income column in the above table include any capital gain distributions from underlying funds, which are presented in the corresponding line-item in the Statement of Operations if applicable.
Investment Valuation
The following is a summary of the inputs used, as of October 31, 2018, involving the Fund's assets and liabilities carried at fair value. The inputs or methodology used for valuing securities may not be an indication of the risk associated with investing in those securities. For more information on valuation inputs, and their aggregation into the levels used below, please refer to the Investment Valuation section in the accompanying Notes to Financial Statements.
| | Valuation Inputs at Reporting Date: |
| Description | Total | Level 1 | Level 2 | Level 3 |
| Investments in Securities: | | | | |
| Equities: | | | | |
| Communication Services | $8,971,705 | $8,971,705 | $-- | $-- |
| Consumer Discretionary | 45,842,320 | 45,842,320 | -- | -- |
| Consumer Staples | 18,703,068 | 18,592,193 | -- | 110,875 |
| Energy | 9,173,310 | 9,173,310 | -- | -- |
| Financials | 36,881,654 | 35,978,987 | 902,667 | -- |
| Health Care | 21,597,503 | 21,597,503 | -- | -- |
| Industrials | 40,638,586 | 40,638,586 | -- | -- |
| Information Technology | 20,540,686 | 19,762,943 | 740,785 | 36,958 |
| Materials | 31,047,578 | 31,047,578 | -- | -- |
| Real Estate | 17,271,639 | 17,271,639 | -- | -- |
| Utilities | 8,657,268 | 8,657,268 | -- | -- |
| Government Obligations | 309,631 | -- | 309,631 | -- |
| Money Market Funds | 13,669,062 | 13,669,062 | -- | -- |
| Total Investments in Securities: | $273,304,010 | $271,203,094 | $1,953,083 | $147,833 |
| Derivative Instruments: | | | | |
| Liabilities | | | | |
| Futures Contracts | $(16,907) | $(16,907) | $-- | $-- |
| Total Liabilities | $(16,907) | $(16,907) | $-- | $-- |
| Total Derivative Instruments: | $(16,907) | $(16,907) | $-- | $-- |
Value of Derivative Instruments
The following table is a summary of the Fund's value of derivative instruments by primary risk exposure as of October 31, 2018. For additional information on derivative instruments, please refer to the Derivative Instruments section in the accompanying Notes to Financial Statements.
| Primary Risk Exposure / Derivative Type | Value |
| | Asset | Liability |
| Equity Risk | | |
| Futures Contracts(a) | $0 | $(16,907) |
| Total Equity Risk | 0 | (16,907) |
| Total Value of Derivatives | $0 | $(16,907) |
(a) Reflects gross cumulative appreciation (depreciation) on futures contracts as presented in the Consolidated Schedule of Investments. In the Consolidated Statement of Assets and Liabilities, the period end daily variation margin is included in receivable or payable for daily variation margin on futures contracts, and the net cumulative appreciation (depreciation) is included in net unrealized appreciation (depreciation).
See accompanying notes which are an integral part of the financial statements.
Fidelity® Emerging Markets Discovery Fund
Financial Statements
Statement of Assets and Liabilities
| | | October 31, 2018 |
| Assets | | |
Investment in securities, at value (including securities loaned of $2,080,445) — See accompanying schedule:
Unaffiliated issuers (cost $291,650,224) | $259,634,948 | |
| Fidelity Central Funds (cost $13,668,902) | 13,669,062 | |
| Total Investment in Securities (cost $305,319,126) | | $273,304,010 |
| Foreign currency held at value (cost $78,311) | | 78,159 |
| Receivable for investments sold | | 9,296,461 |
| Receivable for fund shares sold | | 188,247 |
| Dividends receivable | | 128,304 |
| Distributions receivable from Fidelity Central Funds | | 26,008 |
| Prepaid expenses | | 839 |
| Receivable from investment adviser for expense reductions | | 35 |
| Other receivables | | 131,965 |
| Total assets | | 283,154,028 |
| Liabilities | | |
| Payable to custodian bank | $771,649 | |
| Payable for investments purchased | 358,932 | |
| Payable for fund shares redeemed | 661,286 | |
| Accrued management fee | 208,323 | |
| Distribution and service plan fees payable | 15,767 | |
| Payable for daily variation margin on futures contracts | 16,907 | |
| Other affiliated payables | 70,848 | |
| Other payables and accrued expenses | 277,195 | |
| Collateral on securities loaned | 2,041,470 | |
| Total liabilities | | 4,422,377 |
| Net Assets | | $278,731,651 |
| Net Assets consist of: | | |
| Paid in capital | | $313,680,032 |
| Total distributable earnings (loss) | | (34,948,381) |
| Net Assets | | $278,731,651 |
| Net Asset Value and Maximum Offering Price | | |
| Class A: | | |
| Net Asset Value and redemption price per share ($14,471,629 ÷ 1,204,469 shares) | | $12.01 |
| Maximum offering price per share (100/94.25 of $12.01) | | $12.74 |
| Class M: | | |
| Net Asset Value and redemption price per share ($5,374,097 ÷ 450,151 shares) | | $11.94 |
| Maximum offering price per share (100/96.50 of $11.94) | | $12.37 |
| Class C: | | |
| Net Asset Value and offering price per share ($11,277,806 ÷ 967,110 shares)(a) | | $11.66 |
| Emerging Markets Discovery: | | |
| Net Asset Value, offering price and redemption price per share ($188,690,039 ÷ 15,594,899 shares) | | $12.10 |
| Class I: | | |
| Net Asset Value, offering price and redemption price per share ($57,505,607 ÷ 4,742,108 shares) | | $12.13 |
| Class Z: | | |
| Net Asset Value, offering price and redemption price per share ($1,412,473 ÷ 116,433 shares) | | $12.13 |
(a) Redemption price per share is equal to net asset value less any applicable contingent deferred sales charge.
See accompanying notes which are an integral part of the financial statements.
Statement of Operations
| | | Year ended October 31, 2018 |
| Investment Income | | |
| Dividends | | $11,976,209 |
| Interest | | 10,117 |
| Income from Fidelity Central Funds | | 419,569 |
| Income before foreign taxes withheld | | 12,405,895 |
| Less foreign taxes withheld | | (1,011,481) |
| Total income | | 11,394,414 |
| Expenses | | |
| Management fee | $3,563,125 | |
| Transfer agent fees | 819,817 | |
| Distribution and service plan fees | 251,929 | |
| Accounting and security lending fees | 221,004 | |
| Custodian fees and expenses | 397,085 | |
| Independent trustees' fees and expenses | 2,153 | |
| Registration fees | 97,487 | |
| Audit | 96,635 | |
| Legal | 855 | |
| Interest | 788 | |
| Miscellaneous | 2,416 | |
| Total expenses before reductions | 5,453,294 | |
| Expense reductions | (177,951) | |
| Total expenses after reductions | | 5,275,343 |
| Net investment income (loss) | | 6,119,071 |
| Realized and Unrealized Gain (Loss) | | |
| Net realized gain (loss) on: | | |
| Investment securities: | | |
| Unaffiliated issuers (net of foreign taxes of $86,279) | (2,365,412) | |
| Fidelity Central Funds | 433 | |
| Foreign currency transactions | (613,305) | |
| Futures contracts | (803,067) | |
| Total net realized gain (loss) | | (3,781,351) |
| Change in net unrealized appreciation (depreciation) on: | | |
| Investment securities: | | |
| Unaffiliated issuers (net of decrease in deferred foreign taxes of $567,272) | (74,718,839) | |
| Fidelity Central Funds | (851) | |
| Assets and liabilities in foreign currencies | (17,214) | |
| Futures contracts | (16,907) | |
| Total change in net unrealized appreciation (depreciation) | | (74,753,811) |
| Net gain (loss) | | (78,535,162) |
| Net increase (decrease) in net assets resulting from operations | | $(72,416,091) |
See accompanying notes which are an integral part of the financial statements.
Statement of Changes in Net Assets
| | Year ended October 31, 2018 | Year ended October 31, 2017 |
| Increase (Decrease) in Net Assets | | |
| Operations | | |
| Net investment income (loss) | $6,119,071 | $2,767,445 |
| Net realized gain (loss) | (3,781,351) | 9,091,626 |
| Change in net unrealized appreciation (depreciation) | (74,753,811) | 38,838,325 |
| Net increase (decrease) in net assets resulting from operations | (72,416,091) | 50,697,396 |
| Distributions to shareholders | (9,625,215) | – |
| Distributions to shareholders from net investment income | – | (659,806) |
| Distributions to shareholders from net realized gain | – | (485,420) |
| Total distributions | (9,625,215) | (1,145,226) |
| Share transactions - net increase (decrease) | (24,209,703) | 249,358,868 |
| Redemption fees | 66,640 | 166,495 |
| Total increase (decrease) in net assets | (106,184,369) | 299,077,533 |
| Net Assets | | |
| Beginning of period | 384,916,020 | 85,838,487 |
| End of period | $278,731,651 | $384,916,020 |
| Other Information | | |
| Undistributed net investment income end of period | | $2,568,661 |
See accompanying notes which are an integral part of the financial statements.
Financial Highlights
Fidelity Emerging Markets Discovery Fund Class A
| Years ended October 31, | 2018 | 2017 | 2016 | 2015 | 2014 |
| Selected Per–Share Data | | | | | |
| Net asset value, beginning of period | $15.03 | $12.27 | $10.92 | $12.17 | $12.49 |
| Income from Investment Operations | | | | | |
| Net investment income (loss)A | .18 | .14 | .09 | .09B | .04 |
| Net realized and unrealized gain (loss) | (2.89) | 2.74 | 1.30 | (1.34) | (.01) |
| Total from investment operations | (2.71) | 2.88 | 1.39 | (1.25) | .03 |
| Distributions from net investment income | (.08) | (.07) | (.05) | – | (.06) |
| Distributions from net realized gain | (.23) | (.06) | – | – | (.30) |
| Total distributions | (.31) | (.13) | (.05) | – | (.36) |
| Redemption fees added to paid in capitalA | –C | .01 | .01 | –C | .01 |
| Net asset value, end of period | $12.01 | $15.03 | $12.27 | $10.92 | $12.17 |
| Total ReturnD,E | (18.39)% | 23.89% | 12.93% | (10.27)% | .31% |
| Ratios to Average Net AssetsF,G | | | | | |
| Expenses before reductions | 1.52% | 1.63% | 1.89% | 1.88% | 1.82% |
| Expenses net of fee waivers, if any | 1.52% | 1.63% | 1.70% | 1.70% | 1.70% |
| Expenses net of all reductions | 1.48% | 1.62% | 1.70% | 1.69% | 1.70% |
| Net investment income (loss) | 1.22% | 1.03% | .85% | .76%B | .29% |
| Supplemental Data | | | | | |
| Net assets, end of period (000 omitted) | $14,472 | $16,062 | $5,252 | $4,660 | $4,362 |
| Portfolio turnover rateH | 98% | 58% | 60% | 103% | 148% |
A Calculated based on average shares outstanding during the period.
B Net investment income per share reflects a large, non-recurring dividend which amounted to $.06 per share. Excluding this non-recurring dividend, the ratio of net investment income (loss) to average net assets would have been .22%.
C Amount represents less than $.005 per share.
D Total returns would have been lower if certain expenses had not been reduced during the applicable periods shown.
E Total returns do not include the effect of the sales charges.
F Fees and expenses of any underlying Fidelity Central Funds are not included in the Fund's expense ratio. The Fund indirectly bears its proportionate share of the expenses of any underlying Fidelity Central Funds.
G Expense ratios reflect operating expenses of the class. Expenses before reductions do not reflect amounts reimbursed by the investment adviser or reductions from brokerage service arrangements or reductions from other expense offset arrangements and do not represent the amount paid by the class during periods when reimbursements or reductions occur. Expenses net of fee waivers reflect expenses after reimbursement by the investment adviser but prior to reductions from brokerage service arrangements or other expense offset arrangements. Expenses net of all reductions represent the net expenses paid by the class.
H Amount does not include the portfolio activity of any underlying Fidelity Central Funds.
See accompanying notes which are an integral part of the financial statements.
Fidelity Emerging Markets Discovery Fund Class M
| Years ended October 31, | 2018 | 2017 | 2016 | 2015 | 2014 |
| Selected Per–Share Data | | | | | |
| Net asset value, beginning of period | $14.94 | $12.20 | $10.86 | $12.13 | $12.44 |
| Income from Investment Operations | | | | | |
| Net investment income (loss)A | .14 | .10 | .07 | .06B | –C |
| Net realized and unrealized gain (loss) | (2.87) | 2.74 | 1.28 | (1.33) | –C |
| Total from investment operations | (2.73) | 2.84 | 1.35 | (1.27) | –C |
| Distributions from net investment income | (.04) | (.04) | (.02) | – | (.02) |
| Distributions from net realized gain | (.23) | (.06) | – | – | (.30) |
| Total distributions | (.27) | (.11)D | (.02) | – | (.32) |
| Redemption fees added to paid in capitalA | –C | .01 | .01 | –C | .01 |
| Net asset value, end of period | $11.94 | $14.94 | $12.20 | $10.86 | $12.13 |
| Total ReturnE,F | (18.58)% | 23.63% | 12.58% | (10.47)% | .05% |
| Ratios to Average Net AssetsG,H | | | | | |
| Expenses before reductions | 1.79% | 1.92% | 2.17% | 2.16% | 2.10% |
| Expenses net of fee waivers, if any | 1.79% | 1.92% | 1.95% | 1.95% | 1.95% |
| Expenses net of all reductions | 1.75% | 1.90% | 1.94% | 1.94% | 1.95% |
| Net investment income (loss) | .94% | .74% | .60% | .51%B | .04% |
| Supplemental Data | | | | | |
| Net assets, end of period (000 omitted) | $5,374 | $9,393 | $2,868 | $2,015 | $2,031 |
| Portfolio turnover rateI | 98% | 58% | 60% | 103% | 148% |
A Calculated based on average shares outstanding during the period.
B Net investment income per share reflects a large, non-recurring dividend which amounted to $.06 per share. Excluding this non-recurring dividend, the ratio of net investment income (loss) to average net assets would have been (.03) %.
C Amount represents less than $.005 per share.
D Total distributions of $.11 per share is comprised of distributions from net investment income of $.044 and distributions from net realized gain of $.064 per share.
E Total returns would have been lower if certain expenses had not been reduced during the applicable periods shown.
F Total returns do not include the effect of the sales charges.
G Fees and expenses of any underlying Fidelity Central Funds are not included in the Fund's expense ratio. The Fund indirectly bears its proportionate share of the expenses of any underlying Fidelity Central Funds.
H Expense ratios reflect operating expenses of the class. Expenses before reductions do not reflect amounts reimbursed by the investment adviser or reductions from brokerage service arrangements or reductions from other expense offset arrangements and do not represent the amount paid by the class during periods when reimbursements or reductions occur. Expenses net of fee waivers reflect expenses after reimbursement by the investment adviser but prior to reductions from brokerage service arrangements or other expense offset arrangements. Expenses net of all reductions represent the net expenses paid by the class.
I Amount does not include the portfolio activity of any underlying Fidelity Central Funds.
See accompanying notes which are an integral part of the financial statements.
Fidelity Emerging Markets Discovery Fund Class C
| Years ended October 31, | 2018 | 2017 | 2016 | 2015 | 2014 |
| Selected Per–Share Data | | | | | |
| Net asset value, beginning of period | $14.64 | $11.97 | $10.69 | $12.00 | $12.35 |
| Income from Investment Operations | | | | | |
| Net investment income (loss)A | .06 | .04 | .01 | –B,C | (.06) |
| Net realized and unrealized gain (loss) | (2.79) | 2.69 | 1.26 | (1.31) | –C |
| Total from investment operations | (2.73) | 2.73 | 1.27 | (1.31) | (.06) |
| Distributions from net investment income | (.02) | (.01) | – | – | – |
| Distributions from net realized gain | (.23) | (.06) | – | – | (.30) |
| Total distributions | (.25) | (.07) | – | – | (.30) |
| Redemption fees added to paid in capitalA | –C | .01 | .01 | –C | .01 |
| Net asset value, end of period | $11.66 | $14.64 | $11.97 | $10.69 | $12.00 |
| Total ReturnD,E | (18.97)% | 23.02% | 11.97% | (10.92)% | (.42)% |
| Ratios to Average Net AssetsF,G | | | | | |
| Expenses before reductions | 2.28% | 2.38% | 2.63% | 2.64% | 2.58% |
| Expenses net of fee waivers, if any | 2.28% | 2.38% | 2.45% | 2.45% | 2.45% |
| Expenses net of all reductions | 2.24% | 2.37% | 2.44% | 2.44% | 2.45% |
| Net investment income (loss) | .45% | .28% | .10% | .01%B | (.46)% |
| Supplemental Data | | | | | |
| Net assets, end of period (000 omitted) | $11,278 | $14,168 | $2,203 | $1,675 | $1,750 |
| Portfolio turnover rateH | 98% | 58% | 60% | 103% | 148% |
A Calculated based on average shares outstanding during the period.
B Net investment income per share reflects a large, non-recurring dividend which amounted to $.06 per share. Excluding this non-recurring dividend, the ratio of net investment income (loss) to average net assets would have been (.52) %.
C Amount represents less than $.005 per share.
D Total returns would have been lower if certain expenses had not been reduced during the applicable periods shown.
E Total returns do not include the effect of the contingent deferred sales charge.
F Fees and expenses of any underlying Fidelity Central Funds are not included in the Fund's expense ratio. The Fund indirectly bears its proportionate share of the expenses of any underlying Fidelity Central Funds.
G Expense ratios reflect operating expenses of the class. Expenses before reductions do not reflect amounts reimbursed by the investment adviser or reductions from brokerage service arrangements or reductions from other expense offset arrangements and do not represent the amount paid by the class during periods when reimbursements or reductions occur. Expenses net of fee waivers reflect expenses after reimbursement by the investment adviser but prior to reductions from brokerage service arrangements or other expense offset arrangements. Expenses net of all reductions represent the net expenses paid by the class.
H Amount does not include the portfolio activity of any underlying Fidelity Central Funds.
See accompanying notes which are an integral part of the financial statements.
Fidelity Emerging Markets Discovery Fund
| Years ended October 31, | 2018 | 2017 | 2016 | 2015 | 2014 |
| Selected Per–Share Data | | | | | |
| Net asset value, beginning of period | $15.12 | $12.33 | $10.98 | $12.21 | $12.52 |
| Income from Investment Operations | | | | | |
| Net investment income (loss)A | .23 | .18 | .12 | .12B | .07 |
| Net realized and unrealized gain (loss) | (2.91) | 2.76 | 1.31 | (1.35) | –C |
| Total from investment operations | (2.68) | 2.94 | 1.43 | (1.23) | .07 |
| Distributions from net investment income | (.11) | (.09) | (.09) | – | (.09) |
| Distributions from net realized gain | (.23) | (.06) | – | – | (.30) |
| Total distributions | (.34) | (.16)D | (.09) | – | (.39) |
| Redemption fees added to paid in capitalA | –C | .01 | .01 | –C | .01 |
| Net asset value, end of period | $12.10 | $15.12 | $12.33 | $10.98 | $12.21 |
| Total ReturnE | (18.11)% | 24.30% | 13.19% | (10.07)% | .61% |
| Ratios to Average Net AssetsF,G | | | | | |
| Expenses before reductions | 1.22% | 1.35% | 1.55% | 1.56% | 1.48% |
| Expenses net of fee waivers, if any | 1.22% | 1.35% | 1.45% | 1.45% | 1.45% |
| Expenses net of all reductions | 1.18% | 1.34% | 1.44% | 1.44% | 1.45% |
| Net investment income (loss) | 1.51% | 1.31% | 1.10% | 1.01%B | .54% |
| Supplemental Data | | | | | |
| Net assets, end of period (000 omitted) | $188,690 | $248,124 | $67,178 | $61,601 | $78,377 |
| Portfolio turnover rateH | 98% | 58% | 60% | 103% | 148% |
A Calculated based on average shares outstanding during the period.
B Net investment income per share reflects a large, non-recurring dividend which amounted to $.06 per share. Excluding this non-recurring dividend, the ratio of net investment income (loss) to average net assets would have been .48%.
C Amount represents less than $.005 per share.
D Total distributions of $.16 per share is comprised of distributions from net investment income of $.091 and distributions from net realized gain of $.064 per share.
E Total returns would have been lower if certain expenses had not been reduced during the applicable periods shown.
F Fees and expenses of any underlying Fidelity Central Funds are not included in the Fund's expense ratio. The Fund indirectly bears its proportionate share of the expenses of any underlying Fidelity Central Funds.
G Expense ratios reflect operating expenses of the class. Expenses before reductions do not reflect amounts reimbursed by the investment adviser or reductions from brokerage service arrangements or reductions from other expense offset arrangements and do not represent the amount paid by the class during periods when reimbursements or reductions occur. Expenses net of fee waivers reflect expenses after reimbursement by the investment adviser but prior to reductions from brokerage service arrangements or other expense offset arrangements. Expenses net of all reductions represent the net expenses paid by the class.
H Amount does not include the portfolio activity of any underlying Fidelity Central Funds.
See accompanying notes which are an integral part of the financial statements.
Fidelity Emerging Markets Discovery Fund Class I
| Years ended October 31, | 2018 | 2017 | 2016 | 2015 | 2014 |
| Selected Per–Share Data | | | | | |
| Net asset value, beginning of period | $15.15 | $12.37 | $11.02 | $12.25 | $12.53 |
| Income from Investment Operations | | | | | |
| Net investment income (loss)A | .23 | .19 | .13 | .12B | .07 |
| Net realized and unrealized gain (loss) | (2.90) | 2.75 | 1.30 | (1.35) | –C |
| Total from investment operations | (2.67) | 2.94 | 1.43 | (1.23) | .07 |
| Distributions from net investment income | (.12) | (.10) | (.09) | – | (.06) |
| Distributions from net realized gain | (.23) | (.06) | – | – | (.30) |
| Total distributions | (.35) | (.17)D | (.09) | – | (.36) |
| Redemption fees added to paid in capitalA | –C | .01 | .01 | –C | .01 |
| Net asset value, end of period | $12.13 | $15.15 | $12.37 | $11.02 | $12.25 |
| Total ReturnE | (18.06)% | 24.25% | 13.16% | (10.04)% | .61% |
| Ratios to Average Net AssetsF,G | | | | | |
| Expenses before reductions | 1.22% | 1.32% | 1.59% | 1.54% | 1.56% |
| Expenses net of fee waivers, if any | 1.22% | 1.32% | 1.45% | 1.45% | 1.45% |
| Expenses net of all reductions | 1.18% | 1.30% | 1.44% | 1.43% | 1.45% |
| Net investment income (loss) | 1.51% | 1.34% | 1.10% | 1.01%B | .54% |
| Supplemental Data | | | | | |
| Net assets, end of period (000 omitted) | $57,506 | $97,170 | $8,337 | $1,410 | $481 |
| Portfolio turnover rateH | 98% | 58% | 60% | 103% | 148% |
A Calculated based on average shares outstanding during the period.
B Net investment income per share reflects a large, non-recurring dividend which amounted to $.06 per share. Excluding this non-recurring dividend, the ratio of net investment income (loss) to average net assets would have been .48%.
C Amount represents less than $.005 per share.
D Total distributions of $.17 per share is comprised of distributions from net investment income of $.101 and distributions from net realized gain of $.064 per share.
E Total returns would have been lower if certain expenses had not been reduced during the applicable periods shown.
F Fees and expenses of any underlying Fidelity Central Funds are not included in the Fund's expense ratio. The Fund indirectly bears its proportionate share of the expenses of any underlying Fidelity Central Funds.
G Expense ratios reflect operating expenses of the class. Expenses before reductions do not reflect amounts reimbursed by the investment adviser or reductions from brokerage service arrangements or reductions from other expense offset arrangements and do not represent the amount paid by the class during periods when reimbursements or reductions occur. Expenses net of fee waivers reflect expenses after reimbursement by the investment adviser but prior to reductions from brokerage service arrangements or other expense offset arrangements. Expenses net of all reductions represent the net expenses paid by the class.
H Amount does not include the portfolio activity of any underlying Fidelity Central Funds.
See accompanying notes which are an integral part of the financial statements.
Fidelity Emerging Markets Discovery Fund Class Z
| Year ended October 31, | 2018 A |
| Selected Per–Share Data | |
| Net asset value, beginning of period | $13.19 |
| Income from Investment Operations | |
| Net investment income (loss)B | –C |
| Net realized and unrealized gain (loss) | (1.06) |
| Total from investment operations | (1.06) |
| Distributions from net investment income | – |
| Distributions from net realized gain | – |
| Total distributions | – |
| Net asset value, end of period | $12.13 |
| Total ReturnD,E | (8.04)% |
| Ratios to Average Net AssetsF,G | |
| Expenses before reductions | 1.17%H |
| Expenses net of fee waivers, if any | 1.02%H |
| Expenses net of all reductions | .98%H |
| Net investment income (loss) | (.12)%H |
| Supplemental Data | |
| Net assets, end of period (000 omitted) | $1,412 |
| Portfolio turnover rateI | 98% |
A For the period October 2, 2018 (commencement of sale of shares) to October 31, 2018.
B Calculated based on average shares outstanding during the period.
C Amount represents less than $.005 per share.
D Total returns for periods of less than one year are not annualized.
E Total returns would have been lower if certain expenses had not been reduced during the applicable periods shown.
F Fees and expenses of any underlying Fidelity Central Funds are not included in the Fund's expense ratio. The Fund indirectly bears its proportionate share of the expenses of any underlying Fidelity Central Funds.
G Expense ratios reflect operating expenses of the class. Expenses before reductions do not reflect amounts reimbursed by the investment adviser or reductions from brokerage service arrangements or reductions from other expense offset arrangements and do not represent the amount paid by the class during periods when reimbursements or reductions occur. Expense ratios before reductions for start-up periods may not be representative of longer-term operating periods. Expenses net of fee waivers reflect expenses after reimbursement by the investment adviser but prior to reductions from brokerage service arrangements or other expense offset arrangements. Expenses net of all reductions represent the net expenses paid by the class.
H Annualized
I Amount does not include the portfolio activity of any underlying Fidelity Central Funds.
See accompanying notes which are an integral part of the financial statements.
Notes to Financial Statements
For the period ended October 31, 2018
1. Organization.
Fidelity Emerging Markets Discovery Fund (the Fund) is a fund of Fidelity Investment Trust (the Trust) and is authorized to issue an unlimited number of shares. The Trust is registered under the Investment Company Act of 1940, as amended (the 1940 Act), as an open-end management investment company organized as a Massachusetts business trust. The Fund commenced sale of Class Z shares on October 2, 2018. The Fund offers Class A, Class M, Class C, Emerging Markets Discovery, Class I and Class Z shares, each of which has equal rights as to assets and voting privileges. Each class has exclusive voting rights with respect to matters that affect that class. The Fund's investments in emerging markets can be subject to social, economic, regulatory, and political uncertainties and can be extremely volatile.
2. Investments in Fidelity Central Funds.
The Fund invests in Fidelity Central Funds, which are open-end investment companies generally available only to other investment companies and accounts managed by the investment adviser and its affiliates. The Fund's Schedule of Investments lists each of the Fidelity Central Funds held as of period end, if any, as an investment of the Fund, but does not include the underlying holdings of each Fidelity Central Fund. As an Investing Fund, the Fund indirectly bears its proportionate share of the expenses of the underlying Fidelity Central Funds.
The Money Market Central Funds seek preservation of capital and current income and are managed by Fidelity Investments Money Management, Inc. (FIMM), an affiliate of the investment adviser. Annualized expenses of the Money Market Central Funds as of their most recent shareholder report date are less than .005%.
A complete unaudited list of holdings for each Fidelity Central Fund is available upon request or at the Securities and Exchange Commission (the SEC) website at www.sec.gov. In addition, the financial statements of the Fidelity Central Funds, which are not covered by the Fund's Report of Independent Registered Public Accounting Firm, are available on the SEC website or upon request.
3. Significant Accounting Policies.
The Fund is an investment company and applies the accounting and reporting guidance of the Financial Accounting Standards Board (FASB) Accounting Standards Codification Topic 946 Financial Services – Investments Companies. The financial statements have been prepared in conformity with accounting principles generally accepted in the United States of America (GAAP), which require management to make certain estimates and assumptions at the date of the financial statements. Actual results could differ from those estimates. Subsequent events, if any, through the date that the financial statements were issued have been evaluated in the preparation of the financial statements. The following summarizes the significant accounting policies of the Fund:
Investment Valuation. Investments are valued as of 4:00 p.m. Eastern time on the last calendar day of the period. The Board of Trustees (the Board) has delegated the day to day responsibility for the valuation of the Fund's investments to the Fair Value Committee (the Committee) established by the Fund's investment adviser. In accordance with valuation policies and procedures approved by the Board, the Fund attempts to obtain prices from one or more third party pricing vendors or brokers to value its investments. When current market prices, quotations or currency exchange rates are not readily available or reliable, investments will be fair valued in good faith by the Committee, in accordance with procedures adopted by the Board. Factors used in determining fair value vary by investment type and may include market or investment specific events, changes in interest rates and credit quality. The frequency with which these procedures are used cannot be predicted and they may be utilized to a significant extent. The Committee oversees the Fund's valuation policies and procedures and reports to the Board on the Committee's activities and fair value determinations. The Board monitors the appropriateness of the procedures used in valuing the Fund's investments and ratifies the fair value determinations of the Committee.
The Fund categorizes the inputs to valuation techniques used to value its investments into a disclosure hierarchy consisting of three levels as shown below:
- Level 1 – quoted prices in active markets for identical investments
- Level 2 – other significant observable inputs (including quoted prices for similar investments, interest rates, prepayment speeds, etc.)
- Level 3 – unobservable inputs (including the Fund's own assumptions based on the best information available)
Valuation techniques used to value the Fund's investments by major category are as follows:
Equity securities, including restricted securities, for which market quotations are readily available, are valued at the last reported sale price or official closing price as reported by a third party pricing vendor on the primary market or exchange on which they are traded and are categorized as Level 1 in the hierarchy. In the event there were no sales during the day or closing prices are not available, securities are valued at the last quoted bid price or may be valued using the last available price and are generally categorized as Level 2 in the hierarchy. For foreign equity securities, when market or security specific events arise, comparisons to the valuation of American Depositary Receipts (ADRs), futures contracts, Exchange-Traded Funds (ETFs) and certain indexes as well as quoted prices for similar securities may be used and would be categorized as Level 2 in the hierarchy. Utilizing these techniques may result in transfers between Level 1 and Level 2. For equity securities, including restricted securities, where observable inputs are limited, assumptions about market activity and risk are used and these securities may be categorized as Level 3 in the hierarchy.
Debt securities, including restricted securities, are valued based on evaluated prices received from third party pricing vendors or from brokers who make markets in such securities. U.S. government and government agency obligations are valued by pricing vendors who utilize matrix pricing which considers yield or price of bonds of comparable quality, coupon, maturity and type or by broker-supplied prices. When independent prices are unavailable or unreliable, debt securities may be valued utilizing pricing methodologies which consider similar factors that would be used by third party pricing vendors. Debt securities are generally categorized as Level 2 in the hierarchy but may be Level 3 depending on the circumstances.
Investments in open-end mutual funds, including the Fidelity Central Funds, are valued at their closing net asset value (NAV) each business day and are categorized as Level 1 in the hierarchy.
Changes in valuation techniques may result in transfers in or out of an assigned level within the disclosure hierarchy. The aggregate value of investments by input level as of October 31, 2018 is included at the end of the Fund's Schedule of Investments.
Foreign Currency. The Fund may use foreign currency contracts to facilitate transactions in foreign-denominated securities. Gains and losses from these transactions may arise from changes in the value of the foreign currency or if the counterparties do not perform under the contracts' terms.
Foreign-denominated assets, including investment securities, and liabilities are translated into U.S. dollars at the exchange rates at period end. Purchases and sales of investment securities, income and dividends received and expenses denominated in foreign currencies are translated into U.S. dollars at the exchange rate in effect on the transaction date.
The effects of exchange rate fluctuations on investments are included with the net realized and unrealized gain (loss) on investment securities. Other foreign currency transactions resulting in realized and unrealized gain (loss) are disclosed separately.
Investment Transactions and Income. For financial reporting purposes, the Fund's investment holdings and NAV include trades executed through the end of the last business day of the period. The NAV per share for processing shareholder transactions is calculated as of the close of business of the New York Stock Exchange (NYSE), normally 4:00 p.m. Eastern time and includes trades executed through the end of the prior business day. Gains and losses on securities sold are determined on the basis of identified cost. Dividend income is recorded on the ex-dividend date, except for certain dividends from foreign securities where the ex-dividend date may have passed, which are recorded as soon as the Fund is informed of the ex-dividend date. Non-cash dividends included in dividend income, if any, are recorded at the fair market value of the securities received. Income and capital gain distributions from Fidelity Central Funds, if any, are recorded on the ex-dividend date. Certain distributions received by the Fund represent a return of capital or capital gain. The Fund determines the components of these distributions subsequent to the ex-dividend date, based upon receipt of tax filings or other correspondence relating to the underlying investment. These distributions are recorded as a reduction of cost of investments and/or as a realized gain. Interest income is accrued as earned and includes coupon interest and amortization of premium and accretion of discount on debt securities as applicable. Investment income is recorded net of foreign taxes withheld where recovery of such taxes is uncertain.
Class Allocations and Expenses. Investment income, realized and unrealized capital gains and losses, common expenses of the Fund, and certain fund-level expense reductions, if any, are allocated daily on a pro-rata basis to each class based on the relative net assets of each class to the total net assets of the Fund. Each class differs with respect to transfer agent and distribution and service plan fees incurred. Certain expense reductions may also differ by class. For the reporting period, the allocated portion of income and expenses to each class as a percent of its average net assets may vary due to the timing of recording these transactions in relation to fluctuating net assets of the classes. Expenses directly attributable to a fund are charged to that fund. Expenses attributable to more than one fund are allocated among the respective funds on the basis of relative net assets or other appropriate methods. Expense estimates are accrued in the period to which they relate and adjustments are made when actual amounts are known.
Income Tax Information and Distributions to Shareholders. Each year, the Fund intends to qualify as a regulated investment company under Subchapter M of the Internal Revenue Code, including distributing substantially all of its taxable income and realized gains. As a result, no provision for U.S. Federal income taxes is required. As of October 31, 2018, the Fund did not have any unrecognized tax benefits in the financial statements; nor is the Fund aware of any tax positions for which it is reasonably possible that the total amounts of unrecognized tax benefits will significantly change in the next twelve months. The Fund files a U.S. federal tax return, in addition to state and local tax returns as required. The Fund's federal income tax returns are subject to examination by the Internal Revenue Service (IRS) for a period of three fiscal years after they are filed. State and local tax returns may be subject to examination for an additional fiscal year depending on the jurisdiction. Foreign taxes are provided for based on the Fund's understanding of the tax rules and rates that exist in the foreign markets in which it invests. The Fund is subject to a tax imposed on capital gains by certain countries in which it invests. An estimated deferred tax liability for net unrealized appreciation on the applicable securities is included in Other payables and accrued expenses on the Statement of Assets & Liabilities.
Distributions are declared and recorded on the ex-dividend date. Income and capital gain distributions are declared separately for each class. Income and capital gain distributions are determined in accordance with income tax regulations, which may differ from GAAP. In addition, the Fund claimed a portion of the payment made to redeeming shareholders as a distribution for income tax purposes.
Capital accounts within the financial statements are adjusted for permanent book-tax differences. These adjustments have no impact on net assets or the results of operations. Capital accounts are not adjusted for temporary book-tax differences which will reverse in a subsequent period.
Book-tax differences are primarily due to foreign currency transactions, futures transactions, certain foreign taxes, passive foreign investment companies (PFIC), market discount, capital loss carryforwards and losses deferred due to wash sales.
As of period end, the cost and unrealized appreciation (depreciation) in securities, and derivatives if applicable, for federal income tax purposes were as follows:
| Gross unrealized appreciation | $16,925,931 |
| Gross unrealized depreciation | (52,354,716) |
| Net unrealized appreciation (depreciation) | $(35,428,785) |
| Tax Cost | $308,732,795 |
The tax-based components of distributable earnings as of period end were as follows:
| Undistributed ordinary income | $4,482,081 |
| Capital loss carryforward | $(3,929,791) |
| Net unrealized appreciation (depreciation) on securities and other investments | $(35,445,320) |
Capital loss carryforwards are only available to offset future capital gains of the Fund to the extent provided by regulations and may be limited. Under the Regulated Investment Company Modernization Act of 2010 (the Act), the Fund is permitted to carry forward capital losses incurred in taxable years beginning after December 22, 2010 for an unlimited period and such capital losses are required to be used prior to any losses that expire. The capital loss carryforward information presented below, including any applicable limitation, is estimated as of fiscal period end and is subject to adjustment.
| No expiration | |
| Short-term | $(3,929,791) |
| Long-term | - |
| Total no expiration | $(3,929,791) |
| Total capital loss carryforward | $(3,929,791) |
The tax character of distributions paid was as follows:
| | October 31, 2018 | October 31, 2017 |
| Ordinary Income | $7,036,307 | $ 1,145,226 |
| Long-term Capital Gains | 2,588,908 | - |
| Total | $9,625,215 | $ 1,145,226 |
Short-Term Trading (Redemption) Fees. Shares held by investors in the Fund less than 90 days may have been subject to a redemption fee equal to 2.00% of the NAV of shares redeemed. All redemption fees, which reduce the proceeds of the shareholder redemption, are retained by the Fund and accounted for as an addition to paid in capital. In November 2017, the Board of Trustees approved the elimination of these redemption fees effective December 18, 2017.
Restricted Securities. The Fund may invest in securities that are subject to legal or contractual restrictions on resale. These securities generally may be resold in transactions exempt from registration or to the public if the securities are registered. Disposal of these securities may involve time-consuming negotiations and expense, and prompt sale at an acceptable price may be difficult. Information regarding restricted securities is included at the end of the Fund's Schedule of Investments.
New Rule Issuance. During August 2018, the U.S. Securities and Exchange Commission issued Final Rule Release No. 33-10532, Disclosure Update and Simplification. This Final Rule includes amendments specific to registered investment companies that are intended to eliminate overlap in disclosure requirements between Regulation S-X and GAAP. In accordance with these amendments, certain line-items in the Fund's financial statements have been combined or removed for the current period as outlined in the table below.
| Financial Statement | Current Line-Item Presentation | Prior Line-Item Presentation |
| Statement of Assets and Liabilities | Total distributable earnings (loss) | Undistributed/Distributions in excess of/Accumulated net investment income (loss)
Accumulated/Undistributed net realized gain (loss)
Net unrealized appreciation (depreciation) |
| Statement of Changes in Net Assets | N/A - removed | Undistributed/Distributions in excess of/Accumulated net investment income (loss) end of period |
| Statement of Changes in Net Assets | Distributions to shareholders | Distributions to shareholders from net investment income
Distributions to shareholders from net realized gain |
| Distributions to Shareholders Note to Financial Statements | Distributions to shareholders | Distributions to shareholders from net investment income
Distributions to shareholders from net realized gain |
4. Derivative Instruments.
Risk Exposures and the Use of Derivative Instruments. The Fund's investment objective allows the Fund to enter into various types of derivative contracts, including futures contracts. Derivatives are investments whose value is primarily derived from underlying assets, indices or reference rates and may be transacted on an exchange or over-the-counter (OTC). Derivatives may involve a future commitment to buy or sell a specified asset based on specified terms, to exchange future cash flows at periodic intervals based on a notional principal amount, or for one party to make one or more payments upon the occurrence of specified events in exchange for periodic payments from the other party.
The Fund used derivatives to increase returns and to manage exposure to certain risks as defined below. The success of any strategy involving derivatives depends on analysis of numerous economic factors, and if the strategies for investment do not work as intended, the Fund may not achieve its objectives.
The Fund's use of derivatives increased or decreased its exposure to the following risk:
| Equity Risk | Equity risk relates to the fluctuations in the value of financial instruments as a result of changes in market prices (other than those arising from interest rate risk or foreign exchange risk), whether caused by factors specific to an individual investment, its issuer, or all factors affecting all instruments traded in a market or market segment.
|
The Fund is also exposed to additional risks from investing in derivatives, such as liquidity risk and counterparty credit risk. Liquidity risk is the risk that the Fund will be unable to close out the derivative in the open market in a timely manner. Counterparty credit risk is the risk that the counterparty will not be able to fulfill its obligation to the Fund. Counterparty credit risk related to exchange-traded futures contracts may be mitigated by the protection provided by the exchange on which they trade.
Investing in derivatives may involve greater risks than investing in the underlying assets directly and, to varying degrees, may involve risk of loss in excess of any initial investment and collateral received and amounts recognized in the Statement of Assets and Liabilities. In addition, there may be the risk that the change in value of the derivative contract does not correspond to the change in value of the underlying instrument.
Futures Contracts. A futures contract is an agreement between two parties to buy or sell a specified underlying instrument for a fixed price at a specified future date. The Fund used futures contracts to manage its exposure to the stock market.
Upon entering into a futures contract, a fund is required to deposit either cash or securities (initial margin) with a clearing broker in an amount equal to a certain percentage of the face value of the contract. Futures contracts are marked-to-market daily and subsequent daily payments (variation margin) are made or received by a fund depending on the daily fluctuations in the value of the futures contracts and are recorded as unrealized appreciation or (depreciation). This receivable and/or payable, if any, is included in daily variation margin on futures contracts in the Statement of Assets and Liabilities. Realized gain or (loss) is recorded upon the expiration or closing of a futures contract. The net realized gain (loss) and change in net unrealized appreciation (depreciation) on futures contracts during the period is presented in the Statement of Operations.
Any open futures contracts at period end are presented in the Schedule of Investments under the caption "Futures Contracts". The notional amount at value reflects each contract's exposure to the underlying instrument or index at period end and is representative of volume of activity during the period. Securities deposited to meet initial margin requirements are identified in the Schedule of Investments.
5. Purchases and Sales of Investments.
Purchases and sales of securities, other than short-term securities, aggregated $389,008,799 and $430,453,965, respectively.
6. Fees and Other Transactions with Affiliates.
Management Fee. Fidelity Management & Research Company (the investment adviser) and its affiliates provide the Fund with investment management related services for which the Fund pays a monthly management fee. The management fee is the sum of an individual fund fee rate that is based on an annual rate of .60% of the Fund's average net assets and an annualized group fee rate that averaged .24% during the period. The group fee rate is based upon the average net assets of all the mutual funds advised by the investment adviser, including any mutual funds previously advised by the investment adviser that are currently advised by Fidelity SelectCo, LLC, an affiliate of the investment adviser. The group fee rate decreases as assets under management increase and increases as assets under management decrease. For the reporting period, the total annual management fee rate was .84% of the Fund's average net assets.
Distribution and Service Plan Fees. In accordance with Rule 12b-1 of the 1940 Act, the Fund has adopted separate Distribution and Service Plans for each class of shares. Certain classes pay Fidelity Distributors Corporation (FDC), an affiliate of the investment adviser, separate Distribution and Service Fees, each of which is based on an annual percentage of each class' average net assets. In addition, FDC may pay financial intermediaries for selling shares of the Fund and providing shareholder support services. For the period, the Distribution and Service Fee rates, total fees and amounts retained by FDC were as follows:
| | Distribution Fee | Service Fee | Total Fees | Retained by FDC |
| Class A | -% | .25% | $47,932 | $6,372 |
| Class M | .25% | .25% | 50,092 | 2,771 |
| Class C | .75% | .25% | 153,905 | 58,660 |
| | | | $251,929 | $67,803 |
Sales Load. FDC may receive a front-end sales charge of up to 5.75% for selling Class A shares and 3.50% for selling Class M shares, some of which is paid to financial intermediaries for selling shares of the Fund. Depending on the holding period, FDC may receive contingent deferred sales charges levied on Class A, Class M and Class C redemptions. The deferred sales charges are 1.00% for Class C shares, 1.00% for certain purchases of Class A shares and .25% for certain purchases of Class M shares.
For the period, sales charge amounts retained by FDC were as follows:
| | Retained by FDC |
| Class A | $31,977 |
| Class M | 3,633 |
| Class C(a) | 3,878 |
| | $39,488 |
(a) When Class C shares are initially sold, FDC pays commissions from its own resources to financial intermediaries through which the sales are made.
Transfer Agent Fees. Fidelity Investments Institutional Operations Company, Inc., (FIIOC), an affiliate of the investment adviser, is the transfer, dividend disbursing and shareholder servicing agent for each class of the Fund. FIIOC receives account fees and asset-based fees that vary according to the account size and type of account of the shareholders of the respective classes of the Fund, except for Class Z. FIIOC receives an asset-based fee of Class Z's average net assets. FIIOC pays for typesetting, printing and mailing of shareholder reports, except proxy statements.
For the period, transfer agent fees for each class were as follows:
| | Amount | % of Class-Level Average Net Assets |
| Class A | $44,392 | .23 |
| Class M | 25,764 | .26 |
| Class C | 37,951 | .25 |
| Emerging Markets Discovery | 532,258 | .19 |
| Class I | 179,443 | .19 |
| Class Z | 9 | .04(a) |
| | $819,817 | |
(a) Annualized.
Accounting and Security Lending Fees. Fidelity Service Company, Inc. (FSC), an affiliate of the investment adviser, maintains the Fund's accounting records. The accounting fee is based on the level of average net assets for each month. Under a separate contract, FSC administers the security lending program. The security lending fee is based on the number and duration of lending transactions. For the period, the fees were equivalent to an annual rate of .05%.
Brokerage Commissions. The Fund placed a portion of its portfolio transactions with brokerage firms which are affiliates of the investment adviser. Brokerage commissions are included in net realized gain (loss) and change in net unrealized appreciation (depreciation) in the Statement of Operations. The commissions paid to these affiliated firms were $2,074 for the period.
Interfund Lending Program. Pursuant to an Exemptive Order issued by the SEC, the Fund, along with other registered investment companies having management contracts with Fidelity Management & Research Company (FMR) or other affiliated entities of FMR, may participate in an interfund lending program. This program provides an alternative credit facility allowing the funds to borrow from, or lend money to, other participating affiliated funds. At period end, there were no interfund loans outstanding. The Fund's activity in this program during the period for which loans were outstanding was as follows:
| Borrower or Lender | Average Loan Balance | Weighted Average Interest Rate | Interest Expense |
| Borrower | $4,425,667 | 2.14% | $788 |
Interfund Trades. The Fund may purchase from or sell securities to other Fidelity Funds under procedures adopted by the Board. The procedures have been designed to ensure these interfund trades are executed in accordance with Rule 17a-7 of the 1940 Act. Interfund trades are included within the respective purchases and sales amounts shown in the Purchases and Sales of Investments note.
Other. During the period, the investment adviser reimbursed the Fund for certain losses in the amount of $7,543.
7. Committed Line of Credit.
The Fund participates with other funds managed by the investment adviser or an affiliate in a $4.25 billion credit facility (the "line of credit") to be utilized for temporary or emergency purposes to fund shareholder redemptions or for other short-term liquidity purposes. The Fund has agreed to pay commitment fees on its pro-rata portion of the line of credit, which amounted to $1,189 and is reflected in Miscellaneous expenses on the Statement of Operations. During the period, the Fund did not borrow on this line of credit.
8. Security Lending.
The Fund lends portfolio securities through a lending agent from time to time in order to earn additional income. For equity securities, a lending agent is used and may loan securities to certain qualified borrowers, including Fidelity Capital Markets (FCM), a broker-dealer affiliated with the Fund. On the settlement date of the loan, the Fund receives collateral (in the form of U.S. Treasury obligations, letters of credit and/or cash) against the loaned securities and maintains collateral in an amount not less than 100% of the market value of the loaned securities during the period of the loan. The market value of the loaned securities is determined at the close of business of the Fund and any additional required collateral is delivered to the Fund on the next business day. The Fund or borrower may terminate the loan at any time, and if the borrower defaults on its obligation to return the securities loaned because of insolvency or other reasons, the Fund may apply collateral received from the borrower against the obligation. The Fund may experience delays and costs in recovering the securities loaned. Any cash collateral received is invested in the Fidelity Securities Lending Cash Central Fund. The value of loaned securities and cash collateral at period end are disclosed on the Fund's Statement of Assets and Liabilities. At period end, there were no security loans outstanding with FCM. Security lending income represents the income earned on investing cash collateral, less rebates paid to borrowers and any lending agent fees associated with the loan, plus any premium payments received for lending certain types of securities. Security lending income is presented in the Statement of Operations as a component of income from Fidelity Central Funds. Total security lending income during the period amounted to $110,375, including $73 from securities loaned to FCM.
9. Expense Reductions.
The investment adviser contractually agreed to reimburse each class to the extent annual operating expenses exceeded certain levels of class-level average net assets as noted in the table below. This reimbursement will remain in place through February 29, 2020. Some expenses, for example the compensation of the independent Trustees, and certain miscellaneous expenses such as proxy and shareholder meeting expenses, are excluded from this reimbursement.
The following classes were in reimbursement during the period:
| | Expense Limitations | Reimbursement |
| Class Z | 1.30% | $35 |
Commissions paid to certain brokers with whom the investment adviser, or its affiliates, places trades on behalf of the Fund include an amount in addition to trade execution, which may be rebated back to the Fund to offset certain expenses. This amount totaled $173,608 for the period.
In addition, during the period the investment adviser reimbursed and/or waived a portion of fund-level operating expenses in the amount of $4,308.
10. Distributions to Shareholders.
Distributions to shareholders of each class were as follows:
| | Year ended
October 31, 2018 | Year ended
October 31, 2017 |
| Distributions to shareholders | | |
| Class A | $352,909 | $– |
| Class M | 173,255 | – |
| Class C | 250,963 | – |
| Emerging Markets Discovery | 6,626,159 | – |
| Class I | 2,221,929 | – |
| Total | $9,625,215 | $– |
| From net investment income | | |
| Class A | $– | $29,900 |
| Class M | – | 10,789 |
| Class C | – | 1,070 |
| Emerging Markets Discovery | – | 534,294 |
| Class I | – | 83,753 |
| Total | $– | $659,806 |
| From net realized gain | | |
| Class A | $– | $29,370 |
| Class M | – | 15,653 |
| Class C | – | 12,406 |
| Emerging Markets Discovery | – | 375,874 |
| Class I | – | 52,117 |
| Total | $– | $485,420 |
11. Share Transactions.
Share transactions for each class were as follows and may contain automatic conversions between classes or exchanges between affiliated funds:
| | Shares | Shares | Dollars | Dollars |
| | Year ended October 31, 2018 (a) | Year ended October 31, 2017 | Year ended October 31, 2018(a) | Year ended October 31, 2017 |
| Class A | | | | |
| Shares sold | 777,539 | 938,873 | $11,772,607 | $12,644,829 |
| Reinvestment of distributions | 23,808 | 4,936 | 349,501 | 55,853 |
| Shares redeemed | (665,814) | (303,068) | (9,435,862) | (4,070,793) |
| Net increase (decrease) | 135,533 | 640,741 | $2,686,246 | $8,629,889 |
| Class M | | | | |
| Shares sold | 210,943 | 451,879 | $3,284,695 | $5,910,208 |
| Reinvestment of distributions | 11,842 | 2,312 | 173,256 | 26,067 |
| Shares redeemed | (401,523) | (60,393) | (5,504,533) | (796,878) |
| Net increase (decrease) | (178,738) | 393,798 | $(2,046,582) | $5,139,397 |
| Class C | | | | |
| Shares sold | 347,529 | 856,704 | $5,193,330 | $11,379,958 |
| Reinvestment of distributions | 17,450 | 1,203 | 250,411 | 13,340 |
| Shares redeemed | (365,570) | (74,143) | (5,076,684) | (999,641) |
| Net increase (decrease) | (591) | 783,764 | $367,057 | $10,393,657 |
| Emerging Markets Discovery | | | | |
| Shares sold | 10,973,034 | 14,972,932 | $167,396,079 | $202,173,147 |
| Reinvestment of distributions | 427,369 | 74,929 | 6,303,689 | 850,905 |
| Shares redeemed | (12,217,890) | (4,082,672) | (179,945,966) | (56,381,917) |
| Net increase (decrease) | (817,487) | 10,965,189 | $(6,246,198) | $146,642,135 |
| Class I | | | | |
| Shares sold | 3,126,297 | 6,604,470 | $46,808,802 | $89,627,624 |
| Reinvestment of distributions | 148,725 | 11,894 | 2,198,156 | 135,413 |
| Shares redeemed | (4,945,734) | (877,747) | (69,393,677) | (11,209,247) |
| Net increase (decrease) | (1,670,712) | 5,738,617 | $(20,386,719) | $78,553,790 |
| Class Z | | | | |
| Shares sold | 117,308 | – | $1,426,892 | $– |
| Shares redeemed | (875) | – | (10,399) | – |
| Net increase (decrease) | 116,433 | – | $1,416,493 | $– |
(a) Share transactions for Class Z are for the period October 2, 2018 (commencement of sale of shares) to October 31, 2018
12. Other.
The Fund's organizational documents provide former and current trustees and officers with a limited indemnification against liabilities arising in connection with the performance of their duties to the Fund. In the normal course of business, the Fund may also enter into contracts that provide general indemnifications. The Fund's maximum exposure under these arrangements is unknown as this would be dependent on future claims that may be made against the Fund. The risk of material loss from such claims is considered remote.
Fidelity® Total Emerging Markets Fund
Performance: The Bottom Line
Average annual total return reflects the change in the value of an investment, assuming reinvestment of distributions from dividend income and capital gains (the profits earned upon the sale of securities that have grown in value, if any) and assuming a constant rate of performance each year. The hypothetical investment and the average annual total returns do not reflect the deduction of taxes that a shareholder would pay on fund distributions or the redemption of fund shares. During periods of reimbursement by Fidelity, a fund’s total return will be greater than it would be had the reimbursement not occurred. How a fund did yesterday is no guarantee of how it will do tomorrow.
Average Annual Total Returns
| For the periods ended October 31, 2018 | Past 1 year | Past 5 years | Life of fundA |
| Fidelity® Total Emerging Markets Fund | (12.56)% | 2.43% | 3.93% |
A From November 1, 2011
$10,000 Over Life of Fund
Let's say hypothetically that $10,000 was invested in Fidelity® Total Emerging Markets Fund, a class of the fund, on November 1, 2011, when the fund started.
The chart shows how the value of your investment would have changed, and also shows how the MSCI Emerging Markets Index performed over the same period.
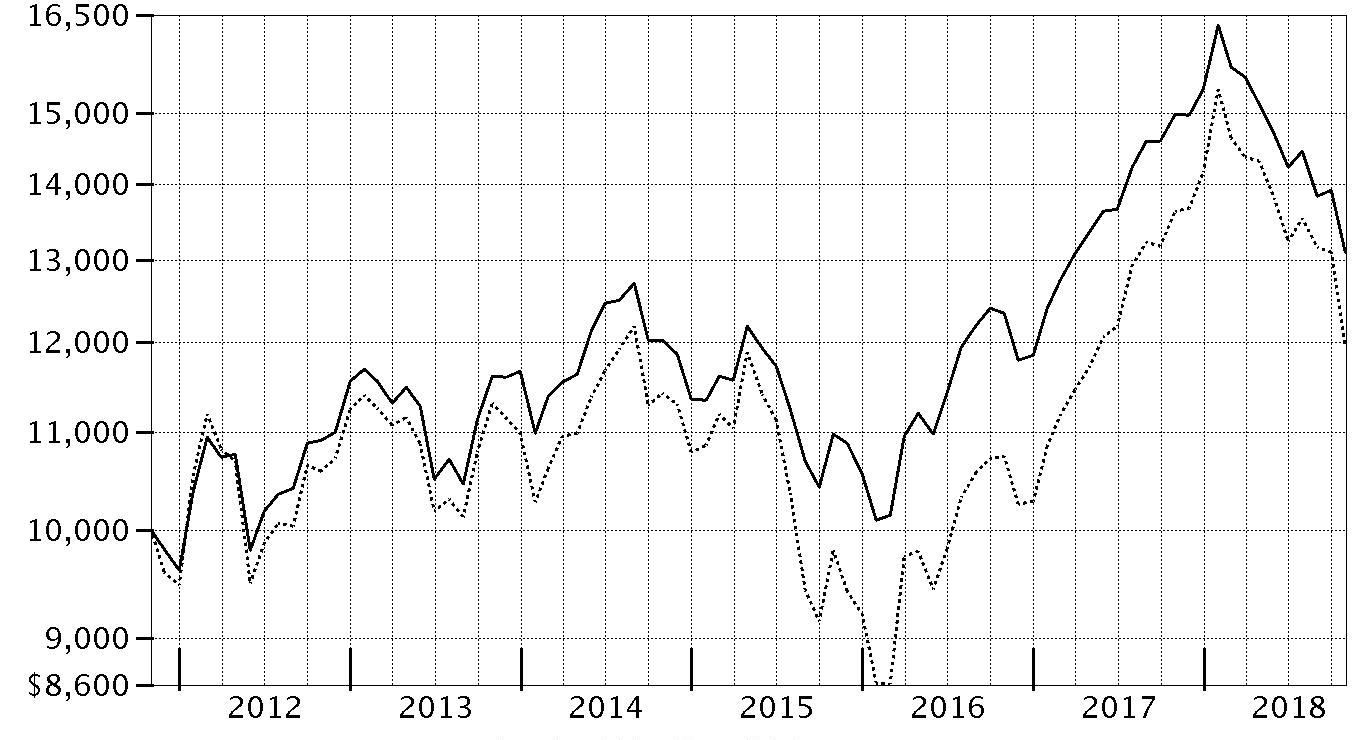
| Period Ending Values |
| $13,102 | Fidelity® Total Emerging Markets Fund |
| $11,958 | MSCI Emerging Markets Index |
Fidelity® Total Emerging Markets Fund
Management's Discussion of Fund Performance
Market Recap: For the 12 months ending October 31, 2018, the Fidelity Total Emerging Markets Composite IndexSM – consisting of 60% equities and 40% debt – returned -9.50%. Separately, emerging-markets (EM) equities returned -12.19%, as measured by the MSCI Emerging Markets Index, while EM debt returned -5.27%, according to the J.P. Morgan Emerging Markets Bond Index Global. Early in the period, both asset classes generally benefited from synchronous expansion in global economic activity, which sustained investors' appetite for risk assets. The U.S. Federal Reserve continued its methodical pace, while central banks in Europe and Japan remained accommodative. However, sentiment shifted sharply in February, amid fear that interest rates could rise faster than expected, as well as heightened uncertainty related to the path of the Fed, increased tension about global trade – especially between the U.S. and China – and an economic slowdown in China. This downtrend continued through September and worsened considerably in October, especially for equities. Among individual countries in the EM equities index, Turkey (-43%) declined most, followed by South Korea (-20%) and China (-17%). Russia was a notable standout (+12%). Looking at debt, Venezuela (-38%) continued to grapple with a deep economic crisis, whereas Thailand gained about 5% and Russia rose 4%.
Comments from Lead Portfolio Manager John Carlson: For the fiscal year, the fund’s share classes (excluding sales charges, if applicable) returned about -13%, lagging the -9.50% result of the Fidelity Total Emerging Markets Composite Index℠. Versus the Composite index, our decision to overweight EM equities and underweight EM debt hurt, as stocks underperformed debt the past 12 months. Security selection within the EM equities subportfolio was the primary relative detractor, as our investments trailed the EM equities index. Here, a sizable position in online publishing and e-book company China Literature, which we established this period, was by far the fund’s biggest individual detractor. The stock fell amid fresh U.S. tariffs and the corresponding depreciation of the Chinese yuan versus the dollar. In August, China Literature reported a decline in user numbers. It also hurt to overweight Chinese software firm Kingsoft. Conversely, the biggest contributor versus the Composite index was security selection within the EM debt subportfolio, led by our choices in Lebanon and Ukraine, with an overweighting in the latter market also helping.
The views expressed above reflect those of the portfolio manager(s) only through the end of the period as stated on the cover of this report and do not necessarily represent the views of Fidelity or any other person in the Fidelity organization. Any such views are subject to change at any time based upon market or other conditions and Fidelity disclaims any responsibility to update such views. These views may not be relied on as investment advice and, because investment decisions for a Fidelity fund are based on numerous factors, may not be relied on as an indication of trading intent on behalf of any Fidelity fund.
Notes to shareholders: On June 30, 2018, Jane Wu assumed portfolio management responsibilities for the fund's health care sleeve, replacing Tim Gannon. On December 1, 2018, Xiaoting Zhao assumed portfolio management responsibilities for the fund's telecommunication services subportfolio, succeeding James Hayes.
Fidelity® Total Emerging Markets Fund
Investment Summary (Unaudited)
Top Five Stocks as of October 31, 2018
| | % of fund's net assets |
| Tencent Holdings Ltd. (Cayman Islands, Interactive Media & Services) | 2.9 |
| Alibaba Group Holding Ltd. sponsored ADR (Cayman Islands, Internet & Direct Marketing Retail) | 2.5 |
| Taiwan Semiconductor Manufacturing Co. Ltd. (Taiwan, Semiconductors & Semiconductor Equipment) | 2.3 |
| Industrial & Commercial Bank of China Ltd. (H Shares) (China, Banks) | 1.7 |
| Sberbank of Russia (Russia, Banks) | 1.4 |
| | 10.8 |
Top Five Market Sectors as of October 31, 2018
| | % of fund's net assets |
| Financials | 17.1 |
| Consumer Discretionary | 9.2 |
| Energy | 8.9 |
| Communication Services | 8.7 |
| Information Technology | 5.4 |
Top Five Countries as of October 31, 2018
| (excluding cash equivalents) | % of fund's net assets |
| Cayman Islands | 10.8 |
| Korea (South) | 7.8 |
| India | 5.9 |
| Brazil | 5.9 |
| China | 5.7 |
Percentages are adjusted for the effect of futures contracts, if applicable.
Asset Allocation (% of fund's net assets)
| As of October 31, 2018 |
| | Stocks | 59.4% |
| | Bonds | 38.3% |
| | Short-Term Investments and Net Other Assets (Liabilities) | 2.3% |

Fidelity® Total Emerging Markets Fund
Schedule of Investments October 31, 2018
Showing Percentage of Net Assets
| Common Stocks - 55.0% | | | |
| | | Shares | Value |
| Argentina - 0.2% | | | |
| Central Puerto SA sponsored ADR | | 32,760 | $313,841 |
| Grupo Financiero Galicia SA sponsored ADR | | 11,100 | 255,966 |
| Inversiones y Representaciones SA ADR | | 6,200 | 82,894 |
| Telecom Argentina SA Class B sponsored ADR | | 17,830 | 322,901 |
|
| TOTAL ARGENTINA | | | 975,602 |
|
| Australia - 0.0% | | | |
| Frontier Digital Ventures Ltd. (a) | | 458,043 | 176,778 |
| Bermuda - 0.6% | | | |
| AGTech Holdings Ltd. (a) | | 1,692,000 | 87,384 |
| Credicorp Ltd. (United States) | | 8,300 | 1,873,393 |
| GP Investments Ltd. Class A (depositary receipt) (a) | | 22,922 | 31,043 |
| Pacific Basin Shipping Ltd. | | 2,479,000 | 540,566 |
| Shangri-La Asia Ltd. | | 814,000 | 1,110,668 |
|
| TOTAL BERMUDA | | | 3,643,054 |
|
| Brazil - 2.6% | | | |
| Azul SA sponsored ADR (a) | | 50,100 | 1,221,438 |
| B2W Companhia Global do Varejo (a) | | 201,017 | 1,863,519 |
| Banco do Brasil SA | | 206,100 | 2,367,533 |
| BR Malls Participacoes SA | | 214,100 | 730,638 |
| BTG Pactual Participations Ltd. unit | | 147,300 | 782,513 |
| Companhia de Saneamento de Minas Gerais | | 79,736 | 1,099,142 |
| Direcional Engenharia SA | | 340,300 | 652,893 |
| Equatorial Energia SA | | 9,040 | 165,156 |
| Localiza Rent A Car SA | | 190,385 | 1,470,796 |
| Natura Cosmeticos SA | | 132,300 | 1,158,580 |
| Petrobras Distribuidora SA | | 193,300 | 1,245,555 |
| Vale SA sponsored ADR | | 200,068 | 3,021,027 |
|
| TOTAL BRAZIL | | | 15,778,790 |
|
| British Virgin Islands - 0.2% | | | |
| Despegar.com Corp. (a) | | 4,800 | 77,136 |
| Mail.Ru Group Ltd. GDR (Reg. S) (a) | | 41,800 | 1,113,552 |
|
| TOTAL BRITISH VIRGIN ISLANDS | | | 1,190,688 |
|
| Canada - 0.2% | | | |
| Pan American Silver Corp. | | 98,700 | 1,448,916 |
| Cayman Islands - 10.8% | | | |
| Airtac International Group | | 97,000 | 834,951 |
| Alibaba Group Holding Ltd. sponsored ADR (a) | | 108,600 | 15,451,608 |
| Ant International Co. Ltd. Class C (b)(c) | | 288,435 | 1,618,120 |
| BeiGene Ltd. ADR (a) | | 2,930 | 369,004 |
| BizLink Holding, Inc. | | 32,587 | 173,668 |
| Chailease Holding Co. Ltd. | | 311,268 | 886,738 |
| China Biologic Products Holdings, Inc. (a) | | 11,191 | 743,530 |
| China Literature Ltd. (a)(d) | | 675,639 | 3,648,750 |
| China Resources Land Ltd. | | 218,920 | 742,580 |
| E-House China Enterprise Holdings Ltd. (a) | | 47,100 | 82,645 |
| ENN Energy Holdings Ltd. | | 81,494 | 692,631 |
| Haitian International Holdings Ltd. | | 423,000 | 825,292 |
| JD.com, Inc. sponsored ADR (a) | | 228,400 | 5,371,968 |
| Kingsoft Corp. Ltd. | | 2,571,000 | 3,639,159 |
| LexinFintech Holdings Ltd. ADR | | 24,300 | 237,654 |
| Meituan Dianping Class B | | 232,600 | 1,503,812 |
| Momo, Inc. ADR (a) | | 48,900 | 1,641,573 |
| NetEase, Inc. ADR | | 17,700 | 3,678,945 |
| PPDAI Group, Inc. ADR (a) | | 42,200 | 240,962 |
| Shenzhou International Group Holdings Ltd. | | 222,000 | 2,451,584 |
| Shimao Property Holdings Ltd. | | 176,200 | 344,673 |
| TAL Education Group ADR (a) | | 12,300 | 356,454 |
| Tencent Holdings Ltd. | | 521,750 | 17,874,771 |
| Uni-President China Holdings Ltd. | | 1,954,600 | 1,896,787 |
| Wise Talent Information Technology Co. Ltd. (a) | | 163,868 | 535,991 |
| Zai Lab Ltd. ADR (a) | | 22,400 | 366,464 |
|
| TOTAL CAYMAN ISLANDS | | | 66,210,314 |
|
| Chile - 0.3% | | | |
| Compania Cervecerias Unidas SA sponsored ADR | | 22,000 | 551,540 |
| Vina Concha y Toro SA | | 567,835 | 1,068,762 |
|
| TOTAL CHILE | | | 1,620,302 |
|
| China - 5.7% | | | |
| BBMG Corp. (H Shares) | | 2,506,000 | 690,257 |
| China International Travel Service Corp. Ltd. (A Shares) | | 230,500 | 1,773,776 |
| China Life Insurance Co. Ltd. (H Shares) | | 1,132,834 | 2,269,971 |
| China Longyuan Power Grid Corp. Ltd. (H Shares) | | 2,283,060 | 1,735,160 |
| China Oilfield Services Ltd. (H Shares) | | 1,492,000 | 1,398,402 |
| China Pacific Insurance (Group) Co. Ltd. (H Shares) | | 385,106 | 1,433,967 |
| China Petroleum & Chemical Corp. (H Shares) | | 3,478,000 | 2,833,096 |
| China Telecom Corp. Ltd. (H Shares) | | 2,028,549 | 957,113 |
| China Tower Corp. Ltd. Class H | | 2,098,000 | 318,367 |
| Hangzhou Tigermed Consulting Co. Ltd. Class A | | 128,000 | 781,874 |
| Industrial & Commercial Bank of China Ltd. (H Shares) | | 15,483,160 | 10,504,907 |
| PICC Property & Casualty Co. Ltd. (H Shares) | | 1,097,870 | 1,063,997 |
| Ping An Insurance (Group) Co. of China Ltd. (H Shares) | | 426,300 | 4,014,595 |
| Qingdao Haier Co. Ltd. | | 495,251 | 898,823 |
| Shanghai International Airport Co. Ltd. (A Shares) | | 169,982 | 1,207,430 |
| Sinopec Engineering Group Co. Ltd. (H Shares) | | 710,500 | 660,492 |
| Sinopharm Group Co. Ltd. (H Shares) | | 197,607 | 952,511 |
| Tonghua Dongbao Pharmaceutical Co. Ltd. Class A | | 175,372 | 336,381 |
| Tsingtao Brewery Co. Ltd. (H Shares) | | 266,000 | 1,049,828 |
| Zhengzhou Yutong Bus Co. Ltd. | | 211,690 | 323,499 |
|
| TOTAL CHINA | | | 35,204,446 |
|
| Egypt - 0.0% | | | |
| Six of October Development & Investment Co. (a) | | 87,200 | 72,504 |
| Greece - 0.3% | | | |
| Titan Cement Co. SA (Reg.) | | 90,100 | 1,983,886 |
| Hong Kong - 2.0% | | | |
| AIA Group Ltd. | | 64,000 | 484,369 |
| China Everbright International Ltd. | | 644,000 | 513,265 |
| China Overseas Land and Investment Ltd. | | 760,460 | 2,380,695 |
| China Resources Beer Holdings Co. Ltd. | | 542,666 | 1,885,711 |
| China Resources Power Holdings Co. Ltd. | | 333,829 | 586,610 |
| China Unicom Ltd. | | 612,300 | 640,435 |
| China Unicom Ltd. sponsored ADR | | 116,520 | 1,215,304 |
| CNOOC Ltd. | | 1,941,000 | 3,305,484 |
| Far East Horizon Ltd. | | 1,297,780 | 1,257,739 |
|
| TOTAL HONG KONG | | | 12,269,612 |
|
| India - 5.9% | | | |
| Adani Ports & Special Economic Zone Ltd. | | 308,703 | 1,330,854 |
| Axis Bank Ltd. (a) | | 292,279 | 2,301,559 |
| Bharti Airtel Ltd. | | 91,812 | 362,916 |
| Bharti Infratel Ltd. | | 70,090 | 255,161 |
| Federal Bank Ltd. | | 913,406 | 1,021,963 |
| Future Retail Ltd. | | 43,774 | 289,509 |
| GAIL India Ltd. | | 32,340 | 163,646 |
| ICICI Bank Ltd. | | 277,392 | 1,330,192 |
| ICICI Bank Ltd. sponsored ADR | | 519,740 | 4,932,333 |
| IndoStar Capital Finance Ltd. | | 71,213 | 290,446 |
| Indraprastha Gas Ltd. | | 283,793 | 1,025,661 |
| ITC Ltd. | | 609,513 | 2,308,337 |
| JK Cement Ltd. (a) | | 71,774 | 652,769 |
| Larsen & Toubro Ltd. | | 101,269 | 1,776,589 |
| LIC Housing Finance Ltd. | | 434,590 | 2,415,629 |
| Lupin Ltd. (a) | | 108,444 | 1,298,293 |
| Manappuram General Finance & Leasing Ltd. | | 757,540 | 818,381 |
| NTPC Ltd. | | 135,420 | 292,318 |
| Oberoi Realty Ltd. | | 130,303 | 745,860 |
| Petronet LNG Ltd. | | 247,706 | 755,912 |
| Phoenix Mills Ltd. | | 106,792 | 799,063 |
| Power Grid Corp. of India Ltd. | | 410,102 | 1,031,077 |
| Reliance Industries Ltd. | | 393,278 | 5,643,135 |
| SREI Infrastructure Finance Ltd. | | 116,223 | 51,936 |
| State Bank of India (a) | | 408,575 | 1,554,530 |
| Sun Pharmaceutical Industries Ltd. | | 208,335 | 1,634,483 |
| Tejas Networks Ltd. (a)(d) | | 27,156 | 93,115 |
| Torrent Pharmaceuticals Ltd. | | 52,269 | 1,178,526 |
|
| TOTAL INDIA | | | 36,354,193 |
|
| Indonesia - 1.4% | | | |
| PT Astra International Tbk | | 3,753,800 | 1,950,667 |
| PT Bank Mandiri (Persero) Tbk | | 3,631,400 | 1,631,667 |
| PT Bank Rakyat Indonesia Tbk | | 14,397,800 | 2,983,264 |
| PT Media Nusantara Citra Tbk | | 14,502,700 | 744,095 |
| PT Semen Gresik (Persero) Tbk | | 448,800 | 265,693 |
| PT Telekomunikasi Indonesia Tbk: | | | |
| Series B | | 3,830,400 | 970,333 |
| sponsored ADR | | 11,160 | 281,232 |
|
| TOTAL INDONESIA | | | 8,826,951 |
|
| Israel - 0.2% | | | |
| Bezeq The Israel Telecommunication Corp. Ltd. | | 858,017 | 986,759 |
| Italy - 0.3% | | | |
| Prada SpA | | 451,200 | 1,593,767 |
| Japan - 0.3% | | | |
| GMO Internet, Inc. | | 5,662 | 80,889 |
| LINE Corp. (a) | | 14,800 | 471,852 |
| Panasonic Corp. | | 45,300 | 486,135 |
| SoftBank Corp. | | 4,882 | 386,356 |
| Yume No Machi Souzou Iinkai Co. Ltd. | | 6,400 | 133,292 |
|
| TOTAL JAPAN | | | 1,558,524 |
|
| Korea (South) - 6.7% | | | |
| AMOREPACIFIC Group, Inc. | | 24,949 | 1,357,873 |
| BS Financial Group, Inc. | | 412,942 | 2,746,915 |
| Cafe24 Corp. (a) | | 1,900 | 184,005 |
| Daou Technology, Inc. | | 59,822 | 1,048,589 |
| Hanon Systems | | 94,781 | 909,599 |
| Hyundai Fire & Marine Insurance Co. Ltd. | | 26,335 | 964,770 |
| Hyundai Mobis | | 26,944 | 4,486,731 |
| Iljin Materials Co. Ltd. | | 13,081 | 521,062 |
| KB Financial Group, Inc. | | 96,868 | 4,028,866 |
| KEPCO Plant Service & Engineering Co. Ltd. | | 6,624 | 159,649 |
| Korea Electric Power Corp. | | 13,402 | 319,720 |
| LG Chemical Ltd. | | 8,180 | 2,487,695 |
| LG Corp. | | 24,712 | 1,435,938 |
| NAVER Corp. | | 6,991 | 701,551 |
| NCSOFT Corp. | | 3,450 | 1,298,663 |
| POSCO | | 9,002 | 2,057,876 |
| S-Oil Corp. | | 11,580 | 1,258,475 |
| Samsung Biologics Co. Ltd. (a)(d) | | 3,319 | 1,127,180 |
| Samsung Electronics Co. Ltd. | | 121,238 | 4,505,251 |
| Samsung Life Insurance Co. Ltd. | | 12,955 | 1,044,575 |
| Samsung SDI Co. Ltd. | | 13,347 | 2,754,793 |
| Shinhan Financial Group Co. Ltd. | | 93,663 | 3,484,123 |
| SK Hynix, Inc. | | 28,802 | 1,721,557 |
| SK Telecom Co. Ltd. | | 1,840 | 431,778 |
| SK Telecom Co. Ltd. sponsored ADR | | 15,560 | 403,160 |
|
| TOTAL KOREA (SOUTH) | | | 41,440,394 |
|
| Luxembourg - 0.4% | | | |
| Samsonite International SA | | 931,500 | 2,672,645 |
| Malaysia - 0.0% | | | |
| British American Tobacco (Malaysia) Bhd | | 30,200 | 224,452 |
| Mauritius - 0.0% | | | |
| MakeMyTrip Ltd. (a) | | 12,600 | 312,354 |
| Mexico - 1.7% | | | |
| America Movil S.A.B. de CV Series L sponsored ADR | | 111,900 | 1,610,241 |
| Fibra Uno Administracion SA de CV | | 788,400 | 847,268 |
| Gruma S.A.B. de CV Series B | | 161,800 | 1,688,632 |
| Grupo Aeroportuario del Pacifico S.A.B. de CV Series B | | 103,800 | 858,730 |
| Grupo Financiero Banorte S.A.B. de CV Series O | | 366,929 | 2,018,780 |
| Macquarie Mexican (REIT) (d) | | 1,029,848 | 1,002,813 |
| Wal-Mart de Mexico SA de CV Series V | | 908,300 | 2,319,796 |
|
| TOTAL MEXICO | | | 10,346,260 |
|
| Netherlands - 0.4% | | | |
| VEON Ltd. sponsored ADR | | 234,960 | 660,238 |
| Yandex NV Series A (a) | | 56,739 | 1,709,546 |
|
| TOTAL NETHERLANDS | | | 2,369,784 |
|
| Nigeria - 0.4% | | | |
| Guaranty Trust Bank PLC | | 3,055,783 | 315,680 |
| Guaranty Trust Bank PLC GDR (Reg. S) | | 124,480 | 634,848 |
| Transnational Corp. of Nigeria PLC | | 41,804,033 | 152,015 |
| Zenith Bank PLC | | 16,686,236 | 1,080,238 |
|
| TOTAL NIGERIA | | | 2,182,781 |
|
| Pakistan - 0.1% | | | |
| Habib Bank Ltd. | | 440,000 | 484,125 |
| Panama - 0.2% | | | |
| Copa Holdings SA Class A | | 14,549 | 1,053,784 |
| Peru - 0.4% | | | |
| Compania de Minas Buenaventura SA sponsored ADR | | 196,200 | 2,715,408 |
| Philippines - 0.5% | | | |
| Metro Pacific Investments Corp. | | 7,261,700 | 652,285 |
| Metropolitan Bank & Trust Co. | | 1,282,492 | 1,573,205 |
| Robinsons Land Corp. | | 1,860,460 | 729,394 |
|
| TOTAL PHILIPPINES | | | 2,954,884 |
|
| Russia - 3.3% | | | |
| Lukoil PJSC sponsored ADR | | 56,600 | 4,228,020 |
| MMC Norilsk Nickel PJSC sponsored ADR | | 116,100 | 1,924,938 |
| Mobile TeleSystems OJSC | | 120,712 | 473,449 |
| Mobile TeleSystems OJSC sponsored ADR | | 59,440 | 476,114 |
| NOVATEK OAO GDR (Reg. S) | | 15,000 | 2,542,500 |
| RusHydro PJSC | | 20 | 0 |
| Sberbank of Russia | | 1,264,400 | 3,634,247 |
| Sberbank of Russia sponsored ADR | | 394,584 | 4,656,091 |
| Tatneft PAO | | 114,500 | 1,363,423 |
| Unipro PJSC | | 20,732,700 | 852,299 |
|
| TOTAL RUSSIA | | | 20,151,081 |
|
| Singapore - 0.2% | | | |
| Ascendas Real Estate Investment Trust | | 179,000 | 325,654 |
| First Resources Ltd. | | 768,900 | 877,062 |
|
| TOTAL SINGAPORE | | | 1,202,716 |
|
| South Africa - 3.2% | | | |
| Barclays Africa Group Ltd. | | 308,050 | 3,113,597 |
| Bidvest Group Ltd. | | 101,156 | 1,260,087 |
| FirstRand Ltd. | | 422,800 | 1,843,096 |
| Impala Platinum Holdings Ltd. (a) | | 13,200 | 24,338 |
| Imperial Holdings Ltd. | | 159,964 | 1,766,462 |
| Mondi Ltd. | | 7,000 | 167,440 |
| Mr Price Group Ltd. | | 61,800 | 967,561 |
| MTN Group Ltd. | | 88,800 | 514,652 |
| Naspers Ltd. Class N | | 46,000 | 8,084,276 |
| Sasol Ltd. | | 55,300 | 1,807,202 |
|
| TOTAL SOUTH AFRICA | | | 19,548,711 |
|
| Taiwan - 3.5% | | | |
| Chroma ATE, Inc. | | 97,000 | 339,933 |
| King's Town Bank | | 962,600 | 918,746 |
| LandMark Optoelectronics Corp. | | 61,000 | 404,887 |
| Largan Precision Co. Ltd. | | 10,403 | 1,125,629 |
| Nanya Technology Corp. | | 222,000 | 368,560 |
| PChome Online, Inc. (a) | | 41,032 | 186,868 |
| Taiwan Semiconductor Manufacturing Co. Ltd. | | 1,587,000 | 11,907,481 |
| Taiwan Semiconductor Manufacturing Co. Ltd. sponsored ADR | | 52,342 | 1,994,230 |
| Unified-President Enterprises Corp. | | 1,555,000 | 3,761,874 |
| United Microelectronics Corp. | | 1,512,000 | 575,870 |
|
| TOTAL TAIWAN | | | 21,584,078 |
|
| Thailand - 0.9% | | | |
| PTT Global Chemical PCL (For. Reg.) | | 841,600 | 1,960,603 |
| Siam Cement PCL (For. Reg.) | | 194,900 | 2,456,821 |
| Total Access Communication PCL (For. Reg.) | | 595,300 | 852,737 |
|
| TOTAL THAILAND | | | 5,270,161 |
|
| Turkey - 0.5% | | | |
| Aselsan A/S | | 171,500 | 775,027 |
| Tupras Turkiye Petrol Rafinerileri A/S | | 75,800 | 1,785,970 |
| Turkcell Iletisim Hizmet A/S | | 102,126 | 207,373 |
| Turkcell Iletisim Hizmet A/S sponsored ADR | | 48,900 | 252,324 |
|
| TOTAL TURKEY | | | 3,020,694 |
|
| United Arab Emirates - 0.7% | | | |
| DP World Ltd. | | 65,059 | 1,170,411 |
| Emaar Properties PJSC | | 1,273,564 | 1,768,285 |
| National Bank of Abu Dhabi PJSC | | 380,780 | 1,432,661 |
|
| TOTAL UNITED ARAB EMIRATES | | | 4,371,357 |
|
| United Kingdom - 0.5% | | | |
| Contemporary Amperex Technology Co. Ltd. ELS (UBS Bank Warrant Program) Class A warrants 6/24/19 (a)(d) | | 51,208 | 546,902 |
| Fresnillo PLC | | 95,000 | 1,030,446 |
| NMC Health PLC | | 26,586 | 1,200,252 |
| Tonghua Dongbao Pharmaceutical Co. Ltd. ELS (UBS Bank Warrant Program) Class A warrants 3/26/19 (a) | | 204,673 | 392,583 |
|
| TOTAL UNITED KINGDOM | | | 3,170,183 |
|
| United States of America - 0.3% | | | |
| Arco Platform Ltd. Class A | | 50 | 1,066 |
| MercadoLibre, Inc. | | 4,801 | 1,557,925 |
| Uxin Ltd. ADR (a) | | 43,700 | 237,728 |
|
| TOTAL UNITED STATES OF AMERICA | | | 1,796,719 |
|
| Vietnam - 0.1% | | | |
| Vietnam Technological & Commercial Joint Stock Bank (a) | | 500,000 | 576,128 |
| TOTAL COMMON STOCKS | | | |
| (Cost $343,907,741) | | | 337,343,785 |
|
| Nonconvertible Preferred Stocks - 4.4% | | | |
| Brazil - 3.3% | | | |
| Ambev SA sponsored ADR | | 347,800 | 1,505,974 |
| Banco do Estado Rio Grande do Sul SA | | 162,820 | 868,898 |
| Companhia Paranaense de Energia-Copel: | | | |
| (PN-B) | | 3,915 | 27,594 |
| (PN-B) sponsored ADR | | 169,752 | 1,189,962 |
| Fibria Celulose SA sponsored ADR | | 128,200 | 2,462,722 |
| Itau Unibanco Holding SA sponsored ADR | | 529,791 | 6,977,347 |
| Metalurgica Gerdau SA (PN) | | 677,470 | 1,445,415 |
| Petroleo Brasileiro SA - Petrobras (PN) sponsored ADR (non-vtg.) | | 307,306 | 4,554,275 |
| Telefonica Brasil SA | | 63,263 | 734,711 |
| TIM Participacoes SA sponsored ADR | | 25,100 | 388,297 |
|
| TOTAL BRAZIL | | | 20,155,195 |
|
| Korea (South) - 1.1% | | | |
| Hyundai Motor Co. Series 2 | | 48,417 | 3,004,315 |
| Samsung Electronics Co. Ltd. | | 74,628 | 2,338,257 |
| Samsung Fire & Marine Insurance Co. Ltd. | | 7,728 | 1,205,595 |
|
| TOTAL KOREA (SOUTH) | | | 6,548,167 |
|
| TOTAL NONCONVERTIBLE PREFERRED STOCKS | | | |
| (Cost $22,858,754) | | | 26,703,362 |
| | | Principal Amount(e) | Value |
|
| Nonconvertible Bonds - 8.1% | | | |
| Azerbaijan - 1.0% | | | |
| Southern Gas Corridor CJSC 6.875% 3/24/26 (d) | | 2,830,000 | 3,035,679 |
| State Oil Co. of Azerbaijan Republic 6.95% 3/18/30 (Reg. S) | | 3,225,000 | 3,419,996 |
|
| TOTAL AZERBAIJAN | | | 6,455,675 |
|
| Bahrain - 0.4% | | | |
| The Oil and Gas Holding Co.: | | | |
| 7.5% 10/25/27 (d) | | 2,155,000 | 2,084,549 |
| 7.625% 11/7/24 (d) | | 200,000 | 200,000 |
| 8.375% 11/7/28 (d) | | 225,000 | 225,000 |
|
| TOTAL BAHRAIN | | | 2,509,549 |
|
| Georgia - 1.2% | | | |
| Georgian Oil & Gas Corp. 6.75% 4/26/21 (d) | | 3,475,000 | 3,535,590 |
| JSC Georgian Railway 7.75% 7/11/22 (d) | | 3,500,000 | 3,694,600 |
|
| TOTAL GEORGIA | | | 7,230,190 |
|
| Mexico - 1.5% | | | |
| Mexico City Airport Trust 4.25% 10/31/26 (d) | | 550,000 | 459,525 |
| Pemex Project Funding Master Trust 6.625% 6/15/35 | | 4,875,000 | 4,460,625 |
| Petroleos Mexicanos 6.5% 6/2/41 | | 5,050,000 | 4,324,315 |
|
| TOTAL MEXICO | | | 9,244,465 |
|
| Mongolia - 0.1% | | | |
| Development Bank of Mongolia 7.25% 10/23/23 (d) | | 230,000 | 224,538 |
| Trade and Development Bank of Mongolia LLC 9.375% 5/19/20 (Reg. S) | | 550,000 | 576,446 |
|
| TOTAL MONGOLIA | | | 800,984 |
|
| Oman - 0.3% | | | |
| Oman Sovereign Sukuk SAOC 4.397% 6/1/24 (d) | | 2,400,000 | 2,260,517 |
| South Africa - 1.0% | | | |
| Eskom Holdings SOC Ltd.: | | | |
| 5.75% 1/26/21 (Reg. S) | | 2,700,000 | 2,585,250 |
| 6.75% 8/6/23 (d) | | 3,725,000 | 3,482,875 |
|
| TOTAL SOUTH AFRICA | | | 6,068,125 |
|
| Turkey - 0.2% | | | |
| Export Credit Bank of Turkey 5% 9/23/21 (d) | | 400,000 | 368,525 |
| Turkiye Ihracat Kredi Bankasi A/S 6.125% 5/3/24 (d) | | 805,000 | 720,475 |
|
| TOTAL TURKEY | | | 1,089,000 |
|
| United Arab Emirates - 0.4% | | | |
| Abu Dhabi Crude Oil Pipeline 4.6% 11/2/47 (d) | | 2,395,000 | 2,264,329 |
| United Kingdom - 1.7% | | | |
| Biz Finance PLC 9.625% 4/27/22 (d) | | 10,200,000 | 10,292,392 |
| Venezuela - 0.3% | | | |
| Petroleos de Venezuela SA: | | | |
| 6% 5/16/24 (d)(f) | | 4,700,000 | 806,050 |
| 6% 11/15/26 (Reg. S) (f) | | 5,500,000 | 948,750 |
|
| TOTAL VENEZUELA | | | 1,754,800 |
|
| TOTAL NONCONVERTIBLE BONDS | | | |
| (Cost $53,539,230) | | | 49,970,026 |
|
| Government Obligations - 30.2% | | | |
| Argentina - 3.6% | | | |
| Argentine Republic: | | | |
| 5.875% 1/11/28 | | 4,980,000 | 3,834,600 |
| 6.875% 4/22/21 | | 4,925,000 | 4,710,763 |
| 7.125% 7/6/36 | | 5,800,000 | 4,410,958 |
| 7.5% 4/22/26 | | 10,760,000 | 9,388,100 |
|
| TOTAL ARGENTINA | | | 22,344,421 |
|
| Armenia - 0.2% | | | |
| Republic of Armenia 7.15% 3/26/25 (d) | | 920,000 | 958,364 |
| Cameroon - 0.7% | | | |
| Cameroon Republic 9.5% 11/19/25 (d) | | 4,350,000 | 4,527,819 |
| Ecuador - 0.6% | | | |
| Ecuador Republic: | | | |
| 7.875% 1/23/28 (d) | | 600,000 | 501,420 |
| 7.95% 6/20/24 (d) | | 770,000 | 688,765 |
| 8.75% 6/2/23 (d) | | 950,000 | 907,250 |
| 8.875% 10/23/27 (d) | | 710,000 | 624,090 |
| 9.625% 6/2/27 (d) | | 200,000 | 183,750 |
| 9.65% 12/13/26 (d) | | 650,000 | 604,500 |
|
| TOTAL ECUADOR | | | 3,509,775 |
|
| Egypt - 2.5% | | | |
| Arab Republic of Egypt: | | | |
| , yield at date of purchase 0% 4/23/19 (b) | EGP | 34,000,000 | 1,733,564 |
| , yield at date of purchase 18.6494% 12/18/18 | EGP | 10,750,000 | 573,563 |
| 5.577% 2/21/23 (d) | | 1,345,000 | 1,283,641 |
| 6.125% 1/31/22 (d) | | 1,575,000 | 1,554,714 |
| 7.5% 1/31/27 (d) | | 2,600,000 | 2,542,332 |
| 7.903% 2/21/48 (d) | | 2,325,000 | 2,079,322 |
| 8.5% 1/31/47 (d) | | 5,575,000 | 5,260,849 |
|
| TOTAL EGYPT | | | 15,027,985 |
|
| El Salvador - 2.0% | | | |
| El Salvador Republic: | | | |
| 6.375% 1/18/27 (d) | | 1,550,000 | 1,385,313 |
| 7.375% 12/1/19 | | 1,375,000 | 1,372,938 |
| 7.625% 2/1/41 (d) | | 2,050,000 | 1,859,596 |
| 7.65% 6/15/35 (Reg. S) | | 3,000,000 | 2,748,750 |
| 8.625% 2/28/29 (d) | | 4,910,000 | 4,995,925 |
|
| TOTAL EL SALVADOR | | | 12,362,522 |
|
| Ethiopia - 0.5% | | | |
| Federal Democratic Republic of Ethiopia 6.625% 12/11/24 (d) | | 3,115,000 | 3,022,422 |
| Gabon - 0.1% | | | |
| Gabonese Republic 6.375% 12/12/24 (d) | | 1,000,000 | 908,540 |
| Ghana - 0.8% | | | |
| Ghana Republic: | | | |
| 7.875% 8/7/23 (Reg.S) | | 750,000 | 764,123 |
| 8.125% 1/18/26 (d) | | 1,375,000 | 1,381,399 |
| 8.627% 6/16/49 (d) | | 2,170,000 | 2,035,573 |
| 10.75% 10/14/30 (d) | | 825,000 | 988,994 |
|
| TOTAL GHANA | | | 5,170,089 |
|
| Iraq - 0.8% | | | |
| Republic of Iraq 5.8% 1/15/28 (Reg. S) | | 5,650,000 | 5,175,332 |
| Ivory Coast - 0.4% | | | |
| Ivory Coast 5.75% 12/31/32 | | 2,405,000 | 2,177,160 |
| Jordan - 1.3% | | | |
| Jordanian Kingdom: | | | |
| 6.125% 1/29/26 (d) | | 4,200,000 | 4,016,880 |
| 7.375% 10/10/47 (d) | | 4,310,000 | 3,901,240 |
|
| TOTAL JORDAN | | | 7,918,120 |
|
| Lebanon - 4.5% | | | |
| Lebanese Republic: | | | |
| 5.45% 11/28/19 | | 7,050,000 | 6,792,957 |
| 6% 5/20/19 | | 7,535,000 | 7,425,471 |
| 6.1% 10/4/22 | | 4,535,000 | 3,952,797 |
| 6.375% 3/9/20 | | 7,375,000 | 7,093,983 |
| 6.65% 11/3/28(Reg. S) | | 1,500,000 | 1,184,502 |
| 8.25% 4/12/21 (Reg.S) | | 1,445,000 | 1,382,923 |
|
| TOTAL LEBANON | | | 27,832,633 |
|
| Nigeria - 0.5% | | | |
| Republic of Nigeria, yield at date of purchase 0% 12/6/18 (b) | NGN | 1,225,000,000 | 3,331,706 |
| Oman - 0.9% | | | |
| Sultanate of Oman: | | | |
| 6.5% 3/8/47 (d) | | 780,000 | 696,150 |
| 6.75% 1/17/48 (d) | | 4,950,000 | 4,516,875 |
|
| TOTAL OMAN | | | 5,213,025 |
|
| Qatar - 1.5% | | | |
| State of Qatar: | | | |
| 4.5% 4/23/28 (d) | | 2,705,000 | 2,759,100 |
| 5.103% 4/23/48 (d) | | 1,425,000 | 1,446,375 |
| 9.75% 6/15/30 (Reg. S) | | 3,280,000 | 4,852,957 |
|
| TOTAL QATAR | | | 9,058,432 |
|
| Rwanda - 0.6% | | | |
| Rwanda Republic 6.625% 5/2/23 (d) | | 3,475,000 | 3,495,329 |
| Suriname - 0.9% | | | |
| Republic of Suriname 9.25% 10/26/26 (d) | | 5,700,000 | 5,600,250 |
| TAJIKISTAN - 0.3% | | | |
| Tajikistan Republic 7.125% 9/14/27 (d) | | 2,175,000 | 1,936,838 |
| Turkey - 2.4% | | | |
| Turkish Republic: | | | |
| 5.125% 2/17/28 | | 795,000 | 670,781 |
| 5.75% 5/11/47 | | 2,300,000 | 1,742,250 |
| 6.875% 3/17/36 | | 2,275,000 | 2,022,589 |
| 7.25% 3/5/38 | | 950,000 | 873,620 |
| 7.375% 2/5/25 | | 1,050,000 | 1,040,714 |
| 8% 2/14/34 | | 905,000 | 898,949 |
| Turkiye Ihracat Kredi Bankasi A/S 5.375% 2/8/21 (d) | | 7,675,000 | 7,268,302 |
|
| TOTAL TURKEY | | | 14,517,205 |
|
| Ukraine - 1.1% | | | |
| Ukraine Government: | | | |
| 7.75% 9/1/20 (d) | | 2,300,000 | 2,288,500 |
| 7.75% 9/1/21 (d) | | 4,455,000 | 4,382,428 |
|
| TOTAL UKRAINE | | | 6,670,928 |
|
| United States of America - 3.5% | | | |
| U.S. Treasury Bonds 3% 8/15/48 | | 23,000,000 | 21,328,900 |
| Venezuela - 0.3% | | | |
| Venezuelan Republic 9.25% 9/15/27 (f) | | 7,500,000 | 1,893,750 |
| Zambia - 0.2% | | | |
| Republic of Zambia 8.97% 7/30/27 (d) | | 1,600,000 | 1,086,400 |
| TOTAL GOVERNMENT OBLIGATIONS | | | |
| (Cost $195,180,691) | | | 185,067,945 |
| | | Shares | Value |
|
| Money Market Funds - 1.9% | | | |
| Fidelity Cash Central Fund, 2.23% (g) | | | |
| (Cost $11,923,534) | | 11,921,364 | 11,923,749 |
| TOTAL INVESTMENT IN SECURITIES - 99.6% | | | |
| (Cost $627,409,950) | | | 611,008,867 |
| NET OTHER ASSETS (LIABILITIES) - 0.4% | | | 2,666,345 |
| NET ASSETS - 100% | | | $613,675,212 |
Currency Abbreviations
EGP – Egyptian pound
NGN – Nigerian naira
Security Type Abbreviations
ELS – Equity-Linked Security
Categorizations in the Schedule of Investments are based on country or territory of incorporation.
Legend
(a) Non-income producing
(b) Level 3 security
(c) Restricted securities - Investment in securities not registered under the Securities Act of 1933 (excluding 144A issues). At the end of the period, the value of restricted securities (excluding 144A issues) amounted to $1,618,120 or 0.3% of net assets.
(d) Security exempt from registration under Rule 144A of the Securities Act of 1933. These securities may be resold in transactions exempt from registration, normally to qualified institutional buyers. At the end of the period, the value of these securities amounted to $121,762,649 or 19.8% of net assets.
(e) Amount is stated in United States dollars unless otherwise noted.
(f) Non-income producing - Security is in default.
(g) Affiliated fund that is generally available only to investment companies and other accounts managed by Fidelity Investments. The rate quoted is the annualized seven-day yield of the fund at period end. A complete unaudited listing of the fund's holdings as of its most recent quarter end is available upon request. In addition, each Fidelity Central Fund's financial statements, which are not covered by the Fund's Report of Independent Registered Public Accounting Firm, are available on the SEC's website or upon request.
Additional information on each restricted holding is as follows:
| Security | Acquisition Date | Acquisition Cost |
| Ant International Co. Ltd. Class C | 5/16/18 | $1,618,120 |
Affiliated Central Funds
Information regarding fiscal year to date income earned by the Fund from investments in Fidelity Central Funds is as follows:
| Fund | Income earned |
| Fidelity Cash Central Fund | $482,817 |
| Fidelity Securities Lending Cash Central Fund | 14,284 |
| Total | $497,101 |
Amounts in the income column in the above table include any capital gain distributions from underlying funds, which are presented in the corresponding line-item in the Statement of Operations if applicable.
Investment Valuation
The following is a summary of the inputs used, as of October 31, 2018, involving the Fund's assets and liabilities carried at fair value. The inputs or methodology used for valuing securities may not be an indication of the risk associated with investing in those securities. For more information on valuation inputs, and their aggregation into the levels used below, please refer to the Investment Valuation section in the accompanying Notes to Financial Statements.
| | Valuation Inputs at Reporting Date: |
| Description | Total | Level 1 | Level 2 | Level 3 |
| Investments in Securities: | | | | |
| Equities: | | | | |
| Communication Services | $50,702,408 | $29,453,434 | $21,248,974 | $-- |
| Consumer Discretionary | 57,313,702 | 56,827,567 | 486,135 | -- |
| Consumer Staples | 21,655,208 | 21,655,208 | -- | -- |
| Energy | 29,668,692 | 23,530,112 | 6,138,580 | -- |
| Financials | 93,280,137 | 65,456,679 | 27,823,458 | -- |
| Health Care | 9,988,498 | 9,988,498 | -- | -- |
| Industrials | 17,592,466 | 17,592,466 | -- | -- |
| Information Technology | 33,322,666 | 20,839,315 | 12,483,351 | -- |
| Materials | 28,603,452 | 24,738,374 | 3,865,078 | -- |
| Real Estate | 12,273,086 | 10,654,966 | -- | 1,618,120 |
| Utilities | 9,646,832 | 9,327,112 | 319,720 | -- |
| Corporate Bonds | 49,970,026 | -- | 49,970,026 | -- |
| Government Obligations | 185,067,945 | -- | 180,002,675 | 5,065,270 |
| Money Market Funds | 11,923,749 | 11,923,749 | -- | -- |
| Total Investments in Securities: | $611,008,867 | $301,987,480 | $302,337,997 | $6,683,390 |
The following is a summary of transfers between Level 1 and Level 2 for the period ended October 31, 2018. Transfers are assumed to have occurred at the beginning of the period, and are primarily attributable to the valuation techniques used for foreign equity securities, as discussed in the accompanying Notes to Financial Statements:
| Transfers | Total |
| Level 1 to Level 2 | $12,616,876 |
| Level 2 to Level 1 | $30,780 |
The following is a reconciliation of Investments in Securities and Derivative Instruments for which Level 3 inputs were used in determining value:
| Investments in Securities | |
| Beginning Balance | $-- |
| Net Realized Gain (Loss) on Investment Securities | -- |
| Net Unrealized Gain (Loss) on Investment Securities | (20,073) |
| Cost of Purchases | 6,605,763 |
| Proceeds of Sales | -- |
| Amortization/Accretion | 97,700 |
| Transfers into Level 3 | -- |
| Transfers out of Level 3 | -- |
| Ending Balance | $6,683,390 |
| The change in unrealized gain (loss) for the period attributable to Level 3 securities held at October 31, 2018 | $(20,073) |
The information used in the above reconciliation represents fiscal year to date activity for any Investments in Securities identified as using Level 3 inputs at either the beginning or the end of the current fiscal period. Transfers in or out of Level 3 represent the beginning value of any Security or Instrument where a change in the pricing level occurred from the beginning to the end of the period. The cost of purchases and the proceeds of sales may include securities received or delivered through corporate actions or exchanges. Realized and unrealized gains (losses) disclosed in the reconciliation are included in Net Gain (Loss) on the Fund's Statement of Operations.
Other Information
The composition of credit quality ratings as a percentage of Total Net Assets is as follows (Unaudited):
| U.S. Government and U.S. Government Agency Obligations | 3.5% |
| AAA,AA,A | 1.9% |
| BBB | 2.7% |
| BB | 2.2% |
| B | 21.3% |
| CCC,CC,C | 3.1% |
| D | 0.3% |
| Not Rated | 3.3% |
| Equities | 59.4% |
| Short-Term Investments and Net Other Assets | 2.3% |
| | 100% |
We have used ratings from Moody's Investors Service, Inc. Where Moody's® ratings are not available, we have used S&P® ratings. All ratings are as of the date indicated and do not reflect subsequent changes.
See accompanying notes which are an integral part of the financial statements.
Fidelity® Total Emerging Markets Fund
Financial Statements
Statement of Assets and Liabilities
| | | October 31, 2018 |
| Assets | | |
Investment in securities, at value — See accompanying schedule:
Unaffiliated issuers (cost $615,486,416) | $599,085,118 | |
| Fidelity Central Funds (cost $11,923,534) | 11,923,749 | |
| Total Investment in Securities (cost $627,409,950) | | $611,008,867 |
| Foreign currency held at value (cost $267,647) | | 267,579 |
| Receivable for investments sold | | 11,499,064 |
| Receivable for fund shares sold | | 596,476 |
| Dividends receivable | | 313,277 |
| Interest receivable | | 3,713,299 |
| Distributions receivable from Fidelity Central Funds | | 20,848 |
| Prepaid expenses | | 1,583 |
| Receivable from investment adviser for expense reductions | | 6 |
| Other receivables | | 160,185 |
| Total assets | | 627,581,184 |
| Liabilities | | |
| Payable to custodian bank | $2,012,767 | |
| Payable for investments purchased | 8,479,700 | |
| Payable for fund shares redeemed | 2,502,338 | |
| Accrued management fee | 429,574 | |
| Distribution and service plan fees payable | 43,390 | |
| Other affiliated payables | 139,654 | |
| Other payables and accrued expenses | 298,549 | |
| Total liabilities | | 13,905,972 |
| Net Assets | | $613,675,212 |
| Net Assets consist of: | | |
| Paid in capital | | $650,415,262 |
| Total distributable earnings (loss) | | (36,740,050) |
| Net Assets | | $613,675,212 |
| Net Asset Value and Maximum Offering Price | | |
| Class A: | | |
| Net Asset Value and redemption price per share ($34,616,978 ÷ 3,002,951 shares) | | $11.53 |
| Maximum offering price per share (100/94.25 of $11.53) | | $12.23 |
| Class M: | | |
| Net Asset Value and redemption price per share ($8,519,165 ÷ 740,374 shares) | | $11.51 |
| Maximum offering price per share (100/96.50 of $11.51) | | $11.93 |
| Class C: | | |
| Net Asset Value and offering price per share ($37,191,297 ÷ 3,262,408 shares)(a) | | $11.40 |
| Total Emerging Markets: | | |
| Net Asset Value, offering price and redemption price per share ($190,024,761 ÷ 16,431,469 shares) | | $11.56 |
| Class I: | | |
| Net Asset Value, offering price and redemption price per share ($341,719,745 ÷ 29,588,536 shares) | | $11.55 |
| Class Z: | | |
| Net Asset Value, offering price and redemption price per share ($1,603,266 ÷ 138,847 shares) | | $11.55 |
(a) Redemption price per share is equal to net asset value less any applicable contingent deferred sales charge.
See accompanying notes which are an integral part of the financial statements.
Statement of Operations
| | | Year ended October 31, 2018 |
| Investment Income | | |
| Dividends | | $13,893,002 |
| Interest | | 13,731,236 |
| Income from Fidelity Central Funds | | 497,101 |
| Income before foreign taxes withheld | | 28,121,339 |
| Less foreign taxes withheld | | (1,549,046) |
| Total income | | 26,572,293 |
| Expenses | | |
| Management fee | $6,374,320 | |
| Transfer agent fees | 1,512,997 | |
| Distribution and service plan fees | 582,621 | |
| Accounting and security lending fees | 386,433 | |
| Custodian fees and expenses | 569,740 | |
| Independent trustees' fees and expenses | 4,050 | |
| Registration fees | 127,543 | |
| Audit | 103,667 | |
| Legal | 10,142 | |
| Interest | 832 | |
| Miscellaneous | 4,783 | |
| Total expenses before reductions | 9,677,128 | |
| Expense reductions | (203,988) | |
| Total expenses after reductions | | 9,473,140 |
| Net investment income (loss) | | 17,099,153 |
| Realized and Unrealized Gain (Loss) | | |
| Net realized gain (loss) on: | | |
| Investment securities: | | |
| Unaffiliated issuers | (26,990,776) | |
| Fidelity Central Funds | 1,326 | |
| Foreign currency transactions | (388,008) | |
| Futures contracts | (1,298,975) | |
| Total net realized gain (loss) | | (28,676,433) |
| Change in net unrealized appreciation (depreciation) on: | | |
| Investment securities: | | |
| Unaffiliated issuers (net of decrease in deferred foreign taxes of $653,550) | (97,165,034) | |
| Fidelity Central Funds | (1,505) | |
| Assets and liabilities in foreign currencies | (30,935) | |
| Total change in net unrealized appreciation (depreciation) | | (97,197,474) |
| Net gain (loss) | | (125,873,907) |
| Net increase (decrease) in net assets resulting from operations | | $(108,774,754) |
See accompanying notes which are an integral part of the financial statements.
Statement of Changes in Net Assets
| | Year ended October 31, 2018 | Year ended October 31, 2017 |
| Increase (Decrease) in Net Assets | | |
| Operations | | |
| Net investment income (loss) | $17,099,153 | $9,051,354 |
| Net realized gain (loss) | (28,676,433) | 10,774,070 |
| Change in net unrealized appreciation (depreciation)�� | (97,197,474) | 71,398,614 |
| Net increase (decrease) in net assets resulting from operations | (108,774,754) | 91,224,038 |
| Distributions to shareholders | (20,273,542) | – |
| Distributions to shareholders from net investment income | – | (1,957,793) |
| Distributions to shareholders from net realized gain | – | (138,064) |
| Total distributions | (20,273,542) | (2,095,857) |
| Share transactions - net increase (decrease) | 13,246,904 | 485,742,909 |
| Redemption fees | 23,374 | 215,914 |
| Total increase (decrease) in net assets | (115,778,018) | 575,087,004 |
| Net Assets | | |
| Beginning of period | 729,453,230 | 154,366,226 |
| End of period | $613,675,212 | $729,453,230 |
| Other Information | | |
| Undistributed net investment income end of period | | $8,176,283 |
See accompanying notes which are an integral part of the financial statements.
Financial Highlights
Fidelity Total Emerging Markets Fund Class A
| Years ended October 31, | 2018 | 2017 | 2016 | 2015 | 2014 |
| Selected Per–Share Data | | | | | |
| Net asset value, beginning of period | $13.56 | $11.33 | $10.35 | $11.56 | $11.37 |
| Income from Investment Operations | | | | | |
| Net investment income (loss)A | .25 | .24 | .26 | .28 | .18 |
| Net realized and unrealized gain (loss) | (1.94) | 2.11 | .96 | (1.30) | .19 |
| Total from investment operations | (1.69) | 2.35 | 1.22 | (1.02) | .37 |
| Distributions from net investment income | (.16) | (.12) | (.24) | (.17) | (.18) |
| Distributions from net realized gain | (.19) | (.01) | – | (.02) | – |
| Total distributions | (.34)B | (.13) | (.24) | (.19) | (.18) |
| Redemption fees added to paid in capitalA | –C | .01 | –C | –C | –C |
| Net asset value, end of period | $11.53 | $13.56 | $11.33 | $10.35 | $11.56 |
| Total ReturnD,E | (12.77)% | 21.13% | 12.13% | (8.92)% | 3.30% |
| Ratios to Average Net AssetsF,G | | | | | |
| Expenses before reductions | 1.40% | 1.47% | 1.87% | 1.93% | 1.98% |
| Expenses net of fee waivers, if any | 1.40% | 1.47% | 1.65% | 1.65% | 1.65% |
| Expenses net of all reductions | 1.37% | 1.46% | 1.64% | 1.64% | 1.65% |
| Net investment income (loss) | 1.92% | 1.97% | 2.47% | 2.58% | 1.61% |
| Supplemental Data | | | | | |
| Net assets, end of period (000 omitted) | $34,617 | $42,213 | $15,206 | $10,164 | $13,627 |
| Portfolio turnover rateH | 94% | 59% | 57% | 80% | 102% |
A Calculated based on average shares outstanding during the period.
B Total distributions of $.34 per share is comprised of distributions from net investment income of $.157 and distributions from net realized gain of $.185 per share.
C Amount represents less than $.005 per share.
D Total returns would have been lower if certain expenses had not been reduced during the applicable periods shown.
E Total returns do not include the effect of the sales charges.
F Fees and expenses of any underlying Fidelity Central Funds are not included in the Fund's expense ratio. The Fund indirectly bears its proportionate share of the expenses of any underlying Fidelity Central Funds.
G Expense ratios reflect operating expenses of the class. Expenses before reductions do not reflect amounts reimbursed by the investment adviser or reductions from brokerage service arrangements or reductions from other expense offset arrangements and do not represent the amount paid by the class during periods when reimbursements or reductions occur. Expenses net of fee waivers reflect expenses after reimbursement by the investment adviser but prior to reductions from brokerage service arrangements or other expense offset arrangements. Expenses net of all reductions represent the net expenses paid by the class.
H Amount does not include the portfolio activity of any underlying Fidelity Central Funds.
See accompanying notes which are an integral part of the financial statements.
Fidelity Total Emerging Markets Fund Class M
| Years ended October 31, | 2018 | 2017 | 2016 | 2015 | 2014 |
| Selected Per–Share Data | | | | | |
| Net asset value, beginning of period | $13.55 | $11.33 | $10.33 | $11.54 | $11.34 |
| Income from Investment Operations | | | | | |
| Net investment income (loss)A | .21 | .20 | .23 | .25 | .15 |
| Net realized and unrealized gain (loss) | (1.93) | 2.11 | .97 | (1.30) | .19 |
| Total from investment operations | (1.72) | 2.31 | 1.20 | (1.05) | .34 |
| Distributions from net investment income | (.13) | (.09) | (.20) | (.14) | (.14) |
| Distributions from net realized gain | (.19) | (.01) | – | (.02) | – |
| Total distributions | (.32) | (.10) | (.20) | (.16) | (.14) |
| Redemption fees added to paid in capitalA | –B | .01 | –B | –B | –B |
| Net asset value, end of period | $11.51 | $13.55 | $11.33 | $10.33 | $11.54 |
| Total ReturnC,D | (13.03)% | 20.66% | 11.92% | (9.18)% | 3.04% |
| Ratios to Average Net AssetsE,F | | | | | |
| Expenses before reductions | 1.74% | 1.82% | 2.22% | 2.27% | 2.32% |
| Expenses net of fee waivers, if any | 1.74% | 1.82% | 1.90% | 1.90% | 1.90% |
| Expenses net of all reductions | 1.71% | 1.81% | 1.90% | 1.89% | 1.90% |
| Net investment income (loss) | 1.58% | 1.62% | 2.22% | 2.33% | 1.36% |
| Supplemental Data | | | | | |
| Net assets, end of period (000 omitted) | $8,519 | $8,751 | $3,019 | $3,331 | $5,277 |
| Portfolio turnover rateG | 94% | 59% | 57% | 80% | 102% |
A Calculated based on average shares outstanding during the period.
B Amount represents less than $.005 per share.
C Total returns would have been lower if certain expenses had not been reduced during the applicable periods shown.
D Total returns do not include the effect of the sales charges.
E Fees and expenses of any underlying Fidelity Central Funds are not included in the Fund's expense ratio. The Fund indirectly bears its proportionate share of the expenses of any underlying Fidelity Central Funds.
F Expense ratios reflect operating expenses of the class. Expenses before reductions do not reflect amounts reimbursed by the investment adviser or reductions from brokerage service arrangements or reductions from other expense offset arrangements and do not represent the amount paid by the class during periods when reimbursements or reductions occur. Expenses net of fee waivers reflect expenses after reimbursement by the investment adviser but prior to reductions from brokerage service arrangements or other expense offset arrangements. Expenses net of all reductions represent the net expenses paid by the class.
G Amount does not include the portfolio activity of any underlying Fidelity Central Funds.
See accompanying notes which are an integral part of the financial statements.
Fidelity Total Emerging Markets Fund Class C
| Years ended October 31, | 2018 | 2017 | 2016 | 2015 | 2014 |
| Selected Per–Share Data | | | | | |
| Net asset value, beginning of period | $13.45 | $11.25 | $10.25 | $11.47 | $11.29 |
| Income from Investment Operations | | | | | |
| Net investment income (loss)A | .15 | .15 | .18 | .20 | .10 |
| Net realized and unrealized gain (loss) | (1.92) | 2.11 | .97 | (1.30) | .19 |
| Total from investment operations | (1.77) | 2.26 | 1.15 | (1.10) | .29 |
| Distributions from net investment income | (.09) | (.06) | (.15) | (.10) | (.11) |
| Distributions from net realized gain | (.19) | (.01) | – | (.02) | – |
| Total distributions | (.28) | (.07) | (.15) | (.12) | (.11) |
| Redemption fees added to paid in capitalA | –B | .01 | –B | –B | –B |
| Net asset value, end of period | $11.40 | $13.45 | $11.25 | $10.25 | $11.47 |
| Total ReturnC,D | (13.45)% | 20.29% | 11.36% | (9.68)% | 2.56% |
| Ratios to Average Net AssetsE,F | | | | | |
| Expenses before reductions | 2.14% | 2.21% | 2.62% | 2.68% | 2.72% |
| Expenses net of fee waivers, if any | 2.14% | 2.21% | 2.40% | 2.40% | 2.40% |
| Expenses net of all reductions | 2.12% | 2.20% | 2.39% | 2.39% | 2.40% |
| Net investment income (loss) | 1.18% | 1.23% | 1.72% | 1.83% | .86% |
| Supplemental Data | | | | | |
| Net assets, end of period (000 omitted) | $37,191 | $34,869 | $10,710 | $7,736 | $10,104 |
| Portfolio turnover rateG | 94% | 59% | 57% | 80% | 102% |
A Calculated based on average shares outstanding during the period.
B Amount represents less than $.005 per share.
C Total returns would have been lower if certain expenses had not been reduced during the applicable periods shown.
D Total returns do not include the effect of the contingent deferred sales charge.
E Fees and expenses of any underlying Fidelity Central Funds are not included in the Fund's expense ratio. The Fund indirectly bears its proportionate share of the expenses of any underlying Fidelity Central Funds.
F Expense ratios reflect operating expenses of the class. Expenses before reductions do not reflect amounts reimbursed by the investment adviser or reductions from brokerage service arrangements or reductions from other expense offset arrangements and do not represent the amount paid by the class during periods when reimbursements or reductions occur. Expenses net of fee waivers reflect expenses after reimbursement by the investment adviser but prior to reductions from brokerage service arrangements or other expense offset arrangements. Expenses net of all reductions represent the net expenses paid by the class.
G Amount does not include the portfolio activity of any underlying Fidelity Central Funds.
See accompanying notes which are an integral part of the financial statements.
Fidelity Total Emerging Markets Fund
| Years ended October 31, | 2018 | 2017 | 2016 | 2015 | 2014 |
| Selected Per–Share Data | | | | | |
| Net asset value, beginning of period | $13.58 | $11.34 | $10.38 | $11.60 | $11.40 |
| Income from Investment Operations | | | | | |
| Net investment income (loss)A | .29 | .27 | .28 | .31 | .21 |
| Net realized and unrealized gain (loss) | (1.95) | 2.10 | .97 | (1.31) | .19 |
| Total from investment operations | (1.66) | 2.37 | 1.25 | (1.00) | .40 |
| Distributions from net investment income | (.17) | (.14) | (.29) | (.20) | (.20) |
| Distributions from net realized gain | (.19) | (.01) | – | (.02) | – |
| Total distributions | (.36) | (.14)B | (.29) | (.22) | (.20) |
| Redemption fees added to paid in capitalA | –C | .01 | –C | –C | –C |
| Net asset value, end of period | $11.56 | $13.58 | $11.34 | $10.38 | $11.60 |
| Total ReturnD | (12.56)% | 21.37% | 12.44% | (8.74)% | 3.56% |
| Ratios to Average Net AssetsE,F | | | | | |
| Expenses before reductions | 1.13% | 1.26% | 1.62% | 1.72% | 1.73% |
| Expenses net of fee waivers, if any | 1.13% | 1.26% | 1.40% | 1.40% | 1.40% |
| Expenses net of all reductions | 1.11% | 1.24% | 1.39% | 1.39% | 1.40% |
| Net investment income (loss) | 2.19% | 2.18% | 2.72% | 2.83% | 1.86% |
| Supplemental Data | | | | | |
| Net assets, end of period (000 omitted) | $190,025 | $272,002 | $104,332 | $37,918 | $45,763 |
| Portfolio turnover rateG | 94% | 59% | 57% | 80% | 102% |
A Calculated based on average shares outstanding during the period.
B Total distributions of $.14 per share is comprised of distributions from net investment income of $.135 and distributions from net realized gain of $.009 per share.
C Amount represents less than $.005 per share.
D Total returns would have been lower if certain expenses had not been reduced during the applicable periods shown.
E Fees and expenses of any underlying Fidelity Central Funds are not included in the Fund's expense ratio. The Fund indirectly bears its proportionate share of the expenses of any underlying Fidelity Central Funds.
F Expense ratios reflect operating expenses of the class. Expenses before reductions do not reflect amounts reimbursed by the investment adviser or reductions from brokerage service arrangements or reductions from other expense offset arrangements and do not represent the amount paid by the class during periods when reimbursements or reductions occur. Expenses net of fee waivers reflect expenses after reimbursement by the investment adviser but prior to reductions from brokerage service arrangements or other expense offset arrangements. Expenses net of all reductions represent the net expenses paid by the class.
G Amount does not include the portfolio activity of any underlying Fidelity Central Funds.
See accompanying notes which are an integral part of the financial statements.
Fidelity Total Emerging Markets Fund Class I
| Years ended October 31, | 2018 | 2017 | 2016 | 2015 | 2014 |
| Selected Per–Share Data | | | | | |
| Net asset value, beginning of period | $13.58 | $11.33 | $10.37 | $11.59 | $11.40 |
| Income from Investment Operations | | | | | |
| Net investment income (loss)A | .29 | .28 | .29 | .31 | .21 |
| Net realized and unrealized gain (loss) | (1.95) | 2.11 | .96 | (1.31) | .18 |
| Total from investment operations | (1.66) | 2.39 | 1.25 | (1.00) | .39 |
| Distributions from net investment income | (.19) | (.14) | (.29) | (.20) | (.20) |
| Distributions from net realized gain | (.19) | (.01) | – | (.02) | – |
| Total distributions | (.37)B | (.15) | (.29) | (.22) | (.20) |
| Redemption fees added to paid in capitalA | –C | .01 | –C | –C | –C |
| Net asset value, end of period | $11.55 | $13.58 | $11.33 | $10.37 | $11.59 |
| Total ReturnD | (12.56)% | 21.51% | 12.48% | (8.74)% | 3.51% |
| Ratios to Average Net AssetsE,F | | | | | |
| Expenses before reductions | 1.12% | 1.19% | 1.54% | 1.58% | 1.71% |
| Expenses net of fee waivers, if any | 1.12% | 1.19% | 1.40% | 1.40% | 1.40% |
| Expenses net of all reductions | 1.10% | 1.17% | 1.39% | 1.39% | 1.40% |
| Net investment income (loss) | 2.20% | 2.25% | 2.72% | 2.83% | 1.86% |
| Supplemental Data | | | | | |
| Net assets, end of period (000 omitted) | $341,720 | $371,617 | $21,099 | $6,343 | $4,773 |
| Portfolio turnover rateG | 94% | 59% | 57% | 80% | 102% |
A Calculated based on average shares outstanding during the period.
B Total distributions of $.37 per share is comprised of distributions from net investment income of $.185 and distributions from net realized gain of $.185 per share.
C Amount represents less than $.005 per share.
D Total returns would have been lower if certain expenses had not been reduced during the applicable periods shown.
E Fees and expenses of any underlying Fidelity Central Funds are not included in the Fund's expense ratio. The Fund indirectly bears its proportionate share of the expenses of any underlying Fidelity Central Funds.
F Expense ratios reflect operating expenses of the class. Expenses before reductions do not reflect amounts reimbursed by the investment adviser or reductions from brokerage service arrangements or reductions from other expense offset arrangements and do not represent the amount paid by the class during periods when reimbursements or reductions occur. Expenses net of fee waivers reflect expenses after reimbursement by the investment adviser but prior to reductions from brokerage service arrangements or other expense offset arrangements. Expenses net of all reductions represent the net expenses paid by the class.
G Amount does not include the portfolio activity of any underlying Fidelity Central Funds.
See accompanying notes which are an integral part of the financial statements.
Fidelity Total Emerging Markets Fund Class Z
| Year ended October 31, | 2018 A |
| Selected Per–Share Data | |
| Net asset value, beginning of period | $12.17 |
| Income from Investment Operations | |
| Net investment income (loss)B | .01 |
| Net realized and unrealized gain (loss) | (.63) |
| Total from investment operations | (.62) |
| Distributions from net investment income | – |
| Distributions from net realized gain | – |
| Total distributions | – |
| Net asset value, end of period | $11.55 |
| Total ReturnC,D | (5.09)% |
| Ratios to Average Net AssetsE,F | |
| Expenses before reductions | 1.07%G |
| Expenses net of fee waivers, if any | 1.04%G |
| Expenses net of all reductions | 1.02%G |
| Net investment income (loss) | 1.51%G |
| Supplemental Data | |
| Net assets, end of period (000 omitted) | $1,603 |
| Portfolio turnover rateH | 94% |
A For the period October 2, 2018 (commencement of sale of shares) to October 31, 2018.
B Calculated based on average shares outstanding during the period.
C Total returns for periods of less than one year are not annualized.
D Total returns would have been lower if certain expenses had not been reduced during the applicable periods shown.
E Fees and expenses of any underlying Fidelity Central Funds are not included in the Fund's expense ratio. The Fund indirectly bears its proportionate share of the expenses of any underlying Fidelity Central Funds.
F Expense ratios reflect operating expenses of the class. Expenses before reductions do not reflect amounts reimbursed by the investment adviser or reductions from brokerage service arrangements or reductions from other expense offset arrangements and do not represent the amount paid by the class during periods when reimbursements or reductions occur. Expense ratios before reductions for start-up periods may not be representative of longer-term operating periods. Expenses net of fee waivers reflect expenses after reimbursement by the investment adviser but prior to reductions from brokerage service arrangements or other expense offset arrangements. Expenses net of all reductions represent the net expenses paid by the class.
G Annualized
H Amount does not include the portfolio activity of any underlying Fidelity Central Funds.
See accompanying notes which are an integral part of the financial statements.
Notes to Financial Statements
For the period ended October 31, 2018
1. Organization.
Fidelity Total Emerging Markets Fund (the Fund) is a fund of Fidelity Investment Trust (the Trust) and is authorized to issue an unlimited number of shares. The Trust is registered under the Investment Company Act of 1940, as amended (the 1940 Act), as an open-end management investment company organized as a Massachusetts business trust. The Fund commenced sale of Class Z shares on October 2, 2018. The Fund offers Class A, Class M, Class C, Total Emerging Markets, Class I and Class Z shares, each of which has equal rights as to assets and voting privileges. Each class has exclusive voting rights with respect to matters that affect that class. The Fund's investments in emerging markets can be subject to social, economic, regulatory, and political uncertainties and can be extremely volatile.
2. Investments in Fidelity Central Funds.
The Fund invests in Fidelity Central Funds, which are open-end investment companies generally available only to other investment companies and accounts managed by the investment adviser and its affiliates. The Fund's Schedule of Investments lists each of the Fidelity Central Funds held as of period end, if any, as an investment of the Fund, but does not include the underlying holdings of each Fidelity Central Fund. As an Investing Fund, the Fund indirectly bears its proportionate share of the expenses of the underlying Fidelity Central Funds.
The Money Market Central Funds seek preservation of capital and current income and are managed by Fidelity Investments Money Management, Inc. (FIMM), an affiliate of the investment adviser. Annualized expenses of the Money Market Central Funds as of their most recent shareholder report date are less than .005%.
A complete unaudited list of holdings for each Fidelity Central Fund is available upon request or at the Securities and Exchange Commission (the SEC) website at www.sec.gov. In addition, the financial statements of the Fidelity Central Funds, which are not covered by the Fund's Report of Independent Registered Public Accounting Firm, are available on the SEC website or upon request.
3. Significant Accounting Policies.
The Fund is an investment company and applies the accounting and reporting guidance of the Financial Accounting Standards Board (FASB) Accounting Standards Codification Topic 946 Financial Services – Investments Companies. The financial statements have been prepared in conformity with accounting principles generally accepted in the United States of America (GAAP), which require management to make certain estimates and assumptions at the date of the financial statements. Actual results could differ from those estimates. Subsequent events, if any, through the date that the financial statements were issued have been evaluated in the preparation of the financial statements. The following summarizes the significant accounting policies of the Fund:
Investment Valuation. Investments are valued as of 4:00 p.m. Eastern time on the last calendar day of the period. The Board of Trustees (the Board) has delegated the day to day responsibility for the valuation of the Fund's investments to the Fair Value Committee (the Committee) established by the Fund's investment adviser. In accordance with valuation policies and procedures approved by the Board, the Fund attempts to obtain prices from one or more third party pricing vendors or brokers to value its investments. When current market prices, quotations or currency exchange rates are not readily available or reliable, investments will be fair valued in good faith by the Committee, in accordance with procedures adopted by the Board. Factors used in determining fair value vary by investment type and may include market or investment specific events, changes in interest rates and credit quality. The frequency with which these procedures are used cannot be predicted and they may be utilized to a significant extent. The Committee oversees the Fund's valuation policies and procedures and reports to the Board on the Committee's activities and fair value determinations. The Board monitors the appropriateness of the procedures used in valuing the Fund's investments and ratifies the fair value determinations of the Committee.
The Fund categorizes the inputs to valuation techniques used to value its investments into a disclosure hierarchy consisting of three levels as shown below:
- Level 1 – quoted prices in active markets for identical investments
- Level 2 – other significant observable inputs (including quoted prices for similar investments, interest rates, prepayment speeds, etc.)
- Level 3 – unobservable inputs (including the Fund's own assumptions based on the best information available)
Valuation techniques used to value the Fund's investments by major category are as follows:
Equity securities, including restricted securities, for which market quotations are readily available, are valued at the last reported sale price or official closing price as reported by a third party pricing vendor on the primary market or exchange on which they are traded and are categorized as Level 1 in the hierarchy. In the event there were no sales during the day or closing prices are not available, securities are valued at the last quoted bid price or may be valued using the last available price and are generally categorized as Level 2 in the hierarchy. For foreign equity securities, when market or security specific events arise, comparisons to the valuation of American Depositary Receipts (ADRs), futures contracts, Exchange-Traded Funds (ETFs) and certain indexes as well as quoted prices for similar securities may be used and would be categorized as Level 2 in the hierarchy. Utilizing these techniques may result in transfers between Level 1 and Level 2. For equity securities, including restricted securities, where observable inputs are limited, assumptions about market activity and risk are used and these securities may be categorized as Level 3 in the hierarchy.
Debt securities, including restricted securities, are valued based on evaluated prices received from third party pricing vendors or from brokers who make markets in such securities. Corporate bonds, foreign government and government agency obligations, and U.S. government and government agency obligations are valued by pricing vendors who utilize matrix pricing which considers yield or price of bonds of comparable quality, coupon, maturity and type or by broker-supplied prices. When independent prices are unavailable or unreliable, debt securities may be valued utilizing pricing methodologies which consider similar factors that would be used by third party pricing vendors. Debt securities are generally categorized as Level 2 in the hierarchy but may be Level 3 depending on the circumstances.
Investments in open-end mutual funds, including the Fidelity Central Funds, are valued at their closing net asset value (NAV) each business day and are categorized as Level 1 in the hierarchy.
Changes in valuation techniques may result in transfers in or out of an assigned level within the disclosure hierarchy. The aggregate value of investments by input level as of October 31, 2018, including information on transfers between Levels 1 and 2, as well as a roll forward of Level 3 investments, is included at the end of the Fund's Schedule of Investments.
Foreign Currency. The Fund may use foreign currency contracts to facilitate transactions in foreign-denominated securities. Gains and losses from these transactions may arise from changes in the value of the foreign currency or if the counterparties do not perform under the contracts' terms.
Foreign-denominated assets, including investment securities, and liabilities are translated into U.S. dollars at the exchange rates at period end. Purchases and sales of investment securities, income and dividends received and expenses denominated in foreign currencies are translated into U.S. dollars at the exchange rate in effect on the transaction date.
The effects of exchange rate fluctuations on investments are included with the net realized and unrealized gain (loss) on investment securities. Other foreign currency transactions resulting in realized and unrealized gain (loss) are disclosed separately.
Investment Transactions and Income. For financial reporting purposes, the Fund's investment holdings and NAV include trades executed through the end of the last business day of the period. The NAV per share for processing shareholder transactions is calculated as of the close of business of the New York Stock Exchange (NYSE), normally 4:00 p.m. Eastern time and includes trades executed through the end of the prior business day. Gains and losses on securities sold are determined on the basis of identified cost. Dividend income is recorded on the ex-dividend date, except for certain dividends from foreign securities where the ex-dividend date may have passed, which are recorded as soon as the Fund is informed of the ex-dividend date. Non-cash dividends included in dividend income, if any, are recorded at the fair market value of the securities received. Income and capital gain distributions from Fidelity Central Funds, if any, are recorded on the ex-dividend date. Certain distributions received by the Fund represent a return of capital or capital gain. The Fund determines the components of these distributions subsequent to the ex-dividend date, based upon receipt of tax filings or other correspondence relating to the underlying investment. These distributions are recorded as a reduction of cost of investments and/or as a realized gain. Interest income is accrued as earned and includes coupon interest and amortization of premium and accretion of discount on debt securities as applicable. Paid in Kind (PIK) income is recorded at the fair market value of the securities received. Investment income is recorded net of foreign taxes withheld where recovery of such taxes is uncertain. Debt obligations may be placed on non-accrual status and related interest income may be reduced by ceasing current accruals and writing off interest receivables when the collection of all or a portion of interest has become doubtful based on consistently applied procedures. A debt obligation is removed from non-accrual status when the issuer resumes interest payments or when collectability of interest is reasonably assured.
Class Allocations and Expenses. Investment income, realized and unrealized capital gains and losses, common expenses of the Fund, and certain fund-level expense reductions, if any, are allocated daily on a pro-rata basis to each class based on the relative net assets of each class to the total net assets of the Fund. Each class differs with respect to transfer agent and distribution and service plan fees incurred. Certain expense reductions may also differ by class. For the reporting period, the allocated portion of income and expenses to each class as a percent of its average net assets may vary due to the timing of recording these transactions in relation to fluctuating net assets of the classes. Expenses directly attributable to a fund are charged to that fund. Expenses attributable to more than one fund are allocated among the respective funds on the basis of relative net assets or other appropriate methods. Expense estimates are accrued in the period to which they relate and adjustments are made when actual amounts are known.
Income Tax Information and Distributions to Shareholders. Each year, the Fund intends to qualify as a regulated investment company under Subchapter M of the Internal Revenue Code, including distributing substantially all of its taxable income and realized gains. As a result, no provision for U.S. Federal income taxes is required. As of October 31, 2018, the Fund did not have any unrecognized tax benefits in the financial statements; nor is the Fund aware of any tax positions for which it is reasonably possible that the total amounts of unrecognized tax benefits will significantly change in the next twelve months. The Fund files a U.S. federal tax return, in addition to state and local tax returns as required. The Fund's federal income tax returns are subject to examination by the Internal Revenue Service (IRS) for a period of three fiscal years after they are filed. State and local tax returns may be subject to examination for an additional fiscal year depending on the jurisdiction. Foreign taxes are provided for based on the Fund's understanding of the tax rules and rates that exist in the foreign markets in which it invests. The Fund is subject to a tax imposed on capital gains by certain countries in which it invests.
Distributions are declared and recorded on the ex-dividend date. Income and capital gain distributions are declared separately for each class. Income and capital gain distributions are determined in accordance with income tax regulations, which may differ from GAAP. In addition, the Fund claimed a portion of the payment made to redeeming shareholders as a distribution for income tax purposes.
Capital accounts within the financial statements are adjusted for permanent book-tax differences. These adjustments have no impact on net assets or the results of operations. Capital accounts are not adjusted for temporary book-tax differences which will reverse in a subsequent period.
Book-tax differences are primarily due to foreign currency transactions, futures contracts, certain foreign taxes, market discount, passive foreign investment companies (PFIC), capital loss carryforwards and losses deferred due to wash sales.
As of period end, the cost and unrealized appreciation (depreciation) in securities, and derivatives if applicable, for federal income tax purposes were as follows:
| Gross unrealized appreciation | $39,191,912 |
| Gross unrealized depreciation | (61,193,625) |
| Net unrealized appreciation (depreciation) | $(22,001,713) |
| Tax Cost | $633,010,580 |
The tax-based components of distributable earnings as of period end were as follows:
| Undistributed ordinary income | $11,013,570 |
| Capital loss carryforward | $(25,726,179) |
| Net unrealized appreciation (depreciation) on securities and other investments | $(22,029,305) |
Capital loss carryforwards are only available to offset future capital gains of the Fund to the extent provided by regulations and may be limited. Under the Regulated Investment Company Modernization Act of 2010 (the Act), the Fund is permitted to carry forward capital losses incurred in taxable years beginning after December 22, 2010 for an unlimited period and such capital losses are required to be used prior to any losses that expire. The capital loss carryforward information presented below, including any applicable limitation, is estimated as of fiscal period end and is subject to adjustment.
| No expiration | |
| Short-term | $(25,726,179) |
| Long-term | - |
| Total no expiration | $(25,726,179) |
The tax character of distributions paid was as follows:
| | October 31, 2018 | October 31, 2017 |
| Ordinary Income | $16,040,300 | $ 2,095,857 |
| Long-term Capital Gains | 4,233,242 | – |
| Total | $20,273,542 | $ 2,095,857 |
Short-Term Trading (Redemption) Fees. Shares held by investors in the Fund less than 90 days may have been subject to a redemption fee equal to 1.50% of the NAV of shares redeemed. All redemption fees, which reduce the proceeds of the shareholder redemption, are retained by the Fund and accounted for as an addition to paid in capital. In November 2017, the Board of Trustees approved the elimination of these redemption fees effective December 18, 2017.
Restricted Securities. The Fund may invest in securities that are subject to legal or contractual restrictions on resale. These securities generally may be resold in transactions exempt from registration or to the public if the securities are registered. Disposal of these securities may involve time-consuming negotiations and expense, and prompt sale at an acceptable price may be difficult. Information regarding restricted securities is included at the end of the Fund's Schedule of Investments.
New Rule Issuance. During August 2018, the U.S. Securities and Exchange Commission issued Final Rule Release No. 33-10532, Disclosure Update and Simplification. This Final Rule includes amendments specific to registered investment companies that are intended to eliminate overlap in disclosure requirements between Regulation S-X and GAAP. In accordance with these amendments, certain line-items in the Fund's financial statements have been combined or removed for the current period as outlined in the table below.
| Financial Statement | Current Line-Item Presentation | Prior Line-Item Presentation |
| Statement of Assets and Liabilities | Total distributable earnings (loss) | Undistributed/Distributions in excess of/Accumulated net investment income (loss)
Accumulated/Undistributed net realized gain (loss)
Net unrealized appreciation (depreciation) |
| Statement of Changes in Net Assets | N/A - removed | Undistributed/Distributions in excess of/Accumulated net investment income (loss) end of period |
| Statement of Changes in Net Assets | Distributions to shareholders | Distributions to shareholders from net investment income
Distributions to shareholders from net realized gain |
| Distributions to Shareholders Note to Financial Statements | Distributions to shareholders | Distributions to shareholders from net investment income
Distributions to shareholders from net realized gain |
4. Derivative Instruments.
Risk Exposures and the Use of Derivative Instruments. The Fund's investment objective allows the Fund to enter into various types of derivative contracts, including futures contracts. Derivatives are investments whose value is primarily derived from underlying assets, indices or reference rates and may be transacted on an exchange or over-the-counter (OTC). Derivatives may involve a future commitment to buy or sell a specified asset based on specified terms, to exchange future cash flows at periodic intervals based on a notional principal amount, or for one party to make one or more payments upon the occurrence of specified events in exchange for periodic payments from the other party.
The Fund used derivatives to increase returns and to manage exposure to certain risks as defined below. The success of any strategy involving derivatives depends on analysis of numerous economic factors, and if the strategies for investment do not work as intended, the Fund may not achieve its objectives.
The Fund's use of derivatives increased or decreased its exposure to the following risk:
| Equity Risk | Equity risk relates to the fluctuations in the value of financial instruments as a result of changes in market prices (other than those arising from interest rate risk or foreign exchange risk), whether caused by factors specific to an individual investment, its issuer, or all factors affecting all instruments traded in a market or market segment.
|
The Fund is also exposed to additional risks from investing in derivatives, such as liquidity risk and counterparty credit risk. Liquidity risk is the risk that the Fund will be unable to close out the derivative in the open market in a timely manner. Counterparty credit risk is the risk that the counterparty will not be able to fulfill its obligation to the Fund. Counterparty credit risk related to exchange-traded futures contracts may be mitigated by the protection provided by the exchange on which they trade.
Investing in derivatives may involve greater risks than investing in the underlying assets directly and, to varying degrees, may involve risk of loss in excess of any initial investment and collateral received and amounts recognized in the Statement of Assets and Liabilities. In addition, there may be the risk that the change in value of the derivative contract does not correspond to the change in value of the underlying instrument.
Futures Contracts. A futures contract is an agreement between two parties to buy or sell a specified underlying instrument for a fixed price at a specified future date. The Fund used futures contracts to manage its exposure to the stock market.
Upon entering into a futures contract, a fund is required to deposit either cash or securities (initial margin) with a clearing broker in an amount equal to a certain percentage of the face value of the contract. Futures contracts are marked-to-market daily and subsequent daily payments (variation margin) are made or received by a fund depending on the daily fluctuations in the value of the futures contracts and are recorded as unrealized appreciation or (depreciation). This receivable and/or payable, if any, is included in daily variation margin on futures contracts in the Statement of Assets and Liabilities. Realized gain or (loss) is recorded upon the expiration or closing of a futures contract. The net realized gain (loss) and change in net unrealized appreciation (depreciation) on futures contracts during the period is presented in the Statement of Operations.
Any open futures contracts at period end are presented in the Schedule of Investments under the caption "Futures Contracts". The notional amount at value reflects each contract's exposure to the underlying instrument or index at period end.
5. Purchases and Sales of Investments.
Purchases and sales of securities, other than short-term securities and U.S. government securities, aggregated $645,392,522 and $659,169,031, respectively.
6. Fees and Other Transactions with Affiliates.
Management Fee. Fidelity Management & Research Company (the investment adviser) and its affiliates provide the Fund with investment management related services for which the Fund pays a monthly management fee. The management fee is the sum of an individual fund fee rate that is based on an annual rate of .55% of the Fund's average net assets and an annualized group fee rate that averaged .24% during the period. The group fee rate is based upon the average net assets of all the mutual funds advised by the investment adviser, including any mutual funds previously advised by the investment adviser that are currently advised by Fidelity SelectCo, LLC, an affiliate of the investment adviser. The group fee rate decreases as assets under management increase and increases as assets under management decrease. For the reporting period, the total annual management fee rate was .79% of the Fund's average net assets.
Distribution and Service Plan Fees. In accordance with Rule 12b-1 of the 1940 Act, the Fund has adopted separate Distribution and Service Plans for each class of shares. Certain classes pay Fidelity Distributors Corporation (FDC), an affiliate of the investment adviser, separate Distribution and Service Fees, each of which is based on an annual percentage of each class' average net assets. In addition, FDC may pay financial intermediaries for selling shares of the Fund and providing shareholder support services. For the period, the Distribution and Service Fee rates, total fees and amounts retained by FDC were as follows:
| | Distribution Fee | Service Fee | Total Fees | Retained by FDC |
| Class A | -% | .25% | $114,744 | $14,838 |
| Class M | .25% | .25% | 47,109 | 2,167 |
| Class C | .75% | .25% | 420,768 | 179,385 |
| | | | $582,621 | $196,390 |
Sales Load. FDC may receive a front-end sales charge of up to 5.75% for selling Class A shares and 3.50% for selling Class M shares, some of which is paid to financial intermediaries for selling shares of the Fund. Depending on the holding period, FDC may receive contingent deferred sales charges levied on Class A, Class M and Class C redemptions. The deferred sales charges are 1.00% for Class C shares, 1.00% for certain purchases of Class A shares and .25% for certain purchases of Class M shares.
For the period, sales charge amounts retained by FDC were as follows:
| | Retained by FDC |
| Class A | $53,073 |
| Class M | 6,981 |
| Class C(a) | 11,971 |
| | $72,025 |
(a) When Class C shares are initially sold, FDC pays commissions from its own resources to financial intermediaries through which the sales are made.
Transfer Agent Fees. Fidelity Investments Institutional Operations Company, Inc., (FIIOC), an affiliate of the investment adviser, is the transfer, dividend disbursing and shareholder servicing agent for each class of the Fund. FIIOC receives account fees and asset-based fees that vary according to the account size and type of account of the shareholders of the respective classes of the Fund, except for Class Z. FIIOC receives an asset-based fee of Class Z's average net assets. FIIOC pays for typesetting, printing and mailing of shareholder reports, except proxy statements.
For the period, transfer agent fees for each class were as follows:
| | Amount | % of Class-Level Average Net Assets |
| Class A | $94,707 | .21 |
| Class M | 28,184 | .30 |
| Class C | 85,269 | .20 |
| Total Emerging Markets | 534,318 | .19 |
| Class I | 770,510 | .18 |
| Class Z | 9 | .04(a) |
| | $1,512,997 | |
(a) Annualized.
Accounting and Security Lending Fees. Fidelity Service Company, Inc. (FSC), an affiliate of the investment adviser, maintains the Fund's accounting records. The accounting fee is based on the level of average net assets for each month. Under a separate contract, FSC administers the security lending program. The security lending fee is based on the number and duration of lending transactions. For the period, the fees were equivalent to an annual rate of .05%.
Brokerage Commissions. The Fund placed a portion of its portfolio transactions with brokerage firms which are affiliates of the investment adviser. Brokerage commissions are included in net realized gain (loss) and change in net unrealized appreciation (depreciation) in the Statement of Operations. The commissions paid to these affiliated firms were $4,671 for the period.
Interfund Lending Program. Pursuant to an Exemptive Order issued by the SEC, the Fund, along with other registered investment companies having management contracts with Fidelity Management & Research Company (FMR) or other affiliated entities of FMR, may participate in an interfund lending program. This program provides an alternative credit facility allowing the funds to borrow from, or lend money to, other participating affiliated funds. At period end, there were no interfund loans outstanding. The Fund's activity in this program during the period for which loans were outstanding was as follows:
| Borrower or Lender | Average Loan Balance | Weighted Average Interest Rate | Interest Expense |
| Borrower | $13,840,000 | 2.17% | $832 |
Interfund Trades. The Fund may purchase from or sell securities to other Fidelity Funds under procedures adopted by the Board. The procedures have been designed to ensure these interfund trades are executed in accordance with Rule 17a-7 of the 1940 Act. Interfund trades are included within the respective purchases and sales amounts shown in the Purchases and Sales of Investments note.
Other. During the period, the investment adviser reimbursed the Fund for certain losses in the amount of $1,966.
7. Committed Line of Credit.
The Fund participates with other funds managed by the investment adviser or an affiliate in a $4.25 billion credit facility (the "line of credit") to be utilized for temporary or emergency purposes to fund shareholder redemptions or for other short-term liquidity purposes. The Fund has agreed to pay commitment fees on its pro-rata portion of the line of credit, which amounted to $2,227 and is reflected in Miscellaneous expenses on the Statement of Operations. During the period, the Fund did not borrow on this line of credit.
8. Security Lending.
The Fund lends portfolio securities through a lending agent from time to time in order to earn additional income. For equity securities, a lending agent is used and may loan securities to certain qualified borrowers, including Fidelity Capital Markets (FCM), a broker-dealer affiliated with the Fund. On the settlement date of the loan, the Fund receives collateral (in the form of U.S. Treasury obligations, letters of credit and/or cash) against the loaned securities and maintains collateral in an amount not less than 100% of the market value of the loaned securities during the period of the loan. The market value of the loaned securities is determined at the close of business of the Fund and any additional required collateral is delivered to the Fund on the next business day. The Fund or borrower may terminate the loan at any time, and if the borrower defaults on its obligation to return the securities loaned because of insolvency or other reasons, the Fund may apply collateral received from the borrower against the obligation. The Fund may experience delays and costs in recovering the securities loaned. Any cash collateral received is invested in the Fidelity Securities Lending Cash Central Fund. At period end, there were no security loans outstanding. Security lending income represents the income earned on investing cash collateral, less rebates paid to borrowers and any lending agent fees associated with the loan, plus any premium payments received for lending certain types of securities. Security lending income is presented in the Statement of Operations as a component of income from Fidelity Central Funds. Total security lending income during the period amounted to $14,284. During the period, there were no securities loaned to FCM.
9. Expense Reductions.
The investment adviser contractually agreed to reimburse each class to the extent annual operating expenses exceeded certain levels of class-level average net assets as noted in the table below. This reimbursement will remain in place through February 29, 2020. Some expenses, for example the compensation of the independent Trustees, and certain miscellaneous expenses such as proxy and shareholder meeting expenses, are excluded from this reimbursement.
The following classes were in reimbursement during the period:
| | Expense Limitations | Reimbursement |
| Class Z | 1.25% | $6 |
Commissions paid to certain brokers with whom the investment adviser, or its affiliates, places trades on behalf of the Fund include an amount in addition to trade execution, which may be rebated back to the Fund to offset certain expenses. This amount totaled $193,897 for the period. Through arrangements with the Fund's custodian, credits realized as a result of certain uninvested cash balances were used to reduce the Fund's expenses. During the period, these credits reduced the Fund's custody expenses by $2,447.
In addition, during the period the investment adviser reimbursed and/or waived a portion of fund-level operating expenses in the amount of $7,638.
10. Distributions to Shareholders.
Distributions to shareholders of each class were as follows:
| | Year ended
October 31, 2018 | Year ended
October 31, 2017 |
| Distributions to shareholders | | |
| Class A | $1,173,252 | $– |
| Class M | 134,477 | – |
| Class C | 782,198 | – |
| Total Emerging Markets | 7,266,702 | – |
| Class I | 10,916,913 | – |
| Total | $20,273,542 | $– |
| From net investment income | | |
| Class A | $– | $195,255 |
| Class M | – | 23,027 |
| Class C | – | 57,828 |
| Total Emerging Markets | – | 1,274,142 |
| Class I | – | 407,541 |
| Total | $– | $1,957,793 |
| From net realized gain | | |
| Class A | $– | $14,644 |
| Class M | – | 2,410 |
| Class C | – | 9,294 |
| Total Emerging Markets | – | 84,943 |
| Class I | – | 26,773 |
| Total | $– | $138,064 |
11. Share Transactions.
Share transactions for each class were as follows and may contain automatic conversions between classes or exchanges between affiliated funds:
| | Shares | Shares | Dollars | Dollars |
| | Year ended October 31, 2018(a) | Year ended October 31, 2017 | Year ended October 31, 2018(a) | Year ended October 31, 2017 |
| Class A | | | | |
| Shares sold | 1,859,563 | 3,615,728 | $25,085,167 | $43,198,307 |
| Reinvestment of distributions | 88,408 | 19,523 | 1,166,980 | 207,918 |
| Shares redeemed | (2,058,546) | (1,863,978) | (26,793,915) | (21,909,724) |
| Net increase (decrease) | (110,575) | 1,771,273 | $(541,768) | $21,496,501 |
| Class M | | | | |
| Shares sold | 275,701 | 451,431 | $3,701,993 | $5,673,545 |
| Reinvestment of distributions | 15,634 | 2,361 | 206,523 | 25,216 |
| Shares redeemed | (196,678) | (74,567) | (2,571,520) | (886,466) |
| Net increase (decrease) | 94,657 | 379,225 | $1,336,996 | $4,812,295 |
| Class C | | | | |
| Shares sold | 1,470,832 | 1,907,365 | $19,647,127 | $23,252,010 |
| Reinvestment of distributions | 59,490 | 6,299 | 781,699 | 66,954 |
| Shares redeemed | (861,075) | (272,258) | (10,881,951) | (3,283,907) |
| Net increase (decrease) | 669,247 | 1,641,406 | $9,546,875 | $20,035,057 |
| Total Emerging Markets | | | | |
| Shares sold | 8,907,832 | 17,602,916 | $120,823,803 | $212,356,677 |
| Reinvestment of distributions | 522,036 | 124,771 | 6,896,099 | 1,328,813 |
| Shares redeemed | (13,024,202) | (6,900,916) | (167,212,962) | (84,713,141) |
| Net increase (decrease) | (3,594,334) | 10,826,771 | $(39,493,060) | $128,972,349 |
| Class I | | | | |
| Shares sold | 17,527,189 | 29,232,950 | $232,099,188 | $357,207,778 |
| Reinvestment of distributions | 792,863 | 38,174 | 10,457,863 | 405,784 |
| Shares redeemed | (16,103,644) | (3,761,001) | (201,759,709) | (47,186,855) |
| Net increase (decrease) | 2,216,408 | 25,510,123 | $40,797,342 | $310,426,707 |
| Class Z | | | | |
| Shares sold | 139,605 | – | $1,609,269 | $– |
| Shares redeemed | (758) | – | (8,750) | – |
| Net increase (decrease) | 138,847 | – | $1,600,519 | $– |
(a) Share transactions for Class Z are for the period October 2, 2018 (commencement of sale of shares) to October 31, 2018
12. Other.
The Fund's organizational documents provide former and current trustees and officers with a limited indemnification against liabilities arising in connection with the performance of their duties to the Fund. In the normal course of business, the Fund may also enter into contracts that provide general indemnifications. The Fund's maximum exposure under these arrangements is unknown as this would be dependent on future claims that may be made against the Fund. The risk of material loss from such claims is considered remote.
Report of Independent Registered Public Accounting Firm
To the Board of Trustees of Fidelity Investment Trust and the Shareholders of Fidelity Emerging Markets Discovery Fund and Fidelity Total Emerging Markets Fund:
Opinions on the Financial Statements
We have audited the accompanying statements of assets and liabilities, including the schedules of investments, of Fidelity Emerging Markets Discovery Fund and Fidelity Total Emerging Markets Fund (two of the funds constituting Fidelity Investment Trust, hereafter collectively referred to as the "Funds") as of October 31, 2018, the related statements of operations for the year ended October 31, 2018, the statements of changes in net assets for each of the two years in the period ended October 31, 2018, including the related notes, and the financial highlights for each of the periods indicated therein (collectively referred to as the “financial statements”). In our opinion, the financial statements present fairly, in all material respects, the financial position of each of the Funds as of October 31, 2018, the results of each of their operations for the year then ended, the changes in each of their net assets for each of the two years in the period ended October 31, 2018 and each of the financial highlights for each of the periods indicated therein in conformity with accounting principles generally accepted in the United States of America.
Basis for Opinions
These financial statements are the responsibility of the Funds' management. Our responsibility is to express an opinion on the Funds' financial statements based on our audits. We are a public accounting firm registered with the Public Company Accounting Oversight Board (United States) (“PCAOB”) and are required to be independent with respect to the Funds in accordance with the U.S. federal securities laws and the applicable rules and regulations of the Securities and Exchange Commission and the PCAOB.
We conducted our audits of these financial statements in accordance with the standards of the PCAOB. Those standards require that we plan and perform the audit to obtain reasonable assurance about whether the financial statements are free of material misstatement, whether due to error or fraud.
Our audits included performing procedures to assess the risks of material misstatement of the financial statements, whether due to error or fraud, and performing procedures that respond to those risks. Such procedures included examining, on a test basis, evidence regarding the amounts and disclosures in the financial statements. Our audits also included evaluating the accounting principles used and significant estimates made by management, as well as evaluating the overall presentation of the financial statements. Our procedures included confirmation of securities owned as of October 31, 2018 by correspondence with the custodians and brokers; when replies were not received from brokers, we performed other auditing procedures. We believe that our audits provide a reasonable basis for our opinions.
PricewaterhouseCoopers LLP
Boston, Massachusetts
December 14, 2018
We have served as the auditor of one or more investment companies in the Fidelity group of funds since 1932.
Trustees and Officers
The Trustees, Members of the Advisory Board (if any), and officers of the trust and funds, as applicable, are listed below. The Board of Trustees governs each fund and is responsible for protecting the interests of shareholders. The Trustees are experienced executives who meet periodically throughout the year to oversee each fund's activities, review contractual arrangements with companies that provide services to each fund, oversee management of the risks associated with such activities and contractual arrangements, and review each fund's performance. Except for Jonathan Chiel, each of the Trustees oversees 283 funds. Mr. Chiel oversees 154 funds.
The Trustees hold office without limit in time except that (a) any Trustee may resign; (b) any Trustee may be removed by written instrument, signed by at least two-thirds of the number of Trustees prior to such removal; (c) any Trustee who requests to be retired or who has become incapacitated by illness or injury may be retired by written instrument signed by a majority of the other Trustees; and (d) any Trustee may be removed at any special meeting of shareholders by a two-thirds vote of the outstanding voting securities of the trust. Each Trustee who is not an interested person (as defined in the 1940 Act) of the trust and the funds is referred to herein as an Independent Trustee. Each Independent Trustee shall retire not later than the last day of the calendar year in which his or her 75th birthday occurs. The Independent Trustees may waive this mandatory retirement age policy with respect to individual Trustees. Officers and Advisory Board Members hold office without limit in time, except that any officer or Advisory Board Member may resign or may be removed by a vote of a majority of the Trustees at any regular meeting or any special meeting of the Trustees. Except as indicated, each individual has held the office shown or other offices in the same company for the past five years.
Each fund’s Statement of Additional Information (SAI) includes more information about the Trustees. To request a free copy, call Fidelity at 1-800-544-8544.
Experience, Skills, Attributes, and Qualifications of the Trustees. The Governance and Nominating Committee has adopted a statement of policy that describes the experience, qualifications, attributes, and skills that are necessary and desirable for potential Independent Trustee candidates (Statement of Policy). The Board believes that each Trustee satisfied at the time he or she was initially elected or appointed a Trustee, and continues to satisfy, the standards contemplated by the Statement of Policy. The Governance and Nominating Committee also engages professional search firms to help identify potential Independent Trustee candidates who have the experience, qualifications, attributes, and skills consistent with the Statement of Policy. From time to time, additional criteria based on the composition and skills of the current Independent Trustees, as well as experience or skills that may be appropriate in light of future changes to board composition, business conditions, and regulatory or other developments, have also been considered by the professional search firms and the Governance and Nominating Committee. In addition, the Board takes into account the Trustees' commitment and participation in Board and committee meetings, as well as their leadership of standing and ad hoc committees throughout their tenure.
In determining that a particular Trustee was and continues to be qualified to serve as a Trustee, the Board has considered a variety of criteria, none of which, in isolation, was controlling. The Board believes that, collectively, the Trustees have balanced and diverse experience, qualifications, attributes, and skills, which allow the Board to operate effectively in governing each fund and protecting the interests of shareholders. Information about the specific experience, skills, attributes, and qualifications of each Trustee, which in each case led to the Board's conclusion that the Trustee should serve (or continue to serve) as a trustee of the funds, is provided below.
Board Structure and Oversight Function. James C. Curvey is an interested person and currently serves as Chairman. The Trustees have determined that an interested Chairman is appropriate and benefits shareholders because an interested Chairman has a personal and professional stake in the quality and continuity of services provided to the funds. Independent Trustees exercise their informed business judgment to appoint an individual of their choosing to serve as Chairman, regardless of whether the Trustee happens to be independent or a member of management. The Independent Trustees have determined that they can act independently and effectively without having an Independent Trustee serve as Chairman and that a key structural component for assuring that they are in a position to do so is for the Independent Trustees to constitute a substantial majority for the Board. The Independent Trustees also regularly meet in executive session. Ned C. Lautenbach serves as Chairman of the Independent Trustees and as such (i) acts as a liaison between the Independent Trustees and management with respect to matters important to the Independent Trustees and (ii) with management prepares agendas for Board meetings.
Fidelity® funds are overseen by different Boards of Trustees. The funds' Board oversees Fidelity's high income and certain equity funds, and other Boards oversee Fidelity's investment-grade bond, money market, asset allocation, and other equity funds. The asset allocation funds may invest in Fidelity® funds overseen by the funds' Board. The use of separate Boards, each with its own committee structure, allows the Trustees of each group of Fidelity® funds to focus on the unique issues of the funds they oversee, including common research, investment, and operational issues. On occasion, the separate Boards establish joint committees to address issues of overlapping consequences for the Fidelity® funds overseen by each Board.
The Trustees operate using a system of committees to facilitate the timely and efficient consideration of all matters of importance to the Trustees, each fund, and fund shareholders and to facilitate compliance with legal and regulatory requirements and oversight of the funds' activities and associated risks. The Board, acting through its committees, has charged FMR and its affiliates with (i) identifying events or circumstances the occurrence of which could have demonstrably adverse effects on the funds' business and/or reputation; (ii) implementing processes and controls to lessen the possibility that such events or circumstances occur or to mitigate the effects of such events or circumstances if they do occur; and (iii) creating and maintaining a system designed to evaluate continuously business and market conditions in order to facilitate the identification and implementation processes described in (i) and (ii) above. Because the day-to-day operations and activities of the funds are carried out by or through FMR, its affiliates, and other service providers, the funds' exposure to risks is mitigated but not eliminated by the processes overseen by the Trustees. While each of the Board's committees has responsibility for overseeing different aspects of the funds' activities, oversight is exercised primarily through the Operations, Audit, and Compliance Committees. In addition, the Independent Trustees have worked with Fidelity to enhance the Board's oversight of investment and financial risks, legal and regulatory risks, technology risks, and operational risks, including the development of additional risk reporting to the Board. Appropriate personnel, including but not limited to the funds' Chief Compliance Officer (CCO), FMR's internal auditor, the independent accountants, the funds' Treasurer and portfolio management personnel, make periodic reports to the Board's committees, as appropriate, including an annual review of Fidelity's risk management program for the Fidelity® funds. The responsibilities of each standing committee, including their oversight responsibilities, are described further under "Standing Committees of the Trustees."
Interested Trustees*:
Correspondence intended for a Trustee who is an interested person may be sent to Fidelity Investments, 245 Summer Street, Boston, Massachusetts 02210.
Name, Year of Birth; Principal Occupations and Other Relevant Experience+
Jonathan Chiel (1957)
Year of Election or Appointment: 2016
Trustee
Mr. Chiel also serves as Trustee of other Fidelity® funds. Mr. Chiel is Executive Vice President and General Counsel for FMR LLC (diversified financial services company, 2012-present). Previously, Mr. Chiel served as general counsel (2004-2012) and senior vice president and deputy general counsel (2000-2004) for John Hancock Financial Services; a partner with Choate, Hall & Stewart (1996-2000) (law firm); and an Assistant United States Attorney for the United States Attorney’s Office of the District of Massachusetts (1986-95), including Chief of the Criminal Division (1993-1995). Mr. Chiel is a director on the boards of the Boston Bar Foundation and the Maimonides School.
James C. Curvey (1935)
Year of Election or Appointment: 2007
Trustee
Chairman of the Board of Trustees
Mr. Curvey also serves as Trustee of other Fidelity® funds. Mr. Curvey is Vice Chairman (2007-present) and Director of FMR LLC (diversified financial services company). In addition, Mr. Curvey is an Overseer Emeritus for the Boston Symphony Orchestra, a Director of Artis-Naples, and a Trustee of Brewster Academy in Wolfeboro, New Hampshire. Previously, Mr. Curvey served as a Director of Fidelity Research & Analysis Co. (investment adviser firm, 2009-2018), Director of Fidelity Investments Money Management, Inc. (investment adviser firm, 2009-2014) and a Director of FMR and FMR Co., Inc. (investment adviser firms, 2007-2014).
Charles S. Morrison (1960)
Year of Election or Appointment: 2014
Trustee
Mr. Morrison also serves as Trustee of other funds. He serves as President of Fidelity SelectCo, LLC (investment adviser firm, 2017-present) and Fidelity Management & Research Company (FMR) (investment adviser firm, 2016-present), a Director of Fidelity Investments Money Management, Inc. (FIMM) (investment adviser firm, 2014-present), Director of Fidelity SelectCo, LLC (investment adviser firm, 2014-present), President, Asset Management (2014-present), and is an employee of Fidelity Investments. Previously, Mr. Morrison served as Vice President of Fidelity's Fixed Income and Asset Allocation Funds (2012-2014), President, Fixed Income (2011-2014), Vice President of Fidelity's Money Market Funds (2005-2009), President, Money Market Group Leader of FMR (investment adviser firm, 2009), and Senior Vice President, Money Market Group of FMR (2004-2009). Mr. Morrison also served as Vice President of Fidelity's Bond Funds (2002-2005), certain Balanced Funds (2002-2005), and certain Asset Allocation Funds (2002-2007), and as Senior Vice President (2002-2005) of Fidelity's Bond Division.
* Determined to be an “Interested Trustee” by virtue of, among other things, his or her affiliation with the trust or various entities under common control with FMR.
+ The information includes the Trustee's principal occupation during the last five years and other information relating to the experience, attributes, and skills relevant to the Trustee's qualifications to serve as a Trustee, which led to the conclusion that the Trustee should serve as a Trustee for each fund.
Independent Trustees:
Correspondence intended for an Independent Trustee may be sent to Fidelity Investments, P.O. Box 55235, Boston, Massachusetts 02205-5235.
Name, Year of Birth; Principal Occupations and Other Relevant Experience+
Dennis J. Dirks (1948)
Year of Election or Appointment: 2005
Trustee
Mr. Dirks also serves as Trustee of other Fidelity® funds. Prior to his retirement in May 2003, Mr. Dirks was Chief Operating Officer and a member of the Board of The Depository Trust & Clearing Corporation (DTCC). He also served as President, Chief Operating Officer, and Board member of The Depository Trust Company (DTC) and President and Board member of the National Securities Clearing Corporation (NSCC). In addition, Mr. Dirks served as Chief Executive Officer and Board member of the Government Securities Clearing Corporation, Chief Executive Officer and Board member of the Mortgage-Backed Securities Clearing Corporation, as a Trustee and a member of the Finance Committee of Manhattan College (2005-2008), as a Trustee and a member of the Finance Committee of AHRC of Nassau County (2006-2008), as a member of the Independent Directors Council (IDC) Governing Council (2010-2015), and as a member of the Board of Directors for The Brookville Center for Children’s Services, Inc. (2009-2017). Mr. Dirks is a member of the Finance Committee (2016-present), Board of Directors (2017-present) and Board of Trustees (2018-present) and is Treasurer (2018-present) of the Asolo Repertory Theatre.
Donald F. Donahue (1950)
Year of Election or Appointment: 2018
Trustee
Mr. Donahue also serves as a Trustee of other Fidelity® funds. Mr. Donahue is President and Chief Executive Officer of Miranda Partners, LLC (risk consulting for the financial services industry, 2012-present). Previously, Mr. Donahue served as a Member of the Advisory Board of certain Fidelity® funds (2015-2018) and Chief Executive Officer (2006-2012), Chief Operating Officer (2003-2006), and Managing Director, Customer Marketing and Development (1999-2003) of The Depository Trust & Clearing Corporation (financial markets infrastructure). Mr. Donahue serves as a Member (2007-present) and Co-Chairman (2016-present) of the Board of Directors of United Way of New York, Member of the Board of Directors of NYC Leadership Academy (2012-present) and Member of the Board of Advisors of Ripple Labs, Inc. (financial services, 2015-present). He also served as Chairman (2010-2012) and Member of the Board of Directors (2012-2013) of Omgeo, LLC (financial services), Treasurer of United Way of New York (2012-2016), and Member of the Board of Directors of XBRL US (financial services non-profit, 2009-2012) and the International Securities Services Association (2009-2012).
Alan J. Lacy (1953)
Year of Election or Appointment: 2008
Trustee
Mr. Lacy also serves as Trustee of other Fidelity® funds. Mr. Lacy serves as a Director of Bristol-Myers Squibb Company (global pharmaceuticals, 2008-present). He is a Trustee of the California Chapter of The Nature Conservancy (2015-present) and a Director of the Center for Advanced Study in the Behavioral Sciences at Stanford University (2015-present). In addition, Mr. Lacy served as Senior Adviser (2007-2014) of Oak Hill Capital Partners, L.P. (private equity) and also served as Chief Executive Officer (2005) and Vice Chairman (2005-2006) of Sears Holdings Corporation (retail) and Chief Executive Officer and Chairman of the Board of Sears, Roebuck and Co. (retail, 2000-2005). Previously, Mr. Lacy served as Chairman (2014-2017) and a member (2010-2017) of the Board of Directors of Dave & Buster’s Entertainment, Inc. (restaurant and entertainment complexes), as Chairman (2008-2011) and a member (2006-2015) of the Board of Trustees of the National Parks Conservation Association, and as a member of the Board of Directors for The Hillman Companies, Inc. (hardware wholesalers, 2010-2014), Earth Fare, Inc. (retail grocery, 2010-2014), and The Western Union Company (global money transfer, 2006-2011).
Ned C. Lautenbach (1944)
Year of Election or Appointment: 2000
Trustee
Chairman of the Independent Trustees
Mr. Lautenbach also serves as Trustee of other Fidelity® funds. Mr. Lautenbach currently serves as Vice Chair of the Board of Governors, State University System of Florida (2013-present) and is a member of the Council on Foreign Relations (1994-present). He is also a member and has most recently served as Chairman of the Board of Directors of Artis-Naples (2012-present). Previously, Mr. Lautenbach served as a member and then Lead Director of the Board of Directors of Eaton Corporation (diversified industrial, 1997-2016). He was also a Partner and Advisory Partner at Clayton, Dubilier & Rice, LLC (private equity investment, 1998-2010), as well as a Director of Sony Corporation (2006-2007). In addition, Mr. Lautenbach also had a 30-year career with IBM (technology company) during which time he served as Senior Vice President and a member of the Corporate Executive Committee (1968-1998).
Joseph Mauriello (1944)
Year of Election or Appointment: 2008
Trustee
Mr. Mauriello also serves as Trustee of other Fidelity® funds. Prior to his retirement in January 2006, Mr. Mauriello served in numerous senior management positions including Deputy Chairman and Chief Operating Officer (2004-2005), and Vice Chairman of Financial Services (2002-2004) of KPMG LLP US (professional services, 1965-2005). Mr. Mauriello currently serves as a member of the Independent Directors Council (IDC) Governing Council (2015-present). Previously, Mr. Mauriello served as a member of the Board of Directors of XL Group plc. (global insurance and re-insurance, 2006-2018).
Cornelia M. Small (1944)
Year of Election or Appointment: 2005
Trustee
Ms. Small also serves as Trustee of other Fidelity® funds. Ms. Small is a member of the Board of Directors (2009-present) and Chair of the Investment Committee (2010-present) of the Teagle Foundation. Ms. Small also serves on the Investment Committee of the Berkshire Taconic Community Foundation (2008-present). Previously, Ms. Small served as Chairperson (2002-2008) and a member of the Investment Committee and Chairperson (2008-2012) and a member of the Board of Trustees of Smith College. In addition, Ms. Small served as Chief Investment Officer, Director of Global Equity Investments, and a member of the Board of Directors of Scudder, Stevens & Clark and Scudder Kemper Investments.
Garnett A. Smith (1947)
Year of Election or Appointment: 2018
Trustee
Mr. Smith also serves as Trustee of other Fidelity® funds. Prior to Mr. Smith's retirement, he served as Chairman and Chief Executive Officer of Inbrand Corp. (manufacturer of personal absorbent products, 1990-1997). He also served as President (1986-1990) of Inbrand Corp. Prior to his employment with Inbrand Corp., he was employed by a retail fabric chain and North Carolina National Bank. In addition, Mr. Smith served as a Member of the Advisory Board of certain Fidelity® funds (2012-2013) and as a board member of the Jackson Hole Land Trust (2009-2012).
David M. Thomas (1949)
Year of Election or Appointment: 2008
Trustee
Mr. Thomas also serves as Trustee of other Fidelity® funds. Mr. Thomas serves as Non-Executive Chairman of the Board of Directors of Fortune Brands Home and Security (home and security products, 2011-present), as a member of the Board of Directors (2004-present) and Presiding Director (2013-present) of Interpublic Group of Companies, Inc. (marketing communication), and as a member of the Board of Trustees of the University of Florida (2013-present). Previously, Mr. Thomas served as Executive Chairman (2005-2006) and Chairman and Chief Executive Officer (2000-2005) of IMS Health, Inc. (pharmaceutical and healthcare information solutions), and a Director of Fortune Brands, Inc. (consumer products, 2000-2011).
+ The information includes the Trustee's principal occupation during the last five years and other information relating to the experience, attributes, and skills relevant to the Trustee's qualifications to serve as a Trustee, which led to the conclusion that the Trustee should serve as a Trustee for each fund.
Advisory Board Members and Officers:
Correspondence intended for a Member of the Advisory Board (if any) may be sent to Fidelity Investments, P.O. Box 55235, Boston, Massachusetts 02205-5235. Correspondence intended for an officer or Peter S. Lynch may be sent to Fidelity Investments, 245 Summer Street, Boston, Massachusetts 02210. Officers appear below in alphabetical order.
Name, Year of Birth; Principal Occupation
Vicki L. Fuller (1957)
Year of Election or Appointment: 2018
Member of the Advisory Board
Ms. Fuller also serves as Member of the Advisory Board of other Fidelity® funds. Ms. Fuller serves as a member of the Board of Directors, Audit Committee, and Nominating and Governance Committee of The Williams Companies, Inc. (natural gas infrastructure, 2018-present). Previously, Ms. Fuller served as the Chief Investment Officer of the New York State Common Retirement Fund (2012-2018) and held a variety of positions at AllianceBernstein L.P. (global asset management, 1985-2012), including Managing Director (2006-2012) and Senior Vice President and Senior Portfolio Manager (2001-2006).
Peter S. Lynch (1944)
Year of Election or Appointment: 2003
Member of the Advisory Board
Mr. Lynch also serves as Member of the Advisory Board of other Fidelity® funds. Mr. Lynch is Vice Chairman and a Director of FMR (investment adviser firm) and FMR Co., Inc. (investment adviser firm). In addition, Mr. Lynch serves as a Trustee of Boston College and as the Chairman of the Inner-City Scholarship Fund. Previously, Mr. Lynch served on the Special Olympics International Board of Directors (1997-2006).
William S. Stavropoulos (1939)
Year of Election or Appointment: 2018
Member of the Advisory Board
Mr. Stavropoulos also serves as Member of the Advisory Board of other Fidelity® funds. Mr. Stavropoulos serves as President and Founder of the Michigan Baseball Foundation, the Great Lakes Loons (2007-present). Mr. Stavropoulos is Chairman Emeritus of the Board of Directors of The Dow Chemical Company, where he previously served in numerous senior management positions, including President, CEO (1995-2000; 2002-2004), Chairman of the Executive Committee (2000-2006), and as a member of the Board of Directors (1990-2006). Currently, Mr. Stavropoulos is Chairman of the Board of Directors of Univar Inc. (global distributor of commodity and specialty chemicals), a Director of Teradata Corporation (data warehousing and technology solutions), and a member of the Advisory Board for Metalmark Capital LLC (private equity investment, 2005-present). Mr. Stavropoulos is an operating advisor to Clayton, Dubilier & Rice, LLC (private equity investment). In addition, Mr. Stavropoulos is a member of the University of Notre Dame Advisory Council for the College of Science, a Trustee of the Rollin L. Gerstacker Foundation, and a Director of Artis-Naples in Naples, Florida. Previously, Mr. Stavropoulos served as Trustee of certain Fidelity® funds (2001-2018) and as a Director of Chemical Financial Corporation (bank holding company, 1993-2012) and Tyco International, Ltd. (multinational manufacturing and services, 2007-2012).
Carol B. Tomé (1957)
Year of Election or Appointment: 2018
Member of the Advisory Board
Ms. Tomé also serves as Member of the Advisory Board of other Fidelity® funds. Ms. Tomé is Chief Financial Officer (2001-present) and Executive Vice President of Corporate Services (2007-present) of The Home Depot, Inc. (home improvement retailer) and a Director (2003-present) and Chair of the Audit Committee (2004-present) of United Parcel Service, Inc. (package delivery and supply chain management). Previously, Ms. Tomé served as Trustee of certain Fidelity® funds (2017), Senior Vice President of Finance and Accounting/Treasurer (2000-2007) and Vice President and Treasurer (1995-2000) of The Home Depot, Inc. and Chair of the Board (2010-2012), Vice Chair of the Board (2009 and 2013), and a Director (2008-2013) of the Federal Reserve Bank of Atlanta. Ms. Tomé is also a director or trustee of many community and professional organizations.
Michael E. Wiley (1950)
Year of Election or Appointment: 2018
Member of the Advisory Board
Mr. Wiley also serves as Trustee or Member of the Advisory Board of other Fidelity® funds. Mr. Wiley serves as a Director of High Point Resources (exploration and production, 2005-present). Previously, Mr. Wiley served as a Director of Andeavor Corporation (independent oil refiner and marketer, 2005-2018), a Director of Andeavor Logistics LP (natural resources logistics, 2015-2018), a Director of Post Oak Bank (privately-held bank, 2004-2018), a Director of Asia Pacific Exploration Consolidated (international oil and gas exploration and production, 2008-2013), a member of the Board of Trustees of the University of Tulsa (2000-2006; 2007-2010), a Senior Energy Advisor of Katzenbach Partners, LLC (consulting, 2006-2007), an Advisory Director of Riverstone Holdings (private investment), a Director of Spinnaker Exploration Company (exploration and production, 2001-2005) and Chairman, President, and CEO of Baker Hughes, Inc. (oilfield services, 2000-2004).
Elizabeth Paige Baumann (1968)
Year of Election or Appointment: 2017
Anti-Money Laundering (AML) Officer
Ms. Baumann also serves as AML Officer of other funds. She is Chief AML Officer (2012-present) and Senior Vice President (2014-present) of FMR LLC (diversified financial services company) and is an employee of Fidelity Investments. Previously, Ms. Baumann served as AML Officer of the funds (2012-2016), and Vice President (2007-2014) and Deputy Anti-Money Laundering Officer (2007-2012) of FMR LLC.
John J. Burke III (1964)
Year of Election or Appointment: 2018
Chief Financial Officer
Mr. Burke also serves as Chief Financial Officer of other funds. Mr. Burke serves as Head of Investment Operations for Fidelity Fund and Investment Operations (2018-present) and is an employee of Fidelity Investments (1998-present). Previously Mr. Burke served as head of Asset Management Investment Operations (2012-2018).
William C. Coffey (1969)
Year of Election or Appointment: 2018
Secretary and Chief Legal Officer (CLO)
Mr. Coffey also serves as Secretary and CLO of other funds. Mr. Coffey serves as CLO, Secretary, and Senior Vice President of Fidelity Management & Research Company and FMR Co., Inc. (investment adviser firms, 2018-present); Secretary of Fidelity SelectCo, LLC and Fidelity Investments Money Management, Inc. (investment adviser firms, 2018-present); and CLO of Fidelity Management & Research (Hong Kong) Limited, FMR Investment Management (UK) Limited, and Fidelity Management & Research (Japan) Limited (investment adviser firms, 2018-present). He is Senior Vice President and Deputy General Counsel of FMR LLC (diversified financial services company, 2010-present), and is an employee of Fidelity Investments. Previously, Mr. Coffey served as Assistant Secretary of certain funds (2009-2018) and as Vice President and Associate General Counsel of FMR LLC (2005-2009).
Timothy M. Cohen (1969)
Year of Election or Appointment: 2018
Vice President
Mr. Cohen also serves as Vice President of other funds. Mr. Cohen serves as Co-Head of Global Equity Research (2016-present), a Director of Fidelity Management & Research (Japan) Limited (investment adviser firm, 2016-present), and is an employee of Fidelity Investments. Previously, Mr. Cohen served as Chief Investment Officer - Equity and a Director of Fidelity Management & Research (U.K.) Inc. (investment adviser firm, 2013-2015) and as a Director of Fidelity Management & Research (Hong Kong) Limited (investment adviser firm, 2017).
Jonathan Davis (1968)
Year of Election or Appointment: 2010
Assistant Treasurer
Mr. Davis also serves as Assistant Treasurer of other funds. Mr. Davis serves as Assistant Treasurer of FMR Capital, Inc. (2017-present) and is an employee of Fidelity Investments. Previously, Mr. Davis served as Vice President and Associate General Counsel of FMR LLC (diversified financial services company, 2003-2010).
Adrien E. Deberghes (1967)
Year of Election or Appointment: 2016
Assistant Treasurer
Mr. Deberghes also serves as an officer of other funds. He serves as Assistant Treasurer of FMR Capital, Inc. (2017-present), Executive Vice President of Fidelity Investments Money Management, Inc. (FIMM) (investment adviser firm, 2016-present), and is an employee of Fidelity Investments (2008-present). Previously, Mr. Deberghes served as President and Treasurer of certain Fidelity® funds (2013-2018). Prior to joining Fidelity Investments, Mr. Deberghes was Senior Vice President of Mutual Fund Administration at State Street Corporation (2007-2008), Senior Director of Mutual Fund Administration at Investors Bank & Trust (2005-2007), and Director of Finance for Dunkin' Brands (2000-2005). Previously, Mr. Deberghes served in other fund officer roles.
Laura M. Del Prato (1964)
Year of Election or Appointment: 2018
Assistant Treasurer
Ms. Del Prato also serves as an officer of other funds. Ms. Del Prato is an employee of Fidelity Investments (2017-present). Prior to joining Fidelity Investments, Ms. Del Prato served as a Managing Director and Treasurer of the JPMorgan Mutual Funds (2014-2017). Prior to JPMorgan, Ms. Del Prato served as a partner at Cohen Fund Audit Services (accounting firm, 2012-2013) and KPMG LLP (accounting firm, 2004-2012).
Colm A. Hogan (1973)
Year of Election or Appointment: 2016
Deputy Treasurer
Mr. Hogan also serves as an officer of other funds. Mr. Hogan serves as Assistant Treasurer of FMR Capital, Inc. (2017-present) and is an employee of Fidelity Investments (2005-present). Previously, Mr. Hogan served as Assistant Treasurer of certain Fidelity® funds (2016-2018).
Pamela R. Holding (1964)
Year of Election or Appointment: 2018
Vice President
Ms. Holding also serves as Vice President of other funds. Ms. Holding serves as Co-Head of Global Equity Research (2018-present) and is an employee of Fidelity Investments (2013-present).
Chris Maher (1972)
Year of Election or Appointment: 2013
Assistant Treasurer
Mr. Maher serves as Assistant Treasurer of other funds. Mr. Maher is Vice President of Valuation Oversight, serves as Assistant Treasurer of FMR Capital, Inc. (2017-present), and is an employee of Fidelity Investments. Previously, Mr. Maher served as Vice President of Asset Management Compliance (2013), Vice President of the Program Management Group of FMR (investment adviser firm, 2010-2013), and Vice President of Valuation Oversight (2008-2010).
Rieco E. Mello (1969)
Year of Election or Appointment: 2017
Assistant Treasurer
Mr. Mello also serves as Assistant Treasurer of other funds. Mr. Mello serves as Assistant Treasurer of FMR Capital, Inc. (2017-present) and is an employee of Fidelity Investments (1995-present).
Kenneth B. Robins (1969)
Year of Election or Appointment: 2016
Chief Compliance Officer
Mr. Robins also serves as an officer of other funds. Mr. Robins serves as Compliance Officer of Fidelity Management & Research Company and FMR Co., Inc. (investment adviser firms, 2016-present) and is an employee of Fidelity Investments (2004-present). Previously, Mr. Robins served as Executive Vice President of Fidelity Investments Money Management, Inc. (investment adviser firm, 2013-2016) and served in other fund officer roles.
Stacie M. Smith (1974)
Year of Election or Appointment: 2016
President and Treasurer
Ms. Smith also serves as an officer of other funds. Ms. Smith serves as Assistant Treasurer of FMR Capital, Inc. (2017-present), is an employee of Fidelity Investments (2009-present), and has served in other fund officer roles. Prior to joining Fidelity Investments, Ms. Smith served as Senior Audit Manager of Ernst & Young LLP (accounting firm, 1996-2009). Previously, Ms. Smith served as Assistant Treasurer (2013-2018) and Deputy Treasurer (2013-2016) of certain Fidelity® funds.
Marc L. Spector (1972)
Year of Election or Appointment: 2016
Assistant Treasurer
Mr. Spector also serves as an officer of other funds. Mr. Spector serves as Assistant Treasurer of FMR Capital, Inc. (2017-present) and is an employee of Fidelity Investments (2016-present). Prior to joining Fidelity Investments, Mr. Spector served as Director at the Siegfried Group (accounting firm, 2013-2016), and prior to Siegfried Group as audit senior manager at Deloitte & Touche (accounting firm, 2005-2013).
Shareholder Expense Example
As a shareholder of a Fund, you incur two types of costs: (1) transaction costs, including sales charges (loads) on purchase payments or redemption proceeds, redemption fees and (2) ongoing costs, including management fees, distribution and/or service (12b-1) fees and other Fund expenses. This Example is intended to help you understand your ongoing costs (in dollars) of investing in the Funds and to compare these costs with the ongoing costs of investing in other mutual funds.
The actual expense Example is based on an investment of $1,000 invested at the beginning of the period and held for the entire period (May 1, 2018 to October 31, 2018) for Class A, Class M, Class C, Emerging Markets Discovery, Total Emerging Markets and Class I, and for the period (October 2, 2018 to October 31, 2018) for Class Z. The hypothetical expense Example is based on an investment of $1,000 invested for one-half year period (May 1, 2018 to October 31, 2018).
Actual Expenses
The first line of the accompanying table for each Class of each fund provides information about actual account values and actual expenses. You may use the information in this line, together with the amount you invested, to estimate the expenses that you paid over the period. Simply divide your account value by $1,000.00 (for example, an $8,600 account value divided by $1,000.00 = 8.6), then multiply the result by the number in the first line for a Class of the fund under the heading entitled "Expenses Paid During Period" to estimate the expenses you paid on your account during this period. A small balance maintenance fee of $12.00 that is charged once a year may apply for certain accounts with a value of less than $2,000. This fee, which was eliminated effective August 1, 2018, is not included in the table below. If it was, the estimate of expenses you paid during the period would be higher, and your ending account value lower, by this amount. In addition, each Fund, as a shareholder in the underlying Fidelity Central Funds, will indirectly bear its pro-rata share of the fees and expenses incurred by the underlying Fidelity Central Funds. These fees and expenses are not included in the Fund's annualized expense ratio used to calculate the expense estimate in the table below.
Hypothetical Example for Comparison Purposes
The second line of the accompanying table for each Class of each fund provides information about hypothetical account values and hypothetical expenses based on a Class' actual expense ratio and an assumed rate of return of 5% per year before expenses, which is not the Class' actual return. The hypothetical account values and expenses may not be used to estimate the actual ending account balance or expenses you paid for the period. You may use this information to compare the ongoing costs of investing in the Fund and other funds. To do so, compare this 5% hypothetical example with the 5% hypothetical examples that appear in the shareholder reports of the other funds. A small balance maintenance fee of $12.00 that is charged once a year may apply for certain accounts with a value of less than $2,000. This fee, which was eliminated effective August 1, 2018, is not included in the table below. If it was, the estimate of expenses you paid during the period would be higher, and your ending account value lower, by this amount. In addition, each Fund, as a shareholder in the underlying Fidelity Central Funds, will indirectly bear its pro-rata share of the fees and expenses incurred by the underlying Fidelity Central Funds. These fees and expenses are not included in the Fund's annualized expense ratio used to calculate the expense estimate in the table below.
Please note that the expenses shown in the table are meant to highlight your ongoing costs only and do not reflect any transaction costs. Therefore, the second line of the table is useful in comparing ongoing costs only, and will not help you determine the relative total costs of owning different funds. In addition, if these transactional costs were included, your costs would have been higher.
| | Annualized Expense Ratio-A | Beginning
Account Value | Ending
Account Value
October 31, 2018 | Expenses Paid
During Period |
| Fidelity Emerging Markets Discovery Fund | | | | |
| Class A | 1.54% | | | |
| Actual | | $1,000.00 | $773.30 | $6.88-B |
| Hypothetical-C | | $1,000.00 | $1,017.44 | $7.83-D |
| Class M | 1.82% | | | |
| Actual | | $1,000.00 | $772.80 | $8.13-B |
| Hypothetical-C | | $1,000.00 | $1,016.03 | $9.25-D |
| Class C | 2.32% | | | |
| Actual | | $1,000.00 | $770.70 | $10.35-B |
| Hypothetical-C | | $1,000.00 | $1,013.51 | $11.77-D |
| Emerging Markets Discovery | 1.25% | | | |
| Actual | | $1,000.00 | $774.60 | $5.59-B |
| Hypothetical-C | | $1,000.00 | $1,018.90 | $6.36-D |
| Class I | 1.24% | | | |
| Actual | | $1,000.00 | $775.10 | $5.55- B |
| Hypothetical-C | | $1,000.00 | $1,018.95 | $6.31-D |
| Class Z | 1.02% | | | |
| Actual | | $1,000.00 | $919.60 | $.80-B |
| Hypothetical-C | | $1,000.00 | $1,020.06 | $5.19-D |
| Fidelity Total Emerging Markets Fund | | | | |
| Class A | 1.41% | | | |
| Actual | | $1,000.00 | $865.00 | $6.63-B |
| Hypothetical-C | | $1,000.00 | $1,018.10 | $7.17-D |
| Class M | 1.75% | | | |
| Actual | | $1,000.00 | $863.50 | $8.22-B |
| Hypothetical-C | | $1,000.00 | $1,016.38 | $8.89-D |
| Class C | 2.15% | | | |
| Actual | | $1,000.00 | $861.70 | $10.09-B |
| Hypothetical-C | | $1,000.00 | $1,014.37 | $10.92-D |
| Total Emerging Markets | 1.14% | | | |
| Actual | | $1,000.00 | $865.90 | $5.36-B |
| Hypothetical-C | | $1,000.00 | $1,019.46 | $5.80-D |
| Class I | 1.13% | | | |
| Actual | | $1,000.00 | $865.80 | $5.31-B |
| Hypothetical-C | | $1,000.00 | $1,019.51 | $5.75-D |
| Class Z | 1.04% | | | |
| Actual | | $1,000.00 | $949.10 | $.83-B |
| Hypothetical-C | | $1,000.00 | $1,019.96 | $5.30-D |
A Annualized expense ratio reflects expenses net of applicable fee waivers.
B Actual expenses are equal to each Class' annualized expense ratio, multiplied by the average account value over the period, multiplied by 184/ 365 (to reflect the one-half year period) for Class A, Class M, Class C, Emerging Markets Discovery, Total Emerging Markets and Class I, and multiplied by 30/365 (to reflect the period October 2, 2018 to October 31, 2018) for Class Z.
C 5% return per year before expenses
D Hypothetical expenses are equal to each Class' annualized expense ratio, multiplied by the average account value over the period, multiplied by 184/365 (to reflect the one-half year period).
Distributions (Unaudited)
The Board of Trustees of each fund voted to pay to shareholders of record at the opening of business on record date, the following distributions per share derived from capital gains realized from sales of portfolio securities and dividends derived from net investment income:
| | Pay Date | Record Date | Dividends | Capital Gains |
| Fidelity Emerging Markets Discovery Fund | | | | |
| Class A | 12/17/18 | 12/14/18 | $0.180 | $0.008 |
| Class M | 12/17/18 | 12/14/18 | $0.098 | $0.008 |
| Class C | 12/17/18 | 12/14/18 | $0.051 | $0.008 |
| Emerging Markets Discovery | 12/17/18 | 12/14/18 | $0.222 | $0.008 |
| Class I | 12/17/18 | 12/14/18 | $0.218 | $0.008 |
| Class Z | 12/17/18 | 12/14/18 | $0.256 | $0.008 |
| Fidelity Total Emerging Markets Fund | | | | |
| Class A | 12/17/18 | 12/14/18 | $0.242 | $0.000 |
| Class M | 12/17/18 | 12/14/18 | $0.207 | $0.000 |
| Class C | 12/17/18 | 12/14/18 | $0.152 | $0.000 |
| Total Emerging Markets | 12/17/18 | 12/14/18 | $0.279 | $0.000 |
| Class I | 12/17/18 | 12/14/18 | $0.284 | $0.000 |
| Class Z | 12/17/18 | 12/14/18 | $0.310 | $0.000 |
|
A percentage of the dividends distributed during the fiscal year for the following funds may be taken into account as a dividend for purposes of the maximum rate under section 1(h)(11) of the Internal Revenue Code.
| | Class A | Class M | Class C | Retail Class | Class I |
| Fidelity Emerging Markets Discovery Fund | | | | | |
| December 15, 2017 | 51% | 60% | 68% | 45% | 45% |
| Fidelity Total Emerging Markets Fund | | | | | |
| December 15, 2017 | 37% | 41% | 48% | 35% | 34% |
|
The amounts per share which represent income derived from sources within, and taxes paid to, foreign countries or possessions of the United States are as follows:
| | Pay Date | Income | Taxes |
| Fidelity Emerging Markets Discovery Fund | | | |
| Class A | 12/18/17 | $0.1720 | $0.0180 |
| Class M | 12/18/17 | $0.1447 | $0.0180 |
| Class C | 12/18/17 | $0.1274 | $0.0180 |
| Emerging Markets Discovery | 12/18/17 | $0.1950 | $0.0180 |
| Class I | 12/18/17 | $0.1965 | $0.0180 |
| Fidelity Total Emerging Markets Fund | | | |
| Class A | 12/18/17 | $0.2118 | $0.0135 |
| Class M | 12/18/17 | $0.1914 | $0.0135 |
| Class C | 12/18/17 | $0.1635 | $0.0135 |
| Total Emerging Markets | 12/18/17 | $0.2247 | $0.0135 |
| Class I | 12/18/17 | $0.2330 | $0.0135 |
|
The funds will notify shareholders in January 2019 of amounts for use in preparing 2018 income tax returns.
Board Approval of Investment Advisory Contracts
Fidelity Emerging Markets Discovery Fund
Fidelity Total Emerging Markets Fund At its July 2018 meeting, the Board of Trustees, including the Independent Trustees (together, the Board), voted to continue the management contracts with Fidelity Management & Research Company (FMR) and the sub-advisory agreements (together, the Advisory Contracts) for the funds for six months through January 31, 2019, in connection with the reunification of the Fidelity Equity High Income Funds Board, which oversees the funds, and the Sector Portfolios Board.
The Board considered that the approval of the funds' Advisory Contracts will not result in any changes in (i) the investment process or strategies employed in the management of the funds' assets; (ii) the fees and expenses paid by shareholders, including the expense cap arrangement currently in place for each fund; (iii) the nature, extent or quality of services provided under the funds' Advisory Contracts; or (iv) the day-to-day management of each fund or the persons primarily responsible for such management. The Board concluded that the funds' Advisory Contracts are fair and reasonable, and that the funds' Advisory Contracts should be renewed, without modification, through January 31, 2019, with the understanding that the Board will consider the annual renewal for a full one year period in January 2019.
In connection with its consideration of future renewals of the funds' Advisory Contracts, the Board will consider: (i) the nature, extent and quality of services provided to the funds, including shareholder and administrative services and investment performance; (ii) the competitiveness of the management fee and total expenses for each fund; (iii) the costs of the services and profitability, including the revenues earned and the expenses incurred in conducting the business of developing, marketing, distributing, managing, administering, and servicing each fund and its shareholders, to the extent applicable, as well as potential fall-out benefits from Fidelity's non-fund businesses; and (iv) whether there have been economies of scale in respect of the Fidelity funds, whether the Fidelity funds (including the funds) have appropriately benefited from any such economies of scale, and whether there is the potential for realization of any further economies.
Based on its evaluation of all of the conclusions noted above, and after considering all factors it believed relevant, the Board ultimately concluded that the funds' management fee structures are fair and reasonable, and that the continuation of the funds' Advisory Contracts should be approved.
EMD-TEK-ANN-1218
1.931237.106
Fidelity® Global Equity Income Fund
Annual Report October 31, 2018 |
|
Contents
To view a fund's proxy voting guidelines and proxy voting record for the 12-month period ended June 30, visit http://www.fidelity.com/proxyvotingresults or visit the Securities and Exchange Commission's (SEC) web site at http://www.sec.gov.
You may also call 1-800-544-8544 to request a free copy of the proxy voting guidelines.
Standard & Poor's, S&P and S&P 500 are registered service marks of The McGraw-Hill Companies, Inc. and have been licensed for use by Fidelity Distributors Corporation.
Other third-party marks appearing herein are the property of their respective owners.
All other marks appearing herein are registered or unregistered trademarks or service marks of FMR LLC or an affiliated company. © 2018 FMR LLC. All rights reserved.
This report and the financial statements contained herein are submitted for the general information of the shareholders of the Fund. This report is not authorized for distribution to prospective investors in the Fund unless preceded or accompanied by an effective prospectus.
A fund files its complete schedule of portfolio holdings with the SEC for the first and third quarters of each fiscal year on Form N-Q. Forms N-Q are available on the SEC’s web site at http://www.sec.gov. A fund's Forms N-Q may be reviewed and copied at the SEC’s Public Reference Room in Washington, DC. Information regarding the operation of the SEC's Public Reference Room may be obtained by calling 1-800-SEC-0330.
For a complete list of a fund's portfolio holdings, view the most recent holdings listing, semiannual report, or annual report on Fidelity's web site at http://www.fidelity.com, http://www.institutional.fidelity.com, or http://www.401k.com, as applicable.
NOT FDIC INSURED •MAY LOSE VALUE •NO BANK GUARANTEE
Neither the Fund nor Fidelity Distributors Corporation is a bank.
Performance: The Bottom Line
Average annual total return reflects the change in the value of an investment, assuming reinvestment of distributions from dividend income and capital gains (the profits earned upon the sale of securities that have grown in value, if any) and assuming a constant rate of performance each year. The hypothetical investment and the average annual total returns do not reflect the deduction of taxes that a shareholder would pay on fund distributions or the redemption of fund shares. During periods of reimbursement by Fidelity, a fund’s total return will be greater than it would be had the reimbursement not occurred. How a fund did yesterday is no guarantee of how it will do tomorrow.
Average Annual Total Returns
| For the periods ended October 31, 2018 | Past 1 year | Past 5 years | Life of fundA |
| Fidelity® Global Equity Income Fund | (1.88)% | 6.26% | 8.51% |
A From May 2, 2012
$10,000 Over Life of Fund
Let's say hypothetically that $10,000 was invested in Fidelity® Global Equity Income Fund on May 2, 2012, when the fund started.
The chart shows how the value of your investment would have changed, and also shows how the MSCI ACWI (All Country World Index) Index performed over the same period.
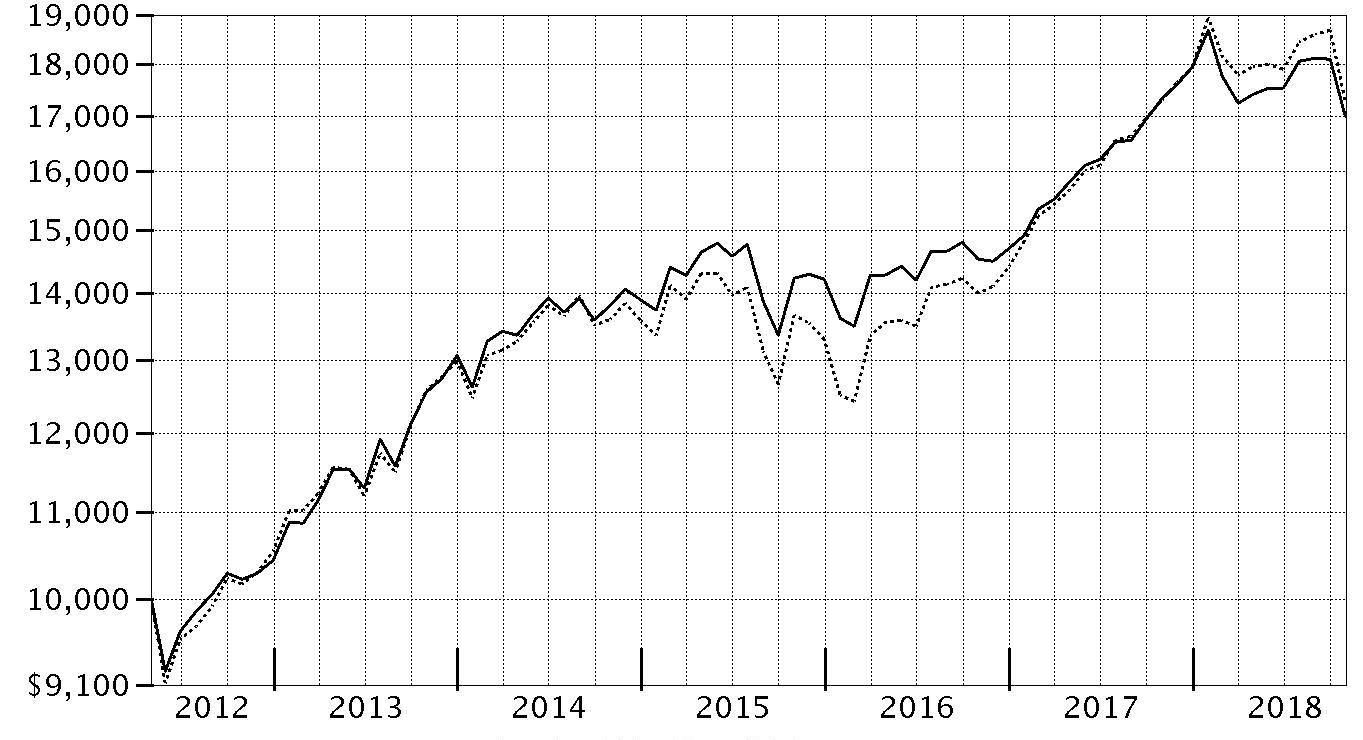
| Period Ending Values |
| $17,004 | Fidelity® Global Equity Income Fund |
| $17,285 | MSCI ACWI (All Country World Index) Index |
Management's Discussion of Fund Performance
Market Recap: Global equities returned -0.14% for the 12 months ending October 31, 2018, according to the MSCI ACWI (All Country World Index) Index. A modestly positive first half of the period gave way to a confluence of negative factors – including escalating trade tension, a surging U.S. dollar, tepid economic growth in Europe, global central bank tightening, concerns about Italy’s budget stalemate with the EU, and weakness in China’s stock market – that yielded a -4% second-half return. The index lost 7.5% in October alone, its largest monthly drop in more than six years. Among sectors, economically sensitive materials (-8%), financials (-6%) and industrials (-5%) stocks suffered from concerns about slowing growth in some key markets. Rising interest rates in the U.S. exerted pressure on real estate (-4%) and utilities (-2%). Conversely, information technology (+9%) benefited from better-than-expected earnings from some major index constituents. Stable profit growth helped health care (+8%) perform well, while elevated crude-oil prices supported energy (+5%). Regionally, emerging markets (-12%) fared the worst, hampered by the impact of foreign exchange and concerns about economic weakness in China, India and South Korea. Sluggish growth pressured shares in continental Europe (-9%). Stocks in Japan (-3%) and the U.K. (-4%) held up better, followed by Canada (-5%) and Asia-Pacific ex Japan (-6%). The U.S. (+7%) was the only region with a positive return, helped by steady economic and corporate profit growth.
Comments from Portfolio Manager Ramona Persaud: For the year, the fund returned -1.88%, behind the -0.14% result of the benchmark MSCI ACWI (All Country World Index) Index. Mixed performance among global stocks, along with investors’ preference for growth over value for much of the 12 months, provided a challenging backdrop for the fund, given its focus on value- and quality-oriented stocks and sectors. A few specific stocks particularly detracted, including U.K. software & services firm Micro Focus International. Its shares returned about -54% the past year, significantly declining in mid-March after the firm announced the resignation of CEO Chris Hsu, who had been on the job just a few months, and issued a profit warning as it struggled to integrate its acquisition of software assets from Hewlett Packard Enterprise, completed in September 2017. Elsewhere, ongoing concerns regarding demand for traditional tobacco products and the growing popularity of e-cigarettes as an alternative hurt shares of fund holding British American Tobacco (-30%). Conversely, ConocoPhillips (+39%) contributed more than any other fund position, driven higher by higher oil prices, new discoveries and stronger-than-expected financial results, including reduced debt.
The views expressed above reflect those of the portfolio manager(s) only through the end of the period as stated on the cover of this report and do not necessarily represent the views of Fidelity or any other person in the Fidelity organization. Any such views are subject to change at any time based upon market or other conditions and Fidelity disclaims any responsibility to update such views. These views may not be relied on as investment advice and, because investment decisions for a Fidelity fund are based on numerous factors, may not be relied on as an indication of trading intent on behalf of any Fidelity fund.
Investment Summary (Unaudited)
Geographic Diversification (% of fund's net assets)
| As of October 31, 2018 |
| | United States of America* | 49.8% |
| | United Kingdom | 11.4% |
| | Japan | 7.4% |
| | Switzerland | 4.6% |
| | Canada | 4.4% |
| | Germany | 2.8% |
| | Netherlands | 2.6% |
| | France | 2.4% |
| | Spain | 1.5% |
| | Other | 13.1% |

* Includes Short-Term investments and Net Other Assets (Liabilities).
Percentages are based on country or territory of incorporation and are adjusted for the effect of futures contracts, if applicable.
Asset Allocation as of October 31, 2018
| | % of fund's net assets |
| Stocks | 98.7 |
| Short-Term Investments and Net Other Assets (Liabilities) | 1.3 |
Top Ten Stocks as of October 31, 2018
| | % of fund's net assets |
| Apple, Inc. (United States of America, Technology Hardware, Storage & Peripherals) | 3.7 |
| Microsoft Corp. (United States of America, Software) | 3.2 |
| American Tower Corp. (United States of America, Equity Real Estate Investment Trusts (REITs)) | 2.0 |
| Bank of America Corp. (United States of America, Banks) | 2.0 |
| Nestle SA (Reg. S) (Switzerland, Food Products) | 1.9 |
| Verizon Communications, Inc. (United States of America, Diversified Telecommunication Services) | 1.9 |
| JPMorgan Chase & Co. (United States of America, Banks) | 1.9 |
| Amgen, Inc. (United States of America, Biotechnology) | 1.9 |
| Chevron Corp. (United States of America, Oil, Gas & Consumable Fuels) | 1.8 |
| Wells Fargo & Co. (United States of America, Banks) | 1.8 |
| | 22.1 |
Top Market Sectors as of October 31, 2018
| | % of fund's net assets |
| Financials | 20.2 |
| Health Care | 14.3 |
| Information Technology | 13.7 |
| Consumer Staples | 13.5 |
| Energy | 9.7 |
| Industrials | 9.6 |
| Communication Services | 8.0 |
| Consumer Discretionary | 5.4 |
| Real Estate | 2.0 |
| Materials | 1.7 |
Schedule of Investments October 31, 2018
Showing Percentage of Net Assets
| Common Stocks - 97.6% | | | |
| | | Shares | Value |
| Bailiwick of Jersey - 1.5% | | | |
| Ferguson PLC | | 3,727 | $251,674 |
| Shire PLC | | 7,800 | 470,737 |
| WPP PLC | | 26,600 | 300,998 |
|
| TOTAL BAILIWICK OF JERSEY | | | 1,023,409 |
|
| Belgium - 0.8% | | | |
| KBC Groep NV | | 7,945 | 548,033 |
| Bermuda - 1.0% | | | |
| Hiscox Ltd. | | 12,200 | 253,871 |
| IHS Markit Ltd. (a) | | 7,400 | 388,722 |
|
| TOTAL BERMUDA | | | 642,593 |
|
| Canada - 4.4% | | | |
| Alimentation Couche-Tard, Inc. Class B (sub. vtg.) | | 8,300 | 396,385 |
| Constellation Software, Inc. | | 1,300 | 894,689 |
| Fairfax Financial Holdings Ltd. (sub. vtg.) | | 541 | 262,887 |
| Imperial Oil Ltd. | | 17,300 | 540,374 |
| Suncor Energy, Inc. | | 27,900 | 935,899 |
|
| TOTAL CANADA | | | 3,030,234 |
|
| Cayman Islands - 0.6% | | | |
| Best Pacific International Holdings Ltd. | | 138,000 | 35,195 |
| SITC International Holdings Co. Ltd. | | 465,000 | 341,548 |
| Value Partners Group Ltd. | | 53,000 | 39,335 |
|
| TOTAL CAYMAN ISLANDS | | | 416,078 |
|
| China - 0.3% | | | |
| Kweichow Moutai Co. Ltd. (A Shares) | | 1,400 | 110,163 |
| Shanghai International Airport Co. Ltd. (A Shares) | | 13,168 | 93,536 |
| Zhengzhou Yutong Bus Co. Ltd. | | 11,600 | 17,727 |
|
| TOTAL CHINA | | | 221,426 |
|
| France - 2.4% | | | |
| Amundi SA (b) | | 2,600 | 154,842 |
| Compagnie de St. Gobain | | 8,500 | 320,207 |
| Edenred SA | | 3,087 | 117,237 |
| Sanofi SA | | 7,000 | 625,524 |
| VINCI SA | | 4,700 | 418,297 |
|
| TOTAL FRANCE | | | 1,636,107 |
|
| Germany - 2.8% | | | |
| Deutsche Post AG | | 8,809 | 278,147 |
| Deutsche Telekom AG | | 11,000 | 180,418 |
| Hannover Reuck SE | | 2,000 | 269,797 |
| Linde PLC | | 3,696 | 606,382 |
| SAP SE | | 5,519 | 590,939 |
|
| TOTAL GERMANY | | | 1,925,683 |
|
| Hong Kong - 0.8% | | | |
| AIA Group Ltd. | | 28,200 | 213,425 |
| Techtronic Industries Co. Ltd. | | 63,500 | 297,177 |
|
| TOTAL HONG KONG | | | 510,602 |
|
| India - 0.7% | | | |
| HDFC Asset Management Co. Ltd. (a) | | 1,900 | 35,978 |
| HDFC Bank Ltd. sponsored ADR | | 1,800 | 160,038 |
| Housing Development Finance Corp. Ltd. | | 5,600 | 133,962 |
| Reliance Industries Ltd. | | 11,000 | 157,839 |
|
| TOTAL INDIA | | | 487,817 |
|
| Ireland - 1.4% | | | |
| Accenture PLC Class A | | 4,640 | 731,357 |
| Paddy Power Betfair PLC (Ireland) | | 2,700 | 233,031 |
|
| TOTAL IRELAND | | | 964,388 |
|
| Israel - 0.6% | | | |
| Ituran Location & Control Ltd. | | 11,200 | 382,144 |
| Japan - 7.4% | | | |
| A/S One Corp. | | 2,600 | 184,801 |
| Aucnet, Inc. | | 9,500 | 99,601 |
| Broadleaf Co. Ltd. | | 19,900 | 114,989 |
| Daiichikosho Co. Ltd. | | 22,900 | 1,055,346 |
| Hoya Corp. | | 20,200 | 1,148,250 |
| Inaba Denki Sangyo Co. Ltd. | | 8,000 | 322,240 |
| Japan Meat Co. Ltd. | | 18,600 | 337,103 |
| Minebea Mitsumi, Inc. | | 21,500 | 328,908 |
| Mitani Shoji Co. Ltd. | | 3,500 | 166,881 |
| Nippon Telegraph & Telephone Corp. | | 8,900 | 367,024 |
| Nitori Holdings Co. Ltd. | | 900 | 117,530 |
| Ryohin Keikaku Co. Ltd. | | 200 | 52,838 |
| Sony Corp. | | 8,400 | 454,581 |
| Tsuruha Holdings, Inc. | | 3,200 | 333,514 |
|
| TOTAL JAPAN | | | 5,083,606 |
|
| Kenya - 0.5% | | | |
| Safaricom Ltd. | | 1,382,200 | 314,752 |
| Luxembourg - 0.6% | | | |
| B&M European Value Retail S.A. | | 78,956 | 420,641 |
| Multi-National - 0.7% | | | |
| HKT Trust/HKT Ltd. unit | | 351,600 | 484,227 |
| Netherlands - 2.6% | | | |
| LyondellBasell Industries NV Class A | | 5,900 | 526,693 |
| NXP Semiconductors NV | | 2,600 | 194,974 |
| Unilever NV (Certificaten Van Aandelen) (Bearer) | | 20,079 | 1,078,945 |
|
| TOTAL NETHERLANDS | | | 1,800,612 |
|
| Norway - 0.8% | | | |
| Equinor ASA | | 21,463 | 558,357 |
| Panama - 0.4% | | | |
| Carnival Corp. | | 5,000 | 280,200 |
| Spain - 0.9% | | | |
| Amadeus IT Holding SA Class A | | 2,300 | 185,431 |
| CaixaBank SA | | 50,000 | 202,336 |
| Prosegur Cash SA (b) | | 127,800 | 253,317 |
|
| TOTAL SPAIN | | | 641,084 |
|
| Sweden - 0.9% | | | |
| AddTech AB (B Shares) | | 5,300 | 108,303 |
| Essity AB Class B | | 8,000 | 182,622 |
| HEXPOL AB (B Shares) | | 9,300 | 86,078 |
| Loomis AB (B Shares) | | 5,700 | 176,273 |
| Radisson Hospitality AB (a) | | 18,400 | 71,077 |
|
| TOTAL SWEDEN | | | 624,353 |
|
| Switzerland - 4.6% | | | |
| Banque Cantonale Vaudoise | | 470 | 351,398 |
| Chubb Ltd. | | 3,600 | 449,676 |
| Nestle SA (Reg. S) | | 15,345 | 1,295,473 |
| Roche Holding AG (participation certificate) | | 3,000 | 730,087 |
| Swatch Group AG (Bearer) | | 980 | 331,613 |
|
| TOTAL SWITZERLAND | | | 3,158,247 |
|
| Taiwan - 1.0% | | | |
| Taiwan Semiconductor Manufacturing Co. Ltd. | | 94,000 | 705,295 |
| United Kingdom - 11.4% | | | |
| AstraZeneca PLC sponsored ADR | | 19,100 | 740,698 |
| BP PLC | | 58,500 | 422,588 |
| British American Tobacco PLC (United Kingdom) | | 19,278 | 835,706 |
| Bunzl PLC | | 15,800 | 466,719 |
| Cineworld Group PLC | | 75,000 | 282,418 |
| Compass Group PLC | | 15,500 | 305,106 |
| Conviviality PLC (c) | | 62,820 | 1 |
| Cranswick PLC | | 4,400 | 162,536 |
| GlaxoSmithKline PLC | | 27,653 | 535,577 |
| Hastings Group Holdings PLC (b) | | 71,432 | 169,004 |
| Hilton Food Group PLC | | 58,600 | 690,601 |
| Imperial Tobacco Group PLC | | 11,756 | 398,654 |
| Melrose Industries PLC | | 137,654 | 296,739 |
| Micro Focus International PLC | | 54,158 | 839,569 |
| Moneysupermarket.com Group PLC | | 92,244 | 345,819 |
| Nielsen Holdings PLC | | 7,400 | 192,252 |
| Reckitt Benckiser Group PLC | | 5,400 | 436,666 |
| Rolls-Royce Holdings PLC | | 8,500 | 91,156 |
| St. James's Place Capital PLC | | 25,521 | 330,613 |
| Standard Life PLC | | 73,825 | 255,252 |
|
| TOTAL UNITED KINGDOM | | | 7,797,674 |
|
| United States of America - 48.5% | | | |
| Altria Group, Inc. | | 11,100 | 721,944 |
| Ameren Corp. | | 3,300 | 213,114 |
| American Tower Corp. | | 8,760 | 1,364,896 |
| AMETEK, Inc. | | 11,200 | 751,296 |
| Amgen, Inc. | | 6,620 | 1,276,270 |
| Apple, Inc. | | 11,650 | 2,549,719 |
| Bank of America Corp. | | 49,080 | 1,349,700 |
| Becton, Dickinson & Co. | | 3,300 | 760,650 |
| Bristol-Myers Squibb Co. | | 6,100 | 308,294 |
| Capital One Financial Corp. | | 9,100 | 812,630 |
| Cedar Fair LP (depositary unit) | | 4,100 | 210,166 |
| Charter Communications, Inc. Class A (a) | | 1,200 | 384,444 |
| Chevron Corp. | | 11,065 | 1,235,407 |
| Citigroup, Inc. | | 15,700 | 1,027,722 |
| Comcast Corp. Class A | | 14,700 | 560,658 |
| ConocoPhillips Co. | | 16,500 | 1,153,350 |
| Danaher Corp. | | 4,900 | 487,060 |
| Delek U.S. Holdings, Inc. | | 4,000 | 146,880 |
| Diamond Hill Investment Group, Inc. | | 1,000 | 172,180 |
| DowDuPont, Inc. | | 10,640 | 573,709 |
| Enterprise Products Partners LP | | 6,400 | 171,648 |
| Exxon Mobil Corp. | | 9,630 | 767,318 |
| Fortive Corp. | | 4,200 | 311,850 |
| General Dynamics Corp. | | 1,300 | 224,354 |
| General Electric Co. | | 25,000 | 252,500 |
| Interpublic Group of Companies, Inc. | | 10,700 | 247,812 |
| Johnson & Johnson | | 7,600 | 1,063,924 |
| JPMorgan Chase & Co. | | 11,730 | 1,278,805 |
| Lowe's Companies, Inc. | | 4,700 | 447,534 |
| MetLife, Inc. | | 5,400 | 222,426 |
| Microsoft Corp. | | 20,664 | 2,207,122 |
| MSCI, Inc. | | 2,400 | 360,912 |
| Northrop Grumman Corp. | | 900 | 235,755 |
| NRG Energy, Inc. | | 5,200 | 188,188 |
| Packaging Corp. of America | | 900 | 82,629 |
| PepsiCo, Inc. | | 6,300 | 707,994 |
| Philip Morris International, Inc. | | 3,900 | 343,473 |
| Phillips 66 Co. | | 3,500 | 359,870 |
| S&P Global, Inc. | | 2,140 | 390,165 |
| SunTrust Banks, Inc. | | 12,400 | 776,984 |
| The Coca-Cola Co. | | 16,400 | 785,232 |
| The J.M. Smucker Co. | | 3,500 | 379,120 |
| The Travelers Companies, Inc. | | 1,900 | 237,747 |
| U.S. Bancorp | | 17,580 | 918,907 |
| United Technologies Corp. | | 3,100 | 385,051 |
| UnitedHealth Group, Inc. | | 3,700 | 966,995 |
| Valero Energy Corp. | | 3,900 | 355,251 |
| Verizon Communications, Inc. | | 22,600 | 1,290,234 |
| Wells Fargo & Co. | | 22,657 | 1,206,032 |
|
| TOTAL UNITED STATES OF AMERICA | | | 33,225,921 |
|
| TOTAL COMMON STOCKS | | | |
| (Cost $56,384,825) | | | 66,883,483 |
|
| Nonconvertible Preferred Stocks - 1.1% | | | |
| Brazil - 0.5% | | | |
| Itau Unibanco Holding SA | | 27,200 | 359,962 |
| Spain - 0.6% | | | |
| Grifols SA Class B | | 18,900 | 392,771 |
| United Kingdom - 0.0% | | | |
| Rolls-Royce Holdings PLC Series C (a) | | 391,000 | 500 |
| TOTAL NONCONVERTIBLE PREFERRED STOCKS | | | |
| (Cost $680,138) | | | 753,233 |
| | | Principal Amount(d) | Value |
|
| Nonconvertible Bonds - 0.0% | | | |
| Canada - 0.0% | | | |
| Constellation Software, Inc. Canada Consumer Price Index + 6.500% 8.1% 3/31/40(e)(f) | CAD | | |
| (Cost $2,060) | | CAD 2,400 | 2,283 |
| | | Shares | Value |
|
| Money Market Funds - 1.7% | | | |
| Fidelity Cash Central Fund, 2.23% (g) | | | |
| (Cost $1,198,277) | | 1,198,038 | 1,198,277 |
| TOTAL INVESTMENT IN SECURITIES - 100.4% | | | |
| (Cost $58,265,300) | | | 68,837,276 |
| NET OTHER ASSETS (LIABILITIES) - (0.4)% | | | (305,677) |
| NET ASSETS - 100% | | | $68,531,599 |
Currency Abbreviations
CAD – Canadian dollar
Categorizations in the Schedule of Investments are based on country or territory of incorporation.
Legend
(a) Non-income producing
(b) Security exempt from registration under Rule 144A of the Securities Act of 1933. These securities may be resold in transactions exempt from registration, normally to qualified institutional buyers. At the end of the period, the value of these securities amounted to $577,163 or 0.8% of net assets.
(c) Level 3 security
(d) Amount is stated in United States dollars unless otherwise noted.
(e) Coupon rates for floating and adjustable rate securities reflect the rates in effect at period end.
(f) Coupon is indexed to a floating interest rate which may be multiplied by a specified factor and/or subject to caps or floors.
(g) Affiliated fund that is generally available only to investment companies and other accounts managed by Fidelity Investments. The rate quoted is the annualized seven-day yield of the fund at period end. A complete unaudited listing of the fund's holdings as of its most recent quarter end is available upon request. In addition, each Fidelity Central Fund's financial statements, which are not covered by the Fund's Report of Independent Registered Public Accounting Firm, are available on the SEC's website or upon request.
Affiliated Central Funds
Information regarding fiscal year to date income earned by the Fund from investments in Fidelity Central Funds is as follows:
| Fund | Income earned |
| Fidelity Cash Central Fund | $52,610 |
| Fidelity Securities Lending Cash Central Fund | 5,608 |
| Total | $58,218 |
Amounts in the income column in the above table include any capital gain distributions from underlying funds, which are presented in the corresponding line-item in the Statement of Operations if applicable.
Investment Valuation
The following is a summary of the inputs used, as of October 31, 2018, involving the Fund's assets and liabilities carried at fair value. The inputs or methodology used for valuing securities may not be an indication of the risk associated with investing in those securities. For more information on valuation inputs, and their aggregation into the levels used below, please refer to the Investment Valuation section in the accompanying Notes to Financial Statements.
| | Valuation Inputs at Reporting Date: |
| Description | Total | Level 1 | Level 2 | Level 3 |
| Investments in Securities: | | | | |
| Equities: | | | | |
| Communication Services | $5,468,331 | $4,619,891 | $848,440 | $-- |
| Consumer Discretionary | 3,702,109 | 3,247,528 | 454,581 | -- |
| Consumer Staples | 9,196,132 | 5,549,341 | 3,646,790 | 1 |
| Energy | 6,804,781 | 6,382,193 | 422,588 | -- |
| Financials | 13,804,318 | 13,601,982 | 202,336 | -- |
| Health Care | 9,691,638 | 6,936,942 | 2,754,696 | -- |
| Industrials | 6,537,872 | 5,101,157 | 1,436,715 | -- |
| Information Technology | 9,396,228 | 7,260,425 | 2,135,803 | -- |
| Materials | 1,269,109 | 1,269,109 | -- | -- |
| Real Estate | 1,364,896 | 1,364,896 | -- | -- |
| Utilities | 401,302 | 401,302 | -- | -- |
| Corporate Bonds | 2,283 | -- | 2,283 | -- |
| Money Market Funds | 1,198,277 | 1,198,277 | -- | -- |
| Total Investments in Securities: | $68,837,276 | $56,933,043 | $11,904,232 | $1 |
The following is a summary of transfers between Level 1 and Level 2 for the period ended October 31, 2018. Transfers are assumed to have occurred at the beginning of the period, and are primarily attributable to the valuation techniques used for foreign equity securities, as discussed in the accompanying Notes to Financial Statements:
| Transfers | Total |
| Level 1 to Level 2 | $3,109,335 |
| Level 2 to Level 1 | $4,469,981 |
See accompanying notes which are an integral part of the financial statements.
Financial Statements
Statement of Assets and Liabilities
| | | October 31, 2018 |
| Assets | | |
Investment in securities, at value — See accompanying schedule:
Unaffiliated issuers (cost $57,067,023) | $67,638,999 | |
| Fidelity Central Funds (cost $1,198,277) | 1,198,277 | |
| Total Investment in Securities (cost $58,265,300) | | $68,837,276 |
| Cash | | 38,583 |
| Foreign currency held at value (cost $204) | | 150 |
| Receivable for fund shares sold | | 13,317 |
| Dividends receivable | | 209,940 |
| Interest receivable | | 13 |
| Distributions receivable from Fidelity Central Funds | | 3,127 |
| Prepaid expenses | | 141 |
| Other receivables | | 2,047 |
| Total assets | | 69,104,594 |
| Liabilities | | |
| Payable for fund shares redeemed | $467,424 | |
| Accrued management fee | 40,896 | |
| Audit fee payable | 43,826 | |
| Other affiliated payables | 14,514 | |
| Other payables and accrued expenses | 6,335 | |
| Total liabilities | | 572,995 |
| Net Assets | | $68,531,599 |
| Net Assets consist of: | | |
| Paid in capital | | $55,336,835 |
| Total distributable earnings (loss) | | 13,194,764 |
| Net Assets, for 5,063,669 shares outstanding | | $68,531,599 |
| Net Asset Value, offering price and redemption price per share ($68,531,599 ÷ 5,063,669 shares) | | $13.53 |
See accompanying notes which are an integral part of the financial statements.
Statement of Operations
| | | Year ended October 31, 2018 |
| Investment Income | | |
| Dividends | | $2,218,476 |
| Interest | | 150 |
| Income from Fidelity Central Funds | | 58,218 |
| Income before foreign taxes withheld | | 2,276,844 |
| Less foreign taxes withheld | | (90,036) |
| Total income | | 2,186,808 |
| Expenses | | |
| Management fee | $539,985 | |
| Transfer agent fees | 143,555 | |
| Accounting and security lending fees | 40,630 | |
| Custodian fees and expenses | 12,023 | |
| Independent trustees' fees and expenses | 391 | |
| Registration fees | 22,684 | |
| Audit | 69,843 | |
| Legal | 1,124 | |
| Miscellaneous | 552 | |
| Total expenses before reductions | 830,787 | |
| Expense reductions | (7,584) | |
| Total expenses after reductions | | 823,203 |
| Net investment income (loss) | | 1,363,605 |
| Realized and Unrealized Gain (Loss) | | |
| Net realized gain (loss) on: | | |
| Investment securities: | | |
| Unaffiliated issuers | 3,308,342 | |
| Fidelity Central Funds | (126) | |
| Foreign currency transactions | (367) | |
| Total net realized gain (loss) | | 3,307,849 |
| Change in net unrealized appreciation (depreciation) on: | | |
| Investment securities: | | |
| Unaffiliated issuers (net of decrease in deferred foreign taxes of $1,361) | (5,804,163) | |
| Fidelity Central Funds | (58) | |
| Assets and liabilities in foreign currencies | (3,195) | |
| Total change in net unrealized appreciation (depreciation) | | (5,807,416) |
| Net gain (loss) | | (2,499,567) |
| Net increase (decrease) in net assets resulting from operations | | $(1,135,962) |
See accompanying notes which are an integral part of the financial statements.
Statement of Changes in Net Assets
| | Year ended October 31, 2018 | Year ended October 31, 2017 |
| Increase (Decrease) in Net Assets | | |
| Operations | | |
| Net investment income (loss) | $1,363,605 | $977,143 |
| Net realized gain (loss) | 3,307,849 | 2,279,736 |
| Change in net unrealized appreciation (depreciation) | (5,807,416) | 10,160,125 |
| Net increase (decrease) in net assets resulting from operations | (1,135,962) | 13,417,004 |
| Distributions to shareholders | (2,362,860) | – |
| Distributions to shareholders from net investment income | – | (949,348) |
| Total distributions | (2,362,860) | (949,348) |
| Share transactions | | |
| Proceeds from sales of shares | 13,947,450 | 22,414,620 |
| Reinvestment of distributions | 2,226,993 | 891,642 |
| Cost of shares redeemed | (25,151,825) | (26,444,504) |
| Net increase (decrease) in net assets resulting from share transactions | (8,977,382) | (3,138,242) |
| Redemption fees | 1,273 | 2,427 |
| Total increase (decrease) in net assets | (12,474,931) | 9,331,841 |
| Net Assets | | |
| Beginning of period | 81,006,530 | 71,674,689 |
| End of period | $68,531,599 | $81,006,530 |
| Other Information | | |
| Undistributed net investment income end of period | | $66,533 |
| Shares | | |
| Sold | 967,487 | 1,724,355 |
| Issued in reinvestment of distributions | 156,544 | 67,744 |
| Redeemed | (1,759,434) | (2,036,720) |
| Net increase (decrease) | (635,403) | (244,621) |
See accompanying notes which are an integral part of the financial statements.
Financial Highlights
Fidelity Global Equity Income Fund
| | | | | | |
| Years ended October 31, | 2018 | 2017 | 2016 | 2015 | 2014 |
| Selected Per–Share Data | | | | | |
| Net asset value, beginning of period | $14.21 | $12.06 | $12.12 | $12.87 | $12.20 |
| Income from Investment Operations | | | | | |
| Net investment income (loss)A | .25 | .17 | .15 | .16 | .28B |
| Net realized and unrealized gain (loss) | (.50) | 2.15 | .11 | .21 | .92 |
| Total from investment operations | (.25) | 2.32 | .26 | .37 | 1.20 |
| Distributions from net investment income | (.25) | (.17) | (.15) | (.16) | (.25) |
| Distributions from net realized gain | (.18) | – | (.16) | (.95) | (.28) |
| Total distributions | (.43) | (.17) | (.32)C | (1.12)D | (.53) |
| Redemption fees added to paid in capitalA,E | – | – | – | – | – |
| Net asset value, end of period | $13.53 | $14.21 | $12.06 | $12.12 | $12.87 |
| Total ReturnF | (1.88)% | 19.31% | 2.13% | 2.93% | 10.10% |
| Ratios to Average Net AssetsG,H | | | | | |
| Expenses before reductions | 1.06% | 1.13% | 1.18% | 1.15% | 1.16% |
| Expenses net of fee waivers, if any | 1.06% | 1.13% | 1.18% | 1.15% | 1.16% |
| Expenses net of all reductions | 1.05% | 1.13% | 1.18% | 1.14% | 1.16% |
| Net investment income (loss) | 1.75% | 1.29% | 1.24% | 1.27% | 2.21%B |
| Supplemental Data | | | | | |
| Net assets, end of period (000 omitted) | $68,532 | $81,007 | $71,675 | $67,926 | $52,038 |
| Portfolio turnover rateI | 34% | 37% | 40% | 64% | 92% |
A Calculated based on average shares outstanding during the period.
B Net investment income per share reflects a large, non-recurring dividend which amounted to $.08 per share. Excluding this non-recurring dividend, the ratio of net investment income (loss) to average net assets would have been 1.56%.
C Total distributions of $.32 per share is comprised of distributions from net investment income of $.153 and distributions from net realized gain of $.162 per share.
D Total distributions of $1.12 per share is comprised of distributions from net investment income of $.164 and distributions from net realized gain of $.954 per share.
E Amount represents less than $.005 per share.
F Total returns would have been lower if certain expenses had not been reduced during the applicable periods shown.
G Fees and expenses of any underlying Fidelity Central Funds are not included in the Fund's expense ratio. The Fund indirectly bears its proportionate share of the expenses of any underlying Fidelity Central Funds.
H Expense ratios reflect operating expenses of the Fund. Expenses before reductions do not reflect amounts reimbursed by the investment adviser or reductions from brokerage service arrangements or reductions from other expense offset arrangements and do not represent the amount paid by the Fund during periods when reimbursements or reductions occur. Expenses net of fee waivers reflect expenses after reimbursement by the investment adviser but prior to reductions from brokerage service arrangements or other expense offset arrangements. Expenses net of all reductions represent the net expenses paid by the Fund.
I Amount does not include the portfolio activity of any underlying Fidelity Central Funds.
See accompanying notes which are an integral part of the financial statements.
Notes to Financial Statements
For the period ended October 31, 2018
1. Organization.
Fidelity Global Equity Income Fund (the Fund) is a fund of Fidelity Investment Trust (the Trust) and is authorized to issue an unlimited number of shares. Share transactions on the Statement of Changes in Net Assets may contain exchanges between affiliated funds. The Trust is registered under the Investment Company Act of 1940, as amended (the 1940 Act), as an open-end management investment company organized as a Massachusetts business trust.
2. Investments in Fidelity Central Funds.
The Fund invests in Fidelity Central Funds, which are open-end investment companies generally available only to other investment companies and accounts managed by the investment adviser and its affiliates. The Fund's Schedule of Investments lists each of the Fidelity Central Funds held as of period end, if any, as an investment of the Fund, but does not include the underlying holdings of each Fidelity Central Fund. As an Investing Fund, the Fund indirectly bears its proportionate share of the expenses of the underlying Fidelity Central Funds.
The Money Market Central Funds seek preservation of capital and current income and are managed by Fidelity Investments Money Management, Inc. (FIMM), an affiliate of the investment adviser. Annualized expenses of the Money Market Central Funds as of their most recent shareholder report date are less than .005%.
A complete unaudited list of holdings for each Fidelity Central Fund is available upon request or at the Securities and Exchange Commission (the SEC) website at www.sec.gov. In addition, the financial statements of the Fidelity Central Funds, which are not covered by the Fund's Report of Independent Registered Public Accounting Firm, are available on the SEC website or upon request.
3. Significant Accounting Policies.
The Fund is an investment company and applies the accounting and reporting guidance of the Financial Accounting Standards Board (FASB) Accounting Standards Codification Topic 946 Financial Services – Investments Companies. The financial statements have been prepared in conformity with accounting principles generally accepted in the United States of America (GAAP), which require management to make certain estimates and assumptions at the date of the financial statements. Actual results could differ from those estimates. Subsequent events, if any, through the date that the financial statements were issued have been evaluated in the preparation of the financial statements. The following summarizes the significant accounting policies of the Fund:
Investment Valuation. Investments are valued as of 4:00 p.m. Eastern time on the last calendar day of the period. The Board of Trustees (the Board) has delegated the day to day responsibility for the valuation of the Fund's investments to the Fair Value Committee (the Committee) established by the Fund's investment adviser. In accordance with valuation policies and procedures approved by the Board, the Fund attempts to obtain prices from one or more third party pricing vendors or brokers to value its investments. When current market prices, quotations or currency exchange rates are not readily available or reliable, investments will be fair valued in good faith by the Committee, in accordance with procedures adopted by the Board. Factors used in determining fair value vary by investment type and may include market or investment specific events, changes in interest rates and credit quality. The frequency with which these procedures are used cannot be predicted and they may be utilized to a significant extent. The Committee oversees the Fund's valuation policies and procedures and reports to the Board on the Committee's activities and fair value determinations. The Board monitors the appropriateness of the procedures used in valuing the Fund's investments and ratifies the fair value determinations of the Committee.
The Fund categorizes the inputs to valuation techniques used to value its investments into a disclosure hierarchy consisting of three levels as shown below:
- Level 1 – quoted prices in active markets for identical investments
- Level 2 – other significant observable inputs (including quoted prices for similar investments, interest rates, prepayment speeds, etc.)
- Level 3 – unobservable inputs (including the Fund's own assumptions based on the best information available)
Valuation techniques used to value the Fund's investments by major category are as follows:
Equity securities, including restricted securities, for which market quotations are readily available, are valued at the last reported sale price or official closing price as reported by a third party pricing vendor on the primary market or exchange on which they are traded and are categorized as Level 1 in the hierarchy. In the event there were no sales during the day or closing prices are not available, securities are valued at the last quoted bid price or may be valued using the last available price and are generally categorized as Level 2 in the hierarchy. For foreign equity securities, when market or security specific events arise, comparisons to the valuation of American Depositary Receipts (ADRs), futures contracts, Exchange-Traded Funds (ETFs) and certain indexes as well as quoted prices for similar securities may be used and would be categorized as Level 2 in the hierarchy. Utilizing these techniques may result in transfers between Level 1 and Level 2. For equity securities, including restricted securities, where observable inputs are limited, assumptions about market activity and risk are used and these securities may be categorized as Level 3 in the hierarchy.
Debt securities, including restricted securities, are valued based on evaluated prices received from third party pricing vendors or from brokers who make markets in such securities. Corporate bonds are valued by pricing vendors who utilize matrix pricing which considers yield or price of bonds of comparable quality, coupon, maturity and type or by broker-supplied prices. When independent prices are unavailable or unreliable, debt securities may be valued utilizing pricing methodologies which consider similar factors that would be used by third party pricing vendors. Debt securities are generally categorized as Level 2 in the hierarchy but may be Level 3 depending on the circumstances.
Investments in open-end mutual funds, including the Fidelity Central Funds, are valued at their closing net asset value (NAV) each business day and are categorized as Level 1 in the hierarchy.
Changes in valuation techniques may result in transfers in or out of an assigned level within the disclosure hierarchy. The aggregate value of investments by input level as of October 31, 2018, including information on transfers between Levels 1 and 2, is included at the end of the Fund's Schedule of Investments.
Foreign Currency. The Fund may use foreign currency contracts to facilitate transactions in foreign-denominated securities. Gains and losses from these transactions may arise from changes in the value of the foreign currency or if the counterparties do not perform under the contracts' terms.
Foreign-denominated assets, including investment securities, and liabilities are translated into U.S. dollars at the exchange rates at period end. Purchases and sales of investment securities, income and dividends received and expenses denominated in foreign currencies are translated into U.S. dollars at the exchange rate in effect on the transaction date.
The effects of exchange rate fluctuations on investments are included with the net realized and unrealized gain (loss) on investment securities. Other foreign currency transactions resulting in realized and unrealized gain (loss) are disclosed separately.
Investment Transactions and Income. For financial reporting purposes, the Fund's investment holdings and NAV include trades executed through the end of the last business day of the period. The NAV per share for processing shareholder transactions is calculated as of the close of business of the New York Stock Exchange (NYSE), normally 4:00 p.m. Eastern time and includes trades executed through the end of the prior business day. Gains and losses on securities sold are determined on the basis of identified cost and include proceeds received from litigation. Dividend income is recorded on the ex-dividend date, except for certain dividends from foreign securities where the ex-dividend date may have passed, which are recorded as soon as the Fund is informed of the ex-dividend date. Non-cash dividends included in dividend income, if any, are recorded at the fair market value of the securities received. Income and capital gain distributions from Fidelity Central Funds, if any, are recorded on the ex-dividend date. Certain distributions received by the Fund represent a return of capital or capital gain. The Fund determines the components of these distributions subsequent to the ex-dividend date, based upon receipt of tax filings or other correspondence relating to the underlying investment. These distributions are recorded as a reduction of cost of investments and/or as a realized gain. Interest income is accrued as earned and includes coupon interest and amortization of premium and accretion of discount on debt securities as applicable. Investment income is recorded net of foreign taxes withheld where recovery of such taxes is uncertain.
Expenses. Expenses directly attributable to a fund are charged to that fund. Expenses attributable to more than one fund are allocated among the respective funds on the basis of relative net assets or other appropriate methods. Expense estimates are accrued in the period to which they relate and adjustments are made when actual amounts are known.
Income Tax Information and Distributions to Shareholders. Each year, the Fund intends to qualify as a regulated investment company under Subchapter M of the Internal Revenue Code, including distributing substantially all of its taxable income and realized gains. As a result, no provision for U.S. Federal income taxes is required. As of October 31, 2018, the Fund did not have any unrecognized tax benefits in the financial statements; nor is the Fund aware of any tax positions for which it is reasonably possible that the total amounts of unrecognized tax benefits will significantly change in the next twelve months. The Fund files a U.S. federal tax return, in addition to state and local tax returns as required. The Fund's federal income tax returns are subject to examination by the Internal Revenue Service (IRS) for a period of three fiscal years after they are filed. State and local tax returns may be subject to examination for an additional fiscal year depending on the jurisdiction. Foreign taxes are provided for based on the Fund's understanding of the tax rules and rates that exist in the foreign markets in which it invests.
Distributions are declared and recorded on the ex-dividend date. Income and capital gain distributions are determined in accordance with income tax regulations, which may differ from GAAP. In addition, the Fund claimed a portion of the payment made to redeeming shareholders as a distribution for income tax purposes.
Capital accounts within the financial statements are adjusted for permanent book-tax differences. These adjustments have no impact on net assets or the results of operations. Capital accounts are not adjusted for temporary book-tax differences which will reverse in a subsequent period.
Book-tax differences are primarily due to foreign currency transactions, passive foreign investment companies (PFIC), partnerships, and losses deferred due to wash sales.
As of period end, the cost and unrealized appreciation (depreciation) in securities, and derivatives if applicable, for federal income tax purposes were as follows:
| Gross unrealized appreciation | $14,634,237 |
| Gross unrealized depreciation | (4,048,089) |
| Net unrealized appreciation (depreciation) | $10,586,148 |
| Tax Cost | $58,251,128 |
The tax-based components of distributable earnings as of period end were as follows:
| Undistributed ordinary income | $62,787 |
| Undistributed long-term capital gain | $2,548,080 |
| Net unrealized appreciation (depreciation) on securities and other investments | $10,583,897 |
The tax character of distributions paid was as follows:
| | October 31, 2018 | October 31, 2017 |
| Ordinary Income | $1,346,877 | $ 949,348 |
| Long-term Capital Gains | 1,015,983 | – |
| Total | $2,362,860 | $ 949,348 |
Short-Term Trading (Redemption) Fees. Shares held by investors in the Fund less than 30 days may have been subject to a redemption fee equal to 1.00% of the NAV of shares redeemed. All redemption fees, which reduce the proceeds of the shareholder redemption, are retained by the Fund and accounted for as an addition to paid in capital. In November 2017, the Board of Trustees approved the elimination of these redemption fees effective December 18, 2017.
Restricted Securities. The Fund may invest in securities that are subject to legal or contractual restrictions on resale. These securities generally may be resold in transactions exempt from registration or to the public if the securities are registered. Disposal of these securities may involve time-consuming negotiations and expense, and prompt sale at an acceptable price may be difficult. Information regarding restricted securities is included at the end of the Fund's Schedule of Investments.
New Rule Issuance. During August 2018, the U.S. Securities and Exchange Commission issued Final Rule Release No. 33-10532, Disclosure Update and Simplification. This Final Rule includes amendments specific to registered investment companies that are intended to eliminate overlap in disclosure requirements between Regulation S-X and GAAP. In accordance with these amendments, certain line-items in the Fund's financial statements have been combined or removed for the current period as outlined in the table below.
| Financial Statement | Current Line-Item Presentation | Prior Line-Item Presentation |
Statement of Assets and Liabilities
| Total distributable earnings (loss) | Undistributed/Distributions in excess of/Accumulated net investment income (loss)
Accumulated/Undistributed net realized gain (loss)
Net unrealized appreciation (depreciation) |
| Statement of Changes in Net Assets | N/A – removed | Undistributed/Distributions in excess of/Accumulated net investment income (loss) end of period |
| Statement of Changes in Net Assets | Distributions to shareholders | Distributions to shareholders from net investment income
Distributions to shareholders from net realized gain |
4. Purchases and Sales of Investments.
Purchases and sales of securities, other than short-term securities, aggregated $25,356,106 and $32,819,570, respectively.
5. Fees and Other Transactions with Affiliates.
Management Fee. Fidelity Management & Research Company (the investment adviser) and its affiliates provide the Fund with investment management related services for which the Fund pays a monthly management fee. The management fee is the sum of an individual fund fee rate that is based on an annual rate of .45% of the Fund's average net assets and an annualized group fee rate that averaged .24% during the period. The group fee rate is based upon the average net assets of all the mutual funds advised by the investment adviser, including any mutual funds previously advised by the investment adviser that are currently advised by Fidelity SelectCo, LLC, an affiliate of the investment adviser. The group fee rate decreases as assets under management increase and increases as assets under management decrease. For the reporting period, the total annual management fee rate was .69% of the Fund's average net assets.
Transfer Agent Fees. Fidelity Investments Institutional Operations Company, Inc. (FIIOC), an affiliate of the investment adviser, is the Fund's transfer, dividend disbursing and shareholder servicing agent. FIIOC receives account fees and asset-based fees that vary according to account size and type of account. FIIOC pays for typesetting, printing and mailing of shareholder reports, except proxy statements. For the period, the transfer agent fees were equivalent to an annual rate of .18% of average net assets.
Accounting and Security Lending Fees. Fidelity Service Company, Inc. (FSC), an affiliate of the investment adviser, maintains the Fund's accounting records. The accounting fee is based on the level of average net assets for each month. Under a separate contract, FSC administers the security lending program. The security lending fee is based on the number and duration of lending transactions. For the period, the fees were equivalent to an annual rate of .05%.
Brokerage Commissions. The Fund placed a portion of its portfolio transactions with brokerage firms which are affiliates of the investment adviser. Brokerage commissions are included in net realized gain (loss) and change in net unrealized appreciation (depreciation) in the Statement of Operations. The commissions paid to these affiliated firms were $241 for the period.
Interfund Trades. The Fund may purchase from or sell securities to other Fidelity Funds under procedures adopted by the Board. The procedures have been designed to ensure these interfund trades are executed in accordance with Rule 17a-7 of the 1940 Act. Interfund trades are included within the respective purchases and sales amounts shown in the Purchases and Sales of Investments note.
6. Committed Line of Credit.
The Fund participates with other funds managed by the investment adviser or an affiliate in a $4.25 billion credit facility (the "line of credit") to be utilized for temporary or emergency purposes to fund shareholder redemptions or for other short-term liquidity purposes. The Fund has agreed to pay commitment fees on its pro-rata portion of the line of credit, which amounted to $216 and is reflected in Miscellaneous expenses on the Statement of Operations. During the period, the Fund did not borrow on this line of credit.
7. Security Lending.
The Fund lends portfolio securities through a lending agent from time to time in order to earn additional income. For equity securities, a lending agent is used and may loan securities to certain qualified borrowers, including Fidelity Capital Markets (FCM), a broker-dealer affiliated with the Fund. On the settlement date of the loan, the Fund receives collateral (in the form of U.S. Treasury obligations, letters of credit and/or cash) against the loaned securities and maintains collateral in an amount not less than 100% of the market value of the loaned securities during the period of the loan. The market value of the loaned securities is determined at the close of business of the Fund and any additional required collateral is delivered to the Fund on the next business day. The Fund or borrower may terminate the loan at any time, and if the borrower defaults on its obligation to return the securities loaned because of insolvency or other reasons, the Fund may apply collateral received from the borrower against the obligation. The Fund may experience delays and costs in recovering the securities loaned. Any cash collateral received is invested in the Fidelity Securities Lending Cash Central Fund. At period end, there were no security loans outstanding. Security lending income represents the income earned on investing cash collateral, less rebates paid to borrowers and any lending agent fees associated with the loan, plus any premium payments received for lending certain types of securities. Security lending income is presented in the Statement of Operations as a component of income from Fidelity Central Funds. Total security lending income during the period amounted to $5,608. During the period, there were no securities loaned to FCM.
8. Expense Reductions.
Commissions paid to certain brokers with whom the investment adviser, or its affiliates, places trades on behalf of the Fund include an amount in addition to trade execution, which may be rebated back to the Fund to offset certain expenses. This amount totaled $6,755 for the period.
In addition, during the period the investment adviser reimbursed and/or waived a portion of operating expenses in the amount of $829.
9. Other.
The Fund's organizational documents provide former and current trustees and officers with a limited indemnification against liabilities arising in connection with the performance of their duties to the Fund. In the normal course of business, the Fund may also enter into contracts that provide general indemnifications. The Fund's maximum exposure under these arrangements is unknown as this would be dependent on future claims that may be made against the Fund. The risk of material loss from such claims is considered remote.
Report of Independent Registered Public Accounting Firm
To the Trustees of Fidelity Investment Trust and Shareholders of Fidelity Global Equity Income Fund:
Opinion on the Financial Statements and Financial Highlights
We have audited the accompanying statement of assets and liabilities of Fidelity Global Equity Income Fund (the "Fund"), a fund of Fidelity Investment Trust , including the schedule of investments, as of October 31, 2018, and the related statement of operations for the year then ended, the statement of changes in net assets for each of the two years in the period then ended, the financial highlights for each of the five years in the period then ended, and the related notes. In our opinion, the financial statements and financial highlights present fairly, in all material respects, the financial position of the Fund as of October 31, 2018, and the results of its operations for the year then ended, the changes in its net assets for each of the two years in the period then ended, and the financial highlights for each of the five years in the period then ended, in conformity with accounting principles generally accepted in the United States of America.
Basis for Opinion
These financial statements and financial highlights are the responsibility of the Fund's management. Our responsibility is to express an opinion on the Fund's financial statements and financial highlights based on our audits. We are a public accounting firm registered with the Public Company Accounting Oversight Board (United States) (PCAOB) and are required to be independent with respect to the Fund in accordance with the U.S. federal securities laws and the applicable rules and regulations of the Securities and Exchange Commission and the PCAOB.
We conducted our audits in accordance with the standards of the PCAOB. Those standards require that we plan and perform the audit to obtain reasonable assurance about whether the financial statements and financial highlights are free of material misstatement, whether due to error or fraud. The Fund is not required to have, nor were we engaged to perform, an audit of its internal control over financial reporting. As part of our audits we are required to obtain an understanding of internal control over financial reporting but not for the purpose of expressing an opinion on the effectiveness of the Fund’s internal control over financial reporting. Accordingly, we express no such opinion.
Our audits included performing procedures to assess the risks of material misstatement of the financial statements and financial highlights, whether due to error or fraud, and performing procedures that respond to those risks. Such procedures included examining, on a test basis, evidence regarding the amounts and disclosures in the financial statements and financial highlights. Our audits also included evaluating the accounting principles used and significant estimates made by management, as well as evaluating the overall presentation of the financial statements and financial highlights. Our procedures included confirmation of securities owned as of October 31, 2018, by correspondence with the custodians and brokers. We believe that our audits provide a reasonable basis for our opinion.
DELOITTE & TOUCHE LLP
Boston, Massachusetts
December 14, 2018
We have served as the auditor of one or more of the Fidelity investment companies since 1999.
Trustees and Officers
The Trustees, Members of the Advisory Board (if any), and officers of the trust and fund, as applicable, are listed below. The Board of Trustees governs the fund and is responsible for protecting the interests of shareholders. The Trustees are experienced executives who meet periodically throughout the year to oversee the fund's activities, review contractual arrangements with companies that provide services to the fund, oversee management of the risks associated with such activities and contractual arrangements, and review the fund's performance. Except for Jonathan Chiel, each of the Trustees oversees 283 funds. Mr. Chiel oversees 154 funds.
The Trustees hold office without limit in time except that (a) any Trustee may resign; (b) any Trustee may be removed by written instrument, signed by at least two-thirds of the number of Trustees prior to such removal; (c) any Trustee who requests to be retired or who has become incapacitated by illness or injury may be retired by written instrument signed by a majority of the other Trustees; and (d) any Trustee may be removed at any special meeting of shareholders by a two-thirds vote of the outstanding voting securities of the trust. Each Trustee who is not an interested person (as defined in the 1940 Act) of the trust and the fund is referred to herein as an Independent Trustee. Each Independent Trustee shall retire not later than the last day of the calendar year in which his or her 75th birthday occurs. The Independent Trustees may waive this mandatory retirement age policy with respect to individual Trustees. Officers and Advisory Board Members hold office without limit in time, except that any officer or Advisory Board Member may resign or may be removed by a vote of a majority of the Trustees at any regular meeting or any special meeting of the Trustees. Except as indicated, each individual has held the office shown or other offices in the same company for the past five years.
The fund’s Statement of Additional Information (SAI) includes more information about the Trustees. To request a free copy, call Fidelity at 1-800-544-8544.
Experience, Skills, Attributes, and Qualifications of the Trustees. The Governance and Nominating Committee has adopted a statement of policy that describes the experience, qualifications, attributes, and skills that are necessary and desirable for potential Independent Trustee candidates (Statement of Policy). The Board believes that each Trustee satisfied at the time he or she was initially elected or appointed a Trustee, and continues to satisfy, the standards contemplated by the Statement of Policy. The Governance and Nominating Committee also engages professional search firms to help identify potential Independent Trustee candidates who have the experience, qualifications, attributes, and skills consistent with the Statement of Policy. From time to time, additional criteria based on the composition and skills of the current Independent Trustees, as well as experience or skills that may be appropriate in light of future changes to board composition, business conditions, and regulatory or other developments, have also been considered by the professional search firms and the Governance and Nominating Committee. In addition, the Board takes into account the Trustees' commitment and participation in Board and committee meetings, as well as their leadership of standing and ad hoc committees throughout their tenure.
In determining that a particular Trustee was and continues to be qualified to serve as a Trustee, the Board has considered a variety of criteria, none of which, in isolation, was controlling. The Board believes that, collectively, the Trustees have balanced and diverse experience, qualifications, attributes, and skills, which allow the Board to operate effectively in governing the fund and protecting the interests of shareholders. Information about the specific experience, skills, attributes, and qualifications of each Trustee, which in each case led to the Board's conclusion that the Trustee should serve (or continue to serve) as a trustee of the fund, is provided below.
Board Structure and Oversight Function. James C. Curvey is an interested person and currently serves as Chairman. The Trustees have determined that an interested Chairman is appropriate and benefits shareholders because an interested Chairman has a personal and professional stake in the quality and continuity of services provided to the fund. Independent Trustees exercise their informed business judgment to appoint an individual of their choosing to serve as Chairman, regardless of whether the Trustee happens to be independent or a member of management. The Independent Trustees have determined that they can act independently and effectively without having an Independent Trustee serve as Chairman and that a key structural component for assuring that they are in a position to do so is for the Independent Trustees to constitute a substantial majority for the Board. The Independent Trustees also regularly meet in executive session. Ned C. Lautenbach serves as Chairman of the Independent Trustees and as such (i) acts as a liaison between the Independent Trustees and management with respect to matters important to the Independent Trustees and (ii) with management prepares agendas for Board meetings.
Fidelity® funds are overseen by different Boards of Trustees. The fund's Board oversees Fidelity's high income and certain equity funds, and other Boards oversee Fidelity's investment-grade bond, money market, asset allocation, and other equity funds. The asset allocation funds may invest in Fidelity® funds overseen by the fund's Board. The use of separate Boards, each with its own committee structure, allows the Trustees of each group of Fidelity® funds to focus on the unique issues of the funds they oversee, including common research, investment, and operational issues. On occasion, the separate Boards establish joint committees to address issues of overlapping consequences for the Fidelity® funds overseen by each Board.
The Trustees operate using a system of committees to facilitate the timely and efficient consideration of all matters of importance to the Trustees, the fund, and fund shareholders and to facilitate compliance with legal and regulatory requirements and oversight of the fund's activities and associated risks. The Board, acting through its committees, has charged FMR and its affiliates with (i) identifying events or circumstances the occurrence of which could have demonstrably adverse effects on the fund's business and/or reputation; (ii) implementing processes and controls to lessen the possibility that such events or circumstances occur or to mitigate the effects of such events or circumstances if they do occur; and (iii) creating and maintaining a system designed to evaluate continuously business and market conditions in order to facilitate the identification and implementation processes described in (i) and (ii) above. Because the day-to-day operations and activities of the fund are carried out by or through FMR, its affiliates, and other service providers, the fund's exposure to risks is mitigated but not eliminated by the processes overseen by the Trustees. While each of the Board's committees has responsibility for overseeing different aspects of the fund's activities, oversight is exercised primarily through the Operations, Audit, and Compliance Committees. In addition, the Independent Trustees have worked with Fidelity to enhance the Board's oversight of investment and financial risks, legal and regulatory risks, technology risks, and operational risks, including the development of additional risk reporting to the Board. Appropriate personnel, including but not limited to the fund's Chief Compliance Officer (CCO), FMR's internal auditor, the independent accountants, the fund's Treasurer and portfolio management personnel, make periodic reports to the Board's committees, as appropriate, including an annual review of Fidelity's risk management program for the Fidelity® funds. The responsibilities of each standing committee, including their oversight responsibilities, are described further under "Standing Committees of the Trustees."
Interested Trustees*:
Correspondence intended for a Trustee who is an interested person may be sent to Fidelity Investments, 245 Summer Street, Boston, Massachusetts 02210.
Name, Year of Birth; Principal Occupations and Other Relevant Experience+
Jonathan Chiel (1957)
Year of Election or Appointment: 2016
Trustee
Mr. Chiel also serves as Trustee of other Fidelity® funds. Mr. Chiel is Executive Vice President and General Counsel for FMR LLC (diversified financial services company, 2012-present). Previously, Mr. Chiel served as general counsel (2004-2012) and senior vice president and deputy general counsel (2000-2004) for John Hancock Financial Services; a partner with Choate, Hall & Stewart (1996-2000) (law firm); and an Assistant United States Attorney for the United States Attorney’s Office of the District of Massachusetts (1986-95), including Chief of the Criminal Division (1993-1995). Mr. Chiel is a director on the boards of the Boston Bar Foundation and the Maimonides School.
James C. Curvey (1935)
Year of Election or Appointment: 2007
Trustee
Chairman of the Board of Trustees
Mr. Curvey also serves as Trustee of other Fidelity® funds. Mr. Curvey is Vice Chairman (2007-present) and Director of FMR LLC (diversified financial services company). In addition, Mr. Curvey is an Overseer Emeritus for the Boston Symphony Orchestra, a Director of Artis-Naples, and a Trustee of Brewster Academy in Wolfeboro, New Hampshire. Previously, Mr. Curvey served as a Director of Fidelity Research & Analysis Co. (investment adviser firm, 2009-2018), Director of Fidelity Investments Money Management, Inc. (investment adviser firm, 2009-2014) and a Director of FMR and FMR Co., Inc. (investment adviser firms, 2007-2014).
Charles S. Morrison (1960)
Year of Election or Appointment: 2014
Trustee
Mr. Morrison also serves as Trustee of other funds. He serves as President of Fidelity SelectCo, LLC (investment adviser firm, 2017-present) and Fidelity Management & Research Company (FMR) (investment adviser firm, 2016-present), a Director of Fidelity Investments Money Management, Inc. (FIMM) (investment adviser firm, 2014-present), Director of Fidelity SelectCo, LLC (investment adviser firm, 2014-present), President, Asset Management (2014-present), and is an employee of Fidelity Investments. Previously, Mr. Morrison served as Vice President of Fidelity's Fixed Income and Asset Allocation Funds (2012-2014), President, Fixed Income (2011-2014), Vice President of Fidelity's Money Market Funds (2005-2009), President, Money Market Group Leader of FMR (investment adviser firm, 2009), and Senior Vice President, Money Market Group of FMR (2004-2009). Mr. Morrison also served as Vice President of Fidelity's Bond Funds (2002-2005), certain Balanced Funds (2002-2005), and certain Asset Allocation Funds (2002-2007), and as Senior Vice President (2002-2005) of Fidelity's Bond Division.
* Determined to be an “Interested Trustee” by virtue of, among other things, his or her affiliation with the trust or various entities under common control with FMR.
+ The information includes the Trustee's principal occupation during the last five years and other information relating to the experience, attributes, and skills relevant to the Trustee's qualifications to serve as a Trustee, which led to the conclusion that the Trustee should serve as a Trustee for the fund.
Independent Trustees:
Correspondence intended for an Independent Trustee may be sent to Fidelity Investments, P.O. Box 55235, Boston, Massachusetts 02205-5235.
Name, Year of Birth; Principal Occupations and Other Relevant Experience+
Dennis J. Dirks (1948)
Year of Election or Appointment: 2005
Trustee
Mr. Dirks also serves as Trustee of other Fidelity® funds. Prior to his retirement in May 2003, Mr. Dirks was Chief Operating Officer and a member of the Board of The Depository Trust & Clearing Corporation (DTCC). He also served as President, Chief Operating Officer, and Board member of The Depository Trust Company (DTC) and President and Board member of the National Securities Clearing Corporation (NSCC). In addition, Mr. Dirks served as Chief Executive Officer and Board member of the Government Securities Clearing Corporation, Chief Executive Officer and Board member of the Mortgage-Backed Securities Clearing Corporation, as a Trustee and a member of the Finance Committee of Manhattan College (2005-2008), as a Trustee and a member of the Finance Committee of AHRC of Nassau County (2006-2008), as a member of the Independent Directors Council (IDC) Governing Council (2010-2015), and as a member of the Board of Directors for The Brookville Center for Children’s Services, Inc. (2009-2017). Mr. Dirks is a member of the Finance Committee (2016-present), Board of Directors (2017-present) and Board of Trustees (2018-present) and is Treasurer (2018-present) of the Asolo Repertory Theatre.
Donald F. Donahue (1950)
Year of Election or Appointment: 2018
Trustee
Mr. Donahue also serves as a Trustee of other Fidelity® funds. Mr. Donahue is President and Chief Executive Officer of Miranda Partners, LLC (risk consulting for the financial services industry, 2012-present). Previously, Mr. Donahue served as a Member of the Advisory Board of certain Fidelity® funds (2015-2018) and Chief Executive Officer (2006-2012), Chief Operating Officer (2003-2006), and Managing Director, Customer Marketing and Development (1999-2003) of The Depository Trust & Clearing Corporation (financial markets infrastructure). Mr. Donahue serves as a Member (2007-present) and Co-Chairman (2016-present) of the Board of Directors of United Way of New York, Member of the Board of Directors of NYC Leadership Academy (2012-present) and Member of the Board of Advisors of Ripple Labs, Inc. (financial services, 2015-present). He also served as Chairman (2010-2012) and Member of the Board of Directors (2012-2013) of Omgeo, LLC (financial services), Treasurer of United Way of New York (2012-2016), and Member of the Board of Directors of XBRL US (financial services non-profit, 2009-2012) and the International Securities Services Association (2009-2012).
Alan J. Lacy (1953)
Year of Election or Appointment: 2008
Trustee
Mr. Lacy also serves as Trustee of other Fidelity® funds. Mr. Lacy serves as a Director of Bristol-Myers Squibb Company (global pharmaceuticals, 2008-present). He is a Trustee of the California Chapter of The Nature Conservancy (2015-present) and a Director of the Center for Advanced Study in the Behavioral Sciences at Stanford University (2015-present). In addition, Mr. Lacy served as Senior Adviser (2007-2014) of Oak Hill Capital Partners, L.P. (private equity) and also served as Chief Executive Officer (2005) and Vice Chairman (2005-2006) of Sears Holdings Corporation (retail) and Chief Executive Officer and Chairman of the Board of Sears, Roebuck and Co. (retail, 2000-2005). Previously, Mr. Lacy served as Chairman (2014-2017) and a member (2010-2017) of the Board of Directors of Dave & Buster’s Entertainment, Inc. (restaurant and entertainment complexes), as Chairman (2008-2011) and a member (2006-2015) of the Board of Trustees of the National Parks Conservation Association, and as a member of the Board of Directors for The Hillman Companies, Inc. (hardware wholesalers, 2010-2014), Earth Fare, Inc. (retail grocery, 2010-2014), and The Western Union Company (global money transfer, 2006-2011).
Ned C. Lautenbach (1944)
Year of Election or Appointment: 2000
Trustee
Chairman of the Independent Trustees
Mr. Lautenbach also serves as Trustee of other Fidelity® funds. Mr. Lautenbach currently serves as Vice Chair of the Board of Governors, State University System of Florida (2013-present) and is a member of the Council on Foreign Relations (1994-present). He is also a member and has most recently served as Chairman of the Board of Directors of Artis-Naples (2012-present). Previously, Mr. Lautenbach served as a member and then Lead Director of the Board of Directors of Eaton Corporation (diversified industrial, 1997-2016). He was also a Partner and Advisory Partner at Clayton, Dubilier & Rice, LLC (private equity investment, 1998-2010), as well as a Director of Sony Corporation (2006-2007). In addition, Mr. Lautenbach also had a 30-year career with IBM (technology company) during which time he served as Senior Vice President and a member of the Corporate Executive Committee (1968-1998).
Joseph Mauriello (1944)
Year of Election or Appointment: 2008
Trustee
Mr. Mauriello also serves as Trustee of other Fidelity® funds. Prior to his retirement in January 2006, Mr. Mauriello served in numerous senior management positions including Deputy Chairman and Chief Operating Officer (2004-2005), and Vice Chairman of Financial Services (2002-2004) of KPMG LLP US (professional services, 1965-2005). Mr. Mauriello currently serves as a member of the Independent Directors Council (IDC) Governing Council (2015-present). Previously, Mr. Mauriello served as a member of the Board of Directors of XL Group plc. (global insurance and re-insurance, 2006-2018).
Cornelia M. Small (1944)
Year of Election or Appointment: 2005
Trustee
Ms. Small also serves as Trustee of other Fidelity® funds. Ms. Small is a member of the Board of Directors (2009-present) and Chair of the Investment Committee (2010-present) of the Teagle Foundation. Ms. Small also serves on the Investment Committee of the Berkshire Taconic Community Foundation (2008-present). Previously, Ms. Small served as Chairperson (2002-2008) and a member of the Investment Committee and Chairperson (2008-2012) and a member of the Board of Trustees of Smith College. In addition, Ms. Small served as Chief Investment Officer, Director of Global Equity Investments, and a member of the Board of Directors of Scudder, Stevens & Clark and Scudder Kemper Investments.
Garnett A. Smith (1947)
Year of Election or Appointment: 2018
Trustee
Mr. Smith also serves as Trustee of other Fidelity® funds. Prior to Mr. Smith's retirement, he served as Chairman and Chief Executive Officer of Inbrand Corp. (manufacturer of personal absorbent products, 1990-1997). He also served as President (1986-1990) of Inbrand Corp. Prior to his employment with Inbrand Corp., he was employed by a retail fabric chain and North Carolina National Bank. In addition, Mr. Smith served as a Member of the Advisory Board of certain Fidelity® funds (2012-2013) and as a board member of the Jackson Hole Land Trust (2009-2012).
David M. Thomas (1949)
Year of Election or Appointment: 2008
Trustee
Mr. Thomas also serves as Trustee of other Fidelity® funds. Mr. Thomas serves as Non-Executive Chairman of the Board of Directors of Fortune Brands Home and Security (home and security products, 2011-present), as a member of the Board of Directors (2004-present) and Presiding Director (2013-present) of Interpublic Group of Companies, Inc. (marketing communication), and as a member of the Board of Trustees of the University of Florida (2013-present). Previously, Mr. Thomas served as Executive Chairman (2005-2006) and Chairman and Chief Executive Officer (2000-2005) of IMS Health, Inc. (pharmaceutical and healthcare information solutions), and a Director of Fortune Brands, Inc. (consumer products, 2000-2011).
+ The information includes the Trustee's principal occupation during the last five years and other information relating to the experience, attributes, and skills relevant to the Trustee's qualifications to serve as a Trustee, which led to the conclusion that the Trustee should serve as a Trustee for the fund.
Advisory Board Members and Officers:
Correspondence intended for a Member of the Advisory Board (if any) may be sent to Fidelity Investments, P.O. Box 55235, Boston, Massachusetts 02205-5235. Correspondence intended for an officer or Peter S. Lynch may be sent to Fidelity Investments, 245 Summer Street, Boston, Massachusetts 02210. Officers appear below in alphabetical order.
Name, Year of Birth; Principal Occupation
Vicki L. Fuller (1957)
Year of Election or Appointment: 2018
Member of the Advisory Board
Ms. Fuller also serves as Member of the Advisory Board of other Fidelity® funds. Ms. Fuller serves as a member of the Board of Directors, Audit Committee, and Nominating and Governance Committee of The Williams Companies, Inc. (natural gas infrastructure, 2018-present). Previously, Ms. Fuller served as the Chief Investment Officer of the New York State Common Retirement Fund (2012-2018) and held a variety of positions at AllianceBernstein L.P. (global asset management, 1985-2012), including Managing Director (2006-2012) and Senior Vice President and Senior Portfolio Manager (2001-2006).
Peter S. Lynch (1944)
Year of Election or Appointment: 2003
Member of the Advisory Board
Mr. Lynch also serves as Member of the Advisory Board of other Fidelity® funds. Mr. Lynch is Vice Chairman and a Director of FMR (investment adviser firm) and FMR Co., Inc. (investment adviser firm). In addition, Mr. Lynch serves as a Trustee of Boston College and as the Chairman of the Inner-City Scholarship Fund. Previously, Mr. Lynch served on the Special Olympics International Board of Directors (1997-2006).
William S. Stavropoulos (1939)
Year of Election or Appointment: 2018
Member of the Advisory Board
Mr. Stavropoulos also serves as Member of the Advisory Board of other Fidelity® funds. Mr. Stavropoulos serves as President and Founder of the Michigan Baseball Foundation, the Great Lakes Loons (2007-present). Mr. Stavropoulos is Chairman Emeritus of the Board of Directors of The Dow Chemical Company, where he previously served in numerous senior management positions, including President, CEO (1995-2000; 2002-2004), Chairman of the Executive Committee (2000-2006), and as a member of the Board of Directors (1990-2006). Currently, Mr. Stavropoulos is Chairman of the Board of Directors of Univar Inc. (global distributor of commodity and specialty chemicals), a Director of Teradata Corporation (data warehousing and technology solutions), and a member of the Advisory Board for Metalmark Capital LLC (private equity investment, 2005-present). Mr. Stavropoulos is an operating advisor to Clayton, Dubilier & Rice, LLC (private equity investment). In addition, Mr. Stavropoulos is a member of the University of Notre Dame Advisory Council for the College of Science, a Trustee of the Rollin L. Gerstacker Foundation, and a Director of Artis-Naples in Naples, Florida. Previously, Mr. Stavropoulos served as Trustee of certain Fidelity® funds (2001-2018) and as a Director of Chemical Financial Corporation (bank holding company, 1993-2012) and Tyco International, Ltd. (multinational manufacturing and services, 2007-2012).
Carol B. Tomé (1957)
Year of Election or Appointment: 2018
Member of the Advisory Board
Ms. Tomé also serves as Member of the Advisory Board of other Fidelity® funds. Ms. Tomé is Chief Financial Officer (2001-present) and Executive Vice President of Corporate Services (2007-present) of The Home Depot, Inc. (home improvement retailer) and a Director (2003-present) and Chair of the Audit Committee (2004-present) of United Parcel Service, Inc. (package delivery and supply chain management). Previously, Ms. Tomé served as Trustee of certain Fidelity® funds (2017), Senior Vice President of Finance and Accounting/Treasurer (2000-2007) and Vice President and Treasurer (1995-2000) of The Home Depot, Inc. and Chair of the Board (2010-2012), Vice Chair of the Board (2009 and 2013), and a Director (2008-2013) of the Federal Reserve Bank of Atlanta. Ms. Tomé is also a director or trustee of many community and professional organizations.
Michael E. Wiley (1950)
Year of Election or Appointment: 2018
Member of the Advisory Board
Mr. Wiley also serves as Trustee or Member of the Advisory Board of other Fidelity® funds. Mr. Wiley serves as a Director of High Point Resources (exploration and production, 2005-present). Previously, Mr. Wiley served as a Director of Andeavor Corporation (independent oil refiner and marketer, 2005-2018), a Director of Andeavor Logistics LP (natural resources logistics, 2015-2018), a Director of Post Oak Bank (privately-held bank, 2004-2018), a Director of Asia Pacific Exploration Consolidated (international oil and gas exploration and production, 2008-2013), a member of the Board of Trustees of the University of Tulsa (2000-2006; 2007-2010), a Senior Energy Advisor of Katzenbach Partners, LLC (consulting, 2006-2007), an Advisory Director of Riverstone Holdings (private investment), a Director of Spinnaker Exploration Company (exploration and production, 2001-2005) and Chairman, President, and CEO of Baker Hughes, Inc. (oilfield services, 2000-2004).
Elizabeth Paige Baumann (1968)
Year of Election or Appointment: 2017
Anti-Money Laundering (AML) Officer
Ms. Baumann also serves as AML Officer of other funds. She is Chief AML Officer (2012-present) and Senior Vice President (2014-present) of FMR LLC (diversified financial services company) and is an employee of Fidelity Investments. Previously, Ms. Baumann served as AML Officer of the funds (2012-2016), and Vice President (2007-2014) and Deputy Anti-Money Laundering Officer (2007-2012) of FMR LLC.
John J. Burke III (1964)
Year of Election or Appointment: 2018
Chief Financial Officer
Mr. Burke also serves as Chief Financial Officer of other funds. Mr. Burke serves as Head of Investment Operations for Fidelity Fund and Investment Operations (2018-present) and is an employee of Fidelity Investments (1998-present). Previously Mr. Burke served as head of Asset Management Investment Operations (2012-2018).
William C. Coffey (1969)
Year of Election or Appointment: 2018
Secretary and Chief Legal Officer (CLO)
Mr. Coffey also serves as Secretary and CLO of other funds. Mr. Coffey serves as CLO, Secretary, and Senior Vice President of Fidelity Management & Research Company and FMR Co., Inc. (investment adviser firms, 2018-present); Secretary of Fidelity SelectCo, LLC and Fidelity Investments Money Management, Inc. (investment adviser firms, 2018-present); and CLO of Fidelity Management & Research (Hong Kong) Limited, FMR Investment Management (UK) Limited, and Fidelity Management & Research (Japan) Limited (investment adviser firms, 2018-present). He is Senior Vice President and Deputy General Counsel of FMR LLC (diversified financial services company, 2010-present), and is an employee of Fidelity Investments. Previously, Mr. Coffey served as Assistant Secretary of certain funds (2009-2018) and as Vice President and Associate General Counsel of FMR LLC (2005-2009).
Timothy M. Cohen (1969)
Year of Election or Appointment: 2018
Vice President
Mr. Cohen also serves as Vice President of other funds. Mr. Cohen serves as Co-Head of Global Equity Research (2016-present), a Director of Fidelity Management & Research (Japan) Limited (investment adviser firm, 2016-present), and is an employee of Fidelity Investments. Previously, Mr. Cohen served as Chief Investment Officer - Equity and a Director of Fidelity Management & Research (U.K.) Inc. (investment adviser firm, 2013-2015) and as a Director of Fidelity Management & Research (Hong Kong) Limited (investment adviser firm, 2017).
Jonathan Davis (1968)
Year of Election or Appointment: 2010
Assistant Treasurer
Mr. Davis also serves as Assistant Treasurer of other funds. Mr. Davis serves as Assistant Treasurer of FMR Capital, Inc. (2017-present) and is an employee of Fidelity Investments. Previously, Mr. Davis served as Vice President and Associate General Counsel of FMR LLC (diversified financial services company, 2003-2010).
Adrien E. Deberghes (1967)
Year of Election or Appointment: 2016
Assistant Treasurer
Mr. Deberghes also serves as an officer of other funds. He serves as Assistant Treasurer of FMR Capital, Inc. (2017-present), Executive Vice President of Fidelity Investments Money Management, Inc. (FIMM) (investment adviser firm, 2016-present), and is an employee of Fidelity Investments (2008-present). Previously, Mr. Deberghes served as President and Treasurer of certain Fidelity® funds (2013-2018). Prior to joining Fidelity Investments, Mr. Deberghes was Senior Vice President of Mutual Fund Administration at State Street Corporation (2007-2008), Senior Director of Mutual Fund Administration at Investors Bank & Trust (2005-2007), and Director of Finance for Dunkin' Brands (2000-2005). Previously, Mr. Deberghes served in other fund officer roles.
Laura M. Del Prato (1964)
Year of Election or Appointment: 2018
Assistant Treasurer
Ms. Del Prato also serves as an officer of other funds. Ms. Del Prato is an employee of Fidelity Investments (2017-present). Prior to joining Fidelity Investments, Ms. Del Prato served as a Managing Director and Treasurer of the JPMorgan Mutual Funds (2014-2017). Prior to JPMorgan, Ms. Del Prato served as a partner at Cohen Fund Audit Services (accounting firm, 2012-2013) and KPMG LLP (accounting firm, 2004-2012).
Colm A. Hogan (1973)
Year of Election or Appointment: 2016
Deputy Treasurer
Mr. Hogan also serves as an officer of other funds. Mr. Hogan serves as Assistant Treasurer of FMR Capital, Inc. (2017-present) and is an employee of Fidelity Investments (2005-present). Previously, Mr. Hogan served as Assistant Treasurer of certain Fidelity® funds (2016-2018).
Pamela R. Holding (1964)
Year of Election or Appointment: 2018
Vice President
Ms. Holding also serves as Vice President of other funds. Ms. Holding serves as Co-Head of Global Equity Research (2018-present) and is an employee of Fidelity Investments (2013-present).
Chris Maher (1972)
Year of Election or Appointment: 2013
Assistant Treasurer
Mr. Maher serves as Assistant Treasurer of other funds. Mr. Maher is Vice President of Valuation Oversight, serves as Assistant Treasurer of FMR Capital, Inc. (2017-present), and is an employee of Fidelity Investments. Previously, Mr. Maher served as Vice President of Asset Management Compliance (2013), Vice President of the Program Management Group of FMR (investment adviser firm, 2010-2013), and Vice President of Valuation Oversight (2008-2010).
Rieco E. Mello (1969)
Year of Election or Appointment: 2017
Assistant Treasurer
Mr. Mello also serves as Assistant Treasurer of other funds. Mr. Mello serves as Assistant Treasurer of FMR Capital, Inc. (2017-present) and is an employee of Fidelity Investments (1995-present).
Kenneth B. Robins (1969)
Year of Election or Appointment: 2016
Chief Compliance Officer
Mr. Robins also serves as an officer of other funds. Mr. Robins serves as Compliance Officer of Fidelity Management & Research Company and FMR Co., Inc. (investment adviser firms, 2016-present) and is an employee of Fidelity Investments (2004-present). Previously, Mr. Robins served as Executive Vice President of Fidelity Investments Money Management, Inc. (investment adviser firm, 2013-2016) and served in other fund officer roles.
Stacie M. Smith (1974)
Year of Election or Appointment: 2016
President and Treasurer
Ms. Smith also serves as an officer of other funds. Ms. Smith serves as Assistant Treasurer of FMR Capital, Inc. (2017-present), is an employee of Fidelity Investments (2009-present), and has served in other fund officer roles. Prior to joining Fidelity Investments, Ms. Smith served as Senior Audit Manager of Ernst & Young LLP (accounting firm, 1996-2009). Previously, Ms. Smith served as Assistant Treasurer (2013-2018) and Deputy Treasurer (2013-2016) of certain Fidelity® funds.
Marc L. Spector (1972)
Year of Election or Appointment: 2016
Assistant Treasurer
Mr. Spector also serves as an officer of other funds. Mr. Spector serves as Assistant Treasurer of FMR Capital, Inc. (2017-present) and is an employee of Fidelity Investments (2016-present). Prior to joining Fidelity Investments, Mr. Spector served as Director at the Siegfried Group (accounting firm, 2013-2016), and prior to Siegfried Group as audit senior manager at Deloitte & Touche (accounting firm, 2005-2013).
Shareholder Expense Example
As a shareholder of the Fund, you incur two types of costs: (1) transaction costs, including redemption fees and (2) ongoing costs, including management fees and other Fund expenses. This Example is intended to help you understand your ongoing costs (in dollars) of investing in the Fund and to compare these costs with the ongoing costs of investing in other mutual funds.
The Example is based on an investment of $1,000 invested at the beginning of the period and held for the entire period (May 1, 2018 to October 31, 2018).
Actual Expenses
The first line of the accompanying table provides information about actual account values and actual expenses. You may use the information in this line, together with the amount you invested, to estimate the expenses that you paid over the period. Simply divide your account value by $1,000.00 (for example, an $8,600 account value divided by $1,000.00 = 8.6), then multiply the result by the number in the first line under the heading entitled "Expenses Paid During Period" to estimate the expenses you paid on your account during this period. A small balance maintenance fee of $12.00 that is charged once a year may apply for certain accounts with a value of less than $2,000. This fee, which was eliminated effective August 1, 2018, is not included in the table below. If it was, the estimate of expenses you paid during the period would be higher, and your ending account value lower, by this amount. In addition, the Fund, as a shareholder in the underlying Fidelity Central Funds, will indirectly bear its pro-rata share of the fees and expenses incurred by the underlying Fidelity Central Funds. These fees and expenses are not included in the Fund's annualized expense ratio used to calculate the expense estimate in the table below.
Hypothetical Example for Comparison Purposes
The second line of the accompanying table provides information about hypothetical account values and hypothetical expenses based on the Fund's actual expense ratio and an assumed rate of return of 5% per year before expenses, which is not the Fund's actual return. The hypothetical account values and expenses may not be used to estimate the actual ending account balance or expenses you paid for the period. You may use this information to compare the ongoing costs of investing in the Fund and other funds. To do so, compare this 5% hypothetical example with the 5% hypothetical examples that appear in the shareholder reports of the other funds. A small balance maintenance fee of $12.00 that is charged once a year may apply for certain accounts with a value of less than $2,000. This fee, which was eliminated effective August 1, 2018, is not included in the table below. If it was, the estimate of expenses you paid during the period would be higher, and your ending account value lower, by this amount. In addition, the Fund, as a shareholder in the underlying Fidelity Central Funds, will indirectly bear its pro-rata share of the fees and expenses incurred by the underlying Fidelity Central Funds. These fees and expenses are not included in the Fund's annualized expense ratio used to calculate the expense estimate in the table below.
Please note that the expenses shown in the table are meant to highlight your ongoing costs only and do not reflect any transaction costs. Therefore, the second line of the table is useful in comparing ongoing costs only, and will not help you determine the relative total costs of owning different funds. In addition, if these transactional costs were included, your costs would have been higher.
| | Annualized Expense Ratio-A | Beginning
Account Value
May 1, 2018 | Ending
Account Value
October 31, 2018 | Expenses Paid
During Period-B
May 1, 2018
to October 31, 2018 |
| Actual | 1.06% | $1,000.00 | $976.40 | $5.28 |
| Hypothetical-C | | $1,000.00 | $1,019.86 | $5.40 |
A Annualized expense ratio reflects expenses net of applicable fee waivers.
B Expenses are equal to the Fund's annualized expense ratio, multiplied by the average account value over the period, multiplied by 184/365 (to reflect the one-half year period).
C 5% return per year before expenses
Distributions (Unaudited)
The Board of Trustees of Fidelity Global Equity Income Fund voted to pay on December 17, 2018, to shareholders of record at the opening of business on December 14, 2018, a distribution of $0.508 per share derived from capital gains realized from sales of portfolio securities and a dividend of $0.043 per share from net investment income.
The fund hereby designates as a capital gain dividend with respect to the taxable year ended October 31, 2018, $3,103,306, or, if subsequently determined to be different, the net capital gain of such year.
A total of 0.56% of the dividends distributed during the fiscal year was derived from interest on U.S. Government securities which is generally exempt from state income tax.
The fund designates 57%, 68%, 68%, and 68% of the dividends distributed in December, April, July, and October, respectively during the fiscal year as qualifying for the dividends–received deduction for corporate shareholders.
The fund designates 100% of the dividends distributed during the fiscal year as amounts which may be taken into account as a dividend for the purposes of the maximum rate under section 1(h)(11) of the Internal Revenue Code.
The amounts per share which represent income derived from sources within, and taxes paid to, foreign countries or possessions of the United States are $0.0457 and $0.0038 for the dividend paid December 18, 2017.
The fund will notify shareholders in January 2019 of amounts for use in preparing 2018 income tax returns.
Board Approval of Investment Advisory Contracts
Fidelity Global Equity Income Fund
At its July 2018 meeting, the Board of Trustees, including the Independent Trustees (together, the Board), voted to continue the management contract with Fidelity Management & Research Company (FMR) and the sub-advisory agreements (together, the Advisory Contracts) for the fund for six months through January 31, 2019, in connection with the reunification of the Fidelity Equity High Income Funds Board, which oversees the fund, and the Sector Portfolios Board.
The Board considered that the approval of the fund's Advisory Contracts will not result in any changes in (i) the investment process or strategies employed in the management of the fund's assets; (ii) the fees and expenses paid by shareholders, including the expense cap arrangement currently in place for the fund; (iii) the nature, extent or quality of services provided under the fund's Advisory Contracts; or (iv) the day-to-day management of the fund or the persons primarily responsible for such management. The Board concluded that the fund's Advisory Contracts are fair and reasonable, and that the fund's Advisory Contracts should be renewed, without modification, through January 31, 2019, with the understanding that the Board will consider the annual renewal for a full one year period in January 2019.
In connection with its consideration of future renewals of the fund's Advisory Contracts, the Board will consider: (i) the nature, extent and quality of services provided to the fund, including shareholder and administrative services and investment performance; (ii) the competitiveness of the management fee and total expenses for the fund; (iii) the costs of the services and profitability, including the revenues earned and the expenses incurred in conducting the business of developing, marketing, distributing, managing, administering, and servicing the fund and its shareholders, to the extent applicable, as well as potential fall-out benefits from Fidelity's non-fund businesses; and (iv) whether there have been economies of scale in respect of the Fidelity funds, whether the Fidelity funds (including the fund) have appropriately benefited from any such economies of scale, and whether there is the potential for realization of any further economies.
Based on its evaluation of all of the conclusions noted above, and after considering all factors it believed relevant, the Board ultimately concluded that the fund's management fee structure is fair and reasonable, and that the continuation of the fund's Advisory Contracts should be approved.
Corporate Headquarters
245 Summer St.
Boston, MA 02210
www.fidelity.com
GED-ANN-1218
1.938162.106
Fidelity Flex℠ Funds Fidelity Flex℠ International Fund
Annual Report October 31, 2018 |
|
Contents
To view a fund's proxy voting guidelines and proxy voting record for the 12-month period ended June 30, visit http://www.fidelity.com/proxyvotingresults or visit the Securities and Exchange Commission's (SEC) web site at http://www.sec.gov.
You may also call 1-800-835-5092 to request a free copy of the proxy voting guidelines.
Standard & Poor's, S&P and S&P 500 are registered service marks of The McGraw-Hill Companies, Inc. and have been licensed for use by Fidelity Distributors Corporation.
Other third-party marks appearing herein are the property of their respective owners.
All other marks appearing herein are registered or unregistered trademarks or service marks of FMR LLC or an affiliated company. © 2018 FMR LLC. All rights reserved.
This report and the financial statements contained herein are submitted for the general information of the shareholders of the Fund. This report is not authorized for distribution to prospective investors in the Fund unless preceded or accompanied by an effective prospectus.
A fund files its complete schedule of portfolio holdings with the SEC for the first and third quarters of each fiscal year on Form N-Q. Forms N-Q are available on the SEC’s web site at http://www.sec.gov. A fund's Forms N-Q may be reviewed and copied at the SEC’s Public Reference Room in Washington, DC. Information regarding the operation of the SEC's Public Reference Room may be obtained by calling 1-800-SEC-0330.
For a complete list of a fund's portfolio holdings, view the most recent holdings listing, semiannual report, or annual report on Fidelity's web site at http://www.fidelity.com, http://www.institutional.fidelity.com, or http://www.401k.com, as applicable.
NOT FDIC INSURED •MAY LOSE VALUE •NO BANK GUARANTEE
Neither the Fund nor Fidelity Distributors Corporation is a bank.
Performance: The Bottom Line
Average annual total return reflects the change in the value of an investment, assuming reinvestment of distributions from dividend income and capital gains (the profits earned upon the sale of securities that have grown in value, if any) and assuming a constant rate of performance each year. The hypothetical investment and the average annual total returns do not reflect the deduction of taxes that a shareholder would pay on fund distributions or the redemption of fund shares. During periods of reimbursement by Fidelity, a fund’s total return will be greater than it would be had the reimbursement not occurred. How a fund did yesterday is no guarantee of how it will do tomorrow.
Average Annual Total Returns
| For the periods ended October 31, 2018 | Past 1 year | Life of fundA |
| Fidelity Flex℠ International Fund | (7.98)% | 5.92% |
A From March 7, 2017
$10,000 Over Life of Fund
Let's say hypothetically that $10,000 was invested in Fidelity Flex℠ International Fund on March 7, 2017, when the fund started.
The chart shows how the value of your investment would have changed, and also shows how the MSCI ACWI (All Country World Index) ex USA Index performed over the same period.
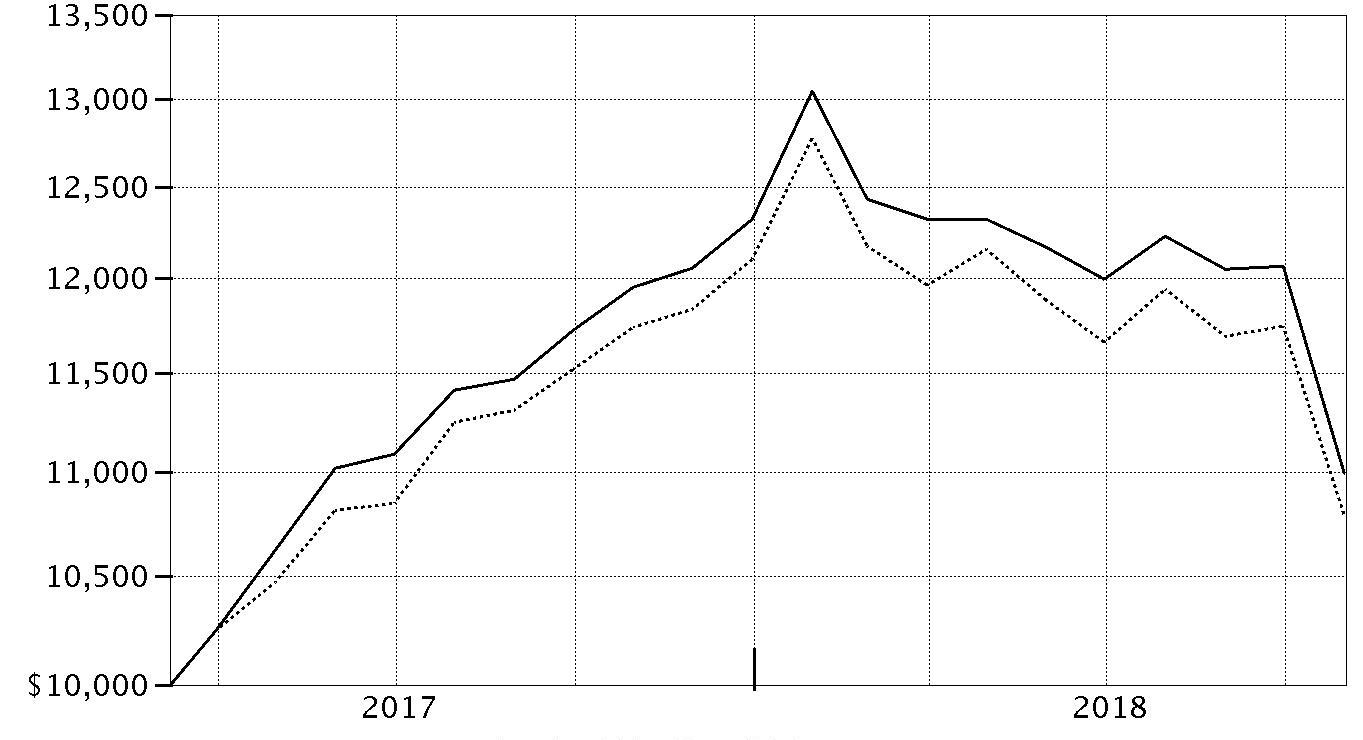
| Period Ending Values |
| $10,996 | Fidelity Flex℠ International Fund |
| $10,789 | MSCI ACWI (All Country World Index) ex USA Index |
Management's Discussion of Fund Performance
Market Recap: International equities returned -8.08% for the 12 months ending October 31, 2018, according to the MSCI ACWI (All Country World Index) ex USA Index. A modestly positive first half of the period gave way to a confluence of overwhelmingly negative factors – including escalating trade tensions, a surging U.S. dollar, tepid economic growth in Europe, global central bank tightening, concerns about Italy’s budget stalemate with the EU, and weakness in China’s stock market – that yielded a -11% second-half return. The index lost 8% in October alone, its largest monthly drop in more than six years. Among sectors, new-media-infused communications services (-15%) was hit the hardest, while economically sensitive consumer discretionary (-13%), information technology (-12%), financials (-10%), industrials (-9%) and materials (-7%) stocks also fared poorly. Even the more defensive real estate (-9%), utilities (-6%) and consumer staples (-5%) sectors weren’t spared this period. Conversely, elevated crude-oil prices fueled a positive return for energy (+7%), the top-performing sector, followed by the relatively stable-growing health care segment (+2%). Regionally, emerging markets (-12%) fared the worst, hampered by the impact of foreign exchange and concerns about economic weakness in China, India and South Korea. Sluggish growth also pressured shares in continental Europe (-9%). Stocks in Japan (-3%) and the U.K. (-4%) held up better, followed by Canada (-5%) and Asia-Pacific ex Japan (-6%).
Comments from Co-Portfolio Manager Jed Weiss: For the fiscal year, the fund returned -7.98%, roughly in line with the benchmark MSCI ACWI (All Country World Index) ex USA Index. Versus the benchmark, unfavorable stock picks in the U.K. and China notably detracted. By sector, security selection within the consumer staples and consumer discretionary sectors weighed on relative performance. Conversely, the fund benefited from non-benchmark exposure to the United States, as well as strong stock picks in continental Europe. Out-of-benchmark stakes in U.S.-based credit-card processors Mastercard and Visa were the top individual relative contributors, as both companies continued to maintain considerable pricing power and significant market share. A sizable overweighting in Australian global biopharmaceutical firm CSL Limited also proved beneficial, as its shares gained following the acquisition and successful turnaround of Novartis' flu business. I'll note that the fund's small cash stake – representing about 1% of assets, on average – helped our relative result in a down market. Conversely, the largest individual relative detractor was untimely ownership of Swiss drug manufacturer Novartis. We sold the stock in June, missing out as the stock gained due to a number of positive changes either made or anticipated by the company's new CEO. Underexposure to benchmark heavyweight Royal Dutch Shell also detracted. We established a position in April and held it through period end, which weighed on relative performance as shares of the Anglo-Dutch multinational oil and gas giant gained during the period.
The views expressed above reflect those of the portfolio manager(s) only through the end of the period as stated on the cover of this report and do not necessarily represent the views of Fidelity or any other person in the Fidelity organization. Any such views are subject to change at any time based upon market or other conditions and Fidelity disclaims any responsibility to update such views. These views may not be relied on as investment advice and, because investment decisions for a Fidelity fund are based on numerous factors, may not be relied on as an indication of trading intent on behalf of any Fidelity fund.
Note to Shareholders: Following a roughly five-month leave of absence, Jed Weiss returned to Fidelity on November 29, 2017, and resumed his day-to-day responsibilities as Co-Portfolio Manager. In his stead, Vincent Montemaggiore served as interim manager of the fund's developed-growth subportfolio, while Patrick Drouot and Patrick Buchanan served as co-managers of the developed small-cap sleeve.
Investment Summary (Unaudited)
Geographic Diversification (% of fund's net assets)
| As of October 31, 2018 |
| | Japan | 14.0% |
| | United States of America | 10.8% |
| | United Kingdom | 10.3% |
| | France | 6.9% |
| | Germany | 6.0% |
| | Canada | 5.2% |
| | Cayman Islands | 4.6% |
| | Switzerland | 4.4% |
| | India | 3.6% |
| | Other* | 34.2% |

* Includes Short-Term investments and Net Other Assets (Liabilities).
Percentages are based on country or territory of incorporation and are adjusted for the effect of futures contracts, if applicable.
Asset Allocation as of October 31, 2018
| | % of fund's net assets |
| Stocks | 98.1 |
| Investment Companies | 0.2 |
| Short-Term Investments and Net Other Assets (Liabilities) | 1.7 |
Top Ten Stocks as of October 31, 2018
| | % of fund's net assets |
| Taiwan Semiconductor Manufacturing Co. Ltd. (Taiwan, Semiconductors & Semiconductor Equipment) | 1.6 |
| Alibaba Group Holding Ltd. sponsored ADR (Cayman Islands, Internet & Direct Marketing Retail) | 1.4 |
| Samsung Electronics Co. Ltd. (Korea (South), Technology Hardware, Storage & Peripherals) | 1.3 |
| SAP SE (Germany, Software) | 1.3 |
| Tencent Holdings Ltd. (Cayman Islands, Interactive Media & Services) | 1.3 |
| Nestle SA (Reg. S) (Switzerland, Food Products) | 1.3 |
| Keyence Corp. (Japan, Electronic Equipment & Components) | 1.2 |
| Visa, Inc. Class A (United States of America, IT Services) | 1.2 |
| MasterCard, Inc. Class A (United States of America, IT Services) | 1.1 |
| CSL Ltd. (Australia, Biotechnology) | 1.1 |
| | 12.8 |
Top Market Sectors as of October 31, 2018
| | % of fund's net assets |
| Financials | 22.1 |
| Industrials | 14.2 |
| Information Technology | 14.0 |
| Consumer Discretionary | 9.4 |
| Materials | 8.3 |
| Health Care | 7.9 |
| Consumer Staples | 7.3 |
| Communication Services | 7.0 |
| Energy | 5.8 |
| Real Estate | 1.9 |
Schedule of Investments October 31, 2018
Showing Percentage of Net Assets
| Common Stocks - 96.8% | | | |
| | | Shares | Value |
| Australia - 2.2% | | | |
| Adelaide Brighton Ltd. | | 2,068 | $8,303 |
| Beacon Lighting Group Ltd. | | 6,675 | 6,547 |
| Commonwealth Bank of Australia | | 4,712 | 231,007 |
| CSL Ltd. | | 3,874 | 515,754 |
| DuluxGroup Ltd. | | 4,224 | 22,135 |
| Imdex Ltd. (a) | | 9,628 | 7,841 |
| Insurance Australia Group Ltd. | | 19,485 | 94,242 |
| Macquarie Group Ltd. | | 1,455 | 120,758 |
|
| TOTAL AUSTRALIA | | | 1,006,587 |
|
| Austria - 0.7% | | | |
| Andritz AG | | 3,613 | 187,262 |
| Erste Group Bank AG | | 2,873 | 117,148 |
|
| TOTAL AUSTRIA | | | 304,410 |
|
| Bailiwick of Jersey - 0.7% | | | |
| Ferguson PLC | | 842 | 56,858 |
| Glencore Xstrata PLC | | 44,493 | 181,333 |
| Integrated Diagnostics Holdings PLC (b) | | 3,449 | 11,899 |
| WPP PLC | | 6,719 | 76,030 |
|
| TOTAL BAILIWICK OF JERSEY | | | 326,120 |
|
| Belgium - 1.0% | | | |
| KBC Ancora | | 1,030 | 47,645 |
| KBC Groep NV | | 4,710 | 324,888 |
| Umicore SA | | 1,710 | 80,553 |
|
| TOTAL BELGIUM | | | 453,086 |
|
| Bermuda - 0.2% | | | |
| Credicorp Ltd. (United States) | | 294 | 66,359 |
| Vostok New Ventures Ltd. (depositary receipt) (a) | | 1,631 | 12,405 |
|
| TOTAL BERMUDA | | | 78,764 |
|
| Brazil - 1.7% | | | |
| BM&F BOVESPA SA | | 16,200 | 115,531 |
| CVC Brasil Operadora e Agencia de Viagens SA | | 5,400 | 82,128 |
| IRB Brasil Resseguros SA | | 4,700 | 91,512 |
| Itau Unibanco Holding SA | | 1,700 | 19,364 |
| Localiza Rent A Car SA | | 14,100 | 108,928 |
| Lojas Renner SA | | 10,200 | 103,055 |
| Notre Dame Intermedica Participacoes SA | | 13,900 | 90,127 |
| Rumo SA (a) | | 17,300 | 77,400 |
| Suzano Papel e Celulose SA | | 7,900 | 80,348 |
|
| TOTAL BRAZIL | | | 768,393 |
|
| Canada - 5.2% | | | |
| Alimentation Couche-Tard, Inc. Class B (sub. vtg.) | | 6,434 | 307,270 |
| Canadian National Railway Co. | | 4,447 | 380,163 |
| Canadian Pacific Railway Ltd. | | 1,393 | 285,668 |
| CCL Industries, Inc. Class B | | 4,790 | 201,504 |
| Constellation Software, Inc. | | 373 | 256,707 |
| Franco-Nevada Corp. | | 3,506 | 218,970 |
| McCoy Global, Inc. (a) | | 50 | 44 |
| New Look Vision Group, Inc. | | 528 | 12,935 |
| Nutrien Ltd. | | 6,256 | 331,179 |
| Pason Systems, Inc. | | 8,399 | 126,771 |
| PrairieSky Royalty Ltd. | | 6,666 | 101,272 |
| ShawCor Ltd. Class A | | 350 | 6,349 |
| Suncor Energy, Inc. | | 5,261 | 176,479 |
|
| TOTAL CANADA | | | 2,405,311 |
|
| Cayman Islands - 4.6% | | | |
| 58.com, Inc. ADR (a) | | 1,395 | 91,498 |
| Alibaba Group Holding Ltd. sponsored ADR (a) | | 4,514 | 642,252 |
| Baidu.com, Inc. sponsored ADR (a) | | 1,088 | 206,785 |
| Baozun, Inc. sponsored ADR (a)(c) | | 2,039 | 81,173 |
| Huazhu Group Ltd. ADR | | 3,100 | 81,096 |
| New Oriental Education & Technology Group, Inc. sponsored ADR | | 1,885 | 110,291 |
| Shenzhou International Group Holdings Ltd. | | 9,000 | 99,389 |
| Sunny Optical Technology Group Co. Ltd. | | 9,300 | 80,643 |
| TAL Education Group ADR (a) | | 3,878 | 112,384 |
| Tencent Holdings Ltd. | | 17,900 | 613,241 |
| Value Partners Group Ltd. | | 9,000 | 6,679 |
|
| TOTAL CAYMAN ISLANDS | | | 2,125,431 |
|
| Chile - 0.4% | | | |
| Banco Santander Chile sponsored ADR | | 3,124 | 92,033 |
| Sociedad Quimica y Minera de Chile SA (PN-B) sponsored ADR | | 2,050 | 89,811 |
|
| TOTAL CHILE | | | 181,844 |
|
| China - 2.4% | | | |
| China International Travel Service Corp. Ltd. (A Shares) | | 11,200 | 86,188 |
| Gree Electric Appliances, Inc. of Zhuhai Class A (a) | | 12,400 | 67,656 |
| Hangzhou Hikvision Digital Technology Co. Ltd. Class A | | 21,467 | 74,474 |
| Inner Mongoli Yili Industries Co. Ltd. (A Shares) | | 24,500 | 77,550 |
| Jiangsu Yanghe Brewery Joint-Stock Co. Ltd. Class A | | 6,312 | 79,981 |
| Kweichow Moutai Co. Ltd. (A Shares) | | 1,100 | 86,557 |
| Midea Group Co. Ltd. Class A | | 15,500 | 82,303 |
| Ping An Insurance (Group) Co. of China Ltd. (H Shares) | | 23,000 | 216,598 |
| Shanghai International Airport Co. Ltd. (A Shares) | | 12,100 | 85,950 |
| Shenzhen Inovance Technology Co. Ltd. Class A | | 23,100 | 73,781 |
| Wuliangye Yibin Co. Ltd. Class A | | 10,900 | 75,238 |
| Yunnan Baiyao Group Co. Ltd. (d) | | 8,500 | 85,577 |
|
| TOTAL CHINA | | | 1,091,853 |
|
| Denmark - 0.4% | | | |
| A.P. Moller - Maersk A/S Series B | | 43 | 54,275 |
| Jyske Bank A/S (Reg.) | | 2,290 | 93,625 |
| Netcompany Group A/S | | 300 | 9,922 |
| Scandinavian Tobacco Group A/S (b) | | 469 | 7,117 |
| SimCorp A/S | | 207 | 15,949 |
| Spar Nord Bank A/S | | 2,322 | 19,247 |
|
| TOTAL DENMARK | | | 200,135 |
|
| Finland - 0.7% | | | |
| Nordea Bank ABP (a) | | 15,419 | 134,103 |
| Sampo Oyj (A Shares) | | 3,127 | 144,009 |
| Tikkurila Oyj | | 2,747 | 37,399 |
|
| TOTAL FINLAND | | | 315,511 |
|
| France - 6.9% | | | |
| Accor SA | | 1,534 | 70,229 |
| Atos Origin SA | | 956 | 82,056 |
| AXA SA | | 9,304 | 232,848 |
| Bouygues SA | | 2,595 | 94,761 |
| Capgemini SA | | 943 | 115,354 |
| Compagnie de St. Gobain | | 2,124 | 80,014 |
| Edenred SA | | 3,280 | 124,567 |
| Elis SA | | 4,959 | 100,148 |
| Hermes International SCA | | 132 | 75,502 |
| Kering SA | | 173 | 77,125 |
| Laurent-Perrier Group SA | | 119 | 12,212 |
| Legrand SA | | 1,617 | 105,751 |
| LVMH Moet Hennessy - Louis Vuitton SA | | 246 | 74,638 |
| Natixis SA | | 17,645 | 103,246 |
| Pernod Ricard SA | | 503 | 76,799 |
| Safran SA | | 1,964 | 253,803 |
| Sanofi SA | | 4,293 | 383,625 |
| Societe Generale Series A | | 3,253 | 119,248 |
| SR Teleperformance SA | | 572 | 94,331 |
| Thales SA | | 500 | 63,995 |
| Total SA | | 8,099 | 475,212 |
| Vetoquinol SA | | 272 | 15,250 |
| VINCI SA | | 2,639 | 234,869 |
| Virbac SA (a) | | 76 | 12,206 |
| Vivendi SA | | 4,671 | 112,657 |
|
| TOTAL FRANCE | | | 3,190,446 |
|
| Germany - 5.8% | | | |
| adidas AG | | 345 | 81,279 |
| Bayer AG | | 4,267 | 327,076 |
| Brenntag AG | | 1,535 | 80,272 |
| CompuGroup Medical AG | | 999 | 56,576 |
| Continental AG | | 300 | 49,593 |
| CTS Eventim AG | | 901 | 33,840 |
| Deutsche Telekom AG | | 13,365 | 219,208 |
| Fresenius SE & Co. KGaA | | 1,116 | 70,928 |
| Hannover Reuck SE | | 1,131 | 152,570 |
| HeidelbergCement Finance AG | | 1,070 | 72,716 |
| Linde PLC | | 2,678 | 439,364 |
| MTU Aero Engines Holdings AG | | 663 | 141,028 |
| Nexus AG | | 419 | 11,437 |
| SAP SE | | 5,756 | 616,315 |
| Vonovia SE | | 5,721 | 261,917 |
| WashTec AG | | 240 | 18,512 |
| Wirecard AG | | 400 | 74,936 |
|
| TOTAL GERMANY | | | 2,707,567 |
|
| Greece - 0.0% | | | |
| Motor Oil (HELLAS) Corinth Refineries SA | | 400 | 9,469 |
| Hong Kong - 1.4% | | | |
| AIA Group Ltd. | | 63,800 | 482,856 |
| China Resources Beer Holdings Co. Ltd. | | 26,000 | 90,347 |
| Techtronic Industries Co. Ltd. | | 15,000 | 70,199 |
|
| TOTAL HONG KONG | | | 643,402 |
|
| India - 3.6% | | | |
| Adani Ports & Special Economic Zone Ltd. | | 6,281 | 27,078 |
| Asian Paints Ltd. | | 5,416 | 90,101 |
| Dabur India Ltd. | | 13,500 | 70,229 |
| Eicher Motors Ltd. | | 223 | 65,925 |
| Godrej Consumer Products Ltd. | | 8,363 | 81,962 |
| HDFC Bank Ltd. | | 2,920 | 75,804 |
| Hindustan Unilever Ltd. | | 4,900 | 107,441 |
| Housing Development Finance Corp. Ltd. | | 13,837 | 331,005 |
| Indraprastha Gas Ltd. | | 21,479 | 77,628 |
| IndusInd Bank Ltd. | | 3,333 | 64,222 |
| ITC Ltd. | | 26,400 | 99,982 |
| Jyothy Laboratories Ltd. | | 2,052 | 5,252 |
| Kotak Mahindra Bank Ltd. | | 4,952 | 74,933 |
| Maruti Suzuki India Ltd. | | 1,088 | 97,332 |
| Pidilite Industries Ltd. | | 5,226 | 67,752 |
| Reliance Industries Ltd. | | 12,805 | 183,739 |
| Titan Co. Ltd. | | 7,088 | 80,943 |
| Ultratech Cemco Ltd. (a) | | 1,620 | 76,650 |
|
| TOTAL INDIA | | | 1,677,978 |
|
| Indonesia - 0.5% | | | |
| PT Bank Central Asia Tbk | | 74,300 | 115,586 |
| PT Bank Rakyat Indonesia Tbk | | 541,600 | 112,221 |
|
| TOTAL INDONESIA | | | 227,807 |
|
| Ireland - 1.3% | | | |
| Accenture PLC Class A | | 463 | 72,978 |
| CRH PLC | | 3,571 | 106,516 |
| CRH PLC sponsored ADR | | 8,490 | 252,832 |
| FBD Holdings PLC | | 500 | 6,088 |
| James Hardie Industries PLC CDI | | 12,866 | 171,197 |
|
| TOTAL IRELAND | | | 609,611 |
|
| Israel - 0.2% | | | |
| Azrieli Group | | 141 | 6,846 |
| Ituran Location & Control Ltd. | | 1,158 | 39,511 |
| Strauss Group Ltd. | | 1,194 | 26,202 |
|
| TOTAL ISRAEL | | | 72,559 |
|
| Italy - 0.7% | | | |
| Assicurazioni Generali SpA | | 4,391 | 71,021 |
| Interpump Group SpA | | 5,001 | 144,442 |
| Intesa Sanpaolo SpA | | 31,873 | 70,601 |
| Mediobanca SpA | | 4,642 | 40,758 |
|
| TOTAL ITALY | | | 326,822 |
|
| Japan - 14.0% | | | |
| Ai Holdings Corp. | | 500 | 9,545 |
| Aoki Super Co. Ltd. | | 400 | 9,362 |
| Artnature, Inc. | | 1,200 | 7,051 |
| Aucnet, Inc. | | 500 | 5,242 |
| Azbil Corp. | | 5,400 | 100,596 |
| Broadleaf Co. Ltd. | | 1,300 | 7,512 |
| Central Automotive Products Ltd. | | 100 | 1,360 |
| Century21 Real Estate Japan Ltd. | | 200 | 2,185 |
| Coca-Cola West Co. Ltd. | | 300 | 7,857 |
| Daiichikosho Co. Ltd. | | 700 | 32,259 |
| Daikokutenbussan Co. Ltd. | | 500 | 18,700 |
| DENSO Corp. | | 3,480 | 155,228 |
| East Japan Railway Co. | | 1,900 | 165,942 |
| Fanuc Corp. | | 800 | 139,174 |
| Funai Soken Holdings, Inc. | | 900 | 19,087 |
| GCA Savvian Group Corp. | | 1,300 | 10,415 |
| Goldcrest Co. Ltd. | | 1,400 | 21,899 |
| Honda Motor Co. Ltd. | | 7,670 | 218,944 |
| Hoya Corp. | | 5,177 | 294,282 |
| Idemitsu Kosan Co. Ltd. | | 1,875 | 85,579 |
| INPEX Corp. | | 5,200 | 59,210 |
| Itochu Corp. | | 10,068 | 186,721 |
| Japan Tobacco, Inc. | | 4,952 | 127,243 |
| Kao Corp. | | 1,516 | 100,848 |
| Keyence Corp. | | 1,100 | 539,106 |
| Kobayashi Pharmaceutical Co. Ltd. | | 300 | 19,675 |
| Komatsu Ltd. | | 4,400 | 114,587 |
| Koshidaka Holdings Co. Ltd. | | 2,500 | 29,091 |
| Kusuri No Aoki Holdings Co. Ltd. | | 300 | 21,536 |
| Lasertec Corp. | | 1,300 | 37,329 |
| Makita Corp. | | 2,326 | 80,498 |
| Medikit Co. Ltd. | | 300 | 16,218 |
| Minebea Mitsumi, Inc. | | 3,458 | 52,901 |
| Miroku Jyoho Service Co., Ltd. | | 400 | 7,551 |
| Misumi Group, Inc. | | 6,950 | 139,573 |
| Mitsubishi UFJ Financial Group, Inc. | | 47,418 | 286,997 |
| Mitsui Fudosan Co. Ltd. | | 4,785 | 107,769 |
| Nabtesco Corp. | | 4,200 | 92,610 |
| Nagaileben Co. Ltd. | | 1,400 | 31,441 |
| Nakano Refrigerators Co. Ltd. | | 200 | 10,688 |
| ND Software Co. Ltd. | | 100 | 1,116 |
| Nihon Parkerizing Co. Ltd. | | 3,600 | 43,487 |
| Nintendo Co. Ltd. | | 446 | 139,242 |
| Nomura Holdings, Inc. | | 20,857 | 100,154 |
| NS Tool Co. Ltd. | | 400 | 9,408 |
| OBIC Co. Ltd. | | 2,017 | 183,762 |
| Oracle Corp. Japan | | 1,036 | 70,331 |
| ORIX Corp. | | 10,771 | 175,738 |
| OSG Corp. | | 6,100 | 126,179 |
| Panasonic Corp. | | 9,026 | 96,862 |
| Paramount Bed Holdings Co. Ltd. | | 800 | 33,713 |
| ProNexus, Inc. | | 1,087 | 10,568 |
| Recruit Holdings Co. Ltd. | | 3,015 | 80,921 |
| San-Ai Oil Co. Ltd. | | 2,300 | 24,848 |
| Shin-Etsu Chemical Co. Ltd. | | 1,285 | 107,375 |
| Shinsei Bank Ltd. | | 6,092 | 92,799 |
| SHO-BOND Holdings Co. Ltd. | | 2,260 | 161,035 |
| Shoei Co. Ltd. | | 1,000 | 39,039 |
| SoftBank Corp. | | 1,350 | 106,837 |
| Software Service, Inc. | | 200 | 15,066 |
| Sony Corp. | | 2,055 | 111,210 |
| Sony Financial Holdings, Inc. | | 6,094 | 140,585 |
| Subaru Corp. | | 2,753 | 74,261 |
| Sumitomo Mitsui Financial Group, Inc. | | 5,916 | 230,340 |
| T&D Holdings, Inc. | | 6,779 | 108,367 |
| Taiheiyo Cement Corp. | | 1,873 | 55,116 |
| Takeda Pharmaceutical Co. Ltd. | | 4,065 | 168,533 |
| The Monogatari Corp. | | 100 | 8,933 |
| TKC Corp. | | 500 | 19,054 |
| Tokio Marine Holdings, Inc. | | 4,124 | 194,290 |
| USS Co. Ltd. | | 16,700 | 301,484 |
| Welcia Holdings Co. Ltd. | | 400 | 20,419 |
| Workman Co. Ltd. | | 400 | 25,311 |
| Yamada Consulting Group Co. Ltd. | | 900 | 20,746 |
| Yamato Kogyo Co. Ltd. | | 300 | 7,896 |
|
| TOTAL JAPAN | | | 6,478,836 |
|
| Kenya - 0.4% | | | |
| Safaricom Ltd. | | 743,800 | 169,377 |
| Korea (South) - 2.1% | | | |
| BGF Retail Co. Ltd. | | 500 | 73,839 |
| Leeno Industrial, Inc. | | 139 | 7,297 |
| LG Chemical Ltd. | | 405 | 123,168 |
| LG Household & Health Care Ltd. | | 111 | 101,564 |
| NAVER Corp. | | 575 | 57,702 |
| Samsung Electronics Co. Ltd. | | 16,913 | 628,494 |
|
| TOTAL KOREA (SOUTH) | | | 992,064 |
|
| Mexico - 0.7% | | | |
| Consorcio ARA S.A.B. de CV | | 21,214 | 5,629 |
| Embotelladoras Arca S.A.B. de CV | | 9,700 | 48,779 |
| Grupo Aeroportuario del Pacifico S.A.B. de CV Series B | | 9,100 | 75,284 |
| Grupo Aeroportuario del Sureste S.A.B. de CV Series B | | 5,055 | 84,023 |
| Wal-Mart de Mexico SA de CV Series V | | 43,500 | 111,099 |
|
| TOTAL MEXICO | | | 324,814 |
|
| Netherlands - 2.3% | | | |
| Aalberts Industries NV | | 829 | 30,469 |
| ASML Holding NV (Netherlands) | | 2,768 | 476,772 |
| Ferrari NV | | 675 | 79,130 |
| ING Groep NV (Certificaten Van Aandelen) | | 11,718 | 138,636 |
| Koninklijke Philips Electronics NV | | 3,005 | 112,074 |
| Takeaway.com Holding BV (a)(b) | | 232 | 13,664 |
| VastNed Retail NV | | 274 | 10,862 |
| Wolters Kluwer NV | | 1,827 | 103,799 |
| Yandex NV Series A (a) | | 2,759 | 83,129 |
|
| TOTAL NETHERLANDS | | | 1,048,535 |
|
| New Zealand - 0.1% | | | |
| Auckland International Airport Ltd. | | 15,168 | 69,186 |
| Norway - 0.7% | | | |
| Equinor ASA | | 8,595 | 223,598 |
| Kongsberg Gruppen ASA | | 1,224 | 20,125 |
| Schibsted ASA (B Shares) | | 2,444 | 77,410 |
| Skandiabanken ASA (b) | | 1,474 | 14,688 |
|
| TOTAL NORWAY | | | 335,821 |
|
| Philippines - 0.8% | | | |
| Ayala Corp. | | 5,100 | 87,804 |
| Ayala Land, Inc. | | 122,900 | 91,191 |
| Jollibee Food Corp. | | 3,000 | 15,495 |
| SM Investments Corp. | | 5,465 | 92,043 |
| SM Prime Holdings, Inc. | | 147,700 | 93,423 |
|
| TOTAL PHILIPPINES | | | 379,956 |
|
| Portugal - 0.2% | | | |
| Galp Energia SGPS SA Class B | | 5,777 | 100,734 |
| Russia - 0.8% | | | |
| Alrosa Co. Ltd. | | 57,300 | 86,898 |
| NOVATEK OAO GDR (Reg. S) | | 755 | 127,973 |
| Sberbank of Russia | | 57,410 | 165,013 |
|
| TOTAL RUSSIA | | | 379,884 |
|
| South Africa - 1.9% | | | |
| Capitec Bank Holdings Ltd. | | 1,312 | 88,104 |
| Clicks Group Ltd. | | 9,524 | 121,370 |
| Discovery Ltd. | | 7,982 | 85,450 |
| FirstRand Ltd. | | 27,319 | 119,091 |
| Mondi Ltd. | | 3,696 | 88,408 |
| Naspers Ltd. Class N | | 2,247 | 394,899 |
|
| TOTAL SOUTH AFRICA | | | 897,322 |
|
| Spain - 2.6% | | | |
| Amadeus IT Holding SA Class A | | 5,399 | 435,278 |
| Banco Santander SA | | 60,372 | 287,247 |
| Banco Santander SA rights (a) | | 60,372 | 2,345 |
| CaixaBank SA | | 27,631 | 111,815 |
| Grifols SA ADR | | 5,613 | 114,617 |
| Masmovil Ibercom SA (a) | | 380 | 49,325 |
| Merlin Properties Socimi SA | | 4,140 | 51,956 |
| Prosegur Compania de Seguridad SA (Reg.) | | 20,807 | 115,667 |
| Unicaja Banco SA (b) | | 33,240 | 42,581 |
|
| TOTAL SPAIN | | | 1,210,831 |
|
| Sweden - 3.1% | | | |
| Addlife AB | | 586 | 13,447 |
| AddTech AB (B Shares) | | 1,426 | 29,140 |
| Alfa Laval AB | | 3,828 | 97,759 |
| ASSA ABLOY AB (B Shares) | | 17,206 | 342,240 |
| Atlas Copco AB (A Shares) | | 6,916 | 171,253 |
| Epiroc AB Class A (a) | | 9,353 | 82,133 |
| Fagerhult AB | | 6,470 | 56,844 |
| Hexagon AB (B Shares) | | 1,496 | 73,336 |
| Investor AB (B Shares) | | 2,618 | 113,490 |
| Lagercrantz Group AB (B Shares) | | 2,161 | 21,277 |
| Loomis AB (B Shares) | | 2,176 | 67,293 |
| Saab AB (B Shares) | | 617 | 24,178 |
| Svenska Handelsbanken AB (A Shares) | | 7,155 | 77,774 |
| Swedbank AB (A Shares) | | 6,959 | 156,729 |
| Telefonaktiebolaget LM Ericsson (B Shares) | | 12,703 | 110,602 |
|
| TOTAL SWEDEN | | | 1,437,495 |
|
| Switzerland - 4.4% | | | |
| Credit Suisse Group AG | | 8,980 | 117,402 |
| Nestle SA (Reg. S) | | 6,918 | 584,039 |
| Roche Holding AG (participation certificate) | | 1,992 | 484,778 |
| Schindler Holding AG: | | | |
| (participation certificate) | | 702 | 148,046 |
| (Reg.) | | 127 | 26,380 |
| Sika AG | | 648 | 83,127 |
| Swiss Life Holding AG | | 286 | 107,965 |
| Tecan Group AG | | 100 | 22,559 |
| UBS Group AG | | 16,312 | 226,737 |
| Zurich Insurance Group AG | | 718 | 222,926 |
|
| TOTAL SWITZERLAND | | | 2,023,959 |
|
| Taiwan - 2.3% | | | |
| Addcn Technology Co. Ltd. | | 1,000 | 7,784 |
| E.SUN Financial Holdings Co. Ltd. | | 137,000 | 90,712 |
| Formosa Chemicals & Fibre Corp. | | 32,000 | 115,760 |
| Formosa Plastics Corp. | | 36,000 | 117,440 |
| Taiwan Semiconductor Manufacturing Co. Ltd. | | 101,000 | 757,816 |
|
| TOTAL TAIWAN | | | 1,089,512 |
|
| Thailand - 0.4% | | | |
| Airports of Thailand PCL (For. Reg.) | | 50,900 | 98,239 |
| C.P. ALL PCL (For. Reg.) | | 51,400 | 104,242 |
|
| TOTAL THAILAND | | | 202,481 |
|
| United Arab Emirates - 0.2% | | | |
| National Bank of Abu Dhabi PJSC | | 22,600 | 85,031 |
| United Kingdom - 10.3% | | | |
| Alliance Pharma PLC | | 13,836 | 11,814 |
| Ascential PLC | | 5,556 | 26,759 |
| AstraZeneca PLC (United Kingdom) | | 3,174 | 242,778 |
| Aviva PLC | | 27,664 | 151,181 |
| Avon Rubber PLC | | 659 | 10,108 |
| BAE Systems PLC | | 35,080 | 235,221 |
| BHP Billiton PLC | | 18,314 | 365,340 |
| BP PLC | | 67,245 | 485,759 |
| British American Tobacco PLC (United Kingdom) | | 5,708 | 247,443 |
| Bunzl PLC | | 3,217 | 95,028 |
| Cineworld Group PLC | | 3,146 | 11,847 |
| Compass Group PLC | | 2,652 | 52,203 |
| Dechra Pharmaceuticals PLC | | 1,738 | 50,784 |
| DP Poland PLC (a) | | 16,894 | 5,830 |
| Elementis PLC | | 28,170 | 73,814 |
| GlaxoSmithKline PLC | | 7,326 | 141,888 |
| Great Portland Estates PLC | | 2,560 | 22,830 |
| Hilton Food Group PLC | | 368 | 4,337 |
| Howden Joinery Group PLC | | 1,743 | 10,451 |
| HSBC Holdings PLC sponsored ADR | | 2,696 | 110,779 |
| Imperial Tobacco Group PLC | | 4,199 | 142,391 |
| Informa PLC | | 36,983 | 337,331 |
| InterContinental Hotel Group PLC ADR | | 4,707 | 253,048 |
| ITE Group PLC | | 17,123 | 12,475 |
| ITV PLC | | 30,100 | 57,307 |
| Melrose Industries PLC | | 31,172 | 67,197 |
| Micro Focus International PLC | | 3,686 | 57,141 |
| NMC Health PLC | | 1,917 | 86,545 |
| Prudential PLC | | 15,568 | 311,728 |
| Reckitt Benckiser Group PLC | | 2,092 | 169,168 |
| Rightmove PLC | | 11,097 | 64,134 |
| Royal Dutch Shell PLC Class B sponsored ADR | | 4,679 | 307,457 |
| RSA Insurance Group PLC | | 9,412 | 67,900 |
| Shaftesbury PLC | | 6,572 | 75,351 |
| Spectris PLC | | 5,082 | 139,270 |
| Spirax-Sarco Engineering PLC | | 772 | 63,844 |
| Standard Chartered PLC (United Kingdom) | | 10,508 | 73,805 |
| Standard Life PLC | | 23,190 | 80,180 |
| The Weir Group PLC | | 2,984 | 60,492 |
| Ultra Electronics Holdings PLC | | 737 | 13,546 |
|
| TOTAL UNITED KINGDOM | | | 4,796,504 |
|
| United States of America - 8.9% | | | |
| Alphabet, Inc. Class A (a) | | 278 | 303,181 |
| American Tower Corp. | | 557 | 86,786 |
| Amgen, Inc. | | 498 | 96,009 |
| Amphenol Corp. Class A | | 940 | 84,130 |
| Autoliv, Inc. | | 1,430 | 119,176 |
| Berkshire Hathaway, Inc. Class B (a) | | 812 | 166,687 |
| Black Knight, Inc. (a) | | 1,751 | 85,396 |
| ConocoPhillips Co. | | 1,725 | 120,578 |
| Constellation Brands, Inc. Class A (sub. vtg.) | | 362 | 72,121 |
| Marsh & McLennan Companies, Inc. | | 1,300 | 110,175 |
| Martin Marietta Materials, Inc. | | 860 | 147,301 |
| MasterCard, Inc. Class A | | 2,624 | 518,686 |
| MercadoLibre, Inc. | | 261 | 84,695 |
| Mohawk Industries, Inc. (a) | | 679 | 84,692 |
| Moody's Corp. | | 1,442 | 209,782 |
| MSCI, Inc. | | 1,689 | 253,992 |
| NVIDIA Corp. | | 313 | 65,990 |
| PayPal Holdings, Inc. (a) | | 862 | 72,572 |
| PriceSmart, Inc. | | 1,112 | 78,007 |
| ResMed, Inc. | | 1,659 | 175,721 |
| S&P Global, Inc. | | 1,373 | 250,325 |
| Sherwin-Williams Co. | | 749 | 294,709 |
| TransDigm Group, Inc. (a) | | 221 | 72,985 |
| Veoneer, Inc. (a) | | 1,653 | 55,508 |
| Visa, Inc. Class A | | 3,906 | 538,442 |
|
| TOTAL UNITED STATES OF AMERICA | | | 4,147,646 |
|
| TOTAL COMMON STOCKS | | | |
| (Cost $47,880,542) | | | 44,893,094 |
|
| Nonconvertible Preferred Stocks - 1.3% | | | |
| Brazil - 0.9% | | | |
| Itau Unibanco Holding SA | | 21,000 | 277,912 |
| Itausa-Investimentos Itau SA (PN) | | 39,900 | 120,509 |
|
| TOTAL BRAZIL | | | 398,421 |
|
| Germany - 0.2% | | | |
| Porsche Automobil Holding SE (Germany) | | 1,373 | 87,316 |
| Sartorius AG (non-vtg.) | | 210 | 30,446 |
|
| TOTAL GERMANY | | | 117,762 |
|
| Spain - 0.2% | | | |
| Grifols SA Class B | | 3,769 | 78,326 |
| TOTAL NONCONVERTIBLE PREFERRED STOCKS | | | |
| (Cost $609,429) | | | 594,509 |
|
| Investment Companies - 0.2% | | | |
| United States of America - 0.2% | | | |
| iShares MSCI EAFE Small-Cap ETF | | | |
| (Cost $108,511) | | 1,662 | 93,488 |
|
| Money Market Funds - 1.3% | | | |
| Fidelity Cash Central Fund, 2.23% (e) | | 568,097 | 568,211 |
| Fidelity Securities Lending Cash Central Fund 2.23% (e)(f) | | 50,630 | 50,635 |
| TOTAL MONEY MARKET FUNDS | | | |
| (Cost $618,846) | | | 618,846 |
| TOTAL INVESTMENT IN SECURITIES - 99.6% | | | |
| (Cost $49,217,328) | | | 46,199,937 |
| NET OTHER ASSETS (LIABILITIES) - 0.4% | | | 192,082 |
| NET ASSETS - 100% | | | $46,392,019 |
Security Type Abbreviations
ETF – Exchange-Traded Fund
Categorizations in the Schedule of Investments are based on country or territory of incorporation.
Legend
(a) Non-income producing
(b) Security exempt from registration under Rule 144A of the Securities Act of 1933. These securities may be resold in transactions exempt from registration, normally to qualified institutional buyers. At the end of the period, the value of these securities amounted to $89,949 or 0.2% of net assets.
(c) Security or a portion of the security is on loan at period end.
(d) Level 3 security
(e) Affiliated fund that is generally available only to investment companies and other accounts managed by Fidelity Investments. The rate quoted is the annualized seven-day yield of the fund at period end. A complete unaudited listing of the fund's holdings as of its most recent quarter end is available upon request. In addition, each Fidelity Central Fund's financial statements, which are not covered by the Fund's Report of Independent Registered Public Accounting Firm, are available on the SEC's website or upon request.
(f) Investment made with cash collateral received from securities on loan.
Affiliated Central Funds
Information regarding fiscal year to date income earned by the Fund from investments in Fidelity Central Funds is as follows:
| Fund | Income earned |
| Fidelity Cash Central Fund | $16,275 |
| Fidelity Securities Lending Cash Central Fund | 2,355 |
| Total | $18,630 |
Amounts in the income column in the above table include any capital gain distributions from underlying funds, which are presented in the corresponding line-item in the Statement of Operations if applicable.
Investment Valuation
The following is a summary of the inputs used, as of October 31, 2018, involving the Fund's assets and liabilities carried at fair value. The inputs or methodology used for valuing securities may not be an indication of the risk associated with investing in those securities. For more information on valuation inputs, and their aggregation into the levels used below, please refer to the Investment Valuation section in the accompanying Notes to Financial Statements.
| | Valuation Inputs at Reporting Date: |
| Description | Total | Level 1 | Level 2 | Level 3 |
| Investments in Securities: | | | | |
| Equities: | | | | |
| Communication Services | $3,284,257 | $2,017,042 | $1,267,215 | $-- |
| Consumer Discretionary | 4,233,513 | 3,415,054 | 818,459 | -- |
| Consumer Staples | 3,395,229 | 2,166,488 | 1,228,741 | -- |
| Energy | 2,615,071 | 1,594,890 | 1,020,181 | -- |
| Financials | 10,305,704 | 7,069,949 | 3,235,755 | -- |
| Health Care | 3,802,610 | 1,707,027 | 2,010,006 | 85,577 |
| Industrials | 6,647,467 | 4,706,799 | 1,940,668 | -- |
| Information Technology | 6,486,130 | 4,467,484 | 2,018,646 | -- |
| Materials | 3,806,979 | 3,172,632 | 634,347 | -- |
| Real Estate | 833,015 | 725,246 | 107,769 | -- |
| Utilities | 77,628 | 77,628 | -- | -- |
| Investment Companies | 93,488 | 93,488 | -- | -- |
| Money Market Funds | 618,846 | 618,846 | -- | -- |
| Total Investments in Securities: | $46,199,937 | $31,832,573 | $14,281,787 | $85,577 |
The following is a summary of transfers between Level 1 and Level 2 for the period ended October 31, 2018. Transfers are assumed to have occurred at the beginning of the period, and are primarily attributable to the valuation techniques used for foreign equity securities, as discussed in the accompanying Notes to Financial Statements:
| Transfers | Total |
| Level 1 to Level 2 | $377,931 |
| Level 2 to Level 1 | $861,424 |
See accompanying notes which are an integral part of the financial statements.
Financial Statements
Statement of Assets and Liabilities
| | | October 31, 2018 |
| Assets | | |
Investment in securities, at value (including securities loaned of $51,753) — See accompanying schedule:
Unaffiliated issuers (cost $48,598,482) | $45,581,091 | |
| Fidelity Central Funds (cost $618,846) | 618,846 | |
| Total Investment in Securities (cost $49,217,328) | | $46,199,937 |
| Cash | | 61,764 |
| Foreign currency held at value (cost $12,146) | | 12,121 |
| Receivable for investments sold | | 308,138 |
| Receivable for fund shares sold | | 21,556 |
| Dividends receivable | | 127,778 |
| Distributions receivable from Fidelity Central Funds | | 1,075 |
| Total assets | | 46,732,369 |
| Liabilities | | |
| Payable for investments purchased | $275,209 | |
| Payable for fund shares redeemed | 14,467 | |
| Other payables and accrued expenses | 39 | |
| Collateral on securities loaned | 50,635 | |
| Total liabilities | | 340,350 |
| Net Assets | | $46,392,019 |
| Net Assets consist of: | | |
| Paid in capital | | $50,870,833 |
| Total distributable earnings (loss) | | (4,478,814) |
| Net Assets, for 4,255,840 shares outstanding | | $46,392,019 |
| Net Asset Value, offering price and redemption price per share ($46,392,019 ÷ 4,255,840 shares) | | $10.90 |
See accompanying notes which are an integral part of the financial statements.
Statement of Operations
| | | Year ended October 31, 2018 |
| Investment Income | | |
| Dividends | | $1,284,911 |
| Income from Fidelity Central Funds | | 18,630 |
| Income before foreign taxes withheld | | 1,303,541 |
| Less foreign taxes withheld | | (122,825) |
| Total income | | 1,180,716 |
| Expenses | | |
| Independent trustees' fees and expenses | $220 | |
| Commitment fees | 114 | |
| Total expenses | | 334 |
| Net investment income (loss) | | 1,180,382 |
| Realized and Unrealized Gain (Loss) | | |
| Net realized gain (loss) on: | | |
| Investment securities: | | |
| Unaffiliated issuers | (2,290,529) | |
| Fidelity Central Funds | 21 | |
| Foreign currency transactions | (12,759) | |
| Total net realized gain (loss) | | (2,303,267) |
| Change in net unrealized appreciation (depreciation) on: | | |
| Investment securities: | | |
| Unaffiliated issuers | (4,147,815) | |
| Assets and liabilities in foreign currencies | (1,590) | |
| Total change in net unrealized appreciation (depreciation) | | (4,149,405) |
| Net gain (loss) | | (6,452,672) |
| Net increase (decrease) in net assets resulting from operations | | $(5,272,290) |
See accompanying notes which are an integral part of the financial statements.
Statement of Changes in Net Assets
| | Year ended October 31, 2018 | For the period
March 7, 2017 (commencement of operations) to October 31, 2017 |
| Increase (Decrease) in Net Assets | | |
| Operations | | |
| Net investment income (loss) | $1,180,382 | $113,865 |
| Net realized gain (loss) | (2,303,267) | 34,417 |
| Change in net unrealized appreciation (depreciation) | (4,149,405) | 1,130,319 |
| Net increase (decrease) in net assets resulting from operations | (5,272,290) | 1,278,601 |
| Distributions to shareholders | (243,461) | – |
| Total distributions | (243,461) | – |
| Share transactions | | |
| Proceeds from sales of shares | 61,885,506 | 14,011,215 |
| Reinvestment of distributions | 243,461 | – |
| Cost of shares redeemed | (24,832,406) | (678,607) |
| Net increase (decrease) in net assets resulting from share transactions | 37,296,561 | 13,332,608 |
| Total increase (decrease) in net assets | 31,780,810 | 14,611,209 |
| Net Assets | | |
| Beginning of period | 14,611,209 | – |
| End of period | $46,392,019 | $14,611,209 |
| Other Information | | |
| Undistributed net investment income end of period | | $113,847 |
| Shares | | |
| Sold | 5,081,975 | 1,281,107 |
| Issued in reinvestment of distributions | 20,407 | – |
| Redeemed | (2,068,952) | (58,697) |
| Net increase (decrease) | 3,033,430 | 1,222,410 |
See accompanying notes which are an integral part of the financial statements.
Financial Highlights
Fidelity Flex International Fund
| | | |
| Years ended October 31, | 2018 | 2017 A |
| Selected Per–Share Data | | |
| Net asset value, beginning of period | $11.95 | $10.00 |
| Income from Investment Operations | | |
| Net investment income (loss)B | .30 | .16 |
| Net realized and unrealized gain (loss) | (1.24) | 1.79 |
| Total from investment operations | (.94) | 1.95 |
| Distributions from net investment income | (.07) | – |
| Distributions from net realized gain | (.03) | – |
| Total distributions | (.11)C | – |
| Net asset value, end of period | $10.90 | $11.95 |
| Total ReturnD | (7.98)% | 19.50% |
| Ratios to Average Net AssetsE,F | | |
| Expenses before reductionsG | -% | - %H |
| Expenses net of fee waivers, if anyG | -% | - %H |
| Expenses net of all reductionsG | -% | - %H |
| Net investment income (loss) | 2.53% | 2.24%H |
| Supplemental Data | | |
| Net assets, end of period (000 omitted) | $46,392 | $14,611 |
| Portfolio turnover rateI | 69% | 35%H |
A For the period March 7, 2017 (commencement of operations) to October 31, 2017.
B Calculated based on average shares outstanding during the period.
C Total distributions of $.11 per share is comprised of distributions from net investment income of $.073 and distributions from net realized gain of $.032 per share.
D Total returns for periods of less than one year are not annualized.
E Fees and expenses of any underlying Fidelity Central Funds are not included in the Fund's expense ratio. The Fund indirectly bears its proportionate share of the expenses of any underlying Fidelity Central Funds.
F Expense ratios reflect operating expenses of the Fund. Expenses before reductions do not reflect amounts reimbursed by the investment adviser or reductions from expense offset arrangements and do not represent the amount paid by the Fund during periods when reimbursements or reductions occur. Expense ratios before reductions for start-up periods may not be representative of longer term operating periods. Expenses net of fee waivers reflect expenses after reimbursement by the investment adviser but prior to reductions from expense offset arrangements. Expenses net of all reductions represent the net expenses paid by the Fund.
G Amount represents less than .005%.
H Annualized
I Amount does not include the portfolio activity of any underlying Fidelity Central Funds.
See accompanying notes which are an integral part of the financial statements.
Notes to Financial Statements
For the period ended October 31, 2018
1. Organization.
Fidelity Flex International Fund (the Fund) is a fund of Fidelity Investment Trust (the Trust) and is authorized to issue an unlimited number of shares. Share transactions on the Statement of Changes in Net Assets may contain exchanges between affiliated funds. The Trust is registered under the Investment Company Act of 1940, as amended (the 1940 Act), as an open-end management investment company organized as a Massachusetts business trust. The Fund is available only to certain fee-based accounts offered by Fidelity. The Fund's investments in emerging markets can be subject to social, economic, regulatory, and political uncertainties and can be extremely volatile.
2. Investments in Fidelity Central Funds.
The Fund invests in Fidelity Central Funds, which are open-end investment companies generally available only to other investment companies and accounts managed by the investment adviser and its affiliates. The Fund's Schedule of Investments lists each of the Fidelity Central Funds held as of period end, if any, as an investment of the Fund, but does not include the underlying holdings of each Fidelity Central Fund. As an Investing Fund, the Fund indirectly bears its proportionate share of the expenses of the underlying Fidelity Central Funds.
The Money Market Central Funds seek preservation of capital and current income and are managed by Fidelity Investments Money Management, Inc. (FIMM), an affiliate of the investment adviser. Annualized expenses of the Money Market Central Funds as of their most recent shareholder report date are less than .005%.
A complete unaudited list of holdings for each Fidelity Central Fund is available upon request or at the Securities and Exchange Commission (the SEC) website at www.sec.gov. In addition, the financial statements of the Fidelity Central Funds, which are not covered by the Fund's Report of Independent Registered Public Accounting Firm, are available on the SEC website or upon request.
3. Significant Accounting Policies.
The Fund is an investment company and applies the accounting and reporting guidance of the Financial Accounting Standards Board (FASB) Accounting Standards Codification Topic 946 Financial Services – Investments Companies. The financial statements have been prepared in conformity with accounting principles generally accepted in the United States of America (GAAP), which require management to make certain estimates and assumptions at the date of the financial statements. Actual results could differ from those estimates. Subsequent events, if any, through the date that the financial statements were issued have been evaluated in the preparation of the financial statements. The following summarizes the significant accounting policies of the Fund:
Investment Valuation. Investments are valued as of 4:00 p.m. Eastern time on the last calendar day of the period. The Board of Trustees (the Board) has delegated the day to day responsibility for the valuation of the Fund's investments to the Fair Value Committee (the Committee) established by the Fund's investment adviser. In accordance with valuation policies and procedures approved by the Board, the Fund attempts to obtain prices from one or more third party pricing vendors or brokers to value its investments. When current market prices, quotations or currency exchange rates are not readily available or reliable, investments will be fair valued in good faith by the Committee, in accordance with procedures adopted by the Board. Factors used in determining fair value vary by investment type and may include market or investment specific events. The frequency with which these procedures are used cannot be predicted and they may be utilized to a significant extent. The Committee oversees the Fund's valuation policies and procedures and reports to the Board on the Committee's activities and fair value determinations. The Board monitors the appropriateness of the procedures used in valuing the Fund's investments and ratifies the fair value determinations of the Committee.
The Fund categorizes the inputs to valuation techniques used to value its investments into a disclosure hierarchy consisting of three levels as shown below:
- Level 1 – quoted prices in active markets for identical investments
- Level 2 – other significant observable inputs (including quoted prices for similar investments, interest rates, prepayment speeds, etc.)
- Level 3 – unobservable inputs (including the Fund's own assumptions based on the best information available)
Valuation techniques used to value the Fund's investments by major category are as follows:
Equity securities, including restricted securities, for which market quotations are readily available, are valued at the last reported sale price or official closing price as reported by a third party pricing vendor on the primary market or exchange on which they are traded and are categorized as Level 1 in the hierarchy. In the event there were no sales during the day or closing prices are not available, securities are valued at the last quoted bid price or may be valued using the last available price and are generally categorized as Level 2 in the hierarchy. For foreign equity securities, when market or security specific events arise, comparisons to the valuation of American Depositary Receipts (ADRs), futures contracts, Exchange-Traded Funds (ETFs) and certain indexes as well as quoted prices for similar securities may be used and would be categorized as Level 2 in the hierarchy. Utilizing these techniques may result in transfers between Level 1 and Level 2. For equity securities, including restricted securities, where observable inputs are limited, assumptions about market activity and risk are used and these securities may be categorized as Level 3 in the hierarchy.
ETFs are valued at their last sale price or official closing price as reported by a third party pricing vendor on the primary market or exchange on which they are traded and are categorized as Level 1 in the hierarchy. In the event there were no sales during the day but the exchange reports a closing bid level, ETFs are valued at the closing bid and would be categorized as Level 1 in the hierarchy. In the event there was no closing bid, ETFs may be valued by another method that the Board believes reflects fair value in accordance with the Board's fair value pricing policies and may be categorized as Level 2 in the hierarchy.
Investments in open-end mutual funds, including the Fidelity Central Funds, are valued at their closing net asset value (NAV) each business day and are categorized as Level 1 in the hierarchy.
Changes in valuation techniques may result in transfers in or out of an assigned level within the disclosure hierarchy. The aggregate value of investments by input level as of October 31, 2018, including information on transfers between Levels 1 and 2, is included at the end of the Fund's Schedule of Investments.
Foreign Currency. The Fund may use foreign currency contracts to facilitate transactions in foreign-denominated securities. Gains and losses from these transactions may arise from changes in the value of the foreign currency or if the counterparties do not perform under the contracts' terms.
Foreign-denominated assets, including investment securities, and liabilities are translated into U.S. dollars at the exchange rates at period end. Purchases and sales of investment securities, income and dividends received and expenses denominated in foreign currencies are translated into U.S. dollars at the exchange rate in effect on the transaction date.
The effects of exchange rate fluctuations on investments are included with the net realized and unrealized gain (loss) on investment securities. Other foreign currency transactions resulting in realized and unrealized gain (loss) are disclosed separately.
Investment Transactions and Income. For financial reporting purposes, the Fund's investment holdings and NAV include trades executed through the end of the last business day of the period. The NAV per share for processing shareholder transactions is calculated as of the close of business of the New York Stock Exchange (NYSE), normally 4:00 p.m. Eastern time and includes trades executed through the end of the prior business day. Gains and losses on securities sold are determined on the basis of identified cost. Dividend income is recorded on the ex-dividend date, except for certain dividends from foreign securities where the ex-dividend date may have passed, which are recorded as soon as the Fund is informed of the ex-dividend date. Non-cash dividends included in dividend income, if any, are recorded at the fair market value of the securities received. Income and capital gain distributions from Fidelity Central Funds, if any, are recorded on the ex-dividend date. Certain distributions received by the Fund represent a return of capital or capital gain. The Fund determines the components of these distributions subsequent to the ex-dividend date, based upon receipt of tax filings or other correspondence relating to the underlying investment. These distributions are recorded as a reduction of cost of investments and/or as a realized gain. Investment income is recorded net of foreign taxes withheld where recovery of such taxes is uncertain.
Expenses. Expenses directly attributable to a fund are charged to that fund. Expenses attributable to more than one fund are allocated among the respective funds on the basis of relative net assets or other appropriate methods. Expense estimates are accrued in the period to which they relate and adjustments are made when actual amounts are known.
Income Tax Information and Distributions to Shareholders. Each year, the Fund intends to qualify as a regulated investment company under Subchapter M of the Internal Revenue Code, including distributing substantially all of its taxable income and realized gains. As a result, no provision for U.S. Federal income taxes is required. As of October 31, 2018, the Fund did not have any unrecognized tax benefits in the financial statements; nor is the Fund aware of any tax positions for which it is reasonably possible that the total amounts of unrecognized tax benefits will significantly change in the next twelve months. The Fund files a U.S. federal tax return, in addition to state and local tax returns as required. The Fund's federal income tax returns are subject to examination by the Internal Revenue Service (IRS) for a period of three fiscal years after they are filed. State and local tax returns may be subject to examination for an additional fiscal year depending on the jurisdiction. Foreign taxes are provided for based on the Fund's understanding of the tax rules and rates that exist in the foreign markets in which it invests.
Distributions are declared and recorded on the ex-dividend date. Income and capital gain distributions are determined in accordance with income tax regulations, which may differ from GAAP. In addition, the Fund claimed a portion of the payment made to redeeming shareholders as a distribution for income tax purposes.
Capital accounts within the financial statements are adjusted for permanent book-tax differences. These adjustments have no impact on net assets or the results of operations. Capital accounts are not adjusted for temporary book-tax differences which will reverse in a subsequent period.
Book-tax differences are primarily due to foreign currency transactions, passive foreign investment companies (PFIC), capital loss carryforwards and losses deferred due to wash sales.
As of period end, the cost and unrealized appreciation (depreciation) in securities, and derivatives if applicable, for federal income tax purposes were as follows:
| Gross unrealized appreciation | $2,121,953 |
| Gross unrealized depreciation | (5,409,415) |
| Net unrealized appreciation (depreciation) | $(3,287,462) |
| Tax Cost | $49,487,399 |
The tax-based components of distributable earnings as of period end were as follows:
| Undistributed ordinary income | $875,258 |
| Capital loss carryforward | $(2,065,182) |
| Net unrealized appreciation (depreciation) on securities and other investments | $(3,288,888) |
Capital loss carryforwards are only available to offset future capital gains of the Fund to the extent provided by regulations and may be limited. Under the Regulated Investment Company Modernization Act of 2010 (the Act), the Fund is permitted to carry forward capital losses incurred in taxable years beginning after December 22, 2010 for an unlimited period and such capital losses are required to be used prior to any losses that expire. The capital loss carryforward information presented below, including any applicable limitation, is estimated as of fiscal period end and is subject to adjustment.
| No expiration | |
| Short-term | $(2,064,682) |
| Long-term | (501) |
| Total capital loss carryforward | $(2,065,183) |
The tax character of distributions paid was as follows:
| | October 31, 2018 | October 31, 2017 |
| Ordinary Income | $243,461 | $ - |
Restricted Securities. The Fund may invest in securities that are subject to legal or contractual restrictions on resale. These securities generally may be resold in transactions exempt from registration or to the public if the securities are registered. Disposal of these securities may involve time-consuming negotiations and expense, and prompt sale at an acceptable price may be difficult. Information regarding restricted securities is included at the end of the Fund's Schedule of Investments.
New Rule Issuance. During August 2018, the U.S. Securities and Exchange Commission issued Final Rule Release No. 33-10532, Disclosure Update and Simplification. This Final Rule includes amendments specific to registered investment companies that are intended to eliminate overlap in disclosure requirements between Regulation S-X and GAAP. In accordance with these amendments, certain line-items in the Fund's financial statements have been combined or removed for the current period as outlined in the table below.
| Financial Statement | Current Line-Item Presentation | Prior Line-Item Presentation |
| Statement of Assets and Liabilities | Total distributable earnings (loss) | Undistributed/Distributions in excess of/Accumulated net investment income (loss)
Accumulated/Undistributed net realized gain (loss)
Net unrealized appreciation (depreciation) |
| Statement of Changes in Net Assets | N/A - removed | Undistributed/Distributions in excess of/Accumulated net investment income (loss) end of period |
| Statement of Changes in Net Assets | Distributions to shareholders | Distributions to shareholders from net investment income
Distributions to shareholders from net realized gain |
4. Purchases and Sales of Investments.
Purchases and sales of securities, other than short-term securities, aggregated $67,987,424 and $30,417,423, respectively.
5. Fees and Other Transactions with Affiliates.
Management Fee. Fidelity Management & Research Company (the investment adviser) and its affiliates provide the Fund with investment management related services and the Fund does not pay any fees for these services. Under the management contract, the investment adviser or an affiliate pays all other expenses of the Fund, excluding fees and expenses of the independent Trustees, and certain miscellaneous expenses such as proxy and shareholder meeting expenses.
Brokerage Commissions. The Fund placed a portion of its portfolio transactions with brokerage firms which are affiliates of the investment adviser. Brokerage commissions are included in net realized gain (loss) and change in net unrealized appreciation (depreciation) in the Statement of Operations. The commissions paid to these affiliated firms were $265 for the period.
Interfund Trades. The Fund may purchase from or sell securities to other Fidelity Funds under procedures adopted by the Board. The procedures have been designed to ensure these interfund trades are executed in accordance with Rule 17a-7 of the 1940 Act. Interfund trades are included within the respective purchases and sales amounts shown in the Purchases and Sales of Investments note.
6. Committed Line of Credit.
The Fund participates with other funds managed by the investment adviser or an affiliate in a $4.25 billion credit facility (the "line of credit") to be utilized for temporary or emergency purposes to fund shareholder redemptions or for other short-term liquidity purposes. The Fund has agreed to pay commitment fees on its pro-rata portion of the line of credit, which amounted to $114 and is reflected in Commitment fees on the Statement of Operations. During the period, the Fund did not borrow on this line of credit.
7. Security Lending.
The Fund lends portfolio securities through a lending agent from time to time in order to earn additional income. For equity securities, a lending agent is used and may loan securities to certain qualified borrowers, including Fidelity Capital Markets (FCM), a broker-dealer affiliated with the Fund. On the settlement date of the loan, the Fund receives collateral (in the form of U.S. Treasury obligations, letters of credit and/or cash) against the loaned securities and maintains collateral in an amount not less than 100% of the market value of the loaned securities during the period of the loan. The market value of the loaned securities is determined at the close of business of the Fund and any additional required collateral is delivered to the Fund on the next business day. The Fund or borrower may terminate the loan at any time, and if the borrower defaults on its obligation to return the securities loaned because of insolvency or other reasons, the Fund may apply collateral received from the borrower against the obligation. The Fund may experience delays and costs in recovering the securities loaned. Any cash collateral received is invested in the Fidelity Securities Lending Cash Central Fund. The value of loaned securities and cash collateral at period end are disclosed on the Fund's Statement of Assets and Liabilities. Security lending income represents the income earned on investing cash collateral, less rebates paid to borrowers and any lending agent fees associated with the loan, plus any premium payments received for lending certain types of securities. Security lending income is presented in the Statement of Operations as a component of income from Fidelity Central Funds. Total security lending income during the period amounted to $2,355. During the period, there were no securities loaned to FCM.
8. Other.
The Fund's organizational documents provide former and current trustees and officers with a limited indemnification against liabilities arising in connection with the performance of their duties to the Fund. In the normal course of business, the Fund may also enter into contracts that provide general indemnifications. The Fund's maximum exposure under these arrangements is unknown as this would be dependent on future claims that may be made against the Fund. The risk of material loss from such claims is considered remote.
At the end of the period, the investment adviser or its affiliates were the owners of record of 12% of the total outstanding shares of the Fund.
Report of Independent Registered Public Accounting Firm
To the Trustees of Fidelity Investment Trust and Shareholders of Fidelity Flex International Fund:
Opinion on the Financial Statements and Financial Highlights
We have audited the accompanying statement of assets and liabilities of Fidelity Flex International Fund (the "Fund"), a fund of Fidelity Investment Trust, including the schedule of investments, as of October 31, 2018, the related statement of operations for the year then ended, the statement of changes in net assets and the financial highlights for the year then ended and for the period from March 7, 2017 (commencement of operations) to October 31, 2017, and the related notes. In our opinion, the financial statements and financial highlights present fairly, in all material respects, the financial position of the Fund as of October 31, 2018, the results of its operations for the year then ended, and the changes in its net assets and the financial highlights for the year then ended and for the period from March 7, 2017 (commencement of operations) to October 31, 2017, in conformity with accounting principles generally accepted in the United States of America.
Basis for Opinion
These financial statements and financial highlights are the responsibility of the Fund's management. Our responsibility is to express an opinion on the Fund's financial statements and financial highlights based on our audits. We are a public accounting firm registered with the Public Company Accounting Oversight Board (United States) (PCAOB) and are required to be independent with respect to the Fund in accordance with the U.S. federal securities laws and the applicable rules and regulations of the Securities and Exchange Commission and the PCAOB.
We conducted our audits in accordance with the standards of the PCAOB. Those standards require that we plan and perform the audit to obtain reasonable assurance about whether the financial statements and financial highlights are free of material misstatement, whether due to error or fraud. The Fund is not required to have, nor were we engaged to perform, an audit of its internal control over financial reporting. As part of our audits we are required to obtain an understanding of internal control over financial reporting but not for the purpose of expressing an opinion on the effectiveness of the Fund’s internal control over financial reporting. Accordingly, we express no such opinion.
Our audits included performing procedures to assess the risks of material misstatement of the financial statements and financial highlights, whether due to error or fraud, and performing procedures that respond to those risks. Such procedures included examining, on a test basis, evidence regarding the amounts and disclosures in the financial statements and financial highlights. Our audits also included evaluating the accounting principles used and significant estimates made by management, as well as evaluating the overall presentation of the financial statements and financial highlights. Our procedures included confirmation of securities owned as of October 31, 2018, by correspondence with the custodians and brokers; when replies were not received from brokers, we performed other auditing procedures. We believe that our audits provide a reasonable basis for our opinion.
/s/ Deloitte & Touche LLP
Boston, Massachusetts
December 18, 2018
We have served as the auditor of one or more of the Fidelity investment companies since 1999.
Trustees and Officers
The Trustees, Members of the Advisory Board (if any), and officers of the trust and fund, as applicable, are listed below. The Board of Trustees governs the fund and is responsible for protecting the interests of shareholders. The Trustees are experienced executives who meet periodically throughout the year to oversee the fund's activities, review contractual arrangements with companies that provide services to the fund, oversee management of the risks associated with such activities and contractual arrangements, and review the fund's performance. Except for Jonathan Chiel each of the Trustees oversees 283 funds. Mr. Chiel oversees 154 funds.
The Trustees hold office without limit in time except that (a) any Trustee may resign; (b) any Trustee may be removed by written instrument, signed by at least two-thirds of the number of Trustees prior to such removal; (c) any Trustee who requests to be retired or who has become incapacitated by illness or injury may be retired by written instrument signed by a majority of the other Trustees; and (d) any Trustee may be removed at any special meeting of shareholders by a two-thirds vote of the outstanding voting securities of the trust. Each Trustee who is not an interested person (as defined in the 1940 Act) of the trust and the fund is referred to herein as an Independent Trustee. Each Independent Trustee shall retire not later than the last day of the calendar year in which his or her 75th birthday occurs. The Independent Trustees may waive this mandatory retirement age policy with respect to individual Trustees. Officers and Advisory Board Members hold office without limit in time, except that any officer or Advisory Board Member may resign or may be removed by a vote of a majority of the Trustees at any regular meeting or any special meeting of the Trustees. Except as indicated, each individual has held the office shown or other offices in the same company for the past five years.
The fund’s Statement of Additional Information (SAI) includes more information about the Trustees. To request a free copy, call Fidelity at 1-800-835-5092.
Experience, Skills, Attributes, and Qualifications of the Trustees. The Governance and Nominating Committee has adopted a statement of policy that describes the experience, qualifications, attributes, and skills that are necessary and desirable for potential Independent Trustee candidates (Statement of Policy). The Board believes that each Trustee satisfied at the time he or she was initially elected or appointed a Trustee, and continues to satisfy, the standards contemplated by the Statement of Policy. The Governance and Nominating Committee also engages professional search firms to help identify potential Independent Trustee candidates who have the experience, qualifications, attributes, and skills consistent with the Statement of Policy. From time to time, additional criteria based on the composition and skills of the current Independent Trustees, as well as experience or skills that may be appropriate in light of future changes to board composition, business conditions, and regulatory or other developments, have also been considered by the professional search firms and the Governance and Nominating Committee. In addition, the Board takes into account the Trustees' commitment and participation in Board and committee meetings, as well as their leadership of standing and ad hoc committees throughout their tenure.
In determining that a particular Trustee was and continues to be qualified to serve as a Trustee, the Board has considered a variety of criteria, none of which, in isolation, was controlling. The Board believes that, collectively, the Trustees have balanced and diverse experience, qualifications, attributes, and skills, which allow the Board to operate effectively in governing the fund and protecting the interests of shareholders. Information about the specific experience, skills, attributes, and qualifications of each Trustee, which in each case led to the Board's conclusion that the Trustee should serve (or continue to serve) as a trustee of the fund, is provided below.
Board Structure and Oversight Function. James C. Curvey is an interested person and currently serves as Chairman. The Trustees have determined that an interested Chairman is appropriate and benefits shareholders because an interested Chairman has a personal and professional stake in the quality and continuity of services provided to the fund. Independent Trustees exercise their informed business judgment to appoint an individual of their choosing to serve as Chairman, regardless of whether the Trustee happens to be independent or a member of management. The Independent Trustees have determined that they can act independently and effectively without having an Independent Trustee serve as Chairman and that a key structural component for assuring that they are in a position to do so is for the Independent Trustees to constitute a substantial majority for the Board. The Independent Trustees also regularly meet in executive session. Ned C. Lautenbach serves as Chairman of the Independent Trustees and as such (i) acts as a liaison between the Independent Trustees and management with respect to matters important to the Independent Trustees and (ii) with management prepares agendas for Board meetings.
Fidelity® funds are overseen by different Boards of Trustees. The fund's Board oversees Fidelity's high income and certain equity funds, and other Boards oversee Fidelity's investment-grade bond, money market, asset allocation, and other equity funds. The asset allocation funds may invest in Fidelity® funds overseen by the fund's Board. The use of separate Boards, each with its own committee structure, allows the Trustees of each group of Fidelity® funds to focus on the unique issues of the funds they oversee, including common research, investment, and operational issues. On occasion, the separate Boards establish joint committees to address issues of overlapping consequences for the Fidelity® funds overseen by each Board.
The Trustees operate using a system of committees to facilitate the timely and efficient consideration of all matters of importance to the Trustees, the fund, and fund shareholders and to facilitate compliance with legal and regulatory requirements and oversight of the fund's activities and associated risks. The Board, acting through its committees, has charged FMR and its affiliates with (i) identifying events or circumstances the occurrence of which could have demonstrably adverse effects on the fund's business and/or reputation; (ii) implementing processes and controls to lessen the possibility that such events or circumstances occur or to mitigate the effects of such events or circumstances if they do occur; and (iii) creating and maintaining a system designed to evaluate continuously business and market conditions in order to facilitate the identification and implementation processes described in (i) and (ii) above. Because the day-to-day operations and activities of the fund are carried out by or through FMR, its affiliates, and other service providers, the fund's exposure to risks is mitigated but not eliminated by the processes overseen by the Trustees. While each of the Board's committees has responsibility for overseeing different aspects of the fund's activities, oversight is exercised primarily through the Operations, Audit, and Compliance Committees. In addition, the Independent Trustees have worked with Fidelity to enhance the Board's oversight of investment and financial risks, legal and regulatory risks, technology risks, and operational risks, including the development of additional risk reporting to the Board. Appropriate personnel, including but not limited to the fund's Chief Compliance Officer (CCO), FMR's internal auditor, the independent accountants, the fund's Treasurer and portfolio management personnel, make periodic reports to the Board's committees, as appropriate, including an annual review of Fidelity's risk management program for the Fidelity® funds. The responsibilities of each standing committee, including their oversight responsibilities, are described further under "Standing Committees of the Trustees."
Interested Trustees*:
Correspondence intended for a Trustee who is an interested person may be sent to Fidelity Investments, 245 Summer Street, Boston, Massachusetts 02210.
Name, Year of Birth; Principal Occupations and Other Relevant Experience+
Jonathan Chiel (1957)
Year of Election or Appointment: 2016
Trustee
Mr. Chiel also serves as Trustee of other Fidelity® funds. Mr. Chiel is Executive Vice President and General Counsel for FMR LLC (diversified financial services company, 2012-present). Previously, Mr. Chiel served as general counsel (2004-2012) and senior vice president and deputy general counsel (2000-2004) for John Hancock Financial Services; a partner with Choate, Hall & Stewart (1996-2000) (law firm); and an Assistant United States Attorney for the United States Attorney’s Office of the District of Massachusetts (1986-95), including Chief of the Criminal Division (1993-1995). Mr. Chiel is a director on the boards of the Boston Bar Foundation and the Maimonides School.
James C. Curvey (1935)
Year of Election or Appointment: 2007
Trustee
Chairman of the Board of Trustees
Mr. Curvey also serves as Trustee of other Fidelity® funds. Mr. Curvey is Vice Chairman (2007-present) and Director of FMR LLC (diversified financial services company). In addition, Mr. Curvey is an Overseer Emeritus for the Boston Symphony Orchestra, a Director of Artis-Naples, and a Trustee of Brewster Academy in Wolfeboro, New Hampshire. Previously, Mr. Curvey served as a Director of Fidelity Research & Analysis Co. (investment adviser firm, 2009-2018), Director of Fidelity Investments Money Management, Inc. (investment adviser firm, 2009-2014) and a Director of FMR and FMR Co., Inc. (investment adviser firms, 2007-2014).
Charles S. Morrison (1960)
Year of Election or Appointment: 2014
Trustee
Mr. Morrison also serves as Trustee of other funds. He serves as President of Fidelity SelectCo, LLC (investment adviser firm, 2017-present) and Fidelity Management & Research Company (FMR) (investment adviser firm, 2016-present), a Director of Fidelity Investments Money Management, Inc. (FIMM) (investment adviser firm, 2014-present), Director of Fidelity SelectCo, LLC (investment adviser firm, 2014-present), President, Asset Management (2014-present), and is an employee of Fidelity Investments. Previously, Mr. Morrison served as Vice President of Fidelity's Fixed Income and Asset Allocation Funds (2012-2014), President, Fixed Income (2011-2014), Vice President of Fidelity's Money Market Funds (2005-2009), President, Money Market Group Leader of FMR (investment adviser firm, 2009), and Senior Vice President, Money Market Group of FMR (2004-2009). Mr. Morrison also served as Vice President of Fidelity's Bond Funds (2002-2005), certain Balanced Funds (2002-2005), and certain Asset Allocation Funds (2002-2007), and as Senior Vice President (2002-2005) of Fidelity's Bond Division.
* Determined to be an “Interested Trustee” by virtue of, among other things, his or her affiliation with the trust or various entities under common control with FMR.
+ The information includes the Trustee's principal occupation during the last five years and other information relating to the experience, attributes, and skills relevant to the Trustee's qualifications to serve as a Trustee, which led to the conclusion that the Trustee should serve as a Trustee for the fund.
Independent Trustees:
Correspondence intended for an Independent Trustee may be sent to Fidelity Investments, P.O. Box 55235, Boston, Massachusetts 02205-5235.
Name, Year of Birth; Principal Occupations and Other Relevant Experience+
Dennis J. Dirks (1948)
Year of Election or Appointment: 2005
Trustee
Mr. Dirks also serves as Trustee of other Fidelity® funds. Prior to his retirement in May 2003, Mr. Dirks was Chief Operating Officer and a member of the Board of The Depository Trust & Clearing Corporation (DTCC). He also served as President, Chief Operating Officer, and Board member of The Depository Trust Company (DTC) and President and Board member of the National Securities Clearing Corporation (NSCC). In addition, Mr. Dirks served as Chief Executive Officer and Board member of the Government Securities Clearing Corporation, Chief Executive Officer and Board member of the Mortgage-Backed Securities Clearing Corporation, as a Trustee and a member of the Finance Committee of Manhattan College (2005-2008), as a Trustee and a member of the Finance Committee of AHRC of Nassau County (2006-2008), as a member of the Independent Directors Council (IDC) Governing Council (2010-2015), and as a member of the Board of Directors for The Brookville Center for Children’s Services, Inc. (2009-2017). Mr. Dirks is a member of the Finance Committee (2016-present), Board of Directors (2017-present) and Board of Trustees (2018-present) and is Treasurer (2018-present) of the Asolo Repertory Theatre.
Donald F. Donahue (1950)
Year of Election or Appointment: 2018
Trustee
Mr. Donahue also serves as a Trustee of other Fidelity® funds. Mr. Donahue is President and Chief Executive Officer of Miranda Partners, LLC (risk consulting for the financial services industry, 2012-present). Previously, Mr. Donahue served as a Member of the Advisory Board of certain Fidelity® funds (2015-2018) and Chief Executive Officer (2006-2012), Chief Operating Officer (2003-2006), and Managing Director, Customer Marketing and Development (1999-2003) of The Depository Trust & Clearing Corporation (financial markets infrastructure). Mr. Donahue serves as a Member (2007-present) and Co-Chairman (2016-present) of the Board of Directors of United Way of New York, Member of the Board of Directors of NYC Leadership Academy (2012-present) and Member of the Board of Advisors of Ripple Labs, Inc. (financial services, 2015-present). He also served as Chairman (2010-2012) and Member of the Board of Directors (2012-2013) of Omgeo, LLC (financial services), Treasurer of United Way of New York (2012-2016), and Member of the Board of Directors of XBRL US (financial services non-profit, 2009-2012) and the International Securities Services Association (2009-2012).
Alan J. Lacy (1953)
Year of Election or Appointment: 2008
Trustee
Mr. Lacy also serves as Trustee of other Fidelity® funds. Mr. Lacy serves as a Director of Bristol-Myers Squibb Company (global pharmaceuticals, 2008-present). He is a Trustee of the California Chapter of The Nature Conservancy (2015-present) and a Director of the Center for Advanced Study in the Behavioral Sciences at Stanford University (2015-present). In addition, Mr. Lacy served as Senior Adviser (2007-2014) of Oak Hill Capital Partners, L.P. (private equity) and also served as Chief Executive Officer (2005) and Vice Chairman (2005-2006) of Sears Holdings Corporation (retail) and Chief Executive Officer and Chairman of the Board of Sears, Roebuck and Co. (retail, 2000-2005). Previously, Mr. Lacy served as Chairman (2014-2017) and a member (2010-2017) of the Board of Directors of Dave & Buster’s Entertainment, Inc. (restaurant and entertainment complexes), as Chairman (2008-2011) and a member (2006-2015) of the Board of Trustees of the National Parks Conservation Association, and as a member of the Board of Directors for The Hillman Companies, Inc. (hardware wholesalers, 2010-2014), Earth Fare, Inc. (retail grocery, 2010-2014), and The Western Union Company (global money transfer, 2006-2011).
Ned C. Lautenbach (1944)
Year of Election or Appointment: 2000
Trustee
Chairman of the Independent Trustees
Mr. Lautenbach also serves as Trustee of other Fidelity® funds. Mr. Lautenbach currently serves as Vice Chair of the Board of Governors, State University System of Florida (2013-present) and is a member of the Council on Foreign Relations (1994-present). He is also a member and has most recently served as Chairman of the Board of Directors of Artis-Naples (2012-present). Previously, Mr. Lautenbach served as a member and then Lead Director of the Board of Directors of Eaton Corporation (diversified industrial, 1997-2016). He was also a Partner and Advisory Partner at Clayton, Dubilier & Rice, LLC (private equity investment, 1998-2010), as well as a Director of Sony Corporation (2006-2007). In addition, Mr. Lautenbach also had a 30-year career with IBM (technology company) during which time he served as Senior Vice President and a member of the Corporate Executive Committee (1968-1998).
Joseph Mauriello (1944)
Year of Election or Appointment: 2008
Trustee
Mr. Mauriello also serves as Trustee of other Fidelity® funds. Prior to his retirement in January 2006, Mr. Mauriello served in numerous senior management positions including Deputy Chairman and Chief Operating Officer (2004-2005), and Vice Chairman of Financial Services (2002-2004) of KPMG LLP US (professional services, 1965-2005). Mr. Mauriello currently serves as a member of the Independent Directors Council (IDC) Governing Council (2015-present). Previously, Mr. Mauriello served as a member of the Board of Directors of XL Group plc. (global insurance and re-insurance, 2006-2018).
Cornelia M. Small (1944)
Year of Election or Appointment: 2005
Trustee
Ms. Small also serves as Trustee of other Fidelity® funds. Ms. Small is a member of the Board of Directors (2009-present) and Chair of the Investment Committee (2010-present) of the Teagle Foundation. Ms. Small also serves on the Investment Committee of the Berkshire Taconic Community Foundation (2008-present). Previously, Ms. Small served as Chairperson (2002-2008) and a member of the Investment Committee and Chairperson (2008-2012) and a member of the Board of Trustees of Smith College. In addition, Ms. Small served as Chief Investment Officer, Director of Global Equity Investments, and a member of the Board of Directors of Scudder, Stevens & Clark and Scudder Kemper Investments.
Garnett A. Smith (1947)
Year of Election or Appointment: 2018
Trustee
Mr. Smith also serves as Trustee of other Fidelity® funds. Prior to Mr. Smith's retirement, he served as Chairman and Chief Executive Officer of Inbrand Corp. (manufacturer of personal absorbent products, 1990-1997). He also served as President (1986-1990) of Inbrand Corp. Prior to his employment with Inbrand Corp., he was employed by a retail fabric chain and North Carolina National Bank. In addition, Mr. Smith served as a Member of the Advisory Board of certain Fidelity® funds (2012-2013) and as a board member of the Jackson Hole Land Trust (2009-2012).
David M. Thomas (1949)
Year of Election or Appointment: 2008
Trustee
Mr. Thomas also serves as Trustee of other Fidelity® funds. Mr. Thomas serves as Non-Executive Chairman of the Board of Directors of Fortune Brands Home and Security (home and security products, 2011-present), as a member of the Board of Directors (2004-present) and Presiding Director (2013-present) of Interpublic Group of Companies, Inc. (marketing communication), and as a member of the Board of Trustees of the University of Florida (2013-present). Previously, Mr. Thomas served as Executive Chairman (2005-2006) and Chairman and Chief Executive Officer (2000-2005) of IMS Health, Inc. (pharmaceutical and healthcare information solutions), and a Director of Fortune Brands, Inc. (consumer products, 2000-2011).
+ The information includes the Trustee's principal occupation during the last five years and other information relating to the experience, attributes, and skills relevant to the Trustee's qualifications to serve as a Trustee, which led to the conclusion that the Trustee should serve as a Trustee for the fund.
Advisory Board Members and Officers:
Correspondence intended for a Member of the Advisory Board (if any) may be sent to Fidelity Investments, P.O. Box 55235, Boston, Massachusetts 02205-5235. Correspondence intended for an officer or Peter S. Lynch may be sent to Fidelity Investments, 245 Summer Street, Boston, Massachusetts 02210. Officers appear below in alphabetical order.
Name, Year of Birth; Principal Occupation
Vicki L. Fuller (1957)
Year of Election or Appointment: 2018
Member of the Advisory Board
Ms. Fuller also serves as Member of the Advisory Board of other Fidelity® funds. Ms. Fuller serves as a member of the Board of Directors, Audit Committee, and Nominating and Governance Committee of The Williams Companies, Inc. (natural gas infrastructure, 2018-present). Previously, Ms. Fuller served as the Chief Investment Officer of the New York State Common Retirement Fund (2012-2018) and held a variety of positions at AllianceBernstein L.P. (global asset management, 1985-2012), including Managing Director (2006-2012) and Senior Vice President and Senior Portfolio Manager (2001-2006).
Peter S. Lynch (1944)
Year of Election or Appointment: 2003
Member of the Advisory Board
Mr. Lynch also serves as Member of the Advisory Board of other Fidelity® funds. Mr. Lynch is Vice Chairman and a Director of FMR (investment adviser firm) and FMR Co., Inc. (investment adviser firm). In addition, Mr. Lynch serves as a Trustee of Boston College and as the Chairman of the Inner-City Scholarship Fund. Previously, Mr. Lynch served on the Special Olympics International Board of Directors (1997-2006).
William S. Stavropoulos (1939)
Year of Election or Appointment: 2018
Member of the Advisory Board
Mr. Stavropoulos also serves as Member of the Advisory Board of other Fidelity® funds. Mr. Stavropoulos serves as President and Founder of the Michigan Baseball Foundation, the Great Lakes Loons (2007-present). Mr. Stavropoulos is Chairman Emeritus of the Board of Directors of The Dow Chemical Company, where he previously served in numerous senior management positions, including President, CEO (1995-2000; 2002-2004), Chairman of the Executive Committee (2000-2006), and as a member of the Board of Directors (1990-2006). Currently, Mr. Stavropoulos is Chairman of the Board of Directors of Univar Inc. (global distributor of commodity and specialty chemicals), a Director of Teradata Corporation (data warehousing and technology solutions), and a member of the Advisory Board for Metalmark Capital LLC (private equity investment, 2005-present). Mr. Stavropoulos is an operating advisor to Clayton, Dubilier & Rice, LLC (private equity investment). In addition, Mr. Stavropoulos is a member of the University of Notre Dame Advisory Council for the College of Science, a Trustee of the Rollin L. Gerstacker Foundation, and a Director of Artis-Naples in Naples, Florida. Previously, Mr. Stavropoulos served as Trustee of certain Fidelity® funds (2001-2018) and as a Director of Chemical Financial Corporation (bank holding company, 1993-2012) and Tyco International, Ltd. (multinational manufacturing and services, 2007-2012).
Carol B. Tomé (1957)
Year of Election or Appointment: 2018
Member of the Advisory Board
Ms. Tomé also serves as Member of the Advisory Board of other Fidelity® funds. Ms. Tomé is Chief Financial Officer (2001-present) and Executive Vice President of Corporate Services (2007-present) of The Home Depot, Inc. (home improvement retailer) and a Director (2003-present) and Chair of the Audit Committee (2004-present) of United Parcel Service, Inc. (package delivery and supply chain management). Previously, Ms. Tomé served as Trustee of certain Fidelity® funds (2017), Senior Vice President of Finance and Accounting/Treasurer (2000-2007) and Vice President and Treasurer (1995-2000) of The Home Depot, Inc. and Chair of the Board (2010-2012), Vice Chair of the Board (2009 and 2013), and a Director (2008-2013) of the Federal Reserve Bank of Atlanta. Ms. Tomé is also a director or trustee of many community and professional organizations.
Michael E. Wiley (1950)
Year of Election or Appointment: 2018
Member of the Advisory Board
Mr. Wiley also serves as Trustee or Member of the Advisory Board of other Fidelity® funds. Mr. Wiley serves as a Director of High Point Resources (exploration and production, 2005-present). Previously, Mr. Wiley served as a Director of Andeavor Corporation (independent oil refiner and marketer, 2005-2018), a Director of Andeavor Logistics LP (natural resources logistics, 2015-2018), a Director of Post Oak Bank (privately-held bank, 2004-2018), a Director of Asia Pacific Exploration Consolidated (international oil and gas exploration and production, 2008-2013), a member of the Board of Trustees of the University of Tulsa (2000-2006; 2007-2010), a Senior Energy Advisor of Katzenbach Partners, LLC (consulting, 2006-2007), an Advisory Director of Riverstone Holdings (private investment), a Director of Spinnaker Exploration Company (exploration and production, 2001-2005) and Chairman, President, and CEO of Baker Hughes, Inc. (oilfield services, 2000-2004).
Elizabeth Paige Baumann (1968)
Year of Election or Appointment: 2017
Anti-Money Laundering (AML) Officer
Ms. Baumann also serves as AML Officer of other funds. She is Chief AML Officer (2012-present) and Senior Vice President (2014-present) of FMR LLC (diversified financial services company) and is an employee of Fidelity Investments. Previously, Ms. Baumann served as AML Officer of the funds (2012-2016), and Vice President (2007-2014) and Deputy Anti-Money Laundering Officer (2007-2012) of FMR LLC.
John J. Burke III (1964)
Year of Election or Appointment: 2018
Chief Financial Officer
Mr. Burke also serves as Chief Financial Officer of other funds. Mr. Burke serves as Head of Investment Operations for Fidelity Fund and Investment Operations (2018-present) and is an employee of Fidelity Investments (1998-present). Previously Mr. Burke served as head of Asset Management Investment Operations (2012-2018).
William C. Coffey (1969)
Year of Election or Appointment: 2018
Secretary and Chief Legal Officer (CLO)
Mr. Coffey also serves as Secretary and CLO of other funds. Mr. Coffey serves as CLO, Secretary, and Senior Vice President of Fidelity Management & Research Company and FMR Co., Inc. (investment adviser firms, 2018-present); Secretary of Fidelity SelectCo, LLC and Fidelity Investments Money Management, Inc. (investment adviser firms, 2018-present); and CLO of Fidelity Management & Research (Hong Kong) Limited, FMR Investment Management (UK) Limited, and Fidelity Management & Research (Japan) Limited (investment adviser firms, 2018-present). He is Senior Vice President and Deputy General Counsel of FMR LLC (diversified financial services company, 2010-present), and is an employee of Fidelity Investments. Previously, Mr. Coffey served as Assistant Secretary of certain funds (2009-2018) and as Vice President and Associate General Counsel of FMR LLC (2005-2009).
Timothy M. Cohen (1969)
Year of Election or Appointment: 2018
Vice President
Mr. Cohen also serves as Vice President of other funds. Mr. Cohen serves as Co-Head of Global Equity Research (2016-present), a Director of Fidelity Management & Research (Japan) Limited (investment adviser firm, 2016-present), and is an employee of Fidelity Investments. Previously, Mr. Cohen served as Chief Investment Officer - Equity and a Director of Fidelity Management & Research (U.K.) Inc. (investment adviser firm, 2013-2015) and as a Director of Fidelity Management & Research (Hong Kong) Limited (investment adviser firm, 2017).
Jonathan Davis (1968)
Year of Election or Appointment: 2010
Assistant Treasurer
Mr. Davis also serves as Assistant Treasurer of other funds. Mr. Davis serves as Assistant Treasurer of FMR Capital, Inc. (2017-present) and is an employee of Fidelity Investments. Previously, Mr. Davis served as Vice President and Associate General Counsel of FMR LLC (diversified financial services company, 2003-2010).
Adrien E. Deberghes (1967)
Year of Election or Appointment: 2016
Assistant Treasurer
Mr. Deberghes also serves as an officer of other funds. He serves as Assistant Treasurer of FMR Capital, Inc. (2017-present), Executive Vice President of Fidelity Investments Money Management, Inc. (FIMM) (investment adviser firm, 2016-present), and is an employee of Fidelity Investments (2008-present). Previously, Mr. Deberghes served as President and Treasurer of certain Fidelity® funds (2013-2018). Prior to joining Fidelity Investments, Mr. Deberghes was Senior Vice President of Mutual Fund Administration at State Street Corporation (2007-2008), Senior Director of Mutual Fund Administration at Investors Bank & Trust (2005-2007), and Director of Finance for Dunkin' Brands (2000-2005). Previously, Mr. Deberghes served in other fund officer roles.
Laura M. Del Prato (1964)
Year of Election or Appointment: 2018
Assistant Treasurer
Ms. Del Prato also serves as an officer of other funds. Ms. Del Prato is an employee of Fidelity Investments (2017-present). Prior to joining Fidelity Investments, Ms. Del Prato served as a Managing Director and Treasurer of the JPMorgan Mutual Funds (2014-2017). Prior to JPMorgan, Ms. Del Prato served as a partner at Cohen Fund Audit Services (accounting firm, 2012-2013) and KPMG LLP (accounting firm, 2004-2012).
Colm A. Hogan (1973)
Year of Election or Appointment: 2016
Deputy Treasurer
Mr. Hogan also serves as an officer of other funds. Mr. Hogan serves as Assistant Treasurer of FMR Capital, Inc. (2017-present) and is an employee of Fidelity Investments (2005-present). Previously, Mr. Hogan served as Assistant Treasurer of certain Fidelity® funds (2016-2018).
Pamela R. Holding (1964)
Year of Election or Appointment: 2018
Vice President
Ms. Holding also serves as Vice President of other funds. Ms. Holding serves as Co-Head of Global Equity Research (2018-present) and is an employee of Fidelity Investments (2013-present).
Chris Maher (1972)
Year of Election or Appointment: 2013
Assistant Treasurer
Mr. Maher serves as Assistant Treasurer of other funds. Mr. Maher is Vice President of Valuation Oversight, serves as Assistant Treasurer of FMR Capital, Inc. (2017-present), and is an employee of Fidelity Investments. Previously, Mr. Maher served as Vice President of Asset Management Compliance (2013), Vice President of the Program Management Group of FMR (investment adviser firm, 2010-2013), and Vice President of Valuation Oversight (2008-2010).
Rieco E. Mello (1969)
Year of Election or Appointment: 2017
Assistant Treasurer
Mr. Mello also serves as Assistant Treasurer of other funds. Mr. Mello serves as Assistant Treasurer of FMR Capital, Inc. (2017-present) and is an employee of Fidelity Investments (1995-present).
Kenneth B. Robins (1969)
Year of Election or Appointment: 2016
Chief Compliance Officer
Mr. Robins also serves as an officer of other funds. Mr. Robins serves as Compliance Officer of Fidelity Management & Research Company and FMR Co., Inc. (investment adviser firms, 2016-present) and is an employee of Fidelity Investments (2004-present). Previously, Mr. Robins served as Executive Vice President of Fidelity Investments Money Management, Inc. (investment adviser firm, 2013-2016) and served in other fund officer roles.
Stacie M. Smith (1974)
Year of Election or Appointment: 2016
President and Treasurer
Ms. Smith also serves as an officer of other funds. Ms. Smith serves as Assistant Treasurer of FMR Capital, Inc. (2017-present), is an employee of Fidelity Investments (2009-present), and has served in other fund officer roles. Prior to joining Fidelity Investments, Ms. Smith served as Senior Audit Manager of Ernst & Young LLP (accounting firm, 1996-2009). Previously, Ms. Smith served as Assistant Treasurer (2013-2018) and Deputy Treasurer (2013-2016) of certain Fidelity® funds.
Marc L. Spector (1972)
Year of Election or Appointment: 2016
Assistant Treasurer
Mr. Spector also serves as an officer of other funds. Mr. Spector serves as Assistant Treasurer of FMR Capital, Inc. (2017-present) and is an employee of Fidelity Investments (2016-present). Prior to joining Fidelity Investments, Mr. Spector served as Director at the Siegfried Group (accounting firm, 2013-2016), and prior to Siegfried Group as audit senior manager at Deloitte & Touche (accounting firm, 2005-2013).
Shareholder Expense Example
As a shareholder of the Fund, you incur two types of costs: (1) transaction costs and (2) ongoing costs, including other Fund expenses. This Example is intended to help you understand your ongoing costs (in dollars) of investing in the Fund and to compare these costs with the ongoing costs of investing in other mutual funds.
The Example is based on an investment of $1,000 invested at the beginning of the period and held for the entire period (May 1, 2018 to October 31, 2018).
Actual Expenses
The first line of the accompanying table provides information about actual account values and actual expenses. You may use the information in this line, together with the amount you invested, to estimate the expenses that you paid over the period. Simply divide your account value by $1,000.00 (for example, an $8,600 account value divided by $1,000.00 = 8.6), then multiply the result by the number in the first line under the heading entitled "Expenses Paid During Period" to estimate the expenses you paid on your account during this period. In addition, the Fund, as a shareholder in the underlying Fidelity Central Funds, will indirectly bear its pro-rata share of the fees and expenses incurred by the underlying Fidelity Central Funds. These fees and expenses are not included in the Fund's annualized expense ratio used to calculate the expense estimate in the table below.
Hypothetical Example for Comparison Purposes
The second line of the accompanying table provides information about hypothetical account values and hypothetical expenses based on the Fund's actual expense ratio and an assumed rate of return of 5% per year before expenses, which is not the Fund's actual return. The hypothetical account values and expenses may not be used to estimate the actual ending account balance or expenses you paid for the period. You may use this information to compare the ongoing costs of investing in the Fund and other funds. To do so, compare this 5% hypothetical example with the 5% hypothetical examples that appear in the shareholder reports of the other funds. In addition, the Fund, as a shareholder in the underlying Fidelity Central Funds, will indirectly bear its pro-rata share of the fees and expenses incurred by the underlying Fidelity Central Funds. These fees and expenses are not included in the Fund's annualized expense ratio used to calculate the expense estimate in the table below.
Please note that the expenses shown in the table are meant to highlight your ongoing costs only and do not reflect any transaction costs. Therefore, the second line of the table is useful in comparing ongoing costs only, and will not help you determine the relative total costs of owning different funds.
| | Annualized Expense Ratio-A | Beginning
Account Value
May 1, 2018 | Ending
Account Value
October 31, 2018 | Expenses Paid
During Period-B
May 1, 2018
to October 31, 2018 |
| Actual | - %C | $1,000.00 | $892.70 | $-D |
| Hypothetical-E | | $1,000.00 | $1,025.21 | $-D |
A Annualized expense ratio reflects expenses net of applicable fee waivers.
B Expenses are equal to the Fund's annualized expense ratio, multiplied by the average account value over the period, multiplied by 184/365 (to reflect the one-half year period).
C Amount represents less than .005%.
D Amount represents less than $.005.
E 5% return per year before expenses
Distributions (Unaudited)
The fund designates 3% of the dividends distributed during the fiscal year as qualifying for the dividends–received deduction for corporate shareholders.
The fund designates 63% of the dividends distributed during the fiscal year as amounts which may be taken into account as a dividend for the purposes of the maximum rate under section 1(h)(11) of the Internal Revenue Code.
The amounts per share which represent income derived from sources within, and taxes paid to, foreign countries or possessions of the United States are $0.0510 and $0.0055 for the dividend paid December 11, 2017.
The fund will notify shareholders in January 2019 of amounts for use in preparing 2018 income tax returns.
Board Approval of Investment Advisory Contracts
Fidelity Flex International Fund
At its July 2018 meeting, the Board of Trustees, including the Independent Trustees (together, the Board), voted to continue the management contract with Fidelity Management & Research Company (FMR) and the sub-advisory agreements (together, the Advisory Contracts) for the fund for six months through January 31, 2019, in connection with the reunification of the Fidelity Equity High Income Funds Board, which oversees the fund, and the Sector Portfolios Board.
The Board considered that the approval of the fund's Advisory Contracts will not result in any changes in (i) the investment process or strategies employed in the management of the fund's assets; (ii) the fees and expenses paid by shareholders; (iii) the nature, extent or quality of services provided under the fund's Advisory Contracts; or (iv) the day-to-day management of the fund or the persons primarily responsible for such management. The Board concluded that the fund's Advisory Contracts are fair and reasonable, and that the fund's Advisory Contracts should be renewed, without modification, through January 31, 2019, with the understanding that the Board will consider the annual renewal for a full one year period in January 2019.
In connection with its consideration of future renewals of the fund's Advisory Contracts, the Board will consider: (i) the nature, extent and quality of services provided to the fund, including shareholder and administrative services and investment performance; (ii) the competitiveness of the management fee and total expenses for the fund; (iii) the costs of the services and profitability, including the revenues earned and the expenses incurred in conducting the business of developing, marketing, distributing, managing, administering, and servicing the fund and its shareholders, to the extent applicable, as well as potential fall-out benefits from Fidelity's non-fund businesses; and (iv) whether there have been economies of scale in respect of the Fidelity funds, whether the Fidelity funds (including the fund) have appropriately benefited from any such economies of scale, and whether there is the potential for realization of any further economies.
Based on its evaluation of all of the conclusions noted above, and after considering all factors it believed relevant, the Board ultimately concluded that the fund's management fee structure is fair and reasonable, and that the continuation of the fund's Advisory Contracts should be approved.
Corporate Headquarters
245 Summer St.
Boston, MA 02210
www.fidelity.com
ZNL-ANN-1218
1.9881587.101
Fidelity® International Capital Appreciation K6 Fund
Annual Report October 31, 2018 |
|
Contents
To view a fund's proxy voting guidelines and proxy voting record for the 12-month period ended June 30, visit http://www.fidelity.com/proxyvotingresults or visit the Securities and Exchange Commission's (SEC) web site at http://www.sec.gov.
You may also call 1-800-835-5092 to request a free copy of the proxy voting guidelines.
Standard & Poor's, S&P and S&P 500 are registered service marks of The McGraw-Hill Companies, Inc. and have been licensed for use by Fidelity Distributors Corporation.
Other third-party marks appearing herein are the property of their respective owners.
All other marks appearing herein are registered or unregistered trademarks or service marks of FMR LLC or an affiliated company. © 2018 FMR LLC. All rights reserved.
This report and the financial statements contained herein are submitted for the general information of the shareholders of the Fund. This report is not authorized for distribution to prospective investors in the Fund unless preceded or accompanied by an effective prospectus.
A fund files its complete schedule of portfolio holdings with the SEC for the first and third quarters of each fiscal year on Form N-Q. Forms N-Q are available on the SEC’s web site at http://www.sec.gov. A fund's Forms N-Q may be reviewed and copied at the SEC’s Public Reference Room in Washington, DC. Information regarding the operation of the SEC's Public Reference Room may be obtained by calling 1-800-SEC-0330.
For a complete list of a fund's portfolio holdings, view the most recent holdings listing, semiannual report, or annual report on Fidelity's web site at http://www.fidelity.com, http://www.institutional.fidelity.com, or http://www.401k.com, as applicable.
NOT FDIC INSURED •MAY LOSE VALUE •NO BANK GUARANTEE
Neither the Fund nor Fidelity Distributors Corporation is a bank.
Performance: The Bottom Line
Average annual total return reflects the change in the value of an investment, assuming reinvestment of distributions from dividend income and capital gains (the profits earned upon the sale of securities that have grown in value, if any) and assuming a constant rate of performance each year. The hypothetical investment and the average annual total returns do not reflect the deduction of taxes that a shareholder would pay on fund distributions or the redemption of fund shares. During periods of reimbursement by Fidelity, a fund’s total return will be greater than it would be had the reimbursement not occurred. How a fund did yesterday is no guarantee of how it will do tomorrow.
Average Annual Total Returns
| For the periods ended October 31, 2018 | Past 1 year | Life of fundA |
| Fidelity® International Capital Appreciation K6 Fund | (7.36)% | 1.38% |
A From May 25, 2017
$10,000 Over Life of Fund
Let's say hypothetically that $10,000 was invested in Fidelity® International Capital Appreciation K6 Fund on May 25, 2017, when the fund started.
The chart shows how the value of your investment would have changed, and also shows how the MSCI ACWI (All Country World Index) ex USA Index performed over the same period.
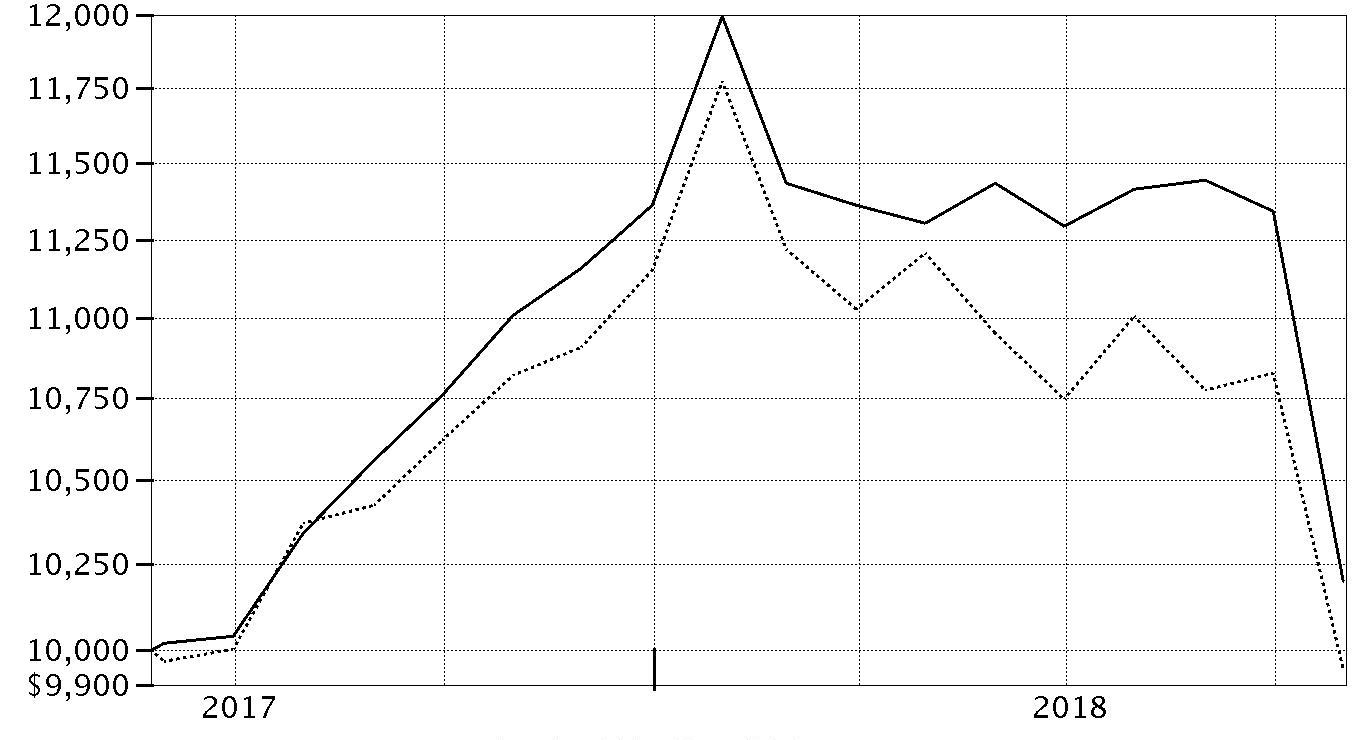
| Period Ending Values |
| $10,199 | Fidelity® International Capital Appreciation K6 Fund |
| $9,946 | MSCI ACWI (All Country World Index) ex USA Index |
Management's Discussion of Fund Performance
Market Recap: International equities returned -8.08% for the 12 months ending October 31, 2018, according to the MSCI ACWI (All Country World Index) ex USA Index. A modestly positive first half of the period gave way to a confluence of overwhelmingly negative factors – including escalating trade tensions, a surging U.S. dollar, tepid economic growth in Europe, global central bank tightening, concerns about Italy’s budget stalemate with the EU, and weakness in China’s stock market – that yielded a -11% second-half return. The index lost 8% in October alone, its largest monthly drop in more than six years. Among sectors, new-media-infused communications services (-15%) was hit the hardest, while economically sensitive consumer discretionary (-13%), information technology (-12%), financials (-10%), industrials (-9%) and materials (-7%) stocks also fared poorly. Even the more defensive real estate (-9%), utilities (-6%) and consumer staples (-5%) sectors weren’t spared this period. Conversely, elevated crude-oil prices fueled a positive return for energy (+7%), the top-performing sector, followed by the relatively stable-growing health care segment (+2%). Regionally, emerging markets (-12%) fared the worst, hampered by the impact of foreign exchange and concerns about economic weakness in China, India and South Korea. Sluggish growth also pressured shares in continental Europe (-9%). Stocks in Japan (-3%) and the U.K. (-4%) held up better, followed by Canada (-5%) and Asia-Pacific ex Japan (-6%).
Comments from Portfolio Manager Sammy Simnegar: For the fiscal year, the fund returned -7.36%, ahead of the benchmark MSCI ACWI (All Country World Index) ex USA Index. Versus the benchmark, favorable stock selection within the information technology, financials and industrials sectors notably lifted the fund's relative performance. Geographically, stock picks in continental Europe, Germany in particular, as well as out-of-benchmark exposure to the United States, added value. The fund’s top relative contributor was an overweight stake in Wirecard, a Germany-based provider of online payment processing that gained after the company reported strong financial results during the period. Other contributors included an out-of-benchmark position in Heico, a provider of aftermarket aerospace components, and a non-benchmark stake in online retailer Amazon.com. Conversely, the fund's relative result was curbed by stock choices in consumer staples and notable underweight in energy. By region, positioning in emerging markets was by far the biggest detractor. Several of the fund’s largest relative detractors were based in China, starting with TAL Education Group, a provider of after-school tutoring that was bought during the period and later sold. Midea Group, an electrical appliance manufacturer in China, is another stock purchased this period that underperformed. Lastly, China-based CSPC Pharmaceutical Group, which was also sold prior to period-end, detracted as well.
The views expressed above reflect those of the portfolio manager(s) only through the end of the period as stated on the cover of this report and do not necessarily represent the views of Fidelity or any other person in the Fidelity organization. Any such views are subject to change at any time based upon market or other conditions and Fidelity disclaims any responsibility to update such views. These views may not be relied on as investment advice and, because investment decisions for a Fidelity fund are based on numerous factors, may not be relied on as an indication of trading intent on behalf of any Fidelity fund.
Investment Summary (Unaudited)
Geographic Diversification (% of fund's net assets)
| As of October 31, 2018 |
| | United States of America* | 15.1% |
| | United Kingdom | 11.3% |
| | France | 9.1% |
| | Japan | 8.3% |
| | Canada | 6.1% |
| | India | 6.1% |
| | Germany | 5.8% |
| | Cayman Islands | 4.3% |
| | Netherlands | 4.0% |
| | Other | 29.9% |
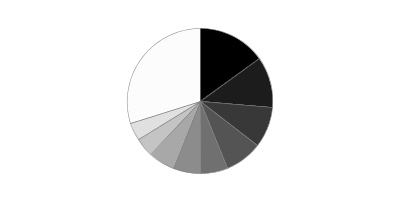
* Includes Short-Term investments and Net Other Assets (Liabilities).
Percentages are based on country or territory of incorporation and are adjusted for the effect of futures contracts, if applicable.
Asset Allocation as of October 31, 2018
| | % of fund's net assets |
| Stocks | 99.0 |
| Short-Term Investments and Net Other Assets (Liabilities) | 1.0 |
Top Ten Stocks as of October 31, 2018
| | % of fund's net assets |
| Tencent Holdings Ltd. (Cayman Islands, Interactive Media & Services) | 1.6 |
| Taiwan Semiconductor Manufacturing Co. Ltd. sponsored ADR (Taiwan, Semiconductors & Semiconductor Equipment) | 1.5 |
| Alibaba Group Holding Ltd. sponsored ADR (Cayman Islands, Internet & Direct Marketing Retail) | 1.4 |
| SAP SE (Germany, Software) | 1.1 |
| The Toronto-Dominion Bank (Canada, Banks) | 1.0 |
| AIA Group Ltd. (Hong Kong, Insurance) | 1.0 |
| LVMH Moet Hennessy - Louis Vuitton SA (France, Textiles, Apparel & Luxury Goods) | 1.0 |
| Diageo PLC (United Kingdom, Beverages) | 1.0 |
| British American Tobacco PLC (United Kingdom) (United Kingdom, Tobacco) | 1.0 |
| Naspers Ltd. Class N (South Africa, Media) | 1.0 |
| | 11.6 |
Top Market Sectors as of October 31, 2018
| | % of fund's net assets |
| Industrials | 19.3 |
| Information Technology | 17.7 |
| Financials | 16.1 |
| Consumer Discretionary | 12.8 |
| Consumer Staples | 9.6 |
| Materials | 6.7 |
| Health Care | 6.6 |
| Communication Services | 4.8 |
| Real Estate | 2.9 |
| Energy | 1.4 |
Schedule of Investments October 31, 2018
Showing Percentage of Net Assets
| Common Stocks - 97.7% | | | |
| | | Shares | Value |
| Australia - 2.0% | | | |
| Aristocrat Leisure Ltd. | | 109,239 | $2,049,976 |
| CSL Ltd. | | 23,525 | 3,131,935 |
| realestate.com.au Ltd. | | 39,045 | 1,980,273 |
|
| TOTAL AUSTRALIA | | | 7,162,184 |
|
| Bailiwick of Jersey - 0.7% | | | |
| Experian PLC | | 105,200 | 2,419,516 |
| Belgium - 0.6% | | | |
| Umicore SA | | 46,842 | 2,206,582 |
| Bermuda - 1.7% | | | |
| Credicorp Ltd. (United States) | | 10,087 | 2,276,737 |
| Hiscox Ltd. | | 93,362 | 1,942,779 |
| IHS Markit Ltd. (a) | | 36,900 | 1,938,357 |
|
| TOTAL BERMUDA | | | 6,157,873 |
|
| Brazil - 0.6% | | | |
| BM&F BOVESPA SA | | 314,700 | 2,244,293 |
| Canada - 6.1% | | | |
| Alimentation Couche-Tard, Inc. Class B (sub. vtg.) | | 49,300 | 2,354,431 |
| Canadian National Railway Co. | | 36,129 | 3,088,577 |
| Canadian Pacific Railway Ltd. | | 12,056 | 2,472,375 |
| CCL Industries, Inc. Class B | | 49,565 | 2,085,085 |
| Constellation Software, Inc. | | 3,244 | 2,232,593 |
| Dollarama, Inc. | | 71,600 | 1,980,292 |
| Open Text Corp. | | 61,300 | 2,069,332 |
| The Toronto-Dominion Bank | | 68,000 | 3,772,297 |
| Waste Connection, Inc. (Canada) | | 26,743 | 2,044,449 |
|
| TOTAL CANADA | | | 22,099,431 |
|
| Cayman Islands - 4.3% | | | |
| Alibaba Group Holding Ltd. sponsored ADR (a) | | 36,446 | 5,185,537 |
| New Oriental Education & Technology Group, Inc. sponsored ADR | | 40,683 | 2,380,362 |
| Shenzhou International Group Holdings Ltd. | | 189,000 | 2,087,159 |
| Tencent Holdings Ltd. | | 172,900 | 5,923,427 |
|
| TOTAL CAYMAN ISLANDS | | | 15,576,485 |
|
| Chile - 0.6% | | | |
| Sociedad Quimica y Minera de Chile SA (PN-B) sponsored ADR (b) | | 49,500 | 2,168,595 |
| China - 3.7% | | | |
| China International Travel Service Corp. Ltd. (A Shares) | | 275,479 | 2,119,905 |
| Hangzhou Hikvision Digital Technology Co. Ltd. Class A | | 547,648 | 1,899,906 |
| Kweichow Moutai Co. Ltd. (A Shares) | | 27,247 | 2,144,012 |
| Midea Group Co. Ltd. Class A | | 385,700 | 2,048,028 |
| Ping An Insurance (Group) Co. of China Ltd. (H Shares) | | 324,000 | 3,051,205 |
| Shanghai International Airport Co. Ltd. (A Shares) | | 289,333 | 2,055,214 |
|
| TOTAL CHINA | | | 13,318,270 |
|
| Denmark - 1.2% | | | |
| DONG Energy A/S (c) | | 34,100 | 2,166,550 |
| DSV de Sammensluttede Vognmaend A/S | | 28,300 | 2,275,377 |
|
| TOTAL DENMARK | | | 4,441,927 |
|
| Finland - 0.6% | | | |
| Neste Oyj | | 26,700 | 2,200,390 |
| France - 9.1% | | | |
| Dassault Systemes SA | | 17,800 | 2,234,866 |
| Eiffage SA | | 22,154 | 2,168,514 |
| Hermes International SCA | | 3,988 | 2,281,089 |
| Kering SA | | 6,083 | 2,711,869 |
| L'Oreal SA | | 14,000 | 3,153,977 |
| Legrand SA | | 36,034 | 2,356,595 |
| LVMH Moet Hennessy - Louis Vuitton SA | | 11,994 | 3,639,045 |
| Orpea | | 16,478 | 2,031,555 |
| Pernod Ricard SA | | 17,015 | 2,597,871 |
| Safran SA | | 21,600 | 2,791,321 |
| SR Teleperformance SA | | 12,101 | 1,995,622 |
| Thales SA | | 16,967 | 2,171,597 |
| VINCI SA (b) | | 32,072 | 2,854,388 |
|
| TOTAL FRANCE | | | 32,988,309 |
|
| Germany - 5.8% | | | |
| adidas AG | | 11,562 | 2,723,905 |
| Deutsche Wohnen AG (Bearer) | | 49,343 | 2,260,125 |
| Infineon Technologies AG | | 123,000 | 2,464,538 |
| Linde PLC | | 16,385 | 2,688,194 |
| SAP SE | | 36,584 | 3,917,177 |
| Symrise AG | | 26,208 | 2,201,402 |
| Vonovia SE | | 53,100 | 2,431,009 |
| Wirecard AG | | 12,401 | 2,323,207 |
|
| TOTAL GERMANY | | | 21,009,557 |
|
| Hong Kong - 1.0% | | | |
| AIA Group Ltd. | | 497,800 | 3,767,485 |
| India - 6.1% | | | |
| Asian Paints Ltd. | | 123,522 | 2,054,914 |
| Eicher Motors Ltd. | | 7,310 | 2,161,036 |
| Godrej Consumer Products Ltd. | | 194,658 | 1,907,759 |
| HDFC Bank Ltd. | | 39,857 | 1,034,698 |
| HDFC Bank Ltd. sponsored ADR | | 10,810 | 961,117 |
| Housing Development Finance Corp. Ltd. | | 122,873 | 2,939,333 |
| IndusInd Bank Ltd. | | 101,508 | 1,955,909 |
| Kotak Mahindra Bank Ltd. | | 137,145 | 2,075,255 |
| Maruti Suzuki India Ltd. | | 21,993 | 1,967,475 |
| Reliance Industries Ltd. | | 196,985 | 2,826,532 |
| Titan Co. Ltd. | | 184,400 | 2,105,790 |
|
| TOTAL INDIA | | | 21,989,818 |
|
| Indonesia - 0.6% | | | |
| PT Bank Central Asia Tbk | | 1,473,800 | 2,292,739 |
| Ireland - 2.3% | | | |
| Accenture PLC Class A | | 11,825 | 1,863,857 |
| DCC PLC (United Kingdom) | | 23,788 | 2,041,751 |
| Kerry Group PLC Class A | | 21,500 | 2,203,854 |
| Kingspan Group PLC (Ireland) | | 46,400 | 2,018,110 |
|
| TOTAL IRELAND | | | 8,127,572 |
|
| Italy - 1.1% | | | |
| Amplifon SpA | | 103,200 | 1,830,489 |
| Recordati SpA | | 59,800 | 2,026,556 |
|
| TOTAL ITALY | | | 3,857,045 |
|
| Japan - 8.3% | | | |
| Daikin Industries Ltd. | | 1,726 | 200,064 |
| Hoya Corp. | | 43,900 | 2,495,454 |
| Kao Corp. | | 39,618 | 2,635,478 |
| Keyence Corp. | | 5,932 | 2,907,250 |
| Misumi Group, Inc. | | 101,100 | 2,030,333 |
| Nidec Corp. | | 20,400 | 2,619,719 |
| Nissan Chemical Corp. | | 39,000 | 1,838,900 |
| Nitori Holdings Co. Ltd. | | 17,500 | 2,285,306 |
| OBIC Co. Ltd. | | 22,800 | 2,077,228 |
| Recruit Holdings Co. Ltd. | | 100,812 | 2,705,753 |
| Relo Group, Inc. | | 80,930 | 1,912,167 |
| Tsuruha Holdings, Inc. | | 20,105 | 2,095,403 |
| Unicharm Corp. | | 80,600 | 2,194,383 |
| Zozo, Inc. | | 80,100 | 1,930,180 |
|
| TOTAL JAPAN | | | 29,927,618 |
|
| Korea (South) - 0.6% | | | |
| LG Household & Health Care Ltd. | | 2,312 | 2,115,450 |
| Mexico - 0.5% | | | |
| Grupo Aeroportuario del Sureste S.A.B. de CV Series B | | 116,040 | 1,928,778 |
| Netherlands - 4.0% | | | |
| ASML Holding NV (Netherlands) | | 19,620 | 3,379,430 |
| Ferrari NV | | 19,300 | 2,262,525 |
| Heineken NV (Bearer) | | 29,300 | 2,641,657 |
| Interxion Holding N.V. (a) | | 32,867 | 1,934,880 |
| Wolters Kluwer NV | | 38,600 | 2,193,010 |
| Yandex NV Series A (a) | | 65,800 | 1,982,554 |
|
| TOTAL NETHERLANDS | | | 14,394,056 |
|
| Philippines - 0.6% | | | |
| SM Prime Holdings, Inc. | | 3,250,100 | 2,055,755 |
| South Africa - 2.2% | | | |
| Capitec Bank Holdings Ltd. | | 30,603 | 2,055,074 |
| FirstRand Ltd. | | 504,300 | 2,198,375 |
| Naspers Ltd. Class N | | 20,301 | 3,567,802 |
|
| TOTAL SOUTH AFRICA | | | 7,821,251 |
|
| Spain - 0.7% | | | |
| Amadeus IT Holding SA Class A | | 32,024 | 2,581,840 |
| Sweden - 1.9% | | | |
| Alfa Laval AB | | 82,800 | 2,114,528 |
| ASSA ABLOY AB (B Shares) | | 116,000 | 2,307,329 |
| Hexagon AB (B Shares) | | 47,459 | 2,326,495 |
|
| TOTAL SWEDEN | | | 6,748,352 |
|
| Switzerland - 3.9% | | | |
| Givaudan SA | | 980 | 2,378,116 |
| Lonza Group AG | | 7,246 | 2,278,517 |
| Partners Group Holding AG | | 3,244 | 2,311,046 |
| Schindler Holding AG (participation certificate) | | 10,300 | 2,172,189 |
| Sika AG | | 19,590 | 2,513,060 |
| Temenos Group AG | | 16,600 | 2,282,778 |
|
| TOTAL SWITZERLAND | | | 13,935,706 |
|
| Taiwan - 1.5% | | | |
| Taiwan Semiconductor Manufacturing Co. Ltd. sponsored ADR | | 143,825 | 5,479,733 |
| United Kingdom - 11.3% | | | |
| Beazley PLC | | 308,900 | 2,082,760 |
| British American Tobacco PLC (United Kingdom) | | 83,100 | 3,602,407 |
| Bunzl PLC | | 75,589 | 2,232,839 |
| Compass Group PLC | | 128,479 | 2,529,017 |
| Croda International PLC | | 34,700 | 2,137,841 |
| Diageo PLC | | 104,772 | 3,622,127 |
| Halma PLC | | 119,305 | 2,025,142 |
| Hargreaves Lansdown PLC | | 89,600 | 2,139,359 |
| InterContinental Hotel Group PLC | | 43,496 | 2,285,020 |
| Intertek Group PLC | | 36,521 | 2,188,412 |
| London Stock Exchange Group PLC | | 41,147 | 2,269,435 |
| Mondi PLC | | 94,900 | 2,237,400 |
| NMC Health PLC | | 50,000 | 2,257,301 |
| RELX PLC | | 137,511 | 2,720,985 |
| Rentokil Initial PLC | | 548,890 | 2,218,431 |
| Rightmove PLC | | 347,390 | 2,007,699 |
| St. James's Place Capital PLC | | 164,154 | 2,126,542 |
|
| TOTAL UNITED KINGDOM | | | 40,682,717 |
|
| United States of America - 14.1% | | | |
| Activision Blizzard, Inc. | | 28,100 | 1,940,305 |
| Adobe, Inc. (a) | | 7,721 | 1,897,513 |
| American Tower Corp. | | 12,400 | 1,932,044 |
| Amphenol Corp. Class A | | 22,588 | 2,021,626 |
| Becton, Dickinson & Co. | | 8,100 | 1,867,050 |
| Constellation Brands, Inc. Class A (sub. vtg.) | | 9,300 | 1,852,839 |
| Fiserv, Inc. (a) | | 24,900 | 1,974,570 |
| FleetCor Technologies, Inc. (a) | | 10,000 | 2,000,300 |
| Global Payments, Inc. | | 17,096 | 1,952,876 |
| HEICO Corp. Class A | | 29,600 | 1,973,136 |
| Marsh & McLennan Companies, Inc. | | 24,200 | 2,050,950 |
| MasterCard, Inc. Class A | | 9,680 | 1,913,446 |
| Microsoft Corp. | | 18,000 | 1,922,580 |
| Moody's Corp. | | 13,119 | 1,908,552 |
| MSCI, Inc. | | 12,759 | 1,918,698 |
| NextEra Energy, Inc. | | 11,000 | 1,897,500 |
| NVIDIA Corp. | | 10,060 | 2,120,950 |
| ResMed, Inc. | | 18,600 | 1,970,112 |
| S&P Global, Inc. | | 10,638 | 1,939,520 |
| Sherwin-Williams Co. | | 5,230 | 2,057,848 |
| SS&C Technologies Holdings, Inc. | | 38,600 | 1,974,776 |
| Thermo Fisher Scientific, Inc. | | 8,300 | 1,939,295 |
| TransDigm Group, Inc. (a) | | 6,140 | 2,027,735 |
| UnitedHealth Group, Inc. | | 7,200 | 1,881,720 |
| Verisk Analytics, Inc. (a) | | 16,600 | 1,989,344 |
| Visa, Inc. Class A | | 13,727 | 1,892,267 |
|
| TOTAL UNITED STATES OF AMERICA | | | 50,817,552 |
|
| TOTAL COMMON STOCKS | | | |
| (Cost $365,396,851) | | | 352,516,879 |
|
| Nonconvertible Preferred Stocks - 1.3% | | | |
| Brazil - 1.3% | | | |
| Itau Unibanco Holding SA sponsored ADR | | 211,992 | 2,791,935 |
| Itausa-Investimentos Itau SA (PN) | | 680,700 | 2,055,910 |
| TOTAL NONCONVERTIBLE PREFERRED STOCKS | | | |
| (Cost $4,555,139) | | | 4,847,845 |
|
| Money Market Funds - 5.2% | | | |
| Fidelity Cash Central Fund, 2.23% (d) | | 13,948,450 | 13,951,240 |
| Fidelity Securities Lending Cash Central Fund 2.23% (d)(e) | | 4,683,357 | 4,683,825 |
| TOTAL MONEY MARKET FUNDS | | | |
| (Cost $18,635,065) | | | 18,635,065 |
| TOTAL INVESTMENT IN SECURITIES - 104.2% | | | |
| (Cost $388,587,055) | | | 375,999,789 |
| NET OTHER ASSETS (LIABILITIES) - (4.2)% | | | (15,037,075) |
| NET ASSETS - 100% | | | $360,962,714 |
Categorizations in the Schedule of Investments are based on country or territory of incorporation.
Legend
(a) Non-income producing
(b) Security or a portion of the security is on loan at period end.
(c) Security exempt from registration under Rule 144A of the Securities Act of 1933. These securities may be resold in transactions exempt from registration, normally to qualified institutional buyers. At the end of the period, the value of these securities amounted to $2,166,550 or 0.6% of net assets.
(d) Affiliated fund that is generally available only to investment companies and other accounts managed by Fidelity Investments. The rate quoted is the annualized seven-day yield of the fund at period end. A complete unaudited listing of the fund's holdings as of its most recent quarter end is available upon request. In addition, each Fidelity Central Fund's financial statements, which are not covered by the Fund's Report of Independent Registered Public Accounting Firm, are available on the SEC's website or upon request.
(e) Investment made with cash collateral received from securities on loan.
Affiliated Central Funds
Information regarding fiscal year to date income earned by the Fund from investments in Fidelity Central Funds is as follows:
| Fund | Income earned |
| Fidelity Cash Central Fund | $72,084 |
| Fidelity Securities Lending Cash Central Fund | 19,453 |
| Total | $91,537 |
Amounts in the income column in the above table include any capital gain distributions from underlying funds, which are presented in the corresponding line-item in the Statement of Operations if applicable.
Investment Valuation
The following is a summary of the inputs used, as of October 31, 2018, involving the Fund's assets and liabilities carried at fair value. The inputs or methodology used for valuing securities may not be an indication of the risk associated with investing in those securities. For more information on valuation inputs, and their aggregation into the levels used below, please refer to the Investment Valuation section in the accompanying Notes to Financial Statements.
| | Valuation Inputs at Reporting Date: |
| Description | Total | Level 1 | Level 2 | Level 3 |
| Investments in Securities: | | | | |
| Equities: | | | | |
| Communication Services | $17,402,060 | $11,478,633 | $5,923,427 | $-- |
| Consumer Discretionary | 46,733,516 | 43,094,471 | 3,639,045 | -- |
| Consumer Staples | 35,121,648 | 25,261,636 | 9,860,012 | -- |
| Energy | 5,026,922 | 5,026,922 | -- | -- |
| Financials | 58,850,197 | 57,815,499 | 1,034,698 | -- |
| Health Care | 23,709,984 | 23,709,984 | -- | -- |
| Industrials | 68,314,348 | 55,035,977 | 13,278,371 | -- |
| Information Technology | 63,671,156 | 53,910,011 | 9,761,145 | -- |
| Materials | 23,879,743 | 22,040,843 | 1,838,900 | -- |
| Real Estate | 10,591,100 | 10,591,100 | -- | -- |
| Utilities | 4,064,050 | 4,064,050 | -- | -- |
| Money Market Funds | 18,635,065 | 18,635,065 | -- | -- |
| Total Investments in Securities: | $375,999,789 | $330,664,191 | $45,335,598 | $-- |
The following is a summary of transfers between Level 1 and Level 2 for the period ended October 31, 2018. Transfers are assumed to have occurred at the beginning of the period, and are primarily attributable to the valuation techniques used for foreign equity securities, as discussed in the accompanying Notes to Financial Statements:
| Transfers | Total |
| Level 1 to Level 2 | $1,359,518 |
| Level 2 to Level 1 | $8,652,436 |
See accompanying notes which are an integral part of the financial statements.
Financial Statements
Statement of Assets and Liabilities
| | | October 31, 2018 |
| Assets | | |
Investment in securities, at value (including securities loaned of $4,571,214) — See accompanying schedule:
Unaffiliated issuers (cost $369,951,990) | $357,364,724 | |
| Fidelity Central Funds (cost $18,635,065) | 18,635,065 | |
| Total Investment in Securities (cost $388,587,055) | | $375,999,789 |
| Cash | | 6,074 |
| Foreign currency held at value (cost $205,757) | | 205,606 |
| Receivable for investments sold | | 8,338,597 |
| Receivable for fund shares sold | | 276,480 |
| Dividends receivable | | 240,500 |
| Distributions receivable from Fidelity Central Funds | | 8,869 |
| Other receivables | | 60,856 |
| Total assets | | 385,136,771 |
| Liabilities | | |
| Payable for investments purchased | $18,754,135 | |
| Payable for fund shares redeemed | 540,807 | |
| Accrued management fee | 195,290 | |
| Collateral on securities loaned | 4,683,825 | |
| Total liabilities | | 24,174,057 |
| Net Assets | | $360,962,714 |
| Net Assets consist of: | | |
| Paid in capital | | $385,503,473 |
| Total distributable earnings (loss) | | (24,540,759) |
| Net Assets, for 35,485,803 shares outstanding | | $360,962,714 |
| Net Asset Value, offering price and redemption price per share ($360,962,714 ÷ 35,485,803 shares) | | $10.17 |
See accompanying notes which are an integral part of the financial statements.
Statement of Operations
| | | Year ended October 31, 2018 |
| Investment Income | | |
| Dividends | | $4,953,380 |
| Income from Fidelity Central Funds | | 91,537 |
| Income before foreign taxes withheld | | 5,044,917 |
| Less foreign taxes withheld | | (467,267) |
| Total income | | 4,577,650 |
| Expenses | | |
| Management fee | $1,881,239 | |
| Independent trustees' fees and expenses | 1,367 | |
| Commitment fees | 473 | |
| Total expenses before reductions | 1,883,079 | |
| Expense reductions | (181,361) | |
| Total expenses after reductions | | 1,701,718 |
| Net investment income (loss) | | 2,875,932 |
| Realized and Unrealized Gain (Loss) | | |
| Net realized gain (loss) on: | | |
| Investment securities: | | |
| Unaffiliated issuers (net of foreign taxes of $32) | (14,642,445) | |
| Fidelity Central Funds | 1,403 | |
| Foreign currency transactions | (920) | |
| Total net realized gain (loss) | | (14,641,962) |
| Change in net unrealized appreciation (depreciation) on: | | |
| Investment securities: | | |
| Unaffiliated issuers | (23,010,226) | |
| Assets and liabilities in foreign currencies | 885 | |
| Total change in net unrealized appreciation (depreciation) | | (23,009,341) |
| Net gain (loss) | | (37,651,303) |
| Net increase (decrease) in net assets resulting from operations | | $(34,775,371) |
See accompanying notes which are an integral part of the financial statements.
Statement of Changes in Net Assets
| | Year ended October 31, 2018 | For the period
May 25, 2017 (commencement of operations) to October 31, 2017 |
| Increase (Decrease) in Net Assets | | |
| Operations | | |
| Net investment income (loss) | $2,875,932 | $223,392 |
| Net realized gain (loss) | (14,641,962) | 147,544 |
| Change in net unrealized appreciation (depreciation) | (23,009,341) | 10,420,074 |
| Net increase (decrease) in net assets resulting from operations | (34,775,371) | 10,791,010 |
| Distributions to shareholders | (556,479) | – |
| Total distributions | (556,479) | – |
| Share transactions | | |
| Proceeds from sales of shares | 284,114,051 | 174,806,251 |
| Reinvestment of distributions | 556,479 | – |
| Cost of shares redeemed | (63,779,612) | (10,193,615) |
| Net increase (decrease) in net assets resulting from share transactions | 220,890,918 | 164,612,636 |
| Total increase (decrease) in net assets | 185,559,068 | 175,403,646 |
| Net Assets | | |
| Beginning of period | 175,403,646 | – |
| End of period | $360,962,714 | $175,403,646 |
| Other Information | | |
| Undistributed net investment income end of period | | $215,830 |
| Shares | | |
| Sold | 25,176,612 | 16,893,772 |
| Issued in reinvestment of distributions | 50,133 | – |
| Redeemed | (5,674,611) | (960,103) |
| Net increase (decrease) | 19,552,134 | 15,933,669 |
See accompanying notes which are an integral part of the financial statements.
Financial Highlights
Fidelity International Capital Appreciation K6 Fund
| | | |
| Years ended October 31, | 2018 | 2017 A |
| Selected Per–Share Data | | |
| Net asset value, beginning of period | $11.01 | $10.00 |
| Income from Investment Operations | | |
| Net investment income (loss)B | .11 | .02 |
| Net realized and unrealized gain (loss) | (.92) | .99 |
| Total from investment operations | (.81) | 1.01 |
| Distributions from net investment income | (.02) | – |
| Distributions from net realized gain | (.01) | – |
| Total distributions | (.03) | – |
| Net asset value, end of period | $10.17 | $11.01 |
| Total ReturnC,D | (7.36)% | 10.10% |
| Ratios to Average Net AssetsE,F | | |
| Expenses before reductions | .65% | .65%G |
| Expenses net of fee waivers, if any | .65% | .65%G |
| Expenses net of all reductions | .58% | .65%G |
| Net investment income (loss) | .99% | .51%G |
| Supplemental Data | | |
| Net assets, end of period (000 omitted) | $360,963 | $175,404 |
| Portfolio turnover rateH | 158%I | 81%I,J |
A For the period May 25, 2017 (commencement of operations) to October 31, 2017.
B Calculated based on average shares outstanding during the period.
C Total returns for periods of less than one year are not annualized.
D Total returns would have been lower if certain expenses had not been reduced during the applicable periods shown.
E Fees and expenses of any underlying Fidelity Central Funds are not included in the Fund's expense ratio. The Fund indirectly bears its proportionate share of the expenses of any underlying Fidelity Central Funds.
F Expense ratios reflect operating expenses of the Fund. Expenses before reductions do not reflect amounts reimbursed by the investment adviser or reductions from brokerage service arrangements or reductions from other expense offset arrangements and do not represent the amount paid by the Fund during periods when reimbursements or reductions occur. Expense ratios before reductions for start-up periods may not be representative of longer term operating periods. Expenses net of fee waivers reflect expenses after reimbursement by the investment adviser but prior to reductions from brokerage service arrangements or other expense offset arrangements. Expenses net of all reductions represent the net expenses paid by the Fund.
G Annualized
H Amount does not include the portfolio activity of any underlying Fidelity Central Funds.
I Portfolio turnover rate excludes securities received or delivered in-kind.
J Amount not annualized.
See accompanying notes which are an integral part of the financial statements.
Notes to Financial Statements
For the period ended October 31, 2018
1. Organization.
Fidelity International Capital Appreciation K6 Fund (the Fund) is a fund of Fidelity Investment Trust (the Trust) and is authorized to issue an unlimited number of shares. Share transactions on the Statement of Changes in Net Assets may contain exchanges between affiliated funds. The Trust is registered under the Investment Company Act of 1940, as amended (the 1940 Act), as an open-end management investment company organized as a Massachusetts business trust. Shares generally are available only to employer-sponsored retirement plans that are recordkept by Fidelity, or to certain employer-sponsored retirement plans that are not recordkept by Fidelity. The Fund's investments in emerging markets can be subject to social, economic, regulatory, and political uncertainties and can be extremely volatile.
2. Investments in Fidelity Central Funds.
The Fund invests in Fidelity Central Funds, which are open-end investment companies generally available only to other investment companies and accounts managed by the investment adviser and its affiliates. The Fund's Schedule of Investments lists each of the Fidelity Central Funds held as of period end, if any, as an investment of the Fund, but does not include the underlying holdings of each Fidelity Central Fund. As an Investing Fund, the Fund indirectly bears its proportionate share of the expenses of the underlying Fidelity Central Funds.
The Money Market Central Funds seek preservation of capital and current income and are managed by Fidelity Investments Money Management, Inc. (FIMM), an affiliate of the investment adviser. Annualized expenses of the Money Market Central Funds as of their most recent shareholder report date are less than .005%.
A complete unaudited list of holdings for each Fidelity Central Fund is available upon request or at the Securities and Exchange Commission (the SEC) website at www.sec.gov. In addition, the financial statements of the Fidelity Central Funds, which are not covered by the Fund's Report of Independent Registered Public Accounting Firm, are available on the SEC website or upon request.
3. Significant Accounting Policies.
The Fund is an investment company and applies the accounting and reporting guidance of the Financial Accounting Standards Board (FASB) Accounting Standards Codification Topic 946 Financial Services – Investments Companies. The financial statements have been prepared in conformity with accounting principles generally accepted in the United States of America (GAAP), which require management to make certain estimates and assumptions at the date of the financial statements. Actual results could differ from those estimates. Subsequent events, if any, through the date that the financial statements were issued have been evaluated in the preparation of the financial statements. The following summarizes the significant accounting policies of the Fund:
Investment Valuation. Investments are valued as of 4:00 p.m. Eastern time on the last calendar day of the period. The Board of Trustees (the Board) has delegated the day to day responsibility for the valuation of the Fund's investments to the Fair Value Committee (the Committee) established by the Fund's investment adviser. In accordance with valuation policies and procedures approved by the Board, the Fund attempts to obtain prices from one or more third party pricing vendors or brokers to value its investments. When current market prices, quotations or currency exchange rates are not readily available or reliable, investments will be fair valued in good faith by the Committee, in accordance with procedures adopted by the Board. Factors used in determining fair value vary by investment type and may include market or investment specific events. The frequency with which these procedures are used cannot be predicted and they may be utilized to a significant extent. The Committee oversees the Fund's valuation policies and procedures and reports to the Board on the Committee's activities and fair value determinations. The Board monitors the appropriateness of the procedures used in valuing the Fund's investments and ratifies the fair value determinations of the Committee.
The Fund categorizes the inputs to valuation techniques used to value its investments into a disclosure hierarchy consisting of three levels as shown below:
- Level 1 – quoted prices in active markets for identical investments
- Level 2 – other significant observable inputs (including quoted prices for similar investments, interest rates, prepayment speeds, etc.)
- Level 3 – unobservable inputs (including the Fund's own assumptions based on the best information available)
Valuation techniques used to value the Fund's investments by major category are as follows:
Equity securities, including restricted securities, for which market quotations are readily available, are valued at the last reported sale price or official closing price as reported by a third party pricing vendor on the primary market or exchange on which they are traded and are categorized as Level 1 in the hierarchy. In the event there were no sales during the day or closing prices are not available, securities are valued at the last quoted bid price or may be valued using the last available price and are generally categorized as Level 2 in the hierarchy. For foreign equity securities, when market or security specific events arise, comparisons to the valuation of American Depositary Receipts (ADRs), futures contracts, Exchange-Traded Funds (ETFs) and certain indexes as well as quoted prices for similar securities may be used and would be categorized as Level 2 in the hierarchy. Utilizing these techniques may result in transfers between Level 1 and Level 2. For equity securities, including restricted securities, where observable inputs are limited, assumptions about market activity and risk are used and these securities may be categorized as Level 3 in the hierarchy.
Investments in open-end mutual funds, including the Fidelity Central Funds, are valued at their closing net asset value (NAV) each business day and are categorized as Level 1 in the hierarchy.
Changes in valuation techniques may result in transfers in or out of an assigned level within the disclosure hierarchy. The aggregate value of investments by input level as of October 31, 2018, including information on transfers between Levels 1 and 2, is included at the end of the Fund's Schedule of Investments.
Foreign Currency. The Fund may use foreign currency contracts to facilitate transactions in foreign-denominated securities. Gains and losses from these transactions may arise from changes in the value of the foreign currency or if the counterparties do not perform under the contracts' terms.
Foreign-denominated assets, including investment securities, and liabilities are translated into U.S. dollars at the exchange rates at period end. Purchases and sales of investment securities, income and dividends received and expenses denominated in foreign currencies are translated into U.S. dollars at the exchange rate in effect on the transaction date.
The effects of exchange rate fluctuations on investments are included with the net realized and unrealized gain (loss) on investment securities. Other foreign currency transactions resulting in realized and unrealized gain (loss) are disclosed separately.
Investment Transactions and Income. For financial reporting purposes, the Fund's investment holdings and NAV include trades executed through the end of the last business day of the period. The NAV per share for processing shareholder transactions is calculated as of the close of business of the New York Stock Exchange (NYSE), normally 4:00 p.m. Eastern time and includes trades executed through the end of the prior business day. Gains and losses on securities sold are determined on the basis of identified cost. Dividend income is recorded on the ex-dividend date, except for certain dividends from foreign securities where the ex-dividend date may have passed, which are recorded as soon as the Fund is informed of the ex-dividend date. Non-cash dividends included in dividend income, if any, are recorded at the fair market value of the securities received. Income and capital gain distributions from Fidelity Central Funds, if any, are recorded on the ex-dividend date. Certain distributions received by the Fund represent a return of capital or capital gain. The Fund determines the components of these distributions subsequent to the ex-dividend date, based upon receipt of tax filings or other correspondence relating to the underlying investment. These distributions are recorded as a reduction of cost of investments and/or as a realized gain. Investment income is recorded net of foreign taxes withheld where recovery of such taxes is uncertain.
Expenses. Expenses directly attributable to a fund are charged to that fund. Expenses attributable to more than one fund are allocated among the respective funds on the basis of relative net assets or other appropriate methods. Expense estimates are accrued in the period to which they relate and adjustments are made when actual amounts are known.
Income Tax Information and Distributions to Shareholders. Each year, the Fund intends to qualify as a regulated investment company under Subchapter M of the Internal Revenue Code, including distributing substantially all of its taxable income and realized gains. As a result, no provision for U.S. Federal income taxes is required. As of October 31, 2018, the Fund did not have any unrecognized tax benefits in the financial statements; nor is the Fund aware of any tax positions for which it is reasonably possible that the total amounts of unrecognized tax benefits will significantly change in the next twelve months. The Fund files a U.S. federal tax return, in addition to state and local tax returns as required. The Fund's federal income tax returns are subject to examination by the Internal Revenue Service (IRS) for a period of three fiscal years after they are filed. State and local tax returns may be subject to examination for an additional fiscal year depending on the jurisdiction. Foreign taxes are provided for based on the Fund's understanding of the tax rules and rates that exist in the foreign markets in which it invests. The Fund is subject to a tax imposed on capital gains by certain countries in which it invests.
Distributions are declared and recorded on the ex-dividend date. Income and capital gain distributions are determined in accordance with income tax regulations, which may differ from GAAP.
Capital accounts within the financial statements are adjusted for permanent book-tax differences. These adjustments have no impact on net assets or the results of operations. Capital accounts are not adjusted for temporary book-tax differences which will reverse in a subsequent period.
Book-tax differences are primarily due to foreign currency transactions, certain foreign taxes, passive foreign investment companies (PFIC), capital loss carryforwards and losses deferred due to wash sales.
As of period end, the cost and unrealized appreciation (depreciation) in securities, and derivatives if applicable, for federal income tax purposes were as follows:
| Gross unrealized appreciation | $13,323,503 |
| Gross unrealized depreciation | (27,609,607) |
| Net unrealized appreciation (depreciation) | $(14,286,104) |
| Tax Cost | $390,285,893 |
The tax-based components of distributable earnings as of period end were as follows:
| Undistributed ordinary income | $2,706,513 |
| Capital loss carryforward | $(12,971,090) |
| Net unrealized appreciation (depreciation) on securities and other investments | $(14,276,183) |
Capital loss carryforwards are only available to offset future capital gains of the Fund to the extent provided by regulations and may be limited. Under the Regulated Investment Company Modernization Act of 2010 (the Act), the Fund is permitted to carry forward capital losses incurred in taxable years beginning after December 22, 2010 for an unlimited period and such capital losses are required to be used prior to any losses that expire. The capital loss carryforward information presented below, including any applicable limitation, is estimated as of fiscal period end and is subject to adjustment.
| No expiration | |
| Short-term | $(12,971,090) |
| Total capital loss carryforward | $(12,971,090) |
The tax character of distributions paid was as follows:
| | October 31, 2018 | October 31, 2017(a) |
| Ordinary Income | $539,089 | $ - |
| Long-term Capital Gains | 17,390 | – |
| Total | $556,479 | $ - |
(a) For the period May 25, 2017 (commencement of operations) to October 31, 2017.
Restricted Securities. The Fund may invest in securities that are subject to legal or contractual restrictions on resale. These securities generally may be resold in transactions exempt from registration or to the public if the securities are registered. Disposal of these securities may involve time-consuming negotiations and expense, and prompt sale at an acceptable price may be difficult. Information regarding restricted securities is included at the end of the Fund's Schedule of Investments.
New Rule Issuance. During August 2018, the U.S. Securities and Exchange Commission issued Final Rule Release No. 33-10532, Disclosure Update and Simplification. This Final Rule includes amendments specific to registered investment companies that are intended to eliminate overlap in disclosure requirements between Regulation S-X and GAAP. In accordance with these amendments, certain line-items in the Fund's financial statements have been combined or removed for the current period as outlined in the table below.
| Financial Statement | Current Line-Item Presentation | Prior Line-Item Presentation |
Statement of Assets and Liabilities
| Total distributable earnings (loss) | Undistributed/Distributions in excess of/Accumulated net investment income (loss)
Accumulated/Undistributed net realized gain (loss)
Net unrealized appreciation (depreciation) |
| Statement of Changes in Net Assets | N/A – removed | Undistributed/Distributions in excess of/Accumulated net investment income (loss) end of period |
| Statement of Changes in Net Assets | Distributions to shareholders | Distributions to shareholders from net investment income
Distributions to shareholders from net realized gain |
4. Purchases and Sales of Investments.
Purchases and sales of securities, other than short-term securities and in-kind transactions, aggregated $637,363,760 and $445,056,516, respectively.
Exchanges In-Kind. Investments and cash received in-kind through subscriptions totaled $29,374,572 in exchange for 2,605,896 shares of the Fund. The amount of in-kind exchanges is included in share transactions in the accompanying Statement of Changes in Net Assets. The Fund recognized no gain or loss for federal income tax purposes.
5. Fees and Other Transactions with Affiliates.
Management Fee. Fidelity Management & Research Company (the investment adviser) and its affiliates provide the Fund with investment management related services for which the Fund pays a monthly management fee that is based on an annual rate of .65% of average net assets. Under the management contract, the investment adviser or an affiliate pays all other expenses of the Fund, excluding fees and expenses of the independent Trustees, and certain miscellaneous expenses such as proxy and shareholder meeting expenses.
Brokerage Commissions. The Fund placed a portion of its portfolio transactions with brokerage firms which are affiliates of the investment adviser. Brokerage commissions are included in net realized gain (loss) and change in net unrealized appreciation (depreciation) in the Statement of Operations. The commissions paid to these affiliated firms were $2,447 for the period.
Interfund Trades. The Fund may purchase from or sell securities to other Fidelity Funds under procedures adopted by the Board. The procedures have been designed to ensure these interfund trades are executed in accordance with Rule 17a-7 of the 1940 Act. Interfund trades are included within the respective purchases and sales amounts shown in the Purchases and Sales of Investments note.
Other. During the period, the investment adviser reimbursed the Fund for certain losses in the amount of $6,074.
Prior Fiscal Year Exchanges In-Kind. During the prior period, an affiliated entity completed an exchange in-kind with the Fund. The affiliated entity delivered investments and cash valued at $165,479,456 in exchange for 16,003,816 shares of the Fund. The amount of in-kind exchanges is included in share transactions in the accompanying Statement of Changes in Net Assets. The Fund recognized no gain or loss for federal income tax purposes.
6. Committed Line of Credit.
The Fund participates with other funds managed by the investment adviser or an affiliate in a $4.25 billion credit facility (the "line of credit") to be utilized for temporary or emergency purposes to fund shareholder redemptions or for other short-term liquidity purposes. The Fund has agreed to pay commitment fees on its pro-rata portion of the line of credit, which amounted to $473 and is reflected in Commitment fees on the Statement of Operations. During the period, the Fund did not borrow on this line of credit.
7. Security Lending.
The Fund lends portfolio securities through a lending agent from time to time in order to earn additional income. For equity securities, a lending agent is used and may loan securities to certain qualified borrowers, including Fidelity Capital Markets (FCM), a broker-dealer affiliated with the Fund. On the settlement date of the loan, the Fund receives collateral (in the form of U.S. Treasury obligations, letters of credit and/or cash) against the loaned securities and maintains collateral in an amount not less than 100% of the market value of the loaned securities during the period of the loan. The market value of the loaned securities is determined at the close of business of the Fund and any additional required collateral is delivered to the Fund on the next business day. The Fund or borrower may terminate the loan at any time, and if the borrower defaults on its obligation to return the securities loaned because of insolvency or other reasons, the Fund may apply collateral received from the borrower against the obligation. The Fund may experience delays and costs in recovering the securities loaned. Any cash collateral received is invested in the Fidelity Securities Lending Cash Central Fund. The value of loaned securities and cash collateral at period end are disclosed on the Fund's Statement of Assets and Liabilities. The value of securities loaned to FCM at period end was $801,723. Security lending income represents the income earned on investing cash collateral, less rebates paid to borrowers and any lending agent fees associated with the loan, plus any premium payments received for lending certain types of securities. Security lending income is presented in the Statement of Operations as a component of income from Fidelity Central Funds. Total security lending income during the period amounted to $19,453, including $100 from securities loaned to FCM.
8. Expense Reductions.
Commissions paid to certain brokers with whom the investment adviser, or its affiliates, places trades on behalf of the Fund include an amount in addition to trade execution, which may be rebated back to the Fund to offset certain expenses. This amount totaled $181,256 for the period. In addition, through arrangements with the Fund's custodian, credits realized as a result of certain uninvested cash balances were used to reduce the Fund's expenses. During the period, these credits reduced the Fund's expenses by $105.
9. Other.
The Fund's organizational documents provide former and current trustees and officers with a limited indemnification against liabilities arising in connection with the performance of their duties to the Fund. In the normal course of business, the Fund may also enter into contracts that provide general indemnifications. The Fund's maximum exposure under these arrangements is unknown as this would be dependent on future claims that may be made against the Fund. The risk of material loss from such claims is considered remote.
Report of Independent Registered Public Accounting Firm
To the Trustees of Fidelity Investment Trust and Shareholders of Fidelity International Capital Appreciation K6 Fund:
Opinion on the Financial Statements and Financial Highlights
We have audited the accompanying statement of assets and liabilities of Fidelity International Capital Appreciation K6 Fund (the "Fund"), a fund of Fidelity Investment Trust, including the schedule of investments, as of October 31, 2018, the related statement of operations for the year then ended, the statement of changes in net assets and the financial highlights for the year then ended and for the period from May 25, 2017 (commencement of operations) to October 31, 2017, and the related notes. In our opinion, the financial statements and financial highlights present fairly, in all material respects, the financial position of the Fund as of October 31, 2018, the results of its operations for the year then ended, and the changes in its net assets and the financial highlights for the year then ended and for the period from May 25, 2017 (commencement of operations) to October 31, 2017, in conformity with accounting principles generally accepted in the United States of America.
Basis for Opinion
These financial statements and financial highlights are the responsibility of the Fund's management. Our responsibility is to express an opinion on the Fund's financial statements and financial highlights based on our audits. We are a public accounting firm registered with the Public Company Accounting Oversight Board (United States) (PCAOB) and are required to be independent with respect to the Fund in accordance with the U.S. federal securities laws and the applicable rules and regulations of the Securities and Exchange Commission and the PCAOB.
We conducted our audits in accordance with the standards of the PCAOB. Those standards require that we plan and perform the audit to obtain reasonable assurance about whether the financial statements and financial highlights are free of material misstatement, whether due to error or fraud. The Fund is not required to have, nor were we engaged to perform, an audit of its internal control over financial reporting. As part of our audits we are required to obtain an understanding of internal control over financial reporting but not for the purpose of expressing an opinion on the effectiveness of the Fund’s internal control over financial reporting. Accordingly, we express no such opinion.
Our audits included performing procedures to assess the risks of material misstatement of the financial statements and financial highlights, whether due to error or fraud, and performing procedures that respond to those risks. Such procedures included examining, on a test basis, evidence regarding the amounts and disclosures in the financial statements and financial highlights. Our audits also included evaluating the accounting principles used and significant estimates made by management, as well as evaluating the overall presentation of the financial statements and financial highlights. Our procedures included confirmation of securities owned as of October 31, 2018, by correspondence with the custodians and brokers; when replies were not received from brokers, we performed other auditing procedures. We believe that our audits provide a reasonable basis for our opinion.
/s/ Deloitte & Touche LLP
Boston, Massachusetts
December 13, 2018
We have served as the auditor of one or more of the Fidelity investment companies since 1999.
Trustees and Officers
The Trustees, Members of the Advisory Board (if any), and officers of the trust and fund, as applicable, are listed below. The Board of Trustees governs the fund and is responsible for protecting the interests of shareholders. The Trustees are experienced executives who meet periodically throughout the year to oversee the fund's activities, review contractual arrangements with companies that provide services to the fund, oversee management of the risks associated with such activities and contractual arrangements, and review the fund's performance. Except for Jonathan Chiel, each of the Trustees oversees 283 funds. Mr. Chiel oversees 154 funds.
The Trustees hold office without limit in time except that (a) any Trustee may resign; (b) any Trustee may be removed by written instrument, signed by at least two-thirds of the number of Trustees prior to such removal; (c) any Trustee who requests to be retired or who has become incapacitated by illness or injury may be retired by written instrument signed by a majority of the other Trustees; and (d) any Trustee may be removed at any special meeting of shareholders by a two-thirds vote of the outstanding voting securities of the trust. Each Trustee who is not an interested person (as defined in the 1940 Act) of the trust and the fund is referred to herein as an Independent Trustee. Each Independent Trustee shall retire not later than the last day of the calendar year in which his or her 75th birthday occurs. The Independent Trustees may waive this mandatory retirement age policy with respect to individual Trustees. Officers and Advisory Board Members hold office without limit in time, except that any officer or Advisory Board Member may resign or may be removed by a vote of a majority of the Trustees at any regular meeting or any special meeting of the Trustees. Except as indicated, each individual has held the office shown or other offices in the same company for the past five years.
The fund’s Statement of Additional Information (SAI) includes more information about the Trustees. To request a free copy, call Fidelity at 1-800-835-5092.
Experience, Skills, Attributes, and Qualifications of the Trustees. The Governance and Nominating Committee has adopted a statement of policy that describes the experience, qualifications, attributes, and skills that are necessary and desirable for potential Independent Trustee candidates (Statement of Policy). The Board believes that each Trustee satisfied at the time he or she was initially elected or appointed a Trustee, and continues to satisfy, the standards contemplated by the Statement of Policy. The Governance and Nominating Committee also engages professional search firms to help identify potential Independent Trustee candidates who have the experience, qualifications, attributes, and skills consistent with the Statement of Policy. From time to time, additional criteria based on the composition and skills of the current Independent Trustees, as well as experience or skills that may be appropriate in light of future changes to board composition, business conditions, and regulatory or other developments, have also been considered by the professional search firms and the Governance and Nominating Committee. In addition, the Board takes into account the Trustees' commitment and participation in Board and committee meetings, as well as their leadership of standing and ad hoc committees throughout their tenure.
In determining that a particular Trustee was and continues to be qualified to serve as a Trustee, the Board has considered a variety of criteria, none of which, in isolation, was controlling. The Board believes that, collectively, the Trustees have balanced and diverse experience, qualifications, attributes, and skills, which allow the Board to operate effectively in governing the fund and protecting the interests of shareholders. Information about the specific experience, skills, attributes, and qualifications of each Trustee, which in each case led to the Board's conclusion that the Trustee should serve (or continue to serve) as a trustee of the fund, is provided below.
Board Structure and Oversight Function. James C. Curvey is an interested person and currently serves as Chairman. The Trustees have determined that an interested Chairman is appropriate and benefits shareholders because an interested Chairman has a personal and professional stake in the quality and continuity of services provided to the fund. Independent Trustees exercise their informed business judgment to appoint an individual of their choosing to serve as Chairman, regardless of whether the Trustee happens to be independent or a member of management. The Independent Trustees have determined that they can act independently and effectively without having an Independent Trustee serve as Chairman and that a key structural component for assuring that they are in a position to do so is for the Independent Trustees to constitute a substantial majority for the Board. The Independent Trustees also regularly meet in executive session. Ned C. Lautenbach serves as Chairman of the Independent Trustees and as such (i) acts as a liaison between the Independent Trustees and management with respect to matters important to the Independent Trustees and (ii) with management prepares agendas for Board meetings.
Fidelity® funds are overseen by different Boards of Trustees. The fund's Board oversees Fidelity's high income and certain equity funds, and other Boards oversee Fidelity's investment-grade bond, money market, asset allocation, and other equity funds. The asset allocation funds may invest in Fidelity® funds overseen by the fund's Board. The use of separate Boards, each with its own committee structure, allows the Trustees of each group of Fidelity® funds to focus on the unique issues of the funds they oversee, including common research, investment, and operational issues. On occasion, the separate Boards establish joint committees to address issues of overlapping consequences for the Fidelity® funds overseen by each Board.
The Trustees operate using a system of committees to facilitate the timely and efficient consideration of all matters of importance to the Trustees, the fund, and fund shareholders and to facilitate compliance with legal and regulatory requirements and oversight of the fund's activities and associated risks. The Board, acting through its committees, has charged FMR and its affiliates with (i) identifying events or circumstances the occurrence of which could have demonstrably adverse effects on the fund's business and/or reputation; (ii) implementing processes and controls to lessen the possibility that such events or circumstances occur or to mitigate the effects of such events or circumstances if they do occur; and (iii) creating and maintaining a system designed to evaluate continuously business and market conditions in order to facilitate the identification and implementation processes described in (i) and (ii) above. Because the day-to-day operations and activities of the fund are carried out by or through FMR, its affiliates, and other service providers, the fund's exposure to risks is mitigated but not eliminated by the processes overseen by the Trustees. While each of the Board's committees has responsibility for overseeing different aspects of the fund's activities, oversight is exercised primarily through the Operations, Audit, and Compliance Committees. In addition, the Independent Trustees have worked with Fidelity to enhance the Board's oversight of investment and financial risks, legal and regulatory risks, technology risks, and operational risks, including the development of additional risk reporting to the Board. Appropriate personnel, including but not limited to the fund's Chief Compliance Officer (CCO), FMR's internal auditor, the independent accountants, the fund's Treasurer and portfolio management personnel, make periodic reports to the Board's committees, as appropriate, including an annual review of Fidelity's risk management program for the Fidelity® funds. The responsibilities of each standing committee, including their oversight responsibilities, are described further under "Standing Committees of the Trustees."
Interested Trustees*:
Correspondence intended for a Trustee who is an interested person may be sent to Fidelity Investments, 245 Summer Street, Boston, Massachusetts 02210.
Name, Year of Birth; Principal Occupations and Other Relevant Experience+
Jonathan Chiel (1957)
Year of Election or Appointment: 2016
Trustee
Mr. Chiel also serves as Trustee of other Fidelity® funds. Mr. Chiel is Executive Vice President and General Counsel for FMR LLC (diversified financial services company, 2012-present). Previously, Mr. Chiel served as general counsel (2004-2012) and senior vice president and deputy general counsel (2000-2004) for John Hancock Financial Services; a partner with Choate, Hall & Stewart (1996-2000) (law firm); and an Assistant United States Attorney for the United States Attorney’s Office of the District of Massachusetts (1986-95), including Chief of the Criminal Division (1993-1995). Mr. Chiel is a director on the boards of the Boston Bar Foundation and the Maimonides School.
James C. Curvey (1935)
Year of Election or Appointment: 2007
Trustee
Chairman of the Board of Trustees
Mr. Curvey also serves as Trustee of other Fidelity® funds. Mr. Curvey is Vice Chairman (2007-present) and Director of FMR LLC (diversified financial services company). In addition, Mr. Curvey is an Overseer Emeritus for the Boston Symphony Orchestra, a Director of Artis-Naples, and a Trustee of Brewster Academy in Wolfeboro, New Hampshire. Previously, Mr. Curvey served as a Director of Fidelity Research & Analysis Co. (investment adviser firm, 2009-2018), Director of Fidelity Investments Money Management, Inc. (investment adviser firm, 2009-2014) and a Director of FMR and FMR Co., Inc. (investment adviser firms, 2007-2014).
Charles S. Morrison (1960)
Year of Election or Appointment: 2014
Trustee
Mr. Morrison also serves as Trustee of other funds. He serves as President of Fidelity SelectCo, LLC (investment adviser firm, 2017-present) and Fidelity Management & Research Company (FMR) (investment adviser firm, 2016-present), a Director of Fidelity Investments Money Management, Inc. (FIMM) (investment adviser firm, 2014-present), Director of Fidelity SelectCo, LLC (investment adviser firm, 2014-present), President, Asset Management (2014-present), and is an employee of Fidelity Investments. Previously, Mr. Morrison served as Vice President of Fidelity's Fixed Income and Asset Allocation Funds (2012-2014), President, Fixed Income (2011-2014), Vice President of Fidelity's Money Market Funds (2005-2009), President, Money Market Group Leader of FMR (investment adviser firm, 2009), and Senior Vice President, Money Market Group of FMR (2004-2009). Mr. Morrison also served as Vice President of Fidelity's Bond Funds (2002-2005), certain Balanced Funds (2002-2005), and certain Asset Allocation Funds (2002-2007), and as Senior Vice President (2002-2005) of Fidelity's Bond Division.
* Determined to be an “Interested Trustee” by virtue of, among other things, his or her affiliation with the trust or various entities under common control with FMR.
+ The information includes the Trustee's principal occupation during the last five years and other information relating to the experience, attributes, and skills relevant to the Trustee's qualifications to serve as a Trustee, which led to the conclusion that the Trustee should serve as a Trustee for the fund.
Independent Trustees:
Correspondence intended for an Independent Trustee may be sent to Fidelity Investments, P.O. Box 55235, Boston, Massachusetts 02205-5235.
Name, Year of Birth; Principal Occupations and Other Relevant Experience+
Dennis J. Dirks (1948)
Year of Election or Appointment: 2005
Trustee
Mr. Dirks also serves as Trustee of other Fidelity® funds. Prior to his retirement in May 2003, Mr. Dirks was Chief Operating Officer and a member of the Board of The Depository Trust & Clearing Corporation (DTCC). He also served as President, Chief Operating Officer, and Board member of The Depository Trust Company (DTC) and President and Board member of the National Securities Clearing Corporation (NSCC). In addition, Mr. Dirks served as Chief Executive Officer and Board member of the Government Securities Clearing Corporation, Chief Executive Officer and Board member of the Mortgage-Backed Securities Clearing Corporation, as a Trustee and a member of the Finance Committee of Manhattan College (2005-2008), as a Trustee and a member of the Finance Committee of AHRC of Nassau County (2006-2008), as a member of the Independent Directors Council (IDC) Governing Council (2010-2015), and as a member of the Board of Directors for The Brookville Center for Children’s Services, Inc. (2009-2017). Mr. Dirks is a member of the Finance Committee (2016-present), Board of Directors (2017-present) and Board of Trustees (2018-present) and is Treasurer (2018-present) of the Asolo Repertory Theatre.
Donald F. Donahue (1950)
Year of Election or Appointment: 2018
Trustee
Mr. Donahue also serves as a Trustee of other Fidelity® funds. Mr. Donahue is President and Chief Executive Officer of Miranda Partners, LLC (risk consulting for the financial services industry, 2012-present). Previously, Mr. Donahue served as a Member of the Advisory Board of certain Fidelity® funds (2015-2018) and Chief Executive Officer (2006-2012), Chief Operating Officer (2003-2006), and Managing Director, Customer Marketing and Development (1999-2003) of The Depository Trust & Clearing Corporation (financial markets infrastructure). Mr. Donahue serves as a Member (2007-present) and Co-Chairman (2016-present) of the Board of Directors of United Way of New York, Member of the Board of Directors of NYC Leadership Academy (2012-present) and Member of the Board of Advisors of Ripple Labs, Inc. (financial services, 2015-present). He also served as Chairman (2010-2012) and Member of the Board of Directors (2012-2013) of Omgeo, LLC (financial services), Treasurer of United Way of New York (2012-2016), and Member of the Board of Directors of XBRL US (financial services non-profit, 2009-2012) and the International Securities Services Association (2009-2012).
Alan J. Lacy (1953)
Year of Election or Appointment: 2008
Trustee
Mr. Lacy also serves as Trustee of other Fidelity® funds. Mr. Lacy serves as a Director of Bristol-Myers Squibb Company (global pharmaceuticals, 2008-present). He is a Trustee of the California Chapter of The Nature Conservancy (2015-present) and a Director of the Center for Advanced Study in the Behavioral Sciences at Stanford University (2015-present). In addition, Mr. Lacy served as Senior Adviser (2007-2014) of Oak Hill Capital Partners, L.P. (private equity) and also served as Chief Executive Officer (2005) and Vice Chairman (2005-2006) of Sears Holdings Corporation (retail) and Chief Executive Officer and Chairman of the Board of Sears, Roebuck and Co. (retail, 2000-2005). Previously, Mr. Lacy served as Chairman (2014-2017) and a member (2010-2017) of the Board of Directors of Dave & Buster’s Entertainment, Inc. (restaurant and entertainment complexes), as Chairman (2008-2011) and a member (2006-2015) of the Board of Trustees of the National Parks Conservation Association, and as a member of the Board of Directors for The Hillman Companies, Inc. (hardware wholesalers, 2010-2014), Earth Fare, Inc. (retail grocery, 2010-2014), and The Western Union Company (global money transfer, 2006-2011).
Ned C. Lautenbach (1944)
Year of Election or Appointment: 2000
Trustee
Chairman of the Independent Trustees
Mr. Lautenbach also serves as Trustee of other Fidelity® funds. Mr. Lautenbach currently serves as Vice Chair of the Board of Governors, State University System of Florida (2013-present) and is a member of the Council on Foreign Relations (1994-present). He is also a member and has most recently served as Chairman of the Board of Directors of Artis-Naples (2012-present). Previously, Mr. Lautenbach served as a member and then Lead Director of the Board of Directors of Eaton Corporation (diversified industrial, 1997-2016). He was also a Partner and Advisory Partner at Clayton, Dubilier & Rice, LLC (private equity investment, 1998-2010), as well as a Director of Sony Corporation (2006-2007). In addition, Mr. Lautenbach also had a 30-year career with IBM (technology company) during which time he served as Senior Vice President and a member of the Corporate Executive Committee (1968-1998).
Joseph Mauriello (1944)
Year of Election or Appointment: 2008
Trustee
Mr. Mauriello also serves as Trustee of other Fidelity® funds. Prior to his retirement in January 2006, Mr. Mauriello served in numerous senior management positions including Deputy Chairman and Chief Operating Officer (2004-2005), and Vice Chairman of Financial Services (2002-2004) of KPMG LLP US (professional services, 1965-2005). Mr. Mauriello currently serves as a member of the Independent Directors Council (IDC) Governing Council (2015-present). Previously, Mr. Mauriello served as a member of the Board of Directors of XL Group plc. (global insurance and re-insurance, 2006-2018).
Cornelia M. Small (1944)
Year of Election or Appointment: 2005
Trustee
Ms. Small also serves as Trustee of other Fidelity® funds. Ms. Small is a member of the Board of Directors (2009-present) and Chair of the Investment Committee (2010-present) of the Teagle Foundation. Ms. Small also serves on the Investment Committee of the Berkshire Taconic Community Foundation (2008-present). Previously, Ms. Small served as Chairperson (2002-2008) and a member of the Investment Committee and Chairperson (2008-2012) and a member of the Board of Trustees of Smith College. In addition, Ms. Small served as Chief Investment Officer, Director of Global Equity Investments, and a member of the Board of Directors of Scudder, Stevens & Clark and Scudder Kemper Investments.
Garnett A. Smith (1947)
Year of Election or Appointment: 2018
Trustee
Mr. Smith also serves as Trustee of other Fidelity® funds. Prior to Mr. Smith's retirement, he served as Chairman and Chief Executive Officer of Inbrand Corp. (manufacturer of personal absorbent products, 1990-1997). He also served as President (1986-1990) of Inbrand Corp. Prior to his employment with Inbrand Corp., he was employed by a retail fabric chain and North Carolina National Bank. In addition, Mr. Smith served as a Member of the Advisory Board of certain Fidelity® funds (2012-2013) and as a board member of the Jackson Hole Land Trust (2009-2012).
David M. Thomas (1949)
Year of Election or Appointment: 2008
Trustee
Mr. Thomas also serves as Trustee of other Fidelity® funds. Mr. Thomas serves as Non-Executive Chairman of the Board of Directors of Fortune Brands Home and Security (home and security products, 2011-present), as a member of the Board of Directors (2004-present) and Presiding Director (2013-present) of Interpublic Group of Companies, Inc. (marketing communication), and as a member of the Board of Trustees of the University of Florida (2013-present). Previously, Mr. Thomas served as Executive Chairman (2005-2006) and Chairman and Chief Executive Officer (2000-2005) of IMS Health, Inc. (pharmaceutical and healthcare information solutions), and a Director of Fortune Brands, Inc. (consumer products, 2000-2011).
+ The information includes the Trustee's principal occupation during the last five years and other information relating to the experience, attributes, and skills relevant to the Trustee's qualifications to serve as a Trustee, which led to the conclusion that the Trustee should serve as a Trustee for the fund.
Advisory Board Members and Officers:
Correspondence intended for a Member of the Advisory Board (if any) may be sent to Fidelity Investments, P.O. Box 55235, Boston, Massachusetts 02205-5235. Correspondence intended for an officer or Peter S. Lynch may be sent to Fidelity Investments, 245 Summer Street, Boston, Massachusetts 02210. Officers appear below in alphabetical order.
Name, Year of Birth; Principal Occupation
Vicki L. Fuller (1957)
Year of Election or Appointment: 2018
Member of the Advisory Board
Ms. Fuller also serves as Member of the Advisory Board of other Fidelity® funds. Ms. Fuller serves as a member of the Board of Directors, Audit Committee, and Nominating and Governance Committee of The Williams Companies, Inc. (natural gas infrastructure, 2018-present). Previously, Ms. Fuller served as the Chief Investment Officer of the New York State Common Retirement Fund (2012-2018) and held a variety of positions at AllianceBernstein L.P. (global asset management, 1985-2012), including Managing Director (2006-2012) and Senior Vice President and Senior Portfolio Manager (2001-2006).
Peter S. Lynch (1944)
Year of Election or Appointment: 2003
Member of the Advisory Board
Mr. Lynch also serves as Member of the Advisory Board of other Fidelity® funds. Mr. Lynch is Vice Chairman and a Director of FMR (investment adviser firm) and FMR Co., Inc. (investment adviser firm). In addition, Mr. Lynch serves as a Trustee of Boston College and as the Chairman of the Inner-City Scholarship Fund. Previously, Mr. Lynch served on the Special Olympics International Board of Directors (1997-2006).
William S. Stavropoulos (1939)
Year of Election or Appointment: 2018
Member of the Advisory Board
Mr. Stavropoulos also serves as Member of the Advisory Board of other Fidelity® funds. Mr. Stavropoulos serves as President and Founder of the Michigan Baseball Foundation, the Great Lakes Loons (2007-present). Mr. Stavropoulos is Chairman Emeritus of the Board of Directors of The Dow Chemical Company, where he previously served in numerous senior management positions, including President, CEO (1995-2000; 2002-2004), Chairman of the Executive Committee (2000-2006), and as a member of the Board of Directors (1990-2006). Currently, Mr. Stavropoulos is Chairman of the Board of Directors of Univar Inc. (global distributor of commodity and specialty chemicals), a Director of Teradata Corporation (data warehousing and technology solutions), and a member of the Advisory Board for Metalmark Capital LLC (private equity investment, 2005-present). Mr. Stavropoulos is an operating advisor to Clayton, Dubilier & Rice, LLC (private equity investment). In addition, Mr. Stavropoulos is a member of the University of Notre Dame Advisory Council for the College of Science, a Trustee of the Rollin L. Gerstacker Foundation, and a Director of Artis-Naples in Naples, Florida. Previously, Mr. Stavropoulos served as Trustee of certain Fidelity® funds (2001-2018) and as a Director of Chemical Financial Corporation (bank holding company, 1993-2012) and Tyco International, Ltd. (multinational manufacturing and services, 2007-2012).
Carol B. Tomé (1957)
Year of Election or Appointment: 2018
Member of the Advisory Board
Ms. Tomé also serves as Member of the Advisory Board of other Fidelity® funds. Ms. Tomé is Chief Financial Officer (2001-present) and Executive Vice President of Corporate Services (2007-present) of The Home Depot, Inc. (home improvement retailer) and a Director (2003-present) and Chair of the Audit Committee (2004-present) of United Parcel Service, Inc. (package delivery and supply chain management). Previously, Ms. Tomé served as Trustee of certain Fidelity® funds (2017), Senior Vice President of Finance and Accounting/Treasurer (2000-2007) and Vice President and Treasurer (1995-2000) of The Home Depot, Inc. and Chair of the Board (2010-2012), Vice Chair of the Board (2009 and 2013), and a Director (2008-2013) of the Federal Reserve Bank of Atlanta. Ms. Tomé is also a director or trustee of many community and professional organizations.
Michael E. Wiley (1950)
Year of Election or Appointment: 2018
Member of the Advisory Board
Mr. Wiley also serves as Trustee or Member of the Advisory Board of other Fidelity® funds. Mr. Wiley serves as a Director of High Point Resources (exploration and production, 2005-present). Previously, Mr. Wiley served as a Director of Andeavor Corporation (independent oil refiner and marketer, 2005-2018), a Director of Andeavor Logistics LP (natural resources logistics, 2015-2018), a Director of Post Oak Bank (privately-held bank, 2004-2018), a Director of Asia Pacific Exploration Consolidated (international oil and gas exploration and production, 2008-2013), a member of the Board of Trustees of the University of Tulsa (2000-2006; 2007-2010), a Senior Energy Advisor of Katzenbach Partners, LLC (consulting, 2006-2007), an Advisory Director of Riverstone Holdings (private investment), a Director of Spinnaker Exploration Company (exploration and production, 2001-2005) and Chairman, President, and CEO of Baker Hughes, Inc. (oilfield services, 2000-2004).
Elizabeth Paige Baumann (1968)
Year of Election or Appointment: 2017
Anti-Money Laundering (AML) Officer
Ms. Baumann also serves as AML Officer of other funds. She is Chief AML Officer (2012-present) and Senior Vice President (2014-present) of FMR LLC (diversified financial services company) and is an employee of Fidelity Investments. Previously, Ms. Baumann served as AML Officer of the funds (2012-2016), and Vice President (2007-2014) and Deputy Anti-Money Laundering Officer (2007-2012) of FMR LLC.
John J. Burke III (1964)
Year of Election or Appointment: 2018
Chief Financial Officer
Mr. Burke also serves as Chief Financial Officer of other funds. Mr. Burke serves as Head of Investment Operations for Fidelity Fund and Investment Operations (2018-present) and is an employee of Fidelity Investments (1998-present). Previously Mr. Burke served as head of Asset Management Investment Operations (2012-2018).
William C. Coffey (1969)
Year of Election or Appointment: 2018
Secretary and Chief Legal Officer (CLO)
Mr. Coffey also serves as Secretary and CLO of other funds. Mr. Coffey serves as CLO, Secretary, and Senior Vice President of Fidelity Management & Research Company and FMR Co., Inc. (investment adviser firms, 2018-present); Secretary of Fidelity SelectCo, LLC and Fidelity Investments Money Management, Inc. (investment adviser firms, 2018-present); and CLO of Fidelity Management & Research (Hong Kong) Limited, FMR Investment Management (UK) Limited, and Fidelity Management & Research (Japan) Limited (investment adviser firms, 2018-present). He is Senior Vice President and Deputy General Counsel of FMR LLC (diversified financial services company, 2010-present), and is an employee of Fidelity Investments. Previously, Mr. Coffey served as Assistant Secretary of certain funds (2009-2018) and as Vice President and Associate General Counsel of FMR LLC (2005-2009).
Timothy M. Cohen (1969)
Year of Election or Appointment: 2018
Vice President
Mr. Cohen also serves as Vice President of other funds. Mr. Cohen serves as Co-Head of Global Equity Research (2016-present), a Director of Fidelity Management & Research (Japan) Limited (investment adviser firm, 2016-present), and is an employee of Fidelity Investments. Previously, Mr. Cohen served as Chief Investment Officer - Equity and a Director of Fidelity Management & Research (U.K.) Inc. (investment adviser firm, 2013-2015) and as a Director of Fidelity Management & Research (Hong Kong) Limited (investment adviser firm, 2017).
Jonathan Davis (1968)
Year of Election or Appointment: 2010
Assistant Treasurer
Mr. Davis also serves as Assistant Treasurer of other funds. Mr. Davis serves as Assistant Treasurer of FMR Capital, Inc. (2017-present) and is an employee of Fidelity Investments. Previously, Mr. Davis served as Vice President and Associate General Counsel of FMR LLC (diversified financial services company, 2003-2010).
Adrien E. Deberghes (1967)
Year of Election or Appointment: 2016
Assistant Treasurer
Mr. Deberghes also serves as an officer of other funds. He serves as Assistant Treasurer of FMR Capital, Inc. (2017-present), Executive Vice President of Fidelity Investments Money Management, Inc. (FIMM) (investment adviser firm, 2016-present), and is an employee of Fidelity Investments (2008-present). Previously, Mr. Deberghes served as President and Treasurer of certain Fidelity® funds (2013-2018). Prior to joining Fidelity Investments, Mr. Deberghes was Senior Vice President of Mutual Fund Administration at State Street Corporation (2007-2008), Senior Director of Mutual Fund Administration at Investors Bank & Trust (2005-2007), and Director of Finance for Dunkin' Brands (2000-2005). Previously, Mr. Deberghes served in other fund officer roles.
Laura M. Del Prato (1964)
Year of Election or Appointment: 2018
Assistant Treasurer
Ms. Del Prato also serves as an officer of other funds. Ms. Del Prato is an employee of Fidelity Investments (2017-present). Prior to joining Fidelity Investments, Ms. Del Prato served as a Managing Director and Treasurer of the JPMorgan Mutual Funds (2014-2017). Prior to JPMorgan, Ms. Del Prato served as a partner at Cohen Fund Audit Services (accounting firm, 2012-2013) and KPMG LLP (accounting firm, 2004-2012).
Colm A. Hogan (1973)
Year of Election or Appointment: 2016
Deputy Treasurer
Mr. Hogan also serves as an officer of other funds. Mr. Hogan serves as Assistant Treasurer of FMR Capital, Inc. (2017-present) and is an employee of Fidelity Investments (2005-present). Previously, Mr. Hogan served as Assistant Treasurer of certain Fidelity® funds (2016-2018).
Pamela R. Holding (1964)
Year of Election or Appointment: 2018
Vice President
Ms. Holding also serves as Vice President of other funds. Ms. Holding serves as Co-Head of Global Equity Research (2018-present) and is an employee of Fidelity Investments (2013-present).
Chris Maher (1972)
Year of Election or Appointment: 2013
Assistant Treasurer
Mr. Maher serves as Assistant Treasurer of other funds. Mr. Maher is Vice President of Valuation Oversight, serves as Assistant Treasurer of FMR Capital, Inc. (2017-present), and is an employee of Fidelity Investments. Previously, Mr. Maher served as Vice President of Asset Management Compliance (2013), Vice President of the Program Management Group of FMR (investment adviser firm, 2010-2013), and Vice President of Valuation Oversight (2008-2010).
Rieco E. Mello (1969)
Year of Election or Appointment: 2017
Assistant Treasurer
Mr. Mello also serves as Assistant Treasurer of other funds. Mr. Mello serves as Assistant Treasurer of FMR Capital, Inc. (2017-present) and is an employee of Fidelity Investments (1995-present).
Kenneth B. Robins (1969)
Year of Election or Appointment: 2016
Chief Compliance Officer
Mr. Robins also serves as an officer of other funds. Mr. Robins serves as Compliance Officer of Fidelity Management & Research Company and FMR Co., Inc. (investment adviser firms, 2016-present) and is an employee of Fidelity Investments (2004-present). Previously, Mr. Robins served as Executive Vice President of Fidelity Investments Money Management, Inc. (investment adviser firm, 2013-2016) and served in other fund officer roles.
Stacie M. Smith (1974)
Year of Election or Appointment: 2016
President and Treasurer
Ms. Smith also serves as an officer of other funds. Ms. Smith serves as Assistant Treasurer of FMR Capital, Inc. (2017-present), is an employee of Fidelity Investments (2009-present), and has served in other fund officer roles. Prior to joining Fidelity Investments, Ms. Smith served as Senior Audit Manager of Ernst & Young LLP (accounting firm, 1996-2009). Previously, Ms. Smith served as Assistant Treasurer (2013-2018) and Deputy Treasurer (2013-2016) of certain Fidelity® funds.
Marc L. Spector (1972)
Year of Election or Appointment: 2016
Assistant Treasurer
Mr. Spector also serves as an officer of other funds. Mr. Spector serves as Assistant Treasurer of FMR Capital, Inc. (2017-present) and is an employee of Fidelity Investments (2016-present). Prior to joining Fidelity Investments, Mr. Spector served as Director at the Siegfried Group (accounting firm, 2013-2016), and prior to Siegfried Group as audit senior manager at Deloitte & Touche (accounting firm, 2005-2013).
Shareholder Expense Example
As a shareholder of the Fund, you incur two types of costs: (1) transaction costs and (2) ongoing costs, including management fees and other Fund expenses. This Example is intended to help you understand your ongoing costs (in dollars) of investing in the Fund and to compare these costs with the ongoing costs of investing in other mutual funds.
The Example is based on an investment of $1,000 invested at the beginning of the period and held for the entire period (May 1, 2018 to October 31, 2018).
Actual Expenses
The first line of the accompanying table provides information about actual account values and actual expenses. You may use the information in this line, together with the amount you invested, to estimate the expenses that you paid over the period. Simply divide your account value by $1,000.00 (for example, an $8,600 account value divided by $1,000.00 = 8.6), then multiply the result by the number in the first line under the heading entitled "Expenses Paid During Period" to estimate the expenses you paid on your account during this period. In addition, the Fund, as a shareholder in the underlying Fidelity Central Funds, will indirectly bear its pro-rata share of the fees and expenses incurred by the underlying Fidelity Central Funds. These fees and expenses are not included in the Fund's annualized expense ratio used to calculate the expense estimate in the table below.
Hypothetical Example for Comparison Purposes
The second line of the accompanying table provides information about hypothetical account values and hypothetical expenses based on the Fund's actual expense ratio and an assumed rate of return of 5% per year before expenses, which is not the Fund's actual return. The hypothetical account values and expenses may not be used to estimate the actual ending account balance or expenses you paid for the period. You may use this information to compare the ongoing costs of investing in the Fund and other funds. To do so, compare this 5% hypothetical example with the 5% hypothetical examples that appear in the shareholder reports of the other funds. In addition, the Fund, as a shareholder in the underlying Fidelity Central Funds, will indirectly bear its pro-rata share of the fees and expenses incurred by the underlying Fidelity Central Funds. These fees and expenses are not included in the Fund's annualized expense ratio used to calculate the expense estimate in the table below.
Please note that the expenses shown in the table are meant to highlight your ongoing costs only and do not reflect any transaction costs. Therefore, the second line of the table is useful in comparing ongoing costs only, and will not help you determine the relative total costs of owning different funds.
| | Annualized Expense Ratio-A | Beginning
Account Value
May 1, 2018 | Ending
Account Value
October 31, 2018 | Expenses Paid
During Period-B
May 1, 2018
to October 31, 2018 |
| Actual | .65% | $1,000.00 | $902.40 | $3.12 |
| Hypothetical-C | | $1,000.00 | $1,021.93 | $3.31 |
A Annualized expense ratio reflects expenses net of applicable fee waivers.
B Expenses are equal to the Fund's annualized expense ratio, multiplied by the average account value over the period, multiplied by 184/365 (to reflect the one-half year period).
C 5% return per year before expenses
Distributions (Unaudited)
The fund designates 15% of the dividends distributed during the fiscal year as qualifying for the dividends–received deduction for corporate shareholders.
The fund designates 98% of the dividends distributed during the fiscal year as amounts which may be taken into account as a dividend for the purposes of the maximum rate under section 1(h)(11) of the Internal Revenue Code.
The amounts per share which represent income derived from sources within, and taxes paid to, foreign countries or possessions of the United States are $0.0252 and $0.0017 for the dividend paid December 11, 2017.
The fund will notify shareholders in January 2019 of amounts for use in preparing 2018 income tax returns.
Board Approval of Investment Advisory Contracts
Fidelity International Capital Appreciation K6 Fund
At its July 2018 meeting, the Board of Trustees, including the Independent Trustees (together, the Board), voted to continue the management contract with Fidelity Management & Research Company (FMR) and the sub-advisory agreements (together, the Advisory Contracts) for the fund for six months through January 31, 2019, in connection with the reunification of the Fidelity Equity High Income Funds Board, which oversees the fund, and the Sector Portfolios Board.
The Board considered that the approval of the fund's Advisory Contracts will not result in any changes in (i) the investment process or strategies employed in the management of the fund's assets; (ii) the fees and expenses paid by shareholders; (iii) the nature, extent or quality of services provided under the fund's Advisory Contracts; or (iv) the day-to-day management of the fund or the persons primarily responsible for such management. The Board concluded that the fund's Advisory Contracts are fair and reasonable, and that the fund's Advisory Contracts should be renewed, without modification, through January 31, 2019, with the understanding that the Board will consider the annual renewal for a full one year period in January 2019.
In connection with its consideration of future renewals of the fund's Advisory Contracts, the Board will consider: (i) the nature, extent and quality of services provided to the fund, including shareholder and administrative services and investment performance; (ii) the competitiveness of the management fee and total expenses for the fund; (iii) the costs of the services and profitability, including the revenues earned and the expenses incurred in conducting the business of developing, marketing, distributing, managing, administering, and servicing the fund and its shareholders, to the extent applicable, as well as potential fall-out benefits from Fidelity's non-fund businesses; and (iv) whether there have been economies of scale in respect of the Fidelity funds, whether the Fidelity funds (including the fund) have appropriately benefited from any such economies of scale, and whether there is the potential for realization of any further economies.
Based on its evaluation of all of the conclusions noted above, and after considering all factors it believed relevant, the Board ultimately concluded that the fund's management fee structure is fair and reasonable, and that the continuation of the fund's Advisory Contracts should be approved.
Corporate Headquarters
245 Summer St.
Boston, MA 02210
www.fidelity.com
IVFK6-ANN-1218
1.9883991.101
Fidelity® Series Canada Fund
Annual Report October 31, 2018 |
|
Contents
To view a fund's proxy voting guidelines and proxy voting record for the 12-month period ended June 30, visit http://www.fidelity.com/proxyvotingresults or visit the Securities and Exchange Commission's (SEC) web site at http://www.sec.gov.
You may also call 1-800-544-8544 to request a free copy of the proxy voting guidelines.
Standard & Poor's, S&P and S&P 500 are registered service marks of The McGraw-Hill Companies, Inc. and have been licensed for use by Fidelity Distributors Corporation.
Other third-party marks appearing herein are the property of their respective owners.
All other marks appearing herein are registered or unregistered trademarks or service marks of FMR LLC or an affiliated company. © 2018 FMR LLC. All rights reserved.
This report and the financial statements contained herein are submitted for the general information of the shareholders of the Fund. This report is not authorized for distribution to prospective investors in the Fund unless preceded or accompanied by an effective prospectus.
A fund files its complete schedule of portfolio holdings with the SEC for the first and third quarters of each fiscal year on Form N-Q. Forms N-Q are available on the SEC’s web site at http://www.sec.gov. A fund's Forms N-Q may be reviewed and copied at the SEC’s Public Reference Room in Washington, DC. Information regarding the operation of the SEC's Public Reference Room may be obtained by calling 1-800-SEC-0330.
For a complete list of a fund's portfolio holdings, view the most recent holdings listing, semiannual report, or annual report on Fidelity's web site at http://www.fidelity.com, http://www.institutional.fidelity.com, or http://www.401k.com, as applicable.
NOT FDIC INSURED •MAY LOSE VALUE •NO BANK GUARANTEE
Neither the Fund nor Fidelity Distributors Corporation is a bank.
Performance: The Bottom Line
Average annual total return reflects the change in the value of an investment, assuming reinvestment of distributions from dividend income and capital gains (the profits earned upon the sale of securities that have grown in value, if any) and assuming a constant rate of performance each year. The hypothetical investment and the average annual total returns do not reflect the deduction of taxes that a shareholder would pay on fund distributions or the redemption of fund shares. During periods of reimbursement by Fidelity, a fund’s total return will be greater than it would be had the reimbursement not occurred. How a fund did yesterday is no guarantee of how it will do tomorrow.
Average Annual Total Returns
| For the periods ended October 31, 2018 | Past 1 year | Life of fundA |
| Fidelity® Series Canada Fund | (5.26)% | 0.82% |
A From August 15, 2017
$10,000 Over Life of Fund
Let's say hypothetically that $10,000 was invested in Fidelity® Series Canada Fund on August 15, 2017, when the fund started.
The chart shows how the value of your investment would have changed, and also shows how the MSCI Canada Index performed over the same period.
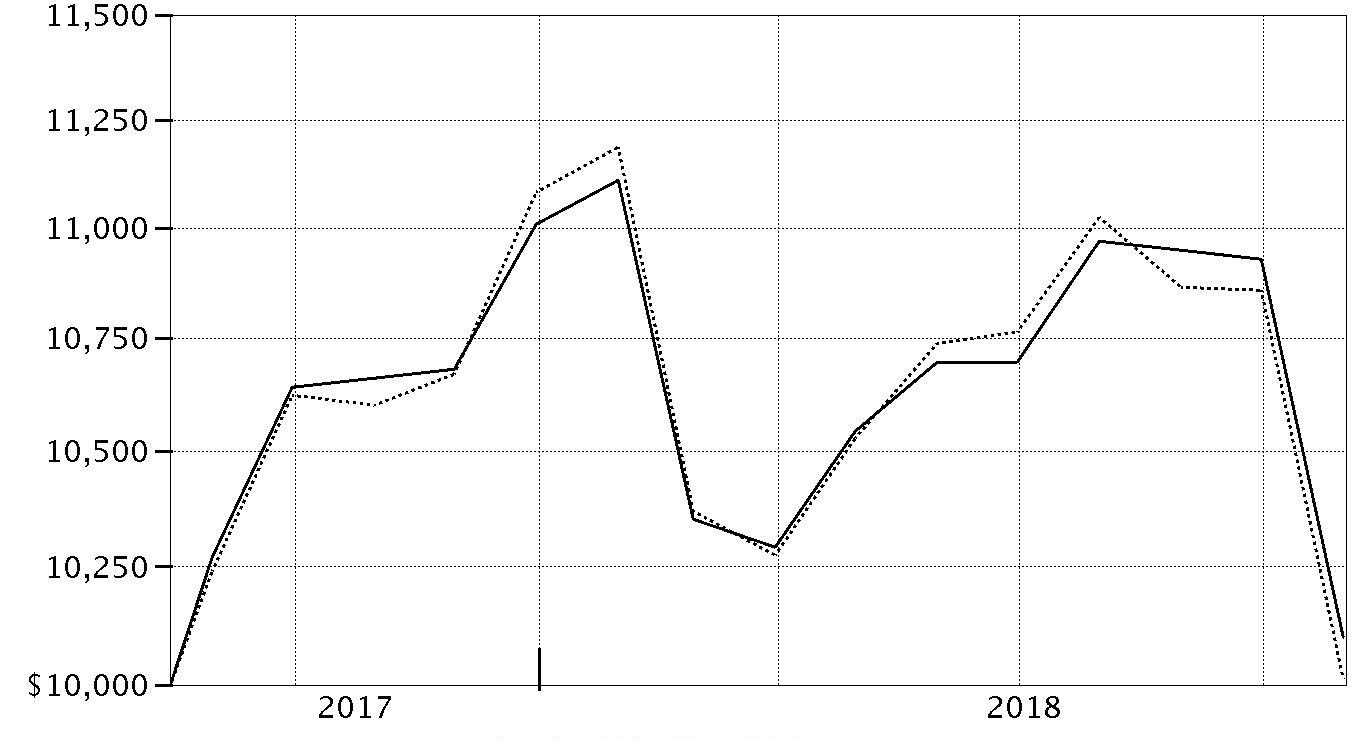
| Period Ending Values |
| $10,100 | Fidelity® Series Canada Fund |
| $10,012 | MSCI Canada Index |
Management's Discussion of Fund Performance
Market Recap: International equities returned -8.08% for the 12 months ending October 31, 2018, according to the MSCI ACWI (All Country World Index) ex USA Index. A modestly positive first half of the period gave way to a confluence of overwhelmingly negative factors – including escalating trade tension, a surging U.S. dollar, tepid economic growth in Europe, global central bank tightening, concerns about Italy’s budget stalemate with the EU, and weakness in China’s stock market – that yielded a -11% second-half return. The index lost 8% in October alone, its largest monthly drop in more than six years. Among sectors, new-media-infused communications services (-15%) was hit the hardest, while economically sensitive consumer discretionary (-13%), information technology (-12%), financials (-10%), industrials (-9%) and materials (-7%) stocks also fared poorly. Even the more defensive real estate (-9%), utilities (-6%) and consumer staples (-5%) sectors weren’t spared this period. Conversely, elevated crude-oil prices fueled a positive return for energy (+7%), the top-performing sector, followed by the relatively stable-growing health care segment (+2%). Regionally, emerging markets (-12%) fared the worst, hampered by the impact of foreign exchange and concerns about economic weakness in China, India and South Korea. Sluggish growth also pressured shares in continental Europe (-9%). Stocks in Japan (-3%) and the U.K. (-4%) held up better, followed by Canada (-5%) and Asia-Pacific ex Japan (-6%).
Comments from Portfolio Manager Ryan Oldham: For the fiscal year, the fund returned -5.26%, edging out the -5.56% result of the benchmark MSCI Canada Index. Volatile crude-oil prices dampened returns from resource-rich Canada, falling behind those in the United States, as measured by the S&P 500
® Index. Versus the MSCI index, positioning in industrials proved advantageous, as did an overweighting in information technology. In the transportation industry within industrials, the fund’s stake in Canadian Pacific Railway was the fund's biggest individual contributor on a relative basis. The firm benefited from a high return on equity, strong pricing power and strong volumes this period, all positive factors that encouraged investors and helped buoy its share price. An outsized position in financial media and information provider Thomson Reuters also added value. Conversely, stock selection in energy detracted. Overweighted positions in PrairieSky Royalty, which derives royalties from oil and gas production on its land, and non-benchmark oilfield services company CES Energy Solutions were the fund's most significant individual detractors. A weakened oil production outlook weighed on shares of PrairieSky, while reduced drilling in North America hindered results for CES.
The views expressed above reflect those of the portfolio manager(s) only through the end of the period as stated on the cover of this report and do not necessarily represent the views of Fidelity or any other person in the Fidelity organization. Any such views are subject to change at any time based upon market or other conditions and Fidelity disclaims any responsibility to update such views. These views may not be relied on as investment advice and, because investment decisions for a Fidelity fund are based on numerous factors, may not be relied on as an indication of trading intent on behalf of any Fidelity fund.
Note to Shareholders: On June 13, 2018, Ryan Oldham assumed co-management responsibilities for the fund, joining Risteard Hogan. On July 30, Risteard stepped down from the fund, leaving Ryan as sole manager.
Investment Summary (Unaudited)
Geographic Diversification (% of fund's net assets)
| As of October 31, 2018 |
| | Canada | 98.0% |
| | United States of America* | 2.0% |

* Includes Short-Term investments and Net Other Assets (Liabilities).
Percentages are based on country or territory of incorporation and are adjusted for the effect of futures contracts, if applicable.
Asset Allocation as of October 31, 2018
| | % of fund's net assets |
| Stocks | 98.0 |
| Short-Term Investments and Net Other Assets (Liabilities) | 2.0 |
Top Ten Stocks as of October 31, 2018
| | % of fund's net assets |
| The Toronto-Dominion Bank (Banks) | 10.8 |
| Suncor Energy, Inc. (Oil, Gas & Consumable Fuels) | 6.3 |
| Royal Bank of Canada (Banks) | 5.2 |
| Bank of Montreal (Banks) | 5.1 |
| Canadian Pacific Railway Ltd. (Road & Rail) | 5.0 |
| Nutrien Ltd. (Chemicals) | 4.2 |
| Sun Life Financial, Inc. (Insurance) | 4.2 |
| Bank of Nova Scotia (Banks) | 4.1 |
| Canadian National Railway Co. (Road & Rail) | 4.0 |
| Alimentation Couche-Tard, Inc. Class B (sub. vtg.) (Food & Staples Retailing) | 3.9 |
| | 52.8 |
Top Market Sectors as of October 31, 2018
| | % of fund's net assets |
| Financials | 38.8 |
| Energy | 18.4 |
| Industrials | 10.2 |
| Materials | 10.1 |
| Consumer Staples | 6.9 |
| Communication Services | 5.4 |
| Information Technology | 5.1 |
| Consumer Discretionary | 2.6 |
| Real Estate | 0.5 |
Market Sectors may include more than one industry category.
The Fund may invest up to 35% of its total assets in any industry that represents more than 20% of the Canadian market. As of October 31, 2018, 25.5% of the Fund’s total assets were invested in the Diversified Banks industry, which accounts for more than 20% of the Canadian market.
Schedule of Investments October 31, 2018
Showing Percentage of Net Assets
| Common Stocks - 98.0% | | | |
| | | Shares | Value |
| COMMUNICATION SERVICES - 5.4% | | | |
| Diversified Telecommunication Services - 2.3% | | | |
| TELUS Corp. | | 918,400 | $31,449,331 |
| Media - 1.3% | | | |
| Cogeco Communications, Inc. | | 204,100 | 10,007,714 |
| Quebecor, Inc. Class B (sub. vtg.) | | 428,500 | 8,404,322 |
| | | | 18,412,036 |
| Wireless Telecommunication Services - 1.8% | | | |
| Rogers Communications, Inc. Class B (non-vtg.) | | 483,100 | 24,877,017 |
|
| TOTAL COMMUNICATION SERVICES | | | 74,738,384 |
|
| CONSUMER DISCRETIONARY - 2.6% | | | |
| Hotels, Restaurants & Leisure - 0.4% | | | |
| Recipe Unlimited Corp. | | 284,100 | 5,861,336 |
| Leisure Products - 0.8% | | | |
| Spin Master Corp. (a)(b) | | 285,800 | 10,168,918 |
| Multiline Retail - 1.4% | | | |
| Dollarama, Inc. | | 714,400 | 19,758,672 |
|
| TOTAL CONSUMER DISCRETIONARY | | | 35,788,926 |
|
| CONSUMER STAPLES - 6.9% | | | |
| Food & Staples Retailing - 6.9% | | | |
| Alimentation Couche-Tard, Inc. Class B (sub. vtg.) | | 1,139,600 | 54,424,135 |
| George Weston Ltd. | | 436,900 | 31,777,261 |
| North West Co., Inc. | | 429,400 | 9,361,373 |
| | | | 95,562,769 |
| ENERGY - 18.4% | | | |
| Energy Equipment & Services - 0.6% | | | |
| Canadian Energy Services & Technology Corp. | | 2,896,500 | 7,678,822 |
| Oil, Gas & Consumable Fuels - 17.8% | | | |
| Canadian Natural Resources Ltd. | | 1,851,100 | 50,789,420 |
| Cenovus Energy, Inc. (Canada) | | 1,893,400 | 16,022,239 |
| Enbridge, Inc. | | 1,220,100 | 38,017,777 |
| Peyto Exploration & Development Corp. (c) | | 760,300 | 6,202,759 |
| Pinnacle Renewable Holds, Inc. | | 521,900 | 5,740,523 |
| PrairieSky Royalty Ltd. (c) | | 2,831,100 | 43,011,128 |
| Suncor Energy, Inc. | | 2,605,000 | 87,384,101 |
| | | | 247,167,947 |
|
| TOTAL ENERGY | | | 254,846,769 |
|
| FINANCIALS - 38.8% | | | |
| Banks - 25.2% | | | |
| Bank of Montreal (c) | | 952,600 | 71,225,203 |
| Bank of Nova Scotia | | 1,055,400 | 56,640,214 |
| Royal Bank of Canada | | 978,700 | 71,310,649 |
| The Toronto-Dominion Bank | | 2,693,500 | 149,421,783 |
| | | | 348,597,849 |
| Capital Markets - 4.3% | | | |
| Gluskin Sheff + Associates, Inc. | | 338,100 | 2,881,600 |
| IGM Financial, Inc. | | 518,200 | 12,726,200 |
| Thomson Reuters Corp. | | 937,400 | 43,628,317 |
| | | | 59,236,117 |
| Insurance - 9.3% | | | |
| Intact Financial Corp. | | 468,300 | 36,999,417 |
| Power Corp. of Canada (sub. vtg.) | | 1,650,200 | 34,070,748 |
| Sun Life Financial, Inc. | | 1,593,800 | 58,366,894 |
| | | | 129,437,059 |
|
| TOTAL FINANCIALS | | | 537,271,025 |
|
| INDUSTRIALS - 10.2% | | | |
| Aerospace & Defense - 0.7% | | | |
| CAE, Inc. | | 546,100 | 9,632,301 |
| Road & Rail - 9.5% | | | |
| Canadian National Railway Co. | | 646,300 | 55,250,562 |
| Canadian Pacific Railway Ltd. | | 339,300 | 69,581,694 |
| TransForce, Inc. | | 211,400 | 7,035,158 |
| | | | 131,867,414 |
|
| TOTAL INDUSTRIALS | | | 141,499,715 |
|
| INFORMATION TECHNOLOGY - 5.1% | | | |
| IT Services - 2.0% | | | |
| CGI Group, Inc. Class A (sub. vtg.) (a) | | 448,000 | 27,667,135 |
| Software - 3.1% | | | |
| Constellation Software, Inc. | | 31,900 | 21,954,285 |
| Open Text Corp. | | 634,100 | 21,405,601 |
| | | | 43,359,886 |
|
| TOTAL INFORMATION TECHNOLOGY | | | 71,027,021 |
|
| MATERIALS - 10.1% | | | |
| Chemicals - 4.2% | | | |
| Nutrien Ltd. | | 1,107,178 | 58,611,595 |
| Containers & Packaging - 1.4% | | | |
| CCL Industries, Inc. Class B | | 440,000 | 18,509,780 |
| Metals & Mining - 4.0% | | | |
| Franco-Nevada Corp. | | 465,400 | 29,066,951 |
| Lundin Mining Corp. | | 2,148,300 | 8,828,518 |
| OceanaGold Corp. | | 242,100 | 696,995 |
| Wheaton Precious Metals Corp. | | 1,031,400 | 16,954,306 |
| | | | 55,546,770 |
| Paper & Forest Products - 0.5% | | | |
| Western Forest Products, Inc. | | 4,846,500 | 6,479,426 |
|
| TOTAL MATERIALS | | | 139,147,571 |
|
| REAL ESTATE - 0.5% | | | |
| Equity Real Estate Investment Trusts (REITs) - 0.5% | | | |
| Allied Properties (REIT) | | 229,900 | 7,387,117 |
| TOTAL COMMON STOCKS | | | |
| (Cost $1,417,832,178) | | | 1,357,269,297 |
|
| Money Market Funds - 7.0% | | | |
| Fidelity Cash Central Fund, 2.23% (d) | | 15,798,986 | 15,802,146 |
| Fidelity Securities Lending Cash Central Fund 2.23% (d)(e) | | 81,532,997 | 81,541,151 |
| TOTAL MONEY MARKET FUNDS | | | |
| (Cost $97,343,297) | | | 97,343,297 |
| TOTAL INVESTMENT IN SECURITIES - 105.0% | | | |
| (Cost $1,515,175,475) | | | 1,454,612,594 |
| NET OTHER ASSETS (LIABILITIES) - (5.0)% | | | (69,113,959) |
| NET ASSETS - 100% | | | $1,385,498,635 |
Legend
(a) Non-income producing
(b) Security exempt from registration under Rule 144A of the Securities Act of 1933. These securities may be resold in transactions exempt from registration, normally to qualified institutional buyers. At the end of the period, the value of these securities amounted to $10,168,918 or 0.8% of net assets.
(c) Security or a portion of the security is on loan at period end.
(d) Affiliated fund that is generally available only to investment companies and other accounts managed by Fidelity Investments. The rate quoted is the annualized seven-day yield of the fund at period end. A complete unaudited listing of the fund's holdings as of its most recent quarter end is available upon request. In addition, each Fidelity Central Fund's financial statements, which are not covered by the Fund's Report of Independent Registered Public Accounting Firm, are available on the SEC's website or upon request.
(e) Investment made with cash collateral received from securities on loan.
Affiliated Central Funds
Information regarding fiscal year to date income earned by the Fund from investments in Fidelity Central Funds is as follows:
| Fund | Income earned |
| Fidelity Cash Central Fund | $539,892 |
| Fidelity Securities Lending Cash Central Fund | 167,740 |
| Total | $707,632 |
Amounts in the income column in the above table include any capital gain distributions from underlying funds, which are presented in the corresponding line-item in the Statement of Operations if applicable.
Investment Valuation
All investments are categorized as Level 1 under the Fair Value Hierarchy. The inputs or methodology used for valuing securities may not be an indication of the risk associated with investing in those securities. For more information on valuation inputs please refer to the Investment Valuation section in the accompanying Notes to Financial Statements.
See accompanying notes which are an integral part of the financial statements.
Financial Statements
Statement of Assets and Liabilities
| | | October 31, 2018 |
| Assets | | |
Investment in securities, at value (including securities loaned of $77,022,835) — See accompanying schedule:
Unaffiliated issuers (cost $1,417,832,178) | $1,357,269,297 | |
| Fidelity Central Funds (cost $97,343,297) | 97,343,297 | |
| Total Investment in Securities (cost $1,515,175,475) | | $1,454,612,594 |
| Foreign currency held at value (cost $739,223) | | 739,223 |
| Receivable for investments sold | | 759 |
| Receivable for fund shares sold | | 18,942,524 |
| Dividends receivable | | 1,995,341 |
| Distributions receivable from Fidelity Central Funds | | 56,028 |
| Other receivables | | 146,208 |
| Total assets | | 1,476,492,677 |
| Liabilities | | |
| Payable for investments purchased | $8,179,025 | |
| Payable for fund shares redeemed | 1,266,136 | |
| Other payables and accrued expenses | 6,546 | |
| Collateral on securities loaned | 81,542,335 | |
| Total liabilities | | 90,994,042 |
| Net Assets | | $1,385,498,635 |
| Net Assets consist of: | | |
| Paid in capital | | $1,427,333,036 |
| Total distributable earnings (loss) | | (41,834,401) |
| Net Assets, for 138,684,503 shares outstanding | | $1,385,498,635 |
| Net Asset Value, offering price and redemption price per share ($1,385,498,635 ÷ 138,684,503 shares) | | $9.99 |
See accompanying notes which are an integral part of the financial statements.
Statement of Operations
| | | Year ended October 31, 2018 |
| Investment Income | | |
| Dividends | | $41,681,651 |
| Income from Fidelity Central Funds | | 707,632 |
| Income before foreign taxes withheld | | 42,389,283 |
| Less foreign taxes withheld | | (6,274,841) |
| Total income | | 36,114,442 |
| Expenses | | |
| Custodian fees and expenses | $22,810 | |
| Independent trustees' fees and expenses | 7,356 | |
| Commitment fees | 2,248 | |
| Total expenses | | 32,414 |
| Net investment income (loss) | | 36,082,028 |
| Realized and Unrealized Gain (Loss) | | |
| Net realized gain (loss) on: | | |
| Investment securities: | | |
| Unaffiliated issuers | (5,300,110) | |
| Fidelity Central Funds | (1,576) | |
| Foreign currency transactions | (149,023) | |
| Total net realized gain (loss) | | (5,450,709) |
| Change in net unrealized appreciation (depreciation) on: | | |
| Investment securities: | | |
| Unaffiliated issuers | (102,749,473) | |
| Assets and liabilities in foreign currencies | 16,465 | |
| Total change in net unrealized appreciation (depreciation) | | (102,733,008) |
| Net gain (loss) | | (108,183,717) |
| Net increase (decrease) in net assets resulting from operations | | $(72,101,689) |
See accompanying notes which are an integral part of the financial statements.
Statement of Changes in Net Assets
| | Year ended October 31, 2018 | For the period
August 15, 2017 (commencement of operations) to October 31, 2017 |
| Increase (Decrease) in Net Assets | | |
| Operations | | |
| Net investment income (loss) | $36,082,028 | $6,106,214 |
| Net realized gain (loss) | (5,450,709) | (1,889,438) |
| Change in net unrealized appreciation (depreciation) | (102,733,008) | 42,162,066 |
| Net increase (decrease) in net assets resulting from operations | (72,101,689) | 46,378,842 |
| Distributions to shareholders | (16,111,554) | – |
| Total distributions | (16,111,554) | – |
| Share transactions | | |
| Proceeds from sales of shares | 164,696,337 | 1,473,942,687 |
| Reinvestment of distributions | 16,111,554 | – |
| Cost of shares redeemed | (184,063,223) | (43,354,319) |
| Net increase (decrease) in net assets resulting from share transactions | (3,255,332) | 1,430,588,368 |
| Total increase (decrease) in net assets | (91,468,575) | 1,476,967,210 |
| Net Assets | | |
| Beginning of period | 1,476,967,210 | – |
| End of period | $1,385,498,635 | $1,476,967,210 |
| Other Information | | |
| Undistributed net investment income end of period | | $6,106,214 |
| Shares | | |
| Sold | 15,644,674 | 142,690,282 |
| Issued in reinvestment of distributions | 1,522,831 | – |
| Redeemed | (17,094,786) | (4,078,498) |
| Net increase (decrease) | 72,719 | 138,611,784 |
See accompanying notes which are an integral part of the financial statements.
Financial Highlights
Fidelity Series Canada Fund
| | | |
| Years ended October 31, | 2018 | 2017 A |
| Selected Per–Share Data | | |
| Net asset value, beginning of period | $10.66 | $10.00 |
| Income from Investment Operations | | |
| Net investment income (loss)B | .26 | .06 |
| Net realized and unrealized gain (loss) | (.81) | .60 |
| Total from investment operations | (.55) | .66 |
| Distributions from net investment income | (.10) | – |
| Distributions from net realized gain | (.02) | – |
| Total distributions | (.12) | – |
| Net asset value, end of period | $9.99 | $10.66 |
| Total ReturnC,D | (5.26)% | 6.60% |
| Ratios to Average Net AssetsE,F | | |
| Expenses before reductions | - %G | - %G,H |
| Expenses net of fee waivers, if any | - %G | - %G,H |
| Expenses net of all reductions | - %G | - %G,H |
| Net investment income (loss) | 2.42% | 2.62%H |
| Supplemental Data | | |
| Net assets, end of period (000 omitted) | $1,385,499 | $1,476,967 |
| Portfolio turnover rateI | 36% | 3%J |
A For the period August 15, 2017 (commencement of operations) to October 31, 2017.
B Calculated based on average shares outstanding during the period.
C Total returns for periods of less than one year are not annualized.
D Total returns would have been lower if certain expenses had not been reduced during the applicable periods shown.
E Fees and expenses of any underlying Fidelity Central Funds are not included in the Fund's expense ratio. The Fund indirectly bears its proportionate share of the expenses of any underlying Fidelity Central Funds.
F Expense ratios reflect operating expenses of the Fund. Expenses before reductions do not reflect amounts reimbursed by the investment adviser or reductions from expense offset arrangements and do not represent the amount paid by the Fund during periods when reimbursements or reductions occur. Expense ratios before reductions for start-up periods may not be representative of longer term operating periods. Expenses net of fee waivers reflect expenses after reimbursement by the investment adviser but prior to reductions from expense offset arrangements. Expenses net of all reductions represent the net expenses paid by the Fund.
G Amount represents less than .005%.
H Annualized
I Amount does not include the portfolio activity of any underlying Fidelity Central Funds.
J Amount not annualized.
See accompanying notes which are an integral part of the financial statements.
Notes to Financial Statements
For the period ended October 31, 2018
1. Organization.
Fidelity Series Canada Fund (the Fund) is a fund of Fidelity Investment Trust (the Trust) and is authorized to issue an unlimited number of shares. Shares of the Fund are only available for purchase by mutual funds for which Fidelity Management & Research Company (FMR) or an affiliate serves as an investment manager. The Trust is registered under the Investment Company Act of 1940, as amended (the 1940 Act), as an open-end management investment company organized as a Massachusetts business trust.
2. Investments in Fidelity Central Funds.
The Fund invests in Fidelity Central Funds, which are open-end investment companies generally available only to other investment companies and accounts managed by the investment adviser and its affiliates. The Fund's Schedule of Investments lists each of the Fidelity Central Funds held as of period end, if any, as an investment of the Fund, but does not include the underlying holdings of each Fidelity Central Fund. As an Investing Fund, the Fund indirectly bears its proportionate share of the expenses of the underlying Fidelity Central Funds.
The Money Market Central Funds seek preservation of capital and current income and are managed by Fidelity Investments Money Management, Inc. (FIMM), an affiliate of the investment adviser. Annualized expenses of the Money Market Central Funds as of their most recent shareholder report date are less than .005%.
A complete unaudited list of holdings for each Fidelity Central Fund is available upon request or at the Securities and Exchange Commission (the SEC) website at www.sec.gov. In addition, the financial statements of the Fidelity Central Funds, which are not covered by the Fund's Report of Independent Registered Public Accounting Firm, are available on the SEC website or upon request.
3. Significant Accounting Policies.
The Fund is an investment company and applies the accounting and reporting guidance of the Financial Accounting Standards Board (FASB) Accounting Standards Codification Topic 946 Financial Services – Investments Companies. The financial statements have been prepared in conformity with accounting principles generally accepted in the United States of America (GAAP), which require management to make certain estimates and assumptions at the date of the financial statements. Actual results could differ from those estimates. Subsequent events, if any, through the date that the financial statements were issued have been evaluated in the preparation of the financial statements. The following summarizes the significant accounting policies of the Fund:
Investment Valuation. Investments are valued as of 4:00 p.m. Eastern time on the last calendar day of the period. The Board of Trustees (the Board) has delegated the day to day responsibility for the valuation of the Fund's investments to the Fair Value Committee (the Committee) established by the Fund's investment adviser. In accordance with valuation policies and procedures approved by the Board, the Fund attempts to obtain prices from one or more third party pricing vendors or brokers to value its investments. When current market prices, quotations or currency exchange rates are not readily available or reliable, investments will be fair valued in good faith by the Committee, in accordance with procedures adopted by the Board. Factors used in determining fair value vary by investment type and may include market or investment specific events. The frequency with which these procedures are used cannot be predicted and they may be utilized to a significant extent. The Committee oversees the Fund's valuation policies and procedures and reports to the Board on the Committee's activities and fair value determinations. The Board monitors the appropriateness of the procedures used in valuing the Fund's investments and ratifies the fair value determinations of the Committee.
The Fund categorizes the inputs to valuation techniques used to value its investments into a disclosure hierarchy consisting of three levels as shown below:
- Level 1 – quoted prices in active markets for identical investments
- Level 2 – other significant observable inputs (including quoted prices for similar investments, interest rates, prepayment speeds, etc.)
- Level 3 – unobservable inputs (including the Fund's own assumptions based on the best information available)
Valuation techniques used to value the Fund's investments by major category are as follows:
Equity securities, including restricted securities, for which market quotations are readily available, are valued at the last reported sale price or official closing price as reported by a third party pricing vendor on the primary market or exchange on which they are traded and are categorized as Level 1 in the hierarchy. In the event there were no sales during the day or closing prices are not available, securities are valued at the last quoted bid price or may be valued using the last available price and are generally categorized as Level 2 in the hierarchy. For foreign equity securities, when market or security specific events arise, comparisons to the valuation of American Depositary Receipts (ADRs), futures contracts, Exchange-Traded Funds (ETFs) and certain indexes as well as quoted prices for similar securities may be used and would be categorized as Level 2 in the hierarchy. Utilizing these techniques may result in transfers between Level 1 and Level 2. For equity securities, including restricted securities, where observable inputs are limited, assumptions about market activity and risk are used and these securities may be categorized as Level 3 in the hierarchy.
Investments in open-end mutual funds, including the Fidelity Central Funds, are valued at their closing net asset value (NAV) each business day and are categorized as Level 1 in the hierarchy.
Changes in valuation techniques may result in transfers in or out of an assigned level within the disclosure hierarchy.
Foreign Currency. The Fund may use foreign currency contracts to facilitate transactions in foreign-denominated securities. Gains and losses from these transactions may arise from changes in the value of the foreign currency or if the counterparties do not perform under the contracts' terms.
Foreign-denominated assets, including investment securities, and liabilities are translated into U.S. dollars at the exchange rates at period end. Purchases and sales of investment securities, income and dividends received and expenses denominated in foreign currencies are translated into U.S. dollars at the exchange rate in effect on the transaction date.
The effects of exchange rate fluctuations on investments are included with the net realized and unrealized gain (loss) on investment securities. Other foreign currency transactions resulting in realized and unrealized gain (loss) are disclosed separately.
Investment Transactions and Income. For financial reporting purposes, the Fund's investment holdings and NAV include trades executed through the end of the last business day of the period. The NAV per share for processing shareholder transactions is calculated as of the close of business of the New York Stock Exchange (NYSE), normally 4:00 p.m. Eastern time and includes trades executed through the end of the prior business day. Gains and losses on securities sold are determined on the basis of identified cost. Dividend income is recorded on the ex-dividend date, except for certain dividends from foreign securities where the ex-dividend date may have passed, which are recorded as soon as the Fund is informed of the ex-dividend date. Non-cash dividends included in dividend income, if any, are recorded at the fair market value of the securities received. Income and capital gain distributions from Fidelity Central Funds, if any, are recorded on the ex-dividend date. Certain distributions received by the Fund represent a return of capital or capital gain. The Fund determines the components of these distributions subsequent to the ex-dividend date, based upon receipt of tax filings or other correspondence relating to the underlying investment. These distributions are recorded as a reduction of cost of investments and/or as a realized gain. Investment income is recorded net of foreign taxes withheld where recovery of such taxes is uncertain.
Expenses. Expenses directly attributable to a fund are charged to that fund. Expenses attributable to more than one fund are allocated among the respective funds on the basis of relative net assets or other appropriate methods. Expense estimates are accrued in the period to which they relate and adjustments are made when actual amounts are known.
Income Tax Information and Distributions to Shareholders. Each year, the Fund intends to qualify as a regulated investment company under Subchapter M of the Internal Revenue Code, including distributing substantially all of its taxable income and realized gains. As a result, no provision for U.S. Federal income taxes is required. As of October 31, 2018, the Fund did not have any unrecognized tax benefits in the financial statements; nor is the Fund aware of any tax positions for which it is reasonably possible that the total amounts of unrecognized tax benefits will significantly change in the next twelve months. The Fund files a U.S. federal tax return, in addition to state and local tax returns as required. The Fund's federal income tax returns are subject to examination by the Internal Revenue Service (IRS) for a period of three fiscal years after they are filed. State and local tax returns may be subject to examination for an additional fiscal year depending on the jurisdiction. Foreign taxes are provided for based on the Fund's understanding of the tax rules and rates that exist in the foreign markets in which it invests.
Distributions are declared and recorded on the ex-dividend date. Income and capital gain distributions are determined in accordance with income tax regulations, which may differ from GAAP.
Capital accounts within the financial statements are adjusted for permanent book-tax differences. These adjustments have no impact on net assets or the results of operations. Capital accounts are not adjusted for temporary book-tax differences which will reverse in a subsequent period.
Book-tax differences are primarily due to foreign currency transactions, passive foreign investment companies (PFIC), capital loss carryforwards and losses deferred due to wash sales.
As of period end, the cost and unrealized appreciation (depreciation) in securities, and derivatives if applicable, for federal income tax purposes were as follows:
| Gross unrealized appreciation | $59,281,923 |
| Gross unrealized depreciation | (121,030,026) |
| Net unrealized appreciation (depreciation) | $(61,748,103) |
| Tax Cost | $1,516,360,697 |
The tax-based components of distributable earnings as of period end were as follows:
| Undistributed ordinary income | $25,409,915 |
| Capital loss carryforward | $(5,488,153) |
| Net unrealized appreciation (depreciation) on securities and other investments | $(61,756,164) |
Capital loss carryforwards are only available to offset future capital gains of the Fund to the extent provided by regulations and may be limited. Under the Regulated Investment Company Modernization Act of 2010 (the Act), the Fund is permitted to carry forward capital losses incurred in taxable years beginning after December 22, 2010 for an unlimited period and such capital losses are required to be used prior to any losses that expire. The capital loss carryforward information presented below, including any applicable limitation, is estimated as of fiscal period end and is subject to adjustment.
| No expiration | |
| Short-term | $(5,488,153) |
The tax character of distributions paid was as follows:
| | October 31, 2018 | October 31, 2017(a) |
| Ordinary Income | $16,111,554 | $ - |
(a) For the period August 15, 2017 (commencement of operations) to October 31, 2017
Restricted Securities. The Fund may invest in securities that are subject to legal or contractual restrictions on resale. These securities generally may be resold in transactions exempt from registration or to the public if the securities are registered. Disposal of these securities may involve time-consuming negotiations and expense, and prompt sale at an acceptable price may be difficult. Information regarding restricted securities is included at the end of the Fund's Schedule of Investments.
New Rule Issuance. During August 2018, the U.S. Securities and Exchange Commission issued Final Rule Release No. 33-10532, Disclosure Update and Simplification. This Final Rule includes amendments specific to registered investment companies that are intended to eliminate overlap in disclosure requirements between Regulation S-X and GAAP. In accordance with these amendments, certain line-items in the Fund's financial statements have been combined or removed for the current period as outlined in the table below.
| Financial Statement | Current Line-Item Presentation | Prior Line-Item Presentation |
| Statement of Assets and Liabilities | Total distributable earnings (loss) | Undistributed/Distributions in excess of/Accumulated net investment income (loss)
Accumulated/Undistributed net realized gain (loss)
Net unrealized appreciation (depreciation) |
| Statement of Changes in Net Assets | N/A - removed | Undistributed/Distributions in excess of/Accumulated net investment income (loss) end of period |
| Statement of Changes in Net Assets | Distributions to shareholders | Distributions to shareholders from net investment income
Distributions to shareholders from net realized gain |
4. Purchases and Sales of Investments.
Purchases and sales of securities, other than short-term securities, aggregated $557,957,976 and $525,950,549, respectively.
5. Fees and Other Transactions with Affiliates.
Management Fee. Fidelity Management & Research Company (the investment adviser) and its affiliates provide the Fund with investment management related services for which the Fund does not pay a management fee. Under the management contract, the investment adviser or an affiliate pays all ordinary operating expenses of the Fund, except custody fees, fees and expenses of the independent Trustees, and certain miscellaneous expenses such as proxy and shareholder meeting expenses.
Interfund Trades. The Fund may purchase from or sell securities to other Fidelity Funds under procedures adopted by the Board. The procedures have been designed to ensure these interfund trades are executed in accordance with Rule 17a-7 of the 1940 Act. Interfund trades are included within the respective purchases and sales amounts shown in the Purchases and Sales of Investments note.
Other. During the period, the investment adviser reimbursed the Fund certain losses in the amount of $146,208.
6. Committed Line of Credit.
The Fund participates with other funds managed by the investment adviser or an affiliate in a $4.25 billion credit facility (the "line of credit") to be utilized for temporary or emergency purposes to fund shareholder redemptions or for other short-term liquidity purposes. The Fund has agreed to pay commitment fees on its pro-rata portion of the line of credit, which amounted to $2,248 and is reflected in Commitment fees on the Statement of Operations. During the period, the Fund did not borrow on this line of credit.
7. Security Lending.
The Fund lends portfolio securities through a lending agent from time to time in order to earn additional income. For equity securities, a lending agent is used and may loan securities to certain qualified borrowers, including Fidelity Capital Markets (FCM), a broker-dealer affiliated with the Fund. On the settlement date of the loan, the Fund receives collateral (in the form of U.S. Treasury obligations, letters of credit and/or cash) against the loaned securities and maintains collateral in an amount not less than 100% of the market value of the loaned securities during the period of the loan. The market value of the loaned securities is determined at the close of business of the Fund and any additional required collateral is delivered to the Fund on the next business day. The Fund or borrower may terminate the loan at any time, and if the borrower defaults on its obligation to return the securities loaned because of insolvency or other reasons, the Fund may apply collateral received from the borrower against the obligation. The Fund may experience delays and costs in recovering the securities loaned. Any cash collateral received is invested in the Fidelity Securities Lending Cash Central Fund. The value of loaned securities and cash collateral at period end are disclosed on the Fund's Statement of Assets and Liabilities. Security lending income represents the income earned on investing cash collateral, less rebates paid to borrowers and any lending agent fees associated with the loan, plus any premium payments received for lending certain types of securities. Security lending income is presented in the Statement of Operations as a component of income from Fidelity Central Funds. Total security lending income during the period amounted to $167,740. During the period, there were no securities loaned to FCM.
8. Other.
The Fund's organizational documents provide former and current trustees and officers with a limited indemnification against liabilities arising in connection with the performance of their duties to the Fund. In the normal course of business, the Fund may also enter into contracts that provide general indemnifications. The Fund's maximum exposure under these arrangements is unknown as this would be dependent on future claims that may be made against the Fund. The risk of material loss from such claims is considered remote.
At the end of the period, mutual funds managed by the investment adviser or its affiliates were the owners of record of all of the outstanding shares of the Fund.
Report of Independent Registered Public Accounting Firm
To the Board of Trustees of Fidelity Investment Trust and Shareholders of Fidelity Series Canada Fund:
Opinion on the Financial Statements
We have audited the accompanying statement of assets and liabilities, including the schedule of investments, of Fidelity Series Canada Fund (one of the funds constituting Fidelity Investment Trust, referred to hereafter as the "Fund") as of October 31, 2018, the related statement of operations for the year ended October 31, 2018 and the statement of changes in net assets and the financial highlights for the year ended October 31, 2018 and for the period August 15, 2017 (commencement of operations) through October 31, 2017, including the related notes (collectively referred to as the “financial statements”). In our opinion, the financial statements present fairly, in all material respects, the financial position of the Fund as of October 31, 2018, the results of its operations for the year ended October 31, 2018, the changes in its net assets and the financial highlights for the year ended October 31, 2018 and for the period August 15, 2017 (commencement of operations) through October 31, 2017 in conformity with accounting principles generally accepted in the United States of America.
Basis for Opinion
These financial statements are the responsibility of the Fund’s management. Our responsibility is to express an opinion on the Fund’s financial statements based on our audits. We are a public accounting firm registered with the Public Company Accounting Oversight Board (United States) (“PCAOB”) and are required to be independent with respect to the Fund in accordance with the U.S. federal securities laws and the applicable rules and regulations of the Securities and Exchange Commission and the PCAOB.
We conducted our audits of these financial statements in accordance with the standards of the PCAOB. Those standards require that we plan and perform the audit to obtain reasonable assurance about whether the financial statements are free of material misstatement, whether due to error or fraud.
Our audits included performing procedures to assess the risks of material misstatement of the financial statements, whether due to error or fraud, and performing procedures that respond to those risks. Such procedures included examining, on a test basis, evidence regarding the amounts and disclosures in the financial statements. Our audits also included evaluating the accounting principles used and significant estimates made by management, as well as evaluating the overall presentation of the financial statements. Our procedures included confirmation of securities owned as of October 31, 2018 by correspondence with the custodian and brokers; when replies were not received from brokers, we performed other auditing procedures. We believe that our audits provide a reasonable basis for our opinion.
PricewaterhouseCoopers LLP
Boston, Massachusetts
December 18, 2018
We have served as the auditor of one or more investment companies in the Fidelity group of funds since 1932.
Trustees and Officers
The Trustees, Members of the Advisory Board (if any), and officers of the trust and fund, as applicable, are listed below. The Board of Trustees governs the fund and is responsible for protecting the interests of shareholders. The Trustees are experienced executives who meet periodically throughout the year to oversee the fund's activities, review contractual arrangements with companies that provide services to the fund, oversee management of the risks associated with such activities and contractual arrangements, and review the fund's performance. Except for Jonathan Chiel, each of the Trustees oversees 283 funds. Mr. Chiel oversees 154 funds.
The Trustees hold office without limit in time except that (a) any Trustee may resign; (b) any Trustee may be removed by written instrument, signed by at least two-thirds of the number of Trustees prior to such removal; (c) any Trustee who requests to be retired or who has become incapacitated by illness or injury may be retired by written instrument signed by a majority of the other Trustees; and (d) any Trustee may be removed at any special meeting of shareholders by a two-thirds vote of the outstanding voting securities of the trust. Each Trustee who is not an interested person (as defined in the 1940 Act) of the trust and the fund is referred to herein as an Independent Trustee. Each Independent Trustee shall retire not later than the last day of the calendar year in which his or her 75th birthday occurs. The Independent Trustees may waive this mandatory retirement age policy with respect to individual Trustees. Officers and Advisory Board Members hold office without limit in time, except that any officer or Advisory Board Member may resign or may be removed by a vote of a majority of the Trustees at any regular meeting or any special meeting of the Trustees. Except as indicated, each individual has held the office shown or other offices in the same company for the past five years.
The fund’s Statement of Additional Information (SAI) includes more information about the Trustees. To request a free copy, call Fidelity at 1-800-544-8544.
Experience, Skills, Attributes, and Qualifications of the Trustees. The Governance and Nominating Committee has adopted a statement of policy that describes the experience, qualifications, attributes, and skills that are necessary and desirable for potential Independent Trustee candidates (Statement of Policy). The Board believes that each Trustee satisfied at the time he or she was initially elected or appointed a Trustee, and continues to satisfy, the standards contemplated by the Statement of Policy. The Governance and Nominating Committee also engages professional search firms to help identify potential Independent Trustee candidates who have the experience, qualifications, attributes, and skills consistent with the Statement of Policy. From time to time, additional criteria based on the composition and skills of the current Independent Trustees, as well as experience or skills that may be appropriate in light of future changes to board composition, business conditions, and regulatory or other developments, have also been considered by the professional search firms and the Governance and Nominating Committee. In addition, the Board takes into account the Trustees' commitment and participation in Board and committee meetings, as well as their leadership of standing and ad hoc committees throughout their tenure.
In determining that a particular Trustee was and continues to be qualified to serve as a Trustee, the Board has considered a variety of criteria, none of which, in isolation, was controlling. The Board believes that, collectively, the Trustees have balanced and diverse experience, qualifications, attributes, and skills, which allow the Board to operate effectively in governing the fund and protecting the interests of shareholders. Information about the specific experience, skills, attributes, and qualifications of each Trustee, which in each case led to the Board's conclusion that the Trustee should serve (or continue to serve) as a trustee of the fund, is provided below.
Board Structure and Oversight Function. James C. Curvey is an interested person and currently serves as Chairman. The Trustees have determined that an interested Chairman is appropriate and benefits shareholders because an interested Chairman has a personal and professional stake in the quality and continuity of services provided to the fund. Independent Trustees exercise their informed business judgment to appoint an individual of their choosing to serve as Chairman, regardless of whether the Trustee happens to be independent or a member of management. The Independent Trustees have determined that they can act independently and effectively without having an Independent Trustee serve as Chairman and that a key structural component for assuring that they are in a position to do so is for the Independent Trustees to constitute a substantial majority for the Board. The Independent Trustees also regularly meet in executive session. Ned C. Lautenbach serves as Chairman of the Independent Trustees and as such (i) acts as a liaison between the Independent Trustees and management with respect to matters important to the Independent Trustees and (ii) with management prepares agendas for Board meetings.
Fidelity® funds are overseen by different Boards of Trustees. The fund's Board oversees Fidelity's high income and certain equity funds, and other Boards oversee Fidelity's investment-grade bond, money market, asset allocation, and other equity funds. The asset allocation funds may invest in Fidelity® funds overseen by the fund's Board. The use of separate Boards, each with its own committee structure, allows the Trustees of each group of Fidelity® funds to focus on the unique issues of the funds they oversee, including common research, investment, and operational issues. On occasion, the separate Boards establish joint committees to address issues of overlapping consequences for the Fidelity® funds overseen by each Board.
The Trustees operate using a system of committees to facilitate the timely and efficient consideration of all matters of importance to the Trustees, the fund, and fund shareholders and to facilitate compliance with legal and regulatory requirements and oversight of the fund's activities and associated risks. The Board, acting through its committees, has charged FMR and its affiliates with (i) identifying events or circumstances the occurrence of which could have demonstrably adverse effects on the fund's business and/or reputation; (ii) implementing processes and controls to lessen the possibility that such events or circumstances occur or to mitigate the effects of such events or circumstances if they do occur; and (iii) creating and maintaining a system designed to evaluate continuously business and market conditions in order to facilitate the identification and implementation processes described in (i) and (ii) above. Because the day-to-day operations and activities of the fund are carried out by or through FMR, its affiliates, and other service providers, the fund's exposure to risks is mitigated but not eliminated by the processes overseen by the Trustees. While each of the Board's committees has responsibility for overseeing different aspects of the fund's activities, oversight is exercised primarily through the Operations, Audit, and Compliance Committees. In addition, the Independent Trustees have worked with Fidelity to enhance the Board's oversight of investment and financial risks, legal and regulatory risks, technology risks, and operational risks, including the development of additional risk reporting to the Board. Appropriate personnel, including but not limited to the fund's Chief Compliance Officer (CCO), FMR's internal auditor, the independent accountants, the fund's Treasurer and portfolio management personnel, make periodic reports to the Board's committees, as appropriate, including an annual review of Fidelity's risk management program for the Fidelity® funds. The responsibilities of each standing committee, including their oversight responsibilities, are described further under "Standing Committees of the Trustees."
Interested Trustees*:
Correspondence intended for a Trustee who is an interested person may be sent to Fidelity Investments, 245 Summer Street, Boston, Massachusetts 02210.
Name, Year of Birth; Principal Occupations and Other Relevant Experience+
Jonathan Chiel (1957)
Year of Election or Appointment: 2016
Trustee
Mr. Chiel also serves as Trustee of other Fidelity® funds. Mr. Chiel is Executive Vice President and General Counsel for FMR LLC (diversified financial services company, 2012-present). Previously, Mr. Chiel served as general counsel (2004-2012) and senior vice president and deputy general counsel (2000-2004) for John Hancock Financial Services; a partner with Choate, Hall & Stewart (1996-2000) (law firm); and an Assistant United States Attorney for the United States Attorney’s Office of the District of Massachusetts (1986-95), including Chief of the Criminal Division (1993-1995). Mr. Chiel is a director on the boards of the Boston Bar Foundation and the Maimonides School.
James C. Curvey (1935)
Year of Election or Appointment: 2007
Trustee
Chairman of the Board of Trustees
Mr. Curvey also serves as Trustee of other Fidelity® funds. Mr. Curvey is Vice Chairman (2007-present) and Director of FMR LLC (diversified financial services company). In addition, Mr. Curvey is an Overseer Emeritus for the Boston Symphony Orchestra, a Director of Artis-Naples, and a Trustee of Brewster Academy in Wolfeboro, New Hampshire. Previously, Mr. Curvey served as a Director of Fidelity Research & Analysis Co. (investment adviser firm, 2009-2018), Director of Fidelity Investments Money Management, Inc. (investment adviser firm, 2009-2014) and a Director of FMR and FMR Co., Inc. (investment adviser firms, 2007-2014).
Charles S. Morrison (1960)
Year of Election or Appointment: 2014
Trustee
Mr. Morrison also serves as Trustee of other funds. He serves as President of Fidelity SelectCo, LLC (investment adviser firm, 2017-present) and Fidelity Management & Research Company (FMR) (investment adviser firm, 2016-present), a Director of Fidelity Investments Money Management, Inc. (FIMM) (investment adviser firm, 2014-present), Director of Fidelity SelectCo, LLC (investment adviser firm, 2014-present), President, Asset Management (2014-present), and is an employee of Fidelity Investments. Previously, Mr. Morrison served as Vice President of Fidelity's Fixed Income and Asset Allocation Funds (2012-2014), President, Fixed Income (2011-2014), Vice President of Fidelity's Money Market Funds (2005-2009), President, Money Market Group Leader of FMR (investment adviser firm, 2009), and Senior Vice President, Money Market Group of FMR (2004-2009). Mr. Morrison also served as Vice President of Fidelity's Bond Funds (2002-2005), certain Balanced Funds (2002-2005), and certain Asset Allocation Funds (2002-2007), and as Senior Vice President (2002-2005) of Fidelity's Bond Division.
* Determined to be an “Interested Trustee” by virtue of, among other things, his or her affiliation with the trust or various entities under common control with FMR.
+ The information includes the Trustee's principal occupation during the last five years and other information relating to the experience, attributes, and skills relevant to the Trustee's qualifications to serve as a Trustee, which led to the conclusion that the Trustee should serve as a Trustee for the fund.
Independent Trustees:
Correspondence intended for an Independent Trustee may be sent to Fidelity Investments, P.O. Box 55235, Boston, Massachusetts 02205-5235.
Name, Year of Birth; Principal Occupations and Other Relevant Experience+
Dennis J. Dirks (1948)
Year of Election or Appointment: 2005
Trustee
Mr. Dirks also serves as Trustee of other Fidelity® funds. Prior to his retirement in May 2003, Mr. Dirks was Chief Operating Officer and a member of the Board of The Depository Trust & Clearing Corporation (DTCC). He also served as President, Chief Operating Officer, and Board member of The Depository Trust Company (DTC) and President and Board member of the National Securities Clearing Corporation (NSCC). In addition, Mr. Dirks served as Chief Executive Officer and Board member of the Government Securities Clearing Corporation, Chief Executive Officer and Board member of the Mortgage-Backed Securities Clearing Corporation, as a Trustee and a member of the Finance Committee of Manhattan College (2005-2008), as a Trustee and a member of the Finance Committee of AHRC of Nassau County (2006-2008), as a member of the Independent Directors Council (IDC) Governing Council (2010-2015), and as a member of the Board of Directors for The Brookville Center for Children’s Services, Inc. (2009-2017). Mr. Dirks is a member of the Finance Committee (2016-present), Board of Directors (2017-present) and Board of Trustees (2018-present) and is Treasurer (2018-present) of the Asolo Repertory Theatre.
Donald F. Donahue (1950)
Year of Election or Appointment: 2018
Trustee
Mr. Donahue also serves as a Trustee of other Fidelity® funds. Mr. Donahue is President and Chief Executive Officer of Miranda Partners, LLC (risk consulting for the financial services industry, 2012-present). Previously, Mr. Donahue served as a Member of the Advisory Board of certain Fidelity® funds (2015-2018) and Chief Executive Officer (2006-2012), Chief Operating Officer (2003-2006), and Managing Director, Customer Marketing and Development (1999-2003) of The Depository Trust & Clearing Corporation (financial markets infrastructure). Mr. Donahue serves as a Member (2007-present) and Co-Chairman (2016-present) of the Board of Directors of United Way of New York, Member of the Board of Directors of NYC Leadership Academy (2012-present) and Member of the Board of Advisors of Ripple Labs, Inc. (financial services, 2015-present). He also served as Chairman (2010-2012) and Member of the Board of Directors (2012-2013) of Omgeo, LLC (financial services), Treasurer of United Way of New York (2012-2016), and Member of the Board of Directors of XBRL US (financial services non-profit, 2009-2012) and the International Securities Services Association (2009-2012).
Alan J. Lacy (1953)
Year of Election or Appointment: 2008
Trustee
Mr. Lacy also serves as Trustee of other Fidelity® funds. Mr. Lacy serves as a Director of Bristol-Myers Squibb Company (global pharmaceuticals, 2008-present). He is a Trustee of the California Chapter of The Nature Conservancy (2015-present) and a Director of the Center for Advanced Study in the Behavioral Sciences at Stanford University (2015-present). In addition, Mr. Lacy served as Senior Adviser (2007-2014) of Oak Hill Capital Partners, L.P. (private equity) and also served as Chief Executive Officer (2005) and Vice Chairman (2005-2006) of Sears Holdings Corporation (retail) and Chief Executive Officer and Chairman of the Board of Sears, Roebuck and Co. (retail, 2000-2005). Previously, Mr. Lacy served as Chairman (2014-2017) and a member (2010-2017) of the Board of Directors of Dave & Buster’s Entertainment, Inc. (restaurant and entertainment complexes), as Chairman (2008-2011) and a member (2006-2015) of the Board of Trustees of the National Parks Conservation Association, and as a member of the Board of Directors for The Hillman Companies, Inc. (hardware wholesalers, 2010-2014), Earth Fare, Inc. (retail grocery, 2010-2014), and The Western Union Company (global money transfer, 2006-2011).
Ned C. Lautenbach (1944)
Year of Election or Appointment: 2000
Trustee
Chairman of the Independent Trustees
Mr. Lautenbach also serves as Trustee of other Fidelity® funds. Mr. Lautenbach currently serves as Vice Chair of the Board of Governors, State University System of Florida (2013-present) and is a member of the Council on Foreign Relations (1994-present). He is also a member and has most recently served as Chairman of the Board of Directors of Artis-Naples (2012-present). Previously, Mr. Lautenbach served as a member and then Lead Director of the Board of Directors of Eaton Corporation (diversified industrial, 1997-2016). He was also a Partner and Advisory Partner at Clayton, Dubilier & Rice, LLC (private equity investment, 1998-2010), as well as a Director of Sony Corporation (2006-2007). In addition, Mr. Lautenbach also had a 30-year career with IBM (technology company) during which time he served as Senior Vice President and a member of the Corporate Executive Committee (1968-1998).
Joseph Mauriello (1944)
Year of Election or Appointment: 2008
Trustee
Mr. Mauriello also serves as Trustee of other Fidelity® funds. Prior to his retirement in January 2006, Mr. Mauriello served in numerous senior management positions including Deputy Chairman and Chief Operating Officer (2004-2005), and Vice Chairman of Financial Services (2002-2004) of KPMG LLP US (professional services, 1965-2005). Mr. Mauriello currently serves as a member of the Independent Directors Council (IDC) Governing Council (2015-present). Previously, Mr. Mauriello served as a member of the Board of Directors of XL Group plc. (global insurance and re-insurance, 2006-2018).
Cornelia M. Small (1944)
Year of Election or Appointment: 2005
Trustee
Ms. Small also serves as Trustee of other Fidelity® funds. Ms. Small is a member of the Board of Directors (2009-present) and Chair of the Investment Committee (2010-present) of the Teagle Foundation. Ms. Small also serves on the Investment Committee of the Berkshire Taconic Community Foundation (2008-present). Previously, Ms. Small served as Chairperson (2002-2008) and a member of the Investment Committee and Chairperson (2008-2012) and a member of the Board of Trustees of Smith College. In addition, Ms. Small served as Chief Investment Officer, Director of Global Equity Investments, and a member of the Board of Directors of Scudder, Stevens & Clark and Scudder Kemper Investments.
Garnett A. Smith (1947)
Year of Election or Appointment: 2018
Trustee
Mr. Smith also serves as Trustee of other Fidelity® funds. Prior to Mr. Smith's retirement, he served as Chairman and Chief Executive Officer of Inbrand Corp. (manufacturer of personal absorbent products, 1990-1997). He also served as President (1986-1990) of Inbrand Corp. Prior to his employment with Inbrand Corp., he was employed by a retail fabric chain and North Carolina National Bank. In addition, Mr. Smith served as a Member of the Advisory Board of certain Fidelity® funds (2012-2013) and as a board member of the Jackson Hole Land Trust (2009-2012).
David M. Thomas (1949)
Year of Election or Appointment: 2008
Trustee
Mr. Thomas also serves as Trustee of other Fidelity® funds. Mr. Thomas serves as Non-Executive Chairman of the Board of Directors of Fortune Brands Home and Security (home and security products, 2011-present), as a member of the Board of Directors (2004-present) and Presiding Director (2013-present) of Interpublic Group of Companies, Inc. (marketing communication), and as a member of the Board of Trustees of the University of Florida (2013-present). Previously, Mr. Thomas served as Executive Chairman (2005-2006) and Chairman and Chief Executive Officer (2000-2005) of IMS Health, Inc. (pharmaceutical and healthcare information solutions), and a Director of Fortune Brands, Inc. (consumer products, 2000-2011).
+ The information includes the Trustee's principal occupation during the last five years and other information relating to the experience, attributes, and skills relevant to the Trustee's qualifications to serve as a Trustee, which led to the conclusion that the Trustee should serve as a Trustee for the fund.
Advisory Board Members and Officers:
Correspondence intended for a Member of the Advisory Board (if any) may be sent to Fidelity Investments, P.O. Box 55235, Boston, Massachusetts 02205-5235. Correspondence intended for an officer or Peter S. Lynch may be sent to Fidelity Investments, 245 Summer Street, Boston, Massachusetts 02210. Officers appear below in alphabetical order.
Name, Year of Birth; Principal Occupation
Vicki L. Fuller (1957)
Year of Election or Appointment: 2018
Member of the Advisory Board
Ms. Fuller also serves as Member of the Advisory Board of other Fidelity® funds. Ms. Fuller serves as a member of the Board of Directors, Audit Committee, and Nominating and Governance Committee of The Williams Companies, Inc. (natural gas infrastructure, 2018-present). Previously, Ms. Fuller served as the Chief Investment Officer of the New York State Common Retirement Fund (2012-2018) and held a variety of positions at AllianceBernstein L.P. (global asset management, 1985-2012), including Managing Director (2006-2012) and Senior Vice President and Senior Portfolio Manager (2001-2006).
Peter S. Lynch (1944)
Year of Election or Appointment: 2003
Member of the Advisory Board
Mr. Lynch also serves as Member of the Advisory Board of other Fidelity® funds. Mr. Lynch is Vice Chairman and a Director of FMR (investment adviser firm) and FMR Co., Inc. (investment adviser firm). In addition, Mr. Lynch serves as a Trustee of Boston College and as the Chairman of the Inner-City Scholarship Fund. Previously, Mr. Lynch served on the Special Olympics International Board of Directors (1997-2006).
William S. Stavropoulos (1939)
Year of Election or Appointment: 2018
Member of the Advisory Board
Mr. Stavropoulos also serves as Member of the Advisory Board of other Fidelity® funds. Mr. Stavropoulos serves as President and Founder of the Michigan Baseball Foundation, the Great Lakes Loons (2007-present). Mr. Stavropoulos is Chairman Emeritus of the Board of Directors of The Dow Chemical Company, where he previously served in numerous senior management positions, including President, CEO (1995-2000; 2002-2004), Chairman of the Executive Committee (2000-2006), and as a member of the Board of Directors (1990-2006). Currently, Mr. Stavropoulos is Chairman of the Board of Directors of Univar Inc. (global distributor of commodity and specialty chemicals), a Director of Teradata Corporation (data warehousing and technology solutions), and a member of the Advisory Board for Metalmark Capital LLC (private equity investment, 2005-present). Mr. Stavropoulos is an operating advisor to Clayton, Dubilier & Rice, LLC (private equity investment). In addition, Mr. Stavropoulos is a member of the University of Notre Dame Advisory Council for the College of Science, a Trustee of the Rollin L. Gerstacker Foundation, and a Director of Artis-Naples in Naples, Florida. Previously, Mr. Stavropoulos served as Trustee of certain Fidelity® funds (2001-2018) and as a Director of Chemical Financial Corporation (bank holding company, 1993-2012) and Tyco International, Ltd. (multinational manufacturing and services, 2007-2012).
Carol B. Tomé (1957)
Year of Election or Appointment: 2018
Member of the Advisory Board
Ms. Tomé also serves as Member of the Advisory Board of other Fidelity® funds. Ms. Tomé is Chief Financial Officer (2001-present) and Executive Vice President of Corporate Services (2007-present) of The Home Depot, Inc. (home improvement retailer) and a Director (2003-present) and Chair of the Audit Committee (2004-present) of United Parcel Service, Inc. (package delivery and supply chain management). Previously, Ms. Tomé served as Trustee of certain Fidelity® funds (2017), Senior Vice President of Finance and Accounting/Treasurer (2000-2007) and Vice President and Treasurer (1995-2000) of The Home Depot, Inc. and Chair of the Board (2010-2012), Vice Chair of the Board (2009 and 2013), and a Director (2008-2013) of the Federal Reserve Bank of Atlanta. Ms. Tomé is also a director or trustee of many community and professional organizations.
Michael E. Wiley (1950)
Year of Election or Appointment: 2018
Member of the Advisory Board
Mr. Wiley also serves as Trustee or Member of the Advisory Board of other Fidelity® funds. Mr. Wiley serves as a Director of High Point Resources (exploration and production, 2005-present). Previously, Mr. Wiley served as a Director of Andeavor Corporation (independent oil refiner and marketer, 2005-2018), a Director of Andeavor Logistics LP (natural resources logistics, 2015-2018), a Director of Post Oak Bank (privately-held bank, 2004-2018), a Director of Asia Pacific Exploration Consolidated (international oil and gas exploration and production, 2008-2013), a member of the Board of Trustees of the University of Tulsa (2000-2006; 2007-2010), a Senior Energy Advisor of Katzenbach Partners, LLC (consulting, 2006-2007), an Advisory Director of Riverstone Holdings (private investment), a Director of Spinnaker Exploration Company (exploration and production, 2001-2005) and Chairman, President, and CEO of Baker Hughes, Inc. (oilfield services, 2000-2004).
Elizabeth Paige Baumann (1968)
Year of Election or Appointment: 2017
Anti-Money Laundering (AML) Officer
Ms. Baumann also serves as AML Officer of other funds. She is Chief AML Officer (2012-present) and Senior Vice President (2014-present) of FMR LLC (diversified financial services company) and is an employee of Fidelity Investments. Previously, Ms. Baumann served as AML Officer of the funds (2012-2016), and Vice President (2007-2014) and Deputy Anti-Money Laundering Officer (2007-2012) of FMR LLC.
John J. Burke III (1964)
Year of Election or Appointment: 2018
Chief Financial Officer
Mr. Burke also serves as Chief Financial Officer of other funds. Mr. Burke serves as Head of Investment Operations for Fidelity Fund and Investment Operations (2018-present) and is an employee of Fidelity Investments (1998-present). Previously Mr. Burke served as head of Asset Management Investment Operations (2012-2018).
William C. Coffey (1969)
Year of Election or Appointment: 2018
Secretary and Chief Legal Officer (CLO)
Mr. Coffey also serves as Secretary and CLO of other funds. Mr. Coffey serves as CLO, Secretary, and Senior Vice President of Fidelity Management & Research Company and FMR Co., Inc. (investment adviser firms, 2018-present); Secretary of Fidelity SelectCo, LLC and Fidelity Investments Money Management, Inc. (investment adviser firms, 2018-present); and CLO of Fidelity Management & Research (Hong Kong) Limited, FMR Investment Management (UK) Limited, and Fidelity Management & Research (Japan) Limited (investment adviser firms, 2018-present). He is Senior Vice President and Deputy General Counsel of FMR LLC (diversified financial services company, 2010-present), and is an employee of Fidelity Investments. Previously, Mr. Coffey served as Assistant Secretary of certain funds (2009-2018) and as Vice President and Associate General Counsel of FMR LLC (2005-2009).
Timothy M. Cohen (1969)
Year of Election or Appointment: 2018
Vice President
Mr. Cohen also serves as Vice President of other funds. Mr. Cohen serves as Co-Head of Global Equity Research (2016-present), a Director of Fidelity Management & Research (Japan) Limited (investment adviser firm, 2016-present), and is an employee of Fidelity Investments. Previously, Mr. Cohen served as Chief Investment Officer - Equity and a Director of Fidelity Management & Research (U.K.) Inc. (investment adviser firm, 2013-2015) and as a Director of Fidelity Management & Research (Hong Kong) Limited (investment adviser firm, 2017).
Jonathan Davis (1968)
Year of Election or Appointment: 2010
Assistant Treasurer
Mr. Davis also serves as Assistant Treasurer of other funds. Mr. Davis serves as Assistant Treasurer of FMR Capital, Inc. (2017-present) and is an employee of Fidelity Investments. Previously, Mr. Davis served as Vice President and Associate General Counsel of FMR LLC (diversified financial services company, 2003-2010).
Adrien E. Deberghes (1967)
Year of Election or Appointment: 2016
Assistant Treasurer
Mr. Deberghes also serves as an officer of other funds. He serves as Assistant Treasurer of FMR Capital, Inc. (2017-present), Executive Vice President of Fidelity Investments Money Management, Inc. (FIMM) (investment adviser firm, 2016-present), and is an employee of Fidelity Investments (2008-present). Previously, Mr. Deberghes served as President and Treasurer of certain Fidelity® funds (2013-2018). Prior to joining Fidelity Investments, Mr. Deberghes was Senior Vice President of Mutual Fund Administration at State Street Corporation (2007-2008), Senior Director of Mutual Fund Administration at Investors Bank & Trust (2005-2007), and Director of Finance for Dunkin' Brands (2000-2005). Previously, Mr. Deberghes served in other fund officer roles.
Laura M. Del Prato (1964)
Year of Election or Appointment: 2018
Assistant Treasurer
Ms. Del Prato also serves as an officer of other funds. Ms. Del Prato is an employee of Fidelity Investments (2017-present). Prior to joining Fidelity Investments, Ms. Del Prato served as a Managing Director and Treasurer of the JPMorgan Mutual Funds (2014-2017). Prior to JPMorgan, Ms. Del Prato served as a partner at Cohen Fund Audit Services (accounting firm, 2012-2013) and KPMG LLP (accounting firm, 2004-2012).
Colm A. Hogan (1973)
Year of Election or Appointment: 2016
Deputy Treasurer
Mr. Hogan also serves as an officer of other funds. Mr. Hogan serves as Assistant Treasurer of FMR Capital, Inc. (2017-present) and is an employee of Fidelity Investments (2005-present). Previously, Mr. Hogan served as Assistant Treasurer of certain Fidelity® funds (2016-2018).
Pamela R. Holding (1964)
Year of Election or Appointment: 2018
Vice President
Ms. Holding also serves as Vice President of other funds. Ms. Holding serves as Co-Head of Global Equity Research (2018-present) and is an employee of Fidelity Investments (2013-present).
Chris Maher (1972)
Year of Election or Appointment: 2013
Assistant Treasurer
Mr. Maher serves as Assistant Treasurer of other funds. Mr. Maher is Vice President of Valuation Oversight, serves as Assistant Treasurer of FMR Capital, Inc. (2017-present), and is an employee of Fidelity Investments. Previously, Mr. Maher served as Vice President of Asset Management Compliance (2013), Vice President of the Program Management Group of FMR (investment adviser firm, 2010-2013), and Vice President of Valuation Oversight (2008-2010).
Rieco E. Mello (1969)
Year of Election or Appointment: 2017
Assistant Treasurer
Mr. Mello also serves as Assistant Treasurer of other funds. Mr. Mello serves as Assistant Treasurer of FMR Capital, Inc. (2017-present) and is an employee of Fidelity Investments (1995-present).
Kenneth B. Robins (1969)
Year of Election or Appointment: 2016
Chief Compliance Officer
Mr. Robins also serves as an officer of other funds. Mr. Robins serves as Compliance Officer of Fidelity Management & Research Company and FMR Co., Inc. (investment adviser firms, 2016-present) and is an employee of Fidelity Investments (2004-present). Previously, Mr. Robins served as Executive Vice President of Fidelity Investments Money Management, Inc. (investment adviser firm, 2013-2016) and served in other fund officer roles.
Stacie M. Smith (1974)
Year of Election or Appointment: 2016
President and Treasurer
Ms. Smith also serves as an officer of other funds. Ms. Smith serves as Assistant Treasurer of FMR Capital, Inc. (2017-present), is an employee of Fidelity Investments (2009-present), and has served in other fund officer roles. Prior to joining Fidelity Investments, Ms. Smith served as Senior Audit Manager of Ernst & Young LLP (accounting firm, 1996-2009). Previously, Ms. Smith served as Assistant Treasurer (2013-2018) and Deputy Treasurer (2013-2016) of certain Fidelity® funds.
Marc L. Spector (1972)
Year of Election or Appointment: 2016
Assistant Treasurer
Mr. Spector also serves as an officer of other funds. Mr. Spector serves as Assistant Treasurer of FMR Capital, Inc. (2017-present) and is an employee of Fidelity Investments (2016-present). Prior to joining Fidelity Investments, Mr. Spector served as Director at the Siegfried Group (accounting firm, 2013-2016), and prior to Siegfried Group as audit senior manager at Deloitte & Touche (accounting firm, 2005-2013).
Shareholder Expense Example
As a shareholder of the Fund, you incur two types of costs: (1) transaction costs and (2) ongoing costs, including other Fund expenses. This Example is intended to help you understand your ongoing costs (in dollars) of investing in the Fund and to compare these costs with the ongoing costs of investing in other mutual funds.
The Example is based on an investment of $1,000 invested at the beginning of the period and held for the entire period (May 1, 2018 to October 31, 2018).
Actual Expenses
The first line of the accompanying table provides information about actual account values and actual expenses. You may use the information in this line, together with the amount you invested, to estimate the expenses that you paid over the period. Simply divide your account value by $1,000.00 (for example, an $8,600 account value divided by $1,000.00 = 8.6), then multiply the result by the number in the first line under the heading entitled "Expenses Paid During Period" to estimate the expenses you paid on your account during this period. In addition, the Fund, as a shareholder in the underlying Fidelity Central Funds, will indirectly bear its pro-rata share of the fees and expenses incurred by the underlying Fidelity Central Funds. These fees and expenses are not included in the Fund's annualized expense ratio used to calculate the expense estimate in the table below.
Hypothetical Example for Comparison Purposes
The second line of the accompanying table provides information about hypothetical account values and hypothetical expenses based on the Fund's actual expense ratio and an assumed rate of return of 5% per year before expenses, which is not the Fund's actual return. The hypothetical account values and expenses may not be used to estimate the actual ending account balance or expenses you paid for the period. You may use this information to compare the ongoing costs of investing in the Fund and other funds. To do so, compare this 5% hypothetical example with the 5% hypothetical examples that appear in the shareholder reports of the other funds. In addition, the Fund, as a shareholder in the underlying Fidelity Central Funds, will indirectly bear its pro-rata share of the fees and expenses incurred by the underlying Fidelity Central Funds. These fees and expenses are not included in the Fund's annualized expense ratio used to calculate the expense estimate in the table below.
Please note that the expenses shown in the table are meant to highlight your ongoing costs only and do not reflect any transaction costs. Therefore, the second line of the table is useful in comparing ongoing costs only, and will not help you determine the relative total costs of owning different funds.
| | Annualized Expense Ratio-A | Beginning
Account Value
May 1, 2018 | Ending
Account Value
October 31, 2018 | Expenses Paid
During Period-B
May 1, 2018
to October 31, 2018 |
| Actual | - %-C | $1,000.00 | $957.80 | $--D |
| Hypothetical-E | | $1,000.00 | $1,025.21 | $--D |
A Annualized expense ratio reflects expenses net of applicable fee waivers.
B Expenses are equal to the Fund's annualized expense ratio, multiplied by the average account value over the period, multiplied by 184/365 to reflect the one-half year period).
C Amount represents less than .005%.
D Amount represents less than $.005.
E 5% return per year before expenses.
Distributions (Unaudited)
The fund designates 78% of the dividend distributed during the fiscal year as amounts which may be taken into account as a dividend for the purposes of the maximum rate under section 1(h)(11) of the Internal Revenue Code.
The fund will notify shareholders in January 2019 of amounts for use in preparing 2018 income tax returns.
Board Approval of Investment Advisory Contracts
Fidelity Series Canada Fund
At its July 2018 meeting, the Board of Trustees, including the Independent Trustees (together, the Board), voted to continue the management contract with Fidelity Management & Research Company (FMR) and the sub-advisory agreements (together, the Advisory Contracts) for the fund for six months through January 31, 2019, in connection with the reunification of the Fidelity Equity High Income Funds Board, which oversees the fund, and the Sector Portfolios Board.
The Board considered that the approval of the fund's Advisory Contracts will not result in any changes in (i) the investment process or strategies employed in the management of the fund's assets; (ii) the fees and expenses paid by shareholders, including the expense cap arrangement currently in place for the fund; (iii) the nature, extent or quality of services provided under the fund's Advisory Contracts; or (iv) the day-to-day management of the fund or the persons primarily responsible for such management. The Board concluded that the fund's Advisory Contracts are fair and reasonable, and that the fund's Advisory Contracts should be renewed, without modification, through January 31, 2019, with the understanding that the Board will consider the annual renewal for a full one year period in January 2019.
In connection with its consideration of future renewals of the fund's Advisory Contracts, the Board will consider: (i) the nature, extent and quality of services provided to the fund, including shareholder and administrative services and investment performance; (ii) the competitiveness of the management fee and total expenses for the fund; (iii) the costs of the services and profitability, including the revenues earned and the expenses incurred in conducting the business of developing, marketing, distributing, managing, administering, and servicing the fund and its shareholders, to the extent applicable, as well as potential fall-out benefits from Fidelity's non-fund businesses; and (iv) whether there have been economies of scale in respect of the Fidelity funds, whether the Fidelity funds (including the fund) have appropriately benefited from any such economies of scale, and whether there is the potential for realization of any further economies.
Based on its evaluation of all of the conclusions noted above, and after considering all factors it believed relevant, the Board ultimately concluded that the fund's management fee structure is fair and reasonable, and that the continuation of the fund's Advisory Contracts should be approved.
Corporate Headquarters
245 Summer St.
Boston, MA 02210
www.fidelity.com
SAD-ANN-1218
1.9883882.101
Item 2.
Code of Ethics
As of the end of the period, October 31, 2018, Fidelity Investment Trust (the trust) has adopted a code of ethics, as defined in Item 2 of Form N-CSR, that applies to its President and Treasurer and its Chief Financial Officer. A copy of the code of ethics is filed as an exhibit to this Form N-CSR.
Item 3.
Audit Committee Financial Expert
The Board of Trustees of the trust has determined that Joseph Mauriello is an audit committee financial expert, as defined in Item 3 of Form N-CSR. Mr. Mauriello is independent for purposes of Item 3 of Form N-CSR.
Item 4.
Principal Accountant Fees and Services
Fees and Services
The following table presents fees billed by Deloitte & Touche LLP, the member firms of Deloitte Touche Tohmatsu, and their respective affiliates (collectively, “Deloitte Entities”) in each of the last two fiscal years for services rendered to Fidelity Diversified International K6 Fund, Fidelity Emerging Europe, Middle East, Africa (EMEA) Fund, Fidelity Flex International Fund, Fidelity Global Equity Income Fund, Fidelity International Capital Appreciation K6 Fund, Fidelity International Small Cap Fund, Fidelity International Small Cap Opportunities Fund, Fidelity International Value Fund, Fidelity Series Emerging Markets Fund, Fidelity Series Emerging Markets Opportunities Fund, Fidelity Series International Small Cap Fund, Fidelity Series International Value Fund and Fidelity Total International Equity Fund (the “Funds”):
Services Billed by Deloitte Entities
October 31, 2018 FeesA,B
| | | | |
| Audit Fees | Audit-Related Fees | Tax Fees | All Other Fees |
| | | | |
Fidelity Diversified International K6 Fund | $55,000 | $100 | $7,100 | $1,500 |
Fidelity Emerging Europe, Middle East, Africa (EMEA) Fund | $52,000 | $100 | $6,200 | $1,500 |
Fidelity Flex International Fund | $55,000 | $100 | $7,100 | $1,600 |
Fidelity Global Equity Income Fund | $48,000 | $100 | $6,000 | $1,400 |
Fidelity International Capital Appreciation K6 Fund | $54,000 | $100 | $7,100 | $1,500 |
Fidelity International Small Cap Fund | $59,000 | $100 | $7,100 | $1,700 |
Fidelity International Small Cap Opportunities Fund | $53,000 | $100 | $6,000 | $1,500 |
Fidelity International Value Fund | $51,000 | $100 | $6,000 | $1,500 |
Fidelity Series Emerging Markets Fund | $33,000 | $- | $7,100 | $200 |
Fidelity Series Emerging Markets Opportunities Fund | $47,000 | $100 | $7,400 | $1,400 |
Fidelity Series International Small Cap Fund | $46,000 | $100 | $6,000 | $1,300 |
Fidelity Series International Value Fund | $45,000 | $100 | $6,000 | $1,300 |
Fidelity Total International Equity Fund | $67,000 | $100 | $6,900 | $1,700 |
October 31, 2017 FeesA,B,C
| | | | |
| Audit Fees | Audit-Related Fees | Tax Fees | All Other Fees |
Fidelity Diversified International K6 Fund | $47,000 | $- | $7,200 | $600 |
Fidelity Emerging Europe, Middle East, Africa (EMEA) Fund | $52,000 | $100 | $6,300 | $1,500 |
Fidelity Flex International Fund | $47,000 | $100 | $7,000 | $800 |
Fidelity Global Equity Income Fund | $48,000 | $100 | $6,100 | $1,400 |
Fidelity International Capital Appreciation K6 Fund | $46,000 | $- | $7,200 | $600 |
Fidelity International Small Cap Fund | $59,000 | $100 | $7,200 | $1,700 |
Fidelity International Small Cap Opportunities Fund | $53,000 | $100 | $6,100 | $1,500 |
Fidelity International Value Fund | $51,000 | $100 | $6,100 | $1,400 |
Fidelity Series Emerging Markets Fund | $- | $- | $- | $- |
| | | | |
Fidelity Series Emerging Markets Opportunities Fund | $45,000 | $100 | $7,500 | $1,300 |
Fidelity Series International Small Cap Fund | $47,000 | $100 | $6,100 | $1,300 |
Fidelity Series International Value Fund | $47,000 | $100 | $6,100 | $1,300 |
Fidelity Total International Equity Fund | $65,000 | $100 | $7,000 | $1,800 |
A Amounts may reflect rounding.
B Fidelity Series Emerging Markets Fund commenced operations on August 29, 2018.
C Fidelity Flex International Fund commenced operations on March 7, 2017 and Fidelity Diversified International K6 Fund and Fidelity International Capital Appreciation K6 Fund commenced operations on May 25, 2017.
The following table presents fees billed by PricewaterhouseCoopers LLP (“PwC”) in each of the last two fiscal years for services rendered to Fidelity Emerging Markets Discovery Fund, Fidelity Global Commodity Stock Fund, Fidelity International Discovery Fund, Fidelity International Growth Fund, Fidelity Series Canada Fund, Fidelity Series International Growth Fund and Fidelity Total Emerging Markets Fund (the “Funds”):
Services Billed by PwC
October 31, 2018 FeesA
| | | | |
| Audit Fees | Audit-Related Fees | Tax Fees | All Other Fees |
Fidelity Emerging Markets Discovery Fund | $54,000 | $4,800 | $5,200 | $2,400 |
Fidelity Global Commodity Stock Fund | $41,000 | $3,600 | $2,600 | $1,800 |
Fidelity International Discovery Fund | $73,000 | $6,300 | $5,400 | $3,100 |
Fidelity International Growth Fund | $57,000 | $5,000 | $5,200 | $2,500 |
Fidelity Series Canada Fund | $44,000 | $4,000 | $5,200 | $2,000 |
Fidelity Series International Growth Fund | $46,000 | $4,200 | $5,200 | $2,100 |
Fidelity Total Emerging Markets Fund | $61,000 | $5,300 | $4,400 | $2,600 |
| | | | |
| Audit Fees | Audit-Related Fees | Tax Fees | All Other Fees |
Fidelity Emerging Markets Discovery Fund | $54,000 | $5,200 | $5,500 | $2,500 |
Fidelity Global Commodity Stock Fund | $41,000 | $3,900 | $3,000 | $1,800 |
Fidelity International Discovery Fund | $75,000 | $6,800 | $8,100 | $3,300 |
Fidelity International Growth Fund | $56,000 | $5,400 | $5,500 | $2,600 |
Fidelity Series Canada Fund | $44,000 | $700 | $5,500 | $300 |
Fidelity Series International Growth Fund | $47,000 | $4,600 | $5,500 | $2,200 |
Fidelity Total Emerging Markets Fund | $61,000 | $5,800 | $4,600 | $2,800 |
A Amounts may reflect rounding.
B Fidelity Series Canada Fund commenced operations on August 15, 2017.
The following table presents fees billed by PwC and Deloitte Entities that were required to be approved by the Audit Committee for services that relate directly to the operations and financial reporting of the Funds and that are rendered on behalf of Fidelity Management & Research Company (“FMR”) and entities controlling, controlled by, or under common control with FMR (not including any sub-adviser whose role is primarily portfolio management and is subcontracted with or overseen by another investment adviser) that provide ongoing services to the Funds (“Fund Service Providers”):
Services Billed by Deloitte Entities
| | |
| October 31, 2018A,B | October 31, 2017A,B,C |
Audit-Related Fees | $290,000 | $- |
Tax Fees | $5,000 | $25,000 |
All Other Fees | $- | $- |
A Amounts may reflect rounding.
B May include amounts billed prior to the Fidelity Series Emerging Markets Fund’s commencement of operations.
C May include amounts billed prior to the Fidelity Flex International Fund, Fidelity Diversified International K6 Fund and Fidelity International Capital Appreciation K6 Funds’ commencement of operations.
Services Billed by PwC
| | |
| October 31, 2018A | October 31, 2017A,B |
Audit-Related Fees | $7,745,000 | $12,525,000 |
Tax Fees | $20,000 | $155,000 |
All Other Fees | $- | $- |
A Amounts may reflect rounding.
B May include amounts billed prior to the Fidelity Series Canada Fund’s commencement of operations.
“Audit-Related Fees” represent fees billed for assurance and related services that are reasonably related to the performance of the fund audit or the review of the fund's financial statements and that are not reported under Audit Fees.
“Tax Fees” represent fees billed for tax compliance, tax advice or tax planning that relate directly to the operations and financial reporting of the fund.
“All Other Fees” represent fees billed for services provided to the fund or Fund Service Provider, a significant portion of which are assurance related, that relate directly to the operations and financial reporting of the fund, excluding those services that are reported under Audit Fees, Audit-Related Fees or Tax Fees.
Assurance services must be performed by an independent public accountant.
* * *
The aggregate non-audit fees billed by PwC and Deloitte Entities for services rendered to the Funds, FMR (not including any sub-adviser whose role is primarily portfolio management and is subcontracted with or overseen by another investment adviser), and any Fund Service Provider for each of the last two fiscal years of the Funds are as follows:
| | |
Billed By | October 31, 2018A.B | October 31, 2017A,B,C,D |
Deloitte Entities | $860,000 | $625,000 |
PwC | $10,845,000 | $15,350,000 |
A Amounts may reflect rounding.
B May include amounts billed prior to the Fidelity Series Emerging Markets Fund’s commencement of operations.
C May include amounts billed prior to the Fidelity Flex International Fund, Fidelity Diversified International K6 Fund and Fidelity International Capital Appreciation K6 Funds’ commencement of operations.
D May include amounts billed prior to the Fidelity Series Canada Fund’s commencement of operations.
The trust's Audit Committee has considered non-audit services that were not pre-approved that were provided by PwC and Deloitte Entities to Fund Service Providers to be compatible with maintaining the independence of PwC and Deloitte Entities in their audits of the Funds, taking into account representations from PwC and Deloitte Entities, in accordance with Public Company Accounting Oversight Board rules, regarding their independence from the Funds and their related entities and FMR’s review of the appropriateness and permissibility under applicable law of such non-audit services prior to their provision to the Fund Service Providers.
Audit Committee Pre-Approval Policies and Procedures
The trust’s Audit Committee must pre-approve all audit and non-audit services provided by a fund’s independent registered public accounting firm relating to the operations or financial reporting of the fund. Prior to the commencement of any audit or non-audit services to a fund, the Audit Committee reviews the services to determine whether they are appropriate and permissible under applicable law.
The Audit Committee has adopted policies and procedures to, among other purposes, provide a framework for the Committee’s consideration of non-audit services by the audit firms that audit the Fidelity funds. The policies and procedures require that any non-audit service provided by a fund audit firm to a Fidelity fund and any non-audit service provided by a fund auditor to a Fund Service Provider that relates directly to the operations and financial reporting of a Fidelity fund (“Covered Service”) are subject to approval by the Audit Committee before such service is provided.
All Covered Services must be approved in advance of provision of the service either: (i) by formal resolution of the Audit Committee, or (ii) by oral or written approval of the service by the Chair of the Audit Committee (or if the Chair is unavailable, such other member of the Audit Committee as may be designated by the Chair to act in the Chair’s absence). The approval contemplated by (ii) above is permitted where the Treasurer determines that action on such an engagement is necessary before the next meeting of the Audit Committee.
Non-audit services provided by a fund audit firm to a Fund Service Provider that do not relate directly to the operations and financial reporting of a Fidelity fund are reported to the Audit Committee periodically.
Non-Audit Services Approved Pursuant to Rule 2-01(c)(7)(i)(C) and (ii) of Regulation S-X (“De Minimis Exception”)
There were no non-audit services approved or required to be approved by the Audit Committee pursuant to the De Minimis Exception during the Funds’ last two fiscal years relating to services provided to (i) the Funds or (ii) any Fund Service Provider that relate directly to the operations and financial reporting of the Funds.
Item 5.
Audit Committee of Listed Registrants
Not applicable.
Item 6.
Investments
(a)
Not applicable.
(b)
Not applicable
Item 7.
Disclosure of Proxy Voting Policies and Procedures for Closed-End Management Investment Companies
Not applicable.
Item 8.
Portfolio Managers of Closed-End Management Investment Companies
Not applicable.
Item 9.
Purchase of Equity Securities by Closed-End Management Investment Company and Affiliated Purchasers
Not applicable.
Item 10.
Submission of Matters to a Vote of Security Holders
There were no material changes to the procedures by which shareholders may recommend nominees to the trust’s Board of Trustees.
Item 11.
Controls and Procedures
(a)(i) The President and Treasurer and the Chief Financial Officer have concluded that the trust’s disclosure controls and procedures (as defined in Rule 30a-3(c) under the Investment Company Act) provide reasonable assurances that material information
relating to the trust is made known to them by the appropriate persons, based on their evaluation of these controls and procedures as of a date within 90 days of the filing date of this report.
(a)(ii) There was no change in the trust’s internal control over financial reporting (as defined in Rule 30a-3(d) under the Investment Company Act) that occurred during the period covered by this report that has materially affected, or is reasonably likely to materially affect, the trust’s internal control over financial reporting.
Item 12.
Disclosure of Securities Lending Activities for Closed-End Management
Investment Companies
Not applicable.
Item 13.
Exhibits
| | |
(a) | (1) | Code of Ethics pursuant to Item 2 of Form N-CSR is filed and attached hereto as EX-99.CODE ETH. |
(a) | (2) | Certification pursuant to Rule 30a-2(a) under the Investment Company Act of 1940 (17 CFR 270.30a-2(a)) is filed and attached hereto as Exhibit 99.CERT. |
(a) | (3) | Not applicable. |
(b) | | Certification pursuant to Rule 30a-2(b) under the Investment Company Act of 1940 (17 CFR 270.30a-2(b)) is furnished and attached hereto as Exhibit 99.906CERT. |
SIGNATURES
Pursuant to the requirements of the Securities Exchange Act of 1934 and the Investment Company Act of 1940, the registrant has duly caused this report to be signed on its behalf by the undersigned, thereunto duly authorized.
Fidelity Investment Trust
| |
By: | /s/Stacie M. Smith |
| Stacie M. Smith |
| President and Treasurer |
| |
Date: | December 26, 2018 |
Pursuant to the requirements of the Securities Exchange Act of 1934 and the Investment Company Act of 1940, this report has been signed below by the following persons on behalf of the registrant and in the capacities and on the dates indicated.
| |
By: | /s/Stacie M. Smith |
| Stacie M. Smith |
| President and Treasurer |
| |
Date: | December 26, 2018 |
| |
By: | /s/John J. Burke III |
| John J. Burke III |
| Chief Financial Officer |
| |
Date: | December 26, 2018 |