UNITED STATES
SECURITIES AND EXCHANGE COMMISSION
Washington, D.C. 20549
FORM N-CSR
CERTIFIED SHAREHOLDER REPORT OF REGISTERED
MANAGEMENT INVESTMENT COMPANIES
Investment Company Act file number 811-4008
Fidelity Investment Trust
(Exact name of registrant as specified in charter)
245 Summer St., Boston, Massachusetts 02210
(Address of principal executive offices) (Zip code)
Marc Bryant, Secretary
245 Summer St.
Boston, Massachusetts 02210
(Name and address of agent for service)
Registrant's telephone number, including area code:
617-563-7000
| |
Date of fiscal year end: | October 31 |
| |
Date of reporting period: | October 31, 2017 |
This report on Form N-CSR relates solely to the Registrant’s Fidelity Canada Fund, Fidelity China Region Fund, Fidelity Emerging Asia Fund, Fidelity Emerging Markets Fund, Fidelity Europe Fund, Fidelity Japan Fund, Fidelity Japan Smaller Companies Fund, Fidelity Latin America Fund, Fidelity Nordic Fund and Fidelity Pacific Basin Fund (each, a “Fund” and collectively, the “Funds”).
Item 1.
Reports to Stockholders
Fidelity Advisor® Canada Fund - Class A, Class M (formerly Class T), Class C and Class I
Annual Report October 31, 2017 Class A, Class M, Class C and Class I are classes of Fidelity® Canada Fund |
 |
Contents
To view a fund's proxy voting guidelines and proxy voting record for the 12-month period ended June 30, visit http://www.fidelity.com/proxyvotingresults or visit the Securities and Exchange Commission's (SEC) web site at http://www.sec.gov.
You may also call 1-877-208-0098 to request a free copy of the proxy voting guidelines.
Standard & Poor's, S&P and S&P 500 are registered service marks of The McGraw-Hill Companies, Inc. and have been licensed for use by Fidelity Distributors Corporation.
Other third-party marks appearing herein are the property of their respective owners.
All other marks appearing herein are registered or unregistered trademarks or service marks of FMR LLC or an affiliated company. © 2017 FMR LLC. All rights reserved.
This report and the financial statements contained herein are submitted for the general information of the shareholders of the Fund. This report is not authorized for distribution to prospective investors in the Fund unless preceded or accompanied by an effective prospectus.
A fund files its complete schedule of portfolio holdings with the SEC for the first and third quarters of each fiscal year on Form N-Q. Forms N-Q are available on the SEC’s web site at http://www.sec.gov. A fund's Forms N-Q may be reviewed and copied at the SEC’s Public Reference Room in Washington, DC. Information regarding the operation of the SEC's Public Reference Room may be obtained by calling 1-800-SEC-0330.
For a complete list of a fund's portfolio holdings, view the most recent holdings listing, semiannual report, or annual report on Fidelity's web site at http://www.fidelity.com, http://www.institutional.fidelity.com, or http://www.401k.com, as applicable.
NOT FDIC INSURED •MAY LOSE VALUE •NO BANK GUARANTEE
Neither the Fund nor Fidelity Distributors Corporation is a bank.
Performance: The Bottom Line
Average annual total return reflects the change in the value of an investment, assuming reinvestment of distributions from dividend income and capital gains (the profits earned upon the sale of securities that have grown in value, if any) and assuming a constant rate of performance each year. The hypothetical investment and the average annual total returns do not reflect the deduction of taxes that a shareholder would pay on fund distributions or the redemption of fund shares. During periods of reimbursement by Fidelity, a fund’s total return will be greater than it would be had the reimbursement not occurred. How a fund did yesterday is no guarantee of how it will do tomorrow.
Average Annual Total Returns
| For the periods ended October 31, 2017 | Past 1 year | Past 5 years | Past 10 years |
| Class A (incl. 5.75% sales charge) | 7.42% | 2.57% | (0.46)% |
| Class M (incl. 3.50% sales charge) | 9.67% | 2.76% | (0.51)% |
| Class C (incl. contingent deferred sales charge) | 12.16% | 3.04% | (0.61)% |
| Class I | 14.38% | 4.13% | 0.44% |
Class C shares' contingent deferred sales charges included in the past one year, past five years and past ten years total return figures are 1%, 0% and 0%, respectively.
$10,000 Over 10 Years
Let's say hypothetically that $10,000 was invested in Fidelity Advisor® Canada Fund - Class A on October 31, 2007, and the current 5.75% sales charge was paid.
The chart shows how the value of your investment would have changed, and also shows how the S&P/TSX Composite Index performed over the same period.
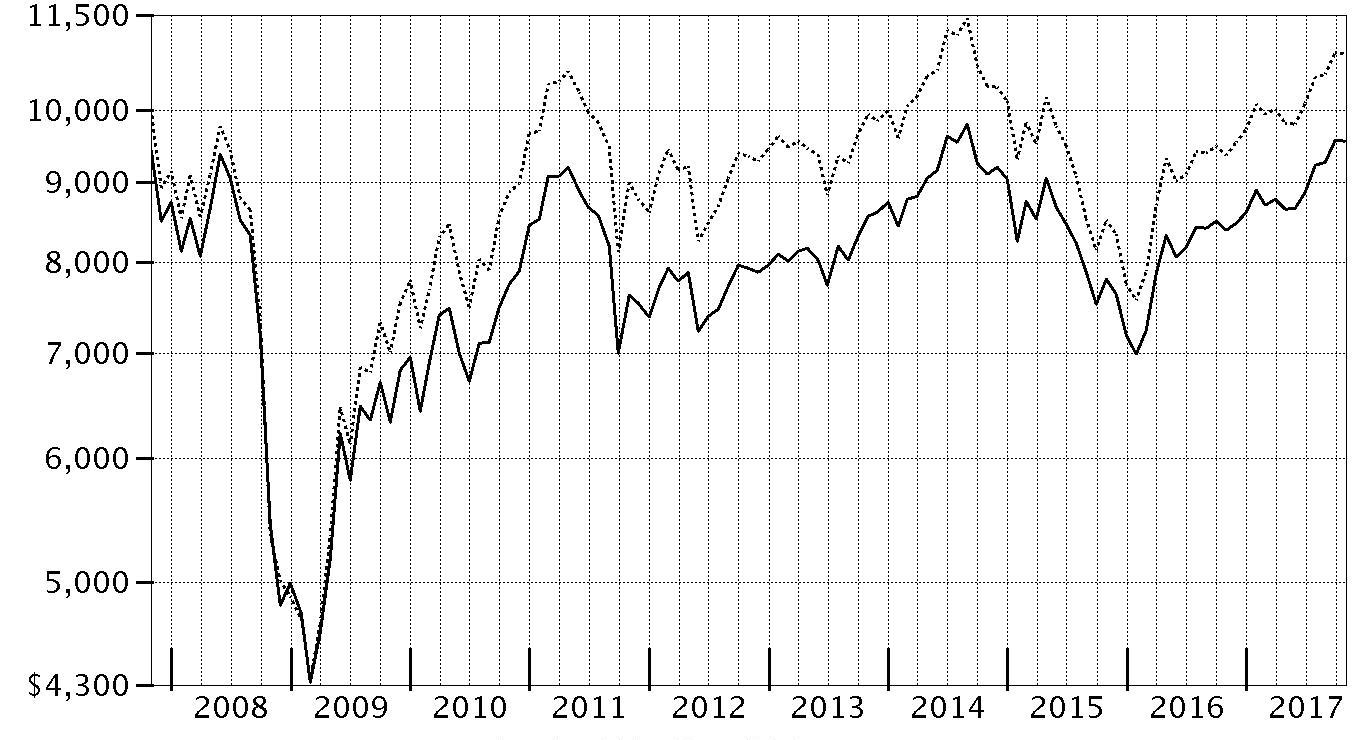
| Period Ending Values |
| $9,554 | Fidelity Advisor® Canada Fund - Class A |
| $10,849 | S&P/TSX Composite Index |
Management's Discussion of Fund Performance
Market Recap: The MSCI ACWI (All Country World Index) ex USA Index returned 23.85% for the 12 months ending October 31, 2017, helped partly by a generally weak U.S. dollar. Some favorable election results in continental Europe (+30%) suggested ebbing political uncertainty and near-term risk there, but the U.K. (+20%) faced more-mixed conditions ahead of its expected exit from the European Union. Despite central-bank easing – and pressured recently by yen strength – Japan (+18%) lagged the rest of the Asia-Pacific group (+22%). Commodity-price volatility slowed Canada (+17%), but the emerging-markets group (+26%) sped ahead. Sector-wise, information technology (+47%) was driven by a surge among several Chinese internet-related names. Financials (+27%) rode rising interest rates that, at the same time, weighed on real estate (+17%), utilities (+16%), consumer staples (+14%) and telecommunication services (+9%) – so-called “bond proxy” sectors. Materials (+28%) and industrials (+27%) responded to demand from China and price gains for certain commodities. In the energy sector (+20%), oil prices lost ground in the spring before rebounding through October 31 to end well above where they started 12 months ago. Lastly, health care (+14%) was hurt by early-period turmoil around drug pricing and health care legislation.
Comments from Portfolio Manager Risteard Hogan: For the fiscal year ending October 31, 2017, the fund’s share classes (excluding sales charges, if applicable) gained about 13% to 14%, lagging the 15.90% return of the benchmark S&P/TSX Composite Index. My more conservative investment approach, which emphasizes companies with what I consider solid fundamentals and long-term growth prospects, held back the fund’s performance versus the benchmark. An overweighting in consumer staples, most notably a position in convenience-store operator Alimentation Couche-Tard, detracted most. Investors became increasingly concerned about Couche-Tard’s June 2016 acquisition of U.S.-based CST Brands and any potential synergies from that purchase. The fund’s most significant relative detractor, though, was untimely positioning in insurer Manulife Financial. I had chosen to emphasize competitor Sun Life Financial earlier in the period, which rose in valuation, but not as much as Manulife. I sold Sun Life in February to take profits and redeployed assets to build an overweighting in Manulife, believing in the firm's further potential upside. It turned out, though, that Manulife already delivered its strongest results for the period, and the fund had missed out. Conversely, stock picking in materials benefited our relative results, led by the fund’s top individual relative contributor: copper, nickel and zinc miner Lundin Mining, which was aided by strength in base-metal prices, especially copper.
The views expressed above reflect those of the portfolio manager(s) only through the end of the period as stated on the cover of this report and do not necessarily represent the views of Fidelity or any other person in the Fidelity organization. Any such views are subject to change at any time based upon market or other conditions and Fidelity disclaims any responsibility to update such views. These views may not be relied on as investment advice and, because investment decisions for a Fidelity fund are based on numerous factors, may not be relied on as an indication of trading intent on behalf of any Fidelity fund.
Investment Summary (Unaudited)
Geographic Diversification (% of fund's net assets)
| As of October 31, 2017 |
| | Canada | 95.3% |
| | United States of America* | 3.0% |
| | Bailiwick of Jersey | 0.7% |
| | Ireland | 0.5% |
| | United Kingdom | 0.5% |

* Includes Short-Term investments and Net Other Assets (Liabilities).
Percentages are based on country or territory of incorporation and are adjusted for the effect of futures contracts, if applicable.
| As of April 30, 2017 |
| | Canada | 93.4% |
| | United States of America* | 3.3% |
| | Bailiwick of Jersey | 0.8% |
| | United Kingdom | 0.7% |
| | Germany | 0.6% |
| | France | 0.6% |
| | Ireland | 0.6% |

* Includes Short-Term investments and Net Other Assets (Liabilities).
Percentages are based on country or territory of incorporation and are adjusted for the effect of futures contracts, if applicable.
Asset Allocation as of October 31, 2017
| | % of fund's net assets | % of fund's net assets 6 months ago |
| Stocks | 97.4 | 97.1 |
| Short-Term Investments and Net Other Assets (Liabilities) | 2.6 | 2.9 |
Top Ten Stocks as of October 31, 2017
| | % of fund's net assets | % of fund's net assets 6 months ago |
| The Toronto-Dominion Bank (Banks) | 9.7 | 8.9 |
| Royal Bank of Canada (Banks) | 9.7 | 9.9 |
| Suncor Energy, Inc. (Oil, Gas & Consumable Fuels) | 6.2 | 5.9 |
| Manulife Financial Corp. (Insurance) | 4.1 | 3.6 |
| Canadian Pacific Railway Ltd. (Road & Rail) | 3.6 | 3.1 |
| Rogers Communications, Inc. Class B (non-vtg.) (Wireless Telecommunication Services) | 3.3 | 3.7 |
| Canadian National Railway Co. (Road & Rail) | 3.3 | 3.1 |
| Agrium, Inc. (Chemicals) | 3.1 | 2.5 |
| TELUS Corp. (Diversified Telecommunication Services) | 3.1 | 2.8 |
| Enbridge, Inc. (Oil, Gas & Consumable Fuels) | 3.0 | 4.3 |
| | 49.1 | |
Top Market Sectors as of October 31, 2017
| | % of fund's net assets | % of fund's net assets 6 months ago |
| Financials | 32.9 | 31.0 |
| Energy | 18.7 | 19.6 |
| Materials | 12.7 | 13.0 |
| Industrials | 9.1 | 8.5 |
| Consumer Staples | 7.5 | 8.1 |
| Telecommunication Services | 6.4 | 6.5 |
| Information Technology | 4.7 | 4.6 |
| Consumer Discretionary | 3.5 | 3.6 |
| Real Estate | 0.8 | 0.9 |
| Utilities | 0.7 | 0.7 |
Market Sectors may include more than one industry category.
The Fund may invest up to 35% of its total assets in any industry that represents more than 20% of the Canadian market. As of October 31, 2017, the Fund did not have more than 25% of its total assets invested in any one industry.
Investments October 31, 2017
Showing Percentage of Net Assets
| Common Stocks - 97.4% | | | |
| | | Shares | Value |
| CONSUMER DISCRETIONARY - 3.5% | | | |
| Diversified Consumer Services - 0.1% | | | |
| Park Lawn Corp. | | 44,000 | $678,707 |
| Hotels, Restaurants & Leisure - 0.4% | | | |
| Cara Operations Ltd. | | 222,000 | 4,544,624 |
| Leisure Products - 0.4% | | | |
| BRP, Inc. | | 157,000 | 5,276,738 |
| Media - 1.9% | | | |
| Cogeco Communications, Inc. | | 120,300 | 8,648,806 |
| Corus Entertainment, Inc. Class B (non-vtg.) | | 351,400 | 3,260,412 |
| Quebecor, Inc. Class B (sub. vtg.) | | 294,900 | 11,127,612 |
| | | | 23,036,830 |
| Specialty Retail - 0.5% | | | |
| AutoCanada, Inc. (a) | | 81,500 | 1,472,572 |
| Sleep Country Canada Holdings, Inc. | | 155,600 | 4,615,776 |
| | | | 6,088,348 |
| Textiles, Apparel & Luxury Goods - 0.2% | | | |
| ERO Copper Corp. | | 779,000 | 3,091,605 |
|
| TOTAL CONSUMER DISCRETIONARY | | | 42,716,852 |
|
| CONSUMER STAPLES - 7.5% | | | |
| Food & Staples Retailing - 7.0% | | | |
| Alimentation Couche-Tard, Inc. Class B (sub. vtg.) | | 715,700 | 33,557,626 |
| George Weston Ltd. | | 270,700 | 22,728,644 |
| Jean Coutu Group, Inc. Class A (sub. vtg.) | | 395,700 | 7,508,516 |
| Metro, Inc. Class A (sub. vtg.) | | 375,295 | 11,813,604 |
| North West Co., Inc. | | 405,300 | 9,889,810 |
| | | | 85,498,200 |
| Tobacco - 0.5% | | | |
| Imperial Tobacco Group PLC | | 149,313 | 6,089,110 |
|
| TOTAL CONSUMER STAPLES | | | 91,587,310 |
|
| ENERGY - 18.7% | | | |
| Energy Equipment & Services - 1.3% | | | |
| Canadian Energy Services & Technology Corp. | | 1,643,800 | 8,855,445 |
| ShawCor Ltd. Class A | | 308,900 | 6,694,709 |
| | | | 15,550,154 |
| Oil, Gas & Consumable Fuels - 17.4% | | | |
| ARC Resources Ltd. | | 662,400 | 8,076,546 |
| Canadian Natural Resources Ltd. | | 788,398 | 27,512,346 |
| Cenovus Energy, Inc. | | 1,497,400 | 14,531,779 |
| Enbridge, Inc. | | 957,000 | 36,778,591 |
| Imperial Oil Ltd. | | 242,800 | 7,872,509 |
| NuVista Energy Ltd. (b) | | 1,036,200 | 6,441,612 |
| Peyto Exploration & Development Corp. (a) | | 397,800 | 5,426,928 |
| PrairieSky Royalty Ltd. (a) | | 940,118 | 25,024,147 |
| Raging River Exploration, Inc. (b) | | 932,200 | 5,498,831 |
| Suncor Energy, Inc. | | 2,252,300 | 76,467,514 |
| | | | 213,630,803 |
|
| TOTAL ENERGY | | | 229,180,957 |
|
| FINANCIALS - 32.9% | | | |
| Banks - 21.6% | | | |
| Bank of Nova Scotia | | 422,900 | 27,299,521 |
| Royal Bank of Canada | | 1,514,700 | 118,430,966 |
| The Toronto-Dominion Bank | | 2,096,700 | 119,193,848 |
| | | | 264,924,335 |
| Capital Markets - 3.3% | | | |
| Brookfield Asset Management, Inc. Class A | | 330,900 | 13,881,333 |
| CI Financial Corp. | | 555,000 | 12,338,113 |
| Fairfax India Holdings Corp. (b) | | 102,000 | 1,731,960 |
| Gluskin Sheff + Associates, Inc. | | 104,900 | 1,312,368 |
| TMX Group Ltd. | | 208,000 | 11,364,948 |
| | | | 40,628,722 |
| Insurance - 8.0% | | | |
| Intact Financial Corp. | | 196,425 | 16,055,357 |
| Manulife Financial Corp. | | 2,499,400 | 50,255,357 |
| Power Corp. of Canada (sub. vtg.) | | 1,230,200 | 31,544,079 |
| | | | 97,854,793 |
|
| TOTAL FINANCIALS | | | 403,407,850 |
|
| HEALTH CARE - 0.4% | | | |
| Biotechnology - 0.4% | | | |
| Amgen, Inc. | | 31,500 | 5,519,430 |
| INDUSTRIALS - 9.1% | | | |
| Professional Services - 0.8% | | | |
| Stantec, Inc. | | 339,000 | 9,685,714 |
| Road & Rail - 7.5% | | | |
| Canadian National Railway Co. | | 507,400 | 40,828,768 |
| Canadian Pacific Railway Ltd. | | 250,500 | 43,432,168 |
| TransForce, Inc. | | 320,600 | 7,738,535 |
| | | | 91,999,471 |
| Trading Companies & Distributors - 0.8% | | | |
| Toromont Industries Ltd. | | 216,700 | 9,552,538 |
|
| TOTAL INDUSTRIALS | | | 111,237,723 |
|
| INFORMATION TECHNOLOGY - 4.7% | | | |
| IT Services - 2.0% | | | |
| CGI Group, Inc. Class A (sub. vtg.) (b) | | 468,000 | 24,867,375 |
| Software - 2.7% | | | |
| Constellation Software, Inc. | | 30,300 | 17,238,659 |
| Open Text Corp. | | 457,528 | 15,998,053 |
| | | | 33,236,712 |
|
| TOTAL INFORMATION TECHNOLOGY | | | 58,104,087 |
|
| MATERIALS - 12.7% | | | |
| Chemicals - 3.4% | | | |
| Agrium, Inc. | | 344,700 | 37,526,637 |
| Methanex Corp. | | 73,300 | 3,572,104 |
| | | | 41,098,741 |
| Construction Materials - 0.5% | | | |
| CRH PLC | | 169,400 | 6,374,854 |
| Containers & Packaging - 1.0% | | | |
| CCL Industries, Inc. Class B | | 265,900 | 12,815,799 |
| Metals & Mining - 7.0% | | | |
| Agnico Eagle Mines Ltd. (Canada) | | 305,500 | 13,639,873 |
| Barrick Gold Corp. | | 454,700 | 6,569,729 |
| Detour Gold Corp. (b) | | 45,300 | 482,811 |
| Franco-Nevada Corp. | | 274,500 | 21,813,611 |
| Lundin Mining Corp. | | 1,739,600 | 13,268,478 |
| Premier Gold Mines Ltd. (b) | | 1,631,800 | 4,338,481 |
| Randgold Resources Ltd. | | 92,064 | 9,046,925 |
| Torex Gold Resources, Inc. (b) | | 276,270 | 3,809,661 |
| Wheaton Precious Metals Corp. | | 601,900 | 12,489,623 |
| | | | 85,459,192 |
| Paper & Forest Products - 0.8% | | | |
| Western Forest Products, Inc. | | 4,756,900 | 9,660,552 |
|
| TOTAL MATERIALS | | | 155,409,138 |
|
| REAL ESTATE - 0.8% | | | |
| Equity Real Estate Investment Trusts (REITs) - 0.8% | | | |
| Allied Properties (REIT) | | 308,500 | 9,885,583 |
| TELECOMMUNICATION SERVICES - 6.4% | | | |
| Diversified Telecommunication Services - 3.1% | | | |
| TELUS Corp. | | 1,034,300 | 37,456,396 |
| Wireless Telecommunication Services - 3.3% | | | |
| Rogers Communications, Inc. Class B (non-vtg.) | | 788,800 | 40,928,821 |
|
| TOTAL TELECOMMUNICATION SERVICES | | | 78,385,217 |
|
| UTILITIES - 0.7% | | | |
| Electric Utilities - 0.7% | | | |
| Hydro One Ltd. | | 495,600 | 8,762,604 |
| TOTAL COMMON STOCKS | | | |
| (Cost $840,299,904) | | | 1,194,196,751 |
|
| Money Market Funds - 4.1% | | | |
| Fidelity Cash Central Fund, 1.10% (c) | | 28,350,091 | 28,355,761 |
| Fidelity Securities Lending Cash Central Fund 1.11% (c)(d) | | 21,558,076 | 21,560,232 |
| TOTAL MONEY MARKET FUNDS | | | |
| (Cost $49,915,993) | | | 49,915,993 |
| TOTAL INVESTMENT IN SECURITIES - 101.5% | | | |
| (Cost $890,215,897) | | | 1,244,112,744 |
| NET OTHER ASSETS (LIABILITIES) - (1.5)% | | | (18,879,072) |
| NET ASSETS - 100% | | | $1,225,233,672 |
Legend
(a) Security or a portion of the security is on loan at period end.
(b) Non-income producing
(c) Affiliated fund that is generally available only to investment companies and other accounts managed by Fidelity Investments. The rate quoted is the annualized seven-day yield of the fund at period end. A complete unaudited listing of the fund's holdings as of its most recent quarter end is available upon request. In addition, each Fidelity Central Fund's financial statements, which are not covered by the Fund's Report of Independent Registered Public Accounting Firm, are available on the SEC's website or upon request.
(d) Investment made with cash collateral received from securities on loan.
Affiliated Central Funds
Information regarding fiscal year to date income earned by the Fund from investments in Fidelity Central Funds is as follows:
| Fund | Income earned |
| Fidelity Cash Central Fund | $246,412 |
| Fidelity Securities Lending Cash Central Fund | 641,086 |
| Total | $887,498 |
Investment Valuation
The following is a summary of the inputs used, as of October 31, 2017, involving the Fund's assets and liabilities carried at fair value. The inputs or methodology used for valuing securities may not be an indication of the risk associated with investing in those securities. For more information on valuation inputs, and their aggregation into the levels used below, please refer to the Investment Valuation section in the accompanying Notes to Financial Statements.
| | Valuation Inputs at Reporting Date: |
| Description | Total | Level 1 | Level 2 | Level 3 |
| Investments in Securities: | | | | |
| Equities: | | | | |
| Consumer Discretionary | $42,716,852 | $42,716,852 | $-- | $-- |
| Consumer Staples | 91,587,310 | 91,587,310 | -- | -- |
| Energy | 229,180,957 | 229,180,957 | -- | -- |
| Financials | 403,407,850 | 403,407,850 | -- | -- |
| Health Care | 5,519,430 | 5,519,430 | -- | -- |
| Industrials | 111,237,723 | 111,237,723 | -- | -- |
| Information Technology | 58,104,087 | 58,104,087 | -- | -- |
| Materials | 155,409,138 | 139,987,359 | 15,421,779 | -- |
| Real Estate | 9,885,583 | 9,885,583 | -- | -- |
| Telecommunication Services | 78,385,217 | 78,385,217 | -- | -- |
| Utilities | 8,762,604 | 8,762,604 | -- | -- |
| Money Market Funds | 49,915,993 | 49,915,993 | -- | -- |
| Total Investments in Securities: | $1,244,112,744 | $1,228,690,965 | $15,421,779 | $-- |
See accompanying notes which are an integral part of the financial statements.
Financial Statements
Statement of Assets and Liabilities
| | | October 31, 2017 |
| Assets | | |
Investment in securities, at value (including securities loaned of $20,327,440) — See accompanying schedule:
Unaffiliated issuers (cost $840,299,904) | $1,194,196,751 | |
| Fidelity Central Funds (cost $49,915,993) | 49,915,993 | |
| Total Investment in Securities (cost $890,215,897) | | $1,244,112,744 |
| Foreign currency held at value (cost $848,874) | | 848,874 |
| Receivable for investments sold | | 3,078,869 |
| Receivable for fund shares sold | | 1,453,857 |
| Dividends receivable | | 1,432,929 |
| Distributions receivable from Fidelity Central Funds | | 34,125 |
| Prepaid expenses | | 2,971 |
| Other receivables | | 18,556 |
| Total assets | | 1,250,982,925 |
| Liabilities | | |
| Payable for investments purchased | $602,941 | |
| Payable for fund shares redeemed | 2,474,545 | |
| Accrued management fee | 750,639 | |
| Distribution and service plan fees payable | 25,849 | |
| Other affiliated payables | 270,258 | |
| Other payables and accrued expenses | 67,249 | |
| Collateral on securities loaned | 21,557,772 | |
| Total liabilities | | 25,749,253 |
| Net Assets | | $1,225,233,672 |
| Net Assets consist of: | | |
| Paid in capital | | $855,795,706 |
| Undistributed net investment income | | 13,463,474 |
| Accumulated undistributed net realized gain (loss) on investments and foreign currency transactions | | 2,087,258 |
| Net unrealized appreciation (depreciation) on investments and assets and liabilities in foreign currencies | | 353,887,234 |
| Net Assets | | $1,225,233,672 |
| Calculation of Maximum Offering Price | | |
| Class A: | | |
| Net Asset Value and redemption price per share ($37,556,754 ÷ 694,094 shares) | | $54.11 |
| Maximum offering price per share (100/94.25 of $54.11) | | $57.41 |
| Class M: | | |
| Net Asset Value and redemption price per share ($10,355,815 ÷ 192,605 shares) | | $53.77 |
| Maximum offering price per share (100/96.50 of $53.77) | | $55.72 |
| Class C: | | |
| Net Asset Value and offering price per share ($15,937,951 ÷ 302,330 shares)(a) | | $52.72 |
| Canada: | | |
| Net Asset Value, offering price and redemption price per share ($1,130,802,507 ÷ 20,783,469 shares) | | $54.41 |
| Class I: | | |
| Net Asset Value, offering price and redemption price per share ($30,580,645 ÷ 563,294 shares) | | $54.29 |
(a) Redemption price per share is equal to net asset value less any applicable contingent deferred sales charge.
See accompanying notes which are an integral part of the financial statements.
Statement of Operations
| | | Year ended October 31, 2017 |
| Investment Income | | |
| Dividends | | $34,811,602 |
| Income from Fidelity Central Funds | | 887,498 |
| Income before foreign taxes withheld | | 35,699,100 |
| Less foreign taxes withheld | | (5,108,976) |
| Total income | | 30,590,124 |
| Expenses | | |
| Management fee | | |
| Basic fee | $9,178,955 | |
| Performance adjustment | 698,108 | |
| Transfer agent fees | 2,811,788 | |
| Distribution and service plan fees | 328,967 | |
| Accounting and security lending fees | 606,213 | |
| Custodian fees and expenses | 21,527 | |
| Independent trustees' fees and expenses | 5,317 | |
| Registration fees | 78,523 | |
| Audit | 77,648 | |
| Legal | 4,549 | |
| Miscellaneous | 11,407 | |
| Total expenses before reductions | 13,823,002 | |
| Expense reductions | (52,679) | 13,770,323 |
| Net investment income (loss) | | 16,819,801 |
| Realized and Unrealized Gain (Loss) | | |
| Net realized gain (loss) on: | | |
| Investment securities: | | |
| Unaffiliated issuers | 52,759,350 | |
| Fidelity Central Funds | 6,750 | |
| Foreign currency transactions | 172,359 | |
| Total net realized gain (loss) | | 52,938,459 |
| Change in net unrealized appreciation (depreciation) on: | | |
| Investment securities: | | |
| Unaffiliated issuers | 106,010,225 | |
| Fidelity Central Funds | (8,858) | |
| Assets and liabilities in foreign currencies | (5,883) | |
| Total change in net unrealized appreciation (depreciation) | | 105,995,484 |
| Net gain (loss) | | 158,933,943 |
| Net increase (decrease) in net assets resulting from operations | | $175,753,744 |
See accompanying notes which are an integral part of the financial statements.
Statement of Changes in Net Assets
| | Year ended October 31, 2017 | Year ended October 31, 2016 |
| Increase (Decrease) in Net Assets | | |
| Operations | | |
| Net investment income (loss) | $16,819,801 | $17,076,194 |
| Net realized gain (loss) | 52,938,459 | (32,588,329) |
| Change in net unrealized appreciation (depreciation) | 105,995,484 | 98,530,458 |
| Net increase (decrease) in net assets resulting from operations | 175,753,744 | 83,018,323 |
| Distributions to shareholders from net investment income | (16,443,381) | (17,462,078) |
| Distributions to shareholders from net realized gain | (5,168,976) | (1,771,774) |
| Total distributions | (21,612,357) | (19,233,852) |
| Share transactions - net increase (decrease) | (276,985,730) | (105,554,211) |
| Redemption fees | 38,887 | 81,286 |
| Total increase (decrease) in net assets | (122,805,456) | (41,688,454) |
| Net Assets | | |
| Beginning of period | 1,348,039,128 | 1,389,727,582 |
| End of period | $1,225,233,672 | $1,348,039,128 |
| Other Information | | |
| Undistributed net investment income end of period | $13,463,474 | $13,430,443 |
See accompanying notes which are an integral part of the financial statements.
Financial Highlights
Fidelity Canada Fund Class A
| Years ended October 31, | 2017 | 2016 | 2015 | 2014 | 2013 |
| Selected Per–Share Data | | | | | |
| Net asset value, beginning of period | $48.09 | $45.25 | $60.56 | $57.31 | $53.65 |
| Income from Investment Operations | | | | | |
| Net investment income (loss)A | .50 | .48 | .45 | .47 | .60 |
| Net realized and unrealized gain (loss) | 6.16 | 2.84 | (8.04) | 3.13 | 3.63 |
| Total from investment operations | 6.66 | 3.32 | (7.59) | 3.60 | 4.23 |
| Distributions from net investment income | (.45) | (.42) | (.50) | (.03) | (.57) |
| Distributions from net realized gain | (.19) | (.06) | (7.22) | (.32) | – |
| Total distributions | (.64) | (.48) | (7.72) | (.35) | (.57) |
| Redemption fees added to paid in capitalA,B | – | – | – | – | – |
| Net asset value, end of period | $54.11 | $48.09 | $45.25 | $60.56 | $57.31 |
| Total ReturnC,D | 13.98% | 7.45% | (14.32)% | 6.32% | 7.98% |
| Ratios to Average Net AssetsE,F | | | | | |
| Expenses before reductions | 1.34% | 1.48% | 1.43% | 1.29% | 1.19% |
| Expenses net of fee waivers, if any | 1.34% | 1.48% | 1.43% | 1.29% | 1.19% |
| Expenses net of all reductions | 1.34% | 1.48% | 1.43% | 1.29% | 1.18% |
| Net investment income (loss) | .98% | 1.06% | .90% | .79% | 1.11% |
| Supplemental Data | | | | | |
| Net assets, end of period (000 omitted) | $37,557 | $44,144 | $58,286 | $95,004 | $116,661 |
| Portfolio turnover rateG | 26% | 44% | 24% | 85% | 64% |
A Calculated based on average shares outstanding during the period.
B Amount represents less than $.005 per share.
C Total returns would have been lower if certain expenses had not been reduced during the applicable periods shown.
D Total returns do not include the effect of the sales charges.
E Fees and expenses of any underlying Fidelity Central Funds are not included in the Fund's expense ratio. The Fund indirectly bears its proportionate share of the expenses of any underlying Fidelity Central Funds.
F Expense ratios reflect operating expenses of the class. Expenses before reductions do not reflect amounts reimbursed by the investment adviser or reductions from brokerage service arrangements or reductions from other expense offset arrangements and do not represent the amount paid by the class during periods when reimbursements or reductions occur. Expenses net of fee waivers reflect expenses after reimbursement by the investment adviser but prior to reductions from brokerage service arrangements or other expense offset arrangements. Expenses net of all reductions represent the net expenses paid by the class.
G Amount does not include the portfolio activity of any underlying Fidelity Central Funds.
See accompanying notes which are an integral part of the financial statements.
Fidelity Canada Fund Class M
| Years ended October 31, | 2017 | 2016 | 2015 | 2014 | 2013 |
| Selected Per–Share Data | | | | | |
| Net asset value, beginning of period | $47.82 | $44.99 | $60.22 | $57.14 | $53.48 |
| Income from Investment Operations | | | | | |
| Net investment income (loss)A | .35 | .35 | .29 | .29 | .45 |
| Net realized and unrealized gain (loss) | 6.13 | 2.83 | (8.00) | 3.11 | 3.63 |
| Total from investment operations | 6.48 | 3.18 | (7.71) | 3.40 | 4.08 |
| Distributions from net investment income | (.34) | (.29) | (.30) | – | (.42) |
| Distributions from net realized gain | (.19) | (.06) | (7.22) | (.32) | – |
| Total distributions | (.53) | (.35) | (7.52) | (.32) | (.42) |
| Redemption fees added to paid in capitalA,B | – | – | – | – | – |
| Net asset value, end of period | $53.77 | $47.82 | $44.99 | $60.22 | $57.14 |
| Total ReturnC,D | 13.64% | 7.14% | (14.58)% | 5.99% | 7.69% |
| Ratios to Average Net AssetsE,F | | | | | |
| Expenses before reductions | 1.63% | 1.77% | 1.75% | 1.59% | 1.47% |
| Expenses net of fee waivers, if any | 1.63% | 1.77% | 1.75% | 1.59% | 1.47% |
| Expenses net of all reductions | 1.63% | 1.77% | 1.75% | 1.59% | 1.46% |
| Net investment income (loss) | .69% | .78% | .58% | .48% | .83% |
| Supplemental Data | | | | | |
| Net assets, end of period (000 omitted) | $10,356 | $11,140 | $12,820 | $21,989 | $23,751 |
| Portfolio turnover rateG | 26% | 44% | 24% | 85% | 64% |
A Calculated based on average shares outstanding during the period.
B Amount represents less than $.005 per share.
C Total returns would have been lower if certain expenses had not been reduced during the applicable periods shown.
D Total returns do not include the effect of the sales charges.
E Fees and expenses of any underlying Fidelity Central Funds are not included in the Fund's expense ratio. The Fund indirectly bears its proportionate share of the expenses of any underlying Fidelity Central Funds.
F Expense ratios reflect operating expenses of the class. Expenses before reductions do not reflect amounts reimbursed by the investment adviser or reductions from brokerage service arrangements or reductions from other expense offset arrangements and do not represent the amount paid by the class during periods when reimbursements or reductions occur. Expenses net of fee waivers reflect expenses after reimbursement by the investment adviser but prior to reductions from brokerage service arrangements or other expense offset arrangements. Expenses net of all reductions represent the net expenses paid by the class.
G Amount does not include the portfolio activity of any underlying Fidelity Central Funds.
See accompanying notes which are an integral part of the financial statements.
Fidelity Canada Fund Class C
| Years ended October 31, | 2017 | 2016 | 2015 | 2014 | 2013 |
| Selected Per–Share Data | | | | | |
| Net asset value, beginning of period | $46.87 | $44.02 | $59.04 | $56.27 | $52.61 |
| Income from Investment Operations | | | | | |
| Net investment income (loss)A | .13 | .15 | .07 | .02 | .20 |
| Net realized and unrealized gain (loss) | 6.01 | 2.78 | (7.85) | 3.07 | 3.58 |
| Total from investment operations | 6.14 | 2.93 | (7.78) | 3.09 | 3.78 |
| Distributions from net investment income | (.11) | (.02) | (.02) | – | (.12) |
| Distributions from net realized gain | (.19) | (.06) | (7.22) | (.32) | – |
| Total distributions | (.29)B | (.08) | (7.24) | (.32) | (.12) |
| Redemption fees added to paid in capitalA,C | – | – | – | – | – |
| Net asset value, end of period | $52.72 | $46.87 | $44.02 | $59.04 | $56.27 |
| Total ReturnD,E | 13.16% | 6.67% | (14.96)% | 5.53% | 7.21% |
| Ratios to Average Net AssetsF,G | | | | | |
| Expenses before reductions | 2.06% | 2.21% | 2.19% | 2.03% | 1.93% |
| Expenses net of fee waivers, if any | 2.06% | 2.21% | 2.19% | 2.03% | 1.92% |
| Expenses net of all reductions | 2.06% | 2.21% | 2.18% | 2.03% | 1.92% |
| Net investment income (loss) | .26% | .33% | .14% | .04% | .37% |
| Supplemental Data | | | | | |
| Net assets, end of period (000 omitted) | $15,938 | $18,489 | $21,610 | $38,749 | $46,040 |
| Portfolio turnover rateH | 26% | 44% | 24% | 85% | 64% |
A Calculated based on average shares outstanding during the period.
B Total distributions of $.29 per share is comprised of distributions from net investment income of $.105 and distributions from net realized gain of $.188 per share.
C Amount represents less than $.005 per share.
D Total returns would have been lower if certain expenses had not been reduced during the applicable periods shown.
E Total returns do not include the effect of the contingent deferred sales charge.
F Fees and expenses of any underlying Fidelity Central Funds are not included in the Fund's expense ratio. The Fund indirectly bears its proportionate share of the expenses of any underlying Fidelity Central Funds.
G Expense ratios reflect operating expenses of the class. Expenses before reductions do not reflect amounts reimbursed by the investment adviser or reductions from brokerage service arrangements or reductions from other expense offset arrangements and do not represent the amount paid by the class during periods when reimbursements or reductions occur. Expenses net of fee waivers reflect expenses after reimbursement by the investment adviser but prior to reductions from brokerage service arrangements or other expense offset arrangements. Expenses net of all reductions represent the net expenses paid by the class.
H Amount does not include the portfolio activity of any underlying Fidelity Central Funds.
See accompanying notes which are an integral part of the financial statements.
Fidelity Canada Fund
| Years ended October 31, | 2017 | 2016 | 2015 | 2014 | 2013 |
| Selected Per–Share Data | | | | | |
| Net asset value, beginning of period | $48.35 | $45.55 | $60.95 | $57.72 | $54.05 |
| Income from Investment Operations | | | | | |
| Net investment income (loss)A | .66 | .62 | .60 | .66 | .77 |
| Net realized and unrealized gain (loss) | 6.20 | 2.85 | (8.09) | 3.13 | 3.66 |
| Total from investment operations | 6.86 | 3.47 | (7.49) | 3.79 | 4.43 |
| Distributions from net investment income | (.61) | (.61) | (.69) | (.24) | (.76) |
| Distributions from net realized gain | (.19) | (.06) | (7.22) | (.32) | – |
| Total distributions | (.80) | (.67) | (7.91) | (.56) | (.76) |
| Redemption fees added to paid in capitalA,B | – | – | – | – | – |
| Net asset value, end of period | $54.41 | $48.35 | $45.55 | $60.95 | $57.72 |
| Total ReturnC | 14.35% | 7.79% | (14.08)% | 6.64% | 8.32% |
| Ratios to Average Net AssetsD,E | | | | | |
| Expenses before reductions | 1.02% | 1.17% | 1.15% | .98% | .87% |
| Expenses net of fee waivers, if any | 1.02% | 1.17% | 1.15% | .98% | .87% |
| Expenses net of all reductions | 1.02% | 1.17% | 1.14% | .98% | .86% |
| Net investment income (loss) | 1.30% | 1.37% | 1.18% | 1.09% | 1.42% |
| Supplemental Data | | | | | |
| Net assets, end of period (000 omitted) | $1,130,803 | $1,233,050 | $1,279,488 | $2,057,843 | $2,262,380 |
| Portfolio turnover rateF | 26% | 44% | 24% | 85% | 64% |
A Calculated based on average shares outstanding during the period.
B Amount represents less than $.005 per share.
C Total returns would have been lower if certain expenses had not been reduced during the applicable periods shown.
D Fees and expenses of any underlying Fidelity Central Funds are not included in the Fund's expense ratio. The Fund indirectly bears its proportionate share of the expenses of any underlying Fidelity Central Funds.
E Expense ratios reflect operating expenses of the class. Expenses before reductions do not reflect amounts reimbursed by the investment adviser or reductions from brokerage service arrangements or reductions from other expense offset arrangements and do not represent the amount paid by the class during periods when reimbursements or reductions occur. Expenses net of fee waivers reflect expenses after reimbursement by the investment adviser but prior to reductions from brokerage service arrangements or other expense offset arrangements. Expenses net of all reductions represent the net expenses paid by the class.
F Amount does not include the portfolio activity of any underlying Fidelity Central Funds.
See accompanying notes which are an integral part of the financial statements.
Fidelity Canada Fund Class I
| Years ended October 31, | 2017 | 2016 | 2015 | 2014 | 2013 |
| Selected Per–Share Data | | | | | |
| Net asset value, beginning of period | $48.28 | $45.44 | $60.80 | $57.57 | $53.91 |
| Income from Investment Operations | | | | | |
| Net investment income (loss)A | .67 | .66 | .61 | .65 | .78 |
| Net realized and unrealized gain (loss) | 6.19 | 2.83 | (8.07) | 3.12 | 3.64 |
| Total from investment operations | 6.86 | 3.49 | (7.46) | 3.77 | 4.42 |
| Distributions from net investment income | (.66) | (.59) | (.68) | (.22) | (.76) |
| Distributions from net realized gain | (.19) | (.06) | (7.22) | (.32) | – |
| Total distributions | (.85) | (.65) | (7.90) | (.54) | (.76) |
| Redemption fees added to paid in capitalA,B | – | – | – | – | – |
| Net asset value, end of period | $54.29 | $48.28 | $45.44 | $60.80 | $57.57 |
| Total ReturnC | 14.38% | 7.83% | (14.05)% | 6.62% | 8.34% |
| Ratios to Average Net AssetsD,E | | | | | |
| Expenses before reductions | 1.00% | 1.14% | 1.13% | 1.00% | .86% |
| Expenses net of fee waivers, if any | .99% | 1.13% | 1.12% | 1.00% | .86% |
| Expenses net of all reductions | .99% | 1.13% | 1.12% | 1.00% | .85% |
| Net investment income (loss) | 1.33% | 1.41% | 1.21% | 1.08% | 1.43% |
| Supplemental Data | | | | | |
| Net assets, end of period (000 omitted) | $30,581 | $41,217 | $14,846 | $30,165 | $30,831 |
| Portfolio turnover rateF | 26% | 44% | 24% | 85% | 64% |
A Calculated based on average shares outstanding during the period.
B Amount represents less than $.005 per share.
C Total returns would have been lower if certain expenses had not been reduced during the applicable periods shown.
D Fees and expenses of any underlying Fidelity Central Funds are not included in the Fund's expense ratio. The Fund indirectly bears its proportionate share of the expenses of any underlying Fidelity Central Funds.
E Expense ratios reflect operating expenses of the class. Expenses before reductions do not reflect amounts reimbursed by the investment adviser or reductions from brokerage service arrangements or reductions from other expense offset arrangements and do not represent the amount paid by the class during periods when reimbursements or reductions occur. Expenses net of fee waivers reflect expenses after reimbursement by the investment adviser but prior to reductions from brokerage service arrangements or other expense offset arrangements. Expenses net of all reductions represent the net expenses paid by the class.
F Amount does not include the portfolio activity of any underlying Fidelity Central Funds.
See accompanying notes which are an integral part of the financial statements.
Notes to Financial Statements
For the period ended October 31, 2017
1. Organization.
Fidelity Canada Fund (the Fund) is a fund of Fidelity Investment Trust (the Trust) and is authorized to issue an unlimited number of shares. The Trust is registered under the Investment Company Act of 1940, as amended (the 1940 Act), as an open-end management investment company organized as a Massachusetts business trust. The Fund offers Class A, Class M (formerly Class T), Class C, Canada and Class I shares, each of which has equal rights as to assets and voting privileges. Each class has exclusive voting rights with respect to matters that affect that class.
After the close of business on June 24, 2016, all outstanding Class B shares were converted to Class A shares. All prior fiscal period dollar and share amounts for Class B presented in the Notes to Financial Statements are for the period November 1, 2015 through June 24, 2016.
2. Investments in Fidelity Central Funds.
The Fund invests in Fidelity Central Funds, which are open-end investment companies generally available only to other investment companies and accounts managed by the investment adviser and its affiliates. The Fund's Schedule of Investments lists each of the Fidelity Central Funds held as of period end, if any, as an investment of the Fund, but does not include the underlying holdings of each Fidelity Central Fund. As an Investing Fund, the Fund indirectly bears its proportionate share of the expenses of the underlying Fidelity Central Funds.
The Money Market Central Funds seek preservation of capital and current income and are managed by Fidelity Investments Money Management, Inc. (FIMM), an affiliate of the investment adviser. Annualized expenses of the Money Market Central Funds as of their most recent shareholder report date are less than .005%.
A complete unaudited list of holdings for each Fidelity Central Fund is available upon request or at the Securities and Exchange Commission (the SEC) website at www.sec.gov. In addition, the financial statements of the Fidelity Central Funds, which are not covered by the Fund's Report of Independent Registered Public Accounting Firm, are available on the SEC website or upon request.
3. Significant Accounting Policies.
The Fund is an investment company and applies the accounting and reporting guidance of the Financial Accounting Standards Board (FASB) Accounting Standards Codification Topic 946 Financial Services – Investments Companies. The financial statements have been prepared in conformity with accounting principles generally accepted in the United States of America (GAAP), which require management to make certain estimates and assumptions at the date of the financial statements. Actual results could differ from those estimates. Subsequent events, if any, through the date that the financial statements were issued have been evaluated in the preparation of the financial statements. The following summarizes the significant accounting policies of the Fund:
Investment Valuation. Investments are valued as of 4:00 p.m. Eastern time on the last calendar day of the period. The Board of Trustees (the Board) has delegated the day to day responsibility for the valuation of the Fund's investments to the Fair Value Committee (the Committee) established by the Fund's investment adviser. In accordance with valuation policies and procedures approved by the Board, the Fund attempts to obtain prices from one or more third party pricing vendors or brokers to value its investments. When current market prices, quotations or currency exchange rates are not readily available or reliable, investments will be fair valued in good faith by the Committee, in accordance with procedures adopted by the Board. Factors used in determining fair value vary by investment type and may include market or investment specific events. The frequency with which these procedures are used cannot be predicted and they may be utilized to a significant extent. The Committee oversees the Fund's valuation policies and procedures and reports to the Board on the Committee's activities and fair value determinations. The Board monitors the appropriateness of the procedures used in valuing the Fund's investments and ratifies the fair value determinations of the Committee.
The Fund categorizes the inputs to valuation techniques used to value its investments into a disclosure hierarchy consisting of three levels as shown below:
- Level 1 – quoted prices in active markets for identical investments
- Level 2 – other significant observable inputs (including quoted prices for similar investments, interest rates, prepayment speeds, etc.)
- Level 3 – unobservable inputs (including the Fund's own assumptions based on the best information available)
Valuation techniques used to value the Fund's investments by major category are as follows:
Equity securities, including restricted securities, for which market quotations are readily available, are valued at the last reported sale price or official closing price as reported by a third party pricing vendor on the primary market or exchange on which they are traded and are categorized as Level 1 in the hierarchy. In the event there were no sales during the day or closing prices are not available, securities are valued at the last quoted bid price or may be valued using the last available price and are generally categorized as Level 2 in the hierarchy. For foreign equity securities, when market or security specific events arise, comparisons to the valuation of American Depositary Receipts (ADRs), futures contracts, Exchange-Traded Funds (ETFs) and certain indexes as well as quoted prices for similar securities may be used and would be categorized as Level 2 in the hierarchy. Utilizing these techniques may result in transfers between Level 1 and Level 2. For equity securities, including restricted securities, where observable inputs are limited, assumptions about market activity and risk are used and these securities may be categorized as Level 3 in the hierarchy.
Investments in open-end mutual funds, including the Fidelity Central Funds, are valued at their closing net asset value (NAV) each business day and are categorized as Level 1 in the hierarchy.
Changes in valuation techniques may result in transfers in or out of an assigned level within the disclosure hierarchy. The aggregate value of investments by input level as of October 31, 2017 is included at the end of the Fund's Schedule of Investments.
Foreign Currency. The Fund may use foreign currency contracts to facilitate transactions in foreign-denominated securities. Gains and losses from these transactions may arise from changes in the value of the foreign currency or if the counterparties do not perform under the contracts' terms.
Foreign-denominated assets, including investment securities, and liabilities are translated into U.S. dollars at the exchange rates at period end. Purchases and sales of investment securities, income and dividends received and expenses denominated in foreign currencies are translated into U.S. dollars at the exchange rate in effect on the transaction date.
The effects of exchange rate fluctuations on investments are included with the net realized and unrealized gain (loss) on investment securities. Other foreign currency transactions resulting in realized and unrealized gain (loss) are disclosed separately.
Investment Transactions and Income. For financial reporting purposes, the Fund's investment holdings and NAV include trades executed through the end of the last business day of the period. The NAV per share for processing shareholder transactions is calculated as of the close of business of the New York Stock Exchange (NYSE), normally 4:00 p.m. Eastern time and includes trades executed through the end of the prior business day. Gains and losses on securities sold are determined on the basis of identified cost and includes proceeds received from litigation. Dividend income is recorded on the ex-dividend date, except for certain dividends from foreign securities where the ex-dividend date may have passed, which are recorded as soon as the Fund is informed of the ex-dividend date. Non-cash dividends included in dividend income, if any, are recorded at the fair market value of the securities received. Income and capital gain distributions from Fidelity Central Funds, if any, are recorded on the ex-dividend date. Certain distributions received by the Fund represent a return of capital or capital gain. The Fund determines the components of these distributions subsequent to the ex-dividend date, based upon receipt of tax filings or other correspondence relating to the underlying investment. These distributions are recorded as a reduction of cost of investments and/or as a realized gain. Investment income is recorded net of foreign taxes withheld where recovery of such taxes is uncertain.
Class Allocations and Expenses. Investment income, realized and unrealized capital gains and losses, common expenses of the Fund, and certain fund-level expense reductions, if any, are allocated daily on a pro-rata basis to each class based on the relative net assets of each class to the total net assets of the Fund. Each class differs with respect to transfer agent and distribution and service plan fees incurred. Certain expense reductions may also differ by class. For the reporting period, the allocated portion of income and expenses to each class as a percent of its average net assets may vary due to the timing of recording these transactions in relation to fluctuating net assets of the classes. Expenses directly attributable to a fund are charged to that fund. Expenses attributable to more than one fund are allocated among the respective funds on the basis of relative net assets or other appropriate methods. Expense estimates are accrued in the period to which they relate and adjustments are made when actual amounts are known.
Income Tax Information and Distributions to Shareholders. Each year, the Fund intends to qualify as a regulated investment company under Subchapter M of the Internal Revenue Code, including distributing substantially all of its taxable income and realized gains. As a result, no provision for U.S. Federal income taxes is required. As of October 31, 2017, the Fund did not have any unrecognized tax benefits in the financial statements; nor is the Fund aware of any tax positions for which it is reasonably possible that the total amounts of unrecognized tax benefits will significantly change in the next twelve months. The Fund files a U.S. federal tax return, in addition to state and local tax returns as required. The Fund's federal income tax returns are subject to examination by the Internal Revenue Service (IRS) for a period of three fiscal years after they are filed. State and local tax returns may be subject to examination for an additional fiscal year depending on the jurisdiction. Foreign taxes are provided for based on the Fund's understanding of the tax rules and rates that exist in the foreign markets in which it invests.
Distributions are declared and recorded on the ex-dividend date. Income dividends and capital gain distributions are declared separately for each class. Income and capital gain distributions are determined in accordance with income tax regulations, which may differ from GAAP. In addition, the Fund claimed a portion of the payment made to redeeming shareholders as a distribution for income tax purposes.
Capital accounts within the financial statements are adjusted for permanent book-tax differences. These adjustments have no impact on net assets or the results of operations. Capital accounts are not adjusted for temporary book-tax differences which will reverse in a subsequent period.
Book-tax differences are primarily due to foreign currency transactions, passive foreign investment companies (PFIC), capital loss carryforwards, deferred trustees compensation and losses deferred due to wash sales.
As of period end, the cost and unrealized appreciation (depreciation) in securities, and derivatives if applicable, for federal income tax purposes were as follows:
| Gross unrealized appreciation | $367,425,210 |
| Gross unrealized depreciation | (22,192,086) |
| Net unrealized appreciation (depreciation) | $345,233,124 |
| Tax Cost | $898,879,620 |
The tax-based components of distributable earnings as of period end were as follows:
| Undistributed ordinary income | $19,133,560 |
| Undistributed long-term capital gain | $5,081,189 |
| Net unrealized appreciation (depreciation) on securities and other investments | $345,223,511 |
The tax character of distributions paid was as follows:
| | October 31, 2017 | October 31, 2016 |
| Ordinary Income | $21,612,357 | $ 17,462,078 |
| Long-term Capital Gains | – | 1,771,775 |
| Total | $21,612,357 | $ 19,233,853 |
Short-Term Trading (Redemption) Fees. Shares held by investors in the Fund less than 90 days may have been subject to a redemption fee equal to 1.50% of the NAV of shares redeemed. All redemption fees, which reduce the proceeds of the shareholder redemption, are retained by the Fund and accounted for as an addition to paid in capital. In November 2017, the Board of Trustees approved the elimination of these redemption fees effective December 18, 2017.
4. Purchases and Sales of Investments.
Purchases and sales of securities, other than short-term securities, aggregated $338,726,398 and $612,426,009, respectively.
5. Fees and Other Transactions with Affiliates.
Management Fee. Fidelity Management & Research Company (the investment adviser) and its affiliates provide the Fund with investment management related services for which the Fund pays a monthly management fee. The management fee is the sum of an individual fund fee rate that is based on an annual rate of .45% of the Fund's average net assets and an annualized group fee rate that averaged .25% during the period. The group fee rate is based upon the average net assets of all the mutual funds advised by the investment adviser, including any mutual funds previously advised by the investment adviser that are currently advised by Fidelity SelectCo, LLC, an affiliate of the investment adviser. The group fee rate decreases as assets under management increase and increases as assets under management decrease. In addition, the management fee is subject to a performance adjustment (up to a maximum of +/- .20% of the Fund's average net assets over a 36 month performance period). The upward or downward adjustment to the management fee is based on the relative investment performance of Canada as compared to its benchmark index, the S&P/TSX Composite Index, over the same 36 month performance period. For the reporting period, the total annual management fee rate, including the performance adjustment, was .75% of the Fund's average net assets. The performance adjustment included in the management fee rate may be higher or lower than the maximum performance adjustment rate due to the difference between the average net assets for the reporting and performance periods.
Distribution and Service Plan Fees. In accordance with Rule 12b-1 of the 1940 Act, the Fund has adopted separate Distribution and Service Plans for each class of shares. Certain classes pay Fidelity Distributors Corporation (FDC), an affiliate of the investment adviser, separate Distribution and Service Fees, each of which is based on an annual percentage of each class' average net assets. In addition, FDC may pay financial intermediaries for selling shares of the Fund and providing shareholder support services. For the period, the Distribution and Service Fee rates, total fees and amounts retained by FDC were as follows:
| | Distribution
Fee | Service
Fee | Total Fees | Retained
by FDC |
| Class A | -% | .25% | $100,799 | $100 |
| Class M | .25% | .25% | 56,703 | – |
| Class C | .75% | .25% | 171,465 | 4,926 |
| | | | $328,967 | $5,026 |
Sales Load. FDC may receive a front-end sales charge of up to 5.75% for selling Class A shares and 3.50% for selling Class M shares, some of which is paid to financial intermediaries for selling shares of the Fund. Depending on the holding period, FDC may receive contingent deferred sales charges levied on Class A, Class M and Class C redemptions. The deferred sales charges are 1.00% for Class C shares, 1.00% for certain purchases of Class A shares and .25% for certain purchases of Class M shares.
For the period, sales charge amounts retained by FDC were as follows:
| | Retained
by FDC |
| Class A | $3,994 |
| Class M | 1,681 |
| Class C(a) | 1,426 |
| | $7,101 |
(a) When Class C shares are initially sold, FDC pays commissions from its own resources to financial intermediaries through which the sales are made.
Transfer Agent Fees. Fidelity Investments Institutional Operations Company, Inc., (FIIOC), an affiliate of the investment adviser, is the transfer, dividend disbursing and shareholder servicing agent for each class of the Fund. FIIOC receives account fees and asset-based fees that vary according to the account size and type of account of the shareholders of the respective classes of the Fund. FIIOC pays for typesetting, printing and mailing of shareholder reports, except proxy statements.
For the period, transfer agent fees for each class were as follows:
| | Amount | % of
Class-Level Average
Net Assets |
| Class A | $112,117 | .28 |
| Class M | 36,358 | .32 |
| Class C | 43,158 | .25 |
| Canada | 2,538,563 | .21 |
| Class I | 81,592 | .19 |
| | $2,811,788 | |
Accounting and Security Lending Fees. Fidelity Service Company, Inc. (FSC), an affiliate of the investment adviser, maintains the Fund's accounting records. The accounting fee is based on the level of average net assets for each month. Under a separate contract, FSC administers the security lending program. The security lending fee is based on the number and duration of lending transactions.
Brokerage Commissions. The Fund placed a portion of its portfolio transactions with brokerage firms which are affiliates of the investment adviser. Brokerage commissions are included in net realized gain (loss) and change in net unrealized appreciation (depreciation) in the Statement of Operations. The commissions paid to these affiliated firms were $135 for the period.
Interfund Trades. The Fund may purchase from or sell securities to other Fidelity Funds under procedures adopted by the Board. The procedures have been designed to ensure these interfund trades are executed in accordance with Rule 17a-7 of the 1940 Act. Interfund trades are included within the respective purchases and sales amounts shown in the Purchases and Sales of Investments note.
6. Committed Line of Credit.
The Fund participates with other funds managed by the investment adviser or an affiliate in a $4.25 billion credit facility (the "line of credit") to be utilized for temporary or emergency purposes to fund shareholder redemptions or for other short-term liquidity purposes. The Fund has agreed to pay commitment fees on its pro-rata portion of the line of credit, which amounted to $4,281 and is reflected in Miscellaneous expenses on the Statement of Operations. During the period, the Fund did not borrow on this line of credit.
7. Security Lending.
The Fund lends portfolio securities through a lending agent from time to time in order to earn additional income. For equity securities, a lending agent is used and may loan securities to certain qualified borrowers, including Fidelity Capital Markets (FCM), a broker-dealer affiliated with the Fund. On the settlement date of the loan, the Fund receives collateral (in the form of U.S. Treasury obligations, letters of credit and/or cash) against the loaned securities and maintains collateral in an amount not less than 100% of the market value of the loaned securities during the period of the loan. The market value of the loaned securities is determined at the close of business of the Fund and any additional required collateral is delivered to the Fund on the next business day. The Fund or borrower may terminate the loan at any time, and if the borrower defaults on its obligation to return the securities loaned because of insolvency or other reasons, the Fund may apply collateral received from the borrower against the obligation. The Fund may experience delays and costs in recovering the securities loaned. Any cash collateral received is invested in the Fidelity Securities Lending Cash Central Fund. The value of loaned securities and cash collateral at period end are disclosed on the Fund's Statement of Assets and Liabilities. At period end, there were no security loans outstanding with FCM. Security lending income represents the income earned on investing cash collateral, less rebates paid to borrowers and any lending agent fees associated with the loan, plus any premium payments received for lending certain types of securities. Security lending income is presented in the Statement of Operations as a component of income from Fidelity Central Funds. Total security lending income during the period amounted to $641,086, including $5,377 from securities loaned to FCM.
8. Expense Reductions.
Commissions paid to certain brokers with whom the investment adviser, or its affiliates, places trades on behalf of the Fund include an amount in addition to trade execution, which may be rebated back to the Fund to offset certain expenses. This amount totaled $40,399 for the period. In addition, through arrangements with the Fund's custodian, credits realized as a result of certain uninvested cash balances were used to reduce the Fund's expenses. During the period, these credits reduced the Fund's custody expenses by $4.
In addition, during the period the investment adviser reimbursed and/or waived a portion of fund-level operating expenses in the amount of $12,276.
9. Distributions to Shareholders.
Distributions to shareholders of each class were as follows:
| | Year ended October 31, 2017 | Year ended October 31, 2016 |
| From net investment income | | |
| Class A | $406,836 | $482,934 |
| Class M | 78,661 | 79,315 |
| Class C | 39,905 | 8,502 |
| Canada | 15,352,959 | 16,735,044 |
| Class I | 565,020 | 156,283 |
| Total | $16,443,381 | $17,462,078 |
| From net realized gain | | |
| Class A | $168,842 | $69,321 |
| Class M | 43,752 | 16,639 |
| Class B | – | 3,460 |
| Class C | 71,450 | 28,339 |
| Canada | 4,723,987 | 1,638,014 |
| Class I | 160,945 | 16,001 |
| Total | $5,168,976 | $1,771,774 |
10. Share Transactions.
Share transactions for each class were as follows and may contain automatic conversions between classes or exchanges between affiliated funds:
| | Shares | Shares | Dollars | Dollars |
| | Year ended October 31, 2017 | Year ended October 31, 2016 | Year ended October 31, 2017 | Year ended October 31, 2016 |
| Class A | | | | |
| Shares sold | 63,470 | 134,113 | $3,161,163 | $6,147,050 |
| Reinvestment of distributions | 10,631 | 11,425 | 525,595 | 496,287 |
| Shares redeemed | (297,916) | (515,795) | (14,925,894) | (23,017,589) |
| Net increase (decrease) | (223,815) | (370,257) | $(11,239,136) | $(16,374,252) |
| Class M | | | | |
| Shares sold | 24,195 | 23,059 | $1,198,423 | $1,036,279 |
| Reinvestment of distributions | 2,464 | 2,169 | 121,397 | 93,951 |
| Shares redeemed | (67,009) | (77,250) | (3,403,775) | (3,322,138) |
| Net increase (decrease) | (40,350) | (52,022) | $(2,083,955) | $(2,191,908) |
| Class B | | | | |
| Shares sold | – | 499 | $– | $21,798 |
| Reinvestment of distributions | – | 68 | – | 2,895 |
| Shares redeemed | – | (61,115) | – | (2,725,253) |
| Net increase (decrease) | – | (60,548) | $– | $(2,700,560) |
| Class C | | | | |
| Shares sold | 25,680 | 41,578 | $1,254,827 | $1,834,681 |
| Reinvestment of distributions | 1,995 | 731 | 96,717 | 31,141 |
| Shares redeemed | (119,795) | (138,754) | (5,862,219) | (5,980,751) |
| Net increase (decrease) | (92,120) | (96,445) | $(4,510,675) | $(4,114,929) |
| Canada | | | | |
| Shares sold | 1,830,107 | 3,590,664 | $91,494,332 | $166,771,731 |
| Reinvestment of distributions | 381,896 | 388,588 | 18,930,598 | 16,926,879 |
| Shares redeemed | (6,928,660) | (6,566,019) | (353,430,502) | (289,731,847) |
| Net increase (decrease) | (4,716,657) | (2,586,767) | $(243,005,572) | $(106,033,237) |
| Class I | | | | |
| Shares sold | 249,628 | 807,708 | $12,551,193 | $37,813,282 |
| Reinvestment of distributions | 14,338 | 2,849 | 709,005 | 123,890 |
| Shares redeemed | (554,299) | (283,652) | (29,406,590) | (12,076,497) |
| Net increase (decrease) | (290,333) | 526,905 | $(16,146,392) | $25,860,675 |
11. Other.
The Fund's organizational documents provide former and current trustees and officers with a limited indemnification against liabilities arising in connection with the performance of their duties to the Fund. In the normal course of business, the Fund may also enter into contracts that provide general indemnifications. The Fund's maximum exposure under these arrangements is unknown as this would be dependent on future claims that may be made against the Fund. The risk of material loss from such claims is considered remote.
Report of Independent Registered Public Accounting Firm
To the Trustees of Fidelity Investment Trust and Shareholders of Fidelity Canada Fund:
In our opinion, the accompanying statement of assets and liabilities, including the schedule of investments, and the related statements of operations and of changes in net assets and the financial highlights present fairly, in all material respects, the financial position of Fidelity Canada Fund (a fund of Fidelity Investment Trust) as of October 31, 2017, the results of its operations for the year then ended, the changes in its net assets for each of the two years in the period then ended and the financial highlights for each of the five years in the period then ended, in conformity with accounting principles generally accepted in the United States of America. These financial statements and financial highlights (hereafter referred to as “financial statements”) are the responsibility of the Fidelity Canada Fund’s management. Our responsibility is to express an opinion on these financial statements based on our audits. We conducted our audits of these financial statements in accordance with the standards of the Public Company Accounting Oversight Board (United States). Those standards require that we plan and perform the audit to obtain reasonable assurance about whether the financial statements are free of material misstatement. An audit includes examining, on a test basis, evidence supporting the amounts and disclosures in the financial statements, assessing the accounting principles used and significant estimates made by management, and evaluating the overall financial statement presentation. Our procedures included confirmation of securities owned as of October 31, 2017 by correspondence with the custodians and brokers; when replies were not received from brokers, we performed other auditing procedures. We believe that our audits provide a reasonable basis for our opinion.
PricewaterhouseCoopers LLP
Boston, Massachusetts
December 18, 2017
Trustees and Officers
The Trustees, Members of the Advisory Board (if any), and officers of the trusts and fund, as applicable, are listed below. The Board of Trustees governs the fund and is responsible for protecting the interests of shareholders. The Trustees are experienced executives who meet periodically throughout the year to oversee the fund's activities, review contractual arrangements with companies that provide services to the fund, oversee management of the risks associated with such activities and contractual arrangements, and review the fund's performance. Except for Jonathan Chiel, each of the Trustees oversees 190 funds. Mr. Chiel oversees 143 funds.
The Trustees hold office without limit in time except that (a) any Trustee may resign; (b) any Trustee may be removed by written instrument, signed by at least two-thirds of the number of Trustees prior to such removal; (c) any Trustee who requests to be retired or who has become incapacitated by illness or injury may be retired by written instrument signed by a majority of the other Trustees; and (d) any Trustee may be removed at any special meeting of shareholders by a two-thirds vote of the outstanding voting securities of the trust. Each Trustee who is not an interested person (as defined in the 1940 Act) of the trust and the fund is referred to herein as an Independent Trustee. Each Independent Trustee shall retire not later than the last day of the calendar year in which his or her 75th birthday occurs. The Independent Trustees may waive this mandatory retirement age policy with respect to individual Trustees. Officers and Advisory Board Members hold office without limit in time, except that any officer or Advisory Board Member may resign or may be removed by a vote of a majority of the Trustees at any regular meeting or any special meeting of the Trustees. Except as indicated, each individual has held the office shown or other offices in the same company for the past five years.
The fund’s Statement of Additional Information (SAI) includes more information about the Trustees. To request a free copy, call Fidelity at 1-877-208-0098.
Experience, Skills, Attributes, and Qualifications of the Trustees. The Governance and Nominating Committee has adopted a statement of policy that describes the experience, qualifications, attributes, and skills that are necessary and desirable for potential Independent Trustee candidates (Statement of Policy). The Board believes that each Trustee satisfied at the time he or she was initially elected or appointed a Trustee, and continues to satisfy, the standards contemplated by the Statement of Policy. The Governance and Nominating Committee also engages professional search firms to help identify potential Independent Trustee candidates who have the experience, qualifications, attributes, and skills consistent with the Statement of Policy. From time to time, additional criteria based on the composition and skills of the current Independent Trustees, as well as experience or skills that may be appropriate in light of future changes to board composition, business conditions, and regulatory or other developments, have also been considered by the professional search firms and the Governance and Nominating Committee. In addition, the Board takes into account the Trustees' commitment and participation in Board and committee meetings, as well as their leadership of standing and ad hoc committees throughout their tenure.
In determining that a particular Trustee was and continues to be qualified to serve as a Trustee, the Board has considered a variety of criteria, none of which, in isolation, was controlling. The Board believes that, collectively, the Trustees have balanced and diverse experience, qualifications, attributes, and skills, which allow the Board to operate effectively in governing the fund and protecting the interests of shareholders. Information about the specific experience, skills, attributes, and qualifications of each Trustee, which in each case led to the Board's conclusion that the Trustee should serve (or continue to serve) as a trustee of the fund, is provided below.
Board Structure and Oversight Function. James C. Curvey is an interested person and currently serves as Chairman. The Trustees have determined that an interested Chairman is appropriate and benefits shareholders because an interested Chairman has a personal and professional stake in the quality and continuity of services provided to the fund. Independent Trustees exercise their informed business judgment to appoint an individual of their choosing to serve as Chairman, regardless of whether the Trustee happens to be independent or a member of management. The Independent Trustees have determined that they can act independently and effectively without having an Independent Trustee serve as Chairman and that a key structural component for assuring that they are in a position to do so is for the Independent Trustees to constitute a substantial majority for the Board. The Independent Trustees also regularly meet in executive session. Ned C. Lautenbach serves as Chairman of the Independent Trustees and as such (i) acts as a liaison between the Independent Trustees and management with respect to matters important to the Independent Trustees and (ii) with management prepares agendas for Board meetings.
Fidelity® funds are overseen by different Boards of Trustees. The fund's Board oversees Fidelity's high income and certain equity funds, and other Boards oversee Fidelity's investment-grade bond, money market, asset allocation, and sector funds. The asset allocation funds may invest in Fidelity® funds overseen by the fund's Board. The use of separate Boards, each with its own committee structure, allows the Trustees of each group of Fidelity® funds to focus on the unique issues of the funds they oversee, including common research, investment, and operational issues. On occasion, the separate Boards establish joint committees to address issues of overlapping consequences for the Fidelity® funds overseen by each Board.
The Trustees operate using a system of committees to facilitate the timely and efficient consideration of all matters of importance to the Trustees, the fund, and fund shareholders and to facilitate compliance with legal and regulatory requirements and oversight of the fund's activities and associated risks. The Board, acting through its committees, has charged FMR and its affiliates with (i) identifying events or circumstances the occurrence of which could have demonstrably adverse effects on the fund's business and/or reputation; (ii) implementing processes and controls to lessen the possibility that such events or circumstances occur or to mitigate the effects of such events or circumstances if they do occur; and (iii) creating and maintaining a system designed to evaluate continuously business and market conditions in order to facilitate the identification and implementation processes described in (i) and (ii) above. Because the day-to-day operations and activities of the fund are carried out by or through FMR, its affiliates, and other service providers, the fund's exposure to risks is mitigated but not eliminated by the processes overseen by the Trustees. While each of the Board's committees has responsibility for overseeing different aspects of the fund's activities, oversight is exercised primarily through the Operations, Audit, and Compliance Committees. In addition, the Independent Trustees have worked with FMR to enhance the Board's oversight of investment and financial risks, legal and regulatory risks, technology risks, and operational risks, including the development of additional risk reporting to the Board. For example, a working group comprised of Independent Trustees and FMR has worked and continues to work to review the Fidelity® funds' valuation-related activities, reporting and risk management. Appropriate personnel, including but not limited to the fund's Chief Compliance Officer (CCO), FMR's internal auditor, the independent accountants, the fund's Treasurer and portfolio management personnel, make periodic reports to the Board's committees, as appropriate, including an annual review of Fidelity's risk management program for the Fidelity® funds. The responsibilities of each standing committee, including their oversight responsibilities, are described further under "Standing Committees of the Trustees."
Interested Trustees*:
Correspondence intended for a Trustee who is an interested person may be sent to Fidelity Investments, 245 Summer Street, Boston, Massachusetts 02210.
Name, Year of Birth; Principal Occupations and Other Relevant Experience+
Jonathan Chiel (1957)
Year of Election or Appointment: 2016
Trustee
Mr. Chiel also serves as Trustee of other Fidelity® funds. Mr. Chiel is Executive Vice President and General Counsel for FMR LLC (diversified financial services company, 2012-present). Previously, Mr. Chiel served as general counsel (2004-2012) and senior vice president and deputy general counsel (2000-2004) for John Hancock Financial Services; a partner with Choate, Hall & Stewart (1996-2000) (law firm); and an Assistant United States Attorney for the United States Attorney’s Office of the District of Massachusetts (1986-95), including Chief of the Criminal Division (1993-1995). Mr. Chiel is a director on the boards of the Boston Bar Foundation and the Maimonides School.
James C. Curvey (1935)
Year of Election or Appointment: 2007
Trustee
Chairman of the Board of Trustees
Mr. Curvey also serves as Trustee of other Fidelity® funds. Mr. Curvey is a Director of Fidelity Research & Analysis Co. (investment adviser firm, 2009-present), and Vice Chairman (2007-present) and Director of FMR LLC (diversified financial services company). In addition, Mr. Curvey serves as an Overseer for the Boston Symphony Orchestra and a member of the board of Artis-Naples, Naples, Florida, and as a Trustee for Brewster Academy, Wolfeboro, New Hampshire. Previously, Mr. Curvey served as a Director of Fidelity Investments Money Management, Inc. (investment adviser firm, 2009-2014) and a Director of FMR and FMR Co., Inc. (investment adviser firms, 2007-2014).
Charles S. Morrison (1960)
Year of Election or Appointment: 2014
Trustee
Mr. Morrison also serves as Trustee of other funds. He serves as President of Fidelity Management & Research Company (FMR) (investment adviser firm, 2016-present), a Director of Fidelity Investments Money Management, Inc. (FIMM) (investment adviser firm, 2014-present), Director of Fidelity SelectCo, LLC (investment adviser firm, 2014-present), President, Asset Management (2014-present), and is an employee of Fidelity Investments. Previously, Mr. Morrison served as Vice President of Fidelity's Fixed Income and Asset Allocation Funds (2012-2014), President, Fixed Income (2011-2014), Vice President of Fidelity's Money Market Funds (2005-2009), President, Money Market Group Leader of FMR (investment adviser firm, 2009), and Senior Vice President, Money Market Group of FMR (2004-2009). Mr. Morrison also served as Vice President of Fidelity's Bond Funds (2002-2005), certain Balanced Funds (2002-2005), and certain Asset Allocation Funds (2002-2007), and as Senior Vice President (2002-2005) of Fidelity's Bond Division.
* Determined to be an “Interested Trustee” by virtue of, among other things, his or her affiliation with the trust or various entities under common control with FMR.
+ The information includes the Trustee's principal occupation during the last five years and other information relating to the experience, attributes, and skills relevant to the Trustee's qualifications to serve as a Trustee, which led to the conclusion that the Trustee should serve as a Trustee for the fund.
Independent Trustees:
Correspondence intended for an Independent Trustee may be sent to Fidelity Investments, P.O. Box 55235, Boston, Massachusetts 02205-5235.
Name, Year of Birth; Principal Occupations and Other Relevant Experience+
Dennis J. Dirks (1948)
Year of Election or Appointment: 2005
Trustee
Mr. Dirks also serves as Trustee of other Fidelity® funds. Prior to his retirement in May 2003, Mr. Dirks was Chief Operating Officer and a member of the Board of The Depository Trust & Clearing Corporation (DTCC). He also served as President, Chief Operating Officer, and Board member of The Depository Trust Company (DTC) and President and Board member of the National Securities Clearing Corporation (NSCC). In addition, Mr. Dirks served as Chief Executive Officer and Board member of the Government Securities Clearing Corporation, Chief Executive Officer and Board member of the Mortgage-Backed Securities Clearing Corporation, as a Trustee and a member of the Finance Committee of Manhattan College (2005-2008), as a Trustee and a member of the Finance Committee of AHRC of Nassau County (2006-2008), as a member of the Independent Directors Council (IDC) Governing Council (2010-2015), and as a member of the Board of Directors for The Brookville Center for Children’s Services, Inc. (2009-2017). Mr. Dirks is a member of the Finance Committee (2016-present) and Board of Directors (2017-present) of the Asolo Repertory Theatre.
Alan J. Lacy (1953)
Year of Election or Appointment: 2008
Trustee
Mr. Lacy also serves as Trustee of other Fidelity® funds. Mr. Lacy serves as a Director of Bristol-Myers Squibb Company (global pharmaceuticals, 2008-present). He is a Trustee of the California Chapter of The Nature Conservancy (2015-present) and a Director of the Center for Advanced Study in the Behavioral Sciences at Stanford University (2015-present). In addition, Mr. Lacy served as Senior Adviser (2007-2014) of Oak Hill Capital Partners, L.P. (private equity) and also served as Chief Executive Officer (2005) and Vice Chairman (2005-2006) of Sears Holdings Corporation (retail) and Chief Executive Officer and Chairman of the Board of Sears, Roebuck and Co. (retail, 2000-2005). Previously, Mr. Lacy served as Chairman (2014-2017) and a member (2010-2017) of the Board of Directors of Dave & Buster’s Entertainment, Inc. (restaurant and entertainment complexes), as Chairman (2008-2011) and a member (2006-2015) of the Board of Trustees of the National Parks Conservation Association, and as a member of the Board of Directors for The Hillman Companies, Inc. (hardware wholesalers, 2010-2014), Earth Fare, Inc. (retail grocery, 2010-2014), and The Western Union Company (global money transfer, 2006-2011).
Ned C. Lautenbach (1944)
Year of Election or Appointment: 2000
Trustee
Chairman of the Independent Trustees
Mr. Lautenbach also serves as Trustee of other Fidelity® funds. Mr. Lautenbach currently serves as Vice Chair of the Board of Governors, State University System of Florida (2013-present) and is a member of the Council on Foreign Relations (1994-present). He is also a member and has most recently served as Chairman of the Board of Directors of Artis-Naples (2012-present). Previously, Mr. Lautenbach served as a member and then Lead Director of the Board of Directors of Eaton Corporation (diversified industrial, 1997-2016). He was also a Partner and Advisory Partner at Clayton, Dubilier & Rice, LLC (private equity investment, 1998-2010), as well as a Director of Sony Corporation (2006-2007). In addition, Mr. Lautenbach also had a 30-year career with IBM (technology company) during which time he served as Senior Vice President and a member of the Corporate Executive Committee (1968-1998).
Joseph Mauriello (1944)
Year of Election or Appointment: 2008
Trustee
Mr. Mauriello also serves as Trustee of other Fidelity® funds. Prior to his retirement in January 2006, Mr. Mauriello served in numerous senior management positions including Deputy Chairman and Chief Operating Officer (2004-2005), and Vice Chairman of Financial Services (2002-2004) of KPMG LLP US (professional services, 1965-2005). Mr. Mauriello currently serves as a member of the Board of Directors of XL Group plc. (global insurance and re-insurance, 2006-present) and the Independent Directors Council (IDC) Governing Council (2015-present). Previously, Mr. Mauriello served as a Director of the Hamilton Funds of the Bank of New York (2006-2007) and of Arcadia Resources Inc. (health care services and products, 2007-2012).
Cornelia M. Small (1944)
Year of Election or Appointment: 2005
Trustee
Ms. Small also serves as Trustee of other Fidelity® funds. Ms. Small is a member of the Board of Directors (2009-present) and Chair of the Investment Committee (2010-present) of the Teagle Foundation. Ms. Small also serves on the Investment Committee of the Berkshire Taconic Community Foundation (2008-present). Previously, Ms. Small served as Chairperson (2002-2008) and a member of the Investment Committee and Chairperson (2008-2012) and a member of the Board of Trustees of Smith College. In addition, Ms. Small served as Chief Investment Officer, Director of Global Equity Investments, and a member of the Board of Directors of Scudder, Stevens & Clark and Scudder Kemper Investments.
William S. Stavropoulos (1939)
Year of Election or Appointment: 2001
Trustee
Vice Chairman of the Independent Trustees
Mr. Stavropoulos also serves as Trustee of other Fidelity® funds. Mr. Stavropoulos serves as President and Founder of the Michigan Baseball Foundation, the Great Lakes Loons (2007-present). Mr. Stavropoulos is Chairman Emeritus of the Board of Directors of The Dow Chemical Company, where he previously served in numerous senior management positions, including President, CEO (1995-2000; 2002-2004), Chairman of the Executive Committee (2000-2006), and as a member of the Board of Directors (1990-2006). Currently, Mr. Stavropoulos is Chairman of the Board of Directors of Univar Inc. (global distributor of commodity and specialty chemicals), a Director of Teradata Corporation (data warehousing and technology solutions), and a member of the Advisory Board for Metalmark Capital LLC (private equity investment, 2005-present). Mr. Stavropoulos is an operating advisor to Clayton, Dubilier & Rice, LLC (private equity investment). In addition, Mr. Stavropoulos is a member of the University of Notre Dame Advisory Council for the College of Science, a Trustee of the Rollin L. Gerstacker Foundation, and a Director of Artis-Naples in Naples, Florida. Previously, Mr. Stavropoulos served as a Director of Chemical Financial Corporation (bank holding company, 1993-2012) and Tyco International, Ltd. (multinational manufacturing and services, 2007-2012).
David M. Thomas (1949)
Year of Election or Appointment: 2008
Trustee
Mr. Thomas also serves as Trustee of other Fidelity® funds. Mr. Thomas serves as Non-Executive Chairman of the Board of Directors of Fortune Brands Home and Security (home and security products, 2011-present), as a member of the Board of Directors (2004-present) and Presiding Director (2013-present) of Interpublic Group of Companies, Inc. (marketing communication), and as a member of the Board of Trustees of the University of Florida (2013-present). Previously, Mr. Thomas served as Executive Chairman (2005-2006) and Chairman and Chief Executive Officer (2000-2005) of IMS Health, Inc. (pharmaceutical and healthcare information solutions), and a Director of Fortune Brands, Inc. (consumer products, 2000-2011).
+ The information includes the Trustee's principal occupation during the last five years and other information relating to the experience, attributes, and skills relevant to the Trustee's qualifications to serve as a Trustee, which led to the conclusion that the Trustee should serve as a Trustee for the fund.
Advisory Board Members and Officers:
Correspondence intended for an officer or Peter S. Lynch may be sent to Fidelity Investments, 245 Summer Street, Boston, Massachusetts 02210. Officers appear below in alphabetical order.
Name, Year of Birth; Principal Occupation
Peter S. Lynch (1944)
Year of Election or Appointment: 2003
Member of the Advisory Board
Mr. Lynch also serves as Member of the Advisory Board of other Fidelity® funds. Mr. Lynch is Vice Chairman and a Director of FMR (investment adviser firm) and FMR Co., Inc. (investment adviser firm). In addition, Mr. Lynch serves as a Trustee of Boston College and as the Chairman of the Inner-City Scholarship Fund. Previously, Mr. Lynch served on the Special Olympics International Board of Directors (1997-2006).
Elizabeth Paige Baumann (1968)
Year of Election or Appointment: 2017
Anti-Money Laundering (AML) Officer
Ms. Baumann also serves as AML Officer of other funds. She is Chief AML Officer (2012-present) and Senior Vice President (2014-present) of FMR LLC (diversified financial services company) and is an employee of Fidelity Investments. Previously, Ms. Baumann served as AML Officer of the funds (2012-2016), and Vice President (2007-2014) and Deputy Anti-Money Laundering Officer (2007-2012) of FMR LLC.
Marc R. Bryant (1966)
Year of Election or Appointment: 2015
Secretary and Chief Legal Officer (CLO)
Mr. Bryant also serves as Secretary and CLO of other funds. Mr. Bryant serves as CLO, Secretary, and Senior Vice President of Fidelity Management & Research Company (investment adviser firm, 2015-present) and FMR Co., Inc. (investment adviser firm, 2015-present); Secretary of Fidelity SelectCo, LLC (investment adviser firm, 2015-present) and Fidelity Investments Money Management, Inc. (investment adviser firm, 2015-present); and CLO of Fidelity Management & Research (Hong Kong) Limited and FMR Investment Management (UK) Limited (investment adviser firms, 2015-present) and Fidelity Management & Research (Japan) Limited (investment adviser firm, 2016-present). He is Senior Vice President and Deputy General Counsel of FMR LLC (diversified financial services company). Previously, Mr. Bryant served as Secretary and CLO of Fidelity Rutland Square Trust II (2010-2014) and Assistant Secretary of Fidelity's Fixed Income and Asset Allocation Funds (2013-2015). Prior to joining Fidelity Investments, Mr. Bryant served as a Senior Vice President and the Head of Global Retail Legal for AllianceBernstein L.P. (2006-2010), and as the General Counsel for ProFund Advisors LLC (2001-2006).
William C. Coffey (1969)
Year of Election or Appointment: 2009
Assistant Secretary
Mr. Coffey also serves as Assistant Secretary of other funds. He is Senior Vice President and Deputy General Counsel of FMR LLC (diversified financial services company, 2010-present), and is an employee of Fidelity Investments. Previously, Mr. Coffey served as Vice President and Associate General Counsel of FMR LLC (2005-2009).
Jonathan Davis (1968)
Year of Election or Appointment: 2010
Assistant Treasurer
Mr. Davis also serves as Assistant Treasurer of other funds, and is an employee of Fidelity Investments. Previously, Mr. Davis served as Vice President and Associate General Counsel of FMR LLC (diversified financial services company, 2003-2010).
Adrien E. Deberghes (1967)
Year of Election or Appointment: 2016
Assistant Treasurer
Mr. Deberghes also serves as an officer of other funds. He serves as Executive Vice President of Fidelity Investments Money Management, Inc. (FIMM) (investment adviser firm, 2016-present) and is an employee of Fidelity Investments (2008-present). Prior to joining Fidelity Investments, Mr. Deberghes was Senior Vice President of Mutual Fund Administration at State Street Corporation (2007-2008), Senior Director of Mutual Fund Administration at Investors Bank & Trust (2005-2007), and Director of Finance for Dunkin' Brands (2000-2005). Previously, Mr. Deberghes served in other fund officer roles.
Joseph DeSantis (1959)
Year of Election or Appointment: 2017
Vice President
Mr. DeSantis also serves as Vice President of other funds. Mr. DeSantis serves as a Director of Fidelity Management & Research (Japan) Limited (investment adviser firm, 2016-present), Chief Investment Officer, Equities (2010-present) and is an employee of Fidelity Investments.
Stephanie J. Dorsey (1969)
Year of Election or Appointment: 2010
Assistant Treasurer
Ms. Dorsey also serves as an officer of other funds. She is an employee of Fidelity Investments (2008-present) and has served in other fund officer roles. Prior to joining Fidelity Investments, Ms. Dorsey served as Treasurer (2004-2008) of the JPMorgan Mutual Funds and Vice President (2004-2008) of JPMorgan Chase Bank.
Howard J. Galligan III (1966)
Year of Election or Appointment: 2014
Chief Financial Officer
Mr. Galligan also serves as Chief Financial Officer of other funds. Mr. Galligan serves as President of Fidelity Pricing and Cash Management Services (FPCMS) (2014-present) and as a Director of Strategic Advisers, Inc. (investment adviser firm, 2008-present). Previously, Mr. Galligan served as Chief Administrative Officer of Asset Management (2011-2014) and Chief Operating Officer and Senior Vice President of Investment Support for Strategic Advisers, Inc. (2003-2011).
Brian B. Hogan (1964)
Year of Election or Appointment: 2009
Vice President
Mr. Hogan also serves as Trustee or Vice President of other funds. Mr. Hogan serves as a Director of FMR Investment Management (UK) Limited (investment adviser firm, 2015-present) and Fidelity SelectCo, LLC (investment adviser firm, 2014-present) and President of the Equity Division of FMR (investment adviser firm, 2009-present). Previously, Mr. Hogan served as Senior Vice President, Equity Research of FMR (2006-2009) and as a portfolio manager. Mr. Brian B. Hogan is not related to Mr. Colm A. Hogan.
Colm A. Hogan (1973)
Year of Election or Appointment: 2016
Deputy Treasurer
Mr. Hogan also serves as an officer of other funds. Mr. Hogan is an employee of Fidelity Investments (2005-present). Mr. Colm A. Hogan is not related to Mr. Brian B. Hogan.
Chris Maher (1972)
Year of Election or Appointment: 2013
Assistant Treasurer
Mr. Maher serves as Assistant Treasurer of other funds. Mr. Maher is Vice President of Valuation Oversight and is an employee of Fidelity Investments. Previously, Mr. Maher served as Vice President of Asset Management Compliance (2013), Vice President of the Program Management Group of FMR (investment adviser firm, 2010-2013), and Vice President of Valuation Oversight (2008-2010).
Rieco E. Mello (1969)
Year of Election or Appointment: 2017
Assistant Treasurer
Mr. Mello also serves as Assistant Treasurer of other funds. Mr. Mello is an employee of Fidelity Investments (1995-present).
Kenneth B. Robins (1969)
Year of Election or Appointment: 2016
Chief Compliance Officer
Mr. Robins also serves as an officer of other funds. Mr. Robins serves as Compliance Officer of Fidelity Management & Research Company and FMR Co., Inc. (investment adviser firms, 2016-present) and is an employee of Fidelity Investments (2004-present). Previously, Mr. Robins served as Executive Vice President of Fidelity Investments Money Management, Inc. (investment adviser firm, 2013-2016) and served in other fund officer roles.
Stacie M. Smith (1974)
Year of Election or Appointment: 2016
President and Treasurer
Ms. Smith also serves as an officer of other funds. She is an employee of Fidelity Investments (2009-present) and has served in other fund officer roles. Prior to joining Fidelity Investments, Ms. Smith served as Senior Audit Manager of Ernst & Young LLP (accounting firm, 1996-2009). Previously, Ms. Smith served as Deputy Treasurer of certain Fidelity® funds (2013-2016).
Marc L. Spector (1972)
Year of Election or Appointment: 2016
Assistant Treasurer
Mr. Spector also serves as an officer of other funds. Mr. Spector is an employee of Fidelity Investments (2016-present). Prior to joining Fidelity Investments, Mr. Spector served as Director at the Siegfried Group (accounting firm, 2013-2016), and prior to Siegfried Group as audit senior manager at Deloitte & Touche (accounting firm, 2005-2013).
Renee Stagnone (1975)
Year of Election or Appointment: 2016
Assistant Treasurer
Ms. Stagnone also serves as an officer of other funds. Ms. Stagnone is an employee of Fidelity Investments (1997-present). Previously, Ms. Stagnone served as Deputy Treasurer of certain Fidelity® funds (2013-2016).
Shareholder Expense Example
As a shareholder of the Fund, you incur two types of costs: (1) transaction costs, including sales charges (loads) on purchase payments or redemption proceeds, redemption fees and (2) ongoing costs, including management fees, distribution and/or service (12b-1) fees and other Fund expenses. This Example is intended to help you understand your ongoing costs (in dollars) of investing in the Fund and to compare these costs with the ongoing costs of investing in other mutual funds.
The Example is based on an investment of $1,000 invested at the beginning of the period and held for the entire period (May 1, 2017 to October 31, 2017).
Actual Expenses
The first line of the accompanying table for each class of the Fund provides information about actual account values and actual expenses. You may use the information in this line, together with the amount you invested, to estimate the expenses that you paid over the period. Simply divide your account value by $1,000.00 (for example, an $8,600 account value divided by $1,000.00 = 8.6), then multiply the result by the number in the first line for a class of the Fund under the heading entitled "Expenses Paid During Period" to estimate the expenses you paid on your account during this period. A small balance maintenance fee of $12.00 that is charged once a year may apply for certain accounts with a value of less than $2,000. This fee is not included in the table below. If it was, the estimate of expenses you paid during the period would be higher, and your ending account value lower, by this amount. In addition, the Fund, as a shareholder in the underlying Fidelity Central Funds, will indirectly bear its pro-rata share of the fees and expenses incurred by the underlying Fidelity Central Funds. These fees and expenses are not included in the Fund's annualized expense ratio used to calculate the expense estimate in the table below.
Hypothetical Example for Comparison Purposes
The second line of the accompanying table for each class of the Fund provides information about hypothetical account values and hypothetical expenses based on a Class' actual expense ratio and an assumed rate of return of 5% per year before expenses, which is not the Class' actual return. The hypothetical account values and expenses may not be used to estimate the actual ending account balance or expenses you paid for the period. You may use this information to compare the ongoing costs of investing in the Fund and other funds. To do so, compare this 5% hypothetical example with the 5% hypothetical examples that appear in the shareholder reports of the other funds. A small balance maintenance fee of $12.00 that is charged once a year may apply for certain accounts with a value of less than $2,000. This fee is not included in the table below. If it was, the estimate of expenses you paid during the period would be higher, and your ending account value lower, by this amount. In addition, the Fund, as a shareholder in the underlying Fidelity Central Funds, will indirectly bear its pro-rata share of the fees and expenses incurred by the underlying Fidelity Central Funds. These fees and expenses are not included in the Fund's annualized expense ratio used to calculate the expense estimate in the table below.
Please note that the expenses shown in the table are meant to highlight your ongoing costs only and do not reflect any transaction costs. Therefore, the second line of the table is useful in comparing ongoing costs only, and will not help you determine the relative total costs of owning different funds. In addition, if these transactional costs were included, your costs would have been higher.
| | Annualized Expense Ratio-A | Beginning
Account Value
May 1, 2017 | Ending
Account Value
October 31, 2017 | Expenses Paid
During Period-B
May 1, 2017
to October 31, 2017 |
| Class A | 1.33% | | | |
| Actual | | $1,000.00 | $1,104.70 | $7.06 |
| Hypothetical-C | | $1,000.00 | $1,018.50 | $6.77 |
| Class M | 1.63% | | | |
| Actual | | $1,000.00 | $1,103.20 | $8.64 |
| Hypothetical-C | | $1,000.00 | $1,016.99 | $8.29 |
| Class C | 2.06% | | | |
| Actual | | $1,000.00 | $1,100.60 | $10.91 |
| Hypothetical-C | | $1,000.00 | $1,014.82 | $10.46 |
| Canada | 1.02% | | | |
| Actual | | $1,000.00 | $1,106.30 | $5.42 |
| Hypothetical-C | | $1,000.00 | $1,020.06 | $5.19 |
| Class I | 1.00% | | | |
| Actual | | $1,000.00 | $1,106.60 | $5.31 |
| Hypothetical-C | | $1,000.00 | $1,020.16 | $5.09 |
A Annualized expense ratio reflects expenses net of applicable fee waivers.
B Expenses are equal to each Class' annualized expense ratio, multiplied by the average account value over the period, multiplied by 184/365 (to reflect the one-half year period).
C 5% return per year before expenses
Distributions (Unaudited)
The Board of Trustees of Fidelity Canada Fund voted to pay to shareholders of record at the opening of business on record date, the following distributions per share derived from capital gains realized from sales of portfolio securities and dividends derived from net investment income:
| | Pay Date | Record Date | Dividends | Capital Gains |
| Fidelity Canada Fund | | | | |
| Class A | 12/11/17 | 12/08/17 | $0.589 | $0.487 |
| Class M | 12/11/17 | 12/08/17 | $0.402 | $0.487 |
| Class C | 12/11/17 | 12/08/17 | $0.184 | $0.487 |
| Canada | 12/11/17 | 12/08/17 | $0.770 | $0.487 |
| Class I | 12/11/17 | 12/08/17 | $0.765 | $0.487 |
|
The fund hereby designates as a capital gain dividend with respect to the taxable year ended October 31, 2017. $5,081,189, or, if subsequently determined to be different, the net capital gain of such year.
Class A, Class M, Class C, Canada and Class I designate 1% of the dividends distributed during the fiscal year as qualifying for the dividends–received deduction for corporate shareholders.
Class A designates 100%, Class M designates 100%, Class C designates 100%, Canada designates 87%, and Class I designate 83% of the dividends distributed during the fiscal year as amounts which may be taken into account as a dividend for purposes of the maximum rate under section 1(h)(11) of the Internal Revenue Code.
The amounts per share which represent income derived from sources within, and taxes paid to, foreign countries or possessions of the United States are as follows:
| | Pay Date | Income | Taxes |
| Fidelity Canada Fund | | | |
| Class A | 12/12/16 | $0.7679 | $0.1269 |
| Class M | 12/12/16 | $0.6529 | $0.1269 |
| Class C | 12/12/16 | $0.4199 | $0.1269 |
| Canada | 12/12/16 | $0.9259 | $0.1269 |
| Class I | 12/12/16 | $0.9749 | $0.1269 |
|
The fund will notify shareholders in January 2018 of amounts for use in preparing 2017 income tax returns.
Board Approval of Investment Advisory Contracts and Management Fees
Fidelity Canada Fund
Each year, the Board of Trustees, including the Independent Trustees (together, the Board), votes on the renewal of the management contract with Fidelity Management & Research Company (FMR) and the sub-advisory agreements (together, the Advisory Contracts) for the fund. FMR and the sub-advisers are referred to herein as the Investment Advisers. The Board, assisted by the advice of fund counsel and Independent Trustees' counsel, requests and considers a broad range of information relevant to the renewal of the Advisory Contracts throughout the year.
The Board meets regularly and, at each of its meetings, covers an extensive agenda of topics and materials and considers factors that are relevant to its annual consideration of the renewal of the fund's Advisory Contracts, including the services and support provided to the fund and its shareholders. The Board has established various standing committees (Committees), each composed of and chaired by Independent Trustees with varying backgrounds, to which the Board has assigned specific subject matter responsibilities in order to enhance effective decision-making by the Board. The Board, acting directly and through its Committees, requests and receives information concerning the annual consideration of the renewal of the fund's Advisory Contracts. The Board also meets as needed to review matters specifically related to the Board's annual consideration of the renewal of the Advisory Contracts. Members of the Board may also meet with trustees of other Fidelity funds through ad hoc joint committees to discuss certain matters relevant to all of the Fidelity funds.
At its July 2017 meeting, the Board unanimously determined to renew the fund's Advisory Contracts. In reaching its determination, the Board considered all factors it believed relevant, including (i) the nature, extent, and quality of the services to be provided to the fund and its shareholders (including the investment performance of the fund); (ii) the competitiveness of the fund's management fee and total expense ratio relative to peer funds; (iii) the total costs of the services to be provided by and the profits to be realized by Fidelity from its relationships with the fund; and (iv) the extent to which, if any, economies of scale exist and would be realized as the fund grows, and whether any economies of scale are appropriately shared with fund shareholders.
In considering whether to renew the Advisory Contracts for the fund, the Board reached a determination, with the assistance of fund counsel and Independent Trustees' counsel and through the exercise of its business judgment, that the renewal of the Advisory Contracts was in the best interests of the fund and its shareholders and that the compensation payable under the Advisory Contracts was fair and reasonable. The Board's decision to renew the Advisory Contracts was not based on any single factor, but rather was based on a comprehensive consideration of all the information provided to the Board at its meetings throughout the year. The Board, in reaching its determination to renew the Advisory Contracts, was aware that shareholders of the fund have a broad range of investment choices available to them, including a wide choice among funds offered by Fidelity's competitors, and that the fund's shareholders, who have the opportunity to review and weigh the disclosure provided by the fund in its prospectus and other public disclosures, have chosen to invest in this fund, which is part of the Fidelity family of funds.
Amendment to Group Fee Rate. The Board also approved an amendment to the management contract for the fund to add an additional breakpoint to the group fee schedule, effective October 1, 2017. The Board noted that the additional breakpoint would result in lower management fee rates as Fidelity's assets under management increase.
Nature, Extent, and Quality of Services Provided. The Board considered Fidelity's staffing as it relates to the fund, including the backgrounds of investment personnel of Fidelity, and also considered the fund's investment objective, strategies, and related investment philosophy. The Independent Trustees also had discussions with senior management of Fidelity's investment operations and investment groups. The Board considered the structure of the investment personnel compensation program and whether this structure provides appropriate incentives to act in the best interests of the fund. Additionally, the Board considered the portfolio managers' investments, if any, in the funds that they manage.
Resources Dedicated to Investment Management and Support Services. The Board and the Fund Oversight and Research Committees reviewed the general qualifications and capabilities of Fidelity's investment staff, including its size, education, experience, and resources, as well as Fidelity's approach to recruiting, training, managing, and compensating investment personnel. The Board noted that Fidelity has continued to increase the resources devoted to non-U.S. offices, including expansion of Fidelity's global investment organization. The Board also noted that Fidelity's analysts have extensive resources, tools and capabilities that allow them to conduct sophisticated quantitative and fundamental analysis, as well as credit analysis of issuers, counterparties and guarantors. Further, the Board considered that Fidelity's investment professionals have sufficient access to global information and data so as to provide competitive investment results over time, and that those professionals also have access to sophisticated tools that permit them to assess portfolio construction and risk and performance attribution characteristics continuously, as well as to transmit new information and research conclusions rapidly around the world. Additionally, in its deliberations, the Board considered Fidelity's trading, risk management, compliance, and technology and operations capabilities and resources, which are integral parts of the investment management process.
Shareholder and Administrative Services. The Board considered (i) the nature, extent, quality, and cost of advisory, administrative, and shareholder services performed by the Investment Advisers and their affiliates under the Advisory Contracts and under separate agreements covering transfer agency, pricing and bookkeeping, and securities lending services for the fund; (ii) the nature and extent of the supervision of third party service providers, principally custodians, subcustodians, and pricing vendors; and (iii) the resources devoted to, and the record of compliance with, the fund's compliance policies and procedures. The Board also reviewed the allocation of fund brokerage, including allocations to brokers affiliated with the Investment Advisers, the use of brokerage commissions to pay fund expenses, and the use of "soft" commission dollars to pay for research services.
The Board noted that the growth of fund assets over time across the complex allows Fidelity to reinvest in the development of services designed to enhance the value or convenience of the Fidelity funds as investment vehicles. These services include 24-hour access to account information and market information through telephone representatives and over the Internet, investor education materials and asset allocation tools, and the expanded availability of Fidelity Investor Centers.
In 2014, the Board formed an ad hoc Committee on Transfer Agency Fees to review the variety of transfer agency fee structures throughout the industry and Fidelity's competitive positioning with respect to industry participants.
Investment in a Large Fund Family. The Board considered the benefits to shareholders of investing in a Fidelity fund, including the benefits of investing in a fund that is part of a large family of funds offering a variety of investment disciplines and providing a large variety of mutual fund investor services. The Board noted that Fidelity had taken, or had made recommendations that resulted in the Fidelity funds taking, a number of actions over the previous year that benefited particular funds, including: (i) continuing to dedicate additional resources to Fidelity's investment research process, and to the support of the senior management team that oversees asset management; (ii) continuing efforts to enhance Fidelity's global research capabilities; (iii) launching new funds and making other enhancements to meet client needs; (iv) launching new share classes of existing funds; (v) eliminating purchase minimums and broadening eligibility requirements for certain lower-priced share classes; (vi) reducing management fees and total expenses for certain growth equity funds and index funds; (vii) lowering expense caps for certain existing funds and classes to reduce expenses borne by shareholders; (viii) eliminating short-term redemption fees for certain funds; (ix) introducing a new pricing structure for certain funds of funds that is expected to reduce overall expenses paid by shareholders; (x) rationalizing product lines and gaining increased efficiencies through proposals for fund mergers and share class consolidations; (xi) continuing to develop, acquire and implement systems and technology to improve services to the funds and shareholders, strengthen information security, and increase efficiency; and (xii) implementing enhancements to further strengthen Fidelity's product line to increase investors' probability of success in achieving their investment goals, including retirement income goals.
Investment Performance. The Board considered whether the fund has operated in accordance with its investment objective, as well as its record of compliance with its investment restrictions and its performance history. The Board noted that there were portfolio management changes for the fund in January 2014 and September 2014.
The Board took into account discussions with representatives of the Investment Advisers about fund investment performance that occur at Board meetings throughout the year. In this regard the Board noted that as part of regularly scheduled fund reviews and other reports to the Board on fund performance, the Board considers annualized return information for the fund for different time periods, measured against a securities market index ("benchmark index") and a peer group of funds with similar objectives ("peer group"), if any. In its evaluation of fund investment performance, the Board gave particular attention to information indicating changes in performance of certain Fidelity funds for specific time periods and discussed with the Investment Advisers the reasons for any overperformance or underperformance.
In addition to reviewing absolute and relative fund performance, the Independent Trustees periodically consider the appropriateness of fund performance metrics in evaluating the results achieved. In general, the Independent Trustees believe that fund performance should be evaluated based on net performance (after fees and expenses) of both the highest performing and lowest performing fund share classes, where applicable, compared to appropriate benchmark indices, over appropriate time periods that may include full market cycles, and compared to peer groups, as applicable, over the same periods, taking into account relevant factors including the following: general market conditions; issuer-specific information; and fund cash flows and other factors.
The Independent Trustees recognize that shareholders evaluate performance on a net basis over their own holding periods, for which one-, three-, and five-year periods are often used as a proxy. For this reason, the performance information reviewed by the Board also included net cumulative calendar year total return information for the fund and an appropriate benchmark index for the most recent one-, three-, and five-year periods, as shown below. A peer group is not shown below because the fund does not generally utilize a peer group for performance comparison purposes.
Fidelity Canada Fund
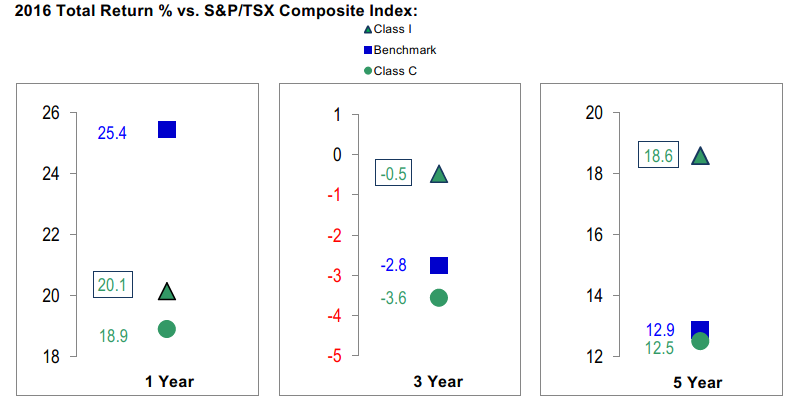
The Board also considered that the fund's management fee is subject to upward or downward adjustment depending upon whether, and to what extent, the fund's investment performance for the performance period (a rolling 36-month period) exceeds, or is exceeded by, a securities index, thus leading to a performance adjustment for the same period. The Board noted that the performance adjustment provides FMR with a strong economic incentive to seek to achieve superior long-term performance for the fund's shareholders and helps to more closely align the interests of FMR and the shareholders of the fund.
Based on its review, the Board concluded that the nature, extent, and quality of services provided to the fund under the Advisory Contracts should continue to benefit the shareholders of the fund.
Competitiveness of Management Fee and Total Expense Ratio. The Board considered the fund's management fee and total expense ratio compared to "mapped groups" of competitive funds and classes created for the purpose of facilitating the Trustees' competitive analysis of management fees and total expenses. Fidelity creates "mapped groups" by combining similar Lipper investment objective categories that have comparable investment mandates. Combining Lipper investment objective categories aids the Board's management fee and total expense ratio comparisons by broadening the competitive group used for comparison.
Management Fee. The Board considered two proprietary management fee comparisons for the 12-month periods shown in basis points (BP) in the chart below. The group of Lipper funds used by the Board for management fee comparisons is referred to below as the "Total Mapped Group." The Total Mapped Group comparison focuses on a fund's standing in terms of gross management fees before expense reimbursements or caps, and without giving effect to the fund's performance adjustment, relative to the total universe of funds with comparable investment mandates, regardless of whether their management fee structures also are comparable. Funds with comparable investment mandates offer exposure to similar types of securities. Funds with comparable management fee structures have similar management fee contractual arrangements (
e.g., flat rate charged for advisory services, all-inclusive fee rate,
etc.). "TMG %" represents the percentage of funds in the Total Mapped Group that had management fees that were lower than the fund's. For example, a hypothetical TMG % of 20% would mean that 80% of the funds in the Total Mapped Group had higher, and 20% had lower, management fees than the fund. The fund's actual TMG %s and the number of funds in the Total Mapped Group are in the chart below. The "Asset-Size Peer Group" (ASPG) comparison focuses on a fund's standing relative to a subset of non-Fidelity funds within the Total Mapped Group that are similar in size and management fee structure without taking into account performance adjustments, if any. For example, if a fund is in the first quartile of the ASPG, the fund's management fee ranks in the least expensive or lowest 25% of funds in the ASPG. The ASPG represents at least 15% of the funds in the Total Mapped Group with comparable asset size and management fee structures, subject to a minimum of 50 funds (or all funds in the Total Mapped Group if fewer than 50). Additional information, such as the ASPG quartile in which the fund's management fee rate ranked and the impact of the fund's performance adjustment, is also included in the chart and considered by the Board.
Fidelity Canada Fund
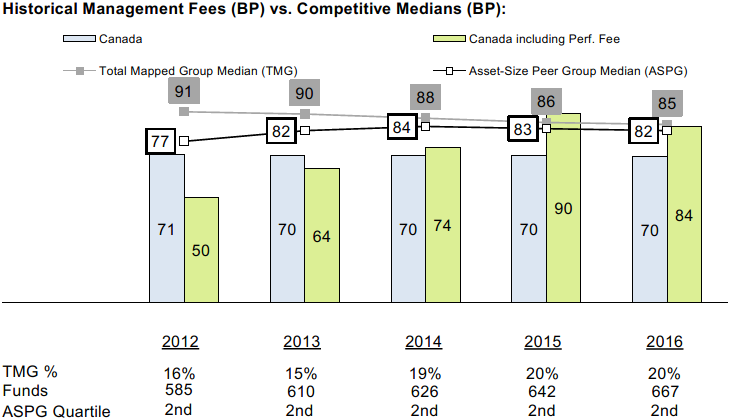
The Board noted that the fund's management fee rate ranked below the median of its Total Mapped Group and below the median of its ASPG for 2016. The Board also noted the effect of the fund's performance adjustment, if any, on the fund's management fee ranking.
The Board noted that, in 2014, the Board and the boards of other Fidelity funds formed the ad hoc Committee on Group Fee to conduct an in-depth review of the "group fee" component of the management fee of funds with such management fee structures. The Committee's focus included the mechanics of the group fee, the competitive landscape of group fee structures, Fidelity funds with no group fee component and investment products not included in group fee assets. The Board also considered that, for funds subject to the group fee, FMR agreed to voluntarily waive fees over a specified period of time in amounts designed to account for assets converted from certain funds to certain collective investment trusts.
The Board also noted that, in 2013, the ad hoc Committee on Management Fees was formed to conduct an in-depth review of the management fee rates of Fidelity's active equity mutual funds. The Committee focused on the following areas: (i) standard fee structures; (ii) research consumption and trading evolution; (iii) management fee competitiveness/profitability by category; and (iv) factors that drive institutional pricing.
Based on its review, the Board concluded that the fund's management fee is fair and reasonable in light of the services that the fund receives and the other factors considered.
Total Expense Ratio. In its review of each class's total expense ratio, the Board considered the fund's management fee rate as well as other fund or class expenses, as applicable, such as transfer agent fees, pricing and bookkeeping fees, fund-paid 12b-1 fees, and custodial, legal, and audit fees. The Board noted the impact of the fund's performance adjustment. The Board also noted that Fidelity may agree to waive fees and expenses from time to time, and the extent to which, if any, it has done so for the fund. As part of its review, the Board also considered the current and historical total expense ratios of each class of the fund compared to competitive fund median expenses. Each class of the fund is compared to those funds and classes in the Total Mapped Group (used by the Board for management fee comparisons) that have a similar sales load structure.
The Board noted that the total expense ratio of the retail class ranked below the competitive median for 2016 and the total expense ratio of each of Class A, Class M (formerly Class T), Class C, and Class I ranked above the competitive median for 2016. The Board considered that, in general, various factors can affect total expense ratios. The Board noted that the total expense ratio of each of Class A, Class M, Class C, and Class I was above the competitive median because of a positive performance fee adjustment in 2016. The Board noted that the total expense ratio of Class M was also above the competitive median because of higher 12b-1 fees on Class M as compared to most competitor funds. Class M has a higher 12b-1 fee, but a lower front-end sales charge, than traditionally priced front-end sales charge classes. The Board considered that Class M is primarily sold load-waived in the retirement plan market where its 0.50% 12b-1 fee is comparable to competing no-load, higher 12b-1 fee classes designed specifically for retirement plans. The Board noted that the total expense ratio of Class C was also above the competitive median because of its 12b-1 fees. The Board also noted that, although Class I is categorized by Lipper as an institutional class, Class I has a significantly lower investment minimum than most other funds and classes categorized as institutional. As a result, FMR believes Class I is generally more comparable to retail funds and classes. The Board noted that the fund offers multiple classes, each of which has a different sales load and 12b-1 fee structure, and that the multiple structures are intended to offer a range of pricing options for the intermediary market. The Board also noted that the total expense ratios of the classes vary primarily by the level of their 12b-1 fees, although differences in transfer agent fees may also cause expenses to vary from class to class.
Fees Charged to Other Fidelity Clients. The Board also considered Fidelity fee structures and other information with respect to clients of Fidelity, such as other funds advised or subadvised by Fidelity, pension plan clients, and other institutional clients with similar mandates. The Board noted that an ad hoc joint committee created by it and the boards of other Fidelity funds periodically (most recently in 2013) reviews and compares Fidelity's institutional investment advisory business with its business of providing services to the Fidelity funds, including the differences in services provided, fees charged, and costs incurred, as well as competition in their respective marketplaces.
Based on its review of total expense ratios and fees charged to other Fidelity clients, the Board concluded that, although some classes were above the median of the universe presented for comparison, the total expense ratio of each class of the fund was reasonable in light of the services that the fund and its shareholders receive and the other factors considered.
Costs of the Services and Profitability. The Board considered the revenues earned and the expenses incurred by Fidelity in conducting the business of developing, marketing, distributing, managing, administering and servicing the fund and servicing the fund's shareholders. The Board also considered the level of Fidelity's profits in respect of all the Fidelity funds.
On an annual basis, Fidelity presents to the Board information about the profitability of its relationships with the fund. Fidelity calculates profitability information for each fund, as well as aggregate profitability information for groups of Fidelity funds and all Fidelity funds, using a series of detailed revenue and cost allocation methodologies which originate with the books and records of Fidelity on which Fidelity's audited financial statements are based. The Audit Committee of the Board reviews any significant changes from the prior year's methodologies.
PricewaterhouseCoopers LLP (PwC), independent registered public accounting firm and auditor to Fidelity and certain Fidelity funds, has been engaged annually by the Board as part of the Board's assessment of Fidelity's profitability analysis. PwC's engagement includes the review and assessment of the methodologies used by Fidelity in determining the revenues and expenses attributable to Fidelity's mutual fund business, and completion of agreed-upon procedures in respect of the mathematical accuracy of the fund profitability information and its conformity to established allocation methodologies. After considering PwC's reports issued under the engagement and information provided by Fidelity, the Board concluded that while other allocation methods may also be reasonable, Fidelity's profitability methodologies are reasonable in all material respects.
The Board also reviewed Fidelity's non-fund businesses and potential fall-out benefits related to the mutual fund business as well as cases where Fidelity's affiliates may benefit from or be related to the fund's business.
The Board considered the costs of the services provided by and the profits realized by Fidelity in connection with the operation of the fund and was satisfied that the profitability was not excessive.
Economies of Scale. The Board considered whether there have been economies of scale in respect of the management of the Fidelity funds, whether the Fidelity funds (including the fund) have appropriately benefited from any such economies of scale, and whether there is potential for realization of any further economies of scale. The Board considered the extent to which the fund will benefit from economies of scale as assets grow through increased services to the fund, through waivers or reimbursements, or through fee or expense ratio reductions. The Board also noted that a committee (the Economies of Scale Committee) created by it and the boards of other Fidelity funds periodically (most recently in 2013) analyzes whether Fidelity attains economies of scale in respect of the management and servicing of the Fidelity funds, whether the Fidelity funds have appropriately benefited from such economies of scale, and whether there is potential for realization of any further economies of scale.
The Board recognized that the fund's management contract incorporates a "group fee" structure, which provides for lower group fee rates as total group assets increase, and for higher group fee rates as total group assets decrease (with "group assets" defined to include fund assets under FMR's management plus the assets of sector funds previously under FMR's management). FMR calculates the group fee rates based on a tiered asset "breakpoint" schedule that varies based on asset class. The Board considered that the group fee is designed to deliver the benefits of economies of scale to fund shareholders when total Fidelity fund assets increase, even if assets of any particular fund are unchanged or have declined, because some portion of Fidelity's costs are attributable to services provided to all Fidelity funds, and all funds benefit if those costs can be allocated among more assets. The Board concluded that, given the group fee structure, fund shareholders will benefit from lower management fees as group assets increase at the fund complex level, regardless of whether Fidelity achieves any such economies of scale.
The Board concluded, taking into account the analysis of the Economies of Scale Committee, that economies of scale, if any, are being appropriately shared between fund shareholders and Fidelity.
Additional Information Requested by the Board. In order to develop fully the factual basis for consideration of the Fidelity funds' advisory contracts, the Board requested and received additional information on certain topics, including: (i) fund performance trends, in particular the underperformance of certain funds, and Fidelity's long-term strategies for certain funds; (ii) Fidelity's fund profitability methodology, profitability trends for certain funds, and the impact of certain factors on fund profitability results, including the impact of market trends on actively managed funds; (iii) the use of performance fees and the calculation of performance adjustments, including the impact of underperformance and fund outflows on performance adjustments; (iv) metrics for evaluating index fund performance; (v) Fidelity's group fee structure, including the group fee breakpoint schedules; (vi) the terms of Fidelity's contractual and voluntary expense cap arrangements with the funds; (vii) the methodology with respect to evaluating competitive fund data and peer group classifications and fee comparisons; (viii) the expense structures for different funds and classes; (ix) Fidelity's arrangements with affiliated sub-advisers on behalf of the funds; (x) information regarding other accounts managed by Fidelity, including institutional accounts and collective investment trusts; (xi) recent changes to the fee structure for certain funds of funds; and (xii) the impact of the Department of Labor's new fiduciary rule on the funds' comparative expense information.
Based on its evaluation of all of the conclusions noted above, and after considering all factors it believed relevant, the Board concluded that the advisory fee structures are fair and reasonable, and that the fund's Advisory Contracts should be renewed.

ACAN-ANN-1217
1.843165.110
Fidelity Advisor® China Region Fund - Class A, Class M (formerly Class T), Class C and Class I
Annual Report October 31, 2017 Class A, Class M, Class C and Class I are classes of Fidelity® China Region Fund |
|
Contents
To view a fund's proxy voting guidelines and proxy voting record for the 12-month period ended June 30, visit http://www.fidelity.com/proxyvotingresults or visit the Securities and Exchange Commission's (SEC) web site at http://www.sec.gov.
You may also call 1-877-208-0098 to request a free copy of the proxy voting guidelines.
Standard & Poor's, S&P and S&P 500 are registered service marks of The McGraw-Hill Companies, Inc. and have been licensed for use by Fidelity Distributors Corporation.
Other third-party marks appearing herein are the property of their respective owners.
All other marks appearing herein are registered or unregistered trademarks or service marks of FMR LLC or an affiliated company. © 2017 FMR LLC. All rights reserved.
This report and the financial statements contained herein are submitted for the general information of the shareholders of the Fund. This report is not authorized for distribution to prospective investors in the Fund unless preceded or accompanied by an effective prospectus.
A fund files its complete schedule of portfolio holdings with the SEC for the first and third quarters of each fiscal year on Form N-Q. Forms N-Q are available on the SEC’s web site at http://www.sec.gov. A fund's Forms N-Q may be reviewed and copied at the SEC’s Public Reference Room in Washington, DC. Information regarding the operation of the SEC's Public Reference Room may be obtained by calling 1-800-SEC-0330.
For a complete list of a fund's portfolio holdings, view the most recent holdings listing, semiannual report, or annual report on Fidelity's web site at http://www.fidelity.com, http://www.institutional.fidelity.com, or http://www.401k.com, as applicable.
NOT FDIC INSURED •MAY LOSE VALUE •NO BANK GUARANTEE
Neither the Fund nor Fidelity Distributors Corporation is a bank.
Performance: The Bottom Line
Average annual total return reflects the change in the value of an investment, assuming reinvestment of distributions from dividend income and capital gains (the profits earned upon the sale of securities that have grown in value, if any) and assuming a constant rate of performance each year. The hypothetical investment and the average annual total returns do not reflect the deduction of taxes that a shareholder would pay on fund distributions or the redemption of fund shares. During periods of reimbursement by Fidelity, a fund’s total return will be greater than it would be had the reimbursement not occurred. How a fund did yesterday is no guarantee of how it will do tomorrow.
Average Annual Total Returns
| For the periods ended October 31, 2017 | Past 1 year | Past 5 years | Past 10 years |
| Class A (incl. 5.75% sales charge) | 27.87% | 11.05% | 3.45% |
| Class M (incl. 3.50% sales charge) | 30.52% | 11.22% | 3.40% |
| Class C (incl. contingent deferred sales charge) | 33.71% | 11.55% | 3.33% |
| Class I | 36.15% | 12.77% | 4.38% |
Class A shares bear a 0.25% 12b-1 fee. The initial offering of Class A shares took place on May 9, 2008. Returns prior to May 9, 2008, are those of Fidelity® China Region Fund, the original class of the fund, which has no 12b-1 fee. Had Class A's 12b-1 fee been reflected, returns prior to May 9, 2008, would have been lower.
Class M shares bear a 0.50% 12b-1 fee. The initial offering of Class M shares took place on May 9, 2008. Returns prior to May 9, 2008, are those of Fidelity® China Region Fund, the original class of the fund, which has no 12b-1 fee. Had Class M's 12b-1 fee been reflected, returns prior to May 9, 2008, would have been lower.
Class C shares bear a 1.00% 12b-1 fee. The initial offering of Class C shares took place on May 9, 2008. Returns prior to May 9, 2008, are those of Fidelity® China Region Fund, the original class of the fund, which has no 12b-1 fee. Had Class C's 12b-1 fee been reflected, returns prior to May 9, 2008, would have been lower.
Class C shares' contingent deferred sales charges included in the past one year, past five years and past ten years total return figures are 1%, 0% and 0%, respectively.
The initial offering of Class I shares took place on May 9, 2008. Returns prior to May 9, 2008 are those of Fidelity® China Region Fund, the original class of the fund.
$10,000 Over 10 Years
Let's say hypothetically that $10,000 was invested in Fidelity Advisor® China Region Fund - Class A on October 31, 2007, and the current 5.75% sales charge was paid.
The chart shows how the value of your investment would have changed, and also shows how the MSCI Golden Dragon Index performed over the same period.
See above for additional information regarding the performance of Class A.
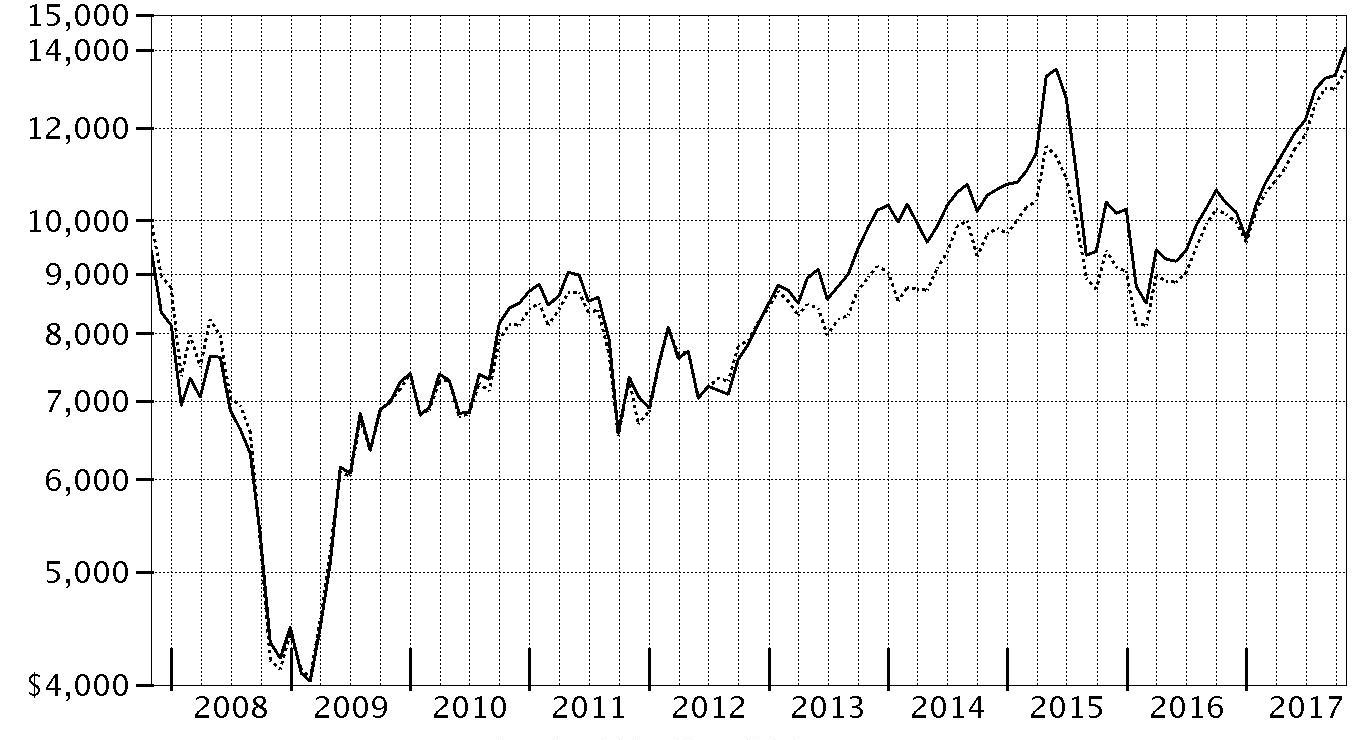
| Period Ending Values |
| $14,037 | Fidelity Advisor® China Region Fund - Class A |
| $13,447 | MSCI Golden Dragon Index |
Management's Discussion of Fund Performance
Market Recap: The MSCI ACWI (All Country World Index) ex USA Index returned 23.85% for the 12 months ending October 31, 2017, helped partly by a generally weak U.S. dollar. Some favorable election results in continental Europe (+30%) suggested ebbing political uncertainty and near-term risk there, but the U.K. (+20%) faced more-mixed conditions ahead of its expected exit from the European Union. Despite central-bank easing – and pressured recently by yen strength – Japan (+18%) lagged the rest of the Asia-Pacific group (+22%). Commodity-price volatility slowed Canada (+17%), but the emerging-markets group (+26%) sped ahead. Sector-wise, information technology (+47%) was driven by a surge among several Chinese internet-related names. Financials (+27%) rode rising interest rates that, at the same time, weighed on real estate (+17%), utilities (+16%), consumer staples (+14%) and telecommunication services (+9%) – so-called “bond proxy” sectors. Materials (+28%) and industrials (+27%) responded to demand from China and price gains for certain commodities. In the energy sector (+20%), oil prices lost ground in the spring before rebounding through October 31 to end well above where they started 12 months ago. Lastly, health care (+14%) was hurt by early-period turmoil around drug pricing and health care legislation.
Comments from Portfolio Manager Robert Bao: For the year, the fund’s share classes (excluding sales charges, if applicable) gained roughly 35% to 36%, topping the 32.83% advance of the benchmark MSCI Golden Dragon Index. Versus the benchmark, positioning in the information technology, consumer discretionary and telecommunication services sectors added the most value. Regionally, underweighting Hong Kong and Taiwan, as well as favorable stock picks in those regions, contributed versus the index. Overweighting China also helped, although picks there detracted. At the stock level, the top relative contributor was wireless services provider China Mobile because this index component returned -6% and we didn’t own it. Several out-of-benchmark positions in China-based companies also were noteworthy contributors, including China Shanshui Cement Group – which I sold by period end – Hangzhou Hikvision Digital Technology, the world’s largest manufacturer of security cameras, and Kweichow Moutai, a maker of the grain-based spirit baijiu. Conversely, positioning in energy and industrials worked against us. China Oilfield Services, a Hong Kong-listed provider of drilling and other energy services, was the fund’s largest relative detractor, followed by non-benchmark positions in two Hong Kong-listed equities: casino operator Summit Ascent Holdings and Zhaojin Mining Industries, a gold-mining stock I bought this period.
The views expressed above reflect those of the portfolio manager(s) only through the end of the period as stated on the cover of this report and do not necessarily represent the views of Fidelity or any other person in the Fidelity organization. Any such views are subject to change at any time based upon market or other conditions and Fidelity disclaims any responsibility to update such views. These views may not be relied on as investment advice and, because investment decisions for a Fidelity fund are based on numerous factors, may not be relied on as an indication of trading intent on behalf of any Fidelity fund.
Investment Summary (Unaudited)
Geographic Diversification (% of fund's net assets)
| As of October 31, 2017 |
| | Cayman Islands | 37.8% |
| | China | 35.7% |
| | Taiwan | 15.3% |
| | Hong Kong | 6.6% |
| | South Africa | 1.5% |
| | Bailiwick of Jersey | 1.0% |
| | British Virgin Islands | 0.9% |
| | United Kingdom | 0.5% |
| | United States of America* | 0.4% |
| | Other | 0.3% |

* Includes Short-Term investments and Net Other Assets (Liabilities).
Percentages are based on country or territory of incorporation and are adjusted for the effect of futures contracts, if applicable.
| As of April 30, 2017 |
| | China | 39.7% |
| | Cayman Islands | 34.3% |
| | Taiwan | 15.2% |
| | Hong Kong | 4.7% |
| | United States of America* | 2.6% |
| | Bailiwick of Jersey | 1.2% |
| | British Virgin Islands | 1.0% |
| | Bermuda | 0.8% |
| | United Kingdom | 0.5% |

* Includes Short-Term investments and Net Other Assets (Liabilities).
Percentages are based on country or territory of incorporation and are adjusted for the effect of futures contracts, if applicable.
Asset Allocation as of October 31, 2017
| | % of fund's net assets | % of fund's net assets 6 months ago |
| Stocks | 99.6 | 97.6 |
| Short-Term Investments and Net Other Assets (Liabilities) | 0.4 | 2.4 |
Top Ten Stocks as of October 31, 2017
| | % of fund's net assets | % of fund's net assets 6 months ago |
| Tencent Holdings Ltd. (Internet Software & Services) | 11.1 | 9.2 |
| Alibaba Group Holding Ltd. sponsored ADR (Internet Software & Services) | 9.6 | 5.7 |
| Taiwan Semiconductor Manufacturing Co. Ltd. (Semiconductors & Semiconductor Equipment) | 6.2 | 6.8 |
| AIA Group Ltd. (Insurance) | 2.8 | 0.0 |
| NetEase, Inc. ADR (Internet Software & Services) | 2.3 | 2.3 |
| JD.com, Inc. sponsored ADR (Internet & Direct Marketing Retail) | 2.3 | 3.2 |
| China Construction Bank Corp. (H Shares) (Banks) | 2.2 | 2.8 |
| Ping An Insurance (Group) Co. of China Ltd. (H Shares) (Insurance) | 1.9 | 1.6 |
| Kweichow Moutai Co. Ltd. (A Shares) (Beverages) | 1.8 | 1.8 |
| Wuliangye Yibin Co. Ltd. Class A (Beverages) | 1.7 | 1.7 |
| | 41.9 | |
Top Market Sectors as of October 31, 2017
| | % of fund's net assets | % of fund's net assets 6 months ago |
| Information Technology | 46.3 | 37.5 |
| Financials | 12.9 | 10.7 |
| Consumer Discretionary | 12.3 | 14.0 |
| Materials | 6.2 | 7.9 |
| Consumer Staples | 5.5 | 5.9 |
| Health Care | 5.4 | 5.1 |
| Industrials | 5.3 | 7.1 |
| Energy | 3.3 | 5.1 |
| Utilities | 1.3 | 2.4 |
| Real Estate | 1.1 | 1.3 |
Market Sectors may include more than one industry category.
The Fund may invest up to 35% of its total assets in any industry that represents more than 20% of the Hong Kong, Taiwanese and Chinese markets. As of October 31, 2017, the Fund did not have more than 25% of its total assets invested in any one industry.
Percentages shown as 0.0% may reflect amounts less than 0.05%.
Investments October 31, 2017
Showing Percentage of Net Assets
| Common Stocks - 98.8% | | | |
| | | Shares | Value |
| CONSUMER DISCRETIONARY - 11.5% | | | |
| Diversified Consumer Services - 1.9% | | | |
| New Oriental Education & Technology Group, Inc. sponsored ADR | | 229,800 | $19,128,552 |
| ZTO Express (Cayman), Inc. sponsored ADR (a) | | 471,400 | 7,537,686 |
| | | | 26,666,238 |
| Hotels, Restaurants & Leisure - 0.0% | | | |
| Huangshan Tourism Development Co. Ltd. | | 14 | 21 |
| Household Durables - 3.7% | | | |
| Hangzhou Robam Appliances Co. Ltd. Class A | | 991,851 | 6,946,799 |
| Midea Group Co. Ltd. Class A | | 2,123,600 | 16,323,321 |
| Nien Made Enterprise Co. Ltd. | | 432,000 | 4,500,896 |
| Sundart Holdings Ltd. | | 20,000,000 | 11,972,210 |
| Techtronic Industries Co. Ltd. | | 1,913,500 | 11,221,399 |
| | | | 50,964,625 |
| Internet & Direct Marketing Retail - 3.2% | | | |
| Ctrip.com International Ltd. ADR (b) | | 99,400 | 4,760,266 |
| JD.com, Inc. sponsored ADR (b) | | 834,000 | 31,291,680 |
| Vipshop Holdings Ltd. ADR (b) | | 1,073,800 | 8,483,020 |
| | | | 44,534,966 |
| Media - 1.5% | | | |
| China Literature Ltd. | | 27,697 | 195,264 |
| Naspers Ltd. Class N | | 81,500 | 19,858,014 |
| | | | 20,053,278 |
| Specialty Retail - 0.4% | | | |
| Chow Tai Fook Jewellery Group Ltd. | | 5,333,800 | 5,572,137 |
| Textiles, Apparel & Luxury Goods - 0.8% | | | |
| Shenzhou International Group Holdings Ltd. | | 1,191,000 | 10,167,483 |
|
| TOTAL CONSUMER DISCRETIONARY | | | 157,958,748 |
|
| CONSUMER STAPLES - 5.5% | | | |
| Beverages - 5.0% | | | |
| Jiangsu Yanghe Brewery Joint-Stock Co. Ltd. Class A | | 1,242,989 | 20,652,475 |
| Kweichow Moutai Co. Ltd. (A Shares) | | 265,732 | 24,752,498 |
| Wuliangye Yibin Co. Ltd. Class A | | 2,363,756 | 23,734,107 |
| | | | 69,139,080 |
| Food & Staples Retailing - 0.5% | | | |
| COFCO Meat Holdings Ltd. (a) | | 34,841,000 | 7,011,609 |
|
| TOTAL CONSUMER STAPLES | | | 76,150,689 |
|
| ENERGY - 3.3% | | | |
| Energy Equipment & Services - 1.2% | | | |
| China Oilfield Services Ltd. (H Shares) | | 19,464,000 | 17,240,013 |
| Oil, Gas & Consumable Fuels - 2.1% | | | |
| CNOOC Ltd. | | 15,768,000 | 21,529,525 |
| PetroChina Co. Ltd. (H Shares) | | 10,832,000 | 7,080,867 |
| | | | 28,610,392 |
|
| TOTAL ENERGY | | | 45,850,405 |
|
| FINANCIALS - 12.9% | | | |
| Banks - 3.9% | | | |
| China Construction Bank Corp. (H Shares) | | 33,810,000 | 30,163,509 |
| Industrial & Commercial Bank of China Ltd. (H Shares) | | 29,680,000 | 23,549,517 |
| | | | 53,713,026 |
| Capital Markets - 1.2% | | | |
| CITIC Securities Co. Ltd. (H Shares) | | 4,092,500 | 9,085,818 |
| Shanghai International Airport Co. Ltd. ELS (UBS Warrant Programme) warrants 5/11/18 (c) | | 1,119,000 | 7,378,597 |
| | | | 16,464,415 |
| Insurance - 7.8% | | | |
| AIA Group Ltd. | | 5,240,400 | 39,430,292 |
| China Life Insurance Co. Ltd. (H Shares) | | 5,682,000 | 18,837,550 |
| China Pacific Insurance (Group) Co. Ltd. (H Shares) | | 4,724,600 | 23,285,676 |
| Ping An Insurance (Group) Co. of China Ltd. (H Shares) | | 3,041,500 | 26,705,816 |
| | | | 108,259,334 |
|
| TOTAL FINANCIALS | | | 178,436,775 |
|
| HEALTH CARE - 5.4% | | | |
| Health Care Providers & Services - 0.6% | | | |
| China Resources Phoenix Health | | 5,764,000 | 7,565,739 |
| Life Sciences Tools & Services - 0.4% | | | |
| JHL Biotech, Inc. (b) | | 3,673,696 | 6,035,062 |
| Pharmaceuticals - 4.4% | | | |
| CSPC Pharmaceutical Group Ltd. | | 10,938,000 | 19,011,880 |
| Jiangsu Hengrui Medicine Co. Ltd. (A Shares) | | 959,932 | 9,726,782 |
| Tonghua Dongbao Pharmaceutical Co. Ltd. Class A | | 4,390,487 | 14,306,520 |
| YiChang HEC ChangJiang Pharmaceutical Co. Ltd. | | 3,291,400 | 9,492,719 |
| Yunnan Baiyao Group Co. Ltd. | | 559,400 | 8,839,243 |
| | | | 61,377,144 |
|
| TOTAL HEALTH CARE | | | 74,977,945 |
|
| INDUSTRIALS - 5.3% | | | |
| Commercial Services & Supplies - 0.7% | | | |
| Focused Photonics Hangzhou, Inc. | | 1,856,652 | 9,424,715 |
| Construction & Engineering - 3.2% | | | |
| Beijing Urban Consolidated & Development Group Ltd. (H Shares) | | 18,319,000 | 10,590,239 |
| China Communications Construction Co. Ltd. (H Shares) | | 12,960,000 | 15,731,946 |
| China Energy Engineering Corp. Ltd. | | 22,208,000 | 3,928,403 |
| China State Construction International Holdings Ltd. | | 9,632,250 | 13,532,117 |
| | | | 43,782,705 |
| Machinery - 0.7% | | | |
| Sany Heavy Industry Co. Ltd. Class A | | 7,886,277 | 9,746,563 |
| Trading Companies & Distributors - 0.3% | | | |
| Summit Ascent Holdings Ltd. (a)(b) | | 31,652,000 | 4,341,226 |
| Transportation Infrastructure - 0.4% | | | |
| Shanghai International Airport Co. Ltd. (A Shares) | | 938,890 | 6,190,966 |
|
| TOTAL INDUSTRIALS | | | 73,486,175 |
|
| INFORMATION TECHNOLOGY - 46.3% | | | |
| Communications Equipment - 1.5% | | | |
| Hytera Communications Corp. Ltd. Class A | | 3,630,953 | 10,485,321 |
| Nanfang Communication Holdings Ltd. | | 20,308,000 | 10,620,740 |
| | | | 21,106,061 |
| Electronic Equipment & Components - 6.6% | | | |
| AVIC Jonhon OptronicTechnology Co. Ltd. | | 2,918,766 | 16,347,096 |
| Chroma ATE, Inc. | | 3,145,000 | 15,339,936 |
| Hangzhou Hikvision Digital Technology Co. Ltd. Class A | | 3,655,950 | 21,643,991 |
| Hon Hai Precision Industry Co. Ltd. (Foxconn) | | 3,778,400 | 14,041,436 |
| Largan Precision Co. Ltd. | | 101,000 | 19,152,399 |
| Lens Technology Co. Ltd. Class A | | 1,006,855 | 5,047,250 |
| | | | 91,572,108 |
| Internet Software & Services - 24.1% | | | |
| 58.com, Inc. ADR (b) | | 219,500 | 14,743,815 |
| Alibaba Group Holding Ltd. sponsored ADR (b) | | 715,300 | 132,251,817 |
| NetEase, Inc. ADR | | 113,600 | 32,026,112 |
| Tencent Holdings Ltd. | | 3,405,300 | 153,051,574 |
| Weibo Corp. sponsored ADR (a)(b) | | 9,970 | 923,721 |
| | | | 332,997,039 |
| Semiconductors & Semiconductor Equipment - 12.7% | | | |
| Advanced Semiconductor Engineering, Inc. | | 3,395,000 | 4,107,393 |
| ASM Pacific Technology Ltd. | | 800,300 | 11,643,301 |
| GlobalWafers Co. Ltd. | | 1,109,500 | 12,829,675 |
| Himax Technologies, Inc. sponsored ADR | | 800,000 | 8,160,000 |
| Nanya Technology Corp. | | 4,781,000 | 12,976,501 |
| Silergy Corp. | | 457,000 | 9,871,491 |
| Sino-American Silicon Products, Inc. | | 3,751,000 | 10,454,708 |
| Taiwan Semiconductor Manufacturing Co. Ltd. | | 10,627,000 | 85,973,179 |
| United Microelectronics Corp. | | 18,963,000 | 9,793,884 |
| Win Semiconductors Corp. | | 1,130,000 | 9,242,319 |
| | | | 175,052,451 |
| Software - 0.4% | | | |
| China City Railway Transportation Technology Holdings Co. Ltd. (b) | | 47,212,000 | 5,386,044 |
| Technology Hardware, Storage & Peripherals - 1.0% | | | |
| ADLINK Technology, Inc. | | 3,682,844 | 8,407,315 |
| Advantech Co. Ltd. | | 380,587 | 2,601,398 |
| Axiomtek Co. Ltd. | | 1,142,000 | 1,955,246 |
| | | | 12,963,959 |
|
| TOTAL INFORMATION TECHNOLOGY | | | 639,077,662 |
|
| MATERIALS - 6.2% | | | |
| Construction Materials - 2.2% | | | |
| BBMG Corp. (H Shares) | | 33,657,000 | 16,782,338 |
| West China Cement Ltd. (b) | | 85,964,000 | 13,663,619 |
| | | | 30,445,957 |
| Metals & Mining - 4.0% | | | |
| Aluminum Corp. of China Ltd. (H Shares) (b) | | 9,772,000 | 7,848,802 |
| Angang Steel Co. Ltd. (A Shares) | | 10,591,910 | 9,961,494 |
| China Molybdenum Co. Ltd. (H Shares) | | 9,999,000 | 6,498,184 |
| Jiangxi Copper Co. Ltd. (H Shares) | | 4,214,000 | 6,719,584 |
| Maanshan Iron & Steel Ltd. (H Shares) (b) | | 13,230,000 | 6,206,809 |
| Zhaojin Mining Industry Co. Ltd. (H Shares) | | 8,844,000 | 7,266,650 |
| Zijin Mng Group Co. Ltd. (H Shares) | | 29,330,000 | 10,150,870 |
| | | | 54,652,393 |
|
| TOTAL MATERIALS | | | 85,098,350 |
|
| REAL ESTATE - 1.1% | | | |
| Real Estate Management & Development - 1.1% | | | |
| Beijing Capital Land Ltd. (H Shares) | | 27,000,000 | 14,535,853 |
| UTILITIES - 1.3% | | | |
| Independent Power and Renewable Electricity Producers - 1.3% | | | |
| Canvest Environmental Protection Group Co. Ltd. (a) | | 16,700,000 | 9,311,790 |
| Huaneng Renewables Corp. Ltd. (H Shares) | | 26,040,000 | 8,945,471 |
| | | | 18,257,261 |
| TOTAL COMMON STOCKS | | | |
| (Cost $1,009,134,734) | | | 1,363,829,863 |
|
| Convertible Preferred Stocks - 0.8% | | | |
| CONSUMER DISCRETIONARY - 0.8% | | | |
| Internet & Direct Marketing Retail - 0.8% | | | |
| China Internet Plus Holdings Ltd. Series A-11 (b)(d)(e) | | | |
| (Cost $6,268,244) | | 1,983,088 | 11,083,598 |
|
| Money Market Funds - 0.6% | | | |
| Fidelity Cash Central Fund, 1.10% (f) | | 459 | 459 |
| Fidelity Securities Lending Cash Central Fund 1.11% (f)(g) | | 9,105,834 | 9,106,745 |
| TOTAL MONEY MARKET FUNDS | | | |
| (Cost $9,106,839) | | | 9,107,204 |
| TOTAL INVESTMENT IN SECURITIES - 100.2% | | | |
| (Cost $1,024,509,817) | | | 1,384,020,665 |
| NET OTHER ASSETS (LIABILITIES) - (0.2)% | | | (3,111,325) |
| NET ASSETS - 100% | | | $1,380,909,340 |
Security Type Abbreviations
ELS – Equity-Linked Security
Legend
(a) Security or a portion of the security is on loan at period end.
(b) Non-income producing
(c) Security exempt from registration under Rule 144A of the Securities Act of 1933. These securities may be resold in transactions exempt from registration, normally to qualified institutional buyers. At the end of the period, the value of these securities amounted to $7,378,597 or 0.5% of net assets.
(d) Restricted securities - Investment in securities not registered under the Securities Act of 1933 (excluding 144A issues). At the end of the period, the value of restricted securities (excluding 144A issues) amounted to $11,083,598 or 0.8% of net assets.
(e) Level 3 security
(f) Affiliated fund that is generally available only to investment companies and other accounts managed by Fidelity Investments. The rate quoted is the annualized seven-day yield of the fund at period end. A complete unaudited listing of the fund's holdings as of its most recent quarter end is available upon request. In addition, each Fidelity Central Fund's financial statements, which are not covered by the Fund's Report of Independent Registered Public Accounting Firm, are available on the SEC's website or upon request.
(g) Investment made with cash collateral received from securities on loan.
Additional information on each restricted holding is as follows:
| Security | Acquisition Date | Acquisition Cost |
| China Internet Plus Holdings Ltd. Series A-11 | 1/26/15 | $6,268,244 |
Affiliated Central Funds
Information regarding fiscal year to date income earned by the Fund from investments in Fidelity Central Funds is as follows:
| Fund | Income earned |
| Fidelity Cash Central Fund | $336,570 |
| Fidelity Securities Lending Cash Central Fund | 548,850 |
| Total | $885,420 |
Investment Valuation
The following is a summary of the inputs used, as of October 31, 2017, involving the Fund's assets and liabilities carried at fair value. The inputs or methodology used for valuing securities may not be an indication of the risk associated with investing in those securities. For more information on valuation inputs, and their aggregation into the levels used below, please refer to the Investment Valuation section in the accompanying Notes to Financial Statements.
| | Valuation Inputs at Reporting Date: |
| Description | Total | Level 1 | Level 2 | Level 3 |
| Investments in Securities: | | | | |
| Equities: | | | | |
| Consumer Discretionary | $169,042,346 | $157,763,484 | $195,264 | $11,083,598 |
| Consumer Staples | 76,150,689 | 76,150,689 | -- | -- |
| Energy | 45,850,405 | 17,240,013 | 28,610,392 | -- |
| Financials | 178,436,775 | 152,220,628 | 26,216,147 | -- |
| Health Care | 74,977,945 | 74,977,945 | -- | -- |
| Industrials | 73,486,175 | 73,486,175 | -- | -- |
| Information Technology | 639,077,662 | 386,151,632 | 252,926,030 | -- |
| Materials | 85,098,350 | 77,249,548 | 7,848,802 | -- |
| Real Estate | 14,535,853 | 14,535,853 | -- | -- |
| Utilities | 18,257,261 | 18,257,261 | -- | -- |
| Money Market Funds | 9,107,204 | 9,107,204 | -- | -- |
| Total Investments in Securities: | $1,384,020,665 | $1,057,140,432 | $315,796,635 | $11,083,598 |
The following is a summary of transfers between Level 1 and Level 2 for the period ended October 31, 2017. Transfers are assumed to have occurred at the beginning of the period, and are primarily attributable to the valuation techniques used for foreign equity securities, as discussed in the accompanying Notes to Financial Statements:
| Transfers | Total |
| Level 1 to Level 2 | $0 |
| Level 2 to Level 1 | $20,300,707 |
The following is a reconciliation of Investments in Securities for which Level 3 inputs were used in determining value:
| Investments in Securities: | |
| Beginning Balance | $16,032,916 |
| Net Realized Gain (Loss) on Investment Securities | 3,052,744 |
| Net Unrealized Gain (Loss) on Investment Securities | 9,545,139 |
| Cost of Purchases | -- |
| Proceeds of Sales | (17,547,201) |
| Amortization/Accretion | -- |
| Transfers into Level 3 | -- |
| Transfers out of Level 3 | -- |
| Ending Balance | $11,083,598 |
| The change in unrealized gain (loss) for the period attributable to Level 3 securities held at October 31, 2017 | $3,427,490 |
The information used in the above reconciliation represents fiscal year to date activity for any Investments in Securities identified as using Level 3 inputs at either the beginning or the end of the current fiscal period. Transfers in or out of Level 3 represent the beginning value of any Security or Instrument where a change in the pricing level occurred from the beginning to the end of the period. The cost of purchases and the proceeds of sales may include securities received or delivered through corporate actions or exchanges.
See accompanying notes which are an integral part of the financial statements.
Financial Statements
Statement of Assets and Liabilities
| | | October 31, 2017 |
| Assets | | |
Investment in securities, at value (including securities loaned of $8,701,526) — See accompanying schedule:
Unaffiliated issuers (cost $1,015,402,978) | $1,374,913,461 | |
| Fidelity Central Funds (cost $9,106,839) | 9,107,204 | |
| Total Investment in Securities (cost $1,024,509,817) | | $1,384,020,665 |
| Foreign currency held at value (cost $23,922,292) | | 23,923,424 |
| Receivable for investments sold | | 5,883,085 |
| Receivable for fund shares sold | | 2,672,820 |
| Dividends receivable | | 179,767 |
| Distributions receivable from Fidelity Central Funds | | 64,682 |
| Prepaid expenses | | 2,752 |
| Other receivables | | 53,151 |
| Total assets | | 1,416,800,346 |
| Liabilities | | |
| Payable for investments purchased | $15,435,772 | |
| Payable for fund shares redeemed | 2,330,785 | |
| Accrued management fee | 783,710 | |
| Distribution and service plan fees payable | 21,919 | |
| Notes payable to affiliates | 7,685,000 | |
| Other affiliated payables | 253,185 | |
| Other payables and accrued expenses | 273,960 | |
| Collateral on securities loaned | 9,106,675 | |
| Total liabilities | | 35,891,006 |
| Net Assets | | $1,380,909,340 |
| Net Assets consist of: | | |
| Paid in capital | | $1,156,699,278 |
| Undistributed net investment income | | 5,536,153 |
| Accumulated undistributed net realized gain (loss) on investments and foreign currency transactions | | (140,834,140) |
| Net unrealized appreciation (depreciation) on investments and assets and liabilities in foreign currencies | | 359,508,049 |
| Net Assets | | $1,380,909,340 |
| Calculation of Maximum Offering Price | | |
| Class A: | | |
| Net Asset Value and redemption price per share ($35,539,258 ÷ 1,038,411 shares) | | $34.22 |
| Maximum offering price per share (100/94.25 of $34.22) | | $36.31 |
| Class M: | | |
| Net Asset Value and redemption price per share ($9,763,388 ÷ 286,713 shares) | | $34.05 |
| Maximum offering price per share (100/96.50 of $34.05) | | $35.28 |
| Class C: | | |
| Net Asset Value and offering price per share ($12,951,739 ÷ 387,632 shares)(a) | | $33.41 |
| China Region: | | |
| Net Asset Value, offering price and redemption price per share ($1,294,775,077 ÷ 37,374,777 shares) | | $34.64 |
| Class I: | | |
| Net Asset Value, offering price and redemption price per share ($27,879,878 ÷ 810,109 shares) | | $34.41 |
(a) Redemption price per share is equal to net asset value less any applicable contingent deferred sales charge.
See accompanying notes which are an integral part of the financial statements.
Statement of Operations
| | | Year ended October 31, 2017 |
| Investment Income | | |
| Dividends | | $18,856,818 |
| Income from Fidelity Central Funds | | 885,420 |
| Income before foreign taxes withheld | | 19,742,238 |
| Less foreign taxes withheld | | (2,164,579) |
| Total income | | 17,577,659 |
| Expenses | | |
| Management fee | $7,778,535 | |
| Transfer agent fees | 2,228,475 | |
| Distribution and service plan fees | 204,378 | |
| Accounting and security lending fees | 518,363 | |
| Custodian fees and expenses | 555,106 | |
| Independent trustees' fees and expenses | 4,340 | |
| Registration fees | 82,884 | |
| Audit | 93,465 | |
| Legal | 3,970 | |
| Interest | 5,750 | |
| Miscellaneous | 9,341 | |
| Total expenses before reductions | 11,484,607 | |
| Expense reductions | (198,144) | 11,286,463 |
| Net investment income (loss) | | 6,291,196 |
| Realized and Unrealized Gain (Loss) | | |
| Net realized gain (loss) on: | | |
| Investment securities: | | |
| Unaffiliated issuers | 78,436,133 | |
| Fidelity Central Funds | (2,989) | |
| Foreign currency transactions | (117,423) | |
| Total net realized gain (loss) | | 78,315,721 |
| Change in net unrealized appreciation (depreciation) on: | | |
| Investment securities: | | |
| Unaffiliated issuers | 266,759,046 | |
| Fidelity Central Funds | (1,961) | |
| Assets and liabilities in foreign currencies | (7,860) | |
| Total change in net unrealized appreciation (depreciation) | | 266,749,225 |
| Net gain (loss) | | 345,064,946 |
| Net increase (decrease) in net assets resulting from operations | | $351,356,142 |
See accompanying notes which are an integral part of the financial statements.
Statement of Changes in Net Assets
| | Year ended October 31, 2017 | Year ended October 31, 2016 |
| Increase (Decrease) in Net Assets | | |
| Operations | | |
| Net investment income (loss) | $6,291,196 | $11,358,761 |
| Net realized gain (loss) | 78,315,721 | (213,446,905) |
| Change in net unrealized appreciation (depreciation) | 266,749,225 | 180,733,105 |
| Net increase (decrease) in net assets resulting from operations | 351,356,142 | (21,355,039) |
| Distributions to shareholders from net investment income | (10,635,865) | (15,103,497) |
| Distributions to shareholders from net realized gain | (1,988,966) | (159,831,115) |
| Total distributions | (12,624,831) | (174,934,612) |
| Share transactions - net increase (decrease) | (22,198,615) | (83,319,865) |
| Redemption fees | 258,175 | 164,633 |
| Total increase (decrease) in net assets | 316,790,871 | (279,444,883) |
| Net Assets | | |
| Beginning of period | 1,064,118,469 | 1,343,563,352 |
| End of period | $1,380,909,340 | $1,064,118,469 |
| Other Information | | |
| Undistributed net investment income end of period | $5,536,153 | $10,634,162 |
See accompanying notes which are an integral part of the financial statements.
Financial Highlights
Fidelity China Region Fund Class A
| Years ended October 31, | 2017 | 2016 | 2015 | 2014 | 2013 |
| Selected Per–Share Data | | | | | |
| Net asset value, beginning of period | $25.46 | $29.34 | $34.18 | $35.56 | $28.53 |
| Income from Investment Operations | | | | | |
| Net investment income (loss)A | .08 | .18 | .40B | .21 | .30 |
| Net realized and unrealized gain (loss) | 8.90 | (.20) | (.83) | 2.01C | 7.06 |
| Total from investment operations | 8.98 | (.02) | (.43) | 2.22 | 7.36 |
| Distributions from net investment income | (.18) | (.27) | (.22) | (.30) | (.34) |
| Distributions from net realized gain | (.05) | (3.59) | (4.24) | (3.31) | – |
| Total distributions | (.23) | (3.86) | (4.46) | (3.61) | (.34) |
| Redemption fees added to paid in capitalA | .01 | –D | .05 | .01 | .01 |
| Net asset value, end of period | $34.22 | $25.46 | $29.34 | $34.18 | $35.56 |
| Total ReturnE,F | 35.67% | (.13)% | (1.45)% | 6.45%C | 26.07% |
| Ratios to Average Net AssetsG,H | | | | | |
| Expenses before reductions | 1.30% | 1.33% | 1.28% | 1.35% | 1.35% |
| Expenses net of fee waivers, if any | 1.30% | 1.33% | 1.28% | 1.35% | 1.35% |
| Expenses net of all reductions | 1.29% | 1.32% | 1.26% | 1.35% | 1.31% |
| Net investment income (loss) | .28% | .75% | 1.26%B | .64% | .94% |
| Supplemental Data | | | | | |
| Net assets, end of period (000 omitted) | $35,539 | $22,937 | $32,761 | $21,728 | $20,623 |
| Portfolio turnover rateI | 68% | 70% | 151% | 87% | 92% |
A Calculated based on average shares outstanding during the period.
B Net Investment income per share reflects a large, non-recurring dividend which amounted to $.13 per share. Excluding this non-recurring dividend, the ratio of net investment income (loss) to average net assets would have been .85%.
C Amount includes a reimbursement from the adviser for an operations error which amounted to $.01 per share. Excluding this reimbursement, the total return would have been 6.42%.
D Amount represents less than $.005 per share.
E Total returns would have been lower if certain expenses had not been reduced during the applicable periods shown.
F Total returns do not include the effect of the sales charges.
G Fees and expenses of any underlying Fidelity Central Funds are not included in the Fund's expense ratio. The Fund indirectly bears its proportionate share of the expenses of any underlying Fidelity Central Funds.
H Expense ratios reflect operating expenses of the class. Expenses before reductions do not reflect amounts reimbursed by the investment adviser or reductions from brokerage service arrangements or reductions from other expense offset arrangements and do not represent the amount paid by the class during periods when reimbursements or reductions occur. Expenses net of fee waivers reflect expenses after reimbursement by the investment adviser but prior to reductions from brokerage service arrangements or other expense offset arrangements. Expenses net of all reductions represent the net expenses paid by the class.
I Amount does not include the portfolio activity of any underlying Fidelity Central Funds.
See accompanying notes which are an integral part of the financial statements.
Fidelity China Region Fund Class M
| Years ended October 31, | 2017 | 2016 | 2015 | 2014 | 2013 |
| Selected Per–Share Data | | | | | |
| Net asset value, beginning of period | $25.34 | $29.18 | $34.02 | $35.40 | $28.40 |
| Income from Investment Operations | | | | | |
| Net investment income (loss)A | (.02) | .10 | .30B | .12 | .21 |
| Net realized and unrealized gain (loss) | 8.88 | (.22) | (.83) | 1.99C | 7.04 |
| Total from investment operations | 8.86 | (.12) | (.53) | 2.11 | 7.25 |
| Distributions from net investment income | (.11) | (.13) | (.12) | (.19) | (.26) |
| Distributions from net realized gain | (.05) | (3.59) | (4.24) | (3.31) | – |
| Total distributions | (.16) | (3.72) | (4.36) | (3.50) | (.26) |
| Redemption fees added to paid in capitalA | .01 | –D | .05 | .01 | .01 |
| Net asset value, end of period | $34.05 | $25.34 | $29.18 | $34.02 | $35.40 |
| Total ReturnE,F | 35.25% | (.50)% | (1.79)% | 6.15%C | 25.74% |
| Ratios to Average Net AssetsG,H | | | | | |
| Expenses before reductions | 1.65% | 1.67% | 1.62% | 1.65% | 1.64% |
| Expenses net of fee waivers, if any | 1.65% | 1.67% | 1.62% | 1.65% | 1.64% |
| Expenses net of all reductions | 1.64% | 1.67% | 1.60% | 1.65% | 1.60% |
| Net investment income (loss) | (.07)% | .40% | .92%B | .35% | .65% |
| Supplemental Data | | | | | |
| Net assets, end of period (000 omitted) | $9,763 | $5,644 | $6,409 | $6,305 | $5,965 |
| Portfolio turnover rateI | 68% | 70% | 151% | 87% | 92% |
A Calculated based on average shares outstanding during the period.
B Net Investment income per share reflects a large, non-recurring dividend which amounted to $.13 per share. Excluding this non-recurring dividend, the ratio of net investment income (loss) to average net assets would have been .51%.
C Amount includes a reimbursement from the adviser for an operations error which amounted to $.01 per share. Excluding this reimbursement, the total return would have been 6.12%.
D Amount represents less than $.005 per share.
E Total returns would have been lower if certain expenses had not been reduced during the applicable periods shown.
F Total returns do not include the effect of the sales charges.
G Fees and expenses of any underlying Fidelity Central Funds are not included in the Fund's expense ratio. The Fund indirectly bears its proportionate share of the expenses of any underlying Fidelity Central Funds.
H Expense ratios reflect operating expenses of the class. Expenses before reductions do not reflect amounts reimbursed by the investment adviser or reductions from brokerage service arrangements or reductions from other expense offset arrangements and do not represent the amount paid by the class during periods when reimbursements or reductions occur. Expenses net of fee waivers reflect expenses after reimbursement by the investment adviser but prior to reductions from brokerage service arrangements or other expense offset arrangements. Expenses net of all reductions represent the net expenses paid by the class.
I Amount does not include the portfolio activity of any underlying Fidelity Central Funds.
See accompanying notes which are an integral part of the financial statements.
Fidelity China Region Fund Class C
| Years ended October 31, | 2017 | 2016 | 2015 | 2014 | 2013 |
| Selected Per–Share Data | | | | | |
| Net asset value, beginning of period | $24.82 | $28.68 | $33.56 | $34.99 | $28.07 |
| Income from Investment Operations | | | | | |
| Net investment income (loss)A | (.13) | –B | .15C | (.02) | .06 |
| Net realized and unrealized gain (loss) | 8.73 | (.21) | (.80) | 1.97D | 6.97 |
| Total from investment operations | 8.60 | (.21) | (.65) | 1.95 | 7.03 |
| Distributions from net investment income | – | (.06) | (.04) | (.08) | (.12) |
| Distributions from net realized gain | (.02) | (3.59) | (4.24) | (3.31) | – |
| Total distributions | (.02) | (3.65) | (4.28) | (3.39) | (.12) |
| Redemption fees added to paid in capitalA | .01 | –B | .05 | .01 | .01 |
| Net asset value, end of period | $33.41 | $24.82 | $28.68 | $33.56 | $34.99 |
| Total ReturnE,F | 34.71% | (.88)% | (2.21)% | 5.71%D | 25.14% |
| Ratios to Average Net AssetsG,H | | | | | |
| Expenses before reductions | 2.05% | 2.07% | 2.05% | 2.07% | 2.10% |
| Expenses net of fee waivers, if any | 2.05% | 2.07% | 2.05% | 2.07% | 2.10% |
| Expenses net of all reductions | 2.03% | 2.06% | 2.02% | 2.07% | 2.07% |
| Net investment income (loss) | (.46)% | .01% | .49%C | (.07)% | .19% |
| Supplemental Data | | | | | |
| Net assets, end of period (000 omitted) | $12,952 | $11,218 | $14,355 | $10,445 | $6,957 |
| Portfolio turnover rateI | 68% | 70% | 151% | 87% | 92% |
A Calculated based on average shares outstanding during the period.
B Amount represents less than $.005 per share.
C Net Investment income per share reflects a large, non-recurring dividend which amounted to $.13 per share. Excluding this non-recurring dividend, the ratio of net investment income (loss) to average net assets would have been .09%.
D Amount includes a reimbursement from the adviser for an operations error which amounted to $.01 per share. Excluding this reimbursement, the total return would have been 5.68%.
E Total returns would have been lower if certain expenses had not been reduced during the applicable periods shown.
F Total returns do not include the effect of the contingent deferred sales charge.
G Fees and expenses of any underlying Fidelity Central Funds are not included in the Fund's expense ratio. The Fund indirectly bears its proportionate share of the expenses of any underlying Fidelity Central Funds.
H Expense ratios reflect operating expenses of the class. Expenses before reductions do not reflect amounts reimbursed by the investment adviser or reductions from brokerage service arrangements or reductions from other expense offset arrangements and do not represent the amount paid by the class during periods when reimbursements or reductions occur. Expenses net of fee waivers reflect expenses after reimbursement by the investment adviser but prior to reductions from brokerage service arrangements or other expense offset arrangements. Expenses net of all reductions represent the net expenses paid by the class.
I Amount does not include the portfolio activity of any underlying Fidelity Central Funds.
See accompanying notes which are an integral part of the financial statements.
Fidelity China Region Fund
| Years ended October 31, | 2017 | 2016 | 2015 | 2014 | 2013 |
| Selected Per–Share Data | | | | | |
| Net asset value, beginning of period | $25.78 | $29.66 | $34.51 | $35.83 | $28.73 |
| Income from Investment Operations | | | | | |
| Net investment income (loss)A | .17 | .26 | .51B | .33 | .41 |
| Net realized and unrealized gain (loss) | 9.00 | (.21) | (.84) | 2.03C | 7.11 |
| Total from investment operations | 9.17 | .05 | (.33) | 2.36 | 7.52 |
| Distributions from net investment income | (.27) | (.35) | (.33) | (.38) | (.43) |
| Distributions from net realized gain | (.05) | (3.59) | (4.24) | (3.31) | – |
| Total distributions | (.32) | (3.93)D | (4.57) | (3.69) | (.43) |
| Redemption fees added to paid in capitalA | .01 | –E | .05 | .01 | .01 |
| Net asset value, end of period | $34.64 | $25.78 | $29.66 | $34.51 | $35.83 |
| Total ReturnF | 36.10% | .15% | (1.14)% | 6.83%C | 26.51% |
| Ratios to Average Net AssetsG,H | | | | | |
| Expenses before reductions | 1.00% | 1.02% | .99% | 1.01% | 1.02% |
| Expenses net of fee waivers, if any | 1.00% | 1.02% | .98% | 1.01% | 1.02% |
| Expenses net of all reductions | .99% | 1.01% | .96% | 1.01% | .98% |
| Net investment income (loss) | .58% | 1.06% | 1.55%B | .99% | 1.27% |
| Supplemental Data | | | | | |
| Net assets, end of period (000 omitted) | $1,294,775 | $1,004,985 | $1,262,274 | $1,352,761 | $1,425,828 |
| Portfolio turnover rateI | 68% | 70% | 151% | 87% | 92% |
A Calculated based on average shares outstanding during the period.
B Net Investment income per share reflects a large, non-recurring dividend which amounted to $.13 per share. Excluding this non-recurring dividend, the ratio of net investment income (loss) to average net assets would have been 1.15%.
C Amount includes a reimbursement from the adviser for an operations error which amounted to $.01 per share. Excluding this reimbursement, the total return would have been 6.80%.
D Total distributions of $3.93 per share is comprised of distributions from net investment income of $.345 and distributions from net realized gain of $3.588 per share.
E Amount represents less than $.005 per share.
F Total returns would have been lower if certain expenses had not been reduced during the applicable periods shown.
G Fees and expenses of any underlying Fidelity Central Funds are not included in the Fund's expense ratio. The Fund indirectly bears its proportionate share of the expenses of any underlying Fidelity Central Funds.
H Expense ratios reflect operating expenses of the class. Expenses before reductions do not reflect amounts reimbursed by the investment adviser or reductions from brokerage service arrangements or reductions from other expense offset arrangements and do not represent the amount paid by the class during periods when reimbursements or reductions occur. Expenses net of fee waivers reflect expenses after reimbursement by the investment adviser but prior to reductions from brokerage service arrangements or other expense offset arrangements. Expenses net of all reductions represent the net expenses paid by the class.
I Amount does not include the portfolio activity of any underlying Fidelity Central Funds.
See accompanying notes which are an integral part of the financial statements.
Fidelity China Region Fund Class I
| Years ended October 31, | 2017 | 2016 | 2015 | 2014 | 2013 |
| Selected Per–Share Data | | | | | |
| Net asset value, beginning of period | $25.62 | $29.51 | $34.39 | $35.75 | $28.68 |
| Income from Investment Operations | | | | | |
| Net investment income (loss)A | .16 | .26 | .51B | .34 | .42 |
| Net realized and unrealized gain (loss) | 8.95 | (.20) | (.84) | 2.02C | 7.10 |
| Total from investment operations | 9.11 | .06 | (.33) | 2.36 | 7.52 |
| Distributions from net investment income | (.28) | (.36) | (.36) | (.43) | (.46) |
| Distributions from net realized gain | (.05) | (3.59) | (4.24) | (3.31) | – |
| Total distributions | (.33) | (3.95) | (4.60) | (3.73)D | (.46) |
| Redemption fees added to paid in capitalA | .01 | –E | .05 | .01 | .01 |
| Net asset value, end of period | $34.41 | $25.62 | $29.51 | $34.39 | $35.75 |
| Total ReturnF | 36.11% | .16% | (1.14)% | 6.87%C | 26.58% |
| Ratios to Average Net AssetsG,H | | | | | |
| Expenses before reductions | 1.01% | 1.00% | .97% | .98% | .97% |
| Expenses net of fee waivers, if any | 1.01% | 1.00% | .97% | .98% | .97% |
| Expenses net of all reductions | .99% | .99% | .95% | .98% | .93% |
| Net investment income (loss) | .57% | 1.07% | 1.57%B | 1.01% | 1.32% |
| Supplemental Data | | | | | |
| Net assets, end of period (000 omitted) | $27,880 | $19,334 | $26,961 | $19,404 | $10,206 |
| Portfolio turnover rateI | 68% | 70% | 151% | 87% | 92% |
A Calculated based on average shares outstanding during the period.
B Net Investment income per share reflects a large, non-recurring dividend which amounted to $.13 per share. Excluding this non-recurring dividend, the ratio of net investment income (loss) to average net assets would have been 1.16%.
C Amount includes a reimbursement from the adviser for an operations error which amounted to $.01 per share. Excluding this reimbursement, the total return would have been 6.84%.
D Total distributions of $3.73 per share is comprised of distributions from net investment income of $.425 and distributions from net realized gain of $3.306 per share.
E Amount represents less than $.005 per share.
F Total returns would have been lower if certain expenses had not been reduced during the applicable periods shown.
G Fees and expenses of any underlying Fidelity Central Funds are not included in the Fund's expense ratio. The Fund indirectly bears its proportionate share of the expenses of any underlying Fidelity Central Funds.
H Expense ratios reflect operating expenses of the class. Expenses before reductions do not reflect amounts reimbursed by the investment adviser or reductions from brokerage service arrangements or reductions from other expense offset arrangements and do not represent the amount paid by the class during periods when reimbursements or reductions occur. Expenses net of fee waivers reflect expenses after reimbursement by the investment adviser but prior to reductions from brokerage service arrangements or other expense offset arrangements. Expenses net of all reductions represent the net expenses paid by the class.
I Amount does not include the portfolio activity of any underlying Fidelity Central Funds.
See accompanying notes which are an integral part of the financial statements.
Notes to Financial Statements
For the period ended October 31, 2017
1. Organization.
Fidelity China Region Fund (the Fund) is a fund of Fidelity Investment Trust (the Trust) and is authorized to issue an unlimited number of shares. The Trust is registered under the Investment Company Act of 1940, as amended (the 1940 Act), as an open-end management investment company organized as a Massachusetts business trust. The Fund offers Class A, Class M (formerly Class T), Class C, China Region and Class I shares, each of which has equal rights as to assets and voting privileges. Each class has exclusive voting rights with respect to matters that affect that class. The Fund's investments in emerging markets can be subject to social, economic, regulatory, and political uncertainties and can be extremely volatile.
After the close of business on June 24, 2016, all outstanding Class B shares were converted to Class A shares. All prior fiscal period dollar and share amounts for Class B presented in the Notes to Financial Statements are for the period November 1, 2015 through June 24, 2016.
2. Investments in Fidelity Central Funds.
The Fund invests in Fidelity Central Funds, which are open-end investment companies generally available only to other investment companies and accounts managed by the investment adviser and its affiliates. The Fund's Schedule of Investments lists each of the Fidelity Central Funds held as of period end, if any, as an investment of the Fund, but does not include the underlying holdings of each Fidelity Central Fund. As an Investing Fund, the Fund indirectly bears its proportionate share of the expenses of the underlying Fidelity Central Funds.
The Money Market Central Funds seek preservation of capital and current income and are managed by Fidelity Investments Money Management, Inc. (FIMM), an affiliate of the investment adviser. Annualized expenses of the Money Market Central Funds as of their most recent shareholder report date are less than .005%.
A complete unaudited list of holdings for each Fidelity Central Fund is available upon request or at the Securities and Exchange Commission (the SEC) website at www.sec.gov. In addition, the financial statements of the Fidelity Central Funds, which are not covered by the Fund's Report of Independent Registered Public Accounting Firm, are available on the SEC website or upon request.
3. Significant Accounting Policies.
The Fund is an investment company and applies the accounting and reporting guidance of the Financial Accounting Standards Board (FASB) Accounting Standards Codification Topic 946 Financial Services – Investments Companies. The financial statements have been prepared in conformity with accounting principles generally accepted in the United States of America (GAAP), which require management to make certain estimates and assumptions at the date of the financial statements. Actual results could differ from those estimates. Subsequent events, if any, through the date that the financial statements were issued have been evaluated in the preparation of the financial statements. The following summarizes the significant accounting policies of the Fund:
Investment Valuation. Investments are valued as of 4:00 p.m. Eastern time on the last calendar day of the period. The Board of Trustees (the Board) has delegated the day to day responsibility for the valuation of the Fund's investments to the Fair Value Committee (the Committee) established by the Fund's investment adviser. In accordance with valuation policies and procedures approved by the Board, the Fund attempts to obtain prices from one or more third party pricing vendors or brokers to value its investments. When current market prices, quotations or currency exchange rates are not readily available or reliable, investments will be fair valued in good faith by the Committee, in accordance with procedures adopted by the Board. Factors used in determining fair value vary by investment type and may include market or investment specific events. The frequency with which these procedures are used cannot be predicted and they may be utilized to a significant extent. The Committee oversees the Fund's valuation policies and procedures and reports to the Board on the Committee's activities and fair value determinations. The Board monitors the appropriateness of the procedures used in valuing the Fund's investments and ratifies the fair value determinations of the Committee.
The Fund categorizes the inputs to valuation techniques used to value its investments into a disclosure hierarchy consisting of three levels as shown below:
- Level 1 – quoted prices in active markets for identical investments
- Level 2 – other significant observable inputs (including quoted prices for similar investments, interest rates, prepayment speeds, etc.)
- Level 3 – unobservable inputs (including the Fund's own assumptions based on the best information available)
Valuation techniques used to value the Fund's investments by major category are as follows:
Equity securities, including restricted securities, for which market quotations are readily available, are valued at the last reported sale price or official closing price as reported by a third party pricing vendor on the primary market or exchange on which they are traded and are categorized as Level 1 in the hierarchy. In the event there were no sales during the day or closing prices are not available, securities are valued at the last quoted bid price or may be valued using the last available price and are generally categorized as Level 2 in the hierarchy. For foreign equity securities, when market or security specific events arise, comparisons to the valuation of American Depositary Receipts (ADRs), futures contracts, Exchange-Traded Funds (ETFs) and certain indexes as well as quoted prices for similar securities may be used and would be categorized as Level 2 in the hierarchy. Utilizing these techniques may result in transfers between Level 1 and Level 2. For equity securities, including restricted securities, where observable inputs are limited, assumptions about market activity and risk are used and these securities may be categorized as Level 3 in the hierarchy.
Investments in open-end mutual funds, including the Fidelity Central Funds, are valued at their closing net asset value (NAV) each business day and are categorized as Level 1 in the hierarchy.
Changes in valuation techniques may result in transfers in or out of an assigned level within the disclosure hierarchy. The aggregate value of investments by input level as of October 31, 2017, including information on transfers between Levels 1 and 2, as well as a roll forward of Level 3 investments, is included at the end of the Fund's Schedule of Investments.
Foreign Currency. The Fund may use foreign currency contracts to facilitate transactions in foreign-denominated securities. Gains and losses from these transactions may arise from changes in the value of the foreign currency or if the counterparties do not perform under the contracts' terms.
Foreign-denominated assets, including investment securities, and liabilities are translated into U.S. dollars at the exchange rates at period end. Purchases and sales of investment securities, income and dividends received and expenses denominated in foreign currencies are translated into U.S. dollars at the exchange rate in effect on the transaction date.
The effects of exchange rate fluctuations on investments are included with the net realized and unrealized gain (loss) on investment securities. Other foreign currency transactions resulting in realized and unrealized gain (loss) are disclosed separately.
Investment Transactions and Income. For financial reporting purposes, the Fund's investment holdings and NAV include trades executed through the end of the last business day of the period. The NAV per share for processing shareholder transactions is calculated as of the close of business of the New York Stock Exchange (NYSE), normally 4:00 p.m. Eastern time and includes trades executed through the end of the prior business day. Gains and losses on securities sold are determined on the basis of identified cost. Dividend income is recorded on the ex-dividend date, except for certain dividends from foreign securities where the ex-dividend date may have passed, which are recorded as soon as the Fund is informed of the ex-dividend date. Non-cash dividends included in dividend income, if any, are recorded at the fair market value of the securities received. Income and capital gain distributions from Fidelity Central Funds, if any, are recorded on the ex-dividend date. Investment income is recorded net of foreign taxes withheld where recovery of such taxes is uncertain.
Class Allocations and Expenses. Investment income, realized and unrealized capital gains and losses, common expenses of the Fund, and certain fund-level expense reductions, if any, are allocated daily on a pro-rata basis to each class based on the relative net assets of each class to the total net assets of the Fund. Each class differs with respect to transfer agent and distribution and service plan fees incurred. Certain expense reductions may also differ by class. For the reporting period, the allocated portion of income and expenses to each class as a percent of its average net assets may vary due to the timing of recording these transactions in relation to fluctuating net assets of the classes. Expenses directly attributable to a fund are charged to that fund. Expenses attributable to more than one fund are allocated among the respective funds on the basis of relative net assets or other appropriate methods. Expense estimates are accrued in the period to which they relate and adjustments are made when actual amounts are known.
Income Tax Information and Distributions to Shareholders. Each year, the Fund intends to qualify as a regulated investment company under Subchapter M of the Internal Revenue Code, including distributing substantially all of its taxable income and realized gains. As a result, no provision for U.S. Federal income taxes is required. As of October 31, 2017, the Fund did not have any unrecognized tax benefits in the financial statements; nor is the Fund aware of any tax positions for which it is reasonably possible that the total amounts of unrecognized tax benefits will significantly change in the next twelve months. The Fund files a U.S. federal tax return, in addition to state and local tax returns as required. The Fund's federal income tax returns are subject to examination by the Internal Revenue Service (IRS) for a period of three fiscal years after they are filed. State and local tax returns may be subject to examination for an additional fiscal year depending on the jurisdiction. Foreign taxes are provided for based on the Fund's understanding of the tax rules and rates that exist in the foreign markets in which it invests.
Distributions are declared and recorded on the ex-dividend date. Income dividends and capital gain distributions are declared separately for each class. Income and capital gain distributions are determined in accordance with income tax regulations, which may differ from GAAP.
Capital accounts within the financial statements are adjusted for permanent book-tax differences. These adjustments have no impact on net assets or the results of operations. Capital accounts are not adjusted for temporary book-tax differences which will reverse in a subsequent period.
Book-tax differences are primarily due to foreign currency transactions, passive foreign investment companies (PFIC), deferred trustees compensation, capital loss carryforwards and losses deferred due to wash sales.
As of period end, the cost and unrealized appreciation (depreciation) in securities, and derivatives if applicable, for federal income tax purposes were as follows:
| Gross unrealized appreciation | $398,740,351 |
| Gross unrealized depreciation | (40,859,652) |
| Net unrealized appreciation (depreciation) | $357,880,699 |
| Tax Cost | $1,026,139,966 |
The tax-based components of distributable earnings as of period end were as follows:
| Undistributed ordinary income | $5,536,158 |
| Capital loss carryforward | $(139,203,991) |
| Net unrealized appreciation (depreciation) on securities and other investments | $357,877,900 |
Capital loss carryforwards are only available to offset future capital gains of the Fund to the extent provided by regulations and may be limited. Under the Regulated Investment Company Modernization Act of 2010 (the Act), the Fund is permitted to carry forward capital losses incurred in taxable years beginning after December 22, 2010 for an unlimited period and such capital losses are required to be used prior to any losses that expire. The capital loss carryforward information presented below, including any applicable limitation, is estimated as of fiscal period end and is subject to adjustment.
| No expiration | |
| Short-term | $(139,203,991) |
The tax character of distributions paid was as follows:
| | October 31, 2017 | October 31, 2016 |
| Ordinary Income | $12,624,831 | $ 15,103,497 |
| Long-term Capital Gains | – | 159,831,115 |
| Total | $12,624,831 | $ 174,934,612 |
Short-Term Trading (Redemption) Fees. Shares held by investors in the Fund less than 90 days may have been subject to a redemption fee equal to 1.50% of the NAV of shares redeemed. All redemption fees, which reduce the proceeds of the shareholder redemption, are retained by the Fund and accounted for as an addition to paid in capital. In November 2017, the Board of Trustees approved the elimination of these redemption fees effective December 18, 2017.
Restricted Securities. The Fund may invest in securities that are subject to legal or contractual restrictions on resale. These securities generally may be resold in transactions exempt from registration or to the public if the securities are registered. Disposal of these securities may involve time-consuming negotiations and expense, and prompt sale at an acceptable price may be difficult. Information regarding restricted securities is included at the end of the Fund's Schedule of Investments.
4. Purchases and Sales of Investments.
Purchases and sales of securities, other than short-term securities, aggregated $781,020,865 and $742,128,259, respectively.
5. Fees and Other Transactions with Affiliates.
Management Fee. Fidelity Management & Research Company (the investment adviser) and its affiliates provide the Fund with investment management related services for which the Fund pays a monthly management fee. The management fee is the sum of an individual fund fee rate that is based on an annual rate of .45% of the Fund's average net assets and an annualized group fee rate that averaged .25% during the period. The group fee rate is based upon the average net assets of all the mutual funds advised by the investment adviser, including any mutual funds previously advised by the investment adviser that are currently advised by Fidelity SelectCo, LLC, an affiliate of the investment adviser. The group fee rate decreases as assets under management increase and increases as assets under management decrease. For the reporting period, the total annual management fee rate was .69% of the Fund's average net assets.
Distribution and Service Plan Fees. In accordance with Rule 12b-1 of the 1940 Act, the Fund has adopted separate Distribution and Service Plans for each class of shares. Certain classes pay Fidelity Distributors Corporation (FDC), an affiliate of the investment adviser, separate Distribution and Service Fees, each of which is based on an annual percentage of each class' average net assets. In addition, FDC may pay financial intermediaries for selling shares of the Fund and providing shareholder support services. For the period, the Distribution and Service Fee rates, total fees and amounts retained by FDC were as follows:
| | Distribution
Fee | Service
Fee | Total Fees | Retained
by FDC |
| Class A | -% | .25% | $64,901 | $– |
| Class M | .25% | .25% | 34,400 | 222 |
| Class C | .75% | .25% | 105,077 | 9,924 |
| | | | $204,378 | $10,146 |
Sales Load. FDC may receive a front-end sales charge of up to 5.75% for selling Class A shares and 3.50% for selling Class M shares, some of which is paid to financial intermediaries for selling shares of the Fund. Depending on the holding period, FDC may receive contingent deferred sales charges levied on Class A, Class M and Class C redemptions. The deferred sales charges are 1.00% for Class C shares, 1.00% for certain purchases of Class A shares and .25% for certain purchases of Class M shares.
For the period, sales charge amounts retained by FDC were as follows:
| | Retained
by FDC |
| Class A | $11,444 |
| Class M | 1,704 |
| Class C(a) | 1,646 |
| | $14,794 |
(a) When Class C shares are initially sold, FDC pays commissions from its own resources to financial intermediaries through which the sales are made.
Transfer Agent Fees. Fidelity Investments Institutional Operations Company, Inc., (FIIOC), an affiliate of the investment adviser, is the transfer, dividend disbursing and shareholder servicing agent for each class of the Fund. FIIOC receives account fees and asset-based fees that vary according to the account size and type of account of the shareholders of the respective classes of the Fund. FIIOC pays for typesetting, printing and mailing of shareholder reports, except proxy statements.
For the period, transfer agent fees for each class were as follows:
| | Amount | % of
Class-Level Average
Net Assets |
| Class A | $64,503 | .25 |
| Class M | 24,020 | .35 |
| Class C | 25,645 | .24 |
| China Region | 2,069,254 | .20 |
| Class I | 45,053 | .20 |
| | $2,228,475 | |
Accounting and Security Lending Fees. Fidelity Service Company, Inc. (FSC), an affiliate of the investment adviser, maintains the Fund's accounting records. The accounting fee is based on the level of average net assets for each month. Under a separate contract, FSC administers the security lending program. The security lending fee is based on the number and duration of lending transactions.
Brokerage Commissions. The Fund placed a portion of its portfolio transactions with brokerage firms which are affiliates of the investment adviser. Brokerage commissions are included in net realized gain (loss) and change in net unrealized appreciation (depreciation) in the Statement of Operations. The commissions paid to these affiliated firms were $3,282 for the period.
Interfund Lending Program. Pursuant to an Exemptive Order issued by the SEC, the Fund, along with other registered investment companies having management contracts with Fidelity Management & Research Company (FMR) or other affiliated entities of FMR, may participate in an interfund lending program. This program provides an alternative credit facility allowing the funds to borrow from, or lend money to, other participating affiliated funds. Any open loans, including accrued interest, at period end are presented under the caption "Notes payable to affiliates" in the Fund's Statement of Assets and Liabilities. The Fund's activity in this program during the period for which loans were outstanding was as follows:
| Borrower or Lender | Average Loan Balance | Weighted Average Interest Rate | Interest Expense |
| Borrower | $12,007,182 | .73% | $5,376 |
Interfund Trades. The Fund may purchase from or sell securities to other Fidelity Funds under procedures adopted by the Board. The procedures have been designed to ensure these interfund trades are executed in accordance with Rule 17a-7 of the 1940 Act. Interfund trades are included within the respective purchases and sales amounts shown in the Purchases and Sales of Investments note.
Other. During the period, the investment adviser reimbursed the Fund for certain losses in the amount of $78,874.
6. Committed Line of Credit.
The Fund participates with other funds managed by the investment adviser or an affiliate in a $4.25 billion credit facility (the "line of credit") to be utilized for temporary or emergency purposes to fund shareholder redemptions or for other short-term liquidity purposes. The Fund has agreed to pay commitment fees on its pro-rata portion of the line of credit, which amounted to $3,476 and is reflected in Miscellaneous expenses on the Statement of Operations. During the period, the Fund did not borrow on this line of credit.
7. Security Lending.
The Fund lends portfolio securities through a lending agent from time to time in order to earn additional income. For equity securities, a lending agent is used and may loan securities to certain qualified borrowers, including Fidelity Capital Markets (FCM), a broker-dealer affiliated with the Fund. On the settlement date of the loan, the Fund receives collateral (in the form of U.S. Treasury obligations, letters of credit and/or cash) against the loaned securities and maintains collateral in an amount not less than 100% of the market value of the loaned securities during the period of the loan. The market value of the loaned securities is determined at the close of business of the Fund and any additional required collateral is delivered to the Fund on the next business day. The Fund or borrower may terminate the loan at any time, and if the borrower defaults on its obligation to return the securities loaned because of insolvency or other reasons, the Fund may apply collateral received from the borrower against the obligation. The Fund may experience delays and costs in recovering the securities loaned. Any cash collateral received is invested in the Fidelity Securities Lending Cash Central Fund. The value of loaned securities and cash collateral at period end are disclosed on the Fund's Statement of Assets and Liabilities. Security lending income represents the income earned on investing cash collateral, less rebates paid to borrowers and any lending agent fees associated with the loan, plus any premium payments received for lending certain types of securities. Security lending income is presented in the Statement of Operations as a component of income from Fidelity Central Funds. Total security lending income during the period amounted to $548,850. During the period, there were no securities loaned to FCM.
8. Bank Borrowings.
The Fund is permitted to have bank borrowings for temporary or emergency purposes to fund shareholder redemptions or for other short-term liquidity requirements. The Fund has established borrowing arrangements with certain banks. The interest rate on the borrowings is the bank's base rate, as revised from time to time. The average loan balance during the period for which loans were outstanding amounted to $4,033,333. The weighted average interest rate was 1.11%. The interest expense amounted to $374 under the bank borrowing program. At period end, there were no bank borrowings outstanding.
9. Expense Reductions.
Commissions paid to certain brokers with whom the investment adviser, or its affiliates, places trades on behalf of the Fund include an amount in addition to trade execution, which may be rebated back to the Fund to offset certain expenses. This amount totaled $189,439 for the period.
In addition, during the period the investment adviser reimbursed and/or waived a portion of fund-level operating expenses in the amount of $8,705.
10. Distributions to Shareholders.
Distributions to shareholders of each class were as follows:
| | Year ended
October 31, 2017 | Year ended October 31, 2016 |
| From net investment income | | |
| Class A | $157,254 | $297,014 |
| Class M | 24,256 | 28,522 |
| Class C | – | 29,301 |
| China Region | 10,242,046 | 14,431,516 |
| Class I | 212,309 | 317,144 |
| Total | $10,635,865 | $15,103,497 |
| From net realized gain | | |
| Class A | $43,202 | $3,946,989 |
| Class M | 10,926 | 763,704 |
| Class B | – | 93,006 |
| Class C | 7,384 | 1,752,229 |
| China Region | 1,889,677 | 150,087,760 |
| Class I | 37,777 | 3,187,427 |
| Total | $1,988,966 | $159,831,115 |
11. Share Transactions.
Share transactions for each class were as follows and may contain automatic conversions between classes or exchanges between affiliated funds:
| | Shares | Shares | Dollars | Dollars |
| | Year ended October 31, 2017 | Year ended October 31, 2016 | Year ended October 31, 2017 | Year ended October 31, 2016 |
| Class A | | | | |
| Shares sold | 484,746 | 240,368 | $14,218,284 | $5,824,186 |
| Reinvestment of distributions | 7,951 | 162,605 | 195,750 | 4,157,811 |
| Shares redeemed | (355,316) | (618,365) | (9,896,035) | (14,282,494) |
| Net increase (decrease) | 137,381 | (215,392) | $4,517,999 | $(4,300,497) |
| Class M | | | | |
| Shares sold | 114,104 | 43,307 | $3,376,139 | $1,037,492 |
| Reinvestment of distributions | 1,419 | 30,599 | 34,859 | 781,504 |
| Shares redeemed | (51,513) | (70,825) | (1,446,359) | (1,686,295) |
| Net increase (decrease) | 64,010 | 3,081 | $1,964,639 | $132,701 |
| Class B | | | | |
| Shares sold | – | 30 | $– | $648 |
| Reinvestment of distributions | – | 3,443 | – | 87,630 |
| Shares redeemed | – | (31,204) | – | (704,876) |
| Net increase (decrease) | – | (27,731) | $– | $(616,598) |
| Class C | | | | |
| Shares sold | 123,999 | 98,283 | $3,531,382 | $2,387,271 |
| Reinvestment of distributions | 254 | 55,713 | 6,148 | 1,398,404 |
| Shares redeemed | (188,578) | (202,505) | (4,895,729) | (4,847,372) |
| Net increase (decrease) | (64,325) | (48,509) | $(1,358,199) | $(1,061,697) |
| China Region | | | | |
| Shares sold | 7,507,787 | 3,781,033 | $224,773,166 | $92,584,217 |
| Reinvestment of distributions | 469,834 | 6,142,435 | 11,675,364 | 158,659,097 |
| Shares redeemed | (9,588,795) | (13,494,506) | (265,714,287) | (325,219,240) |
| Net increase (decrease) | (1,611,174) | (3,571,038) | $(29,265,757) | $(73,975,926) |
| Class I | | | | |
| Shares sold | 659,273 | 405,852 | $19,707,002 | $10,200,502 |
| Reinvestment of distributions | 8,728 | 99,936 | 215,492 | 2,565,348 |
| Shares redeemed | (612,455) | (664,751) | (17,979,791) | (16,263,698) |
| Net increase (decrease) | 55,546 | (158,963) | $1,942,703 | $(3,497,848) |
12. Other.
The Fund's organizational documents provide former and current trustees and officers with a limited indemnification against liabilities arising in connection with the performance of their duties to the Fund. In the normal course of business, the Fund may also enter into contracts that provide general indemnifications. The Fund's maximum exposure under these arrangements is unknown as this would be dependent on future claims that may be made against the Fund. The risk of material loss from such claims is considered remote.
Report of Independent Registered Public Accounting Firm
To the Trustees of Fidelity Investment Trust and Shareholders of Fidelity China Region Fund:
In our opinion, the accompanying statement of assets and liabilities, including the schedule of investments, and the related statements of operations and of changes in net assets and the financial highlights present fairly, in all material respects, the financial position of Fidelity China Region Fund (a fund of Fidelity Investment Trust) as of October 31, 2017, the results of its operations for the year then ended, the changes in its net assets for each of the two years in the period then ended and the financial highlights for each of the five years in the period then ended, in conformity with accounting principles generally accepted in the United States of America. These financial statements and financial highlights (hereafter referred to as “financial statements”) are the responsibility of the Fidelity China Region Fund’s management. Our responsibility is to express an opinion on these financial statements based on our audits. We conducted our audits of these financial statements in accordance with the standards of the Public Company Accounting Oversight Board (United States). Those standards require that we plan and perform the audit to obtain reasonable assurance about whether the financial statements are free of material misstatement. An audit includes examining, on a test basis, evidence supporting the amounts and disclosures in the financial statements, assessing the accounting principles used and significant estimates made by management, and evaluating the overall financial statement presentation. Our procedures included confirmation of securities owned as of October 31, 2017 by correspondence with the custodian and brokers; when replies were not received from brokers, we performed other auditing procedures. We believe that our audits provide a reasonable basis for our opinion.
PricewaterhouseCoopers LLP
Boston, Massachusetts
December 18, 2017
Trustees and Officers
The Trustees, Members of the Advisory Board (if any), and officers of the trust and fund, as applicable, are listed below. The Board of Trustees governs the fund and is responsible for protecting the interests of shareholders. The Trustees are experienced executives who meet periodically throughout the year to oversee the fund's activities, review contractual arrangements with companies that provide services to the fund, oversee management of the risks associated with such activities and contractual arrangements, and review the fund's performance. Except for Jonathan Chiel, each of the Trustees oversees 190 funds. Mr. Chiel oversees 143 funds.
The Trustees hold office without limit in time except that (a) any Trustee may resign; (b) any Trustee may be removed by written instrument, signed by at least two-thirds of the number of Trustees prior to such removal; (c) any Trustee who requests to be retired or who has become incapacitated by illness or injury may be retired by written instrument signed by a majority of the other Trustees; and (d) any Trustee may be removed at any special meeting of shareholders by a two-thirds vote of the outstanding voting securities of the trust. Each Trustee who is not an interested person (as defined in the 1940 Act) of the trust and the fund is referred to herein as an Independent Trustee. Each Independent Trustee shall retire not later than the last day of the calendar year in which his or her 75th birthday occurs. The Independent Trustees may waive this mandatory retirement age policy with respect to individual Trustees. Officers and Advisory Board Members hold office without limit in time, except that any officer or Advisory Board Member may resign or may be removed by a vote of a majority of the Trustees at any regular meeting or any special meeting of the Trustees. Except as indicated, each individual has held the office shown or other offices in the same company for the past five years.
The fund’s Statement of Additional Information (SAI) includes more information about the Trustees. To request a free copy, call Fidelity at 1-877-208-0098.
Experience, Skills, Attributes, and Qualifications of the Trustees. The Governance and Nominating Committee has adopted a statement of policy that describes the experience, qualifications, attributes, and skills that are necessary and desirable for potential Independent Trustee candidates (Statement of Policy). The Board believes that each Trustee satisfied at the time he or she was initially elected or appointed a Trustee, and continues to satisfy, the standards contemplated by the Statement of Policy. The Governance and Nominating Committee also engages professional search firms to help identify potential Independent Trustee candidates who have the experience, qualifications, attributes, and skills consistent with the Statement of Policy. From time to time, additional criteria based on the composition and skills of the current Independent Trustees, as well as experience or skills that may be appropriate in light of future changes to board composition, business conditions, and regulatory or other developments, have also been considered by the professional search firms and the Governance and Nominating Committee. In addition, the Board takes into account the Trustees' commitment and participation in Board and committee meetings, as well as their leadership of standing and ad hoc committees throughout their tenure.
In determining that a particular Trustee was and continues to be qualified to serve as a Trustee, the Board has considered a variety of criteria, none of which, in isolation, was controlling. The Board believes that, collectively, the Trustees have balanced and diverse experience, qualifications, attributes, and skills, which allow the Board to operate effectively in governing the fund and protecting the interests of shareholders. Information about the specific experience, skills, attributes, and qualifications of each Trustee, which in each case led to the Board's conclusion that the Trustee should serve (or continue to serve) as a trustee of the fund, is provided below.
Board Structure and Oversight Function. James C. Curvey is an interested person and currently serves as Chairman. The Trustees have determined that an interested Chairman is appropriate and benefits shareholders because an interested Chairman has a personal and professional stake in the quality and continuity of services provided to the fund. Independent Trustees exercise their informed business judgment to appoint an individual of their choosing to serve as Chairman, regardless of whether the Trustee happens to be independent or a member of management. The Independent Trustees have determined that they can act independently and effectively without having an Independent Trustee serve as Chairman and that a key structural component for assuring that they are in a position to do so is for the Independent Trustees to constitute a substantial majority for the Board. The Independent Trustees also regularly meet in executive session. Ned C. Lautenbach serves as Chairman of the Independent Trustees and as such (i) acts as a liaison between the Independent Trustees and management with respect to matters important to the Independent Trustees and (ii) with management prepares agendas for Board meetings.
Fidelity® funds are overseen by different Boards of Trustees. The fund's Board oversees Fidelity's high income and certain equity funds, and other Boards oversee Fidelity's investment-grade bond, money market, asset allocation, and sector funds. The asset allocation funds may invest in Fidelity® funds overseen by the fund's Board. The use of separate Boards, each with its own committee structure, allows the Trustees of each group of Fidelity® funds to focus on the unique issues of the funds they oversee, including common research, investment, and operational issues. On occasion, the separate Boards establish joint committees to address issues of overlapping consequences for the Fidelity® funds overseen by each Board.
The Trustees operate using a system of committees to facilitate the timely and efficient consideration of all matters of importance to the Trustees, the fund, and fund shareholders and to facilitate compliance with legal and regulatory requirements and oversight of the fund's activities and associated risks. The Board, acting through its committees, has charged FMR and its affiliates with (i) identifying events or circumstances the occurrence of which could have demonstrably adverse effects on the fund's business and/or reputation; (ii) implementing processes and controls to lessen the possibility that such events or circumstances occur or to mitigate the effects of such events or circumstances if they do occur; and (iii) creating and maintaining a system designed to evaluate continuously business and market conditions in order to facilitate the identification and implementation processes described in (i) and (ii) above. Because the day-to-day operations and activities of the fund are carried out by or through FMR, its affiliates, and other service providers, the fund's exposure to risks is mitigated but not eliminated by the processes overseen by the Trustees. While each of the Board's committees has responsibility for overseeing different aspects of the fund's activities, oversight is exercised primarily through the Operations, Audit, and Compliance Committees. In addition, the Independent Trustees have worked with FMR to enhance the Board's oversight of investment and financial risks, legal and regulatory risks, technology risks, and operational risks, including the development of additional risk reporting to the Board. For example, a working group comprised of Independent Trustees and FMR has worked and continues to work to review the Fidelity® funds' valuation-related activities, reporting and risk management. Appropriate personnel, including but not limited to the fund's Chief Compliance Officer (CCO), FMR's internal auditor, the independent accountants, the fund's Treasurer and portfolio management personnel, make periodic reports to the Board's committees, as appropriate, including an annual review of Fidelity's risk management program for the Fidelity® funds. The responsibilities of each standing committee, including their oversight responsibilities, are described further under "Standing Committees of the Trustees."
Interested Trustees*:
Correspondence intended for a Trustee who is an interested person may be sent to Fidelity Investments, 245 Summer Street, Boston, Massachusetts 02210.
Name, Year of Birth; Principal Occupations and Other Relevant Experience+
Jonathan Chiel (1957)
Year of Election or Appointment: 2016
Trustee
Mr. Chiel also serves as Trustee of other Fidelity® funds. Mr. Chiel is Executive Vice President and General Counsel for FMR LLC (diversified financial services company, 2012-present). Previously, Mr. Chiel served as general counsel (2004-2012) and senior vice president and deputy general counsel (2000-2004) for John Hancock Financial Services; a partner with Choate, Hall & Stewart (1996-2000) (law firm); and an Assistant United States Attorney for the United States Attorney’s Office of the District of Massachusetts (1986-95), including Chief of the Criminal Division (1993-1995). Mr. Chiel is a director on the boards of the Boston Bar Foundation and the Maimonides School.
James C. Curvey (1935)
Year of Election or Appointment: 2007
Trustee
Chairman of the Board of Trustees
Mr. Curvey also serves as Trustee of other Fidelity® funds. Mr. Curvey is a Director of Fidelity Research & Analysis Co. (investment adviser firm, 2009-present), and Vice Chairman (2007-present) and Director of FMR LLC (diversified financial services company). In addition, Mr. Curvey serves as an Overseer for the Boston Symphony Orchestra and a member of the board of Artis-Naples, Naples, Florida, and as a Trustee for Brewster Academy, Wolfeboro, New Hampshire. Previously, Mr. Curvey served as a Director of Fidelity Investments Money Management, Inc. (investment adviser firm, 2009-2014) and a Director of FMR and FMR Co., Inc. (investment adviser firms, 2007-2014).
Charles S. Morrison (1960)
Year of Election or Appointment: 2014
Trustee
Mr. Morrison also serves as Trustee of other funds. He serves as President of Fidelity Management & Research Company (FMR) (investment adviser firm, 2016-present), a Director of Fidelity Investments Money Management, Inc. (FIMM) (investment adviser firm, 2014-present), Director of Fidelity SelectCo, LLC (investment adviser firm, 2014-present), President, Asset Management (2014-present), and is an employee of Fidelity Investments. Previously, Mr. Morrison served as Vice President of Fidelity's Fixed Income and Asset Allocation Funds (2012-2014), President, Fixed Income (2011-2014), Vice President of Fidelity's Money Market Funds (2005-2009), President, Money Market Group Leader of FMR (investment adviser firm, 2009), and Senior Vice President, Money Market Group of FMR (2004-2009). Mr. Morrison also served as Vice President of Fidelity's Bond Funds (2002-2005), certain Balanced Funds (2002-2005), and certain Asset Allocation Funds (2002-2007), and as Senior Vice President (2002-2005) of Fidelity's Bond Division.
* Determined to be an “Interested Trustee” by virtue of, among other things, his or her affiliation with the trust or various entities under common control with FMR.
+ The information includes the Trustee's principal occupation during the last five years and other information relating to the experience, attributes, and skills relevant to the Trustee's qualifications to serve as a Trustee, which led to the conclusion that the Trustee should serve as a Trustee for the fund.
Independent Trustees:
Correspondence intended for an Independent Trustee may be sent to Fidelity Investments, P.O. Box 55235, Boston, Massachusetts 02205-5235.
Name, Year of Birth; Principal Occupations and Other Relevant Experience+
Dennis J. Dirks (1948)
Year of Election or Appointment: 2005
Trustee
Mr. Dirks also serves as Trustee of other Fidelity® funds. Prior to his retirement in May 2003, Mr. Dirks was Chief Operating Officer and a member of the Board of The Depository Trust & Clearing Corporation (DTCC). He also served as President, Chief Operating Officer, and Board member of The Depository Trust Company (DTC) and President and Board member of the National Securities Clearing Corporation (NSCC). In addition, Mr. Dirks served as Chief Executive Officer and Board member of the Government Securities Clearing Corporation, Chief Executive Officer and Board member of the Mortgage-Backed Securities Clearing Corporation, as a Trustee and a member of the Finance Committee of Manhattan College (2005-2008), as a Trustee and a member of the Finance Committee of AHRC of Nassau County (2006-2008), as a member of the Independent Directors Council (IDC) Governing Council (2010-2015), and as a member of the Board of Directors for The Brookville Center for Children’s Services, Inc. (2009-2017). Mr. Dirks is a member of the Finance Committee (2016-present) and Board of Directors (2017-present) of the Asolo Repertory Theatre.
Alan J. Lacy (1953)
Year of Election or Appointment: 2008
Trustee
Mr. Lacy also serves as Trustee of other Fidelity® funds. Mr. Lacy serves as a Director of Bristol-Myers Squibb Company (global pharmaceuticals, 2008-present). He is a Trustee of the California Chapter of The Nature Conservancy (2015-present) and a Director of the Center for Advanced Study in the Behavioral Sciences at Stanford University (2015-present). In addition, Mr. Lacy served as Senior Adviser (2007-2014) of Oak Hill Capital Partners, L.P. (private equity) and also served as Chief Executive Officer (2005) and Vice Chairman (2005-2006) of Sears Holdings Corporation (retail) and Chief Executive Officer and Chairman of the Board of Sears, Roebuck and Co. (retail, 2000-2005). Previously, Mr. Lacy served as Chairman (2014-2017) and a member (2010-2017) of the Board of Directors of Dave & Buster’s Entertainment, Inc. (restaurant and entertainment complexes), as Chairman (2008-2011) and a member (2006-2015) of the Board of Trustees of the National Parks Conservation Association, and as a member of the Board of Directors for The Hillman Companies, Inc. (hardware wholesalers, 2010-2014), Earth Fare, Inc. (retail grocery, 2010-2014), and The Western Union Company (global money transfer, 2006-2011).
Ned C. Lautenbach (1944)
Year of Election or Appointment: 2000
Trustee
Chairman of the Independent Trustees
Mr. Lautenbach also serves as Trustee of other Fidelity® funds. Mr. Lautenbach currently serves as Vice Chair of the Board of Governors, State University System of Florida (2013-present) and is a member of the Council on Foreign Relations (1994-present). He is also a member and has most recently served as Chairman of the Board of Directors of Artis-Naples (2012-present). Previously, Mr. Lautenbach served as a member and then Lead Director of the Board of Directors of Eaton Corporation (diversified industrial, 1997-2016). He was also a Partner and Advisory Partner at Clayton, Dubilier & Rice, LLC (private equity investment, 1998-2010), as well as a Director of Sony Corporation (2006-2007). In addition, Mr. Lautenbach also had a 30-year career with IBM (technology company) during which time he served as Senior Vice President and a member of the Corporate Executive Committee (1968-1998).
Joseph Mauriello (1944)
Year of Election or Appointment: 2008
Trustee
Mr. Mauriello also serves as Trustee of other Fidelity® funds. Prior to his retirement in January 2006, Mr. Mauriello served in numerous senior management positions including Deputy Chairman and Chief Operating Officer (2004-2005), and Vice Chairman of Financial Services (2002-2004) of KPMG LLP US (professional services, 1965-2005). Mr. Mauriello currently serves as a member of the Board of Directors of XL Group plc. (global insurance and re-insurance, 2006-present) and the Independent Directors Council (IDC) Governing Council (2015-present). Previously, Mr. Mauriello served as a Director of the Hamilton Funds of the Bank of New York (2006-2007) and of Arcadia Resources Inc. (health care services and products, 2007-2012).
Cornelia M. Small (1944)
Year of Election or Appointment: 2005
Trustee
Ms. Small also serves as Trustee of other Fidelity® funds. Ms. Small is a member of the Board of Directors (2009-present) and Chair of the Investment Committee (2010-present) of the Teagle Foundation. Ms. Small also serves on the Investment Committee of the Berkshire Taconic Community Foundation (2008-present). Previously, Ms. Small served as Chairperson (2002-2008) and a member of the Investment Committee and Chairperson (2008-2012) and a member of the Board of Trustees of Smith College. In addition, Ms. Small served as Chief Investment Officer, Director of Global Equity Investments, and a member of the Board of Directors of Scudder, Stevens & Clark and Scudder Kemper Investments.
William S. Stavropoulos (1939)
Year of Election or Appointment: 2001
Trustee
Vice Chairman of the Independent Trustees
Mr. Stavropoulos also serves as Trustee of other Fidelity® funds. Mr. Stavropoulos serves as President and Founder of the Michigan Baseball Foundation, the Great Lakes Loons (2007-present). Mr. Stavropoulos is Chairman Emeritus of the Board of Directors of The Dow Chemical Company, where he previously served in numerous senior management positions, including President, CEO (1995-2000; 2002-2004), Chairman of the Executive Committee (2000-2006), and as a member of the Board of Directors (1990-2006). Currently, Mr. Stavropoulos is Chairman of the Board of Directors of Univar Inc. (global distributor of commodity and specialty chemicals), a Director of Teradata Corporation (data warehousing and technology solutions), and a member of the Advisory Board for Metalmark Capital LLC (private equity investment, 2005-present). Mr. Stavropoulos is an operating advisor to Clayton, Dubilier & Rice, LLC (private equity investment). In addition, Mr. Stavropoulos is a member of the University of Notre Dame Advisory Council for the College of Science, a Trustee of the Rollin L. Gerstacker Foundation, and a Director of Artis-Naples in Naples, Florida. Previously, Mr. Stavropoulos served as a Director of Chemical Financial Corporation (bank holding company, 1993-2012) and Tyco International, Ltd. (multinational manufacturing and services, 2007-2012).
David M. Thomas (1949)
Year of Election or Appointment: 2008
Trustee
Mr. Thomas also serves as Trustee of other Fidelity® funds. Mr. Thomas serves as Non-Executive Chairman of the Board of Directors of Fortune Brands Home and Security (home and security products, 2011-present), as a member of the Board of Directors (2004-present) and Presiding Director (2013-present) of Interpublic Group of Companies, Inc. (marketing communication), and as a member of the Board of Trustees of the University of Florida (2013-present). Previously, Mr. Thomas served as Executive Chairman (2005-2006) and Chairman and Chief Executive Officer (2000-2005) of IMS Health, Inc. (pharmaceutical and healthcare information solutions), and a Director of Fortune Brands, Inc. (consumer products, 2000-2011).
+ The information includes the Trustee's principal occupation during the last five years and other information relating to the experience, attributes, and skills relevant to the Trustee's qualifications to serve as a Trustee, which led to the conclusion that the Trustee should serve as a Trustee for the fund.
Advisory Board Members and Officers:
Correspondence intended for an officer or Peter S. Lynch may be sent to Fidelity Investments, 245 Summer Street, Boston, Massachusetts 02210. Officers appear below in alphabetical order.
Name, Year of Birth; Principal Occupation
Peter S. Lynch (1944)
Year of Election or Appointment: 2003
Member of the Advisory Board
Mr. Lynch also serves as Member of the Advisory Board of other Fidelity® funds. Mr. Lynch is Vice Chairman and a Director of FMR (investment adviser firm) and FMR Co., Inc. (investment adviser firm). In addition, Mr. Lynch serves as a Trustee of Boston College and as the Chairman of the Inner-City Scholarship Fund. Previously, Mr. Lynch served on the Special Olympics International Board of Directors (1997-2006).
Elizabeth Paige Baumann (1968)
Year of Election or Appointment: 2017
Anti-Money Laundering (AML) Officer
Ms. Baumann also serves as AML Officer of other funds. She is Chief AML Officer (2012-present) and Senior Vice President (2014-present) of FMR LLC (diversified financial services company) and is an employee of Fidelity Investments. Previously, Ms. Baumann served as AML Officer of the funds (2012-2016), and Vice President (2007-2014) and Deputy Anti-Money Laundering Officer (2007-2012) of FMR LLC.
Marc R. Bryant (1966)
Year of Election or Appointment: 2015
Secretary and Chief Legal Officer (CLO)
Mr. Bryant also serves as Secretary and CLO of other funds. Mr. Bryant serves as CLO, Secretary, and Senior Vice President of Fidelity Management & Research Company (investment adviser firm, 2015-present) and FMR Co., Inc. (investment adviser firm, 2015-present); Secretary of Fidelity SelectCo, LLC (investment adviser firm, 2015-present) and Fidelity Investments Money Management, Inc. (investment adviser firm, 2015-present); and CLO of Fidelity Management & Research (Hong Kong) Limited and FMR Investment Management (UK) Limited (investment adviser firms, 2015-present) and Fidelity Management & Research (Japan) Limited (investment adviser firm, 2016-present). He is Senior Vice President and Deputy General Counsel of FMR LLC (diversified financial services company). Previously, Mr. Bryant served as Secretary and CLO of Fidelity Rutland Square Trust II (2010-2014) and Assistant Secretary of Fidelity's Fixed Income and Asset Allocation Funds (2013-2015). Prior to joining Fidelity Investments, Mr. Bryant served as a Senior Vice President and the Head of Global Retail Legal for AllianceBernstein L.P. (2006-2010), and as the General Counsel for ProFund Advisors LLC (2001-2006).
William C. Coffey (1969)
Year of Election or Appointment: 2009
Assistant Secretary
Mr. Coffey also serves as Assistant Secretary of other funds. He is Senior Vice President and Deputy General Counsel of FMR LLC (diversified financial services company, 2010-present), and is an employee of Fidelity Investments. Previously, Mr. Coffey served as Vice President and Associate General Counsel of FMR LLC (2005-2009).
Jonathan Davis (1968)
Year of Election or Appointment: 2010
Assistant Treasurer
Mr. Davis also serves as Assistant Treasurer of other funds, and is an employee of Fidelity Investments. Previously, Mr. Davis served as Vice President and Associate General Counsel of FMR LLC (diversified financial services company, 2003-2010).
Adrien E. Deberghes (1967)
Year of Election or Appointment: 2016
Assistant Treasurer
Mr. Deberghes also serves as an officer of other funds. He serves as Executive Vice President of Fidelity Investments Money Management, Inc. (FIMM) (investment adviser firm, 2016-present) and is an employee of Fidelity Investments (2008-present). Prior to joining Fidelity Investments, Mr. Deberghes was Senior Vice President of Mutual Fund Administration at State Street Corporation (2007-2008), Senior Director of Mutual Fund Administration at Investors Bank & Trust (2005-2007), and Director of Finance for Dunkin' Brands (2000-2005). Previously, Mr. Deberghes served in other fund officer roles.
Joseph DeSantis (1959)
Year of Election or Appointment: 2017
Vice President
Mr. DeSantis also serves as Vice President of other funds. Mr. DeSantis serves as a Director of Fidelity Management & Research (Japan) Limited (investment adviser firm, 2016-present), Chief Investment Officer, Equities (2010-present) and is an employee of Fidelity Investments.
Stephanie J. Dorsey (1969)
Year of Election or Appointment: 2010
Assistant Treasurer
Ms. Dorsey also serves as an officer of other funds. She is an employee of Fidelity Investments (2008-present) and has served in other fund officer roles. Prior to joining Fidelity Investments, Ms. Dorsey served as Treasurer (2004-2008) of the JPMorgan Mutual Funds and Vice President (2004-2008) of JPMorgan Chase Bank.
Howard J. Galligan III (1966)
Year of Election or Appointment: 2014
Chief Financial Officer
Mr. Galligan also serves as Chief Financial Officer of other funds. Mr. Galligan serves as President of Fidelity Pricing and Cash Management Services (FPCMS) (2014-present) and as a Director of Strategic Advisers, Inc. (investment adviser firm, 2008-present). Previously, Mr. Galligan served as Chief Administrative Officer of Asset Management (2011-2014) and Chief Operating Officer and Senior Vice President of Investment Support for Strategic Advisers, Inc. (2003-2011).
Brian B. Hogan (1964)
Year of Election or Appointment: 2009
Vice President
Mr. Hogan also serves as Trustee or Vice President of other funds. Mr. Hogan serves as a Director of FMR Investment Management (UK) Limited (investment adviser firm, 2015-present) and Fidelity SelectCo, LLC (investment adviser firm, 2014-present) and President of the Equity Division of FMR (investment adviser firm, 2009-present). Previously, Mr. Hogan served as Senior Vice President, Equity Research of FMR (2006-2009) and as a portfolio manager. Mr. Brian B. Hogan is not related to Mr. Colm A. Hogan.
Colm A. Hogan (1973)
Year of Election or Appointment: 2016
Deputy Treasurer
Mr. Hogan also serves as an officer of other funds. Mr. Hogan is an employee of Fidelity Investments (2005-present). Mr. Colm A. Hogan is not related to Mr. Brian B. Hogan.
Chris Maher (1972)
Year of Election or Appointment: 2013
Assistant Treasurer
Mr. Maher serves as Assistant Treasurer of other funds. Mr. Maher is Vice President of Valuation Oversight and is an employee of Fidelity Investments. Previously, Mr. Maher served as Vice President of Asset Management Compliance (2013), Vice President of the Program Management Group of FMR (investment adviser firm, 2010-2013), and Vice President of Valuation Oversight (2008-2010).
Rieco E. Mello (1969)
Year of Election or Appointment: 2017
Assistant Treasurer
Mr. Mello also serves as Assistant Treasurer of other funds. Mr. Mello is an employee of Fidelity Investments (1995-present).
Kenneth B. Robins (1969)
Year of Election or Appointment: 2016
Chief Compliance Officer
Mr. Robins also serves as an officer of other funds. Mr. Robins serves as Compliance Officer of Fidelity Management & Research Company and FMR Co., Inc. (investment adviser firms, 2016-present) and is an employee of Fidelity Investments (2004-present). Previously, Mr. Robins served as Executive Vice President of Fidelity Investments Money Management, Inc. (investment adviser firm, 2013-2016) and served in other fund officer roles.
Stacie M. Smith (1974)
Year of Election or Appointment: 2016
President and Treasurer
Ms. Smith also serves as an officer of other funds. She is an employee of Fidelity Investments (2009-present) and has served in other fund officer roles. Prior to joining Fidelity Investments, Ms. Smith served as Senior Audit Manager of Ernst & Young LLP (accounting firm, 1996-2009). Previously, Ms. Smith served as Deputy Treasurer of certain Fidelity® funds (2013-2016).
Marc L. Spector (1972)
Year of Election or Appointment: 2016
Assistant Treasurer
Mr. Spector also serves as an officer of other funds. Mr. Spector is an employee of Fidelity Investments (2016-present). Prior to joining Fidelity Investments, Mr. Spector served as Director at the Siegfried Group (accounting firm, 2013-2016), and prior to Siegfried Group as audit senior manager at Deloitte & Touche (accounting firm, 2005-2013).
Renee Stagnone (1975)
Year of Election or Appointment: 2016
Assistant Treasurer
Ms. Stagnone also serves as an officer of other funds. Ms. Stagnone is an employee of Fidelity Investments (1997-present). Previously, Ms. Stagnone served as Deputy Treasurer of certain Fidelity® funds (2013-2016).
Shareholder Expense Example
As a shareholder of the Fund, you incur two types of costs: (1) transaction costs, including sales charges (loads) on purchase payments or redemption proceeds, redemption fees and (2) ongoing costs, including management fees, distribution and/or service (12b-1) fees and other Fund expenses. This Example is intended to help you understand your ongoing costs (in dollars) of investing in the Fund and to compare these costs with the ongoing costs of investing in other mutual funds.
The Example is based on an investment of $1,000 invested at the beginning of the period and held for the entire period (May 1, 2017 to October 31, 2017).
Actual Expenses
The first line of the accompanying table for each class of the Fund provides information about actual account values and actual expenses. You may use the information in this line, together with the amount you invested, to estimate the expenses that you paid over the period. Simply divide your account value by $1,000.00 (for example, an $8,600 account value divided by $1,000.00 = 8.6), then multiply the result by the number in the first line for a class of the Fund under the heading entitled "Expenses Paid During Period" to estimate the expenses you paid on your account during this period. A small balance maintenance fee of $12.00 that is charged once a year may apply for certain accounts with a value of less than $2,000. This fee is not included in the table below. If it was, the estimate of expenses you paid during the period would be higher, and your ending account value lower, by this amount. In addition, the Fund, as a shareholder in the underlying Fidelity Central Funds, will indirectly bear its pro-rata share of the fees and expenses incurred by the underlying Fidelity Central Funds. These fees and expenses are not included in the Fund's annualized expense ratio used to calculate the expense estimate in the table below.
Hypothetical Example for Comparison Purposes
The second line of the accompanying table for each class of the Fund provides information about hypothetical account values and hypothetical expenses based on a Class' actual expense ratio and an assumed rate of return of 5% per year before expenses, which is not the Class' actual return. The hypothetical account values and expenses may not be used to estimate the actual ending account balance or expenses you paid for the period. You may use this information to compare the ongoing costs of investing in the Fund and other funds. To do so, compare this 5% hypothetical example with the 5% hypothetical examples that appear in the shareholder reports of the other funds. A small balance maintenance fee of $12.00 that is charged once a year may apply for certain accounts with a value of less than $2,000. This fee is not included in the table below. If it was, the estimate of expenses you paid during the period would be higher, and your ending account value lower, by this amount. In addition, the Fund, as a shareholder in the underlying Fidelity Central Funds, will indirectly bear its pro-rata share of the fees and expenses incurred by the underlying Fidelity Central Funds. These fees and expenses are not included in the Fund's annualized expense ratio used to calculate the expense estimate in the table below.
Please note that the expenses shown in the table are meant to highlight your ongoing costs only and do not reflect any transaction costs. Therefore, the second line of the table is useful in comparing ongoing costs only, and will not help you determine the relative total costs of owning different funds. In addition, if these transactional costs were included, your costs would have been higher.
| | Annualized Expense Ratio-A | Beginning
Account Value
May 1, 2017 | Ending
Account Value
October 31, 2017 | Expenses Paid
During Period-B
May 1, 2017
to October 31, 2017 |
| Class A | 1.30% | | | |
| Actual | | $1,000.00 | $1,219.10 | $7.27 |
| Hypothetical-C | | $1,000.00 | $1,018.65 | $6.61 |
| Class M | 1.66% | | | |
| Actual | | $1,000.00 | $1,217.40 | $9.28 |
| Hypothetical-C | | $1,000.00 | $1,016.84 | $8.44 |
| Class C | 2.05% | | | |
| Actual | | $1,000.00 | $1,214.90 | $11.44 |
| Hypothetical-C | | $1,000.00 | $1,014.87 | $10.41 |
| China Region | 1.00% | | | |
| Actual | | $1,000.00 | $1,221.00 | $5.60 |
| Hypothetical-C | | $1,000.00 | $1,020.16 | $5.09 |
| Class I | 1.02% | | | |
| Actual | | $1,000.00 | $1,221.10 | $5.71 |
| Hypothetical-C | | $1,000.00 | $1,020.06 | $5.19 |
A Annualized expense ratio reflects expenses net of applicable fee waivers.
B Expenses are equal to each Class' annualized expense ratio, multiplied by the average account value over the period, multiplied by 184/365 (to reflect the one-half year period).
C 5% return per year before expenses
Distributions (Unaudited)
Class A designates 91%; Class M and Class C designate 100%; Retail Class designates 70%; and Class I designates 68%; of the dividend distributed in December, 2016, respectively during the fiscal year as amounts which may be taken into account as a dividend for purposes of the maximum rate under section 1(h)(11) of the Internal Revenue Code.
The amounts per share which represent income derived from sources within, and taxes paid to, foreign countries or possessions of the United States are as follows:
| | Pay Date | Income | Taxes |
| Fidelity China Region Fund | | | |
| Class A | 12/12/16 | $0.2936 | $0.0616 |
| Class M | 12/12/16 | $0.2226 | $0.0616 |
| Class C | 12/12/16 | $0.0796 | $0.0616 |
| China Region | 12/12/16 | $0.3826 | $0.0616 |
| Class I | 12/12/16 | $0.3926 | $0.0616 |
| | | | |
The fund will notify shareholders in January 2018 of amounts for use in preparing 2017 income tax returns.
Board Approval of Investment Advisory Contracts and Management Fees
Fidelity China Region Fund
Each year, the Board of Trustees, including the Independent Trustees (together, the Board), votes on the renewal of the management contract with Fidelity Management & Research Company (FMR) and the sub-advisory agreements (together, the Advisory Contracts) for the fund. FMR and the sub-advisers are referred to herein as the Investment Advisers. The Board, assisted by the advice of fund counsel and Independent Trustees' counsel, requests and considers a broad range of information relevant to the renewal of the Advisory Contracts throughout the year.
The Board meets regularly and, at each of its meetings, covers an extensive agenda of topics and materials and considers factors that are relevant to its annual consideration of the renewal of the fund's Advisory Contracts, including the services and support provided to the fund and its shareholders. The Board has established various standing committees (Committees), each composed of and chaired by Independent Trustees with varying backgrounds, to which the Board has assigned specific subject matter responsibilities in order to enhance effective decision-making by the Board. The Board, acting directly and through its Committees, requests and receives information concerning the annual consideration of the renewal of the fund's Advisory Contracts. The Board also meets as needed to review matters specifically related to the Board's annual consideration of the renewal of the Advisory Contracts. Members of the Board may also meet with trustees of other Fidelity funds through ad hoc joint committees to discuss certain matters relevant to all of the Fidelity funds.
At its July 2017 meeting, the Board unanimously determined to renew the fund's Advisory Contracts. In reaching its determination, the Board considered all factors it believed relevant, including (i) the nature, extent, and quality of the services to be provided to the fund and its shareholders (including the investment performance of the fund); (ii) the competitiveness of the fund's management fee and total expense ratio relative to peer funds; (iii) the total costs of the services to be provided by and the profits to be realized by Fidelity from its relationships with the fund; and (iv) the extent to which, if any, economies of scale exist and would be realized as the fund grows, and whether any economies of scale are appropriately shared with fund shareholders.
In considering whether to renew the Advisory Contracts for the fund, the Board reached a determination, with the assistance of fund counsel and Independent Trustees' counsel and through the exercise of its business judgment, that the renewal of the Advisory Contracts was in the best interests of the fund and its shareholders and that the compensation payable under the Advisory Contracts was fair and reasonable. The Board's decision to renew the Advisory Contracts was not based on any single factor, but rather was based on a comprehensive consideration of all the information provided to the Board at its meetings throughout the year. The Board, in reaching its determination to renew the Advisory Contracts, was aware that shareholders of the fund have a broad range of investment choices available to them, including a wide choice among funds offered by Fidelity's competitors, and that the fund's shareholders, who have the opportunity to review and weigh the disclosure provided by the fund in its prospectus and other public disclosures, have chosen to invest in this fund, which is part of the Fidelity family of funds.
Amendment to Group Fee Rate. The Board also approved an amendment to the management contract for the fund to add an additional breakpoint to the group fee schedule, effective October 1, 2017. The Board noted that the additional breakpoint would result in lower management fee rates as Fidelity's assets under management increase.
Nature, Extent, and Quality of Services Provided. The Board considered Fidelity's staffing as it relates to the fund, including the backgrounds of investment personnel of Fidelity, and also considered the fund's investment objective, strategies, and related investment philosophy. The Independent Trustees also had discussions with senior management of Fidelity's investment operations and investment groups. The Board considered the structure of the investment personnel compensation program and whether this structure provides appropriate incentives to act in the best interests of the fund. Additionally, the Board considered the portfolio managers' investments, if any, in the funds that they manage.
Resources Dedicated to Investment Management and Support Services. The Board and the Fund Oversight and Research Committees reviewed the general qualifications and capabilities of Fidelity's investment staff, including its size, education, experience, and resources, as well as Fidelity's approach to recruiting, training, managing, and compensating investment personnel. The Board noted that Fidelity has continued to increase the resources devoted to non-U.S. offices, including expansion of Fidelity's global investment organization. The Board also noted that Fidelity's analysts have extensive resources, tools and capabilities that allow them to conduct sophisticated quantitative and fundamental analysis, as well as credit analysis of issuers, counterparties and guarantors. Further, the Board considered that Fidelity's investment professionals have sufficient access to global information and data so as to provide competitive investment results over time, and that those professionals also have access to sophisticated tools that permit them to assess portfolio construction and risk and performance attribution characteristics continuously, as well as to transmit new information and research conclusions rapidly around the world. Additionally, in its deliberations, the Board considered Fidelity's trading, risk management, compliance, and technology and operations capabilities and resources, which are integral parts of the investment management process.
Shareholder and Administrative Services. The Board considered (i) the nature, extent, quality, and cost of advisory, administrative, and shareholder services performed by the Investment Advisers and their affiliates under the Advisory Contracts and under separate agreements covering transfer agency, pricing and bookkeeping, and securities lending services for the fund; (ii) the nature and extent of the supervision of third party service providers, principally custodians, subcustodians, and pricing vendors; and (iii) the resources devoted to, and the record of compliance with, the fund's compliance policies and procedures. The Board also reviewed the allocation of fund brokerage, including allocations to brokers affiliated with the Investment Advisers, the use of brokerage commissions to pay fund expenses, and the use of "soft" commission dollars to pay for research services.
The Board noted that the growth of fund assets over time across the complex allows Fidelity to reinvest in the development of services designed to enhance the value or convenience of the Fidelity funds as investment vehicles. These services include 24-hour access to account information and market information through telephone representatives and over the Internet, investor education materials and asset allocation tools, and the expanded availability of Fidelity Investor Centers.
In 2014, the Board formed an ad hoc Committee on Transfer Agency Fees to review the variety of transfer agency fee structures throughout the industry and Fidelity's competitive positioning with respect to industry participants.
Investment in a Large Fund Family. The Board considered the benefits to shareholders of investing in a Fidelity fund, including the benefits of investing in a fund that is part of a large family of funds offering a variety of investment disciplines and providing a large variety of mutual fund investor services. The Board noted that Fidelity had taken, or had made recommendations that resulted in the Fidelity funds taking, a number of actions over the previous year that benefited particular funds, including: (i) continuing to dedicate additional resources to Fidelity's investment research process, and to the support of the senior management team that oversees asset management; (ii) continuing efforts to enhance Fidelity's global research capabilities; (iii) launching new funds and making other enhancements to meet client needs; (iv) launching new share classes of existing funds; (v) eliminating purchase minimums and broadening eligibility requirements for certain lower-priced share classes; (vi) reducing management fees and total expenses for certain growth equity funds and index funds; (vii) lowering expense caps for certain existing funds and classes to reduce expenses borne by shareholders; (viii) eliminating short-term redemption fees for certain funds; (ix) introducing a new pricing structure for certain funds of funds that is expected to reduce overall expenses paid by shareholders; (x) rationalizing product lines and gaining increased efficiencies through proposals for fund mergers and share class consolidations; (xi) continuing to develop, acquire and implement systems and technology to improve services to the funds and shareholders, strengthen information security, and increase efficiency; and (xii) implementing enhancements to further strengthen Fidelity's product line to increase investors' probability of success in achieving their investment goals, including retirement income goals.
Investment Performance. The Board considered whether the fund has operated in accordance with its investment objective, as well as its record of compliance with its investment restrictions and its performance history.
The Board took into account discussions with representatives of the Investment Advisers about fund investment performance that occur at Board meetings throughout the year. In this regard the Board noted that as part of regularly scheduled fund reviews and other reports to the Board on fund performance, the Board considers annualized return information for the fund for different time periods, measured against a securities market index ("benchmark index") and a peer group of funds with similar objectives ("peer group"), if any. In its evaluation of fund investment performance, the Board gave particular attention to information indicating changes in performance of certain Fidelity funds for specific time periods and discussed with the Investment Advisers the reasons for any overperformance or underperformance.
In addition to reviewing absolute and relative fund performance, the Independent Trustees periodically consider the appropriateness of fund performance metrics in evaluating the results achieved. In general, the Independent Trustees believe that fund performance should be evaluated based on net performance (after fees and expenses) of both the highest performing and lowest performing fund share classes, where applicable, compared to appropriate benchmark indices, over appropriate time periods that may include full market cycles, and compared to peer groups, as applicable, over the same periods, taking into account relevant factors including the following: general market conditions; issuer-specific information; and fund cash flows and other factors.
The Independent Trustees recognize that shareholders evaluate performance on a net basis over their own holding periods, for which one-, three-, and five-year periods are often used as a proxy. For this reason, the performance information reviewed by the Board also included net cumulative calendar year total return information for the fund and an appropriate benchmark index for the most recent one-, three-, and five-year periods, as shown below. A peer group is not shown below because the fund does not generally utilize a peer group for performance comparison purposes.
Fidelity China Region Fund
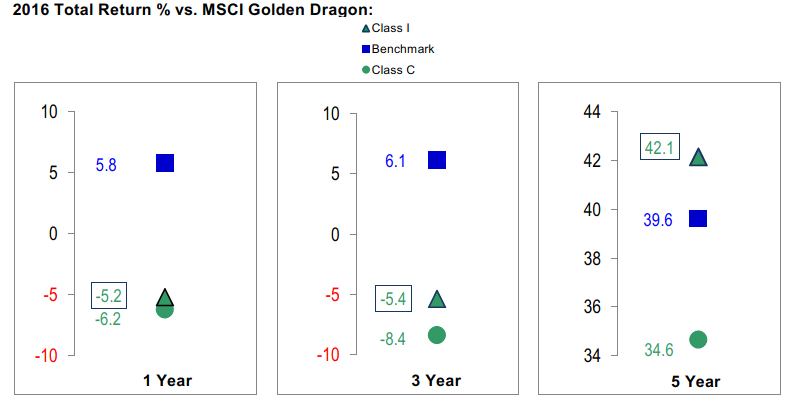
Based on its review, the Board concluded that the nature, extent, and quality of services provided to the fund under the Advisory Contracts should continue to benefit the shareholders of the fund.
Competitiveness of Management Fee and Total Expense Ratio. The Board considered the fund's management fee and total expense ratio compared to "mapped groups" of competitive funds and classes created for the purpose of facilitating the Trustees' competitive analysis of management fees and total expenses. Fidelity creates "mapped groups" by combining similar Lipper investment objective categories that have comparable investment mandates. Combining Lipper investment objective categories aids the Board's management fee and total expense ratio comparisons by broadening the competitive group used for comparison.
Management Fee. The Board considered two proprietary management fee comparisons for the 12-month periods shown in basis points (BP) in the chart below. The group of Lipper funds used by the Board for management fee comparisons is referred to below as the "Total Mapped Group." The Total Mapped Group comparison focuses on a fund's standing in terms of gross management fees before expense reimbursements or caps relative to the total universe of funds with comparable investment mandates, regardless of whether their management fee structures also are comparable. Funds with comparable investment mandates offer exposure to similar types of securities. Funds with comparable management fee structures have similar management fee contractual arrangements (
e.g., flat rate charged for advisory services, all-inclusive fee rate,
etc.). "TMG %" represents the percentage of funds in the Total Mapped Group that had management fees that were lower than the fund's. For example, a hypothetical TMG % of 20% would mean that 80% of the funds in the Total Mapped Group had higher, and 20% had lower, management fees than the fund. The fund's actual TMG %s and the number of funds in the Total Mapped Group are in the chart below. The "Asset-Size Peer Group" (ASPG) comparison focuses on a fund's standing relative to a subset of non-Fidelity funds within the Total Mapped Group that are similar in size and management fee structure. For example, if a fund is in the first quartile of the ASPG, the fund's management fee ranks in the least expensive or lowest 25% of funds in the ASPG. The ASPG represents at least 15% of the funds in the Total Mapped Group with comparable asset size and management fee structures, subject to a minimum of 50 funds (or all funds in the Total Mapped Group if fewer than 50). Additional information, such as the ASPG quartile in which the fund's management fee rate ranked, is also included in the chart and considered by the Board.
Fidelity China Region Fund
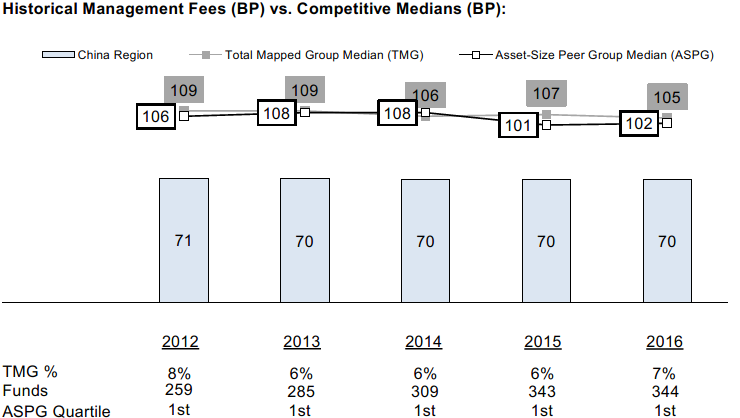
The Board noted that the fund's management fee rate ranked below the median of its Total Mapped Group and below the median of its ASPG for 2016.
The Board noted that, in 2014, the Board and the boards of other Fidelity funds formed the ad hoc Committee on Group Fee to conduct an in-depth review of the "group fee" component of the management fee of funds with such management fee structures. The Committee's focus included the mechanics of the group fee, the competitive landscape of group fee structures, Fidelity funds with no group fee component and investment products not included in group fee assets. The Board also considered that, for funds subject to the group fee, FMR agreed to voluntarily waive fees over a specified period of time in amounts designed to account for assets converted from certain funds to certain collective investment trusts.
The Board also noted that, in 2013, the ad hoc Committee on Management Fees was formed to conduct an in-depth review of the management fee rates of Fidelity's active equity mutual funds. The Committee focused on the following areas: (i) standard fee structures; (ii) research consumption and trading evolution; (iii) management fee competitiveness/profitability by category; and (iv) factors that drive institutional pricing.
Based on its review, the Board concluded that the fund's management fee is fair and reasonable in light of the services that the fund receives and the other factors considered.
Total Expense Ratio. In its review of each class's total expense ratio, the Board considered the fund's management fee rate as well as other fund or class expenses, as applicable, such as transfer agent fees, pricing and bookkeeping fees, fund-paid 12b-1 fees, and custodial, legal, and audit fees. The Board also noted that Fidelity may agree to waive fees and expenses from time to time, and the extent to which, if any, it has done so for the fund. As part of its review, the Board also considered the current and historical total expense ratios of each class of the fund compared to competitive fund median expenses. Each class of the fund is compared to those funds and classes in the Total Mapped Group (used by the Board for management fee comparisons) that have a similar sales load structure.
The Board noted that the total expense ratio of each of Class A, Class C, Class I, and the retail class ranked below the competitive median for 2016 and the total expense ratio of Class M (formerly Class T) ranked above the competitive median for 2016. The Board considered that, in general, various factors can affect total expense ratios. The Board noted that the total expense ratio of Class M was above the competitive median primarily because of higher 12b-1 fees on Class M as compared to most competitor funds. Class M has a higher 12b-1 fee, but a lower front-end sales charge, than traditionally priced front-end sales charge classes. The Board considered that Class M is primarily sold load-waived in the retirement plan market where its 0.50% 12b-1 fee is comparable to competing no-load, higher 12b-1 fee classes designed specifically for retirement plans. The Board noted that the fund offers multiple classes, each of which has a different sales load and 12b-1 fee structure, and that the multiple structures are intended to offer a range of pricing options for the intermediary market. The Board also noted that the total expense ratios of the classes vary primarily by the level of their 12b-1 fees, although differences in transfer agent fees may also cause expenses to vary from class to class.
Fees Charged to Other Fidelity Clients. The Board also considered Fidelity fee structures and other information with respect to clients of Fidelity, such as other funds advised or subadvised by Fidelity, pension plan clients, and other institutional clients with similar mandates. The Board noted that an ad hoc joint committee created by it and the boards of other Fidelity funds periodically (most recently in 2013) reviews and compares Fidelity's institutional investment advisory business with its business of providing services to the Fidelity funds, including the differences in services provided, fees charged, and costs incurred, as well as competition in their respective marketplaces.
Based on its review of total expense ratios and fees charged to other Fidelity clients, the Board concluded that, although Class M was above the median of the universe presented for comparison, the total expense ratio of each class of the fund was reasonable in light of the services that the fund and its shareholders receive and the other factors considered.
Costs of the Services and Profitability. The Board considered the revenues earned and the expenses incurred by Fidelity in conducting the business of developing, marketing, distributing, managing, administering and servicing the fund and servicing the fund's shareholders. The Board also considered the level of Fidelity's profits in respect of all the Fidelity funds.
On an annual basis, Fidelity presents to the Board information about the profitability of its relationships with the fund. Fidelity calculates profitability information for each fund, as well as aggregate profitability information for groups of Fidelity funds and all Fidelity funds, using a series of detailed revenue and cost allocation methodologies which originate with the books and records of Fidelity on which Fidelity's audited financial statements are based. The Audit Committee of the Board reviews any significant changes from the prior year's methodologies.
PricewaterhouseCoopers LLP (PwC), independent registered public accounting firm and auditor to Fidelity and certain Fidelity funds, has been engaged annually by the Board as part of the Board's assessment of Fidelity's profitability analysis. PwC's engagement includes the review and assessment of the methodologies used by Fidelity in determining the revenues and expenses attributable to Fidelity's mutual fund business, and completion of agreed-upon procedures in respect of the mathematical accuracy of the fund profitability information and its conformity to established allocation methodologies. After considering PwC's reports issued under the engagement and information provided by Fidelity, the Board concluded that while other allocation methods may also be reasonable, Fidelity's profitability methodologies are reasonable in all material respects.
The Board also reviewed Fidelity's non-fund businesses and potential fall-out benefits related to the mutual fund business as well as cases where Fidelity's affiliates may benefit from or be related to the fund's business.
The Board considered the costs of the services provided by and the profits realized by Fidelity in connection with the operation of the fund and was satisfied that the profitability was not excessive.
Economies of Scale. The Board considered whether there have been economies of scale in respect of the management of the Fidelity funds, whether the Fidelity funds (including the fund) have appropriately benefited from any such economies of scale, and whether there is potential for realization of any further economies of scale. The Board considered the extent to which the fund will benefit from economies of scale as assets grow through increased services to the fund, through waivers or reimbursements, or through fee or expense ratio reductions. The Board also noted that a committee (the Economies of Scale Committee) created by it and the boards of other Fidelity funds periodically (most recently in 2013) analyzes whether Fidelity attains economies of scale in respect of the management and servicing of the Fidelity funds, whether the Fidelity funds have appropriately benefited from such economies of scale, and whether there is potential for realization of any further economies of scale.
The Board recognized that the fund's management contract incorporates a "group fee" structure, which provides for lower group fee rates as total group assets increase, and for higher group fee rates as total group assets decrease (with "group assets" defined to include fund assets under FMR's management plus the assets of sector funds previously under FMR's management). FMR calculates the group fee rates based on a tiered asset "breakpoint" schedule that varies based on asset class. The Board considered that the group fee is designed to deliver the benefits of economies of scale to fund shareholders when total Fidelity fund assets increase, even if assets of any particular fund are unchanged or have declined, because some portion of Fidelity's costs are attributable to services provided to all Fidelity funds, and all funds benefit if those costs can be allocated among more assets. The Board concluded that, given the group fee structure, fund shareholders will benefit from lower management fees as group assets increase at the fund complex level, regardless of whether Fidelity achieves any such economies of scale.
The Board concluded, taking into account the analysis of the Economies of Scale Committee, that economies of scale, if any, are being appropriately shared between fund shareholders and Fidelity.
Additional Information Requested by the Board. In order to develop fully the factual basis for consideration of the Fidelity funds' advisory contracts, the Board requested and received additional information on certain topics, including: (i) fund performance trends, in particular the underperformance of certain funds, and Fidelity's long-term strategies for certain funds; (ii) Fidelity's fund profitability methodology, profitability trends for certain funds, and the impact of certain factors on fund profitability results, including the impact of market trends on actively managed funds; (iii) the use of performance fees and the calculation of performance adjustments, including the impact of underperformance and fund outflows on performance adjustments; (iv) metrics for evaluating index fund performance; (v) Fidelity's group fee structure, including the group fee breakpoint schedules; (vi) the terms of Fidelity's contractual and voluntary expense cap arrangements with the funds; (vii) the methodology with respect to evaluating competitive fund data and peer group classifications and fee comparisons; (viii) the expense structures for different funds and classes; (ix) Fidelity's arrangements with affiliated sub-advisers on behalf of the funds; (x) information regarding other accounts managed by Fidelity, including institutional accounts and collective investment trusts; (xi) recent changes to the fee structure for certain funds of funds; and (xii) the impact of the Department of Labor's new fiduciary rule on the funds' comparative expense information.
Based on its evaluation of all of the conclusions noted above, and after considering all factors it believed relevant, the Board concluded that the advisory fee structures are fair and reasonable, and that the fund's Advisory Contracts should be renewed.
AHKC-ANN-1217
1.861459.109
Fidelity® Emerging Markets Fund Class K
Annual Report October 31, 2017 |
|
Contents
To view a fund's proxy voting guidelines and proxy voting record for the 12-month period ended June 30, visit http://www.fidelity.com/proxyvotingresults or visit the Securities and Exchange Commission's (SEC) web site at http://www.sec.gov.
You may also call 1-800-835-5092 to request a free copy of the proxy voting guidelines.
Standard & Poor's, S&P and S&P 500 are registered service marks of The McGraw-Hill Companies, Inc. and have been licensed for use by Fidelity Distributors Corporation.
Other third-party marks appearing herein are the property of their respective owners.
All other marks appearing herein are registered or unregistered trademarks or service marks of FMR LLC or an affiliated company. © 2017 FMR LLC. All rights reserved.
This report and the financial statements contained herein are submitted for the general information of the shareholders of the Fund. This report is not authorized for distribution to prospective investors in the Fund unless preceded or accompanied by an effective prospectus.
A fund files its complete schedule of portfolio holdings with the SEC for the first and third quarters of each fiscal year on Form N-Q. Forms N-Q are available on the SEC’s web site at http://www.sec.gov. A fund's Forms N-Q may be reviewed and copied at the SEC’s Public Reference Room in Washington, DC. Information regarding the operation of the SEC's Public Reference Room may be obtained by calling 1-800-SEC-0330.
For a complete list of a fund's portfolio holdings, view the most recent holdings listing, semiannual report, or annual report on Fidelity's web site at http://www.fidelity.com, http://www.institutional.fidelity.com, or http://www.401k.com, as applicable.
NOT FDIC INSURED •MAY LOSE VALUE •NO BANK GUARANTEE
Neither the Fund nor Fidelity Distributors Corporation is a bank.
Performance: The Bottom Line
Average annual total return reflects the change in the value of an investment, assuming reinvestment of distributions from dividend income and capital gains (the profits earned upon the sale of securities that have grown in value, if any) and assuming a constant rate of performance each year. The hypothetical investment and the average annual total returns do not reflect the deduction of taxes that a shareholder would pay on fund distributions or the redemption of fund shares. During periods of reimbursement by Fidelity, a fund’s total return will be greater than it would be had the reimbursement not occurred. How a fund did yesterday is no guarantee of how it will do tomorrow.
Average Annual Total Returns
| For the periods ended October 31, 2017 | Past 1 year | Past 5 years | Past 10 years |
| Class K | 30.44% | 8.12% | (0.24)% |
The initial offering of Class K shares took place on May 9, 2008. Returns prior to May 9, 2008 are those of Fidelity® Emerging Markets Fund, the original class of the fund.
$10,000 Over 10 Years
Let's say hypothetically that $10,000 was invested in Fidelity® Emerging Markets Fund - Class K on October 31, 2017.
The chart shows how the value of your investment would have changed, and also shows how the MSCI Emerging Markets Index performed over the same period.
See above for additional information regarding the performance of Class K.
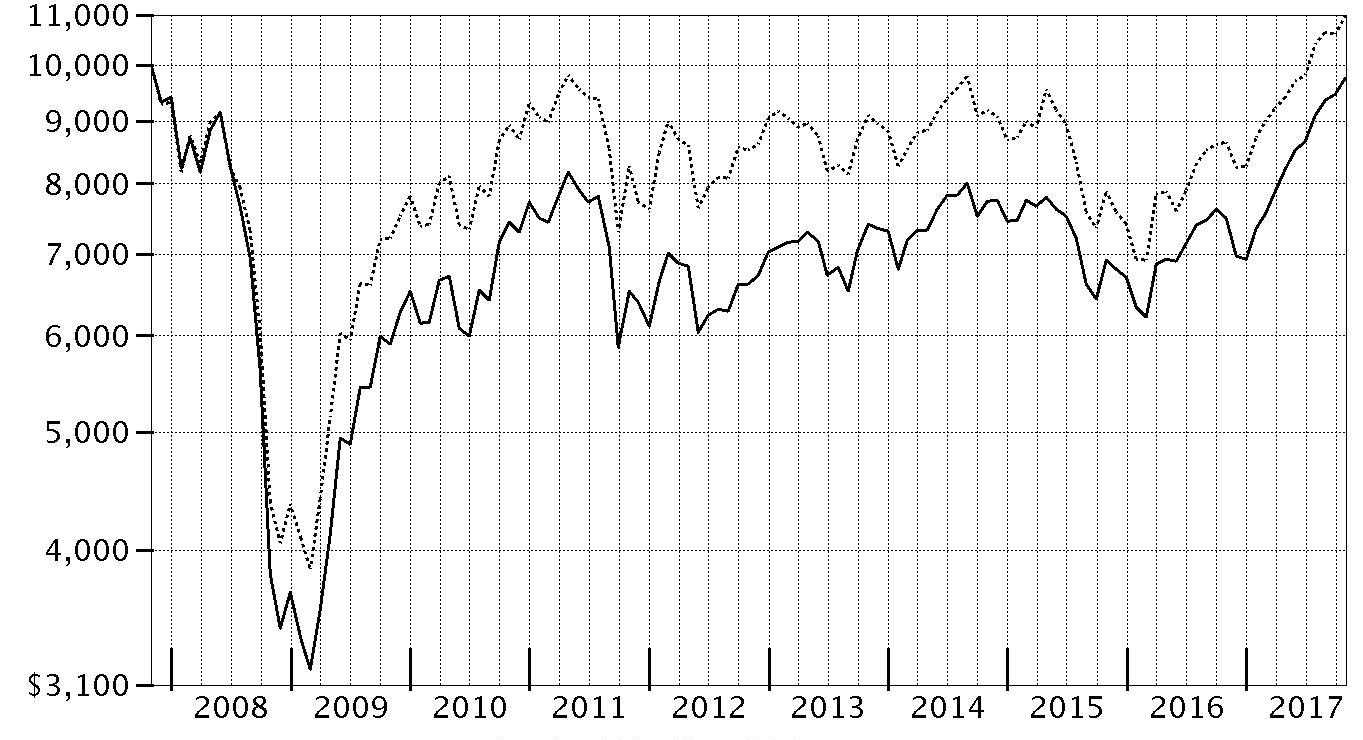
| Period Ending Values |
| $9,766 | Fidelity® Emerging Markets Fund - Class K |
| $10,970 | MSCI Emerging Markets Index |
Management's Discussion of Fund Performance
Market Recap: The MSCI ACWI (All Country World Index) ex USA Index returned 23.85% for the 12 months ending October 31, 2017, helped partly by a generally weak U.S. dollar. Some favorable election results in continental Europe (+30%) suggested ebbing political uncertainty and near-term risk there, but the U.K. (+20%) faced more-mixed conditions ahead of its expected exit from the European Union. Despite central-bank easing – and pressured recently by yen strength – Japan (+18%) lagged the rest of the Asia-Pacific group (+22%). Commodity-price volatility slowed Canada (+17%), but the emerging-markets group (+26%) sped ahead. Sector-wise, information technology (+47%) was driven by a surge among several Chinese internet-related names. Financials (+27%) rode rising interest rates that, at the same time, weighed on real estate (+17%), utilities (+16%), consumer staples (+14%) and telecommunication services (+9%) – so-called “bond proxy” sectors. Materials (+28%) and industrials (+27%) responded to demand from China and price gains for certain commodities. In the energy sector (+20%), oil prices lost ground in the spring before rebounding through October 31 to end well above where they started 12 months ago. Lastly, health care (+14%) was hurt by early-period turmoil around drug pricing and health care legislation.
Comments from Portfolio Manager Sammy Simnegar: For the year, the fund’s share classes gained roughly 30%, topping the 26.91% advance of the benchmark MSCI Emerging Markets Index. Versus the benchmark, stock picking in the consumer discretionary sector contributed most to fund performance; an underweighting in telecommunication services and positioning in financials also helped. Overall, active management added value in nine of 11 market sectors this period. Geographically, China, Netherlands, Hong Kong, India and South Africa all contributed. At the stock level, avoiding two weak-performing, state-owned benchmark components – wireless-services provider China Mobile and Brazil-based energy giant Petroleo Brasileiro – bolstered relative performance. Out-of-benchmark positions in Brazil-based for-profit educator Estacio Participacoes and China’s Hangzhou Hikvision Digital Technology, the world’s largest manufacturer of security cameras, further lifted relative results. Conversely, materials and real estate detracted from relative performance, as did a small cash position. Among countries, positioning in Mexico and South Korea held back results. Avoiding the strong-performing shares of South Korea-based index name SK Hynix made this stock our largest relative detractor. Untimely ownership of strong-performing index name JD.com, a China-based e-tailer, further worked against us.
The views expressed above reflect those of the portfolio manager(s) only through the end of the period as stated on the cover of this report and do not necessarily represent the views of Fidelity or any other person in the Fidelity organization. Any such views are subject to change at any time based upon market or other conditions and Fidelity disclaims any responsibility to update such views. These views may not be relied on as investment advice and, because investment decisions for a Fidelity fund are based on numerous factors, may not be relied on as an indication of trading intent on behalf of any Fidelity fund.
Investment Summary (Unaudited)
Geographic Diversification (% of fund's net assets)
| As of October 31, 2017 |
| | Cayman Islands | 17.2% |
| | India | 13.8% |
| | United States of America* | 7.9% |
| | China | 7.7% |
| | South Africa | 6.0% |
| | Korea (South) | 5.8% |
| | Brazil | 5.6% |
| | Taiwan | 5.5% |
| | Mexico | 4.7% |
| | Other | 25.8% |
* Includes Short-Term investments and Net Other Assets (Liabilities).
Percentages are based on country or territory of incorporation and are adjusted for the effect of futures contracts, if applicable.
| As of April 30, 2017 |
| | India | 11.6% |
| | Cayman Islands | 10.9% |
| | United States of America* | 9.7% |
| | Brazil | 9.7% |
| | Korea (South) | 8.1% |
| | South Africa | 6.9% |
| | Mexico | 6.4% |
| | Taiwan | 5.4% |
| | China | 5.3% |
| | Other | 26.0% |
* Includes Short-Term investments and Net Other Assets (Liabilities).
Percentages are based on country or territory of incorporation and are adjusted for the effect of futures contracts, if applicable.
Asset Allocation as of October 31, 2017
| | % of fund's net assets | % of fund's net assets 6 months ago |
| Stocks | 97.9 | 98.0 |
| Short-Term Investments and Net Other Assets (Liabilities) | 2.1 | 2.0 |
Top Ten Stocks as of October 31, 2017
| | % of fund's net assets | % of fund's net assets 6 months ago |
| Samsung Electronics Co. Ltd. (Korea (South), Technology Hardware, Storage & Peripherals) | 5.8 | 5.4 |
| Tencent Holdings Ltd. (Cayman Islands, Internet Software & Services) | 5.3 | 4.5 |
| Alibaba Group Holding Ltd. sponsored ADR (Cayman Islands, Internet Software & Services) | 4.5 | 3.4 |
| Taiwan Semiconductor Manufacturing Co. Ltd. (Taiwan, Semiconductors & Semiconductor Equipment) | 4.4 | 4.0 |
| Naspers Ltd. Class N (South Africa, Media) | 2.5 | 2.3 |
| Baidu.com, Inc. sponsored ADR (Cayman Islands, Internet Software & Services) | 1.8 | 0.0 |
| Ping An Insurance (Group) Co. of China Ltd. (H Shares) (China, Insurance) | 1.4 | 0.0 |
| Reliance Industries Ltd. (India, Oil, Gas & Consumable Fuels) | 1.3 | 1.1 |
| Itau Unibanco Holding SA (Brazil, Banks) | 1.2 | 1.4 |
| Housing Development Finance Corp. Ltd. (India, Thrifts & Mortgage Finance) | 1.2 | 1.4 |
| | 29.4 | |
Top Market Sectors as of October 31, 2017
| | % of fund's net assets | % of fund's net assets 6 months ago |
| Information Technology | 30.6 | 27.5 |
| Financials | 17.7 | 16.3 |
| Consumer Discretionary | 16.2 | 12.8 |
| Industrials | 7.5 | 7.5 |
| Consumer Staples | 7.4 | 12.1 |
| Materials | 6.1 | 9.6 |
| Health Care | 2.8 | 5.8 |
| Utilities | 2.5 | 1.6 |
| Energy | 2.4 | 2.4 |
| Telecommunication Services | 2.4 | 1.2 |
Percentages shown as 0.0% may reflect amounts less than 0.05%.
Investments October 31, 2017
Showing Percentage of Net Assets
| Common Stocks - 96.7% | | | |
| | | Shares | Value |
| Argentina - 1.5% | | | |
| Banco Macro SA sponsored ADR | | 185,649 | $23,376,922 |
| IRSA Propiedades Comerciales SA sponsored ADR | | 418,400 | 23,430,400 |
| Telecom Argentina SA Class B sponsored ADR (a) | | 735,853 | 23,996,166 |
|
| TOTAL ARGENTINA | | | 70,803,488 |
|
| Australia - 0.5% | | | |
| Amcor Ltd. | | 1,955,680 | 23,708,990 |
| Bermuda - 0.8% | | | |
| Credicorp Ltd. (United States) | | 175,732 | 36,805,310 |
| Brazil - 4.4% | | | |
| BM&F BOVESPA SA | | 5,016,900 | 36,653,291 |
| BTG Pactual Participations Ltd. unit | | 3,712,200 | 24,976,469 |
| Equatorial Energia SA | | 1,348,500 | 25,145,508 |
| Estacio Participacoes SA | | 2,637,600 | 23,648,338 |
| IRB Brasil Resseguros SA | | 2,456,100 | 24,633,828 |
| Kroton Educacional SA | | 5,045,460 | 27,746,714 |
| Qualicorp SA | | 2,319,900 | 24,820,866 |
| Smiles Fidelidade SA | | 932,500 | 24,372,191 |
|
| TOTAL BRAZIL | | | 211,997,205 |
|
| Cayman Islands - 17.2% | | | |
| 58.com, Inc. ADR (a) | | 482,700 | 32,422,959 |
| Alibaba Group Holding Ltd. sponsored ADR (a) | | 1,181,200 | 218,392,068 |
| Baidu.com, Inc. sponsored ADR (a) | | 347,500 | 84,769,150 |
| China Literature Ltd. | | 4,577 | 32,268 |
| Ctrip.com International Ltd. ADR (a) | | 795,000 | 38,072,550 |
| JD.com, Inc. sponsored ADR (a) | | 1,215,100 | 45,590,552 |
| Melco Crown Entertainment Ltd. sponsored ADR | | 998,700 | 25,247,136 |
| NetEase, Inc. ADR | | 160,400 | 45,219,968 |
| New Oriental Education & Technology Group, Inc. sponsored ADR | | 406,083 | 33,802,349 |
| Sands China Ltd. | | 4,823,200 | 22,720,614 |
| Shenzhou International Group Holdings Ltd. | | 3,426,000 | 29,247,520 |
| Tencent Holdings Ltd. | | 5,749,100 | 258,393,918 |
|
| TOTAL CAYMAN ISLANDS | | | 833,911,052 |
|
| China - 7.7% | | | |
| Gree Electric Appliances, Inc. of Zhuhai Class A | | 3,830,067 | 24,562,443 |
| Hangzhou Hikvision Digital Technology Co. Ltd. Class A | | 4,786,000 | 28,334,124 |
| Hangzhou Robam Appliances Co. Ltd. Class A | | 3,749,956 | 26,264,217 |
| Inner Mongoli Yili Industries Co. Ltd. (A Shares) | | 5,520,508 | 24,586,808 |
| Jiangsu Yanghe Brewery Joint-Stock Co. Ltd. Class A | | 1,431,860 | 23,790,599 |
| Kweichow Moutai Co. Ltd. (A Shares) | | 263,831 | 24,575,423 |
| Midea Group Co. Ltd. Class A | | 3,458,500 | 26,584,199 |
| Ping An Insurance (Group) Co. of China Ltd. (H Shares) | | 7,726,500 | 67,842,342 |
| Shanghai International Airport Co. Ltd. (A Shares) | | 4,079,400 | 26,899,237 |
| Shenzhen Inovance Technology Co. Ltd. Class A | | 5,478,000 | 25,479,070 |
| Tonghua Dongbao Pharmaceutical Co. Ltd. Class A | | 7,135,700 | 23,251,870 |
| Wuliangye Yibin Co. Ltd. Class A | | 2,747,800 | 27,590,233 |
| Yunnan Baiyao Group Co. Ltd. | | 1,585,097 | 25,046,582 |
|
| TOTAL CHINA | | | 374,807,147 |
|
| France - 2.1% | | | |
| Dassault Systemes SA | | 226,462 | 24,050,123 |
| Kering SA | | 58,875 | 26,986,444 |
| LVMH Moet Hennessy - Louis Vuitton SA | | 87,994 | 26,245,387 |
| Rubis | | 360,800 | 22,644,572 |
|
| TOTAL FRANCE | | | 99,926,526 |
|
| Germany - 0.4% | | | |
| adidas AG | | 97,984 | 21,805,809 |
| Greece - 0.4% | | | |
| Titan Cement Co. SA (Reg.) | | 849,800 | 20,510,511 |
| Hong Kong - 2.2% | | | |
| AIA Group Ltd. | | 3,009,600 | 22,645,105 |
| CSPC Pharmaceutical Group Ltd. | | 18,372,000 | 31,933,284 |
| Guangdong Investment Ltd. | | 18,247,000 | 26,430,013 |
| Techtronic Industries Co. Ltd. | | 4,532,500 | 26,580,085 |
|
| TOTAL HONG KONG | | | 107,588,487 |
|
| Hungary - 0.7% | | | |
| OTP Bank PLC | | 857,200 | 34,569,029 |
| India - 13.8% | | | |
| Adani Ports & Special Economic Zone Ltd. | | 4,738,576 | 31,494,150 |
| Asian Paints Ltd. | | 1,621,308 | 29,567,900 |
| Bharat Petroleum Corp. Ltd. | | 3,742,921 | 31,307,583 |
| Eicher Motors Ltd. | | 55,061 | 27,410,089 |
| Godrej Consumer Products Ltd. | | 1,906,101 | 27,492,011 |
| HDFC Bank Ltd. | | 846,455 | 23,692,494 |
| Hero Motocorp Ltd. | | 451,749 | 26,860,054 |
| Housing Development Finance Corp. Ltd. | | 2,305,407 | 60,791,535 |
| Indraprastha Gas Ltd. | | 1,074,357 | 26,301,421 |
| IndusInd Bank Ltd. | | 877,835 | 22,059,756 |
| ITC Ltd. | | 8,929,226 | 36,640,855 |
| Kotak Mahindra Bank Ltd. | | 1,593,533 | 25,227,043 |
| LIC Housing Finance Ltd. | | 2,807,587 | 25,959,882 |
| Maruti Suzuki India Ltd. | | 292,659 | 37,113,455 |
| PC Jeweller Ltd. | | 8,277,230 | 44,844,051 |
| Power Grid Corp. of India Ltd. | | 7,323,014 | 23,959,545 |
| Reliance Industries Ltd. | | 4,287,498 | 62,299,498 |
| Shree Cement Ltd. | | 89,901 | 26,283,581 |
| Ultratech Cemco Ltd. | | 456,758 | 31,045,788 |
| UPL Ltd. | | 2,214,164 | 27,332,530 |
| Vakrangee Ltd. | | 2,852,979 | 24,775,754 |
|
| TOTAL INDIA | | | 672,458,975 |
|
| Indonesia - 2.3% | | | |
| PT Bank Central Asia Tbk | | 25,898,000 | 39,909,176 |
| PT Bank Rakyat Indonesia Tbk | | 31,035,700 | 35,698,206 |
| PT Telkomunikasi Indonesia Tbk Series B | | 127,402,600 | 38,012,727 |
|
| TOTAL INDONESIA | | | 113,620,109 |
|
| Israel - 1.5% | | | |
| Check Point Software Technologies Ltd. (a) | | 209,300 | 24,636,703 |
| Elbit Systems Ltd. (Israel) | | 165,900 | 24,593,482 |
| Frutarom Industries Ltd. | | 293,700 | 24,179,945 |
|
| TOTAL ISRAEL | | | 73,410,130 |
|
| Kenya - 0.5% | | | |
| Safaricom Ltd. | | 100,613,100 | 24,729,003 |
| Korea (South) - 5.8% | | | |
| Samsung Electronics Co. Ltd. | | 115,359 | 284,144,108 |
| Luxembourg - 0.1% | | | |
| Eurofins Scientific SA | | 10,894 | 6,814,463 |
| Mexico - 4.7% | | | |
| CEMEX S.A.B. de CV sponsored ADR | | 4,508,020 | 36,560,042 |
| Embotelladoras Arca S.A.B. de CV | | 3,981,200 | 25,336,561 |
| Fomento Economico Mexicano S.A.B. de CV unit | | 4,511,567 | 39,386,126 |
| Gruma S.A.B. de CV Series B | | 1,877,830 | 24,597,621 |
| Grupo Aeroportuario del Pacifico S.A.B. de CV Series B | | 2,817,857 | 26,725,309 |
| Grupo Aeroportuario del Sureste S.A.B. de CV Series B | | 1,610,330 | 28,719,550 |
| Grupo Aeroportuario Norte S.A.B. de CV | | 4,556,300 | 22,990,935 |
| Grupo Cementos de Chihuahua S.A.B. de CV | | 4,559,939 | 21,779,630 |
|
| TOTAL MEXICO | | | 226,095,774 |
|
| Netherlands - 1.5% | | | |
| ASML Holding NV (Netherlands) | | 141,900 | 25,602,943 |
| X5 Retail Group NV GDR (Reg. S) (a) | | 568,800 | 23,377,680 |
| Yandex NV Series A (a) | | 747,300 | 25,281,159 |
|
| TOTAL NETHERLANDS | | | 74,261,782 |
|
| Panama - 0.5% | | | |
| Copa Holdings SA Class A | | 189,900 | 23,393,781 |
| Philippines - 2.6% | | | |
| Ayala Corp. | | 1,470,560 | 29,390,960 |
| Ayala Land, Inc. | | 36,918,500 | 30,917,200 |
| D&L Industries, Inc. | | 26,273,100 | 5,286,656 |
| SM Investments Corp. | | 1,667,663 | 30,873,369 |
| SM Prime Holdings, Inc. | | 43,987,800 | 31,550,505 |
|
| TOTAL PHILIPPINES | | | 128,018,690 |
|
| Russia - 1.2% | | | |
| Sberbank of Russia | | 16,935,210 | 56,117,038 |
| South Africa - 6.0% | | | |
| Bidcorp Ltd. | | 1,387,398 | 30,517,604 |
| Capitec Bank Holdings Ltd. | | 393,700 | 26,170,277 |
| Discovery Ltd. | | 2,509,985 | 26,016,324 |
| FirstRand Ltd. | | 8,882,300 | 32,196,472 |
| Mondi Ltd. | | 1,093,566 | 26,231,662 |
| Naspers Ltd. Class N | | 503,712 | 122,732,762 |
| Sanlam Ltd. | | 5,781,300 | 28,909,056 |
|
| TOTAL SOUTH AFRICA | | | 292,774,157 |
|
| Spain - 0.5% | | | |
| Amadeus IT Holding SA Class A | | 367,600 | 24,942,584 |
| Switzerland - 1.0% | | | |
| Compagnie Financiere Richemont SA Series A | | 246,345 | 22,709,629 |
| Sika AG | | 3,170 | 23,465,594 |
|
| TOTAL SWITZERLAND | | | 46,175,223 |
|
| Taiwan - 5.5% | | | |
| Advantech Co. Ltd. | | 3,680,402 | 25,156,374 |
| Taiwan Semiconductor Manufacturing Co. Ltd. | | 26,082,000 | 211,005,219 |
| United Microelectronics Corp. | | 57,981,000 | 29,945,641 |
|
| TOTAL TAIWAN | | | 266,107,234 |
|
| Thailand - 0.6% | | | |
| Airports of Thailand PCL (For. Reg.) | | 17,367,000 | 31,105,855 |
| Turkey - 2.2% | | | |
| Koc Holding A/S | | 6,266,000 | 28,013,697 |
| Tofas Turk Otomobil Fabrikasi A/S | | 2,768,287 | 22,534,223 |
| Tupras Turkiye Petrol Rafinerileri A/S | | 753,058 | 27,096,629 |
| Turkcell Iletisim Hizmet A/S | | 7,314,000 | 27,319,893 |
|
| TOTAL TURKEY | | | 104,964,442 |
|
| United Arab Emirates - 0.2% | | | |
| DP World Ltd. | | 361,930 | 8,595,838 |
| United Kingdom - 2.5% | | | |
| British American Tobacco PLC (United Kingdom) | | 368,300 | 23,795,801 |
| Diageo PLC | | 659,105 | 22,507,670 |
| InterContinental Hotel Group PLC | | 457,500 | 25,350,266 |
| NMC Health PLC | | 653,100 | 25,085,635 |
| Prudential PLC | | 942,278 | 23,128,568 |
|
| TOTAL UNITED KINGDOM | | | 119,867,940 |
|
| United States of America - 5.8% | | | |
| A.O. Smith Corp. | | 405,700 | 24,017,440 |
| Alphabet, Inc. Class C (a) | | 24,745 | 25,156,757 |
| American Tower Corp. | | 170,600 | 24,510,102 |
| Amphenol Corp. Class A | | 277,700 | 24,159,900 |
| Facebook, Inc. Class A (a) | | 135,400 | 24,380,124 |
| MasterCard, Inc. Class A | | 166,300 | 24,740,451 |
| Moody's Corp. | | 178,100 | 25,363,221 |
| MSCI, Inc. | | 209,300 | 24,563,448 |
| S&P Global, Inc. | | 152,100 | 23,799,087 |
| Visa, Inc. Class A | | 211,100 | 23,216,778 |
| Yum China Holdings, Inc. | | 960,800 | 38,768,280 |
|
| TOTAL UNITED STATES OF AMERICA | | | 282,675,588 |
|
| TOTAL COMMON STOCKS | | | |
| (Cost $3,195,922,757) | | | 4,696,706,268 |
|
| Nonconvertible Preferred Stocks - 1.2% | | | |
| Brazil - 1.2% | | | |
| Itau Unibanco Holding SA | | | |
| (Cost $37,894,250) | | 4,782,910 | 61,480,563 |
|
| Money Market Funds - 2.1% | | | |
| Fidelity Cash Central Fund, 1.10% (b) | | | |
| (Cost $100,811,178) | | 100,791,019 | 100,811,178 |
| TOTAL INVESTMENT IN SECURITIES - 100.0% | | | |
| (Cost $3,334,628,185) | | | 4,858,998,009 |
| NET OTHER ASSETS (LIABILITIES) - 0.0% | | | (813,774) |
| NET ASSETS - 100% | | | $4,858,184,235 |
Categorizations in the Schedule of Investments are based on country or territory of incorporation.
Legend
(a) Non-income producing
(b) Affiliated fund that is generally available only to investment companies and other accounts managed by Fidelity Investments. The rate quoted is the annualized seven-day yield of the fund at period end. A complete unaudited listing of the fund's holdings as of its most recent quarter end is available upon request. In addition, each Fidelity Central Fund's financial statements, which are not covered by the Fund's Report of Independent Registered Public Accounting Firm, are available on the SEC's website or upon request.
Affiliated Central Funds
Information regarding fiscal year to date income earned by the Fund from investments in Fidelity Central Funds is as follows:
| Fund | Income earned |
| Fidelity Cash Central Fund | $347,884 |
| Fidelity Securities Lending Cash Central Fund | 130,241 |
| Total | $478,125 |
Investment Valuation
The following is a summary of the inputs used, as of October 31, 2017, involving the Fund's assets and liabilities carried at fair value. The inputs or methodology used for valuing securities may not be an indication of the risk associated with investing in those securities. For more information on valuation inputs, and their aggregation into the levels used below, please refer to the Investment Valuation section in the accompanying Notes to Financial Statements.
| | Valuation Inputs at Reporting Date: |
| Description | Total | Level 1 | Level 2 | Level 3 |
| Investments in Securities: | | | | |
| Equities: | | | | |
| Consumer Discretionary | $790,421,536 | $741,434,252 | $48,987,284 | $-- |
| Consumer Staples | 354,194,992 | 307,891,521 | 46,303,471 | -- |
| Energy | 120,703,710 | 120,703,710 | -- | -- |
| Financials | 861,975,402 | 759,037,302 | 102,938,100 | -- |
| Health Care | 136,952,700 | 136,952,700 | -- | -- |
| Industrials | 360,311,802 | 360,311,802 | -- | -- |
| Information Technology | 1,488,726,805 | 963,779,084 | 524,947,721 | -- |
| Materials | 295,952,829 | 295,952,829 | -- | -- |
| Real Estate | 110,408,207 | 110,408,207 | -- | -- |
| Telecommunication Services | 114,057,789 | 76,045,062 | 38,012,727 | -- |
| Utilities | 124,481,059 | 124,481,059 | -- | -- |
| Money Market Funds | 100,811,178 | 100,811,178 | -- | -- |
| Total Investments in Securities: | $4,858,998,009 | $4,097,808,706 | $761,189,303 | $-- |
See accompanying notes which are an integral part of the financial statements.
Financial Statements
Statement of Assets and Liabilities
| | | October 31, 2017 |
| Assets | | |
Investment in securities, at value — See accompanying schedule:
Unaffiliated issuers (cost $3,233,817,007) | $4,758,186,831 | |
| Fidelity Central Funds (cost $100,811,178) | 100,811,178 | |
| Total Investment in Securities (cost $3,334,628,185) | | $4,858,998,009 |
| Foreign currency held at value (cost $3,691,421) | | 3,706,186 |
| Receivable for investments sold | | 3,921,829 |
| Receivable for fund shares sold | | 17,607,683 |
| Dividends receivable | | 2,279,335 |
| Distributions receivable from Fidelity Central Funds | | 54,868 |
| Prepaid expenses | | 9,949 |
| Other receivables | | 2,009,297 |
| Total assets | | 4,888,587,156 |
| Liabilities | | |
| Payable for investments purchased | $8,532,188 | |
| Payable for fund shares redeemed | 9,394,654 | |
| Accrued management fee | 2,776,321 | |
| Other affiliated payables | 761,388 | |
| Other payables and accrued expenses | 8,938,370 | |
| Total liabilities | | 30,402,921 |
| Net Assets | | $4,858,184,235 |
| Net Assets consist of: | | |
| Paid in capital | | $3,568,613,112 |
| Undistributed net investment income | | 25,936,057 |
| Accumulated undistributed net realized gain (loss) on investments and foreign currency transactions | | (251,852,477) |
| Net unrealized appreciation (depreciation) on investments and assets and liabilities in foreign currencies | | 1,515,487,543 |
| Net Assets | | $4,858,184,235 |
| Emerging Markets: | | |
| Net Asset Value, offering price and redemption price per share ($3,933,401,062 ÷ 125,386,136 shares) | | $31.37 |
| Class K: | | |
| Net Asset Value, offering price and redemption price per share ($924,783,173 ÷ 29,443,570 shares) | | $31.41 |
See accompanying notes which are an integral part of the financial statements.
Statement of Operations
| | | Year ended October 31, 2017 |
| Investment Income | | |
| Dividends | | $78,616,045 |
| Income from Fidelity Central Funds | | 478,125 |
| Income before foreign taxes withheld | | 79,094,170 |
| Less foreign taxes withheld | | (6,775,655) |
| Total income | | 72,318,515 |
| Expenses | | |
| Management fee | $28,126,405 | |
| Transfer agent fees | 6,788,281 | |
| Accounting and security lending fees | 1,526,540 | |
| Custodian fees and expenses | 1,574,787 | |
| Independent trustees' fees and expenses | 15,753 | |
| Registration fees | 112,793 | |
| Audit | 137,189 | |
| Legal | 9,648 | |
| Interest | 11,278 | |
| Miscellaneous | 31,934 | |
| Total expenses before reductions | 38,334,608 | |
| Expense reductions | (661,369) | 37,673,239 |
| Net investment income (loss) | | 34,645,276 |
| Realized and Unrealized Gain (Loss) | | |
| Net realized gain (loss) on: | | |
| Investment securities: | | |
| Unaffiliated issuers | 214,428,798 | |
| Fidelity Central Funds | 2,710 | |
| Foreign currency transactions | (1,927,606) | |
| Total net realized gain (loss) | | 212,503,902 |
| Change in net unrealized appreciation (depreciation) on: | | |
| Unaffiliated issuers (net of increase in deferred foreign taxes of $8,307,470) | 865,214,081 | |
| Fidelity Central Funds | (2,725) | |
| Assets and liabilities in foreign currencies | 105,469 | |
| Total change in net unrealized appreciation (depreciation) | | 865,316,825 |
| Net gain (loss) | | 1,077,820,727 |
| Net increase (decrease) in net assets resulting from operations | | $1,112,466,003 |
See accompanying notes which are an integral part of the financial statements.
Statement of Changes in Net Assets
| | Year ended October 31, 2017 | Year ended October 31, 2016 |
| Increase (Decrease) in Net Assets | | |
| Operations | | |
| Net investment income (loss) | $34,645,276 | $21,682,785 |
| Net realized gain (loss) | 212,503,902 | (227,815,936) |
| Change in net unrealized appreciation (depreciation) | 865,316,825 | 470,369,169 |
| Net increase (decrease) in net assets resulting from operations | 1,112,466,003 | 264,236,018 |
| Distributions to shareholders from net investment income | (23,974,554) | (17,361,594) |
| Share transactions - net increase (decrease) | 96,080,893 | 131,573,266 |
| Redemption fees | 379,582 | 1,810,193 |
| Total increase (decrease) in net assets | 1,184,951,924 | 380,257,883 |
| Net Assets | | |
| Beginning of period | 3,673,232,311 | 3,292,974,428 |
| End of period | $4,858,184,235 | $3,673,232,311 |
| Other Information | | |
| Undistributed net investment income end of period | $25,936,057 | $17,935,313 |
See accompanying notes which are an integral part of the financial statements.
Financial Highlights
Fidelity Emerging Markets Fund
| Years ended October 31, | 2017 | 2016 | 2015 | 2014 | 2013 |
| Selected Per–Share Data | | | | | |
| Net asset value, beginning of period | $24.25 | $22.55 | $25.44 | $24.43 | $22.15 |
| Income from Investment Operations | | | | | |
| Net investment income (loss)A | .22 | .14 | .19 | .17 | .20 |
| Net realized and unrealized gain (loss) | 7.05 | 1.66 | (2.91) | .86 | 2.38 |
| Total from investment operations | 7.27 | 1.80 | (2.72) | 1.03 | 2.58 |
| Distributions from net investment income | (.15) | (.11) | (.14) | (.02) | (.30) |
| Distributions from net realized gain | – | – | (.03) | – | – |
| Total distributions | (.15) | (.11) | (.17) | (.02) | (.30) |
| Redemption fees added to paid in capitalA | –B | .01 | –B | –B | –B |
| Net asset value, end of period | $31.37 | $24.25 | $22.55 | $25.44 | $24.43 |
| Total ReturnC | 30.21% | 8.07% | (10.76)% | 4.22% | 11.78% |
| Ratios to Average Net AssetsD,E | | | | | |
| Expenses before reductions | .97% | 1.01% | 1.05% | 1.07% | 1.08% |
| Expenses net of fee waivers, if any | .97% | 1.01% | 1.05% | 1.07% | 1.08% |
| Expenses net of all reductions | .96% | 1.00% | 1.03% | 1.07% | 1.03% |
| Net investment income (loss) | .83% | .61% | .78% | .71% | .85% |
| Supplemental Data | | | | | |
| Net assets, end of period (000 omitted) | $3,933,401 | $3,014,957 | $2,738,934 | $2,370,927 | $2,241,338 |
| Portfolio turnover rateF | 81% | 79% | 107% | 94% | 119% |
A Calculated based on average shares outstanding during the period.
B Amount represents less than $.005 per share.
C Total returns would have been lower if certain expenses had not been reduced during the applicable periods shown.
D Fees and expenses of any underlying Fidelity Central Funds are not included in the Fund's expense ratio. The Fund indirectly bears its proportionate share of the expenses of any underlying Fidelity Central Funds.
E Expense ratios reflect operating expenses of the class. Expenses before reductions do not reflect amounts reimbursed by the investment adviser or reductions from brokerage service arrangements or reductions from other expense offset arrangements and do not represent the amount paid by the class during periods when reimbursements or reductions occur. Expenses net of fee waivers reflect expenses after reimbursement by the investment adviser but prior to reductions from brokerage service arrangements or other expense offset arrangements. Expenses net of all reductions represent the net expenses paid by the class.
F Amount does not include the portfolio activity of any underlying Fidelity Central Funds.
See accompanying notes which are an integral part of the financial statements.
Fidelity Emerging Markets Fund Class K
| Years ended October 31, | 2017 | 2016 | 2015 | 2014 | 2013 |
| Selected Per–Share Data | | | | | |
| Net asset value, beginning of period | $24.28 | $22.58 | $25.48 | $24.42 | $22.15 |
| Income from Investment Operations | | | | | |
| Net investment income (loss)A | .26 | .18 | .24 | .23 | .25 |
| Net realized and unrealized gain (loss) | 7.06 | 1.66 | (2.92) | .86 | 2.38 |
| Total from investment operations | 7.32 | 1.84 | (2.68) | 1.09 | 2.63 |
| Distributions from net investment income | (.19) | (.15) | (.20) | (.03) | (.36) |
| Distributions from net realized gain | – | – | (.03) | – | – |
| Total distributions | (.19) | (.15) | (.22)B | (.03) | (.36) |
| Redemption fees added to paid in capitalA | –C | .01 | –C | –C | –C |
| Net asset value, end of period | $31.41 | $24.28 | $22.58 | $25.48 | $24.42 |
| Total ReturnD | 30.44% | 8.27% | (10.60)% | 4.47% | 12.01% |
| Ratios to Average Net AssetsE,F | | | | | |
| Expenses before reductions | .83% | .84% | .85% | .86% | .87% |
| Expenses net of fee waivers, if any | .82% | .84% | .85% | .85% | .87% |
| Expenses net of all reductions | .81% | .83% | .83% | .85% | .82% |
| Net investment income (loss) | .98% | .78% | .98% | .92% | 1.07% |
| Supplemental Data | | | | | |
| Net assets, end of period (000 omitted) | $924,783 | $658,276 | $554,041 | $623,430 | $547,369 |
| Portfolio turnover rateG | 81% | 79% | 107% | 94% | 119% |
A Calculated based on average shares outstanding during the period.
B Total distributions of $.22 per share is comprised of distributions from net investment income of $.195 and distributions from net realized gain of $.025 per share.
C Amount represents less than $.005 per share.
D Total returns would have been lower if certain expenses had not been reduced during the applicable periods shown.
E Fees and expenses of any underlying Fidelity Central Funds are not included in the Fund's expense ratio. The Fund indirectly bears its proportionate share of the expenses of any underlying Fidelity Central Funds.
F Expense ratios reflect operating expenses of the class. Expenses before reductions do not reflect amounts reimbursed by the investment adviser or reductions from brokerage service arrangements or reductions from other expense offset arrangements and do not represent the amount paid by the class during periods when reimbursements or reductions occur. Expenses net of fee waivers reflect expenses after reimbursement by the investment adviser but prior to reductions from brokerage service arrangements or other expense offset arrangements. Expenses net of all reductions represent the net expenses paid by the class.
G Amount does not include the portfolio activity of any underlying Fidelity Central Funds.
See accompanying notes which are an integral part of the financial statements.
Notes to Financial Statements
For the period ended October 31, 2017
1. Organization.
Fidelity Emerging Markets Fund (the Fund) is a fund of Fidelity Investment Trust (the Trust) and is authorized to issue an unlimited number of shares. The Trust is registered under the Investment Company Act of 1940, as amended (the 1940 Act), as an open-end management investment company organized as a Massachusetts business trust. The Fund offers Emerging Markets and Class K shares, each of which has equal rights as to assets and voting privileges. Each class has exclusive voting rights with respect to matters that affect that class. The Fund's investments in emerging markets can be subject to social, economic, regulatory, and political uncertainties and can be extremely volatile.
2. Investments in Fidelity Central Funds.
The Fund invests in Fidelity Central Funds, which are open-end investment companies generally available only to other investment companies and accounts managed by the investment adviser and its affiliates. The Fund's Schedule of Investments lists each of the Fidelity Central Funds held as of period end, if any, as an investment of the Fund, but does not include the underlying holdings of each Fidelity Central Fund. As an Investing Fund, the Fund indirectly bears its proportionate share of the expenses of the underlying Fidelity Central Funds.
The Money Market Central Funds seek preservation of capital and current income and are managed by Fidelity Investments Money Management, Inc. (FIMM), an affiliate of the investment adviser. Annualized expenses of the Money Market Central Funds as of their most recent shareholder report date are less than .005%.
A complete unaudited list of holdings for each Fidelity Central Fund is available upon request or at the Securities and Exchange Commission (the SEC) website at www.sec.gov. In addition, the financial statements of the Fidelity Central Funds, which are not covered by the Fund's Report of Independent Registered Public Accounting Firm, are available on the SEC website or upon request.
3. Significant Accounting Policies.
The Fund is an investment company and applies the accounting and reporting guidance of the Financial Accounting Standards Board (FASB) Accounting Standards Codification Topic 946 Financial Services – Investments Companies. The financial statements have been prepared in conformity with accounting principles generally accepted in the United States of America (GAAP), which require management to make certain estimates and assumptions at the date of the financial statements. Actual results could differ from those estimates. Subsequent events, if any, through the date that the financial statements were issued have been evaluated in the preparation of the financial statements. The following summarizes the significant accounting policies of the Fund:
Investment Valuation. Investments are valued as of 4:00 p.m. Eastern time on the last calendar day of the period. The Board of Trustees (the Board) has delegated the day to day responsibility for the valuation of the Fund's investments to the Fair Value Committee (the Committee) established by the Fund's investment adviser. In accordance with valuation policies and procedures approved by the Board, the Fund attempts to obtain prices from one or more third party pricing vendors or brokers to value its investments. When current market prices, quotations or currency exchange rates are not readily available or reliable, investments will be fair valued in good faith by the Committee, in accordance with procedures adopted by the Board. Factors used in determining fair value vary by investment type and may include market or investment specific events. The frequency with which these procedures are used cannot be predicted and they may be utilized to a significant extent. The Committee oversees the Fund's valuation policies and procedures and reports to the Board on the Committee's activities and fair value determinations. The Board monitors the appropriateness of the procedures used in valuing the Fund's investments and ratifies the fair value determinations of the Committee.
The Fund categorizes the inputs to valuation techniques used to value its investments into a disclosure hierarchy consisting of three levels as shown below:
- Level 1 – quoted prices in active markets for identical investments
- Level 2 – other significant observable inputs (including quoted prices for similar investments, interest rates, prepayment speeds, etc.)
- Level 3 – unobservable inputs (including the Fund's own assumptions based on the best information available)
Valuation techniques used to value the Fund's investments by major category are as follows:
Equity securities, including restricted securities, for which market quotations are readily available, are valued at the last reported sale price or official closing price as reported by a third party pricing vendor on the primary market or exchange on which they are traded and are categorized as Level 1 in the hierarchy. In the event there were no sales during the day or closing prices are not available, securities are valued at the last quoted bid price or may be valued using the last available price and are generally categorized as Level 2 in the hierarchy. For foreign equity securities, when market or security specific events arise, comparisons to the valuation of American Depositary Receipts (ADRs), futures contracts, Exchange-Traded Funds (ETFs) and certain indexes as well as quoted prices for similar securities may be used and would be categorized as Level 2 in the hierarchy. Utilizing these techniques may result in transfers between Level 1 and Level 2. For equity securities, including restricted securities, where observable inputs are limited, assumptions about market activity and risk are used and these securities may be categorized as Level 3 in the hierarchy.
Investments in open-end mutual funds, including the Fidelity Central Funds, are valued at their closing net asset value (NAV) each business day and are categorized as Level 1 in the hierarchy.
Changes in valuation techniques may result in transfers in or out of an assigned level within the disclosure hierarchy. The aggregate value of investments by input level as of October 31, 2017 is included at the end of the Fund's Schedule of Investments.
Foreign Currency. The Fund may use foreign currency contracts to facilitate transactions in foreign-denominated securities. Gains and losses from these transactions may arise from changes in the value of the foreign currency or if the counterparties do not perform under the contracts' terms.
Foreign-denominated assets, including investment securities, and liabilities are translated into U.S. dollars at the exchange rates at period end. Purchases and sales of investment securities, income and dividends received and expenses denominated in foreign currencies are translated into U.S. dollars at the exchange rate in effect on the transaction date.
The effects of exchange rate fluctuations on investments are included with the net realized and unrealized gain (loss) on investment securities. Other foreign currency transactions resulting in realized and unrealized gain (loss) are disclosed separately.
Investment Transactions and Income. For financial reporting purposes, the Fund's investment holdings and NAV include trades executed through the end of the last business day of the period. The NAV per share for processing shareholder transactions is calculated as of the close of business of the New York Stock Exchange (NYSE), normally 4:00 p.m. Eastern time and includes trades executed through the end of the prior business day. Gains and losses on securities sold are determined on the basis of identified cost and includes proceeds received from litigation. Dividend income is recorded on the ex-dividend date, except for certain dividends from foreign securities where the ex-dividend date may have passed, which are recorded as soon as the Fund is informed of the ex-dividend date. Non-cash dividends included in dividend income, if any, are recorded at the fair market value of the securities received. Income and capital gain distributions from Fidelity Central Funds, if any, are recorded on the ex-dividend date. Certain distributions received by the Fund represent a return of capital or capital gain. The Fund determines the components of these distributions subsequent to the ex-dividend date, based upon receipt of tax filings or other correspondence relating to the underlying investment. These distributions are recorded as a reduction of cost of investments and/or as a realized gain. Investment income is recorded net of foreign taxes withheld where recovery of such taxes is uncertain.
Class Allocations and Expenses. Investment income, realized and unrealized capital gains and losses, common expenses of the Fund, and certain fund-level expense reductions, if any, are allocated daily on a pro-rata basis to each class based on the relative net assets of each class to the total net assets of the Fund. Each class differs with respect to transfer agent fees incurred. Certain expense reductions may also differ by class. For the reporting period, the allocated portion of income and expenses to each class as a percent of its average net assets may vary due to the timing of recording these transactions in relation to fluctuating net assets of the classes. Expenses directly attributable to a fund are charged to that fund. Expenses attributable to more than one fund are allocated among the respective funds on the basis of relative net assets or other appropriate methods. Expense estimates are accrued in the period to which they relate and adjustments are made when actual amounts are known.
Income Tax Information and Distributions to Shareholders. Each year, the Fund intends to qualify as a regulated investment company under Subchapter M of the Internal Revenue Code, including distributing substantially all of its taxable income and realized gains. As a result, no provision for U.S. Federal income taxes is required. As of October 31, 2017, the Fund did not have any unrecognized tax benefits in the financial statements; nor is the Fund aware of any tax positions for which it is reasonably possible that the total amounts of unrecognized tax benefits will significantly change in the next twelve months. The Fund files a U.S. federal tax return, in addition to state and local tax returns as required. The Fund's federal income tax returns are subject to examination by the Internal Revenue Service (IRS) for a period of three fiscal years after they are filed. State and local tax returns may be subject to examination for an additional fiscal year depending on the jurisdiction. Foreign taxes are provided for based on the Fund's understanding of the tax rules and rates that exist in the foreign markets in which it invests. The Fund is subject to a tax imposed on capital gains by certain countries in which it invests. An estimated deferred tax liability for net unrealized appreciation on the applicable securities is included in Other payables and accrued expenses on the Statement of Assets & Liabilities.
Distributions are declared and recorded on the ex-dividend date. Income dividends and capital gain distributions are declared separately for each class. Income and capital gain distributions are determined in accordance with income tax regulations, which may differ from GAAP. In addition, the Fund claimed a portion of the payment made to redeeming shareholders as a distribution for income tax purposes.
Capital accounts within the financial statements are adjusted for permanent book-tax differences. These adjustments have no impact on net assets or the results of operations. Capital accounts are not adjusted for temporary book-tax differences which will reverse in a subsequent period.
Book-tax differences are primarily due to foreign currency transactions, passive foreign investment companies (PFIC), capital loss carryforwards, certain foreign taxes, expiring capital loss carryforwards, deferred trustees compensation and losses deferred due to wash sales.
As of period end, the cost and unrealized appreciation (depreciation) in securities, and derivatives if applicable, for federal income tax purposes were as follows:
| Gross unrealized appreciation | $1,545,672,869 |
| Gross unrealized depreciation | (28,382,758) |
| Net unrealized appreciation (depreciation) | $1,517,290,111 |
| Tax Cost | $3,341,707,898 |
The tax-based components of distributable earnings as of period end were as follows:
| Undistributed ordinary income | $29,971,472 |
| Capital loss carryforward | $(248,807,540) |
| Net unrealized appreciation (depreciation) on securities and other investments | $1,516,715,300 |
Capital loss carryforwards are only available to offset future capital gains of the Fund to the extent provided by regulations and may be limited. Under the Regulated Investment Company Modernization Act of 2010 (the Act), the Fund is permitted to carry forward capital losses incurred in taxable years beginning after December 22, 2010 for an unlimited period and such capital losses are required to be used prior to any losses that expire. The capital loss carryforward information presented below, including any applicable limitation, is estimated as of fiscal period end and is subject to adjustment.
| No expiration | |
| Short-term | $(248,807,540) |
The tax character of distributions paid was as follows:
| | October 31, 2017 | October 31, 2016 |
| Ordinary Income | $23,974,554 | $ 17,361,593 |
Short-Term Trading (Redemption) Fees. Shares held by investors in the Fund less than 90 days may have been subject to a redemption fee equal to 1.50% of the NAV of shares redeemed. All redemption fees, which reduce the proceeds of the shareholder redemption, are retained by the Fund and accounted for as an addition to paid in capital. In November 2017, the Board of Trustees approved the elimination of these redemption fees effective December 18, 2017.
4. Purchases and Sales of Investments.
Purchases and sales of securities, other than short-term securities, aggregated $3,283,400,892 and $3,255,705,980, respectively.
5. Fees and Other Transactions with Affiliates.
Management Fee. Fidelity Management & Research Company (the investment adviser) and its affiliates provide the Fund with investment management related services for which the Fund pays a monthly management fee. The management fee is the sum of an individual fund fee rate that is based on an annual rate of .45% of the Fund's average net assets and an annualized group fee rate that averaged .25% during the period. The group fee rate is based upon the average net assets of all the mutual funds advised by the investment adviser, including any mutual funds previously advised by the investment adviser that are currently advised by Fidelity SelectCo, LLC, an affiliate of the investment adviser. The group fee rate decreases as assets under management increase and increases as assets under management decrease. For the reporting period, the total annual management fee rate was .69% of the Fund's average net assets.
Transfer Agent Fees. Fidelity Investments Institutional Operations Company, Inc., (FIIOC), an affiliate of the investment adviser, is the transfer, dividend disbursing and shareholder servicing agent for each class of the Fund. FIIOC receives account fees and asset-based fees that vary according to the account size and type of account of the shareholders of Emerging Markets, except for Class K. FIIOC receives an asset-based fee of Class K's average net assets. FIIOC pays for typesetting, printing and mailing of shareholder reports, except proxy statements.
For the period, transfer agent fees for each class were as follows:
| | Amount | % of
Class-Level Average
Net Assets |
| Emerging Markets | $6,436,331 | .19 |
| Class K | 351,950 | .05 |
| | $6,788,281 | |
Accounting and Security Lending Fees. Fidelity Service Company, Inc. (FSC), an affiliate of the investment adviser, maintains the Fund's accounting records. The accounting fee is based on the level of average net assets for each month. Under a separate contract, FSC administers the security lending program. The security lending fee is based on the number and duration of lending transactions.
Brokerage Commissions. The Fund placed a portion of its portfolio transactions with brokerage firms which are affiliates of the investment adviser. Brokerage commissions are included in net realized gain (loss) and change in net unrealized appreciation (depreciation) in the Statement of Operations. The commissions paid to these affiliated firms were $24,222 for the period.
Interfund Lending Program. Pursuant to an Exemptive Order issued by the SEC, the Fund, along with other registered investment companies having management contracts with Fidelity Management & Research Company (FMR) or other affiliated entities of FMR, may participate in an interfund lending program. This program provides an alternative credit facility allowing the funds to borrow from, or lend money to, other participating affiliated funds. At period end, there were no interfund loans outstanding. The Fund's activity in this program during the period for which loans were outstanding was as follows:
| Borrower or Lender | Average Loan Balance | Weighted Average Interest Rate | Interest Expense |
| Borrower | $12,541,938 | 1.01% | $11,278 |
Interfund Trades. The Fund may purchase from or sell securities to other Fidelity Funds under procedures adopted by the Board. The procedures have been designed to ensure these interfund trades are executed in accordance with Rule 17a-7 of the 1940 Act. Interfund trades are included within the respective purchases and sales amounts shown in the Purchases and Sales of Investments note.
6. Committed Line of Credit.
The Fund participates with other funds managed by the investment adviser or an affiliate in a $4.25 billion credit facility (the "line of credit") to be utilized for temporary or emergency purposes to fund shareholder redemptions or for other short-term liquidity purposes. The Fund has agreed to pay commitment fees on its pro-rata portion of the line of credit, which amounted to $12,519 and is reflected in Miscellaneous expenses on the Statement of Operations. During the period, the Fund did not borrow on this line of credit.
7. Security Lending.
The Fund lends portfolio securities through a lending agent from time to time in order to earn additional income. For equity securities, a lending agent is used and may loan securities to certain qualified borrowers, including Fidelity Capital Markets (FCM), a broker-dealer affiliated with the Fund. On the settlement date of the loan, the Fund receives collateral (in the form of U.S. Treasury obligations, letters of credit and/or cash) against the loaned securities and maintains collateral in an amount not less than 100% of the market value of the loaned securities during the period of the loan. The market value of the loaned securities is determined at the close of business of the Fund and any additional required collateral is delivered to the Fund on the next business day. The Fund or borrower may terminate the loan at any time, and if the borrower defaults on its obligation to return the securities loaned because of insolvency or other reasons, the Fund may apply collateral received from the borrower against the obligation. The Fund may experience delays and costs in recovering the securities loaned. Any cash collateral received is invested in the Fidelity Securities Lending Cash Central Fund. At period end, there were no security loans outstanding. Security lending income represents the income earned on investing cash collateral, less rebates paid to borrowers and any lending agent fees associated with the loan, plus any premium payments received for lending certain types of securities. Security lending income is presented in the Statement of Operations as a component of income from Fidelity Central Funds. Total security lending income during the period amounted to $130,241, including $1,060 from securities loaned to FCM.
8. Expense Reductions.
Commissions paid to certain brokers with whom the investment adviser, or its affiliates, places trades on behalf of the Fund include an amount in addition to trade execution, which may be rebated back to the Fund to offset certain expenses. This amount totaled $628,353 for the period. In addition, through arrangements with the Fund's custodian, credits realized as a result of certain uninvested cash balances were used to reduce the Fund's expenses. During the period, these credits reduced the Fund's custody expenses by $2,153.
In addition, during the period the investment adviser reimbursed and/or waived a portion of fund-level operating expenses in the amount of $30,863.
9. Distributions to Shareholders.
Distributions to shareholders of each class were as follows:
| | Year ended October 31, 2017 | Year ended October 31, 2016 |
| From net investment income | | |
| Emerging Markets | $18,744,412 | $13,660,209 |
| Class K | 5,230,142 | 3,701,385 |
| Total | $23,974,554 | $17,361,594 |
10. Share Transactions.
Share transactions for each class were as follows and may contain automatic conversions between classes or exchanges between affiliated funds:
| | Shares | Shares | Dollars | Dollars |
| | Year ended October 31, 2017 | Year ended October 31, 2016 | Year ended October 31, 2017 | Year ended October 31, 2016 |
| Emerging Markets | | | | |
| Shares sold | 35,833,343 | 40,381,882 | $958,972,147 | $879,217,354 |
| Reinvestment of distributions | 790,787 | 572,542 | 17,864,538 | 12,670,348 |
| Shares redeemed | (35,588,763) | (38,074,038) | (943,601,756) | (819,023,837) |
| Net increase (decrease) | 1,035,367 | 2,880,386 | $33,234,929 | $72,863,865 |
| Class K | | | | |
| Shares sold | 9,726,562 | 8,389,679 | $257,288,456 | $189,089,919 |
| Reinvestment of distributions | 231,437 | 167,256 | 5,230,142 | 3,701,385 |
| Shares redeemed | (7,627,038) | (5,977,816) | (199,672,634) | (134,081,903) |
| Net increase (decrease) | 2,330,961 | 2,579,119 | $62,845,964 | $58,709,401 |
11. Other.
The Fund's organizational documents provide former and current trustees and officers with a limited indemnification against liabilities arising in connection with the performance of their duties to the Fund. In the normal course of business, the Fund may also enter into contracts that provide general indemnifications. The Fund's maximum exposure under these arrangements is unknown as this would be dependent on future claims that may be made against the Fund. The risk of material loss from such claims is considered remote.
Report of Independent Registered Public Accounting Firm
To the Trustees of Fidelity Investment Trust and Shareholders of Fidelity Emerging Markets Fund:
In our opinion, the accompanying statement of assets and liabilities, including the schedule of investments, and the related statements of operations and of changes in net assets and the financial highlights present fairly, in all material respects, the financial position of Fidelity Emerging Markets Fund (a fund of Fidelity Investment Trust) as of October 31, 2017, the results of its operations for the year then ended, the changes in its net assets for each of the two years in the period then ended and the financial highlights for each of the five years in the period then ended, in conformity with accounting principles generally accepted in the United States of America. These financial statements and financial highlights (hereafter referred to as “financial statements”) are the responsibility of the Fidelity Emerging Markets Fund’s management. Our responsibility is to express an opinion on these financial statements based on our audits. We conducted our audits of these financial statements in accordance with the standards of the Public Company Accounting Oversight Board (United States). Those standards require that we plan and perform the audit to obtain reasonable assurance about whether the financial statements are free of material misstatement. An audit includes examining, on a test basis, evidence supporting the amounts and disclosures in the financial statements, assessing the accounting principles used and significant estimates made by management, and evaluating the overall financial statement presentation. Our procedures included confirmation of securities owned as of October 31, 2017 by correspondence with the custodians and brokers; when replies were not received from brokers, we performed other auditing procedures. We believe that our audits provide a reasonable basis for our opinion.
PricewaterhouseCoopers LLP
Boston, Massachusetts
December 18, 2017
Trustees and Officers
The Trustees, Members of the Advisory Board (if any), and officers of the trusts and fund, as applicable, are listed below. The Board of Trustees governs the fund and is responsible for protecting the interests of shareholders. The Trustees are experienced executives who meet periodically throughout the year to oversee the fund's activities, review contractual arrangements with companies that provide services to the fund, oversee management of the risks associated with such activities and contractual arrangements, and review the fund's performance. Except for Jonathan Chiel, each of the Trustees oversees 190 funds. Mr. Chiel oversees 143 funds.
The Trustees hold office without limit in time except that (a) any Trustee may resign; (b) any Trustee may be removed by written instrument, signed by at least two-thirds of the number of Trustees prior to such removal; (c) any Trustee who requests to be retired or who has become incapacitated by illness or injury may be retired by written instrument signed by a majority of the other Trustees; and (d) any Trustee may be removed at any special meeting of shareholders by a two-thirds vote of the outstanding voting securities of the trust. Each Trustee who is not an interested person (as defined in the 1940 Act) of the trust and the fund is referred to herein as an Independent Trustee. Each Independent Trustee shall retire not later than the last day of the calendar year in which his or her 75th birthday occurs. The Independent Trustees may waive this mandatory retirement age policy with respect to individual Trustees. Officers and Advisory Board Members hold office without limit in time, except that any officer or Advisory Board Member may resign or may be removed by a vote of a majority of the Trustees at any regular meeting or any special meeting of the Trustees. Except as indicated, each individual has held the office shown or other offices in the same company for the past five years.
The fund’s Statement of Additional Information (SAI) includes more information about the Trustees. To request a free copy, call Fidelity at 1-877-208-0098.
Experience, Skills, Attributes, and Qualifications of the Trustees. The Governance and Nominating Committee has adopted a statement of policy that describes the experience, qualifications, attributes, and skills that are necessary and desirable for potential Independent Trustee candidates (Statement of Policy). The Board believes that each Trustee satisfied at the time he or she was initially elected or appointed a Trustee, and continues to satisfy, the standards contemplated by the Statement of Policy. The Governance and Nominating Committee also engages professional search firms to help identify potential Independent Trustee candidates who have the experience, qualifications, attributes, and skills consistent with the Statement of Policy. From time to time, additional criteria based on the composition and skills of the current Independent Trustees, as well as experience or skills that may be appropriate in light of future changes to board composition, business conditions, and regulatory or other developments, have also been considered by the professional search firms and the Governance and Nominating Committee. In addition, the Board takes into account the Trustees' commitment and participation in Board and committee meetings, as well as their leadership of standing and ad hoc committees throughout their tenure.
In determining that a particular Trustee was and continues to be qualified to serve as a Trustee, the Board has considered a variety of criteria, none of which, in isolation, was controlling. The Board believes that, collectively, the Trustees have balanced and diverse experience, qualifications, attributes, and skills, which allow the Board to operate effectively in governing the fund and protecting the interests of shareholders. Information about the specific experience, skills, attributes, and qualifications of each Trustee, which in each case led to the Board's conclusion that the Trustee should serve (or continue to serve) as a trustee of the fund, is provided below.
Board Structure and Oversight Function. James C. Curvey is an interested person and currently serves as Chairman. The Trustees have determined that an interested Chairman is appropriate and benefits shareholders because an interested Chairman has a personal and professional stake in the quality and continuity of services provided to the fund. Independent Trustees exercise their informed business judgment to appoint an individual of their choosing to serve as Chairman, regardless of whether the Trustee happens to be independent or a member of management. The Independent Trustees have determined that they can act independently and effectively without having an Independent Trustee serve as Chairman and that a key structural component for assuring that they are in a position to do so is for the Independent Trustees to constitute a substantial majority for the Board. The Independent Trustees also regularly meet in executive session. Ned C. Lautenbach serves as Chairman of the Independent Trustees and as such (i) acts as a liaison between the Independent Trustees and management with respect to matters important to the Independent Trustees and (ii) with management prepares agendas for Board meetings.
Fidelity® funds are overseen by different Boards of Trustees. The fund's Board oversees Fidelity's high income and certain equity funds, and other Boards oversee Fidelity's investment-grade bond, money market, asset allocation, and sector funds. The asset allocation funds may invest in Fidelity® funds overseen by the fund's Board. The use of separate Boards, each with its own committee structure, allows the Trustees of each group of Fidelity® funds to focus on the unique issues of the funds they oversee, including common research, investment, and operational issues. On occasion, the separate Boards establish joint committees to address issues of overlapping consequences for the Fidelity® funds overseen by each Board.
The Trustees operate using a system of committees to facilitate the timely and efficient consideration of all matters of importance to the Trustees, the fund, and fund shareholders and to facilitate compliance with legal and regulatory requirements and oversight of the fund's activities and associated risks. The Board, acting through its committees, has charged FMR and its affiliates with (i) identifying events or circumstances the occurrence of which could have demonstrably adverse effects on the fund's business and/or reputation; (ii) implementing processes and controls to lessen the possibility that such events or circumstances occur or to mitigate the effects of such events or circumstances if they do occur; and (iii) creating and maintaining a system designed to evaluate continuously business and market conditions in order to facilitate the identification and implementation processes described in (i) and (ii) above. Because the day-to-day operations and activities of the fund are carried out by or through FMR, its affiliates, and other service providers, the fund's exposure to risks is mitigated but not eliminated by the processes overseen by the Trustees. While each of the Board's committees has responsibility for overseeing different aspects of the fund's activities, oversight is exercised primarily through the Operations, Audit, and Compliance Committees. In addition, the Independent Trustees have worked with FMR to enhance the Board's oversight of investment and financial risks, legal and regulatory risks, technology risks, and operational risks, including the development of additional risk reporting to the Board. For example, a working group comprised of Independent Trustees and FMR has worked and continues to work to review the Fidelity® funds' valuation-related activities, reporting and risk management. Appropriate personnel, including but not limited to the fund's Chief Compliance Officer (CCO), FMR's internal auditor, the independent accountants, the fund's Treasurer and portfolio management personnel, make periodic reports to the Board's committees, as appropriate, including an annual review of Fidelity's risk management program for the Fidelity® funds. The responsibilities of each standing committee, including their oversight responsibilities, are described further under "Standing Committees of the Trustees."
Interested Trustees*:
Correspondence intended for a Trustee who is an interested person may be sent to Fidelity Investments, 245 Summer Street, Boston, Massachusetts 02210.
Name, Year of Birth; Principal Occupations and Other Relevant Experience+
Jonathan Chiel (1957)
Year of Election or Appointment: 2016
Trustee
Mr. Chiel also serves as Trustee of other Fidelity® funds. Mr. Chiel is Executive Vice President and General Counsel for FMR LLC (diversified financial services company, 2012-present). Previously, Mr. Chiel served as general counsel (2004-2012) and senior vice president and deputy general counsel (2000-2004) for John Hancock Financial Services; a partner with Choate, Hall & Stewart (1996-2000) (law firm); and an Assistant United States Attorney for the United States Attorney’s Office of the District of Massachusetts (1986-95), including Chief of the Criminal Division (1993-1995). Mr. Chiel is a director on the boards of the Boston Bar Foundation and the Maimonides School.
James C. Curvey (1935)
Year of Election or Appointment: 2007
Trustee
Chairman of the Board of Trustees
Mr. Curvey also serves as Trustee of other Fidelity® funds. Mr. Curvey is a Director of Fidelity Research & Analysis Co. (investment adviser firm, 2009-present), and Vice Chairman (2007-present) and Director of FMR LLC (diversified financial services company). In addition, Mr. Curvey serves as an Overseer for the Boston Symphony Orchestra and a member of the board of Artis-Naples, Naples, Florida, and as a Trustee for Brewster Academy, Wolfeboro, New Hampshire. Previously, Mr. Curvey served as a Director of Fidelity Investments Money Management, Inc. (investment adviser firm, 2009-2014) and a Director of FMR and FMR Co., Inc. (investment adviser firms, 2007-2014).
Charles S. Morrison (1960)
Year of Election or Appointment: 2014
Trustee
Mr. Morrison also serves as Trustee of other funds. He serves as President of Fidelity Management & Research Company (FMR) (investment adviser firm, 2016-present), a Director of Fidelity Investments Money Management, Inc. (FIMM) (investment adviser firm, 2014-present), Director of Fidelity SelectCo, LLC (investment adviser firm, 2014-present), President, Asset Management (2014-present), and is an employee of Fidelity Investments. Previously, Mr. Morrison served as Vice President of Fidelity's Fixed Income and Asset Allocation Funds (2012-2014), President, Fixed Income (2011-2014), Vice President of Fidelity's Money Market Funds (2005-2009), President, Money Market Group Leader of FMR (investment adviser firm, 2009), and Senior Vice President, Money Market Group of FMR (2004-2009). Mr. Morrison also served as Vice President of Fidelity's Bond Funds (2002-2005), certain Balanced Funds (2002-2005), and certain Asset Allocation Funds (2002-2007), and as Senior Vice President (2002-2005) of Fidelity's Bond Division.
* Determined to be an “Interested Trustee” by virtue of, among other things, his or her affiliation with the trust or various entities under common control with FMR.
+ The information includes the Trustee's principal occupation during the last five years and other information relating to the experience, attributes, and skills relevant to the Trustee's qualifications to serve as a Trustee, which led to the conclusion that the Trustee should serve as a Trustee for the fund.
Independent Trustees:
Correspondence intended for an Independent Trustee may be sent to Fidelity Investments, P.O. Box 55235, Boston, Massachusetts 02205-5235.
Name, Year of Birth; Principal Occupations and Other Relevant Experience+
Dennis J. Dirks (1948)
Year of Election or Appointment: 2005
Trustee
Mr. Dirks also serves as Trustee of other Fidelity® funds. Prior to his retirement in May 2003, Mr. Dirks was Chief Operating Officer and a member of the Board of The Depository Trust & Clearing Corporation (DTCC). He also served as President, Chief Operating Officer, and Board member of The Depository Trust Company (DTC) and President and Board member of the National Securities Clearing Corporation (NSCC). In addition, Mr. Dirks served as Chief Executive Officer and Board member of the Government Securities Clearing Corporation, Chief Executive Officer and Board member of the Mortgage-Backed Securities Clearing Corporation, as a Trustee and a member of the Finance Committee of Manhattan College (2005-2008), as a Trustee and a member of the Finance Committee of AHRC of Nassau County (2006-2008), as a member of the Independent Directors Council (IDC) Governing Council (2010-2015), and as a member of the Board of Directors for The Brookville Center for Children’s Services, Inc. (2009-2017). Mr. Dirks is a member of the Finance Committee (2016-present) and Board of Directors (2017-present) of the Asolo Repertory Theatre.
Alan J. Lacy (1953)
Year of Election or Appointment: 2008
Trustee
Mr. Lacy also serves as Trustee of other Fidelity® funds. Mr. Lacy serves as a Director of Bristol-Myers Squibb Company (global pharmaceuticals, 2008-present). He is a Trustee of the California Chapter of The Nature Conservancy (2015-present) and a Director of the Center for Advanced Study in the Behavioral Sciences at Stanford University (2015-present). In addition, Mr. Lacy served as Senior Adviser (2007-2014) of Oak Hill Capital Partners, L.P. (private equity) and also served as Chief Executive Officer (2005) and Vice Chairman (2005-2006) of Sears Holdings Corporation (retail) and Chief Executive Officer and Chairman of the Board of Sears, Roebuck and Co. (retail, 2000-2005). Previously, Mr. Lacy served as Chairman (2014-2017) and a member (2010-2017) of the Board of Directors of Dave & Buster’s Entertainment, Inc. (restaurant and entertainment complexes), as Chairman (2008-2011) and a member (2006-2015) of the Board of Trustees of the National Parks Conservation Association, and as a member of the Board of Directors for The Hillman Companies, Inc. (hardware wholesalers, 2010-2014), Earth Fare, Inc. (retail grocery, 2010-2014), and The Western Union Company (global money transfer, 2006-2011).
Ned C. Lautenbach (1944)
Year of Election or Appointment: 2000
Trustee
Chairman of the Independent Trustees
Mr. Lautenbach also serves as Trustee of other Fidelity® funds. Mr. Lautenbach currently serves as Vice Chair of the Board of Governors, State University System of Florida (2013-present) and is a member of the Council on Foreign Relations (1994-present). He is also a member and has most recently served as Chairman of the Board of Directors of Artis-Naples (2012-present). Previously, Mr. Lautenbach served as a member and then Lead Director of the Board of Directors of Eaton Corporation (diversified industrial, 1997-2016). He was also a Partner and Advisory Partner at Clayton, Dubilier & Rice, LLC (private equity investment, 1998-2010), as well as a Director of Sony Corporation (2006-2007). In addition, Mr. Lautenbach also had a 30-year career with IBM (technology company) during which time he served as Senior Vice President and a member of the Corporate Executive Committee (1968-1998).
Joseph Mauriello (1944)
Year of Election or Appointment: 2008
Trustee
Mr. Mauriello also serves as Trustee of other Fidelity® funds. Prior to his retirement in January 2006, Mr. Mauriello served in numerous senior management positions including Deputy Chairman and Chief Operating Officer (2004-2005), and Vice Chairman of Financial Services (2002-2004) of KPMG LLP US (professional services, 1965-2005). Mr. Mauriello currently serves as a member of the Board of Directors of XL Group plc. (global insurance and re-insurance, 2006-present) and the Independent Directors Council (IDC) Governing Council (2015-present). Previously, Mr. Mauriello served as a Director of the Hamilton Funds of the Bank of New York (2006-2007) and of Arcadia Resources Inc. (health care services and products, 2007-2012).
Cornelia M. Small (1944)
Year of Election or Appointment: 2005
Trustee
Ms. Small also serves as Trustee of other Fidelity® funds. Ms. Small is a member of the Board of Directors (2009-present) and Chair of the Investment Committee (2010-present) of the Teagle Foundation. Ms. Small also serves on the Investment Committee of the Berkshire Taconic Community Foundation (2008-present). Previously, Ms. Small served as Chairperson (2002-2008) and a member of the Investment Committee and Chairperson (2008-2012) and a member of the Board of Trustees of Smith College. In addition, Ms. Small served as Chief Investment Officer, Director of Global Equity Investments, and a member of the Board of Directors of Scudder, Stevens & Clark and Scudder Kemper Investments.
William S. Stavropoulos (1939)
Year of Election or Appointment: 2001
Trustee
Vice Chairman of the Independent Trustees
Mr. Stavropoulos also serves as Trustee of other Fidelity® funds. Mr. Stavropoulos serves as President and Founder of the Michigan Baseball Foundation, the Great Lakes Loons (2007-present). Mr. Stavropoulos is Chairman Emeritus of the Board of Directors of The Dow Chemical Company, where he previously served in numerous senior management positions, including President, CEO (1995-2000; 2002-2004), Chairman of the Executive Committee (2000-2006), and as a member of the Board of Directors (1990-2006). Currently, Mr. Stavropoulos is Chairman of the Board of Directors of Univar Inc. (global distributor of commodity and specialty chemicals), a Director of Teradata Corporation (data warehousing and technology solutions), and a member of the Advisory Board for Metalmark Capital LLC (private equity investment, 2005-present). Mr. Stavropoulos is an operating advisor to Clayton, Dubilier & Rice, LLC (private equity investment). In addition, Mr. Stavropoulos is a member of the University of Notre Dame Advisory Council for the College of Science, a Trustee of the Rollin L. Gerstacker Foundation, and a Director of Artis-Naples in Naples, Florida. Previously, Mr. Stavropoulos served as a Director of Chemical Financial Corporation (bank holding company, 1993-2012) and Tyco International, Ltd. (multinational manufacturing and services, 2007-2012).
David M. Thomas (1949)
Year of Election or Appointment: 2008
Trustee
Mr. Thomas also serves as Trustee of other Fidelity® funds. Mr. Thomas serves as Non-Executive Chairman of the Board of Directors of Fortune Brands Home and Security (home and security products, 2011-present), as a member of the Board of Directors (2004-present) and Presiding Director (2013-present) of Interpublic Group of Companies, Inc. (marketing communication), and as a member of the Board of Trustees of the University of Florida (2013-present). Previously, Mr. Thomas served as Executive Chairman (2005-2006) and Chairman and Chief Executive Officer (2000-2005) of IMS Health, Inc. (pharmaceutical and healthcare information solutions), and a Director of Fortune Brands, Inc. (consumer products, 2000-2011).
+ The information includes the Trustee's principal occupation during the last five years and other information relating to the experience, attributes, and skills relevant to the Trustee's qualifications to serve as a Trustee, which led to the conclusion that the Trustee should serve as a Trustee for the fund.
Advisory Board Members and Officers:
Correspondence intended for an officer or Peter S. Lynch may be sent to Fidelity Investments, 245 Summer Street, Boston, Massachusetts 02210. Officers appear below in alphabetical order.
Name, Year of Birth; Principal Occupation
Peter S. Lynch (1944)
Year of Election or Appointment: 2003
Member of the Advisory Board
Mr. Lynch also serves as Member of the Advisory Board of other Fidelity® funds. Mr. Lynch is Vice Chairman and a Director of FMR (investment adviser firm) and FMR Co., Inc. (investment adviser firm). In addition, Mr. Lynch serves as a Trustee of Boston College and as the Chairman of the Inner-City Scholarship Fund. Previously, Mr. Lynch served on the Special Olympics International Board of Directors (1997-2006).
Elizabeth Paige Baumann (1968)
Year of Election or Appointment: 2017
Anti-Money Laundering (AML) Officer
Ms. Baumann also serves as AML Officer of other funds. She is Chief AML Officer (2012-present) and Senior Vice President (2014-present) of FMR LLC (diversified financial services company) and is an employee of Fidelity Investments. Previously, Ms. Baumann served as AML Officer of the funds (2012-2016), and Vice President (2007-2014) and Deputy Anti-Money Laundering Officer (2007-2012) of FMR LLC.
Marc R. Bryant (1966)
Year of Election or Appointment: 2015
Secretary and Chief Legal Officer (CLO)
Mr. Bryant also serves as Secretary and CLO of other funds. Mr. Bryant serves as CLO, Secretary, and Senior Vice President of Fidelity Management & Research Company (investment adviser firm, 2015-present) and FMR Co., Inc. (investment adviser firm, 2015-present); Secretary of Fidelity SelectCo, LLC (investment adviser firm, 2015-present) and Fidelity Investments Money Management, Inc. (investment adviser firm, 2015-present); and CLO of Fidelity Management & Research (Hong Kong) Limited and FMR Investment Management (UK) Limited (investment adviser firms, 2015-present) and Fidelity Management & Research (Japan) Limited (investment adviser firm, 2016-present). He is Senior Vice President and Deputy General Counsel of FMR LLC (diversified financial services company). Previously, Mr. Bryant served as Secretary and CLO of Fidelity Rutland Square Trust II (2010-2014) and Assistant Secretary of Fidelity's Fixed Income and Asset Allocation Funds (2013-2015). Prior to joining Fidelity Investments, Mr. Bryant served as a Senior Vice President and the Head of Global Retail Legal for AllianceBernstein L.P. (2006-2010), and as the General Counsel for ProFund Advisors LLC (2001-2006).
William C. Coffey (1969)
Year of Election or Appointment: 2009
Assistant Secretary
Mr. Coffey also serves as Assistant Secretary of other funds. He is Senior Vice President and Deputy General Counsel of FMR LLC (diversified financial services company, 2010-present), and is an employee of Fidelity Investments. Previously, Mr. Coffey served as Vice President and Associate General Counsel of FMR LLC (2005-2009).
Jonathan Davis (1968)
Year of Election or Appointment: 2010
Assistant Treasurer
Mr. Davis also serves as Assistant Treasurer of other funds, and is an employee of Fidelity Investments. Previously, Mr. Davis served as Vice President and Associate General Counsel of FMR LLC (diversified financial services company, 2003-2010).
Adrien E. Deberghes (1967)
Year of Election or Appointment: 2016
Assistant Treasurer
Mr. Deberghes also serves as an officer of other funds. He serves as Executive Vice President of Fidelity Investments Money Management, Inc. (FIMM) (investment adviser firm, 2016-present) and is an employee of Fidelity Investments (2008-present). Prior to joining Fidelity Investments, Mr. Deberghes was Senior Vice President of Mutual Fund Administration at State Street Corporation (2007-2008), Senior Director of Mutual Fund Administration at Investors Bank & Trust (2005-2007), and Director of Finance for Dunkin' Brands (2000-2005). Previously, Mr. Deberghes served in other fund officer roles.
Joseph DeSantis (1959)
Year of Election or Appointment: 2017
Vice President
Mr. DeSantis also serves as Vice President of other funds. Mr. DeSantis serves as a Director of Fidelity Management & Research (Japan) Limited (investment adviser firm, 2016-present), Chief Investment Officer, Equities (2010-present) and is an employee of Fidelity Investments.
Stephanie J. Dorsey (1969)
Year of Election or Appointment: 2010
Assistant Treasurer
Ms. Dorsey also serves as an officer of other funds. She is an employee of Fidelity Investments (2008-present) and has served in other fund officer roles. Prior to joining Fidelity Investments, Ms. Dorsey served as Treasurer (2004-2008) of the JPMorgan Mutual Funds and Vice President (2004-2008) of JPMorgan Chase Bank.
Howard J. Galligan III (1966)
Year of Election or Appointment: 2014
Chief Financial Officer
Mr. Galligan also serves as Chief Financial Officer of other funds. Mr. Galligan serves as President of Fidelity Pricing and Cash Management Services (FPCMS) (2014-present) and as a Director of Strategic Advisers, Inc. (investment adviser firm, 2008-present). Previously, Mr. Galligan served as Chief Administrative Officer of Asset Management (2011-2014) and Chief Operating Officer and Senior Vice President of Investment Support for Strategic Advisers, Inc. (2003-2011).
Brian B. Hogan (1964)
Year of Election or Appointment: 2009
Vice President
Mr. Hogan also serves as Trustee or Vice President of other funds. Mr. Hogan serves as a Director of FMR Investment Management (UK) Limited (investment adviser firm, 2015-present) and Fidelity SelectCo, LLC (investment adviser firm, 2014-present) and President of the Equity Division of FMR (investment adviser firm, 2009-present). Previously, Mr. Hogan served as Senior Vice President, Equity Research of FMR (2006-2009) and as a portfolio manager. Mr. Brian B. Hogan is not related to Mr. Colm A. Hogan.
Colm A. Hogan (1973)
Year of Election or Appointment: 2016
Deputy Treasurer
Mr. Hogan also serves as an officer of other funds. Mr. Hogan is an employee of Fidelity Investments (2005-present). Mr. Colm A. Hogan is not related to Mr. Brian B. Hogan.
Chris Maher (1972)
Year of Election or Appointment: 2013
Assistant Treasurer
Mr. Maher serves as Assistant Treasurer of other funds. Mr. Maher is Vice President of Valuation Oversight and is an employee of Fidelity Investments. Previously, Mr. Maher served as Vice President of Asset Management Compliance (2013), Vice President of the Program Management Group of FMR (investment adviser firm, 2010-2013), and Vice President of Valuation Oversight (2008-2010).
Rieco E. Mello (1969)
Year of Election or Appointment: 2017
Assistant Treasurer
Mr. Mello also serves as Assistant Treasurer of other funds. Mr. Mello is an employee of Fidelity Investments (1995-present).
Kenneth B. Robins (1969)
Year of Election or Appointment: 2016
Chief Compliance Officer
Mr. Robins also serves as an officer of other funds. Mr. Robins serves as Compliance Officer of Fidelity Management & Research Company and FMR Co., Inc. (investment adviser firms, 2016-present) and is an employee of Fidelity Investments (2004-present). Previously, Mr. Robins served as Executive Vice President of Fidelity Investments Money Management, Inc. (investment adviser firm, 2013-2016) and served in other fund officer roles.
Stacie M. Smith (1974)
Year of Election or Appointment: 2016
President and Treasurer
Ms. Smith also serves as an officer of other funds. She is an employee of Fidelity Investments (2009-present) and has served in other fund officer roles. Prior to joining Fidelity Investments, Ms. Smith served as Senior Audit Manager of Ernst & Young LLP (accounting firm, 1996-2009). Previously, Ms. Smith served as Deputy Treasurer of certain Fidelity® funds (2013-2016).
Marc L. Spector (1972)
Year of Election or Appointment: 2016
Assistant Treasurer
Mr. Spector also serves as an officer of other funds. Mr. Spector is an employee of Fidelity Investments (2016-present). Prior to joining Fidelity Investments, Mr. Spector served as Director at the Siegfried Group (accounting firm, 2013-2016), and prior to Siegfried Group as audit senior manager at Deloitte & Touche (accounting firm, 2005-2013).
Renee Stagnone (1975)
Year of Election or Appointment: 2016
Assistant Treasurer
Ms. Stagnone also serves as an officer of other funds. Ms. Stagnone is an employee of Fidelity Investments (1997-present). Previously, Ms. Stagnone served as Deputy Treasurer of certain Fidelity® funds (2013-2016).
Shareholder Expense Example
As a shareholder of the Fund, you incur two types of costs: (1) transaction costs, including redemption fees and (2) ongoing costs, including management fees and other Fund expenses. This Example is intended to help you understand your ongoing costs (in dollars) of investing in the Fund and to compare these costs with the ongoing costs of investing in other mutual funds.
The Example is based on an investment of $1,000 invested at the beginning of the period and held for the entire period (May 1, 2017 to October 31, 2017).
Actual Expenses
The first line of the accompanying table for each class of the Fund provides information about actual account values and actual expenses. You may use the information in this line, together with the amount you invested, to estimate the expenses that you paid over the period. Simply divide your account value by $1,000.00 (for example, an $8,600 account value divided by $1,000.00 = 8.6), then multiply the result by the number in the first line for a class of the Fund under the heading entitled "Expenses Paid During Period" to estimate the expenses you paid on your account during this period. A small balance maintenance fee of $12.00 that is charged once a year may apply for certain accounts with a value of less than $2,000. This fee is not included in the table below. If it was, the estimate of expenses you paid during the period would be higher, and your ending account value lower, by this amount. In addition, the Fund, as a shareholder in the underlying Fidelity Central Funds, will indirectly bear its pro-rata share of the fees and expenses incurred by the underlying Fidelity Central Funds. These fees and expenses are not included in the Fund's annualized expense ratio used to calculate the expense estimate in the table below.
Hypothetical Example for Comparison Purposes
The second line of the accompanying table for each class of the Fund provides information about hypothetical account values and hypothetical expenses based on a Class' actual expense ratio and an assumed rate of return of 5% per year before expenses, which is not the Class' actual return. The hypothetical account values and expenses may not be used to estimate the actual ending account balance or expenses you paid for the period. You may use this information to compare the ongoing costs of investing in the Fund and other funds. To do so, compare this 5% hypothetical example with the 5% hypothetical examples that appear in the shareholder reports of the other funds. A small balance maintenance fee of $12.00 that is charged once a year may apply for certain accounts with a value of less than $2,000. This fee is not included in the table below. If it was, the estimate of expenses you paid during the period would be higher, and your ending account value lower, by this amount. In addition, the Fund, as a shareholder in the underlying Fidelity Central Funds, will indirectly bear its pro-rata share of the fees and expenses incurred by the underlying Fidelity Central Funds. These fees and expenses are not included in the Fund's annualized expense ratio used to calculate the expense estimate in the table below.
Please note that the expenses shown in the table are meant to highlight your ongoing costs only and do not reflect any transaction costs. Therefore, the second line of the table is useful in comparing ongoing costs only, and will not help you determine the relative total costs of owning different funds. In addition, if these transactional costs were included, your costs would have been higher.
| | Annualized Expense Ratio-A | Beginning
Account Value
May 1, 2017 | Ending
Account Value
October 31, 2017 | Expenses Paid
During Period-B
May 1, 2017
to October 31, 2017 |
| Emerging Markets | .96% | | | |
| Actual | | $1,000.00 | $1,187.80 | $5.29 |
| Hypothetical-C | | $1,000.00 | $1,020.37 | $4.89 |
| Class K | .82% | | | |
| Actual | | $1,000.00 | $1,188.40 | $4.52 |
| Hypothetical-C | | $1,000.00 | $1,021.07 | $4.18 |
A Annualized expense ratio reflects expenses net of applicable fee waivers.
B Expenses are equal to each Class' annualized expense ratio, multiplied by the average account value over the period, multiplied by 184/365 (to reflect the one-half year period).
C 5% return per year before expenses
Distributions (Unaudited)
The Board of Trustees of Fidelity Emerging Markets Fund voted to pay to shareholders of record at the opening of business on record date, the following distributions per share derived from capital gains realized from sales of portfolio securities, and dividends derived from net investment income:
| | Pay Date | Record Date | Dividends | Capital Gains |
| Fidelity Emerging Markets Fund | | | | |
| Emerging Markets | 12/11/17 | 12/08/17 | $0.162 | $0.027 |
| Class K | 12/11/17 | 12/08/17 | $0.200 | $0.027 |
|
A percentage of the dividends distributed during the fiscal year for the following funds qualify for the dividends–received deduction for corporate shareholders:
| | Retail | Class K |
| Fidelity Emerging Markets Fund | | |
| December 9, 2016 | 15% | 13% |
| December 27, 2016 | 9% | 9% |
|
Emerging Markets and Class K designates 100% of the dividend distributed during the fiscal year as amounts which may be taken into account as a dividend for purposes of the maximum rate under section 1(h)(11) of the Internal Revenue Code.
The amounts per share which represent income derived from sources within, and taxes paid to, foreign countries or possessions of the United States are as follows:
| | Pay Date | Income | Taxes |
| Fidelity Emerging Markets Fund | | | |
| Emerging Markets | 12/12/2016 | $0.1744 | $0.0344 |
| | 12/28/2016 | $0.0090 | $0.0000 |
| Class K | 12/12/2016 | $0.2124 | $0.0344 |
| | 12/28/2016 | $0.0090 | $0.0000 |
|
The fund will notify shareholders in January 2018 of amounts for use in preparing 2017 income tax returns.
Board Approval of Investment Advisory Contracts and Management Fees
Fidelity Emerging Markets Fund
Each year, the Board of Trustees, including the Independent Trustees (together, the Board), votes on the renewal of the management contract with Fidelity Management & Research Company (FMR) and the sub-advisory agreements (together, the Advisory Contracts) for the fund. FMR and the sub-advisers are referred to herein as the Investment Advisers. The Board, assisted by the advice of fund counsel and Independent Trustees' counsel, requests and considers a broad range of information relevant to the renewal of the Advisory Contracts throughout the year.
The Board meets regularly and, at each of its meetings, covers an extensive agenda of topics and materials and considers factors that are relevant to its annual consideration of the renewal of the fund's Advisory Contracts, including the services and support provided to the fund and its shareholders. The Board has established various standing committees (Committees), each composed of and chaired by Independent Trustees with varying backgrounds, to which the Board has assigned specific subject matter responsibilities in order to enhance effective decision-making by the Board. The Board, acting directly and through its Committees, requests and receives information concerning the annual consideration of the renewal of the fund's Advisory Contracts. The Board also meets as needed to review matters specifically related to the Board's annual consideration of the renewal of the Advisory Contracts. Members of the Board may also meet with trustees of other Fidelity funds through ad hoc joint committees to discuss certain matters relevant to all of the Fidelity funds.
At its July 2017 meeting, the Board unanimously determined to renew the fund's Advisory Contracts. In reaching its determination, the Board considered all factors it believed relevant, including (i) the nature, extent, and quality of the services to be provided to the fund and its shareholders (including the investment performance of the fund); (ii) the competitiveness of the fund's management fee and total expense ratio relative to peer funds; (iii) the total costs of the services to be provided by and the profits to be realized by Fidelity from its relationships with the fund; and (iv) the extent to which, if any, economies of scale exist and would be realized as the fund grows, and whether any economies of scale are appropriately shared with fund shareholders.
In considering whether to renew the Advisory Contracts for the fund, the Board reached a determination, with the assistance of fund counsel and Independent Trustees' counsel and through the exercise of its business judgment, that the renewal of the Advisory Contracts was in the best interests of the fund and its shareholders and that the compensation payable under the Advisory Contracts was fair and reasonable. The Board's decision to renew the Advisory Contracts was not based on any single factor, but rather was based on a comprehensive consideration of all the information provided to the Board at its meetings throughout the year. The Board, in reaching its determination to renew the Advisory Contracts, was aware that shareholders of the fund have a broad range of investment choices available to them, including a wide choice among funds offered by Fidelity's competitors, and that the fund's shareholders, who have the opportunity to review and weigh the disclosure provided by the fund in its prospectus and other public disclosures, have chosen to invest in this fund, which is part of the Fidelity family of funds.
Amendment to Group Fee Rate. The Board also approved an amendment to the management contract for the fund to add an additional breakpoint to the group fee schedule, effective October 1, 2017. The Board noted that the additional breakpoint would result in lower management fee rates as Fidelity's assets under management increase.
Nature, Extent, and Quality of Services Provided. The Board considered Fidelity's staffing as it relates to the fund, including the backgrounds of investment personnel of Fidelity, and also considered the fund's investment objective, strategies, and related investment philosophy. The Independent Trustees also had discussions with senior management of Fidelity's investment operations and investment groups. The Board considered the structure of the investment personnel compensation program and whether this structure provides appropriate incentives to act in the best interests of the fund. Additionally, the Board considered the portfolio managers' investments, if any, in the funds that they manage.
Resources Dedicated to Investment Management and Support Services. The Board and the Fund Oversight and Research Committees reviewed the general qualifications and capabilities of Fidelity's investment staff, including its size, education, experience, and resources, as well as Fidelity's approach to recruiting, training, managing, and compensating investment personnel. The Board noted that Fidelity has continued to increase the resources devoted to non-U.S. offices, including expansion of Fidelity's global investment organization. The Board also noted that Fidelity's analysts have extensive resources, tools and capabilities that allow them to conduct sophisticated quantitative and fundamental analysis, as well as credit analysis of issuers, counterparties and guarantors. Further, the Board considered that Fidelity's investment professionals have sufficient access to global information and data so as to provide competitive investment results over time, and that those professionals also have access to sophisticated tools that permit them to assess portfolio construction and risk and performance attribution characteristics continuously, as well as to transmit new information and research conclusions rapidly around the world. Additionally, in its deliberations, the Board considered Fidelity's trading, risk management, compliance, and technology and operations capabilities and resources, which are integral parts of the investment management process.
Shareholder and Administrative Services. The Board considered (i) the nature, extent, quality, and cost of advisory, administrative, and shareholder services performed by the Investment Advisers and their affiliates under the Advisory Contracts and under separate agreements covering transfer agency, pricing and bookkeeping, and securities lending services for the fund; (ii) the nature and extent of the supervision of third party service providers, principally custodians, subcustodians, and pricing vendors; and (iii) the resources devoted to, and the record of compliance with, the fund's compliance policies and procedures. The Board also reviewed the allocation of fund brokerage, including allocations to brokers affiliated with the Investment Advisers, the use of brokerage commissions to pay fund expenses, and the use of "soft" commission dollars to pay for research services.
The Board noted that the growth of fund assets over time across the complex allows Fidelity to reinvest in the development of services designed to enhance the value or convenience of the Fidelity funds as investment vehicles. These services include 24-hour access to account information and market information through telephone representatives and over the Internet, investor education materials and asset allocation tools, and the expanded availability of Fidelity Investor Centers.
In 2014, the Board formed an ad hoc Committee on Transfer Agency Fees to review the variety of transfer agency fee structures throughout the industry and Fidelity's competitive positioning with respect to industry participants.
Investment in a Large Fund Family. The Board considered the benefits to shareholders of investing in a Fidelity fund, including the benefits of investing in a fund that is part of a large family of funds offering a variety of investment disciplines and providing a large variety of mutual fund investor services. The Board noted that Fidelity had taken, or had made recommendations that resulted in the Fidelity funds taking, a number of actions over the previous year that benefited particular funds, including: (i) continuing to dedicate additional resources to Fidelity's investment research process, and to the support of the senior management team that oversees asset management; (ii) continuing efforts to enhance Fidelity's global research capabilities; (iii) launching new funds and making other enhancements to meet client needs; (iv) launching new share classes of existing funds; (v) eliminating purchase minimums and broadening eligibility requirements for certain lower-priced share classes; (vi) reducing management fees and total expenses for certain growth equity funds and index funds; (vii) lowering expense caps for certain existing funds and classes to reduce expenses borne by shareholders; (viii) eliminating short-term redemption fees for certain funds; (ix) introducing a new pricing structure for certain funds of funds that is expected to reduce overall expenses paid by shareholders; (x) rationalizing product lines and gaining increased efficiencies through proposals for fund mergers and share class consolidations; (xi) continuing to develop, acquire and implement systems and technology to improve services to the funds and shareholders, strengthen information security, and increase efficiency; and (xii) implementing enhancements to further strengthen Fidelity's product line to increase investors' probability of success in achieving their investment goals, including retirement income goals.
Investment Performance. The Board considered whether the fund has operated in accordance with its investment objective, as well as its record of compliance with its investment restrictions and its performance history.
The Board took into account discussions with representatives of the Investment Advisers about fund investment performance that occur at Board meetings throughout the year. In this regard the Board noted that as part of regularly scheduled fund reviews and other reports to the Board on fund performance, the Board considers annualized return information for the fund for different time periods, measured against a securities market index ("benchmark index") and a peer group of funds with similar objectives ("peer group"), if any. In its evaluation of fund investment performance, the Board gave particular attention to information indicating changes in performance of certain Fidelity funds for specific time periods and discussed with the Investment Advisers the reasons for any overperformance or underperformance.
In addition to reviewing absolute and relative fund performance, the Independent Trustees periodically consider the appropriateness of fund performance metrics in evaluating the results achieved. In general, the Independent Trustees believe that fund performance should be evaluated based on net performance (after fees and expenses) of both the highest performing and lowest performing fund share classes, where applicable, compared to appropriate benchmark indices, over appropriate time periods that may include full market cycles, and compared to peer groups, as applicable, over the same periods, taking into account relevant factors including the following: general market conditions; issuer-specific information; and fund cash flows and other factors.
The Independent Trustees recognize that shareholders evaluate performance on a net basis over their own holding periods, for which one-, three-, and five-year periods are often used as a proxy. For this reason, the performance information reviewed by the Board also included net cumulative calendar year total return information for the fund and an appropriate benchmark index and peer group for the most recent one-, three-, and five-year periods, as shown below. Returns are shown compared to the 25th percentile (top of box, 75% beaten) and 75th percentile (bottom of box, 25% beaten) of the peer universe.
Fidelity Emerging Markets Fund

Based on its review, the Board concluded that the nature, extent, and quality of services provided to the fund under the Advisory Contracts should continue to benefit the shareholders of the fund.
Competitiveness of Management Fee and Total Expense Ratio. The Board considered the fund's management fee and total expense ratio compared to "mapped groups" of competitive funds and classes created for the purpose of facilitating the Trustees' competitive analysis of management fees and total expenses. Fidelity creates "mapped groups" by combining similar Lipper investment objective categories that have comparable investment mandates. Combining Lipper investment objective categories aids the Board's management fee and total expense ratio comparisons by broadening the competitive group used for comparison.
Management Fee. The Board considered two proprietary management fee comparisons for the 12-month periods shown in basis points (BP) in the chart below. The group of Lipper funds used by the Board for management fee comparisons is referred to below as the "Total Mapped Group." The Total Mapped Group comparison focuses on a fund's standing in terms of gross management fees before expense reimbursements or caps relative to the total universe of funds with comparable investment mandates, regardless of whether their management fee structures also are comparable. Funds with comparable investment mandates offer exposure to similar types of securities. Funds with comparable management fee structures have similar management fee contractual arrangements (
e.g., flat rate charged for advisory services, all-inclusive fee rate,
etc.). "TMG %" represents the percentage of funds in the Total Mapped Group that had management fees that were lower than the fund's. For example, a hypothetical TMG % of 20% would mean that 80% of the funds in the Total Mapped Group had higher, and 20% had lower, management fees than the fund. The fund's actual TMG %s and the number of funds in the Total Mapped Group are in the chart below. The "Asset-Size Peer Group" (ASPG) comparison focuses on a fund's standing relative to a subset of non-Fidelity funds within the Total Mapped Group that are similar in size and management fee structure. For example, if a fund is in the first quartile of the ASPG, the fund's management fee ranks in the least expensive or lowest 25% of funds in the ASPG. The ASPG represents at least 15% of the funds in the Total Mapped Group with comparable asset size and management fee structures, subject to a minimum of 50 funds (or all funds in the Total Mapped Group if fewer than 50). Additional information, such as the ASPG quartile in which the fund's management fee rate ranked, is also included in the chart and considered by the Board.
Fidelity Emerging Markets Fund
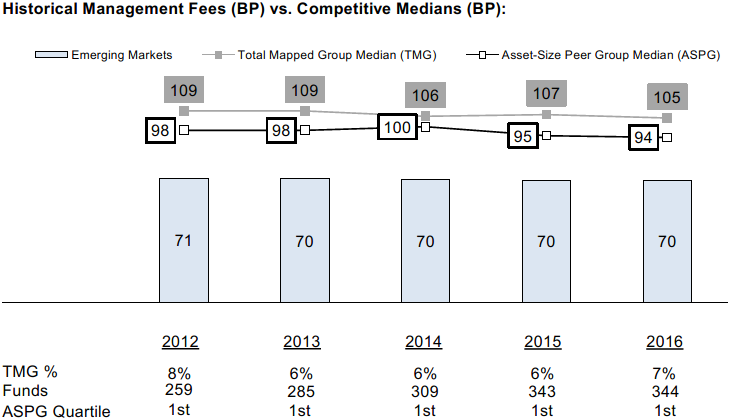
The Board noted that the fund's management fee rate ranked below the median of its Total Mapped Group and below the median of its ASPG for 2016.
The Board noted that, in 2014, the Board and the boards of other Fidelity funds formed the ad hoc Committee on Group Fee to conduct an in-depth review of the "group fee" component of the management fee of funds with such management fee structures. The Committee's focus included the mechanics of the group fee, the competitive landscape of group fee structures, Fidelity funds with no group fee component and investment products not included in group fee assets. The Board also considered that, for funds subject to the group fee, FMR agreed to voluntarily waive fees over a specified period of time in amounts designed to account for assets converted from certain funds to certain collective investment trusts.
The Board also noted that, in 2013, the ad hoc Committee on Management Fees was formed to conduct an in-depth review of the management fee rates of Fidelity's active equity mutual funds. The Committee focused on the following areas: (i) standard fee structures; (ii) research consumption and trading evolution; (iii) management fee competitiveness/profitability by category; and (iv) factors that drive institutional pricing.
Based on its review, the Board concluded that the fund's management fee is fair and reasonable in light of the services that the fund receives and the other factors considered.
Total Expense Ratio. In its review of each class's total expense ratio, the Board considered the fund's management fee rate as well as other fund or class expenses, as applicable, such as transfer agent fees, pricing and bookkeeping fees, and custodial, legal, and audit fees. The Board also noted that Fidelity may agree to waive fees and expenses from time to time, and the extent to which, if any, it has done so for the fund. As part of its review, the Board also considered the current and historical total expense ratios of each class of the fund compared to competitive fund median expenses. Each class of the fund is compared to those funds and classes in the Total Mapped Group (used by the Board for management fee comparisons) that have a similar sales load structure.
The Board noted that the total expense ratio of each class ranked below the competitive median for 2016.
Fees Charged to Other Fidelity Clients. The Board also considered Fidelity fee structures and other information with respect to clients of Fidelity, such as other funds advised or subadvised by Fidelity, pension plan clients, and other institutional clients with similar mandates. The Board noted that an ad hoc joint committee created by it and the boards of other Fidelity funds periodically (most recently in 2013) reviews and compares Fidelity's institutional investment advisory business with its business of providing services to the Fidelity funds, including the differences in services provided, fees charged, and costs incurred, as well as competition in their respective marketplaces.
Based on its review of total expense ratios and fees charged to other Fidelity clients, the Board concluded that the total expense ratio of each class of the fund was reasonable in light of the services that the fund and its shareholders receive and the other factors considered.
Costs of the Services and Profitability. The Board considered the revenues earned and the expenses incurred by Fidelity in conducting the business of developing, marketing, distributing, managing, administering and servicing the fund and servicing the fund's shareholders. The Board also considered the level of Fidelity's profits in respect of all the Fidelity funds.
On an annual basis, Fidelity presents to the Board information about the profitability of its relationships with the fund. Fidelity calculates profitability information for each fund, as well as aggregate profitability information for groups of Fidelity funds and all Fidelity funds, using a series of detailed revenue and cost allocation methodologies which originate with the books and records of Fidelity on which Fidelity's audited financial statements are based. The Audit Committee of the Board reviews any significant changes from the prior year's methodologies.
PricewaterhouseCoopers LLP (PwC), independent registered public accounting firm and auditor to Fidelity and certain Fidelity funds, has been engaged annually by the Board as part of the Board's assessment of Fidelity's profitability analysis. PwC's engagement includes the review and assessment of the methodologies used by Fidelity in determining the revenues and expenses attributable to Fidelity's mutual fund business, and completion of agreed-upon procedures in respect of the mathematical accuracy of the fund profitability information and its conformity to established allocation methodologies. After considering PwC's reports issued under the engagement and information provided by Fidelity, the Board concluded that while other allocation methods may also be reasonable, Fidelity's profitability methodologies are reasonable in all material respects.
The Board also reviewed Fidelity's non-fund businesses and potential fall-out benefits related to the mutual fund business as well as cases where Fidelity's affiliates may benefit from or be related to the fund's business.
The Board considered the costs of the services provided by and the profits realized by Fidelity in connection with the operation of the fund and was satisfied that the profitability was not excessive.
Economies of Scale. The Board considered whether there have been economies of scale in respect of the management of the Fidelity funds, whether the Fidelity funds (including the fund) have appropriately benefited from any such economies of scale, and whether there is potential for realization of any further economies of scale. The Board considered the extent to which the fund will benefit from economies of scale as assets grow through increased services to the fund, through waivers or reimbursements, or through fee or expense ratio reductions. The Board also noted that a committee (the Economies of Scale Committee) created by it and the boards of other Fidelity funds periodically (most recently in 2013) analyzes whether Fidelity attains economies of scale in respect of the management and servicing of the Fidelity funds, whether the Fidelity funds have appropriately benefited from such economies of scale, and whether there is potential for realization of any further economies of scale.
The Board recognized that the fund's management contract incorporates a "group fee" structure, which provides for lower group fee rates as total group assets increase, and for higher group fee rates as total group assets decrease (with "group assets" defined to include fund assets under FMR's management plus the assets of sector funds previously under FMR's management). FMR calculates the group fee rates based on a tiered asset "breakpoint" schedule that varies based on asset class. The Board considered that the group fee is designed to deliver the benefits of economies of scale to fund shareholders when total Fidelity fund assets increase, even if assets of any particular fund are unchanged or have declined, because some portion of Fidelity's costs are attributable to services provided to all Fidelity funds, and all funds benefit if those costs can be allocated among more assets. The Board concluded that, given the group fee structure, fund shareholders will benefit from lower management fees as group assets increase at the fund complex level, regardless of whether Fidelity achieves any such economies of scale.
The Board concluded, taking into account the analysis of the Economies of Scale Committee, that economies of scale, if any, are being appropriately shared between fund shareholders and Fidelity.
Additional Information Requested by the Board. In order to develop fully the factual basis for consideration of the Fidelity funds' advisory contracts, the Board requested and received additional information on certain topics, including: (i) fund performance trends, in particular the underperformance of certain funds, and Fidelity's long-term strategies for certain funds; (ii) Fidelity's fund profitability methodology, profitability trends for certain funds, and the impact of certain factors on fund profitability results, including the impact of market trends on actively managed funds; (iii) the use of performance fees and the calculation of performance adjustments, including the impact of underperformance and fund outflows on performance adjustments; (iv) metrics for evaluating index fund performance; (v) Fidelity's group fee structure, including the group fee breakpoint schedules; (vi) the terms of Fidelity's contractual and voluntary expense cap arrangements with the funds; (vii) the methodology with respect to evaluating competitive fund data and peer group classifications and fee comparisons; (viii) the expense structures for different funds and classes; (ix) Fidelity's arrangements with affiliated sub-advisers on behalf of the funds; (x) information regarding other accounts managed by Fidelity, including institutional accounts and collective investment trusts; (xi) recent changes to the fee structure for certain funds of funds; and (xii) the impact of the Department of Labor's new fiduciary rule on the funds' comparative expense information.
Based on its evaluation of all of the conclusions noted above, and after considering all factors it believed relevant, the Board concluded that the advisory fee structures are fair and reasonable, and that the fund's Advisory Contracts should be renewed.
Corporate Headquarters
245 Summer St.
Boston, MA 02210
www.fidelity.com
EMF-K-ANN-1217
1.863015.109
Fidelity Advisor® Europe Fund - Class A, Class M (formerly Class T), Class C and Class I
Annual Report October 31, 2017 Class A, Class M, Class C and Class I are classes of Fidelity® Europe Fund |
|
Contents
To view a fund's proxy voting guidelines and proxy voting record for the 12-month period ended June 30, visit http://www.fidelity.com/proxyvotingresults or visit the Securities and Exchange Commission's (SEC) web site at http://www.sec.gov.
You may also call 1-877-208-0098 to request a free copy of the proxy voting guidelines.
Standard & Poor's, S&P and S&P 500 are registered service marks of The McGraw-Hill Companies, Inc. and have been licensed for use by Fidelity Distributors Corporation.
Other third-party marks appearing herein are the property of their respective owners.
All other marks appearing herein are registered or unregistered trademarks or service marks of FMR LLC or an affiliated company. © 2017 FMR LLC. All rights reserved.
This report and the financial statements contained herein are submitted for the general information of the shareholders of the Fund. This report is not authorized for distribution to prospective investors in the Fund unless preceded or accompanied by an effective prospectus.
A fund files its complete schedule of portfolio holdings with the SEC for the first and third quarters of each fiscal year on Form N-Q. Forms N-Q are available on the SEC’s web site at http://www.sec.gov. A fund's Forms N-Q may be reviewed and copied at the SEC’s Public Reference Room in Washington, DC. Information regarding the operation of the SEC's Public Reference Room may be obtained by calling 1-800-SEC-0330.
For a complete list of a fund's portfolio holdings, view the most recent holdings listing, semiannual report, or annual report on Fidelity's web site at http://www.fidelity.com, http://www.institutional.fidelity.com, or http://www.401k.com, as applicable.
NOT FDIC INSURED •MAY LOSE VALUE •NO BANK GUARANTEE
Neither the Fund nor Fidelity Distributors Corporation is a bank.
Performance: The Bottom Line
Average annual total return reflects the change in the value of an investment, assuming reinvestment of distributions from dividend income and capital gains (the profits earned upon the sale of securities that have grown in value, if any) and assuming a constant rate of performance each year. The hypothetical investment and the average annual total returns do not reflect the deduction of taxes that a shareholder would pay on fund distributions or the redemption of fund shares. During periods of reimbursement by Fidelity, a fund’s total return will be greater than it would be had the reimbursement not occurred. How a fund did yesterday is no guarantee of how it will do tomorrow.
Average Annual Total Returns
| For the periods ended October 31, 2017 | Past 1 year | Past 5 years | Past 10 years |
| Class A (incl. 5.75% sales charge) | 18.39% | 7.60% | 0.94% |
| Class M (incl. 3.50% sales charge) | 20.87% | 7.88% | 1.07% |
| Class C (incl. contingent deferred sales charge) | 23.63% | 8.27% | 1.25% |
| Class I | 26.04% | 9.17% | 1.67% |
Class A shares bear a 0.25% 12b-1 fee. The initial offering of Class A shares took place on March 18, 2014. Returns prior to March 18, 2014, are those of Fidelity® Europe Fund, the original class of the fund, which has no 12b-1 fee. Had Class A's 12b-1 fee been reflected, returns prior to March 18, 2014, would have been lower.
Class M shares bear a 0.50% 12b-1 fee. The initial offering of Class M shares took place on March 18, 2014. Returns prior to March 18, 2014, are those of Fidelity® Europe Fund, the original class of the fund, which has no 12b-1 fee. Had Class M's 12b-1 fee been reflected, returns prior to March 18, 2014, would have been lower.
Class C shares bear a 1.00% 12b-1 fee. The initial offering of Class C shares took place on March 18, 2014. Returns prior to March 18, 2014, are those of Fidelity® Europe Fund, the original class of the fund, which has no 12b-1 fee. Had Class C's 12b-1 fee been reflected, returns prior to March 18, 2014, would have been lower.
Class C shares' contingent deferred sales charges included in the past one year, past five years and past ten years total return figures are 1%, 0% and 0%, respectively.
The initial offering of Class I shares took place on March 18, 2014. Returns prior to March 18, 2014 are those of Fidelity® Europe Fund, the original class of the fund.
$10,000 Over 10 Years
Let's say hypothetically that $10,000 was invested in Fidelity Advisor® Europe Fund - Class A on October 31, 2007, and the current 5.75% sales charge was paid.
The chart shows how the value of your investment would have changed, and also shows how the MSCI Europe Index performed over the same period.
See above for additional information regarding the performance of Class A.
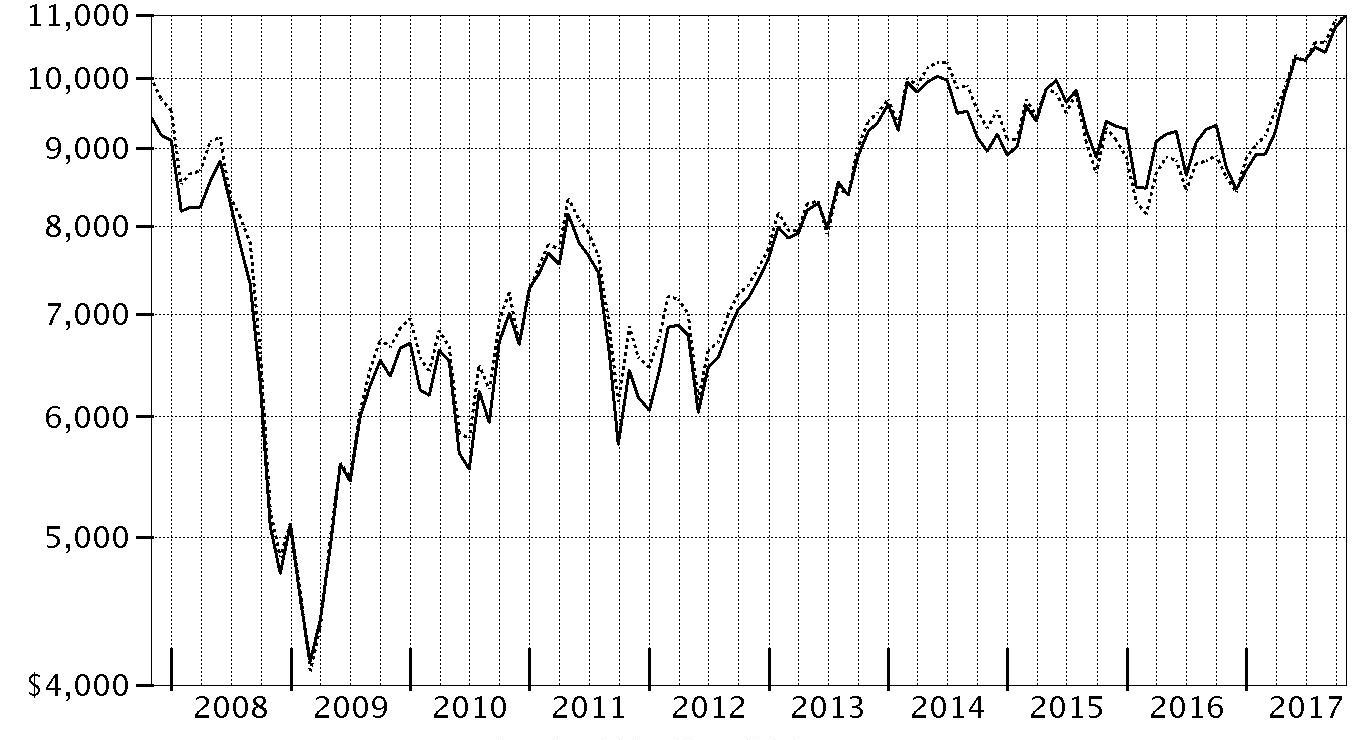
| Period Ending Values |
| $10,978 | Fidelity Advisor® Europe Fund - Class A |
| $10,959 | MSCI Europe Index |
Management's Discussion of Fund Performance
Market Recap: The MSCI ACWI (All Country World Index) ex USA Index returned 23.85% for the 12 months ending October 31, 2017, helped partly by a generally weak U.S. dollar. Some favorable election results in continental Europe (+30%) suggested ebbing political uncertainty and near-term risk there, but the U.K. (+20%) faced more-mixed conditions ahead of its expected exit from the European Union. Despite central-bank easing – and pressured recently by yen strength – Japan (+18%) lagged the rest of the Asia-Pacific group (+22%). Commodity-price volatility slowed Canada (+17%), but the emerging-markets group (+26%) sped ahead. Sector-wise, information technology (+47%) was driven by a surge among several Chinese internet-related names. Financials (+27%) rode rising interest rates that, at the same time, weighed on real estate (+17%), utilities (+16%), consumer staples (+14%) and telecommunication services (+9%) – so-called “bond proxy” sectors. Materials (+28%) and industrials (+27%) responded to demand from China and price gains for certain commodities. In the energy sector (+20%), oil prices lost ground in the spring before rebounding through October 31 to end well above where they started 12 months ago. Lastly, health care (+14%) was hurt by early-period turmoil around drug pricing and health care legislation.
Comments from Portfolio Manager Stefan Lindblad: For the fiscal year, the fund’s share classes (excluding sales charges, if applicable) gained roughly 25% to 26%, lagging the 27.33% return of the benchmark MSCI Europe Index. Amid a strong market for European stocks, bolstered by a sense of optimism as the political environment stabilized, the fund's defensive positioning hampered our results versus the benchmark. In particular, stock selection in the industrials and consumer discretionary sectors notably detracted. The largest individual detractor was Intertrust, a Netherlands-based trust and corporate services company. Shares of the company lost ground the past year, mainly due to poor execution and internal issues, as well as disappointing financial results. Also detracting was our position in emerging-markets lender International Personal Finance. Shares of the U.K.-based firm declined on news of potential regulatory changes in Poland, one of the company’s primary markets. Intertrust and International Personal Finance were non-benchmark holdings. Turning to contributors, stock picking in health care boosted the fund’s relative result most. The fund’s biggest individual contributor versus the benchmark was an overweighting in Svenska Cellulosa, a manufacturer of tinder, pulp and paper. Investors were enthusiastic about the company’s recent split from the consumer tissue side of the business.
The views expressed above reflect those of the portfolio manager(s) only through the end of the period as stated on the cover of this report and do not necessarily represent the views of Fidelity or any other person in the Fidelity organization. Any such views are subject to change at any time based upon market or other conditions and Fidelity disclaims any responsibility to update such views. These views may not be relied on as investment advice and, because investment decisions for a Fidelity fund are based on numerous factors, may not be relied on as an indication of trading intent on behalf of any Fidelity fund.
Investment Summary (Unaudited)
Geographic Diversification (% of fund's net assets)
| As of October 31, 2017 |
| | United Kingdom | 19.2% |
| | Sweden | 18.3% |
| | Germany | 11.8% |
| | United States of America* | 9.5% |
| | Italy | 6.2% |
| | Spain | 5.9% |
| | Ireland | 5.4% |
| | France | 5.1% |
| | Netherlands | 4.5% |
| | Other | 14.1% |

* Includes Short-Term investments and Net Other Assets (Liabilities).
Percentages are based on country or territory of incorporation and are adjusted for the effect of futures contracts, if applicable.
| As of April 30, 2017 |
| | Germany | 15.0% |
| | Sweden | 14.2% |
| | United Kingdom | 13.1% |
| | France | 10.4% |
| | Netherlands | 7.6% |
| | Italy | 7.3% |
| | Spain | 6.2% |
| | Switzerland | 6.0% |
| | United States of America* | 3.9% |
| | Other | 16.3% |

* Includes Short-Term investments and Net Other Assets (Liabilities).
Percentages are based on country or territory of incorporation and are adjusted for the effect of futures contracts, if applicable.
Asset Allocation as of October 31, 2017
| | % of fund's net assets | % of fund's net assets 6 months ago |
| Stocks | 93.6 | 98.7 |
| Short-Term Investments and Net Other Assets (Liabilities) | 6.4 | 1.3 |
Top Ten Stocks as of October 31, 2017
| | % of fund's net assets | % of fund's net assets 6 months ago |
| Getinge AB (B Shares) (Sweden, Health Care Equipment & Supplies) | 3.7 | 3.3 |
| Securitas AB (B Shares) (Sweden, Commercial Services & Supplies) | 3.5 | 0.0 |
| SAP SE (Germany, Software) | 3.1 | 4.3 |
| Autoliv, Inc. (depositary receipt) (United States of America, Auto Components) | 3.1 | 2.6 |
| Prudential PLC (United Kingdom, Insurance) | 2.9 | 3.1 |
| NCC Group Ltd. (United Kingdom, IT Services) | 2.6 | 1.9 |
| Schibsted ASA (A Shares) (Norway, Media) | 2.6 | 2.0 |
| Investor AB (B Shares) (Sweden, Diversified Financial Services) | 2.4 | 2.8 |
| Vostok New Ventures Ltd. (depositary receipt) (Bermuda, Capital Markets) | 2.3 | 2.6 |
| Intertrust NV (Netherlands, Professional Services) | 2.3 | 1.2 |
| | 28.5 | |
Top Market Sectors as of October 31, 2017
| | % of fund's net assets | % of fund's net assets 6 months ago |
| Industrials | 19.2 | 19.4 |
| Financials | 19.2 | 18.6 |
| Consumer Discretionary | 17.1 | 17.0 |
| Health Care | 10.9 | 12.6 |
| Information Technology | 10.5 | 12.2 |
| Materials | 6.9 | 6.4 |
| Consumer Staples | 6.1 | 7.6 |
| Real Estate | 3.4 | 3.3 |
| Utilities | 0.3 | 1.6 |
Percentages shown as 0.0% may reflect amounts less than 0.05%.
Investments October 31, 2017
Showing Percentage of Net Assets
| Common Stocks - 91.1% | | | |
| | | Shares | Value |
| Bermuda - 3.1% | | | |
| Vostok Emerging Finance Ltd. (depository receipt) (a)(b)(c) | | 53,590,807 | $11,714,677 |
| Vostok New Ventures Ltd. (depositary receipt) (a)(b) | | 3,850,361 | 31,735,071 |
|
| TOTAL BERMUDA | | | 43,449,748 |
|
| Canada - 0.2% | | | |
| Lundin Mining Corp. | | 447,200 | 3,445,486 |
| Denmark - 3.3% | | | |
| A.P. Moller - Maersk A/S Series B | | 15,055 | 28,916,346 |
| Novozymes A/S Series B | | 316,100 | 17,457,063 |
|
| TOTAL DENMARK | | | 46,373,409 |
|
| France - 5.1% | | | |
| Capgemini SA | | 225,600 | 27,422,153 |
| Rubis | | 71,806 | 4,506,697 |
| The Vicat Group | | 158,300 | 12,245,722 |
| Wendel SA | | 157,200 | 26,514,968 |
|
| TOTAL FRANCE | | | 70,689,540 |
|
| Germany - 11.8% | | | |
| Bertrandt AG (b) | | 126,900 | 11,899,467 |
| CompuGroup Medical AG | | 126,309 | 7,257,974 |
| CTS Eventim AG | | 417,769 | 17,256,191 |
| Fresenius Medical Care AG & Co. KGaA | | 160,500 | 15,539,930 |
| LEG Immobilien AG | | 280,268 | 28,468,200 |
| MTU Aero Engines Holdings AG | | 143,000 | 24,111,521 |
| SAP SE | | 381,437 | 43,583,993 |
| Vonovia SE | | 371,900 | 16,357,923 |
|
| TOTAL GERMANY | | | 164,475,199 |
|
| Hungary - 0.5% | | | |
| OTP Bank PLC | | 171,900 | 6,932,357 |
| Ireland - 5.4% | | | |
| DCC PLC (United Kingdom) | | 154,100 | 14,613,289 |
| Paddy Power Betfair PLC (Ireland) | | 253,900 | 25,967,326 |
| Ryanair Holdings PLC sponsored ADR (a) | | 152,667 | 17,115,497 |
| United Drug PLC (United Kingdom) | | 1,420,241 | 17,438,780 |
|
| TOTAL IRELAND | | | 75,134,892 |
|
| Italy - 5.2% | | | |
| Banca Generali SpA | | 418,800 | 13,796,092 |
| Buzzi Unicem SpA | | 490,500 | 13,672,619 |
| Prada SpA | | 5,541,700 | 19,179,365 |
| UniCredit SpA (a) | | 1,314,200 | 25,151,798 |
|
| TOTAL ITALY | | | 71,799,874 |
|
| Luxembourg - 1.3% | | | |
| B&M European Value Retail S.A. | | 3,334,636 | 17,596,007 |
| Malta - 0.8% | | | |
| Kambi Group PLC (a)(b) | | 1,055,109 | 11,090,955 |
| Netherlands - 4.5% | | | |
| Intertrust NV (b) | | 2,058,425 | 31,650,384 |
| Unilever NV (Certificaten Van Aandelen) (Bearer) | | 528,100 | 30,677,312 |
|
| TOTAL NETHERLANDS | | | 62,327,696 |
|
| Norway - 2.6% | | | |
| Schibsted ASA (A Shares) (b) | | 1,405,250 | 36,232,327 |
| Spain - 4.4% | | | |
| Aedas Homes SAU | | 52,983 | 1,851,517 |
| Amadeus IT Holding SA Class A | | 296,800 | 20,138,626 |
| Grifols SA | | 499,300 | 15,630,758 |
| Prosegur Cash SA | | 7,417,400 | 24,192,444 |
|
| TOTAL SPAIN | | | 61,813,345 |
|
| Sweden - 18.3% | | | |
| AF AB (B Shares) | | 132,500 | 2,730,197 |
| Dometic Group AB (d) | | 2,927,400 | 25,456,716 |
| Essity AB Class B | | 798,700 | 23,879,953 |
| Getinge AB (B Shares) | | 2,608,684 | 51,353,215 |
| Indutrade AB | | 1,080,500 | 29,969,253 |
| Investor AB (B Shares) | | 670,971 | 33,253,405 |
| Nobia AB | | 637,800 | 5,233,957 |
| Pandox AB | | 263,672 | 4,806,262 |
| Securitas AB (B Shares) | | 2,781,200 | 48,802,599 |
| Svenska Cellulosa AB (SCA) (B Shares) | | 3,159,600 | 29,664,948 |
|
| TOTAL SWEDEN | | | 255,150,505 |
|
| Switzerland - 2.3% | | | |
| EDAG Engineering Group AG | | 297,000 | 4,651,438 |
| Swatch Group AG (Bearer) | | 69,820 | 27,363,925 |
|
| TOTAL SWITZERLAND | | | 32,015,363 |
|
| United Kingdom - 19.2% | | | |
| British American Tobacco PLC (United Kingdom) | | 464,200 | 29,991,884 |
| Bunzl PLC | | 379,058 | 11,805,806 |
| Dechra Pharmaceuticals PLC | | 881,600 | 24,073,643 |
| Diploma PLC | | 1,206,600 | 17,291,469 |
| Essentra PLC | | 1,039,335 | 7,343,690 |
| International Personal Finance PLC | | 4,931,872 | 13,247,913 |
| Micro Focus International PLC | | 519,158 | 18,237,796 |
| NCC Group Ltd. (b) | | 11,931,824 | 36,448,680 |
| Prudential PLC | | 1,636,678 | 40,172,877 |
| Rolls-Royce Holdings PLC | | 2,252,300 | 29,106,433 |
| Standard Chartered PLC (United Kingdom) (a) | | 2,594,366 | 25,856,587 |
| Standard Life PLC | | 2,370,514 | 13,531,815 |
|
| TOTAL UNITED KINGDOM | | | 267,108,593 |
|
| United States of America - 3.1% | | | |
| Autoliv, Inc. (depositary receipt) | | 342,700 | 42,982,566 |
| TOTAL COMMON STOCKS | | | |
| (Cost $1,065,432,054) | | | 1,268,617,862 |
|
| Nonconvertible Preferred Stocks - 2.5% | | | |
| Italy - 1.0% | | | |
| Buzzi Unicem SpA (Risparmio Shares) | | 889,200 | 14,097,029 |
| Spain - 1.5% | | | |
| Grifols SA Class B | | 850,250 | 19,970,448 |
| United Kingdom - 0.0% | | | |
| Rolls-Royce Holdings PLC Series C (a) | | 103,605,800 | 137,604 |
| TOTAL NONCONVERTIBLE PREFERRED STOCKS | | | |
| (Cost $23,679,782) | | | 34,205,081 |
|
| Money Market Funds - 2.0% | | | |
| Fidelity Cash Central Fund, 1.10%(e) | | 11,413,326 | 11,415,608 |
| Fidelity Securities Lending Cash Central Fund 1.11%(e)(f) | | 16,893,729 | 16,895,418 |
| TOTAL MONEY MARKET FUNDS | | | |
| (Cost $28,312,287) | | | 28,311,026 |
| TOTAL INVESTMENT IN SECURITIES - 95.6% | | | |
| (Cost $1,117,424,123) | | | 1,331,133,969 |
| NET OTHER ASSETS (LIABILITIES) - 4.4% | | | 61,067,864 |
| NET ASSETS - 100% | | | $1,392,201,833 |
Categorizations in the Schedule of Investments are based on country or territory of incorporation.
Legend
(a) Non-income producing
(b) Security or a portion of the security is on loan at period end.
(c) Affiliated company
(d) Security exempt from registration under Rule 144A of the Securities Act of 1933. These securities may be resold in transactions exempt from registration, normally to qualified institutional buyers. At the end of the period, the value of these securities amounted to $25,456,716 or 1.8% of net assets.
(e) Affiliated fund that is generally available only to investment companies and other accounts managed by Fidelity Investments. The rate quoted is the annualized seven-day yield of the fund at period end. A complete unaudited listing of the fund's holdings as of its most recent quarter end is available upon request. In addition, each Fidelity Central Fund's financial statements, which are not covered by the Fund's Report of Independent Registered Public Accounting Firm, are available on the SEC's website or upon request.
(f) Investment made with cash collateral received from securities on loan.
Affiliated Central Funds
Information regarding fiscal year to date income earned by the Fund from investments in Fidelity Central Funds is as follows:
| Fund | Income earned |
| Fidelity Cash Central Fund | $154,307 |
| Fidelity Securities Lending Cash Central Fund | 440,682 |
| Total | $594,989 |
Other Affiliated Issuers
An affiliated company is a company in which the Fund has ownership of at least 5% of the voting securities. Fiscal year to date transactions with companies which are or were affiliates are as follows:
| Affiliate | Value, beginning of period | Purchases | Sales Proceeds | Dividend Income | Realized Gain (loss) | Change in Unrealized appreciation (depreciation) | Value, end of period |
| Vostok Emerging Finance Ltd. (depository receipt) | $8,746,849 | $47,949 | $-- | $-- | $-- | $2,919,879 | $11,714,677 |
| Total | $8,746,849 | $47,949 | $-- | $-- | $-- | $2,919,879 | $11,714,677 |
Investment Valuation
The following is a summary of the inputs used, as of October 31, 2017, involving the Fund's assets and liabilities carried at fair value. The inputs or methodology used for valuing securities may not be an indication of the risk associated with investing in those securities. For more information on valuation inputs, and their aggregation into the levels used below, please refer to the Investment Valuation section in the accompanying Notes to Financial Statements.
| | Valuation Inputs at Reporting Date: |
| Description | Total | Level 1 | Level 2 | Level 3 |
| Investments in Securities: | | | | |
| Equities: | | | | |
| Consumer Discretionary | $237,817,035 | $237,817,035 | $-- | $-- |
| Consumer Staples | 84,549,149 | 23,879,953 | 60,669,196 | -- |
| Financials | 266,100,004 | 225,927,127 | 40,172,877 | -- |
| Health Care | 151,264,748 | 115,754,370 | 35,510,378 | -- |
| Industrials | 268,149,865 | 239,043,432 | 29,106,433 | -- |
| Information Technology | 145,831,248 | 102,247,255 | 43,583,993 | -- |
| Materials | 97,926,557 | 97,926,557 | -- | -- |
| Real Estate | 46,677,640 | 46,677,640 | -- | -- |
| Utilities | 4,506,697 | 4,506,697 | -- | -- |
| Money Market Funds | 28,311,026 | 28,311,026 | -- | -- |
| Total Investments in Securities: | $1,331,133,969 | $1,122,091,092 | $209,042,877 | $-- |
See accompanying notes which are an integral part of the financial statements.
Financial Statements
Statement of Assets and Liabilities
| | | October 31, 2017 |
| Assets | | |
Investment in securities, at value (including securities loaned of $15,987,991) — See accompanying schedule:
Unaffiliated issuers (cost $1,082,251,869) | $1,291,108,266 | |
| Fidelity Central Funds (cost $28,312,287) | 28,311,026 | |
| Other affiliated issuers (cost $6,859,967) | 11,714,677 | |
| Total Investment in Securities (cost $1,117,424,123) | | $1,331,133,969 |
| Foreign currency held at value (cost $18) | | 18 |
| Receivable for investments sold | | 78,005,956 |
| Receivable for fund shares sold | | 1,222,809 |
| Dividends receivable | | 1,283,153 |
| Distributions receivable from Fidelity Central Funds | | 41,979 |
| Prepaid expenses | | 3,034 |
| Other receivables | | 163,560 |
| Total assets | | 1,411,854,478 |
| Liabilities | | |
| Payable for fund shares redeemed | $1,463,950 | |
| Accrued management fee | 920,390 | |
| Distribution and service plan fees payable | 16,710 | |
| Other affiliated payables | 252,571 | |
| Other payables and accrued expenses | 103,888 | |
| Collateral on securities loaned | 16,895,136 | |
| Total liabilities | | 19,652,645 |
| Net Assets | | $1,392,201,833 |
| Net Assets consist of: | | |
| Paid in capital | | $1,170,393,373 |
| Undistributed net investment income | | 11,925,792 |
| Accumulated undistributed net realized gain (loss) on investments and foreign currency transactions | | (3,762,839) |
| Net unrealized appreciation (depreciation) on investments and assets and liabilities in foreign currencies | | 213,645,507 |
| Net Assets | | $1,392,201,833 |
| Calculation of Maximum Offering Price | | |
| Class A: | | |
| Net Asset Value and redemption price per share ($20,925,236 ÷ 492,654 shares) | | $42.47 |
| Maximum offering price per share (100/94.25 of $42.47) | | $45.06 |
| Class M: | | |
| Net Asset Value and redemption price per share ($8,873,889 ÷ 208,967 shares) | | $42.47 |
| Maximum offering price per share (100/96.50 of $42.47) | | $44.01 |
| Class C: | | |
| Net Asset Value and offering price per share ($10,720,880 ÷ 254,337 shares)(a) | | $42.15 |
| Europe: | | |
| Net Asset Value, offering price and redemption price per share ($1,343,212,879 ÷ 31,581,803 shares) | | $42.53 |
| Class I: | | |
| Net Asset Value, offering price and redemption price per share ($8,468,949 ÷ 199,120 shares) | | $42.53 |
(a) Redemption price per share is equal to net asset value less any applicable contingent deferred sales charge.
See accompanying notes which are an integral part of the financial statements.
Statement of Operations
| | | Year ended October 31, 2017 |
| Investment Income | | |
| Dividends | | $25,640,247 |
| Income from Fidelity Central Funds | | 594,989 |
| Income before foreign taxes withheld | | 26,235,236 |
| Less foreign taxes withheld | | (2,345,172) |
| Total income | | 23,890,064 |
| Expenses | | |
| Management fee | | |
| Basic fee | $8,371,538 | |
| Performance adjustment | 597,984 | |
| Transfer agent fees | 2,232,646 | |
| Distribution and service plan fees | 172,086 | |
| Accounting and security lending fees | 556,523 | |
| Custodian fees and expenses | 121,167 | |
| Independent trustees' fees and expenses | 4,875 | |
| Registration fees | 93,013 | |
| Audit | 85,481 | |
| Legal | 8,157 | |
| Interest | 2,747 | |
| Miscellaneous | 10,268 | |
| Total expenses before reductions | 12,256,485 | |
| Expense reductions | (503,177) | 11,753,308 |
| Net investment income (loss) | | 12,136,756 |
| Realized and Unrealized Gain (Loss) | | |
| Net realized gain (loss) on: | | |
| Investment securities: | | |
| Unaffiliated issuers | 23,987,396 | |
| Fidelity Central Funds | (1,038) | |
| Foreign currency transactions | (21,372) | |
| Total net realized gain (loss) | | 23,964,986 |
| Change in net unrealized appreciation (depreciation) on: | | |
| Investment securities: | | |
| Unaffiliated issuers | 238,651,010 | |
| Fidelity Central Funds | (1,725) | |
| Other affiliated issuers | 2,919,879 | |
| Assets and liabilities in foreign currencies | 73,320 | |
| Total change in net unrealized appreciation (depreciation) | | 241,642,484 |
| Net gain (loss) | | 265,607,470 |
| Net increase (decrease) in net assets resulting from operations | | $277,744,226 |
See accompanying notes which are an integral part of the financial statements.
Statement of Changes in Net Assets
| | Year ended October 31, 2017 | Year ended October 31, 2016 |
| Increase (Decrease) in Net Assets | | |
| Operations | | |
| Net investment income (loss) | $12,136,756 | $11,518,138 |
| Net realized gain (loss) | 23,964,986 | (10,272,498) |
| Change in net unrealized appreciation (depreciation) | 241,642,484 | (89,926,922) |
| Net increase (decrease) in net assets resulting from operations | 277,744,226 | (88,681,282) |
| Distributions to shareholders from net investment income | (11,727,868) | (15,981,681) |
| Distributions to shareholders from net realized gain | (3,911,466) | (5,885,187) |
| Total distributions | (15,639,334) | (21,866,868) |
| Share transactions - net increase (decrease) | 25,014,944 | (219,773,724) |
| Redemption fees | 434 | 22,478 |
| Total increase (decrease) in net assets | 287,120,270 | (330,299,396) |
| Net Assets | | |
| Beginning of period | 1,105,081,563 | 1,435,380,959 |
| End of period | $1,392,201,833 | $1,105,081,563 |
| Other Information | | |
| Undistributed net investment income end of period | $11,925,792 | $11,516,901 |
See accompanying notes which are an integral part of the financial statements.
Financial Highlights
Fidelity Europe Fund Class A
| Years ended October 31, | 2017 | 2016 | 2015 | 2014 A |
| Selected Per–Share Data | | | | |
| Net asset value, beginning of period | $34.17 | $37.06 | $36.24 | $39.45 |
| Income from Investment Operations | | | | |
| Net investment income (loss)B | .26 | .22 | .37 | .47 |
| Net realized and unrealized gain (loss) | 8.39 | (2.67) | 1.29 | (3.68) |
| Total from investment operations | 8.65 | (2.45) | 1.66 | (3.21) |
| Distributions from net investment income | (.22) | (.29) | (.84) | – |
| Distributions from net realized gain | (.13) | (.15) | – | – |
| Total distributions | (.35) | (.44) | (.84) | – |
| Redemption fees added to paid in capitalB,C | – | – | – | – |
| Net asset value, end of period | $42.47 | $34.17 | $37.06 | $36.24 |
| Total ReturnD,E,F | 25.61% | (6.69)% | 4.63% | (8.14)% |
| Ratios to Average Net AssetsG,H | | | | |
| Expenses before reductions | 1.32% | 1.39% | 1.33% | 1.35%I |
| Expenses net of fee waivers, if any | 1.32% | 1.39% | 1.33% | 1.35%I |
| Expenses net of all reductions | 1.28% | 1.38% | 1.31% | 1.35%I |
| Net investment income (loss) | .70% | .62% | .98% | 1.94%I |
| Supplemental Data | | | | |
| Net assets, end of period (000 omitted) | $20,925 | $17,267 | $23,381 | $23,633 |
| Portfolio turnover rateJ | 73% | 62% | 87% | 80%K |
A For the period March 18, 2014 (commencement of sale of shares) to October 31, 2014.
B Calculated based on average shares outstanding during the period.
C Amount represents less than $.005 per share.
D Total returns for periods of less than one year are not annualized.
E Total returns would have been lower if certain expenses had not been reduced during the applicable periods shown.
F Total returns do not include the effect of the sales charges.
G Fees and expenses of any underlying Fidelity Central Funds are not included in the Fund's expense ratio. The Fund indirectly bears its proportionate share of the expenses of any underlying Fidelity Central Funds.
H Expense ratios reflect operating expenses of the class. Expenses before reductions do not reflect amounts reimbursed by the investment adviser or reductions from brokerage service arrangements or reductions from other expense offset arrangements and do not represent the amount paid by the class during periods when reimbursements or reductions occur. Expense ratios before reductions for start-up periods may not be representative of longer-term operating periods. Expenses net of fee waivers reflect expenses after reimbursement by the investment adviser but prior to reductions from brokerage service arrangements or other expense offset arrangements. Expenses net of all reductions represent the net expenses paid by the class.
I Annualized
J Amount does not include the portfolio activity of any underlying Fidelity Central Funds.
K The portfolio turnover rate does not include the assets acquired in the merger.
See accompanying notes which are an integral part of the financial statements.
Fidelity Europe Fund Class M
| Years ended October 31, | 2017 | 2016 | 2015 | 2014 A |
| Selected Per–Share Data | | | | |
| Net asset value, beginning of period | $34.13 | $36.94 | $36.18 | $39.45 |
| Income from Investment Operations | | | | |
| Net investment income (loss)B | .15 | .11 | .26 | .40 |
| Net realized and unrealized gain (loss) | 8.41 | (2.67) | 1.29 | (3.67) |
| Total from investment operations | 8.56 | (2.56) | 1.55 | (3.27) |
| Distributions from net investment income | (.09) | (.09) | (.79) | – |
| Distributions from net realized gain | (.13) | (.15) | – | – |
| Total distributions | (.22) | (.25)C | (.79) | – |
| Redemption fees added to paid in capitalB,D | – | – | – | – |
| Net asset value, end of period | $42.47 | $34.13 | $36.94 | $36.18 |
| Total ReturnE,F,G | 25.25% | (6.99)% | 4.33% | (8.29)% |
| Ratios to Average Net AssetsH,I | | | | |
| Expenses before reductions | 1.63% | 1.70% | 1.61% | 1.62%J |
| Expenses net of fee waivers, if any | 1.63% | 1.70% | 1.61% | 1.61%J |
| Expenses net of all reductions | 1.59% | 1.68% | 1.59% | 1.61%J |
| Net investment income (loss) | .39% | .31% | .70% | 1.68%J |
| Supplemental Data | | | | |
| Net assets, end of period (000 omitted) | $8,874 | $6,980 | $9,632 | $13,679 |
| Portfolio turnover rateK | 73% | 62% | 87% | 80%L |
A For the period March 18, 2014 (commencement of sale of shares) to October 31, 2014.
B Calculated based on average shares outstanding during the period.
C Total distributions of $.25 per share is comprised of distributions from net investment income of $.092 and distributions from net realized gain of $.154 per share.
D Amount represents less than $.005 per share.
E Total returns for periods of less than one year are not annualized.
F Total returns would have been lower if certain expenses had not been reduced during the applicable periods shown.
G Total returns do not include the effect of the sales charges.
H Fees and expenses of any underlying Fidelity Central Funds are not included in the Fund's expense ratio. The Fund indirectly bears its proportionate share of the expenses of any underlying Fidelity Central Funds.
I Expense ratios reflect operating expenses of the class. Expenses before reductions do not reflect amounts reimbursed by the investment adviser or reductions from brokerage service arrangements or reductions from other expense offset arrangements and do not represent the amount paid by the class during periods when reimbursements or reductions occur. Expense ratios before reductions for start-up periods may not be representative of longer-term operating periods. Expenses net of fee waivers reflect expenses after reimbursement by the investment adviser but prior to reductions from brokerage service arrangements or other expense offset arrangements. Expenses net of all reductions represent the net expenses paid by the class.
J Annualized
K Amount does not include the portfolio activity of any underlying Fidelity Central Funds.
L The portfolio turnover rate does not include the assets acquired in the merger.
See accompanying notes which are an integral part of the financial statements.
Fidelity Europe Fund Class C
| Years ended October 31, | 2017 | 2016 | 2015 | 2014 A |
| Selected Per–Share Data | | | | |
| Net asset value, beginning of period | $33.82 | $36.81 | $36.07 | $39.45 |
| Income from Investment Operations | | | | |
| Net investment income (loss)B | (.03) | (.06) | .07 | .29 |
| Net realized and unrealized gain (loss) | 8.36 | (2.65) | 1.29 | (3.67) |
| Total from investment operations | 8.33 | (2.71) | 1.36 | (3.38) |
| Distributions from net investment income | – | (.12) | (.62) | – |
| Distributions from net realized gain | – | (.15) | – | – |
| Total distributions | – | (.28)C | (.62) | – |
| Redemption fees added to paid in capitalB,D | – | – | – | – |
| Net asset value, end of period | $42.15 | $33.82 | $36.81 | $36.07 |
| Total ReturnE,F,G | 24.63% | (7.43)% | 3.79% | (8.57)% |
| Ratios to Average Net AssetsH,I | | | | |
| Expenses before reductions | 2.11% | 2.18% | 2.13% | 2.10%J |
| Expenses net of fee waivers, if any | 2.11% | 2.18% | 2.13% | 2.10%J |
| Expenses net of all reductions | 2.07% | 2.17% | 2.11% | 2.10%J |
| Net investment income (loss) | (.09)% | (.17)% | .18% | 1.19%J |
| Supplemental Data | | | | |
| Net assets, end of period (000 omitted) | $10,721 | $9,007 | $11,151 | $6,818 |
| Portfolio turnover rateK | 73% | 62% | 87% | 80%L |
A For the period March 18, 2014 (commencement of sale of shares) to October 31, 2014.
B Calculated based on average shares outstanding during the period.
C Total distributions of $.28 per share is comprised of distributions from net investment income of $.123 and distributions from net realized gain of $.154 per share.
D Amount represents less than $.005 per share.
E Total returns for periods of less than one year are not annualized.
F Total returns would have been lower if certain expenses had not been reduced during the applicable periods shown.
G Total returns do not include the effect of the contingent deferred sales charge.
H Fees and expenses of any underlying Fidelity Central Funds are not included in the Fund's expense ratio. The Fund indirectly bears its proportionate share of the expenses of any underlying Fidelity Central Funds.
I Expense ratios reflect operating expenses of the class. Expenses before reductions do not reflect amounts reimbursed by the investment adviser or reductions from brokerage service arrangements or reductions from other expense offset arrangements and do not represent the amount paid by the class during periods when reimbursements or reductions occur. Expense ratios before reductions for start-up periods may not be representative of longer-term operating periods. Expenses net of fee waivers reflect expenses after reimbursement by the investment adviser but prior to reductions from brokerage service arrangements or other expense offset arrangements. Expenses net of all reductions represent the net expenses paid by the class.
J Annualized
K Amount does not include the portfolio activity of any underlying Fidelity Central Funds.
L The portfolio turnover rate does not include the assets acquired in the merger.
See accompanying notes which are an integral part of the financial statements.
Fidelity Europe Fund
| Years ended October 31, | 2017 | 2016 | 2015 | 2014 | 2013 |
| Selected Per–Share Data | | | | | |
| Net asset value, beginning of period | $34.26 | $37.19 | $36.32 | $37.92 | $30.15 |
| Income from Investment Operations | | | | | |
| Net investment income (loss)A | .38 | .33 | .48 | .94B | .61 |
| Net realized and unrealized gain (loss) | 8.40 | (2.68) | 1.30 | (2.00) | 7.87 |
| Total from investment operations | 8.78 | (2.35) | 1.78 | (1.06) | 8.48 |
| Distributions from net investment income | (.38) | (.43) | (.91) | (.52) | (.70) |
| Distributions from net realized gain | (.13) | (.15) | – | (.02) | (.01) |
| Total distributions | (.51) | (.58) | (.91) | (.54) | (.71) |
| Redemption fees added to paid in capitalA,C | – | – | – | – | – |
| Net asset value, end of period | $42.53 | $34.26 | $37.19 | $36.32 | $37.92 |
| Total ReturnD | 26.05% | (6.42)% | 4.97% | (2.82)% | 28.71% |
| Ratios to Average Net AssetsE,F | | | | | |
| Expenses before reductions | 1.00% | 1.07% | 1.03% | .97% | 1.06% |
| Expenses net of fee waivers, if any | 1.00% | 1.07% | 1.03% | .97% | 1.05% |
| Expenses net of all reductions | .96% | 1.06% | 1.01% | .96% | 1.02% |
| Net investment income (loss) | 1.02% | .94% | 1.28% | 2.43%B | 1.82% |
| Supplemental Data | | | | | |
| Net assets, end of period (000 omitted) | $1,343,213 | $1,066,488 | $1,384,134 | $1,237,047 | $957,048 |
| Portfolio turnover rateG | 73% | 62% | 87% | 80%H | 59% |
A Calculated based on average shares outstanding during the period.
B Net Investment income per share reflects a large, non-recurring dividend which amounted to $.19 per share. Excluding this non-recurring dividend, the ratio of net investment income (loss) to average net assets would have been 1.93%.
C Amount represents less than $.005 per share.
D Total returns would have been lower if certain expenses had not been reduced during the applicable periods shown.
E Fees and expenses of any underlying Fidelity Central Funds are not included in the Fund's expense ratio. The Fund indirectly bears its proportionate share of the expenses of any underlying Fidelity Central Funds.
F Expense ratios reflect operating expenses of the class. Expenses before reductions do not reflect amounts reimbursed by the investment adviser or reductions from brokerage service arrangements or reductions from other expense offset arrangements and do not represent the amount paid by the class during periods when reimbursements or reductions occur. Expenses net of fee waivers reflect expenses after reimbursement by the investment adviser but prior to reductions from brokerage service arrangements or other expense offset arrangements. Expenses net of all reductions represent the net expenses paid by the class.
G Amount does not include the portfolio activity of any underlying Fidelity Central Funds.
H The portfolio turnover rate does not include the assets acquired in the merger.
See accompanying notes which are an integral part of the financial statements.
Fidelity Europe Fund Class I
| Years ended October 31, | 2017 | 2016 | 2015 | 2014 A |
| Selected Per–Share Data | | | | |
| Net asset value, beginning of period | $34.29 | $37.21 | $36.32 | $39.45 |
| Income from Investment Operations | | | | |
| Net investment income (loss)B | .39 | .35 | .50 | .56 |
| Net realized and unrealized gain (loss) | 8.38 | (2.67) | 1.30 | (3.69) |
| Total from investment operations | 8.77 | (2.32) | 1.80 | (3.13) |
| Distributions from net investment income | (.41) | (.45) | (.91) | – |
| Distributions from net realized gain | (.13) | (.15) | – | – |
| Total distributions | (.53)C | (.60) | (.91) | – |
| Redemption fees added to paid in capitalB,D | – | – | – | – |
| Net asset value, end of period | $42.53 | $34.29 | $37.21 | $36.32 |
| Total ReturnE,F | 26.04% | (6.33)% | 5.02% | (7.93)% |
| Ratios to Average Net AssetsG,H | | | | |
| Expenses before reductions | .98% | 1.01% | .98% | .97%I |
| Expenses net of fee waivers, if any | .98% | 1.01% | .98% | .97%I |
| Expenses net of all reductions | .94% | 1.00% | .96% | .96%I |
| Net investment income (loss) | 1.04% | 1.00% | 1.33% | 2.33%I |
| Supplemental Data | | | | |
| Net assets, end of period (000 omitted) | $8,469 | $5,340 | $6,552 | $5,666 |
| Portfolio turnover rateJ | 73% | 62% | 87% | 80%K |
A For the period March 18, 2014 (commencement of sale of shares) to October 31, 2014.
B Calculated based on average shares outstanding during the period.
C Total distributions of $.53 per share is comprised of distributions from net investment income of $.408 and distributions from net realized gain of $.126 per share.
D Amount represents less than $.005 per share.
E Total returns for periods of less than one year are not annualized.
F Total returns would have been lower if certain expenses had not been reduced during the applicable periods shown.
G Fees and expenses of any underlying Fidelity Central Funds are not included in the Fund's expense ratio. The Fund indirectly bears its proportionate share of the expenses of any underlying Fidelity Central Funds.
H Expense ratios reflect operating expenses of the class. Expenses before reductions do not reflect amounts reimbursed by the investment adviser or reductions from brokerage service arrangements or reductions from other expense offset arrangements and do not represent the amount paid by the class during periods when reimbursements or reductions occur. Expense ratios before reductions for start-up periods may not be representative of longer-term operating periods. Expenses net of fee waivers reflect expenses after reimbursement by the investment adviser but prior to reductions from brokerage service arrangements or other expense offset arrangements. Expenses net of all reductions represent the net expenses paid by the class.
I Annualized
J Amount does not include the portfolio activity of any underlying Fidelity Central Funds.
K The portfolio turnover rate does not include the assets acquired in the merger.
See accompanying notes which are an integral part of the financial statements.
Notes to Financial Statements
For the period ended October 31, 2017
1. Organization.
Fidelity Europe Fund (the Fund) is a fund of Fidelity Investment Trust (the Trust) and is authorized to issue an unlimited number of shares. The Trust is registered under the Investment Company Act of 1940, as amended (the 1940 Act), as an open-end management investment company organized as a Massachusetts business trust. The Fund offers Class A, Class M (formerly Class T), Class C, Europe and Class I shares, each of which has equal rights as to assets and voting privileges. Each class has exclusive voting rights with respect to matters that affect that class.
After the close of business on June 24, 2016, all outstanding Class B shares were converted to Class A shares. All prior fiscal period dollar and share amounts for Class B presented in the Notes to Financial Statements are for the period November 1, 2015 through June 24, 2016.
2. Investments in Fidelity Central Funds.
The Fund invests in Fidelity Central Funds, which are open-end investment companies generally available only to other investment companies and accounts managed by the investment adviser and its affiliates. The Fund's Schedule of Investments lists each of the Fidelity Central Funds held as of period end, if any, as an investment of the Fund, but does not include the underlying holdings of each Fidelity Central Fund. As an Investing Fund, the Fund indirectly bears its proportionate share of the expenses of the underlying Fidelity Central Funds.
The Money Market Central Funds seek preservation of capital and current income and are managed by Fidelity Investments Money Management, Inc. (FIMM), an affiliate of the investment adviser. Annualized expenses of the Money Market Central Funds as of their most recent shareholder report date are less than .005%.
A complete unaudited list of holdings for each Fidelity Central Fund is available upon request or at the Securities and Exchange Commission (the SEC) website at www.sec.gov. In addition, the financial statements of the Fidelity Central Funds, which are not covered by the Fund's Report of Independent Registered Public Accounting Firm, are available on the SEC website or upon request.
3. Significant Accounting Policies.
The Fund is an investment company and applies the accounting and reporting guidance of the Financial Accounting Standards Board (FASB) Accounting Standards Codification Topic 946 Financial Services – Investments Companies. The financial statements have been prepared in conformity with accounting principles generally accepted in the United States of America (GAAP), which require management to make certain estimates and assumptions at the date of the financial statements. Actual results could differ from those estimates. Subsequent events, if any, through the date that the financial statements were issued have been evaluated in the preparation of the financial statements. The following summarizes the significant accounting policies of the Fund:
Investment Valuation. Investments are valued as of 4:00 p.m. Eastern time on the last calendar day of the period. The Board of Trustees (the Board) has delegated the day to day responsibility for the valuation of the Fund's investments to the Fair Value Committee (the Committee) established by the Fund's investment adviser. In accordance with valuation policies and procedures approved by the Board, the Fund attempts to obtain prices from one or more third party pricing vendors or brokers to value its investments. When current market prices, quotations or currency exchange rates are not readily available or reliable, investments will be fair valued in good faith by the Committee, in accordance with procedures adopted by the Board. Factors used in determining fair value vary by investment type and may include market or investment specific events. The frequency with which these procedures are used cannot be predicted and they may be utilized to a significant extent. The Committee oversees the Fund's valuation policies and procedures and reports to the Board on the Committee's activities and fair value determinations. The Board monitors the appropriateness of the procedures used in valuing the Fund's investments and ratifies the fair value determinations of the Committee.
The Fund categorizes the inputs to valuation techniques used to value its investments into a disclosure hierarchy consisting of three levels as shown below:
- Level 1 – quoted prices in active markets for identical investments
- Level 2 – other significant observable inputs (including quoted prices for similar investments, interest rates, prepayment speeds, etc.)
- Level 3 – unobservable inputs (including the Fund's own assumptions based on the best information available)
Valuation techniques used to value the Fund's investments by major category are as follows:
Equity securities, including restricted securities, for which market quotations are readily available, are valued at the last reported sale price or official closing price as reported by a third party pricing vendor on the primary market or exchange on which they are traded and are categorized as Level 1 in the hierarchy. In the event there were no sales during the day or closing prices are not available, securities are valued at the last quoted bid price or may be valued using the last available price and are generally categorized as Level 2 in the hierarchy. For foreign equity securities, when market or security specific events arise, comparisons to the valuation of American Depositary Receipts (ADRs), futures contracts, Exchange-Traded Funds (ETFs) and certain indexes as well as quoted prices for similar securities may be used and would be categorized as Level 2 in the hierarchy. Utilizing these techniques may result in transfers between Level 1 and Level 2. For equity securities, including restricted securities, where observable inputs are limited, assumptions about market activity and risk are used and these securities may be categorized as Level 3 in the hierarchy.
Investments in open-end mutual funds, including the Fidelity Central Funds, are valued at their closing net asset value (NAV) each business day and are categorized as Level 1 in the hierarchy.
Changes in valuation techniques may result in transfers in or out of an assigned level within the disclosure hierarchy. The aggregate value of investments by input level as of October 31, 2017 is included at the end of the Fund's Schedule of Investments.
Foreign Currency. The Fund may use foreign currency contracts to facilitate transactions in foreign-denominated securities. Gains and losses from these transactions may arise from changes in the value of the foreign currency or if the counterparties do not perform under the contracts' terms.
Foreign-denominated assets, including investment securities, and liabilities are translated into U.S. dollars at the exchange rates at period end. Purchases and sales of investment securities, income and dividends received and expenses denominated in foreign currencies are translated into U.S. dollars at the exchange rate in effect on the transaction date.
The effects of exchange rate fluctuations on investments are included with the net realized and unrealized gain (loss) on investment securities. Other foreign currency transactions resulting in realized and unrealized gain (loss) are disclosed separately.
Investment Transactions and Income. For financial reporting purposes, the Fund's investment holdings and NAV include trades executed through the end of the last business day of the period. The NAV per share for processing shareholder transactions is calculated as of the close of business of the New York Stock Exchange (NYSE), normally 4:00 p.m. Eastern time and includes trades executed through the end of the prior business day. Gains and losses on securities sold are determined on the basis of identified cost and includes proceeds received from litigation. Dividend income is recorded on the ex-dividend date, except for certain dividends from foreign securities where the ex-dividend date may have passed, which are recorded as soon as the Fund is informed of the ex-dividend date. Non-cash dividends included in dividend income, if any, are recorded at the fair market value of the securities received. Income and capital gain distributions from Fidelity Central Funds, if any, are recorded on the ex-dividend date. Investment income is recorded net of foreign taxes withheld where recovery of such taxes is uncertain.
Class Allocations and Expenses. Investment income, realized and unrealized capital gains and losses, common expenses of the Fund, and certain fund-level expense reductions, if any, are allocated daily on a pro-rata basis to each class based on the relative net assets of each class to the total net assets of the Fund. Each class differs with respect to transfer agent and distribution and service plan fees incurred. Certain expense reductions may also differ by class. For the reporting period, the allocated portion of income and expenses to each class as a percent of its average net assets may vary due to the timing of recording these transactions in relation to fluctuating net assets of the classes. Expenses directly attributable to a fund are charged to that fund. Expenses attributable to more than one fund are allocated among the respective funds on the basis of relative net assets or other appropriate methods. Expense estimates are accrued in the period to which they relate and adjustments are made when actual amounts are known.
Income Tax Information and Distributions to Shareholders. Each year, the Fund intends to qualify as a regulated investment company under Subchapter M of the Internal Revenue Code, including distributing substantially all of its taxable income and realized gains. As a result, no provision for U.S. Federal income taxes is required. As of October 31, 2017, the Fund did not have any unrecognized tax benefits in the financial statements; nor is the Fund aware of any tax positions for which it is reasonably possible that the total amounts of unrecognized tax benefits will significantly change in the next twelve months. The Fund files a U.S. federal tax return, in addition to state and local tax returns as required. The Fund's federal income tax returns are subject to examination by the Internal Revenue Service (IRS) for a period of three fiscal years after they are filed. State and local tax returns may be subject to examination for an additional fiscal year depending on the jurisdiction. Foreign taxes are provided for based on the Fund's understanding of the tax rules and rates that exist in the foreign markets in which it invests.
Distributions are declared and recorded on the ex-dividend date. Income dividends and capital gain distributions are declared separately for each class. Income and capital gain distributions are determined in accordance with income tax regulations, which may differ from GAAP.
Capital accounts within the financial statements are adjusted for permanent book-tax differences. These adjustments have no impact on net assets or the results of operations. Capital accounts are not adjusted for temporary book-tax differences which will reverse in a subsequent period.
Book-tax differences are primarily due to foreign currency transactions, passive foreign investment companies (PFIC), deferred trustees compensation, expiring capital loss carryforwards, capital loss carryforwards and losses deferred due to wash sales.
As of period end, the cost and unrealized appreciation (depreciation) in securities, and derivatives if applicable, for federal income tax purposes were as follows:
| Gross unrealized appreciation | $234,800,448 |
| Gross unrealized depreciation | (44,145,250) |
| Net unrealized appreciation (depreciation) | $190,655,198 |
| Tax Cost | $1,140,478,771 |
The tax-based components of distributable earnings as of period end were as follows:
| Undistributed ordinary income | $31,219,073 |
| Net unrealized appreciation (depreciation) on securities and other investments | $190,590,859 |
The tax character of distributions paid was as follows:
| | October 31, 2017 | October 31, 2016 |
| Ordinary Income | $15,639,334 | $ 21,866,868 |
Short-Term Trading (Redemption) Fees. Shares held by investors in the Fund less than 90 days may have been subject to a redemption fee equal to 1.00% of the NAV of shares redeemed. All redemption fees, which reduce the proceeds of the shareholder redemption, are retained by the Fund and accounted for as an addition to paid in capital. In November 2016, the Board of Trustees approved the elimination of these redemption fees effective December 12, 2016.
Restricted Securities. The Fund may invest in securities that are subject to legal or contractual restrictions on resale. These securities generally may be resold in transactions exempt from registration or to the public if the securities are registered. Disposal of these securities may involve time-consuming negotiations and expense, and prompt sale at an acceptable price may be difficult. Information regarding restricted securities is included at the end of the Fund's Schedule of Investments.
4. Purchases and Sales of Investments.
Purchases and sales of securities, other than short-term securities, aggregated $861,032,771 and $924,236,987, respectively.
5. Fees and Other Transactions with Affiliates.
Management Fee. Fidelity Management & Research Company (the investment adviser) and its affiliates provide the Fund with investment management related services for which the Fund pays a monthly management fee. The management fee is the sum of an individual fund fee rate that is based on an annual rate of .45% of the Fund's average net assets and an annualized group fee rate that averaged .25% during the period. The group fee rate is based upon the average net assets of all the mutual funds advised by the investment adviser, including any mutual funds previously advised by the investment adviser that are currently advised by Fidelity SelectCo, LLC, an affiliate of the investment adviser. The group fee rate decreases as assets under management increase and increases as assets under management decrease. In addition, the management fee is subject to a performance adjustment (up to a maximum of +/- .20% of the Fund's average net assets over a 36 month performance period). The upward or downward adjustment to the management fee is based on the relative investment performance of Europe as compared to its benchmark index, the MSCI Europe Index, over the same 36 month performance period. For the reporting period, the total annual management fee rate, including the performance adjustment, was .74% of the Fund's average net assets. The performance adjustment included in the management fee rate may be higher or lower than the maximum performance adjustment rate due to the difference between the average net assets for the reporting and performance periods.
Distribution and Service Plan Fees. In accordance with Rule 12b-1 of the 1940 Act, the Fund has adopted separate Distribution and Service Plans for each class of shares. Certain classes pay Fidelity Distributors Corporation (FDC), an affiliate of the investment adviser, separate Distribution and Service Fees, each of which is based on an annual percentage of each class' average net assets. In addition, FDC may pay financial intermediaries for selling shares of the Fund and providing shareholder support services. For the period, the Distribution and Service Fee rates, total fees and amounts retained by FDC were as follows:
| | Distribution
Fee | Service
Fee | Total Fees | Retained
by FDC |
| Class A | -% | .25% | $43,317 | $2,453 |
| Class M | .25% | .25% | 37,584 | – |
| Class C | .75% | .25% | 91,185 | 9,823 |
| | | | $172,086 | $12,276 |
Sales Load. FDC may receive a front-end sales charge of up to 5.75% for selling Class A shares and 3.50% for selling Class M shares, some of which is paid to financial intermediaries for selling shares of the Fund. Depending on the holding period, FDC may receive contingent deferred sales charges levied on Class A, Class M and Class C redemptions. The deferred sales charges are 1.00% for Class C shares, 1.00% for certain purchases of Class A shares and .25% for certain purchases of Class M shares.
For the period, sales charge amounts retained by FDC were as follows:
| | Retained
by FDC |
| Class A | $9,023 |
| Class M | 1,838 |
| Class C(a) | 454 |
| | $11,315 |
(a) When Class C shares are initially sold, FDC pays commissions from its own resources to financial intermediaries through which the sales are made.
Transfer Agent Fees. Fidelity Investments Institutional Operations Company, Inc., (FIIOC), an affiliate of the investment adviser, is the transfer, dividend disbursing and shareholder servicing agent for each class of the Fund. FIIOC receives account fees and asset-based fees that vary according to the account size and type of account of the shareholders of the respective classes of the Fund. FIIOC pays for typesetting, printing and mailing of shareholder reports, except proxy statements.
For the period, transfer agent fees for each class were as follows:
| | Amount | % of
Class-Level Average
Net Assets |
| Class A | $44,947 | .26 |
| Class M | 23,576 | .31 |
| Class C | 26,783 | .29 |
| Europe | 2,126,814 | .18 |
| Class I | 10,526 | .16 |
| | $2,232,646 | |
Accounting and Security Lending Fees. Fidelity Service Company, Inc. (FSC), an affiliate of the investment adviser, maintains the Fund's accounting records. The accounting fee is based on the level of average net assets for each month. Under a separate contract, FSC administers the security lending program. The security lending fee is based on the number and duration of lending transactions.
Interfund Lending Program. Pursuant to an Exemptive Order issued by the SEC, the Fund, along with other registered investment companies having management contracts with Fidelity Management & Research Company (FMR) or other affiliated entities of FMR, may participate in an interfund lending program. This program provides an alternative credit facility allowing the funds to borrow from, or lend money to, other participating affiliated funds. At period end, there were no interfund loans outstanding. The Fund's activity in this program during the period for which loans were outstanding was as follows:
| Borrower or Lender | Average Loan Balance | Weighted Average Interest Rate | Interest Expense |
| Borrower | $16,487,800 | .60% | $2,747 |
Interfund Trades. The Fund may purchase from or sell securities to other Fidelity Funds under procedures adopted by the Board. The procedures have been designed to ensure these interfund trades are executed in accordance with Rule 17a-7 of the 1940 Act. Interfund trades are included within the respective purchases and sales amounts shown in the Purchases and Sales of Investments note.
6. Committed Line of Credit.
The Fund participates with other funds managed by the investment adviser or an affiliate in a $4.25 billion credit facility (the "line of credit") to be utilized for temporary or emergency purposes to fund shareholder redemptions or for other short-term liquidity purposes. The Fund has agreed to pay commitment fees on its pro-rata portion of the line of credit, which amounted to $3,773 and is reflected in Miscellaneous expenses on the Statement of Operations. During the period, the Fund did not borrow on this line of credit.
7. Security Lending.
The Fund lends portfolio securities through a lending agent from time to time in order to earn additional income. For equity securities, a lending agent is used and may loan securities to certain qualified borrowers, including Fidelity Capital Markets (FCM), a broker-dealer affiliated with the Fund. On the settlement date of the loan, the Fund receives collateral (in the form of U.S. Treasury obligations, letters of credit and/or cash) against the loaned securities and maintains collateral in an amount not less than 100% of the market value of the loaned securities during the period of the loan. The market value of the loaned securities is determined at the close of business of the Fund and any additional required collateral is delivered to the Fund on the next business day. The Fund or borrower may terminate the loan at any time, and if the borrower defaults on its obligation to return the securities loaned because of insolvency or other reasons, the Fund may apply collateral received from the borrower against the obligation. The Fund may experience delays and costs in recovering the securities loaned. Any cash collateral received is invested in the Fidelity Securities Lending Cash Central Fund. The value of loaned securities and cash collateral at period end are disclosed on the Fund's Statement of Assets and Liabilities. Security lending income represents the income earned on investing cash collateral, less rebates paid to borrowers and any lending agent fees associated with the loan, plus any premium payments received for lending certain types of securities. Security lending income is presented in the Statement of Operations as a component of income from Fidelity Central Funds. Total security lending income during the period amounted to $440,682. During the period, there were no securities loaned to FCM.
8. Expense Reductions.
Commissions paid to certain brokers with whom the investment adviser, or its affiliates, places trades on behalf of the Fund include an amount in addition to trade execution, which may be rebated back to the Fund to offset certain expenses. This amount totaled $493,713 for the period.
In addition, during the period the investment adviser reimbursed and/or waived a portion of fund-level operating expenses in the amount of $9,464.
9. Distributions to Shareholders.
Distributions to shareholders of each class were as follows:
| | Year ended October 31, 2017 | Year ended October 31, 2016 |
| From net investment income | | |
| Class A | $107,755 | $174,443 |
| Class M | 18,342 | 23,347 |
| Class C | – | 38,160 |
| Europe | 11,539,715 | 15,664,870 |
| Class I | 62,056 | 80,861 |
| Total | $11,727,868 | $15,981,681 |
| From net realized gain | | |
| Class A | $60,612 | $94,260 |
| Class M | 25,396 | 39,080 |
| Class C | – | 47,778 |
| Europe | 3,806,294 | 5,676,211 |
| Class I | 19,164 | 27,858 |
| Total | $3,911,466 | $5,885,187 |
10. Share Transactions.
Share transactions for each class were as follows and may contain automatic conversions between classes or exchanges between affiliated funds:
| | Shares | Shares | Dollars | Dollars |
| | Year ended October 31, 2017 | Year ended October 31, 2016 | Year ended October 31, 2017 | Year ended October 31, 2016 |
| Class A | | | | |
| Shares sold | 183,985 | 144,459 | $7,204,193 | $5,004,460 |
| Reinvestment of distributions | 4,870 | 7,044 | 160,602 | 257,822 |
| Shares redeemed | (201,553) | (277,024) | (7,350,664) | (9,579,027) |
| Net increase (decrease) | (12,698) | (125,521) | $14,131 | $(4,316,745) |
| Class M | | | | |
| Shares sold | 58,824 | 18,157 | $2,231,944 | $629,088 |
| Reinvestment of distributions | 1,308 | 1,677 | 43,252 | 61,481 |
| Shares redeemed | (55,679) | (76,071) | (2,027,896) | (2,635,140) |
| Net increase (decrease) | 4,453 | (56,237) | $247,300 | $(1,944,571) |
| Class B | | | | |
| Shares sold | – | 183 | $– | $6,069 |
| Shares redeemed | – | (14,607) | – | (499,471) |
| Net increase (decrease) | – | (14,424) | $– | $(493,402) |
| Class C | | | | |
| Shares sold | 65,577 | 64,049 | $2,522,918 | $2,232,592 |
| Reinvestment of distributions | – | 2,232 | – | 81,438 |
| Shares redeemed | (77,588) | (102,859) | (2,798,078) | (3,518,604) |
| Net increase (decrease) | (12,011) | (36,578) | $(275,160) | $(1,204,574) |
| Europe | | | | |
| Shares sold | 6,873,387 | 2,489,815 | $263,271,628 | $86,835,858 |
| Reinvestment of distributions | 443,969 | 559,844 | 14,619,907 | 20,484,708 |
| Shares redeemed | (6,861,890) | (9,143,028) | (254,648,472) | (318,516,566) |
| Net increase (decrease) | 455,466 | (6,093,369) | $23,243,063 | $(211,196,000) |
| Class I | | | | |
| Shares sold | 152,572 | 73,750 | $5,796,106 | $2,648,638 |
| Reinvestment of distributions | 2,369 | 2,803 | 78,022 | 102,586 |
| Shares redeemed | (111,570) | (96,879) | (4,088,518) | (3,369,656) |
| Net increase (decrease) | 43,371 | (20,326) | $1,785,610 | $(618,432) |
11. Other.
The Fund's organizational documents provide former and current trustees and officers with a limited indemnification against liabilities arising in connection with the performance of their duties to the Fund. In the normal course of business, the Fund may also enter into contracts that provide general indemnifications. The Fund's maximum exposure under these arrangements is unknown as this would be dependent on future claims that may be made against the Fund. The risk of material loss from such claims is considered remote.
Report of Independent Registered Public Accounting Firm
To the Trustees of Fidelity Investment Trust and Shareholders of Fidelity Europe Fund:
In our opinion, the accompanying statement of assets and liabilities, including the schedule of investments, and the related statements of operations and of changes in net assets and the financial highlights present fairly, in all material respects, the financial position of Fidelity Europe Fund (a fund of Fidelity Investment Trust) as of October 31, 2017, the results of its operations for the year then ended, the changes in its net assets for each of the two years in the period then ended and the financial highlights for each of the five years in the period then ended, in conformity with accounting principles generally accepted in the United States of America. These financial statements and financial highlights (hereafter referred to as “financial statements”) are the responsibility of the Fidelity Europe Fund’s management. Our responsibility is to express an opinion on these financial statements based on our audits. We conducted our audits of these financial statements in accordance with the standards of the Public Company Accounting Oversight Board (United States). Those standards require that we plan and perform the audit to obtain reasonable assurance about whether the financial statements are free of material misstatement. An audit includes examining, on a test basis, evidence supporting the amounts and disclosures in the financial statements, assessing the accounting principles used and significant estimates made by management, and evaluating the overall financial statement presentation. Our procedures included confirmation of securities owned as of October 31, 2017 by correspondence with the custodians and brokers; when replies were not received from brokers, we performed other auditing procedures. We believe that our audits provide a reasonable basis for our opinion.
PricewaterhouseCoopers LLP
Boston, Massachusetts
December 18, 2017
Trustees and Officers
The Trustees, Members of the Advisory Board (if any), and officers of the trusts and fund, as applicable, are listed below. The Board of Trustees governs the fund and is responsible for protecting the interests of shareholders. The Trustees are experienced executives who meet periodically throughout the year to oversee the fund's activities, review contractual arrangements with companies that provide services to the fund, oversee management of the risks associated with such activities and contractual arrangements, and review the fund's performance. Except for Jonathan Chiel, each of the Trustees oversees 190 funds. Mr. Chiel oversees 143 funds.
The Trustees hold office without limit in time except that (a) any Trustee may resign; (b) any Trustee may be removed by written instrument, signed by at least two-thirds of the number of Trustees prior to such removal; (c) any Trustee who requests to be retired or who has become incapacitated by illness or injury may be retired by written instrument signed by a majority of the other Trustees; and (d) any Trustee may be removed at any special meeting of shareholders by a two-thirds vote of the outstanding voting securities of the trust. Each Trustee who is not an interested person (as defined in the 1940 Act) of the trust and the fund is referred to herein as an Independent Trustee. Each Independent Trustee shall retire not later than the last day of the calendar year in which his or her 75th birthday occurs. The Independent Trustees may waive this mandatory retirement age policy with respect to individual Trustees. Officers and Advisory Board Members hold office without limit in time, except that any officer or Advisory Board Member may resign or may be removed by a vote of a majority of the Trustees at any regular meeting or any special meeting of the Trustees. Except as indicated, each individual has held the office shown or other offices in the same company for the past five years.
The fund’s Statement of Additional Information (SAI) includes more information about the Trustees. To request a free copy, call Fidelity at 1-877-208-0098.
Experience, Skills, Attributes, and Qualifications of the Trustees. The Governance and Nominating Committee has adopted a statement of policy that describes the experience, qualifications, attributes, and skills that are necessary and desirable for potential Independent Trustee candidates (Statement of Policy). The Board believes that each Trustee satisfied at the time he or she was initially elected or appointed a Trustee, and continues to satisfy, the standards contemplated by the Statement of Policy. The Governance and Nominating Committee also engages professional search firms to help identify potential Independent Trustee candidates who have the experience, qualifications, attributes, and skills consistent with the Statement of Policy. From time to time, additional criteria based on the composition and skills of the current Independent Trustees, as well as experience or skills that may be appropriate in light of future changes to board composition, business conditions, and regulatory or other developments, have also been considered by the professional search firms and the Governance and Nominating Committee. In addition, the Board takes into account the Trustees' commitment and participation in Board and committee meetings, as well as their leadership of standing and ad hoc committees throughout their tenure.
In determining that a particular Trustee was and continues to be qualified to serve as a Trustee, the Board has considered a variety of criteria, none of which, in isolation, was controlling. The Board believes that, collectively, the Trustees have balanced and diverse experience, qualifications, attributes, and skills, which allow the Board to operate effectively in governing the fund and protecting the interests of shareholders. Information about the specific experience, skills, attributes, and qualifications of each Trustee, which in each case led to the Board's conclusion that the Trustee should serve (or continue to serve) as a trustee of the fund, is provided below.
Board Structure and Oversight Function. James C. Curvey is an interested person and currently serves as Chairman. The Trustees have determined that an interested Chairman is appropriate and benefits shareholders because an interested Chairman has a personal and professional stake in the quality and continuity of services provided to the fund. Independent Trustees exercise their informed business judgment to appoint an individual of their choosing to serve as Chairman, regardless of whether the Trustee happens to be independent or a member of management. The Independent Trustees have determined that they can act independently and effectively without having an Independent Trustee serve as Chairman and that a key structural component for assuring that they are in a position to do so is for the Independent Trustees to constitute a substantial majority for the Board. The Independent Trustees also regularly meet in executive session. Ned C. Lautenbach serves as Chairman of the Independent Trustees and as such (i) acts as a liaison between the Independent Trustees and management with respect to matters important to the Independent Trustees and (ii) with management prepares agendas for Board meetings.
Fidelity® funds are overseen by different Boards of Trustees. The fund's Board oversees Fidelity's high income and certain equity funds, and other Boards oversee Fidelity's investment-grade bond, money market, asset allocation, and sector funds. The asset allocation funds may invest in Fidelity® funds overseen by the fund's Board. The use of separate Boards, each with its own committee structure, allows the Trustees of each group of Fidelity® funds to focus on the unique issues of the funds they oversee, including common research, investment, and operational issues. On occasion, the separate Boards establish joint committees to address issues of overlapping consequences for the Fidelity® funds overseen by each Board.
The Trustees operate using a system of committees to facilitate the timely and efficient consideration of all matters of importance to the Trustees, the fund, and fund shareholders and to facilitate compliance with legal and regulatory requirements and oversight of the fund's activities and associated risks. The Board, acting through its committees, has charged FMR and its affiliates with (i) identifying events or circumstances the occurrence of which could have demonstrably adverse effects on the fund's business and/or reputation; (ii) implementing processes and controls to lessen the possibility that such events or circumstances occur or to mitigate the effects of such events or circumstances if they do occur; and (iii) creating and maintaining a system designed to evaluate continuously business and market conditions in order to facilitate the identification and implementation processes described in (i) and (ii) above. Because the day-to-day operations and activities of the fund are carried out by or through FMR, its affiliates, and other service providers, the fund's exposure to risks is mitigated but not eliminated by the processes overseen by the Trustees. While each of the Board's committees has responsibility for overseeing different aspects of the fund's activities, oversight is exercised primarily through the Operations, Audit, and Compliance Committees. In addition, the Independent Trustees have worked with FMR to enhance the Board's oversight of investment and financial risks, legal and regulatory risks, technology risks, and operational risks, including the development of additional risk reporting to the Board. For example, a working group comprised of Independent Trustees and FMR has worked and continues to work to review the Fidelity® funds' valuation-related activities, reporting and risk management. Appropriate personnel, including but not limited to the fund's Chief Compliance Officer (CCO), FMR's internal auditor, the independent accountants, the fund's Treasurer and portfolio management personnel, make periodic reports to the Board's committees, as appropriate, including an annual review of Fidelity's risk management program for the Fidelity® funds. The responsibilities of each standing committee, including their oversight responsibilities, are described further under "Standing Committees of the Trustees."
Interested Trustees*:
Correspondence intended for a Trustee who is an interested person may be sent to Fidelity Investments, 245 Summer Street, Boston, Massachusetts 02210.
Name, Year of Birth; Principal Occupations and Other Relevant Experience+
Jonathan Chiel (1957)
Year of Election or Appointment: 2016
Trustee
Mr. Chiel also serves as Trustee of other Fidelity® funds. Mr. Chiel is Executive Vice President and General Counsel for FMR LLC (diversified financial services company, 2012-present). Previously, Mr. Chiel served as general counsel (2004-2012) and senior vice president and deputy general counsel (2000-2004) for John Hancock Financial Services; a partner with Choate, Hall & Stewart (1996-2000) (law firm); and an Assistant United States Attorney for the United States Attorney’s Office of the District of Massachusetts (1986-95), including Chief of the Criminal Division (1993-1995). Mr. Chiel is a director on the boards of the Boston Bar Foundation and the Maimonides School.
James C. Curvey (1935)
Year of Election or Appointment: 2007
Trustee
Chairman of the Board of Trustees
Mr. Curvey also serves as Trustee of other Fidelity® funds. Mr. Curvey is a Director of Fidelity Research & Analysis Co. (investment adviser firm, 2009-present), and Vice Chairman (2007-present) and Director of FMR LLC (diversified financial services company). In addition, Mr. Curvey serves as an Overseer for the Boston Symphony Orchestra and a member of the board of Artis-Naples, Naples, Florida, and as a Trustee for Brewster Academy, Wolfeboro, New Hampshire. Previously, Mr. Curvey served as a Director of Fidelity Investments Money Management, Inc. (investment adviser firm, 2009-2014) and a Director of FMR and FMR Co., Inc. (investment adviser firms, 2007-2014).
Charles S. Morrison (1960)
Year of Election or Appointment: 2014
Trustee
Mr. Morrison also serves as Trustee of other funds. He serves as President of Fidelity Management & Research Company (FMR) (investment adviser firm, 2016-present), a Director of Fidelity Investments Money Management, Inc. (FIMM) (investment adviser firm, 2014-present), Director of Fidelity SelectCo, LLC (investment adviser firm, 2014-present), President, Asset Management (2014-present), and is an employee of Fidelity Investments. Previously, Mr. Morrison served as Vice President of Fidelity's Fixed Income and Asset Allocation Funds (2012-2014), President, Fixed Income (2011-2014), Vice President of Fidelity's Money Market Funds (2005-2009), President, Money Market Group Leader of FMR (investment adviser firm, 2009), and Senior Vice President, Money Market Group of FMR (2004-2009). Mr. Morrison also served as Vice President of Fidelity's Bond Funds (2002-2005), certain Balanced Funds (2002-2005), and certain Asset Allocation Funds (2002-2007), and as Senior Vice President (2002-2005) of Fidelity's Bond Division.
* Determined to be an “Interested Trustee” by virtue of, among other things, his or her affiliation with the trust or various entities under common control with FMR.
+ The information includes the Trustee's principal occupation during the last five years and other information relating to the experience, attributes, and skills relevant to the Trustee's qualifications to serve as a Trustee, which led to the conclusion that the Trustee should serve as a Trustee for the fund.
Independent Trustees:
Correspondence intended for an Independent Trustee may be sent to Fidelity Investments, P.O. Box 55235, Boston, Massachusetts 02205-5235.
Name, Year of Birth; Principal Occupations and Other Relevant Experience+
Dennis J. Dirks (1948)
Year of Election or Appointment: 2005
Trustee
Mr. Dirks also serves as Trustee of other Fidelity® funds. Prior to his retirement in May 2003, Mr. Dirks was Chief Operating Officer and a member of the Board of The Depository Trust & Clearing Corporation (DTCC). He also served as President, Chief Operating Officer, and Board member of The Depository Trust Company (DTC) and President and Board member of the National Securities Clearing Corporation (NSCC). In addition, Mr. Dirks served as Chief Executive Officer and Board member of the Government Securities Clearing Corporation, Chief Executive Officer and Board member of the Mortgage-Backed Securities Clearing Corporation, as a Trustee and a member of the Finance Committee of Manhattan College (2005-2008), as a Trustee and a member of the Finance Committee of AHRC of Nassau County (2006-2008), as a member of the Independent Directors Council (IDC) Governing Council (2010-2015), and as a member of the Board of Directors for The Brookville Center for Children’s Services, Inc. (2009-2017). Mr. Dirks is a member of the Finance Committee (2016-present) and Board of Directors (2017-present) of the Asolo Repertory Theatre.
Alan J. Lacy (1953)
Year of Election or Appointment: 2008
Trustee
Mr. Lacy also serves as Trustee of other Fidelity® funds. Mr. Lacy serves as a Director of Bristol-Myers Squibb Company (global pharmaceuticals, 2008-present). He is a Trustee of the California Chapter of The Nature Conservancy (2015-present) and a Director of the Center for Advanced Study in the Behavioral Sciences at Stanford University (2015-present). In addition, Mr. Lacy served as Senior Adviser (2007-2014) of Oak Hill Capital Partners, L.P. (private equity) and also served as Chief Executive Officer (2005) and Vice Chairman (2005-2006) of Sears Holdings Corporation (retail) and Chief Executive Officer and Chairman of the Board of Sears, Roebuck and Co. (retail, 2000-2005). Previously, Mr. Lacy served as Chairman (2014-2017) and a member (2010-2017) of the Board of Directors of Dave & Buster’s Entertainment, Inc. (restaurant and entertainment complexes), as Chairman (2008-2011) and a member (2006-2015) of the Board of Trustees of the National Parks Conservation Association, and as a member of the Board of Directors for The Hillman Companies, Inc. (hardware wholesalers, 2010-2014), Earth Fare, Inc. (retail grocery, 2010-2014), and The Western Union Company (global money transfer, 2006-2011).
Ned C. Lautenbach (1944)
Year of Election or Appointment: 2000
Trustee
Chairman of the Independent Trustees
Mr. Lautenbach also serves as Trustee of other Fidelity® funds. Mr. Lautenbach currently serves as Vice Chair of the Board of Governors, State University System of Florida (2013-present) and is a member of the Council on Foreign Relations (1994-present). He is also a member and has most recently served as Chairman of the Board of Directors of Artis-Naples (2012-present). Previously, Mr. Lautenbach served as a member and then Lead Director of the Board of Directors of Eaton Corporation (diversified industrial, 1997-2016). He was also a Partner and Advisory Partner at Clayton, Dubilier & Rice, LLC (private equity investment, 1998-2010), as well as a Director of Sony Corporation (2006-2007). In addition, Mr. Lautenbach also had a 30-year career with IBM (technology company) during which time he served as Senior Vice President and a member of the Corporate Executive Committee (1968-1998).
Joseph Mauriello (1944)
Year of Election or Appointment: 2008
Trustee
Mr. Mauriello also serves as Trustee of other Fidelity® funds. Prior to his retirement in January 2006, Mr. Mauriello served in numerous senior management positions including Deputy Chairman and Chief Operating Officer (2004-2005), and Vice Chairman of Financial Services (2002-2004) of KPMG LLP US (professional services, 1965-2005). Mr. Mauriello currently serves as a member of the Board of Directors of XL Group plc. (global insurance and re-insurance, 2006-present) and the Independent Directors Council (IDC) Governing Council (2015-present). Previously, Mr. Mauriello served as a Director of the Hamilton Funds of the Bank of New York (2006-2007) and of Arcadia Resources Inc. (health care services and products, 2007-2012).
Cornelia M. Small (1944)
Year of Election or Appointment: 2005
Trustee
Ms. Small also serves as Trustee of other Fidelity® funds. Ms. Small is a member of the Board of Directors (2009-present) and Chair of the Investment Committee (2010-present) of the Teagle Foundation. Ms. Small also serves on the Investment Committee of the Berkshire Taconic Community Foundation (2008-present). Previously, Ms. Small served as Chairperson (2002-2008) and a member of the Investment Committee and Chairperson (2008-2012) and a member of the Board of Trustees of Smith College. In addition, Ms. Small served as Chief Investment Officer, Director of Global Equity Investments, and a member of the Board of Directors of Scudder, Stevens & Clark and Scudder Kemper Investments.
William S. Stavropoulos (1939)
Year of Election or Appointment: 2001
Trustee
Vice Chairman of the Independent Trustees
Mr. Stavropoulos also serves as Trustee of other Fidelity® funds. Mr. Stavropoulos serves as President and Founder of the Michigan Baseball Foundation, the Great Lakes Loons (2007-present). Mr. Stavropoulos is Chairman Emeritus of the Board of Directors of The Dow Chemical Company, where he previously served in numerous senior management positions, including President, CEO (1995-2000; 2002-2004), Chairman of the Executive Committee (2000-2006), and as a member of the Board of Directors (1990-2006). Currently, Mr. Stavropoulos is Chairman of the Board of Directors of Univar Inc. (global distributor of commodity and specialty chemicals), a Director of Teradata Corporation (data warehousing and technology solutions), and a member of the Advisory Board for Metalmark Capital LLC (private equity investment, 2005-present). Mr. Stavropoulos is an operating advisor to Clayton, Dubilier & Rice, LLC (private equity investment). In addition, Mr. Stavropoulos is a member of the University of Notre Dame Advisory Council for the College of Science, a Trustee of the Rollin L. Gerstacker Foundation, and a Director of Artis-Naples in Naples, Florida. Previously, Mr. Stavropoulos served as a Director of Chemical Financial Corporation (bank holding company, 1993-2012) and Tyco International, Ltd. (multinational manufacturing and services, 2007-2012).
David M. Thomas (1949)
Year of Election or Appointment: 2008
Trustee
Mr. Thomas also serves as Trustee of other Fidelity® funds. Mr. Thomas serves as Non-Executive Chairman of the Board of Directors of Fortune Brands Home and Security (home and security products, 2011-present), as a member of the Board of Directors (2004-present) and Presiding Director (2013-present) of Interpublic Group of Companies, Inc. (marketing communication), and as a member of the Board of Trustees of the University of Florida (2013-present). Previously, Mr. Thomas served as Executive Chairman (2005-2006) and Chairman and Chief Executive Officer (2000-2005) of IMS Health, Inc. (pharmaceutical and healthcare information solutions), and a Director of Fortune Brands, Inc. (consumer products, 2000-2011).
+ The information includes the Trustee's principal occupation during the last five years and other information relating to the experience, attributes, and skills relevant to the Trustee's qualifications to serve as a Trustee, which led to the conclusion that the Trustee should serve as a Trustee for the fund.
Advisory Board Members and Officers:
Correspondence intended for an officer or Peter S. Lynch may be sent to Fidelity Investments, 245 Summer Street, Boston, Massachusetts 02210. Officers appear below in alphabetical order.
Name, Year of Birth; Principal Occupation
Peter S. Lynch (1944)
Year of Election or Appointment: 2003
Member of the Advisory Board
Mr. Lynch also serves as Member of the Advisory Board of other Fidelity® funds. Mr. Lynch is Vice Chairman and a Director of FMR (investment adviser firm) and FMR Co., Inc. (investment adviser firm). In addition, Mr. Lynch serves as a Trustee of Boston College and as the Chairman of the Inner-City Scholarship Fund. Previously, Mr. Lynch served on the Special Olympics International Board of Directors (1997-2006).
Elizabeth Paige Baumann (1968)
Year of Election or Appointment: 2017
Anti-Money Laundering (AML) Officer
Ms. Baumann also serves as AML Officer of other funds. She is Chief AML Officer (2012-present) and Senior Vice President (2014-present) of FMR LLC (diversified financial services company) and is an employee of Fidelity Investments. Previously, Ms. Baumann served as AML Officer of the funds (2012-2016), and Vice President (2007-2014) and Deputy Anti-Money Laundering Officer (2007-2012) of FMR LLC.
Marc R. Bryant (1966)
Year of Election or Appointment: 2015
Secretary and Chief Legal Officer (CLO)
Mr. Bryant also serves as Secretary and CLO of other funds. Mr. Bryant serves as CLO, Secretary, and Senior Vice President of Fidelity Management & Research Company (investment adviser firm, 2015-present) and FMR Co., Inc. (investment adviser firm, 2015-present); Secretary of Fidelity SelectCo, LLC (investment adviser firm, 2015-present) and Fidelity Investments Money Management, Inc. (investment adviser firm, 2015-present); and CLO of Fidelity Management & Research (Hong Kong) Limited and FMR Investment Management (UK) Limited (investment adviser firms, 2015-present) and Fidelity Management & Research (Japan) Limited (investment adviser firm, 2016-present). He is Senior Vice President and Deputy General Counsel of FMR LLC (diversified financial services company). Previously, Mr. Bryant served as Secretary and CLO of Fidelity Rutland Square Trust II (2010-2014) and Assistant Secretary of Fidelity's Fixed Income and Asset Allocation Funds (2013-2015). Prior to joining Fidelity Investments, Mr. Bryant served as a Senior Vice President and the Head of Global Retail Legal for AllianceBernstein L.P. (2006-2010), and as the General Counsel for ProFund Advisors LLC (2001-2006).
William C. Coffey (1969)
Year of Election or Appointment: 2009
Assistant Secretary
Mr. Coffey also serves as Assistant Secretary of other funds. He is Senior Vice President and Deputy General Counsel of FMR LLC (diversified financial services company, 2010-present), and is an employee of Fidelity Investments. Previously, Mr. Coffey served as Vice President and Associate General Counsel of FMR LLC (2005-2009).
Jonathan Davis (1968)
Year of Election or Appointment: 2010
Assistant Treasurer
Mr. Davis also serves as Assistant Treasurer of other funds, and is an employee of Fidelity Investments. Previously, Mr. Davis served as Vice President and Associate General Counsel of FMR LLC (diversified financial services company, 2003-2010).
Adrien E. Deberghes (1967)
Year of Election or Appointment: 2016
Assistant Treasurer
Mr. Deberghes also serves as an officer of other funds. He serves as Executive Vice President of Fidelity Investments Money Management, Inc. (FIMM) (investment adviser firm, 2016-present) and is an employee of Fidelity Investments (2008-present). Prior to joining Fidelity Investments, Mr. Deberghes was Senior Vice President of Mutual Fund Administration at State Street Corporation (2007-2008), Senior Director of Mutual Fund Administration at Investors Bank & Trust (2005-2007), and Director of Finance for Dunkin' Brands (2000-2005). Previously, Mr. Deberghes served in other fund officer roles.
Joseph DeSantis (1959)
Year of Election or Appointment: 2017
Vice President
Mr. DeSantis also serves as Vice President of other funds. Mr. DeSantis serves as a Director of Fidelity Management & Research (Japan) Limited (investment adviser firm, 2016-present), Chief Investment Officer, Equities (2010-present) and is an employee of Fidelity Investments.
Stephanie J. Dorsey (1969)
Year of Election or Appointment: 2010
Assistant Treasurer
Ms. Dorsey also serves as an officer of other funds. She is an employee of Fidelity Investments (2008-present) and has served in other fund officer roles. Prior to joining Fidelity Investments, Ms. Dorsey served as Treasurer (2004-2008) of the JPMorgan Mutual Funds and Vice President (2004-2008) of JPMorgan Chase Bank.
Howard J. Galligan III (1966)
Year of Election or Appointment: 2014
Chief Financial Officer
Mr. Galligan also serves as Chief Financial Officer of other funds. Mr. Galligan serves as President of Fidelity Pricing and Cash Management Services (FPCMS) (2014-present) and as a Director of Strategic Advisers, Inc. (investment adviser firm, 2008-present). Previously, Mr. Galligan served as Chief Administrative Officer of Asset Management (2011-2014) and Chief Operating Officer and Senior Vice President of Investment Support for Strategic Advisers, Inc. (2003-2011).
Brian B. Hogan (1964)
Year of Election or Appointment: 2009
Vice President
Mr. Hogan also serves as Trustee or Vice President of other funds. Mr. Hogan serves as a Director of FMR Investment Management (UK) Limited (investment adviser firm, 2015-present) and Fidelity SelectCo, LLC (investment adviser firm, 2014-present) and President of the Equity Division of FMR (investment adviser firm, 2009-present). Previously, Mr. Hogan served as Senior Vice President, Equity Research of FMR (2006-2009) and as a portfolio manager. Mr. Brian B. Hogan is not related to Mr. Colm A. Hogan.
Colm A. Hogan (1973)
Year of Election or Appointment: 2016
Deputy Treasurer
Mr. Hogan also serves as an officer of other funds. Mr. Hogan is an employee of Fidelity Investments (2005-present). Mr. Colm A. Hogan is not related to Mr. Brian B. Hogan.
Chris Maher (1972)
Year of Election or Appointment: 2013
Assistant Treasurer
Mr. Maher serves as Assistant Treasurer of other funds. Mr. Maher is Vice President of Valuation Oversight and is an employee of Fidelity Investments. Previously, Mr. Maher served as Vice President of Asset Management Compliance (2013), Vice President of the Program Management Group of FMR (investment adviser firm, 2010-2013), and Vice President of Valuation Oversight (2008-2010).
Rieco E. Mello (1969)
Year of Election or Appointment: 2017
Assistant Treasurer
Mr. Mello also serves as Assistant Treasurer of other funds. Mr. Mello is an employee of Fidelity Investments (1995-present).
Kenneth B. Robins (1969)
Year of Election or Appointment: 2016
Chief Compliance Officer
Mr. Robins also serves as an officer of other funds. Mr. Robins serves as Compliance Officer of Fidelity Management & Research Company and FMR Co., Inc. (investment adviser firms, 2016-present) and is an employee of Fidelity Investments (2004-present). Previously, Mr. Robins served as Executive Vice President of Fidelity Investments Money Management, Inc. (investment adviser firm, 2013-2016) and served in other fund officer roles.
Stacie M. Smith (1974)
Year of Election or Appointment: 2016
President and Treasurer
Ms. Smith also serves as an officer of other funds. She is an employee of Fidelity Investments (2009-present) and has served in other fund officer roles. Prior to joining Fidelity Investments, Ms. Smith served as Senior Audit Manager of Ernst & Young LLP (accounting firm, 1996-2009). Previously, Ms. Smith served as Deputy Treasurer of certain Fidelity® funds (2013-2016).
Marc L. Spector (1972)
Year of Election or Appointment: 2016
Assistant Treasurer
Mr. Spector also serves as an officer of other funds. Mr. Spector is an employee of Fidelity Investments (2016-present). Prior to joining Fidelity Investments, Mr. Spector served as Director at the Siegfried Group (accounting firm, 2013-2016), and prior to Siegfried Group as audit senior manager at Deloitte & Touche (accounting firm, 2005-2013).
Renee Stagnone (1975)
Year of Election or Appointment: 2016
Assistant Treasurer
Ms. Stagnone also serves as an officer of other funds. Ms. Stagnone is an employee of Fidelity Investments (1997-present). Previously, Ms. Stagnone served as Deputy Treasurer of certain Fidelity® funds (2013-2016).
Shareholder Expense Example
As a shareholder of the Fund, you incur two types of costs: (1) transaction costs, including sales charges (loads) on purchase payments or redemption proceeds, redemption fees and (2) ongoing costs, including management fees, distribution and/or service (12b-1) fees and other Fund expenses. This Example is intended to help you understand your ongoing costs (in dollars) of investing in the Fund and to compare these costs with the ongoing costs of investing in other mutual funds.
The Example is based on an investment of $1,000 invested at the beginning of the period and held for the entire period (May 1, 2017 to October 31, 2017).
Actual Expenses
The first line of the accompanying table for each class of the Fund provides information about actual account values and actual expenses. You may use the information in this line, together with the amount you invested, to estimate the expenses that you paid over the period. Simply divide your account value by $1,000.00 (for example, an $8,600 account value divided by $1,000.00 = 8.6), then multiply the result by the number in the first line for a class of the Fund under the heading entitled "Expenses Paid During Period" to estimate the expenses you paid on your account during this period. A small balance maintenance fee of $12.00 that is charged once a year may apply for certain accounts with a value of less than $2,000. This fee is not included in the table below. If it was, the estimate of expenses you paid during the period would be higher, and your ending account value lower, by this amount. In addition, the Fund, as a shareholder in the underlying Fidelity Central Funds, will indirectly bear its pro-rata share of the fees and expenses incurred by the underlying Fidelity Central Funds. These fees and expenses are not included in the Fund's annualized expense ratio used to calculate the expense estimate in the table below.
Hypothetical Example for Comparison Purposes
The second line of the accompanying table for each class of the Fund provides information about hypothetical account values and hypothetical expenses based on a Class' actual expense ratio and an assumed rate of return of 5% per year before expenses, which is not the Class' actual return. The hypothetical account values and expenses may not be used to estimate the actual ending account balance or expenses you paid for the period. You may use this information to compare the ongoing costs of investing in the Fund and other funds. To do so, compare this 5% hypothetical example with the 5% hypothetical examples that appear in the shareholder reports of the other funds. A small balance maintenance fee of $12.00 that is charged once a year may apply for certain accounts with a value of less than $2,000. This fee is not included in the table below. If it was, the estimate of expenses you paid during the period would be higher, and your ending account value lower, by this amount. In addition, the Fund, as a shareholder in the underlying Fidelity Central Funds, will indirectly bear its pro-rata share of the fees and expenses incurred by the underlying Fidelity Central Funds. These fees and expenses are not included in the Fund's annualized expense ratio used to calculate the expense estimate in the table below.
Please note that the expenses shown in the table are meant to highlight your ongoing costs only and do not reflect any transaction costs. Therefore, the second line of the table is useful in comparing ongoing costs only, and will not help you determine the relative total costs of owning different funds. In addition, if these transactional costs were included, your costs would have been higher.
| | Annualized Expense Ratio-A | Beginning
Account Value
May 1, 2017 | Ending
Account Value
October 31, 2017 | Expenses Paid
During Period-B
May 1, 2017
to October 31, 2017 |
| Class A | 1.34% | | | |
| Actual | | $1,000.00 | $1,122.10 | $7.17 |
| Hypothetical-C | | $1,000.00 | $1,018.45 | $6.82 |
| Class M | 1.66% | | | |
| Actual | | $1,000.00 | $1,120.30 | $8.87 |
| Hypothetical-C | | $1,000.00 | $1,016.84 | $8.44 |
| Class C | 2.13% | | | |
| Actual | | $1,000.00 | $1,117.70 | $11.37 |
| Hypothetical-C | | $1,000.00 | $1,014.47 | $10.82 |
| Europe | 1.02% | | | |
| Actual | | $1,000.00 | $1,123.90 | $5.46 |
| Hypothetical-C | | $1,000.00 | $1,020.06 | $5.19 |
| Class I | 1.00% | | | |
| Actual | | $1,000.00 | $1,123.90 | $5.35 |
| Hypothetical-C | | $1,000.00 | $1,020.16 | $5.09 |
A Annualized expense ratio reflects expenses net of applicable fee waivers.
B Expenses are equal to each Class' annualized expense ratio, multiplied by the average account value over the period, multiplied by 184/365 (to reflect the one-half year period).
C 5% return per year before expenses
Distributions (Unaudited)
The Board of Trustees of Fidelity Europe Fund voted to pay to shareholders of record at the opening of business on record date, the following distributions per share derived from capital gains realized from sales of portfolio securities and dividends derived from net investment income:
| | Pay Date | Record Date | Dividends | Capital Gains |
| Fidelity Europe Fund | | | | |
| Class A | 12/18/17 | 12/15/17 | $0.329 | $0.657 |
| Class M | 12/18/17 | 12/15/17 | $0.227 | $0.657 |
| Class C | 12/18/17 | 12/15/17 | $0.099 | $0.657 |
| Europe | 12/18/17 | 12/15/17 | $0.410 | $0.657 |
| Class I | 12/18/17 | 12/15/17 | $0.433 | $0.657 |
|
Class A, Class M, Class C, Europe, and Class I designates 100% of dividends distributed during the fiscal year as amounts which may be taken into account as a dividend for purposes of the maximum rate under section 1(h)(11) of the Internal Revenue Code.
The amounts per share which represent income derived from sources within, and taxes paid to, foreign countries or possessions of the United States are as follows:
| | Pay Date | Income | Taxes |
| Fidelity Europe Fund | | | |
| Class A | 12/19/16 | $0.3993 | $0.0493 |
| Class M | 12/19/16 | $0.2663 | $0.0493 |
| Europe | 12/19/16 | $0.5573 | $0.0493 |
| Class I | 12/19/16 | $0.5833 | $0.0493 |
|
The fund will notify shareholders in January 2018 of amounts for use in preparing 2017 income tax returns.
Board Approval of Investment Advisory Contracts and Management Fees
Fidelity Europe Fund
Each year, the Board of Trustees, including the Independent Trustees (together, the Board), votes on the renewal of the management contract with Fidelity Management & Research Company (FMR) and the sub-advisory agreements (together, the Advisory Contracts) for the fund. FMR and the sub-advisers are referred to herein as the Investment Advisers. The Board, assisted by the advice of fund counsel and Independent Trustees' counsel, requests and considers a broad range of information relevant to the renewal of the Advisory Contracts throughout the year.
The Board meets regularly and, at each of its meetings, covers an extensive agenda of topics and materials and considers factors that are relevant to its annual consideration of the renewal of the fund's Advisory Contracts, including the services and support provided to the fund and its shareholders. The Board has established various standing committees (Committees), each composed of and chaired by Independent Trustees with varying backgrounds, to which the Board has assigned specific subject matter responsibilities in order to enhance effective decision-making by the Board. The Board, acting directly and through its Committees, requests and receives information concerning the annual consideration of the renewal of the fund's Advisory Contracts. The Board also meets as needed to review matters specifically related to the Board's annual consideration of the renewal of the Advisory Contracts. Members of the Board may also meet with trustees of other Fidelity funds through ad hoc joint committees to discuss certain matters relevant to all of the Fidelity funds.
At its July 2017 meeting, the Board unanimously determined to renew the fund's Advisory Contracts. In reaching its determination, the Board considered all factors it believed relevant, including (i) the nature, extent, and quality of the services to be provided to the fund and its shareholders (including the investment performance of the fund); (ii) the competitiveness of the fund's management fee and total expense ratio relative to peer funds; (iii) the total costs of the services to be provided by and the profits to be realized by Fidelity from its relationships with the fund; and (iv) the extent to which, if any, economies of scale exist and would be realized as the fund grows, and whether any economies of scale are appropriately shared with fund shareholders.
In considering whether to renew the Advisory Contracts for the fund, the Board reached a determination, with the assistance of fund counsel and Independent Trustees' counsel and through the exercise of its business judgment, that the renewal of the Advisory Contracts was in the best interests of the fund and its shareholders and that the compensation payable under the Advisory Contracts was fair and reasonable. The Board's decision to renew the Advisory Contracts was not based on any single factor, but rather was based on a comprehensive consideration of all the information provided to the Board at its meetings throughout the year. The Board, in reaching its determination to renew the Advisory Contracts, was aware that shareholders of the fund have a broad range of investment choices available to them, including a wide choice among funds offered by Fidelity's competitors, and that the fund's shareholders, who have the opportunity to review and weigh the disclosure provided by the fund in its prospectus and other public disclosures, have chosen to invest in this fund, which is part of the Fidelity family of funds.
Amendment to Group Fee Rate. The Board also approved an amendment to the management contract for the fund to add an additional breakpoint to the group fee schedule, effective October 1, 2017. The Board noted that the additional breakpoint would result in lower management fee rates as Fidelity's assets under management increase.
Nature, Extent, and Quality of Services Provided. The Board considered Fidelity's staffing as it relates to the fund, including the backgrounds of investment personnel of Fidelity, and also considered the fund's investment objective, strategies, and related investment philosophy. The Independent Trustees also had discussions with senior management of Fidelity's investment operations and investment groups. The Board considered the structure of the investment personnel compensation program and whether this structure provides appropriate incentives to act in the best interests of the fund. Additionally, the Board considered the portfolio managers' investments, if any, in the funds that they manage.
Resources Dedicated to Investment Management and Support Services. The Board and the Fund Oversight and Research Committees reviewed the general qualifications and capabilities of Fidelity's investment staff, including its size, education, experience, and resources, as well as Fidelity's approach to recruiting, training, managing, and compensating investment personnel. The Board noted that Fidelity has continued to increase the resources devoted to non-U.S. offices, including expansion of Fidelity's global investment organization. The Board also noted that Fidelity's analysts have extensive resources, tools and capabilities that allow them to conduct sophisticated quantitative and fundamental analysis, as well as credit analysis of issuers, counterparties and guarantors. Further, the Board considered that Fidelity's investment professionals have sufficient access to global information and data so as to provide competitive investment results over time, and that those professionals also have access to sophisticated tools that permit them to assess portfolio construction and risk and performance attribution characteristics continuously, as well as to transmit new information and research conclusions rapidly around the world. Additionally, in its deliberations, the Board considered Fidelity's trading, risk management, compliance, and technology and operations capabilities and resources, which are integral parts of the investment management process.
Shareholder and Administrative Services. The Board considered (i) the nature, extent, quality, and cost of advisory, administrative, and shareholder services performed by the Investment Advisers and their affiliates under the Advisory Contracts and under separate agreements covering transfer agency, pricing and bookkeeping, and securities lending services for the fund; (ii) the nature and extent of the supervision of third party service providers, principally custodians, subcustodians, and pricing vendors; and (iii) the resources devoted to, and the record of compliance with, the fund's compliance policies and procedures. The Board also reviewed the allocation of fund brokerage, including allocations to brokers affiliated with the Investment Advisers, the use of brokerage commissions to pay fund expenses, and the use of "soft" commission dollars to pay for research services.
The Board noted that the growth of fund assets over time across the complex allows Fidelity to reinvest in the development of services designed to enhance the value or convenience of the Fidelity funds as investment vehicles. These services include 24-hour access to account information and market information through telephone representatives and over the Internet, investor education materials and asset allocation tools, and the expanded availability of Fidelity Investor Centers.
In 2014, the Board formed an ad hoc Committee on Transfer Agency Fees to review the variety of transfer agency fee structures throughout the industry and Fidelity's competitive positioning with respect to industry participants.
Investment in a Large Fund Family. The Board considered the benefits to shareholders of investing in a Fidelity fund, including the benefits of investing in a fund that is part of a large family of funds offering a variety of investment disciplines and providing a large variety of mutual fund investor services. The Board noted that Fidelity had taken, or had made recommendations that resulted in the Fidelity funds taking, a number of actions over the previous year that benefited particular funds, including: (i) continuing to dedicate additional resources to Fidelity's investment research process, and to the support of the senior management team that oversees asset management; (ii) continuing efforts to enhance Fidelity's global research capabilities; (iii) launching new funds and making other enhancements to meet client needs; (iv) launching new share classes of existing funds; (v) eliminating purchase minimums and broadening eligibility requirements for certain lower-priced share classes; (vi) reducing management fees and total expenses for certain growth equity funds and index funds; (vii) lowering expense caps for certain existing funds and classes to reduce expenses borne by shareholders; (viii) eliminating short-term redemption fees for certain funds; (ix) introducing a new pricing structure for certain funds of funds that is expected to reduce overall expenses paid by shareholders; (x) rationalizing product lines and gaining increased efficiencies through proposals for fund mergers and share class consolidations; (xi) continuing to develop, acquire and implement systems and technology to improve services to the funds and shareholders, strengthen information security, and increase efficiency; and (xii) implementing enhancements to further strengthen Fidelity's product line to increase investors' probability of success in achieving their investment goals, including retirement income goals.
Investment Performance. The Board considered whether the fund has operated in accordance with its investment objective, as well as its record of compliance with its investment restrictions and its performance history. The Board noted that there were portfolio management changes for the fund in December 2013 and September 2014.
The Board took into account discussions with representatives of the Investment Advisers about fund investment performance that occur at Board meetings throughout the year. In this regard the Board noted that as part of regularly scheduled fund reviews and other reports to the Board on fund performance, the Board considers annualized return information for the fund for different time periods, measured against a securities market index ("benchmark index") and a peer group of funds with similar objectives ("peer group"), if any. In its evaluation of fund investment performance, the Board gave particular attention to information indicating changes in performance of certain Fidelity funds for specific time periods and discussed with the Investment Advisers the reasons for any overperformance or underperformance.
In addition to reviewing absolute and relative fund performance, the Independent Trustees periodically consider the appropriateness of fund performance metrics in evaluating the results achieved. In general, the Independent Trustees believe that fund performance should be evaluated based on net performance (after fees and expenses) of both the highest performing and lowest performing fund share classes, where applicable, compared to appropriate benchmark indices, over appropriate time periods that may include full market cycles, and compared to peer groups, as applicable, over the same periods, taking into account relevant factors including the following: general market conditions; issuer-specific information; and fund cash flows and other factors.
The Independent Trustees recognize that shareholders evaluate performance on a net basis over their own holding periods, for which one-, three-, and five-year periods are often used as a proxy. For this reason, the performance information reviewed by the Board also included net cumulative calendar year total return information for the fund and an appropriate benchmark index and peer group for the most recentone-, three-, and five-year periods, as shown below. Returns are shown compared to the 25th percentile (top of box, 75% beaten) and 75th percentile (bottom of box, 25% beaten) of the peer universe. Returns of the benchmark index are "net MA,"
i.e., adjusted for tax withholding rates applicable to U.S.-based funds organized as Massachusetts business trusts.
Fidelity Europe Fund
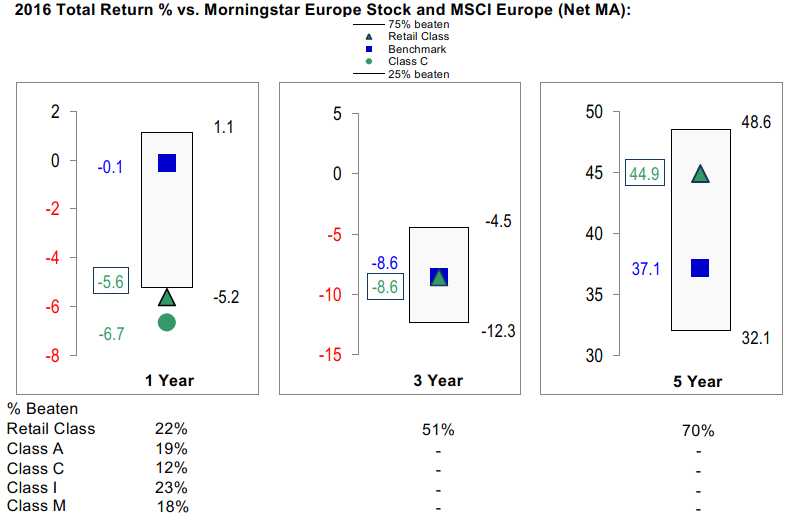
The Board also considered that the fund's management fee is subject to upward or downward adjustment depending upon whether, and to what extent, the fund's investment performance for the performance period (a rolling 36-month period) exceeds, or is exceeded by, a securities index, thus leading to a performance adjustment for the same period. The Board noted that the performance adjustment provides FMR with a strong economic incentive to seek to achieve superior long-term performance for the fund's shareholders and helps to more closely align the interests of FMR and the shareholders of the fund.
Based on its review, the Board concluded that the nature, extent, and quality of services provided to the fund under the Advisory Contracts should continue to benefit the shareholders of the fund.
Competitiveness of Management Fee and Total Expense Ratio. The Board considered the fund's management fee and total expense ratio compared to "mapped groups" of competitive funds and classes created for the purpose of facilitating the Trustees' competitive analysis of management fees and total expenses. Fidelity creates "mapped groups" by combining similar Lipper investment objective categories that have comparable investment mandates. Combining Lipper investment objective categories aids the Board's management fee and total expense ratio comparisons by broadening the competitive group used for comparison.
Management Fee. The Board considered two proprietary management fee comparisons for the 12-month periods shown in basis points (BP) in the chart below. The group of Lipper funds used by the Board for management fee comparisons is referred to below as the "Total Mapped Group." The Total Mapped Group comparison focuses on a fund's standing in terms of gross management fees before expense reimbursements or caps, and without giving effect to the fund's performance adjustment, relative to the total universe of funds with comparable investment mandates, regardless of whether their management fee structures also are comparable. Funds with comparable investment mandates offer exposure to similar types of securities. Funds with comparable management fee structures have similar management fee contractual arrangements (
e.g., flat rate charged for advisory services, all-inclusive fee rate,
etc.). "TMG %" represents the percentage of funds in the Total Mapped Group that had management fees that were lower than the fund's. For example, a hypothetical TMG % of 20% would mean that 80% of the funds in the Total Mapped Group had higher, and 20% had lower, management fees than the fund. The fund's actual TMG %s and the number of funds in the Total Mapped Group are in the chart below. The "Asset-Size Peer Group" (ASPG) comparison focuses on a fund's standing relative to a subset of non-Fidelity funds within the Total Mapped Group that are similar in size and management fee structure without taking into account performance adjustments, if any. For example, if a fund is in the first quartile of the ASPG, the fund's management fee ranks in the least expensive or lowest 25% of funds in the ASPG. The ASPG represents at least 15% of the funds in the Total Mapped Group with comparable asset size and management fee structures, subject to a minimum of 50 funds (or all funds in the Total Mapped Group if fewer than 50). Additional information, such as the ASPG quartile in which the fund's management fee rate ranked and the impact of the fund's performance adjustment, is also included in the chart and considered by the Board.
Fidelity Europe Fund

The Board noted that the fund's management fee rate ranked below the median of its Total Mapped Group and below the median of its ASPG for 2016. The Board also noted the effect of the fund's performance adjustment, if any, on the fund's management fee ranking.
The Board noted that, in 2014, the Board and the boards of other Fidelity funds formed the ad hoc Committee on Group Fee to conduct an in-depth review of the "group fee" component of the management fee of funds with such management fee structures. The Committee's focus included the mechanics of the group fee, the competitive landscape of group fee structures, Fidelity funds with no group fee component and investment products not included in group fee assets. The Board also considered that, for funds subject to the group fee, FMR agreed to voluntarily waive fees over a specified period of time in amounts designed to account for assets converted from certain funds to certain collective investment trusts.
The Board also noted that, in 2013, the ad hoc Committee on Management Fees was formed to conduct an in-depth review of the management fee rates of Fidelity's active equity mutual funds. The Committee focused on the following areas: (i) standard fee structures; (ii) research consumption and trading evolution; (iii) management fee competitiveness/profitability by category; and (iv) factors that drive institutional pricing.
Based on its review, the Board concluded that the fund's management fee is fair and reasonable in light of the services that the fund receives and the other factors considered.
Total Expense Ratio. In its review of each class's total expense ratio, the Board considered the fund's management fee rate as well as other fund or class expenses, as applicable, such as transfer agent fees, pricing and bookkeeping fees, fund-paid 12b-1 fees, and custodial, legal, and audit fees. The Board noted the impact of the fund's performance adjustment. The Board also noted that Fidelity may agree to waive fees and expenses from time to time, and the extent to which, if any, it has done so for the fund. As part of its review, the Board also considered the current and historical total expense ratios of each class of the fund compared to competitive fund median expenses. Each class of the fund is compared to those funds and classes in the Total Mapped Group (used by the Board for management fee comparisons) that have a similar sales load structure.
The Board noted that the total expense ratio of the retail class ranked below the competitive median for 2016 and the total expense ratio of each of Class A, Class M (formerly Class T), Class C, and Class I ranked above the competitive median for 2016. The Board considered that, in general, various factors can affect total expense ratios. The Board noted that the total expense ratio of each of Class A, Class M, Class C, and Class I was above the competitive median because of a positive performance fee adjustment in 2016 and relatively higher other expenses due to low asset levels. The Board noted that the total expense ratio of Class M was also above the competitive median because of higher 12b-1 fees on Class M as compared to most competitor funds. Class M has a higher 12b-1 fee, but a lower front-end sales charge, than traditionally priced front-end sales charge classes. The Board considered that Class M is primarily sold load-waived in the retirement plan market where its 0.50% 12b-1 fee is comparable to competing no-load, higher 12b-1 fee classes designed specifically for retirement plans. The Board noted that the total expense ratio of Class C was also above the competitive median because of its 12b-1 fees. The Board also noted that, although Class I is categorized by Lipper as an institutional class, Class I has a significantly lower investment minimum than most other funds and classes categorized as institutional. As a result, FMR believes Class I is generally more comparable to retail funds and classes. The Board noted that the fund offers multiple classes, each of which has a different sales load and 12b-1 fee structure, and that the multiple structures are intended to offer a range of pricing options for the intermediary market. The Board also noted that the total expense ratios of the classes vary primarily by the level of their 12b-1 fees, although differences in transfer agent fees may also cause expenses to vary from class to class.
Fees Charged to Other Fidelity Clients. The Board also considered Fidelity fee structures and other information with respect to clients of Fidelity, such as other funds advised or subadvised by Fidelity, pension plan clients, and other institutional clients with similar mandates. The Board noted that an ad hoc joint committee created by it and the boards of other Fidelity funds periodically (most recently in 2013) reviews and compares Fidelity's institutional investment advisory business with its business of providing services to the Fidelity funds, including the differences in services provided, fees charged, and costs incurred, as well as competition in their respective marketplaces.
Based on its review of total expense ratios and fees charged to other Fidelity clients, the Board concluded that, although some classes were above the median of the universe presented for comparison, the total expense ratio of each class of the fund was reasonable in light of the services that the fund and its shareholders receive and the other factors considered.
Costs of the Services and Profitability. The Board considered the revenues earned and the expenses incurred by Fidelity in conducting the business of developing, marketing, distributing, managing, administering and servicing the fund and servicing the fund's shareholders. The Board also considered the level of Fidelity's profits in respect of all the Fidelity funds.
On an annual basis, Fidelity presents to the Board information about the profitability of its relationships with the fund. Fidelity calculates profitability information for each fund, as well as aggregate profitability information for groups of Fidelity funds and all Fidelity funds, using a series of detailed revenue and cost allocation methodologies which originate with the books and records of Fidelity on which Fidelity's audited financial statements are based. The Audit Committee of the Board reviews any significant changes from the prior year's methodologies.
PricewaterhouseCoopers LLP (PwC), independent registered public accounting firm and auditor to Fidelity and certain Fidelity funds, has been engaged annually by the Board as part of the Board's assessment of Fidelity's profitability analysis. PwC's engagement includes the review and assessment of the methodologies used by Fidelity in determining the revenues and expenses attributable to Fidelity's mutual fund business, and completion of agreed-upon procedures in respect of the mathematical accuracy of the fund profitability information and its conformity to established allocation methodologies. After considering PwC's reports issued under the engagement and information provided by Fidelity, the Board concluded that while other allocation methods may also be reasonable, Fidelity's profitability methodologies are reasonable in all material respects.
The Board also reviewed Fidelity's non-fund businesses and potential fall-out benefits related to the mutual fund business as well as cases where Fidelity's affiliates may benefit from or be related to the fund's business.
The Board considered the costs of the services provided by and the profits realized by Fidelity in connection with the operation of the fund and was satisfied that the profitability was not excessive.
Economies of Scale. The Board considered whether there have been economies of scale in respect of the management of the Fidelity funds, whether the Fidelity funds (including the fund) have appropriately benefited from any such economies of scale, and whether there is potential for realization of any further economies of scale. The Board considered the extent to which the fund will benefit from economies of scale as assets grow through increased services to the fund, through waivers or reimbursements, or through fee or expense ratio reductions. The Board also noted that a committee (the Economies of Scale Committee) created by it and the boards of other Fidelity funds periodically (most recently in 2013) analyzes whether Fidelity attains economies of scale in respect of the management and servicing of the Fidelity funds, whether the Fidelity funds have appropriately benefited from such economies of scale, and whether there is potential for realization of any further economies of scale.
The Board recognized that the fund's management contract incorporates a "group fee" structure, which provides for lower group fee rates as total group assets increase, and for higher group fee rates as total group assets decrease (with "group assets" defined to include fund assets under FMR's management plus the assets of sector funds previously under FMR's management). FMR calculates the group fee rates based on a tiered asset "breakpoint" schedule that varies based on asset class. The Board considered that the group fee is designed to deliver the benefits of economies of scale to fund shareholders when total Fidelity fund assets increase, even if assets of any particular fund are unchanged or have declined, because some portion of Fidelity's costs are attributable to services provided to all Fidelity funds, and all funds benefit if those costs can be allocated among more assets. The Board concluded that, given the group fee structure, fund shareholders will benefit from lower management fees as group assets increase at the fund complex level, regardless of whether Fidelity achieves any such economies of scale.
The Board concluded, taking into account the analysis of the Economies of Scale Committee, that economies of scale, if any, are being appropriately shared between fund shareholders and Fidelity.
Additional Information Requested by the Board. In order to develop fully the factual basis for consideration of the Fidelity funds' advisory contracts, the Board requested and received additional information on certain topics, including: (i) fund performance trends, in particular the underperformance of certain funds, and Fidelity's long-term strategies for certain funds; (ii) Fidelity's fund profitability methodology, profitability trends for certain funds, and the impact of certain factors on fund profitability results, including the impact of market trends on actively managed funds; (iii) the use of performance fees and the calculation of performance adjustments, including the impact of underperformance and fund outflows on performance adjustments; (iv) metrics for evaluating index fund performance; (v) Fidelity's group fee structure, including the group fee breakpoint schedules; (vi) the terms of Fidelity's contractual and voluntary expense cap arrangements with the funds; (vii) the methodology with respect to evaluating competitive fund data and peer group classifications and fee comparisons; (viii) the expense structures for different funds and classes; (ix) Fidelity's arrangements with affiliated sub-advisers on behalf of the funds; (x) information regarding other accounts managed by Fidelity, including institutional accounts and collective investment trusts; (xi) recent changes to the fee structure for certain funds of funds; and (xii) the impact of the Department of Labor's new fiduciary rule on the funds' comparative expense information.
Based on its evaluation of all of the conclusions noted above, and after considering all factors it believed relevant, the Board concluded that the advisory fee structures are fair and reasonable, and that the fund's Advisory Contracts should be renewed.
AEUF-ANN-1217
1.9585993.103
Fidelity Advisor® Japan Fund - Class A, Class M (formerly Class T), Class C and Class I
Annual Report October 31, 2017 Class A, Class M, Class C and Class I are classes of Fidelity® Japan Fund |
|
Contents
To view a fund's proxy voting guidelines and proxy voting record for the 12-month period ended June 30, visit http://www.fidelity.com/proxyvotingresults or visit the Securities and Exchange Commission's (SEC) web site at http://www.sec.gov.
You may also call 1-877-208-0098 to request a free copy of the proxy voting guidelines.
Standard & Poor's, S&P and S&P 500 are registered service marks of The McGraw-Hill Companies, Inc. and have been licensed for use by Fidelity Distributors Corporation.
Other third-party marks appearing herein are the property of their respective owners.
All other marks appearing herein are registered or unregistered trademarks or service marks of FMR LLC or an affiliated company. © 2017 FMR LLC. All rights reserved.
This report and the financial statements contained herein are submitted for the general information of the shareholders of the Fund. This report is not authorized for distribution to prospective investors in the Fund unless preceded or accompanied by an effective prospectus.
A fund files its complete schedule of portfolio holdings with the SEC for the first and third quarters of each fiscal year on Form N-Q. Forms N-Q are available on the SEC’s web site at http://www.sec.gov. A fund's Forms N-Q may be reviewed and copied at the SEC’s Public Reference Room in Washington, DC. Information regarding the operation of the SEC's Public Reference Room may be obtained by calling 1-800-SEC-0330.
For a complete list of a fund's portfolio holdings, view the most recent holdings listing, semiannual report, or annual report on Fidelity's web site at http://www.fidelity.com, http://www.institutional.fidelity.com, or http://www.401k.com, as applicable.
NOT FDIC INSURED •MAY LOSE VALUE •NO BANK GUARANTEE
Neither the Fund nor Fidelity Distributors Corporation is a bank.
Performance: The Bottom Line
Average annual total return reflects the change in the value of an investment, assuming reinvestment of distributions from dividend income and capital gains (the profits earned upon the sale of securities that have grown in value, if any) and assuming a constant rate of performance each year. The hypothetical investment and the average annual total returns do not reflect the deduction of taxes that a shareholder would pay on fund distributions or the redemption of fund shares. During periods of reimbursement by Fidelity, a fund’s total return will be greater than it would be had the reimbursement not occurred. How a fund did yesterday is no guarantee of how it will do tomorrow.
Average Annual Total Returns
| For the periods ended October 31, 2017 | Past 1 year | Past 5 years | Past 10 years |
| Class A (incl. 5.75% sales charge) | 13.76% | 9.80% | 0.43% |
| Class M (incl. 3.50% sales charge) | 16.03% | 9.94% | 0.45% |
| Class C (incl. contingent deferred sales charge) | 18.94% | 10.31% | 0.54% |
| Class I | 21.22% | 11.48% | 1.28% |
Class A shares bear a 0.25% 12b-1 fee. The initial offering of Class A shares took place on December 14, 2010. Returns prior to December 14, 2010, are those of Fidelity® Japan Fund, the original class of the fund, which has no 12b-1 fee. Had Class A's 12b-1 fee been reflected, returns prior to December 14, 2010, would have been lower.
Class M shares bear a 0.50% 12b-1 fee. The initial offering of Class M shares took place on December 14, 2010. Returns prior to December 14, 2010, are those of Fidelity® Japan Fund, the original class of the fund, which has no 12b-1 fee. Had Class M's 12b-1 fee been reflected, returns prior to December 14, 2010, would have been lower.
Class C shares bear a 1.00% 12b-1 fee. The initial offering of Class C shares took place on December 14, 2010. Returns prior to December 14, 2010, are those of Fidelity® Japan Fund, the original class of the fund, which has no 12b-1 fee. Had Class C's 12b-1 fee been reflected, returns prior to December 14, 2010, would have been lower.
Class C shares' contingent deferred sales charges included in the past one year, past five years and past ten years total return figures are 1%, 0% and 0%, respectively.
The initial offering of Class I shares took place on December 14, 2010. Returns prior to December 14, 2010 are those of Fidelity® Japan Fund, the original class of the fund.
$10,000 Over 10 Years
Let's say hypothetically that $10,000 was invested in Fidelity Advisor® Japan Fund - Class A on October 31, 2007, and the current 5.75% sales charge was paid.
The chart shows how the value of your investment would have changed, and also shows how the Tokyo Stock Price Index (TOPIX) performed over the same period.
See above for additional information regarding the performance of Class A.
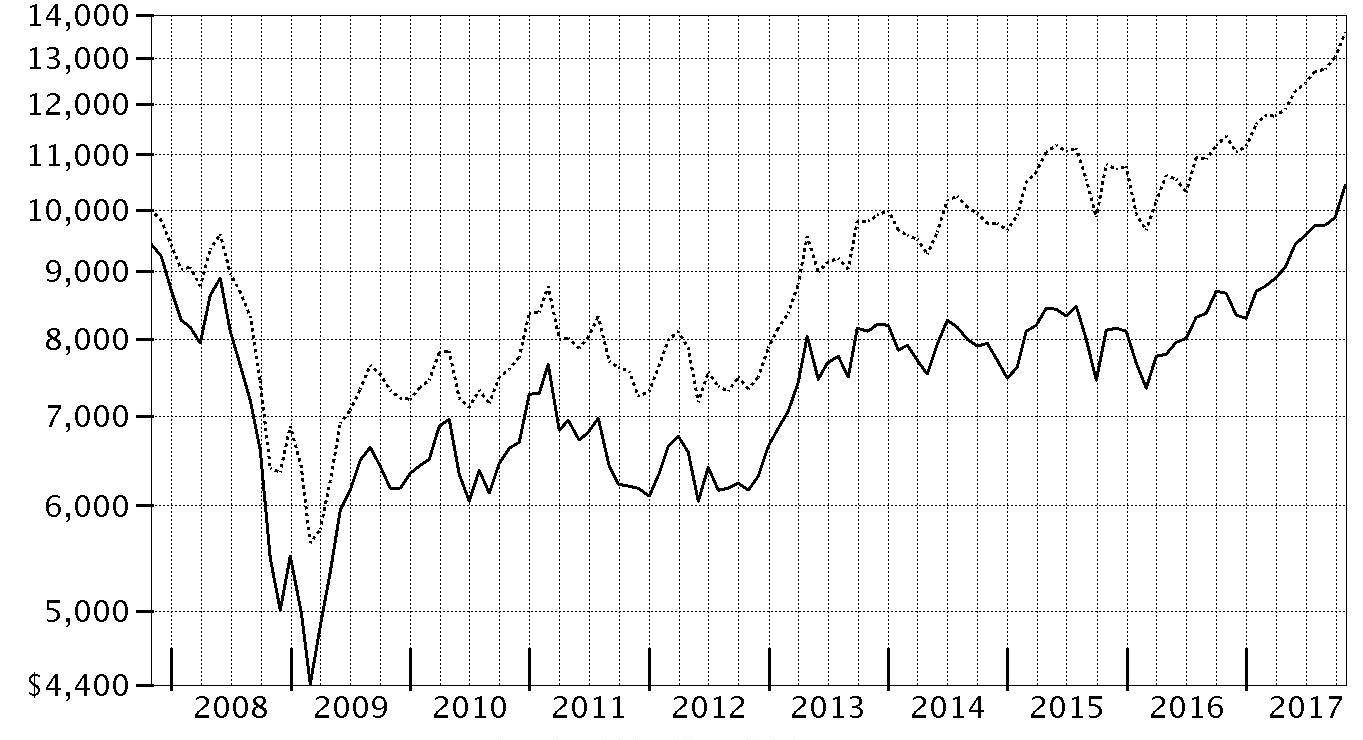
| Period Ending Values |
| $10,441 | Fidelity Advisor® Japan Fund - Class A |
| $13,585 | Tokyo Stock Price Index (TOPIX) |
Management's Discussion of Fund Performance
Market Recap: The MSCI ACWI (All Country World Index) ex USA Index returned 23.85% for the 12 months ending October 31, 2017, helped partly by a generally weak U.S. dollar. Some favorable election results in continental Europe (+30%) suggested ebbing political uncertainty and near-term risk there, but the U.K. (+20%) faced more-mixed conditions ahead of its expected exit from the European Union. Despite central-bank easing – and pressured recently by yen strength – Japan (+18%) lagged the rest of the Asia-Pacific group (+22%). Commodity-price volatility slowed Canada (+17%), but the emerging-markets group (+26%) sped ahead. Sector-wise, information technology (+47%) was driven by a surge among several Chinese internet-related names. Financials (+27%) rode rising interest rates that, at the same time, weighed on real estate (+17%), utilities (+16%), consumer staples (+14%) and telecommunication services (+9%) – so-called “bond proxy” sectors. Materials (+28%) and industrials (+27%) responded to demand from China and price gains for certain commodities. In the energy sector (+20%), oil prices lost ground in the spring before rebounding through October 31 to end well above where they started 12 months ago. Lastly, health care (+14%) was hurt by early-period turmoil around drug pricing and health care legislation.
Comments from Portfolio Manager Kirk Neureiter: For the fiscal year, the fund’s share classes (excluding sales charges, if applicable) gained roughly 20% to 21%, topping the 19.70% advance of the benchmark Tokyo Stock Price Index. Versus the benchmark, stock selection in the industrials and consumer discretionary sectors particularly aided the fund, along with positioning in real estate. The top relative contributor was Sumco, a manufacturer of silicon wafers for the semiconductor and solar photovoltaic-cell industries. Demand from both traditional sources such as computer manufacturing and newer applications drove expanding wafer demand and firmer pricing. Other notable relative contributors included automaker Suzuki Motor, Shimadzu, which manufactures measuring equipment of various kinds, and SMC, a leading global manufacturer of pneumatic equipment. The fund's results also reflect a positive fair-value adjustment of 1.33 percentage points. Turning to detractors, stock picking in information technology, materials and consumer staples weighed on relative performance. At the stock level, a sizable overweighting in telephone-service provider KDDI was our biggest detractor. This stock, which is considered somewhat defensive, struggled this period, as investors generally preferred more-aggressive investments. Lastly, price-comparison website Kakaku disappointed.
The views expressed above reflect those of the portfolio manager(s) only through the end of the period as stated on the cover of this report and do not necessarily represent the views of Fidelity or any other person in the Fidelity organization. Any such views are subject to change at any time based upon market or other conditions and Fidelity disclaims any responsibility to update such views. These views may not be relied on as investment advice and, because investment decisions for a Fidelity fund are based on numerous factors, may not be relied on as an indication of trading intent on behalf of any Fidelity fund.
Investment Summary (Unaudited)
Geographic Diversification (% of fund's net assets)
| As of October 31, 2017 |
| | Japan | 98.2% |
| | United States of America* | 1.1% |
| | Hong Kong | 0.7% |

* Includes Short-Term investments and Net Other Assets (Liabilities).
Percentages are based on country or territory of incorporation and are adjusted for the effect of futures contracts, if applicable.
| As of April 30, 2017 |
| | Japan | 97.8% |
| | Hong Kong | 1.0% |
| | Cayman Islands | 0.7% |
| | United States of America* | 0.5% |

* Includes Short-Term investments and Net Other Assets (Liabilities).
Percentages are based on country or territory of incorporation and are adjusted for the effect of futures contracts, if applicable.
Asset Allocation as of October 31, 2017
| | % of fund's net assets | % of fund's net assets 6 months ago |
| Stocks | 98.9 | 99.5 |
| Short-Term Investments and Net Other Assets (Liabilities) | 1.1 | 0.5 |
Top Ten Stocks as of October 31, 2017
| | % of fund's net assets | % of fund's net assets 6 months ago |
| SoftBank Corp. (Wireless Telecommunication Services) | 5.1 | 4.4 |
| Sony Corp. (Household Durables) | 4.1 | 3.7 |
| Mitsubishi UFJ Financial Group, Inc. (Banks) | 3.8 | 3.9 |
| Hoya Corp. (Health Care Equipment & Supplies) | 3.5 | 3.6 |
| ORIX Corp. (Diversified Financial Services) | 3.4 | 3.4 |
| KDDI Corp. (Wireless Telecommunication Services) | 3.2 | 3.7 |
| Shimadzu Corp. (Electronic Equipment & Components) | 2.7 | 2.5 |
| East Japan Railway Co. (Road & Rail) | 2.7 | 2.7 |
| Nidec Corp. (Electrical Equipment) | 2.5 | 2.0 |
| Suzuki Motor Corp. (Automobiles) | 2.5 | 2.2 |
| | 33.5 | |
Top Market Sectors as of October 31, 2017
| | % of fund's net assets | % of fund's net assets 6 months ago |
| Consumer Discretionary | 19.2 | 19.9 |
| Industrials | 18.2 | 17.0 |
| Information Technology | 14.9 | 14.6 |
| Financials | 11.3 | 12.7 |
| Consumer Staples | 8.8 | 10.0 |
| Health Care | 8.7 | 9.6 |
| Materials | 8.5 | 7.6 |
| Telecommunication Services | 8.3 | 8.1 |
| Real Estate | 0.7 | 0.0 |
| Multi Sector | 0.3 | 0.0 |
Percentages shown as 0.0% may reflect amounts less than 0.05%.
Investments October 31, 2017
Showing Percentage of Net Assets
| Common Stocks - 98.9% | | | |
| | | Shares | Value |
| CONSUMER DISCRETIONARY - 19.2% | | | |
| Auto Components - 2.8% | | | |
| Bridgestone Corp. | | 143,900 | $6,874,160 |
| DaikyoNishikawa Corp. | | 109,000 | 1,852,296 |
| Sumitomo Electric Industries Ltd. | | 249,000 | 4,239,311 |
| | | | 12,965,767 |
| Automobiles - 5.5% | | | |
| Honda Motor Co. Ltd. | | 278,800 | 8,736,777 |
| Subaru Corp. | | 145,900 | 5,040,715 |
| Suzuki Motor Corp. | | 206,500 | 11,310,680 |
| | | | 25,088,172 |
| Household Durables - 7.9% | | | |
| Panasonic Corp. | | 399,400 | 6,030,686 |
| Rinnai Corp. | | 38,600 | 3,307,341 |
| Sekisui Chemical Co. Ltd. | | 123,500 | 2,492,763 |
| Sekisui House Ltd. | | 121,100 | 2,264,385 |
| Sony Corp. | | 445,200 | 18,624,805 |
| Techtronic Industries Co. Ltd. | | 543,500 | 3,187,264 |
| | | | 35,907,244 |
| Internet & Direct Marketing Retail - 0.3% | | | |
| Start Today Co. Ltd. | | 55,600 | 1,522,864 |
| Media - 1.5% | | | |
| Dentsu, Inc. | | 89,500 | 3,828,270 |
| LIFULL Co. Ltd. | | 388,900 | 2,988,468 |
| | | | 6,816,738 |
| Specialty Retail - 1.2% | | | |
| Nitori Holdings Co. Ltd. | | 18,600 | 2,703,163 |
| USS Co. Ltd. | | 147,400 | 2,979,663 |
| | | | 5,682,826 |
|
| TOTAL CONSUMER DISCRETIONARY | | | 87,983,611 |
|
| CONSUMER STAPLES - 8.8% | | | |
| Food & Staples Retailing - 5.2% | | | |
| Ain Holdings, Inc. | | 39,300 | 2,688,689 |
| San-A Co. Ltd. | | 49,600 | 2,282,505 |
| Seven & i Holdings Co. Ltd. | | 192,700 | 7,766,672 |
| Sundrug Co. Ltd. | | 91,200 | 3,968,889 |
| Tsuruha Holdings, Inc. | | 22,800 | 2,826,804 |
| Welcia Holdings Co. Ltd. | | 112,300 | 4,262,034 |
| | | | 23,795,593 |
| Food Products - 0.9% | | | |
| Japan Meat Co. Ltd. | | 92,700 | 1,482,799 |
| Morinaga & Co. Ltd. | | 46,300 | 2,630,293 |
| | | | 4,113,092 |
| Personal Products - 1.9% | | | |
| Kao Corp. | | 85,500 | 5,167,205 |
| Kose Corp. | | 29,700 | 3,611,901 |
| | | | 8,779,106 |
| Tobacco - 0.8% | | | |
| Japan Tobacco, Inc. | | 106,100 | 3,511,931 |
|
| TOTAL CONSUMER STAPLES | | | 40,199,722 |
|
| FINANCIALS - 11.3% | | | |
| Banks - 4.7% | | | |
| Mitsubishi UFJ Financial Group, Inc. | | 2,551,400 | 17,306,515 |
| Shinsei Bank Ltd. | | 245,900 | 4,149,752 |
| | | | 21,456,267 |
| Consumer Finance - 0.7% | | | |
| AEON Financial Service Co. Ltd. | | 149,300 | 3,206,439 |
| Diversified Financial Services - 3.4% | | | |
| ORIX Corp. | | 912,300 | 15,685,734 |
| Insurance - 2.5% | | | |
| Sony Financial Holdings, Inc. | | 201,600 | 3,349,278 |
| Tokio Marine Holdings, Inc. | | 187,900 | 8,099,848 |
| | | | 11,449,126 |
|
| TOTAL FINANCIALS | | | 51,797,566 |
|
| HEALTH CARE - 8.7% | | | |
| Biotechnology - 0.6% | | | |
| PeptiDream, Inc. (a)(b) | | 88,600 | 2,811,604 |
| Health Care Equipment & Supplies - 6.7% | | | |
| Hoya Corp. | | 291,000 | 15,810,246 |
| Nakanishi, Inc. | | 26,500 | 1,200,971 |
| Olympus Corp. | | 259,300 | 9,649,765 |
| Paramount Bed Holdings Co. Ltd. | | 88,800 | 3,916,005 |
| | | | 30,576,987 |
| Health Care Providers & Services - 0.9% | | | |
| Ship Healthcare Holdings, Inc. | | 140,300 | 4,387,447 |
| Pharmaceuticals - 0.5% | | | |
| Astellas Pharma, Inc. | | 167,600 | 2,230,564 |
|
| TOTAL HEALTH CARE | | | 40,006,602 |
|
| INDUSTRIALS - 18.2% | | | |
| Building Products - 2.6% | | | |
| Daikin Industries Ltd. | | 64,500 | 7,127,951 |
| Toto Ltd. | | 102,200 | 5,005,150 |
| | | | 12,133,101 |
| Commercial Services & Supplies - 1.1% | | | |
| Sohgo Security Services Co., Ltd. | | 102,100 | 4,918,966 |
| Construction & Engineering - 1.0% | | | |
| Toshiba Plant Systems & Services Corp. | | 252,800 | 4,360,646 |
| Electrical Equipment - 4.0% | | | |
| Mitsubishi Electric Corp. | | 406,200 | 6,951,506 |
| Nidec Corp. | | 85,400 | 11,356,741 |
| | | | 18,308,247 |
| Machinery - 3.2% | | | |
| Komatsu Ltd. | | 78,800 | 2,574,851 |
| Minebea Mitsumi, Inc. | | 245,400 | 4,498,947 |
| SMC Corp. | | 20,400 | 7,804,233 |
| | | | 14,878,031 |
| Professional Services - 1.4% | | | |
| Benefit One, Inc. | | 158,600 | 3,046,928 |
| Outsourcing, Inc. (b) | | 244,000 | 3,363,800 |
| | | | 6,410,728 |
| Road & Rail - 2.7% | | | |
| East Japan Railway Co. | | 127,300 | 12,345,505 |
| Trading Companies & Distributors - 2.2% | | | |
| Misumi Group, Inc. | | 276,800 | 7,583,642 |
| Trusco Nakayama Corp. | | 92,600 | 2,369,186 |
| | | | 9,952,828 |
|
| TOTAL INDUSTRIALS | | | 83,308,052 |
|
| INFORMATION TECHNOLOGY - 14.9% | | | |
| Electronic Equipment & Components - 7.4% | | | |
| Anritsu Corp. | | 132,600 | 1,248,575 |
| Azbil Corp. | | 96,400 | 4,209,478 |
| Iriso Electronics Co. Ltd. | | 36,200 | 2,041,761 |
| Murata Manufacturing Co. Ltd. | | 26,500 | 4,164,793 |
| Shimadzu Corp. | | 602,000 | 12,516,854 |
| TDK Corp. | | 55,400 | 4,256,899 |
| Topcon Corp. | | 248,400 | 5,252,063 |
| | | | 33,690,423 |
| Internet Software & Services - 3.1% | | | |
| DeNA Co. Ltd. | | 143,800 | 3,381,795 |
| Kakaku.com, Inc. | | 344,900 | 4,735,831 |
| SMS Co., Ltd. | | 83,700 | 2,521,415 |
| Yahoo! Japan Corp. | | 742,400 | 3,319,166 |
| | | | 13,958,207 |
| IT Services - 1.2% | | | |
| Fujitsu Ltd. | | 316,000 | 2,462,429 |
| IT Holdings Corp. | | 44,200 | 1,375,492 |
| Otsuka Corp. | | 25,900 | 1,765,564 |
| | | | 5,603,485 |
| Semiconductors & Semiconductor Equipment - 1.7% | | | |
| Renesas Electronics Corp. (a) | | 167,600 | 2,166,916 |
| Sumco Corp. | | 258,900 | 5,702,678 |
| | | | 7,869,594 |
| Software - 1.5% | | | |
| Nintendo Co. Ltd. | | 17,600 | 6,828,128 |
|
| TOTAL INFORMATION TECHNOLOGY | | | 67,949,837 |
|
| MATERIALS - 8.5% | | | |
| Chemicals - 8.5% | | | |
| Daicel Chemical Industries Ltd. | | 208,300 | 2,600,754 |
| Hitachi Chemical Co. Ltd. | | 134,900 | 3,846,784 |
| JSR Corp. | | 245,000 | 4,749,293 |
| Kansai Paint Co. Ltd. | | 172,100 | 4,423,476 |
| Nissan Chemical Industries Co. Ltd. | | 79,200 | 2,954,118 |
| Okamoto Industries, Inc. | | 131,000 | 1,425,335 |
| Shin-Etsu Chemical Co. Ltd. | | 87,600 | 9,238,404 |
| Sumitomo Chemical Co. Ltd. | | 602,000 | 4,230,766 |
| Toray Industries, Inc. | | 524,000 | 5,303,742 |
| | | | 38,772,672 |
| MULTI SECTOR - 0.3% | | | |
| Insource Co. Ltd. | | 65,900 | 1,144,360 |
| REAL ESTATE - 0.7% | | | |
| Real Estate Management & Development - 0.7% | | | |
| Investors Cloud Co. Ltd. (b) | | 50,800 | 3,097,948 |
| TELECOMMUNICATION SERVICES - 8.3% | | | |
| Wireless Telecommunication Services - 8.3% | | | |
| KDDI Corp. | | 548,000 | 14,600,167 |
| SoftBank Corp. | | 264,500 | 23,440,568 |
| | | | 38,040,735 |
| TOTAL COMMON STOCKS | | | |
| (Cost $339,896,835) | | | 452,301,105 |
|
| Money Market Funds - 2.0% | | | |
| Fidelity Cash Central Fund, 1.10% (c) | | 1,860,046 | 1,860,418 |
| Fidelity Securities Lending Cash Central Fund 1.11% (c)(d) | | 7,156,005 | 7,156,720 |
| TOTAL MONEY MARKET FUNDS | | | |
| (Cost $9,017,646) | | | 9,017,138 |
| TOTAL INVESTMENT IN SECURITIES - 100.9% | | | |
| (Cost $348,914,481) | | | 461,318,243 |
| NET OTHER ASSETS (LIABILITIES) - (0.9)% | | | (3,969,451) |
| NET ASSETS - 100% | | | $457,348,792 |
Legend
(a) Non-income producing
(b) Security or a portion of the security is on loan at period end.
(c) Affiliated fund that is generally available only to investment companies and other accounts managed by Fidelity Investments. The rate quoted is the annualized seven-day yield of the fund at period end. A complete unaudited listing of the fund's holdings as of its most recent quarter end is available upon request. In addition, each Fidelity Central Fund's financial statements, which are not covered by the Fund's Report of Independent Registered Public Accounting Firm, are available on the SEC's website or upon request.
(d) Investment made with cash collateral received from securities on loan.
Affiliated Central Funds
Information regarding fiscal year to date income earned by the Fund from investments in Fidelity Central Funds is as follows:
| Fund | Income earned |
| Fidelity Cash Central Fund | $12,784 |
| Fidelity Securities Lending Cash Central Fund | 169,053 |
| Total | $181,837 |
Investment Valuation
The following is a summary of the inputs used, as of October 31, 2017, involving the Fund's assets and liabilities carried at fair value. The inputs or methodology used for valuing securities may not be an indication of the risk associated with investing in those securities. For more information on valuation inputs, and their aggregation into the levels used below, please refer to the Investment Valuation section in the accompanying Notes to Financial Statements.
| | Valuation Inputs at Reporting Date: |
| Description | Total | Level 1 | Level 2 | Level 3 |
| Investments in Securities: | | | | |
| Equities: | | | | |
| Consumer Discretionary | $87,983,611 | $3,187,264 | $84,796,347 | $-- |
| Consumer Staples | 40,199,722 | -- | 40,199,722 | -- |
| Financials | 51,797,566 | -- | 51,797,566 | -- |
| Health Care | 40,006,602 | -- | 40,006,602 | -- |
| Industrials | 83,308,052 | -- | 83,308,052 | -- |
| Information Technology | 67,949,837 | -- | 67,949,837 | -- |
| Materials | 38,772,672 | -- | 38,772,672 | -- |
| Multi Sector | 1,144,360 | -- | 1,144,360 | -- |
| Real Estate | 3,097,948 | -- | 3,097,948 | -- |
| Telecommunication Services | 38,040,735 | -- | 38,040,735 | -- |
| Money Market Funds | 9,017,138 | 9,017,138 | -- | -- |
| Total Investments in Securities: | $461,318,243 | $12,204,402 | $449,113,841 | $-- |
The following is a summary of transfers between Level 1 and Level 2 for the period ended October 31, 2017. Transfers are assumed to have occurred at the beginning of the period, and are primarily attributable to the valuation techniques used for foreign equity securities, as discussed in the accompanying Notes to Financial Statements:
| Transfers | Total |
| Level 1 to Level 2 | $246,167,378 |
| Level 2 to Level 1 | $0 |
See accompanying notes which are an integral part of the financial statements.
Financial Statements
Statement of Assets and Liabilities
| | | October 31, 2017 |
| Assets | | |
Investment in securities, at value (including securities loaned of $6,812,555) — See accompanying schedule:
Unaffiliated issuers (cost $339,896,835) | $452,301,105 | |
| Fidelity Central Funds (cost $9,017,646) | 9,017,138 | |
| Total Investment in Securities (cost $348,914,481) | | $461,318,243 |
| Receivable for investments sold | | 3,343,923 |
| Receivable for fund shares sold | | 1,076,225 |
| Dividends receivable | | 2,273,750 |
| Distributions receivable from Fidelity Central Funds | | 26,993 |
| Prepaid expenses | | 981 |
| Other receivables | | 1,773 |
| Total assets | | 468,041,888 |
| Liabilities | | |
| Payable for investments purchased | $2,038,928 | |
| Payable for fund shares redeemed | 1,127,324 | |
| Accrued management fee | 196,004 | |
| Distribution and service plan fees payable | 16,035 | |
| Other affiliated payables | 85,458 | |
| Other payables and accrued expenses | 74,042 | |
| Collateral on securities loaned | 7,155,305 | |
| Total liabilities | | 10,693,096 |
| Net Assets | | $457,348,792 |
| Net Assets consist of: | | |
| Paid in capital | | $488,718,340 |
| Undistributed net investment income | | 2,940,381 |
| Accumulated undistributed net realized gain (loss) on investments and foreign currency transactions | | (146,708,452) |
| Net unrealized appreciation (depreciation) on investments and assets and liabilities in foreign currencies | | 112,398,523 |
| Net Assets | | $457,348,792 |
| Calculation of Maximum Offering Price | | |
| Class A: | | |
| Net Asset Value and redemption price per share ($16,154,766 ÷ 1,071,121 shares) | | $15.08 |
| Maximum offering price per share (100/94.25 of $15.08) | | $16.00 |
| Class M: | | |
| Net Asset Value and redemption price per share ($4,464,261 ÷ 296,345 shares) | | $15.06 |
| Maximum offering price per share (100/96.50 of $15.06) | | $15.61 |
| Class C: | | |
| Net Asset Value and offering price per share ($13,542,383 ÷ 907,765 shares)(a) | | $14.92 |
| Japan: | | |
| Net Asset Value, offering price and redemption price per share ($247,371,686 ÷ 16,352,921 shares) | | $15.13 |
| Class I: | | |
| Net Asset Value, offering price and redemption price per share ($175,815,696 ÷ 11,630,041 shares) | | $15.12 |
(a) Redemption price per share is equal to net asset value less any applicable contingent deferred sales charge.
See accompanying notes which are an integral part of the financial statements.
Statement of Operations
| | | Year ended October 31, 2017 |
| Investment Income | | |
| Dividends | | $7,060,926 |
| Income from Fidelity Central Funds | | 181,837 |
| Income before foreign taxes withheld | | 7,242,763 |
| Less foreign taxes withheld | | (702,113) |
| Total income | | 6,540,650 |
| Expenses | | |
| Management fee | | |
| Basic fee | $2,913,164 | |
| Performance adjustment | (731,266) | |
| Transfer agent fees | 794,297 | |
| Distribution and service plan fees | 204,631 | |
| Accounting and security lending fees | 218,756 | |
| Custodian fees and expenses | 41,805 | |
| Independent trustees' fees and expenses | 1,670 | |
| Registration fees | 73,226 | |
| Audit | 79,089 | |
| Legal | 1,052 | |
| Interest | 617 | |
| Miscellaneous | 3,234 | |
| Total expenses before reductions | 3,600,275 | |
| Expense reductions | (14,814) | 3,585,461 |
| Net investment income (loss) | | 2,955,189 |
| Realized and Unrealized Gain (Loss) | | |
| Net realized gain (loss) on: | | |
| Investment securities: | | |
| Unaffiliated issuers | 11,597,777 | |
| Fidelity Central Funds | 1,313 | |
| Foreign currency transactions | (296,959) | |
| Total net realized gain (loss) | | 11,302,131 |
| Change in net unrealized appreciation (depreciation) on: | | |
| Investment securities: | | |
| Unaffiliated issuers | 67,682,350 | |
| Fidelity Central Funds | (911) | |
| Assets and liabilities in foreign currencies | 88,784 | |
| Total change in net unrealized appreciation (depreciation) | | 67,770,223 |
| Net gain (loss) | | 79,072,354 |
| Net increase (decrease) in net assets resulting from operations | | $82,027,543 |
See accompanying notes which are an integral part of the financial statements.
Statement of Changes in Net Assets
| | Year ended October 31, 2017 | Year ended October 31, 2016 |
| Increase (Decrease) in Net Assets | | |
| Operations | | |
| Net investment income (loss) | $2,955,189 | $3,375,493 |
| Net realized gain (loss) | 11,302,131 | (19,947,501) |
| Change in net unrealized appreciation (depreciation) | 67,770,223 | 35,358,570 |
| Net increase (decrease) in net assets resulting from operations | 82,027,543 | 18,786,562 |
| Distributions to shareholders from net investment income | (3,369,067) | (3,027,093) |
| Distributions to shareholders from net realized gain | (1,060,540) | (270,338) |
| Total distributions | (4,429,607) | (3,297,431) |
| Share transactions - net increase (decrease) | (23,430,665) | (159,708,771) |
| Redemption fees | 33,312 | 43,507 |
| Total increase (decrease) in net assets | 54,200,583 | (144,176,133) |
| Net Assets | | |
| Beginning of period | 403,148,209 | 547,324,342 |
| End of period | $457,348,792 | $403,148,209 |
| Other Information | | |
| Undistributed net investment income end of period | $2,940,381 | $3,364,219 |
See accompanying notes which are an integral part of the financial statements.
Financial Highlights
Fidelity Japan Fund Class A
| Years ended October 31, | 2017 | 2016 | 2015 | 2014 | 2013 |
| Selected Per–Share Data | | | | | |
| Net asset value, beginning of period | $12.59 | $11.87 | $11.65 | $12.00 | $9.30 |
| Income from Investment Operations | | | | | |
| Net investment income (loss)A | .06 | .06 | .04 | .05 | .08 |
| Net realized and unrealized gain (loss) | 2.52 | .72 | .23 | (.31) | 2.80 |
| Total from investment operations | 2.58 | .78 | .27 | (.26) | 2.88 |
| Distributions from net investment income | (.06) | (.05) | (.05) | (.08) | (.11) |
| Distributions from net realized gain | (.03) | (.01) | – | (.01) | (.08) |
| Total distributions | (.09) | (.06) | (.05) | (.09) | (.19) |
| Redemption fees added to paid in capitalA | –B | –B | –B | –B | .01 |
| Net asset value, end of period | $15.08 | $12.59 | $11.87 | $11.65 | $12.00 |
| Total ReturnC,D | 20.70% | 6.56% | 2.31% | (2.18)% | 31.58% |
| Ratios to Average Net AssetsE,F | | | | | |
| Expenses before reductions | 1.11% | 1.08% | 1.10% | 1.23% | 1.26% |
| Expenses net of fee waivers, if any | 1.11% | 1.08% | 1.10% | 1.23% | 1.26% |
| Expenses net of all reductions | 1.11% | 1.08% | 1.09% | 1.23% | 1.25% |
| Net investment income (loss) | .45% | .51% | .37% | .41% | .75% |
| Supplemental Data | | | | | |
| Net assets, end of period (000 omitted) | $16,155 | $23,910 | $23,918 | $21,352 | $20,520 |
| Portfolio turnover rateG | 23% | 15% | 35% | 112% | 68% |
A Calculated based on average shares outstanding during the period.
B Amount represents less than $.005 per share.
C Total returns would have been lower if certain expenses had not been reduced during the applicable periods shown.
D Total returns do not include the effect of the sales charges.
E Fees and expenses of any underlying Fidelity Central Funds are not included in the Fund's expense ratio. The Fund indirectly bears its proportionate share of the expenses of any underlying Fidelity Central Funds.
F Expense ratios reflect operating expenses of the class. Expenses before reductions do not reflect amounts reimbursed by the investment adviser or reductions from brokerage service arrangements or reductions from other expense offset arrangements and do not represent the amount paid by the class during periods when reimbursements or reductions occur. Expenses net of fee waivers reflect expenses after reimbursement by the investment adviser but prior to reductions from brokerage service arrangements or other expense offset arrangements. Expenses net of all reductions represent the net expenses paid by the class.
G Amount does not include the portfolio activity of any underlying Fidelity Central Funds.
See accompanying notes which are an integral part of the financial statements.
Fidelity Japan Fund Class M
| Years ended October 31, | 2017 | 2016 | 2015 | 2014 | 2013 |
| Selected Per–Share Data | | | | | |
| Net asset value, beginning of period | $12.57 | $11.85 | $11.62 | $11.96 | $9.28 |
| Income from Investment Operations | | | | | |
| Net investment income (loss)A | .01 | .02 | –B | .01 | .05 |
| Net realized and unrealized gain (loss) | 2.52 | .71 | .23 | (.30) | 2.78 |
| Total from investment operations | 2.53 | .73 | .23 | (.29) | 2.83 |
| Distributions from net investment income | (.01) | –B | – | (.04) | (.08) |
| Distributions from net realized gain | (.03) | (.01) | – | (.01) | (.08) |
| Total distributions | (.04) | (.01) | – | (.05) | (.16) |
| Redemption fees added to paid in capitalA | –B | –B | –B | –B | .01 |
| Net asset value, end of period | $15.06 | $12.57 | $11.85 | $11.62 | $11.96 |
| Total ReturnC,D | 20.24% | 6.15% | 1.98% | (2.42)% | 31.04% |
| Ratios to Average Net AssetsE,F | | | | | |
| Expenses before reductions | 1.46% | 1.44% | 1.43% | 1.54% | 1.55% |
| Expenses net of fee waivers, if any | 1.46% | 1.44% | 1.43% | 1.54% | 1.55% |
| Expenses net of all reductions | 1.46% | 1.44% | 1.42% | 1.54% | 1.53% |
| Net investment income (loss) | .10% | .16% | .04% | .10% | .46% |
| Supplemental Data | | | | | |
| Net assets, end of period (000 omitted) | $4,464 | $4,193 | $4,809 | $4,104 | $5,357 |
| Portfolio turnover rateG | 23% | 15% | 35% | 112% | 68% |
A Calculated based on average shares outstanding during the period.
B Amount represents less than $.005 per share.
C Total returns would have been lower if certain expenses had not been reduced during the applicable periods shown.
D Total returns do not include the effect of the sales charges.
E Fees and expenses of any underlying Fidelity Central Funds are not included in the Fund's expense ratio. The Fund indirectly bears its proportionate share of the expenses of any underlying Fidelity Central Funds.
F Expense ratios reflect operating expenses of the class. Expenses before reductions do not reflect amounts reimbursed by the investment adviser or reductions from brokerage service arrangements or reductions from other expense offset arrangements and do not represent the amount paid by the class during periods when reimbursements or reductions occur. Expenses net of fee waivers reflect expenses after reimbursement by the investment adviser but prior to reductions from brokerage service arrangements or other expense offset arrangements. Expenses net of all reductions represent the net expenses paid by the class.
G Amount does not include the portfolio activity of any underlying Fidelity Central Funds.
See accompanying notes which are an integral part of the financial statements.
Fidelity Japan Fund Class C
| Years ended October 31, | 2017 | 2016 | 2015 | 2014 | 2013 |
| Selected Per–Share Data | | | | | |
| Net asset value, beginning of period | $12.44 | $11.77 | $11.58 | $11.96 | $9.25 |
| Income from Investment Operations | | | | | |
| Net investment income (loss)A | (.03) | (.02) | (.04) | (.03) | –B |
| Net realized and unrealized gain (loss) | 2.51 | .69 | .23 | (.32) | 2.79 |
| Total from investment operations | 2.48 | .67 | .19 | (.35) | 2.79 |
| Distributions from net investment income | – | – | – | (.03) | (.01) |
| Distributions from net realized gain | – | – | – | (.01) | (.08) |
| Total distributions | – | – | – | (.03)C | (.09) |
| Redemption fees added to paid in capitalA | –B | –B | –B | –B | .01 |
| Net asset value, end of period | $14.92 | $12.44 | $11.77 | $11.58 | $11.96 |
| Total ReturnD,E | 19.94% | 5.69% | 1.64% | (2.90)% | 30.55% |
| Ratios to Average Net AssetsF,G | | | | | |
| Expenses before reductions | 1.81% | 1.81% | 1.81% | 1.93% | 1.97% |
| Expenses net of fee waivers, if any | 1.81% | 1.81% | 1.81% | 1.93% | 1.97% |
| Expenses net of all reductions | 1.81% | 1.81% | 1.80% | 1.93% | 1.95% |
| Net investment income (loss) | (.25)% | (.21)% | (.34)% | (.29)% | .04% |
| Supplemental Data | | | | | |
| Net assets, end of period (000 omitted) | $13,542 | $15,077 | $18,491 | $13,162 | $11,824 |
| Portfolio turnover rateH | 23% | 15% | 35% | 112% | 68% |
A Calculated based on average shares outstanding during the period.
B Amount represents less than $.005 per share.
C Total distributions of $.03 per share is comprised of distributions from net investment income of $.025 and distributions from net realized gain of $.009 per share.
D Total returns would have been lower if certain expenses had not been reduced during the applicable periods shown.
E Total returns do not include the effect of the contingent deferred sales charge.
F Fees and expenses of any underlying Fidelity Central Funds are not included in the Fund's expense ratio. The Fund indirectly bears its proportionate share of the expenses of any underlying Fidelity Central Funds.
G Expense ratios reflect operating expenses of the class. Expenses before reductions do not reflect amounts reimbursed by the investment adviser or reductions from brokerage service arrangements or reductions from other expense offset arrangements and do not represent the amount paid by the class during periods when reimbursements or reductions occur. Expenses net of fee waivers reflect expenses after reimbursement by the investment adviser but prior to reductions from brokerage service arrangements or other expense offset arrangements. Expenses net of all reductions represent the net expenses paid by the class.
H Amount does not include the portfolio activity of any underlying Fidelity Central Funds.
See accompanying notes which are an integral part of the financial statements.
Fidelity Japan Fund
| Years ended October 31, | 2017 | 2016 | 2015 | 2014 | 2013 |
| Selected Per–Share Data | | | | | |
| Net asset value, beginning of period | $12.64 | $11.91 | $11.69 | $12.03 | $9.34 |
| Income from Investment Operations | | | | | |
| Net investment income (loss)A | .10 | .09 | .08 | .09 | .12 |
| Net realized and unrealized gain (loss) | 2.54 | .72 | .23 | (.32) | 2.79 |
| Total from investment operations | 2.64 | .81 | .31 | (.23) | 2.91 |
| Distributions from net investment income | (.11) | (.07) | (.09) | (.11) | (.15) |
| Distributions from net realized gain | (.03) | (.01) | – | (.01) | (.08) |
| Total distributions | (.15)B | (.08) | (.09) | (.11)C | (.23) |
| Redemption fees added to paid in capitalA | –D | –D | –D | –D | .01 |
| Net asset value, end of period | $15.13 | $12.64 | $11.91 | $11.69 | $12.03 |
| Total ReturnE | 21.13% | 6.80% | 2.66% | (1.90)% | 31.92% |
| Ratios to Average Net AssetsF,G | | | | | |
| Expenses before reductions | .82% | .78% | .80% | .90% | .93% |
| Expenses net of fee waivers, if any | .82% | .78% | .80% | .90% | .93% |
| Expenses net of all reductions | .82% | .78% | .79% | .90% | .91% |
| Net investment income (loss) | .74% | .81% | .67% | .74% | 1.08% |
| Supplemental Data | | | | | |
| Net assets, end of period (000 omitted) | $247,372 | $352,936 | $485,803 | $415,612 | $480,773 |
| Portfolio turnover rateH | 23% | 15% | 35% | 112% | 68% |
A Calculated based on average shares outstanding during the period.
B Total distributions of $.15 per share is comprised of distributions from net investment income of $.112 and distributions from net realized gain of $.034 per share.
C Total distributions of $.11 per share is comprised of distributions from net investment income of $.105 and distributions from net realized gain of $.009 per share.
D Amount represents less than $.005 per share.
E Total returns would have been lower if certain expenses had not been reduced during the applicable periods shown.
F Fees and expenses of any underlying Fidelity Central Funds are not included in the Fund's expense ratio. The Fund indirectly bears its proportionate share of the expenses of any underlying Fidelity Central Funds.
G Expense ratios reflect operating expenses of the class. Expenses before reductions do not reflect amounts reimbursed by the investment adviser or reductions from brokerage service arrangements or reductions from other expense offset arrangements and do not represent the amount paid by the class during periods when reimbursements or reductions occur. Expenses net of fee waivers reflect expenses after reimbursement by the investment adviser but prior to reductions from brokerage service arrangements or other expense offset arrangements. Expenses net of all reductions represent the net expenses paid by the class.
H Amount does not include the portfolio activity of any underlying Fidelity Central Funds.
See accompanying notes which are an integral part of the financial statements.
Fidelity Japan Fund Class I
| Years ended October 31, | 2017 | 2016 | 2015 | 2014 | 2013 |
| Selected Per–Share Data | | | | | |
| Net asset value, beginning of period | $12.62 | $11.89 | $11.67 | $12.02 | $9.33 |
| Income from Investment Operations | | | | | |
| Net investment income (loss)A | .11 | .10 | .08 | .09 | .13 |
| Net realized and unrealized gain (loss) | 2.53 | .70 | .23 | (.32) | 2.78 |
| Total from investment operations | 2.64 | .80 | .31 | (.23) | 2.91 |
| Distributions from net investment income | (.11) | (.07) | (.09) | (.12) | (.15) |
| Distributions from net realized gain | (.03) | (.01) | – | (.01) | (.08) |
| Total distributions | (.14) | (.07)B | (.09) | (.12)C | (.23) |
| Redemption fees added to paid in capitalA | –D | –D | –D | –D | .01 |
| Net asset value, end of period | $15.12 | $12.62 | $11.89 | $11.67 | $12.02 |
| Total ReturnE | 21.22% | 6.77% | 2.72% | (1.90)% | 32.04% |
| Ratios to Average Net AssetsF,G | | | | | |
| Expenses before reductions | .76% | .77% | .80% | .89% | .90% |
| Expenses net of fee waivers, if any | .76% | .77% | .80% | .89% | .90% |
| Expenses net of all reductions | .76% | .76% | .79% | .89% | .88% |
| Net investment income (loss) | .80% | .83% | .67% | .76% | 1.11% |
| Supplemental Data | | | | | |
| Net assets, end of period (000 omitted) | $175,816 | $7,032 | $13,957 | $20,253 | $20,033 |
| Portfolio turnover rateH | 23% | 15% | 35% | 112% | 68% |
A Calculated based on average shares outstanding during the period.
B Total distributions of $.07 per share is comprised of distributions from net investment income of $.065 and distributions from net realized gain of $.006 per share.
C Total distributions of $.12 per share is comprised of distributions from net investment income of $.115 and distributions from net realized gain of $.009 per share.
D Amount represents less than $.005 per share.
E Total returns would have been lower if certain expenses had not been reduced during the applicable periods shown.
F Fees and expenses of any underlying Fidelity Central Funds are not included in the Fund's expense ratio. The Fund indirectly bears its proportionate share of the expenses of any underlying Fidelity Central Funds.
G Expense ratios reflect operating expenses of the class. Expenses before reductions do not reflect amounts reimbursed by the investment adviser or reductions from brokerage service arrangements or reductions from other expense offset arrangements and do not represent the amount paid by the class during periods when reimbursements or reductions occur. Expenses net of fee waivers reflect expenses after reimbursement by the investment adviser but prior to reductions from brokerage service arrangements or other expense offset arrangements. Expenses net of all reductions represent the net expenses paid by the class.
H Amount does not include the portfolio activity of any underlying Fidelity Central Funds.
See accompanying notes which are an integral part of the financial statements.
Notes to Financial Statements
For the period ended October 31, 2017
1. Organization.
Fidelity Japan Fund (the Fund) is a fund of Fidelity Investment Trust (the Trust) and is authorized to issue an unlimited number of shares. The Trust is registered under the Investment Company Act of 1940, as amended (the 1940 Act), as an open-end management investment company organized as a Massachusetts business trust. The Fund offers Class A, Class M (formerly Class T), Class C, Japan and Class I shares, each of which has equal rights as to assets and voting privileges. Each class has exclusive voting rights with respect to matters that affect that class.
After the close of business on June 24, 2016, all outstanding Class B shares were converted to Class A shares. All prior fiscal period dollar and share amounts for Class B presented in the Notes to Financial Statements are for the period November 1, 2015 through June 24, 2016.
2. Investments in Fidelity Central Funds.
The Fund invests in Fidelity Central Funds, which are open-end investment companies generally available only to other investment companies and accounts managed by the investment adviser and its affiliates. The Fund's Schedule of Investments lists each of the Fidelity Central Funds held as of period end, if any, as an investment of the Fund, but does not include the underlying holdings of each Fidelity Central Fund. As an Investing Fund, the Fund indirectly bears its proportionate share of the expenses of the underlying Fidelity Central Funds.
The Money Market Central Funds seek preservation of capital and current income and are managed by Fidelity Investments Money Management, Inc. (FIMM), an affiliate of the investment adviser. Annualized expenses of the Money Market Central Funds as of their most recent shareholder report date are less than .005%.
A complete unaudited list of holdings for each Fidelity Central Fund is available upon request or at the Securities and Exchange Commission (the SEC) website at www.sec.gov. In addition, the financial statements of the Fidelity Central Funds, which are not covered by the Fund's Report of Independent Registered Public Accounting Firm, are available on the SEC website or upon request.
3. Significant Accounting Policies.
The Fund is an investment company and applies the accounting and reporting guidance of the Financial Accounting Standards Board (FASB) Accounting Standards Codification Topic 946 Financial Services – Investments Companies. The financial statements have been prepared in conformity with accounting principles generally accepted in the United States of America (GAAP), which require management to make certain estimates and assumptions at the date of the financial statements. Actual results could differ from those estimates. Subsequent events, if any, through the date that the financial statements were issued have been evaluated in the preparation of the financial statements. The following summarizes the significant accounting policies of the Fund:
Investment Valuation. Investments are valued as of 4:00 p.m. Eastern time on the last calendar day of the period. The Board of Trustees (the Board) has delegated the day to day responsibility for the valuation of the Fund's investments to the Fair Value Committee (the Committee) established by the Fund's investment adviser. In accordance with valuation policies and procedures approved by the Board, the Fund attempts to obtain prices from one or more third party pricing vendors or brokers to value its investments. When current market prices, quotations or currency exchange rates are not readily available or reliable, investments will be fair valued in good faith by the Committee, in accordance with procedures adopted by the Board. Factors used in determining fair value vary by investment type and may include market or investment specific events. The frequency with which these procedures are used cannot be predicted and they may be utilized to a significant extent. The Committee oversees the Fund's valuation policies and procedures and reports to the Board on the Committee's activities and fair value determinations. The Board monitors the appropriateness of the procedures used in valuing the Fund's investments and ratifies the fair value determinations of the Committee.
The Fund categorizes the inputs to valuation techniques used to value its investments into a disclosure hierarchy consisting of three levels as shown below:
- Level 1 – quoted prices in active markets for identical investments
- Level 2 – other significant observable inputs (including quoted prices for similar investments, interest rates, prepayment speeds, etc.)
- Level 3 – unobservable inputs (including the Fund's own assumptions based on the best information available)
Valuation techniques used to value the Fund's investments by major category are as follows:
Equity securities, including restricted securities, for which market quotations are readily available, are valued at the last reported sale price or official closing price as reported by a third party pricing vendor on the primary market or exchange on which they are traded and are categorized as Level 1 in the hierarchy. In the event there were no sales during the day or closing prices are not available, securities are valued at the last quoted bid price or may be valued using the last available price and are generally categorized as Level 2 in the hierarchy. For foreign equity securities, when market or security specific events arise, comparisons to the valuation of American Depositary Receipts (ADRs), futures contracts, Exchange-Traded Funds (ETFs) and certain indexes as well as quoted prices for similar securities may be used and would be categorized as Level 2 in the hierarchy. Utilizing these techniques may result in transfers between Level 1 and Level 2. For equity securities, including restricted securities, where observable inputs are limited, assumptions about market activity and risk are used and these securities may be categorized as Level 3 in the hierarchy.
Investments in open-end mutual funds, including the Fidelity Central Funds, are valued at their closing net asset value (NAV) each business day and are categorized as Level 1 in the hierarchy.
Changes in valuation techniques may result in transfers in or out of an assigned level within the disclosure hierarchy. The aggregate value of investments by input level as of October 31, 2017, including information on transfers between Levels 1 and 2, is included at the end of the Fund's Schedule of Investments.
Foreign Currency. The Fund may use foreign currency contracts to facilitate transactions in foreign-denominated securities. Gains and losses from these transactions may arise from changes in the value of the foreign currency or if the counterparties do not perform under the contracts' terms.
Foreign-denominated assets, including investment securities, and liabilities are translated into U.S. dollars at the exchange rates at period end. Purchases and sales of investment securities, income and dividends received and expenses denominated in foreign currencies are translated into U.S. dollars at the exchange rate in effect on the transaction date.
The effects of exchange rate fluctuations on investments are included with the net realized and unrealized gain (loss) on investment securities. Other foreign currency transactions resulting in realized and unrealized gain (loss) are disclosed separately.
Investment Transactions and Income. For financial reporting purposes, the Fund's investment holdings and NAV include trades executed through the end of the last business day of the period. The NAV per share for processing shareholder transactions is calculated as of the close of business of the New York Stock Exchange (NYSE), normally 4:00 p.m. Eastern time and includes trades executed through the end of the prior business day. Gains and losses on securities sold are determined on the basis of identified cost. Dividend income is recorded on the ex-dividend date, except for certain dividends from foreign securities where the ex-dividend date may have passed, which are recorded as soon as the Fund is informed of the ex-dividend date. Non-cash dividends included in dividend income, if any, are recorded at the fair market value of the securities received. Income and capital gain distributions from Fidelity Central Funds, if any, are recorded on the ex-dividend date. Investment income is recorded net of foreign taxes withheld where recovery of such taxes is uncertain.
Class Allocations and Expenses. Investment income, realized and unrealized capital gains and losses, common expenses of the Fund, and certain fund-level expense reductions, if any, are allocated daily on a pro-rata basis to each class based on the relative net assets of each class to the total net assets of the Fund. Each class differs with respect to transfer agent and distribution and service plan fees incurred. Certain expense reductions may also differ by class. For the reporting period, the allocated portion of income and expenses to each class as a percent of its average net assets may vary due to the timing of recording these transactions in relation to fluctuating net assets of the classes. Expenses directly attributable to a fund are charged to that fund. Expenses attributable to more than one fund are allocated among the respective funds on the basis of relative net assets or other appropriate methods. Expense estimates are accrued in the period to which they relate and adjustments are made when actual amounts are known.
Income Tax Information and Distributions to Shareholders. Each year, the Fund intends to qualify as a regulated investment company under Subchapter M of the Internal Revenue Code, including distributing substantially all of its taxable income and realized gains. As a result, no provision for U.S. Federal income taxes is required. As of October 31, 2017, the Fund did not have any unrecognized tax benefits in the financial statements; nor is the Fund aware of any tax positions for which it is reasonably possible that the total amounts of unrecognized tax benefits will significantly change in the next twelve months. The Fund files a U.S. federal tax return, in addition to state and local tax returns as required. The Fund's federal income tax returns are subject to examination by the Internal Revenue Service (IRS) for a period of three fiscal years after they are filed. State and local tax returns may be subject to examination for an additional fiscal year depending on the jurisdiction. Foreign taxes are provided for based on the Fund's understanding of the tax rules and rates that exist in the foreign markets in which it invests.
Distributions are declared and recorded on the ex-dividend date. Income dividends and capital gain distributions are declared separately for each class. Income and capital gain distributions are determined in accordance with income tax regulations, which may differ from GAAP.
Capital accounts within the financial statements are adjusted for permanent book-tax differences. These adjustments have no impact on net assets or the results of operations. Capital accounts are not adjusted for temporary book-tax differences which will reverse in a subsequent period.
Book-tax differences are primarily due to foreign currency transactions, passive-foreign investment companies (PFIC), expiring capital loss carryforwards, deferred trustees compensation, capital loss carryforwards and losses deferred due to wash sales.
As of period end, the cost and unrealized appreciation (depreciation) in securities, and derivatives if applicable, for federal income tax purposes were as follows:
| Gross unrealized appreciation | $116,513,795 |
| Gross unrealized depreciation | (9,678,199) |
| Net unrealized appreciation (depreciation) | $106,835,596 |
| Tax Cost | $354,482,647 |
The tax-based components of distributable earnings as of period end were as follows:
| Undistributed ordinary income | $3,808,926 |
| Capital loss carryforward | $(141,997,898) |
| Net unrealized appreciation (depreciation) on securities and other investments | $106,819,605 |
Capital loss carryforwards are only available to offset future capital gains of the Fund to the extent provided by regulations and may be limited. Under the Regulated Investment Company Modernization Act of 2010 (the Act), the Fund is permitted to carry forward capital losses incurred in taxable years beginning after December 22, 2010 for an unlimited period and such capital losses are required to be used prior to any losses that expire. The capital loss carryforward information presented below, including any applicable limitation, is estimated as of fiscal period end and is subject to adjustment.
| Fiscal year of expiration | |
| 2018 | $(26,887,863) |
| 2019 | (98,806,037) |
| Total with expiration | $(125,693,900) |
| No expiration | |
| Short-term | (5,646,628) |
| Long-term | (10,657,370) |
| Total no expiration | (16,303,998) |
| Total capital loss carryforward | $(141,997,898) |
The tax character of distributions paid was as follows:
| | October 31, 2017 | October 31, 2016 |
| Ordinary Income | $4,429,607 | $ 3,297,431 |
Short-Term Trading (Redemption) Fees. Shares held by investors in the Fund less than 90 days may have been subject to a redemption fee equal to 1.50% of the NAV of shares redeemed. All redemption fees, which reduce the proceeds of the shareholder redemption, are retained by the Fund and accounted for as an addition to paid in capital. In November 2017, the Board of Trustees approved the elimination of these redemption fees effective December 18, 2017.
4. Purchases and Sales of Investments.
Purchases and sales of securities, other than short-term securities, aggregated $96,762,670 and $122,325,801, respectively.
5. Fees and Other Transactions with Affiliates.
Management Fee. Fidelity Management & Research Company (the investment adviser) and its affiliates provide the Fund with investment management related services for which the Fund pays a monthly management fee. The management fee is the sum of an individual fund fee rate that is based on an annual rate of .45% of the Fund's average net assets and an annualized group fee rate that averaged .25% during the period. The group fee rate is based upon the average net assets of all the mutual funds advised by the investment adviser, including any mutual funds previously advised by the investment adviser that are currently advised by Fidelity SelectCo, LLC, an affiliate of the investment adviser. The group fee rate decreases as assets under management increase and increases as assets under management decrease. In addition, the management fee is subject to a performance adjustment (up to a maximum of +/- .20% of the Fund's average net assets over a 36 month performance period). The upward or downward adjustment to the management fee is based on the relative investment performance of Japan as compared to its benchmark index, the TOPIX, over the same 36 month performance period. For the reporting period, the total annual management fee rate, including the performance adjustment, was .52% of the Fund's average net assets. The performance adjustment included in the management fee rate may be higher or lower than the maximum performance adjustment rate due to the difference between the average net assets for the reporting and performance periods.
Distribution and Service Plan Fees. In accordance with Rule 12b-1 of the 1940 Act, the Fund has adopted separate Distribution and Service Plans for each class of shares. Certain classes pay Fidelity Distributors Corporation (FDC), an affiliate of the investment adviser, separate Distribution and Service Fees, each of which is based on an annual percentage of each class' average net assets. In addition, FDC may pay financial intermediaries for selling shares of the Fund and providing shareholder support services. For the period, the Distribution and Service Fee rates, total fees and amounts retained by FDC were as follows:
| | Distribution
Fee | Service
Fee | Total Fees | Retained
by FDC |
| Class A | -% | .25% | $47,060 | $1,787 |
| Class M | .25% | .25% | 21,035 | 125 |
| Class C | .75% | .25% | 136,536 | 12,586 |
| | | | $204,631 | $14,498 |
Sales Load. FDC may receive a front-end sales charge of up to 5.75% for selling Class A shares and 3.50% for selling Class M shares, some of which is paid to financial intermediaries for selling shares of the Fund. Depending on the holding period, FDC may receive contingent deferred sales charges levied on Class A, Class M and Class C redemptions. The deferred sales charges are 1.00% for Class C shares, 1.00% for certain purchases of Class A shares and .25% for certain purchases of Class M shares.
For the period, sales charge amounts retained by FDC were as follows:
| | Retained
by FDC |
| Class A | $11,128 |
| Class M | 527 |
| Class C(a) | 1,873 |
| | $13,528 |
(a) When Class C shares are initially sold, FDC pays commissions from its own resources to financial intermediaries through which the sales are made.
Transfer Agent Fees. Fidelity Investments Institutional Operations Company, Inc., (FIIOC), an affiliate of the investment adviser, is the transfer, dividend disbursing and shareholder servicing agent for each class of the Fund. FIIOC receives account fees and asset-based fees that vary according to the account size and type of account of the shareholders of the respective classes of the Fund. FIIOC pays for typesetting, printing and mailing of shareholder reports, except proxy statements.
For the period, transfer agent fees for each class were as follows:
| | Amount | % of
Class-Level Average
Net Assets |
| Class A | $44,772 | .24 |
| Class M | 14,260 | .34 |
| Class C | 26,437 | .19 |
| Japan | 574,549 | .20 |
| Class I | 134,279 | .14 |
| | $794,297 | |
Accounting and Security Lending Fees. Fidelity Service Company, Inc. (FSC), an affiliate of the investment adviser, maintains the Fund's accounting records. The accounting fee is based on the level of average net assets for each month. Under a separate contract, FSC administers the security lending program. The security lending fee is based on the number and duration of lending transactions.
Brokerage Commissions. The Fund placed a portion of its portfolio transactions with brokerage firms which are affiliates of the investment adviser. Brokerage commissions are included in net realized gain (loss) and change in net unrealized appreciation (depreciation) in the Statement of Operations. The commissions paid to these affiliated firms were $33 for the period.
Interfund Lending Program. Pursuant to an Exemptive Order issued by the SEC, the Fund, along with other registered investment companies having management contracts with Fidelity Management & Research Company (FMR) or other affiliated entities of FMR, may participate in an interfund lending program. This program provides an alternative credit facility allowing the funds to borrow from, or lend money to, other participating affiliated funds. At period end, there were no interfund loans outstanding. The Fund's activity in this program during the period for which loans were outstanding was as follows:
| Borrower or Lender | Average Loan Balance | Weighted Average Interest Rate | Interest Expense |
| Borrower | $5,094,750 | 1.09% | $617 |
Interfund Trades. The Fund may purchase from or sell securities to other Fidelity Funds under procedures adopted by the Board. The procedures have been designed to ensure these interfund trades are executed in accordance with Rule 17a-7 of the 1940 Act. Interfund trades are included within the respective purchases and sales amounts shown in the Purchases and Sales of Investments note.
6. Committed Line of Credit.
The Fund participates with other funds managed by the investment adviser or an affiliate in a $4.25 billion credit facility (the "line of credit") to be utilized for temporary or emergency purposes to fund shareholder redemptions or for other short-term liquidity purposes. The Fund has agreed to pay commitment fees on its pro-rata portion of the line of credit, which amounted to $1,329 and is reflected in Miscellaneous expenses on the Statement of Operations. During the period, the Fund did not borrow on this line of credit.
7. Security Lending.
The Fund lends portfolio securities through a lending agent from time to time in order to earn additional income. For equity securities, a lending agent is used and may loan securities to certain qualified borrowers, including Fidelity Capital Markets (FCM), a broker-dealer affiliated with the Fund. On the settlement date of the loan, the Fund receives collateral (in the form of U.S. Treasury obligations, letters of credit and/or cash) against the loaned securities and maintains collateral in an amount not less than 100% of the market value of the loaned securities during the period of the loan. The market value of the loaned securities is determined at the close of business of the Fund and any additional required collateral is delivered to the Fund on the next business day. The Fund or borrower may terminate the loan at any time, and if the borrower defaults on its obligation to return the securities loaned because of insolvency or other reasons, the Fund may apply collateral received from the borrower against the obligation. The Fund may experience delays and costs in recovering the securities loaned. Any cash collateral received is invested in the Fidelity Securities Lending Cash Central Fund. The value of loaned securities and cash collateral at period end are disclosed on the Fund's Statement of Assets and Liabilities. Security lending income represents the income earned on investing cash collateral, less rebates paid to borrowers and any lending agent fees associated with the loan, plus any premium payments received for lending certain types of securities. Security lending income is presented in the Statement of Operations as a component of income from Fidelity Central Funds. Total security lending income during the period amounted to $169,053. During the period, there were no securities loaned to FCM.
8. Expense Reductions.
Commissions paid to certain brokers with whom the investment adviser, or its affiliates, places trades on behalf of the Fund include an amount in addition to trade execution, which may be rebated back to the Fund to offset certain expenses. This amount totaled $11,247 for the period.
In addition, during the period the investment adviser reimbursed and/or waived a portion of fund-level operating expenses in the amount of $3,567.
9. Distributions to Shareholders.
Distributions to shareholders of each class were as follows:
| | Year ended
October 31, 2017 | Year ended October 31, 2016 |
| From net investment income | | |
| Class A | $104,209 | $121,415 |
| Class M | 3,257 | 822 |
| Japan | 3,209,793 | 2,828,514 |
| Class I | 51,808 | 76,342 |
| Total | $3,369,067 | $3,027,093 |
| From net realized gain | | |
| Class A | $59,052 | $14,867 |
| Class M | 11,074 | 2,466 |
| Japan | 974,401 | 245,958 |
| Class I | 16,013 | 7,047 |
| Total | $1,060,540 | $270,338 |
10. Share Transactions.
Share transactions for each class were as follows and may contain automatic conversions between classes or exchanges between affiliated funds:
| | Shares | Shares | Dollars | Dollars |
| | Year ended October 31, 2017 | Year ended October 31, 2016 | Year ended October 31, 2017 | Year ended October 31, 2016 |
| Class A | | | | |
| Shares sold | 261,996 | 813,081 | $3,537,670 | $9,592,333 |
| Reinvestment of distributions | 12,680 | 10,746 | 155,198 | 128,096 |
| Shares redeemed | (1,102,972) | (938,856) | (14,608,137) | (10,914,042) |
| Net increase (decrease) | (828,296) | (115,029) | $(10,915,269) | $(1,193,613) |
| Class M | | | | |
| Shares sold | 34,522 | 36,363 | $446,496 | $424,255 |
| Reinvestment of distributions | 1,137 | 269 | 13,940 | 3,216 |
| Shares redeemed | (72,947) | (108,870) | (961,323) | (1,266,529) |
| Net increase (decrease) | (37,288) | (72,238) | $(500,887) | $(839,058) |
| Class B | | | | |
| Shares sold | – | 1,967 | $– | $21,930 |
| Shares redeemed | – | (31,378) | – | (356,692) |
| Net increase (decrease) | – | (29,411) | $– | $(334,762) |
| Class C | | | | |
| Shares sold | 75,525 | 261,804 | $955,948 | $3,054,392 |
| Shares redeemed | (379,339) | (621,443) | (4,904,728) | (7,129,408) |
| Net increase (decrease) | (303,814) | (359,639) | $(3,948,780) | $(4,075,016) |
| Japan | | | | |
| Shares sold | 5,531,120 | 4,048,778 | $70,265,364 | $48,328,822 |
| Reinvestment of distributions | 332,957 | 251,274 | 4,075,396 | 3,000,214 |
| Shares redeemed | (17,427,207) | (17,176,238) | (225,423,617) | (197,588,759) |
| Net increase (decrease) | (11,563,130) | (12,876,186) | $(151,082,857) | $(146,259,723) |
| Class I | | | | |
| Shares sold | 12,120,647 | 323,014 | $156,870,865 | $3,826,994 |
| Reinvestment of distributions | 4,957 | 6,575 | 60,627 | 78,372 |
| Shares redeemed | (1,052,603) | (946,812) | (13,914,364) | (10,911,965) |
| Net increase (decrease) | 11,073,001 | (617,223) | $143,017,128 | $(7,006,599) |
11. Other.
The Fund's organizational documents provide former and current trustees and officers with a limited indemnification against liabilities arising in connection with the performance of their duties to the Fund. In the normal course of business, the Fund may also enter into contracts that provide general indemnifications. The Fund's maximum exposure under these arrangements is unknown as this would be dependent on future claims that may be made against the Fund. The risk of material loss from such claims is considered remote.
At the end of the period, Strategic Advisers International Fund and Strategic Advisers International II Fund were the owners of record of approximately 11% and 25%, respectively, of the total outstanding shares of the Fund. Mutual funds managed by the investment adviser or its affiliates were the owners of record, in the aggregate, of approximately 53% of the total outstanding shares of the Fund.
Report of Independent Registered Public Accounting Firm
To the Trustees of Fidelity Investment Trust and Shareholders of Fidelity Japan Fund:
In our opinion, the accompanying statement of assets and liabilities, including the schedule of investments, and the related statements of operations and of changes in net assets and the financial highlights present fairly, in all material respects, the financial position of Fidelity Japan Fund (a fund of Fidelity Investment Trust) as of October 31, 2017, the results of its operations for the year then ended, the changes in its net assets for each of the two years in the period then ended and the financial highlights for each of the five years in the period then ended, in conformity with accounting principles generally accepted in the United States of America. These financial statements and financial highlights (hereafter referred to as “financial statements”) are the responsibility of the Fidelity Japan Fund’s management. Our responsibility is to express an opinion on these financial statements based on our audits. We conducted our audits of these financial statements in accordance with the standards of the Public Company Accounting Oversight Board (United States). Those standards require that we plan and perform the audit to obtain reasonable assurance about whether the financial statements are free of material misstatement. An audit includes examining, on a test basis, evidence supporting the amounts and disclosures in the financial statements, assessing the accounting principles used and significant estimates made by management, and evaluating the overall financial statement presentation. Our procedures included confirmation of securities owned as of October 31, 2017 by correspondence with the custodian and brokers; when replies were not received from brokers, we performed other auditing procedures. We believe that our audits provide a reasonable basis for our opinion.
PricewaterhouseCoopers LLP
Boston, Massachusetts
December 18, 2017
Trustees and Officers
The Trustees, Members of the Advisory Board (if any), and officers of the trust and fund, as applicable, are listed below. The Board of Trustees governs the fund and is responsible for protecting the interests of shareholders. The Trustees are experienced executives who meet periodically throughout the year to oversee the fund's activities, review contractual arrangements with companies that provide services to the fund, oversee management of the risks associated with such activities and contractual arrangements, and review the fund's performance. Except for Jonathan Chiel, each of the Trustees oversees 190 funds. Mr Chiel oversees 143 funds.
The Trustees hold office without limit in time except that (a) any Trustee may resign; (b) any Trustee may be removed by written instrument, signed by at least two-thirds of the number of Trustees prior to such removal; (c) any Trustee who requests to be retired or who has become incapacitated by illness or injury may be retired by written instrument signed by a majority of the other Trustees; and (d) any Trustee may be removed at any special meeting of shareholders by a two-thirds vote of the outstanding voting securities of the trust. Each Trustee who is not an interested person (as defined in the 1940 Act) of the trust and the fund is referred to herein as an Independent Trustee. Each Independent Trustee shall retire not later than the last day of the calendar year in which his or her 75th birthday occurs. The Independent Trustees may waive this mandatory retirement age policy with respect to individual Trustees. Officers and Advisory Board Members hold office without limit in time, except that any officer or Advisory Board Member may resign or may be removed by a vote of a majority of the Trustees at any regular meeting or any special meeting of the Trustees. Except as indicated, each individual has held the office shown or other offices in the same company for the past five years.
The fund’s Statement of Additional Information (SAI) includes more information about the Trustees. To request a free copy, call Fidelity at 1-877-208-0098.
Experience, Skills, Attributes, and Qualifications of the Trustees. The Governance and Nominating Committee has adopted a statement of policy that describes the experience, qualifications, attributes, and skills that are necessary and desirable for potential Independent Trustee candidates (Statement of Policy). The Board believes that each Trustee satisfied at the time he or she was initially elected or appointed a Trustee, and continues to satisfy, the standards contemplated by the Statement of Policy. The Governance and Nominating Committee also engages professional search firms to help identify potential Independent Trustee candidates who have the experience, qualifications, attributes, and skills consistent with the Statement of Policy. From time to time, additional criteria based on the composition and skills of the current Independent Trustees, as well as experience or skills that may be appropriate in light of future changes to board composition, business conditions, and regulatory or other developments, have also been considered by the professional search firms and the Governance and Nominating Committee. In addition, the Board takes into account the Trustees' commitment and participation in Board and committee meetings, as well as their leadership of standing and ad hoc committees throughout their tenure.
In determining that a particular Trustee was and continues to be qualified to serve as a Trustee, the Board has considered a variety of criteria, none of which, in isolation, was controlling. The Board believes that, collectively, the Trustees have balanced and diverse experience, qualifications, attributes, and skills, which allow the Board to operate effectively in governing the fund and protecting the interests of shareholders. Information about the specific experience, skills, attributes, and qualifications of each Trustee, which in each case led to the Board's conclusion that the Trustee should serve (or continue to serve) as a trustee of the fund, is provided below.
Board Structure and Oversight Function. James C. Curvey is an interested person and currently serves as Chairman. The Trustees have determined that an interested Chairman is appropriate and benefits shareholders because an interested Chairman has a personal and professional stake in the quality and continuity of services provided to the fund. Independent Trustees exercise their informed business judgment to appoint an individual of their choosing to serve as Chairman, regardless of whether the Trustee happens to be independent or a member of management. The Independent Trustees have determined that they can act independently and effectively without having an Independent Trustee serve as Chairman and that a key structural component for assuring that they are in a position to do so is for the Independent Trustees to constitute a substantial majority for the Board. The Independent Trustees also regularly meet in executive session. Ned C. Lautenbach serves as Chairman of the Independent Trustees and as such (i) acts as a liaison between the Independent Trustees and management with respect to matters important to the Independent Trustees and (ii) with management prepares agendas for Board meetings.
Fidelity® funds are overseen by different Boards of Trustees. The fund's Board oversees Fidelity's high income and certain equity funds, and other Boards oversee Fidelity's investment-grade bond, money market, asset allocation, and sector funds. The asset allocation funds may invest in Fidelity® funds overseen by the fund's Board. The use of separate Boards, each with its own committee structure, allows the Trustees of each group of Fidelity® funds to focus on the unique issues of the funds they oversee, including common research, investment, and operational issues. On occasion, the separate Boards establish joint committees to address issues of overlapping consequences for the Fidelity® funds overseen by each Board.
The Trustees operate using a system of committees to facilitate the timely and efficient consideration of all matters of importance to the Trustees, the fund, and fund shareholders and to facilitate compliance with legal and regulatory requirements and oversight of the fund's activities and associated risks. The Board, acting through its committees, has charged FMR and its affiliates with (i) identifying events or circumstances the occurrence of which could have demonstrably adverse effects on the fund's business and/or reputation; (ii) implementing processes and controls to lessen the possibility that such events or circumstances occur or to mitigate the effects of such events or circumstances if they do occur; and (iii) creating and maintaining a system designed to evaluate continuously business and market conditions in order to facilitate the identification and implementation processes described in (i) and (ii) above. Because the day-to-day operations and activities of the fund are carried out by or through FMR, its affiliates, and other service providers, the fund's exposure to risks is mitigated but not eliminated by the processes overseen by the Trustees. While each of the Board's committees has responsibility for overseeing different aspects of the fund's activities, oversight is exercised primarily through the Operations, Audit, and Compliance Committees. In addition, the Independent Trustees have worked with FMR to enhance the Board's oversight of investment and financial risks, legal and regulatory risks, technology risks, and operational risks, including the development of additional risk reporting to the Board. For example, a working group comprised of Independent Trustees and FMR has worked and continues to work to review the Fidelity® funds' valuation-related activities, reporting and risk management. Appropriate personnel, including but not limited to the fund's Chief Compliance Officer (CCO), FMR's internal auditor, the independent accountants, the fund's Treasurer and portfolio management personnel, make periodic reports to the Board's committees, as appropriate, including an annual review of Fidelity's risk management program for the Fidelity® funds. The responsibilities of each standing committee, including their oversight responsibilities, are described further under "Standing Committees of the Trustees."
Interested Trustees*:
Correspondence intended for a Trustee who is an interested person may be sent to Fidelity Investments, 245 Summer Street, Boston, Massachusetts 02210.
Name, Year of Birth; Principal Occupations and Other Relevant Experience+
Jonathan Chiel (1957)
Year of Election or Appointment: 2016
Trustee
Mr. Chiel also serves as Trustee of other Fidelity® funds. Mr. Chiel is Executive Vice President and General Counsel for FMR LLC (diversified financial services company, 2012-present). Previously, Mr. Chiel served as general counsel (2004-2012) and senior vice president and deputy general counsel (2000-2004) for John Hancock Financial Services; a partner with Choate, Hall & Stewart (1996-2000) (law firm); and an Assistant United States Attorney for the United States Attorney’s Office of the District of Massachusetts (1986-95), including Chief of the Criminal Division (1993-1995). Mr. Chiel is a director on the boards of the Boston Bar Foundation and the Maimonides School.
James C. Curvey (1935)
Year of Election or Appointment: 2007
Trustee
Chairman of the Board of Trustees
Mr. Curvey also serves as Trustee of other Fidelity® funds. Mr. Curvey is a Director of Fidelity Research & Analysis Co. (investment adviser firm, 2009-present), and Vice Chairman (2007-present) and Director of FMR LLC (diversified financial services company). In addition, Mr. Curvey serves as an Overseer for the Boston Symphony Orchestra and a member of the board of Artis-Naples, Naples, Florida, and as a Trustee for Brewster Academy, Wolfeboro, New Hampshire. Previously, Mr. Curvey served as a Director of Fidelity Investments Money Management, Inc. (investment adviser firm, 2009-2014) and a Director of FMR and FMR Co., Inc. (investment adviser firms, 2007-2014).
Charles S. Morrison (1960)
Year of Election or Appointment: 2014
Trustee
Mr. Morrison also serves as Trustee of other funds. He serves as President of Fidelity Management & Research Company (FMR) (investment adviser firm, 2016-present), a Director of Fidelity Investments Money Management, Inc. (FIMM) (investment adviser firm, 2014-present), Director of Fidelity SelectCo, LLC (investment adviser firm, 2014-present), President, Asset Management (2014-present), and is an employee of Fidelity Investments. Previously, Mr. Morrison served as Vice President of Fidelity's Fixed Income and Asset Allocation Funds (2012-2014), President, Fixed Income (2011-2014), Vice President of Fidelity's Money Market Funds (2005-2009), President, Money Market Group Leader of FMR (investment adviser firm, 2009), and Senior Vice President, Money Market Group of FMR (2004-2009). Mr. Morrison also served as Vice President of Fidelity's Bond Funds (2002-2005), certain Balanced Funds (2002-2005), and certain Asset Allocation Funds (2002-2007), and as Senior Vice President (2002-2005) of Fidelity's Bond Division.
* Determined to be an “Interested Trustee” by virtue of, among other things, his or her affiliation with the trust or various entities under common control with FMR.
+ The information includes the Trustee's principal occupation during the last five years and other information relating to the experience, attributes, and skills relevant to the Trustee's qualifications to serve as a Trustee, which led to the conclusion that the Trustee should serve as a Trustee for the fund.
Independent Trustees:
Correspondence intended for an Independent Trustee may be sent to Fidelity Investments, P.O. Box 55235, Boston, Massachusetts 02205-5235.
Name, Year of Birth; Principal Occupations and Other Relevant Experience+
Dennis J. Dirks (1948)
Year of Election or Appointment: 2005
Trustee
Mr. Dirks also serves as Trustee of other Fidelity® funds. Prior to his retirement in May 2003, Mr. Dirks was Chief Operating Officer and a member of the Board of The Depository Trust & Clearing Corporation (DTCC). He also served as President, Chief Operating Officer, and Board member of The Depository Trust Company (DTC) and President and Board member of the National Securities Clearing Corporation (NSCC). In addition, Mr. Dirks served as Chief Executive Officer and Board member of the Government Securities Clearing Corporation, Chief Executive Officer and Board member of the Mortgage-Backed Securities Clearing Corporation, as a Trustee and a member of the Finance Committee of Manhattan College (2005-2008), as a Trustee and a member of the Finance Committee of AHRC of Nassau County (2006-2008), as a member of the Independent Directors Council (IDC) Governing Council (2010-2015), and as a member of the Board of Directors for The Brookville Center for Children’s Services, Inc. (2009-2017). Mr. Dirks is a member of the Finance Committee (2016-present) and Board of Directors (2017-present) of the Asolo Repertory Theatre.
Alan J. Lacy (1953)
Year of Election or Appointment: 2008
Trustee
Mr. Lacy also serves as Trustee of other Fidelity® funds. Mr. Lacy serves as a Director of Bristol-Myers Squibb Company (global pharmaceuticals, 2008-present). He is a Trustee of the California Chapter of The Nature Conservancy (2015-present) and a Director of the Center for Advanced Study in the Behavioral Sciences at Stanford University (2015-present). In addition, Mr. Lacy served as Senior Adviser (2007-2014) of Oak Hill Capital Partners, L.P. (private equity) and also served as Chief Executive Officer (2005) and Vice Chairman (2005-2006) of Sears Holdings Corporation (retail) and Chief Executive Officer and Chairman of the Board of Sears, Roebuck and Co. (retail, 2000-2005). Previously, Mr. Lacy served as Chairman (2014-2017) and a member (2010-2017) of the Board of Directors of Dave & Buster’s Entertainment, Inc. (restaurant and entertainment complexes), as Chairman (2008-2011) and a member (2006-2015) of the Board of Trustees of the National Parks Conservation Association, and as a member of the Board of Directors for The Hillman Companies, Inc. (hardware wholesalers, 2010-2014), Earth Fare, Inc. (retail grocery, 2010-2014), and The Western Union Company (global money transfer, 2006-2011).
Ned C. Lautenbach (1944)
Year of Election or Appointment: 2000
Trustee
Chairman of the Independent Trustees
Mr. Lautenbach also serves as Trustee of other Fidelity® funds. Mr. Lautenbach currently serves as Vice Chair of the Board of Governors, State University System of Florida (2013-present) and is a member of the Council on Foreign Relations (1994-present). He is also a member and has most recently served as Chairman of the Board of Directors of Artis-Naples (2012-present). Previously, Mr. Lautenbach served as a member and then Lead Director of the Board of Directors of Eaton Corporation (diversified industrial, 1997-2016). He was also a Partner and Advisory Partner at Clayton, Dubilier & Rice, LLC (private equity investment, 1998-2010), as well as a Director of Sony Corporation (2006-2007). In addition, Mr. Lautenbach also had a 30-year career with IBM (technology company) during which time he served as Senior Vice President and a member of the Corporate Executive Committee (1968-1998).
Joseph Mauriello (1944)
Year of Election or Appointment: 2008
Trustee
Mr. Mauriello also serves as Trustee of other Fidelity® funds. Prior to his retirement in January 2006, Mr. Mauriello served in numerous senior management positions including Deputy Chairman and Chief Operating Officer (2004-2005), and Vice Chairman of Financial Services (2002-2004) of KPMG LLP US (professional services, 1965-2005). Mr. Mauriello currently serves as a member of the Board of Directors of XL Group plc. (global insurance and re-insurance, 2006-present) and the Independent Directors Council (IDC) Governing Council (2015-present). Previously, Mr. Mauriello served as a Director of the Hamilton Funds of the Bank of New York (2006-2007) and of Arcadia Resources Inc. (health care services and products, 2007-2012).
Cornelia M. Small (1944)
Year of Election or Appointment: 2005
Trustee
Ms. Small also serves as Trustee of other Fidelity® funds. Ms. Small is a member of the Board of Directors (2009-present) and Chair of the Investment Committee (2010-present) of the Teagle Foundation. Ms. Small also serves on the Investment Committee of the Berkshire Taconic Community Foundation (2008-present). Previously, Ms. Small served as Chairperson (2002-2008) and a member of the Investment Committee and Chairperson (2008-2012) and a member of the Board of Trustees of Smith College. In addition, Ms. Small served as Chief Investment Officer, Director of Global Equity Investments, and a member of the Board of Directors of Scudder, Stevens & Clark and Scudder Kemper Investments.
William S. Stavropoulos (1939)
Year of Election or Appointment: 2001
Trustee
Vice Chairman of the Independent Trustees
Mr. Stavropoulos also serves as Trustee of other Fidelity® funds. Mr. Stavropoulos serves as President and Founder of the Michigan Baseball Foundation, the Great Lakes Loons (2007-present). Mr. Stavropoulos is Chairman Emeritus of the Board of Directors of The Dow Chemical Company, where he previously served in numerous senior management positions, including President, CEO (1995-2000; 2002-2004), Chairman of the Executive Committee (2000-2006), and as a member of the Board of Directors (1990-2006). Currently, Mr. Stavropoulos is Chairman of the Board of Directors of Univar Inc. (global distributor of commodity and specialty chemicals), a Director of Teradata Corporation (data warehousing and technology solutions), and a member of the Advisory Board for Metalmark Capital LLC (private equity investment, 2005-present). Mr. Stavropoulos is an operating advisor to Clayton, Dubilier & Rice, LLC (private equity investment). In addition, Mr. Stavropoulos is a member of the University of Notre Dame Advisory Council for the College of Science, a Trustee of the Rollin L. Gerstacker Foundation, and a Director of Artis-Naples in Naples, Florida. Previously, Mr. Stavropoulos served as a Director of Chemical Financial Corporation (bank holding company, 1993-2012) and Tyco International, Ltd. (multinational manufacturing and services, 2007-2012).
David M. Thomas (1949)
Year of Election or Appointment: 2008
Trustee
Mr. Thomas also serves as Trustee of other Fidelity® funds. Mr. Thomas serves as Non-Executive Chairman of the Board of Directors of Fortune Brands Home and Security (home and security products, 2011-present), as a member of the Board of Directors (2004-present) and Presiding Director (2013-present) of Interpublic Group of Companies, Inc. (marketing communication), and as a member of the Board of Trustees of the University of Florida (2013-present). Previously, Mr. Thomas served as Executive Chairman (2005-2006) and Chairman and Chief Executive Officer (2000-2005) of IMS Health, Inc. (pharmaceutical and healthcare information solutions), and a Director of Fortune Brands, Inc. (consumer products, 2000-2011).
+ The information includes the Trustee's principal occupation during the last five years and other information relating to the experience, attributes, and skills relevant to the Trustee's qualifications to serve as a Trustee, which led to the conclusion that the Trustee should serve as a Trustee for the fund.
Advisory Board Members and Officers:
Correspondence intended for an officer or Peter S. Lynch may be sent to Fidelity Investments, 245 Summer Street, Boston, Massachusetts 02210. Officers appear below in alphabetical order.
Name, Year of Birth; Principal Occupation
Peter S. Lynch (1944)
Year of Election or Appointment: 2003
Member of the Advisory Board
Mr. Lynch also serves as Member of the Advisory Board of other Fidelity® funds. Mr. Lynch is Vice Chairman and a Director of FMR (investment adviser firm) and FMR Co., Inc. (investment adviser firm). In addition, Mr. Lynch serves as a Trustee of Boston College and as the Chairman of the Inner-City Scholarship Fund. Previously, Mr. Lynch served on the Special Olympics International Board of Directors (1997-2006).
Elizabeth Paige Baumann (1968)
Year of Election or Appointment: 2017
Anti-Money Laundering (AML) Officer
Ms. Baumann also serves as AML Officer of other funds. She is Chief AML Officer (2012-present) and Senior Vice President (2014-present) of FMR LLC (diversified financial services company) and is an employee of Fidelity Investments. Previously, Ms. Baumann served as AML Officer of the funds (2012-2016), and Vice President (2007-2014) and Deputy Anti-Money Laundering Officer (2007-2012) of FMR LLC.
Marc R. Bryant (1966)
Year of Election or Appointment: 2015
Secretary and Chief Legal Officer (CLO)
Mr. Bryant also serves as Secretary and CLO of other funds. Mr. Bryant serves as CLO, Secretary, and Senior Vice President of Fidelity Management & Research Company (investment adviser firm, 2015-present) and FMR Co., Inc. (investment adviser firm, 2015-present); Secretary of Fidelity SelectCo, LLC (investment adviser firm, 2015-present) and Fidelity Investments Money Management, Inc. (investment adviser firm, 2015-present); and CLO of Fidelity Management & Research (Hong Kong) Limited and FMR Investment Management (UK) Limited (investment adviser firms, 2015-present) and Fidelity Management & Research (Japan) Limited (investment adviser firm, 2016-present). He is Senior Vice President and Deputy General Counsel of FMR LLC (diversified financial services company). Previously, Mr. Bryant served as Secretary and CLO of Fidelity Rutland Square Trust II (2010-2014) and Assistant Secretary of Fidelity's Fixed Income and Asset Allocation Funds (2013-2015). Prior to joining Fidelity Investments, Mr. Bryant served as a Senior Vice President and the Head of Global Retail Legal for AllianceBernstein L.P. (2006-2010), and as the General Counsel for ProFund Advisors LLC (2001-2006).
William C. Coffey (1969)
Year of Election or Appointment: 2009
Assistant Secretary
Mr. Coffey also serves as Assistant Secretary of other funds. He is Senior Vice President and Deputy General Counsel of FMR LLC (diversified financial services company, 2010-present), and is an employee of Fidelity Investments. Previously, Mr. Coffey served as Vice President and Associate General Counsel of FMR LLC (2005-2009).
Jonathan Davis (1968)
Year of Election or Appointment: 2010
Assistant Treasurer
Mr. Davis also serves as Assistant Treasurer of other funds, and is an employee of Fidelity Investments. Previously, Mr. Davis served as Vice President and Associate General Counsel of FMR LLC (diversified financial services company, 2003-2010).
Adrien E. Deberghes (1967)
Year of Election or Appointment: 2016
Assistant Treasurer
Mr. Deberghes also serves as an officer of other funds. He serves as Executive Vice President of Fidelity Investments Money Management, Inc. (FIMM) (investment adviser firm, 2016-present) and is an employee of Fidelity Investments (2008-present). Prior to joining Fidelity Investments, Mr. Deberghes was Senior Vice President of Mutual Fund Administration at State Street Corporation (2007-2008), Senior Director of Mutual Fund Administration at Investors Bank & Trust (2005-2007), and Director of Finance for Dunkin' Brands (2000-2005). Previously, Mr. Deberghes served in other fund officer roles.
Joseph DeSantis (1959)
Year of Election or Appointment: 2017
Vice President
Mr. DeSantis also serves as Vice President of other funds. Mr. DeSantis serves as a Director of Fidelity Management & Research (Japan) Limited (investment adviser firm, 2016-present), Chief Investment Officer, Equities (2010-present) and is an employee of Fidelity Investments.
Stephanie J. Dorsey (1969)
Year of Election or Appointment: 2010
Assistant Treasurer
Ms. Dorsey also serves as an officer of other funds. She is an employee of Fidelity Investments (2008-present) and has served in other fund officer roles. Prior to joining Fidelity Investments, Ms. Dorsey served as Treasurer (2004-2008) of the JPMorgan Mutual Funds and Vice President (2004-2008) of JPMorgan Chase Bank.
Howard J. Galligan III (1966)
Year of Election or Appointment: 2014
Chief Financial Officer
Mr. Galligan also serves as Chief Financial Officer of other funds. Mr. Galligan serves as President of Fidelity Pricing and Cash Management Services (FPCMS) (2014-present) and as a Director of Strategic Advisers, Inc. (investment adviser firm, 2008-present). Previously, Mr. Galligan served as Chief Administrative Officer of Asset Management (2011-2014) and Chief Operating Officer and Senior Vice President of Investment Support for Strategic Advisers, Inc. (2003-2011).
Brian B. Hogan (1964)
Year of Election or Appointment: 2009
Vice President
Mr. Hogan also serves as Trustee or Vice President of other funds. Mr. Hogan serves as a Director of FMR Investment Management (UK) Limited (investment adviser firm, 2015-present) and Fidelity SelectCo, LLC (investment adviser firm, 2014-present) and President of the Equity Division of FMR (investment adviser firm, 2009-present). Previously, Mr. Hogan served as Senior Vice President, Equity Research of FMR (2006-2009) and as a portfolio manager. Mr. Brian B. Hogan is not related to Mr. Colm A. Hogan.
Colm A. Hogan (1973)
Year of Election or Appointment: 2016
Deputy Treasurer
Mr. Hogan also serves as an officer of other funds. Mr. Hogan is an employee of Fidelity Investments (2005-present). Mr. Colm A. Hogan is not related to Mr. Brian B. Hogan.
Chris Maher (1972)
Year of Election or Appointment: 2013
Assistant Treasurer
Mr. Maher serves as Assistant Treasurer of other funds. Mr. Maher is Vice President of Valuation Oversight and is an employee of Fidelity Investments. Previously, Mr. Maher served as Vice President of Asset Management Compliance (2013), Vice President of the Program Management Group of FMR (investment adviser firm, 2010-2013), and Vice President of Valuation Oversight (2008-2010).
Rieco E. Mello (1969)
Year of Election or Appointment: 2017
Assistant Treasurer
Mr. Mello also serves as Assistant Treasurer of other funds. Mr. Mello is an employee of Fidelity Investments (1995-present).
Kenneth B. Robins (1969)
Year of Election or Appointment: 2016
Chief Compliance Officer
Mr. Robins also serves as an officer of other funds. Mr. Robins serves as Compliance Officer of Fidelity Management & Research Company and FMR Co., Inc. (investment adviser firms, 2016-present) and is an employee of Fidelity Investments (2004-present). Previously, Mr. Robins served as Executive Vice President of Fidelity Investments Money Management, Inc. (investment adviser firm, 2013-2016) and served in other fund officer roles.
Stacie M. Smith (1974)
Year of Election or Appointment: 2016
President and Treasurer
Ms. Smith also serves as an officer of other funds. She is an employee of Fidelity Investments (2009-present) and has served in other fund officer roles. Prior to joining Fidelity Investments, Ms. Smith served as Senior Audit Manager of Ernst & Young LLP (accounting firm, 1996-2009). Previously, Ms. Smith served as Deputy Treasurer of certain Fidelity® funds (2013-2016).
Marc L. Spector (1972)
Year of Election or Appointment: 2016
Assistant Treasurer
Mr. Spector also serves as an officer of other funds. Mr. Spector is an employee of Fidelity Investments (2016-present). Prior to joining Fidelity Investments, Mr. Spector served as Director at the Siegfried Group (accounting firm, 2013-2016), and prior to Siegfried Group as audit senior manager at Deloitte & Touche (accounting firm, 2005-2013).
Renee Stagnone (1975)
Year of Election or Appointment: 2016
Assistant Treasurer
Ms. Stagnone also serves as an officer of other funds. Ms. Stagnone is an employee of Fidelity Investments (1997-present). Previously, Ms. Stagnone served as Deputy Treasurer of certain Fidelity® funds (2013-2016).
Shareholder Expense Example
As a shareholder of the Fund, you incur two types of costs: (1) transaction costs, including sales charges (loads) on purchase payments or redemption proceeds, redemption fees and (2) ongoing costs, including management fees, distribution and/or service (12b-1) fees and other Fund expenses. This Example is intended to help you understand your ongoing costs (in dollars) of investing in the Fund and to compare these costs with the ongoing costs of investing in other mutual funds.
The Example is based on an investment of $1,000 invested at the beginning of the period and held for the entire period (May 1, 2017 to October 31, 2017).
Actual Expenses
The first line of the accompanying table for each class of the Fund provides information about actual account values and actual expenses. You may use the information in this line, together with the amount you invested, to estimate the expenses that you paid over the period. Simply divide your account value by $1,000.00 (for example, an $8,600 account value divided by $1,000.00 = 8.6), then multiply the result by the number in the first line for a class of the Fund under the heading entitled "Expenses Paid During Period" to estimate the expenses you paid on your account during this period. A small balance maintenance fee of $12.00 that is charged once a year may apply for certain accounts with a value of less than $2,000. This fee is not included in the table below. If it was, the estimate of expenses you paid during the period would be higher, and your ending account value lower, by this amount. In addition, the Fund, as a shareholder in the underlying Fidelity Central Funds, will indirectly bear its pro-rata share of the fees and expenses incurred by the underlying Fidelity Central Funds. These fees and expenses are not included in the Fund's annualized expense ratio used to calculate the expense estimate in the table below.
Hypothetical Example for Comparison Purposes
The second line of the accompanying table for each class of the Fund provides information about hypothetical account values and hypothetical expenses based on a Class' actual expense ratio and an assumed rate of return of 5% per year before expenses, which is not the Class' actual return. The hypothetical account values and expenses may not be used to estimate the actual ending account balance or expenses you paid for the period. You may use this information to compare the ongoing costs of investing in the Fund and other funds. To do so, compare this 5% hypothetical example with the 5% hypothetical examples that appear in the shareholder reports of the other funds. A small balance maintenance fee of $12.00 that is charged once a year may apply for certain accounts with a value of less than $2,000. This fee is not included in the table below. If it was, the estimate of expenses you paid during the period would be higher, and your ending account value lower, by this amount. In addition, the Fund, as a shareholder in the underlying Fidelity Central Funds, will indirectly bear its pro-rata share of the fees and expenses incurred by the underlying Fidelity Central Funds. These fees and expenses are not included in the Fund's annualized expense ratio used to calculate the expense estimate in the table below.
Please note that the expenses shown in the table are meant to highlight your ongoing costs only and do not reflect any transaction costs. Therefore, the second line of the table is useful in comparing ongoing costs only, and will not help you determine the relative total costs of owning different funds. In addition, if these transactional costs were included, your costs would have been higher.
| | Annualized Expense Ratio-A | Beginning
Account Value
May 1, 2017 | Ending
Account Value
October 31, 2017 | Expenses Paid
During Period-B
May 1, 2017
to October 31, 2017 |
| Class A | 1.14% | | | |
| Actual | | $1,000.00 | $1,152.90 | $6.19 |
| Hypothetical-C | | $1,000.00 | $1,019.46 | $5.80 |
| Class M | 1.48% | | | |
| Actual | | $1,000.00 | $1,150.50 | $8.02 |
| Hypothetical-C | | $1,000.00 | $1,017.74 | $7.53 |
| Class C | 1.83% | | | |
| Actual | | $1,000.00 | $1,149.50 | $9.91 |
| Hypothetical-C | | $1,000.00 | $1,015.98 | $9.30 |
| Japan | .85% | | | |
| Actual | | $1,000.00 | $1,155.00 | $4.62 |
| Hypothetical-C | | $1,000.00 | $1,020.92 | $4.33 |
| Class I | .78% | | | |
| Actual | | $1,000.00 | $1,155.10 | $4.24 |
| Hypothetical-C | | $1,000.00 | $1,021.27 | $3.97 |
A Annualized expense ratio reflects expenses net of applicable fee waivers.
B Expenses are equal to each Class' annualized expense ratio, multiplied by the average account value over the period, multiplied by 184/365 (to reflect the one-half year period).
C 5% return per year before expenses
Distributions (Unaudited)
The Board of Trustees of Fidelity Japan Fund voted to pay to shareholders of record at the opening of business on record date, the following distributions per share derived from capital gains realized from sales of portfolio securities, and dividends derived from net investment income:
| | Pay Date | Record Date | Dividends | Capital Gains |
| Fidelity Japan Fund | | | | |
| Class A | 12/11/17 | 12/08/17 | $0.078 | $0.035 |
| Class M | 12/11/17 | 12/08/17 | $0.047 | $0.035 |
| Class C | 12/11/17 | 12/08/17 | $0.003 | $0.035 |
| Japan | 12/11/17 | 12/08/17 | $0.107 | $0.035 |
| Class I | 12/11/17 | 12/08/17 | $0.135 | $0.035 |
| | | | | |
Class A, Class M, Japan, and Class I designate 100% of the dividends distributed during the fiscal year as amounts which may be taken into account as a dividend for purposes of the maximum rate under section 1(h)(11) of the Internal Revenue Code.
The amounts per share which represent income derived from sources within, and taxes paid to, foreign countries or possessions of the United States are as follows:
| | Pay Date | Income | Taxes |
| Fidelity Japan Fund | | | |
| Class A | 12/12/16 | $0.1187 | $0.0247 |
| Class M | 12/12/16 | $0.0687 | $0.0247 |
| Japan | 12/12/16 | $0.1707 | $0.0247 |
| Class I | 12/12/16 | $0.1687 | $0.0247 |
|
The fund will notify shareholders in January 2018 of amounts for use in preparing 2017 income tax returns.
Board Approval of Investment Advisory Contracts and Management Fees
Fidelity Japan Fund
Each year, the Board of Trustees, including the Independent Trustees (together, the Board), votes on the renewal of the management contract with Fidelity Management & Research Company (FMR) and the sub-advisory agreements (together, the Advisory Contracts) for the fund. FMR and the sub-advisers are referred to herein as the Investment Advisers. The Board, assisted by the advice of fund counsel and Independent Trustees' counsel, requests and considers a broad range of information relevant to the renewal of the Advisory Contracts throughout the year.
The Board meets regularly and, at each of its meetings, covers an extensive agenda of topics and materials and considers factors that are relevant to its annual consideration of the renewal of the fund's Advisory Contracts, including the services and support provided to the fund and its shareholders. The Board has established various standing committees (Committees), each composed of and chaired by Independent Trustees with varying backgrounds, to which the Board has assigned specific subject matter responsibilities in order to enhance effective decision-making by the Board. The Board, acting directly and through its Committees, requests and receives information concerning the annual consideration of the renewal of the fund's Advisory Contracts. The Board also meets as needed to review matters specifically related to the Board's annual consideration of the renewal of the Advisory Contracts. Members of the Board may also meet with trustees of other Fidelity funds through ad hoc joint committees to discuss certain matters relevant to all of the Fidelity funds.
At its July 2017 meeting, the Board unanimously determined to renew the fund's Advisory Contracts. In reaching its determination, the Board considered all factors it believed relevant, including (i) the nature, extent, and quality of the services to be provided to the fund and its shareholders (including the investment performance of the fund); (ii) the competitiveness of the fund's management fee and total expense ratio relative to peer funds; (iii) the total costs of the services to be provided by and the profits to be realized by Fidelity from its relationships with the fund; and (iv) the extent to which, if any, economies of scale exist and would be realized as the fund grows, and whether any economies of scale are appropriately shared with fund shareholders.
In considering whether to renew the Advisory Contracts for the fund, the Board reached a determination, with the assistance of fund counsel and Independent Trustees' counsel and through the exercise of its business judgment, that the renewal of the Advisory Contracts was in the best interests of the fund and its shareholders and that the compensation payable under the Advisory Contracts was fair and reasonable. The Board's decision to renew the Advisory Contracts was not based on any single factor, but rather was based on a comprehensive consideration of all the information provided to the Board at its meetings throughout the year. The Board, in reaching its determination to renew the Advisory Contracts, was aware that shareholders of the fund have a broad range of investment choices available to them, including a wide choice among funds offered by Fidelity's competitors, and that the fund's shareholders, who have the opportunity to review and weigh the disclosure provided by the fund in its prospectus and other public disclosures, have chosen to invest in this fund, which is part of the Fidelity family of funds.
Amendment to Group Fee Rate. The Board also approved an amendment to the management contract for the fund to add an additional breakpoint to the group fee schedule, effective October 1, 2017. The Board noted that the additional breakpoint would result in lower management fee rates as Fidelity's assets under management increase.
Nature, Extent, and Quality of Services Provided. The Board considered Fidelity's staffing as it relates to the fund, including the backgrounds of investment personnel of Fidelity, and also considered the fund's investment objective, strategies, and related investment philosophy. The Independent Trustees also had discussions with senior management of Fidelity's investment operations and investment groups. The Board considered the structure of the investment personnel compensation program and whether this structure provides appropriate incentives to act in the best interests of the fund. Additionally, the Board considered the portfolio managers' investments, if any, in the funds that they manage.
Resources Dedicated to Investment Management and Support Services. The Board and the Fund Oversight and Research Committees reviewed the general qualifications and capabilities of Fidelity's investment staff, including its size, education, experience, and resources, as well as Fidelity's approach to recruiting, training, managing, and compensating investment personnel. The Board noted that Fidelity has continued to increase the resources devoted to non-U.S. offices, including expansion of Fidelity's global investment organization. The Board also noted that Fidelity's analysts have extensive resources, tools and capabilities that allow them to conduct sophisticated quantitative and fundamental analysis, as well as credit analysis of issuers, counterparties and guarantors. Further, the Board considered that Fidelity's investment professionals have sufficient access to global information and data so as to provide competitive investment results over time, and that those professionals also have access to sophisticated tools that permit them to assess portfolio construction and risk and performance attribution characteristics continuously, as well as to transmit new information and research conclusions rapidly around the world. Additionally, in its deliberations, the Board considered Fidelity's trading, risk management, compliance, and technology and operations capabilities and resources, which are integral parts of the investment management process.
Shareholder and Administrative Services. The Board considered (i) the nature, extent, quality, and cost of advisory, administrative, and shareholder services performed by the Investment Advisers and their affiliates under the Advisory Contracts and under separate agreements covering transfer agency, pricing and bookkeeping, and securities lending services for the fund; (ii) the nature and extent of the supervision of third party service providers, principally custodians, subcustodians, and pricing vendors; and (iii) the resources devoted to, and the record of compliance with, the fund's compliance policies and procedures. The Board also reviewed the allocation of fund brokerage, including allocations to brokers affiliated with the Investment Advisers, the use of brokerage commissions to pay fund expenses, and the use of "soft" commission dollars to pay for research services.
The Board noted that the growth of fund assets over time across the complex allows Fidelity to reinvest in the development of services designed to enhance the value or convenience of the Fidelity funds as investment vehicles. These services include 24-hour access to account information and market information through telephone representatives and over the Internet, investor education materials and asset allocation tools, and the expanded availability of Fidelity Investor Centers.
In 2014, the Board formed an ad hoc Committee on Transfer Agency Fees to review the variety of transfer agency fee structures throughout the industry and Fidelity's competitive positioning with respect to industry participants.
Investment in a Large Fund Family. The Board considered the benefits to shareholders of investing in a Fidelity fund, including the benefits of investing in a fund that is part of a large family of funds offering a variety of investment disciplines and providing a large variety of mutual fund investor services. The Board noted that Fidelity had taken, or had made recommendations that resulted in the Fidelity funds taking, a number of actions over the previous year that benefited particular funds, including: (i) continuing to dedicate additional resources to Fidelity's investment research process, and to the support of the senior management team that oversees asset management; (ii) continuing efforts to enhance Fidelity's global research capabilities; (iii) launching new funds and making other enhancements to meet client needs; (iv) launching new share classes of existing funds; (v) eliminating purchase minimums and broadening eligibility requirements for certain lower-priced share classes; (vi) reducing management fees and total expenses for certain growth equity funds and index funds; (vii) lowering expense caps for certain existing funds and classes to reduce expenses borne by shareholders; (viii) eliminating short-term redemption fees for certain funds; (ix) introducing a new pricing structure for certain funds of funds that is expected to reduce overall expenses paid by shareholders; (x) rationalizing product lines and gaining increased efficiencies through proposals for fund mergers and share class consolidations; (xi) continuing to develop, acquire and implement systems and technology to improve services to the funds and shareholders, strengthen information security, and increase efficiency; and (xii) implementing enhancements to further strengthen Fidelity's product line to increase investors' probability of success in achieving their investment goals, including retirement income goals.
Investment Performance. The Board considered whether the fund has operated in accordance with its investment objective, as well as its record of compliance with its investment restrictions and its performance history. The Board noted that there was a portfolio management change for the fund in March 2014.
The Board took into account discussions with representatives of the Investment Advisers about fund investment performance that occur at Board meetings throughout the year. In this regard the Board noted that as part of regularly scheduled fund reviews and other reports to the Board on fund performance, the Board considers annualized return information for the fund for different time periods, measured against a securities market index ("benchmark index") and a peer group of funds with similar objectives ("peer group"), if any. In its evaluation of fund investment performance, the Board gave particular attention to information indicating changes in performance of certain Fidelity funds for specific time periods and discussed with the Investment Advisers the reasons for any overperformance or underperformance.
In addition to reviewing absolute and relative fund performance, the Independent Trustees periodically consider the appropriateness of fund performance metrics in evaluating the results achieved. In general, the Independent Trustees believe that fund performance should be evaluated based on net performance (after fees and expenses) of both the highest performing and lowest performing fund share classes, where applicable, compared to appropriate benchmark indices, over appropriate time periods that may include full market cycles, and compared to peer groups, as applicable, over the same periods, taking into account relevant factors including the following: general market conditions; issuer-specific information; and fund cash flows and other factors.
The Independent Trustees recognize that shareholders evaluate performance on a net basis over their own holding periods, for which one-, three-, and five-year periods are often used as a proxy. For this reason, the performance information reviewed by the Board also included net cumulative calendar year total return information for the fund and an appropriate benchmark index and peer group for the most recent one-, three-, and five-year periods, as shown below. Returns are shown compared to the 25th percentile (top of box, 75% beaten) and 75th percentile (bottom of box, 25% beaten) of the peer universe.
Fidelity Japan Fund

The Board also considered that the fund's management fee is subject to upward or downward adjustment depending upon whether, and to what extent, the fund's investment performance for the performance period (a rolling 36-month period) exceeds, or is exceeded by, a securities index, thus leading to a performance adjustment for the same period. The Board noted that the performance adjustment provides FMR with a strong economic incentive to seek to achieve superior long-term performance for the fund's shareholders and helps to more closely align the interests of FMR and the shareholders of the fund.
Based on its review, the Board concluded that the nature, extent, and quality of services provided to the fund under the Advisory Contracts should continue to benefit the shareholders of the fund.
Competitiveness of Management Fee and Total Expense Ratio. The Board considered the fund's management fee and total expense ratio compared to "mapped groups" of competitive funds and classes created for the purpose of facilitating the Trustees' competitive analysis of management fees and total expenses. Fidelity creates "mapped groups" by combining similar Lipper investment objective categories that have comparable investment mandates. Combining Lipper investment objective categories aids the Board's management fee and total expense ratio comparisons by broadening the competitive group used for comparison.
Management Fee. The Board considered two proprietary management fee comparisons for the 12-month periods shown in basis points (BP) in the chart below. The group of Lipper funds used by the Board for management fee comparisons is referred to below as the "Total Mapped Group." The Total Mapped Group is broader than the Lipper peer group used by the Board for performance comparisons because the Total Mapped Group combines several Lipper investment objective categories while the Lipper peer group does not. The Total Mapped Group comparison focuses on a fund's standing in terms of gross management fees before expense reimbursements or caps, and without giving effect to the fund's performance adjustment, relative to the total universe of funds with comparable investment mandates, regardless of whether their management fee structures also are comparable. Funds with comparable investment mandates offer exposure to similar types of securities. Funds with comparable management fee structures have similar management fee contractual arrangements (
e.g., flat rate charged for advisory services, all-inclusive fee rate,
etc.). "TMG %" represents the percentage of funds in the Total Mapped Group that had management fees that were lower than the fund's. For example, a hypothetical TMG % of 20% would mean that 80% of the funds in the Total Mapped Group had higher, and 20% had lower, management fees than the fund. The fund's actual TMG %s and the number of funds in the Total Mapped Group are in the chart below. The "Asset-Size Peer Group" (ASPG) comparison focuses on a fund's standing relative to a subset of non-Fidelity funds within the Total Mapped Group that are similar in size and management fee structure without taking into account performance adjustments, if any. For example, if a fund is in the first quartile of the ASPG, the fund's management fee ranks in the least expensive or lowest 25% of funds in the ASPG. The ASPG represents at least 15% of the funds in the Total Mapped Group with comparable asset size and management fee structures, subject to a minimum of 50 funds (or all funds in the Total Mapped Group if fewer than 50). Additional information, such as the ASPG quartile in which the fund's management fee rate ranked and the impact of the fund's performance adjustment, is also included in the chart and considered by the Board.
Fidelity Japan Fund

The Board noted that the fund's management fee rate ranked below the median of its Total Mapped Group and below the median of its ASPG for 2016. The Board also noted the effect of the fund's performance adjustment, if any, on the fund's management fee ranking.
The Board noted that, in 2014, the Board and the boards of other Fidelity funds formed the ad hoc Committee on Group Fee to conduct an in-depth review of the "group fee" component of the management fee of funds with such management fee structures. The Committee's focus included the mechanics of the group fee, the competitive landscape of group fee structures, Fidelity funds with no group fee component and investment products not included in group fee assets. The Board also considered that, for funds subject to the group fee, FMR agreed to voluntarily waive fees over a specified period of time in amounts designed to account for assets converted from certain funds to certain collective investment trusts.
The Board also noted that, in 2013, the ad hoc Committee on Management Fees was formed to conduct an in-depth review of the management fee rates of Fidelity's active equity mutual funds. The Committee focused on the following areas: (i) standard fee structures; (ii) research consumption and trading evolution; (iii) management fee competitiveness/profitability by category; and (iv) factors that drive institutional pricing.
Based on its review, the Board concluded that the fund's management fee is fair and reasonable in light of the services that the fund receives and the other factors considered.
Total Expense Ratio. In its review of each class's total expense ratio, the Board considered the fund's management fee rate as well as other fund or class expenses, as applicable, such as transfer agent fees, pricing and bookkeeping fees, fund-paid 12b-1 fees, and custodial, legal, and audit fees. The Board noted the impact of the fund's performance adjustment. The Board also noted that Fidelity may agree to waive fees and expenses from time to time, and the extent to which, if any, it has done so for the fund. As part of its review, the Board also considered the current and historical total expense ratios of each class of the fund compared to competitive fund median expenses. Each class of the fund is compared to those funds and classes in the Total Mapped Group (used by the Board for management fee comparisons) that have a similar sales load structure.
The Board noted that the total expense ratio of each of Class A, Class C, Class I, and the retail class ranked below the competitive median for 2016 and the total expense ratio of Class M (formerly Class T) ranked above the competitive median for 2016. The Board considered that, in general, various factors can affect total expense ratios. The Board noted that the total expense ratio of Class M was above the competitive median primarily because of higher 12b-1 fees on Class M as compared to most competitor funds. Class M has a higher 12b-1 fee, but a lower front-end sales charge, than traditionally priced front-end sales charge classes. The Board considered that Class M is primarily sold load-waived in the retirement plan market where its 0.50% 12b-1 fee is comparable to competing no-load, higher 12b-1 fee classes designed specifically for retirement plans. The Board noted that the fund offers multiple classes, each of which has a different sales load and 12b-1 fee structure, and that the multiple structures are intended to offer a range of pricing options for the intermediary market. The Board also noted that the total expense ratios of the classes vary primarily by the level of their 12b-1 fees, although differences in transfer agent fees may also cause expenses to vary from class to class.
Fees Charged to Other Fidelity Clients. The Board also considered Fidelity fee structures and other information with respect to clients of Fidelity, such as other funds advised or subadvised by Fidelity, pension plan clients, and other institutional clients with similar mandates. The Board noted that an ad hoc joint committee created by it and the boards of other Fidelity funds periodically (most recently in 2013) reviews and compares Fidelity's institutional investment advisory business with its business of providing services to the Fidelity funds, including the differences in services provided, fees charged, and costs incurred, as well as competition in their respective marketplaces.
Based on its review of total expense ratios and fees charged to other Fidelity clients, the Board concluded that, although Class M was above the median of the universe presented for comparison, the total expense ratio of each class of the fund was reasonable in light of the services that the fund and its shareholders receive and the other factors considered.
Costs of the Services and Profitability. The Board considered the revenues earned and the expenses incurred by Fidelity in conducting the business of developing, marketing, distributing, managing, administering and servicing the fund and servicing the fund's shareholders. The Board also considered the level of Fidelity's profits in respect of all the Fidelity funds.
On an annual basis, Fidelity presents to the Board information about the profitability of its relationships with the fund. Fidelity calculates profitability information for each fund, as well as aggregate profitability information for groups of Fidelity funds and all Fidelity funds, using a series of detailed revenue and cost allocation methodologies which originate with the books and records of Fidelity on which Fidelity's audited financial statements are based. The Audit Committee of the Board reviews any significant changes from the prior year's methodologies.
PricewaterhouseCoopers LLP (PwC), independent registered public accounting firm and auditor to Fidelity and certain Fidelity funds, has been engaged annually by the Board as part of the Board's assessment of Fidelity's profitability analysis. PwC's engagement includes the review and assessment of the methodologies used by Fidelity in determining the revenues and expenses attributable to Fidelity's mutual fund business, and completion of agreed-upon procedures in respect of the mathematical accuracy of the fund profitability information and its conformity to established allocation methodologies. After considering PwC's reports issued under the engagement and information provided by Fidelity, the Board concluded that while other allocation methods may also be reasonable, Fidelity's profitability methodologies are reasonable in all material respects.
The Board also reviewed Fidelity's non-fund businesses and potential fall-out benefits related to the mutual fund business as well as cases where Fidelity's affiliates may benefit from or be related to the fund's business.
The Board considered the costs of the services provided by and the profits realized by Fidelity in connection with the operation of the fund and was satisfied that the profitability was not excessive.
Economies of Scale. The Board considered whether there have been economies of scale in respect of the management of the Fidelity funds, whether the Fidelity funds (including the fund) have appropriately benefited from any such economies of scale, and whether there is potential for realization of any further economies of scale. The Board considered the extent to which the fund will benefit from economies of scale as assets grow through increased services to the fund, through waivers or reimbursements, or through fee or expense ratio reductions. The Board also noted that a committee (the Economies of Scale Committee) created by it and the boards of other Fidelity funds periodically (most recently in 2013) analyzes whether Fidelity attains economies of scale in respect of the management and servicing of the Fidelity funds, whether the Fidelity funds have appropriately benefited from such economies of scale, and whether there is potential for realization of any further economies of scale.
The Board recognized that the fund's management contract incorporates a "group fee" structure, which provides for lower group fee rates as total group assets increase, and for higher group fee rates as total group assets decrease (with "group assets" defined to include fund assets under FMR's management plus the assets of sector funds previously under FMR's management). FMR calculates the group fee rates based on a tiered asset "breakpoint" schedule that varies based on asset class. The Board considered that the group fee is designed to deliver the benefits of economies of scale to fund shareholders when total Fidelity fund assets increase, even if assets of any particular fund are unchanged or have declined, because some portion of Fidelity's costs are attributable to services provided to all Fidelity funds, and all funds benefit if those costs can be allocated among more assets. The Board concluded that, given the group fee structure, fund shareholders will benefit from lower management fees as group assets increase at the fund complex level, regardless of whether Fidelity achieves any such economies of scale.
The Board concluded, taking into account the analysis of the Economies of Scale Committee, that economies of scale, if any, are being appropriately shared between fund shareholders and Fidelity.
Additional Information Requested by the Board. In order to develop fully the factual basis for consideration of the Fidelity funds' advisory contracts, the Board requested and received additional information on certain topics, including: (i) fund performance trends, in particular the underperformance of certain funds, and Fidelity's long-term strategies for certain funds; (ii) Fidelity's fund profitability methodology, profitability trends for certain funds, and the impact of certain factors on fund profitability results, including the impact of market trends on actively managed funds; (iii) the use of performance fees and the calculation of performance adjustments, including the impact of underperformance and fund outflows on performance adjustments; (iv) metrics for evaluating index fund performance; (v) Fidelity's group fee structure, including the group fee breakpoint schedules; (vi) the terms of Fidelity's contractual and voluntary expense cap arrangements with the funds; (vii) the methodology with respect to evaluating competitive fund data and peer group classifications and fee comparisons; (viii) the expense structures for different funds and classes; (ix) Fidelity's arrangements with affiliated sub-advisers on behalf of the funds; (x) information regarding other accounts managed by Fidelity, including institutional accounts and collective investment trusts; (xi) recent changes to the fee structure for certain funds of funds; and (xii) the impact of the Department of Labor's new fiduciary rule on the funds' comparative expense information.
Based on its evaluation of all of the conclusions noted above, and after considering all factors it believed relevant, the Board concluded that the advisory fee structures are fair and reasonable, and that the fund's Advisory Contracts should be renewed.
AJPNA-ANN-1217
1.917389.106
Fidelity Advisor® Latin America Fund - Class A, Class M (formerly Class T), Class C and Class I
Annual Report October 31, 2017 Class A, Class M, Class C and Class I are classes of Fidelity® Latin America Fund |
|
Contents
To view a fund's proxy voting guidelines and proxy voting record for the 12-month period ended June 30, visit http://www.fidelity.com/proxyvotingresults or visit the Securities and Exchange Commission's (SEC) web site at http://www.sec.gov.
You may also call 1-877-208-0098 to request a free copy of the proxy voting guidelines.
Standard & Poor's, S&P and S&P 500 are registered service marks of The McGraw-Hill Companies, Inc. and have been licensed for use by Fidelity Distributors Corporation.
Other third-party marks appearing herein are the property of their respective owners.
All other marks appearing herein are registered or unregistered trademarks or service marks of FMR LLC or an affiliated company. © 2017 FMR LLC. All rights reserved.
This report and the financial statements contained herein are submitted for the general information of the shareholders of the Fund. This report is not authorized for distribution to prospective investors in the Fund unless preceded or accompanied by an effective prospectus.
A fund files its complete schedule of portfolio holdings with the SEC for the first and third quarters of each fiscal year on Form N-Q. Forms N-Q are available on the SEC’s web site at http://www.sec.gov. A fund's Forms N-Q may be reviewed and copied at the SEC’s Public Reference Room in Washington, DC. Information regarding the operation of the SEC's Public Reference Room may be obtained by calling 1-800-SEC-0330.
For a complete list of a fund's portfolio holdings, view the most recent holdings listing, semiannual report, or annual report on Fidelity's web site at http://www.fidelity.com, http://www.institutional.fidelity.com, or http://www.401k.com, as applicable.
NOT FDIC INSURED •MAY LOSE VALUE •NO BANK GUARANTEE
Neither the Fund nor Fidelity Distributors Corporation is a bank.
Performance: The Bottom Line
Average annual total return reflects the change in the value of an investment, assuming reinvestment of distributions from dividend income and capital gains (the profits earned upon the sale of securities that have grown in value, if any) and assuming a constant rate of performance each year. The hypothetical investment and the average annual total returns do not reflect the deduction of taxes that a shareholder would pay on fund distributions or the redemption of fund shares. During periods of reimbursement by Fidelity, a fund’s total return will be greater than it would be had the reimbursement not occurred. How a fund did yesterday is no guarantee of how it will do tomorrow.
Average Annual Total Returns
| For the periods ended October 31, 2017 | Past 1 year | Past 5 years | Past 10 years |
| Class A (incl. 5.75% sales charge) | 7.02% | (6.05)% | (5.16)% |
| Class M (incl. 3.50% sales charge) | 9.28% | (5.86)% | (5.11)% |
| Class C (incl. contingent deferred sales charge) | 11.71% | (5.64)% | (5.10)% |
| Class I | 13.94% | (4.60)% | (4.36)% |
Class A shares bear a 0.25% 12b-1 fee. The initial offering of Class A shares took place on September 28, 2010. Returns prior to September 28, 2010, are those of Fidelity® Latin America Fund, the original class of the fund, which has no 12b-1 fee. Had Class A's 12b-1 fee been reflected, returns prior to September 28, 2010, would have been lower.
Class M shares bear a 0.50% 12b-1 fee. The initial offering of Class M shares took place on September 28, 2010. Returns prior to September 28, 2010, are those of Fidelity® Latin America Fund, the original class of the fund, which has no 12b-1 fee. Had Class M's 12b-1 fee been reflected, returns prior to September 28, 2010, would have been lower.
Class C shares bear a 1.00% 12b-1 fee. The initial offering of Class C shares took place on September 28, 2010. Returns prior to September 28, 2010, are those of Fidelity® Latin America Fund, the original class of the fund, which has no 12b-1 fee. Had Class C's 12b-1 fee been reflected, returns prior to September 28, 2010, would have been lower.
Class C shares' contingent deferred sales charges included in the past one year, past five years and past ten years total return figures are 1%, 0% and 0%, respectively.
The initial offering of Class I shares took place on September 28, 2010. Returns prior to September 28, 2010 are those of Fidelity® Latin America Fund, the original class of the fund.
$10,000 Over 10 Years
Let's say hypothetically that $10,000 was invested in Fidelity Advisor® Latin America Fund - Class A on October 31, 2007, and the current 5.75% sales charge was paid.
The chart shows how the value of your investment would have changed, and also shows how the MSCI EM (Emerging Markets) Latin America Index performed over the same period.
See above for additional information regarding the performance of Class A.
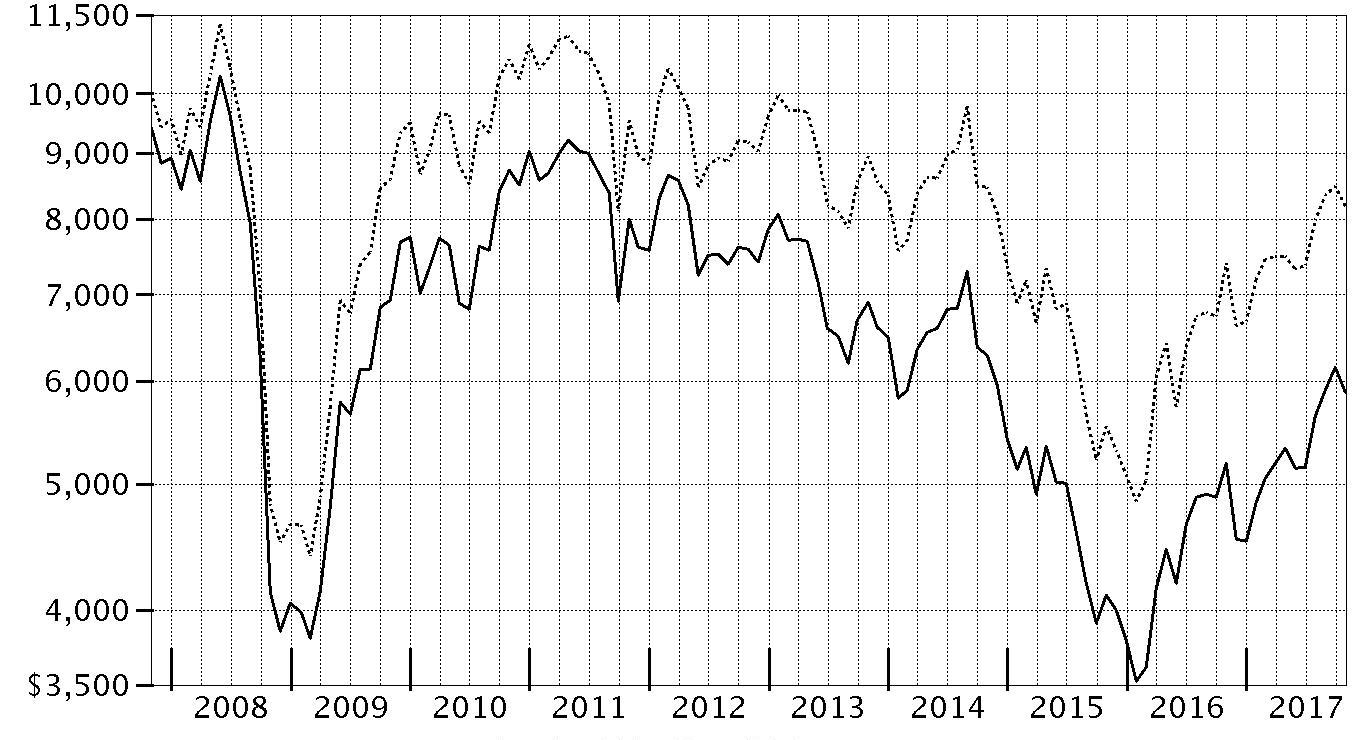
| Period Ending Values |
| $5,890 | Fidelity Advisor® Latin America Fund - Class A |
| $8,182 | MSCI EM (Emerging Markets) Latin America Index |
Management's Discussion of Fund Performance
Market Recap: The MSCI ACWI (All Country World Index) ex USA Index returned 23.85% for the 12 months ending October 31, 2017, helped partly by a generally weak U.S. dollar. Some favorable election results in continental Europe (+30%) suggested ebbing political uncertainty and near-term risk there, but the U.K. (+20%) faced more-mixed conditions ahead of its expected exit from the European Union. Despite central-bank easing – and pressured recently by yen strength – Japan (+18%) lagged the rest of the Asia-Pacific group (+22%). Commodity-price volatility slowed Canada (+17%), but the emerging-markets group (+26%) sped ahead. Sector-wise, information technology (+47%) was driven by a surge among several Chinese internet-related names. Financials (+27%) rode rising interest rates that, at the same time, weighed on real estate (+17%), utilities (+16%), consumer staples (+14%) and telecommunication services (+9%) – so-called “bond proxy” sectors. Materials (+28%) and industrials (+27%) responded to demand from China and price gains for certain commodities. In the energy sector (+20%), oil prices lost ground in the spring before rebounding through October 31 to end well above where they started 12 months ago. Lastly, health care (+14%) was hurt by early-period turmoil around drug pricing and health care legislation.
Comments from Portfolio Manager Will Pruett: For the year, the fund’s share classes (excluding sales charges, if applicable) gained roughly 13% to 14%, ahead of the 10.50% return of the benchmark MSCI Emerging Markets Latin America Index. Versus the benchmark, stock selection in Brazil helped most. Here, for-profit education company Estacio Participacoes contributed more than any other individual holding. Brazil's regulators in June blocked a planned takeover of the company by Kroton Educacional. Shares rallied significantly after the deal rejection, however, as by that time, Estacio had made significant progress increasing its profit margins. Smiles (provider of frequent-flyer programs), CVC Brasil Operadora (tourism services) and Alpargatas (apparel maker best known for its Havaianas
® flip-flops) also did well. Further, non-benchmark exposure to stocks of companies in Panama proved helpful this period. Conversely, stock picking in Mexico significantly detracted, while positioning in Chile and the fund’s stake in cash hurt to a much lesser extent. By individual stock, our stake in Mexico-based Gentera hurt most. The firm, which provides working-capital loans for women's groups, struggled amid increased competition and failed cross-selling efforts. Underweighting Brazil-based Vale, the world’s largest producer of nickel and iron ore, also detracted, as its shares rose 46% this period.
The views expressed above reflect those of the portfolio manager(s) only through the end of the period as stated on the cover of this report and do not necessarily represent the views of Fidelity or any other person in the Fidelity organization. Any such views are subject to change at any time based upon market or other conditions and Fidelity disclaims any responsibility to update such views. These views may not be relied on as investment advice and, because investment decisions for a Fidelity fund are based on numerous factors, may not be relied on as an indication of trading intent on behalf of any Fidelity fund.
Investment Summary (Unaudited)
Geographic Diversification (% of fund's net assets)
| As of October 31, 2017 |
| | Brazil | 65.0% |
| | Mexico | 17.6% |
| | Panama | 4.5% |
| | Bermuda | 3.7% |
| | United States of America* | 3.1% |
| | Spain | 2.0% |
| | United Kingdom | 1.8% |
| | Luxembourg | 1.3% |
| | Chile | 1.0% |

* Amount is stated in United States dollars unless otherwise noted.
Percentages are based on country or territory of incorporation and are adjusted for the effect of futures contracts, if applicable.
| As of April 30, 2017 |
| | Brazil | 61.9% |
| | Mexico | 20.3% |
| | Bermuda | 4.6% |
| | Panama | 4.5% |
| | United States of America* | 2.8% |
| | United Kingdom | 1.8% |
| | Spain | 1.4% |
| | Chile | 0.9% |
| | Peru | 0.9% |
| | Other | 0.9% |

* Includes Short-Term investments and Net Other Assets (Liabilities).
Percentages are based on country or territory of incorporation and are adjusted for the effect of futures contracts, if applicable.
Asset Allocation as of October 31, 2017
| | % of fund's net assets | % of fund's net assets 6 months ago |
| Stocks | 98.4 | 98.6 |
| Short-Term Investments and Net Other Assets (Liabilities) | 1.6 | 1.4 |
Top Ten Stocks as of October 31, 2017
| | % of fund's net assets | % of fund's net assets 6 months ago |
| Itau Unibanco Holding SA (Brazil, Banks) | 8.9 | 10.4 |
| Itausa-Investimentos Itau SA (Brazil, Banks) | 8.2 | 7.4 |
| Estacio Participacoes SA (Brazil, Diversified Consumer Services) | 5.0 | 2.6 |
| Petroleo Brasileiro SA - Petrobras (PN) (non-vtg.) (Brazil, Oil, Gas & Consumable Fuels) | 4.9 | 4.5 |
| Kroton Educacional SA (Brazil, Diversified Consumer Services) | 3.8 | 3.5 |
| Credicorp Ltd. (United States) (Bermuda, Banks) | 3.7 | 3.2 |
| Smiles Fidelidade SA (Brazil, Media) | 3.5 | 3.9 |
| Banco do Brasil SA (Brazil, Banks) | 3.4 | 0.0 |
| Qualicorp SA (Brazil, Health Care Providers & Services) | 3.1 | 2.7 |
| Copa Holdings SA Class A (Panama, Airlines) | 2.8 | 3.0 |
| | 47.3 | |
Top Market Sectors as of October 31, 2017
| | % of fund's net assets | % of fund's net assets 6 months ago |
| Financials | 40.8 | 37.5 |
| Consumer Discretionary | 22.4 | 18.5 |
| Industrials | 13.7 | 12.8 |
| Health Care | 7.6 | 8.6 |
| Energy | 4.9 | 4.5 |
| Consumer Staples | 4.7 | 4.2 |
| Materials | 2.7 | 4.0 |
| Utilities | 1.6 | 2.0 |
| Information Technology | 0.0 | 5.3 |
| Real Estate | 0.0 | 1.2 |
Market Sectors may include more than one industry category.
The Fund may invest up to 35% of its total assets in any industry that represents more than 20% of the Latin American market. As of October 31, 2017, 28.7% of the Fund’s total assets were invested in the Diversified Banks industry, which accounts for more than 20% of the Latin American market.
Percentages shown as 0.0% may reflect amounts less than 0.05%.
Investments October 31, 2017
Showing Percentage of Net Assets
| Common Stocks - 73.0% | | | |
| | | Shares | Value |
| Bermuda - 3.7% | | | |
| Credicorp Ltd. (United States) | | 111,536 | $23,360,100 |
| Brazil - 39.6% | | | |
| Alliar Medicos a Frente SA | | 275,047 | 1,374,688 |
| Azul SA sponsored ADR | | 374,025 | 9,459,092 |
| Banco do Brasil SA | | 2,042,295 | 21,501,128 |
| BTG Pactual Participations Ltd. unit | | 1,105,440 | 7,437,635 |
| CVC Brasil Operadora e Agencia de Viagens SA | | 995,594 | 13,147,575 |
| Equatorial Energia SA | | 554,904 | 10,347,307 |
| Estacio Participacoes SA | | 3,528,564 | 31,636,592 |
| Grendene SA | | 1,250,608 | 10,516,989 |
| Instituto Hermes Pardini SA | | 856,221 | 8,074,594 |
| IRB Brasil Resseguros SA | | 1,136,157 | 11,395,259 |
| Kroton Educacional SA | | 4,457,759 | 24,514,745 |
| Localiza Rent A Car SA | | 704,103 | 12,455,733 |
| Movida Participacoes SA | | 2,782,168 | 6,973,918 |
| Multiplus SA | | 493,667 | 5,734,523 |
| Qualicorp SA | | 1,853,685 | 19,832,781 |
| Rumo SA | | 4,035,286 | 15,665,984 |
| Ser Educacional SA | | 1,294,805 | 12,210,661 |
| Ser Educacional SA (a) | | 146,192 | 1,385,367 |
| Smiles Fidelidade SA | | 860,158 | 22,481,432 |
| Vale SA | | 586,218 | 5,752,330 |
|
| TOTAL BRAZIL | | | 251,898,333 |
|
| Chile - 1.0% | | | |
| Vina San Pedro SA | | 574,573,084 | 6,409,724 |
| Luxembourg - 1.3% | | | |
| Biotoscana Investments SA unit | | 1,139,155 | 8,183,335 |
| Mexico - 17.6% | | | |
| Banco del Bajio SA | | 5,177,980 | 9,382,713 |
| Compartamos S.A.B. de CV (b) | | 11,298,152 | 11,444,449 |
| Credito Real S.A.B. de CV | | 8,463,691 | 13,570,689 |
| Genomma Lab Internacional SA de CV (a) | | 9,284,060 | 10,832,836 |
| Gruma S.A.B. de CV Series B | | 893,007 | 11,697,464 |
| Grupo Aeroportuario Norte S.A.B. de CV | | 1,553,478 | 7,838,797 |
| Grupo Cementos de Chihuahua S.A.B. de CV | | 1,735,190 | 8,287,785 |
| Grupo Mexico SA de CV Series B | | 988,195 | 3,213,274 |
| Promotora y Operadora de Infraestructura S.A.B. de CV | | 2,191,429 | 16,482,797 |
| Qualitas Controladora S.A.B. de CV | | 5,446,845 | 9,014,743 |
| Unifin Financiera SAPI de CV | | 2,918,439 | 9,937,314 |
|
| TOTAL MEXICO | | | 111,702,861 |
|
| Panama - 4.5% | | | |
| Copa Holdings SA Class A | | 142,007 | 17,493,842 |
| Intergroup Financial Services Corp. | | 281,654 | 10,984,506 |
|
| TOTAL PANAMA | | | 28,478,348 |
|
| Spain - 2.0% | | | |
| Prosegur Cash SA | | 3,826,632 | 12,480,866 |
| United Kingdom - 1.8% | | | |
| British American Tobacco PLC (United Kingdom) | | 179,360 | 11,588,419 |
| United States of America - 1.5% | | | |
| First Cash Financial Services, Inc. | | 155,234 | 9,911,691 |
| TOTAL COMMON STOCKS | | | |
| (Cost $347,397,390) | | | 464,013,677 |
|
| Nonconvertible Preferred Stocks - 25.4% | | | |
| Brazil - 25.4% | | | |
| Alpargatas SA (PN) | | 2,276,422 | 12,038,670 |
| Banco ABC Brasil SA | | 1,773,365 | 9,730,658 |
| Itau Unibanco Holding SA | | 4,377,873 | 56,274,127 |
| Itausa-Investimentos Itau SA (PN) | | 16,143,178 | 51,716,598 |
| Petroleo Brasileiro SA - Petrobras (PN) (non-vtg.) (a) | | 6,099,786 | 31,269,957 |
| TOTAL NONCONVERTIBLE PREFERRED STOCKS | | | |
| (Cost $88,150,303) | | | 161,030,010 |
|
| Money Market Funds - 1.3% | | | |
| Fidelity Cash Central Fund, 1.10% (c) | | 7,334,350 | 7,335,817 |
| Fidelity Securities Lending Cash Central Fund 1.11% (c)(d) | | 928,302 | 928,395 |
| TOTAL MONEY MARKET FUNDS | | | |
| (Cost $8,264,212) | | | 8,264,212 |
| TOTAL INVESTMENT IN SECURITIES - 99.7% | | | |
| (Cost $443,811,905) | | | 633,307,899 |
| NET OTHER ASSETS (LIABILITIES) - 0.3% | | | 2,088,124 |
| NET ASSETS - 100% | | | $635,396,023 |
Categorizations in the Schedule of Investments are based on country or territory of incorporation.
Legend
(a) Non-income producing
(b) Security or a portion of the security is on loan at period end.
(c) Affiliated fund that is generally available only to investment companies and other accounts managed by Fidelity Investments. The rate quoted is the annualized seven-day yield of the fund at period end. A complete unaudited listing of the fund's holdings as of its most recent quarter end is available upon request. In addition, each Fidelity Central Fund's financial statements, which are not covered by the Fund's Report of Independent Registered Public Accounting Firm, are available on the SEC's website or upon request.
(d) Investment made with cash collateral received from securities on loan.
Affiliated Central Funds
Information regarding fiscal year to date income earned by the Fund from investments in Fidelity Central Funds is as follows:
| Fund | Income earned |
| Fidelity Cash Central Fund | $42,319 |
| Fidelity Securities Lending Cash Central Fund | 28,012 |
| Total | $70,331 |
Investment Valuation
The following is a summary of the inputs used, as of October 31, 2017, involving the Fund's assets and liabilities carried at fair value. The inputs or methodology used for valuing securities may not be an indication of the risk associated with investing in those securities. For more information on valuation inputs, and their aggregation into the levels used below, please refer to the Investment Valuation section in the accompanying Notes to Financial Statements.
| | Valuation Inputs at Reporting Date: |
| Description | Total | Level 1 | Level 2 | Level 3 |
| Investments in Securities: | | | | |
| Equities: | | | | |
| Consumer Discretionary | $143,049,267 | $143,049,267 | $-- | $-- |
| Consumer Staples | 29,695,607 | 18,107,188 | 11,588,419 | -- |
| Energy | 31,269,957 | 31,269,957 | -- | -- |
| Financials | 258,759,763 | 258,759,763 | -- | -- |
| Health Care | 48,298,234 | 48,298,234 | -- | -- |
| Industrials | 86,370,163 | 86,370,163 | -- | -- |
| Materials | 17,253,389 | 17,253,389 | -- | -- |
| Utilities | 10,347,307 | 10,347,307 | -- | -- |
| Money Market Funds | 8,264,212 | 8,264,212 | -- | -- |
| Total Investments in Securities: | $633,307,899 | $621,719,480 | $11,588,419 | $-- |
See accompanying notes which are an integral part of the financial statements.
Financial Statements
Statement of Assets and Liabilities
| | | October 31, 2017 |
| Assets | | |
Investment in securities, at value (including securities loaned of $856,501) — See accompanying schedule:
Unaffiliated issuers (cost $435,547,693) | $625,043,687 | |
| Fidelity Central Funds (cost $8,264,212) | 8,264,212 | |
| Total Investment in Securities (cost $443,811,905) | | $633,307,899 |
| Receivable for investments sold | | 5,406,649 |
| Receivable for fund shares sold | | 797,212 |
| Dividends receivable | | 244,955 |
| Distributions receivable from Fidelity Central Funds | | 3,852 |
| Prepaid expenses | | 1,356 |
| Other receivables | | 18,780 |
| Total assets | | 639,780,703 |
| Liabilities | | |
| Payable for investments purchased | $92,019 | |
| Payable for fund shares redeemed | 2,656,282 | |
| Accrued management fee | 389,601 | |
| Distribution and service plan fees payable | 11,521 | |
| Other affiliated payables | 159,903 | |
| Other payables and accrued expenses | 147,260 | |
| Collateral on securities loaned | 928,094 | |
| Total liabilities | | 4,384,680 |
| Net Assets | | $635,396,023 |
| Net Assets consist of: | | |
| Paid in capital | | $582,322,725 |
| Undistributed net investment income | | 6,370,322 |
| Accumulated undistributed net realized gain (loss) on investments and foreign currency transactions | | (142,793,848) |
| Net unrealized appreciation (depreciation) on investments and assets and liabilities in foreign currencies | | 189,496,824 |
| Net Assets | | $635,396,023 |
| Calculation of Maximum Offering Price | | |
| Class A: | | |
| Net Asset Value and redemption price per share ($17,801,488 ÷ 714,126 shares) | | $24.93 |
| Maximum offering price per share (100/94.25 of $24.93) | | $26.45 |
| Class M: | | |
| Net Asset Value and redemption price per share ($6,739,971 ÷ 270,076 shares) | | $24.96 |
| Maximum offering price per share (100/96.50 of $24.96) | | $25.87 |
| Class C: | | |
| Net Asset Value and offering price per share ($5,093,879 ÷ 202,791 shares)(a) | | $25.12 |
| Latin America: | | |
| Net Asset Value, offering price and redemption price per share ($597,160,834 ÷ 23,989,174 shares) | | $24.89 |
| Class I: | | |
| Net Asset Value, offering price and redemption price per share ($8,599,851 ÷ 345,686 shares) | | $24.88 |
(a) Redemption price per share is equal to net asset value less any applicable contingent deferred sales charge.
See accompanying notes which are an integral part of the financial statements.
Statement of Operations
| | | Year ended October 31, 2017 |
| Investment Income | | |
| Dividends | | $18,985,735 |
| Non-Cash dividends | | 1,382,861 |
| Income from Fidelity Central Funds | | 70,331 |
| Income before foreign taxes withheld | | 20,438,927 |
| Less foreign taxes withheld | | (1,108,335) |
| Total income | | 19,330,592 |
| Expenses | | |
| Management fee | $4,090,796 | |
| Transfer agent fees | 1,547,021 | |
| Distribution and service plan fees | 130,458 | |
| Accounting and security lending fees | 296,244 | |
| Custodian fees and expenses | 337,237 | |
| Independent trustees' fees and expenses | 2,431 | |
| Registration fees | 87,848 | |
| Audit | 77,905 | |
| Legal | 1,981 | |
| Miscellaneous | 4,898 | |
| Total expenses before reductions | 6,576,819 | |
| Expense reductions | (7,880) | 6,568,939 |
| Net investment income (loss) | | 12,761,653 |
| Realized and Unrealized Gain (Loss) | | |
| Net realized gain (loss) on: | | |
| Investment securities: | | |
| Unaffiliated issuers | 32,787,186 | |
| Fidelity Central Funds | 1,938 | |
| Foreign currency transactions | (463,569) | |
| Total net realized gain (loss) | | 32,325,555 |
| Change in net unrealized appreciation (depreciation) on: | | |
| Investment securities: | | |
| Unaffiliated issuers | 24,738,398 | |
| Fidelity Central Funds | (2,801) | |
| Assets and liabilities in foreign currencies | (17,316) | |
| Total change in net unrealized appreciation (depreciation) | | 24,718,281 |
| Net gain (loss) | | 57,043,836 |
| Net increase (decrease) in net assets resulting from operations | | $69,805,489 |
See accompanying notes which are an integral part of the financial statements.
Statement of Changes in Net Assets
| | Year ended October 31, 2017 | Year ended October 31, 2016 |
| Increase (Decrease) in Net Assets | | |
| Operations | | |
| Net investment income (loss) | $12,761,653 | $12,329,425 |
| Net realized gain (loss) | 32,325,555 | (87,982,612) |
| Change in net unrealized appreciation (depreciation) | 24,718,281 | 203,562,799 |
| Net increase (decrease) in net assets resulting from operations | 69,805,489 | 127,909,612 |
| Distributions to shareholders from net investment income | (12,697,307) | (10,264,003) |
| Share transactions - net increase (decrease) | (55,405,622) | 5,109,952 |
| Redemption fees | 272,096 | 103,536 |
| Total increase (decrease) in net assets | 1,974,656 | 122,859,097 |
| Net Assets | | |
| Beginning of period | 633,421,367 | 510,562,270 |
| End of period | $635,396,023 | $633,421,367 |
| Other Information | | |
| Undistributed net investment income end of period | $6,370,322 | $7,710,475 |
See accompanying notes which are an integral part of the financial statements.
Financial Highlights
Fidelity Latin America Fund Class A
| Years ended October 31, | 2017 | 2016 | 2015 | 2014 | 2013 |
| Selected Per–Share Data | | | | | |
| Net asset value, beginning of period | $22.45 | $18.09 | $30.31 | $40.71 | $48.95 |
| Income from Investment Operations | | | | | |
| Net investment income (loss)A | .42 | .40 | .28 | .49 | .72 |
| Net realized and unrealized gain (loss) | 2.48 | 4.27 | (10.11) | (4.08) | (4.73) |
| Total from investment operations | 2.90 | 4.67 | (9.83) | (3.59) | (4.01) |
| Distributions from net investment income | (.43) | (.31) | (.31) | (.57) | (.79) |
| Distributions from net realized gain | – | – | (2.08) | (6.25) | (3.45) |
| Total distributions | (.43) | (.31) | (2.39) | (6.82) | (4.24) |
| Redemption fees added to paid in capitalA | .01 | –B | –B | .01 | .01 |
| Net asset value, end of period | $24.93 | $22.45 | $18.09 | $30.31 | $40.71 |
| Total ReturnC,D | 13.55% | 26.29% | (34.60)% | (9.06)% | (8.93)% |
| Ratios to Average Net AssetsE,F | | | | | |
| Expenses before reductions | 1.39% | 1.40% | 1.40% | 1.38% | 1.37% |
| Expenses net of fee waivers, if any | 1.39% | 1.40% | 1.40% | 1.38% | 1.37% |
| Expenses net of all reductions | 1.38% | 1.39% | 1.39% | 1.38% | 1.35% |
| Net investment income (loss) | 1.90% | 2.14% | 1.26% | 1.52% | 1.66% |
| Supplemental Data | | | | | |
| Net assets, end of period (000 omitted) | $17,801 | $19,115 | $16,424 | $34,898 | $48,464 |
| Portfolio turnover rateG | 51% | 108% | 30% | 30% | 23% |
A Calculated based on average shares outstanding during the period.
B Amount represents less than $.005 per share.
C Total returns would have been lower if certain expenses had not been reduced during the applicable periods shown.
D Total returns do not include the effect of the sales charges.
E Fees and expenses of any underlying Fidelity Central Funds are not included in the Fund's expense ratio. The Fund indirectly bears its proportionate share of the expenses of any underlying Fidelity Central Funds.
F Expense ratios reflect operating expenses of the class. Expenses before reductions do not reflect amounts reimbursed by the investment adviser or reductions from brokerage service arrangements or reductions from other expense offset arrangements and do not represent the amount paid by the class during periods when reimbursements or reductions occur. Expenses net of fee waivers reflect expenses after reimbursement by the investment adviser but prior to reductions from brokerage service arrangements or other expense offset arrangements. Expenses net of all reductions represent the net expenses paid by the class.
G Amount does not include the portfolio activity of any underlying Fidelity Central Funds.
See accompanying notes which are an integral part of the financial statements.
Fidelity Latin America Fund Class M
| Years ended October 31, | 2017 | 2016 | 2015 | 2014 | 2013 |
| Selected Per–Share Data | | | | | |
| Net asset value, beginning of period | $22.47 | $18.11 | $30.33 | $40.68 | $48.88 |
| Income from Investment Operations | | | | | |
| Net investment income (loss)A | .36 | .35 | .22 | .40 | .61 |
| Net realized and unrealized gain (loss) | 2.49 | 4.27 | (10.13) | (4.08) | (4.74) |
| Total from investment operations | 2.85 | 4.62 | (9.91) | (3.68) | (4.13) |
| Distributions from net investment income | (.37) | (.26) | (.23) | (.43) | (.63) |
| Distributions from net realized gain | – | – | (2.08) | (6.25) | (3.45) |
| Total distributions | (.37) | (.26) | (2.31) | (6.68) | (4.08) |
| Redemption fees added to paid in capitalA | .01 | –B | –B | .01 | .01 |
| Net asset value, end of period | $24.96 | $22.47 | $18.11 | $30.33 | $40.68 |
| Total ReturnC,D | 13.24% | 25.93% | (34.78)% | (9.30)% | (9.17)% |
| Ratios to Average Net AssetsE,F | | | | | |
| Expenses before reductions | 1.66% | 1.68% | 1.67% | 1.65% | 1.63% |
| Expenses net of fee waivers, if any | 1.66% | 1.68% | 1.67% | 1.65% | 1.63% |
| Expenses net of all reductions | 1.66% | 1.68% | 1.66% | 1.65% | 1.61% |
| Net investment income (loss) | 1.62% | 1.86% | .99% | 1.25% | 1.40% |
| Supplemental Data | | | | | |
| Net assets, end of period (000 omitted) | $6,740 | $7,378 | $5,284 | $9,761 | $12,705 |
| Portfolio turnover rateG | 51% | 108% | 30% | 30% | 23% |
A Calculated based on average shares outstanding during the period.
B Amount represents less than $.005 per share.
C Total returns would have been lower if certain expenses had not been reduced during the applicable periods shown.
D Total returns do not include the effect of the sales charges.
E Fees and expenses of any underlying Fidelity Central Funds are not included in the Fund's expense ratio. The Fund indirectly bears its proportionate share of the expenses of any underlying Fidelity Central Funds.
F Expense ratios reflect operating expenses of the class. Expenses before reductions do not reflect amounts reimbursed by the investment adviser or reductions from brokerage service arrangements or reductions from other expense offset arrangements and do not represent the amount paid by the class during periods when reimbursements or reductions occur. Expenses net of fee waivers reflect expenses after reimbursement by the investment adviser but prior to reductions from brokerage service arrangements or other expense offset arrangements. Expenses net of all reductions represent the net expenses paid by the class.
G Amount does not include the portfolio activity of any underlying Fidelity Central Funds.
See accompanying notes which are an integral part of the financial statements.
Fidelity Latin America Fund Class C
| Years ended October 31, | 2017 | 2016 | 2015 | 2014 | 2013 |
| Selected Per–Share Data | | | | | |
| Net asset value, beginning of period | $22.61 | $18.18 | $30.37 | $40.59 | $48.73 |
| Income from Investment Operations | | | | | |
| Net investment income (loss)A | .26 | .26 | .11 | .25 | .40 |
| Net realized and unrealized gain (loss) | 2.52 | 4.30 | (10.17) | (4.07) | (4.74) |
| Total from investment operations | 2.78 | 4.56 | (10.06) | (3.82) | (4.34) |
| Distributions from net investment income | (.28) | (.13) | (.05) | (.16) | (.36) |
| Distributions from net realized gain | – | – | (2.08) | (6.25) | (3.45) |
| Total distributions | (.28) | (.13) | (2.13) | (6.41) | (3.81) |
| Redemption fees added to paid in capitalA | .01 | –B | –B | .01 | .01 |
| Net asset value, end of period | $25.12 | $22.61 | $18.18 | $30.37 | $40.59 |
| Total ReturnC,D | 12.71% | 25.31% | (35.08)% | (9.74)% | (9.62)% |
| Ratios to Average Net AssetsE,F | | | | | |
| Expenses before reductions | 2.14% | 2.15% | 2.15% | 2.13% | 2.12% |
| Expenses net of fee waivers, if any | 2.14% | 2.14% | 2.15% | 2.13% | 2.12% |
| Expenses net of all reductions | 2.14% | 2.14% | 2.15% | 2.13% | 2.10% |
| Net investment income (loss) | 1.15% | 1.39% | .51% | .77% | .91% |
| Supplemental Data | | | | | |
| Net assets, end of period (000 omitted) | $5,094 | $6,590 | $5,394 | $11,349 | $15,185 |
| Portfolio turnover rateG | 51% | 108% | 30% | 30% | 23% |
A Calculated based on average shares outstanding during the period.
B Amount represents less than $.005 per share.
C Total returns would have been lower if certain expenses had not been reduced during the applicable periods shown.
D Total returns do not include the effect of the contingent deferred sales charge.
E Fees and expenses of any underlying Fidelity Central Funds are not included in the Fund's expense ratio. The Fund indirectly bears its proportionate share of the expenses of any underlying Fidelity Central Funds.
F Expense ratios reflect operating expenses of the class. Expenses before reductions do not reflect amounts reimbursed by the investment adviser or reductions from brokerage service arrangements or reductions from other expense offset arrangements and do not represent the amount paid by the class during periods when reimbursements or reductions occur. Expenses net of fee waivers reflect expenses after reimbursement by the investment adviser but prior to reductions from brokerage service arrangements or other expense offset arrangements. Expenses net of all reductions represent the net expenses paid by the class.
G Amount does not include the portfolio activity of any underlying Fidelity Central Funds.
See accompanying notes which are an integral part of the financial statements.
Fidelity Latin America Fund
| Years ended October 31, | 2017 | 2016 | 2015 | 2014 | 2013 |
| Selected Per–Share Data | | | | | |
| Net asset value, beginning of period | $22.41 | $18.08 | $30.34 | $40.80 | $49.09 |
| Income from Investment Operations | | | | | |
| Net investment income (loss)A | .49 | .45 | .34 | .59 | .87 |
| Net realized and unrealized gain (loss) | 2.46 | 4.26 | (10.11) | (4.10) | (4.74) |
| Total from investment operations | 2.95 | 4.71 | (9.77) | (3.51) | (3.87) |
| Distributions from net investment income | (.48) | (.38) | (.41) | (.71) | (.98) |
| Distributions from net realized gain | – | – | (2.08) | (6.25) | (3.45) |
| Total distributions | (.48) | (.38) | (2.49) | (6.96) | (4.43) |
| Redemption fees added to paid in capitalA | .01 | –B | –B | .01 | .01 |
| Net asset value, end of period | $24.89 | $22.41 | $18.08 | $30.34 | $40.80 |
| Total ReturnC | 13.87% | 26.65% | (34.45)% | (8.79)% | (8.63)% |
| Ratios to Average Net AssetsD,E | | | | | |
| Expenses before reductions | 1.09% | 1.14% | 1.13% | 1.08% | 1.04% |
| Expenses net of fee waivers, if any | 1.09% | 1.14% | 1.12% | 1.08% | 1.04% |
| Expenses net of all reductions | 1.09% | 1.13% | 1.12% | 1.07% | 1.03% |
| Net investment income (loss) | 2.19% | 2.40% | 1.53% | 1.83% | 1.99% |
| Supplemental Data | | | | | |
| Net assets, end of period (000 omitted) | $597,161 | $596,514 | $481,005 | $933,298 | $1,324,748 |
| Portfolio turnover rateF | 51% | 108% | 30% | 30% | 23% |
A Calculated based on average shares outstanding during the period.
B Amount represents less than $.005 per share.
C Total returns would have been lower if certain expenses had not been reduced during the applicable periods shown.
D Fees and expenses of any underlying Fidelity Central Funds are not included in the Fund's expense ratio. The Fund indirectly bears its proportionate share of the expenses of any underlying Fidelity Central Funds.
E Expense ratios reflect operating expenses of the class. Expenses before reductions do not reflect amounts reimbursed by the investment adviser or reductions from brokerage service arrangements or reductions from other expense offset arrangements and do not represent the amount paid by the class during periods when reimbursements or reductions occur. Expenses net of fee waivers reflect expenses after reimbursement by the investment adviser but prior to reductions from brokerage service arrangements or other expense offset arrangements. Expenses net of all reductions represent the net expenses paid by the class.
F Amount does not include the portfolio activity of any underlying Fidelity Central Funds.
See accompanying notes which are an integral part of the financial statements.
Fidelity Latin America Fund Class I
| Years ended October 31, | 2017 | 2016 | 2015 | 2014 | 2013 |
| Selected Per–Share Data | | | | | |
| Net asset value, beginning of period | $22.40 | $18.08 | $30.35 | $40.79 | $49.07 |
| Income from Investment Operations | | | | | |
| Net investment income (loss)A | .51 | .46 | .36 | .60 | .87 |
| Net realized and unrealized gain (loss) | 2.45 | 4.26 | (10.13) | (4.07) | (4.74) |
| Total from investment operations | 2.96 | 4.72 | (9.77) | (3.47) | (3.87) |
| Distributions from net investment income | (.49) | (.40) | (.42) | (.73) | (.97) |
| Distributions from net realized gain | – | – | (2.08) | (6.25) | (3.45) |
| Total distributions | (.49) | (.40) | (2.50) | (6.98) | (4.42) |
| Redemption fees added to paid in capitalA | .01 | –B | –B | .01 | .01 |
| Net asset value, end of period | $24.88 | $22.40 | $18.08 | $30.35 | $40.79 |
| Total ReturnC | 13.94% | 26.77% | (34.42)% | (8.69)% | (8.63)% |
| Ratios to Average Net AssetsD,E | | | | | |
| Expenses before reductions | 1.01% | 1.07% | 1.06% | 1.04% | 1.03% |
| Expenses net of fee waivers, if any | 1.01% | 1.07% | 1.06% | 1.04% | 1.03% |
| Expenses net of all reductions | 1.01% | 1.06% | 1.05% | 1.04% | 1.01% |
| Net investment income (loss) | 2.27% | 2.47% | 1.60% | 1.86% | 2.00% |
| Supplemental Data | | | | | |
| Net assets, end of period (000 omitted) | $8,600 | $3,825 | $1,828 | $4,531 | $5,131 |
| Portfolio turnover rateF | 51% | 108% | 30% | 30% | 23% |
A Calculated based on average shares outstanding during the period.
B Amount represents less than $.005 per share.
C Total returns would have been lower if certain expenses had not been reduced during the applicable periods shown.
D Fees and expenses of any underlying Fidelity Central Funds are not included in the Fund's expense ratio. The Fund indirectly bears its proportionate share of the expenses of any underlying Fidelity Central Funds.
E Expense ratios reflect operating expenses of the class. Expenses before reductions do not reflect amounts reimbursed by the investment adviser or reductions from brokerage service arrangements or reductions from other expense offset arrangements and do not represent the amount paid by the class during periods when reimbursements or reductions occur. Expenses net of fee waivers reflect expenses after reimbursement by the investment adviser but prior to reductions from brokerage service arrangements or other expense offset arrangements. Expenses net of all reductions represent the net expenses paid by the class.
F Amount does not include the portfolio activity of any underlying Fidelity Central Funds.
See accompanying notes which are an integral part of the financial statements.
Notes to Financial Statements
For the period ended October 31, 2017
1. Organization.
Fidelity Latin America Fund (the Fund) is a non-diversified fund of Fidelity Investment Trust (the Trust) and is authorized to issue an unlimited number of shares. The Trust is registered under the Investment Company Act of 1940, as amended (the 1940 Act), as an open-end management investment company organized as a Massachusetts business trust. The Fund offers Class A, Class M (formerly Class T), Class C, Latin America and Class I shares, each of which has equal rights as to assets and voting privileges. Each class has exclusive voting rights with respect to matters that affect that class. The Fund's investments in emerging markets can be subject to social, economic, regulatory, and political uncertainties and can be extremely volatile.
After the close of business on June 24, 2016, all outstanding Class B shares were converted to Class A shares. All prior fiscal period dollar and share amounts for Class B presented in the Notes to Financial Statements are for the period November 1, 2015 through June 24, 2016.
2. Investments in Fidelity Central Funds.
The Fund invests in Fidelity Central Funds, which are open-end investment companies generally available only to other investment companies and accounts managed by the investment adviser and its affiliates. The Fund's Schedule of Investments lists each of the Fidelity Central Funds held as of period end, if any, as an investment of the Fund, but does not include the underlying holdings of each Fidelity Central Fund. As an Investing Fund, the Fund indirectly bears its proportionate share of the expenses of the underlying Fidelity Central Funds.
The Money Market Central Funds seek preservation of capital and current income and are managed by Fidelity Investments Money Management, Inc. (FIMM), an affiliate of the investment adviser. Annualized expenses of the Money Market Central Funds as of their most recent shareholder report date are less than .005%.
A complete unaudited list of holdings for each Fidelity Central Fund is available upon request or at the Securities and Exchange Commission (the SEC) website at www.sec.gov. In addition, the financial statements of the Fidelity Central Funds, which are not covered by the Fund's Report of Independent Registered Public Accounting Firm, are available on the SEC website or upon request.
3. Significant Accounting Policies.
The Fund is an investment company and applies the accounting and reporting guidance of the Financial Accounting Standards Board (FASB) Accounting Standards Codification Topic 946 Financial Services – Investments Companies. The financial statements have been prepared in conformity with accounting principles generally accepted in the United States of America (GAAP), which require management to make certain estimates and assumptions at the date of the financial statements. Actual results could differ from those estimates. Subsequent events, if any, through the date that the financial statements were issued have been evaluated in the preparation of the financial statements. The following summarizes the significant accounting policies of the Fund:
Investment Valuation. Investments are valued as of 4:00 p.m. Eastern time on the last calendar day of the period. The Board of Trustees (the Board) has delegated the day to day responsibility for the valuation of the Fund's investments to the Fair Value Committee (the Committee) established by the Fund's investment adviser. In accordance with valuation policies and procedures approved by the Board, the Fund attempts to obtain prices from one or more third party pricing vendors or brokers to value its investments. When current market prices, quotations or currency exchange rates are not readily available or reliable, investments will be fair valued in good faith by the Committee, in accordance with procedures adopted by the Board. Factors used in determining fair value vary by investment type and may include market or investment specific events. The frequency with which these procedures are used cannot be predicted and they may be utilized to a significant extent. The Committee oversees the Fund's valuation policies and procedures and reports to the Board on the Committee's activities and fair value determinations. The Board monitors the appropriateness of the procedures used in valuing the Fund's investments and ratifies the fair value determinations of the Committee.
The Fund categorizes the inputs to valuation techniques used to value its investments into a disclosure hierarchy consisting of three levels as shown below:
- Level 1 – quoted prices in active markets for identical investments
- Level 2 – other significant observable inputs (including quoted prices for similar investments, interest rates, prepayment speeds, etc.)
- Level 3 – unobservable inputs (including the Fund's own assumptions based on the best information available)
Valuation techniques used to value the Fund's investments by major category are as follows:
Equity securities, including restricted securities, for which market quotations are readily available, are valued at the last reported sale price or official closing price as reported by a third party pricing vendor on the primary market or exchange on which they are traded and are categorized as Level 1 in the hierarchy. In the event there were no sales during the day or closing prices are not available, securities are valued at the last quoted bid price or may be valued using the last available price and are generally categorized as Level 2 in the hierarchy. For foreign equity securities, when market or security specific events arise, comparisons to the valuation of American Depositary Receipts (ADRs), futures contracts, Exchange-Traded Funds (ETFs) and certain indexes as well as quoted prices for similar securities may be used and would be categorized as Level 2 in the hierarchy. Utilizing these techniques may result in transfers between Level 1 and Level 2. For equity securities, including restricted securities, where observable inputs are limited, assumptions about market activity and risk are used and these securities may be categorized as Level 3 in the hierarchy.
Investments in open-end mutual funds, including the Fidelity Central Funds, are valued at their closing net asset value (NAV) each business day and are categorized as Level 1 in the hierarchy.
Changes in valuation techniques may result in transfers in or out of an assigned level within the disclosure hierarchy. The aggregate value of investments by input level as of October 31, 2017 is included at the end of the Fund's Schedule of Investments.
Foreign Currency. The Fund may use foreign currency contracts to facilitate transactions in foreign-denominated securities. Gains and losses from these transactions may arise from changes in the value of the foreign currency or if the counterparties do not perform under the contracts' terms.
Foreign-denominated assets, including investment securities, and liabilities are translated into U.S. dollars at the exchange rates at period end. Purchases and sales of investment securities, income and dividends received and expenses denominated in foreign currencies are translated into U.S. dollars at the exchange rate in effect on the transaction date.
The effects of exchange rate fluctuations on investments are included with the net realized and unrealized gain (loss) on investment securities. Other foreign currency transactions resulting in realized and unrealized gain (loss) are disclosed separately.
Investment Transactions and Income. For financial reporting purposes, the Fund's investment holdings and NAV include trades executed through the end of the last business day of the period. The NAV per share for processing shareholder transactions is calculated as of the close of business of the New York Stock Exchange (NYSE), normally 4:00 p.m. Eastern time and includes trades executed through the end of the prior business day. Gains and losses on securities sold are determined on the basis of identified cost. Dividend income is recorded on the ex-dividend date, except for certain dividends from foreign securities where the ex-dividend date may have passed, which are recorded as soon as the Fund is informed of the ex-dividend date. Non-cash dividends included in dividend income, if any, are recorded at the fair market value of the securities received. Income and capital gain distributions from Fidelity Central Funds, if any, are recorded on the ex-dividend date. Certain distributions received by the Fund represent a return of capital or capital gain. The Fund determines the components of these distributions subsequent to the ex-dividend date, based upon receipt of tax filings or other correspondence relating to the underlying investment. These distributions are recorded as a reduction of cost of investments and/or as a realized gain. Investment income is recorded net of foreign taxes withheld where recovery of such taxes is uncertain.
Class Allocations and Expenses. Investment income, realized and unrealized capital gains and losses, common expenses of the Fund, and certain fund-level expense reductions, if any, are allocated daily on a pro-rata basis to each class based on the relative net assets of each class to the total net assets of the Fund. Each class differs with respect to transfer agent and distribution and service plan fees incurred. Certain expense reductions may also differ by class. For the reporting period, the allocated portion of income and expenses to each class as a percent of its average net assets may vary due to the timing of recording these transactions in relation to fluctuating net assets of the classes. Expenses directly attributable to a fund are charged to that fund. Expenses attributable to more than one fund are allocated among the respective funds on the basis of relative net assets or other appropriate methods. Expense estimates are accrued in the period to which they relate and adjustments are made when actual amounts are known.
Income Tax Information and Distributions to Shareholders. Each year, the Fund intends to qualify as a regulated investment company under Subchapter M of the Internal Revenue Code, including distributing substantially all of its taxable income and realized gains. As a result, no provision for U.S. Federal income taxes is required. As of October 31, 2017, the Fund did not have any unrecognized tax benefits in the financial statements; nor is the Fund aware of any tax positions for which it is reasonably possible that the total amounts of unrecognized tax benefits will significantly change in the next twelve months. The Fund files a U.S. federal tax return, in addition to state and local tax returns as required. The Fund's federal income tax returns are subject to examination by the Internal Revenue Service (IRS) for a period of three fiscal years after they are filed. State and local tax returns may be subject to examination for an additional fiscal year depending on the jurisdiction. Foreign taxes are provided for based on the Fund's understanding of the tax rules and rates that exist in the foreign markets in which it invests.
Distributions are declared and recorded on the ex-dividend date. Income dividends and capital gain distributions are declared separately for each class. Income and capital gain distributions are determined in accordance with income tax regulations, which may differ from GAAP. In addition, the Fund claimed a portion of the payment made to redeeming shareholders as a distribution for income tax purposes.
Capital accounts within the financial statements are adjusted for permanent book-tax differences. These adjustments have no impact on net assets or the results of operations. Capital accounts are not adjusted for temporary book-tax differences which will reverse in a subsequent period.
Book-tax differences are primarily due to foreign currency transactions, passive foreign investment companies (PFIC), capital loss carryforwards, deferred trustees compensation, and losses deferred due to wash sales.
As of period end, the cost and unrealized appreciation (depreciation) in securities, and derivatives if applicable, for federal income tax purposes were as follows:
| Gross unrealized appreciation | $213,361,335 |
| Gross unrealized depreciation | (24,935,404) |
| Net unrealized appreciation (depreciation) | $188,425,931 |
| Tax Cost | $444,881,968 |
The tax-based components of distributable earnings as of period end were as follows:
| Undistributed ordinary income | $6,372,360 |
| Capital loss carryforward | $(141,723,785) |
| Net unrealized appreciation (depreciation) on securities and other investments | $188,425,276 |
Capital loss carryforwards are only available to offset future capital gains of the Fund to the extent provided by regulations and may be limited. Under the Regulated Investment Company Modernization Act of 2010 (the Act), the Fund is permitted to carry forward capital losses incurred in taxable years beginning after December 22, 2010 for an unlimited period and such capital losses are required to be used prior to any losses that expire. The capital loss carryforward information presented below, including any applicable limitation, is estimated as of fiscal period end and is subject to adjustment.
| No expiration | |
| Short-term | $(41,534,225) |
| Long-term | (100,189,560) |
| Total capital loss carryforward | $(141,723,785) |
The tax character of distributions paid was as follows:
| | October 31, 2017 | October 31, 2016 |
| Ordinary Income | $12,697,307 | $ 10,264,003 |
Short-Term Trading (Redemption) Fees. Shares held by investors in the Fund less than 90 days may have been subject to a redemption fee equal to 1.50% of the NAV of shares redeemed. All redemption fees, which reduce the proceeds of the shareholder redemption, are retained by the Fund and accounted for as an addition to paid in capital. In November 2017, the Board of Trustees approved the elimination of these redemption fees effective December 18, 2017.
4. Purchases and Sales of Investments.
Purchases and sales of securities, other than short-term securities, aggregated $299,251,839 and $359,490,279, respectively.
5. Fees and Other Transactions with Affiliates.
Management Fee. Fidelity Management & Research Company (the investment adviser) and its affiliates provide the Fund with investment management related services for which the Fund pays a monthly management fee. The management fee is the sum of an individual fund fee rate that is based on an annual rate of .45% of the Fund's average net assets and an annualized group fee rate that averaged .25% during the period. The group fee rate is based upon the average net assets of all the mutual funds advised by the investment adviser, including any mutual funds previously advised by the investment adviser that are currently advised by Fidelity SelectCo, LLC, an affiliate of the investment adviser. The group fee rate decreases as assets under management increase and increases as assets under management decrease. For the reporting period, the total annual management fee rate was .69% of the Fund's average net assets.
Distribution and Service Plan Fees. In accordance with Rule 12b-1 of the 1940 Act, the Fund has adopted separate Distribution and Service Plans for each class of shares. Certain classes pay Fidelity Distributors Corporation (FDC), an affiliate of the investment adviser, separate Distribution and Service Fees, each of which is based on an annual percentage of each class' average net assets. In addition, FDC may pay financial intermediaries for selling shares of the Fund and providing shareholder support services. For the period, the Distribution and Service Fee rates, total fees and amounts retained by FDC were as follows:
| | Distribution
Fee | Service
Fee | Total Fees | Retained
by FDC |
| Class A | -% | .25% | $45,121 | $– |
| Class M | .25% | .25% | 32,465 | – |
| Class C | .75% | .25% | 52,872 | 2,455 |
| | | | $130,458 | $2,455 |
Sales Load. FDC may receive a front-end sales charge of up to 5.75% for selling Class A shares and 3.50% for selling Class M shares, some of which is paid to financial intermediaries for selling shares of the Fund. Depending on the holding period, FDC may receive contingent deferred sales charges levied on Class A, Class M and Class C redemptions. The deferred sales charges are 1.00% for Class C shares, 1.00% for certain purchases of Class A shares and .25% for certain purchases of Class M shares.
For the period, sales charge amounts retained by FDC were as follows:
| | Retained
by FDC |
| Class A | $4,414 |
| Class M | 604 |
| Class C(a) | 669 |
| | $5,687 |
(a) When Class C shares are initially sold, FDC pays commissions from its own resources to financial intermediaries through which the sales are made.
Transfer Agent Fees. Fidelity Investments Institutional Operations Company, Inc., (FIIOC), an affiliate of the investment adviser, is the transfer, dividend disbursing and shareholder servicing agent for each class of the Fund. FIIOC receives account fees and asset-based fees that vary according to the account size and type of account of the shareholders of the respective classes of the Fund. FIIOC pays for typesetting, printing and mailing of shareholder reports, except proxy statements.
For the period, transfer agent fees for each class were as follows:
| | Amount | % of
Class-Level Average
Net Assets |
| Class A | $54,827 | .30 |
| Class M | 21,543 | .33 |
| Class C | 16,158 | .31 |
| Latin America | 1,444,808 | .26 |
| Class I | 9,685 | .18 |
| | $1,547,021 | |
Accounting and Security Lending Fees. Fidelity Service Company, Inc. (FSC), an affiliate of the investment adviser, maintains the Fund's accounting records. The accounting fee is based on the level of average net assets for each month. Under a separate contract, FSC administers the security lending program. The security lending fee is based on the number and duration of lending transactions.
Brokerage Commissions. The Fund placed a portion of its portfolio transactions with brokerage firms which are affiliates of the investment adviser. Brokerage commissions are included in net realized gain (loss) and change in net unrealized appreciation (depreciation) in the Statement of Operations. The commissions paid to these affiliated firms were $726 for the period.
Interfund Trades. The Fund may purchase from or sell securities to other Fidelity Funds under procedures adopted by the Board. The procedures have been designed to ensure these interfund trades are executed in accordance with Rule 17a-7 of the 1940 Act. Interfund trades are included within the respective purchases and sales amounts shown in the Purchases and Sales of Investments note.
6. Committed Line of Credit.
The Fund participates with other funds managed by the investment adviser or an affiliate in a $4.25 billion credit facility (the "line of credit") to be utilized for temporary or emergency purposes to fund shareholder redemptions or for other short-term liquidity purposes. The Fund has agreed to pay commitment fees on its pro-rata portion of the line of credit, which amounted to $1,850 and is reflected in Miscellaneous expenses on the Statement of Operations. During the period, the Fund did not borrow on this line of credit.
7. Security Lending.
The Fund lends portfolio securities through a lending agent from time to time in order to earn additional income. For equity securities, a lending agent is used and may loan securities to certain qualified borrowers, including Fidelity Capital Markets (FCM), a broker-dealer affiliated with the Fund. On the settlement date of the loan, the Fund receives collateral (in the form of U.S. Treasury obligations, letters of credit and/or cash) against the loaned securities and maintains collateral in an amount not less than 100% of the market value of the loaned securities during the period of the loan. The market value of the loaned securities is determined at the close of business of the Fund and any additional required collateral is delivered to the Fund on the next business day. The Fund or borrower may terminate the loan at any time, and if the borrower defaults on its obligation to return the securities loaned because of insolvency or other reasons, the Fund may apply collateral received from the borrower against the obligation. The Fund may experience delays and costs in recovering the securities loaned. Any cash collateral received is invested in the Fidelity Securities Lending Cash Central Fund. The value of loaned securities and cash collateral at period end are disclosed on the Fund's Statement of Assets and Liabilities. Security lending income represents the income earned on investing cash collateral, less rebates paid to borrowers and any lending agent fees associated with the loan, plus any premium payments received for lending certain types of securities. Security lending income is presented in the Statement of Operations as a component of income from Fidelity Central Funds. Total security lending income during the period amounted to $28,012. During the period, there were no securities loaned to FCM.
8. Expense Reductions.
Commissions paid to certain brokers with whom the investment adviser, or its affiliates, places trades on behalf of the Fund include an amount in addition to trade execution, which may be rebated back to the Fund to offset certain expenses. This amount totaled $3,260 for the period. In addition, through arrangements with the Fund's custodian, credits realized as a result of certain uninvested cash balances were used to reduce the Fund's expenses. During the period, these credits reduced the Fund's custody expenses by $40.
In addition, during the period the investment adviser reimbursed and/or waived a portion of fund-level operating expenses in the amount of $4,580.
9. Distributions to Shareholders.
Distributions to shareholders of each class were as follows:
| | Year ended
October 31, 2017 | Year ended October 31, 2016 |
| From net investment income | | |
| Class A | $361,857 | $264,922 |
| Class M | 112,037 | 74,433 |
| Class B | – | 1,059 |
| Class C | 77,689 | 37,419 |
| Latin America | 12,063,200 | 9,833,214 |
| Class I | 82,524 | 52,956 |
| Total | $12,697,307 | $10,264,003 |
10. Share Transactions.
Share transactions for each class were as follows and may contain automatic conversions between classes or exchanges between affiliated funds:
| | Shares | Shares | Dollars | Dollars |
| | Year ended October 31, 2017 | Year ended October 31, 2016 | Year ended October 31, 2017 | Year ended October 31, 2016 |
| Class A | | | | |
| Shares sold | 139,205 | 225,272 | $3,031,500 | $4,334,307 |
| Reinvestment of distributions | 18,202 | 14,810 | 345,275 | 256,538 |
| Shares redeemed | (294,686) | (296,685) | (6,569,414) | (5,448,405) |
| Net increase (decrease) | (137,279) | (56,603) | $(3,192,639) | $(857,560) |
| Class M | | | | |
| Shares sold | 33,689 | 88,506 | $739,767 | $1,738,665 |
| Reinvestment of distributions | 5,687 | 4,243 | 108,338 | 73,689 |
| Shares redeemed | (97,619) | (56,211) | (2,073,277) | (1,058,502) |
| Net increase (decrease) | (58,243) | 36,538 | $(1,225,172) | $753,852 |
| Class B | | | | |
| Shares sold | – | 1 | $– | $10 |
| Reinvestment of distributions | – | 59 | – | 1,009 |
| Shares redeemed | – | (34,427) | – | (635,494) |
| Net increase (decrease) | – | (34,367) | $– | $(634,475) |
| Class C | | | | |
| Shares sold | 20,475 | 75,193 | $450,205 | $1,418,728 |
| Reinvestment of distributions | 3,179 | 1,720 | 61,288 | 30,044 |
| Shares redeemed | (112,274) | (82,272) | (2,414,306) | (1,513,384) |
| Net increase (decrease) | (88,620) | (5,359) | $(1,902,813) | $(64,612) |
| Latin America | | | | |
| Shares sold | 5,339,360 | 5,528,011 | $120,661,935 | $106,883,642 |
| Reinvestment of distributions | 610,988 | 545,601 | 11,542,194 | 9,420,593 |
| Shares redeemed | (8,575,067) | (6,058,036) | (185,420,867) | (111,613,300) |
| Net increase (decrease) | (2,624,719) | 15,576 | $(53,216,738) | $4,690,935 |
| Class I | | | | |
| Shares sold | 265,874 | 136,401 | $6,186,180 | $2,463,122 |
| Reinvestment of distributions | 3,896 | 2,787 | 73,478 | 48,070 |
| Shares redeemed | (94,860) | (69,501) | (2,127,918) | (1,289,380) |
| Net increase (decrease) | 174,910 | 69,687 | $4,131,740 | $1,221,812 |
11. Other.
The Fund's organizational documents provide former and current trustees and officers with a limited indemnification against liabilities arising in connection with the performance of their duties to the Fund. In the normal course of business, the Fund may also enter into contracts that provide general indemnifications. The Fund's maximum exposure under these arrangements is unknown as this would be dependent on future claims that may be made against the Fund. The risk of material loss from such claims is considered remote.
Report of Independent Registered Public Accounting Firm
To the Trustees of Fidelity Investment Trust and Shareholders of Fidelity Latin America Fund:
In our opinion, the accompanying statement of assets and liabilities, including the schedule of investments, and the related statements of operations and of changes in net assets and the financial highlights present fairly, in all material respects, the financial position of Fidelity Latin America Fund (a fund of Fidelity Investment Trust) as of October 31, 2017, the results of its operations for the year then ended, the changes in its net assets for each of the two years in the period then ended and the financial highlights for each of the five years in the period then ended, in conformity with accounting principles generally accepted in the United States of America. These financial statements and financial highlights (hereafter referred to as “financial statements”) are the responsibility of the Fidelity Latin America Fund’s management. Our responsibility is to express an opinion on these financial statements based on our audits. We conducted our audits of these financial statements in accordance with the standards of the Public Company Accounting Oversight Board (United States). Those standards require that we plan and perform the audit to obtain reasonable assurance about whether the financial statements are free of material misstatement. An audit includes examining, on a test basis, evidence supporting the amounts and disclosures in the financial statements, assessing the accounting principles used and significant estimates made by management, and evaluating the overall financial statement presentation. Our procedures included confirmation of securities owned as of October 31, 2017 by correspondence with the custodian and brokers; when replies were not received from brokers, we performed other auditing procedures. We believe that our audits provide a reasonable basis for our opinion.
PricewaterhouseCoopers LLP
Boston, Massachusetts
December 18, 2017
Trustees and Officers
The Trustees, Members of the Advisory Board (if any), and officers of the trust and fund, as applicable, are listed below. The Board of Trustees governs the fund and is responsible for protecting the interests of shareholders. The Trustees are experienced executives who meet periodically throughout the year to oversee the fund's activities, review contractual arrangements with companies that provide services to the fund, oversee management of the risks associated with such activities and contractual arrangements, and review the fund's performance. Except for Jonathan Chiel, each of the Trustees oversees 190 funds. Mr. Chiel oversees 143 funds.
The Trustees hold office without limit in time except that (a) any Trustee may resign; (b) any Trustee may be removed by written instrument, signed by at least two-thirds of the number of Trustees prior to such removal; (c) any Trustee who requests to be retired or who has become incapacitated by illness or injury may be retired by written instrument signed by a majority of the other Trustees; and (d) any Trustee may be removed at any special meeting of shareholders by a two-thirds vote of the outstanding voting securities of the trust. Each Trustee who is not an interested person (as defined in the 1940 Act) of the trust and the fund is referred to herein as an Independent Trustee. Each Independent Trustee shall retire not later than the last day of the calendar year in which his or her 75th birthday occurs. The Independent Trustees may waive this mandatory retirement age policy with respect to individual Trustees. Officers and Advisory Board Members hold office without limit in time, except that any officer or Advisory Board Member may resign or may be removed by a vote of a majority of the Trustees at any regular meeting or any special meeting of the Trustees. Except as indicated, each individual has held the office shown or other offices in the same company for the past five years.
The fund’s Statement of Additional Information (SAI) includes more information about the Trustees. To request a free copy, call Fidelity at 1-877-208-0098.
Experience, Skills, Attributes, and Qualifications of the Trustees. The Governance and Nominating Committee has adopted a statement of policy that describes the experience, qualifications, attributes, and skills that are necessary and desirable for potential Independent Trustee candidates (Statement of Policy). The Board believes that each Trustee satisfied at the time he or she was initially elected or appointed a Trustee, and continues to satisfy, the standards contemplated by the Statement of Policy. The Governance and Nominating Committee also engages professional search firms to help identify potential Independent Trustee candidates who have the experience, qualifications, attributes, and skills consistent with the Statement of Policy. From time to time, additional criteria based on the composition and skills of the current Independent Trustees, as well as experience or skills that may be appropriate in light of future changes to board composition, business conditions, and regulatory or other developments, have also been considered by the professional search firms and the Governance and Nominating Committee. In addition, the Board takes into account the Trustees' commitment and participation in Board and committee meetings, as well as their leadership of standing and ad hoc committees throughout their tenure.
In determining that a particular Trustee was and continues to be qualified to serve as a Trustee, the Board has considered a variety of criteria, none of which, in isolation, was controlling. The Board believes that, collectively, the Trustees have balanced and diverse experience, qualifications, attributes, and skills, which allow the Board to operate effectively in governing the fund and protecting the interests of shareholders. Information about the specific experience, skills, attributes, and qualifications of each Trustee, which in each case led to the Board's conclusion that the Trustee should serve (or continue to serve) as a trustee of the fund, is provided below.
Board Structure and Oversight Function. James C. Curvey is an interested person and currently serves as Chairman. The Trustees have determined that an interested Chairman is appropriate and benefits shareholders because an interested Chairman has a personal and professional stake in the quality and continuity of services provided to the fund. Independent Trustees exercise their informed business judgment to appoint an individual of their choosing to serve as Chairman, regardless of whether the Trustee happens to be independent or a member of management. The Independent Trustees have determined that they can act independently and effectively without having an Independent Trustee serve as Chairman and that a key structural component for assuring that they are in a position to do so is for the Independent Trustees to constitute a substantial majority for the Board. The Independent Trustees also regularly meet in executive session. Ned C. Lautenbach serves as Chairman of the Independent Trustees and as such (i) acts as a liaison between the Independent Trustees and management with respect to matters important to the Independent Trustees and (ii) with management prepares agendas for Board meetings.
Fidelity® funds are overseen by different Boards of Trustees. The fund's Board oversees Fidelity's high income and certain equity funds, and other Boards oversee Fidelity's investment-grade bond, money market, asset allocation, and sector funds. The asset allocation funds may invest in Fidelity® funds overseen by the fund's Board. The use of separate Boards, each with its own committee structure, allows the Trustees of each group of Fidelity® funds to focus on the unique issues of the funds they oversee, including common research, investment, and operational issues. On occasion, the separate Boards establish joint committees to address issues of overlapping consequences for the Fidelity® funds overseen by each Board.
The Trustees operate using a system of committees to facilitate the timely and efficient consideration of all matters of importance to the Trustees, the fund, and fund shareholders and to facilitate compliance with legal and regulatory requirements and oversight of the fund's activities and associated risks. The Board, acting through its committees, has charged FMR and its affiliates with (i) identifying events or circumstances the occurrence of which could have demonstrably adverse effects on the fund's business and/or reputation; (ii) implementing processes and controls to lessen the possibility that such events or circumstances occur or to mitigate the effects of such events or circumstances if they do occur; and (iii) creating and maintaining a system designed to evaluate continuously business and market conditions in order to facilitate the identification and implementation processes described in (i) and (ii) above. Because the day-to-day operations and activities of the fund are carried out by or through FMR, its affiliates, and other service providers, the fund's exposure to risks is mitigated but not eliminated by the processes overseen by the Trustees. While each of the Board's committees has responsibility for overseeing different aspects of the fund's activities, oversight is exercised primarily through the Operations, Audit, and Compliance Committees. In addition, the Independent Trustees have worked with FMR to enhance the Board's oversight of investment and financial risks, legal and regulatory risks, technology risks, and operational risks, including the development of additional risk reporting to the Board. For example, a working group comprised of Independent Trustees and FMR has worked and continues to work to review the Fidelity® funds' valuation-related activities, reporting and risk management. Appropriate personnel, including but not limited to the fund's Chief Compliance Officer (CCO), FMR's internal auditor, the independent accountants, the fund's Treasurer and portfolio management personnel, make periodic reports to the Board's committees, as appropriate, including an annual review of Fidelity's risk management program for the Fidelity® funds. The responsibilities of each standing committee, including their oversight responsibilities, are described further under "Standing Committees of the Trustees."
Interested Trustees*:
Correspondence intended for a Trustee who is an interested person may be sent to Fidelity Investments, 245 Summer Street, Boston, Massachusetts 02210.
Name, Year of Birth; Principal Occupations and Other Relevant Experience+
Jonathan Chiel (1957)
Year of Election or Appointment: 2016
Trustee
Mr. Chiel also serves as Trustee of other Fidelity® funds. Mr. Chiel is Executive Vice President and General Counsel for FMR LLC (diversified financial services company, 2012-present). Previously, Mr. Chiel served as general counsel (2004-2012) and senior vice president and deputy general counsel (2000-2004) for John Hancock Financial Services; a partner with Choate, Hall & Stewart (1996-2000) (law firm); and an Assistant United States Attorney for the United States Attorney’s Office of the District of Massachusetts (1986-95), including Chief of the Criminal Division (1993-1995). Mr. Chiel is a director on the boards of the Boston Bar Foundation and the Maimonides School.
James C. Curvey (1935)
Year of Election or Appointment: 2007
Trustee
Chairman of the Board of Trustees
Mr. Curvey also serves as Trustee of other Fidelity® funds. Mr. Curvey is a Director of Fidelity Research & Analysis Co. (investment adviser firm, 2009-present), and Vice Chairman (2007-present) and Director of FMR LLC (diversified financial services company). In addition, Mr. Curvey serves as an Overseer for the Boston Symphony Orchestra and a member of the board of Artis-Naples, Naples, Florida, and as a Trustee for Brewster Academy, Wolfeboro, New Hampshire. Previously, Mr. Curvey served as a Director of Fidelity Investments Money Management, Inc. (investment adviser firm, 2009-2014) and a Director of FMR and FMR Co., Inc. (investment adviser firms, 2007-2014).
Charles S. Morrison (1960)
Year of Election or Appointment: 2014
Trustee
Mr. Morrison also serves as Trustee of other funds. He serves as President of Fidelity Management & Research Company (FMR) (investment adviser firm, 2016-present), a Director of Fidelity Investments Money Management, Inc. (FIMM) (investment adviser firm, 2014-present), Director of Fidelity SelectCo, LLC (investment adviser firm, 2014-present), President, Asset Management (2014-present), and is an employee of Fidelity Investments. Previously, Mr. Morrison served as Vice President of Fidelity's Fixed Income and Asset Allocation Funds (2012-2014), President, Fixed Income (2011-2014), Vice President of Fidelity's Money Market Funds (2005-2009), President, Money Market Group Leader of FMR (investment adviser firm, 2009), and Senior Vice President, Money Market Group of FMR (2004-2009). Mr. Morrison also served as Vice President of Fidelity's Bond Funds (2002-2005), certain Balanced Funds (2002-2005), and certain Asset Allocation Funds (2002-2007), and as Senior Vice President (2002-2005) of Fidelity's Bond Division.
* Determined to be an “Interested Trustee” by virtue of, among other things, his or her affiliation with the trust or various entities under common control with FMR.
+ The information includes the Trustee's principal occupation during the last five years and other information relating to the experience, attributes, and skills relevant to the Trustee's qualifications to serve as a Trustee, which led to the conclusion that the Trustee should serve as a Trustee for the fund.
Independent Trustees:
Correspondence intended for an Independent Trustee may be sent to Fidelity Investments, P.O. Box 55235, Boston, Massachusetts 02205-5235.
Name, Year of Birth; Principal Occupations and Other Relevant Experience+
Dennis J. Dirks (1948)
Year of Election or Appointment: 2005
Trustee
Mr. Dirks also serves as Trustee of other Fidelity® funds. Prior to his retirement in May 2003, Mr. Dirks was Chief Operating Officer and a member of the Board of The Depository Trust & Clearing Corporation (DTCC). He also served as President, Chief Operating Officer, and Board member of The Depository Trust Company (DTC) and President and Board member of the National Securities Clearing Corporation (NSCC). In addition, Mr. Dirks served as Chief Executive Officer and Board member of the Government Securities Clearing Corporation, Chief Executive Officer and Board member of the Mortgage-Backed Securities Clearing Corporation, as a Trustee and a member of the Finance Committee of Manhattan College (2005-2008), as a Trustee and a member of the Finance Committee of AHRC of Nassau County (2006-2008), as a member of the Independent Directors Council (IDC) Governing Council (2010-2015), and as a member of the Board of Directors for The Brookville Center for Children’s Services, Inc. (2009-2017). Mr. Dirks is a member of the Finance Committee (2016-present) and Board of Directors (2017-present) of the Asolo Repertory Theatre.
Alan J. Lacy (1953)
Year of Election or Appointment: 2008
Trustee
Mr. Lacy also serves as Trustee of other Fidelity® funds. Mr. Lacy serves as a Director of Bristol-Myers Squibb Company (global pharmaceuticals, 2008-present). He is a Trustee of the California Chapter of The Nature Conservancy (2015-present) and a Director of the Center for Advanced Study in the Behavioral Sciences at Stanford University (2015-present). In addition, Mr. Lacy served as Senior Adviser (2007-2014) of Oak Hill Capital Partners, L.P. (private equity) and also served as Chief Executive Officer (2005) and Vice Chairman (2005-2006) of Sears Holdings Corporation (retail) and Chief Executive Officer and Chairman of the Board of Sears, Roebuck and Co. (retail, 2000-2005). Previously, Mr. Lacy served as Chairman (2014-2017) and a member (2010-2017) of the Board of Directors of Dave & Buster’s Entertainment, Inc. (restaurant and entertainment complexes), as Chairman (2008-2011) and a member (2006-2015) of the Board of Trustees of the National Parks Conservation Association, and as a member of the Board of Directors for The Hillman Companies, Inc. (hardware wholesalers, 2010-2014), Earth Fare, Inc. (retail grocery, 2010-2014), and The Western Union Company (global money transfer, 2006-2011).
Ned C. Lautenbach (1944)
Year of Election or Appointment: 2000
Trustee
Chairman of the Independent Trustees
Mr. Lautenbach also serves as Trustee of other Fidelity® funds. Mr. Lautenbach currently serves as Vice Chair of the Board of Governors, State University System of Florida (2013-present) and is a member of the Council on Foreign Relations (1994-present). He is also a member and has most recently served as Chairman of the Board of Directors of Artis-Naples (2012-present). Previously, Mr. Lautenbach served as a member and then Lead Director of the Board of Directors of Eaton Corporation (diversified industrial, 1997-2016). He was also a Partner and Advisory Partner at Clayton, Dubilier & Rice, LLC (private equity investment, 1998-2010), as well as a Director of Sony Corporation (2006-2007). In addition, Mr. Lautenbach also had a 30-year career with IBM (technology company) during which time he served as Senior Vice President and a member of the Corporate Executive Committee (1968-1998).
Joseph Mauriello (1944)
Year of Election or Appointment: 2008
Trustee
Mr. Mauriello also serves as Trustee of other Fidelity® funds. Prior to his retirement in January 2006, Mr. Mauriello served in numerous senior management positions including Deputy Chairman and Chief Operating Officer (2004-2005), and Vice Chairman of Financial Services (2002-2004) of KPMG LLP US (professional services, 1965-2005). Mr. Mauriello currently serves as a member of the Board of Directors of XL Group plc. (global insurance and re-insurance, 2006-present) and the Independent Directors Council (IDC) Governing Council (2015-present). Previously, Mr. Mauriello served as a Director of the Hamilton Funds of the Bank of New York (2006-2007) and of Arcadia Resources Inc. (health care services and products, 2007-2012).
Cornelia M. Small (1944)
Year of Election or Appointment: 2005
Trustee
Ms. Small also serves as Trustee of other Fidelity® funds. Ms. Small is a member of the Board of Directors (2009-present) and Chair of the Investment Committee (2010-present) of the Teagle Foundation. Ms. Small also serves on the Investment Committee of the Berkshire Taconic Community Foundation (2008-present). Previously, Ms. Small served as Chairperson (2002-2008) and a member of the Investment Committee and Chairperson (2008-2012) and a member of the Board of Trustees of Smith College. In addition, Ms. Small served as Chief Investment Officer, Director of Global Equity Investments, and a member of the Board of Directors of Scudder, Stevens & Clark and Scudder Kemper Investments.
William S. Stavropoulos (1939)
Year of Election or Appointment: 2001
Trustee
Vice Chairman of the Independent Trustees
Mr. Stavropoulos also serves as Trustee of other Fidelity® funds. Mr. Stavropoulos serves as President and Founder of the Michigan Baseball Foundation, the Great Lakes Loons (2007-present). Mr. Stavropoulos is Chairman Emeritus of the Board of Directors of The Dow Chemical Company, where he previously served in numerous senior management positions, including President, CEO (1995-2000; 2002-2004), Chairman of the Executive Committee (2000-2006), and as a member of the Board of Directors (1990-2006). Currently, Mr. Stavropoulos is Chairman of the Board of Directors of Univar Inc. (global distributor of commodity and specialty chemicals), a Director of Teradata Corporation (data warehousing and technology solutions), and a member of the Advisory Board for Metalmark Capital LLC (private equity investment, 2005-present). Mr. Stavropoulos is an operating advisor to Clayton, Dubilier & Rice, LLC (private equity investment). In addition, Mr. Stavropoulos is a member of the University of Notre Dame Advisory Council for the College of Science, a Trustee of the Rollin L. Gerstacker Foundation, and a Director of Artis-Naples in Naples, Florida. Previously, Mr. Stavropoulos served as a Director of Chemical Financial Corporation (bank holding company, 1993-2012) and Tyco International, Ltd. (multinational manufacturing and services, 2007-2012).
David M. Thomas (1949)
Year of Election or Appointment: 2008
Trustee
Mr. Thomas also serves as Trustee of other Fidelity® funds. Mr. Thomas serves as Non-Executive Chairman of the Board of Directors of Fortune Brands Home and Security (home and security products, 2011-present), as a member of the Board of Directors (2004-present) and Presiding Director (2013-present) of Interpublic Group of Companies, Inc. (marketing communication), and as a member of the Board of Trustees of the University of Florida (2013-present). Previously, Mr. Thomas served as Executive Chairman (2005-2006) and Chairman and Chief Executive Officer (2000-2005) of IMS Health, Inc. (pharmaceutical and healthcare information solutions), and a Director of Fortune Brands, Inc. (consumer products, 2000-2011).
+ The information includes the Trustee's principal occupation during the last five years and other information relating to the experience, attributes, and skills relevant to the Trustee's qualifications to serve as a Trustee, which led to the conclusion that the Trustee should serve as a Trustee for the fund.
Advisory Board Members and Officers:
Correspondence intended for an officer or Peter S. Lynch may be sent to Fidelity Investments, 245 Summer Street, Boston, Massachusetts 02210. Officers appear below in alphabetical order.
Name, Year of Birth; Principal Occupation
Peter S. Lynch (1944)
Year of Election or Appointment: 2003
Member of the Advisory Board
Mr. Lynch also serves as Member of the Advisory Board of other Fidelity® funds. Mr. Lynch is Vice Chairman and a Director of FMR (investment adviser firm) and FMR Co., Inc. (investment adviser firm). In addition, Mr. Lynch serves as a Trustee of Boston College and as the Chairman of the Inner-City Scholarship Fund. Previously, Mr. Lynch served on the Special Olympics International Board of Directors (1997-2006).
Elizabeth Paige Baumann (1968)
Year of Election or Appointment: 2017
Anti-Money Laundering (AML) Officer
Ms. Baumann also serves as AML Officer of other funds. She is Chief AML Officer (2012-present) and Senior Vice President (2014-present) of FMR LLC (diversified financial services company) and is an employee of Fidelity Investments. Previously, Ms. Baumann served as AML Officer of the funds (2012-2016), and Vice President (2007-2014) and Deputy Anti-Money Laundering Officer (2007-2012) of FMR LLC.
Marc R. Bryant (1966)
Year of Election or Appointment: 2015
Secretary and Chief Legal Officer (CLO)
Mr. Bryant also serves as Secretary and CLO of other funds. Mr. Bryant serves as CLO, Secretary, and Senior Vice President of Fidelity Management & Research Company (investment adviser firm, 2015-present) and FMR Co., Inc. (investment adviser firm, 2015-present); Secretary of Fidelity SelectCo, LLC (investment adviser firm, 2015-present) and Fidelity Investments Money Management, Inc. (investment adviser firm, 2015-present); and CLO of Fidelity Management & Research (Hong Kong) Limited and FMR Investment Management (UK) Limited (investment adviser firms, 2015-present) and Fidelity Management & Research (Japan) Limited (investment adviser firm, 2016-present). He is Senior Vice President and Deputy General Counsel of FMR LLC (diversified financial services company). Previously, Mr. Bryant served as Secretary and CLO of Fidelity Rutland Square Trust II (2010-2014) and Assistant Secretary of Fidelity's Fixed Income and Asset Allocation Funds (2013-2015). Prior to joining Fidelity Investments, Mr. Bryant served as a Senior Vice President and the Head of Global Retail Legal for AllianceBernstein L.P. (2006-2010), and as the General Counsel for ProFund Advisors LLC (2001-2006).
William C. Coffey (1969)
Year of Election or Appointment: 2009
Assistant Secretary
Mr. Coffey also serves as Assistant Secretary of other funds. He is Senior Vice President and Deputy General Counsel of FMR LLC (diversified financial services company, 2010-present), and is an employee of Fidelity Investments. Previously, Mr. Coffey served as Vice President and Associate General Counsel of FMR LLC (2005-2009).
Jonathan Davis (1968)
Year of Election or Appointment: 2010
Assistant Treasurer
Mr. Davis also serves as Assistant Treasurer of other funds, and is an employee of Fidelity Investments. Previously, Mr. Davis served as Vice President and Associate General Counsel of FMR LLC (diversified financial services company, 2003-2010).
Adrien E. Deberghes (1967)
Year of Election or Appointment: 2016
Assistant Treasurer
Mr. Deberghes also serves as an officer of other funds. He serves as Executive Vice President of Fidelity Investments Money Management, Inc. (FIMM) (investment adviser firm, 2016-present) and is an employee of Fidelity Investments (2008-present). Prior to joining Fidelity Investments, Mr. Deberghes was Senior Vice President of Mutual Fund Administration at State Street Corporation (2007-2008), Senior Director of Mutual Fund Administration at Investors Bank & Trust (2005-2007), and Director of Finance for Dunkin' Brands (2000-2005). Previously, Mr. Deberghes served in other fund officer roles.
Joseph DeSantis (1959)
Year of Election or Appointment: 2017
Vice President
Mr. DeSantis also serves as Vice President of other funds. Mr. DeSantis serves as a Director of Fidelity Management & Research (Japan) Limited (investment adviser firm, 2016-present), Chief Investment Officer, Equities (2010-present) and is an employee of Fidelity Investments.
Stephanie J. Dorsey (1969)
Year of Election or Appointment: 2010
Assistant Treasurer
Ms. Dorsey also serves as an officer of other funds. She is an employee of Fidelity Investments (2008-present) and has served in other fund officer roles. Prior to joining Fidelity Investments, Ms. Dorsey served as Treasurer (2004-2008) of the JPMorgan Mutual Funds and Vice President (2004-2008) of JPMorgan Chase Bank.
Howard J. Galligan III (1966)
Year of Election or Appointment: 2014
Chief Financial Officer
Mr. Galligan also serves as Chief Financial Officer of other funds. Mr. Galligan serves as President of Fidelity Pricing and Cash Management Services (FPCMS) (2014-present) and as a Director of Strategic Advisers, Inc. (investment adviser firm, 2008-present). Previously, Mr. Galligan served as Chief Administrative Officer of Asset Management (2011-2014) and Chief Operating Officer and Senior Vice President of Investment Support for Strategic Advisers, Inc. (2003-2011).
Brian B. Hogan (1964)
Year of Election or Appointment: 2009
Vice President
Mr. Hogan also serves as Trustee or Vice President of other funds. Mr. Hogan serves as a Director of FMR Investment Management (UK) Limited (investment adviser firm, 2015-present) and Fidelity SelectCo, LLC (investment adviser firm, 2014-present) and President of the Equity Division of FMR (investment adviser firm, 2009-present). Previously, Mr. Hogan served as Senior Vice President, Equity Research of FMR (2006-2009) and as a portfolio manager. Mr. Brian B. Hogan is not related to Mr. Colm A. Hogan.
Colm A. Hogan (1973)
Year of Election or Appointment: 2016
Deputy Treasurer
Mr. Hogan also serves as an officer of other funds. Mr. Hogan is an employee of Fidelity Investments (2005-present). Mr. Colm A. Hogan is not related to Mr. Brian B. Hogan.
Chris Maher (1972)
Year of Election or Appointment: 2013
Assistant Treasurer
Mr. Maher serves as Assistant Treasurer of other funds. Mr. Maher is Vice President of Valuation Oversight and is an employee of Fidelity Investments. Previously, Mr. Maher served as Vice President of Asset Management Compliance (2013), Vice President of the Program Management Group of FMR (investment adviser firm, 2010-2013), and Vice President of Valuation Oversight (2008-2010).
Rieco E. Mello (1969)
Year of Election or Appointment: 2017
Assistant Treasurer
Mr. Mello also serves as Assistant Treasurer of other funds. Mr. Mello is an employee of Fidelity Investments (1995-present).
Kenneth B. Robins (1969)
Year of Election or Appointment: 2016
Chief Compliance Officer
Mr. Robins also serves as an officer of other funds. Mr. Robins serves as Compliance Officer of Fidelity Management & Research Company and FMR Co., Inc. (investment adviser firms, 2016-present) and is an employee of Fidelity Investments (2004-present). Previously, Mr. Robins served as Executive Vice President of Fidelity Investments Money Management, Inc. (investment adviser firm, 2013-2016) and served in other fund officer roles.
Stacie M. Smith (1974)
Year of Election or Appointment: 2016
President and Treasurer
Ms. Smith also serves as an officer of other funds. She is an employee of Fidelity Investments (2009-present) and has served in other fund officer roles. Prior to joining Fidelity Investments, Ms. Smith served as Senior Audit Manager of Ernst & Young LLP (accounting firm, 1996-2009). Previously, Ms. Smith served as Deputy Treasurer of certain Fidelity® funds (2013-2016).
Marc L. Spector (1972)
Year of Election or Appointment: 2016
Assistant Treasurer
Mr. Spector also serves as an officer of other funds. Mr. Spector is an employee of Fidelity Investments (2016-present). Prior to joining Fidelity Investments, Mr. Spector served as Director at the Siegfried Group (accounting firm, 2013-2016), and prior to Siegfried Group as audit senior manager at Deloitte & Touche (accounting firm, 2005-2013).
Renee Stagnone (1975)
Year of Election or Appointment: 2016
Assistant Treasurer
Ms. Stagnone also serves as an officer of other funds. Ms. Stagnone is an employee of Fidelity Investments (1997-present). Previously, Ms. Stagnone served as Deputy Treasurer of certain Fidelity® funds (2013-2016).
Shareholder Expense Example
As a shareholder of the Fund, you incur two types of costs: (1) transaction costs, including sales charges (loads) on purchase payments or redemption proceeds, redemption fees and (2) ongoing costs, including management fees, distribution and/or service (12b-1) fees and other Fund expenses. This Example is intended to help you understand your ongoing costs (in dollars) of investing in the Fund and to compare these costs with the ongoing costs of investing in other mutual funds.
The Example is based on an investment of $1,000 invested at the beginning of the period and held for the entire period (May 1, 2017 to October 31, 2017).
Actual Expenses
The first line of the accompanying table for each class of the Fund provides information about actual account values and actual expenses. You may use the information in this line, together with the amount you invested, to estimate the expenses that you paid over the period. Simply divide your account value by $1,000.00 (for example, an $8,600 account value divided by $1,000.00 = 8.6), then multiply the result by the number in the first line for a class of the Fund under the heading entitled "Expenses Paid During Period" to estimate the expenses you paid on your account during this period. A small balance maintenance fee of $12.00 that is charged once a year may apply for certain accounts with a value of less than $2,000. This fee is not included in the table below. If it was, the estimate of expenses you paid during the period would be higher, and your ending account value lower, by this amount. In addition, the Fund, as a shareholder in the underlying Fidelity Central Funds, will indirectly bear its pro-rata share of the fees and expenses incurred by the underlying Fidelity Central Funds. These fees and expenses are not included in the Fund's annualized expense ratio used to calculate the expense estimate in the table below.
Hypothetical Example for Comparison Purposes
The second line of the accompanying table for each class of the Fund provides information about hypothetical account values and hypothetical expenses based on a Class' actual expense ratio and an assumed rate of return of 5% per year before expenses, which is not the Class' actual return. The hypothetical account values and expenses may not be used to estimate the actual ending account balance or expenses you paid for the period. You may use this information to compare the ongoing costs of investing in the Fund and other funds. To do so, compare this 5% hypothetical example with the 5% hypothetical examples that appear in the shareholder reports of the other funds. A small balance maintenance fee of $12.00 that is charged once a year may apply for certain accounts with a value of less than $2,000. This fee is not included in the table below. If it was, the estimate of expenses you paid during the period would be higher, and your ending account value lower, by this amount. In addition, the Fund, as a shareholder in the underlying Fidelity Central Funds, will indirectly bear its pro-rata share of the fees and expenses incurred by the underlying Fidelity Central Funds. These fees and expenses are not included in the Fund's annualized expense ratio used to calculate the expense estimate in the table below.
Please note that the expenses shown in the table are meant to highlight your ongoing costs only and do not reflect any transaction costs. Therefore, the second line of the table is useful in comparing ongoing costs only, and will not help you determine the relative total costs of owning different funds. In addition, if these transactional costs were included, your costs would have been higher.
| | Annualized Expense Ratio-A | Beginning
Account Value
May 1, 2017 | Ending
Account Value
October 31, 2017 | Expenses Paid
During Period-B
May 1, 2017
to October 31, 2017 |
| Class A | 1.38% | | | |
| Actual | | $1,000.00 | $1,106.00 | $7.33 |
| Hypothetical-C | | $1,000.00 | $1,018.25 | $7.02 |
| Class M | 1.65% | | | |
| Actual | | $1,000.00 | $1,104.40 | $8.75 |
| Hypothetical-C | | $1,000.00 | $1,016.89 | $8.39 |
| Class C | 2.13% | | | |
| Actual | | $1,000.00 | $1,101.80 | $11.28 |
| Hypothetical-C | | $1,000.00 | $1,014.47 | $10.82 |
| Latin America | 1.07% | | | |
| Actual | | $1,000.00 | $1,107.20 | $5.68 |
| Hypothetical-C | | $1,000.00 | $1,019.81 | $5.45 |
| Class I | 1.01% | | | |
| Actual | | $1,000.00 | $1,107.70 | $5.37 |
| Hypothetical-C | | $1,000.00 | $1,020.11 | $5.14 |
A Annualized expense ratio reflects expenses net of applicable fee waivers.
B Expenses are equal to each Class' annualized expense ratio, multiplied by the average account value over the period, multiplied by 184/365 (to reflect the one-half year period).
C 5% return per year before expenses
Distributions (Unaudited)
Class A, Class M, Class C, Latin America and Class I designate 1% of dividends distributed during the fiscal year as amounts which may be taken into account as a dividend for purposes of the maximum rate under section 1(h)(11) of the Internal Revenue Code.
Class A designates 59% and 3%; Class M designates 70%, and 3%; Class C designates 97% and 3%; Latin America designates 52% and 3%, and Class I designates 51% and 3% of the dividends distributed in December 9, 2016 and December 29, 2016, respectively during the fiscal year as amounts which may be taken into account as a dividend for purposes of the maximum rate under section 1(h)(11) of the Internal Revenue Code.
The amounts per share which represent income derived from sources within, and taxes paid to, foreign countries or possessions of the United States are as follows:
| | Pay Date | Income | Taxes |
| Fidelity Latin America Fund | | | |
| Class A | 12/12/16 | $0.3756 | $0.0296 |
| Class M | 12/12/16 | $0.3186 | $0.0296 |
| Class C | 12/12/16 | $0.2276 | $0.0296 |
| Latin America | 12/12/16 | $0.4246 | $0.0296 |
| Class I | 12/12/16 | $0.4356 | $0.0296 |
| Class A | 12/30/16 | $0.0800 | $0.0000 |
| Class M | 12/30/16 | $0.0800 | $0.0000 |
| Class C | 12/30/16 | $0.0800 | $0.0000 |
| Latin America | 12/30/16 | $0.0800 | $0.0000 |
| Class I | 12/30/16 | $0.0800 | $0.0000 |
|
The fund will notify shareholders in January 2018 of amounts for use in preparing 2017 income tax returns.
Board Approval of Investment Advisory Contracts and Management Fees
Fidelity Latin America Fund
Each year, the Board of Trustees, including the Independent Trustees (together, the Board), votes on the renewal of the management contract with Fidelity Management & Research Company (FMR) and the sub-advisory agreements (together, the Advisory Contracts) for the fund. FMR and the sub-advisers are referred to herein as the Investment Advisers. The Board, assisted by the advice of fund counsel and Independent Trustees' counsel, requests and considers a broad range of information relevant to the renewal of the Advisory Contracts throughout the year.
The Board meets regularly and, at each of its meetings, covers an extensive agenda of topics and materials and considers factors that are relevant to its annual consideration of the renewal of the fund's Advisory Contracts, including the services and support provided to the fund and its shareholders. The Board has established various standing committees (Committees), each composed of and chaired by Independent Trustees with varying backgrounds, to which the Board has assigned specific subject matter responsibilities in order to enhance effective decision-making by the Board. The Board, acting directly and through its Committees, requests and receives information concerning the annual consideration of the renewal of the fund's Advisory Contracts. The Board also meets as needed to review matters specifically related to the Board's annual consideration of the renewal of the Advisory Contracts. Members of the Board may also meet with trustees of other Fidelity funds through ad hoc joint committees to discuss certain matters relevant to all of the Fidelity funds.
At its July 2017 meeting, the Board unanimously determined to renew the fund's Advisory Contracts. In reaching its determination, the Board considered all factors it believed relevant, including (i) the nature, extent, and quality of the services to be provided to the fund and its shareholders (including the investment performance of the fund); (ii) the competitiveness of the fund's management fee and total expense ratio relative to peer funds; (iii) the total costs of the services to be provided by and the profits to be realized by Fidelity from its relationships with the fund; and (iv) the extent to which, if any, economies of scale exist and would be realized as the fund grows, and whether any economies of scale are appropriately shared with fund shareholders.
In considering whether to renew the Advisory Contracts for the fund, the Board reached a determination, with the assistance of fund counsel and Independent Trustees' counsel and through the exercise of its business judgment, that the renewal of the Advisory Contracts was in the best interests of the fund and its shareholders and that the compensation payable under the Advisory Contracts was fair and reasonable. The Board's decision to renew the Advisory Contracts was not based on any single factor, but rather was based on a comprehensive consideration of all the information provided to the Board at its meetings throughout the year. The Board, in reaching its determination to renew the Advisory Contracts, was aware that shareholders of the fund have a broad range of investment choices available to them, including a wide choice among funds offered by Fidelity's competitors, and that the fund's shareholders, who have the opportunity to review and weigh the disclosure provided by the fund in its prospectus and other public disclosures, have chosen to invest in this fund, which is part of the Fidelity family of funds.
Amendment to Group Fee Rate. The Board also approved an amendment to the management contract for the fund to add an additional breakpoint to the group fee schedule, effective October 1, 2017. The Board noted that the additional breakpoint would result in lower management fee rates as Fidelity's assets under management increase.
Nature, Extent, and Quality of Services Provided. The Board considered Fidelity's staffing as it relates to the fund, including the backgrounds of investment personnel of Fidelity, and also considered the fund's investment objective, strategies, and related investment philosophy. The Independent Trustees also had discussions with senior management of Fidelity's investment operations and investment groups. The Board considered the structure of the investment personnel compensation program and whether this structure provides appropriate incentives to act in the best interests of the fund. Additionally, the Board considered the portfolio managers' investments, if any, in the funds that they manage.
Resources Dedicated to Investment Management and Support Services. The Board and the Fund Oversight and Research Committees reviewed the general qualifications and capabilities of Fidelity's investment staff, including its size, education, experience, and resources, as well as Fidelity's approach to recruiting, training, managing, and compensating investment personnel. The Board noted that Fidelity has continued to increase the resources devoted to non-U.S. offices, including expansion of Fidelity's global investment organization. The Board also noted that Fidelity's analysts have extensive resources, tools and capabilities that allow them to conduct sophisticated quantitative and fundamental analysis, as well as credit analysis of issuers, counterparties and guarantors. Further, the Board considered that Fidelity's investment professionals have sufficient access to global information and data so as to provide competitive investment results over time, and that those professionals also have access to sophisticated tools that permit them to assess portfolio construction and risk and performance attribution characteristics continuously, as well as to transmit new information and research conclusions rapidly around the world. Additionally, in its deliberations, the Board considered Fidelity's trading, risk management, compliance, and technology and operations capabilities and resources, which are integral parts of the investment management process.
Shareholder and Administrative Services. The Board considered (i) the nature, extent, quality, and cost of advisory, administrative, and shareholder services performed by the Investment Advisers and their affiliates under the Advisory Contracts and under separate agreements covering transfer agency, pricing and bookkeeping, and securities lending services for the fund; (ii) the nature and extent of the supervision of third party service providers, principally custodians, subcustodians, and pricing vendors; and (iii) the resources devoted to, and the record of compliance with, the fund's compliance policies and procedures. The Board also reviewed the allocation of fund brokerage, including allocations to brokers affiliated with the Investment Advisers, the use of brokerage commissions to pay fund expenses, and the use of "soft" commission dollars to pay for research services.
The Board noted that the growth of fund assets over time across the complex allows Fidelity to reinvest in the development of services designed to enhance the value or convenience of the Fidelity funds as investment vehicles. These services include 24-hour access to account information and market information through telephone representatives and over the Internet, investor education materials and asset allocation tools, and the expanded availability of Fidelity Investor Centers.
In 2014, the Board formed an ad hoc Committee on Transfer Agency Fees to review the variety of transfer agency fee structures throughout the industry and Fidelity's competitive positioning with respect to industry participants.
Investment in a Large Fund Family. The Board considered the benefits to shareholders of investing in a Fidelity fund, including the benefits of investing in a fund that is part of a large family of funds offering a variety of investment disciplines and providing a large variety of mutual fund investor services. The Board noted that Fidelity had taken, or had made recommendations that resulted in the Fidelity funds taking, a number of actions over the previous year that benefited particular funds, including: (i) continuing to dedicate additional resources to Fidelity's investment research process, and to the support of the senior management team that oversees asset management; (ii) continuing efforts to enhance Fidelity's global research capabilities; (iii) launching new funds and making other enhancements to meet client needs; (iv) launching new share classes of existing funds; (v) eliminating purchase minimums and broadening eligibility requirements for certain lower-priced share classes; (vi) reducing management fees and total expenses for certain growth equity funds and index funds; (vii) lowering expense caps for certain existing funds and classes to reduce expenses borne by shareholders; (viii) eliminating short-term redemption fees for certain funds; (ix) introducing a new pricing structure for certain funds of funds that is expected to reduce overall expenses paid by shareholders; (x) rationalizing product lines and gaining increased efficiencies through proposals for fund mergers and share class consolidations; (xi) continuing to develop, acquire and implement systems and technology to improve services to the funds and shareholders, strengthen information security, and increase efficiency; and (xii) implementing enhancements to further strengthen Fidelity's product line to increase investors' probability of success in achieving their investment goals, including retirement income goals.
Investment Performance. The Board considered whether the fund has operated in accordance with its investment objective, as well as its record of compliance with its investment restrictions and its performance history.
The Board took into account discussions with representatives of the Investment Advisers about fund investment performance that occur at Board meetings throughout the year. In this regard the Board noted that as part of regularly scheduled fund reviews and other reports to the Board on fund performance, the Board considers annualized return information for the fund for different time periods, measured against a securities market index ("benchmark index") and a peer group of funds with similar objectives ("peer group"), if any. In its evaluation of fund investment performance, the Board gave particular attention to information indicating changes in performance of certain Fidelity funds for specific time periods and discussed with the Investment Advisers the reasons for any overperformance or underperformance.
In addition to reviewing absolute and relative fund performance, the Independent Trustees periodically consider the appropriateness of fund performance metrics in evaluating the results achieved. In general, the Independent Trustees believe that fund performance should be evaluated based on net performance (after fees and expenses) of both the highest performing and lowest performing fund share classes, where applicable, compared to appropriate benchmark indices, over appropriate time periods that may include full market cycles, and compared to peer groups, as applicable, over the same periods, taking into account relevant factors including the following: general market conditions; issuer-specific information; and fund cash flows and other factors.
The Independent Trustees recognize that shareholders evaluate performance on a net basis over their own holding periods, for which one-, three-, and five-year periods are often used as a proxy. For this reason, the performance information reviewed by the Board also included net cumulative calendar year total return information for the fund and an appropriate benchmark index for the most recent one-, three-, and five-year periods, as shown below. A peer group is not shown below because the fund does not generally utilize a peer group for performance comparison purposes.
Fidelity Latin America Fund
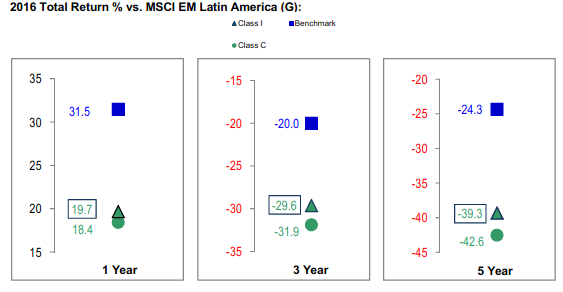
The Board has discussed Fidelity Latin America Fund's underperformance (based on the December 31, 2016 data presented herein) with FMR, including the fund's investment strategy, the portfolio management team, and broader trends in the market that may have impacted the fund's performance, and has engaged with FMR to consider what steps might be taken to remediate the fund's underperformance. The Board noted that the fund's performance has improved since the period shown. The Board noted that there were portfolio management changes for the fund in October 2015 and December 2015.
Based on its review, the Board concluded that the nature, extent, and quality of services provided to the fund under the Advisory Contracts should continue to benefit the shareholders of the fund.
Competitiveness of Management Fee and Total Expense Ratio. The Board considered the fund's management fee and total expense ratio compared to "mapped groups" of competitive funds and classes created for the purpose of facilitating the Trustees' competitive analysis of management fees and total expenses. Fidelity creates "mapped groups" by combining similar Lipper investment objective categories that have comparable investment mandates. Combining Lipper investment objective categories aids the Board's management fee and total expense ratio comparisons by broadening the competitive group used for comparison.
Management Fee. The Board considered two proprietary management fee comparisons for the 12-month periods shown in basis points (BP) in the chart below. The group of Lipper funds used by the Board for management fee comparisons is referred to below as the "Total Mapped Group." The Total Mapped Group comparison focuses on a fund's standing in terms of gross management fees before expense reimbursements or caps relative to the total universe of funds with comparable investment mandates, regardless of whether their management fee structures also are comparable. Funds with comparable investment mandates offer exposure to similar types of securities. Funds with comparable management fee structures have similar management fee contractual arrangements (
e.g., flat rate charged for advisory services, all-inclusive fee rate,
etc.). "TMG %" represents the percentage of funds in the Total Mapped Group that had management fees that were lower than the fund's. For example, a hypothetical TMG % of 20% would mean that 80% of the funds in the Total Mapped Group had higher, and 20% had lower, management fees than the fund. The fund's actual TMG %s and the number of funds in the Total Mapped Group are in the chart below. The "Asset-Size Peer Group" (ASPG) comparison focuses on a fund's standing relative to a subset of non-Fidelity funds within the Total Mapped Group that are similar in size and management fee structure. For example, if a fund is in the first quartile of the ASPG, the fund's management fee ranks in the least expensive or lowest 25% of funds in the ASPG. The ASPG represents at least 15% of the funds in the Total Mapped Group with comparable asset size and management fee structures, subject to a minimum of 50 funds (or all funds in the Total Mapped Group if fewer than 50). Additional information, such as the ASPG quartile in which the fund's management fee rate ranked, is also included in the chart and considered by the Board.
Fidelity Latin America Fund

The Board noted that the fund's management fee rate ranked below the median of its Total Mapped Group and below the median of its ASPG for 2016.
The Board noted that, in 2014, the Board and the boards of other Fidelity funds formed the ad hoc Committee on Group Fee to conduct an in-depth review of the "group fee" component of the management fee of funds with such management fee structures. The Committee's focus included the mechanics of the group fee, the competitive landscape of group fee structures, Fidelity funds with no group fee component and investment products not included in group fee assets. The Board also considered that, for funds subject to the group fee, FMR agreed to voluntarily waive fees over a specified period of time in amounts designed to account for assets converted from certain funds to certain collective investment trusts.
The Board also noted that, in 2013, the ad hoc Committee on Management Fees was formed to conduct an in-depth review of the management fee rates of Fidelity's active equity mutual funds. The Committee focused on the following areas: (i) standard fee structures; (ii) research consumption and trading evolution; (iii) management fee competitiveness/profitability by category; and (iv) factors that drive institutional pricing.
Based on its review, the Board concluded that the fund's management fee is fair and reasonable in light of the services that the fund receives and the other factors considered.
Total Expense Ratio. In its review of each class's total expense ratio, the Board considered the fund's management fee rate as well as other fund or class expenses, as applicable, such as transfer agent fees, pricing and bookkeeping fees, fund-paid 12b-1 fees, and custodial, legal, and audit fees. The Board also noted that Fidelity may agree to waive fees and expenses from time to time, and the extent to which, if any, it has done so for the fund. As part of its review, the Board also considered the current and historical total expense ratios of each class of the fund compared to competitive fund median expenses. Each class of the fund is compared to those funds and classes in the Total Mapped Group (used by the Board for management fee comparisons) that have a similar sales load structure.
The Board noted that the total expense ratio of each of Class A, Class C, Class I, and the retail class ranked below the competitive median for 2016 and the total expense ratio of Class M (formerly Class T) ranked above the competitive median for 2016. The Board considered that, in general, various factors can affect total expense ratios. The Board noted that the total expense ratio of Class M was above the competitive median primarily because of higher 12b-1 fees on Class M as compared to most competitor funds. Class M has a higher 12b-1 fee, but a lower front-end sales charge, than traditionally priced front-end sales charge classes. The Board considered that Class M is primarily sold load-waived in the retirement plan market where its 0.50% 12b-1 fee is comparable to competing no-load, higher 12b-1 fee classes designed specifically for retirement plans. The Board noted that the fund offers multiple classes, each of which has a different sales load and 12b-1 fee structure, and that the multiple structures are intended to offer a range of pricing options for the intermediary market. The Board also noted that the total expense ratios of the classes vary primarily by the level of their 12b-1 fees, although differences in transfer agent fees may also cause expenses to vary from class to class.
Fees Charged to Other Fidelity Clients. The Board also considered Fidelity fee structures and other information with respect to clients of Fidelity, such as other funds advised or subadvised by Fidelity, pension plan clients, and other institutional clients with similar mandates. The Board noted that an ad hoc joint committee created by it and the boards of other Fidelity funds periodically (most recently in 2013) reviews and compares Fidelity's institutional investment advisory business with its business of providing services to the Fidelity funds, including the differences in services provided, fees charged, and costs incurred, as well as competition in their respective marketplaces.
Based on its review of total expense ratios and fees charged to other Fidelity clients, the Board concluded that, although Class M was above the median of the universe presented for comparison, the total expense ratio of each class of the fund was reasonable in light of the services that the fund and its shareholders receive and the other factors considered.
Costs of the Services and Profitability. The Board considered the revenues earned and the expenses incurred by Fidelity in conducting the business of developing, marketing, distributing, managing, administering and servicing the fund and servicing the fund's shareholders. The Board also considered the level of Fidelity's profits in respect of all the Fidelity funds.
On an annual basis, Fidelity presents to the Board information about the profitability of its relationships with the fund. Fidelity calculates profitability information for each fund, as well as aggregate profitability information for groups of Fidelity funds and all Fidelity funds, using a series of detailed revenue and cost allocation methodologies which originate with the books and records of Fidelity on which Fidelity's audited financial statements are based. The Audit Committee of the Board reviews any significant changes from the prior year's methodologies.
PricewaterhouseCoopers LLP (PwC), independent registered public accounting firm and auditor to Fidelity and certain Fidelity funds, has been engaged annually by the Board as part of the Board's assessment of Fidelity's profitability analysis. PwC's engagement includes the review and assessment of the methodologies used by Fidelity in determining the revenues and expenses attributable to Fidelity's mutual fund business, and completion of agreed-upon procedures in respect of the mathematical accuracy of the fund profitability information and its conformity to established allocation methodologies. After considering PwC's reports issued under the engagement and information provided by Fidelity, the Board concluded that while other allocation methods may also be reasonable, Fidelity's profitability methodologies are reasonable in all material respects.
The Board also reviewed Fidelity's non-fund businesses and potential fall-out benefits related to the mutual fund business as well as cases where Fidelity's affiliates may benefit from or be related to the fund's business.
The Board considered the costs of the services provided by and the profits realized by Fidelity in connection with the operation of the fund and was satisfied that the profitability was not excessive.
Economies of Scale. The Board considered whether there have been economies of scale in respect of the management of the Fidelity funds, whether the Fidelity funds (including the fund) have appropriately benefited from any such economies of scale, and whether there is potential for realization of any further economies of scale. The Board considered the extent to which the fund will benefit from economies of scale as assets grow through increased services to the fund, through waivers or reimbursements, or through fee or expense ratio reductions. The Board also noted that a committee (the Economies of Scale Committee) created by it and the boards of other Fidelity funds periodically (most recently in 2013) analyzes whether Fidelity attains economies of scale in respect of the management and servicing of the Fidelity funds, whether the Fidelity funds have appropriately benefited from such economies of scale, and whether there is potential for realization of any further economies of scale.
The Board recognized that the fund's management contract incorporates a "group fee" structure, which provides for lower group fee rates as total group assets increase, and for higher group fee rates as total group assets decrease (with "group assets" defined to include fund assets under FMR's management plus the assets of sector funds previously under FMR's management). FMR calculates the group fee rates based on a tiered asset "breakpoint" schedule that varies based on asset class. The Board considered that the group fee is designed to deliver the benefits of economies of scale to fund shareholders when total Fidelity fund assets increase, even if assets of any particular fund are unchanged or have declined, because some portion of Fidelity's costs are attributable to services provided to all Fidelity funds, and all funds benefit if those costs can be allocated among more assets. The Board concluded that, given the group fee structure, fund shareholders will benefit from lower management fees as group assets increase at the fund complex level, regardless of whether Fidelity achieves any such economies of scale.
The Board concluded, taking into account the analysis of the Economies of Scale Committee, that economies of scale, if any, are being appropriately shared between fund shareholders and Fidelity.
Additional Information Requested by the Board. In order to develop fully the factual basis for consideration of the Fidelity funds' advisory contracts, the Board requested and received additional information on certain topics, including: (i) fund performance trends, in particular the underperformance of certain funds, and Fidelity's long-term strategies for certain funds; (ii) Fidelity's fund profitability methodology, profitability trends for certain funds, and the impact of certain factors on fund profitability results, including the impact of market trends on actively managed funds; (iii) the use of performance fees and the calculation of performance adjustments, including the impact of underperformance and fund outflows on performance adjustments; (iv) metrics for evaluating index fund performance; (v) Fidelity's group fee structure, including the group fee breakpoint schedules; (vi) the terms of Fidelity's contractual and voluntary expense cap arrangements with the funds; (vii) the methodology with respect to evaluating competitive fund data and peer group classifications and fee comparisons; (viii) the expense structures for different funds and classes; (ix) Fidelity's arrangements with affiliated sub-advisers on behalf of the funds; (x) information regarding other accounts managed by Fidelity, including institutional accounts and collective investment trusts; (xi) recent changes to the fee structure for certain funds of funds; and (xii) the impact of the Department of Labor's new fiduciary rule on the funds' comparative expense information.
Based on its evaluation of all of the conclusions noted above, and after considering all factors it believed relevant, the Board concluded that the advisory fee structures are fair and reasonable, and that the fund's Advisory Contracts should be renewed.
FALAA-ANN-1217
1.917418.107
Fidelity's Targeted International Equity Funds® Fidelity® Canada Fund
Fidelity® China Region Fund
Fidelity® Emerging Asia Fund
Fidelity® Emerging Markets Fund
Fidelity® Europe Fund
Fidelity® Japan Fund
Fidelity® Japan Smaller Companies Fund
Fidelity® Latin America Fund
Fidelity® Nordic Fund
Fidelity® Pacific Basin Fund
Annual Report October 31, 2017 |
|
Contents
To view a fund's proxy voting guidelines and proxy voting record for the 12-month period ended June 30, visit http://www.fidelity.com/proxyvotingresults or visit the Securities and Exchange Commission's (SEC) web site at http://www.sec.gov.
You may also call 1-800-544-8544 to request a free copy of the proxy voting guidelines.
Standard & Poor's, S&P and S&P 500 are registered service marks of The McGraw-Hill Companies, Inc. and have been licensed for use by Fidelity Distributors Corporation.
Other third-party marks appearing herein are the property of their respective owners.
All other marks appearing herein are registered or unregistered trademarks or service marks of FMR LLC or an affiliated company. © 2017 FMR LLC. All rights reserved.
This report and the financial statements contained herein are submitted for the general information of the shareholders of the Funds. This report is not authorized for distribution to prospective investors in the Funds unless preceded or accompanied by an effective prospectus.
A fund files its complete schedule of portfolio holdings with the SEC for the first and third quarters of each fiscal year on Form N-Q. Forms N-Q are available on the SEC’s web site at http://www.sec.gov. A fund's Forms N-Q may be reviewed and copied at the SEC’s Public Reference Room in Washington, DC. Information regarding the operation of the SEC's Public Reference Room may be obtained by calling 1-800-SEC-0330.
For a complete list of a fund's portfolio holdings, view the most recent holdings listing, semiannual report, or annual report on Fidelity's web site at http://www.fidelity.com, http://www.institutional.fidelity.com, or http://www.401k.com, as applicable.
NOT FDIC INSURED •MAY LOSE VALUE •NO BANK GUARANTEE
Neither the Funds nor Fidelity Distributors Corporation is a bank.
Fidelity® Canada Fund
Performance: The Bottom Line
Average annual total return reflects the change in the value of an investment, assuming reinvestment of distributions from dividend income and capital gains (the profits earned upon the sale of securities that have grown in value, if any) and assuming a constant rate of performance each year. The hypothetical investment and the average annual total returns do not reflect the deduction of taxes that a shareholder would pay on fund distributions or the redemption of fund shares. During periods of reimbursement by Fidelity, a fund’s total return will be greater than it would be had the reimbursement not occurred. How a fund did yesterday is no guarantee of how it will do tomorrow.
Average Annual Total Returns
| For the periods ended October 31, 2017 | Past 1 year | Past 5 years | Past 10 years |
| Fidelity® Canada Fund | 14.35% | 4.11% | 0.44% |
$10,000 Over 10 Years
Let's say hypothetically that $10,000 was invested in Fidelity® Canada Fund, a class of the fund, on October 31, 2007.
The chart shows how the value of your investment would have changed, and also shows how the S&P/TSX Composite Index performed over the same period.
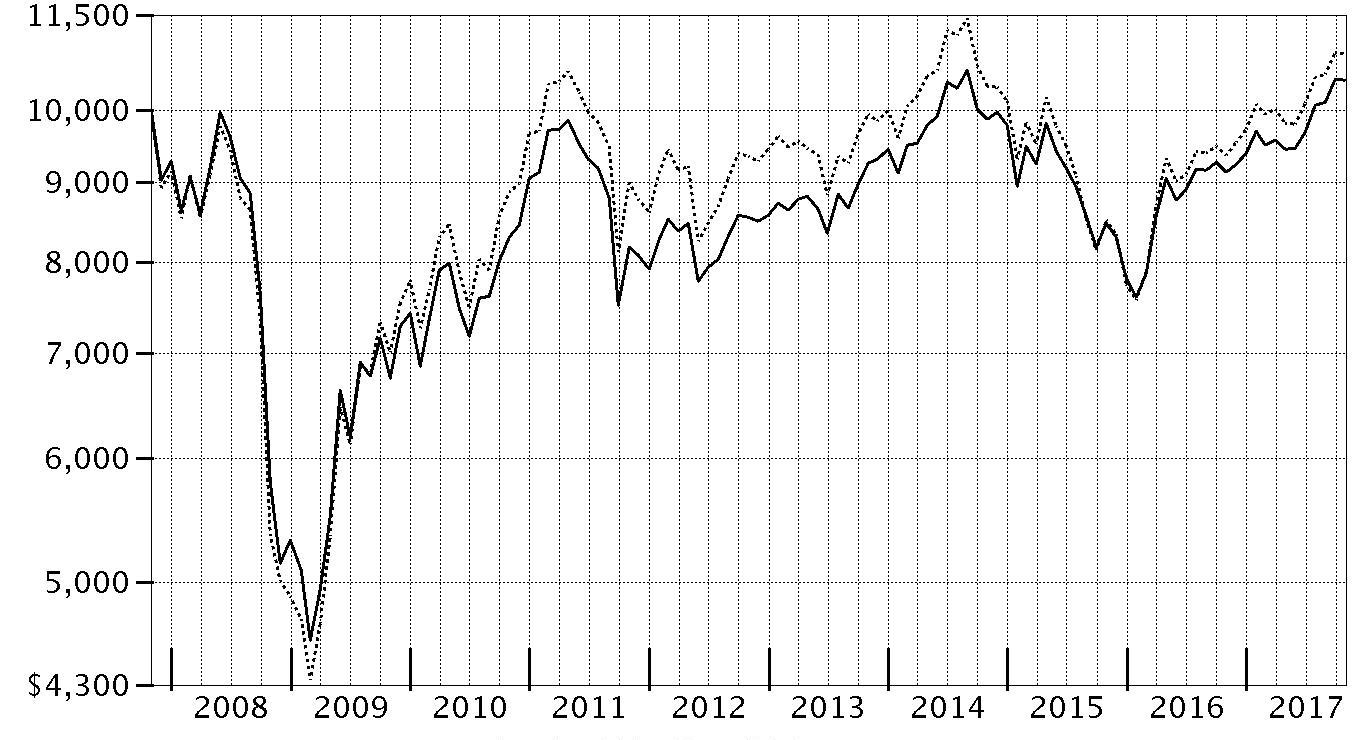
| Period Ending Values |
| $10,446 | Fidelity® Canada Fund |
| $10,849 | S&P/TSX Composite Index |
Fidelity® Canada Fund
Management's Discussion of Fund Performance
Market Recap: The MSCI ACWI (All Country World Index) ex USA Index returned 23.85% for the 12 months ending October 31, 2017, helped partly by a generally weak U.S. dollar. Some favorable election results in continental Europe (+30%) suggested ebbing political uncertainty and near-term risk there, but the U.K. (+20%) faced more-mixed conditions ahead of its expected exit from the European Union. Despite central-bank easing – and pressured recently by yen strength – Japan (+18%) lagged the rest of the Asia-Pacific group (+22%). Commodity-price volatility slowed Canada (+17%), but the emerging-markets group (+26%) sped ahead. Sector-wise, information technology (+47%) was driven by a surge among several Chinese internet-related names. Financials (+27%) rode rising interest rates that, at the same time, weighed on real estate (+17%), utilities (+16%), consumer staples (+14%) and telecommunication services (+9%) – so-called “bond proxy” sectors. Materials (+28%) and industrials (+27%) responded to demand from China and price gains for certain commodities. In the energy sector (+20%), oil prices lost ground in the spring before rebounding through October 31 to end well above where they started 12 months ago. Lastly, health care (+14%) was hurt by early-period turmoil around drug pricing and health care legislation.
Comments from Portfolio Manager Risteard Hogan: For the fiscal year ending October 31, 2017, the fund’s share classes (excluding sales charges, if applicable) gained about 13% to 14%, lagging the 15.90% return of the benchmark S&P/TSX Composite Index. My more conservative investment approach, which emphasizes companies with what I consider solid fundamentals and long-term growth prospects, held back the fund’s performance versus the benchmark. An overweighting in consumer staples, most notably a position in convenience-store operator Alimentation Couche-Tard, detracted most. Investors became increasingly concerned about Couche-Tard’s June 2016 acquisition of U.S.-based CST Brands and any potential synergies from that purchase. The fund’s most significant relative detractor, though, was untimely positioning in insurer Manulife Financial. I had chosen to emphasize competitor Sun Life Financial earlier in the period, which rose in valuation, but not as much as Manulife. I sold Sun Life in February to take profits and redeployed assets to build an overweighting in Manulife, believing in the firm's further potential upside. It turned out, though, that Manulife already delivered its strongest results for the period, and the fund had missed out. Conversely, stock picking in materials benefited our relative results, led by the fund’s top individual relative contributor: copper, nickel and zinc miner Lundin Mining, which was aided by strength in base-metal prices, especially copper.
The views expressed above reflect those of the portfolio manager(s) only through the end of the period as stated on the cover of this report and do not necessarily represent the views of Fidelity or any other person in the Fidelity organization. Any such views are subject to change at any time based upon market or other conditions and Fidelity disclaims any responsibility to update such views. These views may not be relied on as investment advice and, because investment decisions for a Fidelity fund are based on numerous factors, may not be relied on as an indication of trading intent on behalf of any Fidelity fund.
Fidelity® Canada Fund
Investment Summary (Unaudited)
Geographic Diversification (% of fund's net assets)
| As of October 31, 2017 |
| | Canada | 95.3% |
| | United States of America* | 3.0% |
| | Bailiwick of Jersey | 0.7% |
| | Ireland | 0.5% |
| | United Kingdom | 0.5% |

* Includes Short-Term investments and Net Other Assets (Liabilities).
Percentages are based on country or territory of incorporation and are adjusted for the effect of futures contracts, if applicable.
| As of April 30, 2017 |
| | Canada | 93.4% |
| | United States of America* | 3.3% |
| | Bailiwick of Jersey | 0.8% |
| | United Kingdom | 0.7% |
| | Germany | 0.6% |
| | France | 0.6% |
| | Ireland | 0.6% |

* Includes Short-Term investments and Net Other Assets (Liabilities).
Percentages are based on country or territory of incorporation and are adjusted for the effect of futures contracts, if applicable.
Asset Allocation as of October 31, 2017
| | % of fund's net assets | % of fund's net assets 6 months ago |
| Stocks | 97.4 | 97.1 |
| Short-Term Investments and Net Other Assets (Liabilities) | 2.6 | 2.9 |
Top Ten Stocks as of October 31, 2017
| | % of fund's net assets | % of fund's net assets 6 months ago |
| The Toronto-Dominion Bank (Banks) | 9.7 | 8.9 |
| Royal Bank of Canada (Banks) | 9.7 | 9.9 |
| Suncor Energy, Inc. (Oil, Gas & Consumable Fuels) | 6.2 | 5.9 |
| Manulife Financial Corp. (Insurance) | 4.1 | 3.6 |
| Canadian Pacific Railway Ltd. (Road & Rail) | 3.6 | 3.1 |
| Rogers Communications, Inc. Class B (non-vtg.) (Wireless Telecommunication Services) | 3.3 | 3.7 |
| Canadian National Railway Co. (Road & Rail) | 3.3 | 3.1 |
| Agrium, Inc. (Chemicals) | 3.1 | 2.5 |
| TELUS Corp. (Diversified Telecommunication Services) | 3.1 | 2.8 |
| Enbridge, Inc. (Oil, Gas & Consumable Fuels) | 3.0 | 4.3 |
| | 49.1 | |
Top Market Sectors as of October 31, 2017
| | % of fund's net assets | % of fund's net assets 6 months ago |
| Financials | 32.9 | 31.0 |
| Energy | 18.7 | 19.6 |
| Materials | 12.7 | 13.0 |
| Industrials | 9.1 | 8.5 |
| Consumer Staples | 7.5 | 8.1 |
| Telecommunication Services | 6.4 | 6.5 |
| Information Technology | 4.7 | 4.6 |
| Consumer Discretionary | 3.5 | 3.6 |
| Real Estate | 0.8 | 0.9 |
| Utilities | 0.7 | 0.7 |
Market Sectors may include more than one industry category.
The Fund may invest up to 35% of its total assets in any industry that represents more than 20% of the Canadian market. As of October 31, 2017, the Fund did not have more than 25% of its total assets invested in any one industry.
Fidelity® Canada Fund
Investments October 31, 2017
Showing Percentage of Net Assets
| Common Stocks - 97.4% | | | |
| | | Shares | Value |
| CONSUMER DISCRETIONARY - 3.5% | | | |
| Diversified Consumer Services - 0.1% | | | |
| Park Lawn Corp. | | 44,000 | $678,707 |
| Hotels, Restaurants & Leisure - 0.4% | | | |
| Cara Operations Ltd. | | 222,000 | 4,544,624 |
| Leisure Products - 0.4% | | | |
| BRP, Inc. | | 157,000 | 5,276,738 |
| Media - 1.9% | | | |
| Cogeco Communications, Inc. | | 120,300 | 8,648,806 |
| Corus Entertainment, Inc. Class B (non-vtg.) | | 351,400 | 3,260,412 |
| Quebecor, Inc. Class B (sub. vtg.) | | 294,900 | 11,127,612 |
| | | | 23,036,830 |
| Specialty Retail - 0.5% | | | |
| AutoCanada, Inc. (a) | | 81,500 | 1,472,572 |
| Sleep Country Canada Holdings, Inc. | | 155,600 | 4,615,776 |
| | | | 6,088,348 |
| Textiles, Apparel & Luxury Goods - 0.2% | | | |
| ERO Copper Corp. | | 779,000 | 3,091,605 |
|
| TOTAL CONSUMER DISCRETIONARY | | | 42,716,852 |
|
| CONSUMER STAPLES - 7.5% | | | |
| Food & Staples Retailing - 7.0% | | | |
| Alimentation Couche-Tard, Inc. Class B (sub. vtg.) | | 715,700 | 33,557,626 |
| George Weston Ltd. | | 270,700 | 22,728,644 |
| Jean Coutu Group, Inc. Class A (sub. vtg.) | | 395,700 | 7,508,516 |
| Metro, Inc. Class A (sub. vtg.) | | 375,295 | 11,813,604 |
| North West Co., Inc. | | 405,300 | 9,889,810 |
| | | | 85,498,200 |
| Tobacco - 0.5% | | | |
| Imperial Tobacco Group PLC | | 149,313 | 6,089,110 |
|
| TOTAL CONSUMER STAPLES | | | 91,587,310 |
|
| ENERGY - 18.7% | | | |
| Energy Equipment & Services - 1.3% | | | |
| Canadian Energy Services & Technology Corp. | | 1,643,800 | 8,855,445 |
| ShawCor Ltd. Class A | | 308,900 | 6,694,709 |
| | | | 15,550,154 |
| Oil, Gas & Consumable Fuels - 17.4% | | | |
| ARC Resources Ltd. | | 662,400 | 8,076,546 |
| Canadian Natural Resources Ltd. | | 788,398 | 27,512,346 |
| Cenovus Energy, Inc. | | 1,497,400 | 14,531,779 |
| Enbridge, Inc. | | 957,000 | 36,778,591 |
| Imperial Oil Ltd. | | 242,800 | 7,872,509 |
| NuVista Energy Ltd. (b) | | 1,036,200 | 6,441,612 |
| Peyto Exploration & Development Corp. (a) | | 397,800 | 5,426,928 |
| PrairieSky Royalty Ltd. (a) | | 940,118 | 25,024,147 |
| Raging River Exploration, Inc. (b) | | 932,200 | 5,498,831 |
| Suncor Energy, Inc. | | 2,252,300 | 76,467,514 |
| | | | 213,630,803 |
|
| TOTAL ENERGY | | | 229,180,957 |
|
| FINANCIALS - 32.9% | | | |
| Banks - 21.6% | | | |
| Bank of Nova Scotia | | 422,900 | 27,299,521 |
| Royal Bank of Canada | | 1,514,700 | 118,430,966 |
| The Toronto-Dominion Bank | | 2,096,700 | 119,193,848 |
| | | | 264,924,335 |
| Capital Markets - 3.3% | | | |
| Brookfield Asset Management, Inc. Class A | | 330,900 | 13,881,333 |
| CI Financial Corp. | | 555,000 | 12,338,113 |
| Fairfax India Holdings Corp. (b) | | 102,000 | 1,731,960 |
| Gluskin Sheff + Associates, Inc. | | 104,900 | 1,312,368 |
| TMX Group Ltd. | | 208,000 | 11,364,948 |
| | | | 40,628,722 |
| Insurance - 8.0% | | | |
| Intact Financial Corp. | | 196,425 | 16,055,357 |
| Manulife Financial Corp. | | 2,499,400 | 50,255,357 |
| Power Corp. of Canada (sub. vtg.) | | 1,230,200 | 31,544,079 |
| | | | 97,854,793 |
|
| TOTAL FINANCIALS | | | 403,407,850 |
|
| HEALTH CARE - 0.4% | | | |
| Biotechnology - 0.4% | | | |
| Amgen, Inc. | | 31,500 | 5,519,430 |
| INDUSTRIALS - 9.1% | | | |
| Professional Services - 0.8% | | | |
| Stantec, Inc. | | 339,000 | 9,685,714 |
| Road & Rail - 7.5% | | | |
| Canadian National Railway Co. | | 507,400 | 40,828,768 |
| Canadian Pacific Railway Ltd. | | 250,500 | 43,432,168 |
| TransForce, Inc. | | 320,600 | 7,738,535 |
| | | | 91,999,471 |
| Trading Companies & Distributors - 0.8% | | | |
| Toromont Industries Ltd. | | 216,700 | 9,552,538 |
|
| TOTAL INDUSTRIALS | | | 111,237,723 |
|
| INFORMATION TECHNOLOGY - 4.7% | | | |
| IT Services - 2.0% | | | |
| CGI Group, Inc. Class A (sub. vtg.) (b) | | 468,000 | 24,867,375 |
| Software - 2.7% | | | |
| Constellation Software, Inc. | | 30,300 | 17,238,659 |
| Open Text Corp. | | 457,528 | 15,998,053 |
| | | | 33,236,712 |
|
| TOTAL INFORMATION TECHNOLOGY | | | 58,104,087 |
|
| MATERIALS - 12.7% | | | |
| Chemicals - 3.4% | | | |
| Agrium, Inc. | | 344,700 | 37,526,637 |
| Methanex Corp. | | 73,300 | 3,572,104 |
| | | | 41,098,741 |
| Construction Materials - 0.5% | | | |
| CRH PLC | | 169,400 | 6,374,854 |
| Containers & Packaging - 1.0% | | | |
| CCL Industries, Inc. Class B | | 265,900 | 12,815,799 |
| Metals & Mining - 7.0% | | | |
| Agnico Eagle Mines Ltd. (Canada) | | 305,500 | 13,639,873 |
| Barrick Gold Corp. | | 454,700 | 6,569,729 |
| Detour Gold Corp. (b) | | 45,300 | 482,811 |
| Franco-Nevada Corp. | | 274,500 | 21,813,611 |
| Lundin Mining Corp. | | 1,739,600 | 13,268,478 |
| Premier Gold Mines Ltd. (b) | | 1,631,800 | 4,338,481 |
| Randgold Resources Ltd. | | 92,064 | 9,046,925 |
| Torex Gold Resources, Inc. (b) | | 276,270 | 3,809,661 |
| Wheaton Precious Metals Corp. | | 601,900 | 12,489,623 |
| | | | 85,459,192 |
| Paper & Forest Products - 0.8% | | | |
| Western Forest Products, Inc. | | 4,756,900 | 9,660,552 |
|
| TOTAL MATERIALS | | | 155,409,138 |
|
| REAL ESTATE - 0.8% | | | |
| Equity Real Estate Investment Trusts (REITs) - 0.8% | | | |
| Allied Properties (REIT) | | 308,500 | 9,885,583 |
| TELECOMMUNICATION SERVICES - 6.4% | | | |
| Diversified Telecommunication Services - 3.1% | | | |
| TELUS Corp. | | 1,034,300 | 37,456,396 |
| Wireless Telecommunication Services - 3.3% | | | |
| Rogers Communications, Inc. Class B (non-vtg.) | | 788,800 | 40,928,821 |
|
| TOTAL TELECOMMUNICATION SERVICES | | | 78,385,217 |
|
| UTILITIES - 0.7% | | | |
| Electric Utilities - 0.7% | | | |
| Hydro One Ltd. | | 495,600 | 8,762,604 |
| TOTAL COMMON STOCKS | | | |
| (Cost $840,299,904) | | | 1,194,196,751 |
|
| Money Market Funds - 4.1% | | | |
| Fidelity Cash Central Fund, 1.10% (c) | | 28,350,091 | 28,355,761 |
| Fidelity Securities Lending Cash Central Fund 1.11% (c)(d) | | 21,558,076 | 21,560,232 |
| TOTAL MONEY MARKET FUNDS | | | |
| (Cost $49,915,993) | | | 49,915,993 |
| TOTAL INVESTMENT IN SECURITIES - 101.5% | | | |
| (Cost $890,215,897) | | | 1,244,112,744 |
| NET OTHER ASSETS (LIABILITIES) - (1.5)% | | | (18,879,072) |
| NET ASSETS - 100% | | | $1,225,233,672 |
Legend
(a) Security or a portion of the security is on loan at period end.
(b) Non-income producing
(c) Affiliated fund that is generally available only to investment companies and other accounts managed by Fidelity Investments. The rate quoted is the annualized seven-day yield of the fund at period end. A complete unaudited listing of the fund's holdings as of its most recent quarter end is available upon request. In addition, each Fidelity Central Fund's financial statements, which are not covered by the Fund's Report of Independent Registered Public Accounting Firm, are available on the SEC's website or upon request.
(d) Investment made with cash collateral received from securities on loan.
Affiliated Central Funds
Information regarding fiscal year to date income earned by the Fund from investments in Fidelity Central Funds is as follows:
| Fund | Income earned |
| Fidelity Cash Central Fund | $246,412 |
| Fidelity Securities Lending Cash Central Fund | 641,086 |
| Total | $887,498 |
Investment Valuation
The following is a summary of the inputs used, as of October 31, 2017, involving the Fund's assets and liabilities carried at fair value. The inputs or methodology used for valuing securities may not be an indication of the risk associated with investing in those securities. For more information on valuation inputs, and their aggregation into the levels used below, please refer to the Investment Valuation section in the accompanying Notes to Financial Statements.
| | Valuation Inputs at Reporting Date: |
| Description | Total | Level 1 | Level 2 | Level 3 |
| Investments in Securities: | | | | |
| Equities: | | | | |
| Consumer Discretionary | $42,716,852 | $42,716,852 | $-- | $-- |
| Consumer Staples | 91,587,310 | 91,587,310 | -- | -- |
| Energy | 229,180,957 | 229,180,957 | -- | -- |
| Financials | 403,407,850 | 403,407,850 | -- | -- |
| Health Care | 5,519,430 | 5,519,430 | -- | -- |
| Industrials | 111,237,723 | 111,237,723 | -- | -- |
| Information Technology | 58,104,087 | 58,104,087 | -- | -- |
| Materials | 155,409,138 | 139,987,359�� | 15,421,779 | -- |
| Real Estate | 9,885,583 | 9,885,583 | -- | -- |
| Telecommunication Services | 78,385,217 | 78,385,217 | -- | -- |
| Utilities | 8,762,604 | 8,762,604 | -- | -- |
| Money Market Funds | 49,915,993 | 49,915,993 | -- | -- |
| Total Investments in Securities: | $1,244,112,744 | $1,228,690,965 | $15,421,779 | $-- |
See accompanying notes which are an integral part of the financial statements.
Fidelity® Canada Fund
Financial Statements
Statement of Assets and Liabilities
| | | October 31, 2017 |
| Assets | | |
Investment in securities, at value (including securities loaned of $20,327,440) — See accompanying schedule:
Unaffiliated issuers (cost $840,299,904) | $1,194,196,751 | |
| Fidelity Central Funds (cost $49,915,993) | 49,915,993 | |
| Total Investment in Securities (cost $890,215,897) | | $1,244,112,744 |
| Foreign currency held at value (cost $848,874) | | 848,874 |
| Receivable for investments sold | | 3,078,869 |
| Receivable for fund shares sold | | 1,453,857 |
| Dividends receivable | | 1,432,929 |
| Distributions receivable from Fidelity Central Funds | | 34,125 |
| Prepaid expenses | | 2,971 |
| Other receivables | | 18,556 |
| Total assets | | 1,250,982,925 |
| Liabilities | | |
| Payable for investments purchased | $602,941 | |
| Payable for fund shares redeemed | 2,474,545 | |
| Accrued management fee | 750,639 | |
| Distribution and service plan fees payable | 25,849 | |
| Other affiliated payables | 270,258 | |
| Other payables and accrued expenses | 67,249 | |
| Collateral on securities loaned | 21,557,772 | |
| Total liabilities | | 25,749,253 |
| Net Assets | | $1,225,233,672 |
| Net Assets consist of: | | |
| Paid in capital | | $855,795,706 |
| Undistributed net investment income | | 13,463,474 |
| Accumulated undistributed net realized gain (loss) on investments and foreign currency transactions | | 2,087,258 |
| Net unrealized appreciation (depreciation) on investments and assets and liabilities in foreign currencies | | 353,887,234 |
| Net Assets | | $1,225,233,672 |
| Calculation of Maximum Offering Price | | |
| Class A: | | |
| Net Asset Value and redemption price per share ($37,556,754 ÷ 694,094 shares) | | $54.11 |
| Maximum offering price per share (100/94.25 of $54.11) | | $57.41 |
| Class M: | | |
| Net Asset Value and redemption price per share ($10,355,815 ÷ 192,605 shares) | | $53.77 |
| Maximum offering price per share (100/96.50 of $53.77) | | $55.72 |
| Class C: | | |
| Net Asset Value and offering price per share ($15,937,951 ÷ 302,330 shares)(a) | | $52.72 |
| Canada: | | |
| Net Asset Value, offering price and redemption price per share ($1,130,802,507 ÷ 20,783,469 shares) | | $54.41 |
| Class I: | | |
| Net Asset Value, offering price and redemption price per share ($30,580,645 ÷ 563,294 shares) | | $54.29 |
(a) Redemption price per share is equal to net asset value less any applicable contingent deferred sales charge.
See accompanying notes which are an integral part of the financial statements.
Statement of Operations
| | | Year ended October 31, 2017 |
| Investment Income | | |
| Dividends | | $34,811,602 |
| Income from Fidelity Central Funds | | 887,498 |
| Income before foreign taxes withheld | | 35,699,100 |
| Less foreign taxes withheld | | (5,108,976) |
| Total income | | 30,590,124 |
| Expenses | | |
| Management fee | | |
| Basic fee | $9,178,955 | |
| Performance adjustment | 698,108 | |
| Transfer agent fees | 2,811,788 | |
| Distribution and service plan fees | 328,967 | |
| Accounting and security lending fees | 606,213 | |
| Custodian fees and expenses | 21,527 | |
| Independent trustees' fees and expenses | 5,317 | |
| Registration fees | 78,523 | |
| Audit | 77,648 | |
| Legal | 4,549 | |
| Miscellaneous | 11,407 | |
| Total expenses before reductions | 13,823,002 | |
| Expense reductions | (52,679) | 13,770,323 |
| Net investment income (loss) | | 16,819,801 |
| Realized and Unrealized Gain (Loss) | | |
| Net realized gain (loss) on: | | |
| Investment securities: | | |
| Unaffiliated issuers | 52,759,350 | |
| Fidelity Central Funds | 6,750 | |
| Foreign currency transactions | 172,359 | |
| Total net realized gain (loss) | | 52,938,459 |
| Change in net unrealized appreciation (depreciation) on: | | |
| Investment securities: | | |
| Unaffiliated issuers | 106,010,225 | |
| Fidelity Central Funds | (8,858) | |
| Assets and liabilities in foreign currencies | (5,883) | |
| Total change in net unrealized appreciation (depreciation) | | 105,995,484 |
| Net gain (loss) | | 158,933,943 |
| Net increase (decrease) in net assets resulting from operations | | $175,753,744 |
See accompanying notes which are an integral part of the financial statements.
Statement of Changes in Net Assets
| | Year ended October 31, 2017 | Year ended October 31, 2016 |
| Increase (Decrease) in Net Assets | | |
| Operations | | |
| Net investment income (loss) | $16,819,801 | $17,076,194 |
| Net realized gain (loss) | 52,938,459 | (32,588,329) |
| Change in net unrealized appreciation (depreciation) | 105,995,484 | 98,530,458 |
| Net increase (decrease) in net assets resulting from operations | 175,753,744 | 83,018,323 |
| Distributions to shareholders from net investment income | (16,443,381) | (17,462,078) |
| Distributions to shareholders from net realized gain | (5,168,976) | (1,771,774) |
| Total distributions | (21,612,357) | (19,233,852) |
| Share transactions - net increase (decrease) | (276,985,730) | (105,554,211) |
| Redemption fees | 38,887 | 81,286 |
| Total increase (decrease) in net assets | (122,805,456) | (41,688,454) |
| Net Assets | | |
| Beginning of period | 1,348,039,128 | 1,389,727,582 |
| End of period | $1,225,233,672 | $1,348,039,128 |
| Other Information | | |
| Undistributed net investment income end of period | $13,463,474 | $13,430,443 |
See accompanying notes which are an integral part of the financial statements.
Financial Highlights
Fidelity Canada Fund Class A
| Years ended October 31, | 2017 | 2016 | 2015 | 2014 | 2013 |
| Selected Per–Share Data | | | | | |
| Net asset value, beginning of period | $48.09 | $45.25 | $60.56 | $57.31 | $53.65 |
| Income from Investment Operations | | | | | |
| Net investment income (loss)A | .50 | .48 | .45 | .47 | .60 |
| Net realized and unrealized gain (loss) | 6.16 | 2.84 | (8.04) | 3.13 | 3.63 |
| Total from investment operations | 6.66 | 3.32 | (7.59) | 3.60 | 4.23 |
| Distributions from net investment income | (.45) | (.42) | (.50) | (.03) | (.57) |
| Distributions from net realized gain | (.19) | (.06) | (7.22) | (.32) | – |
| Total distributions | (.64) | (.48) | (7.72) | (.35) | (.57) |
| Redemption fees added to paid in capitalA,B | – | – | – | – | – |
| Net asset value, end of period | $54.11 | $48.09 | $45.25 | $60.56 | $57.31 |
| Total ReturnC,D | 13.98% | 7.45% | (14.32)% | 6.32% | 7.98% |
| Ratios to Average Net AssetsE,F | | | | | |
| Expenses before reductions | 1.34% | 1.48% | 1.43% | 1.29% | 1.19% |
| Expenses net of fee waivers, if any | 1.34% | 1.48% | 1.43% | 1.29% | 1.19% |
| Expenses net of all reductions | 1.34% | 1.48% | 1.43% | 1.29% | 1.18% |
| Net investment income (loss) | .98% | 1.06% | .90% | .79% | 1.11% |
| Supplemental Data | | | | | |
| Net assets, end of period (000 omitted) | $37,557 | $44,144 | $58,286 | $95,004 | $116,661 |
| Portfolio turnover rateG | 26% | 44% | 24% | 85% | 64% |
A Calculated based on average shares outstanding during the period.
B Amount represents less than $.005 per share.
C Total returns would have been lower if certain expenses had not been reduced during the applicable periods shown.
D Total returns do not include the effect of the sales charges.
E Fees and expenses of any underlying Fidelity Central Funds are not included in the Fund's expense ratio. The Fund indirectly bears its proportionate share of the expenses of any underlying Fidelity Central Funds.
F Expense ratios reflect operating expenses of the class. Expenses before reductions do not reflect amounts reimbursed by the investment adviser or reductions from brokerage service arrangements or reductions from other expense offset arrangements and do not represent the amount paid by the class during periods when reimbursements or reductions occur. Expenses net of fee waivers reflect expenses after reimbursement by the investment adviser but prior to reductions from brokerage service arrangements or other expense offset arrangements. Expenses net of all reductions represent the net expenses paid by the class.
G Amount does not include the portfolio activity of any underlying Fidelity Central Funds.
See accompanying notes which are an integral part of the financial statements.
Fidelity Canada Fund Class M
| Years ended October 31, | 2017 | 2016 | 2015 | 2014 | 2013 |
| Selected Per–Share Data | | | | | |
| Net asset value, beginning of period | $47.82 | $44.99 | $60.22 | $57.14 | $53.48 |
| Income from Investment Operations | | | | | |
| Net investment income (loss)A | .35 | .35 | .29 | .29 | .45 |
| Net realized and unrealized gain (loss) | 6.13 | 2.83 | (8.00) | 3.11 | 3.63 |
| Total from investment operations | 6.48 | 3.18 | (7.71) | 3.40 | 4.08 |
| Distributions from net investment income | (.34) | (.29) | (.30) | – | (.42) |
| Distributions from net realized gain | (.19) | (.06) | (7.22) | (.32) | – |
| Total distributions | (.53) | (.35) | (7.52) | (.32) | (.42) |
| Redemption fees added to paid in capitalA,B | – | – | – | – | – |
| Net asset value, end of period | $53.77 | $47.82 | $44.99 | $60.22 | $57.14 |
| Total ReturnC,D | 13.64% | 7.14% | (14.58)% | 5.99% | 7.69% |
| Ratios to Average Net AssetsE,F | | | | | |
| Expenses before reductions | 1.63% | 1.77% | 1.75% | 1.59% | 1.47% |
| Expenses net of fee waivers, if any | 1.63% | 1.77% | 1.75% | 1.59% | 1.47% |
| Expenses net of all reductions | 1.63% | 1.77% | 1.75% | 1.59% | 1.46% |
| Net investment income (loss) | .69% | .78% | .58% | .48% | .83% |
| Supplemental Data | | | | | |
| Net assets, end of period (000 omitted) | $10,356 | $11,140 | $12,820 | $21,989 | $23,751 |
| Portfolio turnover rateG | 26% | 44% | 24% | 85% | 64% |
A Calculated based on average shares outstanding during the period.
B Amount represents less than $.005 per share.
C Total returns would have been lower if certain expenses had not been reduced during the applicable periods shown.
D Total returns do not include the effect of the sales charges.
E Fees and expenses of any underlying Fidelity Central Funds are not included in the Fund's expense ratio. The Fund indirectly bears its proportionate share of the expenses of any underlying Fidelity Central Funds.
F Expense ratios reflect operating expenses of the class. Expenses before reductions do not reflect amounts reimbursed by the investment adviser or reductions from brokerage service arrangements or reductions from other expense offset arrangements and do not represent the amount paid by the class during periods when reimbursements or reductions occur. Expenses net of fee waivers reflect expenses after reimbursement by the investment adviser but prior to reductions from brokerage service arrangements or other expense offset arrangements. Expenses net of all reductions represent the net expenses paid by the class.
G Amount does not include the portfolio activity of any underlying Fidelity Central Funds.
See accompanying notes which are an integral part of the financial statements.
Fidelity Canada Fund Class C
| Years ended October 31, | 2017 | 2016 | 2015 | 2014 | 2013 |
| Selected Per–Share Data | | | | | |
| Net asset value, beginning of period | $46.87 | $44.02 | $59.04 | $56.27 | $52.61 |
| Income from Investment Operations | | | | | |
| Net investment income (loss)A | .13 | .15 | .07 | .02 | .20 |
| Net realized and unrealized gain (loss) | 6.01 | 2.78 | (7.85) | 3.07 | 3.58 |
| Total from investment operations | 6.14 | 2.93 | (7.78) | 3.09 | 3.78 |
| Distributions from net investment income | (.11) | (.02) | (.02) | – | (.12) |
| Distributions from net realized gain | (.19) | (.06) | (7.22) | (.32) | – |
| Total distributions | (.29)B | (.08) | (7.24) | (.32) | (.12) |
| Redemption fees added to paid in capitalA,C | – | – | – | – | – |
| Net asset value, end of period | $52.72 | $46.87 | $44.02 | $59.04 | $56.27 |
| Total ReturnD,E | 13.16% | 6.67% | (14.96)% | 5.53% | 7.21% |
| Ratios to Average Net AssetsF,G | | | | | |
| Expenses before reductions | 2.06% | 2.21% | 2.19% | 2.03% | 1.93% |
| Expenses net of fee waivers, if any | 2.06% | 2.21% | 2.19% | 2.03% | 1.92% |
| Expenses net of all reductions | 2.06% | 2.21% | 2.18% | 2.03% | 1.92% |
| Net investment income (loss) | .26% | .33% | .14% | .04% | .37% |
| Supplemental Data | | | | | |
| Net assets, end of period (000 omitted) | $15,938 | $18,489 | $21,610 | $38,749 | $46,040 |
| Portfolio turnover rateH | 26% | 44% | 24% | 85% | 64% |
A Calculated based on average shares outstanding during the period.
B Total distributions of $.29 per share is comprised of distributions from net investment income of $.105 and distributions from net realized gain of $.188 per share.
C Amount represents less than $.005 per share.
D Total returns would have been lower if certain expenses had not been reduced during the applicable periods shown.
E Total returns do not include the effect of the contingent deferred sales charge.
F Fees and expenses of any underlying Fidelity Central Funds are not included in the Fund's expense ratio. The Fund indirectly bears its proportionate share of the expenses of any underlying Fidelity Central Funds.
G Expense ratios reflect operating expenses of the class. Expenses before reductions do not reflect amounts reimbursed by the investment adviser or reductions from brokerage service arrangements or reductions from other expense offset arrangements and do not represent the amount paid by the class during periods when reimbursements or reductions occur. Expenses net of fee waivers reflect expenses after reimbursement by the investment adviser but prior to reductions from brokerage service arrangements or other expense offset arrangements. Expenses net of all reductions represent the net expenses paid by the class.
H Amount does not include the portfolio activity of any underlying Fidelity Central Funds.
See accompanying notes which are an integral part of the financial statements.
Fidelity Canada Fund
| Years ended October 31, | 2017 | 2016 | 2015 | 2014 | 2013 |
| Selected Per–Share Data | | | | | |
| Net asset value, beginning of period | $48.35 | $45.55 | $60.95 | $57.72 | $54.05 |
| Income from Investment Operations | | | | | |
| Net investment income (loss)A | .66 | .62 | .60 | .66 | .77 |
| Net realized and unrealized gain (loss) | 6.20 | 2.85 | (8.09) | 3.13 | 3.66 |
| Total from investment operations | 6.86 | 3.47 | (7.49) | 3.79 | 4.43 |
| Distributions from net investment income | (.61) | (.61) | (.69) | (.24) | (.76) |
| Distributions from net realized gain | (.19) | (.06) | (7.22) | (.32) | – |
| Total distributions | (.80) | (.67) | (7.91) | (.56) | (.76) |
| Redemption fees added to paid in capitalA,B | – | – | – | – | – |
| Net asset value, end of period | $54.41 | $48.35 | $45.55 | $60.95 | $57.72 |
| Total ReturnC | 14.35% | 7.79% | (14.08)% | 6.64% | 8.32% |
| Ratios to Average Net AssetsD,E | | | | | |
| Expenses before reductions | 1.02% | 1.17% | 1.15% | .98% | .87% |
| Expenses net of fee waivers, if any | 1.02% | 1.17% | 1.15% | .98% | .87% |
| Expenses net of all reductions | 1.02% | 1.17% | 1.14% | .98% | .86% |
| Net investment income (loss) | 1.30% | 1.37% | 1.18% | 1.09% | 1.42% |
| Supplemental Data | | | | | |
| Net assets, end of period (000 omitted) | $1,130,803 | $1,233,050 | $1,279,488 | $2,057,843 | $2,262,380 |
| Portfolio turnover rateF | 26% | 44% | 24% | 85% | 64% |
A Calculated based on average shares outstanding during the period.
B Amount represents less than $.005 per share.
C Total returns would have been lower if certain expenses had not been reduced during the applicable periods shown.
D Fees and expenses of any underlying Fidelity Central Funds are not included in the Fund's expense ratio. The Fund indirectly bears its proportionate share of the expenses of any underlying Fidelity Central Funds.
E Expense ratios reflect operating expenses of the class. Expenses before reductions do not reflect amounts reimbursed by the investment adviser or reductions from brokerage service arrangements or reductions from other expense offset arrangements and do not represent the amount paid by the class during periods when reimbursements or reductions occur. Expenses net of fee waivers reflect expenses after reimbursement by the investment adviser but prior to reductions from brokerage service arrangements or other expense offset arrangements. Expenses net of all reductions represent the net expenses paid by the class.
F Amount does not include the portfolio activity of any underlying Fidelity Central Funds.
See accompanying notes which are an integral part of the financial statements.
Fidelity Canada Fund Class I
| Years ended October 31, | 2017 | 2016 | 2015 | 2014 | 2013 |
| Selected Per–Share Data | | | | | |
| Net asset value, beginning of period | $48.28 | $45.44 | $60.80 | $57.57 | $53.91 |
| Income from Investment Operations | | | | | |
| Net investment income (loss)A | .67 | .66 | .61 | .65 | .78 |
| Net realized and unrealized gain (loss) | 6.19 | 2.83 | (8.07) | 3.12 | 3.64 |
| Total from investment operations | 6.86 | 3.49 | (7.46) | 3.77 | 4.42 |
| Distributions from net investment income | (.66) | (.59) | (.68) | (.22) | (.76) |
| Distributions from net realized gain | (.19) | (.06) | (7.22) | (.32) | – |
| Total distributions | (.85) | (.65) | (7.90) | (.54) | (.76) |
| Redemption fees added to paid in capitalA,B | – | – | – | – | – |
| Net asset value, end of period | $54.29 | $48.28 | $45.44 | $60.80 | $57.57 |
| Total ReturnC | 14.38% | 7.83% | (14.05)% | 6.62% | 8.34% |
| Ratios to Average Net AssetsD,E | | | | | |
| Expenses before reductions | 1.00% | 1.14% | 1.13% | 1.00% | .86% |
| Expenses net of fee waivers, if any | .99% | 1.13% | 1.12% | 1.00% | .86% |
| Expenses net of all reductions | .99% | 1.13% | 1.12% | 1.00% | .85% |
| Net investment income (loss) | 1.33% | 1.41% | 1.21% | 1.08% | 1.43% |
| Supplemental Data | | | | | |
| Net assets, end of period (000 omitted) | $30,581 | $41,217 | $14,846 | $30,165 | $30,831 |
| Portfolio turnover rateF | 26% | 44% | 24% | 85% | 64% |
A Calculated based on average shares outstanding during the period.
B Amount represents less than $.005 per share.
C Total returns would have been lower if certain expenses had not been reduced during the applicable periods shown.
D Fees and expenses of any underlying Fidelity Central Funds are not included in the Fund's expense ratio. The Fund indirectly bears its proportionate share of the expenses of any underlying Fidelity Central Funds.
E Expense ratios reflect operating expenses of the class. Expenses before reductions do not reflect amounts reimbursed by the investment adviser or reductions from brokerage service arrangements or reductions from other expense offset arrangements and do not represent the amount paid by the class during periods when reimbursements or reductions occur. Expenses net of fee waivers reflect expenses after reimbursement by the investment adviser but prior to reductions from brokerage service arrangements or other expense offset arrangements. Expenses net of all reductions represent the net expenses paid by the class.
F Amount does not include the portfolio activity of any underlying Fidelity Central Funds.
See accompanying notes which are an integral part of the financial statements.
Notes to Financial Statements
For the period ended October 31, 2017
1. Organization.
Fidelity Canada Fund (the Fund) is a fund of Fidelity Investment Trust (the Trust) and is authorized to issue an unlimited number of shares. The Trust is registered under the Investment Company Act of 1940, as amended (the 1940 Act), as an open-end management investment company organized as a Massachusetts business trust. The Fund offers Class A, Class M (formerly Class T), Class C, Canada and Class I shares, each of which has equal rights as to assets and voting privileges. Each class has exclusive voting rights with respect to matters that affect that class.
After the close of business on June 24, 2016, all outstanding Class B shares were converted to Class A shares. All prior fiscal period dollar and share amounts for Class B presented in the Notes to Financial Statements are for the period November 1, 2015 through June 24, 2016.
2. Investments in Fidelity Central Funds.
The Fund invests in Fidelity Central Funds, which are open-end investment companies generally available only to other investment companies and accounts managed by the investment adviser and its affiliates. The Fund's Schedule of Investments lists each of the Fidelity Central Funds held as of period end, if any, as an investment of the Fund, but does not include the underlying holdings of each Fidelity Central Fund. As an Investing Fund, the Fund indirectly bears its proportionate share of the expenses of the underlying Fidelity Central Funds.
The Money Market Central Funds seek preservation of capital and current income and are managed by Fidelity Investments Money Management, Inc. (FIMM), an affiliate of the investment adviser. Annualized expenses of the Money Market Central Funds as of their most recent shareholder report date are less than .005%.
A complete unaudited list of holdings for each Fidelity Central Fund is available upon request or at the Securities and Exchange Commission (the SEC) website at www.sec.gov. In addition, the financial statements of the Fidelity Central Funds, which are not covered by the Fund's Report of Independent Registered Public Accounting Firm, are available on the SEC website or upon request.
3. Significant Accounting Policies.
The Fund is an investment company and applies the accounting and reporting guidance of the Financial Accounting Standards Board (FASB) Accounting Standards Codification Topic 946 Financial Services – Investments Companies. The financial statements have been prepared in conformity with accounting principles generally accepted in the United States of America (GAAP), which require management to make certain estimates and assumptions at the date of the financial statements. Actual results could differ from those estimates. Subsequent events, if any, through the date that the financial statements were issued have been evaluated in the preparation of the financial statements. The following summarizes the significant accounting policies of the Fund:
Investment Valuation. Investments are valued as of 4:00 p.m. Eastern time on the last calendar day of the period. The Board of Trustees (the Board) has delegated the day to day responsibility for the valuation of the Fund's investments to the Fair Value Committee (the Committee) established by the Fund's investment adviser. In accordance with valuation policies and procedures approved by the Board, the Fund attempts to obtain prices from one or more third party pricing vendors or brokers to value its investments. When current market prices, quotations or currency exchange rates are not readily available or reliable, investments will be fair valued in good faith by the Committee, in accordance with procedures adopted by the Board. Factors used in determining fair value vary by investment type and may include market or investment specific events. The frequency with which these procedures are used cannot be predicted and they may be utilized to a significant extent. The Committee oversees the Fund's valuation policies and procedures and reports to the Board on the Committee's activities and fair value determinations. The Board monitors the appropriateness of the procedures used in valuing the Fund's investments and ratifies the fair value determinations of the Committee.
The Fund categorizes the inputs to valuation techniques used to value its investments into a disclosure hierarchy consisting of three levels as shown below:
- Level 1 – quoted prices in active markets for identical investments
- Level 2 – other significant observable inputs (including quoted prices for similar investments, interest rates, prepayment speeds, etc.)
- Level 3 – unobservable inputs (including the Fund's own assumptions based on the best information available)
Valuation techniques used to value the Fund's investments by major category are as follows:
Equity securities, including restricted securities, for which market quotations are readily available, are valued at the last reported sale price or official closing price as reported by a third party pricing vendor on the primary market or exchange on which they are traded and are categorized as Level 1 in the hierarchy. In the event there were no sales during the day or closing prices are not available, securities are valued at the last quoted bid price or may be valued using the last available price and are generally categorized as Level 2 in the hierarchy. For foreign equity securities, when market or security specific events arise, comparisons to the valuation of American Depositary Receipts (ADRs), futures contracts, Exchange-Traded Funds (ETFs) and certain indexes as well as quoted prices for similar securities may be used and would be categorized as Level 2 in the hierarchy. Utilizing these techniques may result in transfers between Level 1 and Level 2. For equity securities, including restricted securities, where observable inputs are limited, assumptions about market activity and risk are used and these securities may be categorized as Level 3 in the hierarchy.
Investments in open-end mutual funds, including the Fidelity Central Funds, are valued at their closing net asset value (NAV) each business day and are categorized as Level 1 in the hierarchy.
Changes in valuation techniques may result in transfers in or out of an assigned level within the disclosure hierarchy. The aggregate value of investments by input level as of October 31, 2017 is included at the end of the Fund's Schedule of Investments.
Foreign Currency. The Fund may use foreign currency contracts to facilitate transactions in foreign-denominated securities. Gains and losses from these transactions may arise from changes in the value of the foreign currency or if the counterparties do not perform under the contracts' terms.
Foreign-denominated assets, including investment securities, and liabilities are translated into U.S. dollars at the exchange rates at period end. Purchases and sales of investment securities, income and dividends received and expenses denominated in foreign currencies are translated into U.S. dollars at the exchange rate in effect on the transaction date.
The effects of exchange rate fluctuations on investments are included with the net realized and unrealized gain (loss) on investment securities. Other foreign currency transactions resulting in realized and unrealized gain (loss) are disclosed separately.
Investment Transactions and Income. For financial reporting purposes, the Fund's investment holdings and NAV include trades executed through the end of the last business day of the period. The NAV per share for processing shareholder transactions is calculated as of the close of business of the New York Stock Exchange (NYSE), normally 4:00 p.m. Eastern time and includes trades executed through the end of the prior business day. Gains and losses on securities sold are determined on the basis of identified cost and includes proceeds received from litigation. Dividend income is recorded on the ex-dividend date, except for certain dividends from foreign securities where the ex-dividend date may have passed, which are recorded as soon as the Fund is informed of the ex-dividend date. Non-cash dividends included in dividend income, if any, are recorded at the fair market value of the securities received. Income and capital gain distributions from Fidelity Central Funds, if any, are recorded on the ex-dividend date. Certain distributions received by the Fund represent a return of capital or capital gain. The Fund determines the components of these distributions subsequent to the ex-dividend date, based upon receipt of tax filings or other correspondence relating to the underlying investment. These distributions are recorded as a reduction of cost of investments and/or as a realized gain. Investment income is recorded net of foreign taxes withheld where recovery of such taxes is uncertain.
Class Allocations and Expenses. Investment income, realized and unrealized capital gains and losses, common expenses of the Fund, and certain fund-level expense reductions, if any, are allocated daily on a pro-rata basis to each class based on the relative net assets of each class to the total net assets of the Fund. Each class differs with respect to transfer agent and distribution and service plan fees incurred. Certain expense reductions may also differ by class. For the reporting period, the allocated portion of income and expenses to each class as a percent of its average net assets may vary due to the timing of recording these transactions in relation to fluctuating net assets of the classes. Expenses directly attributable to a fund are charged to that fund. Expenses attributable to more than one fund are allocated among the respective funds on the basis of relative net assets or other appropriate methods. Expense estimates are accrued in the period to which they relate and adjustments are made when actual amounts are known.
Income Tax Information and Distributions to Shareholders. Each year, the Fund intends to qualify as a regulated investment company under Subchapter M of the Internal Revenue Code, including distributing substantially all of its taxable income and realized gains. As a result, no provision for U.S. Federal income taxes is required. As of October 31, 2017, the Fund did not have any unrecognized tax benefits in the financial statements; nor is the Fund aware of any tax positions for which it is reasonably possible that the total amounts of unrecognized tax benefits will significantly change in the next twelve months. The Fund files a U.S. federal tax return, in addition to state and local tax returns as required. The Fund's federal income tax returns are subject to examination by the Internal Revenue Service (IRS) for a period of three fiscal years after they are filed. State and local tax returns may be subject to examination for an additional fiscal year depending on the jurisdiction. Foreign taxes are provided for based on the Fund's understanding of the tax rules and rates that exist in the foreign markets in which it invests.
Distributions are declared and recorded on the ex-dividend date. Income dividends and capital gain distributions are declared separately for each class. Income and capital gain distributions are determined in accordance with income tax regulations, which may differ from GAAP. In addition, the Fund claimed a portion of the payment made to redeeming shareholders as a distribution for income tax purposes.
Capital accounts within the financial statements are adjusted for permanent book-tax differences. These adjustments have no impact on net assets or the results of operations. Capital accounts are not adjusted for temporary book-tax differences which will reverse in a subsequent period.
Book-tax differences are primarily due to foreign currency transactions, passive foreign investment companies (PFIC), capital loss carryforwards, deferred trustees compensation and losses deferred due to wash sales.
As of period end, the cost and unrealized appreciation (depreciation) in securities, and derivatives if applicable, for federal income tax purposes were as follows:
| Gross unrealized appreciation | $367,425,210 |
| Gross unrealized depreciation | (22,192,086) |
| Net unrealized appreciation (depreciation) | $345,233,124 |
| Tax Cost | $898,879,620 |
The tax-based components of distributable earnings as of period end were as follows:
| Undistributed ordinary income | $19,133,560 |
| Undistributed long-term capital gain | $5,081,189 |
| Net unrealized appreciation (depreciation) on securities and other investments | $345,223,511 |
The tax character of distributions paid was as follows:
| | October 31, 2017 | October 31, 2016 |
| Ordinary Income | $21,612,357 | $ 17,462,078 |
| Long-term Capital Gains | – | 1,771,775 |
| Total | $21,612,357 | $ 19,233,853 |
Short-Term Trading (Redemption) Fees. Shares held by investors in the Fund less than 90 days may have been subject to a redemption fee equal to 1.50% of the NAV of shares redeemed. All redemption fees, which reduce the proceeds of the shareholder redemption, are retained by the Fund and accounted for as an addition to paid in capital. In November 2017, the Board of Trustees approved the elimination of these redemption fees effective December 18, 2017.
4. Purchases and Sales of Investments.
Purchases and sales of securities, other than short-term securities, aggregated $338,726,398 and $612,426,009, respectively.
5. Fees and Other Transactions with Affiliates.
Management Fee. Fidelity Management & Research Company (the investment adviser) and its affiliates provide the Fund with investment management related services for which the Fund pays a monthly management fee. The management fee is the sum of an individual fund fee rate that is based on an annual rate of .45% of the Fund's average net assets and an annualized group fee rate that averaged .25% during the period. The group fee rate is based upon the average net assets of all the mutual funds advised by the investment adviser, including any mutual funds previously advised by the investment adviser that are currently advised by Fidelity SelectCo, LLC, an affiliate of the investment adviser. The group fee rate decreases as assets under management increase and increases as assets under management decrease. In addition, the management fee is subject to a performance adjustment (up to a maximum of +/- .20% of the Fund's average net assets over a 36 month performance period). The upward or downward adjustment to the management fee is based on the relative investment performance of Canada as compared to its benchmark index, the S&P/TSX Composite Index, over the same 36 month performance period. For the reporting period, the total annual management fee rate, including the performance adjustment, was .75% of the Fund's average net assets. The performance adjustment included in the management fee rate may be higher or lower than the maximum performance adjustment rate due to the difference between the average net assets for the reporting and performance periods.
Distribution and Service Plan Fees. In accordance with Rule 12b-1 of the 1940 Act, the Fund has adopted separate Distribution and Service Plans for each class of shares. Certain classes pay Fidelity Distributors Corporation (FDC), an affiliate of the investment adviser, separate Distribution and Service Fees, each of which is based on an annual percentage of each class' average net assets. In addition, FDC may pay financial intermediaries for selling shares of the Fund and providing shareholder support services. For the period, the Distribution and Service Fee rates, total fees and amounts retained by FDC were as follows:
| | Distribution
Fee | Service
Fee | Total Fees | Retained
by FDC |
| Class A | -% | .25% | $100,799 | $100 |
| Class M | .25% | .25% | 56,703 | – |
| Class C | .75% | .25% | 171,465 | 4,926 |
| | | | $328,967 | $5,026 |
Sales Load. FDC may receive a front-end sales charge of up to 5.75% for selling Class A shares and 3.50% for selling Class M shares, some of which is paid to financial intermediaries for selling shares of the Fund. Depending on the holding period, FDC may receive contingent deferred sales charges levied on Class A, Class M and Class C redemptions. The deferred sales charges are 1.00% for Class C shares, 1.00% for certain purchases of Class A shares and .25% for certain purchases of Class M shares.
For the period, sales charge amounts retained by FDC were as follows:
| | Retained
by FDC |
| Class A | $3,994 |
| Class M | 1,681 |
| Class C(a) | 1,426 |
| | $7,101 |
(a) When Class C shares are initially sold, FDC pays commissions from its own resources to financial intermediaries through which the sales are made.
Transfer Agent Fees. Fidelity Investments Institutional Operations Company, Inc., (FIIOC), an affiliate of the investment adviser, is the transfer, dividend disbursing and shareholder servicing agent for each class of the Fund. FIIOC receives account fees and asset-based fees that vary according to the account size and type of account of the shareholders of the respective classes of the Fund. FIIOC pays for typesetting, printing and mailing of shareholder reports, except proxy statements.
For the period, transfer agent fees for each class were as follows:
| | Amount | % of
Class-Level Average
Net Assets |
| Class A | $112,117 | .28 |
| Class M | 36,358 | .32 |
| Class C | 43,158 | .25 |
| Canada | 2,538,563 | .21 |
| Class I | 81,592 | .19 |
| | $2,811,788 | |
Accounting and Security Lending Fees. Fidelity Service Company, Inc. (FSC), an affiliate of the investment adviser, maintains the Fund's accounting records. The accounting fee is based on the level of average net assets for each month. Under a separate contract, FSC administers the security lending program. The security lending fee is based on the number and duration of lending transactions.
Brokerage Commissions. The Fund placed a portion of its portfolio transactions with brokerage firms which are affiliates of the investment adviser. Brokerage commissions are included in net realized gain (loss) and change in net unrealized appreciation (depreciation) in the Statement of Operations. The commissions paid to these affiliated firms were $135 for the period.
Interfund Trades. The Fund may purchase from or sell securities to other Fidelity Funds under procedures adopted by the Board. The procedures have been designed to ensure these interfund trades are executed in accordance with Rule 17a-7 of the 1940 Act. Interfund trades are included within the respective purchases and sales amounts shown in the Purchases and Sales of Investments note.
6. Committed Line of Credit.
The Fund participates with other funds managed by the investment adviser or an affiliate in a $4.25 billion credit facility (the "line of credit") to be utilized for temporary or emergency purposes to fund shareholder redemptions or for other short-term liquidity purposes. The Fund has agreed to pay commitment fees on its pro-rata portion of the line of credit, which amounted to $4,281 and is reflected in Miscellaneous expenses on the Statement of Operations. During the period, the Fund did not borrow on this line of credit.
7. Security Lending.
The Fund lends portfolio securities through a lending agent from time to time in order to earn additional income. For equity securities, a lending agent is used and may loan securities to certain qualified borrowers, including Fidelity Capital Markets (FCM), a broker-dealer affiliated with the Fund. On the settlement date of the loan, the Fund receives collateral (in the form of U.S. Treasury obligations, letters of credit and/or cash) against the loaned securities and maintains collateral in an amount not less than 100% of the market value of the loaned securities during the period of the loan. The market value of the loaned securities is determined at the close of business of the Fund and any additional required collateral is delivered to the Fund on the next business day. The Fund or borrower may terminate the loan at any time, and if the borrower defaults on its obligation to return the securities loaned because of insolvency or other reasons, the Fund may apply collateral received from the borrower against the obligation. The Fund may experience delays and costs in recovering the securities loaned. Any cash collateral received is invested in the Fidelity Securities Lending Cash Central Fund. The value of loaned securities and cash collateral at period end are disclosed on the Fund's Statement of Assets and Liabilities. At period end, there were no security loans outstanding with FCM. Security lending income represents the income earned on investing cash collateral, less rebates paid to borrowers and any lending agent fees associated with the loan, plus any premium payments received for lending certain types of securities. Security lending income is presented in the Statement of Operations as a component of income from Fidelity Central Funds. Total security lending income during the period amounted to $641,086, including $5,377 from securities loaned to FCM.
8. Expense Reductions.
Commissions paid to certain brokers with whom the investment adviser, or its affiliates, places trades on behalf of the Fund include an amount in addition to trade execution, which may be rebated back to the Fund to offset certain expenses. This amount totaled $40,399 for the period. In addition, through arrangements with the Fund's custodian, credits realized as a result of certain uninvested cash balances were used to reduce the Fund's expenses. During the period, these credits reduced the Fund's custody expenses by $4.
In addition, during the period the investment adviser reimbursed and/or waived a portion of fund-level operating expenses in the amount of $12,276.
9. Distributions to Shareholders.
Distributions to shareholders of each class were as follows:
| | Year ended October 31, 2017 | Year ended October 31, 2016 |
| From net investment income | | |
| Class A | $406,836 | $482,934 |
| Class M | 78,661 | 79,315 |
| Class C | 39,905 | 8,502 |
| Canada | 15,352,959 | 16,735,044 |
| Class I | 565,020 | 156,283 |
| Total | $16,443,381 | $17,462,078 |
| From net realized gain | | |
| Class A | $168,842 | $69,321 |
| Class M | 43,752 | 16,639 |
| Class B | – | 3,460 |
| Class C | 71,450 | 28,339 |
| Canada | 4,723,987 | 1,638,014 |
| Class I | 160,945 | 16,001 |
| Total | $5,168,976 | $1,771,774 |
10. Share Transactions.
Share transactions for each class were as follows and may contain automatic conversions between classes or exchanges between affiliated funds:
| | Shares | Shares | Dollars | Dollars |
| | Year ended October 31, 2017 | Year ended October 31, 2016 | Year ended October 31, 2017 | Year ended October 31, 2016 |
| Class A | | | | |
| Shares sold | 63,470 | 134,113 | $3,161,163 | $6,147,050 |
| Reinvestment of distributions | 10,631 | 11,425 | 525,595 | 496,287 |
| Shares redeemed | (297,916) | (515,795) | (14,925,894) | (23,017,589) |
| Net increase (decrease) | (223,815) | (370,257) | $(11,239,136) | $(16,374,252) |
| Class M | | | | |
| Shares sold | 24,195 | 23,059 | $1,198,423 | $1,036,279 |
| Reinvestment of distributions | 2,464 | 2,169 | 121,397 | 93,951 |
| Shares redeemed | (67,009) | (77,250) | (3,403,775) | (3,322,138) |
| Net increase (decrease) | (40,350) | (52,022) | $(2,083,955) | $(2,191,908) |
| Class B | | | | |
| Shares sold | – | 499 | $– | $21,798 |
| Reinvestment of distributions | – | 68 | – | 2,895 |
| Shares redeemed | – | (61,115) | – | (2,725,253) |
| Net increase (decrease) | – | (60,548) | $– | $(2,700,560) |
| Class C | | | | |
| Shares sold | 25,680 | 41,578 | $1,254,827 | $1,834,681 |
| Reinvestment of distributions | 1,995 | 731 | 96,717 | 31,141 |
| Shares redeemed | (119,795) | (138,754) | (5,862,219) | (5,980,751) |
| Net increase (decrease) | (92,120) | (96,445) | $(4,510,675) | $(4,114,929) |
| Canada | | | | |
| Shares sold | 1,830,107 | 3,590,664 | $91,494,332 | $166,771,731 |
| Reinvestment of distributions | 381,896 | 388,588 | 18,930,598 | 16,926,879 |
| Shares redeemed | (6,928,660) | (6,566,019) | (353,430,502) | (289,731,847) |
| Net increase (decrease) | (4,716,657) | (2,586,767) | $(243,005,572) | $(106,033,237) |
| Class I | | | | |
| Shares sold | 249,628 | 807,708 | $12,551,193 | $37,813,282 |
| Reinvestment of distributions | 14,338 | 2,849 | 709,005 | 123,890 |
| Shares redeemed | (554,299) | (283,652) | (29,406,590) | (12,076,497) |
| Net increase (decrease) | (290,333) | 526,905 | $(16,146,392) | $25,860,675 |
11. Other.
The Fund's organizational documents provide former and current trustees and officers with a limited indemnification against liabilities arising in connection with the performance of their duties to the Fund. In the normal course of business, the Fund may also enter into contracts that provide general indemnifications. The Fund's maximum exposure under these arrangements is unknown as this would be dependent on future claims that may be made against the Fund. The risk of material loss from such claims is considered remote.
Fidelity® China Region Fund
Performance: The Bottom Line
Average annual total return reflects the change in the value of an investment, assuming reinvestment of distributions from dividend income and capital gains (the profits earned upon the sale of securities that have grown in value, if any) and assuming a constant rate of performance each year. The hypothetical investment and the average annual total returns do not reflect the deduction of taxes that a shareholder would pay on fund distributions or the redemption of fund shares. During periods of reimbursement by Fidelity, a fund’s total return will be greater than it would be had the reimbursement not occurred. How a fund did yesterday is no guarantee of how it will do tomorrow.
Average Annual Total Returns
| For the periods ended October 31, 2017 | Past 1 year | Past 5 years | Past 10 years |
| Fidelity® China Region Fund | 36.10% | 12.74% | 4.37% |
$10,000 Over 10 Years
Let's say hypothetically that $10,000 was invested in Fidelity® China Region Fund, a class of the fund, on October 31, 2007.
The chart shows how the value of your investment would have changed, and also shows how the MSCI Golden Dragon Index performed over the same period.
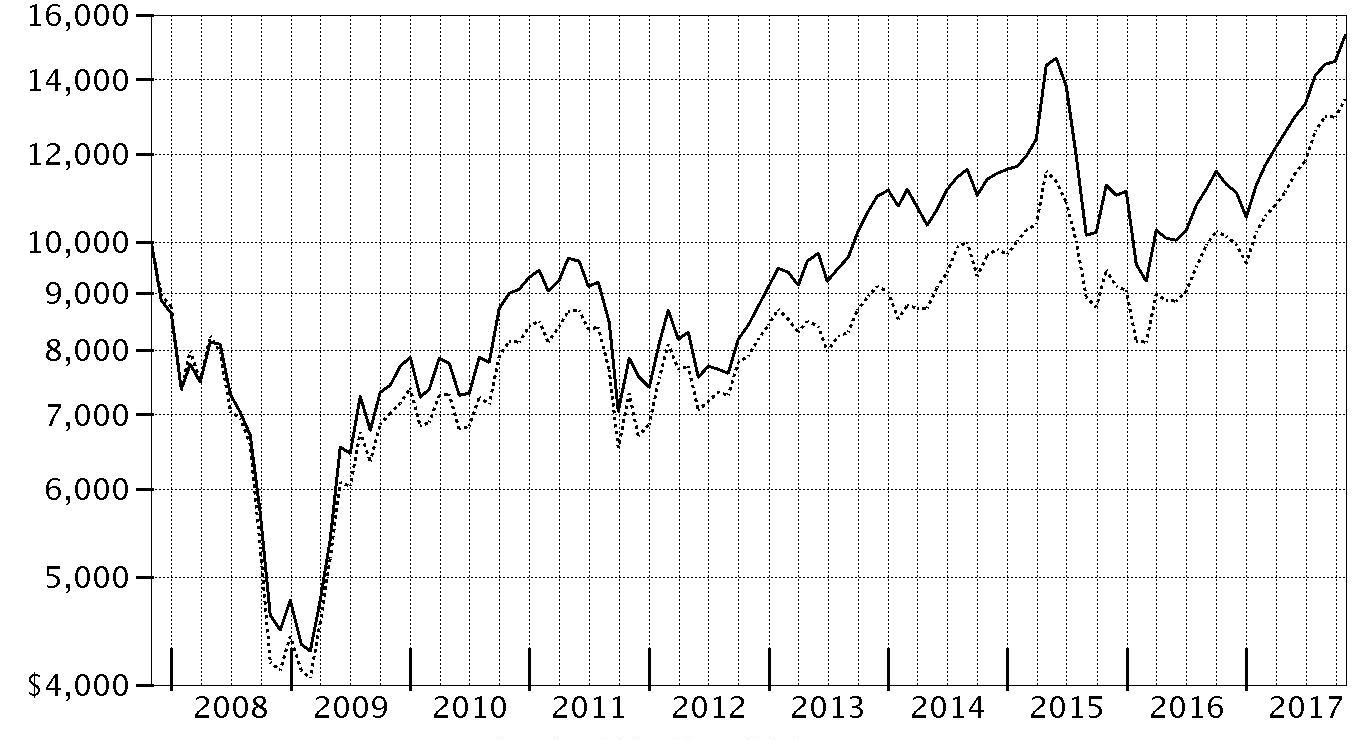
| Period Ending Values |
| $15,337 | Fidelity® China Region Fund |
| $13,447 | MSCI Golden Dragon Index |
Fidelity® China Region Fund
Management's Discussion of Fund Performance
Market Recap: The MSCI ACWI (All Country World Index) ex USA Index returned 23.85% for the 12 months ending October 31, 2017, helped partly by a generally weak U.S. dollar. Some favorable election results in continental Europe (+30%) suggested ebbing political uncertainty and near-term risk there, but the U.K. (+20%) faced more-mixed conditions ahead of its expected exit from the European Union. Despite central-bank easing – and pressured recently by yen strength – Japan (+18%) lagged the rest of the Asia-Pacific group (+22%). Commodity-price volatility slowed Canada (+17%), but the emerging-markets group (+26%) sped ahead. Sector-wise, information technology (+47%) was driven by a surge among several Chinese internet-related names. Financials (+27%) rode rising interest rates that, at the same time, weighed on real estate (+17%), utilities (+16%), consumer staples (+14%) and telecommunication services (+9%) – so-called “bond proxy” sectors. Materials (+28%) and industrials (+27%) responded to demand from China and price gains for certain commodities. In the energy sector (+20%), oil prices lost ground in the spring before rebounding through October 31 to end well above where they started 12 months ago. Lastly, health care (+14%) was hurt by early-period turmoil around drug pricing and health care legislation.
Comments from Portfolio Manager Robert Bao: For the year, the fund’s share classes (excluding sales charges, if applicable) gained roughly 35% to 36%, topping the 32.83% advance of the benchmark MSCI Golden Dragon Index. Versus the benchmark, positioning in the information technology, consumer discretionary and telecommunication services sectors added the most value. Regionally, underweighting Hong Kong and Taiwan, as well as favorable stock picks in those regions, contributed versus the index. Overweighting China also helped, although picks there detracted. At the stock level, the top relative contributor was wireless services provider China Mobile because this index component returned -6% and we didn’t own it. Several out-of-benchmark positions in China-based companies also were noteworthy contributors, including China Shanshui Cement Group – which I sold by period end – Hangzhou Hikvision Digital Technology, the world’s largest manufacturer of security cameras, and Kweichow Moutai, a maker of the grain-based spirit baijiu. Conversely, positioning in energy and industrials worked against us. China Oilfield Services, a Hong Kong-listed provider of drilling and other energy services, was the fund’s largest relative detractor, followed by non-benchmark positions in two Hong Kong-listed equities: casino operator Summit Ascent Holdings and Zhaojin Mining Industries, a gold-mining stock I bought this period.
The views expressed above reflect those of the portfolio manager(s) only through the end of the period as stated on the cover of this report and do not necessarily represent the views of Fidelity or any other person in the Fidelity organization. Any such views are subject to change at any time based upon market or other conditions and Fidelity disclaims any responsibility to update such views. These views may not be relied on as investment advice and, because investment decisions for a Fidelity fund are based on numerous factors, may not be relied on as an indication of trading intent on behalf of any Fidelity fund.
Fidelity® China Region Fund
Investment Summary (Unaudited)
Geographic Diversification (% of fund's net assets)
| As of October 31, 2017 |
| | Cayman Islands | 37.8% |
| | China | 35.7% |
| | Taiwan | 15.3% |
| | Hong Kong | 6.6% |
| | South Africa | 1.5% |
| | Bailiwick of Jersey | 1.0% |
| | British Virgin Islands | 0.9% |
| | United Kingdom | 0.5% |
| | United States of America* | 0.4% |
| | Other | 0.3% |

* Includes Short-Term investments and Net Other Assets (Liabilities).
Percentages are based on country or territory of incorporation and are adjusted for the effect of futures contracts, if applicable.
| As of April 30, 2017 |
| | China | 39.7% |
| | Cayman Islands | 34.3% |
| | Taiwan | 15.2% |
| | Hong Kong | 4.7% |
| | United States of America* | 2.6% |
| | Bailiwick of Jersey | 1.2% |
| | British Virgin Islands | 1.0% |
| | Bermuda | 0.8% |
| | United Kingdom | 0.5% |
* Includes Short-Term investments and Net Other Assets (Liabilities).
Percentages are based on country or territory of incorporation and are adjusted for the effect of futures contracts, if applicable.
Asset Allocation as of October 31, 2017
| | % of fund's net assets | % of fund's net assets 6 months ago |
| Stocks | 99.6 | 97.6 |
| Short-Term Investments and Net Other Assets (Liabilities) | 0.4 | 2.4 |
Top Ten Stocks as of October 31, 2017
| | % of fund's net assets | % of fund's net assets 6 months ago |
| Tencent Holdings Ltd. (Internet Software & Services) | 11.1 | 9.2 |
| Alibaba Group Holding Ltd. sponsored ADR (Internet Software & Services) | 9.6 | 5.7 |
| Taiwan Semiconductor Manufacturing Co. Ltd. (Semiconductors & Semiconductor Equipment) | 6.2 | 6.8 |
| AIA Group Ltd. (Insurance) | 2.8 | 0.0 |
| NetEase, Inc. ADR (Internet Software & Services) | 2.3 | 2.3 |
| JD.com, Inc. sponsored ADR (Internet & Direct Marketing Retail) | 2.3 | 3.2 |
| China Construction Bank Corp. (H Shares) (Banks) | 2.2 | 2.8 |
| Ping An Insurance (Group) Co. of China Ltd. (H Shares) (Insurance) | 1.9 | 1.6 |
| Kweichow Moutai Co. Ltd. (A Shares) (Beverages) | 1.8 | 1.8 |
| Wuliangye Yibin Co. Ltd. Class A (Beverages) | 1.7 | 1.7 |
| | 41.9 | |
Top Market Sectors as of October 31, 2017
| | % of fund's net assets | % of fund's net assets 6 months ago |
| Information Technology | 46.3 | 37.5 |
| Financials | 12.9 | 10.7 |
| Consumer Discretionary | 12.3 | 14.0 |
| Materials | 6.2 | 7.9 |
| Consumer Staples | 5.5 | 5.9 |
| Health Care | 5.4 | 5.1 |
| Industrials | 5.3 | 7.1 |
| Energy | 3.3 | 5.1 |
| Utilities | 1.3 | 2.4 |
| Real Estate | 1.1 | 1.3 |
Market Sectors may include more than one industry category.
The Fund may invest up to 35% of its total assets in any industry that represents more than 20% of the Hong Kong, Taiwanese and Chinese markets. As of October 31, 2017, the Fund did not have more than 25% of its total assets invested in any one industry.
Percentages shown as 0.0% may reflect amounts less than 0.05%.
Fidelity® China Region Fund
Investments October 31, 2017
Showing Percentage of Net Assets
| Common Stocks - 98.8% | | | |
| | | Shares | Value |
| CONSUMER DISCRETIONARY - 11.5% | | | |
| Diversified Consumer Services - 1.9% | | | |
| New Oriental Education & Technology Group, Inc. sponsored ADR | | 229,800 | $19,128,552 |
| ZTO Express (Cayman), Inc. sponsored ADR (a) | | 471,400 | 7,537,686 |
| | | | 26,666,238 |
| Hotels, Restaurants & Leisure - 0.0% | | | |
| Huangshan Tourism Development Co. Ltd. | | 14 | 21 |
| Household Durables - 3.7% | | | |
| Hangzhou Robam Appliances Co. Ltd. Class A | | 991,851 | 6,946,799 |
| Midea Group Co. Ltd. Class A | | 2,123,600 | 16,323,321 |
| Nien Made Enterprise Co. Ltd. | | 432,000 | 4,500,896 |
| Sundart Holdings Ltd. | | 20,000,000 | 11,972,210 |
| Techtronic Industries Co. Ltd. | | 1,913,500 | 11,221,399 |
| | | | 50,964,625 |
| Internet & Direct Marketing Retail - 3.2% | | | |
| Ctrip.com International Ltd. ADR (b) | | 99,400 | 4,760,266 |
| JD.com, Inc. sponsored ADR (b) | | 834,000 | 31,291,680 |
| Vipshop Holdings Ltd. ADR (b) | | 1,073,800 | 8,483,020 |
| | | | 44,534,966 |
| Media - 1.5% | | | |
| China Literature Ltd. | | 27,697 | 195,264 |
| Naspers Ltd. Class N | | 81,500 | 19,858,014 |
| | | | 20,053,278 |
| Specialty Retail - 0.4% | | | |
| Chow Tai Fook Jewellery Group Ltd. | | 5,333,800 | 5,572,137 |
| Textiles, Apparel & Luxury Goods - 0.8% | | | |
| Shenzhou International Group Holdings Ltd. | | 1,191,000 | 10,167,483 |
|
| TOTAL CONSUMER DISCRETIONARY | | | 157,958,748 |
|
| CONSUMER STAPLES - 5.5% | | | |
| Beverages - 5.0% | | | |
| Jiangsu Yanghe Brewery Joint-Stock Co. Ltd. Class A | | 1,242,989 | 20,652,475 |
| Kweichow Moutai Co. Ltd. (A Shares) | | 265,732 | 24,752,498 |
| Wuliangye Yibin Co. Ltd. Class A | | 2,363,756 | 23,734,107 |
| | | | 69,139,080 |
| Food & Staples Retailing - 0.5% | | | |
| COFCO Meat Holdings Ltd. (a) | | 34,841,000 | 7,011,609 |
|
| TOTAL CONSUMER STAPLES | | | 76,150,689 |
|
| ENERGY - 3.3% | | | |
| Energy Equipment & Services - 1.2% | | | |
| China Oilfield Services Ltd. (H Shares) | | 19,464,000 | 17,240,013 |
| Oil, Gas & Consumable Fuels - 2.1% | | | |
| CNOOC Ltd. | | 15,768,000 | 21,529,525 |
| PetroChina Co. Ltd. (H Shares) | | 10,832,000 | 7,080,867 |
| | | | 28,610,392 |
|
| TOTAL ENERGY | | | 45,850,405 |
|
| FINANCIALS - 12.9% | | | |
| Banks - 3.9% | | | |
| China Construction Bank Corp. (H Shares) | | 33,810,000 | 30,163,509 |
| Industrial & Commercial Bank of China Ltd. (H Shares) | | 29,680,000 | 23,549,517 |
| | | | 53,713,026 |
| Capital Markets - 1.2% | | | |
| CITIC Securities Co. Ltd. (H Shares) | | 4,092,500 | 9,085,818 |
| Shanghai International Airport Co. Ltd. ELS (UBS Warrant Programme) warrants 5/11/18 (c) | | 1,119,000 | 7,378,597 |
| | | | 16,464,415 |
| Insurance - 7.8% | | | |
| AIA Group Ltd. | | 5,240,400 | 39,430,292 |
| China Life Insurance Co. Ltd. (H Shares) | | 5,682,000 | 18,837,550 |
| China Pacific Insurance (Group) Co. Ltd. (H Shares) | | 4,724,600 | 23,285,676 |
| Ping An Insurance (Group) Co. of China Ltd. (H Shares) | | 3,041,500 | 26,705,816 |
| | | | 108,259,334 |
|
| TOTAL FINANCIALS | | | 178,436,775 |
|
| HEALTH CARE - 5.4% | | | |
| Health Care Providers & Services - 0.6% | | | |
| China Resources Phoenix Health | | 5,764,000 | 7,565,739 |
| Life Sciences Tools & Services - 0.4% | | | |
| JHL Biotech, Inc. (b) | | 3,673,696 | 6,035,062 |
| Pharmaceuticals - 4.4% | | | |
| CSPC Pharmaceutical Group Ltd. | | 10,938,000 | 19,011,880 |
| Jiangsu Hengrui Medicine Co. Ltd. (A Shares) | | 959,932 | 9,726,782 |
| Tonghua Dongbao Pharmaceutical Co. Ltd. Class A | | 4,390,487 | 14,306,520 |
| YiChang HEC ChangJiang Pharmaceutical Co. Ltd. | | 3,291,400 | 9,492,719 |
| Yunnan Baiyao Group Co. Ltd. | | 559,400 | 8,839,243 |
| | | | 61,377,144 |
|
| TOTAL HEALTH CARE | | | 74,977,945 |
|
| INDUSTRIALS - 5.3% | | | |
| Commercial Services & Supplies - 0.7% | | | |
| Focused Photonics Hangzhou, Inc. | | 1,856,652 | 9,424,715 |
| Construction & Engineering - 3.2% | | | |
| Beijing Urban Consolidated & Development Group Ltd. (H Shares) | | 18,319,000 | 10,590,239 |
| China Communications Construction Co. Ltd. (H Shares) | | 12,960,000 | 15,731,946 |
| China Energy Engineering Corp. Ltd. | | 22,208,000 | 3,928,403 |
| China State Construction International Holdings Ltd. | | 9,632,250 | 13,532,117 |
| | | | 43,782,705 |
| Machinery - 0.7% | | | |
| Sany Heavy Industry Co. Ltd. Class A | | 7,886,277 | 9,746,563 |
| Trading Companies & Distributors - 0.3% | | | |
| Summit Ascent Holdings Ltd. (a)(b) | | 31,652,000 | 4,341,226 |
| Transportation Infrastructure - 0.4% | | | |
| Shanghai International Airport Co. Ltd. (A Shares) | | 938,890 | 6,190,966 |
|
| TOTAL INDUSTRIALS | | | 73,486,175 |
|
| INFORMATION TECHNOLOGY - 46.3% | | | |
| Communications Equipment - 1.5% | | | |
| Hytera Communications Corp. Ltd. Class A | | 3,630,953 | 10,485,321 |
| Nanfang Communication Holdings Ltd. | | 20,308,000 | 10,620,740 |
| | | | 21,106,061 |
| Electronic Equipment & Components - 6.6% | | | |
| AVIC Jonhon OptronicTechnology Co. Ltd. | | 2,918,766 | 16,347,096 |
| Chroma ATE, Inc. | | 3,145,000 | 15,339,936 |
| Hangzhou Hikvision Digital Technology Co. Ltd. Class A | | 3,655,950 | 21,643,991 |
| Hon Hai Precision Industry Co. Ltd. (Foxconn) | | 3,778,400 | 14,041,436 |
| Largan Precision Co. Ltd. | | 101,000 | 19,152,399 |
| Lens Technology Co. Ltd. Class A | | 1,006,855 | 5,047,250 |
| | | | 91,572,108 |
| Internet Software & Services - 24.1% | | | |
| 58.com, Inc. ADR (b) | | 219,500 | 14,743,815 |
| Alibaba Group Holding Ltd. sponsored ADR (b) | | 715,300 | 132,251,817 |
| NetEase, Inc. ADR | | 113,600 | 32,026,112 |
| Tencent Holdings Ltd. | | 3,405,300 | 153,051,574 |
| Weibo Corp. sponsored ADR (a)(b) | | 9,970 | 923,721 |
| | | | 332,997,039 |
| Semiconductors & Semiconductor Equipment - 12.7% | | | |
| Advanced Semiconductor Engineering, Inc. | | 3,395,000 | 4,107,393 |
| ASM Pacific Technology Ltd. | | 800,300 | 11,643,301 |
| GlobalWafers Co. Ltd. | | 1,109,500 | 12,829,675 |
| Himax Technologies, Inc. sponsored ADR | | 800,000 | 8,160,000 |
| Nanya Technology Corp. | | 4,781,000 | 12,976,501 |
| Silergy Corp. | | 457,000 | 9,871,491 |
| Sino-American Silicon Products, Inc. | | 3,751,000 | 10,454,708 |
| Taiwan Semiconductor Manufacturing Co. Ltd. | | 10,627,000 | 85,973,179 |
| United Microelectronics Corp. | | 18,963,000 | 9,793,884 |
| Win Semiconductors Corp. | | 1,130,000 | 9,242,319 |
| | | | 175,052,451 |
| Software - 0.4% | | | |
| China City Railway Transportation Technology Holdings Co. Ltd. (b) | | 47,212,000 | 5,386,044 |
| Technology Hardware, Storage & Peripherals - 1.0% | | | |
| ADLINK Technology, Inc. | | 3,682,844 | 8,407,315 |
| Advantech Co. Ltd. | | 380,587 | 2,601,398 |
| Axiomtek Co. Ltd. | | 1,142,000 | 1,955,246 |
| | | | 12,963,959 |
|
| TOTAL INFORMATION TECHNOLOGY | | | 639,077,662 |
|
| MATERIALS - 6.2% | | | |
| Construction Materials - 2.2% | | | |
| BBMG Corp. (H Shares) | | 33,657,000 | 16,782,338 |
| West China Cement Ltd. (b) | | 85,964,000 | 13,663,619 |
| | | | 30,445,957 |
| Metals & Mining - 4.0% | | | |
| Aluminum Corp. of China Ltd. (H Shares) (b) | | 9,772,000 | 7,848,802 |
| Angang Steel Co. Ltd. (A Shares) | | 10,591,910 | 9,961,494 |
| China Molybdenum Co. Ltd. (H Shares) | | 9,999,000 | 6,498,184 |
| Jiangxi Copper Co. Ltd. (H Shares) | | 4,214,000 | 6,719,584 |
| Maanshan Iron & Steel Ltd. (H Shares) (b) | | 13,230,000 | 6,206,809 |
| Zhaojin Mining Industry Co. Ltd. (H Shares) | | 8,844,000 | 7,266,650 |
| Zijin Mng Group Co. Ltd. (H Shares) | | 29,330,000 | 10,150,870 |
| | | | 54,652,393 |
|
| TOTAL MATERIALS | | | 85,098,350 |
|
| REAL ESTATE - 1.1% | | | |
| Real Estate Management & Development - 1.1% | | | |
| Beijing Capital Land Ltd. (H Shares) | | 27,000,000 | 14,535,853 |
| UTILITIES - 1.3% | | | |
| Independent Power and Renewable Electricity Producers - 1.3% | | | |
| Canvest Environmental Protection Group Co. Ltd. (a) | | 16,700,000 | 9,311,790 |
| Huaneng Renewables Corp. Ltd. (H Shares) | | 26,040,000 | 8,945,471 |
| | | | 18,257,261 |
| TOTAL COMMON STOCKS | | | |
| (Cost $1,009,134,734) | | | 1,363,829,863 |
|
| Convertible Preferred Stocks - 0.8% | | | |
| CONSUMER DISCRETIONARY - 0.8% | | | |
| Internet & Direct Marketing Retail - 0.8% | | | |
| China Internet Plus Holdings Ltd. Series A-11 (b)(d)(e) | | | |
| (Cost $6,268,244) | | 1,983,088 | 11,083,598 |
|
| Money Market Funds - 0.6% | | | |
| Fidelity Cash Central Fund, 1.10% (f) | | 459 | 459 |
| Fidelity Securities Lending Cash Central Fund 1.11% (f)(g) | | 9,105,834 | 9,106,745 |
| TOTAL MONEY MARKET FUNDS | | | |
| (Cost $9,106,839) | | | 9,107,204 |
| TOTAL INVESTMENT IN SECURITIES - 100.2% | | | |
| (Cost $1,024,509,817) | | | 1,384,020,665 |
| NET OTHER ASSETS (LIABILITIES) - (0.2)% | | | (3,111,325) |
| NET ASSETS - 100% | | | $1,380,909,340 |
Security Type Abbreviations
ELS – Equity-Linked Security
Legend
(a) Security or a portion of the security is on loan at period end.
(b) Non-income producing
(c) Security exempt from registration under Rule 144A of the Securities Act of 1933. These securities may be resold in transactions exempt from registration, normally to qualified institutional buyers. At the end of the period, the value of these securities amounted to $7,378,597 or 0.5% of net assets.
(d) Restricted securities - Investment in securities not registered under the Securities Act of 1933 (excluding 144A issues). At the end of the period, the value of restricted securities (excluding 144A issues) amounted to $11,083,598 or 0.8% of net assets.
(e) Level 3 security
(f) Affiliated fund that is generally available only to investment companies and other accounts managed by Fidelity Investments. The rate quoted is the annualized seven-day yield of the fund at period end. A complete unaudited listing of the fund's holdings as of its most recent quarter end is available upon request. In addition, each Fidelity Central Fund's financial statements, which are not covered by the Fund's Report of Independent Registered Public Accounting Firm, are available on the SEC's website or upon request.
(g) Investment made with cash collateral received from securities on loan.
Additional information on each restricted holding is as follows:
| Security | Acquisition Date | Acquisition Cost |
| China Internet Plus Holdings Ltd. Series A-11 | 1/26/15 | $6,268,244 |
Affiliated Central Funds
Information regarding fiscal year to date income earned by the Fund from investments in Fidelity Central Funds is as follows:
| Fund | Income earned |
| Fidelity Cash Central Fund | $336,570 |
| Fidelity Securities Lending Cash Central Fund | 548,850 |
| Total | $885,420 |
Investment Valuation
The following is a summary of the inputs used, as of October 31, 2017, involving the Fund's assets and liabilities carried at fair value. The inputs or methodology used for valuing securities may not be an indication of the risk associated with investing in those securities. For more information on valuation inputs, and their aggregation into the levels used below, please refer to the Investment Valuation section in the accompanying Notes to Financial Statements.
| | Valuation Inputs at Reporting Date: |
| Description | Total | Level 1 | Level 2 | Level 3 |
| Investments in Securities: | | | | |
| Equities: | | | | |
| Consumer Discretionary | $169,042,346 | $157,763,484 | $195,264 | $11,083,598 |
| Consumer Staples | 76,150,689 | 76,150,689 | -- | -- |
| Energy | 45,850,405 | 17,240,013 | 28,610,392 | -- |
| Financials | 178,436,775 | 152,220,628 | 26,216,147 | -- |
| Health Care | 74,977,945 | 74,977,945 | -- | -- |
| Industrials | 73,486,175 | 73,486,175 | -- | -- |
| Information Technology | 639,077,662 | 386,151,632 | 252,926,030 | -- |
| Materials | 85,098,350 | 77,249,548 | 7,848,802 | -- |
| Real Estate | 14,535,853 | 14,535,853 | -- | -- |
| Utilities | 18,257,261 | 18,257,261 | -- | -- |
| Money Market Funds | 9,107,204 | 9,107,204 | -- | -- |
| Total Investments in Securities: | $1,384,020,665 | $1,057,140,432 | $315,796,635 | $11,083,598 |
The following is a summary of transfers between Level 1 and Level 2 for the period ended October 31, 2017. Transfers are assumed to have occurred at the beginning of the period, and are primarily attributable to the valuation techniques used for foreign equity securities, as discussed in the accompanying Notes to Financial Statements:
| Transfers | Total |
| Level 1 to Level 2 | $0 |
| Level 2 to Level 1 | $20,300,707 |
The following is a reconciliation of Investments in Securities for which Level 3 inputs were used in determining value:
| Investments in Securities: | |
| Beginning Balance | $16,032,916 |
| Net Realized Gain (Loss) on Investment Securities | 3,052,744 |
| Net Unrealized Gain (Loss) on Investment Securities | 9,545,139 |
| Cost of Purchases | -- |
| Proceeds of Sales | (17,547,201) |
| Amortization/Accretion | -- |
| Transfers into Level 3 | -- |
| Transfers out of Level 3 | -- |
| Ending Balance | $11,083,598 |
| The change in unrealized gain (loss) for the period attributable to Level 3 securities held at October 31, 2017 | $3,427,490 |
The information used in the above reconciliation represents fiscal year to date activity for any Investments in Securities identified as using Level 3 inputs at either the beginning or the end of the current fiscal period. Transfers in or out of Level 3 represent the beginning value of any Security or Instrument where a change in the pricing level occurred from the beginning to the end of the period. The cost of purchases and the proceeds of sales may include securities received or delivered through corporate actions or exchanges.
See accompanying notes which are an integral part of the financial statements.
Fidelity® China Region Fund
Financial Statements
Statement of Assets and Liabilities
| | | October 31, 2017 |
| Assets | | |
Investment in securities, at value (including securities loaned of $8,701,526) — See accompanying schedule:
Unaffiliated issuers (cost $1,015,402,978) | $1,374,913,461 | |
| Fidelity Central Funds (cost $9,106,839) | 9,107,204 | |
| Total Investment in Securities (cost $1,024,509,817) | | $1,384,020,665 |
| Foreign currency held at value (cost $23,922,292) | | 23,923,424 |
| Receivable for investments sold | | 5,883,085 |
| Receivable for fund shares sold | | 2,672,820 |
| Dividends receivable | | 179,767 |
| Distributions receivable from Fidelity Central Funds | | 64,682 |
| Prepaid expenses | | 2,752 |
| Other receivables | | 53,151 |
| Total assets | | 1,416,800,346 |
| Liabilities | | |
| Payable for investments purchased | $15,435,772 | |
| Payable for fund shares redeemed | 2,330,785 | |
| Accrued management fee | 783,710 | |
| Distribution and service plan fees payable | 21,919 | |
| Notes payable to affiliates | 7,685,000 | |
| Other affiliated payables | 253,185 | |
| Other payables and accrued expenses | 273,960 | |
| Collateral on securities loaned | 9,106,675 | |
| Total liabilities | | 35,891,006 |
| Net Assets | | $1,380,909,340 |
| Net Assets consist of: | | |
| Paid in capital | | $1,156,699,278 |
| Undistributed net investment income | | 5,536,153 |
| Accumulated undistributed net realized gain (loss) on investments and foreign currency transactions | | (140,834,140) |
| Net unrealized appreciation (depreciation) on investments and assets and liabilities in foreign currencies | | 359,508,049 |
| Net Assets | | $1,380,909,340 |
| Calculation of Maximum Offering Price | | |
| Class A: | | |
| Net Asset Value and redemption price per share ($35,539,258 ÷ 1,038,411 shares) | | $34.22 |
| Maximum offering price per share (100/94.25 of $34.22) | | $36.31 |
| Class M: | | |
| Net Asset Value and redemption price per share ($9,763,388 ÷ 286,713 shares) | | $34.05 |
| Maximum offering price per share (100/96.50 of $34.05) | | $35.28 |
| Class C: | | |
| Net Asset Value and offering price per share ($12,951,739 ÷ 387,632 shares)(a) | | $33.41 |
| China Region: | | |
| Net Asset Value, offering price and redemption price per share ($1,294,775,077 ÷ 37,374,777 shares) | | $34.64 |
| Class I: | | |
| Net Asset Value, offering price and redemption price per share ($27,879,878 ÷ 810,109 shares) | | $34.41 |
(a) Redemption price per share is equal to net asset value less any applicable contingent deferred sales charge.
See accompanying notes which are an integral part of the financial statements.
Statement of Operations
| | | Year ended October 31, 2017 |
| Investment Income | | |
| Dividends | | $18,856,818 |
| Income from Fidelity Central Funds | | 885,420 |
| Income before foreign taxes withheld | | 19,742,238 |
| Less foreign taxes withheld | | (2,164,579) |
| Total income | | 17,577,659 |
| Expenses | | |
| Management fee | $7,778,535 | |
| Transfer agent fees | 2,228,475 | |
| Distribution and service plan fees | 204,378 | |
| Accounting and security lending fees | 518,363 | |
| Custodian fees and expenses | 555,106 | |
| Independent trustees' fees and expenses | 4,340 | |
| Registration fees | 82,884 | |
| Audit | 93,465 | |
| Legal | 3,970 | |
| Interest | 5,750 | |
| Miscellaneous | 9,341 | |
| Total expenses before reductions | 11,484,607 | |
| Expense reductions | (198,144) | 11,286,463 |
| Net investment income (loss) | | 6,291,196 |
| Realized and Unrealized Gain (Loss) | | |
| Net realized gain (loss) on: | | |
| Investment securities: | | |
| Unaffiliated issuers | 78,436,133 | |
| Fidelity Central Funds | (2,989) | |
| Foreign currency transactions | (117,423) | |
| Total net realized gain (loss) | | 78,315,721 |
| Change in net unrealized appreciation (depreciation) on: | | |
| Investment securities: | | |
| Unaffiliated issuers | 266,759,046 | |
| Fidelity Central Funds | (1,961) | |
| Assets and liabilities in foreign currencies | (7,860) | |
| Total change in net unrealized appreciation (depreciation) | | 266,749,225 |
| Net gain (loss) | | 345,064,946 |
| Net increase (decrease) in net assets resulting from operations | | $351,356,142 |
See accompanying notes which are an integral part of the financial statements.
Statement of Changes in Net Assets
| | Year ended October 31, 2017 | Year ended October 31, 2016 |
| Increase (Decrease) in Net Assets | | |
| Operations | | |
| Net investment income (loss) | $6,291,196 | $11,358,761 |
| Net realized gain (loss) | 78,315,721 | (213,446,905) |
| Change in net unrealized appreciation (depreciation) | 266,749,225 | 180,733,105 |
| Net increase (decrease) in net assets resulting from operations | 351,356,142 | (21,355,039) |
| Distributions to shareholders from net investment income | (10,635,865) | (15,103,497) |
| Distributions to shareholders from net realized gain | (1,988,966) | (159,831,115) |
| Total distributions | (12,624,831) | (174,934,612) |
| Share transactions - net increase (decrease) | (22,198,615) | (83,319,865) |
| Redemption fees | 258,175 | 164,633 |
| Total increase (decrease) in net assets | 316,790,871 | (279,444,883) |
| Net Assets | | |
| Beginning of period | 1,064,118,469 | 1,343,563,352 |
| End of period | $1,380,909,340 | $1,064,118,469 |
| Other Information | | |
| Undistributed net investment income end of period | $5,536,153 | $10,634,162 |
See accompanying notes which are an integral part of the financial statements.
Financial Highlights
Fidelity China Region Fund Class A
| Years ended October 31, | 2017 | 2016 | 2015 | 2014 | 2013 |
| Selected Per–Share Data | | | | | |
| Net asset value, beginning of period | $25.46 | $29.34 | $34.18 | $35.56 | $28.53 |
| Income from Investment Operations | | | | | |
| Net investment income (loss)A | .08 | .18 | .40B | .21 | .30 |
| Net realized and unrealized gain (loss) | 8.90 | (.20) | (.83) | 2.01C | 7.06 |
| Total from investment operations | 8.98 | (.02) | (.43) | 2.22 | 7.36 |
| Distributions from net investment income | (.18) | (.27) | (.22) | (.30) | (.34) |
| Distributions from net realized gain | (.05) | (3.59) | (4.24) | (3.31) | – |
| Total distributions | (.23) | (3.86) | (4.46) | (3.61) | (.34) |
| Redemption fees added to paid in capitalA | .01 | –D | .05 | .01 | .01 |
| Net asset value, end of period | $34.22 | $25.46 | $29.34 | $34.18 | $35.56 |
| Total ReturnE,F | 35.67% | (.13)% | (1.45)% | 6.45%C | 26.07% |
| Ratios to Average Net AssetsG,H | | | | | |
| Expenses before reductions | 1.30% | 1.33% | 1.28% | 1.35% | 1.35% |
| Expenses net of fee waivers, if any | 1.30% | 1.33% | 1.28% | 1.35% | 1.35% |
| Expenses net of all reductions | 1.29% | 1.32% | 1.26% | 1.35% | 1.31% |
| Net investment income (loss) | .28% | .75% | 1.26%B | .64% | .94% |
| Supplemental Data | | | | | |
| Net assets, end of period (000 omitted) | $35,539 | $22,937 | $32,761 | $21,728 | $20,623 |
| Portfolio turnover rateI | 68% | 70% | 151% | 87% | 92% |
A Calculated based on average shares outstanding during the period.
B Net Investment income per share reflects a large, non-recurring dividend which amounted to $.13 per share. Excluding this non-recurring dividend, the ratio of net investment income (loss) to average net assets would have been .85%.
C Amount includes a reimbursement from the adviser for an operations error which amounted to $.01 per share. Excluding this reimbursement, the total return would have been 6.42%.
D Amount represents less than $.005 per share.
E Total returns would have been lower if certain expenses had not been reduced during the applicable periods shown.
F Total returns do not include the effect of the sales charges.
G Fees and expenses of any underlying Fidelity Central Funds are not included in the Fund's expense ratio. The Fund indirectly bears its proportionate share of the expenses of any underlying Fidelity Central Funds.
H Expense ratios reflect operating expenses of the class. Expenses before reductions do not reflect amounts reimbursed by the investment adviser or reductions from brokerage service arrangements or reductions from other expense offset arrangements and do not represent the amount paid by the class during periods when reimbursements or reductions occur. Expenses net of fee waivers reflect expenses after reimbursement by the investment adviser but prior to reductions from brokerage service arrangements or other expense offset arrangements. Expenses net of all reductions represent the net expenses paid by the class.
I Amount does not include the portfolio activity of any underlying Fidelity Central Funds.
See accompanying notes which are an integral part of the financial statements.
Fidelity China Region Fund Class M
| Years ended October 31, | 2017 | 2016 | 2015 | 2014 | 2013 |
| Selected Per–Share Data | | | | | |
| Net asset value, beginning of period | $25.34 | $29.18 | $34.02 | $35.40 | $28.40 |
| Income from Investment Operations | | | | | |
| Net investment income (loss)A | (.02) | .10 | .30B | .12 | .21 |
| Net realized and unrealized gain (loss) | 8.88 | (.22) | (.83) | 1.99C | 7.04 |
| Total from investment operations | 8.86 | (.12) | (.53) | 2.11 | 7.25 |
| Distributions from net investment income | (.11) | (.13) | (.12) | (.19) | (.26) |
| Distributions from net realized gain | (.05) | (3.59) | (4.24) | (3.31) | – |
| Total distributions | (.16) | (3.72) | (4.36) | (3.50) | (.26) |
| Redemption fees added to paid in capitalA | .01 | –D | .05 | .01 | .01 |
| Net asset value, end of period | $34.05 | $25.34 | $29.18 | $34.02 | $35.40 |
| Total ReturnE,F | 35.25% | (.50)% | (1.79)% | 6.15%C | 25.74% |
| Ratios to Average Net AssetsG,H | | | | | |
| Expenses before reductions | 1.65% | 1.67% | 1.62% | 1.65% | 1.64% |
| Expenses net of fee waivers, if any | 1.65% | 1.67% | 1.62% | 1.65% | 1.64% |
| Expenses net of all reductions | 1.64% | 1.67% | 1.60% | 1.65% | 1.60% |
| Net investment income (loss) | (.07)% | .40% | .92%B | .35% | .65% |
| Supplemental Data | | | | | |
| Net assets, end of period (000 omitted) | $9,763 | $5,644 | $6,409 | $6,305 | $5,965 |
| Portfolio turnover rateI | 68% | 70% | 151% | 87% | 92% |
A Calculated based on average shares outstanding during the period.
B Net Investment income per share reflects a large, non-recurring dividend which amounted to $.13 per share. Excluding this non-recurring dividend, the ratio of net investment income (loss) to average net assets would have been .51%.
C Amount includes a reimbursement from the adviser for an operations error which amounted to $.01 per share. Excluding this reimbursement, the total return would have been 6.12%.
D Amount represents less than $.005 per share.
E Total returns would have been lower if certain expenses had not been reduced during the applicable periods shown.
F Total returns do not include the effect of the sales charges.
G Fees and expenses of any underlying Fidelity Central Funds are not included in the Fund's expense ratio. The Fund indirectly bears its proportionate share of the expenses of any underlying Fidelity Central Funds.
H Expense ratios reflect operating expenses of the class. Expenses before reductions do not reflect amounts reimbursed by the investment adviser or reductions from brokerage service arrangements or reductions from other expense offset arrangements and do not represent the amount paid by the class during periods when reimbursements or reductions occur. Expenses net of fee waivers reflect expenses after reimbursement by the investment adviser but prior to reductions from brokerage service arrangements or other expense offset arrangements. Expenses net of all reductions represent the net expenses paid by the class.
I Amount does not include the portfolio activity of any underlying Fidelity Central Funds.
See accompanying notes which are an integral part of the financial statements.
Fidelity China Region Fund Class C
| Years ended October 31, | 2017 | 2016 | 2015 | 2014 | 2013 |
| Selected Per–Share Data | | | | | |
| Net asset value, beginning of period | $24.82 | $28.68 | $33.56 | $34.99 | $28.07 |
| Income from Investment Operations | | | | | |
| Net investment income (loss)A | (.13) | –B | .15C | (.02) | .06 |
| Net realized and unrealized gain (loss) | 8.73 | (.21) | (.80) | 1.97D | 6.97 |
| Total from investment operations | 8.60 | (.21) | (.65) | 1.95 | 7.03 |
| Distributions from net investment income | – | (.06) | (.04) | (.08) | (.12) |
| Distributions from net realized gain | (.02) | (3.59) | (4.24) | (3.31) | – |
| Total distributions | (.02) | (3.65) | (4.28) | (3.39) | (.12) |
| Redemption fees added to paid in capitalA | .01 | –B | .05 | .01 | .01 |
| Net asset value, end of period | $33.41 | $24.82 | $28.68 | $33.56 | $34.99 |
| Total ReturnE,F | 34.71% | (.88)% | (2.21)% | 5.71%D | 25.14% |
| Ratios to Average Net AssetsG,H | | | | | |
| Expenses before reductions | 2.05% | 2.07% | 2.05% | 2.07% | 2.10% |
| Expenses net of fee waivers, if any | 2.05% | 2.07% | 2.05% | 2.07% | 2.10% |
| Expenses net of all reductions | 2.03% | 2.06% | 2.02% | 2.07% | 2.07% |
| Net investment income (loss) | (.46)% | .01% | .49%C | (.07)% | .19% |
| Supplemental Data | | | | | |
| Net assets, end of period (000 omitted) | $12,952 | $11,218 | $14,355 | $10,445 | $6,957 |
| Portfolio turnover rateI | 68% | 70% | 151% | 87% | 92% |
A Calculated based on average shares outstanding during the period.
B Amount represents less than $.005 per share.
C Net Investment income per share reflects a large, non-recurring dividend which amounted to $.13 per share. Excluding this non-recurring dividend, the ratio of net investment income (loss) to average net assets would have been .09%.
D Amount includes a reimbursement from the adviser for an operations error which amounted to $.01 per share. Excluding this reimbursement, the total return would have been 5.68%.
E Total returns would have been lower if certain expenses had not been reduced during the applicable periods shown.
F Total returns do not include the effect of the contingent deferred sales charge.
G Fees and expenses of any underlying Fidelity Central Funds are not included in the Fund's expense ratio. The Fund indirectly bears its proportionate share of the expenses of any underlying Fidelity Central Funds.
H Expense ratios reflect operating expenses of the class. Expenses before reductions do not reflect amounts reimbursed by the investment adviser or reductions from brokerage service arrangements or reductions from other expense offset arrangements and do not represent the amount paid by the class during periods when reimbursements or reductions occur. Expenses net of fee waivers reflect expenses after reimbursement by the investment adviser but prior to reductions from brokerage service arrangements or other expense offset arrangements. Expenses net of all reductions represent the net expenses paid by the class.
I Amount does not include the portfolio activity of any underlying Fidelity Central Funds.
See accompanying notes which are an integral part of the financial statements.
Fidelity China Region Fund
| Years ended October 31, | 2017 | 2016 | 2015 | 2014 | 2013 |
| Selected Per–Share Data | | | | | |
| Net asset value, beginning of period | $25.78 | $29.66 | $34.51 | $35.83 | $28.73 |
| Income from Investment Operations | | | | | |
| Net investment income (loss)A | .17 | .26 | .51B | .33 | .41 |
| Net realized and unrealized gain (loss) | 9.00 | (.21) | (.84) | 2.03C | 7.11 |
| Total from investment operations | 9.17 | .05 | (.33) | 2.36 | 7.52 |
| Distributions from net investment income | (.27) | (.35) | (.33) | (.38) | (.43) |
| Distributions from net realized gain | (.05) | (3.59) | (4.24) | (3.31) | – |
| Total distributions | (.32) | (3.93)D | (4.57) | (3.69) | (.43) |
| Redemption fees added to paid in capitalA | .01 | –E | .05 | .01 | .01 |
| Net asset value, end of period | $34.64 | $25.78 | $29.66 | $34.51 | $35.83 |
| Total ReturnF | 36.10% | .15% | (1.14)% | 6.83%C | 26.51% |
| Ratios to Average Net AssetsG,H | | | | | |
| Expenses before reductions | 1.00% | 1.02% | .99% | 1.01% | 1.02% |
| Expenses net of fee waivers, if any | 1.00% | 1.02% | .98% | 1.01% | 1.02% |
| Expenses net of all reductions | .99% | 1.01% | .96% | 1.01% | .98% |
| Net investment income (loss) | .58% | 1.06% | 1.55%B | .99% | 1.27% |
| Supplemental Data | | | | | |
| Net assets, end of period (000 omitted) | $1,294,775 | $1,004,985 | $1,262,274 | $1,352,761 | $1,425,828 |
| Portfolio turnover rateI | 68% | 70% | 151% | 87% | 92% |
A Calculated based on average shares outstanding during the period.
B Net Investment income per share reflects a large, non-recurring dividend which amounted to $.13 per share. Excluding this non-recurring dividend, the ratio of net investment income (loss) to average net assets would have been 1.15%.
C Amount includes a reimbursement from the adviser for an operations error which amounted to $.01 per share. Excluding this reimbursement, the total return would have been 6.80%.
D Total distributions of $3.93 per share is comprised of distributions from net investment income of $.345 and distributions from net realized gain of $3.588 per share.
E Amount represents less than $.005 per share.
F Total returns would have been lower if certain expenses had not been reduced during the applicable periods shown.
G Fees and expenses of any underlying Fidelity Central Funds are not included in the Fund's expense ratio. The Fund indirectly bears its proportionate share of the expenses of any underlying Fidelity Central Funds.
H Expense ratios reflect operating expenses of the class. Expenses before reductions do not reflect amounts reimbursed by the investment adviser or reductions from brokerage service arrangements or reductions from other expense offset arrangements and do not represent the amount paid by the class during periods when reimbursements or reductions occur. Expenses net of fee waivers reflect expenses after reimbursement by the investment adviser but prior to reductions from brokerage service arrangements or other expense offset arrangements. Expenses net of all reductions represent the net expenses paid by the class.
I Amount does not include the portfolio activity of any underlying Fidelity Central Funds.
See accompanying notes which are an integral part of the financial statements.
Fidelity China Region Fund Class I
| Years ended October 31, | 2017 | 2016 | 2015 | 2014 | 2013 |
| Selected Per–Share Data | | | | | |
| Net asset value, beginning of period | $25.62 | $29.51 | $34.39 | $35.75 | $28.68 |
| Income from Investment Operations | | | | | |
| Net investment income (loss)A | .16 | .26 | .51B | .34 | .42 |
| Net realized and unrealized gain (loss) | 8.95 | (.20) | (.84) | 2.02C | 7.10 |
| Total from investment operations | 9.11 | .06 | (.33) | 2.36 | 7.52 |
| Distributions from net investment income | (.28) | (.36) | (.36) | (.43) | (.46) |
| Distributions from net realized gain | (.05) | (3.59) | (4.24) | (3.31) | – |
| Total distributions | (.33) | (3.95) | (4.60) | (3.73)D | (.46) |
| Redemption fees added to paid in capitalA | .01 | –E | .05 | .01 | .01 |
| Net asset value, end of period | $34.41 | $25.62 | $29.51 | $34.39 | $35.75 |
| Total ReturnF | 36.11% | .16% | (1.14)% | 6.87%C | 26.58% |
| Ratios to Average Net AssetsG,H | | | | | |
| Expenses before reductions | 1.01% | 1.00% | .97% | .98% | .97% |
| Expenses net of fee waivers, if any | 1.01% | 1.00% | .97% | .98% | .97% |
| Expenses net of all reductions | .99% | .99% | .95% | .98% | .93% |
| Net investment income (loss) | .57% | 1.07% | 1.57%B | 1.01% | 1.32% |
| Supplemental Data | | | | | |
| Net assets, end of period (000 omitted) | $27,880 | $19,334 | $26,961 | $19,404 | $10,206 |
| Portfolio turnover rateI | 68% | 70% | 151% | 87% | 92% |
A Calculated based on average shares outstanding during the period.
B Net Investment income per share reflects a large, non-recurring dividend which amounted to $.13 per share. Excluding this non-recurring dividend, the ratio of net investment income (loss) to average net assets would have been 1.16%.
C Amount includes a reimbursement from the adviser for an operations error which amounted to $.01 per share. Excluding this reimbursement, the total return would have been 6.84%.
D Total distributions of $3.73 per share is comprised of distributions from net investment income of $.425 and distributions from net realized gain of $3.306 per share.
E Amount represents less than $.005 per share.
F Total returns would have been lower if certain expenses had not been reduced during the applicable periods shown.
G Fees and expenses of any underlying Fidelity Central Funds are not included in the Fund's expense ratio. The Fund indirectly bears its proportionate share of the expenses of any underlying Fidelity Central Funds.
H Expense ratios reflect operating expenses of the class. Expenses before reductions do not reflect amounts reimbursed by the investment adviser or reductions from brokerage service arrangements or reductions from other expense offset arrangements and do not represent the amount paid by the class during periods when reimbursements or reductions occur. Expenses net of fee waivers reflect expenses after reimbursement by the investment adviser but prior to reductions from brokerage service arrangements or other expense offset arrangements. Expenses net of all reductions represent the net expenses paid by the class.
I Amount does not include the portfolio activity of any underlying Fidelity Central Funds.
See accompanying notes which are an integral part of the financial statements.
Notes to Financial Statements
For the period ended October 31, 2017
1. Organization.
Fidelity China Region Fund (the Fund) is a fund of Fidelity Investment Trust (the Trust) and is authorized to issue an unlimited number of shares. The Trust is registered under the Investment Company Act of 1940, as amended (the 1940 Act), as an open-end management investment company organized as a Massachusetts business trust. The Fund offers Class A, Class M (formerly Class T), Class C, China Region and Class I shares, each of which has equal rights as to assets and voting privileges. Each class has exclusive voting rights with respect to matters that affect that class. The Fund's investments in emerging markets can be subject to social, economic, regulatory, and political uncertainties and can be extremely volatile.
After the close of business on June 24, 2016, all outstanding Class B shares were converted to Class A shares. All prior fiscal period dollar and share amounts for Class B presented in the Notes to Financial Statements are for the period November 1, 2015 through June 24, 2016.
2. Investments in Fidelity Central Funds.
The Fund invests in Fidelity Central Funds, which are open-end investment companies generally available only to other investment companies and accounts managed by the investment adviser and its affiliates. The Fund's Schedule of Investments lists each of the Fidelity Central Funds held as of period end, if any, as an investment of the Fund, but does not include the underlying holdings of each Fidelity Central Fund. As an Investing Fund, the Fund indirectly bears its proportionate share of the expenses of the underlying Fidelity Central Funds.
The Money Market Central Funds seek preservation of capital and current income and are managed by Fidelity Investments Money Management, Inc. (FIMM), an affiliate of the investment adviser. Annualized expenses of the Money Market Central Funds as of their most recent shareholder report date are less than .005%.
A complete unaudited list of holdings for each Fidelity Central Fund is available upon request or at the Securities and Exchange Commission (the SEC) website at www.sec.gov. In addition, the financial statements of the Fidelity Central Funds, which are not covered by the Fund's Report of Independent Registered Public Accounting Firm, are available on the SEC website or upon request.
3. Significant Accounting Policies.
The Fund is an investment company and applies the accounting and reporting guidance of the Financial Accounting Standards Board (FASB) Accounting Standards Codification Topic 946 Financial Services – Investments Companies. The financial statements have been prepared in conformity with accounting principles generally accepted in the United States of America (GAAP), which require management to make certain estimates and assumptions at the date of the financial statements. Actual results could differ from those estimates. Subsequent events, if any, through the date that the financial statements were issued have been evaluated in the preparation of the financial statements. The following summarizes the significant accounting policies of the Fund:
Investment Valuation. Investments are valued as of 4:00 p.m. Eastern time on the last calendar day of the period. The Board of Trustees (the Board) has delegated the day to day responsibility for the valuation of the Fund's investments to the Fair Value Committee (the Committee) established by the Fund's investment adviser. In accordance with valuation policies and procedures approved by the Board, the Fund attempts to obtain prices from one or more third party pricing vendors or brokers to value its investments. When current market prices, quotations or currency exchange rates are not readily available or reliable, investments will be fair valued in good faith by the Committee, in accordance with procedures adopted by the Board. Factors used in determining fair value vary by investment type and may include market or investment specific events. The frequency with which these procedures are used cannot be predicted and they may be utilized to a significant extent. The Committee oversees the Fund's valuation policies and procedures and reports to the Board on the Committee's activities and fair value determinations. The Board monitors the appropriateness of the procedures used in valuing the Fund's investments and ratifies the fair value determinations of the Committee.
The Fund categorizes the inputs to valuation techniques used to value its investments into a disclosure hierarchy consisting of three levels as shown below:
- Level 1 – quoted prices in active markets for identical investments
- Level 2 – other significant observable inputs (including quoted prices for similar investments, interest rates, prepayment speeds, etc.)
- Level 3 – unobservable inputs (including the Fund's own assumptions based on the best information available)
Valuation techniques used to value the Fund's investments by major category are as follows:
Equity securities, including restricted securities, for which market quotations are readily available, are valued at the last reported sale price or official closing price as reported by a third party pricing vendor on the primary market or exchange on which they are traded and are categorized as Level 1 in the hierarchy. In the event there were no sales during the day or closing prices are not available, securities are valued at the last quoted bid price or may be valued using the last available price and are generally categorized as Level 2 in the hierarchy. For foreign equity securities, when market or security specific events arise, comparisons to the valuation of American Depositary Receipts (ADRs), futures contracts, Exchange-Traded Funds (ETFs) and certain indexes as well as quoted prices for similar securities may be used and would be categorized as Level 2 in the hierarchy. Utilizing these techniques may result in transfers between Level 1 and Level 2. For equity securities, including restricted securities, where observable inputs are limited, assumptions about market activity and risk are used and these securities may be categorized as Level 3 in the hierarchy.
Investments in open-end mutual funds, including the Fidelity Central Funds, are valued at their closing net asset value (NAV) each business day and are categorized as Level 1 in the hierarchy.
Changes in valuation techniques may result in transfers in or out of an assigned level within the disclosure hierarchy. The aggregate value of investments by input level as of October 31, 2017, including information on transfers between Levels 1 and 2, as well as a roll forward of Level 3 investments, is included at the end of the Fund's Schedule of Investments.
Foreign Currency. The Fund may use foreign currency contracts to facilitate transactions in foreign-denominated securities. Gains and losses from these transactions may arise from changes in the value of the foreign currency or if the counterparties do not perform under the contracts' terms.
Foreign-denominated assets, including investment securities, and liabilities are translated into U.S. dollars at the exchange rates at period end. Purchases and sales of investment securities, income and dividends received and expenses denominated in foreign currencies are translated into U.S. dollars at the exchange rate in effect on the transaction date.
The effects of exchange rate fluctuations on investments are included with the net realized and unrealized gain (loss) on investment securities. Other foreign currency transactions resulting in realized and unrealized gain (loss) are disclosed separately.
Investment Transactions and Income. For financial reporting purposes, the Fund's investment holdings and NAV include trades executed through the end of the last business day of the period. The NAV per share for processing shareholder transactions is calculated as of the close of business of the New York Stock Exchange (NYSE), normally 4:00 p.m. Eastern time and includes trades executed through the end of the prior business day. Gains and losses on securities sold are determined on the basis of identified cost. Dividend income is recorded on the ex-dividend date, except for certain dividends from foreign securities where the ex-dividend date may have passed, which are recorded as soon as the Fund is informed of the ex-dividend date. Non-cash dividends included in dividend income, if any, are recorded at the fair market value of the securities received. Income and capital gain distributions from Fidelity Central Funds, if any, are recorded on the ex-dividend date. Investment income is recorded net of foreign taxes withheld where recovery of such taxes is uncertain.
Class Allocations and Expenses. Investment income, realized and unrealized capital gains and losses, common expenses of the Fund, and certain fund-level expense reductions, if any, are allocated daily on a pro-rata basis to each class based on the relative net assets of each class to the total net assets of the Fund. Each class differs with respect to transfer agent and distribution and service plan fees incurred. Certain expense reductions may also differ by class. For the reporting period, the allocated portion of income and expenses to each class as a percent of its average net assets may vary due to the timing of recording these transactions in relation to fluctuating net assets of the classes. Expenses directly attributable to a fund are charged to that fund. Expenses attributable to more than one fund are allocated among the respective funds on the basis of relative net assets or other appropriate methods. Expense estimates are accrued in the period to which they relate and adjustments are made when actual amounts are known.
Income Tax Information and Distributions to Shareholders. Each year, the Fund intends to qualify as a regulated investment company under Subchapter M of the Internal Revenue Code, including distributing substantially all of its taxable income and realized gains. As a result, no provision for U.S. Federal income taxes is required. As of October 31, 2017, the Fund did not have any unrecognized tax benefits in the financial statements; nor is the Fund aware of any tax positions for which it is reasonably possible that the total amounts of unrecognized tax benefits will significantly change in the next twelve months. The Fund files a U.S. federal tax return, in addition to state and local tax returns as required. The Fund's federal income tax returns are subject to examination by the Internal Revenue Service (IRS) for a period of three fiscal years after they are filed. State and local tax returns may be subject to examination for an additional fiscal year depending on the jurisdiction. Foreign taxes are provided for based on the Fund's understanding of the tax rules and rates that exist in the foreign markets in which it invests.
Distributions are declared and recorded on the ex-dividend date. Income dividends and capital gain distributions are declared separately for each class. Income and capital gain distributions are determined in accordance with income tax regulations, which may differ from GAAP.
Capital accounts within the financial statements are adjusted for permanent book-tax differences. These adjustments have no impact on net assets or the results of operations. Capital accounts are not adjusted for temporary book-tax differences which will reverse in a subsequent period.
Book-tax differences are primarily due to foreign currency transactions, passive foreign investment companies (PFIC), deferred trustees compensation, capital loss carryforwards and losses deferred due to wash sales.
As of period end, the cost and unrealized appreciation (depreciation) in securities, and derivatives if applicable, for federal income tax purposes were as follows:
| Gross unrealized appreciation | $398,740,351 |
| Gross unrealized depreciation | (40,859,652) |
| Net unrealized appreciation (depreciation) | $357,880,699 |
| Tax Cost | $1,026,139,966 |
The tax-based components of distributable earnings as of period end were as follows:
| Undistributed ordinary income | $5,536,158 |
| Capital loss carryforward | $(139,203,991) |
| Net unrealized appreciation (depreciation) on securities and other investments | $357,877,900 |
Capital loss carryforwards are only available to offset future capital gains of the Fund to the extent provided by regulations and may be limited. Under the Regulated Investment Company Modernization Act of 2010 (the Act), the Fund is permitted to carry forward capital losses incurred in taxable years beginning after December 22, 2010 for an unlimited period and such capital losses are required to be used prior to any losses that expire. The capital loss carryforward information presented below, including any applicable limitation, is estimated as of fiscal period end and is subject to adjustment.
| No expiration | |
| Short-term | $(139,203,991) |
The tax character of distributions paid was as follows:
| | October 31, 2017 | October 31, 2016 |
| Ordinary Income | $12,624,831 | $ 15,103,497 |
| Long-term Capital Gains | – | 159,831,115 |
| Total | $12,624,831 | $ 174,934,612 |
Short-Term Trading (Redemption) Fees. Shares held by investors in the Fund less than 90 days may have been subject to a redemption fee equal to 1.50% of the NAV of shares redeemed. All redemption fees, which reduce the proceeds of the shareholder redemption, are retained by the Fund and accounted for as an addition to paid in capital. In November 2017, the Board of Trustees approved the elimination of these redemption fees effective December 18, 2017.
Restricted Securities. The Fund may invest in securities that are subject to legal or contractual restrictions on resale. These securities generally may be resold in transactions exempt from registration or to the public if the securities are registered. Disposal of these securities may involve time-consuming negotiations and expense, and prompt sale at an acceptable price may be difficult. Information regarding restricted securities is included at the end of the Fund's Schedule of Investments.
4. Purchases and Sales of Investments.
Purchases and sales of securities, other than short-term securities, aggregated $781,020,865 and $742,128,259, respectively.
5. Fees and Other Transactions with Affiliates.
Management Fee. Fidelity Management & Research Company (the investment adviser) and its affiliates provide the Fund with investment management related services for which the Fund pays a monthly management fee. The management fee is the sum of an individual fund fee rate that is based on an annual rate of .45% of the Fund's average net assets and an annualized group fee rate that averaged .25% during the period. The group fee rate is based upon the average net assets of all the mutual funds advised by the investment adviser, including any mutual funds previously advised by the investment adviser that are currently advised by Fidelity SelectCo, LLC, an affiliate of the investment adviser. The group fee rate decreases as assets under management increase and increases as assets under management decrease. For the reporting period, the total annual management fee rate was .69% of the Fund's average net assets.
Distribution and Service Plan Fees. In accordance with Rule 12b-1 of the 1940 Act, the Fund has adopted separate Distribution and Service Plans for each class of shares. Certain classes pay Fidelity Distributors Corporation (FDC), an affiliate of the investment adviser, separate Distribution and Service Fees, each of which is based on an annual percentage of each class' average net assets. In addition, FDC may pay financial intermediaries for selling shares of the Fund and providing shareholder support services. For the period, the Distribution and Service Fee rates, total fees and amounts retained by FDC were as follows:
| | Distribution
Fee | Service
Fee | Total Fees | Retained
by FDC |
| Class A | -% | .25% | $64,901 | $– |
| Class M | .25% | .25% | 34,400 | 222 |
| Class C | .75% | .25% | 105,077 | 9,924 |
| | | | $204,378 | $10,146 |
Sales Load. FDC may receive a front-end sales charge of up to 5.75% for selling Class A shares and 3.50% for selling Class M shares, some of which is paid to financial intermediaries for selling shares of the Fund. Depending on the holding period, FDC may receive contingent deferred sales charges levied on Class A, Class M and Class C redemptions. The deferred sales charges are 1.00% for Class C shares, 1.00% for certain purchases of Class A shares and .25% for certain purchases of Class M shares.
For the period, sales charge amounts retained by FDC were as follows:
| | Retained
by FDC |
| Class A | $11,444 |
| Class M | 1,704 |
| Class C(a) | 1,646 |
| | $14,794 |
(a) When Class C shares are initially sold, FDC pays commissions from its own resources to financial intermediaries through which the sales are made.
Transfer Agent Fees. Fidelity Investments Institutional Operations Company, Inc., (FIIOC), an affiliate of the investment adviser, is the transfer, dividend disbursing and shareholder servicing agent for each class of the Fund. FIIOC receives account fees and asset-based fees that vary according to the account size and type of account of the shareholders of the respective classes of the Fund. FIIOC pays for typesetting, printing and mailing of shareholder reports, except proxy statements.
For the period, transfer agent fees for each class were as follows:
| | Amount | % of
Class-Level Average
Net Assets |
| Class A | $64,503 | .25 |
| Class M | 24,020 | .35 |
| Class C | 25,645 | .24 |
| China Region | 2,069,254 | .20 |
| Class I | 45,053 | .20 |
| | $2,228,475 | |
Accounting and Security Lending Fees. Fidelity Service Company, Inc. (FSC), an affiliate of the investment adviser, maintains the Fund's accounting records. The accounting fee is based on the level of average net assets for each month. Under a separate contract, FSC administers the security lending program. The security lending fee is based on the number and duration of lending transactions.
Brokerage Commissions. The Fund placed a portion of its portfolio transactions with brokerage firms which are affiliates of the investment adviser. Brokerage commissions are included in net realized gain (loss) and change in net unrealized appreciation (depreciation) in the Statement of Operations. The commissions paid to these affiliated firms were $3,282 for the period.
Interfund Lending Program. Pursuant to an Exemptive Order issued by the SEC, the Fund, along with other registered investment companies having management contracts with Fidelity Management & Research Company (FMR) or other affiliated entities of FMR, may participate in an interfund lending program. This program provides an alternative credit facility allowing the funds to borrow from, or lend money to, other participating affiliated funds. Any open loans, including accrued interest, at period end are presented under the caption "Notes payable to affiliates" in the Fund's Statement of Assets and Liabilities. The Fund's activity in this program during the period for which loans were outstanding was as follows:
| Borrower or Lender | Average Loan Balance | Weighted Average Interest Rate | Interest Expense |
| Borrower | $12,007,182 | .73% | $5,376 |
Interfund Trades. The Fund may purchase from or sell securities to other Fidelity Funds under procedures adopted by the Board. The procedures have been designed to ensure these interfund trades are executed in accordance with Rule 17a-7 of the 1940 Act. Interfund trades are included within the respective purchases and sales amounts shown in the Purchases and Sales of Investments note.
Other. During the period, the investment adviser reimbursed the Fund for certain losses in the amount of $78,874.
6. Committed Line of Credit.
The Fund participates with other funds managed by the investment adviser or an affiliate in a $4.25 billion credit facility (the "line of credit") to be utilized for temporary or emergency purposes to fund shareholder redemptions or for other short-term liquidity purposes. The Fund has agreed to pay commitment fees on its pro-rata portion of the line of credit, which amounted to $3,476 and is reflected in Miscellaneous expenses on the Statement of Operations. During the period, the Fund did not borrow on this line of credit.
7. Security Lending.
The Fund lends portfolio securities through a lending agent from time to time in order to earn additional income. For equity securities, a lending agent is used and may loan securities to certain qualified borrowers, including Fidelity Capital Markets (FCM), a broker-dealer affiliated with the Fund. On the settlement date of the loan, the Fund receives collateral (in the form of U.S. Treasury obligations, letters of credit and/or cash) against the loaned securities and maintains collateral in an amount not less than 100% of the market value of the loaned securities during the period of the loan. The market value of the loaned securities is determined at the close of business of the Fund and any additional required collateral is delivered to the Fund on the next business day. The Fund or borrower may terminate the loan at any time, and if the borrower defaults on its obligation to return the securities loaned because of insolvency or other reasons, the Fund may apply collateral received from the borrower against the obligation. The Fund may experience delays and costs in recovering the securities loaned. Any cash collateral received is invested in the Fidelity Securities Lending Cash Central Fund. The value of loaned securities and cash collateral at period end are disclosed on the Fund's Statement of Assets and Liabilities. Security lending income represents the income earned on investing cash collateral, less rebates paid to borrowers and any lending agent fees associated with the loan, plus any premium payments received for lending certain types of securities. Security lending income is presented in the Statement of Operations as a component of income from Fidelity Central Funds. Total security lending income during the period amounted to $548,850. During the period, there were no securities loaned to FCM.
8. Bank Borrowings.
The Fund is permitted to have bank borrowings for temporary or emergency purposes to fund shareholder redemptions or for other short-term liquidity requirements. The Fund has established borrowing arrangements with certain banks. The interest rate on the borrowings is the bank's base rate, as revised from time to time. The average loan balance during the period for which loans were outstanding amounted to $4,033,333. The weighted average interest rate was 1.11%. The interest expense amounted to $374 under the bank borrowing program. At period end, there were no bank borrowings outstanding.
9. Expense Reductions.
Commissions paid to certain brokers with whom the investment adviser, or its affiliates, places trades on behalf of the Fund include an amount in addition to trade execution, which may be rebated back to the Fund to offset certain expenses. This amount totaled $189,439 for the period.
In addition, during the period the investment adviser reimbursed and/or waived a portion of fund-level operating expenses in the amount of $8,705.
10. Distributions to Shareholders.
Distributions to shareholders of each class were as follows:
| | Year ended
October 31, 2017 | Year ended October 31, 2016 |
| From net investment income | | |
| Class A | $157,254 | $297,014 |
| Class M | 24,256 | 28,522 |
| Class C | – | 29,301 |
| China Region | 10,242,046 | 14,431,516 |
| Class I | 212,309 | 317,144 |
| Total | $10,635,865 | $15,103,497 |
| From net realized gain | | |
| Class A | $43,202 | $3,946,989 |
| Class M | 10,926 | 763,704 |
| Class B | – | 93,006 |
| Class C | 7,384 | 1,752,229 |
| China Region | 1,889,677 | 150,087,760 |
| Class I | 37,777 | 3,187,427 |
| Total | $1,988,966 | $159,831,115 |
11. Share Transactions.
Share transactions for each class were as follows and may contain automatic conversions between classes or exchanges between affiliated funds:
| | Shares | Shares | Dollars | Dollars |
| | Year ended October 31, 2017 | Year ended October 31, 2016 | Year ended October 31, 2017 | Year ended October 31, 2016 |
| Class A | | | | |
| Shares sold | 484,746 | 240,368 | $14,218,284 | $5,824,186 |
| Reinvestment of distributions | 7,951 | 162,605 | 195,750 | 4,157,811 |
| Shares redeemed | (355,316) | (618,365) | (9,896,035) | (14,282,494) |
| Net increase (decrease) | 137,381 | (215,392) | $4,517,999 | $(4,300,497) |
| Class M | | | | |
| Shares sold | 114,104 | 43,307 | $3,376,139 | $1,037,492 |
| Reinvestment of distributions | 1,419 | 30,599 | 34,859 | 781,504 |
| Shares redeemed | (51,513) | (70,825) | (1,446,359) | (1,686,295) |
| Net increase (decrease) | 64,010 | 3,081 | $1,964,639 | $132,701 |
| Class B | | | | |
| Shares sold | – | 30 | $– | $648 |
| Reinvestment of distributions | – | 3,443 | – | 87,630 |
| Shares redeemed | – | (31,204) | – | (704,876) |
| Net increase (decrease) | – | (27,731) | $– | $(616,598) |
| Class C | | | | |
| Shares sold | 123,999 | 98,283 | $3,531,382 | $2,387,271 |
| Reinvestment of distributions | 254 | 55,713 | 6,148 | 1,398,404 |
| Shares redeemed | (188,578) | (202,505) | (4,895,729) | (4,847,372) |
| Net increase (decrease) | (64,325) | (48,509) | $(1,358,199) | $(1,061,697) |
| China Region | | | | |
| Shares sold | 7,507,787 | 3,781,033 | $224,773,166 | $92,584,217 |
| Reinvestment of distributions | 469,834 | 6,142,435 | 11,675,364 | 158,659,097 |
| Shares redeemed | (9,588,795) | (13,494,506) | (265,714,287) | (325,219,240) |
| Net increase (decrease) | (1,611,174) | (3,571,038) | $(29,265,757) | $(73,975,926) |
| Class I | | | | |
| Shares sold | 659,273 | 405,852 | $19,707,002 | $10,200,502 |
| Reinvestment of distributions | 8,728 | 99,936 | 215,492 | 2,565,348 |
| Shares redeemed | (612,455) | (664,751) | (17,979,791) | (16,263,698) |
| Net increase (decrease) | 55,546 | (158,963) | $1,942,703 | $(3,497,848) |
12. Other.
The Fund's organizational documents provide former and current trustees and officers with a limited indemnification against liabilities arising in connection with the performance of their duties to the Fund. In the normal course of business, the Fund may also enter into contracts that provide general indemnifications. The Fund's maximum exposure under these arrangements is unknown as this would be dependent on future claims that may be made against the Fund. The risk of material loss from such claims is considered remote.
Fidelity® Emerging Asia Fund
Performance: The Bottom Line
Average annual total return reflects the change in the value of an investment, assuming reinvestment of distributions from dividend income and capital gains (the profits earned upon the sale of securities that have grown in value, if any) and assuming a constant rate of performance each year. The hypothetical investment and the average annual total returns do not reflect the deduction of taxes that a shareholder would pay on fund distributions or the redemption of fund shares. During periods of reimbursement by Fidelity, a fund’s total return will be greater than it would be had the reimbursement not occurred. How a fund did yesterday is no guarantee of how it will do tomorrow.
Average Annual Total Returns
| For the periods ended October 31, 2017 | Past 1 year | Past 5 years | Past 10 years |
| Fidelity® Emerging Asia Fund | 33.28% | 10.22% | 0.97% |
Prior to December 1, 2010, the fund operated under certain different investment policies and compared its performance to a different index. The fund's historical performance may not represent its current investment policies.
$10,000 Over 10 Years
Let's say hypothetically that $10,000 was invested in Fidelity® Emerging Asia Fund on October 31, 2007.
The chart shows how the value of your investment would have changed, and also shows how the MSCI AC (All Country) Asia ex Japan Index performed over the same period.
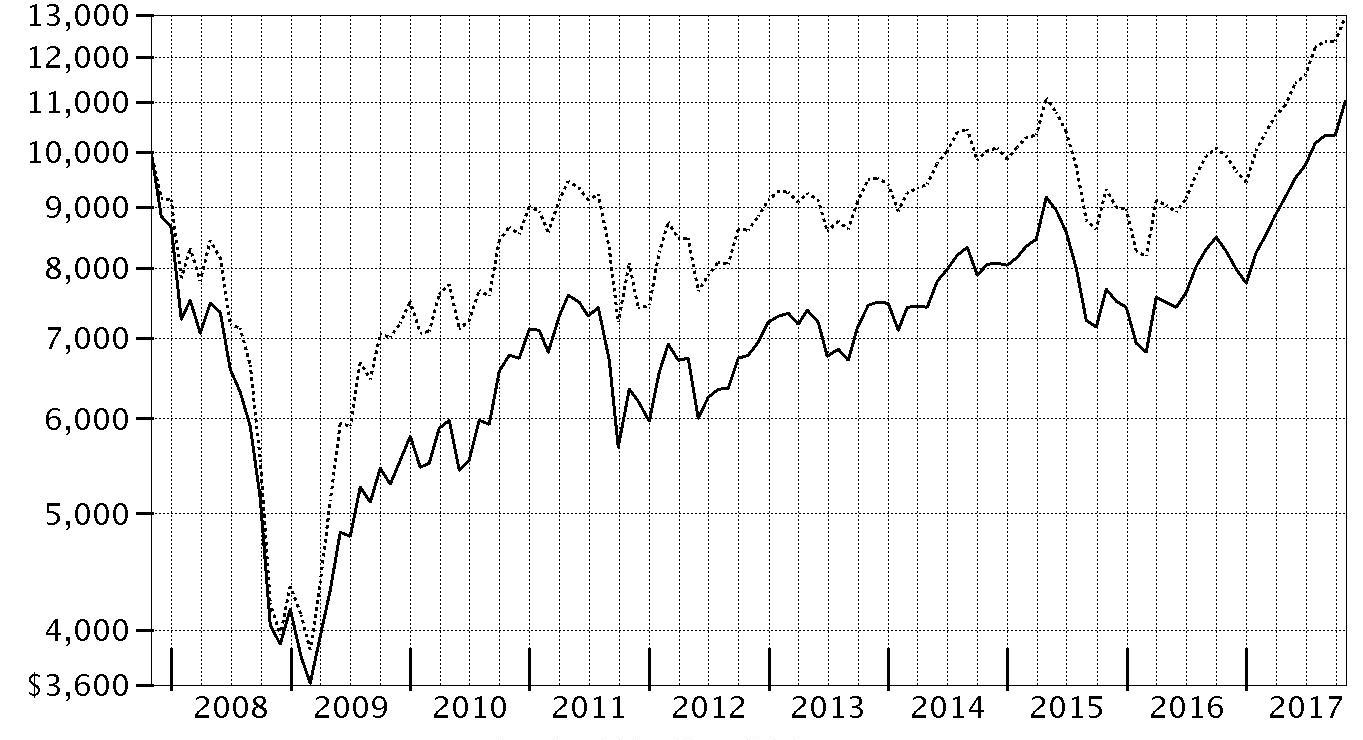
| Period Ending Values |
| $11,009 | Fidelity® Emerging Asia Fund |
| $12,942 | MSCI AC (All Country) Asia ex Japan Index |
Fidelity® Emerging Asia Fund
Management's Discussion of Fund Performance
Market Recap: The MSCI ACWI (All Country World Index) ex USA Index returned 23.85% for the 12 months ending October 31, 2017, helped partly by a generally weak U.S. dollar. Some favorable election results in continental Europe (+30%) suggested ebbing political uncertainty and near-term risk there, but the U.K. (+20%) faced more-mixed conditions ahead of its expected exit from the European Union. Despite central-bank easing – and pressured recently by yen strength – Japan (+18%) lagged the rest of the Asia-Pacific group (+22%). Commodity-price volatility slowed Canada (+17%), but the emerging-markets group (+26%) sped ahead. Sector-wise, information technology (+47%) was driven by a surge among several Chinese internet-related names. Financials (+27%) rode rising interest rates that, at the same time, weighed on real estate (+17%), utilities (+16%), consumer staples (+14%) and telecom services (+9%) – so-called “bond proxy” sectors. Materials (+28%) and industrials (+27%) responded to demand from China and gains in certain commodity prices. In energy (+20%), oil prices lost ground in the spring before rebounding through October 31 to end well above where they started 12 months ago. Lastly, health care (+14%) was hurt by early-period turmoil around drug pricing and health care legislation.
Comments from Portfolio Manager John Dance: For the fiscal year, the fund rose 33.28%, topping the 30.46% return of the MSCI AC (All Country) Asia ex Japan Index. Versus the benchmark, positioning in technology and picks in consumer staples were pluses. Regionally, China was key to the fund’s outperformance. Positioning in Malaysia and India also helped. Among stocks, our top relative contributor was Hangzhou Hikvision Digital Technology, a maker of security cameras and a new position for the fund. Also helpful were two other China-based firms: Kweichow Moutai, a maker of alcoholic beverages, and pharmaceutical firm Jiangsu Hengrui Medicine. All three of these stocks were Chinese A-shares not in the index. Conversely, real estate, health care and financials were minor detractors; Israel, Taiwan and Philippines detracted from a country view. The fund owned two India-based generic-drug makers – Sun Pharmaceutical Industries and Divi’s Laboratories – that were hurt by regulatory headwinds and sold. Other detractors were HKT Trust and HKT Limited, a Hong Kong telecoms provider, and Korea-based digital-memory maker SK Hynix, a strong-performing index name we didn’t own. A cash stake of about 3% of assets, on average, also dragged on our relative result.
The views expressed above reflect those of the portfolio manager(s) only through the end of the period as stated on the cover of this report and do not necessarily represent the views of Fidelity or any other person in the Fidelity organization. Any such views are subject to change at any time based upon market or other conditions and Fidelity disclaims any responsibility to update such views. These views may not be relied on as investment advice and, because investment decisions for a Fidelity fund are based on numerous factors, may not be relied on as an indication of trading intent on behalf of any Fidelity fund.
Note to shareholders: On December 31, 2016, John Dance assumed sole management responsibility for the fund, as former Co-Manager Colin Chickles retired from Fidelity.
Fidelity® Emerging Asia Fund
Investment Summary (Unaudited)
Geographic Diversification (% of fund's net assets)
| As of October 31, 2017 |
| | India | 17.7% |
| | Cayman Islands | 17.3% |
| | China | 17.2% |
| | Korea (South) | 12.7% |
| | Taiwan | 10.3% |
| | Hong Kong | 7.6% |
| | Bermuda | 3.5% |
| | Indonesia | 2.3% |
| | Japan | 2.0% |
| | Other* | 9.4% |
* Includes Short-Term investments and Net Other Assets (Liabilities).
Percentages are based on country or territory of incorporation and are adjusted for the effect of futures contracts, if applicable.
| As of April 30, 2017 |
| | Cayman Islands | 17.2% |
| | India | 15.4% |
| | China | 13.9% |
| | Taiwan | 13.5% |
| | Korea (South) | 12.8% |
| | Hong Kong | 8.8% |
| | Bermuda | 3.9% |
| | Indonesia | 3.6% |
| | United States of America* | 3.4% |
| | Other | 7.5% |

* Includes Short-Term investments and Net Other Assets (Liabilities).
Percentages are based on country or territory of incorporation and are adjusted for the effect of futures contracts, if applicable.
Asset Allocation as of October 31, 2017
| | % of fund's net assets | % of fund's net assets 6 months ago |
| Stocks | 98.0 | 97.2 |
| Short-Term Investments and Net Other Assets (Liabilities) | 2.0 | 2.8 |
Top Ten Stocks as of October 31, 2017
| | % of fund's net assets | % of fund's net assets 6 months ago |
| Tencent Holdings Ltd. (Cayman Islands, Internet Software & Services) | 6.9 | 6.2 |
| Alibaba Group Holding Ltd. sponsored ADR (Cayman Islands, Internet Software & Services) | 6.0 | 4.2 |
| Taiwan Semiconductor Manufacturing Co. Ltd. (Taiwan, Semiconductors & Semiconductor Equipment) | 5.7 | 5.6 |
| Samsung Electronics Co. Ltd. (Korea (South), Technology Hardware, Storage & Peripherals) | 5.4 | 6.2 |
| AIA Group Ltd. (Hong Kong, Insurance) | 2.8 | 2.8 |
| Reliance Industries Ltd. (India, Oil, Gas & Consumable Fuels) | 2.2 | 1.6 |
| China Construction Bank Corp. (H Shares) (China, Banks) | 2.0 | 2.2 |
| Housing Development Finance Corp. Ltd. (India, Thrifts & Mortgage Finance) | 1.7 | 1.7 |
| Kweichow Moutai Co. Ltd. (A Shares) (China, Beverages) | 1.6 | 1.2 |
| Jiangsu Hengrui Medicine Co. Ltd. (A Shares) (China, Pharmaceuticals) | 1.5 | 1.3 |
| | 35.8 | |
Top Market Sectors as of October 31, 2017
| | % of fund's net assets | % of fund's net assets 6 months ago |
| Information Technology | 33.5 | 31.1 |
| Financials | 18.7 | 17.5 |
| Consumer Discretionary | 7.8 | 9.1 |
| Industrials | 6.9 | 7.1 |
| Consumer Staples | 6.0 | 6.9 |
| Health Care | 5.7 | 7.1 |
| Utilities | 4.8 | 4.3 |
| Energy | 4.8 | 4.1 |
| Real Estate | 3.9 | 4.6 |
| Materials | 3.2 | 2.5 |
Fidelity® Emerging Asia Fund
Investments October 31, 2017
Showing Percentage of Net Assets
| Common Stocks - 97.0% | | | |
| | | Shares | Value |
| Australia - 1.4% | | | |
| Blue Sky Alternative Investments Ltd. | | 734,211 | $7,911,952 |
| Netwealth Group Ltd. (a) | | 370,247 | 1,048,464 |
| SpeedCast International Ltd. | | 1,458,110 | 4,642,412 |
| Woodside Petroleum Ltd. | | 205,177 | 4,825,600 |
|
| TOTAL AUSTRALIA | | | 18,428,428 |
|
| Bermuda - 3.5% | | | |
| Cheung Kong Infrastructure Holdings Ltd. | | 1,364,000 | 11,871,664 |
| Hongkong Land Holdings Ltd. | | 1,151,000 | 8,344,750 |
| Man Wah Holdings Ltd. | | 8,595,200 | 7,756,327 |
| Tai Cheung Holdings Ltd. | | 3,875,000 | 4,470,351 |
| Vtech Holdings Ltd. | | 923,100 | 13,122,233 |
|
| TOTAL BERMUDA | | | 45,565,325 |
|
| Cayman Islands - 17.3% | | | |
| Alibaba Group Holding Ltd. sponsored ADR (b) | | 418,100 | 77,302,509 |
| China Literature Ltd. | | 1,581 | 11,146 |
| Haitian International Holdings Ltd. | | 1,227,000 | 3,672,475 |
| International Housewares Retail Co. Ltd. | | 11,010,400 | 2,074,665 |
| JD.com, Inc. sponsored ADR (b) | | 347,900 | 13,053,208 |
| NetEase, Inc. ADR | | 43,900 | 12,376,288 |
| Silergy Corp. | | 373,000 | 8,057,038 |
| SITC International Holdings Co. Ltd. | | 6,685,000 | 6,443,869 |
| Tencent Holdings Ltd. | | 1,986,600 | 89,287,951 |
| Value Partners Group Ltd. (c) | | 5,584,000 | 5,532,894 |
| Xinyi Glass Holdings Ltd. | | 4,612,000 | 4,463,378 |
|
| TOTAL CAYMAN ISLANDS | | | 222,275,421 |
|
| China - 17.2% | | | |
| China Construction Bank Corp. (H Shares) | | 28,376,000 | 25,315,579 |
| China Pacific Insurance (Group) Co. Ltd. (H Shares) | | 2,003,800 | 9,875,934 |
| China Telecom Corp. Ltd. (H Shares) | | 12,404,000 | 6,216,787 |
| Gree Electric Appliances, Inc. of Zhuhai Class A | | 2,246,300 | 14,405,653 |
| Hangzhou Hikvision Digital Technology Co. Ltd. Class A | | 2,939,400 | 17,401,865 |
| Huaneng Renewables Corp. Ltd. (H Shares) | | 14,452,000 | 4,964,668 |
| Jiangsu Hengrui Medicine Co. Ltd. (A Shares) | | 1,927,537 | 19,531,314 |
| Jiangsu Yanghe Brewery Joint-Stock Co. Ltd. Class A | | 1,061,858 | 17,642,953 |
| Kweichow Moutai Co. Ltd. (A Shares) | | 220,081 | 20,500,182 |
| PICC Property & Casualty Co. Ltd. (H Shares) | | 3,921,120 | 7,770,466 |
| Qingdao Port International Co. Ltd. | | 8,501,000 | 6,004,116 |
| Shanghai International Airport Co. Ltd. (A Shares) | | 1,425,200 | 9,397,655 |
| Shenzhen Expressway Co. (H Shares) | | 6,500,000 | 6,648,807 |
| Shenzhen Inovance Technology Co. Ltd. Class A | | 1,642,614 | 7,640,065 |
| Suofeiya Home Collection Co. Ltd. Class A | | 1,437,861 | 8,430,088 |
| Tonghua Dongbao Pharmaceutical Co. Ltd. Class A | | 3,496,260 | 11,392,657 |
| Weifu High-Technology Co. Ltd. (B Shares) | | 1,333,439 | 3,136,438 |
| Yunnan Baiyao Group Co. Ltd. | | 1,060,405 | 16,755,770 |
| Zhengzhou Yutong Bus Co. Ltd. | | 2,018,700 | 7,740,241 |
|
| TOTAL CHINA | | | 220,771,238 |
|
| Hong Kong - 7.6% | | | |
| AIA Group Ltd. | | 4,845,200 | 36,456,692 |
| China Resources Beer Holdings Co. Ltd. | | 3,322,666 | 9,582,893 |
| CSPC Pharmaceutical Group Ltd. | | 8,466,000 | 14,715,174 |
| Dah Sing Banking Group Ltd. | | 3,038,000 | 6,721,342 |
| Power Assets Holdings Ltd. | | 1,228,000 | 10,640,757 |
| Sino Land Ltd. | | 3,122,000 | 5,378,481 |
| Techtronic Industries Co. Ltd. | | 2,406,000 | 14,109,583 |
|
| TOTAL HONG KONG | | | 97,604,922 |
|
| India - 17.7% | | | |
| Adani Ports & Special Economic Zone Ltd. | | 955,661 | 6,351,640 |
| Amara Raja Batteries Ltd. | | 500,360 | 5,406,206 |
| Asian Paints Ltd. | | 483,120 | 8,810,691 |
| Axis Bank Ltd. | | 1,747,101 | 14,115,767 |
| Bajaj Corp. Ltd. | | 511,162 | 3,675,235 |
| Bharat Petroleum Corp. Ltd. | | 1,267,543 | 10,602,337 |
| Bharti Infratel Ltd. | | 1,298,631 | 8,867,795 |
| CCL Products (India) Ltd. | | 967,862 | 4,795,962 |
| Gujarat Gas Ltd. | | 410,763 | 5,788,428 |
| Havells India Ltd. | | 913,651 | 6,840,036 |
| HCL Technologies Ltd. | | 317,882 | 4,201,443 |
| HDFC Bank Ltd. | | 595,746 | 16,675,084 |
| Housing Development Finance Corp. Ltd. | | 844,487 | 22,268,372 |
| Indian Oil Corp. Ltd. | | 1,139,633 | 7,313,012 |
| Indraprastha Gas Ltd. | | 583,050 | 14,273,694 |
| Oberoi Realty Ltd. | | 897,099 | 6,577,571 |
| Petronet LNG Ltd. | | 2,437,994 | 9,783,981 |
| Power Grid Corp. of India Ltd. | | 4,469,779 | 14,624,289 |
| Redington India Ltd. | | 533,540 | 1,299,448 |
| Reliance Industries Ltd. | | 1,953,426 | 28,384,260 |
| Sterlite Optical Technologies Ltd. | | 1,443,471 | 6,351,272 |
| Torrent Pharmaceuticals Ltd. | | 164,827 | 3,232,518 |
| UPL Ltd. | | 607,327 | 7,497,088 |
| Vakrangee Ltd. | | 896,909 | 7,788,910 |
| VST Industries Ltd. | | 57,366 | 2,790,158 |
|
| TOTAL INDIA | | | 228,315,197 |
|
| Indonesia - 2.3% | | | |
| PT Bank Central Asia Tbk | | 10,363,500 | 15,970,297 |
| PT Bank Rakyat Indonesia Tbk | | 11,812,600 | 13,587,212 |
|
| TOTAL INDONESIA | | | 29,557,509 |
|
| Israel - 0.2% | | | |
| Sarine Technologies Ltd. | | 3,165,100 | 2,263,937 |
| Japan - 2.0% | | | |
| Disco Corp. | | 54,100 | 12,536,418 |
| KDDI Corp. | | 139,900 | 3,727,305 |
| Nissan Chemical Industries Co. Ltd. | | 252,700 | 9,425,576 |
|
| TOTAL JAPAN | | | 25,689,299 |
|
| Korea (South) - 11.7% | | | |
| Coway Co. Ltd. | | 115,015 | 10,008,997 |
| Hanon Systems | | 391,716 | 4,554,471 |
| Hyundai Fire & Marine Insurance Co. Ltd. | | 145,877 | 5,916,806 |
| KB Financial Group, Inc. | | 252,657 | 13,236,699 |
| Korea Zinc Co. Ltd. | | 11,540 | 5,284,440 |
| LG Chemical Ltd. | | 28,818 | 10,399,935 |
| LG Household & Health Care Ltd. | | 9,297 | 9,786,841 |
| Loen Entertainment, Inc. | | 99,331 | 9,461,449 |
| LS Industrial Systems Ltd. | | 107,717 | 5,770,777 |
| Osstem Implant Co. Ltd. (b) | | 104,731 | 6,734,841 |
| Samsung Electronics Co. Ltd. | | 28,038 | 69,061,213 |
|
| TOTAL KOREA (SOUTH) | | | 150,216,469 |
|
| Malaysia - 0.2% | | | |
| Bursa Malaysia Bhd | | 885,900 | 2,091,243 |
| Multi-National - 1.0% | | | |
| HKT Trust/HKT Ltd. unit | | 11,003,300 | 13,441,363 |
| Philippines - 1.3% | | | |
| Ayala Land, Inc. | | 10,130,500 | 8,483,733 |
| Bank of the Philippine Islands (BPI) | | 4,068,590 | 7,729,339 |
|
| TOTAL PHILIPPINES | | | 16,213,072 |
|
| Singapore - 1.3% | | | |
| UOL Group Ltd. | | 1,376,700 | 9,130,194 |
| Wing Tai Holdings Ltd. | | 4,456,900 | 7,847,231 |
|
| TOTAL SINGAPORE | | | 16,977,425 |
|
| Taiwan - 10.3% | | | |
| CTCI Corp. | | 4,014,000 | 6,226,508 |
| E.SUN Financial Holdings Co. Ltd. | | 15,207,552 | 9,259,360 |
| Largan Precision Co. Ltd. | | 63,000 | 11,946,546 |
| Micro-Star International Co. Ltd. | | 2,708,000 | 6,604,221 |
| Nien Made Enterprise Co. Ltd. | | 714,000 | 7,438,981 |
| Taiwan Semiconductor Manufacturing Co. Ltd. | | 9,040,192 | 73,135,791 |
| United Microelectronics Corp. | | 17,072,000 | 8,817,233 |
| Voltronic Power Technology Corp. | | 519,000 | 9,781,406 |
|
| TOTAL TAIWAN | | | 133,210,046 |
|
| Thailand - 2.0% | | | |
| Bangkok Bank PCL (For. Reg.) | | 1,140,200 | 6,898,862 |
| Kasikornbank PCL (For. Reg.) | | 1,861,200 | 12,774,040 |
| Thai Beverage PCL | | 8,076,000 | 5,806,236 |
|
| TOTAL THAILAND | | | 25,479,138 |
|
| TOTAL COMMON STOCKS | | | |
| (Cost $893,258,581) | | | 1,248,100,032 |
|
| Nonconvertible Preferred Stocks - 1.0% | | | |
| Korea (South) - 1.0% | | | |
| Samsung Electronics Co. Ltd. | | | |
| (Cost $11,895,960) | | 6,689 | 13,400,853 |
|
| Money Market Funds - 2.2% | | | |
| Fidelity Cash Central Fund, 1.10% (d) | | 27,195,234 | 27,200,673 |
| Fidelity Securities Lending Cash Central Fund 1.11% (d)(e) | | 439,947 | 439,991 |
| TOTAL MONEY MARKET FUNDS | | | |
| (Cost $27,640,990) | | | 27,640,664 |
| TOTAL INVESTMENT IN SECURITIES - 100.2% | | | |
| (Cost $932,795,531) | | | 1,289,141,549 |
| NET OTHER ASSETS (LIABILITIES) - (0.2)% | | | (2,810,475) |
| NET ASSETS - 100% | | | $1,286,331,074 |
Categorizations in the Schedule of Investments are based on country or territory of incorporation.
Legend
(a) Security or a portion of the security purchased on a delayed delivery or when-issued basis.
(b) Non-income producing
(c) Security or a portion of the security is on loan at period end.
(d) Affiliated fund that is generally available only to investment companies and other accounts managed by Fidelity Investments. The rate quoted is the annualized seven-day yield of the fund at period end. A complete unaudited listing of the fund's holdings as of its most recent quarter end is available upon request. In addition, each Fidelity Central Fund's financial statements, which are not covered by the Fund's Report of Independent Registered Public Accounting Firm, are available on the SEC's website or upon request.
(e) Investment made with cash collateral received from securities on loan.
Affiliated Central Funds
Information regarding fiscal year to date income earned by the Fund from investments in Fidelity Central Funds is as follows:
| Fund | Income earned |
| Fidelity Cash Central Fund | $251,827 |
| Fidelity Securities Lending Cash Central Fund | 8,714 |
| Total | $260,541 |
Investment Valuation
The following is a summary of the inputs used, as of October 31, 2017, involving the Fund's assets and liabilities carried at fair value. The inputs or methodology used for valuing securities may not be an indication of the risk associated with investing in those securities. For more information on valuation inputs, and their aggregation into the levels used below, please refer to the Investment Valuation section in the accompanying Notes to Financial Statements.
| | Valuation Inputs at Reporting Date: |
| Description | Total | Level 1 | Level 2 | Level 3 |
| Investments in Securities: | | | | |
| Equities: | | | | |
| Consumer Discretionary | $98,904,384 | $98,893,238 | $11,146 | $-- |
| Consumer Staples | 74,580,460 | 74,580,460 | -- | -- |
| Energy | 60,909,190 | 60,909,190 | -- | -- |
| Financials | 241,156,404 | 210,196,157 | 30,960,247 | -- |
| Health Care | 72,362,274 | 72,362,274 | -- | -- |
| Industrials | 90,187,738 | 90,187,738 | -- | -- |
| Information Technology | 432,691,232 | 248,913,839 | 183,777,393 | -- |
| Materials | 41,417,730 | 31,992,154 | 9,425,576 | -- |
| Real Estate | 50,232,311 | 50,232,311 | -- | -- |
| Telecommunication Services | 36,895,662 | 33,168,357 | 3,727,305 | -- |
| Utilities | 62,163,500 | 62,163,500 | -- | -- |
| Money Market Funds | 27,640,664 | 27,640,664 | -- | -- |
| Total Investments in Securities: | $1,289,141,549 | $1,061,239,882 | $227,901,667 | $-- |
See accompanying notes which are an integral part of the financial statements.
Fidelity® Emerging Asia Fund
Financial Statements
Statement of Assets and Liabilities
| | | October 31, 2017 |
| Assets | | |
Investment in securities, at value (including securities loaned of $396,408) — See accompanying schedule:
Unaffiliated issuers (cost $905,154,541) | $1,261,500,885 | |
| Fidelity Central Funds (cost $27,640,990) | 27,640,664 | |
| Total Investment in Securities (cost $932,795,531) | | $1,289,141,549 |
| Foreign currency held at value (cost $481,039) | | 481,039 |
| Receivable for investments sold | | 2,387,994 |
| Receivable for fund shares sold | | 1,259,256 |
| Dividends receivable | | 566,585 |
| Distributions receivable from Fidelity Central Funds | | 30,631 |
| Prepaid expenses | | 2,550 |
| Other receivables | | 410,305 |
| Total assets | | 1,294,279,909 |
| Liabilities | | |
| Payable for investments purchased | | |
| Regular delivery | $1,066,512 | |
| Delayed delivery | 1,048,464 | |
| Payable for fund shares redeemed | 247,848 | |
| Accrued management fee | 841,809 | |
| Other affiliated payables | 225,445 | |
| Other payables and accrued expenses | 4,078,757 | |
| Collateral on securities loaned | 440,000 | |
| Total liabilities | | 7,948,835 |
| Net Assets | | $1,286,331,074 |
| Net Assets consist of: | | |
| Paid in capital | | $965,115,831 |
| Undistributed net investment income | | 10,490,159 |
| Accumulated undistributed net realized gain (loss) on investments and foreign currency transactions | | (41,575,578) |
| Net unrealized appreciation (depreciation) on investments and assets and liabilities in foreign currencies | | 352,300,662 |
| Net Assets, for 29,274,555 shares outstanding | | $1,286,331,074 |
| Net Asset Value, offering price and redemption price per share ($1,286,331,074 ÷ 29,274,555 shares) | | $43.94 |
See accompanying notes which are an integral part of the financial statements.
Statement of Operations
| | | Year ended October 31, 2017 |
| Investment Income | | |
| Dividends | | $23,725,586 |
| Interest | | 109 |
| Income from Fidelity Central Funds | | 260,541 |
| Income before foreign taxes withheld | | 23,986,236 |
| Less foreign taxes withheld | | (2,181,169) |
| Total income | | 21,805,067 |
| Expenses | | |
| Management fee | | |
| Basic fee | $7,007,247 | |
| Performance adjustment | 1,044,927 | |
| Transfer agent fees | 1,879,819 | |
| Accounting and security lending fees | 470,098 | |
| Custodian fees and expenses | 538,692 | |
| Independent trustees' fees and expenses | 3,983 | |
| Registration fees | 39,326 | |
| Audit | 114,242 | |
| Legal | 2,677 | |
| Miscellaneous | 8,146 | |
| Total expenses before reductions | 11,109,157 | |
| Expense reductions | (162,549) | 10,946,608 |
| Net investment income (loss) | | 10,858,459 |
| Realized and Unrealized Gain (Loss) | | |
| Net realized gain (loss) on: | | |
| Investment securities: | | |
| Unaffiliated issuers | 2,670,112 | |
| Fidelity Central Funds | (2,171) | |
| Foreign currency transactions | (39,417) | |
| Total net realized gain (loss) | | 2,628,524 |
| Change in net unrealized appreciation (depreciation) on: | | |
| Unaffiliated issuers (net of increase in deferred foreign taxes of $3,493,853) | 285,477,861 | |
| Fidelity Central Funds | (1,486) | |
| Assets and liabilities in foreign currencies | 22,167 | |
| Total change in net unrealized appreciation (depreciation) | | 285,498,542 |
| Net gain (loss) | | 288,127,066 |
| Net increase (decrease) in net assets resulting from operations | | $298,985,525 |
See accompanying notes which are an integral part of the financial statements.
Statement of Changes in Net Assets
| | Year ended October 31, 2017 | Year ended October 31, 2016 |
| Increase (Decrease) in Net Assets | | |
| Operations | | |
| Net investment income (loss) | $10,858,459 | $11,443,160 |
| Net realized gain (loss) | 2,628,524 | (42,125,134) |
| Change in net unrealized appreciation (depreciation) | 285,498,542 | 88,111,910 |
| Net increase (decrease) in net assets resulting from operations | 298,985,525 | 57,429,936 |
| Distributions to shareholders from net investment income | (9,245,057) | (4,222,099) |
| Distributions to shareholders from net realized gain | (1,418,120) | – |
| Total distributions | (10,663,177) | (4,222,099) |
| Share transactions | | |
| Proceeds from sales of shares | 240,731,562 | 45,716,202 |
| Reinvestment of distributions | 9,645,118 | 3,878,736 |
| Cost of shares redeemed | (174,712,854) | (188,738,895) |
| Net increase (decrease) in net assets resulting from share transactions | 75,663,826 | (139,143,957) |
| Redemption fees | 79,537 | 23,028 |
| Total increase (decrease) in net assets | 364,065,711 | (85,913,092) |
| Net Assets | | |
| Beginning of period | 922,265,363 | 1,008,178,455 |
| End of period | $1,286,331,074 | $922,265,363 |
| Other Information | | |
| Undistributed net investment income end of period | $10,490,159 | $8,874,495 |
| Shares | | |
| Sold | 6,226,419 | 1,462,017 |
| Issued in reinvestment of distributions | 301,034 | 126,673 |
| Redeemed | (4,887,212) | (6,266,447) |
| Net increase (decrease) | 1,640,241 | (4,677,757) |
See accompanying notes which are an integral part of the financial statements.
Financial Highlights
Fidelity Emerging Asia Fund
| Years ended October 31, | 2017 | 2016 | 2015 | 2014 | 2013 |
| Selected Per–Share Data | | | | | |
| Net asset value, beginning of period | $33.37 | $31.20 | $33.03 | $30.91 | $28.57 |
| Income from Investment Operations | | | | | |
| Net investment income (loss)A | .40 | .39 | .42 | .43 | .39 |
| Net realized and unrealized gain (loss) | 10.56 | 1.91 | (1.96) | 2.08 | 2.49 |
| Total from investment operations | 10.96 | 2.30 | (1.54) | 2.51 | 2.88 |
| Distributions from net investment income | (.34) | (.13) | (.29) | (.39) | (.46) |
| Distributions from net realized gain | (.05) | – | – | – | (.08) |
| Total distributions | (.39) | (.13) | (.29) | (.39) | (.54) |
| Redemption fees added to paid in capitalA,B | – | – | – | – | – |
| Net asset value, end of period | $43.94 | $33.37 | $31.20 | $33.03 | $30.91 |
| Total ReturnC | 33.28% | 7.42% | (4.69)% | 8.21% | 10.19% |
| Ratios to Average Net AssetsD,E | | | | | |
| Expenses before reductions | 1.10% | 1.16% | 1.09% | 1.04% | 1.08% |
| Expenses net of fee waivers, if any | 1.10% | 1.16% | 1.09% | 1.04% | 1.08% |
| Expenses net of all reductions | 1.08% | 1.16% | 1.09% | 1.04% | 1.05% |
| Net investment income (loss) | 1.07% | 1.25% | 1.26% | 1.36% | 1.31% |
| Supplemental Data | | | | | |
| Net assets, end of period (000 omitted) | $1,286,331 | $922,265 | $1,008,178 | $1,111,277 | $1,172,348 |
| Portfolio turnover rateF | 40% | 77% | 68% | 90% | 97% |
A Calculated based on average shares outstanding during the period.
B Amount represents less than $.005 per share.
C Total returns would have been lower if certain expenses had not been reduced during the applicable periods shown.
D Fees and expenses of any underlying Fidelity Central Funds are not included in the Fund's expense ratio. The Fund indirectly bears its proportionate share of the expenses of any underlying Fidelity Central Funds.
E Expense ratios reflect operating expenses of the Fund. Expenses before reductions do not reflect amounts reimbursed by the investment adviser or reductions from brokerage service arrangements or reductions from other expense offset arrangements and do not represent the amount paid by the Fund during periods when reimbursements or reductions occur. Expenses net of fee waivers reflect expenses after reimbursement by the investment adviser but prior to reductions from brokerage service arrangements or other expense offset arrangements. Expenses net of all reductions represent the net expenses paid by the Fund.
F Amount does not include the portfolio activity of any underlying Fidelity Central Funds.
See accompanying notes which are an integral part of the financial statements.
Notes to Financial Statements
For the period ended October 31, 2017
1. Organization.
Fidelity Emerging Asia Fund (the Fund) is a fund of Fidelity Investment Trust (the Trust) and is authorized to issue an unlimited number of shares. Share transactions on the Statement of Changes in Net Assets may contain exchanges between affiliated funds. The Trust is registered under the Investment Company Act of 1940, as amended (the 1940 Act), as an open-end management investment company organized as a Massachusetts business trust. The Fund's investments in emerging markets can be subject to social, economic, regulatory, and political uncertainties and can be extremely volatile.
2. Investments in Fidelity Central Funds.
The Fund invests in Fidelity Central Funds, which are open-end investment companies generally available only to other investment companies and accounts managed by the investment adviser and its affiliates. The Fund's Schedule of Investments lists each of the Fidelity Central Funds held as of period end, if any, as an investment of the Fund, but does not include the underlying holdings of each Fidelity Central Fund. As an Investing Fund, the Fund indirectly bears its proportionate share of the expenses of the underlying Fidelity Central Funds.
The Money Market Central Funds seek preservation of capital and current income and are managed by Fidelity Investments Money Management, Inc. (FIMM), an affiliate of the investment adviser. Annualized expenses of the Money Market Central Funds as of their most recent shareholder report date are less than .005%.
A complete unaudited list of holdings for each Fidelity Central Fund is available upon request or at the Securities and Exchange Commission (the SEC) website at www.sec.gov. In addition, the financial statements of the Fidelity Central Funds, which are not covered by the Fund's Report of Independent Registered Public Accounting Firm, are available on the SEC website or upon request.
3. Significant Accounting Policies.
The Fund is an investment company and applies the accounting and reporting guidance of the Financial Accounting Standards Board (FASB) Accounting Standards Codification Topic 946 Financial Services – Investments Companies. The financial statements have been prepared in conformity with accounting principles generally accepted in the United States of America (GAAP), which require management to make certain estimates and assumptions at the date of the financial statements. Actual results could differ from those estimates. Subsequent events, if any, through the date that the financial statements were issued have been evaluated in the preparation of the financial statements. The following summarizes the significant accounting policies of the Fund:
Investment Valuation. Investments are valued as of 4:00 p.m. Eastern time on the last calendar day of the period. The Board of Trustees (the Board) has delegated the day to day responsibility for the valuation of the Fund's investments to the Fair Value Committee (the Committee) established by the Fund's investment adviser. In accordance with valuation policies and procedures approved by the Board, the Fund attempts to obtain prices from one or more third party pricing vendors or brokers to value its investments. When current market prices, quotations or currency exchange rates are not readily available or reliable, investments will be fair valued in good faith by the Committee, in accordance with procedures adopted by the Board. Factors used in determining fair value vary by investment type and may include market or investment specific events. The frequency with which these procedures are used cannot be predicted and they may be utilized to a significant extent. The Committee oversees the Fund's valuation policies and procedures and reports to the Board on the Committee's activities and fair value determinations. The Board monitors the appropriateness of the procedures used in valuing the Fund's investments and ratifies the fair value determinations of the Committee.
The Fund categorizes the inputs to valuation techniques used to value its investments into a disclosure hierarchy consisting of three levels as shown below:
- Level 1 – quoted prices in active markets for identical investments
- Level 2 – other significant observable inputs (including quoted prices for similar investments, interest rates, prepayment speeds, etc.)
- Level 3 – unobservable inputs (including the Fund's own assumptions based on the best information available)
Valuation techniques used to value the Fund's investments by major category are as follows:
Equity securities, including restricted securities, for which market quotations are readily available, are valued at the last reported sale price or official closing price as reported by a third party pricing vendor on the primary market or exchange on which they are traded and are categorized as Level 1 in the hierarchy. In the event there were no sales during the day or closing prices are not available, securities are valued at the last quoted bid price or may be valued using the last available price and are generally categorized as Level 2 in the hierarchy. For foreign equity securities, when market or security specific events arise, comparisons to the valuation of American Depositary Receipts (ADRs), futures contracts, Exchange-Traded Funds (ETFs) and certain indexes as well as quoted prices for similar securities may be used and would be categorized as Level 2 in the hierarchy. Utilizing these techniques may result in transfers between Level 1 and Level 2. For equity securities, including restricted securities, where observable inputs are limited, assumptions about market activity and risk are used and these securities may be categorized as Level 3 in the hierarchy.
Investments in open-end mutual funds, including the Fidelity Central Funds, are valued at their closing net asset value (NAV) each business day and are categorized as Level 1 in the hierarchy.
Changes in valuation techniques may result in transfers in or out of an assigned level within the disclosure hierarchy. The aggregate value of investments by input level as of October 31, 2017 is included at the end of the Fund's Schedule of Investments.
Foreign Currency. The Fund may use foreign currency contracts to facilitate transactions in foreign-denominated securities. Gains and losses from these transactions may arise from changes in the value of the foreign currency or if the counterparties do not perform under the contracts' terms.
Foreign-denominated assets, including investment securities, and liabilities are translated into U.S. dollars at the exchange rates at period end. Purchases and sales of investment securities, income and dividends received and expenses denominated in foreign currencies are translated into U.S. dollars at the exchange rate in effect on the transaction date.
The effects of exchange rate fluctuations on investments are included with the net realized and unrealized gain (loss) on investment securities. Other foreign currency transactions resulting in realized and unrealized gain (loss) are disclosed separately.
Investment Transactions and Income. For financial reporting purposes, the Fund's investment holdings and NAV include trades executed through the end of the last business day of the period. The NAV per share for processing shareholder transactions is calculated as of the close of business of the New York Stock Exchange (NYSE), normally 4:00 p.m. Eastern time and includes trades executed through the end of the prior business day. Gains and losses on securities sold are determined on the basis of identified cost. Dividend income is recorded on the ex-dividend date, except for certain dividends from foreign securities where the ex-dividend date may have passed, which are recorded as soon as the Fund is informed of the ex-dividend date. Non-cash dividends included in dividend income, if any, are recorded at the fair market value of the securities received. Income and capital gain distributions from Fidelity Central Funds, if any, are recorded on the ex-dividend date. Certain distributions received by the Fund represent a return of capital or capital gain. The Fund determines the components of these distributions subsequent to the ex-dividend date, based upon receipt of tax filings or other correspondence relating to the underlying investment. These distributions are recorded as a reduction of cost of investments and/or as a realized gain. Interest income is accrued as earned and includes coupon interest and amortization of premium and accretion of discount on debt securities as applicable. Investment income is recorded net of foreign taxes withheld where recovery of such taxes is uncertain.
Expenses. Expenses directly attributable to a fund are charged to that fund. Expenses attributable to more than one fund are allocated among the respective funds on the basis of relative net assets or other appropriate methods. Expense estimates are accrued in the period to which they relate and adjustments are made when actual amounts are known.
Income Tax Information and Distributions to Shareholders. Each year, the Fund intends to qualify as a regulated investment company under Subchapter M of the Internal Revenue Code, including distributing substantially all of its taxable income and realized gains. As a result, no provision for U.S. Federal income taxes is required. As of October 31, 2017, the Fund did not have any unrecognized tax benefits in the financial statements; nor is the Fund aware of any tax positions for which it is reasonably possible that the total amounts of unrecognized tax benefits will significantly change in the next twelve months. The Fund files a U.S. federal tax return, in addition to state and local tax returns as required. The Fund's federal income tax returns are subject to examination by the Internal Revenue Service (IRS) for a period of three fiscal years after they are filed. State and local tax returns may be subject to examination for an additional fiscal year depending on the jurisdiction. Foreign taxes are provided for based on the Fund's understanding of the tax rules and rates that exist in the foreign markets in which it invests. The Fund is subject to a tax imposed on capital gains by certain countries in which it invests. An estimated deferred tax liability for net unrealized appreciation on the applicable securities is included in Other payables and accrued expenses on the Statement of Assets & Liabilities.
Distributions are declared and recorded on the ex-dividend date. Income and capital gain distributions are determined in accordance with income tax regulations, which may differ from GAAP.
Capital accounts within the financial statements are adjusted for permanent book-tax differences. These adjustments have no impact on net assets or the results of operations. Capital accounts are not adjusted for temporary book-tax differences which will reverse in a subsequent period.
Book-tax differences are primarily due to foreign currency transactions, certain foreign taxes, passive foreign investment companies (PFIC), deferred trustees compensation, capital loss carryforwards, expiring capital loss carryforwards and losses deferred due to wash sales.
As of period end, the cost and unrealized appreciation (depreciation) in securities, and derivatives if applicable, for federal income tax purposes were as follows:
| Gross unrealized appreciation | $370,777,213 |
| Gross unrealized depreciation | (15,432,640) |
| Net unrealized appreciation (depreciation) | $355,344,573 |
| Tax Cost | $933,796,976 |
The tax-based components of distributable earnings as of period end were as follows:
| Undistributed ordinary income | $11,101,267 |
| Capital loss carryforward | $(41,186,911) |
| Net unrealized appreciation (depreciation) on securities and other investments | $355,174,668 |
Capital loss carryforwards are only available to offset future capital gains of the Fund to the extent provided by regulations and may be limited. Under the Regulated Investment Company Modernization Act of 2010 (the Act), the Fund is permitted to carry forward capital losses incurred in taxable years beginning after December 22, 2010 for an unlimited period and such capital losses are required to be used prior to any losses that expire. The capital loss carryforward information presented below, including any applicable limitation, is estimated as of fiscal period end and is subject to adjustment.
| No expiration | |
| Short-term | $(20,330,977) |
| Long-term | (20,855,934) |
| Total capital loss carryforward | $(41,186,911) |
The tax character of distributions paid was as follows:
| | October 31, 2017 | October 31, 2016 |
| Ordinary Income | $10,663,177 | $ 4,222,099 |
Short-Term Trading (Redemption) Fees. Shares held by investors in the Fund less than 90 days may have been subject to a redemption fee equal to 1.50% of the NAV of shares redeemed. All redemption fees, which reduce the proceeds of the shareholder redemption, are retained by the Fund and accounted for as an addition to paid in capital. In November 2017, the Board of Trustees approved the elimination of these redemption fees effective December 18, 2017.
Delayed Delivery Transactions and When-Issued Securities. During the period, the transacted in securities on a delayed delivery or when-issued basis. Payment and delivery may take place after the customary settlement period for that security. The price of the underlying securities and the date when the securities will be delivered and paid for are fixed at the time the transaction is negotiated. The securities purchased on a delayed delivery or when-issued basis are identified as such in the Fund's Schedule of Investments. With respect to purchase commitments, the Fund identifies securities as segregated in its records with a value at least equal to the amount of the commitment. Losses may arise due to changes in the value of the underlying securities or if the counterparty does not perform under the contract's terms, or if the issuer does not issue the securities due to political, economic, or other factors.
4. Purchases and Sales of Investments.
Purchases and sales of securities, other than short-term securities, aggregated $484,929,434 and $389,348,839, respectively.
5. Fees and Other Transactions with Affiliates.
Management Fee. Fidelity Management & Research Company (the investment adviser) and its affiliates provide the Fund with investment management related services for which the Fund pays a monthly management fee. The management fee is the sum of an individual fund fee rate that is based on an annual rate of .45% of the Fund's average net assets and an annualized group fee rate that averaged .25% during the period. The group fee rate is based upon the average net assets of all the mutual funds advised by the investment adviser, including any mutual funds previously advised by the investment adviser that are currently advised by Fidelity SelectCo, LLC, an affiliate of the investment adviser. The group fee rate decreases as assets under management increase and increases as assets under management decrease. In addition, the management fee is subject to a performance adjustment (up to a maximum of +/- .20% of the Fund's average net assets over a 36 month performance period). The upward or downward adjustment to the management fee is based on the Fund's relative investment performance as compared to its benchmark index, the MSCI All Country Asia ex Japan Index, over the same 36 month performance period. For the reporting period, the total annual management fee rate, including the performance adjustment, was .80% of the Fund's average net assets. The performance adjustment included in the management fee rate may be higher or lower than the maximum performance adjustment rate due to the difference between the average net assets for the reporting and performance periods.
Transfer Agent Fees. Fidelity Investments Institutional Operations Company, Inc. (FIIOC), an affiliate of the investment adviser, is the Fund's transfer, dividend disbursing and shareholder servicing agent. FIIOC receives account fees and asset-based fees that vary according to account size and type of account. FIIOC pays for typesetting, printing and mailing of shareholder reports, except proxy statements. For the period, the transfer agent fees were equivalent to an annual rate of .19% of average net assets.
Accounting and Security Lending Fees. Fidelity Service Company, Inc. (FSC), an affiliate of the investment adviser, maintains the Fund's accounting records. The accounting fee is based on the level of average net assets for each month. Under a separate contract, FSC administers the security lending program. The security lending fee is based on the number and duration of lending transactions.
Brokerage Commissions. The Fund placed a portion of its portfolio transactions with brokerage firms which are affiliates of the investment adviser. Brokerage commissions are included in net realized gain (loss) and change in net unrealized appreciation (depreciation) in the Statement of Operations. The commissions paid to these affiliated firms were $673 for the period.
Interfund Trades. The Fund may purchase from or sell securities to other Fidelity Funds under procedures adopted by the Board. The procedures have been designed to ensure these interfund trades are executed in accordance with Rule 17a-7 of the 1940 Act. Interfund trades are included within the respective purchases and sales amounts shown in the Purchases and Sales of Investments note.
6. Committed Line of Credit.
The Fund participates with other funds managed by the investment adviser or an affiliate in a $4.25 billion credit facility (the "line of credit") to be utilized for temporary or emergency purposes to fund shareholder redemptions or for other short-term liquidity purposes. The Fund has agreed to pay commitment fees on its pro-rata portion of the line of credit, which amounted to $3,111 and is reflected in Miscellaneous expenses on the Statement of Operations. During the period, the Fund did not borrow on this line of credit.
7. Security Lending.
The Fund lends portfolio securities through a lending agent from time to time in order to earn additional income. For equity securities, a lending agent is used and may loan securities to certain qualified borrowers, including Fidelity Capital Markets (FCM), a broker-dealer affiliated with the Fund. On the settlement date of the loan, the Fund receives collateral (in the form of U.S. Treasury obligations, letters of credit and/or cash) against the loaned securities and maintains collateral in an amount not less than 100% of the market value of the loaned securities during the period of the loan. The market value of the loaned securities is determined at the close of business of the Fund and any additional required collateral is delivered to the Fund on the next business day. The Fund or borrower may terminate the loan at any time, and if the borrower defaults on its obligation to return the securities loaned because of insolvency or other reasons, the Fund may apply collateral received from the borrower against the obligation. The Fund may experience delays and costs in recovering the securities loaned. Any cash collateral received is invested in the Fidelity Securities Lending Cash Central Fund. The value of loaned securities and cash collateral at period end are disclosed on the Fund's Statement of Assets and Liabilities. Security lending income represents the income earned on investing cash collateral, less rebates paid to borrowers and any lending agent fees associated with the loan, plus any premium payments received for lending certain types of securities. Security lending income is presented in the Statement of Operations as a component of income from Fidelity Central Funds. Total security lending income during the period amounted to $8,714. During the period, there were no securities loaned to FCM.
8. Expense Reductions.
Commissions paid to certain brokers with whom the investment adviser, or its affiliates, places trades on behalf of the Fund include an amount in addition to trade execution, which may be rebated back to the Fund to offset certain expenses. This amount totaled $154,541 for the period. In addition, through arrangements with the Fund's custodian, credits realized as a result of certain uninvested cash balances were used to reduce the Fund's expenses. During the period, these credits reduced the Fund's custody expenses by $285.
In addition, during the period the investment adviser reimbursed and/or waived a portion of operating expenses in the amount of $7,723.
9. Other.
The Fund's organizational documents provide former and current trustees and officers with a limited indemnification against liabilities arising in connection with the performance of their duties to the Fund. In the normal course of business, the Fund may also enter into contracts that provide general indemnifications. The Fund's maximum exposure under these arrangements is unknown as this would be dependent on future claims that may be made against the Fund. The risk of material loss from such claims is considered remote.
Fidelity® Emerging Markets Fund
Performance: The Bottom Line
Average annual total return reflects the change in the value of an investment, assuming reinvestment of distributions from dividend income and capital gains (the profits earned upon the sale of securities that have grown in value, if any) and assuming a constant rate of performance each year. The hypothetical investment and the average annual total returns do not reflect the deduction of taxes that a shareholder would pay on fund distributions or the redemption of fund shares. During periods of reimbursement by Fidelity, a fund’s total return will be greater than it would be had the reimbursement not occurred. How a fund did yesterday is no guarantee of how it will do tomorrow.
Average Annual Total Returns
| For the periods ended October 31, 2017 | Past 1 year | Past 5 years | Past 10 years |
| Fidelity® Emerging Markets Fund | 30.21% | 7.91% | (0.43)% |
$10,000 Over 10 Years
Let's say hypothetically that $10,000 was invested in Fidelity® Emerging Markets Fund, a class of the fund, on October 31, 2007.
The chart shows how the value of your investment would have changed, and also shows how the MSCI Emerging Markets Index performed over the same period.
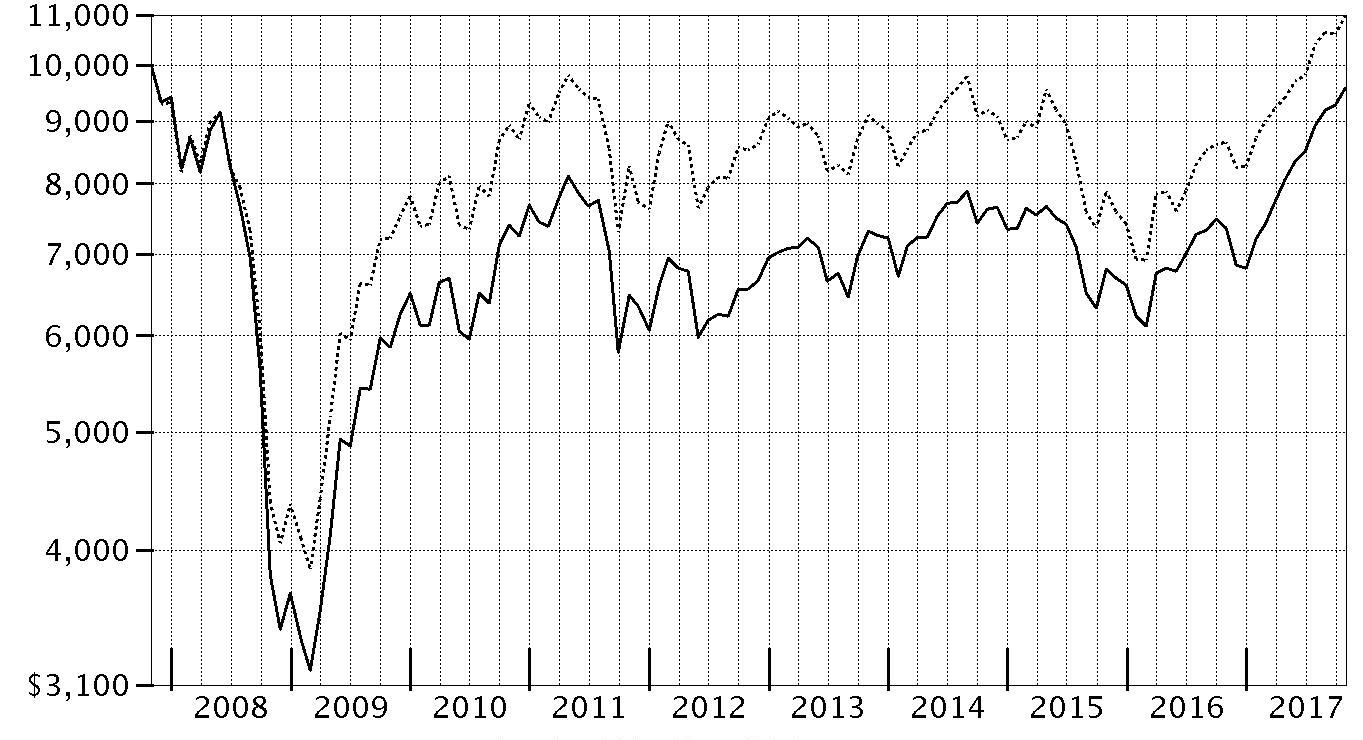
| Period Ending Values |
| $9,574 | Fidelity® Emerging Markets Fund |
| $10,970 | MSCI Emerging Markets Index |
Fidelity® Emerging Markets Fund
Management's Discussion of Fund Performance
Market Recap: The MSCI ACWI (All Country World Index) ex USA Index returned 23.85% for the 12 months ending October 31, 2017, helped partly by a generally weak U.S. dollar. Some favorable election results in continental Europe (+30%) suggested ebbing political uncertainty and near-term risk there, but the U.K. (+20%) faced more-mixed conditions ahead of its expected exit from the European Union. Despite central-bank easing – and pressured recently by yen strength – Japan (+18%) lagged the rest of the Asia-Pacific group (+22%). Commodity-price volatility slowed Canada (+17%), but the emerging-markets group (+26%) sped ahead. Sector-wise, information technology (+47%) was driven by a surge among several Chinese internet-related names. Financials (+27%) rode rising interest rates that, at the same time, weighed on real estate (+17%), utilities (+16%), consumer staples (+14%) and telecommunication services (+9%) – so-called “bond proxy” sectors. Materials (+28%) and industrials (+27%) responded to demand from China and price gains for certain commodities. In the energy sector (+20%), oil prices lost ground in the spring before rebounding through October 31 to end well above where they started 12 months ago. Lastly, health care (+14%) was hurt by early-period turmoil around drug pricing and health care legislation.
Comments from Portfolio Manager Sammy Simnegar: For the year, the fund’s share classes gained roughly 30%, topping the 26.91% advance of the benchmark MSCI Emerging Markets Index. Versus the benchmark, stock picking in the consumer discretionary sector contributed most to fund performance; an underweighting in telecommunication services and positioning in financials also helped. Overall, active management added value in nine of 11 market sectors this period. Geographically, China, Netherlands, Hong Kong, India and South Africa all contributed. At the stock level, avoiding two weak-performing, state-owned benchmark components – wireless-services provider China Mobile and Brazil-based energy giant Petroleo Brasileiro – bolstered relative performance. Out-of-benchmark positions in Brazil-based for-profit educator Estacio Participacoes and China’s Hangzhou Hikvision Digital Technology, the world’s largest manufacturer of security cameras, further lifted relative results. Conversely, materials and real estate detracted from relative performance, as did a small cash position. Among countries, positioning in Mexico and South Korea held back results. Avoiding the strong-performing shares of South Korea-based index name SK Hynix made this stock our largest relative detractor. Untimely ownership of strong-performing index name JD.com, a China-based e-tailer, further worked against us.
The views expressed above reflect those of the portfolio manager(s) only through the end of the period as stated on the cover of this report and do not necessarily represent the views of Fidelity or any other person in the Fidelity organization. Any such views are subject to change at any time based upon market or other conditions and Fidelity disclaims any responsibility to update such views. These views may not be relied on as investment advice and, because investment decisions for a Fidelity fund are based on numerous factors, may not be relied on as an indication of trading intent on behalf of any Fidelity fund.
Fidelity® Emerging Markets Fund
Investment Summary (Unaudited)
Geographic Diversification (% of fund's net assets)
| As of October 31, 2017 |
| | Cayman Islands | 17.2% |
| | India | 13.8% |
| | United States of America* | 7.9% |
| | China | 7.7% |
| | South Africa | 6.0% |
| | Korea (South) | 5.8% |
| | Brazil | 5.6% |
| | Taiwan | 5.5% |
| | Mexico | 4.7% |
| | Other | 25.8% |

* Includes Short-Term investments and Net Other Assets (Liabilities).
Percentages are based on country or territory of incorporation and are adjusted for the effect of futures contracts, if applicable.
| As of April 30, 2017 |
| | India | 11.6% |
| | Cayman Islands | 10.9% |
| | United States of America* | 9.7% |
| | Brazil | 9.7% |
| | Korea (South) | 8.1% |
| | South Africa | 6.9% |
| | Mexico | 6.4% |
| | Taiwan | 5.4% |
| | China | 5.3% |
| | Other | 26.0% |

* Includes Short-Term investments and Net Other Assets (Liabilities).
Percentages are based on country or territory of incorporation and are adjusted for the effect of futures contracts, if applicable.
Asset Allocation as of October 31, 2017
| | % of fund's net assets | % of fund's net assets 6 months ago |
| Stocks | 97.9 | 98.0 |
| Short-Term Investments and Net Other Assets (Liabilities) | 2.1 | 2.0 |
Top Ten Stocks as of October 31, 2017
| | % of fund's net assets | % of fund's net assets 6 months ago |
| Samsung Electronics Co. Ltd. (Korea (South), Technology Hardware, Storage & Peripherals) | 5.8 | 5.4 |
| Tencent Holdings Ltd. (Cayman Islands, Internet Software & Services) | 5.3 | 4.5 |
| Alibaba Group Holding Ltd. sponsored ADR (Cayman Islands, Internet Software & Services) | 4.5 | 3.4 |
| Taiwan Semiconductor Manufacturing Co. Ltd. (Taiwan, Semiconductors & Semiconductor Equipment) | 4.4 | 4.0 |
| Naspers Ltd. Class N (South Africa, Media) | 2.5 | 2.3 |
| Baidu.com, Inc. sponsored ADR (Cayman Islands, Internet Software & Services) | 1.8 | 0.0 |
| Ping An Insurance (Group) Co. of China Ltd. (H Shares) (China, Insurance) | 1.4 | 0.0 |
| Reliance Industries Ltd. (India, Oil, Gas & Consumable Fuels) | 1.3 | 1.1 |
| Itau Unibanco Holding SA (Brazil, Banks) | 1.2 | 1.4 |
| Housing Development Finance Corp. Ltd. (India, Thrifts & Mortgage Finance) | 1.2 | 1.4 |
| | 29.4 | |
Top Market Sectors as of October 31, 2017
| | % of fund's net assets | % of fund's net assets 6 months ago |
| Information Technology | 30.6 | 27.5 |
| Financials | 17.7 | 16.3 |
| Consumer Discretionary | 16.2 | 12.8 |
| Industrials | 7.5 | 7.5 |
| Consumer Staples | 7.4 | 12.1 |
| Materials | 6.1 | 9.6 |
| Health Care | 2.8 | 5.8 |
| Utilities | 2.5 | 1.6 |
| Energy | 2.4 | 2.4 |
| Telecommunication Services | 2.4 | 1.2 |
Percentages shown as 0.0% may reflect amounts less than 0.05%.
Fidelity® Emerging Markets Fund
Investments October 31, 2017
Showing Percentage of Net Assets
| Common Stocks - 96.7% | | | |
| | | Shares | Value |
| Argentina - 1.5% | | | |
| Banco Macro SA sponsored ADR | | 185,649 | $23,376,922 |
| IRSA Propiedades Comerciales SA sponsored ADR | | 418,400 | 23,430,400 |
| Telecom Argentina SA Class B sponsored ADR (a) | | 735,853 | 23,996,166 |
|
| TOTAL ARGENTINA | | | 70,803,488 |
|
| Australia - 0.5% | | | |
| Amcor Ltd. | | 1,955,680 | 23,708,990 |
| Bermuda - 0.8% | | | |
| Credicorp Ltd. (United States) | | 175,732 | 36,805,310 |
| Brazil - 4.4% | | | |
| BM&F BOVESPA SA | | 5,016,900 | 36,653,291 |
| BTG Pactual Participations Ltd. unit | | 3,712,200 | 24,976,469 |
| Equatorial Energia SA | | 1,348,500 | 25,145,508 |
| Estacio Participacoes SA | | 2,637,600 | 23,648,338 |
| IRB Brasil Resseguros SA | | 2,456,100 | 24,633,828 |
| Kroton Educacional SA | | 5,045,460 | 27,746,714 |
| Qualicorp SA | | 2,319,900 | 24,820,866 |
| Smiles Fidelidade SA | | 932,500 | 24,372,191 |
|
| TOTAL BRAZIL | | | 211,997,205 |
|
| Cayman Islands - 17.2% | | | |
| 58.com, Inc. ADR (a) | | 482,700 | 32,422,959 |
| Alibaba Group Holding Ltd. sponsored ADR (a) | | 1,181,200 | 218,392,068 |
| Baidu.com, Inc. sponsored ADR (a) | | 347,500 | 84,769,150 |
| China Literature Ltd. | | 4,577 | 32,268 |
| Ctrip.com International Ltd. ADR (a) | | 795,000 | 38,072,550 |
| JD.com, Inc. sponsored ADR (a) | | 1,215,100 | 45,590,552 |
| Melco Crown Entertainment Ltd. sponsored ADR | | 998,700 | 25,247,136 |
| NetEase, Inc. ADR | | 160,400 | 45,219,968 |
| New Oriental Education & Technology Group, Inc. sponsored ADR | | 406,083 | 33,802,349 |
| Sands China Ltd. | | 4,823,200 | 22,720,614 |
| Shenzhou International Group Holdings Ltd. | | 3,426,000 | 29,247,520 |
| Tencent Holdings Ltd. | | 5,749,100 | 258,393,918 |
|
| TOTAL CAYMAN ISLANDS | | | 833,911,052 |
|
| China - 7.7% | | | |
| Gree Electric Appliances, Inc. of Zhuhai Class A | | 3,830,067 | 24,562,443 |
| Hangzhou Hikvision Digital Technology Co. Ltd. Class A | | 4,786,000 | 28,334,124 |
| Hangzhou Robam Appliances Co. Ltd. Class A | | 3,749,956 | 26,264,217 |
| Inner Mongoli Yili Industries Co. Ltd. (A Shares) | | 5,520,508 | 24,586,808 |
| Jiangsu Yanghe Brewery Joint-Stock Co. Ltd. Class A | | 1,431,860 | 23,790,599 |
| Kweichow Moutai Co. Ltd. (A Shares) | | 263,831 | 24,575,423 |
| Midea Group Co. Ltd. Class A | | 3,458,500 | 26,584,199 |
| Ping An Insurance (Group) Co. of China Ltd. (H Shares) | | 7,726,500 | 67,842,342 |
| Shanghai International Airport Co. Ltd. (A Shares) | | 4,079,400 | 26,899,237 |
| Shenzhen Inovance Technology Co. Ltd. Class A | | 5,478,000 | 25,479,070 |
| Tonghua Dongbao Pharmaceutical Co. Ltd. Class A | | 7,135,700 | 23,251,870 |
| Wuliangye Yibin Co. Ltd. Class A | | 2,747,800 | 27,590,233 |
| Yunnan Baiyao Group Co. Ltd. | | 1,585,097 | 25,046,582 |
|
| TOTAL CHINA | | | 374,807,147 |
|
| France - 2.1% | | | |
| Dassault Systemes SA | | 226,462 | 24,050,123 |
| Kering SA | | 58,875 | 26,986,444 |
| LVMH Moet Hennessy - Louis Vuitton SA | | 87,994 | 26,245,387 |
| Rubis | | 360,800 | 22,644,572 |
|
| TOTAL FRANCE | | | 99,926,526 |
|
| Germany - 0.4% | | | |
| adidas AG | | 97,984 | 21,805,809 |
| Greece - 0.4% | | | |
| Titan Cement Co. SA (Reg.) | | 849,800 | 20,510,511 |
| Hong Kong - 2.2% | | | |
| AIA Group Ltd. | | 3,009,600 | 22,645,105 |
| CSPC Pharmaceutical Group Ltd. | | 18,372,000 | 31,933,284 |
| Guangdong Investment Ltd. | | 18,247,000 | 26,430,013 |
| Techtronic Industries Co. Ltd. | | 4,532,500 | 26,580,085 |
|
| TOTAL HONG KONG | | | 107,588,487 |
|
| Hungary - 0.7% | | | |
| OTP Bank PLC | | 857,200 | 34,569,029 |
| India - 13.8% | | | |
| Adani Ports & Special Economic Zone Ltd. | | 4,738,576 | 31,494,150 |
| Asian Paints Ltd. | | 1,621,308 | 29,567,900 |
| Bharat Petroleum Corp. Ltd. | | 3,742,921 | 31,307,583 |
| Eicher Motors Ltd. | | 55,061 | 27,410,089 |
| Godrej Consumer Products Ltd. | | 1,906,101 | 27,492,011 |
| HDFC Bank Ltd. | | 846,455 | 23,692,494 |
| Hero Motocorp Ltd. | | 451,749 | 26,860,054 |
| Housing Development Finance Corp. Ltd. | | 2,305,407 | 60,791,535 |
| Indraprastha Gas Ltd. | | 1,074,357 | 26,301,421 |
| IndusInd Bank Ltd. | | 877,835 | 22,059,756 |
| ITC Ltd. | | 8,929,226 | 36,640,855 |
| Kotak Mahindra Bank Ltd. | | 1,593,533 | 25,227,043 |
| LIC Housing Finance Ltd. | | 2,807,587 | 25,959,882 |
| Maruti Suzuki India Ltd. | | 292,659 | 37,113,455 |
| PC Jeweller Ltd. | | 8,277,230 | 44,844,051 |
| Power Grid Corp. of India Ltd. | | 7,323,014 | 23,959,545 |
| Reliance Industries Ltd. | | 4,287,498 | 62,299,498 |
| Shree Cement Ltd. | | 89,901 | 26,283,581 |
| Ultratech Cemco Ltd. | | 456,758 | 31,045,788 |
| UPL Ltd. | | 2,214,164 | 27,332,530 |
| Vakrangee Ltd. | | 2,852,979 | 24,775,754 |
|
| TOTAL INDIA | | | 672,458,975 |
|
| Indonesia - 2.3% | | | |
| PT Bank Central Asia Tbk | | 25,898,000 | 39,909,176 |
| PT Bank Rakyat Indonesia Tbk | | 31,035,700 | 35,698,206 |
| PT Telkomunikasi Indonesia Tbk Series B | | 127,402,600 | 38,012,727 |
|
| TOTAL INDONESIA | | | 113,620,109 |
|
| Israel - 1.5% | | | |
| Check Point Software Technologies Ltd. (a) | | 209,300 | 24,636,703 |
| Elbit Systems Ltd. (Israel) | | 165,900 | 24,593,482 |
| Frutarom Industries Ltd. | | 293,700 | 24,179,945 |
|
| TOTAL ISRAEL | | | 73,410,130 |
|
| Kenya - 0.5% | | | |
| Safaricom Ltd. | | 100,613,100 | 24,729,003 |
| Korea (South) - 5.8% | | | |
| Samsung Electronics Co. Ltd. | | 115,359 | 284,144,108 |
| Luxembourg - 0.1% | | | |
| Eurofins Scientific SA | | 10,894 | 6,814,463 |
| Mexico - 4.7% | | | |
| CEMEX S.A.B. de CV sponsored ADR | | 4,508,020 | 36,560,042 |
| Embotelladoras Arca S.A.B. de CV | | 3,981,200 | 25,336,561 |
| Fomento Economico Mexicano S.A.B. de CV unit | | 4,511,567 | 39,386,126 |
| Gruma S.A.B. de CV Series B | | 1,877,830 | 24,597,621 |
| Grupo Aeroportuario del Pacifico S.A.B. de CV Series B | | 2,817,857 | 26,725,309 |
| Grupo Aeroportuario del Sureste S.A.B. de CV Series B | | 1,610,330 | 28,719,550 |
| Grupo Aeroportuario Norte S.A.B. de CV | | 4,556,300 | 22,990,935 |
| Grupo Cementos de Chihuahua S.A.B. de CV | | 4,559,939 | 21,779,630 |
|
| TOTAL MEXICO | | | 226,095,774 |
|
| Netherlands - 1.5% | | | |
| ASML Holding NV (Netherlands) | | 141,900 | 25,602,943 |
| X5 Retail Group NV GDR (Reg. S) (a) | | 568,800 | 23,377,680 |
| Yandex NV Series A (a) | | 747,300 | 25,281,159 |
|
| TOTAL NETHERLANDS | | | 74,261,782 |
|
| Panama - 0.5% | | | |
| Copa Holdings SA Class A | | 189,900 | 23,393,781 |
| Philippines - 2.6% | | | |
| Ayala Corp. | | 1,470,560 | 29,390,960 |
| Ayala Land, Inc. | | 36,918,500 | 30,917,200 |
| D&L Industries, Inc. | | 26,273,100 | 5,286,656 |
| SM Investments Corp. | | 1,667,663 | 30,873,369 |
| SM Prime Holdings, Inc. | | 43,987,800 | 31,550,505 |
|
| TOTAL PHILIPPINES | | | 128,018,690 |
|
| Russia - 1.2% | | | |
| Sberbank of Russia | | 16,935,210 | 56,117,038 |
| South Africa - 6.0% | | | |
| Bidcorp Ltd. | | 1,387,398 | 30,517,604 |
| Capitec Bank Holdings Ltd. | | 393,700 | 26,170,277 |
| Discovery Ltd. | | 2,509,985 | 26,016,324 |
| FirstRand Ltd. | | 8,882,300 | 32,196,472 |
| Mondi Ltd. | | 1,093,566 | 26,231,662 |
| Naspers Ltd. Class N | | 503,712 | 122,732,762 |
| Sanlam Ltd. | | 5,781,300 | 28,909,056 |
|
| TOTAL SOUTH AFRICA | | | 292,774,157 |
|
| Spain - 0.5% | | | |
| Amadeus IT Holding SA Class A | | 367,600 | 24,942,584 |
| Switzerland - 1.0% | | | |
| Compagnie Financiere Richemont SA Series A | | 246,345 | 22,709,629 |
| Sika AG | | 3,170 | 23,465,594 |
|
| TOTAL SWITZERLAND | | | 46,175,223 |
|
| Taiwan - 5.5% | | | |
| Advantech Co. Ltd. | | 3,680,402 | 25,156,374 |
| Taiwan Semiconductor Manufacturing Co. Ltd. | | 26,082,000 | 211,005,219 |
| United Microelectronics Corp. | | 57,981,000 | 29,945,641 |
|
| TOTAL TAIWAN | | | 266,107,234 |
|
| Thailand - 0.6% | | | |
| Airports of Thailand PCL (For. Reg.) | | 17,367,000 | 31,105,855 |
| Turkey - 2.2% | | | |
| Koc Holding A/S | | 6,266,000 | 28,013,697 |
| Tofas Turk Otomobil Fabrikasi A/S | | 2,768,287 | 22,534,223 |
| Tupras Turkiye Petrol Rafinerileri A/S | | 753,058 | 27,096,629 |
| Turkcell Iletisim Hizmet A/S | | 7,314,000 | 27,319,893 |
|
| TOTAL TURKEY | | | 104,964,442 |
|
| United Arab Emirates - 0.2% | | | |
| DP World Ltd. | | 361,930 | 8,595,838 |
| United Kingdom - 2.5% | | | |
| British American Tobacco PLC (United Kingdom) | | 368,300 | 23,795,801 |
| Diageo PLC | | 659,105 | 22,507,670 |
| InterContinental Hotel Group PLC | | 457,500 | 25,350,266 |
| NMC Health PLC | | 653,100 | 25,085,635 |
| Prudential PLC | | 942,278 | 23,128,568 |
|
| TOTAL UNITED KINGDOM | | | 119,867,940 |
|
| United States of America - 5.8% | | | |
| A.O. Smith Corp. | | 405,700 | 24,017,440 |
| Alphabet, Inc. Class C (a) | | 24,745 | 25,156,757 |
| American Tower Corp. | | 170,600 | 24,510,102 |
| Amphenol Corp. Class A | | 277,700 | 24,159,900 |
| Facebook, Inc. Class A (a) | | 135,400 | 24,380,124 |
| MasterCard, Inc. Class A | | 166,300 | 24,740,451 |
| Moody's Corp. | | 178,100 | 25,363,221 |
| MSCI, Inc. | | 209,300 | 24,563,448 |
| S&P Global, Inc. | | 152,100 | 23,799,087 |
| Visa, Inc. Class A | | 211,100 | 23,216,778 |
| Yum China Holdings, Inc. | | 960,800 | 38,768,280 |
|
| TOTAL UNITED STATES OF AMERICA | | | 282,675,588 |
|
| TOTAL COMMON STOCKS | | | |
| (Cost $3,195,922,757) | | | 4,696,706,268 |
|
| Nonconvertible Preferred Stocks - 1.2% | | | |
| Brazil - 1.2% | | | |
| Itau Unibanco Holding SA | | | |
| (Cost $37,894,250) | | 4,782,910 | 61,480,563 |
|
| Money Market Funds - 2.1% | | | |
| Fidelity Cash Central Fund, 1.10% (b) | | | |
| (Cost $100,811,178) | | 100,791,019 | 100,811,178 |
| TOTAL INVESTMENT IN SECURITIES - 100.0% | | | |
| (Cost $3,334,628,185) | | | 4,858,998,009 |
| NET OTHER ASSETS (LIABILITIES) - 0.0% | | | (813,774) |
| NET ASSETS - 100% | | | $4,858,184,235 |
Categorizations in the Schedule of Investments are based on country or territory of incorporation.
Legend
(a) Non-income producing
(b) Affiliated fund that is generally available only to investment companies and other accounts managed by Fidelity Investments. The rate quoted is the annualized seven-day yield of the fund at period end. A complete unaudited listing of the fund's holdings as of its most recent quarter end is available upon request. In addition, each Fidelity Central Fund's financial statements, which are not covered by the Fund's Report of Independent Registered Public Accounting Firm, are available on the SEC's website or upon request.
Affiliated Central Funds
Information regarding fiscal year to date income earned by the Fund from investments in Fidelity Central Funds is as follows:
| Fund | Income earned |
| Fidelity Cash Central Fund | $347,884 |
| Fidelity Securities Lending Cash Central Fund | 130,241 |
| Total | $478,125 |
Investment Valuation
The following is a summary of the inputs used, as of October 31, 2017, involving the Fund's assets and liabilities carried at fair value. The inputs or methodology used for valuing securities may not be an indication of the risk associated with investing in those securities. For more information on valuation inputs, and their aggregation into the levels used below, please refer to the Investment Valuation section in the accompanying Notes to Financial Statements.
| | Valuation Inputs at Reporting Date: |
| Description | Total | Level 1 | Level 2 | Level 3 |
| Investments in Securities: | | | | |
| Equities: | | | | |
| Consumer Discretionary | $790,421,536 | $741,434,252 | $48,987,284 | $-- |
| Consumer Staples | 354,194,992 | 307,891,521 | 46,303,471 | -- |
| Energy | 120,703,710 | 120,703,710 | -- | -- |
| Financials | 861,975,402 | 759,037,302 | 102,938,100 | -- |
| Health Care | 136,952,700 | 136,952,700 | -- | -- |
| Industrials | 360,311,802 | 360,311,802 | -- | -- |
| Information Technology | 1,488,726,805 | 963,779,084 | 524,947,721 | -- |
| Materials | 295,952,829 | 295,952,829 | -- | -- |
| Real Estate | 110,408,207 | 110,408,207 | -- | -- |
| Telecommunication Services | 114,057,789 | 76,045,062 | 38,012,727 | -- |
| Utilities | 124,481,059 | 124,481,059 | -- | -- |
| Money Market Funds | 100,811,178 | 100,811,178 | -- | -- |
| Total Investments in Securities: | $4,858,998,009 | $4,097,808,706 | $761,189,303 | $-- |
See accompanying notes which are an integral part of the financial statements.
Fidelity® Emerging Markets Fund
Financial Statements
Statement of Assets and Liabilities
| | | October 31, 2017 |
| Assets | | |
Investment in securities, at value — See accompanying schedule:
Unaffiliated issuers (cost $3,233,817,007) | $4,758,186,831 | |
| Fidelity Central Funds (cost $100,811,178) | 100,811,178 | |
| Total Investment in Securities (cost $3,334,628,185) | | $4,858,998,009 |
| Foreign currency held at value (cost $3,691,421) | | 3,706,186 |
| Receivable for investments sold | | 3,921,829 |
| Receivable for fund shares sold | | 17,607,683 |
| Dividends receivable | | 2,279,335 |
| Distributions receivable from Fidelity Central Funds | | 54,868 |
| Prepaid expenses | | 9,949 |
| Other receivables | | 2,009,297 |
| Total assets | | 4,888,587,156 |
| Liabilities | | |
| Payable for investments purchased | $8,532,188 | |
| Payable for fund shares redeemed | 9,394,654 | |
| Accrued management fee | 2,776,321 | |
| Other affiliated payables | 761,388 | |
| Other payables and accrued expenses | 8,938,370 | |
| Total liabilities | | 30,402,921 |
| Net Assets | | $4,858,184,235 |
| Net Assets consist of: | | |
| Paid in capital | | $3,568,613,112 |
| Undistributed net investment income | | 25,936,057 |
| Accumulated undistributed net realized gain (loss) on investments and foreign currency transactions | | (251,852,477) |
| Net unrealized appreciation (depreciation) on investments and assets and liabilities in foreign currencies | | 1,515,487,543 |
| Net Assets | | $4,858,184,235 |
| Emerging Markets: | | |
| Net Asset Value, offering price and redemption price per share ($3,933,401,062 ÷ 125,386,136 shares) | | $31.37 |
| Class K: | | |
| Net Asset Value, offering price and redemption price per share ($924,783,173 ÷ 29,443,570 shares) | | $31.41 |
See accompanying notes which are an integral part of the financial statements.
Statement of Operations
| | | Year ended October 31, 2017 |
| Investment Income | | |
| Dividends | | $78,616,045 |
| Income from Fidelity Central Funds | | 478,125 |
| Income before foreign taxes withheld | | 79,094,170 |
| Less foreign taxes withheld | | (6,775,655) |
| Total income | | 72,318,515 |
| Expenses | | |
| Management fee | $28,126,405 | |
| Transfer agent fees | 6,788,281 | |
| Accounting and security lending fees | 1,526,540 | |
| Custodian fees and expenses | 1,574,787 | |
| Independent trustees' fees and expenses | 15,753 | |
| Registration fees | 112,793 | |
| Audit | 137,189 | |
| Legal | 9,648 | |
| Interest | 11,278 | |
| Miscellaneous | 31,934 | |
| Total expenses before reductions | 38,334,608 | |
| Expense reductions | (661,369) | 37,673,239 |
| Net investment income (loss) | | 34,645,276 |
| Realized and Unrealized Gain (Loss) | | |
| Net realized gain (loss) on: | | |
| Investment securities: | | |
| Unaffiliated issuers | 214,428,798 | |
| Fidelity Central Funds | 2,710 | |
| Foreign currency transactions | (1,927,606) | |
| Total net realized gain (loss) | | 212,503,902 |
| Change in net unrealized appreciation (depreciation) on: | | |
| Unaffiliated issuers (net of increase in deferred foreign taxes of $8,307,470) | 865,214,081 | |
| Fidelity Central Funds | (2,725) | |
| Assets and liabilities in foreign currencies | 105,469 | |
| Total change in net unrealized appreciation (depreciation) | | 865,316,825 |
| Net gain (loss) | | 1,077,820,727 |
| Net increase (decrease) in net assets resulting from operations | | $1,112,466,003 |
See accompanying notes which are an integral part of the financial statements.
Statement of Changes in Net Assets
| | Year ended October 31, 2017 | Year ended October 31, 2016 |
| Increase (Decrease) in Net Assets | | |
| Operations | | |
| Net investment income (loss) | $34,645,276 | $21,682,785 |
| Net realized gain (loss) | 212,503,902 | (227,815,936) |
| Change in net unrealized appreciation (depreciation) | 865,316,825 | 470,369,169 |
| Net increase (decrease) in net assets resulting from operations | 1,112,466,003 | 264,236,018 |
| Distributions to shareholders from net investment income | (23,974,554) | (17,361,594) |
| Share transactions - net increase (decrease) | 96,080,893 | 131,573,266 |
| Redemption fees | 379,582 | 1,810,193 |
| Total increase (decrease) in net assets | 1,184,951,924 | 380,257,883 |
| Net Assets | | |
| Beginning of period | 3,673,232,311 | 3,292,974,428 |
| End of period | $4,858,184,235 | $3,673,232,311 |
| Other Information | | |
| Undistributed net investment income end of period | $25,936,057 | $17,935,313 |
See accompanying notes which are an integral part of the financial statements.
Financial Highlights
Fidelity Emerging Markets Fund
| Years ended October 31, | 2017 | 2016 | 2015 | 2014 | 2013 |
| Selected Per–Share Data | | | | | |
| Net asset value, beginning of period | $24.25 | $22.55 | $25.44 | $24.43 | $22.15 |
| Income from Investment Operations | | | | | |
| Net investment income (loss)A | .22 | .14 | .19 | .17 | .20 |
| Net realized and unrealized gain (loss) | 7.05 | 1.66 | (2.91) | .86 | 2.38 |
| Total from investment operations | 7.27 | 1.80 | (2.72) | 1.03 | 2.58 |
| Distributions from net investment income | (.15) | (.11) | (.14) | (.02) | (.30) |
| Distributions from net realized gain | – | – | (.03) | – | – |
| Total distributions | (.15) | (.11) | (.17) | (.02) | (.30) |
| Redemption fees added to paid in capitalA | –B | .01 | –B | –B | –B |
| Net asset value, end of period | $31.37 | $24.25 | $22.55 | $25.44 | $24.43 |
| Total ReturnC | 30.21% | 8.07% | (10.76)% | 4.22% | 11.78% |
| Ratios to Average Net AssetsD,E | | | | | |
| Expenses before reductions | .97% | 1.01% | 1.05% | 1.07% | 1.08% |
| Expenses net of fee waivers, if any | .97% | 1.01% | 1.05% | 1.07% | 1.08% |
| Expenses net of all reductions | .96% | 1.00% | 1.03% | 1.07% | 1.03% |
| Net investment income (loss) | .83% | .61% | .78% | .71% | .85% |
| Supplemental Data | | | | | |
| Net assets, end of period (000 omitted) | $3,933,401 | $3,014,957 | $2,738,934 | $2,370,927 | $2,241,338 |
| Portfolio turnover rateF | 81% | 79% | 107% | 94% | 119% |
A Calculated based on average shares outstanding during the period.
B Amount represents less than $.005 per share.
C Total returns would have been lower if certain expenses had not been reduced during the applicable periods shown.
D Fees and expenses of any underlying Fidelity Central Funds are not included in the Fund's expense ratio. The Fund indirectly bears its proportionate share of the expenses of any underlying Fidelity Central Funds.
E Expense ratios reflect operating expenses of the class. Expenses before reductions do not reflect amounts reimbursed by the investment adviser or reductions from brokerage service arrangements or reductions from other expense offset arrangements and do not represent the amount paid by the class during periods when reimbursements or reductions occur. Expenses net of fee waivers reflect expenses after reimbursement by the investment adviser but prior to reductions from brokerage service arrangements or other expense offset arrangements. Expenses net of all reductions represent the net expenses paid by the class.
F Amount does not include the portfolio activity of any underlying Fidelity Central Funds.
See accompanying notes which are an integral part of the financial statements.
Fidelity Emerging Markets Fund Class K
| Years ended October 31, | 2017 | 2016 | 2015 | 2014 | 2013 |
| Selected Per–Share Data | | | | | |
| Net asset value, beginning of period | $24.28 | $22.58 | $25.48 | $24.42 | $22.15 |
| Income from Investment Operations | | | | | |
| Net investment income (loss)A | .26 | .18 | .24 | .23 | .25 |
| Net realized and unrealized gain (loss) | 7.06 | 1.66 | (2.92) | .86 | 2.38 |
| Total from investment operations | 7.32 | 1.84 | (2.68) | 1.09 | 2.63 |
| Distributions from net investment income | (.19) | (.15) | (.20) | (.03) | (.36) |
| Distributions from net realized gain | – | – | (.03) | – | – |
| Total distributions | (.19) | (.15) | (.22)B | (.03) | (.36) |
| Redemption fees added to paid in capitalA | –C | .01 | –C | –C | –C |
| Net asset value, end of period | $31.41 | $24.28 | $22.58 | $25.48 | $24.42 |
| Total ReturnD | 30.44% | 8.27% | (10.60)% | 4.47% | 12.01% |
| Ratios to Average Net AssetsE,F | | | | | |
| Expenses before reductions | .83% | .84% | .85% | .86% | .87% |
| Expenses net of fee waivers, if any | .82% | .84% | .85% | .85% | .87% |
| Expenses net of all reductions | .81% | .83% | .83% | .85% | .82% |
| Net investment income (loss) | .98% | .78% | .98% | .92% | 1.07% |
| Supplemental Data | | | | | |
| Net assets, end of period (000 omitted) | $924,783 | $658,276 | $554,041 | $623,430 | $547,369 |
| Portfolio turnover rateG | 81% | 79% | 107% | 94% | 119% |
A Calculated based on average shares outstanding during the period.
B Total distributions of $.22 per share is comprised of distributions from net investment income of $.195 and distributions from net realized gain of $.025 per share.
C Amount represents less than $.005 per share.
D Total returns would have been lower if certain expenses had not been reduced during the applicable periods shown.
E Fees and expenses of any underlying Fidelity Central Funds are not included in the Fund's expense ratio. The Fund indirectly bears its proportionate share of the expenses of any underlying Fidelity Central Funds.
F Expense ratios reflect operating expenses of the class. Expenses before reductions do not reflect amounts reimbursed by the investment adviser or reductions from brokerage service arrangements or reductions from other expense offset arrangements and do not represent the amount paid by the class during periods when reimbursements or reductions occur. Expenses net of fee waivers reflect expenses after reimbursement by the investment adviser but prior to reductions from brokerage service arrangements or other expense offset arrangements. Expenses net of all reductions represent the net expenses paid by the class.
G Amount does not include the portfolio activity of any underlying Fidelity Central Funds.
See accompanying notes which are an integral part of the financial statements.
Notes to Financial Statements
For the period ended October 31, 2017
1. Organization.
Fidelity Emerging Markets Fund (the Fund) is a fund of Fidelity Investment Trust (the Trust) and is authorized to issue an unlimited number of shares. The Trust is registered under the Investment Company Act of 1940, as amended (the 1940 Act), as an open-end management investment company organized as a Massachusetts business trust. The Fund offers Emerging Markets and Class K shares, each of which has equal rights as to assets and voting privileges. Each class has exclusive voting rights with respect to matters that affect that class. The Fund's investments in emerging markets can be subject to social, economic, regulatory, and political uncertainties and can be extremely volatile.
2. Investments in Fidelity Central Funds.
The Fund invests in Fidelity Central Funds, which are open-end investment companies generally available only to other investment companies and accounts managed by the investment adviser and its affiliates. The Fund's Schedule of Investments lists each of the Fidelity Central Funds held as of period end, if any, as an investment of the Fund, but does not include the underlying holdings of each Fidelity Central Fund. As an Investing Fund, the Fund indirectly bears its proportionate share of the expenses of the underlying Fidelity Central Funds.
The Money Market Central Funds seek preservation of capital and current income and are managed by Fidelity Investments Money Management, Inc. (FIMM), an affiliate of the investment adviser. Annualized expenses of the Money Market Central Funds as of their most recent shareholder report date are less than .005%.
A complete unaudited list of holdings for each Fidelity Central Fund is available upon request or at the Securities and Exchange Commission (the SEC) website at www.sec.gov. In addition, the financial statements of the Fidelity Central Funds, which are not covered by the Fund's Report of Independent Registered Public Accounting Firm, are available on the SEC website or upon request.
3. Significant Accounting Policies.
The Fund is an investment company and applies the accounting and reporting guidance of the Financial Accounting Standards Board (FASB) Accounting Standards Codification Topic 946 Financial Services – Investments Companies. The financial statements have been prepared in conformity with accounting principles generally accepted in the United States of America (GAAP), which require management to make certain estimates and assumptions at the date of the financial statements. Actual results could differ from those estimates. Subsequent events, if any, through the date that the financial statements were issued have been evaluated in the preparation of the financial statements. The following summarizes the significant accounting policies of the Fund:
Investment Valuation. Investments are valued as of 4:00 p.m. Eastern time on the last calendar day of the period. The Board of Trustees (the Board) has delegated the day to day responsibility for the valuation of the Fund's investments to the Fair Value Committee (the Committee) established by the Fund's investment adviser. In accordance with valuation policies and procedures approved by the Board, the Fund attempts to obtain prices from one or more third party pricing vendors or brokers to value its investments. When current market prices, quotations or currency exchange rates are not readily available or reliable, investments will be fair valued in good faith by the Committee, in accordance with procedures adopted by the Board. Factors used in determining fair value vary by investment type and may include market or investment specific events. The frequency with which these procedures are used cannot be predicted and they may be utilized to a significant extent. The Committee oversees the Fund's valuation policies and procedures and reports to the Board on the Committee's activities and fair value determinations. The Board monitors the appropriateness of the procedures used in valuing the Fund's investments and ratifies the fair value determinations of the Committee.
The Fund categorizes the inputs to valuation techniques used to value its investments into a disclosure hierarchy consisting of three levels as shown below:
- Level 1 – quoted prices in active markets for identical investments
- Level 2 – other significant observable inputs (including quoted prices for similar investments, interest rates, prepayment speeds, etc.)
- Level 3 – unobservable inputs (including the Fund's own assumptions based on the best information available)
Valuation techniques used to value the Fund's investments by major category are as follows:
Equity securities, including restricted securities, for which market quotations are readily available, are valued at the last reported sale price or official closing price as reported by a third party pricing vendor on the primary market or exchange on which they are traded and are categorized as Level 1 in the hierarchy. In the event there were no sales during the day or closing prices are not available, securities are valued at the last quoted bid price or may be valued using the last available price and are generally categorized as Level 2 in the hierarchy. For foreign equity securities, when market or security specific events arise, comparisons to the valuation of American Depositary Receipts (ADRs), futures contracts, Exchange-Traded Funds (ETFs) and certain indexes as well as quoted prices for similar securities may be used and would be categorized as Level 2 in the hierarchy. Utilizing these techniques may result in transfers between Level 1 and Level 2. For equity securities, including restricted securities, where observable inputs are limited, assumptions about market activity and risk are used and these securities may be categorized as Level 3 in the hierarchy.
Investments in open-end mutual funds, including the Fidelity Central Funds, are valued at their closing net asset value (NAV) each business day and are categorized as Level 1 in the hierarchy.
Changes in valuation techniques may result in transfers in or out of an assigned level within the disclosure hierarchy. The aggregate value of investments by input level as of October 31, 2017 is included at the end of the Fund's Schedule of Investments.
Foreign Currency. The Fund may use foreign currency contracts to facilitate transactions in foreign-denominated securities. Gains and losses from these transactions may arise from changes in the value of the foreign currency or if the counterparties do not perform under the contracts' terms.
Foreign-denominated assets, including investment securities, and liabilities are translated into U.S. dollars at the exchange rates at period end. Purchases and sales of investment securities, income and dividends received and expenses denominated in foreign currencies are translated into U.S. dollars at the exchange rate in effect on the transaction date.
The effects of exchange rate fluctuations on investments are included with the net realized and unrealized gain (loss) on investment securities. Other foreign currency transactions resulting in realized and unrealized gain (loss) are disclosed separately.
Investment Transactions and Income. For financial reporting purposes, the Fund's investment holdings and NAV include trades executed through the end of the last business day of the period. The NAV per share for processing shareholder transactions is calculated as of the close of business of the New York Stock Exchange (NYSE), normally 4:00 p.m. Eastern time and includes trades executed through the end of the prior business day. Gains and losses on securities sold are determined on the basis of identified cost and includes proceeds received from litigation. Dividend income is recorded on the ex-dividend date, except for certain dividends from foreign securities where the ex-dividend date may have passed, which are recorded as soon as the Fund is informed of the ex-dividend date. Non-cash dividends included in dividend income, if any, are recorded at the fair market value of the securities received. Income and capital gain distributions from Fidelity Central Funds, if any, are recorded on the ex-dividend date. Certain distributions received by the Fund represent a return of capital or capital gain. The Fund determines the components of these distributions subsequent to the ex-dividend date, based upon receipt of tax filings or other correspondence relating to the underlying investment. These distributions are recorded as a reduction of cost of investments and/or as a realized gain. Investment income is recorded net of foreign taxes withheld where recovery of such taxes is uncertain.
Class Allocations and Expenses. Investment income, realized and unrealized capital gains and losses, common expenses of the Fund, and certain fund-level expense reductions, if any, are allocated daily on a pro-rata basis to each class based on the relative net assets of each class to the total net assets of the Fund. Each class differs with respect to transfer agent fees incurred. Certain expense reductions may also differ by class. For the reporting period, the allocated portion of income and expenses to each class as a percent of its average net assets may vary due to the timing of recording these transactions in relation to fluctuating net assets of the classes. Expenses directly attributable to a fund are charged to that fund. Expenses attributable to more than one fund are allocated among the respective funds on the basis of relative net assets or other appropriate methods. Expense estimates are accrued in the period to which they relate and adjustments are made when actual amounts are known.
Income Tax Information and Distributions to Shareholders. Each year, the Fund intends to qualify as a regulated investment company under Subchapter M of the Internal Revenue Code, including distributing substantially all of its taxable income and realized gains. As a result, no provision for U.S. Federal income taxes is required. As of October 31, 2017, the Fund did not have any unrecognized tax benefits in the financial statements; nor is the Fund aware of any tax positions for which it is reasonably possible that the total amounts of unrecognized tax benefits will significantly change in the next twelve months. The Fund files a U.S. federal tax return, in addition to state and local tax returns as required. The Fund's federal income tax returns are subject to examination by the Internal Revenue Service (IRS) for a period of three fiscal years after they are filed. State and local tax returns may be subject to examination for an additional fiscal year depending on the jurisdiction. Foreign taxes are provided for based on the Fund's understanding of the tax rules and rates that exist in the foreign markets in which it invests. The Fund is subject to a tax imposed on capital gains by certain countries in which it invests. An estimated deferred tax liability for net unrealized appreciation on the applicable securities is included in Other payables and accrued expenses on the Statement of Assets & Liabilities.
Distributions are declared and recorded on the ex-dividend date. Income dividends and capital gain distributions are declared separately for each class. Income and capital gain distributions are determined in accordance with income tax regulations, which may differ from GAAP. In addition, the Fund claimed a portion of the payment made to redeeming shareholders as a distribution for income tax purposes.
Capital accounts within the financial statements are adjusted for permanent book-tax differences. These adjustments have no impact on net assets or the results of operations. Capital accounts are not adjusted for temporary book-tax differences which will reverse in a subsequent period.
Book-tax differences are primarily due to foreign currency transactions, passive foreign investment companies (PFIC), capital loss carryforwards, certain foreign taxes, expiring capital loss carryforwards, deferred trustees compensation and losses deferred due to wash sales.
As of period end, the cost and unrealized appreciation (depreciation) in securities, and derivatives if applicable, for federal income tax purposes were as follows:
| Gross unrealized appreciation | $1,545,672,869 |
| Gross unrealized depreciation | (28,382,758) |
| Net unrealized appreciation (depreciation) | $1,517,290,111 |
| Tax Cost | $3,341,707,898 |
The tax-based components of distributable earnings as of period end were as follows:
| Undistributed ordinary income | $29,971,472 |
| Capital loss carryforward | $(248,807,540) |
| Net unrealized appreciation (depreciation) on securities and other investments | $1,516,715,300 |
Capital loss carryforwards are only available to offset future capital gains of the Fund to the extent provided by regulations and may be limited. Under the Regulated Investment Company Modernization Act of 2010 (the Act), the Fund is permitted to carry forward capital losses incurred in taxable years beginning after December 22, 2010 for an unlimited period and such capital losses are required to be used prior to any losses that expire. The capital loss carryforward information presented below, including any applicable limitation, is estimated as of fiscal period end and is subject to adjustment.
| No expiration | |
| Short-term | $(248,807,540) |
The tax character of distributions paid was as follows:
| | October 31, 2017 | October 31, 2016 |
| Ordinary Income | $23,974,554 | $ 17,361,593 |
Short-Term Trading (Redemption) Fees. Shares held by investors in the Fund less than 90 days may have been subject to a redemption fee equal to 1.50% of the NAV of shares redeemed. All redemption fees, which reduce the proceeds of the shareholder redemption, are retained by the Fund and accounted for as an addition to paid in capital. In November 2017, the Board of Trustees approved the elimination of these redemption fees effective December 18, 2017.
4. Purchases and Sales of Investments.
Purchases and sales of securities, other than short-term securities, aggregated $3,283,400,892 and $3,255,705,980, respectively.
5. Fees and Other Transactions with Affiliates.
Management Fee. Fidelity Management & Research Company (the investment adviser) and its affiliates provide the Fund with investment management related services for which the Fund pays a monthly management fee. The management fee is the sum of an individual fund fee rate that is based on an annual rate of .45% of the Fund's average net assets and an annualized group fee rate that averaged .25% during the period. The group fee rate is based upon the average net assets of all the mutual funds advised by the investment adviser, including any mutual funds previously advised by the investment adviser that are currently advised by Fidelity SelectCo, LLC, an affiliate of the investment adviser. The group fee rate decreases as assets under management increase and increases as assets under management decrease. For the reporting period, the total annual management fee rate was .69% of the Fund's average net assets.
Transfer Agent Fees. Fidelity Investments Institutional Operations Company, Inc., (FIIOC), an affiliate of the investment adviser, is the transfer, dividend disbursing and shareholder servicing agent for each class of the Fund. FIIOC receives account fees and asset-based fees that vary according to the account size and type of account of the shareholders of Emerging Markets, except for Class K. FIIOC receives an asset-based fee of Class K's average net assets. FIIOC pays for typesetting, printing and mailing of shareholder reports, except proxy statements.
For the period, transfer agent fees for each class were as follows:
| | Amount | % of
Class-Level Average
Net Assets |
| Emerging Markets | $6,436,331 | .19 |
| Class K | 351,950 | .05 |
| | $6,788,281 | |
Accounting and Security Lending Fees. Fidelity Service Company, Inc. (FSC), an affiliate of the investment adviser, maintains the Fund's accounting records. The accounting fee is based on the level of average net assets for each month. Under a separate contract, FSC administers the security lending program. The security lending fee is based on the number and duration of lending transactions.
Brokerage Commissions. The Fund placed a portion of its portfolio transactions with brokerage firms which are affiliates of the investment adviser. Brokerage commissions are included in net realized gain (loss) and change in net unrealized appreciation (depreciation) in the Statement of Operations. The commissions paid to these affiliated firms were $24,222 for the period.
Interfund Lending Program. Pursuant to an Exemptive Order issued by the SEC, the Fund, along with other registered investment companies having management contracts with Fidelity Management & Research Company (FMR) or other affiliated entities of FMR, may participate in an interfund lending program. This program provides an alternative credit facility allowing the funds to borrow from, or lend money to, other participating affiliated funds. At period end, there were no interfund loans outstanding. The Fund's activity in this program during the period for which loans were outstanding was as follows:
| Borrower or Lender | Average Loan Balance | Weighted Average Interest Rate | Interest Expense |
| Borrower | $12,541,938 | 1.01% | $11,278 |
Interfund Trades. The Fund may purchase from or sell securities to other Fidelity Funds under procedures adopted by the Board. The procedures have been designed to ensure these interfund trades are executed in accordance with Rule 17a-7 of the 1940 Act. Interfund trades are included within the respective purchases and sales amounts shown in the Purchases and Sales of Investments note.
6. Committed Line of Credit.
The Fund participates with other funds managed by the investment adviser or an affiliate in a $4.25 billion credit facility (the "line of credit") to be utilized for temporary or emergency purposes to fund shareholder redemptions or for other short-term liquidity purposes. The Fund has agreed to pay commitment fees on its pro-rata portion of the line of credit, which amounted to $12,519 and is reflected in Miscellaneous expenses on the Statement of Operations. During the period, the Fund did not borrow on this line of credit.
7. Security Lending.
The Fund lends portfolio securities through a lending agent from time to time in order to earn additional income. For equity securities, a lending agent is used and may loan securities to certain qualified borrowers, including Fidelity Capital Markets (FCM), a broker-dealer affiliated with the Fund. On the settlement date of the loan, the Fund receives collateral (in the form of U.S. Treasury obligations, letters of credit and/or cash) against the loaned securities and maintains collateral in an amount not less than 100% of the market value of the loaned securities during the period of the loan. The market value of the loaned securities is determined at the close of business of the Fund and any additional required collateral is delivered to the Fund on the next business day. The Fund or borrower may terminate the loan at any time, and if the borrower defaults on its obligation to return the securities loaned because of insolvency or other reasons, the Fund may apply collateral received from the borrower against the obligation. The Fund may experience delays and costs in recovering the securities loaned. Any cash collateral received is invested in the Fidelity Securities Lending Cash Central Fund. At period end, there were no security loans outstanding. Security lending income represents the income earned on investing cash collateral, less rebates paid to borrowers and any lending agent fees associated with the loan, plus any premium payments received for lending certain types of securities. Security lending income is presented in the Statement of Operations as a component of income from Fidelity Central Funds. Total security lending income during the period amounted to $130,241, including $1,060 from securities loaned to FCM.
8. Expense Reductions.
Commissions paid to certain brokers with whom the investment adviser, or its affiliates, places trades on behalf of the Fund include an amount in addition to trade execution, which may be rebated back to the Fund to offset certain expenses. This amount totaled $628,353 for the period. In addition, through arrangements with the Fund's custodian, credits realized as a result of certain uninvested cash balances were used to reduce the Fund's expenses. During the period, these credits reduced the Fund's custody expenses by $2,153.
In addition, during the period the investment adviser reimbursed and/or waived a portion of fund-level operating expenses in the amount of $30,863.
9. Distributions to Shareholders.
Distributions to shareholders of each class were as follows:
| | Year ended October 31, 2017 | Year ended October 31, 2016 |
| From net investment income | | |
| Emerging Markets | $18,744,412 | $13,660,209 |
| Class K | 5,230,142 | 3,701,385 |
| Total | $23,974,554 | $17,361,594 |
10. Share Transactions.
Share transactions for each class were as follows and may contain automatic conversions between classes or exchanges between affiliated funds:
| | Shares | Shares | Dollars | Dollars |
| | Year ended October 31, 2017 | Year ended October 31, 2016 | Year ended October 31, 2017 | Year ended October 31, 2016 |
| Emerging Markets | | | | |
| Shares sold | 35,833,343 | 40,381,882 | $958,972,147 | $879,217,354 |
| Reinvestment of distributions | 790,787 | 572,542 | 17,864,538 | 12,670,348 |
| Shares redeemed | (35,588,763) | (38,074,038) | (943,601,756) | (819,023,837) |
| Net increase (decrease) | 1,035,367 | 2,880,386 | $33,234,929 | $72,863,865 |
| Class K | | | | |
| Shares sold | 9,726,562 | 8,389,679 | $257,288,456 | $189,089,919 |
| Reinvestment of distributions | 231,437 | 167,256 | 5,230,142 | 3,701,385 |
| Shares redeemed | (7,627,038) | (5,977,816) | (199,672,634) | (134,081,903) |
| Net increase (decrease) | 2,330,961 | 2,579,119 | $62,845,964 | $58,709,401 |
11. Other.
The Fund's organizational documents provide former and current trustees and officers with a limited indemnification against liabilities arising in connection with the performance of their duties to the Fund. In the normal course of business, the Fund may also enter into contracts that provide general indemnifications. The Fund's maximum exposure under these arrangements is unknown as this would be dependent on future claims that may be made against the Fund. The risk of material loss from such claims is considered remote.
Fidelity® Europe Fund
Performance: The Bottom Line
Average annual total return reflects the change in the value of an investment, assuming reinvestment of distributions from dividend income and capital gains (the profits earned upon the sale of securities that have grown in value, if any) and assuming a constant rate of performance each year. The hypothetical investment and the average annual total returns do not reflect the deduction of taxes that a shareholder would pay on fund distributions or the redemption of fund shares. During periods of reimbursement by Fidelity, a fund’s total return will be greater than it would be had the reimbursement not occurred. How a fund did yesterday is no guarantee of how it will do tomorrow.
Average Annual Total Returns
| For the periods ended October 31, 2017 | Past 1 year | Past 5 years | Past 10 years |
| Fidelity® Europe Fund | 26.05% | 9.14% | 1.66% |
$10,000 Over 10 Years
Let's say hypothetically that $10,000 was invested in Fidelity® Europe Fund, a class of the fund, on October 31, 2007.
The chart shows how the value of your investment would have changed, and also shows how the MSCI Europe Index performed over the same period.
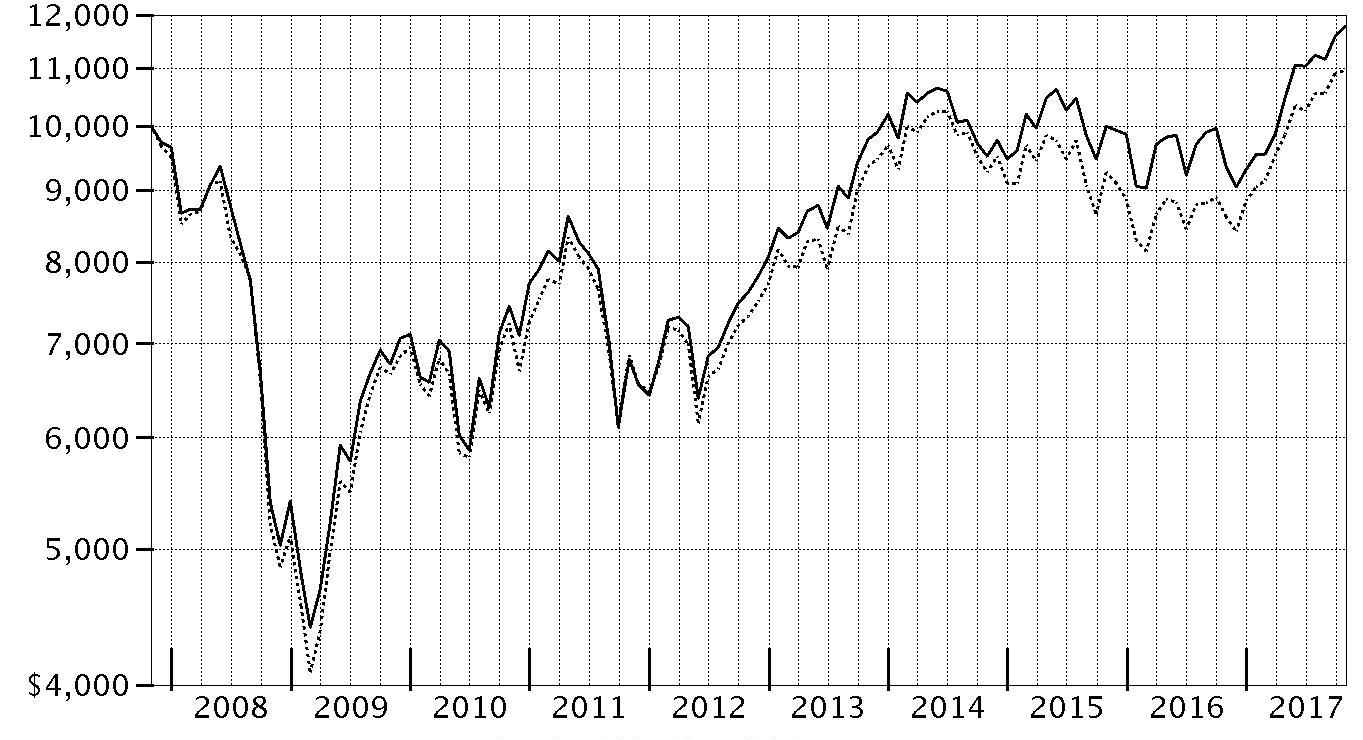
| Period Ending Values |
| $11,787 | Fidelity® Europe Fund |
| $10,959 | MSCI Europe Index |
Fidelity® Europe Fund
Management's Discussion of Fund Performance
Market Recap: The MSCI ACWI (All Country World Index) ex USA Index returned 23.85% for the 12 months ending October 31, 2017, helped partly by a generally weak U.S. dollar. Some favorable election results in continental Europe (+30%) suggested ebbing political uncertainty and near-term risk there, but the U.K. (+20%) faced more-mixed conditions ahead of its expected exit from the European Union. Despite central-bank easing – and pressured recently by yen strength – Japan (+18%) lagged the rest of the Asia-Pacific group (+22%). Commodity-price volatility slowed Canada (+17%), but the emerging-markets group (+26%) sped ahead. Sector-wise, information technology (+47%) was driven by a surge among several Chinese internet-related names. Financials (+27%) rode rising interest rates that, at the same time, weighed on real estate (+17%), utilities (+16%), consumer staples (+14%) and telecommunication services (+9%) – so-called “bond proxy” sectors. Materials (+28%) and industrials (+27%) responded to demand from China and price gains for certain commodities. In the energy sector (+20%), oil prices lost ground in the spring before rebounding through October 31 to end well above where they started 12 months ago. Lastly, health care (+14%) was hurt by early-period turmoil around drug pricing and health care legislation.
Comments from Portfolio Manager Stefan Lindblad: For the fiscal year, the fund’s share classes (excluding sales charges, if applicable) gained roughly 25% to 26%, lagging the 27.33% return of the benchmark MSCI Europe Index. Amid a strong market for European stocks, bolstered by a sense of optimism as the political environment stabilized, the fund's defensive positioning hampered our results versus the benchmark. In particular, stock selection in the industrials and consumer discretionary sectors notably detracted. The largest individual detractor was Intertrust, a Netherlands-based trust and corporate services company. Shares of the company lost ground the past year, mainly due to poor execution and internal issues, as well as disappointing financial results. Also detracting was our position in emerging-markets lender International Personal Finance. Shares of the U.K.-based firm declined on news of potential regulatory changes in Poland, one of the company’s primary markets. Intertrust and International Personal Finance were non-benchmark holdings. Turning to contributors, stock picking in health care boosted the fund’s relative result most. The fund’s biggest individual contributor versus the benchmark was an overweighting in Svenska Cellulosa, a manufacturer of tinder, pulp and paper. Investors were enthusiastic about the company’s recent split from the consumer tissue side of the business.
The views expressed above reflect those of the portfolio manager(s) only through the end of the period as stated on the cover of this report and do not necessarily represent the views of Fidelity or any other person in the Fidelity organization. Any such views are subject to change at any time based upon market or other conditions and Fidelity disclaims any responsibility to update such views. These views may not be relied on as investment advice and, because investment decisions for a Fidelity fund are based on numerous factors, may not be relied on as an indication of trading intent on behalf of any Fidelity fund.
Fidelity® Europe Fund
Investment Summary (Unaudited)
Geographic Diversification (% of fund's net assets)
| As of October 31, 2017 |
| | United Kingdom | 19.2% |
| | Sweden | 18.3% |
| | Germany | 11.8% |
| | United States of America* | 9.5% |
| | Italy | 6.2% |
| | Spain | 5.9% |
| | Ireland | 5.4% |
| | France | 5.1% |
| | Netherlands | 4.5% |
| | Other | 14.1% |

* Includes Short-Term investments and Net Other Assets (Liabilities).
Percentages are based on country or territory of incorporation and are adjusted for the effect of futures contracts, if applicable.
| As of April 30, 2017 |
| | Germany | 15.0% |
| | Sweden | 14.2% |
| | United Kingdom | 13.1% |
| | France | 10.4% |
| | Netherlands | 7.6% |
| | Italy | 7.3% |
| | Spain | 6.2% |
| | Switzerland | 6.0% |
| | United States of America* | 3.9% |
| | Other | 16.3% |
* Includes Short-Term investments and Net Other Assets (Liabilities).
Percentages are based on country or territory of incorporation and are adjusted for the effect of futures contracts, if applicable.
Asset Allocation as of October 31, 2017
| | % of fund's net assets | % of fund's net assets 6 months ago |
| Stocks | 93.6 | 98.7 |
| Short-Term Investments and Net Other Assets (Liabilities) | 6.4 | 1.3 |
Top Ten Stocks as of October 31, 2017
| | % of fund's net assets | % of fund's net assets 6 months ago |
| Getinge AB (B Shares) (Sweden, Health Care Equipment & Supplies) | 3.7 | 3.3 |
| Securitas AB (B Shares) (Sweden, Commercial Services & Supplies) | 3.5 | 0.0 |
| SAP SE (Germany, Software) | 3.1 | 4.3 |
| Autoliv, Inc. (depositary receipt) (United States of America, Auto Components) | 3.1 | 2.6 |
| Prudential PLC (United Kingdom, Insurance) | 2.9 | 3.1 |
| NCC Group Ltd. (United Kingdom, IT Services) | 2.6 | 1.9 |
| Schibsted ASA (A Shares) (Norway, Media) | 2.6 | 2.0 |
| Investor AB (B Shares) (Sweden, Diversified Financial Services) | 2.4 | 2.8 |
| Vostok New Ventures Ltd. (depositary receipt) (Bermuda, Capital Markets) | 2.3 | 2.6 |
| Intertrust NV (Netherlands, Professional Services) | 2.3 | 1.2 |
| | 28.5 | |
Top Market Sectors as of October 31, 2017
| | % of fund's net assets | % of fund's net assets 6 months ago |
| Industrials | 19.2 | 19.4 |
| Financials | 19.2 | 18.6 |
| Consumer Discretionary | 17.1 | 17.0 |
| Health Care | 10.9 | 12.6 |
| Information Technology | 10.5 | 12.2 |
| Materials | 6.9 | 6.4 |
| Consumer Staples | 6.1 | 7.6 |
| Real Estate | 3.4 | 3.3 |
| Utilities | 0.3 | 1.6 |
Percentages shown as 0.0% may reflect amounts less than 0.05%.
Fidelity® Europe Fund
Investments October 31, 2017
Showing Percentage of Net Assets
| Common Stocks - 91.1% | | | |
| | | Shares | Value |
| Bermuda - 3.1% | | | |
| Vostok Emerging Finance Ltd. (depository receipt) (a)(b)(c) | | 53,590,807 | $11,714,677 |
| Vostok New Ventures Ltd. (depositary receipt) (a)(b) | | 3,850,361 | 31,735,071 |
|
| TOTAL BERMUDA | | | 43,449,748 |
|
| Canada - 0.2% | | | |
| Lundin Mining Corp. | | 447,200 | 3,445,486 |
| Denmark - 3.3% | | | |
| A.P. Moller - Maersk A/S Series B | | 15,055 | 28,916,346 |
| Novozymes A/S Series B | | 316,100 | 17,457,063 |
|
| TOTAL DENMARK | | | 46,373,409 |
|
| France - 5.1% | | | |
| Capgemini SA | | 225,600 | 27,422,153 |
| Rubis | | 71,806 | 4,506,697 |
| The Vicat Group | | 158,300 | 12,245,722 |
| Wendel SA | | 157,200 | 26,514,968 |
|
| TOTAL FRANCE | | | 70,689,540 |
|
| Germany - 11.8% | | | |
| Bertrandt AG (a) | | 126,900 | 11,899,467 |
| CompuGroup Medical AG | | 126,309 | 7,257,974 |
| CTS Eventim AG | | 417,769 | 17,256,191 |
| Fresenius Medical Care AG & Co. KGaA | | 160,500 | 15,539,930 |
| LEG Immobilien AG | | 280,268 | 28,468,200 |
| MTU Aero Engines Holdings AG | | 143,000 | 24,111,521 |
| SAP SE | | 381,437 | 43,583,993 |
| Vonovia SE | | 371,900 | 16,357,923 |
|
| TOTAL GERMANY | | | 164,475,199 |
|
| Hungary - 0.5% | | | |
| OTP Bank PLC | | 171,900 | 6,932,357 |
| Ireland - 5.4% | | | |
| DCC PLC (United Kingdom) | | 154,100 | 14,613,289 |
| Paddy Power Betfair PLC (Ireland) | | 253,900 | 25,967,326 |
| Ryanair Holdings PLC sponsored ADR (b) | | 152,667 | 17,115,497 |
| United Drug PLC (United Kingdom) | | 1,420,241 | 17,438,780 |
|
| TOTAL IRELAND | | | 75,134,892 |
|
| Italy - 5.2% | | | |
| Banca Generali SpA | | 418,800 | 13,796,092 |
| Buzzi Unicem SpA | | 490,500 | 13,672,619 |
| Prada SpA | | 5,541,700 | 19,179,365 |
| UniCredit SpA (b) | | 1,314,200 | 25,151,798 |
|
| TOTAL ITALY | | | 71,799,874 |
|
| Luxembourg - 1.3% | | | |
| B&M European Value Retail S.A. | | 3,334,636 | 17,596,007 |
| Malta - 0.8% | | | |
| Kambi Group PLC (a)(b) | | 1,055,109 | 11,090,955 |
| Netherlands - 4.5% | | | |
| Intertrust NV (a) | | 2,058,425 | 31,650,384 |
| Unilever NV (Certificaten Van Aandelen) (Bearer) | | 528,100 | 30,677,312 |
|
| TOTAL NETHERLANDS | | | 62,327,696 |
|
| Norway - 2.6% | | | |
| Schibsted ASA (A Shares) (a) | | 1,405,250 | 36,232,327 |
| Spain - 4.4% | | | |
| Aedas Homes SAU | | 52,983 | 1,851,517 |
| Amadeus IT Holding SA Class A | | 296,800 | 20,138,626 |
| Grifols SA | | 499,300 | 15,630,758 |
| Prosegur Cash SA | | 7,417,400 | 24,192,444 |
|
| TOTAL SPAIN | | | 61,813,345 |
|
| Sweden - 18.3% | | | |
| AF AB (B Shares) | | 132,500 | 2,730,197 |
| Dometic Group AB (d) | | 2,927,400 | 25,456,716 |
| Essity AB Class B | | 798,700 | 23,879,953 |
| Getinge AB (B Shares) | | 2,608,684 | 51,353,215 |
| Indutrade AB | | 1,080,500 | 29,969,253 |
| Investor AB (B Shares) | | 670,971 | 33,253,405 |
| Nobia AB | | 637,800 | 5,233,957 |
| Pandox AB | | 263,672 | 4,806,262 |
| Securitas AB (B Shares) | | 2,781,200 | 48,802,599 |
| Svenska Cellulosa AB (SCA) (B Shares) | | 3,159,600 | 29,664,948 |
|
| TOTAL SWEDEN | | | 255,150,505 |
|
| Switzerland - 2.3% | | | |
| EDAG Engineering Group AG | | 297,000 | 4,651,438 |
| Swatch Group AG (Bearer) | | 69,820 | 27,363,925 |
|
| TOTAL SWITZERLAND | | | 32,015,363 |
|
| United Kingdom - 19.2% | | | |
| British American Tobacco PLC (United Kingdom) | | 464,200 | 29,991,884 |
| Bunzl PLC | | 379,058 | 11,805,806 |
| Dechra Pharmaceuticals PLC | | 881,600 | 24,073,643 |
| Diploma PLC | | 1,206,600 | 17,291,469 |
| Essentra PLC | | 1,039,335 | 7,343,690 |
| International Personal Finance PLC | | 4,931,872 | 13,247,913 |
| Micro Focus International PLC | | 519,158 | 18,237,796 |
| NCC Group Ltd. (a) | | 11,931,824 | 36,448,680 |
| Prudential PLC | | 1,636,678 | 40,172,877 |
| Rolls-Royce Holdings PLC | | 2,252,300 | 29,106,433 |
| Standard Chartered PLC (United Kingdom) (b) | | 2,594,366 | 25,856,587 |
| Standard Life PLC | | 2,370,514 | 13,531,815 |
|
| TOTAL UNITED KINGDOM | | | 267,108,593 |
|
| United States of America - 3.1% | | | |
| Autoliv, Inc. (depositary receipt) | | 342,700 | 42,982,566 |
| TOTAL COMMON STOCKS | | | |
| (Cost $1,065,432,054) | | | 1,268,617,862 |
|
| Nonconvertible Preferred Stocks - 2.5% | | | |
| Italy - 1.0% | | | |
| Buzzi Unicem SpA (Risparmio Shares) | | 889,200 | 14,097,029 |
| Spain - 1.5% | | | |
| Grifols SA Class B | | 850,250 | 19,970,448 |
| United Kingdom - 0.0% | | | |
| Rolls-Royce Holdings PLC Series C (b) | | 103,605,800 | 137,604 |
| TOTAL NONCONVERTIBLE PREFERRED STOCKS | | | |
| (Cost $23,679,782) | | | 34,205,081 |
|
| Money Market Funds - 2.0% | | | |
| Fidelity Cash Central Fund, 1.10%(e) | | 11,413,326 | 11,415,608 |
| Fidelity Securities Lending Cash Central Fund 1.11%(e)(f) | | 16,893,729 | 16,895,418 |
| TOTAL MONEY MARKET FUNDS | | | |
| (Cost $28,312,287) | | | 28,311,026 |
| TOTAL INVESTMENT IN SECURITIES - 95.6% | | | |
| (Cost $1,117,424,123) | | | 1,331,133,969 |
| NET OTHER ASSETS (LIABILITIES) - 4.4% | | | 61,067,864 |
| NET ASSETS - 100% | | | $1,392,201,833 |
Categorizations in the Schedule of Investments are based on country or territory of incorporation.
Legend
(a) Security or a portion of the security is on loan at period end.
(b) Non-income producing
(c) Affiliated company
(d) Security exempt from registration under Rule 144A of the Securities Act of 1933. These securities may be resold in transactions exempt from registration, normally to qualified institutional buyers. At the end of the period, the value of these securities amounted to $25,456,716 or 1.8% of net assets.
(e) Affiliated fund that is generally available only to investment companies and other accounts managed by Fidelity Investments. The rate quoted is the annualized seven-day yield of the fund at period end. A complete unaudited listing of the fund's holdings as of its most recent quarter end is available upon request. In addition, each Fidelity Central Fund's financial statements, which are not covered by the Fund's Report of Independent Registered Public Accounting Firm, are available on the SEC's website or upon request.
(f) Investment made with cash collateral received from securities on loan.
Affiliated Central Funds
Information regarding fiscal year to date income earned by the Fund from investments in Fidelity Central Funds is as follows:
| Fund | Income earned |
| Fidelity Cash Central Fund | $154,307 |
| Fidelity Securities Lending Cash Central Fund | 440,682 |
| Total | $594,989 |
Other Affiliated Issuers
An affiliated company is a company in which the Fund has ownership of at least 5% of the voting securities. Fiscal year to date transactions with companies which are or were affiliates are as follows:
| Affiliate | Value, beginning of period | Purchases | Sales Proceeds | Dividend Income | Realized Gain (loss) | Change in Unrealized appreciation (depreciation) | Value, end of period |
| Vostok Emerging Finance Ltd. (depository receipt) | $8,746,849 | $47,949 | $-- | $-- | $-- | $2,919,879 | $11,714,677 |
| Total | $8,746,849 | $47,949 | $-- | $-- | $-- | $2,919,879 | $11,714,677 |
Investment Valuation
The following is a summary of the inputs used, as of October 31, 2017, involving the Fund's assets and liabilities carried at fair value. The inputs or methodology used for valuing securities may not be an indication of the risk associated with investing in those securities. For more information on valuation inputs, and their aggregation into the levels used below, please refer to the Investment Valuation section in the accompanying Notes to Financial Statements.
| | Valuation Inputs at Reporting Date: |
| Description | Total | Level 1 | Level 2 | Level 3 |
| Investments in Securities: | | | | |
| Equities: | | | | |
| Consumer Discretionary | $237,817,035 | $237,817,035 | $-- | $-- |
| Consumer Staples | 84,549,149 | 23,879,953 | 60,669,196 | -- |
| Financials | 266,100,004 | 225,927,127 | 40,172,877 | -- |
| Health Care | 151,264,748 | 115,754,370 | 35,510,378 | -- |
| Industrials | 268,149,865 | 239,043,432 | 29,106,433 | -- |
| Information Technology | 145,831,248 | 102,247,255 | 43,583,993 | -- |
| Materials | 97,926,557 | 97,926,557 | -- | -- |
| Real Estate | 46,677,640 | 46,677,640 | -- | -- |
| Utilities | 4,506,697 | 4,506,697 | -- | -- |
| Money Market Funds | 28,311,026 | 28,311,026 | -- | -- |
| Total Investments in Securities: | $1,331,133,969 | $1,122,091,092 | $209,042,877 | $-- |
See accompanying notes which are an integral part of the financial statements.
Fidelity® Europe Fund
Financial Statements
Statement of Assets and Liabilities
| | | October 31, 2017 |
| Assets | | |
Investment in securities, at value (including securities loaned of $15,987,991) — See accompanying schedule:
Unaffiliated issuers (cost $1,082,251,869) | $1,291,108,266 | |
| Fidelity Central Funds (cost $28,312,287) | 28,311,026 | |
| Other affiliated issuers (cost $6,859,967) | 11,714,677 | |
| Total Investment in Securities (cost $1,117,424,123) | | $1,331,133,969 |
| Foreign currency held at value (cost $18) | | 18 |
| Receivable for investments sold | | 78,005,956 |
| Receivable for fund shares sold | | 1,222,809 |
| Dividends receivable | | 1,283,153 |
| Distributions receivable from Fidelity Central Funds | | 41,979 |
| Prepaid expenses | | 3,034 |
| Other receivables | | 163,560 |
| Total assets | | 1,411,854,478 |
| Liabilities | | |
| Payable for fund shares redeemed | $1,463,950 | |
| Accrued management fee | 920,390 | |
| Distribution and service plan fees payable | 16,710 | |
| Other affiliated payables | 252,571 | |
| Other payables and accrued expenses | 103,888 | |
| Collateral on securities loaned | 16,895,136 | |
| Total liabilities | | 19,652,645 |
| Net Assets | | $1,392,201,833 |
| Net Assets consist of: | | |
| Paid in capital | | $1,170,393,373 |
| Undistributed net investment income | | 11,925,792 |
| Accumulated undistributed net realized gain (loss) on investments and foreign currency transactions | | (3,762,839) |
| Net unrealized appreciation (depreciation) on investments and assets and liabilities in foreign currencies | | 213,645,507 |
| Net Assets | | $1,392,201,833 |
| Calculation of Maximum Offering Price | | |
| Class A: | | |
| Net Asset Value and redemption price per share ($20,925,236 ÷ 492,654 shares) | | $42.47 |
| Maximum offering price per share (100/94.25 of $42.47) | | $45.06 |
| Class M: | | |
| Net Asset Value and redemption price per share ($8,873,889 ÷ 208,967 shares) | | $42.47 |
| Maximum offering price per share (100/96.50 of $42.47) | | $44.01 |
| Class C: | | |
| Net Asset Value and offering price per share ($10,720,880 ÷ 254,337 shares)(a) | | $42.15 |
| Europe: | | |
| Net Asset Value, offering price and redemption price per share ($1,343,212,879 ÷ 31,581,803 shares) | | $42.53 |
| Class I: | | |
| Net Asset Value, offering price and redemption price per share ($8,468,949 ÷ 199,120 shares) | | $42.53 |
(a) Redemption price per share is equal to net asset value less any applicable contingent deferred sales charge.
See accompanying notes which are an integral part of the financial statements.
Statement of Operations
| | | Year ended October 31, 2017 |
| Investment Income | | |
| Dividends | | $25,640,247 |
| Income from Fidelity Central Funds | | 594,989 |
| Income before foreign taxes withheld | | 26,235,236 |
| Less foreign taxes withheld | | (2,345,172) |
| Total income | | 23,890,064 |
| Expenses | | |
| Management fee | | |
| Basic fee | $8,371,538 | |
| Performance adjustment | 597,984 | |
| Transfer agent fees | 2,232,646 | |
| Distribution and service plan fees | 172,086 | |
| Accounting and security lending fees | 556,523 | |
| Custodian fees and expenses | 121,167 | |
| Independent trustees' fees and expenses | 4,875 | |
| Registration fees | 93,013 | |
| Audit | 85,481 | |
| Legal | 8,157 | |
| Interest | 2,747 | |
| Miscellaneous | 10,268 | |
| Total expenses before reductions | 12,256,485 | |
| Expense reductions | (503,177) | 11,753,308 |
| Net investment income (loss) | | 12,136,756 |
| Realized and Unrealized Gain (Loss) | | |
| Net realized gain (loss) on: | | |
| Investment securities: | | |
| Unaffiliated issuers | 23,987,396 | |
| Fidelity Central Funds | (1,038) | |
| Foreign currency transactions | (21,372) | |
| Total net realized gain (loss) | | 23,964,986 |
| Change in net unrealized appreciation (depreciation) on: | | |
| Investment securities: | | |
| Unaffiliated issuers | 238,651,010 | |
| Fidelity Central Funds | (1,725) | |
| Other affiliated issuers | 2,919,879 | |
| Assets and liabilities in foreign currencies | 73,320 | |
| Total change in net unrealized appreciation (depreciation) | | 241,642,484 |
| Net gain (loss) | | 265,607,470 |
| Net increase (decrease) in net assets resulting from operations | | $277,744,226 |
See accompanying notes which are an integral part of the financial statements.
Statement of Changes in Net Assets
| | Year ended October 31, 2017 | Year ended October 31, 2016 |
| Increase (Decrease) in Net Assets | | |
| Operations | | |
| Net investment income (loss) | $12,136,756 | $11,518,138 |
| Net realized gain (loss) | 23,964,986 | (10,272,498) |
| Change in net unrealized appreciation (depreciation) | 241,642,484 | (89,926,922) |
| Net increase (decrease) in net assets resulting from operations | 277,744,226 | (88,681,282) |
| Distributions to shareholders from net investment income | (11,727,868) | (15,981,681) |
| Distributions to shareholders from net realized gain | (3,911,466) | (5,885,187) |
| Total distributions | (15,639,334) | (21,866,868) |
| Share transactions - net increase (decrease) | 25,014,944 | (219,773,724) |
| Redemption fees | 434 | 22,478 |
| Total increase (decrease) in net assets | 287,120,270 | (330,299,396) |
| Net Assets | | |
| Beginning of period | 1,105,081,563 | 1,435,380,959 |
| End of period | $1,392,201,833 | $1,105,081,563 |
| Other Information | | |
| Undistributed net investment income end of period | $11,925,792 | $11,516,901 |
See accompanying notes which are an integral part of the financial statements.
Financial Highlights
Fidelity Europe Fund Class A
| Years ended October 31, | 2017 | 2016 | 2015 | 2014 A |
| Selected Per–Share Data | | | | |
| Net asset value, beginning of period | $34.17 | $37.06 | $36.24 | $39.45 |
| Income from Investment Operations | | | | |
| Net investment income (loss)B | .26 | .22 | .37 | .47 |
| Net realized and unrealized gain (loss) | 8.39 | (2.67) | 1.29 | (3.68) |
| Total from investment operations | 8.65 | (2.45) | 1.66 | (3.21) |
| Distributions from net investment income | (.22) | (.29) | (.84) | – |
| Distributions from net realized gain | (.13) | (.15) | – | – |
| Total distributions | (.35) | (.44) | (.84) | – |
| Redemption fees added to paid in capitalB,C | – | – | – | – |
| Net asset value, end of period | $42.47 | $34.17 | $37.06 | $36.24 |
| Total ReturnD,E,F | 25.61% | (6.69)% | 4.63% | (8.14)% |
| Ratios to Average Net AssetsG,H | | | | |
| Expenses before reductions | 1.32% | 1.39% | 1.33% | 1.35%I |
| Expenses net of fee waivers, if any | 1.32% | 1.39% | 1.33% | 1.35%I |
| Expenses net of all reductions | 1.28% | 1.38% | 1.31% | 1.35%I |
| Net investment income (loss) | .70% | .62% | .98% | 1.94%I |
| Supplemental Data | | | | |
| Net assets, end of period (000 omitted) | $20,925 | $17,267 | $23,381 | $23,633 |
| Portfolio turnover rateJ | 73% | 62% | 87% | 80%K |
A For the period March 18, 2014 (commencement of sale of shares) to October 31, 2014.
B Calculated based on average shares outstanding during the period.
C Amount represents less than $.005 per share.
D Total returns for periods of less than one year are not annualized.
E Total returns would have been lower if certain expenses had not been reduced during the applicable periods shown.
F Total returns do not include the effect of the sales charges.
G Fees and expenses of any underlying Fidelity Central Funds are not included in the Fund's expense ratio. The Fund indirectly bears its proportionate share of the expenses of any underlying Fidelity Central Funds.
H Expense ratios reflect operating expenses of the class. Expenses before reductions do not reflect amounts reimbursed by the investment adviser or reductions from brokerage service arrangements or reductions from other expense offset arrangements and do not represent the amount paid by the class during periods when reimbursements or reductions occur. Expense ratios before reductions for start-up periods may not be representative of longer-term operating periods. Expenses net of fee waivers reflect expenses after reimbursement by the investment adviser but prior to reductions from brokerage service arrangements or other expense offset arrangements. Expenses net of all reductions represent the net expenses paid by the class.
I Annualized
J Amount does not include the portfolio activity of any underlying Fidelity Central Funds.
K The portfolio turnover rate does not include the assets acquired in the merger.
See accompanying notes which are an integral part of the financial statements.
Fidelity Europe Fund Class M
| Years ended October 31, | 2017 | 2016 | 2015 | 2014 A |
| Selected Per–Share Data | | | | |
| Net asset value, beginning of period | $34.13 | $36.94 | $36.18 | $39.45 |
| Income from Investment Operations | | | | |
| Net investment income (loss)B | .15 | .11 | .26 | .40 |
| Net realized and unrealized gain (loss) | 8.41 | (2.67) | 1.29 | (3.67) |
| Total from investment operations | 8.56 | (2.56) | 1.55 | (3.27) |
| Distributions from net investment income | (.09) | (.09) | (.79) | – |
| Distributions from net realized gain | (.13) | (.15) | – | – |
| Total distributions | (.22) | (.25)C | (.79) | – |
| Redemption fees added to paid in capitalB,D | – | – | – | – |
| Net asset value, end of period | $42.47 | $34.13 | $36.94 | $36.18 |
| Total ReturnE,F,G | 25.25% | (6.99)% | 4.33% | (8.29)% |
| Ratios to Average Net AssetsH,I | | | | |
| Expenses before reductions | 1.63% | 1.70% | 1.61% | 1.62%J |
| Expenses net of fee waivers, if any | 1.63% | 1.70% | 1.61% | 1.61%J |
| Expenses net of all reductions | 1.59% | 1.68% | 1.59% | 1.61%J |
| Net investment income (loss) | .39% | .31% | .70% | 1.68%J |
| Supplemental Data | | | | |
| Net assets, end of period (000 omitted) | $8,874 | $6,980 | $9,632 | $13,679 |
| Portfolio turnover rateK | 73% | 62% | 87% | 80%L |
A For the period March 18, 2014 (commencement of sale of shares) to October 31, 2014.
B Calculated based on average shares outstanding during the period.
C Total distributions of $.25 per share is comprised of distributions from net investment income of $.092 and distributions from net realized gain of $.154 per share.
D Amount represents less than $.005 per share.
E Total returns for periods of less than one year are not annualized.
F Total returns would have been lower if certain expenses had not been reduced during the applicable periods shown.
G Total returns do not include the effect of the sales charges.
H Fees and expenses of any underlying Fidelity Central Funds are not included in the Fund's expense ratio. The Fund indirectly bears its proportionate share of the expenses of any underlying Fidelity Central Funds.
I Expense ratios reflect operating expenses of the class. Expenses before reductions do not reflect amounts reimbursed by the investment adviser or reductions from brokerage service arrangements or reductions from other expense offset arrangements and do not represent the amount paid by the class during periods when reimbursements or reductions occur. Expense ratios before reductions for start-up periods may not be representative of longer-term operating periods. Expenses net of fee waivers reflect expenses after reimbursement by the investment adviser but prior to reductions from brokerage service arrangements or other expense offset arrangements. Expenses net of all reductions represent the net expenses paid by the class.
J Annualized
K Amount does not include the portfolio activity of any underlying Fidelity Central Funds.
L The portfolio turnover rate does not include the assets acquired in the merger.
See accompanying notes which are an integral part of the financial statements.
Fidelity Europe Fund Class C
| Years ended October 31, | 2017 | 2016 | 2015 | 2014 A |
| Selected Per–Share Data | | | | |
| Net asset value, beginning of period | $33.82 | $36.81 | $36.07 | $39.45 |
| Income from Investment Operations | | | | |
| Net investment income (loss)B | (.03) | (.06) | .07 | .29 |
| Net realized and unrealized gain (loss) | 8.36 | (2.65) | 1.29 | (3.67) |
| Total from investment operations | 8.33 | (2.71) | 1.36 | (3.38) |
| Distributions from net investment income | – | (.12) | (.62) | – |
| Distributions from net realized gain | – | (.15) | – | – |
| Total distributions | – | (.28)C | (.62) | – |
| Redemption fees added to paid in capitalB,D | – | – | – | – |
| Net asset value, end of period | $42.15 | $33.82 | $36.81 | $36.07 |
| Total ReturnE,F,G | 24.63% | (7.43)% | 3.79% | (8.57)% |
| Ratios to Average Net AssetsH,I | | | | |
| Expenses before reductions | 2.11% | 2.18% | 2.13% | 2.10%J |
| Expenses net of fee waivers, if any | 2.11% | 2.18% | 2.13% | 2.10%J |
| Expenses net of all reductions | 2.07% | 2.17% | 2.11% | 2.10%J |
| Net investment income (loss) | (.09)% | (.17)% | .18% | 1.19%J |
| Supplemental Data | | | | |
| Net assets, end of period (000 omitted) | $10,721 | $9,007 | $11,151 | $6,818 |
| Portfolio turnover rateK | 73% | 62% | 87% | 80%L |
A For the period March 18, 2014 (commencement of sale of shares) to October 31, 2014.
B Calculated based on average shares outstanding during the period.
C Total distributions of $.28 per share is comprised of distributions from net investment income of $.123 and distributions from net realized gain of $.154 per share.
D Amount represents less than $.005 per share.
E Total returns for periods of less than one year are not annualized.
F Total returns would have been lower if certain expenses had not been reduced during the applicable periods shown.
G Total returns do not include the effect of the contingent deferred sales charge.
H Fees and expenses of any underlying Fidelity Central Funds are not included in the Fund's expense ratio. The Fund indirectly bears its proportionate share of the expenses of any underlying Fidelity Central Funds.
I Expense ratios reflect operating expenses of the class. Expenses before reductions do not reflect amounts reimbursed by the investment adviser or reductions from brokerage service arrangements or reductions from other expense offset arrangements and do not represent the amount paid by the class during periods when reimbursements or reductions occur. Expense ratios before reductions for start-up periods may not be representative of longer-term operating periods. Expenses net of fee waivers reflect expenses after reimbursement by the investment adviser but prior to reductions from brokerage service arrangements or other expense offset arrangements. Expenses net of all reductions represent the net expenses paid by the class.
J Annualized
K Amount does not include the portfolio activity of any underlying Fidelity Central Funds.
L The portfolio turnover rate does not include the assets acquired in the merger.
See accompanying notes which are an integral part of the financial statements.
Fidelity Europe Fund
| Years ended October 31, | 2017 | 2016 | 2015 | 2014 | 2013 |
| Selected Per–Share Data | | | | | |
| Net asset value, beginning of period | $34.26 | $37.19 | $36.32 | $37.92 | $30.15 |
| Income from Investment Operations | | | | | |
| Net investment income (loss)A | .38 | .33 | .48 | .94B | .61 |
| Net realized and unrealized gain (loss) | 8.40 | (2.68) | 1.30 | (2.00) | 7.87 |
| Total from investment operations | 8.78 | (2.35) | 1.78 | (1.06) | 8.48 |
| Distributions from net investment income | (.38) | (.43) | (.91) | (.52) | (.70) |
| Distributions from net realized gain | (.13) | (.15) | – | (.02) | (.01) |
| Total distributions | (.51) | (.58) | (.91) | (.54) | (.71) |
| Redemption fees added to paid in capitalA,C | – | – | – | – | – |
| Net asset value, end of period | $42.53 | $34.26 | $37.19 | $36.32 | $37.92 |
| Total ReturnD | 26.05% | (6.42)% | 4.97% | (2.82)% | 28.71% |
| Ratios to Average Net AssetsE,F | | | | | |
| Expenses before reductions | 1.00% | 1.07% | 1.03% | .97% | 1.06% |
| Expenses net of fee waivers, if any | 1.00% | 1.07% | 1.03% | .97% | 1.05% |
| Expenses net of all reductions | .96% | 1.06% | 1.01% | .96% | 1.02% |
| Net investment income (loss) | 1.02% | .94% | 1.28% | 2.43%B | 1.82% |
| Supplemental Data | | | | | |
| Net assets, end of period (000 omitted) | $1,343,213 | $1,066,488 | $1,384,134 | $1,237,047 | $957,048 |
| Portfolio turnover rateG | 73% | 62% | 87% | 80%H | 59% |
A Calculated based on average shares outstanding during the period.
B Net Investment income per share reflects a large, non-recurring dividend which amounted to $.19 per share. Excluding this non-recurring dividend, the ratio of net investment income (loss) to average net assets would have been 1.93%.
C Amount represents less than $.005 per share.
D Total returns would have been lower if certain expenses had not been reduced during the applicable periods shown.
E Fees and expenses of any underlying Fidelity Central Funds are not included in the Fund's expense ratio. The Fund indirectly bears its proportionate share of the expenses of any underlying Fidelity Central Funds.
F Expense ratios reflect operating expenses of the class. Expenses before reductions do not reflect amounts reimbursed by the investment adviser or reductions from brokerage service arrangements or reductions from other expense offset arrangements and do not represent the amount paid by the class during periods when reimbursements or reductions occur. Expenses net of fee waivers reflect expenses after reimbursement by the investment adviser but prior to reductions from brokerage service arrangements or other expense offset arrangements. Expenses net of all reductions represent the net expenses paid by the class.
G Amount does not include the portfolio activity of any underlying Fidelity Central Funds.
H The portfolio turnover rate does not include the assets acquired in the merger.
See accompanying notes which are an integral part of the financial statements.
Fidelity Europe Fund Class I
| Years ended October 31, | 2017 | 2016 | 2015 | 2014 A |
| Selected Per–Share Data | | | | |
| Net asset value, beginning of period | $34.29 | $37.21 | $36.32 | $39.45 |
| Income from Investment Operations | | | | |
| Net investment income (loss)B | .39 | .35 | .50 | .56 |
| Net realized and unrealized gain (loss) | 8.38 | (2.67) | 1.30 | (3.69) |
| Total from investment operations | 8.77 | (2.32) | 1.80 | (3.13) |
| Distributions from net investment income | (.41) | (.45) | (.91) | – |
| Distributions from net realized gain | (.13) | (.15) | – | – |
| Total distributions | (.53)C | (.60) | (.91) | – |
| Redemption fees added to paid in capitalB,D | – | – | – | – |
| Net asset value, end of period | $42.53 | $34.29 | $37.21 | $36.32 |
| Total ReturnE,F | 26.04% | (6.33)% | 5.02% | (7.93)% |
| Ratios to Average Net AssetsG,H | | | | |
| Expenses before reductions | .98% | 1.01% | .98% | .97%I |
| Expenses net of fee waivers, if any | .98% | 1.01% | .98% | .97%I |
| Expenses net of all reductions | .94% | 1.00% | .96% | .96%I |
| Net investment income (loss) | 1.04% | 1.00% | 1.33% | 2.33%I |
| Supplemental Data | | | | |
| Net assets, end of period (000 omitted) | $8,469 | $5,340 | $6,552 | $5,666 |
| Portfolio turnover rateJ | 73% | 62% | 87% | 80%K |
A For the period March 18, 2014 (commencement of sale of shares) to October 31, 2014.
B Calculated based on average shares outstanding during the period.
C Total distributions of $.53 per share is comprised of distributions from net investment income of $.408 and distributions from net realized gain of $.126 per share.
D Amount represents less than $.005 per share.
E Total returns for periods of less than one year are not annualized.
F Total returns would have been lower if certain expenses had not been reduced during the applicable periods shown.
G Fees and expenses of any underlying Fidelity Central Funds are not included in the Fund's expense ratio. The Fund indirectly bears its proportionate share of the expenses of any underlying Fidelity Central Funds.
H Expense ratios reflect operating expenses of the class. Expenses before reductions do not reflect amounts reimbursed by the investment adviser or reductions from brokerage service arrangements or reductions from other expense offset arrangements and do not represent the amount paid by the class during periods when reimbursements or reductions occur. Expense ratios before reductions for start-up periods may not be representative of longer-term operating periods. Expenses net of fee waivers reflect expenses after reimbursement by the investment adviser but prior to reductions from brokerage service arrangements or other expense offset arrangements. Expenses net of all reductions represent the net expenses paid by the class.
I Annualized
J Amount does not include the portfolio activity of any underlying Fidelity Central Funds.
K The portfolio turnover rate does not include the assets acquired in the merger.
See accompanying notes which are an integral part of the financial statements.
Notes to Financial Statements
For the period ended October 31, 2017
1. Organization.
Fidelity Europe Fund (the Fund) is a fund of Fidelity Investment Trust (the Trust) and is authorized to issue an unlimited number of shares. The Trust is registered under the Investment Company Act of 1940, as amended (the 1940 Act), as an open-end management investment company organized as a Massachusetts business trust. The Fund offers Class A, Class M (formerly Class T), Class C, Europe and Class I shares, each of which has equal rights as to assets and voting privileges. Each class has exclusive voting rights with respect to matters that affect that class.
After the close of business on June 24, 2016, all outstanding Class B shares were converted to Class A shares. All prior fiscal period dollar and share amounts for Class B presented in the Notes to Financial Statements are for the period November 1, 2015 through June 24, 2016.
2. Investments in Fidelity Central Funds.
The Fund invests in Fidelity Central Funds, which are open-end investment companies generally available only to other investment companies and accounts managed by the investment adviser and its affiliates. The Fund's Schedule of Investments lists each of the Fidelity Central Funds held as of period end, if any, as an investment of the Fund, but does not include the underlying holdings of each Fidelity Central Fund. As an Investing Fund, the Fund indirectly bears its proportionate share of the expenses of the underlying Fidelity Central Funds.
The Money Market Central Funds seek preservation of capital and current income and are managed by Fidelity Investments Money Management, Inc. (FIMM), an affiliate of the investment adviser. Annualized expenses of the Money Market Central Funds as of their most recent shareholder report date are less than .005%.
A complete unaudited list of holdings for each Fidelity Central Fund is available upon request or at the Securities and Exchange Commission (the SEC) website at www.sec.gov. In addition, the financial statements of the Fidelity Central Funds, which are not covered by the Fund's Report of Independent Registered Public Accounting Firm, are available on the SEC website or upon request.
3. Significant Accounting Policies.
The Fund is an investment company and applies the accounting and reporting guidance of the Financial Accounting Standards Board (FASB) Accounting Standards Codification Topic 946 Financial Services – Investments Companies. The financial statements have been prepared in conformity with accounting principles generally accepted in the United States of America (GAAP), which require management to make certain estimates and assumptions at the date of the financial statements. Actual results could differ from those estimates. Subsequent events, if any, through the date that the financial statements were issued have been evaluated in the preparation of the financial statements. The following summarizes the significant accounting policies of the Fund:
Investment Valuation. Investments are valued as of 4:00 p.m. Eastern time on the last calendar day of the period. The Board of Trustees (the Board) has delegated the day to day responsibility for the valuation of the Fund's investments to the Fair Value Committee (the Committee) established by the Fund's investment adviser. In accordance with valuation policies and procedures approved by the Board, the Fund attempts to obtain prices from one or more third party pricing vendors or brokers to value its investments. When current market prices, quotations or currency exchange rates are not readily available or reliable, investments will be fair valued in good faith by the Committee, in accordance with procedures adopted by the Board. Factors used in determining fair value vary by investment type and may include market or investment specific events. The frequency with which these procedures are used cannot be predicted and they may be utilized to a significant extent. The Committee oversees the Fund's valuation policies and procedures and reports to the Board on the Committee's activities and fair value determinations. The Board monitors the appropriateness of the procedures used in valuing the Fund's investments and ratifies the fair value determinations of the Committee.
The Fund categorizes the inputs to valuation techniques used to value its investments into a disclosure hierarchy consisting of three levels as shown below:
- Level 1 – quoted prices in active markets for identical investments
- Level 2 – other significant observable inputs (including quoted prices for similar investments, interest rates, prepayment speeds, etc.)
- Level 3 – unobservable inputs (including the Fund's own assumptions based on the best information available)
Valuation techniques used to value the Fund's investments by major category are as follows:
Equity securities, including restricted securities, for which market quotations are readily available, are valued at the last reported sale price or official closing price as reported by a third party pricing vendor on the primary market or exchange on which they are traded and are categorized as Level 1 in the hierarchy. In the event there were no sales during the day or closing prices are not available, securities are valued at the last quoted bid price or may be valued using the last available price and are generally categorized as Level 2 in the hierarchy. For foreign equity securities, when market or security specific events arise, comparisons to the valuation of American Depositary Receipts (ADRs), futures contracts, Exchange-Traded Funds (ETFs) and certain indexes as well as quoted prices for similar securities may be used and would be categorized as Level 2 in the hierarchy. Utilizing these techniques may result in transfers between Level 1 and Level 2. For equity securities, including restricted securities, where observable inputs are limited, assumptions about market activity and risk are used and these securities may be categorized as Level 3 in the hierarchy.
Investments in open-end mutual funds, including the Fidelity Central Funds, are valued at their closing net asset value (NAV) each business day and are categorized as Level 1 in the hierarchy.
Changes in valuation techniques may result in transfers in or out of an assigned level within the disclosure hierarchy. The aggregate value of investments by input level as of October 31, 2017 is included at the end of the Fund's Schedule of Investments.
Foreign Currency. The Fund may use foreign currency contracts to facilitate transactions in foreign-denominated securities. Gains and losses from these transactions may arise from changes in the value of the foreign currency or if the counterparties do not perform under the contracts' terms.
Foreign-denominated assets, including investment securities, and liabilities are translated into U.S. dollars at the exchange rates at period end. Purchases and sales of investment securities, income and dividends received and expenses denominated in foreign currencies are translated into U.S. dollars at the exchange rate in effect on the transaction date.
The effects of exchange rate fluctuations on investments are included with the net realized and unrealized gain (loss) on investment securities. Other foreign currency transactions resulting in realized and unrealized gain (loss) are disclosed separately.
Investment Transactions and Income. For financial reporting purposes, the Fund's investment holdings and NAV include trades executed through the end of the last business day of the period. The NAV per share for processing shareholder transactions is calculated as of the close of business of the New York Stock Exchange (NYSE), normally 4:00 p.m. Eastern time and includes trades executed through the end of the prior business day. Gains and losses on securities sold are determined on the basis of identified cost and includes proceeds received from litigation. Dividend income is recorded on the ex-dividend date, except for certain dividends from foreign securities where the ex-dividend date may have passed, which are recorded as soon as the Fund is informed of the ex-dividend date. Non-cash dividends included in dividend income, if any, are recorded at the fair market value of the securities received. Income and capital gain distributions from Fidelity Central Funds, if any, are recorded on the ex-dividend date. Investment income is recorded net of foreign taxes withheld where recovery of such taxes is uncertain.
Class Allocations and Expenses. Investment income, realized and unrealized capital gains and losses, common expenses of the Fund, and certain fund-level expense reductions, if any, are allocated daily on a pro-rata basis to each class based on the relative net assets of each class to the total net assets of the Fund. Each class differs with respect to transfer agent and distribution and service plan fees incurred. Certain expense reductions may also differ by class. For the reporting period, the allocated portion of income and expenses to each class as a percent of its average net assets may vary due to the timing of recording these transactions in relation to fluctuating net assets of the classes. Expenses directly attributable to a fund are charged to that fund. Expenses attributable to more than one fund are allocated among the respective funds on the basis of relative net assets or other appropriate methods. Expense estimates are accrued in the period to which they relate and adjustments are made when actual amounts are known.
Income Tax Information and Distributions to Shareholders. Each year, the Fund intends to qualify as a regulated investment company under Subchapter M of the Internal Revenue Code, including distributing substantially all of its taxable income and realized gains. As a result, no provision for U.S. Federal income taxes is required. As of October 31, 2017, the Fund did not have any unrecognized tax benefits in the financial statements; nor is the Fund aware of any tax positions for which it is reasonably possible that the total amounts of unrecognized tax benefits will significantly change in the next twelve months. The Fund files a U.S. federal tax return, in addition to state and local tax returns as required. The Fund's federal income tax returns are subject to examination by the Internal Revenue Service (IRS) for a period of three fiscal years after they are filed. State and local tax returns may be subject to examination for an additional fiscal year depending on the jurisdiction. Foreign taxes are provided for based on the Fund's understanding of the tax rules and rates that exist in the foreign markets in which it invests.
Distributions are declared and recorded on the ex-dividend date. Income dividends and capital gain distributions are declared separately for each class. Income and capital gain distributions are determined in accordance with income tax regulations, which may differ from GAAP.
Capital accounts within the financial statements are adjusted for permanent book-tax differences. These adjustments have no impact on net assets or the results of operations. Capital accounts are not adjusted for temporary book-tax differences which will reverse in a subsequent period.
Book-tax differences are primarily due to foreign currency transactions, passive foreign investment companies (PFIC), deferred trustees compensation, expiring capital loss carryforwards, capital loss carryforwards and losses deferred due to wash sales.
As of period end, the cost and unrealized appreciation (depreciation) in securities, and derivatives if applicable, for federal income tax purposes were as follows:
| Gross unrealized appreciation | $234,800,448 |
| Gross unrealized depreciation | (44,145,250) |
| Net unrealized appreciation (depreciation) | $190,655,198 |
| Tax Cost | $1,140,478,771 |
The tax-based components of distributable earnings as of period end were as follows:
| Undistributed ordinary income | $31,219,073 |
| Net unrealized appreciation (depreciation) on securities and other investments | $190,590,859 |
The tax character of distributions paid was as follows:
| | October 31, 2017 | October 31, 2016 |
| Ordinary Income | $15,639,334 | $ 21,866,868 |
Short-Term Trading (Redemption) Fees. Shares held by investors in the Fund less than 90 days may have been subject to a redemption fee equal to 1.00% of the NAV of shares redeemed. All redemption fees, which reduce the proceeds of the shareholder redemption, are retained by the Fund and accounted for as an addition to paid in capital. In November 2016, the Board of Trustees approved the elimination of these redemption fees effective December 12, 2016.
Restricted Securities. The Fund may invest in securities that are subject to legal or contractual restrictions on resale. These securities generally may be resold in transactions exempt from registration or to the public if the securities are registered. Disposal of these securities may involve time-consuming negotiations and expense, and prompt sale at an acceptable price may be difficult. Information regarding restricted securities is included at the end of the Fund's Schedule of Investments.
4. Purchases and Sales of Investments.
Purchases and sales of securities, other than short-term securities, aggregated $861,032,771 and $924,236,987, respectively.
5. Fees and Other Transactions with Affiliates.
Management Fee. Fidelity Management & Research Company (the investment adviser) and its affiliates provide the Fund with investment management related services for which the Fund pays a monthly management fee. The management fee is the sum of an individual fund fee rate that is based on an annual rate of .45% of the Fund's average net assets and an annualized group fee rate that averaged .25% during the period. The group fee rate is based upon the average net assets of all the mutual funds advised by the investment adviser, including any mutual funds previously advised by the investment adviser that are currently advised by Fidelity SelectCo, LLC, an affiliate of the investment adviser. The group fee rate decreases as assets under management increase and increases as assets under management decrease. In addition, the management fee is subject to a performance adjustment (up to a maximum of +/- .20% of the Fund's average net assets over a 36 month performance period). The upward or downward adjustment to the management fee is based on the relative investment performance of Europe as compared to its benchmark index, the MSCI Europe Index, over the same 36 month performance period. For the reporting period, the total annual management fee rate, including the performance adjustment, was .74% of the Fund's average net assets. The performance adjustment included in the management fee rate may be higher or lower than the maximum performance adjustment rate due to the difference between the average net assets for the reporting and performance periods.
Distribution and Service Plan Fees. In accordance with Rule 12b-1 of the 1940 Act, the Fund has adopted separate Distribution and Service Plans for each class of shares. Certain classes pay Fidelity Distributors Corporation (FDC), an affiliate of the investment adviser, separate Distribution and Service Fees, each of which is based on an annual percentage of each class' average net assets. In addition, FDC may pay financial intermediaries for selling shares of the Fund and providing shareholder support services. For the period, the Distribution and Service Fee rates, total fees and amounts retained by FDC were as follows:
| | Distribution
Fee | Service
Fee | Total Fees | Retained
by FDC |
| Class A | -% | .25% | $43,317 | $2,453 |
| Class M | .25% | .25% | 37,584 | – |
| Class C | .75% | .25% | 91,185 | 9,823 |
| | | | $172,086 | $12,276 |
Sales Load. FDC may receive a front-end sales charge of up to 5.75% for selling Class A shares and 3.50% for selling Class M shares, some of which is paid to financial intermediaries for selling shares of the Fund. Depending on the holding period, FDC may receive contingent deferred sales charges levied on Class A, Class M and Class C redemptions. The deferred sales charges are 1.00% for Class C shares, 1.00% for certain purchases of Class A shares and .25% for certain purchases of Class M shares.
For the period, sales charge amounts retained by FDC were as follows:
| | Retained
by FDC |
| Class A | $9,023 |
| Class M | 1,838 |
| Class C(a) | 454 |
| | $11,315 |
(a) When Class C shares are initially sold, FDC pays commissions from its own resources to financial intermediaries through which the sales are made.
Transfer Agent Fees. Fidelity Investments Institutional Operations Company, Inc., (FIIOC), an affiliate of the investment adviser, is the transfer, dividend disbursing and shareholder servicing agent for each class of the Fund. FIIOC receives account fees and asset-based fees that vary according to the account size and type of account of the shareholders of the respective classes of the Fund. FIIOC pays for typesetting, printing and mailing of shareholder reports, except proxy statements.
For the period, transfer agent fees for each class were as follows:
| | Amount | % of
Class-Level Average
Net Assets |
| Class A | $44,947 | .26 |
| Class M | 23,576 | .31 |
| Class C | 26,783 | .29 |
| Europe | 2,126,814 | .18 |
| Class I | 10,526 | .16 |
| | $2,232,646 | |
Accounting and Security Lending Fees. Fidelity Service Company, Inc. (FSC), an affiliate of the investment adviser, maintains the Fund's accounting records. The accounting fee is based on the level of average net assets for each month. Under a separate contract, FSC administers the security lending program. The security lending fee is based on the number and duration of lending transactions.
Interfund Lending Program. Pursuant to an Exemptive Order issued by the SEC, the Fund, along with other registered investment companies having management contracts with Fidelity Management & Research Company (FMR) or other affiliated entities of FMR, may participate in an interfund lending program. This program provides an alternative credit facility allowing the funds to borrow from, or lend money to, other participating affiliated funds. At period end, there were no interfund loans outstanding. The Fund's activity in this program during the period for which loans were outstanding was as follows:
| Borrower or Lender | Average Loan Balance | Weighted Average Interest Rate | Interest Expense |
| Borrower | $16,487,800 | .60% | $2,747 |
Interfund Trades. The Fund may purchase from or sell securities to other Fidelity Funds under procedures adopted by the Board. The procedures have been designed to ensure these interfund trades are executed in accordance with Rule 17a-7 of the 1940 Act. Interfund trades are included within the respective purchases and sales amounts shown in the Purchases and Sales of Investments note.
6. Committed Line of Credit.
The Fund participates with other funds managed by the investment adviser or an affiliate in a $4.25 billion credit facility (the "line of credit") to be utilized for temporary or emergency purposes to fund shareholder redemptions or for other short-term liquidity purposes. The Fund has agreed to pay commitment fees on its pro-rata portion of the line of credit, which amounted to $3,773 and is reflected in Miscellaneous expenses on the Statement of Operations. During the period, the Fund did not borrow on this line of credit.
7. Security Lending.
The Fund lends portfolio securities through a lending agent from time to time in order to earn additional income. For equity securities, a lending agent is used and may loan securities to certain qualified borrowers, including Fidelity Capital Markets (FCM), a broker-dealer affiliated with the Fund. On the settlement date of the loan, the Fund receives collateral (in the form of U.S. Treasury obligations, letters of credit and/or cash) against the loaned securities and maintains collateral in an amount not less than 100% of the market value of the loaned securities during the period of the loan. The market value of the loaned securities is determined at the close of business of the Fund and any additional required collateral is delivered to the Fund on the next business day. The Fund or borrower may terminate the loan at any time, and if the borrower defaults on its obligation to return the securities loaned because of insolvency or other reasons, the Fund may apply collateral received from the borrower against the obligation. The Fund may experience delays and costs in recovering the securities loaned. Any cash collateral received is invested in the Fidelity Securities Lending Cash Central Fund. The value of loaned securities and cash collateral at period end are disclosed on the Fund's Statement of Assets and Liabilities. Security lending income represents the income earned on investing cash collateral, less rebates paid to borrowers and any lending agent fees associated with the loan, plus any premium payments received for lending certain types of securities. Security lending income is presented in the Statement of Operations as a component of income from Fidelity Central Funds. Total security lending income during the period amounted to $440,682. During the period, there were no securities loaned to FCM.
8. Expense Reductions.
Commissions paid to certain brokers with whom the investment adviser, or its affiliates, places trades on behalf of the Fund include an amount in addition to trade execution, which may be rebated back to the Fund to offset certain expenses. This amount totaled $493,713 for the period.
In addition, during the period the investment adviser reimbursed and/or waived a portion of fund-level operating expenses in the amount of $9,464.
9. Distributions to Shareholders.
Distributions to shareholders of each class were as follows:
| | Year ended October 31, 2017 | Year ended October 31, 2016 |
| From net investment income | | |
| Class A | $107,755 | $174,443 |
| Class M | 18,342 | 23,347 |
| Class C | – | 38,160 |
| Europe | 11,539,715 | 15,664,870 |
| Class I | 62,056 | 80,861 |
| Total | $11,727,868 | $15,981,681 |
| From net realized gain | | |
| Class A | $60,612 | $94,260 |
| Class M | 25,396 | 39,080 |
| Class C | – | 47,778 |
| Europe | 3,806,294 | 5,676,211 |
| Class I | 19,164 | 27,858 |
| Total | $3,911,466 | $5,885,187 |
10. Share Transactions.
Share transactions for each class were as follows and may contain automatic conversions between classes or exchanges between affiliated funds:
| | Shares | Shares | Dollars | Dollars |
| | Year ended October 31, 2017 | Year ended October 31, 2016 | Year ended October 31, 2017 | Year ended October 31, 2016 |
| Class A | | | | |
| Shares sold | 183,985 | 144,459 | $7,204,193 | $5,004,460 |
| Reinvestment of distributions | 4,870 | 7,044 | 160,602 | 257,822 |
| Shares redeemed | (201,553) | (277,024) | (7,350,664) | (9,579,027) |
| Net increase (decrease) | (12,698) | (125,521) | $14,131 | $(4,316,745) |
| Class M | | | | |
| Shares sold | 58,824 | 18,157 | $2,231,944 | $629,088 |
| Reinvestment of distributions | 1,308 | 1,677 | 43,252 | 61,481 |
| Shares redeemed | (55,679) | (76,071) | (2,027,896) | (2,635,140) |
| Net increase (decrease) | 4,453 | (56,237) | $247,300 | $(1,944,571) |
| Class B | | | | |
| Shares sold | – | 183 | $– | $6,069 |
| Shares redeemed | – | (14,607) | – | (499,471) |
| Net increase (decrease) | – | (14,424) | $– | $(493,402) |
| Class C | | | | |
| Shares sold | 65,577 | 64,049 | $2,522,918 | $2,232,592 |
| Reinvestment of distributions | – | 2,232 | – | 81,438 |
| Shares redeemed | (77,588) | (102,859) | (2,798,078) | (3,518,604) |
| Net increase (decrease) | (12,011) | (36,578) | $(275,160) | $(1,204,574) |
| Europe | | | | |
| Shares sold | 6,873,387 | 2,489,815 | $263,271,628 | $86,835,858 |
| Reinvestment of distributions | 443,969 | 559,844 | 14,619,907 | 20,484,708 |
| Shares redeemed | (6,861,890) | (9,143,028) | (254,648,472) | (318,516,566) |
| Net increase (decrease) | 455,466 | (6,093,369) | $23,243,063 | $(211,196,000) |
| Class I | | | | |
| Shares sold | 152,572 | 73,750 | $5,796,106 | $2,648,638 |
| Reinvestment of distributions | 2,369 | 2,803 | 78,022 | 102,586 |
| Shares redeemed | (111,570) | (96,879) | (4,088,518) | (3,369,656) |
| Net increase (decrease) | 43,371 | (20,326) | $1,785,610 | $(618,432) |
11. Other.
The Fund's organizational documents provide former and current trustees and officers with a limited indemnification against liabilities arising in connection with the performance of their duties to the Fund. In the normal course of business, the Fund may also enter into contracts that provide general indemnifications. The Fund's maximum exposure under these arrangements is unknown as this would be dependent on future claims that may be made against the Fund. The risk of material loss from such claims is considered remote.
Fidelity® Japan Fund
Performance: The Bottom Line
Average annual total return reflects the change in the value of an investment, assuming reinvestment of distributions from dividend income and capital gains (the profits earned upon the sale of securities that have grown in value, if any) and assuming a constant rate of performance each year. The hypothetical investment and the average annual total returns do not reflect the deduction of taxes that a shareholder would pay on fund distributions or the redemption of fund shares. During periods of reimbursement by Fidelity, a fund’s total return will be greater than it would be had the reimbursement not occurred. How a fund did yesterday is no guarantee of how it will do tomorrow.
Average Annual Total Returns
| For the periods ended October 31, 2017 | Past 1 year | Past 5 years | Past 10 years |
| Fidelity® Japan Fund | 21.13% | 11.44% | 1.26% |
$10,000 Over 10 Years
Let's say hypothetically that $10,000 was invested in Fidelity® Japan Fund, a class of the fund, on October 31, 2007.
The chart shows how the value of your investment would have changed, and also shows how the Tokyo Stock Price Index (TOPIX) performed over the same period.
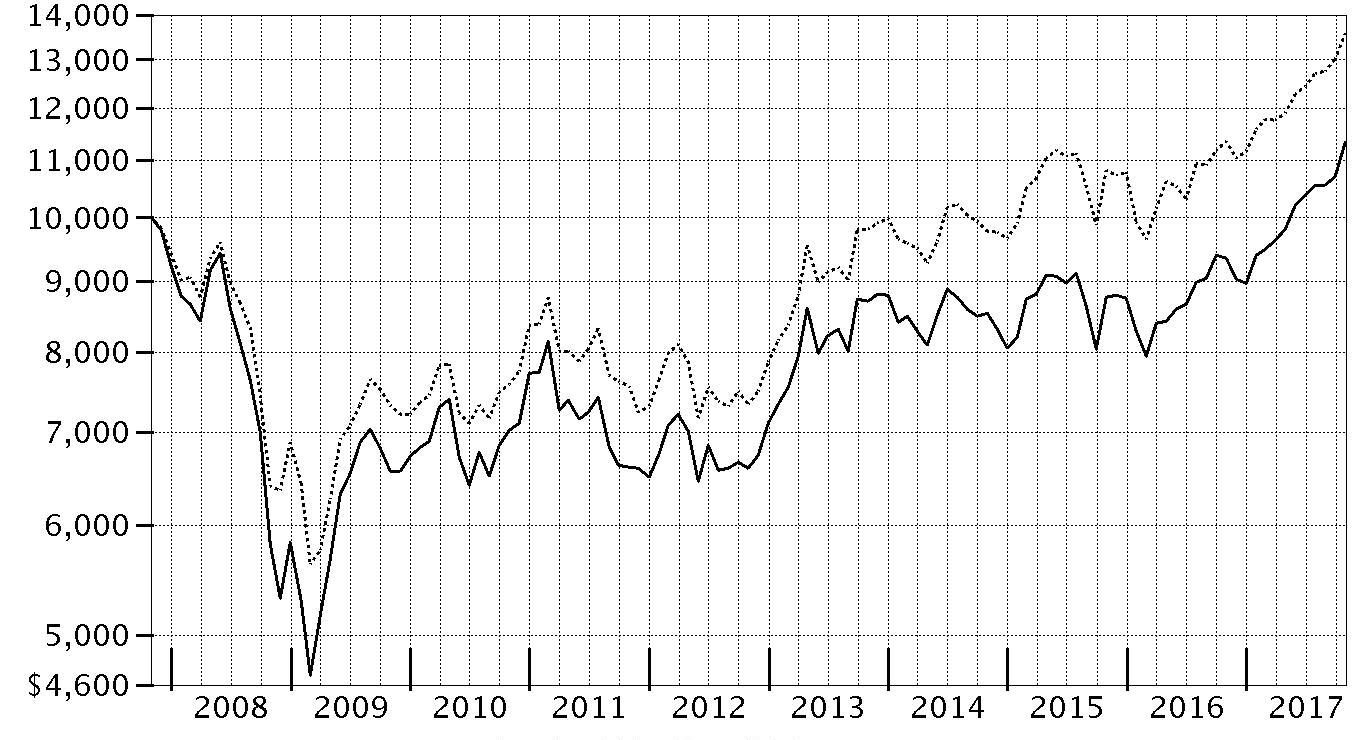
| Period Ending Values |
| $11,329 | Fidelity® Japan Fund |
| $13,585 | Tokyo Stock Price Index (TOPIX) |
Fidelity® Japan Fund
Management's Discussion of Fund Performance
Market Recap: The MSCI ACWI (All Country World Index) ex USA Index returned 23.85% for the 12 months ending October 31, 2017, helped partly by a generally weak U.S. dollar. Some favorable election results in continental Europe (+30%) suggested ebbing political uncertainty and near-term risk there, but the U.K. (+20%) faced more-mixed conditions ahead of its expected exit from the European Union. Despite central-bank easing – and pressured recently by yen strength – Japan (+18%) lagged the rest of the Asia-Pacific group (+22%). Commodity-price volatility slowed Canada (+17%), but the emerging-markets group (+26%) sped ahead. Sector-wise, information technology (+47%) was driven by a surge among several Chinese internet-related names. Financials (+27%) rode rising interest rates that, at the same time, weighed on real estate (+17%), utilities (+16%), consumer staples (+14%) and telecommunication services (+9%) – so-called “bond proxy” sectors. Materials (+28%) and industrials (+27%) responded to demand from China and price gains for certain commodities. In the energy sector (+20%), oil prices lost ground in the spring before rebounding through October 31 to end well above where they started 12 months ago. Lastly, health care (+14%) was hurt by early-period turmoil around drug pricing and health care legislation.
Comments from Portfolio Manager Kirk Neureiter: For the fiscal year, the fund’s share classes (excluding sales charges, if applicable) gained roughly 20% to 21%, topping the 19.70% advance of the benchmark Tokyo Stock Price Index. Versus the benchmark, stock selection in the industrials and consumer discretionary sectors particularly aided the fund, along with positioning in real estate. The top relative contributor was Sumco, a manufacturer of silicon wafers for the semiconductor and solar photovoltaic-cell industries. Demand from both traditional sources such as computer manufacturing and newer applications drove expanding wafer demand and firmer pricing. Other notable relative contributors included automaker Suzuki Motor, Shimadzu, which manufactures measuring equipment of various kinds, and SMC, a leading global manufacturer of pneumatic equipment. The fund's results also reflect a positive fair-value adjustment of 1.33 percentage points. Turning to detractors, stock picking in information technology, materials and consumer staples weighed on relative performance. At the stock level, a sizable overweighting in telephone-service provider KDDI was our biggest detractor. This stock, which is considered somewhat defensive, struggled this period, as investors generally preferred more-aggressive investments. Lastly, price-comparison website Kakaku disappointed.
The views expressed above reflect those of the portfolio manager(s) only through the end of the period as stated on the cover of this report and do not necessarily represent the views of Fidelity or any other person in the Fidelity organization. Any such views are subject to change at any time based upon market or other conditions and Fidelity disclaims any responsibility to update such views. These views may not be relied on as investment advice and, because investment decisions for a Fidelity fund are based on numerous factors, may not be relied on as an indication of trading intent on behalf of any Fidelity fund.
Fidelity® Japan Fund
Investment Summary (Unaudited)
Geographic Diversification (% of fund's net assets)
| As of October 31, 2017 |
| | Japan | 98.2% |
| | United States of America* | 1.1% |
| | Hong Kong | 0.7% |

* Includes Short-Term investments and Net Other Assets (Liabilities).
Percentages are based on country or territory of incorporation and are adjusted for the effect of futures contracts, if applicable.
| As of April 30, 2017 |
| | Japan | 97.8% |
| | Hong Kong | 1.0% |
| | Cayman Islands | 0.7% |
| | United States of America* | 0.5% |

* Includes Short-Term investments and Net Other Assets (Liabilities).
Percentages are based on country or territory of incorporation and are adjusted for the effect of futures contracts, if applicable.
Asset Allocation as of October 31, 2017
| | % of fund's net assets | % of fund's net assets 6 months ago |
| Stocks | 98.9 | 99.5 |
| Short-Term Investments and Net Other Assets (Liabilities) | 1.1 | 0.5 |
Top Ten Stocks as of October 31, 2017
| | % of fund's net assets | % of fund's net assets 6 months ago |
| SoftBank Corp. (Wireless Telecommunication Services) | 5.1 | 4.4 |
| Sony Corp. (Household Durables) | 4.1 | 3.7 |
| Mitsubishi UFJ Financial Group, Inc. (Banks) | 3.8 | 3.9 |
| Hoya Corp. (Health Care Equipment & Supplies) | 3.5 | 3.6 |
| ORIX Corp. (Diversified Financial Services) | 3.4 | 3.4 |
| KDDI Corp. (Wireless Telecommunication Services) | 3.2 | 3.7 |
| Shimadzu Corp. (Electronic Equipment & Components) | 2.7 | 2.5 |
| East Japan Railway Co. (Road & Rail) | 2.7 | 2.7 |
| Nidec Corp. (Electrical Equipment) | 2.5 | 2.0 |
| Suzuki Motor Corp. (Automobiles) | 2.5 | 2.2 |
| | 33.5 | |
Top Market Sectors as of October 31, 2017
| | % of fund's net assets | % of fund's net assets 6 months ago |
| Consumer Discretionary | 19.2 | 19.9 |
| Industrials | 18.2 | 17.0 |
| Information Technology | 14.9 | 14.6 |
| Financials | 11.3 | 12.7 |
| Consumer Staples | 8.8 | 10.0 |
| Health Care | 8.7 | 9.6 |
| Materials | 8.5 | 7.6 |
| Telecommunication Services | 8.3 | 8.1 |
| Real Estate | 0.7 | 0.0 |
| Multi Sector | 0.3 | 0.0 |
Percentages shown as 0.0% may reflect amounts less than 0.05%.
Fidelity® Japan Fund
Investments October 31, 2017
Showing Percentage of Net Assets
| Common Stocks - 98.9% | | | |
| | | Shares | Value |
| CONSUMER DISCRETIONARY - 19.2% | | | |
| Auto Components - 2.8% | | | |
| Bridgestone Corp. | | 143,900 | $6,874,160 |
| DaikyoNishikawa Corp. | | 109,000 | 1,852,296 |
| Sumitomo Electric Industries Ltd. | | 249,000 | 4,239,311 |
| | | | 12,965,767 |
| Automobiles - 5.5% | | | |
| Honda Motor Co. Ltd. | | 278,800 | 8,736,777 |
| Subaru Corp. | | 145,900 | 5,040,715 |
| Suzuki Motor Corp. | | 206,500 | 11,310,680 |
| | | | 25,088,172 |
| Household Durables - 7.9% | | | |
| Panasonic Corp. | | 399,400 | 6,030,686 |
| Rinnai Corp. | | 38,600 | 3,307,341 |
| Sekisui Chemical Co. Ltd. | | 123,500 | 2,492,763 |
| Sekisui House Ltd. | | 121,100 | 2,264,385 |
| Sony Corp. | | 445,200 | 18,624,805 |
| Techtronic Industries Co. Ltd. | | 543,500 | 3,187,264 |
| | | | 35,907,244 |
| Internet & Direct Marketing Retail - 0.3% | | | |
| Start Today Co. Ltd. | | 55,600 | 1,522,864 |
| Media - 1.5% | | | |
| Dentsu, Inc. | | 89,500 | 3,828,270 |
| LIFULL Co. Ltd. | | 388,900 | 2,988,468 |
| | | | 6,816,738 |
| Specialty Retail - 1.2% | | | |
| Nitori Holdings Co. Ltd. | | 18,600 | 2,703,163 |
| USS Co. Ltd. | | 147,400 | 2,979,663 |
| | | | 5,682,826 |
|
| TOTAL CONSUMER DISCRETIONARY | | | 87,983,611 |
|
| CONSUMER STAPLES - 8.8% | | | |
| Food & Staples Retailing - 5.2% | | | |
| Ain Holdings, Inc. | | 39,300 | 2,688,689 |
| San-A Co. Ltd. | | 49,600 | 2,282,505 |
| Seven & i Holdings Co. Ltd. | | 192,700 | 7,766,672 |
| Sundrug Co. Ltd. | | 91,200 | 3,968,889 |
| Tsuruha Holdings, Inc. | | 22,800 | 2,826,804 |
| Welcia Holdings Co. Ltd. | | 112,300 | 4,262,034 |
| | | | 23,795,593 |
| Food Products - 0.9% | | | |
| Japan Meat Co. Ltd. | | 92,700 | 1,482,799 |
| Morinaga & Co. Ltd. | | 46,300 | 2,630,293 |
| | | | 4,113,092 |
| Personal Products - 1.9% | | | |
| Kao Corp. | | 85,500 | 5,167,205 |
| Kose Corp. | | 29,700 | 3,611,901 |
| | | | 8,779,106 |
| Tobacco - 0.8% | | | |
| Japan Tobacco, Inc. | | 106,100 | 3,511,931 |
|
| TOTAL CONSUMER STAPLES | | | 40,199,722 |
|
| FINANCIALS - 11.3% | | | |
| Banks - 4.7% | | | |
| Mitsubishi UFJ Financial Group, Inc. | | 2,551,400 | 17,306,515 |
| Shinsei Bank Ltd. | | 245,900 | 4,149,752 |
| | | | 21,456,267 |
| Consumer Finance - 0.7% | | | |
| AEON Financial Service Co. Ltd. | | 149,300 | 3,206,439 |
| Diversified Financial Services - 3.4% | | | |
| ORIX Corp. | | 912,300 | 15,685,734 |
| Insurance - 2.5% | | | |
| Sony Financial Holdings, Inc. | | 201,600 | 3,349,278 |
| Tokio Marine Holdings, Inc. | | 187,900 | 8,099,848 |
| | | | 11,449,126 |
|
| TOTAL FINANCIALS | | | 51,797,566 |
|
| HEALTH CARE - 8.7% | | | |
| Biotechnology - 0.6% | | | |
| PeptiDream, Inc. (a)(b) | | 88,600 | 2,811,604 |
| Health Care Equipment & Supplies - 6.7% | | | |
| Hoya Corp. | | 291,000 | 15,810,246 |
| Nakanishi, Inc. | | 26,500 | 1,200,971 |
| Olympus Corp. | | 259,300 | 9,649,765 |
| Paramount Bed Holdings Co. Ltd. | | 88,800 | 3,916,005 |
| | | | 30,576,987 |
| Health Care Providers & Services - 0.9% | | | |
| Ship Healthcare Holdings, Inc. | | 140,300 | 4,387,447 |
| Pharmaceuticals - 0.5% | | | |
| Astellas Pharma, Inc. | | 167,600 | 2,230,564 |
|
| TOTAL HEALTH CARE | | | 40,006,602 |
|
| INDUSTRIALS - 18.2% | | | |
| Building Products - 2.6% | | | |
| Daikin Industries Ltd. | | 64,500 | 7,127,951 |
| Toto Ltd. | | 102,200 | 5,005,150 |
| | | | 12,133,101 |
| Commercial Services & Supplies - 1.1% | | | |
| Sohgo Security Services Co., Ltd. | | 102,100 | 4,918,966 |
| Construction & Engineering - 1.0% | | | |
| Toshiba Plant Systems & Services Corp. | | 252,800 | 4,360,646 |
| Electrical Equipment - 4.0% | | | |
| Mitsubishi Electric Corp. | | 406,200 | 6,951,506 |
| Nidec Corp. | | 85,400 | 11,356,741 |
| | | | 18,308,247 |
| Machinery - 3.2% | | | |
| Komatsu Ltd. | | 78,800 | 2,574,851 |
| Minebea Mitsumi, Inc. | | 245,400 | 4,498,947 |
| SMC Corp. | | 20,400 | 7,804,233 |
| | | | 14,878,031 |
| Professional Services - 1.4% | | | |
| Benefit One, Inc. | | 158,600 | 3,046,928 |
| Outsourcing, Inc. (a) | | 244,000 | 3,363,800 |
| | | | 6,410,728 |
| Road & Rail - 2.7% | | | |
| East Japan Railway Co. | | 127,300 | 12,345,505 |
| Trading Companies & Distributors - 2.2% | | | |
| Misumi Group, Inc. | | 276,800 | 7,583,642 |
| Trusco Nakayama Corp. | | 92,600 | 2,369,186 |
| | | | 9,952,828 |
|
| TOTAL INDUSTRIALS | | | 83,308,052 |
|
| INFORMATION TECHNOLOGY - 14.9% | | | |
| Electronic Equipment & Components - 7.4% | | | |
| Anritsu Corp. | | 132,600 | 1,248,575 |
| Azbil Corp. | | 96,400 | 4,209,478 |
| Iriso Electronics Co. Ltd. | | 36,200 | 2,041,761 |
| Murata Manufacturing Co. Ltd. | | 26,500 | 4,164,793 |
| Shimadzu Corp. | | 602,000 | 12,516,854 |
| TDK Corp. | | 55,400 | 4,256,899 |
| Topcon Corp. | | 248,400 | 5,252,063 |
| | | | 33,690,423 |
| Internet Software & Services - 3.1% | | | |
| DeNA Co. Ltd. | | 143,800 | 3,381,795 |
| Kakaku.com, Inc. | | 344,900 | 4,735,831 |
| SMS Co., Ltd. | | 83,700 | 2,521,415 |
| Yahoo! Japan Corp. | | 742,400 | 3,319,166 |
| | | | 13,958,207 |
| IT Services - 1.2% | | | |
| Fujitsu Ltd. | | 316,000 | 2,462,429 |
| IT Holdings Corp. | | 44,200 | 1,375,492 |
| Otsuka Corp. | | 25,900 | 1,765,564 |
| | | | 5,603,485 |
| Semiconductors & Semiconductor Equipment - 1.7% | | | |
| Renesas Electronics Corp. (b) | | 167,600 | 2,166,916 |
| Sumco Corp. | | 258,900 | 5,702,678 |
| | | | 7,869,594 |
| Software - 1.5% | | | |
| Nintendo Co. Ltd. | | 17,600 | 6,828,128 |
|
| TOTAL INFORMATION TECHNOLOGY | | | 67,949,837 |
|
| MATERIALS - 8.5% | | | |
| Chemicals - 8.5% | | | |
| Daicel Chemical Industries Ltd. | | 208,300 | 2,600,754 |
| Hitachi Chemical Co. Ltd. | | 134,900 | 3,846,784 |
| JSR Corp. | | 245,000 | 4,749,293 |
| Kansai Paint Co. Ltd. | | 172,100 | 4,423,476 |
| Nissan Chemical Industries Co. Ltd. | | 79,200 | 2,954,118 |
| Okamoto Industries, Inc. | | 131,000 | 1,425,335 |
| Shin-Etsu Chemical Co. Ltd. | | 87,600 | 9,238,404 |
| Sumitomo Chemical Co. Ltd. | | 602,000 | 4,230,766 |
| Toray Industries, Inc. | | 524,000 | 5,303,742 |
| | | | 38,772,672 |
| MULTI SECTOR - 0.3% | | | |
| Insource Co. Ltd. | | 65,900 | 1,144,360 |
| REAL ESTATE - 0.7% | | | |
| Real Estate Management & Development - 0.7% | | | |
| Investors Cloud Co. Ltd. (a) | | 50,800 | 3,097,948 |
| TELECOMMUNICATION SERVICES - 8.3% | | | |
| Wireless Telecommunication Services - 8.3% | | | |
| KDDI Corp. | | 548,000 | 14,600,167 |
| SoftBank Corp. | | 264,500 | 23,440,568 |
| | | | 38,040,735 |
| TOTAL COMMON STOCKS | | | |
| (Cost $339,896,835) | | | 452,301,105 |
|
| Money Market Funds - 2.0% | | | |
| Fidelity Cash Central Fund, 1.10% (c) | | 1,860,046 | 1,860,418 |
| Fidelity Securities Lending Cash Central Fund 1.11% (c)(d) | | 7,156,005 | 7,156,720 |
| TOTAL MONEY MARKET FUNDS | | | |
| (Cost $9,017,646) | | | 9,017,138 |
| TOTAL INVESTMENT IN SECURITIES - 100.9% | | | |
| (Cost $348,914,481) | | | 461,318,243 |
| NET OTHER ASSETS (LIABILITIES) - (0.9)% | | | (3,969,451) |
| NET ASSETS - 100% | | | $457,348,792 |
Legend
(a) Security or a portion of the security is on loan at period end.
(b) Non-income producing
(c) Affiliated fund that is generally available only to investment companies and other accounts managed by Fidelity Investments. The rate quoted is the annualized seven-day yield of the fund at period end. A complete unaudited listing of the fund's holdings as of its most recent quarter end is available upon request. In addition, each Fidelity Central Fund's financial statements, which are not covered by the Fund's Report of Independent Registered Public Accounting Firm, are available on the SEC's website or upon request.
(d) Investment made with cash collateral received from securities on loan.
Affiliated Central Funds
Information regarding fiscal year to date income earned by the Fund from investments in Fidelity Central Funds is as follows:
| Fund | Income earned |
| Fidelity Cash Central Fund | $12,784 |
| Fidelity Securities Lending Cash Central Fund | 169,053 |
| Total | $181,837 |
Investment Valuation
The following is a summary of the inputs used, as of October 31, 2017, involving the Fund's assets and liabilities carried at fair value. The inputs or methodology used for valuing securities may not be an indication of the risk associated with investing in those securities. For more information on valuation inputs, and their aggregation into the levels used below, please refer to the Investment Valuation section in the accompanying Notes to Financial Statements.
| | Valuation Inputs at Reporting Date: |
| Description | Total | Level 1 | Level 2 | Level 3 |
| Investments in Securities: | | | | |
| Equities: | | | | |
| Consumer Discretionary | $87,983,611 | $3,187,264 | $84,796,347 | $-- |
| Consumer Staples | 40,199,722 | -- | 40,199,722 | -- |
| Financials | 51,797,566 | -- | 51,797,566 | -- |
| Health Care | 40,006,602 | -- | 40,006,602 | -- |
| Industrials | 83,308,052 | -- | 83,308,052 | -- |
| Information Technology | 67,949,837 | -- | 67,949,837 | -- |
| Materials | 38,772,672 | -- | 38,772,672 | -- |
| Multi Sector | 1,144,360 | -- | 1,144,360 | -- |
| Real Estate | 3,097,948 | -- | 3,097,948 | -- |
| Telecommunication Services | 38,040,735 | -- | 38,040,735 | -- |
| Money Market Funds | 9,017,138 | 9,017,138 | -- | -- |
| Total Investments in Securities: | $461,318,243 | $12,204,402 | $449,113,841 | $-- |
The following is a summary of transfers between Level 1 and Level 2 for the period ended October 31, 2017. Transfers are assumed to have occurred at the beginning of the period, and are primarily attributable to the valuation techniques used for foreign equity securities, as discussed in the accompanying Notes to Financial Statements:
| Transfers | Total |
| Level 1 to Level 2 | $246,167,378 |
| Level 2 to Level 1 | $0 |
See accompanying notes which are an integral part of the financial statements.
Fidelity® Japan Fund
Financial Statements
Statement of Assets and Liabilities
| | | October 31, 2017 |
| Assets | | |
Investment in securities, at value (including securities loaned of $6,812,555) — See accompanying schedule:
Unaffiliated issuers (cost $339,896,835) | $452,301,105 | |
| Fidelity Central Funds (cost $9,017,646) | 9,017,138 | |
| Total Investment in Securities (cost $348,914,481) | | $461,318,243 |
| Receivable for investments sold | | 3,343,923 |
| Receivable for fund shares sold | | 1,076,225 |
| Dividends receivable | | 2,273,750 |
| Distributions receivable from Fidelity Central Funds | | 26,993 |
| Prepaid expenses | | 981 |
| Other receivables | | 1,773 |
| Total assets | | 468,041,888 |
| Liabilities | | |
| Payable for investments purchased | $2,038,928 | |
| Payable for fund shares redeemed | 1,127,324 | |
| Accrued management fee | 196,004 | |
| Distribution and service plan fees payable | 16,035 | |
| Other affiliated payables | 85,458 | |
| Other payables and accrued expenses | 74,042 | |
| Collateral on securities loaned | 7,155,305 | |
| Total liabilities | | 10,693,096 |
| Net Assets | | $457,348,792 |
| Net Assets consist of: | | |
| Paid in capital | | $488,718,340 |
| Undistributed net investment income | | 2,940,381 |
| Accumulated undistributed net realized gain (loss) on investments and foreign currency transactions | | (146,708,452) |
| Net unrealized appreciation (depreciation) on investments and assets and liabilities in foreign currencies | | 112,398,523 |
| Net Assets | | $457,348,792 |
| Calculation of Maximum Offering Price | | |
| Class A: | | |
| Net Asset Value and redemption price per share ($16,154,766 ÷ 1,071,121 shares) | | $15.08 |
| Maximum offering price per share (100/94.25 of $15.08) | | $16.00 |
| Class M: | | |
| Net Asset Value and redemption price per share ($4,464,261 ÷ 296,345 shares) | | $15.06 |
| Maximum offering price per share (100/96.50 of $15.06) | | $15.61 |
| Class C: | | |
| Net Asset Value and offering price per share ($13,542,383 ÷ 907,765 shares)(a) | | $14.92 |
| Japan: | | |
| Net Asset Value, offering price and redemption price per share ($247,371,686 ÷ 16,352,921 shares) | | $15.13 |
| Class I: | | |
| Net Asset Value, offering price and redemption price per share ($175,815,696 ÷ 11,630,041 shares) | | $15.12 |
(a) Redemption price per share is equal to net asset value less any applicable contingent deferred sales charge.
See accompanying notes which are an integral part of the financial statements.
Statement of Operations
| | | Year ended October 31, 2017 |
| Investment Income | | |
| Dividends | | $7,060,926 |
| Income from Fidelity Central Funds | | 181,837 |
| Income before foreign taxes withheld | | 7,242,763 |
| Less foreign taxes withheld | | (702,113) |
| Total income | | 6,540,650 |
| Expenses | | |
| Management fee | | |
| Basic fee | $2,913,164 | |
| Performance adjustment | (731,266) | |
| Transfer agent fees | 794,297 | |
| Distribution and service plan fees | 204,631 | |
| Accounting and security lending fees | 218,756 | |
| Custodian fees and expenses | 41,805 | |
| Independent trustees' fees and expenses | 1,670 | |
| Registration fees | 73,226 | |
| Audit | 79,089 | |
| Legal | 1,052 | |
| Interest | 617 | |
| Miscellaneous | 3,234 | |
| Total expenses before reductions | 3,600,275 | |
| Expense reductions | (14,814) | 3,585,461 |
| Net investment income (loss) | | 2,955,189 |
| Realized and Unrealized Gain (Loss) | | |
| Net realized gain (loss) on: | | |
| Investment securities: | | |
| Unaffiliated issuers | 11,597,777 | |
| Fidelity Central Funds | 1,313 | |
| Foreign currency transactions | (296,959) | |
| Total net realized gain (loss) | | 11,302,131 |
| Change in net unrealized appreciation (depreciation) on: | | |
| Investment securities: | | |
| Unaffiliated issuers | 67,682,350 | |
| Fidelity Central Funds | (911) | |
| Assets and liabilities in foreign currencies | 88,784 | |
| Total change in net unrealized appreciation (depreciation) | | 67,770,223 |
| Net gain (loss) | | 79,072,354 |
| Net increase (decrease) in net assets resulting from operations | | $82,027,543 |
See accompanying notes which are an integral part of the financial statements.
Statement of Changes in Net Assets
| | Year ended October 31, 2017 | Year ended October 31, 2016 |
| Increase (Decrease) in Net Assets | | |
| Operations | | |
| Net investment income (loss) | $2,955,189 | $3,375,493 |
| Net realized gain (loss) | 11,302,131 | (19,947,501) |
| Change in net unrealized appreciation (depreciation) | 67,770,223 | 35,358,570 |
| Net increase (decrease) in net assets resulting from operations | 82,027,543 | 18,786,562 |
| Distributions to shareholders from net investment income | (3,369,067) | (3,027,093) |
| Distributions to shareholders from net realized gain | (1,060,540) | (270,338) |
| Total distributions | (4,429,607) | (3,297,431) |
| Share transactions - net increase (decrease) | (23,430,665) | (159,708,771) |
| Redemption fees | 33,312 | 43,507 |
| Total increase (decrease) in net assets | 54,200,583 | (144,176,133) |
| Net Assets | | |
| Beginning of period | 403,148,209 | 547,324,342 |
| End of period | $457,348,792 | $403,148,209 |
| Other Information | | |
| Undistributed net investment income end of period | $2,940,381 | $3,364,219 |
See accompanying notes which are an integral part of the financial statements.
Financial Highlights
Fidelity Japan Fund Class A
| Years ended October 31, | 2017 | 2016 | 2015 | 2014 | 2013 |
| Selected Per–Share Data | | | | | |
| Net asset value, beginning of period | $12.59 | $11.87 | $11.65 | $12.00 | $9.30 |
| Income from Investment Operations | | | | | |
| Net investment income (loss)A | .06 | .06 | .04 | .05 | .08 |
| Net realized and unrealized gain (loss) | 2.52 | .72 | .23 | (.31) | 2.80 |
| Total from investment operations | 2.58 | .78 | .27 | (.26) | 2.88 |
| Distributions from net investment income | (.06) | (.05) | (.05) | (.08) | (.11) |
| Distributions from net realized gain | (.03) | (.01) | – | (.01) | (.08) |
| Total distributions | (.09) | (.06) | (.05) | (.09) | (.19) |
| Redemption fees added to paid in capitalA | –B | –B | –B | –B | .01 |
| Net asset value, end of period | $15.08 | $12.59 | $11.87 | $11.65 | $12.00 |
| Total ReturnC,D | 20.70% | 6.56% | 2.31% | (2.18)% | 31.58% |
| Ratios to Average Net AssetsE,F | | | | | |
| Expenses before reductions | 1.11% | 1.08% | 1.10% | 1.23% | 1.26% |
| Expenses net of fee waivers, if any | 1.11% | 1.08% | 1.10% | 1.23% | 1.26% |
| Expenses net of all reductions | 1.11% | 1.08% | 1.09% | 1.23% | 1.25% |
| Net investment income (loss) | .45% | .51% | .37% | .41% | .75% |
| Supplemental Data | | | | | |
| Net assets, end of period (000 omitted) | $16,155 | $23,910 | $23,918 | $21,352 | $20,520 |
| Portfolio turnover rateG | 23% | 15% | 35% | 112% | 68% |
A Calculated based on average shares outstanding during the period.
B Amount represents less than $.005 per share.
C Total returns would have been lower if certain expenses had not been reduced during the applicable periods shown.
D Total returns do not include the effect of the sales charges.
E Fees and expenses of any underlying Fidelity Central Funds are not included in the Fund's expense ratio. The Fund indirectly bears its proportionate share of the expenses of any underlying Fidelity Central Funds.
F Expense ratios reflect operating expenses of the class. Expenses before reductions do not reflect amounts reimbursed by the investment adviser or reductions from brokerage service arrangements or reductions from other expense offset arrangements and do not represent the amount paid by the class during periods when reimbursements or reductions occur. Expenses net of fee waivers reflect expenses after reimbursement by the investment adviser but prior to reductions from brokerage service arrangements or other expense offset arrangements. Expenses net of all reductions represent the net expenses paid by the class.
G Amount does not include the portfolio activity of any underlying Fidelity Central Funds.
See accompanying notes which are an integral part of the financial statements.
Fidelity Japan Fund Class M
| Years ended October 31, | 2017 | 2016 | 2015 | 2014 | 2013 |
| Selected Per–Share Data | | | | | |
| Net asset value, beginning of period | $12.57 | $11.85 | $11.62 | $11.96 | $9.28 |
| Income from Investment Operations | | | | | |
| Net investment income (loss)A | .01 | .02 | –B | .01 | .05 |
| Net realized and unrealized gain (loss) | 2.52 | .71 | .23 | (.30) | 2.78 |
| Total from investment operations | 2.53 | .73 | .23 | (.29) | 2.83 |
| Distributions from net investment income | (.01) | –B | – | (.04) | (.08) |
| Distributions from net realized gain | (.03) | (.01) | – | (.01) | (.08) |
| Total distributions | (.04) | (.01) | – | (.05) | (.16) |
| Redemption fees added to paid in capitalA | –B | –B | –B | –B | .01 |
| Net asset value, end of period | $15.06 | $12.57 | $11.85 | $11.62 | $11.96 |
| Total ReturnC,D | 20.24% | 6.15% | 1.98% | (2.42)% | 31.04% |
| Ratios to Average Net AssetsE,F | | | | | |
| Expenses before reductions | 1.46% | 1.44% | 1.43% | 1.54% | 1.55% |
| Expenses net of fee waivers, if any | 1.46% | 1.44% | 1.43% | 1.54% | 1.55% |
| Expenses net of all reductions | 1.46% | 1.44% | 1.42% | 1.54% | 1.53% |
| Net investment income (loss) | .10% | .16% | .04% | .10% | .46% |
| Supplemental Data | | | | | |
| Net assets, end of period (000 omitted) | $4,464 | $4,193 | $4,809 | $4,104 | $5,357 |
| Portfolio turnover rateG | 23% | 15% | 35% | 112% | 68% |
A Calculated based on average shares outstanding during the period.
B Amount represents less than $.005 per share.
C Total returns would have been lower if certain expenses had not been reduced during the applicable periods shown.
D Total returns do not include the effect of the sales charges.
E Fees and expenses of any underlying Fidelity Central Funds are not included in the Fund's expense ratio. The Fund indirectly bears its proportionate share of the expenses of any underlying Fidelity Central Funds.
F Expense ratios reflect operating expenses of the class. Expenses before reductions do not reflect amounts reimbursed by the investment adviser or reductions from brokerage service arrangements or reductions from other expense offset arrangements and do not represent the amount paid by the class during periods when reimbursements or reductions occur. Expenses net of fee waivers reflect expenses after reimbursement by the investment adviser but prior to reductions from brokerage service arrangements or other expense offset arrangements. Expenses net of all reductions represent the net expenses paid by the class.
G Amount does not include the portfolio activity of any underlying Fidelity Central Funds.
See accompanying notes which are an integral part of the financial statements.
Fidelity Japan Fund Class C
| Years ended October 31, | 2017 | 2016 | 2015 | 2014 | 2013 |
| Selected Per–Share Data | | | | | |
| Net asset value, beginning of period | $12.44 | $11.77 | $11.58 | $11.96 | $9.25 |
| Income from Investment Operations | | | | | |
| Net investment income (loss)A | (.03) | (.02) | (.04) | (.03) | –B |
| Net realized and unrealized gain (loss) | 2.51 | .69 | .23 | (.32) | 2.79 |
| Total from investment operations | 2.48 | .67 | .19 | (.35) | 2.79 |
| Distributions from net investment income | – | – | – | (.03) | (.01) |
| Distributions from net realized gain | – | – | – | (.01) | (.08) |
| Total distributions | – | – | – | (.03)C | (.09) |
| Redemption fees added to paid in capitalA | –B | –B | –B | –B | .01 |
| Net asset value, end of period | $14.92 | $12.44 | $11.77 | $11.58 | $11.96 |
| Total ReturnD,E | 19.94% | 5.69% | 1.64% | (2.90)% | 30.55% |
| Ratios to Average Net AssetsF,G | | | | | |
| Expenses before reductions | 1.81% | 1.81% | 1.81% | 1.93% | 1.97% |
| Expenses net of fee waivers, if any | 1.81% | 1.81% | 1.81% | 1.93% | 1.97% |
| Expenses net of all reductions | 1.81% | 1.81% | 1.80% | 1.93% | 1.95% |
| Net investment income (loss) | (.25)% | (.21)% | (.34)% | (.29)% | .04% |
| Supplemental Data | | | | | |
| Net assets, end of period (000 omitted) | $13,542 | $15,077 | $18,491 | $13,162 | $11,824 |
| Portfolio turnover rateH | 23% | 15% | 35% | 112% | 68% |
A Calculated based on average shares outstanding during the period.
B Amount represents less than $.005 per share.
C Total distributions of $.03 per share is comprised of distributions from net investment income of $.025 and distributions from net realized gain of $.009 per share.
D Total returns would have been lower if certain expenses had not been reduced during the applicable periods shown.
E Total returns do not include the effect of the contingent deferred sales charge.
F Fees and expenses of any underlying Fidelity Central Funds are not included in the Fund's expense ratio. The Fund indirectly bears its proportionate share of the expenses of any underlying Fidelity Central Funds.
G Expense ratios reflect operating expenses of the class. Expenses before reductions do not reflect amounts reimbursed by the investment adviser or reductions from brokerage service arrangements or reductions from other expense offset arrangements and do not represent the amount paid by the class during periods when reimbursements or reductions occur. Expenses net of fee waivers reflect expenses after reimbursement by the investment adviser but prior to reductions from brokerage service arrangements or other expense offset arrangements. Expenses net of all reductions represent the net expenses paid by the class.
H Amount does not include the portfolio activity of any underlying Fidelity Central Funds.
See accompanying notes which are an integral part of the financial statements.
Fidelity Japan Fund
| Years ended October 31, | 2017 | 2016 | 2015 | 2014 | 2013 |
| Selected Per–Share Data | | | | | |
| Net asset value, beginning of period | $12.64 | $11.91 | $11.69 | $12.03 | $9.34 |
| Income from Investment Operations | | | | | |
| Net investment income (loss)A | .10 | .09 | .08 | .09 | .12 |
| Net realized and unrealized gain (loss) | 2.54 | .72 | .23 | (.32) | 2.79 |
| Total from investment operations | 2.64 | .81 | .31 | (.23) | 2.91 |
| Distributions from net investment income | (.11) | (.07) | (.09) | (.11) | (.15) |
| Distributions from net realized gain | (.03) | (.01) | – | (.01) | (.08) |
| Total distributions | (.15)B | (.08) | (.09) | (.11)C | (.23) |
| Redemption fees added to paid in capitalA | –D | –D | –D | –D | .01 |
| Net asset value, end of period | $15.13 | $12.64 | $11.91 | $11.69 | $12.03 |
| Total ReturnE | 21.13% | 6.80% | 2.66% | (1.90)% | 31.92% |
| Ratios to Average Net AssetsF,G | | | | | |
| Expenses before reductions | .82% | .78% | .80% | .90% | .93% |
| Expenses net of fee waivers, if any | .82% | .78% | .80% | .90% | .93% |
| Expenses net of all reductions | .82% | .78% | .79% | .90% | .91% |
| Net investment income (loss) | .74% | .81% | .67% | .74% | 1.08% |
| Supplemental Data | | | | | |
| Net assets, end of period (000 omitted) | $247,372 | $352,936 | $485,803 | $415,612 | $480,773 |
| Portfolio turnover rateH | 23% | 15% | 35% | 112% | 68% |
A Calculated based on average shares outstanding during the period.
B Total distributions of $.15 per share is comprised of distributions from net investment income of $.112 and distributions from net realized gain of $.034 per share.
C Total distributions of $.11 per share is comprised of distributions from net investment income of $.105 and distributions from net realized gain of $.009 per share.
D Amount represents less than $.005 per share.
E Total returns would have been lower if certain expenses had not been reduced during the applicable periods shown.
F Fees and expenses of any underlying Fidelity Central Funds are not included in the Fund's expense ratio. The Fund indirectly bears its proportionate share of the expenses of any underlying Fidelity Central Funds.
G Expense ratios reflect operating expenses of the class. Expenses before reductions do not reflect amounts reimbursed by the investment adviser or reductions from brokerage service arrangements or reductions from other expense offset arrangements and do not represent the amount paid by the class during periods when reimbursements or reductions occur. Expenses net of fee waivers reflect expenses after reimbursement by the investment adviser but prior to reductions from brokerage service arrangements or other expense offset arrangements. Expenses net of all reductions represent the net expenses paid by the class.
H Amount does not include the portfolio activity of any underlying Fidelity Central Funds.
See accompanying notes which are an integral part of the financial statements.
Fidelity Japan Fund Class I
| Years ended October 31, | 2017 | 2016 | 2015 | 2014 | 2013 |
| Selected Per–Share Data | | | | | |
| Net asset value, beginning of period | $12.62 | $11.89 | $11.67 | $12.02 | $9.33 |
| Income from Investment Operations | | | | | |
| Net investment income (loss)A | .11 | .10 | .08 | .09 | .13 |
| Net realized and unrealized gain (loss) | 2.53 | .70 | .23 | (.32) | 2.78 |
| Total from investment operations | 2.64 | .80 | .31 | (.23) | 2.91 |
| Distributions from net investment income | (.11) | (.07) | (.09) | (.12) | (.15) |
| Distributions from net realized gain | (.03) | (.01) | – | (.01) | (.08) |
| Total distributions | (.14) | (.07)B | (.09) | (.12)C | (.23) |
| Redemption fees added to paid in capitalA | –D | –D | –D | –D | .01 |
| Net asset value, end of period | $15.12 | $12.62 | $11.89 | $11.67 | $12.02 |
| Total ReturnE | 21.22% | 6.77% | 2.72% | (1.90)% | 32.04% |
| Ratios to Average Net AssetsF,G | | | | | |
| Expenses before reductions | .76% | .77% | .80% | .89% | .90% |
| Expenses net of fee waivers, if any | .76% | .77% | .80% | .89% | .90% |
| Expenses net of all reductions | .76% | .76% | .79% | .89% | .88% |
| Net investment income (loss) | .80% | .83% | .67% | .76% | 1.11% |
| Supplemental Data | | | | | |
| Net assets, end of period (000 omitted) | $175,816 | $7,032 | $13,957 | $20,253 | $20,033 |
| Portfolio turnover rateH | 23% | 15% | 35% | 112% | 68% |
A Calculated based on average shares outstanding during the period.
B Total distributions of $.07 per share is comprised of distributions from net investment income of $.065 and distributions from net realized gain of $.006 per share.
C Total distributions of $.12 per share is comprised of distributions from net investment income of $.115 and distributions from net realized gain of $.009 per share.
D Amount represents less than $.005 per share.
E Total returns would have been lower if certain expenses had not been reduced during the applicable periods shown.
F Fees and expenses of any underlying Fidelity Central Funds are not included in the Fund's expense ratio. The Fund indirectly bears its proportionate share of the expenses of any underlying Fidelity Central Funds.
G Expense ratios reflect operating expenses of the class. Expenses before reductions do not reflect amounts reimbursed by the investment adviser or reductions from brokerage service arrangements or reductions from other expense offset arrangements and do not represent the amount paid by the class during periods when reimbursements or reductions occur. Expenses net of fee waivers reflect expenses after reimbursement by the investment adviser but prior to reductions from brokerage service arrangements or other expense offset arrangements. Expenses net of all reductions represent the net expenses paid by the class.
H Amount does not include the portfolio activity of any underlying Fidelity Central Funds.
See accompanying notes which are an integral part of the financial statements.
Notes to Financial Statements
For the period ended October 31, 2017
1. Organization.
Fidelity Japan Fund (the Fund) is a fund of Fidelity Investment Trust (the Trust) and is authorized to issue an unlimited number of shares. The Trust is registered under the Investment Company Act of 1940, as amended (the 1940 Act), as an open-end management investment company organized as a Massachusetts business trust. The Fund offers Class A, Class M (formerly Class T), Class C, Japan and Class I shares, each of which has equal rights as to assets and voting privileges. Each class has exclusive voting rights with respect to matters that affect that class.
After the close of business on June 24, 2016, all outstanding Class B shares were converted to Class A shares. All prior fiscal period dollar and share amounts for Class B presented in the Notes to Financial Statements are for the period November 1, 2015 through June 24, 2016.
2. Investments in Fidelity Central Funds.
The Fund invests in Fidelity Central Funds, which are open-end investment companies generally available only to other investment companies and accounts managed by the investment adviser and its affiliates. The Fund's Schedule of Investments lists each of the Fidelity Central Funds held as of period end, if any, as an investment of the Fund, but does not include the underlying holdings of each Fidelity Central Fund. As an Investing Fund, the Fund indirectly bears its proportionate share of the expenses of the underlying Fidelity Central Funds.
The Money Market Central Funds seek preservation of capital and current income and are managed by Fidelity Investments Money Management, Inc. (FIMM), an affiliate of the investment adviser. Annualized expenses of the Money Market Central Funds as of their most recent shareholder report date are less than .005%.
A complete unaudited list of holdings for each Fidelity Central Fund is available upon request or at the Securities and Exchange Commission (the SEC) website at www.sec.gov. In addition, the financial statements of the Fidelity Central Funds, which are not covered by the Fund's Report of Independent Registered Public Accounting Firm, are available on the SEC website or upon request.
3. Significant Accounting Policies.
The Fund is an investment company and applies the accounting and reporting guidance of the Financial Accounting Standards Board (FASB) Accounting Standards Codification Topic 946 Financial Services – Investments Companies. The financial statements have been prepared in conformity with accounting principles generally accepted in the United States of America (GAAP), which require management to make certain estimates and assumptions at the date of the financial statements. Actual results could differ from those estimates. Subsequent events, if any, through the date that the financial statements were issued have been evaluated in the preparation of the financial statements. The following summarizes the significant accounting policies of the Fund:
Investment Valuation. Investments are valued as of 4:00 p.m. Eastern time on the last calendar day of the period. The Board of Trustees (the Board) has delegated the day to day responsibility for the valuation of the Fund's investments to the Fair Value Committee (the Committee) established by the Fund's investment adviser. In accordance with valuation policies and procedures approved by the Board, the Fund attempts to obtain prices from one or more third party pricing vendors or brokers to value its investments. When current market prices, quotations or currency exchange rates are not readily available or reliable, investments will be fair valued in good faith by the Committee, in accordance with procedures adopted by the Board. Factors used in determining fair value vary by investment type and may include market or investment specific events. The frequency with which these procedures are used cannot be predicted and they may be utilized to a significant extent. The Committee oversees the Fund's valuation policies and procedures and reports to the Board on the Committee's activities and fair value determinations. The Board monitors the appropriateness of the procedures used in valuing the Fund's investments and ratifies the fair value determinations of the Committee.
The Fund categorizes the inputs to valuation techniques used to value its investments into a disclosure hierarchy consisting of three levels as shown below:
- Level 1 – quoted prices in active markets for identical investments
- Level 2 – other significant observable inputs (including quoted prices for similar investments, interest rates, prepayment speeds, etc.)
- Level 3 – unobservable inputs (including the Fund's own assumptions based on the best information available)
Valuation techniques used to value the Fund's investments by major category are as follows:
Equity securities, including restricted securities, for which market quotations are readily available, are valued at the last reported sale price or official closing price as reported by a third party pricing vendor on the primary market or exchange on which they are traded and are categorized as Level 1 in the hierarchy. In the event there were no sales during the day or closing prices are not available, securities are valued at the last quoted bid price or may be valued using the last available price and are generally categorized as Level 2 in the hierarchy. For foreign equity securities, when market or security specific events arise, comparisons to the valuation of American Depositary Receipts (ADRs), futures contracts, Exchange-Traded Funds (ETFs) and certain indexes as well as quoted prices for similar securities may be used and would be categorized as Level 2 in the hierarchy. Utilizing these techniques may result in transfers between Level 1 and Level 2. For equity securities, including restricted securities, where observable inputs are limited, assumptions about market activity and risk are used and these securities may be categorized as Level 3 in the hierarchy.
Investments in open-end mutual funds, including the Fidelity Central Funds, are valued at their closing net asset value (NAV) each business day and are categorized as Level 1 in the hierarchy.
Changes in valuation techniques may result in transfers in or out of an assigned level within the disclosure hierarchy. The aggregate value of investments by input level as of October 31, 2017, including information on transfers between Levels 1 and 2, is included at the end of the Fund's Schedule of Investments.
Foreign Currency. The Fund may use foreign currency contracts to facilitate transactions in foreign-denominated securities. Gains and losses from these transactions may arise from changes in the value of the foreign currency or if the counterparties do not perform under the contracts' terms.
Foreign-denominated assets, including investment securities, and liabilities are translated into U.S. dollars at the exchange rates at period end. Purchases and sales of investment securities, income and dividends received and expenses denominated in foreign currencies are translated into U.S. dollars at the exchange rate in effect on the transaction date.
The effects of exchange rate fluctuations on investments are included with the net realized and unrealized gain (loss) on investment securities. Other foreign currency transactions resulting in realized and unrealized gain (loss) are disclosed separately.
Investment Transactions and Income. For financial reporting purposes, the Fund's investment holdings and NAV include trades executed through the end of the last business day of the period. The NAV per share for processing shareholder transactions is calculated as of the close of business of the New York Stock Exchange (NYSE), normally 4:00 p.m. Eastern time and includes trades executed through the end of the prior business day. Gains and losses on securities sold are determined on the basis of identified cost. Dividend income is recorded on the ex-dividend date, except for certain dividends from foreign securities where the ex-dividend date may have passed, which are recorded as soon as the Fund is informed of the ex-dividend date. Non-cash dividends included in dividend income, if any, are recorded at the fair market value of the securities received. Income and capital gain distributions from Fidelity Central Funds, if any, are recorded on the ex-dividend date. Investment income is recorded net of foreign taxes withheld where recovery of such taxes is uncertain.
Class Allocations and Expenses. Investment income, realized and unrealized capital gains and losses, common expenses of the Fund, and certain fund-level expense reductions, if any, are allocated daily on a pro-rata basis to each class based on the relative net assets of each class to the total net assets of the Fund. Each class differs with respect to transfer agent and distribution and service plan fees incurred. Certain expense reductions may also differ by class. For the reporting period, the allocated portion of income and expenses to each class as a percent of its average net assets may vary due to the timing of recording these transactions in relation to fluctuating net assets of the classes. Expenses directly attributable to a fund are charged to that fund. Expenses attributable to more than one fund are allocated among the respective funds on the basis of relative net assets or other appropriate methods. Expense estimates are accrued in the period to which they relate and adjustments are made when actual amounts are known.
Income Tax Information and Distributions to Shareholders. Each year, the Fund intends to qualify as a regulated investment company under Subchapter M of the Internal Revenue Code, including distributing substantially all of its taxable income and realized gains. As a result, no provision for U.S. Federal income taxes is required. As of October 31, 2017, the Fund did not have any unrecognized tax benefits in the financial statements; nor is the Fund aware of any tax positions for which it is reasonably possible that the total amounts of unrecognized tax benefits will significantly change in the next twelve months. The Fund files a U.S. federal tax return, in addition to state and local tax returns as required. The Fund's federal income tax returns are subject to examination by the Internal Revenue Service (IRS) for a period of three fiscal years after they are filed. State and local tax returns may be subject to examination for an additional fiscal year depending on the jurisdiction. Foreign taxes are provided for based on the Fund's understanding of the tax rules and rates that exist in the foreign markets in which it invests.
Distributions are declared and recorded on the ex-dividend date. Income dividends and capital gain distributions are declared separately for each class. Income and capital gain distributions are determined in accordance with income tax regulations, which may differ from GAAP.
Capital accounts within the financial statements are adjusted for permanent book-tax differences. These adjustments have no impact on net assets or the results of operations. Capital accounts are not adjusted for temporary book-tax differences which will reverse in a subsequent period.
Book-tax differences are primarily due to foreign currency transactions, passive-foreign investment companies (PFIC), expiring capital loss carryforwards, deferred trustees compensation, capital loss carryforwards and losses deferred due to wash sales.
As of period end, the cost and unrealized appreciation (depreciation) in securities, and derivatives if applicable, for federal income tax purposes were as follows:
| Gross unrealized appreciation | $116,513,795 |
| Gross unrealized depreciation | (9,678,199) |
| Net unrealized appreciation (depreciation) | $106,835,596 |
| Tax Cost | $354,482,647 |
The tax-based components of distributable earnings as of period end were as follows:
| Undistributed ordinary income | $3,808,926 |
| Capital loss carryforward | $(141,997,898) |
| Net unrealized appreciation (depreciation) on securities and other investments | $106,819,605 |
Capital loss carryforwards are only available to offset future capital gains of the Fund to the extent provided by regulations and may be limited. Under the Regulated Investment Company Modernization Act of 2010 (the Act), the Fund is permitted to carry forward capital losses incurred in taxable years beginning after December 22, 2010 for an unlimited period and such capital losses are required to be used prior to any losses that expire. The capital loss carryforward information presented below, including any applicable limitation, is estimated as of fiscal period end and is subject to adjustment.
| Fiscal year of expiration | |
| 2018 | $(26,887,863) |
| 2019 | (98,806,037) |
| Total with expiration | $(125,693,900) |
| No expiration | |
| Short-term | (5,646,628) |
| Long-term | (10,657,370) |
| Total no expiration | (16,303,998) |
| Total capital loss carryforward | $(141,997,898) |
The tax character of distributions paid was as follows:
| | October 31, 2017 | October 31, 2016 |
| Ordinary Income | $4,429,607 | $ 3,297,431 |
Short-Term Trading (Redemption) Fees. Shares held by investors in the Fund less than 90 days may have been subject to a redemption fee equal to 1.50% of the NAV of shares redeemed. All redemption fees, which reduce the proceeds of the shareholder redemption, are retained by the Fund and accounted for as an addition to paid in capital. In November 2017, the Board of Trustees approved the elimination of these redemption fees effective December 18, 2017.
4. Purchases and Sales of Investments.
Purchases and sales of securities, other than short-term securities, aggregated $96,762,670 and $122,325,801, respectively.
5. Fees and Other Transactions with Affiliates.
Management Fee. Fidelity Management & Research Company (the investment adviser) and its affiliates provide the Fund with investment management related services for which the Fund pays a monthly management fee. The management fee is the sum of an individual fund fee rate that is based on an annual rate of .45% of the Fund's average net assets and an annualized group fee rate that averaged .25% during the period. The group fee rate is based upon the average net assets of all the mutual funds advised by the investment adviser, including any mutual funds previously advised by the investment adviser that are currently advised by Fidelity SelectCo, LLC, an affiliate of the investment adviser. The group fee rate decreases as assets under management increase and increases as assets under management decrease. In addition, the management fee is subject to a performance adjustment (up to a maximum of +/- .20% of the Fund's average net assets over a 36 month performance period). The upward or downward adjustment to the management fee is based on the relative investment performance of Japan as compared to its benchmark index, the TOPIX, over the same 36 month performance period. For the reporting period, the total annual management fee rate, including the performance adjustment, was .52% of the Fund's average net assets. The performance adjustment included in the management fee rate may be higher or lower than the maximum performance adjustment rate due to the difference between the average net assets for the reporting and performance periods.
Distribution and Service Plan Fees. In accordance with Rule 12b-1 of the 1940 Act, the Fund has adopted separate Distribution and Service Plans for each class of shares. Certain classes pay Fidelity Distributors Corporation (FDC), an affiliate of the investment adviser, separate Distribution and Service Fees, each of which is based on an annual percentage of each class' average net assets. In addition, FDC may pay financial intermediaries for selling shares of the Fund and providing shareholder support services. For the period, the Distribution and Service Fee rates, total fees and amounts retained by FDC were as follows:
| | Distribution
Fee | Service
Fee | Total Fees | Retained
by FDC |
| Class A | -% | .25% | $47,060 | $1,787 |
| Class M | .25% | .25% | 21,035 | 125 |
| Class C | .75% | .25% | 136,536 | 12,586 |
| | | | $204,631 | $14,498 |
Sales Load. FDC may receive a front-end sales charge of up to 5.75% for selling Class A shares and 3.50% for selling Class M shares, some of which is paid to financial intermediaries for selling shares of the Fund. Depending on the holding period, FDC may receive contingent deferred sales charges levied on Class A, Class M and Class C redemptions. The deferred sales charges are 1.00% for Class C shares, 1.00% for certain purchases of Class A shares and .25% for certain purchases of Class M shares.
For the period, sales charge amounts retained by FDC were as follows:
| | Retained
by FDC |
| Class A | $11,128 |
| Class M | 527 |
| Class C(a) | 1,873 |
| | $13,528 |
(a) When Class C shares are initially sold, FDC pays commissions from its own resources to financial intermediaries through which the sales are made.
Transfer Agent Fees. Fidelity Investments Institutional Operations Company, Inc., (FIIOC), an affiliate of the investment adviser, is the transfer, dividend disbursing and shareholder servicing agent for each class of the Fund. FIIOC receives account fees and asset-based fees that vary according to the account size and type of account of the shareholders of the respective classes of the Fund. FIIOC pays for typesetting, printing and mailing of shareholder reports, except proxy statements.
For the period, transfer agent fees for each class were as follows:
| | Amount | % of
Class-Level Average
Net Assets |
| Class A | $44,772 | .24 |
| Class M | 14,260 | .34 |
| Class C | 26,437 | .19 |
| Japan | 574,549 | .20 |
| Class I | 134,279 | .14 |
| | $794,297 | |
Accounting and Security Lending Fees. Fidelity Service Company, Inc. (FSC), an affiliate of the investment adviser, maintains the Fund's accounting records. The accounting fee is based on the level of average net assets for each month. Under a separate contract, FSC administers the security lending program. The security lending fee is based on the number and duration of lending transactions.
Brokerage Commissions. The Fund placed a portion of its portfolio transactions with brokerage firms which are affiliates of the investment adviser. Brokerage commissions are included in net realized gain (loss) and change in net unrealized appreciation (depreciation) in the Statement of Operations. The commissions paid to these affiliated firms were $33 for the period.
Interfund Lending Program. Pursuant to an Exemptive Order issued by the SEC, the Fund, along with other registered investment companies having management contracts with Fidelity Management & Research Company (FMR) or other affiliated entities of FMR, may participate in an interfund lending program. This program provides an alternative credit facility allowing the funds to borrow from, or lend money to, other participating affiliated funds. At period end, there were no interfund loans outstanding. The Fund's activity in this program during the period for which loans were outstanding was as follows:
| Borrower or Lender | Average Loan Balance | Weighted Average Interest Rate | Interest Expense |
| Borrower | $5,094,750 | 1.09% | $617 |
Interfund Trades. The Fund may purchase from or sell securities to other Fidelity Funds under procedures adopted by the Board. The procedures have been designed to ensure these interfund trades are executed in accordance with Rule 17a-7 of the 1940 Act. Interfund trades are included within the respective purchases and sales amounts shown in the Purchases and Sales of Investments note.
6. Committed Line of Credit.
The Fund participates with other funds managed by the investment adviser or an affiliate in a $4.25 billion credit facility (the "line of credit") to be utilized for temporary or emergency purposes to fund shareholder redemptions or for other short-term liquidity purposes. The Fund has agreed to pay commitment fees on its pro-rata portion of the line of credit, which amounted to $1,329 and is reflected in Miscellaneous expenses on the Statement of Operations. During the period, the Fund did not borrow on this line of credit.
7. Security Lending.
The Fund lends portfolio securities through a lending agent from time to time in order to earn additional income. For equity securities, a lending agent is used and may loan securities to certain qualified borrowers, including Fidelity Capital Markets (FCM), a broker-dealer affiliated with the Fund. On the settlement date of the loan, the Fund receives collateral (in the form of U.S. Treasury obligations, letters of credit and/or cash) against the loaned securities and maintains collateral in an amount not less than 100% of the market value of the loaned securities during the period of the loan. The market value of the loaned securities is determined at the close of business of the Fund and any additional required collateral is delivered to the Fund on the next business day. The Fund or borrower may terminate the loan at any time, and if the borrower defaults on its obligation to return the securities loaned because of insolvency or other reasons, the Fund may apply collateral received from the borrower against the obligation. The Fund may experience delays and costs in recovering the securities loaned. Any cash collateral received is invested in the Fidelity Securities Lending Cash Central Fund. The value of loaned securities and cash collateral at period end are disclosed on the Fund's Statement of Assets and Liabilities. Security lending income represents the income earned on investing cash collateral, less rebates paid to borrowers and any lending agent fees associated with the loan, plus any premium payments received for lending certain types of securities. Security lending income is presented in the Statement of Operations as a component of income from Fidelity Central Funds. Total security lending income during the period amounted to $169,053. During the period, there were no securities loaned to FCM.
8. Expense Reductions.
Commissions paid to certain brokers with whom the investment adviser, or its affiliates, places trades on behalf of the Fund include an amount in addition to trade execution, which may be rebated back to the Fund to offset certain expenses. This amount totaled $11,247 for the period.
In addition, during the period the investment adviser reimbursed and/or waived a portion of fund-level operating expenses in the amount of $3,567.
9. Distributions to Shareholders.
Distributions to shareholders of each class were as follows:
| | Year ended
October 31, 2017 | Year ended October 31, 2016 |
| From net investment income | | |
| Class A | $104,209 | $121,415 |
| Class M | 3,257 | 822 |
| Japan | 3,209,793 | 2,828,514 |
| Class I | 51,808 | 76,342 |
| Total | $3,369,067 | $3,027,093 |
| From net realized gain | | |
| Class A | $59,052 | $14,867 |
| Class M | 11,074 | 2,466 |
| Japan | 974,401 | 245,958 |
| Class I | 16,013 | 7,047 |
| Total | $1,060,540 | $270,338 |
10. Share Transactions.
Share transactions for each class were as follows and may contain automatic conversions between classes or exchanges between affiliated funds:
| | Shares | Shares | Dollars | Dollars |
| | Year ended October 31, 2017 | Year ended October 31, 2016 | Year ended October 31, 2017 | Year ended October 31, 2016 |
| Class A | | | | |
| Shares sold | 261,996 | 813,081 | $3,537,670 | $9,592,333 |
| Reinvestment of distributions | 12,680 | 10,746 | 155,198 | 128,096 |
| Shares redeemed | (1,102,972) | (938,856) | (14,608,137) | (10,914,042) |
| Net increase (decrease) | (828,296) | (115,029) | $(10,915,269) | $(1,193,613) |
| Class M | | | | |
| Shares sold | 34,522 | 36,363 | $446,496 | $424,255 |
| Reinvestment of distributions | 1,137 | 269 | 13,940 | 3,216 |
| Shares redeemed | (72,947) | (108,870) | (961,323) | (1,266,529) |
| Net increase (decrease) | (37,288) | (72,238) | $(500,887) | $(839,058) |
| Class B | | | | |
| Shares sold | – | 1,967 | $– | $21,930 |
| Shares redeemed | – | (31,378) | – | (356,692) |
| Net increase (decrease) | – | (29,411) | $– | $(334,762) |
| Class C | | | | |
| Shares sold | 75,525 | 261,804 | $955,948 | $3,054,392 |
| Shares redeemed | (379,339) | (621,443) | (4,904,728) | (7,129,408) |
| Net increase (decrease) | (303,814) | (359,639) | $(3,948,780) | $(4,075,016) |
| Japan | | | | |
| Shares sold | 5,531,120 | 4,048,778 | $70,265,364 | $48,328,822 |
| Reinvestment of distributions | 332,957 | 251,274 | 4,075,396 | 3,000,214 |
| Shares redeemed | (17,427,207) | (17,176,238) | (225,423,617) | (197,588,759) |
| Net increase (decrease) | (11,563,130) | (12,876,186) | $(151,082,857) | $(146,259,723) |
| Class I | | | | |
| Shares sold | 12,120,647 | 323,014 | $156,870,865 | $3,826,994 |
| Reinvestment of distributions | 4,957 | 6,575 | 60,627 | 78,372 |
| Shares redeemed | (1,052,603) | (946,812) | (13,914,364) | (10,911,965) |
| Net increase (decrease) | 11,073,001 | (617,223) | $143,017,128 | $(7,006,599) |
11. Other.
The Fund's organizational documents provide former and current trustees and officers with a limited indemnification against liabilities arising in connection with the performance of their duties to the Fund. In the normal course of business, the Fund may also enter into contracts that provide general indemnifications. The Fund's maximum exposure under these arrangements is unknown as this would be dependent on future claims that may be made against the Fund. The risk of material loss from such claims is considered remote.
At the end of the period, Strategic Advisers International Fund and Strategic Advisers International II Fund were the owners of record of approximately 11% and 25%, respectively, of the total outstanding shares of the Fund. Mutual funds managed by the investment adviser or its affiliates were the owners of record, in the aggregate, of approximately 53% of the total outstanding shares of the Fund.
Fidelity® Japan Smaller Companies Fund
Performance: The Bottom Line
Average annual total return reflects the change in the value of an investment, assuming reinvestment of distributions from dividend income and capital gains (the profits earned upon the sale of securities that have grown in value, if any) and assuming a constant rate of performance each year. The hypothetical investment and the average annual total returns do not reflect the deduction of taxes that a shareholder would pay on fund distributions or the redemption of fund shares. During periods of reimbursement by Fidelity, a fund’s total return will be greater than it would be had the reimbursement not occurred. How a fund did yesterday is no guarantee of how it will do tomorrow.
Average Annual Total Returns
| For the periods ended October 31, 2017 | Past 1 year | Past 5 years | Past 10 years |
| Fidelity® Japan Smaller Companies Fund | 23.68% | 18.16% | 5.99% |
$10,000 Over 10 Years
Let's say hypothetically that $10,000 was invested in Fidelity® Japan Smaller Companies Fund on October 31, 2007.
The chart shows how the value of your investment would have changed, and also shows how the Russell/Nomura Mid-Small Cap™ Index performed over the same period.
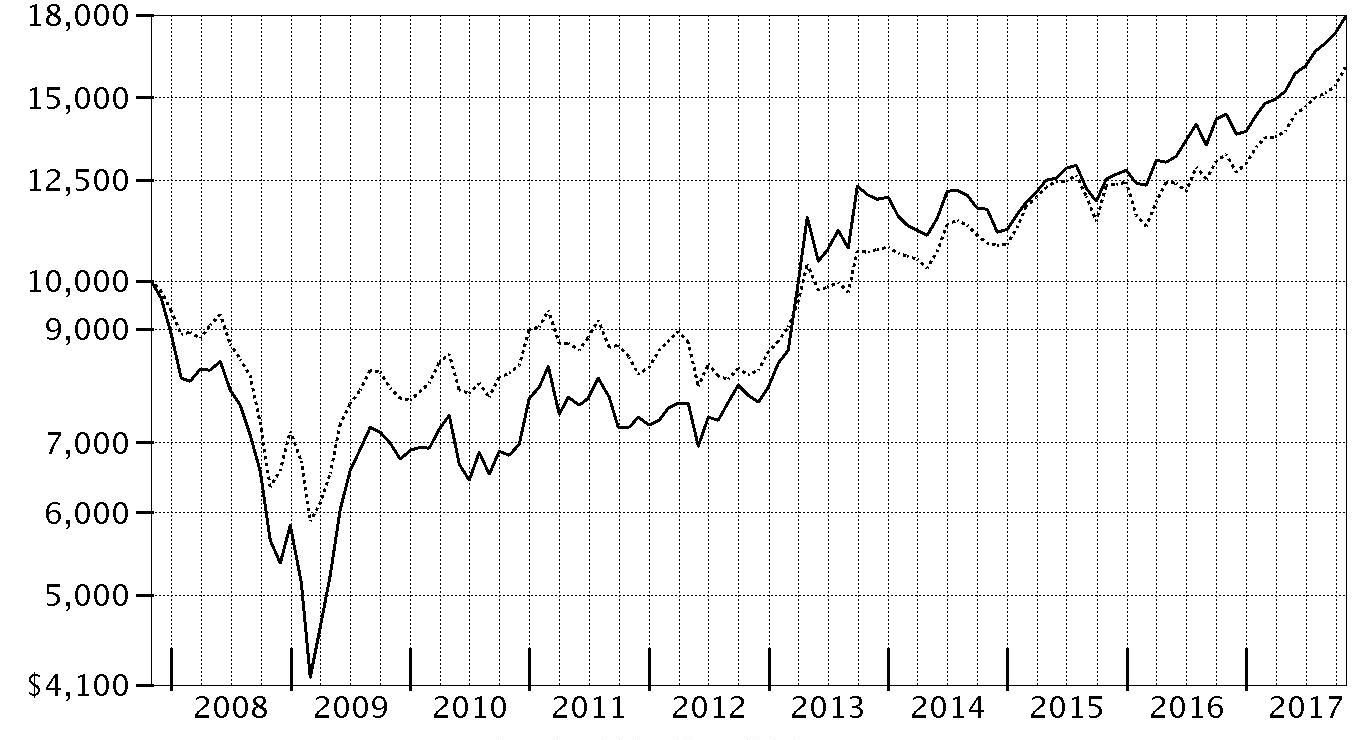
| Period Ending Values |
| $17,894 | Fidelity® Japan Smaller Companies Fund |
| $16,022 | Russell/Nomura Mid-Small Cap™ Index |
Fidelity® Japan Smaller Companies Fund
Management's Discussion of Fund Performance
Market Recap: The MSCI ACWI (All Country World Index) ex USA Index returned 23.85% for the 12 months ending October 31, 2017, helped partly by a generally weak U.S. dollar. Some favorable election results in continental Europe (+30%) suggested ebbing political uncertainty and near-term risk there, but the U.K. (+20%) faced more-mixed conditions ahead of its expected exit from the European Union. Despite central-bank easing – and pressured recently by yen strength – Japan (+18%) lagged the rest of the Asia-Pacific group (+22%). Commodity-price volatility slowed Canada (+17%), but the emerging-markets group (+26%) sped ahead. Sector-wise, information technology (+47%) was driven by a surge among several Chinese internet-related names. Financials (+27%) rode rising interest rates that, at the same time, weighed on real estate (+17%), utilities (+16%), consumer staples (+14%) and telecommunication services (+9%) – so-called “bond proxy” sectors. Materials (+28%) and industrials (+27%) responded to demand from China and price gains for certain commodities. In the energy sector (+20%), oil prices lost ground in the spring before rebounding through October 31 to end well above where they started 12 months ago. Lastly, health care (+14%) was hurt by early-period turmoil around drug pricing and health care legislation.
Comments from Portfolio Manager David Jenkins: For the fiscal year, the fund gained 23.68%, beating the 21.03% return of the benchmark Russell/Nomura Mid-Small Cap℠ Index. Stocks in Japan benefited from improved domestic economic growth, rising consumer confidence, declining unemployment and a weaker yen. Small-cap stocks, with their more-domestic focus, outpaced mid- and large-caps. My focus on higher-quality companies with good balance sheets, strong free-cash-flow conversion and attractive valuations aided the fund’s result versus the benchmark, as did my small-cap bias. Security selection in the consumer discretionary and industrials sectors drove much of the fund's relative result. Our top individual contributor was Koshidaka Holdings, which saw its karaoke business benefit from the introduction of a new urban store format and new technology. We boosted our stake this period and it was the fund’s largest holding as of October 31. In industrials, our position in consulting services company Funai Soken Holdings rose 137%, as the improving economy gave the enterprises it targets more financial resources to pay for help growing their businesses. By contrast, positioning in materials and picks in real estate each detracted. The biggest individual disappointment was San A, a large food retailer. Its stock declined as investors shifted toward more-economically sensitive stocks and exporters.
The views expressed above reflect those of the portfolio manager(s) only through the end of the period as stated on the cover of this report and do not necessarily represent the views of Fidelity or any other person in the Fidelity organization. Any such views are subject to change at any time based upon market or other conditions and Fidelity disclaims any responsibility to update such views. These views may not be relied on as investment advice and, because investment decisions for a Fidelity fund are based on numerous factors, may not be relied on as an indication of trading intent on behalf of any Fidelity fund.
Fidelity® Japan Smaller Companies Fund
Investment Summary (Unaudited)
Geographic Diversification (% of fund's net assets)
| As of October 31, 2017 |
| | Japan | 92.9% |
| | United States of America* | 7.1% |

* Includes Short-Term investments and Net Other Assets (Liabilities).
Percentages are based on country or territory of incorporation and are adjusted for the effect of futures contracts, if applicable.
| As of April 30, 2017 |
| | Japan | 98.0% |
| | United States of America* | 2.0% |

* Includes Short-Term investments and Net Other Assets (Liabilities).
Percentages are based on country or territory of incorporation and are adjusted for the effect of futures contracts, if applicable.
Asset Allocation as of October 31, 2017
| | % of fund's net assets | % of fund's net assets 6 months ago |
| Stocks | 92.9 | 98.0 |
| Short-Term Investments and Net Other Assets (Liabilities) | 7.1 | 2.0 |
Top Ten Stocks as of October 31, 2017
| | % of fund's net assets | % of fund's net assets 6 months ago |
| Koshidaka Holdings Co. Ltd. (Hotels, Restaurants & Leisure) | 2.2 | 1.2 |
| Mitsubishi Chemical Holdings Corp. (Chemicals) | 2.0 | 1.8 |
| Fujitsu Ltd. (IT Services) | 1.9 | 1.9 |
| Yamada Consulting Group Co. Ltd. (Professional Services) | 1.9 | 1.4 |
| Central Automotive Products Ltd. (Distributors) | 1.9 | 1.5 |
| A/S One Corp. (Health Care Providers & Services) | 1.7 | 1.7 |
| Sekisui Jushi Corp. (Building Products) | 1.7 | 1.7 |
| Kotobuki Spirits Co. Ltd. (Food Products) | 1.7 | 2.0 |
| Lintec Corp. (Chemicals) | 1.7 | 1.6 |
| ORIX Corp. (Diversified Financial Services) | 1.6 | 1.8 |
| | 18.3 | |
Top Market Sectors as of October 31, 2017
| | % of fund's net assets | % of fund's net assets 6 months ago |
| Industrials | 22.4 | 23.9 |
| Consumer Discretionary | 19.8 | 20.3 |
| Information Technology | 11.0 | 11.1 |
| Materials | 10.4 | 10.1 |
| Financials | 9.4 | 10.1 |
| Consumer Staples | 8.6 | 9.5 |
| Health Care | 4.8 | 5.3 |
| Utilities | 2.5 | 3.5 |
| Energy | 2.2 | 2.1 |
| Real Estate | 1.4 | 1.6 |
Fidelity® Japan Smaller Companies Fund
Investments October 31, 2017
Showing Percentage of Net Assets
| Common Stocks - 92.9% | | | |
| | | Shares | Value |
| CONSUMER DISCRETIONARY - 19.8% | | | |
| Auto Components - 3.7% | | | |
| Bridgestone Corp. | | 224,900 | $10,743,563 |
| Hi-Lex Corp. | | 271,100 | 6,857,689 |
| Sumitomo Electric Industries Ltd. | | 644,500 | 10,972,834 |
| | | | 28,574,086 |
| Automobiles - 1.8% | | | |
| Isuzu Motors Ltd. | | 606,000 | 8,850,876 |
| Subaru Corp. | | 149,000 | 5,147,818 |
| | | | 13,998,694 |
| Distributors - 3.1% | | | |
| Central Automotive Products Ltd. | | 885,000 | 14,401,166 |
| Chori Co. Ltd. | | 196,100 | 3,573,650 |
| PALTAC Corp. | | 140,000 | 5,560,246 |
| | | | 23,535,062 |
| Diversified Consumer Services - 0.5% | | | |
| Asante, Inc. | | 207,500 | 3,843,825 |
| Hotels, Restaurants & Leisure - 2.2% | | | |
| Koshidaka Holdings Co. Ltd. | | 411,600 | 16,649,951 |
| Household Durables - 0.9% | | | |
| Panasonic Corp. | | 445,000 | 6,719,217 |
| Media - 1.2% | | | |
| Daiichikosho Co. Ltd. | | 187,900 | 8,854,346 |
| Specialty Retail - 5.1% | | | |
| Arc Land Sakamoto Co. Ltd. | | 466,700 | 7,628,089 |
| Fuji Corp. (a) | | 303,300 | 5,675,319 |
| Nitori Holdings Co. Ltd. | | 68,600 | 9,969,730 |
| VT Holdings Co. Ltd. | | 1,487,400 | 8,096,845 |
| Workman Co. Ltd. | | 244,000 | 7,605,701 |
| | | | 38,975,684 |
| Textiles, Apparel & Luxury Goods - 1.3% | | | |
| Hagihara Industries, Inc. | | 565,600 | 9,822,275 |
|
| TOTAL CONSUMER DISCRETIONARY | | | 150,973,140 |
|
| CONSUMER STAPLES - 8.6% | | | |
| Food & Staples Retailing - 2.9% | | | |
| Kirindo Holdings Co. Ltd. | | 301,100 | 4,035,382 |
| Mitsubishi Shokuhin Co. Ltd. | | 342,300 | 10,156,588 |
| San-A Co. Ltd. | | 184,000 | 8,467,357 |
| | | | 22,659,327 |
| Food Products - 5.3% | | | |
| Japan Meat Co. Ltd. | | 487,400 | 7,796,290 |
| Kotobuki Spirits Co. Ltd. (a) | | 315,000 | 12,965,329 |
| Morinaga & Co. Ltd. | | 154,700 | 8,788,474 |
| S Foods, Inc. | | 282,700 | 10,751,181 |
| | | | 40,301,274 |
| Tobacco - 0.4% | | | |
| Japan Tobacco, Inc. | | 90,000 | 2,979,018 |
|
| TOTAL CONSUMER STAPLES | | | 65,939,619 |
|
| ENERGY - 2.2% | | | |
| Energy Equipment & Services - 0.9% | | | |
| Shinko Plantech Co. Ltd. | | 798,000 | 6,890,173 |
| Oil, Gas & Consumable Fuels - 1.3% | | | |
| San-Ai Oil Co. Ltd. | | 820,800 | 9,803,240 |
|
| TOTAL ENERGY | | | 16,693,413 |
|
| FINANCIALS - 9.4% | | | |
| Banks - 3.4% | | | |
| Fukuoka Financial Group, Inc. | | 972,000 | 5,016,694 |
| Mitsubishi UFJ Financial Group, Inc. | | 1,224,600 | 8,306,639 |
| Shinsei Bank Ltd. | | 448,300 | 7,565,407 |
| The Suruga Bank Ltd. | | 230,000 | 5,236,782 |
| | | | 26,125,522 |
| Consumer Finance - 0.8% | | | |
| AEON Financial Service Co. Ltd. | | 291,600 | 6,262,543 |
| Diversified Financial Services - 2.8% | | | |
| Fuyo General Lease Co. Ltd. | | 135,300 | 8,847,571 |
| ORIX Corp. | | 731,800 | 12,582,287 |
| | | | 21,429,858 |
| Insurance - 2.4% | | | |
| T&D Holdings, Inc. | | 618,000 | 9,641,210 |
| Tokio Marine Holdings, Inc. | | 199,500 | 8,599,891 |
| | | | 18,241,101 |
|
| TOTAL FINANCIALS | | | 72,059,024 |
|
| HEALTH CARE - 4.8% | | | |
| Health Care Equipment & Supplies - 2.2% | | | |
| Medikit Co. Ltd. | | 216,100 | 10,447,893 |
| Paramount Bed Holdings Co. Ltd. | | 138,900 | 6,125,373 |
| | | | 16,573,266 |
| Health Care Providers & Services - 1.7% | | | |
| A/S One Corp. | | 241,000 | 13,249,620 |
| Pharmaceuticals - 0.9% | | | |
| Astellas Pharma, Inc. | | 543,500 | 7,233,364 |
|
| TOTAL HEALTH CARE | | | 37,056,250 |
|
| INDUSTRIALS - 22.4% | | | |
| Air Freight & Logistics - 0.8% | | | |
| AIT Corp. | | 525,400 | 6,129,139 |
| Airlines - 1.1% | | | |
| Japan Airlines Co. Ltd. | | 239,600 | 8,200,868 |
| Building Products - 2.9% | | | |
| Sekisui Jushi Corp. | | 581,300 | 12,983,079 |
| Sinko Industries Ltd. | | 553,800 | 9,016,670 |
| | | | 21,999,749 |
| Commercial Services & Supplies - 2.4% | | | |
| Aeon Delight Co. Ltd. | | 281,300 | 10,529,632 |
| ProNexus, Inc. | | 594,900 | 7,219,571 |
| Secom Joshinetsu Co. Ltd. | | 12,500 | 419,073 |
| | | | 18,168,276 |
| Construction & Engineering - 2.0% | | | |
| Hokuriku Electrical Construction Co. Ltd. (a) | | 859,300 | 7,869,524 |
| Toshiba Plant Systems & Services Corp. | | 431,500 | 7,443,112 |
| | | | 15,312,636 |
| Electrical Equipment - 1.9% | | | |
| Aichi Electric Co. Ltd. | | 175,100 | 5,100,886 |
| Denyo Co. Ltd. | | 543,100 | 9,122,845 |
| | | | 14,223,731 |
| Machinery - 2.0% | | | |
| Mitsubishi Heavy Industries Ltd. | | 183,700 | 7,187,614 |
| NGK Insulators Ltd. | | 399,000 | 7,900,751 |
| | | | 15,088,365 |
| Marine - 0.8% | | | |
| Nippon Concept Corp. | | 560,000 | 6,267,043 |
| Professional Services - 3.2% | | | |
| Funai Soken Holdings, Inc. | | 264,320 | 9,711,478 |
| Yamada Consulting Group Co. Ltd. (a) | | 762,400 | 14,729,107 |
| | | | 24,440,585 |
| Trading Companies & Distributors - 3.9% | | | |
| Inaba Denki Sangyo Co. Ltd. | | 228,800 | 10,043,417 |
| Mitani Shoji Co. Ltd. | | 108,100 | 4,287,050 |
| Trusco Nakayama Corp. | | 302,500 | 7,739,510 |
| Yuasa Trading Co. Ltd. | | 220,800 | 8,140,504 |
| | | | 30,210,481 |
| Transportation Infrastructure - 1.4% | | | |
| Kamigumi Co. Ltd. | | 462,000 | 11,059,813 |
|
| TOTAL INDUSTRIALS | | | 171,100,686 |
|
| INFORMATION TECHNOLOGY - 11.0% | | | |
| Electronic Equipment & Components - 2.7% | | | |
| Amano Corp. | | 503,200 | 12,381,984 |
| Dexerials Corp. | | 731,500 | 8,242,572 |
| | | | 20,624,556 |
| Internet Software & Services - 0.5% | | | |
| Aucnet, Inc. | | 301,500 | 3,987,172 |
| IT Services - 4.1% | | | |
| Fujitsu Ltd. | | 1,920,000 | 14,961,591 |
| Otsuka Corp. | | 131,000 | 8,930,075 |
| TKC Corp. | | 238,200 | 7,497,522 |
| | | | 31,389,188 |
| Semiconductors & Semiconductor Equipment - 0.3% | | | |
| Renesas Electronics Corp. (b) | | 184,900 | 2,390,589 |
| Software - 2.0% | | | |
| Broadleaf Co. Ltd. | | 624,000 | 5,123,147 |
| Oracle Corp. Japan | | 114,200 | 9,663,093 |
| | | | 14,786,240 |
| Technology Hardware, Storage & Peripherals - 1.4% | | | |
| Elecom Co. Ltd. | | 543,500 | 10,891,005 |
|
| TOTAL INFORMATION TECHNOLOGY | | | 84,068,750 |
|
| MATERIALS - 10.4% | | | |
| Chemicals - 7.4% | | | |
| C. Uyemura & Co. Ltd. | | 131,400 | 8,145,510 |
| Lintec Corp. | | 458,000 | 12,728,668 |
| Mitsubishi Chemical Holdings Corp. | | 1,479,800 | 15,456,977 |
| Sakata INX Corp. | | 584,000 | 11,262,528 |
| SK Kaken Co. Ltd. | | 103,000 | 8,557,592 |
| | | | 56,151,275 |
| Construction Materials - 1.4% | | | |
| Taiheiyo Cement Corp. | | 274,500 | 10,971,488 |
| Metals & Mining - 1.6% | | | |
| JFE Holdings, Inc. | | 572,000 | 12,293,012 |
|
| TOTAL MATERIALS | | | 79,415,775 |
|
| REAL ESTATE - 1.4% | | | |
| Real Estate Management & Development - 1.4% | | | |
| Century21 Real Estate Japan Ltd. | | 275,400 | 3,315,857 |
| Daito Trust Construction Co. Ltd. | | 42,400 | 7,412,979 |
| | | | 10,728,836 |
| TELECOMMUNICATION SERVICES - 0.4% | | | |
| Wireless Telecommunication Services - 0.4% | | | |
| KDDI Corp. | | 107,900 | 2,874,741 |
| UTILITIES - 2.5% | | | |
| Electric Utilities - 1.1% | | | |
| The Okinawa Electric Power Co., Inc. | | 356,592 | 8,147,223 |
| Gas Utilities - 1.4% | | | |
| Tokyo Gas Co. Ltd. | | 442,200 | 11,030,965 |
|
| TOTAL UTILITIES | | | 19,178,188 |
|
| TOTAL COMMON STOCKS | | | |
| (Cost $486,695,721) | | | 710,088,422 |
|
| Money Market Funds - 6.5% | | | |
| Fidelity Cash Central Fund, 1.10% (c) | | 41,997,205 | 42,005,605 |
| Fidelity Securities Lending Cash Central Fund 1.11% (c)(d) | | 7,531,692 | 7,532,445 |
| TOTAL MONEY MARKET FUNDS | | | |
| (Cost $49,537,792) | | | 49,538,050 |
| TOTAL INVESTMENT IN SECURITIES - 99.4% | | | |
| (Cost $536,233,513) | | | 759,626,472 |
| NET OTHER ASSETS (LIABILITIES) - 0.6% | | | 4,425,214 |
| NET ASSETS - 100% | | | $764,051,686 |
Legend
(a) Security or a portion of the security is on loan at period end.
(b) Non-income producing
(c) Affiliated fund that is generally available only to investment companies and other accounts managed by Fidelity Investments. The rate quoted is the annualized seven-day yield of the fund at period end. A complete unaudited listing of the fund's holdings as of its most recent quarter end is available upon request. In addition, each Fidelity Central Fund's financial statements, which are not covered by the Fund's Report of Independent Registered Public Accounting Firm, are available on the SEC's website or upon request.
(d) Investment made with cash collateral received from securities on loan.
Affiliated Central Funds
Information regarding fiscal year to date income earned by the Fund from investments in Fidelity Central Funds is as follows:
| Fund | Income earned |
| Fidelity Cash Central Fund | $110,866 |
| Fidelity Securities Lending Cash Central Fund | 140,163 |
| Total | $251,029 |
Investment Valuation
The following is a summary of the inputs used, as of October 31, 2017, involving the Fund's assets and liabilities carried at fair value. The inputs or methodology used for valuing securities may not be an indication of the risk associated with investing in those securities. For more information on valuation inputs, and their aggregation into the levels used below, please refer to the Investment Valuation section in the accompanying Notes to Financial Statements.
| | Valuation Inputs at Reporting Date: |
| Description | Total | Level 1 | Level 2 | Level 3 |
| Investments in Securities: | | | | |
| Equities: | | | | |
| Consumer Discretionary | $150,973,140 | $-- | $150,973,140 | $-- |
| Consumer Staples | 65,939,619 | -- | 65,939,619 | -- |
| Energy | 16,693,413 | -- | 16,693,413 | -- |
| Financials | 72,059,024 | -- | 72,059,024 | -- |
| Health Care | 37,056,250 | -- | 37,056,250 | -- |
| Industrials | 171,100,686 | -- | 171,100,686 | -- |
| Information Technology | 84,068,750 | -- | 84,068,750 | -- |
| Materials | 79,415,775 | -- | 79,415,775 | -- |
| Real Estate | 10,728,836 | -- | 10,728,836 | -- |
| Telecommunication Services | 2,874,741 | -- | 2,874,741 | -- |
| Utilities | 19,178,188 | -- | 19,178,188 | -- |
| Money Market Funds | 49,538,050 | 49,538,050 | -- | -- |
| Total Investments in Securities: | $759,626,472 | $49,538,050 | $710,088,422 | $-- |
The following is a summary of transfers between Level 1 and Level 2 for the period ended October 31, 2017. Transfers are assumed to have occurred at the beginning of the period, and are primarily attributable to the valuation techniques used for foreign equity securities, as discussed in the accompanying Notes to Financial Statements:
| Transfers | Total |
| Level 1 to Level 2 | $500,113,772 |
| Level 2 to Level 1 | $0 |
See accompanying notes which are an integral part of the financial statements.
Fidelity® Japan Smaller Companies Fund
Financial Statements
Statement of Assets and Liabilities
| | | October 31, 2017 |
| Assets | | |
Investment in securities, at value (including securities loaned of $7,162,946) — See accompanying schedule:
Unaffiliated issuers (cost $486,695,721) | $710,088,422 | |
| Fidelity Central Funds (cost $49,537,792) | 49,538,050 | |
| Total Investment in Securities (cost $536,233,513) | | $759,626,472 |
| Foreign currency held at value (cost $42,515) | | 42,515 |
| Receivable for investments sold | | 8,798,967 |
| Receivable for fund shares sold | | 1,458,928 |
| Dividends receivable | | 4,546,611 |
| Distributions receivable from Fidelity Central Funds | | 29,844 |
| Prepaid expenses | | 1,518 |
| Other receivables | | 1,699 |
| Total assets | | 774,506,554 |
| Liabilities | | |
| Payable for investments purchased | $1,583,507 | |
| Payable for fund shares redeemed | 716,293 | |
| Accrued management fee | 423,804 | |
| Other affiliated payables | 131,697 | |
| Other payables and accrued expenses | 66,880 | |
| Collateral on securities loaned | 7,532,687 | |
| Total liabilities | | 10,454,868 |
| Net Assets | | $764,051,686 |
| Net Assets consist of: | | |
| Paid in capital | | $530,473,206 |
| Undistributed net investment income | | 6,398,905 |
| Accumulated undistributed net realized gain (loss) on investments and foreign currency transactions | | 3,851,207 |
| Net unrealized appreciation (depreciation) on investments and assets and liabilities in foreign currencies | | 223,328,368 |
| Net Assets, for 40,544,307 shares outstanding | | $764,051,686 |
| Net Asset Value, offering price and redemption price per share ($764,051,686 ÷ 40,544,307 shares) | | $18.84 |
See accompanying notes which are an integral part of the financial statements.
Statement of Operations
| | | Year ended October 31, 2017 |
| Investment Income | | |
| Dividends | | $13,678,947 |
| Income from Fidelity Central Funds | | 251,029 |
| Income before foreign taxes withheld | | 13,929,976 |
| Less foreign taxes withheld | | (1,365,254) |
| Total income | | 12,564,722 |
| Expenses | | |
| Management fee | $4,391,810 | |
| Transfer agent fees | 1,119,257 | |
| Accounting and security lending fees | 315,370 | |
| Custodian fees and expenses | 66,146 | |
| Independent trustees' fees and expenses | 2,449 | |
| Registration fees | 27,095 | |
| Audit | 66,060 | |
| Legal | 1,499 | |
| Miscellaneous | 5,236 | |
| Total expenses before reductions | 5,994,922 | |
| Expense reductions | (26,733) | 5,968,189 |
| Net investment income (loss) | | 6,596,533 |
| Realized and Unrealized Gain (Loss) | | |
| Net realized gain (loss) on: | | |
| Investment securities: | | |
| Unaffiliated issuers | 21,529,944 | |
| Fidelity Central Funds | 262 | |
| Foreign currency transactions | (500,220) | |
| Total net realized gain (loss) | | 21,029,986 |
| Change in net unrealized appreciation (depreciation) on: | | |
| Investment securities: | | |
| Unaffiliated issuers | 112,554,876 | |
| Fidelity Central Funds | (1,877) | |
| Assets and liabilities in foreign currencies | 92,802 | |
| Total change in net unrealized appreciation (depreciation) | | 112,645,801 |
| Net gain (loss) | | 133,675,787 |
| Net increase (decrease) in net assets resulting from operations | | $140,272,320 |
See accompanying notes which are an integral part of the financial statements.
Statement of Changes in Net Assets
| | Year ended October 31, 2017 | Year ended October 31, 2016 |
| Increase (Decrease) in Net Assets | | |
| Operations | | |
| Net investment income (loss) | $6,596,533 | $6,457,657 |
| Net realized gain (loss) | 21,029,986 | 13,937,326 |
| Change in net unrealized appreciation (depreciation) | 112,645,801 | 60,582,606 |
| Net increase (decrease) in net assets resulting from operations | 140,272,320 | 80,977,589 |
| Distributions to shareholders from net investment income | (6,334,246) | (3,361,556) |
| Distributions to shareholders from net realized gain | (9,182,783) | (3,952,599) |
| Total distributions | (15,517,029) | (7,314,155) |
| Share transactions | | |
| Proceeds from sales of shares | 109,404,114 | 106,869,419 |
| Reinvestment of distributions | 14,528,831 | 6,515,367 |
| Cost of shares redeemed | (71,725,248) | (102,939,703) |
| Net increase (decrease) in net assets resulting from share transactions | 52,207,697 | 10,445,083 |
| Redemption fees | 54,565 | 83,902 |
| Total increase (decrease) in net assets | 177,017,553 | 84,192,419 |
| Net Assets | | |
| Beginning of period | 587,034,133 | 502,841,714 |
| End of period | $764,051,686 | $587,034,133 |
| Other Information | | |
| Undistributed net investment income end of period | $6,398,905 | $6,281,121 |
| Shares | | |
| Sold | 6,520,288 | 7,750,747 |
| Issued in reinvestment of distributions | 984,338 | 472,128 |
| Redeemed | (4,442,602) | (7,291,814) |
| Net increase (decrease) | 3,062,024 | 931,061 |
See accompanying notes which are an integral part of the financial statements.
Financial Highlights
Fidelity Japan Smaller Companies Fund
| Years ended October 31, | 2017 | 2016 | 2015 | 2014 | 2013 |
| Selected Per–Share Data | | | | | |
| Net asset value, beginning of period | $15.66 | $13.76 | $13.10 | $13.86 | $9.12 |
| Income from Investment Operations | | | | | |
| Net investment income (loss)A | .17 | .17 | .10 | .09 | .02 |
| Net realized and unrealized gain (loss) | 3.42 | 1.93 | .78 | (.53) | 4.91 |
| Total from investment operations | 3.59 | 2.10 | .88 | (.44) | 4.93 |
| Distributions from net investment income | (.17) | (.09) | (.03) | (.02) | (.07) |
| Distributions from net realized gain | (.25) | (.11) | (.19) | (.31) | (.15) |
| Total distributions | (.41)B | (.20) | (.22) | (.33) | (.22) |
| Redemption fees added to paid in capitalA | –C | –C | –C | .01 | .03 |
| Net asset value, end of period | $18.84 | $15.66 | $13.76 | $13.10 | $13.86 |
| Total ReturnD | 23.68% | 15.44% | 6.93% | (3.16)% | 55.79% |
| Ratios to Average Net AssetsE,F | | | | | |
| Expenses before reductions | .95% | .96% | .98% | 1.00% | 1.01% |
| Expenses net of fee waivers, if any | .95% | .96% | .98% | 1.00% | 1.01% |
| Expenses net of all reductions | .94% | .96% | .97% | 1.00% | .98% |
| Net investment income (loss) | 1.04% | 1.18% | .77% | .70% | .18% |
| Supplemental Data | | | | | |
| Net assets, end of period (000 omitted) | $764,052 | $587,034 | $502,842 | $416,052 | $661,445 |
| Portfolio turnover rateG | 20% | 30% | 41% | 112% | 91% |
A Calculated based on average shares outstanding during the period.
B Total distributions of $.41 per share is comprised of distributions from net investment income of $.169 and distributions from net realized gain of $.245 per share.
C Amount represents less than $.005 per share.
D Total returns would have been lower if certain expenses had not been reduced during the applicable periods shown.
E Fees and expenses of any underlying Fidelity Central Funds are not included in the Fund's expense ratio. The Fund indirectly bears its proportionate share of the expenses of any underlying Fidelity Central Funds.
F Expense ratios reflect operating expenses of the Fund. Expenses before reductions do not reflect amounts reimbursed by the investment adviser or reductions from brokerage service arrangements or reductions from other expense offset arrangements and do not represent the amount paid by the Fund during periods when reimbursements or reductions occur. Expenses net of fee waivers reflect expenses after reimbursement by the investment adviser but prior to reductions from brokerage service arrangements or other expense offset arrangements. Expenses net of all reductions represent the net expenses paid by the Fund.
G Amount does not include the portfolio activity of any underlying Fidelity Central Funds.
See accompanying notes which are an integral part of the financial statements.
Notes to Financial Statements
For the period ended October 31, 2017
1. Organization.
Fidelity Japan Smaller Companies Fund (the Fund) is a fund of Fidelity Investment Trust (the Trust) and is authorized to issue an unlimited number of shares. Share transactions on the Statement of Changes in Net Assets may contain exchanges between affiliated funds. The Trust is registered under the Investment Company Act of 1940, as amended (the 1940 Act), as an open-end management investment company organized as a Massachusetts business trust.
2. Investments in Fidelity Central Funds.
The Fund invests in Fidelity Central Funds, which are open-end investment companies generally available only to other investment companies and accounts managed by the investment adviser and its affiliates. The Fund's Schedule of Investments lists each of the Fidelity Central Funds held as of period end, if any, as an investment of the Fund, but does not include the underlying holdings of each Fidelity Central Fund. As an Investing Fund, the Fund indirectly bears its proportionate share of the expenses of the underlying Fidelity Central Funds.
The Money Market Central Funds seek preservation of capital and current income and are managed by Fidelity Investments Money Management, Inc. (FIMM), an affiliate of the investment adviser. Annualized expenses of the Money Market Central Funds as of their most recent shareholder report date are less than .005%.
A complete unaudited list of holdings for each Fidelity Central Fund is available upon request or at the Securities and Exchange Commission (the SEC) website at www.sec.gov. In addition, the financial statements of the Fidelity Central Funds, which are not covered by the Fund's Report of Independent Registered Public Accounting Firm, are available on the SEC website or upon request.
3. Significant Accounting Policies.
The Fund is an investment company and applies the accounting and reporting guidance of the Financial Accounting Standards Board (FASB) Accounting Standards Codification Topic 946 Financial Services – Investments Companies. The financial statements have been prepared in conformity with accounting principles generally accepted in the United States of America (GAAP), which require management to make certain estimates and assumptions at the date of the financial statements. Actual results could differ from those estimates. Subsequent events, if any, through the date that the financial statements were issued have been evaluated in the preparation of the financial statements. The following summarizes the significant accounting policies of the Fund:
Investment Valuation. Investments are valued as of 4:00 p.m. Eastern time on the last calendar day of the period. The Board of Trustees (the Board) has delegated the day to day responsibility for the valuation of the Fund's investments to the Fair Value Committee (the Committee) established by the Fund's investment adviser. In accordance with valuation policies and procedures approved by the Board, the Fund attempts to obtain prices from one or more third party pricing vendors or brokers to value its investments. When current market prices, quotations or currency exchange rates are not readily available or reliable, investments will be fair valued in good faith by the Committee, in accordance with procedures adopted by the Board. Factors used in determining fair value vary by investment type and may include market or investment specific events. The frequency with which these procedures are used cannot be predicted and they may be utilized to a significant extent. The Committee oversees the Fund's valuation policies and procedures and reports to the Board on the Committee's activities and fair value determinations. The Board monitors the appropriateness of the procedures used in valuing the Fund's investments and ratifies the fair value determinations of the Committee.
The Fund categorizes the inputs to valuation techniques used to value its investments into a disclosure hierarchy consisting of three levels as shown below:
- Level 1 – quoted prices in active markets for identical investments
- Level 2 – other significant observable inputs (including quoted prices for similar investments, interest rates, prepayment speeds, etc.)
- Level 3 – unobservable inputs (including the Fund's own assumptions based on the best information available)
Valuation techniques used to value the Fund's investments by major category are as follows:
Equity securities, including restricted securities, for which market quotations are readily available, are valued at the last reported sale price or official closing price as reported by a third party pricing vendor on the primary market or exchange on which they are traded and are categorized as Level 1 in the hierarchy. In the event there were no sales during the day or closing prices are not available, securities are valued at the last quoted bid price or may be valued using the last available price and are generally categorized as Level 2 in the hierarchy. For foreign equity securities, when market or security specific events arise, comparisons to the valuation of American Depositary Receipts (ADRs), futures contracts, Exchange-Traded Funds (ETFs) and certain indexes as well as quoted prices for similar securities may be used and would be categorized as Level 2 in the hierarchy. Utilizing these techniques may result in transfers between Level 1 and Level 2. For equity securities, including restricted securities, where observable inputs are limited, assumptions about market activity and risk are used and these securities may be categorized as Level 3 in the hierarchy.
Investments in open-end mutual funds, including the Fidelity Central Funds, are valued at their closing net asset value (NAV) each business day and are categorized as Level 1 in the hierarchy.
Changes in valuation techniques may result in transfers in or out of an assigned level within the disclosure hierarchy. The aggregate value of investments by input level as of October 31, 2017, including information on transfers between Levels 1 and 2, is included at the end of the Fund's Schedule of Investments.
Foreign Currency. The Fund may use foreign currency contracts to facilitate transactions in foreign-denominated securities. Gains and losses from these transactions may arise from changes in the value of the foreign currency or if the counterparties do not perform under the contracts' terms.
Foreign-denominated assets, including investment securities, and liabilities are translated into U.S. dollars at the exchange rates at period end. Purchases and sales of investment securities, income and dividends received and expenses denominated in foreign currencies are translated into U.S. dollars at the exchange rate in effect on the transaction date.
The effects of exchange rate fluctuations on investments are included with the net realized and unrealized gain (loss) on investment securities. Other foreign currency transactions resulting in realized and unrealized gain (loss) are disclosed separately.
Investment Transactions and Income. For financial reporting purposes, the Fund's investment holdings and NAV include trades executed through the end of the last business day of the period. The NAV per share for processing shareholder transactions is calculated as of the close of business of the New York Stock Exchange (NYSE), normally 4:00 p.m. Eastern time and includes trades executed through the end of the prior business day. Gains and losses on securities sold are determined on the basis of identified cost. Dividend income is recorded on the ex-dividend date, except for certain dividends from foreign securities where the ex-dividend date may have passed, which are recorded as soon as the Fund is informed of the ex-dividend date. Non-cash dividends included in dividend income, if any, are recorded at the fair market value of the securities received. Income and capital gain distributions from Fidelity Central Funds, if any, are recorded on the ex-dividend date. Investment income is recorded net of foreign taxes withheld where recovery of such taxes is uncertain.
Expenses. Expenses directly attributable to a fund are charged to that fund. Expenses attributable to more than one fund are allocated among the respective funds on the basis of relative net assets or other appropriate methods. Expense estimates are accrued in the period to which they relate and adjustments are made when actual amounts are known.
Income Tax Information and Distributions to Shareholders. Each year, the Fund intends to qualify as a regulated investment company under Subchapter M of the Internal Revenue Code, including distributing substantially all of its taxable income and realized gains. As a result, no provision for U.S. Federal income taxes is required. As of October 31, 2017, the Fund did not have any unrecognized tax benefits in the financial statements; nor is the Fund aware of any tax positions for which it is reasonably possible that the total amounts of unrecognized tax benefits will significantly change in the next twelve months. The Fund files a U.S. federal tax return, in addition to state and local tax returns as required. The Fund's federal income tax returns are subject to examination by the Internal Revenue Service (IRS) for a period of three fiscal years after they are filed. State and local tax returns may be subject to examination for an additional fiscal year depending on the jurisdiction. Foreign taxes are provided for based on the Fund's understanding of the tax rules and rates that exist in the foreign markets in which it invests.
Distributions are declared and recorded on the ex-dividend date. Income and capital gain distributions are determined in accordance with income tax regulations, which may differ from GAAP. In addition, the Fund claimed a portion of the payment made to redeeming shareholders as a distribution for income tax purposes.
Capital accounts within the financial statements are adjusted for permanent book-tax differences. These adjustments have no impact on net assets or the results of operations. Capital accounts are not adjusted for temporary book-tax differences which will reverse in a subsequent period.
Book-tax differences are primarily due to foreign currency transactions, passive foreign investment companies (PFIC), deferred trustees compensation, capital loss carryforwards and losses deferred due to wash sales.
As of period end, the cost and unrealized appreciation (depreciation) in securities, and derivatives if applicable, for federal income tax purposes were as follows:
| Gross unrealized appreciation | $202,483,299 |
| Gross unrealized depreciation | (4,441,096) |
| Net unrealized appreciation (depreciation) | $198,042,203 |
| Tax Cost | $561,584,269 |
The tax-based components of distributable earnings as of period end were as follows:
| Undistributed ordinary income | $19,283,239 |
| Undistributed long-term capital gain | $16,303,701 |
| Net unrealized appreciation (depreciation) on securities and other investments | $197,991,556 |
The tax character of distributions paid was as follows:
| | October 31, 2017 | October 31, 2016 |
| Ordinary Income | $15,517,029 | $ 7,314,155 |
Short-Term Trading (Redemption) Fees. Shares held by investors in the Fund less than 90 days may have been subject to a redemption fee equal to 1.50% of the NAV of shares redeemed. All redemption fees, which reduce the proceeds of the shareholder redemption, are retained by the Fund and accounted for as an addition to paid in capital. In November 2017, the Board of Trustees approved the elimination of these redemption fees effective December 18, 2017.
4. Purchases and Sales of Investments.
Purchases and sales of securities, other than short-term securities, aggregated $125,052,944 and $123,978,409, respectively.
5. Fees and Other Transactions with Affiliates.
Management Fee. Fidelity Management & Research Company (the investment adviser) and its affiliates provide the Fund with investment management related services for which the Fund pays a monthly management fee. The management fee is the sum of an individual fund fee rate that is based on an annual rate of .45% of the Fund's average net assets and an annualized group fee rate that averaged .25% during the period. The group fee rate is based upon the average net assets of all the mutual funds advised by the investment adviser, including any mutual funds previously advised by the investment adviser that are currently advised by Fidelity SelectCo, LLC, an affiliate of the investment adviser. The group fee rate decreases as assets under management increase and increases as assets under management decrease. For the reporting period, the total annual management fee rate was .69% of the Fund's average net assets.
Transfer Agent Fees. Fidelity Investments Institutional Operations Company, Inc. (FIIOC), an affiliate of the investment adviser, is the Fund's transfer, dividend disbursing and shareholder servicing agent. FIIOC receives account fees and asset-based fees that vary according to account size and type of account. FIIOC pays for typesetting, printing and mailing of shareholder reports, except proxy statements. For the period, the transfer agent fees were equivalent to an annual rate of .18% of average net assets.
Accounting and Security Lending Fees. Fidelity Service Company, Inc. (FSC), an affiliate of the investment adviser, maintains the Fund's accounting records. The accounting fee is based on the level of average net assets for each month. Under a separate contract, FSC administers the security lending program. The security lending fee is based on the number and duration of lending transactions.
Interfund Trades. The Fund may purchase from or sell securities to other Fidelity Funds under procedures adopted by the Board. The procedures have been designed to ensure these interfund trades are executed in accordance with Rule 17a-7 of the 1940 Act. Interfund trades are included within the respective purchases and sales amounts shown in the Purchases and Sales of Investments note.
6. Committed Line of Credit.
The Fund participates with other funds managed by the investment adviser or an affiliate in a $4.25 billion credit facility (the "line of credit") to be utilized for temporary or emergency purposes to fund shareholder redemptions or for other short-term liquidity purposes. The Fund has agreed to pay commitment fees on its pro-rata portion of the line of credit, which amounted to $1,969 and is reflected in Miscellaneous expenses on the Statement of Operations. During the period, the Fund did not borrow on this line of credit.
7. Security Lending.
The Fund lends portfolio securities through a lending agent from time to time in order to earn additional income. For equity securities, a lending agent is used and may loan securities to certain qualified borrowers, including Fidelity Capital Markets (FCM), a broker-dealer affiliated with the Fund. On the settlement date of the loan, the Fund receives collateral (in the form of U.S. Treasury obligations, letters of credit and/or cash) against the loaned securities and maintains collateral in an amount not less than 100% of the market value of the loaned securities during the period of the loan. The market value of the loaned securities is determined at the close of business of the Fund and any additional required collateral is delivered to the Fund on the next business day. The Fund or borrower may terminate the loan at any time, and if the borrower defaults on its obligation to return the securities loaned because of insolvency or other reasons, the Fund may apply collateral received from the borrower against the obligation. The Fund may experience delays and costs in recovering the securities loaned. Any cash collateral received is invested in the Fidelity Securities Lending Cash Central Fund. The value of loaned securities and cash collateral at period end are disclosed on the Fund's Statement of Assets and Liabilities. Security lending income represents the income earned on investing cash collateral, less rebates paid to borrowers and any lending agent fees associated with the loan, plus any premium payments received for lending certain types of securities. Security lending income is presented in the Statement of Operations as a component of income from Fidelity Central Funds. Total security lending income during the period amounted to $140,163. During the period, there were no securities loaned to FCM.
8. Expense Reductions.
Commissions paid to certain brokers with whom the investment adviser, or its affiliates, places trades on behalf of the Fund include an amount in addition to trade execution, which may be rebated back to the Fund to offset certain expenses. This amount totaled $21,675 for the period.
In addition, during the period the investment adviser reimbursed and/or waived a portion of operating expenses in the amount of $5,058.
9. Other.
The Fund's organizational documents provide former and current trustees and officers with a limited indemnification against liabilities arising in connection with the performance of their duties to the Fund. In the normal course of business, the Fund may also enter into contracts that provide general indemnifications. The Fund's maximum exposure under these arrangements is unknown as this would be dependent on future claims that may be made against the Fund. The risk of material loss from such claims is considered remote.
At the end of the period, Strategic Advisers International Fund and VIP FundsManager 60% Portfolio were the owners of record of approximately 14% and 10%, respectively of the total outstanding shares of the Fund. Mutual funds managed by the investment adviser or its affiliates were the owners of record, in the aggregate, of approximately 45% of the total outstanding shares of the Fund.
Fidelity® Latin America Fund
Performance: The Bottom Line
Average annual total return reflects the change in the value of an investment, assuming reinvestment of distributions from dividend income and capital gains (the profits earned upon the sale of securities that have grown in value, if any) and assuming a constant rate of performance each year. The hypothetical investment and the average annual total returns do not reflect the deduction of taxes that a shareholder would pay on fund distributions or the redemption of fund shares. During periods of reimbursement by Fidelity, a fund’s total return will be greater than it would be had the reimbursement not occurred. How a fund did yesterday is no guarantee of how it will do tomorrow.
Average Annual Total Returns
| For the periods ended October 31, 2017 | Past 1 year | Past 5 years | Past 10 years |
| Fidelity® Latin America Fund | 13.87% | (4.66)% | (4.39)% |
$10,000 Over 10 Years
Let's say hypothetically that $10,000 was invested in Fidelity® Latin America Fund, a class of the fund, on October 31, 2007.
The chart shows how the value of your investment would have changed, and also shows how the MSCI EM (Emerging Markets) Latin America Index performed over the same period.
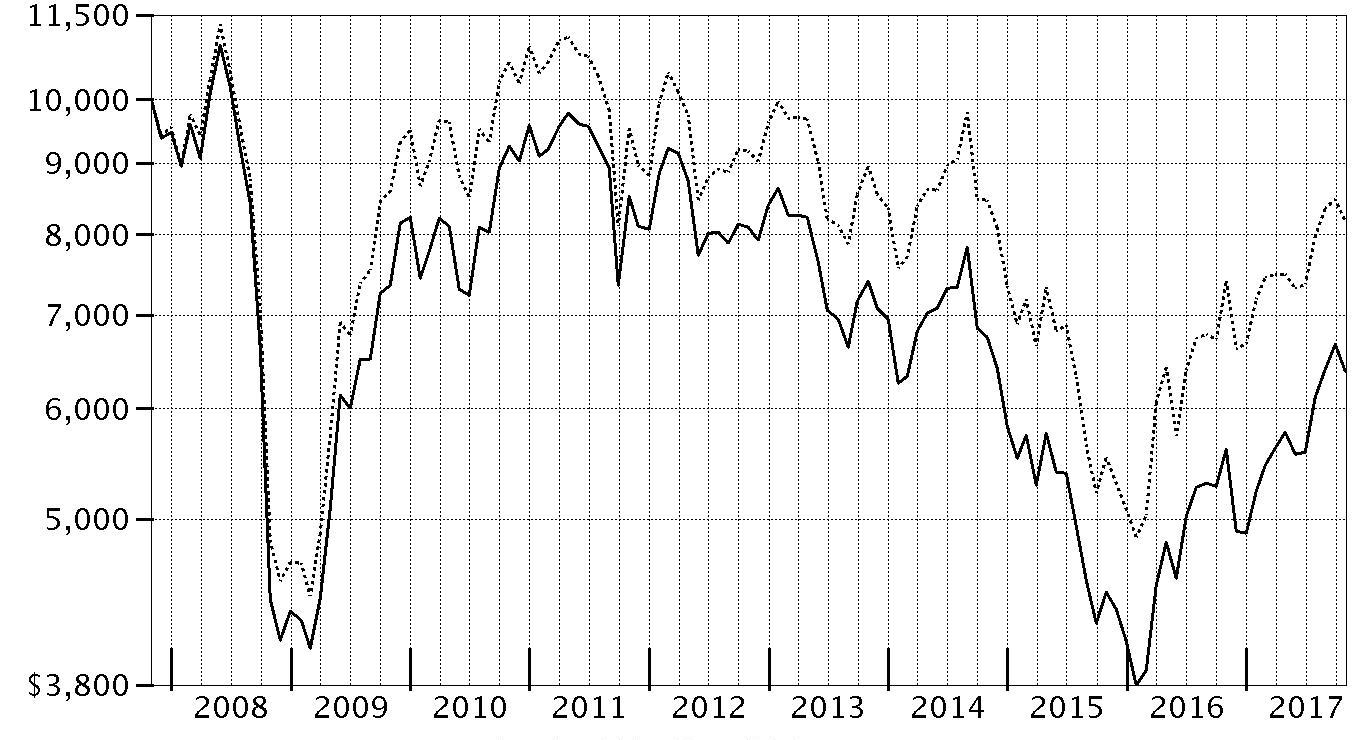
| Period Ending Values |
| $6,384 | Fidelity® Latin America Fund |
| $8,182 | MSCI EM (Emerging Markets) Latin America Index |
Fidelity® Latin America Fund
Management's Discussion of Fund Performance
Market Recap: The MSCI ACWI (All Country World Index) ex USA Index returned 23.85% for the 12 months ending October 31, 2017, helped partly by a generally weak U.S. dollar. Some favorable election results in continental Europe (+30%) suggested ebbing political uncertainty and near-term risk there, but the U.K. (+20%) faced more-mixed conditions ahead of its expected exit from the European Union. Despite central-bank easing – and pressured recently by yen strength – Japan (+18%) lagged the rest of the Asia-Pacific group (+22%). Commodity-price volatility slowed Canada (+17%), but the emerging-markets group (+26%) sped ahead. Sector-wise, information technology (+47%) was driven by a surge among several Chinese internet-related names. Financials (+27%) rode rising interest rates that, at the same time, weighed on real estate (+17%), utilities (+16%), consumer staples (+14%) and telecommunication services (+9%) – so-called “bond proxy” sectors. Materials (+28%) and industrials (+27%) responded to demand from China and price gains for certain commodities. In the energy sector (+20%), oil prices lost ground in the spring before rebounding through October 31 to end well above where they started 12 months ago. Lastly, health care (+14%) was hurt by early-period turmoil around drug pricing and health care legislation.
Comments from Portfolio Manager Will Pruett: For the year, the fund’s share classes (excluding sales charges, if applicable) gained roughly 13% to 14%, ahead of the 10.50% return of the benchmark MSCI Emerging Markets Latin America Index. Versus the benchmark, stock selection in Brazil helped most. Here, for-profit education company Estacio Participacoes contributed more than any other individual holding. Brazil's regulators in June blocked a planned takeover of the company by Kroton Educacional. Shares rallied significantly after the deal rejection, however, as by that time, Estacio had made significant progress increasing its profit margins. Smiles (provider of frequent-flyer programs), CVC Brasil Operadora (tourism services) and Alpargatas (apparel maker best known for its Havaianas
® flip-flops) also did well. Further, non-benchmark exposure to stocks of companies in Panama proved helpful this period. Conversely, stock picking in Mexico significantly detracted, while positioning in Chile and the fund’s stake in cash hurt to a much lesser extent. By individual stock, our stake in Mexico-based Gentera hurt most. The firm, which provides working-capital loans for women's groups, struggled amid increased competition and failed cross-selling efforts. Underweighting Brazil-based Vale, the world’s largest producer of nickel and iron ore, also detracted, as its shares rose 46% this period.
The views expressed above reflect those of the portfolio manager(s) only through the end of the period as stated on the cover of this report and do not necessarily represent the views of Fidelity or any other person in the Fidelity organization. Any such views are subject to change at any time based upon market or other conditions and Fidelity disclaims any responsibility to update such views. These views may not be relied on as investment advice and, because investment decisions for a Fidelity fund are based on numerous factors, may not be relied on as an indication of trading intent on behalf of any Fidelity fund.
Fidelity® Latin America Fund
Investment Summary (Unaudited)
Geographic Diversification (% of fund's net assets)
| As of October 31, 2017 |
| | Brazil | 65.0% |
| | Mexico | 17.6% |
| | Panama | 4.5% |
| | Bermuda | 3.7% |
| | United States of America* | 3.1% |
| | Spain | 2.0% |
| | United Kingdom | 1.8% |
| | Luxembourg | 1.3% |
| | Chile | 1.0% |

* Amount is stated in United States dollars unless otherwise noted.
Percentages are based on country or territory of incorporation and are adjusted for the effect of futures contracts, if applicable.
| As of April 30, 2017 |
| | Brazil | 61.9% |
| | Mexico | 20.3% |
| | Bermuda | 4.6% |
| | Panama | 4.5% |
| | United States of America* | 2.8% |
| | United Kingdom | 1.8% |
| | Spain | 1.4% |
| | Chile | 0.9% |
| | Peru | 0.9% |
| | Other | 0.9% |

* Includes Short-Term investments and Net Other Assets (Liabilities).
Percentages are based on country or territory of incorporation and are adjusted for the effect of futures contracts, if applicable.
Asset Allocation as of October 31, 2017
| | % of fund's net assets | % of fund's net assets 6 months ago |
| Stocks | 98.4 | 98.6 |
| Short-Term Investments and Net Other Assets (Liabilities) | 1.6 | 1.4 |
Top Ten Stocks as of October 31, 2017
| | % of fund's net assets | % of fund's net assets 6 months ago |
| Itau Unibanco Holding SA (Brazil, Banks) | 8.9 | 10.4 |
| Itausa-Investimentos Itau SA (Brazil, Banks) | 8.2 | 7.4 |
| Estacio Participacoes SA (Brazil, Diversified Consumer Services) | 5.0 | 2.6 |
| Petroleo Brasileiro SA - Petrobras (PN) (non-vtg.) (Brazil, Oil, Gas & Consumable Fuels) | 4.9 | 4.5 |
| Kroton Educacional SA (Brazil, Diversified Consumer Services) | 3.8 | 3.5 |
| Credicorp Ltd. (United States) (Bermuda, Banks) | 3.7 | 3.2 |
| Smiles Fidelidade SA (Brazil, Media) | 3.5 | 3.9 |
| Banco do Brasil SA (Brazil, Banks) | 3.4 | 0.0 |
| Qualicorp SA (Brazil, Health Care Providers & Services) | 3.1 | 2.7 |
| Copa Holdings SA Class A (Panama, Airlines) | 2.8 | 3.0 |
| | 47.3 | |
Top Market Sectors as of October 31, 2017
| | % of fund's net assets | % of fund's net assets 6 months ago |
| Financials | 40.8 | 37.5 |
| Consumer Discretionary | 22.4 | 18.5 |
| Industrials | 13.7 | 12.8 |
| Health Care | 7.6 | 8.6 |
| Energy | 4.9 | 4.5 |
| Consumer Staples | 4.7 | 4.2 |
| Materials | 2.7 | 4.0 |
| Utilities | 1.6 | 2.0 |
| Information Technology | 0.0 | 5.3 |
| Real Estate | 0.0 | 1.2 |
Market Sectors may include more than one industry category.
The Fund may invest up to 35% of its total assets in any industry that represents more than 20% of the Latin American market. As of October 31, 2017, 28.7% of the Fund’s total assets were invested in the Diversified Banks industry, which accounts for more than 20% of the Latin American market.
Percentages shown as 0.0% may reflect amounts less than 0.05%.
Fidelity® Latin America Fund
Investments October 31, 2017
Showing Percentage of Net Assets
| Common Stocks - 73.0% | | | |
| | | Shares | Value |
| Bermuda - 3.7% | | | |
| Credicorp Ltd. (United States) | | 111,536 | $23,360,100 |
| Brazil - 39.6% | | | |
| Alliar Medicos a Frente SA | | 275,047 | 1,374,688 |
| Azul SA sponsored ADR | | 374,025 | 9,459,092 |
| Banco do Brasil SA | | 2,042,295 | 21,501,128 |
| BTG Pactual Participations Ltd. unit | | 1,105,440 | 7,437,635 |
| CVC Brasil Operadora e Agencia de Viagens SA | | 995,594 | 13,147,575 |
| Equatorial Energia SA | | 554,904 | 10,347,307 |
| Estacio Participacoes SA | | 3,528,564 | 31,636,592 |
| Grendene SA | | 1,250,608 | 10,516,989 |
| Instituto Hermes Pardini SA | | 856,221 | 8,074,594 |
| IRB Brasil Resseguros SA | | 1,136,157 | 11,395,259 |
| Kroton Educacional SA | | 4,457,759 | 24,514,745 |
| Localiza Rent A Car SA | | 704,103 | 12,455,733 |
| Movida Participacoes SA | | 2,782,168 | 6,973,918 |
| Multiplus SA | | 493,667 | 5,734,523 |
| Qualicorp SA | | 1,853,685 | 19,832,781 |
| Rumo SA | | 4,035,286 | 15,665,984 |
| Ser Educacional SA | | 1,294,805 | 12,210,661 |
| Ser Educacional SA (a) | | 146,192 | 1,385,367 |
| Smiles Fidelidade SA | | 860,158 | 22,481,432 |
| Vale SA | | 586,218 | 5,752,330 |
|
| TOTAL BRAZIL | | | 251,898,333 |
|
| Chile - 1.0% | | | |
| Vina San Pedro SA | | 574,573,084 | 6,409,724 |
| Luxembourg - 1.3% | | | |
| Biotoscana Investments SA unit | | 1,139,155 | 8,183,335 |
| Mexico - 17.6% | | | |
| Banco del Bajio SA | | 5,177,980 | 9,382,713 |
| Compartamos S.A.B. de CV (b) | | 11,298,152 | 11,444,449 |
| Credito Real S.A.B. de CV | | 8,463,691 | 13,570,689 |
| Genomma Lab Internacional SA de CV (a) | | 9,284,060 | 10,832,836 |
| Gruma S.A.B. de CV Series B | | 893,007 | 11,697,464 |
| Grupo Aeroportuario Norte S.A.B. de CV | | 1,553,478 | 7,838,797 |
| Grupo Cementos de Chihuahua S.A.B. de CV | | 1,735,190 | 8,287,785 |
| Grupo Mexico SA de CV Series B | | 988,195 | 3,213,274 |
| Promotora y Operadora de Infraestructura S.A.B. de CV | | 2,191,429 | 16,482,797 |
| Qualitas Controladora S.A.B. de CV | | 5,446,845 | 9,014,743 |
| Unifin Financiera SAPI de CV | | 2,918,439 | 9,937,314 |
|
| TOTAL MEXICO | | | 111,702,861 |
|
| Panama - 4.5% | | | |
| Copa Holdings SA Class A | | 142,007 | 17,493,842 |
| Intergroup Financial Services Corp. | | 281,654 | 10,984,506 |
|
| TOTAL PANAMA | | | 28,478,348 |
|
| Spain - 2.0% | | | |
| Prosegur Cash SA | | 3,826,632 | 12,480,866 |
| United Kingdom - 1.8% | | | |
| British American Tobacco PLC (United Kingdom) | | 179,360 | 11,588,419 |
| United States of America - 1.5% | | | |
| First Cash Financial Services, Inc. | | 155,234 | 9,911,691 |
| TOTAL COMMON STOCKS | | | |
| (Cost $347,397,390) | | | 464,013,677 |
|
| Nonconvertible Preferred Stocks - 25.4% | | | |
| Brazil - 25.4% | | | |
| Alpargatas SA (PN) | | 2,276,422 | 12,038,670 |
| Banco ABC Brasil SA | | 1,773,365 | 9,730,658 |
| Itau Unibanco Holding SA | | 4,377,873 | 56,274,127 |
| Itausa-Investimentos Itau SA (PN) | | 16,143,178 | 51,716,598 |
| Petroleo Brasileiro SA - Petrobras (PN) (non-vtg.) (a) | | 6,099,786 | 31,269,957 |
| TOTAL NONCONVERTIBLE PREFERRED STOCKS | | | |
| (Cost $88,150,303) | | | 161,030,010 |
|
| Money Market Funds - 1.3% | | | |
| Fidelity Cash Central Fund, 1.10% (c) | | 7,334,350 | 7,335,817 |
| Fidelity Securities Lending Cash Central Fund 1.11% (c)(d) | | 928,302 | 928,395 |
| TOTAL MONEY MARKET FUNDS | | | |
| (Cost $8,264,212) | | | 8,264,212 |
| TOTAL INVESTMENT IN SECURITIES - 99.7% | | | |
| (Cost $443,811,905) | | | 633,307,899 |
| NET OTHER ASSETS (LIABILITIES) - 0.3% | | | 2,088,124 |
| NET ASSETS - 100% | | | $635,396,023 |
Categorizations in the Schedule of Investments are based on country or territory of incorporation.
Legend
(a) Non-income producing
(b) Security or a portion of the security is on loan at period end.
(c) Affiliated fund that is generally available only to investment companies and other accounts managed by Fidelity Investments. The rate quoted is the annualized seven-day yield of the fund at period end. A complete unaudited listing of the fund's holdings as of its most recent quarter end is available upon request. In addition, each Fidelity Central Fund's financial statements, which are not covered by the Fund's Report of Independent Registered Public Accounting Firm, are available on the SEC's website or upon request.
(d) Investment made with cash collateral received from securities on loan.
Affiliated Central Funds
Information regarding fiscal year to date income earned by the Fund from investments in Fidelity Central Funds is as follows:
| Fund | Income earned |
| Fidelity Cash Central Fund | $42,319 |
| Fidelity Securities Lending Cash Central Fund | 28,012 |
| Total | $70,331 |
Investment Valuation
The following is a summary of the inputs used, as of October 31, 2017, involving the Fund's assets and liabilities carried at fair value. The inputs or methodology used for valuing securities may not be an indication of the risk associated with investing in those securities. For more information on valuation inputs, and their aggregation into the levels used below, please refer to the Investment Valuation section in the accompanying Notes to Financial Statements.
| | Valuation Inputs at Reporting Date: |
| Description | Total | Level 1 | Level 2 | Level 3 |
| Investments in Securities: | | | | |
| Equities: | | | | |
| Consumer Discretionary | $143,049,267 | $143,049,267 | $-- | $-- |
| Consumer Staples | 29,695,607 | 18,107,188 | 11,588,419 | -- |
| Energy | 31,269,957 | 31,269,957 | -- | -- |
| Financials | 258,759,763 | 258,759,763 | -- | -- |
| Health Care | 48,298,234 | 48,298,234 | -- | -- |
| Industrials | 86,370,163 | 86,370,163 | -- | -- |
| Materials | 17,253,389 | 17,253,389 | -- | -- |
| Utilities | 10,347,307 | 10,347,307 | -- | -- |
| Money Market Funds | 8,264,212 | 8,264,212 | -- | -- |
| Total Investments in Securities: | $633,307,899 | $621,719,480 | $11,588,419 | $-- |
See accompanying notes which are an integral part of the financial statements.
Fidelity® Latin America Fund
Financial Statements
Statement of Assets and Liabilities
| | | October 31, 2017 |
| Assets | | |
Investment in securities, at value (including securities loaned of $856,501) — See accompanying schedule:
Unaffiliated issuers (cost $435,547,693) | $625,043,687 | |
| Fidelity Central Funds (cost $8,264,212) | 8,264,212 | |
| Total Investment in Securities (cost $443,811,905) | | $633,307,899 |
| Receivable for investments sold | | 5,406,649 |
| Receivable for fund shares sold | | 797,212 |
| Dividends receivable | | 244,955 |
| Distributions receivable from Fidelity Central Funds | | 3,852 |
| Prepaid expenses | | 1,356 |
| Other receivables | | 18,780 |
| Total assets | | 639,780,703 |
| Liabilities | | |
| Payable for investments purchased | $92,019 | |
| Payable for fund shares redeemed | 2,656,282 | |
| Accrued management fee | 389,601 | |
| Distribution and service plan fees payable | 11,521 | |
| Other affiliated payables | 159,903 | |
| Other payables and accrued expenses | 147,260 | |
| Collateral on securities loaned | 928,094 | |
| Total liabilities | | 4,384,680 |
| Net Assets | | $635,396,023 |
| Net Assets consist of: | | |
| Paid in capital | | $582,322,725 |
| Undistributed net investment income | | 6,370,322 |
| Accumulated undistributed net realized gain (loss) on investments and foreign currency transactions | | (142,793,848) |
| Net unrealized appreciation (depreciation) on investments and assets and liabilities in foreign currencies | | 189,496,824 |
| Net Assets | | $635,396,023 |
| Calculation of Maximum Offering Price | | |
| Class A: | | |
| Net Asset Value and redemption price per share ($17,801,488 ÷ 714,126 shares) | | $24.93 |
| Maximum offering price per share (100/94.25 of $24.93) | | $26.45 |
| Class M: | | |
| Net Asset Value and redemption price per share ($6,739,971 ÷ 270,076 shares) | | $24.96 |
| Maximum offering price per share (100/96.50 of $24.96) | | $25.87 |
| Class C: | | |
| Net Asset Value and offering price per share ($5,093,879 ÷ 202,791 shares)(a) | | $25.12 |
| Latin America: | | |
| Net Asset Value, offering price and redemption price per share ($597,160,834 ÷ 23,989,174 shares) | | $24.89 |
| Class I: | | |
| Net Asset Value, offering price and redemption price per share ($8,599,851 ÷ 345,686 shares) | | $24.88 |
(a) Redemption price per share is equal to net asset value less any applicable contingent deferred sales charge.
See accompanying notes which are an integral part of the financial statements.
Statement of Operations
| | | Year ended October 31, 2017 |
| Investment Income | | |
| Dividends | | $18,985,735 |
| Non-Cash dividends | | 1,382,861 |
| Income from Fidelity Central Funds | | 70,331 |
| Income before foreign taxes withheld | | 20,438,927 |
| Less foreign taxes withheld | | (1,108,335) |
| Total income | | 19,330,592 |
| Expenses | | |
| Management fee | $4,090,796 | |
| Transfer agent fees | 1,547,021 | |
| Distribution and service plan fees | 130,458 | |
| Accounting and security lending fees | 296,244 | |
| Custodian fees and expenses | 337,237 | |
| Independent trustees' fees and expenses | 2,431 | |
| Registration fees | 87,848 | |
| Audit | 77,905 | |
| Legal | 1,981 | |
| Miscellaneous | 4,898 | |
| Total expenses before reductions | 6,576,819 | |
| Expense reductions | (7,880) | 6,568,939 |
| Net investment income (loss) | | 12,761,653 |
| Realized and Unrealized Gain (Loss) | | |
| Net realized gain (loss) on: | | |
| Investment securities: | | |
| Unaffiliated issuers | 32,787,186 | |
| Fidelity Central Funds | 1,938 | |
| Foreign currency transactions | (463,569) | |
| Total net realized gain (loss) | | 32,325,555 |
| Change in net unrealized appreciation (depreciation) on: | | |
| Investment securities: | | |
| Unaffiliated issuers | 24,738,398 | |
| Fidelity Central Funds | (2,801) | |
| Assets and liabilities in foreign currencies | (17,316) | |
| Total change in net unrealized appreciation (depreciation) | | 24,718,281 |
| Net gain (loss) | | 57,043,836 |
| Net increase (decrease) in net assets resulting from operations | | $69,805,489 |
See accompanying notes which are an integral part of the financial statements.
Statement of Changes in Net Assets
| | Year ended October 31, 2017 | Year ended October 31, 2016 |
| Increase (Decrease) in Net Assets | | |
| Operations | | |
| Net investment income (loss) | $12,761,653 | $12,329,425 |
| Net realized gain (loss) | 32,325,555 | (87,982,612) |
| Change in net unrealized appreciation (depreciation) | 24,718,281 | 203,562,799 |
| Net increase (decrease) in net assets resulting from operations | 69,805,489 | 127,909,612 |
| Distributions to shareholders from net investment income | (12,697,307) | (10,264,003) |
| Share transactions - net increase (decrease) | (55,405,622) | 5,109,952 |
| Redemption fees | 272,096 | 103,536 |
| Total increase (decrease) in net assets | 1,974,656 | 122,859,097 |
| Net Assets | | |
| Beginning of period | 633,421,367 | 510,562,270 |
| End of period | $635,396,023 | $633,421,367 |
| Other Information | | |
| Undistributed net investment income end of period | $6,370,322 | $7,710,475 |
See accompanying notes which are an integral part of the financial statements.
Financial Highlights
Fidelity Latin America Fund Class A
| Years ended October 31, | 2017 | 2016 | 2015 | 2014 | 2013 |
| Selected Per–Share Data | | | | | |
| Net asset value, beginning of period | $22.45 | $18.09 | $30.31 | $40.71 | $48.95 |
| Income from Investment Operations | | | | | |
| Net investment income (loss)A | .42 | .40 | .28 | .49 | .72 |
| Net realized and unrealized gain (loss) | 2.48 | 4.27 | (10.11) | (4.08) | (4.73) |
| Total from investment operations | 2.90 | 4.67 | (9.83) | (3.59) | (4.01) |
| Distributions from net investment income | (.43) | (.31) | (.31) | (.57) | (.79) |
| Distributions from net realized gain | – | – | (2.08) | (6.25) | (3.45) |
| Total distributions | (.43) | (.31) | (2.39) | (6.82) | (4.24) |
| Redemption fees added to paid in capitalA | .01 | –B | –B | .01 | .01 |
| Net asset value, end of period | $24.93 | $22.45 | $18.09 | $30.31 | $40.71 |
| Total ReturnC,D | 13.55% | 26.29% | (34.60)% | (9.06)% | (8.93)% |
| Ratios to Average Net AssetsE,F | | | | | |
| Expenses before reductions | 1.39% | 1.40% | 1.40% | 1.38% | 1.37% |
| Expenses net of fee waivers, if any | 1.39% | 1.40% | 1.40% | 1.38% | 1.37% |
| Expenses net of all reductions | 1.38% | 1.39% | 1.39% | 1.38% | 1.35% |
| Net investment income (loss) | 1.90% | 2.14% | 1.26% | 1.52% | 1.66% |
| Supplemental Data | | | | | |
| Net assets, end of period (000 omitted) | $17,801 | $19,115 | $16,424 | $34,898 | $48,464 |
| Portfolio turnover rateG | 51% | 108% | 30% | 30% | 23% |
A Calculated based on average shares outstanding during the period.
B Amount represents less than $.005 per share.
C Total returns would have been lower if certain expenses had not been reduced during the applicable periods shown.
D Total returns do not include the effect of the sales charges.
E Fees and expenses of any underlying Fidelity Central Funds are not included in the Fund's expense ratio. The Fund indirectly bears its proportionate share of the expenses of any underlying Fidelity Central Funds.
F Expense ratios reflect operating expenses of the class. Expenses before reductions do not reflect amounts reimbursed by the investment adviser or reductions from brokerage service arrangements or reductions from other expense offset arrangements and do not represent the amount paid by the class during periods when reimbursements or reductions occur. Expenses net of fee waivers reflect expenses after reimbursement by the investment adviser but prior to reductions from brokerage service arrangements or other expense offset arrangements. Expenses net of all reductions represent the net expenses paid by the class.
G Amount does not include the portfolio activity of any underlying Fidelity Central Funds.
See accompanying notes which are an integral part of the financial statements.
Fidelity Latin America Fund Class M
| Years ended October 31, | 2017 | 2016 | 2015 | 2014 | 2013 |
| Selected Per–Share Data | | | | | |
| Net asset value, beginning of period | $22.47 | $18.11 | $30.33 | $40.68 | $48.88 |
| Income from Investment Operations | | | | | |
| Net investment income (loss)A | .36 | .35 | .22 | .40 | .61 |
| Net realized and unrealized gain (loss) | 2.49 | 4.27 | (10.13) | (4.08) | (4.74) |
| Total from investment operations | 2.85 | 4.62 | (9.91) | (3.68) | (4.13) |
| Distributions from net investment income | (.37) | (.26) | (.23) | (.43) | (.63) |
| Distributions from net realized gain | – | – | (2.08) | (6.25) | (3.45) |
| Total distributions | (.37) | (.26) | (2.31) | (6.68) | (4.08) |
| Redemption fees added to paid in capitalA | .01 | –B | –B | .01 | .01 |
| Net asset value, end of period | $24.96 | $22.47 | $18.11 | $30.33 | $40.68 |
| Total ReturnC,D | 13.24% | 25.93% | (34.78)% | (9.30)% | (9.17)% |
| Ratios to Average Net AssetsE,F | | | | | |
| Expenses before reductions | 1.66% | 1.68% | 1.67% | 1.65% | 1.63% |
| Expenses net of fee waivers, if any | 1.66% | 1.68% | 1.67% | 1.65% | 1.63% |
| Expenses net of all reductions | 1.66% | 1.68% | 1.66% | 1.65% | 1.61% |
| Net investment income (loss) | 1.62% | 1.86% | .99% | 1.25% | 1.40% |
| Supplemental Data | | | | | |
| Net assets, end of period (000 omitted) | $6,740 | $7,378 | $5,284 | $9,761 | $12,705 |
| Portfolio turnover rateG | 51% | 108% | 30% | 30% | 23% |
A Calculated based on average shares outstanding during the period.
B Amount represents less than $.005 per share.
C Total returns would have been lower if certain expenses had not been reduced during the applicable periods shown.
D Total returns do not include the effect of the sales charges.
E Fees and expenses of any underlying Fidelity Central Funds are not included in the Fund's expense ratio. The Fund indirectly bears its proportionate share of the expenses of any underlying Fidelity Central Funds.
F Expense ratios reflect operating expenses of the class. Expenses before reductions do not reflect amounts reimbursed by the investment adviser or reductions from brokerage service arrangements or reductions from other expense offset arrangements and do not represent the amount paid by the class during periods when reimbursements or reductions occur. Expenses net of fee waivers reflect expenses after reimbursement by the investment adviser but prior to reductions from brokerage service arrangements or other expense offset arrangements. Expenses net of all reductions represent the net expenses paid by the class.
G Amount does not include the portfolio activity of any underlying Fidelity Central Funds.
See accompanying notes which are an integral part of the financial statements.
Fidelity Latin America Fund Class C
| Years ended October 31, | 2017 | 2016 | 2015 | 2014 | 2013 |
| Selected Per–Share Data | | | | | |
| Net asset value, beginning of period | $22.61 | $18.18 | $30.37 | $40.59 | $48.73 |
| Income from Investment Operations | | | | | |
| Net investment income (loss)A | .26 | .26 | .11 | .25 | .40 |
| Net realized and unrealized gain (loss) | 2.52 | 4.30 | (10.17) | (4.07) | (4.74) |
| Total from investment operations | 2.78 | 4.56 | (10.06) | (3.82) | (4.34) |
| Distributions from net investment income | (.28) | (.13) | (.05) | (.16) | (.36) |
| Distributions from net realized gain | – | – | (2.08) | (6.25) | (3.45) |
| Total distributions | (.28) | (.13) | (2.13) | (6.41) | (3.81) |
| Redemption fees added to paid in capitalA | .01 | –B | –B | .01 | .01 |
| Net asset value, end of period | $25.12 | $22.61 | $18.18 | $30.37 | $40.59 |
| Total ReturnC,D | 12.71% | 25.31% | (35.08)% | (9.74)% | (9.62)% |
| Ratios to Average Net AssetsE,F | | | | | |
| Expenses before reductions | 2.14% | 2.15% | 2.15% | 2.13% | 2.12% |
| Expenses net of fee waivers, if any | 2.14% | 2.14% | 2.15% | 2.13% | 2.12% |
| Expenses net of all reductions | 2.14% | 2.14% | 2.15% | 2.13% | 2.10% |
| Net investment income (loss) | 1.15% | 1.39% | .51% | .77% | .91% |
| Supplemental Data | | | | | |
| Net assets, end of period (000 omitted) | $5,094 | $6,590 | $5,394 | $11,349 | $15,185 |
| Portfolio turnover rateG | 51% | 108% | 30% | 30% | 23% |
A Calculated based on average shares outstanding during the period.
B Amount represents less than $.005 per share.
C Total returns would have been lower if certain expenses had not been reduced during the applicable periods shown.
D Total returns do not include the effect of the contingent deferred sales charge.
E Fees and expenses of any underlying Fidelity Central Funds are not included in the Fund's expense ratio. The Fund indirectly bears its proportionate share of the expenses of any underlying Fidelity Central Funds.
F Expense ratios reflect operating expenses of the class. Expenses before reductions do not reflect amounts reimbursed by the investment adviser or reductions from brokerage service arrangements or reductions from other expense offset arrangements and do not represent the amount paid by the class during periods when reimbursements or reductions occur. Expenses net of fee waivers reflect expenses after reimbursement by the investment adviser but prior to reductions from brokerage service arrangements or other expense offset arrangements. Expenses net of all reductions represent the net expenses paid by the class.
G Amount does not include the portfolio activity of any underlying Fidelity Central Funds.
See accompanying notes which are an integral part of the financial statements.
Fidelity Latin America Fund
| Years ended October 31, | 2017 | 2016 | 2015 | 2014 | 2013 |
| Selected Per–Share Data | | | | | |
| Net asset value, beginning of period | $22.41 | $18.08 | $30.34 | $40.80 | $49.09 |
| Income from Investment Operations | | | | | |
| Net investment income (loss)A | .49 | .45 | .34 | .59 | .87 |
| Net realized and unrealized gain (loss) | 2.46 | 4.26 | (10.11) | (4.10) | (4.74) |
| Total from investment operations | 2.95 | 4.71 | (9.77) | (3.51) | (3.87) |
| Distributions from net investment income | (.48) | (.38) | (.41) | (.71) | (.98) |
| Distributions from net realized gain | – | – | (2.08) | (6.25) | (3.45) |
| Total distributions | (.48) | (.38) | (2.49) | (6.96) | (4.43) |
| Redemption fees added to paid in capitalA | .01 | –B | –B | .01 | .01 |
| Net asset value, end of period | $24.89 | $22.41 | $18.08 | $30.34 | $40.80 |
| Total ReturnC | 13.87% | 26.65% | (34.45)% | (8.79)% | (8.63)% |
| Ratios to Average Net AssetsD,E | | | | | |
| Expenses before reductions | 1.09% | 1.14% | 1.13% | 1.08% | 1.04% |
| Expenses net of fee waivers, if any | 1.09% | 1.14% | 1.12% | 1.08% | 1.04% |
| Expenses net of all reductions | 1.09% | 1.13% | 1.12% | 1.07% | 1.03% |
| Net investment income (loss) | 2.19% | 2.40% | 1.53% | 1.83% | 1.99% |
| Supplemental Data | | | | | |
| Net assets, end of period (000 omitted) | $597,161 | $596,514 | $481,005 | $933,298 | $1,324,748 |
| Portfolio turnover rateF | 51% | 108% | 30% | 30% | 23% |
A Calculated based on average shares outstanding during the period.
B Amount represents less than $.005 per share.
C Total returns would have been lower if certain expenses had not been reduced during the applicable periods shown.
D Fees and expenses of any underlying Fidelity Central Funds are not included in the Fund's expense ratio. The Fund indirectly bears its proportionate share of the expenses of any underlying Fidelity Central Funds.
E Expense ratios reflect operating expenses of the class. Expenses before reductions do not reflect amounts reimbursed by the investment adviser or reductions from brokerage service arrangements or reductions from other expense offset arrangements and do not represent the amount paid by the class during periods when reimbursements or reductions occur. Expenses net of fee waivers reflect expenses after reimbursement by the investment adviser but prior to reductions from brokerage service arrangements or other expense offset arrangements. Expenses net of all reductions represent the net expenses paid by the class.
F Amount does not include the portfolio activity of any underlying Fidelity Central Funds.
See accompanying notes which are an integral part of the financial statements.
Fidelity Latin America Fund Class I
| Years ended October 31, | 2017 | 2016 | 2015 | 2014 | 2013 |
| Selected Per–Share Data | | | | | |
| Net asset value, beginning of period | $22.40 | $18.08 | $30.35 | $40.79 | $49.07 |
| Income from Investment Operations | | | | | |
| Net investment income (loss)A | .51 | .46 | .36 | .60 | .87 |
| Net realized and unrealized gain (loss) | 2.45 | 4.26 | (10.13) | (4.07) | (4.74) |
| Total from investment operations | 2.96 | 4.72 | (9.77) | (3.47) | (3.87) |
| Distributions from net investment income | (.49) | (.40) | (.42) | (.73) | (.97) |
| Distributions from net realized gain | – | – | (2.08) | (6.25) | (3.45) |
| Total distributions | (.49) | (.40) | (2.50) | (6.98) | (4.42) |
| Redemption fees added to paid in capitalA | .01 | –B | –B | .01 | .01 |
| Net asset value, end of period | $24.88 | $22.40 | $18.08 | $30.35 | $40.79 |
| Total ReturnC | 13.94% | 26.77% | (34.42)% | (8.69)% | (8.63)% |
| Ratios to Average Net AssetsD,E | | | | | |
| Expenses before reductions | 1.01% | 1.07% | 1.06% | 1.04% | 1.03% |
| Expenses net of fee waivers, if any | 1.01% | 1.07% | 1.06% | 1.04% | 1.03% |
| Expenses net of all reductions | 1.01% | 1.06% | 1.05% | 1.04% | 1.01% |
| Net investment income (loss) | 2.27% | 2.47% | 1.60% | 1.86% | 2.00% |
| Supplemental Data | | | | | |
| Net assets, end of period (000 omitted) | $8,600 | $3,825 | $1,828 | $4,531 | $5,131 |
| Portfolio turnover rateF | 51% | 108% | 30% | 30% | 23% |
A Calculated based on average shares outstanding during the period.
B Amount represents less than $.005 per share.
C Total returns would have been lower if certain expenses had not been reduced during the applicable periods shown.
D Fees and expenses of any underlying Fidelity Central Funds are not included in the Fund's expense ratio. The Fund indirectly bears its proportionate share of the expenses of any underlying Fidelity Central Funds.
E Expense ratios reflect operating expenses of the class. Expenses before reductions do not reflect amounts reimbursed by the investment adviser or reductions from brokerage service arrangements or reductions from other expense offset arrangements and do not represent the amount paid by the class during periods when reimbursements or reductions occur. Expenses net of fee waivers reflect expenses after reimbursement by the investment adviser but prior to reductions from brokerage service arrangements or other expense offset arrangements. Expenses net of all reductions represent the net expenses paid by the class.
F Amount does not include the portfolio activity of any underlying Fidelity Central Funds.
See accompanying notes which are an integral part of the financial statements.
Notes to Financial Statements
For the period ended October 31, 2017
1. Organization.
Fidelity Latin America Fund (the Fund) is a non-diversified fund of Fidelity Investment Trust (the Trust) and is authorized to issue an unlimited number of shares. The Trust is registered under the Investment Company Act of 1940, as amended (the 1940 Act), as an open-end management investment company organized as a Massachusetts business trust. The Fund offers Class A, Class M (formerly Class T), Class C, Latin America and Class I shares, each of which has equal rights as to assets and voting privileges. Each class has exclusive voting rights with respect to matters that affect that class. The Fund's investments in emerging markets can be subject to social, economic, regulatory, and political uncertainties and can be extremely volatile.
After the close of business on June 24, 2016, all outstanding Class B shares were converted to Class A shares. All prior fiscal period dollar and share amounts for Class B presented in the Notes to Financial Statements are for the period November 1, 2015 through June 24, 2016.
2. Investments in Fidelity Central Funds.
The Fund invests in Fidelity Central Funds, which are open-end investment companies generally available only to other investment companies and accounts managed by the investment adviser and its affiliates. The Fund's Schedule of Investments lists each of the Fidelity Central Funds held as of period end, if any, as an investment of the Fund, but does not include the underlying holdings of each Fidelity Central Fund. As an Investing Fund, the Fund indirectly bears its proportionate share of the expenses of the underlying Fidelity Central Funds.
The Money Market Central Funds seek preservation of capital and current income and are managed by Fidelity Investments Money Management, Inc. (FIMM), an affiliate of the investment adviser. Annualized expenses of the Money Market Central Funds as of their most recent shareholder report date are less than .005%.
A complete unaudited list of holdings for each Fidelity Central Fund is available upon request or at the Securities and Exchange Commission (the SEC) website at www.sec.gov. In addition, the financial statements of the Fidelity Central Funds, which are not covered by the Fund's Report of Independent Registered Public Accounting Firm, are available on the SEC website or upon request.
3. Significant Accounting Policies.
The Fund is an investment company and applies the accounting and reporting guidance of the Financial Accounting Standards Board (FASB) Accounting Standards Codification Topic 946 Financial Services – Investments Companies. The financial statements have been prepared in conformity with accounting principles generally accepted in the United States of America (GAAP), which require management to make certain estimates and assumptions at the date of the financial statements. Actual results could differ from those estimates. Subsequent events, if any, through the date that the financial statements were issued have been evaluated in the preparation of the financial statements. The following summarizes the significant accounting policies of the Fund:
Investment Valuation. Investments are valued as of 4:00 p.m. Eastern time on the last calendar day of the period. The Board of Trustees (the Board) has delegated the day to day responsibility for the valuation of the Fund's investments to the Fair Value Committee (the Committee) established by the Fund's investment adviser. In accordance with valuation policies and procedures approved by the Board, the Fund attempts to obtain prices from one or more third party pricing vendors or brokers to value its investments. When current market prices, quotations or currency exchange rates are not readily available or reliable, investments will be fair valued in good faith by the Committee, in accordance with procedures adopted by the Board. Factors used in determining fair value vary by investment type and may include market or investment specific events. The frequency with which these procedures are used cannot be predicted and they may be utilized to a significant extent. The Committee oversees the Fund's valuation policies and procedures and reports to the Board on the Committee's activities and fair value determinations. The Board monitors the appropriateness of the procedures used in valuing the Fund's investments and ratifies the fair value determinations of the Committee.
The Fund categorizes the inputs to valuation techniques used to value its investments into a disclosure hierarchy consisting of three levels as shown below:
- Level 1 – quoted prices in active markets for identical investments
- Level 2 – other significant observable inputs (including quoted prices for similar investments, interest rates, prepayment speeds, etc.)
- Level 3 – unobservable inputs (including the Fund's own assumptions based on the best information available)
Valuation techniques used to value the Fund's investments by major category are as follows:
Equity securities, including restricted securities, for which market quotations are readily available, are valued at the last reported sale price or official closing price as reported by a third party pricing vendor on the primary market or exchange on which they are traded and are categorized as Level 1 in the hierarchy. In the event there were no sales during the day or closing prices are not available, securities are valued at the last quoted bid price or may be valued using the last available price and are generally categorized as Level 2 in the hierarchy. For foreign equity securities, when market or security specific events arise, comparisons to the valuation of American Depositary Receipts (ADRs), futures contracts, Exchange-Traded Funds (ETFs) and certain indexes as well as quoted prices for similar securities may be used and would be categorized as Level 2 in the hierarchy. Utilizing these techniques may result in transfers between Level 1 and Level 2. For equity securities, including restricted securities, where observable inputs are limited, assumptions about market activity and risk are used and these securities may be categorized as Level 3 in the hierarchy.
Investments in open-end mutual funds, including the Fidelity Central Funds, are valued at their closing net asset value (NAV) each business day and are categorized as Level 1 in the hierarchy.
Changes in valuation techniques may result in transfers in or out of an assigned level within the disclosure hierarchy. The aggregate value of investments by input level as of October 31, 2017 is included at the end of the Fund's Schedule of Investments.
Foreign Currency. The Fund may use foreign currency contracts to facilitate transactions in foreign-denominated securities. Gains and losses from these transactions may arise from changes in the value of the foreign currency or if the counterparties do not perform under the contracts' terms.
Foreign-denominated assets, including investment securities, and liabilities are translated into U.S. dollars at the exchange rates at period end. Purchases and sales of investment securities, income and dividends received and expenses denominated in foreign currencies are translated into U.S. dollars at the exchange rate in effect on the transaction date.
The effects of exchange rate fluctuations on investments are included with the net realized and unrealized gain (loss) on investment securities. Other foreign currency transactions resulting in realized and unrealized gain (loss) are disclosed separately.
Investment Transactions and Income. For financial reporting purposes, the Fund's investment holdings and NAV include trades executed through the end of the last business day of the period. The NAV per share for processing shareholder transactions is calculated as of the close of business of the New York Stock Exchange (NYSE), normally 4:00 p.m. Eastern time and includes trades executed through the end of the prior business day. Gains and losses on securities sold are determined on the basis of identified cost. Dividend income is recorded on the ex-dividend date, except for certain dividends from foreign securities where the ex-dividend date may have passed, which are recorded as soon as the Fund is informed of the ex-dividend date. Non-cash dividends included in dividend income, if any, are recorded at the fair market value of the securities received. Income and capital gain distributions from Fidelity Central Funds, if any, are recorded on the ex-dividend date. Certain distributions received by the Fund represent a return of capital or capital gain. The Fund determines the components of these distributions subsequent to the ex-dividend date, based upon receipt of tax filings or other correspondence relating to the underlying investment. These distributions are recorded as a reduction of cost of investments and/or as a realized gain. Investment income is recorded net of foreign taxes withheld where recovery of such taxes is uncertain.
Class Allocations and Expenses. Investment income, realized and unrealized capital gains and losses, common expenses of the Fund, and certain fund-level expense reductions, if any, are allocated daily on a pro-rata basis to each class based on the relative net assets of each class to the total net assets of the Fund. Each class differs with respect to transfer agent and distribution and service plan fees incurred. Certain expense reductions may also differ by class. For the reporting period, the allocated portion of income and expenses to each class as a percent of its average net assets may vary due to the timing of recording these transactions in relation to fluctuating net assets of the classes. Expenses directly attributable to a fund are charged to that fund. Expenses attributable to more than one fund are allocated among the respective funds on the basis of relative net assets or other appropriate methods. Expense estimates are accrued in the period to which they relate and adjustments are made when actual amounts are known.
Income Tax Information and Distributions to Shareholders. Each year, the Fund intends to qualify as a regulated investment company under Subchapter M of the Internal Revenue Code, including distributing substantially all of its taxable income and realized gains. As a result, no provision for U.S. Federal income taxes is required. As of October 31, 2017, the Fund did not have any unrecognized tax benefits in the financial statements; nor is the Fund aware of any tax positions for which it is reasonably possible that the total amounts of unrecognized tax benefits will significantly change in the next twelve months. The Fund files a U.S. federal tax return, in addition to state and local tax returns as required. The Fund's federal income tax returns are subject to examination by the Internal Revenue Service (IRS) for a period of three fiscal years after they are filed. State and local tax returns may be subject to examination for an additional fiscal year depending on the jurisdiction. Foreign taxes are provided for based on the Fund's understanding of the tax rules and rates that exist in the foreign markets in which it invests.
Distributions are declared and recorded on the ex-dividend date. Income dividends and capital gain distributions are declared separately for each class. Income and capital gain distributions are determined in accordance with income tax regulations, which may differ from GAAP. In addition, the Fund claimed a portion of the payment made to redeeming shareholders as a distribution for income tax purposes.
Capital accounts within the financial statements are adjusted for permanent book-tax differences. These adjustments have no impact on net assets or the results of operations. Capital accounts are not adjusted for temporary book-tax differences which will reverse in a subsequent period.
Book-tax differences are primarily due to foreign currency transactions, passive foreign investment companies (PFIC), capital loss carryforwards, deferred trustees compensation, and losses deferred due to wash sales.
As of period end, the cost and unrealized appreciation (depreciation) in securities, and derivatives if applicable, for federal income tax purposes were as follows:
| Gross unrealized appreciation | $213,361,335 |
| Gross unrealized depreciation | (24,935,404) |
| Net unrealized appreciation (depreciation) | $188,425,931 |
| Tax Cost | $444,881,968 |
The tax-based components of distributable earnings as of period end were as follows:
| Undistributed ordinary income | $6,372,360 |
| Capital loss carryforward | $(141,723,785) |
| Net unrealized appreciation (depreciation) on securities and other investments | $188,425,276 |
Capital loss carryforwards are only available to offset future capital gains of the Fund to the extent provided by regulations and may be limited. Under the Regulated Investment Company Modernization Act of 2010 (the Act), the Fund is permitted to carry forward capital losses incurred in taxable years beginning after December 22, 2010 for an unlimited period and such capital losses are required to be used prior to any losses that expire. The capital loss carryforward information presented below, including any applicable limitation, is estimated as of fiscal period end and is subject to adjustment.
| No expiration | |
| Short-term | $(41,534,225) |
| Long-term | (100,189,560) |
| Total capital loss carryforward | $(141,723,785) |
The tax character of distributions paid was as follows:
| | October 31, 2017 | October 31, 2016 |
| Ordinary Income | $12,697,307 | $ 10,264,003 |
Short-Term Trading (Redemption) Fees. Shares held by investors in the Fund less than 90 days may have been subject to a redemption fee equal to 1.50% of the NAV of shares redeemed. All redemption fees, which reduce the proceeds of the shareholder redemption, are retained by the Fund and accounted for as an addition to paid in capital. In November 2017, the Board of Trustees approved the elimination of these redemption fees effective December 18, 2017.
4. Purchases and Sales of Investments.
Purchases and sales of securities, other than short-term securities, aggregated $299,251,839 and $359,490,279, respectively.
5. Fees and Other Transactions with Affiliates.
Management Fee. Fidelity Management & Research Company (the investment adviser) and its affiliates provide the Fund with investment management related services for which the Fund pays a monthly management fee. The management fee is the sum of an individual fund fee rate that is based on an annual rate of .45% of the Fund's average net assets and an annualized group fee rate that averaged .25% during the period. The group fee rate is based upon the average net assets of all the mutual funds advised by the investment adviser, including any mutual funds previously advised by the investment adviser that are currently advised by Fidelity SelectCo, LLC, an affiliate of the investment adviser. The group fee rate decreases as assets under management increase and increases as assets under management decrease. For the reporting period, the total annual management fee rate was .69% of the Fund's average net assets.
Distribution and Service Plan Fees. In accordance with Rule 12b-1 of the 1940 Act, the Fund has adopted separate Distribution and Service Plans for each class of shares. Certain classes pay Fidelity Distributors Corporation (FDC), an affiliate of the investment adviser, separate Distribution and Service Fees, each of which is based on an annual percentage of each class' average net assets. In addition, FDC may pay financial intermediaries for selling shares of the Fund and providing shareholder support services. For the period, the Distribution and Service Fee rates, total fees and amounts retained by FDC were as follows:
| | Distribution
Fee | Service
Fee | Total Fees | Retained
by FDC |
| Class A | -% | .25% | $45,121 | $– |
| Class M | .25% | .25% | 32,465 | – |
| Class C | .75% | .25% | 52,872 | 2,455 |
| | | | $130,458 | $2,455 |
Sales Load. FDC may receive a front-end sales charge of up to 5.75% for selling Class A shares and 3.50% for selling Class M shares, some of which is paid to financial intermediaries for selling shares of the Fund. Depending on the holding period, FDC may receive contingent deferred sales charges levied on Class A, Class M and Class C redemptions. The deferred sales charges are 1.00% for Class C shares, 1.00% for certain purchases of Class A shares and .25% for certain purchases of Class M shares.
For the period, sales charge amounts retained by FDC were as follows:
| | Retained
by FDC |
| Class A | $4,414 |
| Class M | 604 |
| Class C(a) | 669 |
| | $5,687 |
(a) When Class C shares are initially sold, FDC pays commissions from its own resources to financial intermediaries through which the sales are made.
Transfer Agent Fees. Fidelity Investments Institutional Operations Company, Inc., (FIIOC), an affiliate of the investment adviser, is the transfer, dividend disbursing and shareholder servicing agent for each class of the Fund. FIIOC receives account fees and asset-based fees that vary according to the account size and type of account of the shareholders of the respective classes of the Fund. FIIOC pays for typesetting, printing and mailing of shareholder reports, except proxy statements.
For the period, transfer agent fees for each class were as follows:
| | Amount | % of
Class-Level Average
Net Assets |
| Class A | $54,827 | .30 |
| Class M | 21,543 | .33 |
| Class C | 16,158 | .31 |
| Latin America | 1,444,808 | .26 |
| Class I | 9,685 | .18 |
| | $1,547,021 | |
Accounting and Security Lending Fees. Fidelity Service Company, Inc. (FSC), an affiliate of the investment adviser, maintains the Fund's accounting records. The accounting fee is based on the level of average net assets for each month. Under a separate contract, FSC administers the security lending program. The security lending fee is based on the number and duration of lending transactions.
Brokerage Commissions. The Fund placed a portion of its portfolio transactions with brokerage firms which are affiliates of the investment adviser. Brokerage commissions are included in net realized gain (loss) and change in net unrealized appreciation (depreciation) in the Statement of Operations. The commissions paid to these affiliated firms were $726 for the period.
Interfund Trades. The Fund may purchase from or sell securities to other Fidelity Funds under procedures adopted by the Board. The procedures have been designed to ensure these interfund trades are executed in accordance with Rule 17a-7 of the 1940 Act. Interfund trades are included within the respective purchases and sales amounts shown in the Purchases and Sales of Investments note.
6. Committed Line of Credit.
The Fund participates with other funds managed by the investment adviser or an affiliate in a $4.25 billion credit facility (the "line of credit") to be utilized for temporary or emergency purposes to fund shareholder redemptions or for other short-term liquidity purposes. The Fund has agreed to pay commitment fees on its pro-rata portion of the line of credit, which amounted to $1,850 and is reflected in Miscellaneous expenses on the Statement of Operations. During the period, the Fund did not borrow on this line of credit.
7. Security Lending.
The Fund lends portfolio securities through a lending agent from time to time in order to earn additional income. For equity securities, a lending agent is used and may loan securities to certain qualified borrowers, including Fidelity Capital Markets (FCM), a broker-dealer affiliated with the Fund. On the settlement date of the loan, the Fund receives collateral (in the form of U.S. Treasury obligations, letters of credit and/or cash) against the loaned securities and maintains collateral in an amount not less than 100% of the market value of the loaned securities during the period of the loan. The market value of the loaned securities is determined at the close of business of the Fund and any additional required collateral is delivered to the Fund on the next business day. The Fund or borrower may terminate the loan at any time, and if the borrower defaults on its obligation to return the securities loaned because of insolvency or other reasons, the Fund may apply collateral received from the borrower against the obligation. The Fund may experience delays and costs in recovering the securities loaned. Any cash collateral received is invested in the Fidelity Securities Lending Cash Central Fund. The value of loaned securities and cash collateral at period end are disclosed on the Fund's Statement of Assets and Liabilities. Security lending income represents the income earned on investing cash collateral, less rebates paid to borrowers and any lending agent fees associated with the loan, plus any premium payments received for lending certain types of securities. Security lending income is presented in the Statement of Operations as a component of income from Fidelity Central Funds. Total security lending income during the period amounted to $28,012. During the period, there were no securities loaned to FCM.
8. Expense Reductions.
Commissions paid to certain brokers with whom the investment adviser, or its affiliates, places trades on behalf of the Fund include an amount in addition to trade execution, which may be rebated back to the Fund to offset certain expenses. This amount totaled $3,260 for the period. In addition, through arrangements with the Fund's custodian, credits realized as a result of certain uninvested cash balances were used to reduce the Fund's expenses. During the period, these credits reduced the Fund's custody expenses by $40.
In addition, during the period the investment adviser reimbursed and/or waived a portion of fund-level operating expenses in the amount of $4,580.
9. Distributions to Shareholders.
Distributions to shareholders of each class were as follows:
| | Year ended
October 31, 2017 | Year ended October 31, 2016 |
| From net investment income | | |
| Class A | $361,857 | $264,922 |
| Class M | 112,037 | 74,433 |
| Class B | – | 1,059 |
| Class C | 77,689 | 37,419 |
| Latin America | 12,063,200 | 9,833,214 |
| Class I | 82,524 | 52,956 |
| Total | $12,697,307 | $10,264,003 |
10. Share Transactions.
Share transactions for each class were as follows and may contain automatic conversions between classes or exchanges between affiliated funds:
| | Shares | Shares | Dollars | Dollars |
| | Year ended October 31, 2017 | Year ended October 31, 2016 | Year ended October 31, 2017 | Year ended October 31, 2016 |
| Class A | | | | |
| Shares sold | 139,205 | 225,272 | $3,031,500 | $4,334,307 |
| Reinvestment of distributions | 18,202 | 14,810 | 345,275 | 256,538 |
| Shares redeemed | (294,686) | (296,685) | (6,569,414) | (5,448,405) |
| Net increase (decrease) | (137,279) | (56,603) | $(3,192,639) | $(857,560) |
| Class M | | | | |
| Shares sold | 33,689 | 88,506 | $739,767 | $1,738,665 |
| Reinvestment of distributions | 5,687 | 4,243 | 108,338 | 73,689 |
| Shares redeemed | (97,619) | (56,211) | (2,073,277) | (1,058,502) |
| Net increase (decrease) | (58,243) | 36,538 | $(1,225,172) | $753,852 |
| Class B | | | | |
| Shares sold | – | 1 | $– | $10 |
| Reinvestment of distributions | – | 59 | – | 1,009 |
| Shares redeemed | – | (34,427) | – | (635,494) |
| Net increase (decrease) | – | (34,367) | $– | $(634,475) |
| Class C | | | | |
| Shares sold | 20,475 | 75,193 | $450,205 | $1,418,728 |
| Reinvestment of distributions | 3,179 | 1,720 | 61,288 | 30,044 |
| Shares redeemed | (112,274) | (82,272) | (2,414,306) | (1,513,384) |
| Net increase (decrease) | (88,620) | (5,359) | $(1,902,813) | $(64,612) |
| Latin America | | | | |
| Shares sold | 5,339,360 | 5,528,011 | $120,661,935 | $106,883,642 |
| Reinvestment of distributions | 610,988 | 545,601 | 11,542,194 | 9,420,593 |
| Shares redeemed | (8,575,067) | (6,058,036) | (185,420,867) | (111,613,300) |
| Net increase (decrease) | (2,624,719) | 15,576 | $(53,216,738) | $4,690,935 |
| Class I | | | | |
| Shares sold | 265,874 | 136,401 | $6,186,180 | $2,463,122 |
| Reinvestment of distributions | 3,896 | 2,787 | 73,478 | 48,070 |
| Shares redeemed | (94,860) | (69,501) | (2,127,918) | (1,289,380) |
| Net increase (decrease) | 174,910 | 69,687 | $4,131,740 | $1,221,812 |
11. Other.
The Fund's organizational documents provide former and current trustees and officers with a limited indemnification against liabilities arising in connection with the performance of their duties to the Fund. In the normal course of business, the Fund may also enter into contracts that provide general indemnifications. The Fund's maximum exposure under these arrangements is unknown as this would be dependent on future claims that may be made against the Fund. The risk of material loss from such claims is considered remote.
Fidelity® Nordic Fund
Performance: The Bottom Line
Average annual total return reflects the change in the value of an investment, assuming reinvestment of distributions from dividend income and capital gains (the profits earned upon the sale of securities that have grown in value, if any) and assuming a constant rate of performance each year. The hypothetical investment and the average annual total returns do not reflect the deduction of taxes that a shareholder would pay on fund distributions or the redemption of fund shares. During periods of reimbursement by Fidelity, a fund’s total return will be greater than it would be had the reimbursement not occurred. How a fund did yesterday is no guarantee of how it will do tomorrow.
Average Annual Total Returns
| For the periods ended October 31, 2017 | Past 1 year | Past 5 years | Past 10 years |
| Fidelity® Nordic Fund | 22.14% | 14.69% | 3.32% |
$10,000 Over 10 Years
Let's say hypothetically that $10,000 was invested in Fidelity® Nordic Fund on October 31, 2007.
The chart shows how the value of your investment would have changed, and also shows how the FTSE® Capped Nordic Index performed over the same period.
Returns for the FTSE® Capped Nordic Index for periods prior to October 1, 2009 (it's inception date) are returns of the uncapped FTSE Nordic Index.
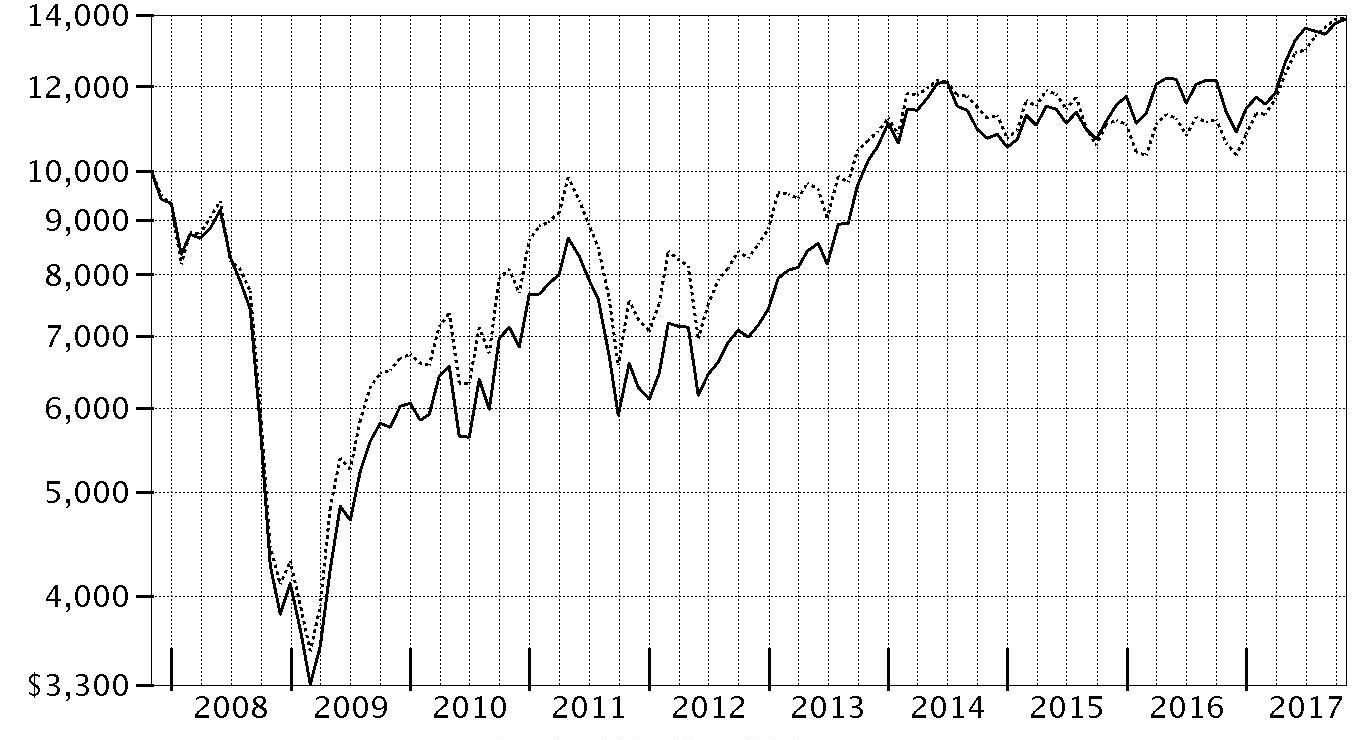
| Period Ending Values |
| $13,858 | Fidelity® Nordic Fund |
| $13,902 | FTSE® Capped Nordic Index |
Fidelity® Nordic Fund
Management's Discussion of Fund Performance
Market Recap: The MSCI ACWI (All Country World Index) ex USA Index returned 23.85% for the 12 months ending October 31, 2017, helped partly by a generally weak U.S. dollar. Some favorable election results in continental Europe (+30%) suggested ebbing political uncertainty and near-term risk there, but the U.K. (+20%) faced more-mixed conditions ahead of its expected exit from the European Union. Despite central-bank easing – and pressured recently by yen strength – Japan (+18%) lagged the rest of the Asia-Pacific group (+22%). Commodity-price volatility slowed Canada (+17%), but the emerging-markets group (+26%) sped ahead. Sector-wise, information technology (+47%) was driven by a surge among several Chinese internet-related names. Financials (+27%) rode rising interest rates that, at the same time, weighed on real estate (+17%), utilities (+16%), consumer staples (+14%) and telecommunication services (+9%) – so-called “bond proxy” sectors. Materials (+28%) and industrials (+27%) responded to demand from China and price gains for certain commodities. In the energy sector (+20%), oil prices lost ground in the spring before rebounding through October 31 to end well above where they started 12 months ago. Lastly, health care (+14%) was hurt by early-period turmoil around drug pricing and health care legislation.
Comments from Portfolio Manager Stefan Lindblad: For the fiscal year, the fund gained 22.14%, notably lagging the 30.96% return of the benchmark FTSE Capped Nordic Index. Amid a strong market for Nordic stocks, the fund's defensive positioning hampered our result versus the benchmark. Specifically, a sizable overweighting in the weak consumer discretionary sector hurt most from a sector standpoint, followed by stock selection in industrials and health care. The fund's largest individual detractor was a non-benchmark stake in Kambi Group, a Malta-based firm providing sports-betting infrastructure to Europe’s gaming industry. Shares of Kambi declined this period, as the company reported disappointing financial results. In health care, underexposure to Novo-Nordisk also hurt our relative result. Skeptical of this Danish pharmaceutical company’s risk/reward profile, I chose to underweight the stock until selling it in September. Conversely, we benefited from stock picking in financials, particularly banks, and the retailing segment of the consumer discretionary sector. The fund’s largest relative contributor was my decision to avoid benchmark component H&M Hennes & Mauritz until establishing a sizable stake. The apparel company has been slow to move its sales to an online platform, and has suffered as consumers shop less and less at brick-and-mortar stores.
The views expressed above reflect those of the portfolio manager(s) only through the end of the period as stated on the cover of this report and do not necessarily represent the views of Fidelity or any other person in the Fidelity organization. Any such views are subject to change at any time based upon market or other conditions and Fidelity disclaims any responsibility to update such views. These views may not be relied on as investment advice and, because investment decisions for a Fidelity fund are based on numerous factors, may not be relied on as an indication of trading intent on behalf of any Fidelity fund.
Fidelity® Nordic Fund
Investment Summary (Unaudited)
Geographic Diversification (% of fund's net assets)
| As of October 31, 2017 |
| | Sweden | 55.4% |
| | Finland | 13.9% |
| | Norway | 8.0% |
| | United States of America* | 7.9% |
| | Malta | 6.2% |
| | Denmark | 5.3% |
| | Bermuda | 2.8% |
| | Canada | 0.5% |

* Includes Short-Term investments and Net Other Assets (Liabilities).
Percentages are based on country or territory of incorporation and are adjusted for the effect of futures contracts, if applicable.
| As of April 30, 2017 |
| | Sweden | 49.1% |
| | Denmark | 13.6% |
| | Finland | 12.3% |
| | Malta | 8.9% |
| | Norway | 8.5% |
| | United States of America* | 4.9% |
| | Bermuda | 2.7% |

* Includes Short-Term investments and Net Other Assets (Liabilities).
Percentages are based on country or territory of incorporation and are adjusted for the effect of futures contracts, if applicable.
Asset Allocation as of October 31, 2017
| | % of fund's net assets | % of fund's net assets 6 months ago |
| Stocks | 94.9 | 97.3 |
| Short-Term Investments and Net Other Assets (Liabilities) | 5.1 | 2.7 |
Top Ten Stocks as of October 31, 2017
| | % of fund's net assets | % of fund's net assets 6 months ago |
| Getinge AB (B Shares) (Sweden, Health Care Equipment & Supplies) | 5.5 | 4.8 |
| Kambi Group PLC (Malta, Hotels, Restaurants & Leisure) | 4.1 | 4.1 |
| Investor AB (B Shares) (Sweden, Diversified Financial Services) | 4.0 | 5.6 |
| Dometic Group AB (Sweden, Auto Components) | 4.0 | 3.9 |
| Vaisala Oyj (Finland, Electronic Equipment & Components) | 3.7 | 5.4 |
| AddTech AB (B Shares) (Sweden, Trading Companies & Distributors) | 3.7 | 3.1 |
| Essity AB Class B (Sweden, Household Products) | 3.7 | 0.0 |
| Eltel AB (Sweden, Construction & Engineering) | 3.6 | 0.0 |
| Svenska Cellulosa AB (SCA) (B Shares) (Sweden, Paper & Forest Products) | 3.5 | 6.5 |
| Nokian Tyres PLC (Finland, Auto Components) | 3.4 | 2.0 |
| | 39.2 | |
Top Market Sectors as of October 31, 2017
| | % of fund's net assets | % of fund's net assets 6 months ago |
| Industrials | 29.1 | 19.3 |
| Consumer Discretionary | 28.2 | 32.8 |
| Health Care | 8.8 | 8.8 |
| Consumer Staples | 8.7 | 14.0 |
| Financials | 8.4 | 9.9 |
| Materials | 6.9 | 3.5 |
| Information Technology | 4.8 | 8.5 |
| Telecommunication Services | 0.0 | 0.5 |
Market Sectors may include more than one industry category.
The Fund may invest up to 35% of its total assets in any industry that represents more than 20% of the Nordic market. As of October 31, 2017, the Fund did not have more than 25% of its total assets invested in any one industry.
Percentages shown as 0.0% may reflect amounts less than 0.05%.
Fidelity® Nordic Fund
Investments October 31, 2017
Showing Percentage of Net Assets
| Common Stocks - 94.9% | | | |
| | | Shares | Value |
| Bermuda - 2.8% | | | |
| Vostok Emerging Finance Ltd. (depository receipt) (a) | | 9,489,995 | $2,074,465 |
| Vostok New Ventures Ltd. (depositary receipt) (a) | | 1,015,554 | 8,370,300 |
|
| TOTAL BERMUDA | | | 10,444,765 |
|
| Canada - 0.5% | | | |
| Lundin Mining Corp. | | 245,200 | 1,889,162 |
| Denmark - 5.3% | | | |
| A.P. Moller - Maersk A/S Series B | | 4,720 | 9,065,769 |
| Novozymes A/S Series B | | 194,700 | 10,752,579 |
|
| TOTAL DENMARK | | | 19,818,348 |
|
| Finland - 13.9% | | | |
| Amer Group PLC (A Shares) | | 143,200 | 3,564,655 |
| Kamux Corp. (b) | | 1,100,000 | 8,789,958 |
| Nokian Tyres PLC | | 276,200 | 12,666,572 |
| Olvi PLC (A Shares) | | 289,146 | 9,447,569 |
| Vaisala Oyj | | 258,700 | 14,036,729 |
| Wartsila Corp. | | 62,200 | 4,006,688 |
|
| TOTAL FINLAND | | | 52,512,171 |
|
| Malta - 6.2% | | | |
| Kambi Group PLC (a)(b) | | 1,462,611 | 15,374,480 |
| Kindred Group PLC (depositary receipt) | | 620,694 | 7,925,820 |
|
| TOTAL MALTA | | | 23,300,300 |
|
| Norway - 8.0% | | | |
| Schibsted ASA: | | | |
| (A Shares) (b) | | 311,400 | 8,028,996 |
| (B Shares) | | 262,847 | 6,162,488 |
| Skandiabanken ASA | | 582,300 | 5,899,281 |
| Zalaris ASA (A Shares) (c) | | 1,688,300 | 10,024,798 |
|
| TOTAL NORWAY | | | 30,115,563 |
|
| Sweden - 55.4% | | | |
| Addlife AB | | 227,375 | 4,481,419 |
| AddTech AB (B Shares) | | 623,800 | 13,822,233 |
| AF AB (B Shares) | | 545,300 | 11,236,047 |
| Alimak Group AB (b) | | 605,900 | 10,856,283 |
| Coor Service Management Holding AB | | 565,300 | 4,456,684 |
| Dometic Group AB (d) | | 1,743,341 | 15,160,121 |
| Eltel AB (a)(b) | | 4,842,050 | 13,765,601 |
| Essity AB Class B | | 461,700 | 13,804,150 |
| Getinge AB (B Shares) | | 1,056,000 | 20,787,871 |
| H&M Hennes & Mauritz AB (B Shares) | | 380,873 | 9,563,169 |
| Investor AB (B Shares) | | 307,650 | 15,247,172 |
| Lagercrantz Group AB (B Shares) | | 377,100 | 4,008,995 |
| Medicover AB Class B | | 1,000,000 | 7,883,751 |
| Momentum Group AB Class B | | 755,000 | 9,289,089 |
| Nobia AB | | 1,118,000 | 9,174,607 |
| Scandi Standard | | 1,334,600 | 9,445,575 |
| Securitas AB (B Shares) | | 702,300 | 12,323,481 |
| Svenska Cellulosa AB (SCA) (B Shares) | | 1,418,800 | 13,320,872 |
| Systemair AB | | 670,479 | 10,151,310 |
|
| TOTAL SWEDEN | | | 208,778,430 |
|
| United States of America - 2.8% | | | |
| Autoliv, Inc. (depositary receipt) | | 84,800 | 10,635,896 |
| TOTAL COMMON STOCKS | | | |
| (Cost $308,256,370) | | | 357,494,635 |
|
| Money Market Funds - 2.6% | | | |
| Fidelity Cash Central Fund, 1.10%(e) | | 3,470,306 | 3,471,001 |
| Fidelity Securities Lending Cash Central Fund 1.11%(e)(f) | | 6,287,104 | 6,287,733 |
| TOTAL MONEY MARKET FUNDS | | | |
| (Cost $9,759,363) | | | 9,758,734 |
| TOTAL INVESTMENT IN SECURITIES - 97.5% | | | |
| (Cost $318,015,733) | | | 367,253,369 |
| NET OTHER ASSETS (LIABILITIES) - 2.5% | | | 9,493,948 |
| NET ASSETS - 100% | | | $376,747,317 |
Categorizations in the Schedule of Investments are based on country or territory of incorporation.
Legend
(a) Non-income producing
(b) Security or a portion of the security is on loan at period end.
(c) Affiliated company
(d) Security exempt from registration under Rule 144A of the Securities Act of 1933. These securities may be resold in transactions exempt from registration, normally to qualified institutional buyers. At the end of the period, the value of these securities amounted to $15,160,121 or 4.0% of net assets.
(e) Affiliated fund that is generally available only to investment companies and other accounts managed by Fidelity Investments. The rate quoted is the annualized seven-day yield of the fund at period end. A complete unaudited listing of the fund's holdings as of its most recent quarter end is available upon request. In addition, each Fidelity Central Fund's financial statements, which are not covered by the Fund's Report of Independent Registered Public Accounting Firm, are available on the SEC's website or upon request.
(f) Investment made with cash collateral received from securities on loan.
Affiliated Central Funds
Information regarding fiscal year to date income earned by the Fund from investments in Fidelity Central Funds is as follows:
| Fund | Income earned |
| Fidelity Cash Central Fund | $42,063 |
| Fidelity Securities Lending Cash Central Fund | 317,803 |
| Total | $359,866 |
Other Affiliated Issuers
An affiliated company is a company in which the Fund has ownership of at least 5% of the voting securities. Fiscal year to date transactions with companies which are or were affiliates are as follows:
| Affiliate | Value, beginning of period | Purchases | Sales Proceeds | Dividend Income | Realized Gain (loss) | Change in Unrealized appreciation (depreciation) | Value, end of period |
| East Capital Explorer AB | $9,439,560 | $-- | $10,988,626 | $-- | $1,017,667 | $531,399 | $-- |
| Zalaris ASA (A Shares) | 7,059,517 | -- | 908,065 | 173,291 | 66,162 | 3,807,184 | 10,024,798 |
| Total | $16,499,077 | $-- | $11,896,691 | $173,291 | $1,083,829 | $4,338,583 | $10,024,798 |
Investment Valuation
All investments are categorized as Level 1 under the Fair Value Hierarchy. The inputs or methodology used for valuing securities may not be an indication of the risk associated with investing in those securities. For more information on valuation inputs please refer to the Investment Valuation section in the accompanying Notes to Financial Statements.
See accompanying notes which are an integral part of the financial statements.
Fidelity® Nordic Fund
Financial Statements
Statement of Assets and Liabilities
| | | October 31, 2017 |
| Assets | | |
Investment in securities, at value (including securities loaned of $6,027,001) — See accompanying schedule:
Unaffiliated issuers (cost $301,730,769) | $347,469,837 | |
| Fidelity Central Funds (cost $9,759,363) | 9,758,734 | |
| Other affiliated issuers (cost $6,525,601) | 10,024,798 | |
| Total Investment in Securities (cost $318,015,733) | | $367,253,369 |
| Receivable for investments sold | | 17,518,864 |
| Receivable for fund shares sold | | 99,155 |
| Dividends receivable | | 401,281 |
| Distributions receivable from Fidelity Central Funds | | 25,580 |
| Prepaid expenses | | 859 |
| Other receivables | | 37,145 |
| Total assets | | 385,336,253 |
| Liabilities | | |
| Payable for fund shares redeemed | $1,946,787 | |
| Accrued management fee | 218,749 | |
| Other affiliated payables | 75,102 | |
| Other payables and accrued expenses | 62,234 | |
| Collateral on securities loaned | 6,286,064 | |
| Total liabilities | | 8,588,936 |
| Net Assets | | $376,747,317 |
| Net Assets consist of: | | |
| Paid in capital | | $321,707,644 |
| Undistributed net investment income | | 3,189,679 |
| Accumulated undistributed net realized gain (loss) on investments and foreign currency transactions | | 2,608,469 |
| Net unrealized appreciation (depreciation) on investments and assets and liabilities in foreign currencies | | 49,241,525 |
| Net Assets, for 6,933,242 shares outstanding | | $376,747,317 |
| Net Asset Value, offering price and redemption price per share ($376,747,317 ÷ 6,933,242 shares) | | $54.34 |
See accompanying notes which are an integral part of the financial statements.
Statement of Operations
| | | Year ended October 31, 2017 |
| Investment Income | | |
| Dividends (including $173,291 earned from other affiliated issuers) | | $8,154,505 |
| Income from Fidelity Central Funds | | 359,866 |
| Income before foreign taxes withheld | | 8,514,371 |
| Less foreign taxes withheld | | (1,107,829) |
| Total income | | 7,406,542 |
| Expenses | | |
| Management fee | $2,579,450 | |
| Transfer agent fees | 716,531 | |
| Accounting and security lending fees | 193,984 | |
| Custodian fees and expenses | 66,148 | |
| Independent trustees' fees and expenses | 1,503 | |
| Registration fees | 24,845 | |
| Audit | 73,047 | |
| Legal | 1,055 | |
| Interest | 906 | |
| Miscellaneous | 3,197 | |
| Total expenses before reductions | 3,660,666 | |
| Expense reductions | (103,912) | 3,556,754 |
| Net investment income (loss) | | 3,849,788 |
| Realized and Unrealized Gain (Loss) | | |
| Net realized gain (loss) on: | | |
| Investment securities: | | |
| Unaffiliated issuers | 34,196,679 | |
| Fidelity Central Funds | 748 | |
| Other affiliated issuers | 1,083,829 | |
| Foreign currency transactions | (84,272) | |
| Total net realized gain (loss) | | 35,196,984 |
| Change in net unrealized appreciation (depreciation) on: | | |
| Investment securities: | | |
| Unaffiliated issuers | 27,214,676 | |
| Fidelity Central Funds | (1,062) | |
| Other affiliated issuers | 4,338,583 | |
| Assets and liabilities in foreign currencies | 10,854 | |
| Total change in net unrealized appreciation (depreciation) | | 31,563,051 |
| Net gain (loss) | | 66,760,035 |
| Net increase (decrease) in net assets resulting from operations | | $70,609,823 |
See accompanying notes which are an integral part of the financial statements.
Statement of Changes in Net Assets
| | Year ended October 31, 2017 | Year ended October 31, 2016 |
| Increase (Decrease) in Net Assets | | |
| Operations | | |
| Net investment income (loss) | $3,849,788 | $6,119,558 |
| Net realized gain (loss) | 35,196,984 | (1,723,759) |
| Change in net unrealized appreciation (depreciation) | 31,563,051 | 3,076,831 |
| Net increase (decrease) in net assets resulting from operations | 70,609,823 | 7,472,630 |
| Distributions to shareholders from net investment income | (5,594,124) | (5,087,442) |
| Distributions to shareholders from net realized gain | (1,032,760) | (468,224) |
| Total distributions | (6,626,884) | (5,555,666) |
| Share transactions | | |
| Proceeds from sales of shares | 37,566,439 | 96,625,403 |
| Reinvestment of distributions | 6,272,273 | 5,260,046 |
| Cost of shares redeemed | (161,114,580) | (79,556,474) |
| Net increase (decrease) in net assets resulting from share transactions | (117,275,868) | 22,328,975 |
| Redemption fees | 20,284 | 47,548 |
| Total increase (decrease) in net assets | (53,272,645) | 24,293,487 |
| Net Assets | | |
| Beginning of period | 430,019,962 | 405,726,475 |
| End of period | $376,747,317 | $430,019,962 |
| Other Information | | |
| Undistributed net investment income end of period | $3,189,679 | $5,589,227 |
| Shares | | |
| Sold | 749,494 | 2,066,948 |
| Issued in reinvestment of distributions | 144,389 | 111,940 |
| Redeemed | (3,458,044) | (1,699,653) |
| Net increase (decrease) | (2,564,161) | 479,235 |
See accompanying notes which are an integral part of the financial statements.
Financial Highlights
Fidelity Nordic Fund
| Years ended October 31, | 2017 | 2016 | 2015 | 2014 | 2013 |
| Selected Per–Share Data | | | | | |
| Net asset value, beginning of period | $45.28 | $44.99 | $43.36 | $43.91 | $30.60 |
| Income from Investment Operations | | | | | |
| Net investment income (loss)A | .51 | .64 | .56 | .71 | .90 |
| Net realized and unrealized gain (loss) | 9.32 | .27 | 1.06 | 1.35 | 13.04 |
| Total from investment operations | 9.83 | .91 | 1.62 | 2.06 | 13.94 |
| Distributions from net investment income | (.65) | (.57) | – | (.83) | (.63) |
| Distributions from net realized gain | (.12) | (.05) | – | (1.80) | – |
| Total distributions | (.77) | (.62) | – | (2.63) | (.63) |
| Redemption fees added to paid in capitalA | –B | –B | .01 | .02 | –B |
| Net asset value, end of period | $54.34 | $45.28 | $44.99 | $43.36 | $43.91 |
| Total ReturnC | 22.14% | 1.97% | 3.76% | 4.88% | 46.42% |
| Ratios to Average Net AssetsD,E | | | | | |
| Expenses before reductions | .99% | .99% | 1.00% | .99% | 1.04% |
| Expenses net of fee waivers, if any | .99% | .98% | 1.00% | .99% | 1.04% |
| Expenses net of all reductions | .96% | .98% | .99% | .98% | 1.02% |
| Net investment income (loss) | 1.04% | 1.37% | 1.26% | 1.56% | 2.50% |
| Supplemental Data | | | | | |
| Net assets, end of period (000 omitted) | $376,747 | $430,020 | $405,726 | $487,582 | $439,147 |
| Portfolio turnover rateF | 69% | 63% | 80% | 103% | 61% |
A Calculated based on average shares outstanding during the period.
B Amount represents less than $.005 per share.
C Total returns would have been lower if certain expenses had not been reduced during the applicable periods shown.
D Fees and expenses of any underlying Fidelity Central Funds are not included in the Fund's expense ratio. The Fund indirectly bears its proportionate share of the expenses of any underlying Fidelity Central Funds.
E Expense ratios reflect operating expenses of the Fund. Expenses before reductions do not reflect amounts reimbursed by the investment adviser or reductions from brokerage service arrangements or reductions from other expense offset arrangements and do not represent the amount paid by the Fund during periods when reimbursements or reductions occur. Expenses net of fee waivers reflect expenses after reimbursement by the investment adviser but prior to reductions from brokerage service arrangements or other expense offset arrangements. Expenses net of all reductions represent the net expenses paid by the Fund.
F Amount does not include the portfolio activity of any underlying Fidelity Central Funds.
See accompanying notes which are an integral part of the financial statements.
Notes to Financial Statements
For the period ended October 31, 2017
1. Organization.
Fidelity Nordic Fund (the Fund) is a fund of Fidelity Investment Trust (the Trust) and is authorized to issue an unlimited number of shares. Share transactions on the Statement of Changes in Net Assets may contain exchanges between affiliated funds. The Trust is registered under the Investment Company Act of 1940, as amended (the 1940 Act), as an open-end management investment company organized as a Massachusetts business trust.
2. Investments in Fidelity Central Funds.
The Fund invests in Fidelity Central Funds, which are open-end investment companies generally available only to other investment companies and accounts managed by the investment adviser and its affiliates. The Fund's Schedule of Investments lists each of the Fidelity Central Funds held as of period end, if any, as an investment of the Fund, but does not include the underlying holdings of each Fidelity Central Fund. As an Investing Fund, the Fund indirectly bears its proportionate share of the expenses of the underlying Fidelity Central Funds.
The Money Market Central Funds seek preservation of capital and current income and are managed by Fidelity Investments Money Management, Inc. (FIMM), an affiliate of the investment adviser. Annualized expenses of the Money Market Central Funds as of their most recent shareholder report date are less than .005%.
A complete unaudited list of holdings for each Fidelity Central Fund is available upon request or at the Securities and Exchange Commission (the SEC) website at www.sec.gov. In addition, the financial statements of the Fidelity Central Funds, which are not covered by the Fund's Report of Independent Registered Public Accounting Firm, are available on the SEC website or upon request.
3. Significant Accounting Policies.
The Fund is an investment company and applies the accounting and reporting guidance of the Financial Accounting Standards Board (FASB) Accounting Standards Codification Topic 946 Financial Services – Investments Companies. The financial statements have been prepared in conformity with accounting principles generally accepted in the United States of America (GAAP), which require management to make certain estimates and assumptions at the date of the financial statements. Actual results could differ from those estimates. Subsequent events, if any, through the date that the financial statements were issued have been evaluated in the preparation of the financial statements. The following summarizes the significant accounting policies of the Fund:
Investment Valuation. Investments are valued as of 4:00 p.m. Eastern time on the last calendar day of the period. The Board of Trustees (the Board) has delegated the day to day responsibility for the valuation of the Fund's investments to the Fair Value Committee (the Committee) established by the Fund's investment adviser. In accordance with valuation policies and procedures approved by the Board, the Fund attempts to obtain prices from one or more third party pricing vendors or brokers to value its investments. When current market prices, quotations or currency exchange rates are not readily available or reliable, investments will be fair valued in good faith by the Committee, in accordance with procedures adopted by the Board. Factors used in determining fair value vary by investment type and may include market or investment specific events. The frequency with which these procedures are used cannot be predicted and they may be utilized to a significant extent. The Committee oversees the Fund's valuation policies and procedures and reports to the Board on the Committee's activities and fair value determinations. The Board monitors the appropriateness of the procedures used in valuing the Fund's investments and ratifies the fair value determinations of the Committee.
The Fund categorizes the inputs to valuation techniques used to value its investments into a disclosure hierarchy consisting of three levels as shown below:
- Level 1 – quoted prices in active markets for identical investments
- Level 2 – other significant observable inputs (including quoted prices for similar investments, interest rates, prepayment speeds, etc.)
- Level 3 – unobservable inputs (including the Fund's own assumptions based on the best information available)
Valuation techniques used to value the Fund's investments by major category are as follows:
Equity securities, including restricted securities, for which market quotations are readily available, are valued at the last reported sale price or official closing price as reported by a third party pricing vendor on the primary market or exchange on which they are traded and are categorized as Level 1 in the hierarchy. In the event there were no sales during the day or closing prices are not available, securities are valued at the last quoted bid price or may be valued using the last available price and are generally categorized as Level 2 in the hierarchy. For foreign equity securities, when market or security specific events arise, comparisons to the valuation of American Depositary Receipts (ADRs), futures contracts, Exchange-Traded Funds (ETFs) and certain indexes as well as quoted prices for similar securities may be used and would be categorized as Level 2 in the hierarchy. Utilizing these techniques may result in transfers between Level 1 and Level 2. For equity securities, including restricted securities, where observable inputs are limited, assumptions about market activity and risk are used and these securities may be categorized as Level 3 in the hierarchy.
Investments in open-end mutual funds, including the Fidelity Central Funds, are valued at their closing net asset value (NAV) each business day and are categorized as Level 1 in the hierarchy.
Changes in valuation techniques may result in transfers in or out of an assigned level within the disclosure hierarchy. The aggregate value of investments by input level as of October 31, 2017 is included at the end of the Fund's Schedule of Investments.
Foreign Currency. The Fund may use foreign currency contracts to facilitate transactions in foreign-denominated securities. Gains and losses from these transactions may arise from changes in the value of the foreign currency or if the counterparties do not perform under the contracts' terms.
Foreign-denominated assets, including investment securities, and liabilities are translated into U.S. dollars at the exchange rates at period end. Purchases and sales of investment securities, income and dividends received and expenses denominated in foreign currencies are translated into U.S. dollars at the exchange rate in effect on the transaction date.
The effects of exchange rate fluctuations on investments are included with the net realized and unrealized gain (loss) on investment securities. Other foreign currency transactions resulting in realized and unrealized gain (loss) are disclosed separately.
Investment Transactions and Income. For financial reporting purposes, the Fund's investment holdings and NAV include trades executed through the end of the last business day of the period. The NAV per share for processing shareholder transactions is calculated as of the close of business of the New York Stock Exchange (NYSE), normally 4:00 p.m. Eastern time and includes trades executed through the end of the prior business day. Gains and losses on securities sold are determined on the basis of identified cost. Dividend income is recorded on the ex-dividend date, except for certain dividends from foreign securities where the ex-dividend date may have passed, which are recorded as soon as the Fund is informed of the ex-dividend date. Non-cash dividends included in dividend income, if any, are recorded at the fair market value of the securities received. Income and capital gain distributions from Fidelity Central Funds, if any, are recorded on the ex-dividend date. Investment income is recorded net of foreign taxes withheld where recovery of such taxes is uncertain.
Expenses. Expenses directly attributable to a fund are charged to that fund. Expenses attributable to more than one fund are allocated among the respective funds on the basis of relative net assets or other appropriate methods. Expense estimates are accrued in the period to which they relate and adjustments are made when actual amounts are known.
Income Tax Information and Distributions to Shareholders. Each year, the Fund intends to qualify as a regulated investment company under Subchapter M of the Internal Revenue Code, including distributing substantially all of its taxable income and realized gains. As a result, no provision for U.S. Federal income taxes is required. As of October 31, 2017, the Fund did not have any unrecognized tax benefits in the financial statements; nor is the Fund aware of any tax positions for which it is reasonably possible that the total amounts of unrecognized tax benefits will significantly change in the next twelve months. The Fund files a U.S. federal tax return, in addition to state and local tax returns as required. The Fund's federal income tax returns are subject to examination by the Internal Revenue Service (IRS) for a period of three fiscal years after they are filed. State and local tax returns may be subject to examination for an additional fiscal year depending on the jurisdiction. Foreign taxes are provided for based on the Fund's understanding of the tax rules and rates that exist in the foreign markets in which it invests.
Distributions are declared and recorded on the ex-dividend date. Income and capital gain distributions are determined in accordance with income tax regulations, which may differ from GAAP. In addition, the Fund claimed a portion of the payment made to redeeming shareholders as a distribution for income tax purposes.
Capital accounts within the financial statements are adjusted for permanent book-tax differences. These adjustments have no impact on net assets or the results of operations. Capital accounts are not adjusted for temporary book-tax differences which will reverse in a subsequent period.
Book-tax differences are primarily due to foreign currency transactions, passive foreign investment companies (PFIC), deferred trustees compensation, capital loss carryforwards and losses deferred due to wash sales
As of period end, the cost and unrealized appreciation (depreciation) in securities, and derivatives if applicable, for federal income tax purposes were as follows:
| Gross unrealized appreciation | $56,373,581 |
| Gross unrealized depreciation | (15,089,424) |
| Net unrealized appreciation (depreciation) | $41,284,157 |
| Tax Cost | $325,969,212 |
The tax-based components of distributable earnings as of period end were as follows:
| Undistributed ordinary income | $10,191,405 |
| Undistributed long-term capital gain | $3,560,225 |
| Net unrealized appreciation (depreciation) on securities and other investments | $41,288,046 |
The tax character of distributions paid was as follows:
| | October 31, 2017 | October 31, 2016 |
| Ordinary Income | $6,626,884 | $ 5,555,666 |
Short-Term Trading (Redemption) Fees. Shares held by investors in the Fund less than 90 days may have been subject to a redemption fee equal to 1.50% of the NAV of shares redeemed. All redemption fees, which reduce the proceeds of the shareholder redemption, are retained by the Fund and accounted for as an addition to paid in capital. In November 2017, the Board of Trustees approved the elimination of these redemption fees effective December 18, 2017.
Restricted Securities. The Fund may invest in securities that are subject to legal or contractual restrictions on resale. These securities generally may be resold in transactions exempt from registration or to the public if the securities are registered. Disposal of these securities may involve time-consuming negotiations and expense, and prompt sale at an acceptable price may be difficult. Information regarding restricted securities is included at the end of the Fund's Schedule of Investments.
4. Purchases and Sales of Investments.
Purchases and sales of securities, other than short-term securities, aggregated $254,141,871 and $378,585,297, respectively.
5. Fees and Other Transactions with Affiliates.
Management Fee. Fidelity Management & Research Company (the investment adviser) and its affiliates provide the Fund with investment management related services for which the Fund pays a monthly management fee. The management fee is the sum of an individual fund fee rate that is based on an annual rate of .45% of the Fund's average net assets and an annualized group fee rate that averaged .25% during the period. The group fee rate is based upon the average net assets of all the mutual funds advised by the investment adviser, including any mutual funds previously advised by the investment adviser that are currently advised by Fidelity SelectCo, LLC, an affiliate of the investment adviser. The group fee rate decreases as assets under management increase and increases as assets under management decrease. For the reporting period, the total annual management fee rate was .70% of the Fund's average net assets.
Transfer Agent Fees. Fidelity Investments Institutional Operations Company, Inc. (FIIOC), an affiliate of the investment adviser, is the Fund's transfer, dividend disbursing and shareholder servicing agent. FIIOC receives account fees and asset-based fees that vary according to account size and type of account. FIIOC pays for typesetting, printing and mailing of shareholder reports, except proxy statements. For the period, the transfer agent fees were equivalent to an annual rate of .19% of average net assets.
Accounting and Security Lending Fees. Fidelity Service Company, Inc. (FSC), an affiliate of the investment adviser, maintains the Fund's accounting records. The accounting fee is based on the level of average net assets for each month. Under a separate contract, FSC administers the security lending program. The security lending fee is based on the number and duration of lending transactions.
Interfund Lending Program. Pursuant to an Exemptive Order issued by the SEC, the Fund, along with other registered investment companies having management contracts with Fidelity Management & Research Company (FMR) or other affiliated entities of FMR, may participate in an interfund lending program. This program provides an alternative credit facility allowing the funds to borrow from, or lend money to, other participating affiliated funds. At period end, there were no interfund loans outstanding. The Fund's activity in this program during the period for which loans were outstanding was as follows:
| Borrower or Lender | Average Loan Balance | Weighted Average Interest Rate | Interest Expense |
| Borrower | $9,059,500 | .60% | $906 |
Interfund Trades. The Fund may purchase from or sell securities to other Fidelity Funds under procedures adopted by the Board. The procedures have been designed to ensure these interfund trades are executed in accordance with Rule 17a-7 of the 1940 Act. Interfund trades are included within the respective purchases and sales amounts shown in the Purchases and Sales of Investments note.
6. Committed Line of Credit.
The Fund participates with other funds managed by the investment adviser or an affiliate in a $4.25 billion credit facility (the "line of credit") to be utilized for temporary or emergency purposes to fund shareholder redemptions or for other short-term liquidity purposes. The Fund has agreed to pay commitment fees on its pro-rata portion of the line of credit, which amounted to $1,211 and is reflected in Miscellaneous expenses on the Statement of Operations. During the period, the Fund did not borrow on this line of credit.
7. Security Lending.
The Fund lends portfolio securities through a lending agent from time to time in order to earn additional income. For equity securities, a lending agent is used and may loan securities to certain qualified borrowers, including Fidelity Capital Markets (FCM), a broker-dealer affiliated with the Fund. On the settlement date of the loan, the Fund receives collateral (in the form of U.S. Treasury obligations, letters of credit and/or cash) against the loaned securities and maintains collateral in an amount not less than 100% of the market value of the loaned securities during the period of the loan. The market value of the loaned securities is determined at the close of business of the Fund and any additional required collateral is delivered to the Fund on the next business day. The Fund or borrower may terminate the loan at any time, and if the borrower defaults on its obligation to return the securities loaned because of insolvency or other reasons, the Fund may apply collateral received from the borrower against the obligation. The Fund may experience delays and costs in recovering the securities loaned. Any cash collateral received is invested in the Fidelity Securities Lending Cash Central Fund. The value of loaned securities and cash collateral at period end are disclosed on the Fund's Statement of Assets and Liabilities. Security lending income represents the income earned on investing cash collateral, less rebates paid to borrowers and any lending agent fees associated with the loan, plus any premium payments received for lending certain types of securities. Security lending income is presented in the Statement of Operations as a component of income from Fidelity Central Funds. Total security lending income during the period amounted to $317,803. During the period, there were no securities loaned to FCM.
8. Expense Reductions.
Commissions paid to certain brokers with whom the investment adviser, or its affiliates, places trades on behalf of the Fund include an amount in addition to trade execution, which may be rebated back to the Fund to offset certain expenses. This amount totaled $100,539 for the period.
In addition, during the period the investment adviser reimbursed and/or waived a portion of operating expenses in the amount of $3,373.
9. Other.
The Fund's organizational documents provide former and current trustees and officers with a limited indemnification against liabilities arising in connection with the performance of their duties to the Fund. In the normal course of business, the Fund may also enter into contracts that provide general indemnifications. The Fund's maximum exposure under these arrangements is unknown as this would be dependent on future claims that may be made against the Fund. The risk of material loss from such claims is considered remote.
Fidelity® Pacific Basin Fund
Performance: The Bottom Line
Average annual total return reflects the change in the value of an investment, assuming reinvestment of distributions from dividend income and capital gains (the profits earned upon the sale of securities that have grown in value, if any) and assuming a constant rate of performance each year. The hypothetical investment and the average annual total returns do not reflect the deduction of taxes that a shareholder would pay on fund distributions or the redemption of fund shares. During periods of reimbursement by Fidelity, a fund’s total return will be greater than it would be had the reimbursement not occurred. How a fund did yesterday is no guarantee of how it will do tomorrow.
Average Annual Total Returns
| For the periods ended October 31, 2017 | Past 1 year | Past 5 years | Past 10 years |
| Fidelity® Pacific Basin Fund | 26.22% | 14.24% | 4.85% |
$10,000 Over 10 Years
Let's say hypothetically that $10,000 was invested in Fidelity® Pacific Basin Fund on October 31, 2007.
The chart shows how the value of your investment would have changed, and also shows how the MSCI AC (All Country) Pacific Index performed over the same period.
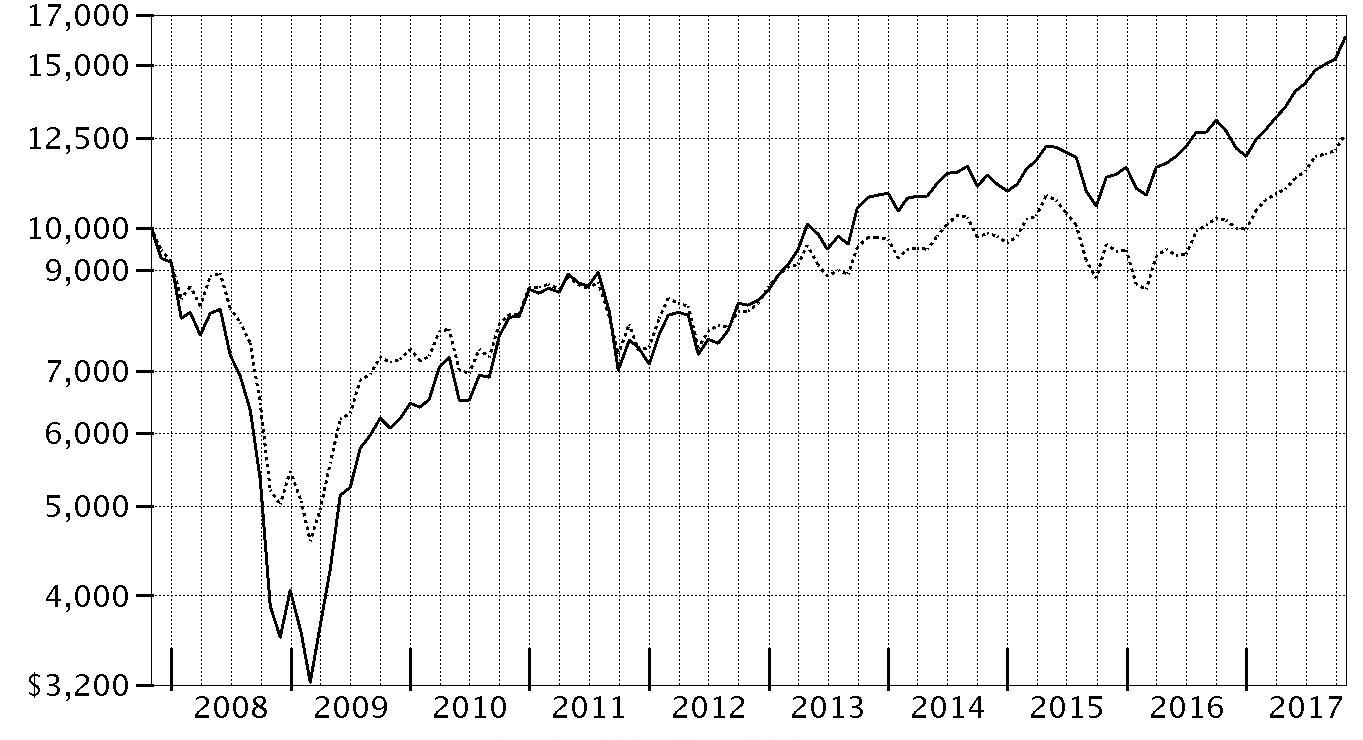
| Period Ending Values |
| $16,065 | Fidelity® Pacific Basin Fund |
| $12,625 | MSCI AC (All Country) Pacific Index |
Fidelity® Pacific Basin Fund
Management's Discussion of Fund Performance
Market Recap: The MSCI ACWI (All Country World Index) ex USA Index returned 23.85% for the 12 months ending October 31, 2017, helped partly by a generally weak U.S. dollar. Some favorable election results in continental Europe (+30%) suggested ebbing political uncertainty and near-term risk there, but the U.K. (+20%) faced more-mixed conditions ahead of its expected exit from the European Union. Despite central-bank easing – and pressured recently by yen strength – Japan (+18%) lagged the rest of the Asia-Pacific group (+22%). Commodity-price volatility slowed Canada (+17%), but the emerging-markets group (+26%) sped ahead. Sector-wise, information technology (+47%) was driven by a surge among several Chinese internet-related names. Financials (+27%) rode rising interest rates that, at the same time, weighed on real estate (+17%), utilities (+16%), consumer staples (+14%) and telecommunication services (+9%) – so-called “bond proxy” sectors. Materials (+28%) and industrials (+27%) responded to demand from China and price gains for certain commodities. In the energy sector (+20%), oil prices lost ground in the spring before rebounding through October 31 to end well above where they started 12 months ago. Lastly, health care (+14%) was hurt by early-period turmoil around drug pricing and health care legislation.
Comments from Portfolio Manager John Dance: For the year, the fund gained 26.22%, topping the 23.84% advance of the benchmark MSCI AC (All Country) Pacific Index. Versus the benchmark, stock selection in the consumer staples, consumer discretionary and financials sectors contributed most to performance. Overall, active management added value in nine of 11 market sectors. Regionally, stock selection in China was a key performance driver, with picks in Australia, South Africa and India also helping. Our top relative contributor was Kweichow Moutai, a China-based maker of the distilled spirit baijiu. Also contributing were two other China-based firms: Hangzhou Hikvision Digital Technology, the world’s largest manufacturer of security cameras, and pharmaceutical firm Jiangsu Hengrui Medicine. All three stocks were "A-shares" – designating mainland China-based shares trading on the Shanghai and Shenzhen stock exchanges –that weren’t part of the fund’s benchmark. A non-benchmark position in South Africa-based media company Naspers also helped. Conversely, positioning in the information technology and materials sectors detracted, as did a modest cash position of 2%, on average. Geographically, South Korea, Israel and New Zealand hurt. Avoiding South Korea’s Samsung Electronics for much of the period made this strong-performing index stock our largest relative detractor. Not owning index name Tencent Holdings further detracted. Overweighting Sarine Technologies, a provider of equipment for processing diamonds and gemstones, also hampered results.
The views expressed above reflect those of the portfolio manager(s) only through the end of the period as stated on the cover of this report and do not necessarily represent the views of Fidelity or any other person in the Fidelity organization. Any such views are subject to change at any time based upon market or other conditions and Fidelity disclaims any responsibility to update such views. These views may not be relied on as investment advice and, because investment decisions for a Fidelity fund are based on numerous factors, may not be relied on as an indication of trading intent on behalf of any Fidelity fund.
Fidelity® Pacific Basin Fund
Investment Summary (Unaudited)
Geographic Diversification (% of fund's net assets)
| As of October 31, 2017 |
| | Japan | 34.5% |
| | Australia | 14.1% |
| | China | 11.3% |
| | India | 8.5% |
| | Cayman Islands | 5.6% |
| | Taiwan | 5.6% |
| | South Africa | 3.9% |
| | Hong Kong | 3.8% |
| | Korea (South) | 3.1% |
| | Other* | 9.6% |

* Includes Short-Term investments and Net Other Assets (Liabilities).
Percentages are based on country or territory of incorporation and are adjusted for the effect of futures contracts, if applicable.
| As of April 30, 2017 |
| | Japan | 34.0% |
| | Australia | 13.5% |
| | China | 8.2% |
| | India | 6.3% |
| | Taiwan | 6.3% |
| | Hong Kong | 5.8% |
| | Cayman Islands | 4.8% |
| | United States of America* | 3.8% |
| | Korea (South) | 3.3% |
| | Other | 14.0% |
* Includes Short-Term investments and Net Other Assets (Liabilities).
Percentages are based on country or territory of incorporation and are adjusted for the effect of futures contracts, if applicable.
Asset Allocation as of October 31, 2017
| | % of fund's net assets | % of fund's net assets 6 months ago |
| Stocks | 98.8 | 97.7 |
| Short-Term Investments and Net Other Assets (Liabilities) | 1.2 | 2.3 |
Top Ten Stocks as of October 31, 2017
| | % of fund's net assets | % of fund's net assets 6 months ago |
| Naspers Ltd. Class N (South Africa, Media) | 3.9 | 3.2 |
| Alibaba Group Holding Ltd. sponsored ADR (Cayman Islands, Internet Software & Services) | 3.4 | 2.1 |
| Taiwan Semiconductor Manufacturing Co. Ltd. (Taiwan, Semiconductors & Semiconductor Equipment) | 3.3 | 3.0 |
| Kweichow Moutai Co. Ltd. (A Shares) (China, Beverages) | 2.3 | 1.8 |
| Commonwealth Bank of Australia (Australia, Banks) | 2.0 | 2.0 |
| AIA Group Ltd. (Hong Kong, Insurance) | 1.8 | 2.0 |
| ORIX Corp. (Japan, Diversified Financial Services) | 1.7 | 1.0 |
| Jiangsu Hengrui Medicine Co. Ltd. (A Shares) (China, Pharmaceuticals) | 1.7 | 1.4 |
| SoftBank Corp. (Japan, Wireless Telecommunication Services) | 1.6 | 1.5 |
| Toto Ltd. (Japan, Building Products) | 1.6 | 0.0 |
| | 23.3 | |
Top Market Sectors as of October 31, 2017
| | % of fund's net assets | % of fund's net assets 6 months ago |
| Financials | 18.7 | 18.4 |
| Consumer Discretionary | 16.9 | 15.9 |
| Information Technology | 15.6 | 12.8 |
| Health Care | 12.0 | 11.6 |
| Industrials | 9.8 | 12.2 |
| Consumer Staples | 9.0 | 10.1 |
| Telecommunication Services | 4.2 | 4.2 |
| Materials | 3.9 | 3.3 |
| Real Estate | 3.4 | 4.8 |
| Utilities | 2.8 | 1.9 |
Percentages shown as 0.0% may reflect amounts less than 0.05%.
Fidelity® Pacific Basin Fund
Investments October 31, 2017
Showing Percentage of Net Assets
| Common Stocks - 97.6% | | | |
| | | Shares | Value |
| Australia - 14.1% | | | |
| 1-Page Ltd. (a)(b) | | 872,167 | $110,140 |
| Amcor Ltd. | | 714,908 | 8,666,933 |
| Arena (REIT) unit | | 3,009,377 | 5,159,228 |
| Australia & New Zealand Banking Group Ltd. | | 555,948 | 12,730,804 |
| Blue Sky Alternative Investments Ltd. | | 1,304,870 | 14,061,446 |
| BWX Ltd. (c) | | 1,552,924 | 8,616,845 |
| Commonwealth Bank of Australia | | 320,420 | 19,037,472 |
| CSL Ltd. | | 103,723 | 11,028,874 |
| Hansen Technologies Ltd. | | 2,550,516 | 6,617,407 |
| HUB24 Ltd. (a) | | 1,203,719 | 8,051,868 |
| Magellan Financial Group Ltd. | | 324,996 | 6,036,815 |
| Netwealth Group Ltd. (d) | | 281,601 | 797,436 |
| NIB Holdings Ltd. | | 1,269,267 | 6,120,031 |
| realestate.com.au Ltd. | | 149,995 | 8,297,648 |
| Reliance Worldwide Corp. Ltd. | | 2,025,464 | 5,782,204 |
| SpeedCast International Ltd. | | 1,171,597 | 3,730,196 |
| Sydney Airport unit | | 791,380 | 4,306,404 |
| Woodside Petroleum Ltd. | | 347,268 | 8,167,467 |
|
| TOTAL AUSTRALIA | | | 137,319,218 |
|
| Bermuda - 1.7% | | | |
| Cheung Kong Infrastructure Holdings Ltd. | | 1,211,000 | 10,540,018 |
| Hongkong Land Holdings Ltd. | | 875,100 | 6,344,475 |
|
| TOTAL BERMUDA | | | 16,884,493 |
|
| Cayman Islands - 5.6% | | | |
| Alibaba Group Holding Ltd. sponsored ADR (a) | | 176,700 | 32,670,063 |
| China High Precision Automation Group Ltd. (a)(b) | | 1,875,000 | 2 |
| China Metal Recycling (Holdings) Ltd. (a)(b) | | 2,572,200 | 3 |
| International Housewares Retail Co. Ltd. | | 17,370,700 | 3,273,121 |
| NetEase, Inc. ADR | | 21,600 | 6,089,472 |
| Silergy Corp. | | 322,000 | 6,955,405 |
| SITC International Holdings Co. Ltd. | | 5,566,000 | 5,365,232 |
|
| TOTAL CAYMAN ISLANDS | | | 54,353,298 |
|
| China - 11.3% | | | |
| Gree Electric Appliances, Inc. of Zhuhai Class A | | 1,470,794 | 9,432,288 |
| Hangzhou Hikvision Digital Technology Co. Ltd. Class A | | 2,023,016 | 11,976,679 |
| Industrial & Commercial Bank of China Ltd. (H Shares) | | 13,110,000 | 10,402,095 |
| Jiangsu Hengrui Medicine Co. Ltd. (A Shares) | | 1,657,294 | 16,793,000 |
| Jiangsu Yanghe Brewery Joint-Stock Co. Ltd. Class A | | 556,654 | 9,248,902 |
| Kweichow Moutai Co. Ltd. (A Shares) | | 235,450 | 21,931,779 |
| Shanghai International Airport Co. Ltd. (A Shares) | | 1,106,113 | 7,293,621 |
| Shenzhen Expressway Co. (H Shares) | | 4,216,000 | 4,312,518 |
| Tonghua Dongbao Pharmaceutical Co. Ltd. Class A | | 1,889,600 | 6,157,312 |
| Weifu High-Technology Co. Ltd. (B Shares) | | 1,382,213 | 3,251,161 |
| Yunnan Baiyao Group Co. Ltd. | | 595,664 | 9,412,261 |
|
| TOTAL CHINA | | | 110,211,616 |
|
| Hong Kong - 3.8% | | | |
| AIA Group Ltd. | | 2,325,600 | 17,498,490 |
| CSPC Pharmaceutical Group Ltd. | | 3,854,000 | 6,698,828 |
| Magnificent Hotel Investment Ltd. | | 90,048,000 | 2,712,498 |
| Techtronic Industries Co. Ltd. | | 1,635,500 | 9,591,115 |
|
| TOTAL HONG KONG | | | 36,500,931 |
|
| India - 8.5% | | | |
| Asian Paints Ltd. | | 288,369 | 5,259,004 |
| Axis Bank Ltd. | | 889,398 | 7,185,924 |
| Bharti Infratel Ltd. | | 1,673,826 | 11,429,840 |
| CCL Products (India) Ltd. | | 590,497 | 2,926,038 |
| HDFC Bank Ltd. | | 394,066 | 11,030,009 |
| Housing Development Finance Corp. Ltd. | | 291,623 | 7,689,840 |
| Indraprastha Gas Ltd. | | 370,196 | 9,062,798 |
| Petronet LNG Ltd. | | 2,476,772 | 9,939,602 |
| Power Grid Corp. of India Ltd. | | 2,301,511 | 7,530,117 |
| Reliance Industries Ltd. | | 494,115 | 7,179,739 |
| Vakrangee Ltd. | | 453,120 | 3,934,971 |
|
| TOTAL INDIA | | | 83,167,882 |
|
| Indonesia - 2.4% | | | |
| PT Bank Central Asia Tbk | | 9,167,900 | 14,127,861 |
| PT Bank Rakyat Indonesia Tbk | | 8,236,100 | 9,473,413 |
|
| TOTAL INDONESIA | | | 23,601,274 |
|
| Israel - 0.3% | | | |
| Sarine Technologies Ltd. | | 4,391,400 | 3,141,086 |
| Japan - 34.5% | | | |
| Arcland Service Holdings Co. Ltd. | | 383,000 | 8,448,692 |
| Bank of Kyoto Ltd. | | 144,400 | 7,583,469 |
| Broadleaf Co. Ltd. | | 293,902 | 2,412,986 |
| Chugai Pharmaceutical Co. Ltd. | | 138,300 | 6,593,696 |
| Create SD Holdings Co. Ltd. | | 211,800 | 5,331,423 |
| Daito Trust Construction Co. Ltd. | | 43,200 | 7,552,847 |
| Disco Corp. | | 37,000 | 8,573,890 |
| East Japan Railway Co. | | 78,300 | 7,593,504 |
| Eiken Chemical Co. Ltd. | | 170,700 | 6,717,469 |
| Hoya Corp. | | 202,300 | 10,991,109 |
| Kao Corp. | | 149,000 | 9,004,837 |
| KDDI Corp. | | 355,000 | 9,458,137 |
| Keyence Corp. | | 21,800 | 12,103,904 |
| Misumi Group, Inc. | | 180,300 | 4,939,779 |
| Money Forward, Inc. | | 10,700 | 296,488 |
| Morinaga & Co. Ltd. | | 94,600 | 5,374,206 |
| Nakanishi, Inc. | | 143,500 | 6,503,374 |
| Nidec Corp. | | 70,700 | 9,401,893 |
| Nifco, Inc. | | 137,000 | 8,943,522 |
| Nihon M&A Center, Inc. | | 92,400 | 4,423,609 |
| Nihon Parkerizing Co. Ltd. | | 223,200 | 3,658,974 |
| Nissan Chemical Industries Co. Ltd. | | 309,600 | 11,547,916 |
| Nitori Holdings Co. Ltd. | | 66,500 | 9,664,535 |
| Olympus Corp. | | 151,600 | 5,641,744 |
| Open House Co. Ltd. | | 184,900 | 7,127,368 |
| ORIX Corp. | | 985,700 | 16,947,746 |
| PALTAC Corp. | | 95,500 | 3,792,882 |
| Panasonic Corp. | | 729,900 | 11,021,026 |
| PeptiDream, Inc. (a)(c) | | 102,000 | 3,236,835 |
| Pilot Corp. | | 147,600 | 7,462,625 |
| ProNexus, Inc. | | 276,400 | 3,354,327 |
| Rakuten, Inc. | | 432,400 | 4,627,029 |
| Renesas Electronics Corp. (a) | | 552,400 | 7,142,030 |
| Santen Pharmaceutical Co. Ltd. | | 391,000 | 6,213,086 |
| Seven & i Holdings Co. Ltd. | | 220,700 | 8,895,197 |
| SK Kaken Co. Ltd. | | 59,000 | 4,901,922 |
| SMS Co., Ltd. | | 210,300 | 6,335,168 |
| SoftBank Corp. | | 175,900 | 15,588,644 |
| Sosei Group Corp. (a)(c) | | 28,500 | 2,615,181 |
| Start Today Co. Ltd. | | 320,500 | 8,778,377 |
| Subaru Corp. | | 297,600 | 10,281,816 |
| Sundrug Co. Ltd. | | 144,600 | 6,292,778 |
| The Suruga Bank Ltd. | | 367,000 | 8,356,083 |
| Toto Ltd. | | 311,500 | 15,255,423 |
| Welcia Holdings Co. Ltd. | | 135,200 | 5,131,140 |
|
| TOTAL JAPAN | | | 336,118,686 |
|
| Korea (South) - 1.9% | | | |
| Coway Co. Ltd. | | 76,558 | 6,662,338 |
| Hanon Systems | | 411,900 | 4,789,149 |
| Loen Entertainment, Inc. | | 78,154 | 7,444,303 |
|
| TOTAL KOREA (SOUTH) | | | 18,895,790 |
|
| New Zealand - 1.1% | | | |
| EBOS Group Ltd. | | 408,279 | 4,917,182 |
| Ryman Healthcare Group Ltd. | | 925,540 | 5,890,127 |
|
| TOTAL NEW ZEALAND | | | 10,807,309 |
|
| Philippines - 0.8% | | | |
| Ayala Land, Inc. | | 5,832,700 | 4,884,563 |
| D&L Industries, Inc. | | 13,974,600 | 2,811,960 |
|
| TOTAL PHILIPPINES | | | 7,696,523 |
|
| Singapore - 0.3% | | | |
| Wing Tai Holdings Ltd. | | 1,890,100 | 3,327,885 |
| South Africa - 3.9% | | | |
| Naspers Ltd. Class N | | 154,400 | 37,620,586 |
| Taiwan - 5.6% | | | |
| CTCI Corp. | | 3,446,000 | 5,345,428 |
| Nien Made Enterprise Co. Ltd. | | 499,000 | 5,198,951 |
| Taiwan Semiconductor Manufacturing Co. Ltd. | | 3,950,000 | 31,955,779 |
| United Microelectronics Corp. | | 8,938,000 | 4,616,239 |
| Voltronic Power Technology Corp. | | 380,703 | 7,174,972 |
|
| TOTAL TAIWAN | | | 54,291,369 |
|
| Thailand - 1.0% | | | |
| Bangkok Bank PCL (For. Reg.) | | 882,400 | 5,339,025 |
| Thai Beverage PCL | | 6,086,700 | 4,376,030 |
|
| TOTAL THAILAND | | | 9,715,055 |
|
| United States of America - 0.8% | | | |
| GI Dynamics, Inc. CDI (a) | | 5,561,290 | 170,253 |
| ResMed, Inc. CDI | | 923,110 | 7,651,419 |
|
| TOTAL UNITED STATES OF AMERICA | | | 7,821,672 |
|
| TOTAL COMMON STOCKS | | | |
| (Cost $678,655,504) | | | 951,474,673 |
|
| Nonconvertible Preferred Stocks - 1.2% | | | |
| Korea (South) - 1.2% | | | |
| Samsung Electronics Co. Ltd. | | | |
| (Cost $10,540,540) | | 5,903 | 11,826,168 |
|
| Money Market Funds - 1.8% | | | |
| Fidelity Cash Central Fund, 1.10% (e) | | 13,584,144 | 13,586,860 |
| Fidelity Securities Lending Cash Central Fund 1.11% (e)(f) | | 3,951,047 | 3,951,442 |
| TOTAL MONEY MARKET FUNDS | | | |
| (Cost $17,538,114) | | | 17,538,302 |
| TOTAL INVESTMENT IN SECURITIES - 100.6% | | | |
| (Cost $706,734,158) | | | 980,839,143 |
| NET OTHER ASSETS (LIABILITIES) - (0.6)% | | | (5,580,134) |
| NET ASSETS - 100% | | | $975,259,009 |
Categorizations in the Schedule of Investments are based on country or territory of incorporation.
Legend
(a) Non-income producing
(b) Level 3 security
(c) Security or a portion of the security is on loan at period end.
(d) Security or a portion of the security purchased on a delayed delivery or when-issued basis.
(e) Affiliated fund that is generally available only to investment companies and other accounts managed by Fidelity Investments. The rate quoted is the annualized seven-day yield of the fund at period end. A complete unaudited listing of the fund's holdings as of its most recent quarter end is available upon request. In addition, each Fidelity Central Fund's financial statements, which are not covered by the Fund's Report of Independent Registered Public Accounting Firm, are available on the SEC's website or upon request.
(f) Investment made with cash collateral received from securities on loan.
Affiliated Central Funds
Information regarding fiscal year to date income earned by the Fund from investments in Fidelity Central Funds is as follows:
| Fund | Income earned |
| Fidelity Cash Central Fund | $144,327 |
| Fidelity Securities Lending Cash Central Fund | 280,773 |
| Total | $425,100 |
Investment Valuation
The following is a summary of the inputs used, as of October 31, 2017, involving the Fund's assets and liabilities carried at fair value. The inputs or methodology used for valuing securities may not be an indication of the risk associated with investing in those securities. For more information on valuation inputs, and their aggregation into the levels used below, please refer to the Investment Valuation section in the accompanying Notes to Financial Statements.
| | Valuation Inputs at Reporting Date: |
| Description | Total | Level 1 | Level 2 | Level 3 |
| Investments in Securities: | | | | |
| Equities: | | | | |
| Consumer Discretionary | $163,831,037 | $98,273,158 | $65,557,879 | $-- |
| Consumer Staples | 87,129,175 | 47,099,594 | 40,029,581 | -- |
| Energy | 25,286,808 | 25,286,808 | -- | -- |
| Financials | 182,469,827 | 137,755,084 | 44,714,743 | -- |
| Health Care | 117,231,750 | 68,719,256 | 48,512,494 | -- |
| Industrials | 95,152,625 | 42,721,465 | 52,431,160 | -- |
| Information Technology | 153,616,791 | 80,070,165 | 73,436,484 | 110,142 |
| Materials | 36,846,712 | 16,737,897 | 20,108,812 | 3 |
| Real Estate | 34,396,366 | 19,716,151 | 14,680,215 | -- |
| Telecommunication Services | 40,206,817 | 15,160,036 | 25,046,781 | -- |
| Utilities | 27,132,933 | 27,132,933 | -- | -- |
| Money Market Funds | 17,538,302 | 17,538,302 | -- | -- |
| Total Investments in Securities: | $980,839,143 | $596,210,849 | $384,518,149 | $110,145 |
The following is a summary of transfers between Level 1 and Level 2 for the period ended October 31, 2017. Transfers are assumed to have occurred at the beginning of the period, and are primarily attributable to the valuation techniques used for foreign equity securities, as discussed in the accompanying Notes to Financial Statements:
| Transfers | Total |
| Level 1 to Level 2 | $152,064,554 |
| Level 2 to Level 1 | $7,869,143 |
See accompanying notes which are an integral part of the financial statements.
Fidelity® Pacific Basin Fund
Financial Statements
Statement of Assets and Liabilities
| | | October 31, 2017 |
| Assets | | |
Investment in securities, at value (including securities loaned of $3,794,279) — See accompanying schedule:
Unaffiliated issuers (cost $689,196,044) | $963,300,841 | |
| Fidelity Central Funds (cost $17,538,114) | 17,538,302 | |
| Total Investment in Securities (cost $706,734,158) | | $980,839,143 |
| Foreign currency held at value (cost $17,167) | | 17,167 |
| Receivable for investments sold | | 1,012,316 |
| Receivable for fund shares sold | | 1,442,870 |
| Dividends receivable | | 1,769,404 |
| Distributions receivable from Fidelity Central Funds | | 19,478 |
| Prepaid expenses | | 1,992 |
| Other receivables | | 36,713 |
| Total assets | | 985,139,083 |
| Liabilities | | |
| Payable for investments purchased | | |
| Regular delivery | $1,757,228 | |
| Delayed delivery | 799,416 | |
| Payable for fund shares redeemed | 669,325 | |
| Accrued management fee | 671,462 | |
| Other affiliated payables | 165,808 | |
| Other payables and accrued expenses | 1,866,240 | |
| Collateral on securities loaned | 3,950,595 | |
| Total liabilities | | 9,880,074 |
| Net Assets | | $975,259,009 |
| Net Assets consist of: | | |
| Paid in capital | | $667,757,015 |
| Undistributed net investment income | | 6,368,166 |
| Accumulated undistributed net realized gain (loss) on investments and foreign currency transactions | | 28,786,367 |
| Net unrealized appreciation (depreciation) on investments and assets and liabilities in foreign currencies | | 272,347,461 |
| Net Assets, for 27,450,904 shares outstanding | | $975,259,009 |
| Net Asset Value, offering price and redemption price per share ($975,259,009 ÷ 27,450,904 shares) | | $35.53 |
See accompanying notes which are an integral part of the financial statements.
Statement of Operations
| | | Year ended October 31, 2017 |
| Investment Income | | |
| Dividends | | $16,427,382 |
| Income from Fidelity Central Funds | | 425,100 |
| Income before foreign taxes withheld | | 16,852,482 |
| Less foreign taxes withheld | | (1,328,698) |
| Total income | | 15,523,784 |
| Expenses | | |
| Management fee | | |
| Basic fee | $5,546,379 | |
| Performance adjustment | 1,227,184 | |
| Transfer agent fees | 1,373,371 | |
| Accounting and security lending fees | 384,495 | |
| Custodian fees and expenses | 201,107 | |
| Independent trustees' fees and expenses | 3,172 | |
| Registration fees | 31,532 | |
| Audit | 91,087 | |
| Legal | 1,803 | |
| Miscellaneous | 6,267 | |
| Total expenses before reductions | 8,866,397 | |
| Expense reductions | (35,056) | 8,831,341 |
| Net investment income (loss) | | 6,692,443 |
| Realized and Unrealized Gain (Loss) | | |
| Net realized gain (loss) on: | | |
| Investment securities: | | |
| Unaffiliated issuers | 37,269,991 | |
| Fidelity Central Funds | 1,015 | |
| Foreign currency transactions | (494,220) | |
| Total net realized gain (loss) | | 36,776,786 |
| Change in net unrealized appreciation (depreciation) on: | | |
| Unaffiliated issuers (net of increase in deferred foreign taxes of $1,702,382) | 155,586,189 | |
| Fidelity Central Funds | (1,902) | |
| Assets and liabilities in foreign currencies | 48,905 | |
| Total change in net unrealized appreciation (depreciation) | | 155,633,192 |
| Net gain (loss) | | 192,409,978 |
| Net increase (decrease) in net assets resulting from operations | | $199,102,421 |
See accompanying notes which are an integral part of the financial statements.
Statement of Changes in Net Assets
| | Year ended October 31, 2017 | Year ended October 31, 2016 |
| Increase (Decrease) in Net Assets | | |
| Operations | | |
| Net investment income (loss) | $6,692,443 | $5,670,296 |
| Net realized gain (loss) | 36,776,786 | 12,054,415 |
| Change in net unrealized appreciation (depreciation) | 155,633,192 | 55,378,405 |
| Net increase (decrease) in net assets resulting from operations | 199,102,421 | 73,103,116 |
| Distributions to shareholders from net investment income | (4,211,523) | (8,723,132) |
| Distributions to shareholders from net realized gain | (11,304,612) | (22,916,293) |
| Total distributions | (15,516,135) | (31,639,425) |
| Share transactions | | |
| Proceeds from sales of shares | 225,357,974 | 74,529,168 |
| Reinvestment of distributions | 14,752,829 | 30,030,138 |
| Cost of shares redeemed | (136,848,518) | (111,767,463) |
| Net increase (decrease) in net assets resulting from share transactions | 103,262,285 | (7,208,157) |
| Redemption fees | 92,091 | 30,553 |
| Total increase (decrease) in net assets | 286,940,662 | 34,286,087 |
| Net Assets | | |
| Beginning of period | 688,318,347 | 654,032,260 |
| End of period | $975,259,009 | $688,318,347 |
| Other Information | | |
| Undistributed net investment income end of period | $6,368,166 | $4,193,451 |
| Shares | | |
| Sold | 7,627,933 | 2,706,719 |
| Issued in reinvestment of distributions | 557,552 | 1,147,503 |
| Redeemed | (4,620,784) | (4,183,480) |
| Net increase (decrease) | 3,564,701 | (329,258) |
See accompanying notes which are an integral part of the financial statements.
Financial Highlights
Fidelity Pacific Basin Fund
| Years ended October 31, | 2017 | 2016 | 2015 | 2014 | 2013 |
| Selected Per–Share Data | | | | | |
| Net asset value, beginning of period | $28.82 | $27.01 | $28.92 | $31.47 | $24.85 |
| Income from Investment Operations | | | | | |
| Net investment income (loss)A | .25 | .24 | .37B | .31 | .12 |
| Net realized and unrealized gain (loss) | 7.09 | 2.88 | (.49) | 1.25 | 7.26 |
| Total from investment operations | 7.34 | 3.12 | (.12) | 1.56 | 7.38 |
| Distributions from net investment income | (.17) | (.36) | (.18) | (.18) | (.29) |
| Distributions from net realized gain | (.46) | (.95) | (1.61) | (3.93) | (.47) |
| Total distributions | (.63) | (1.31) | (1.79) | (4.11) | (.76) |
| Redemption fees added to paid in capitalA,C | – | – | – | – | – |
| Net asset value, end of period | $35.53 | $28.82 | $27.01 | $28.92 | $31.47 |
| Total ReturnD | 26.22% | 12.05% | (.29)% | 5.68% | 30.58% |
| Ratios to Average Net AssetsE,F | | | | | |
| Expenses before reductions | 1.11% | 1.19% | 1.17% | 1.18% | 1.23% |
| Expenses net of fee waivers, if any | 1.11% | 1.19% | 1.17% | 1.18% | 1.22% |
| Expenses net of all reductions | 1.10% | 1.19% | 1.17% | 1.18% | 1.21% |
| Net investment income (loss) | .84% | .87% | 1.34%B | 1.09% | .42% |
| Supplemental Data | | | | | |
| Net assets, end of period (000 omitted) | $975,259 | $688,318 | $654,032 | $697,202 | $719,675 |
| Portfolio turnover rateG | 36% | 30% | 36% | 30% | 82% |
A Calculated based on average shares outstanding during the period.
B Net Investment income per share reflects a large, non-recurring dividend which amounted to $.10 per share. Excluding this non-recurring dividend, the ratio of net investment income (loss) to average net assets would have been .99%.
C Amount represents less than $.005 per share.
D Total returns would have been lower if certain expenses had not been reduced during the applicable periods shown.
E Fees and expenses of any underlying Fidelity Central Funds are not included in the Fund's expense ratio. The Fund indirectly bears its proportionate share of the expenses of any underlying Fidelity Central Funds.
F Expense ratios reflect operating expenses of the Fund. Expenses before reductions do not reflect amounts reimbursed by the investment adviser or reductions from brokerage service arrangements or reductions from other expense offset arrangements and do not represent the amount paid by the Fund during periods when reimbursements or reductions occur. Expenses net of fee waivers reflect expenses after reimbursement by the investment adviser but prior to reductions from brokerage service arrangements or other expense offset arrangements. Expenses net of all reductions represent the net expenses paid by the Fund.
G Amount does not include the portfolio activity of any underlying Fidelity Central Funds.
See accompanying notes which are an integral part of the financial statements.
Notes to Financial Statements
For the period ended October 31, 2017
1. Organization.
Fidelity Pacific Basin Fund (the Fund) is a fund of Fidelity Investment Trust (the Trust) and is authorized to issue an unlimited number of shares. Share transactions on the Statement of Changes in Net Assets may contain exchanges between affiliated funds. The Trust is registered under the Investment Company Act of 1940, as amended (the 1940 Act), as an open-end management investment company organized as a Massachusetts business trust. The Fund's investments in emerging markets can be subject to social, economic, regulatory, and political uncertainties and can be extremely volatile.
2. Investments in Fidelity Central Funds.
The Fund invests in Fidelity Central Funds, which are open-end investment companies generally available only to other investment companies and accounts managed by the investment adviser and its affiliates. The Fund's Schedule of Investments lists each of the Fidelity Central Funds held as of period end, if any, as an investment of the Fund, but does not include the underlying holdings of each Fidelity Central Fund. As an Investing Fund, the Fund indirectly bears its proportionate share of the expenses of the underlying Fidelity Central Funds.
The Money Market Central Funds seek preservation of capital and current income and are managed by Fidelity Investments Money Management, Inc. (FIMM), an affiliate of the investment adviser. Annualized expenses of the Money Market Central Funds as of their most recent shareholder report date are less than .005%.
A complete unaudited list of holdings for each Fidelity Central Fund is available upon request or at the Securities and Exchange Commission (the SEC) website at www.sec.gov. In addition, the financial statements of the Fidelity Central Funds, which are not covered by the Fund's Report of Independent Registered Public Accounting Firm, are available on the SEC website or upon request.
3. Significant Accounting Policies.
The Fund is an investment company and applies the accounting and reporting guidance of the Financial Accounting Standards Board (FASB) Accounting Standards Codification Topic 946 Financial Services – Investments Companies. The financial statements have been prepared in conformity with accounting principles generally accepted in the United States of America (GAAP), which require management to make certain estimates and assumptions at the date of the financial statements. Actual results could differ from those estimates. Subsequent events, if any, through the date that the financial statements were issued have been evaluated in the preparation of the financial statements. The following summarizes the significant accounting policies of the Fund:
Investment Valuation. Investments are valued as of 4:00 p.m. Eastern time on the last calendar day of the period. The Board of Trustees (the Board) has delegated the day to day responsibility for the valuation of the Fund's investments to the Fair Value Committee (the Committee) established by the Fund's investment adviser. In accordance with valuation policies and procedures approved by the Board, the Fund attempts to obtain prices from one or more third party pricing vendors or brokers to value its investments. When current market prices, quotations or currency exchange rates are not readily available or reliable, investments will be fair valued in good faith by the Committee, in accordance with procedures adopted by the Board. Factors used in determining fair value vary by investment type and may include market or investment specific events. The frequency with which these procedures are used cannot be predicted and they may be utilized to a significant extent. The Committee oversees the Fund's valuation policies and procedures and reports to the Board on the Committee's activities and fair value determinations. The Board monitors the appropriateness of the procedures used in valuing the Fund's investments and ratifies the fair value determinations of the Committee.
The Fund categorizes the inputs to valuation techniques used to value its investments into a disclosure hierarchy consisting of three levels as shown below:
- Level 1 – quoted prices in active markets for identical investments
- Level 2 – other significant observable inputs (including quoted prices for similar investments, interest rates, prepayment speeds, etc.)
- Level 3 – unobservable inputs (including the Fund's own assumptions based on the best information available)
Valuation techniques used to value the Fund's investments by major category are as follows:
Equity securities, including restricted securities, for which market quotations are readily available, are valued at the last reported sale price or official closing price as reported by a third party pricing vendor on the primary market or exchange on which they are traded and are categorized as Level 1 in the hierarchy. In the event there were no sales during the day or closing prices are not available, securities are valued at the last quoted bid price or may be valued using the last available price and are generally categorized as Level 2 in the hierarchy. For foreign equity securities, when market or security specific events arise, comparisons to the valuation of American Depositary Receipts (ADRs), futures contracts, Exchange-Traded Funds (ETFs) and certain indexes as well as quoted prices for similar securities may be used and would be categorized as Level 2 in the hierarchy. Utilizing these techniques may result in transfers between Level 1 and Level 2. For equity securities, including restricted securities, where observable inputs are limited, assumptions about market activity and risk are used and these securities may be categorized as Level 3 in the hierarchy.
Investments in open-end mutual funds, including the Fidelity Central Funds, are valued at their closing net asset value (NAV) each business day and are categorized as Level 1 in the hierarchy.
Changes in valuation techniques may result in transfers in or out of an assigned level within the disclosure hierarchy. The aggregate value of investments by input level as of October 31, 2017, including information on transfers between Levels 1 and 2, is included at the end of the Fund's Schedule of Investments.
Foreign Currency. The Fund may use foreign currency contracts to facilitate transactions in foreign-denominated securities. Gains and losses from these transactions may arise from changes in the value of the foreign currency or if the counterparties do not perform under the contracts' terms.
Foreign-denominated assets, including investment securities, and liabilities are translated into U.S. dollars at the exchange rates at period end. Purchases and sales of investment securities, income and dividends received and expenses denominated in foreign currencies are translated into U.S. dollars at the exchange rate in effect on the transaction date.
The effects of exchange rate fluctuations on investments are included with the net realized and unrealized gain (loss) on investment securities. Other foreign currency transactions resulting in realized and unrealized gain (loss) are disclosed separately.
Investment Transactions and Income. For financial reporting purposes, the Fund's investment holdings and NAV include trades executed through the end of the last business day of the period. The NAV per share for processing shareholder transactions is calculated as of the close of business of the New York Stock Exchange (NYSE), normally 4:00 p.m. Eastern time and includes trades executed through the end of the prior business day. Gains and losses on securities sold are determined on the basis of identified cost and includes proceeds received from litigation. Dividend income is recorded on the ex-dividend date, except for certain dividends from foreign securities where the ex-dividend date may have passed, which are recorded as soon as the Fund is informed of the ex-dividend date. Non-cash dividends included in dividend income, if any, are recorded at the fair market value of the securities received. Income and capital gain distributions from Fidelity Central Funds, if any, are recorded on the ex-dividend date. Investment income is recorded net of foreign taxes withheld where recovery of such taxes is uncertain.
Expenses. Expenses directly attributable to a fund are charged to that fund. Expenses attributable to more than one fund are allocated among the respective funds on the basis of relative net assets or other appropriate methods. Expense estimates are accrued in the period to which they relate and adjustments are made when actual amounts are known.
Income Tax Information and Distributions to Shareholders. Each year, the Fund intends to qualify as a regulated investment company under Subchapter M of the Internal Revenue Code, including distributing substantially all of its taxable income and realized gains. As a result, no provision for U.S. Federal income taxes is required. As of October 31, 2017, the Fund did not have any unrecognized tax benefits in the financial statements; nor is the Fund aware of any tax positions for which it is reasonably possible that the total amounts of unrecognized tax benefits will significantly change in the next twelve months. The Fund files a U.S. federal tax return, in addition to state and local tax returns as required. The Fund's federal income tax returns are subject to examination by the Internal Revenue Service (IRS) for a period of three fiscal years after they are filed. State and local tax returns may be subject to examination for an additional fiscal year depending on the jurisdiction. Foreign taxes are provided for based on the Fund's understanding of the tax rules and rates that exist in the foreign markets in which it invests. The Fund is subject to a tax imposed on capital gains by certain countries in which it invests. An estimated deferred tax liability for net unrealized appreciation on the applicable securities is included in Other payables and accrued expenses on the Statement of Assets & Liabilities.
Distributions are declared and recorded on the ex-dividend date. Income and capital gain distributions are determined in accordance with income tax regulations, which may differ from GAAP. In addition, the Fund claimed a portion of the payment made to redeeming shareholders as a distribution for income tax purposes.
Capital accounts within the financial statements are adjusted for permanent book-tax differences. These adjustments have no impact on net assets or the results of operations. Capital accounts are not adjusted for temporary book-tax differences which will reverse in a subsequent period.
Book-tax differences are primarily due to foreign currency transactions, passive foreign investment companies (PFIC), deferred trustees compensation and losses deferred due to wash sales.
As of period end, the cost and unrealized appreciation (depreciation) in securities, and derivatives if applicable, for federal income tax purposes were as follows:
| Gross unrealized appreciation | $297,175,115 |
| Gross unrealized depreciation | (30,826,705) |
| Net unrealized appreciation (depreciation) | $266,348,410 |
| Tax Cost | $714,490,733 |
The tax-based components of distributable earnings as of period end were as follows:
| Undistributed ordinary income | $10,731,213 |
| Undistributed long-term capital gain | $32,182,990 |
| Net unrealized appreciation (depreciation) on securities and other investments | $266,321,040 |
The tax character of distributions paid was as follows:
| | October 31, 2017 | October 31, 2016 |
| Ordinary Income | $7,930,470 | $ 8,723,132 |
| Long-term Capital Gains | 7,585,665 | 22,916,293 |
| Total | $15,516,135 | $ 31,639,425 |
Short-Term Trading (Redemption) Fees. Shares held by investors in the Fund less than 90 days may have been subject to a redemption fee equal to 1.50% of the NAV of shares redeemed. All redemption fees, which reduce the proceeds of the shareholder redemption, are retained by the Fund and accounted for as an addition to paid in capital. In November 2017, the Board of Trustees approved the elimination of these redemption fees effective December 18, 2017.
Delayed Delivery Transactions and When-Issued Securities. During the period, the Fund transacted in securities on a delayed delivery or when-issued basis. Payment and delivery may take place after the customary settlement period for that security. The price of the underlying securities and the date when the securities will be delivered and paid for are fixed at the time the transaction is negotiated. The securities purchased on a delayed delivery or when-issued basis are identified as such in the Fund's Schedule of Investments. The Fund may receive compensation for interest forgone in the purchase of a delayed delivery or when-issued security. With respect to purchase commitments, the Fund identifies securities as segregated in its records with a value at least equal to the amount of the commitment. Losses may arise due to changes in the value of the underlying securities or if the counterparty does not perform under the contract's terms, or if the issuer does not issue the securities due to political, economic, or other factors.
4. Purchases and Sales of Investments.
Purchases and sales of securities, other than short-term securities, aggregated $366,461,811 and $282,167,313, respectively.
5. Fees and Other Transactions with Affiliates.
Management Fee. Fidelity Management & Research Company (the investment adviser) and its affiliates provide the Fund with investment management related services for which the Fund pays a monthly management fee. The management fee is the sum of an individual fund fee rate that is based on an annual rate of .45% of the Fund's average net assets and an annualized group fee rate that averaged .25% during the period. The group fee rate is based upon the average net assets of all the mutual funds advised by the investment adviser, including any mutual funds previously advised by the investment adviser that are currently advised by Fidelity SelectCo, LLC, an affiliate of the investment adviser. The group fee rate decreases as assets under management increase and increases as assets under management decrease. In addition, the management fee is subject to a performance adjustment (up to a maximum of +/- .20% of the Fund's average net assets over a 36 month performance period). The upward or downward adjustment to the management fee is based on the Fund's relative investment performance as compared to its benchmark index, the MSCI All Country Pacific Index, over the same 36 month performance period. For the reporting period, the total annual management fee rate, including the performance adjustment, was .85% of the Fund's average net assets. The performance adjustment included in the management fee rate may be higher or lower than the maximum performance adjustment rate due to the difference between the average net assets for the reporting and performance periods.
Transfer Agent Fees. Fidelity Investments Institutional Operations Company, Inc. (FIIOC), an affiliate of the investment adviser, is the Fund's transfer, dividend disbursing and shareholder servicing agent. FIIOC receives account fees and asset-based fees that vary according to account size and type of account. FIIOC pays for typesetting, printing and mailing of shareholder reports, except proxy statements. For the period, the transfer agent fees were equivalent to an annual rate of .17% of average net assets.
Accounting and Security Lending Fees. Fidelity Service Company, Inc. (FSC), an affiliate of the investment adviser, maintains the Fund's accounting records. The accounting fee is based on the level of average net assets for each month. Under a separate contract, FSC administers the security lending program. The security lending fee is based on the number and duration of lending transactions.
Brokerage Commissions. The Fund placed a portion of its portfolio transactions with brokerage firms which are affiliates of the investment adviser. Brokerage commissions are included in net realized gain (loss) and change in net unrealized appreciation (depreciation) in the Statement of Operations. The commissions paid to these affiliated firms were $414 for the period.
Interfund Trades. The Fund may purchase from or sell securities to other Fidelity Funds under procedures adopted by the Board. The procedures have been designed to ensure these interfund trades are executed in accordance with Rule 17a-7 of the 1940 Act. Interfund trades are included within the respective purchases and sales amounts shown in the Purchases and Sales of Investments note.
6. Committed Line of Credit.
The Fund participates with other funds managed by the investment adviser or an affiliate in a $4.25 billion credit facility (the "line of credit") to be utilized for temporary or emergency purposes to fund shareholder redemptions or for other short-term liquidity purposes. The Fund has agreed to pay commitment fees on its pro-rata portion of the line of credit, which amounted to $2,457 and is reflected in Miscellaneous expenses on the Statement of Operations. During the period, the Fund did not borrow on this line of credit.
7. Security Lending.
The Fund lends portfolio securities through a lending agent from time to time in order to earn additional income. For equity securities, a lending agent is used and may loan securities to certain qualified borrowers, including Fidelity Capital Markets (FCM), a broker-dealer affiliated with the Fund. On the settlement date of the loan, the Fund receives collateral (in the form of U.S. Treasury obligations, letters of credit and/or cash) against the loaned securities and maintains collateral in an amount not less than 100% of the market value of the loaned securities during the period of the loan. The market value of the loaned securities is determined at the close of business of the Fund and any additional required collateral is delivered to the Fund on the next business day. The Fund or borrower may terminate the loan at any time, and if the borrower defaults on its obligation to return the securities loaned because of insolvency or other reasons, the Fund may apply collateral received from the borrower against the obligation. The Fund may experience delays and costs in recovering the securities loaned. Any cash collateral received is invested in the Fidelity Securities Lending Cash Central Fund. The value of loaned securities and cash collateral at period end are disclosed on the Fund's Statement of Assets and Liabilities. At period end, there were no security loans outstanding with FCM. Security lending income represents the income earned on investing cash collateral, less rebates paid to borrowers and any lending agent fees associated with the loan, plus any premium payments received for lending certain types of securities. Security lending income is presented in the Statement of Operations as a component of income from Fidelity Central Funds. Total security lending income during the period amounted to $280,773, including $250 from securities loaned to FCM.
8. Expense Reductions.
Commissions paid to certain brokers with whom the investment adviser, or its affiliates, places trades on behalf of the Fund include an amount in addition to trade execution, which may be rebated back to the Fund to offset certain expenses. This amount totaled $29,007 for the period. In addition, through arrangements with the Fund's custodian, credits realized as a result of certain uninvested cash balances were used to reduce the Fund's expenses. During the period, these credits reduced the Fund's custody expenses by $44.
In addition, during the period the investment adviser reimbursed and/or waived a portion of operating expenses in the amount of $6,005.
9. Other.
The Fund's organizational documents provide former and current trustees and officers with a limited indemnification against liabilities arising in connection with the performance of their duties to the Fund. In the normal course of business, the Fund may also enter into contracts that provide general indemnifications. The Fund's maximum exposure under these arrangements is unknown as this would be dependent on future claims that may be made against the Fund. The risk of material loss from such claims is considered remote.
At the end of the period, Strategic Advisers International II Fund was the owner of record of approximately 16% of the total outstanding shares of the Fund. Mutual funds managed by the investment adviser or its affiliates were the owners of record, in the aggregate, of approximately 24% of the total outstanding shares of the Fund.
Report of Independent Registered Public Accounting Firm
To the Trustees of Fidelity Investment Trust and the Shareholders of Fidelity Canada Fund, Fidelity China Region Fund, Fidelity Emerging Asia Fund, Fidelity Emerging Markets Fund, Fidelity Europe Fund, Fidelity Japan Fund, Fidelity Japan Smaller Companies Fund, Fidelity Latin America Fund, Fidelity Nordic Fund and Fidelity Pacific Basin Fund:
In our opinion, the accompanying statements of assets and liabilities, including the schedules of investments, and the related statements of operations and of changes in net assets and the financial highlights present fairly, in all material respects, the financial position of Fidelity Canada Fund, Fidelity China Region Fund, Fidelity Emerging Asia Fund, Fidelity Emerging Markets Fund, Fidelity Europe Fund, Fidelity Japan Fund, Fidelity Japan Smaller Companies Fund, Fidelity Latin America Fund, Fidelity Nordic Fund and Fidelity Pacific Basin Fund (each a fund of Fidelity Investment Trust) (the"Funds") as of October 31, 2017, the results of each of their operations for the year then ended, the changes in each of their net assets for each of the two years in the period then ended and the financial highlights for each of the five years in the period then ended, in conformity with accounting principles generally accepted in the United States of America. These financial statements and financial highlights (hereafter referred to as “financial statements”) are the responsibility of the Funds' management. Our responsibility is to express an opinion on these financial statements based on our audits. We conducted our audits of these financial statements in accordance with the standards of the Public Company Accounting Oversight Board (United States). Those standards require that we plan and perform the audit to obtain reasonable assurance about whether the financial statements are free of material misstatement. An audit includes examining, on a test basis, evidence supporting the amounts and disclosures in the financial statements, assessing the accounting principles used and significant estimates made by management, and evaluating the overall financial statement presentation. Our procedures included confirmation of securities owned as of October 31, 2017 by correspondence with the custodians and brokers; when replies were not received from brokers, we performed other auditing procedures. We believe that our audits provide a reasonable basis for our opinion.
PricewaterhouseCoopers LLP
Boston, Massachusetts
December 18, 2017
Trustees and Officers
The Trustees, Members of the Advisory Board (if any), and officers of the trust and funds, as applicable, are listed below. The Board of Trustees governs each fund and is responsible for protecting the interests of shareholders. The Trustees are experienced executives who meet periodically throughout the year to oversee each fund's activities, review contractual arrangements with companies that provide services to each fund, oversee management of the risks associated with such activities and contractual arrangements, and review each fund's performance. Except for Jonathan Chiel, each of the Trustees oversees 190 funds. Mr Chiel oversees 143 funds.
The Trustees hold office without limit in time except that (a) any Trustee may resign; (b) any Trustee may be removed by written instrument, signed by at least two-thirds of the number of Trustees prior to such removal; (c) any Trustee who requests to be retired or who has become incapacitated by illness or injury may be retired by written instrument signed by a majority of the other Trustees; and (d) any Trustee may be removed at any special meeting of shareholders by a two-thirds vote of the outstanding voting securities of the trust. Each Trustee who is not an interested person (as defined in the 1940 Act) of the trust and the funds is referred to herein as an Independent Trustee. Each Independent Trustee shall retire not later than the last day of the calendar year in which his or her 75th birthday occurs. The Independent Trustees may waive this mandatory retirement age policy with respect to individual Trustees. Officers and Advisory Board Members hold office without limit in time, except that any officer or Advisory Board Member may resign or may be removed by a vote of a majority of the Trustees at any regular meeting or any special meeting of the Trustees. Except as indicated, each individual has held the office shown or other offices in the same company for the past five years.
Each fund’s Statement of Additional Information (SAI) includes more information about the Trustees. To request a free copy, call Fidelity at 1-800-544-8544.
Experience, Skills, Attributes, and Qualifications of the Trustees. The Governance and Nominating Committee has adopted a statement of policy that describes the experience, qualifications, attributes, and skills that are necessary and desirable for potential Independent Trustee candidates (Statement of Policy). The Board believes that each Trustee satisfied at the time he or she was initially elected or appointed a Trustee, and continues to satisfy, the standards contemplated by the Statement of Policy. The Governance and Nominating Committee also engages professional search firms to help identify potential Independent Trustee candidates who have the experience, qualifications, attributes, and skills consistent with the Statement of Policy. From time to time, additional criteria based on the composition and skills of the current Independent Trustees, as well as experience or skills that may be appropriate in light of future changes to board composition, business conditions, and regulatory or other developments, have also been considered by the professional search firms and the Governance and Nominating Committee. In addition, the Board takes into account the Trustees' commitment and participation in Board and committee meetings, as well as their leadership of standing and ad hoc committees throughout their tenure.
In determining that a particular Trustee was and continues to be qualified to serve as a Trustee, the Board has considered a variety of criteria, none of which, in isolation, was controlling. The Board believes that, collectively, the Trustees have balanced and diverse experience, qualifications, attributes, and skills, which allow the Board to operate effectively in governing each fund and protecting the interests of shareholders. Information about the specific experience, skills, attributes, and qualifications of each Trustee, which in each case led to the Board's conclusion that the Trustee should serve (or continue to serve) as a trustee of the funds, is provided below.
Board Structure and Oversight Function. James C. Curvey is an interested person and currently serves as Chairman. The Trustees have determined that an interested Chairman is appropriate and benefits shareholders because an interested Chairman has a personal and professional stake in the quality and continuity of services provided to the funds. Independent Trustees exercise their informed business judgment to appoint an individual of their choosing to serve as Chairman, regardless of whether the Trustee happens to be independent or a member of management. The Independent Trustees have determined that they can act independently and effectively without having an Independent Trustee serve as Chairman and that a key structural component for assuring that they are in a position to do so is for the Independent Trustees to constitute a substantial majority for the Board. The Independent Trustees also regularly meet in executive session. Ned C. Lautenbach serves as Chairman of the Independent Trustees and as such (i) acts as a liaison between the Independent Trustees and management with respect to matters important to the Independent Trustees and (ii) with management prepares agendas for Board meetings.
Fidelity® funds are overseen by different Boards of Trustees. The funds' Board oversees Fidelity's high income and certain equity funds, and other Boards oversee Fidelity's investment-grade bond, money market, asset allocation, and sector funds. The asset allocation funds may invest in Fidelity® funds overseen by the funds' Board. The use of separate Boards, each with its own committee structure, allows the Trustees of each group of Fidelity® funds to focus on the unique issues of the funds they oversee, including common research, investment, and operational issues. On occasion, the separate Boards establish joint committees to address issues of overlapping consequences for the Fidelity® funds overseen by each Board.
The Trustees operate using a system of committees to facilitate the timely and efficient consideration of all matters of importance to the Trustees, each fund, and fund shareholders and to facilitate compliance with legal and regulatory requirements and oversight of the funds' activities and associated risks. The Board, acting through its committees, has charged FMR and its affiliates with (i) identifying events or circumstances the occurrence of which could have demonstrably adverse effects on the funds' business and/or reputation; (ii) implementing processes and controls to lessen the possibility that such events or circumstances occur or to mitigate the effects of such events or circumstances if they do occur; and (iii) creating and maintaining a system designed to evaluate continuously business and market conditions in order to facilitate the identification and implementation processes described in (i) and (ii) above. Because the day-to-day operations and activities of the funds are carried out by or through FMR, its affiliates, and other service providers, the funds' exposure to risks is mitigated but not eliminated by the processes overseen by the Trustees. While each of the Board's committees has responsibility for overseeing different aspects of the funds' activities, oversight is exercised primarily through the Operations, Audit, and Compliance Committees. In addition, the Independent Trustees have worked with FMR to enhance the Board's oversight of investment and financial risks, legal and regulatory risks, technology risks, and operational risks, including the development of additional risk reporting to the Board. For example, a working group comprised of Independent Trustees and FMR has worked and continues to work to review the Fidelity® funds' valuation-related activities, reporting and risk management. Appropriate personnel, including but not limited to the funds' Chief Compliance Officer (CCO), FMR's internal auditor, the independent accountants, the funds' Treasurer and portfolio management personnel, make periodic reports to the Board's committees, as appropriate, including an annual review of Fidelity's risk management program for the Fidelity® funds. The responsibilities of each standing committee, including their oversight responsibilities, are described further under "Standing Committees of the Trustees."
Interested Trustees*:
Correspondence intended for a Trustee who is an interested person may be sent to Fidelity Investments, 245 Summer Street, Boston, Massachusetts 02210.
Name, Year of Birth; Principal Occupations and Other Relevant Experience+
Jonathan Chiel (1957)
Year of Election or Appointment: 2016
Trustee
Mr. Chiel also serves as Trustee of other Fidelity® funds. Mr. Chiel is Executive Vice President and General Counsel for FMR LLC (diversified financial services company, 2012-present). Previously, Mr. Chiel served as general counsel (2004-2012) and senior vice president and deputy general counsel (2000-2004) for John Hancock Financial Services; a partner with Choate, Hall & Stewart (1996-2000) (law firm); and an Assistant United States Attorney for the United States Attorney’s Office of the District of Massachusetts (1986-95), including Chief of the Criminal Division (1993-1995). Mr. Chiel is a director on the boards of the Boston Bar Foundation and the Maimonides School.
James C. Curvey (1935)
Year of Election or Appointment: 2007
Trustee
Chairman of the Board of Trustees
Mr. Curvey also serves as Trustee of other Fidelity® funds. Mr. Curvey is a Director of Fidelity Research & Analysis Co. (investment adviser firm, 2009-present), and Vice Chairman (2007-present) and Director of FMR LLC (diversified financial services company). In addition, Mr. Curvey serves as an Overseer for the Boston Symphony Orchestra and a member of the board of Artis-Naples, Naples, Florida, and as a Trustee for Brewster Academy, Wolfeboro, New Hampshire. Previously, Mr. Curvey served as a Director of Fidelity Investments Money Management, Inc. (investment adviser firm, 2009-2014) and a Director of FMR and FMR Co., Inc. (investment adviser firms, 2007-2014).
Charles S. Morrison (1960)
Year of Election or Appointment: 2014
Trustee
Mr. Morrison also serves as Trustee of other funds. He serves as President of Fidelity Management & Research Company (FMR) (investment adviser firm, 2016-present), a Director of Fidelity Investments Money Management, Inc. (FIMM) (investment adviser firm, 2014-present), Director of Fidelity SelectCo, LLC (investment adviser firm, 2014-present), President, Asset Management (2014-present), and is an employee of Fidelity Investments. Previously, Mr. Morrison served as Vice President of Fidelity's Fixed Income and Asset Allocation Funds (2012-2014), President, Fixed Income (2011-2014), Vice President of Fidelity's Money Market Funds (2005-2009), President, Money Market Group Leader of FMR (investment adviser firm, 2009), and Senior Vice President, Money Market Group of FMR (2004-2009). Mr. Morrison also served as Vice President of Fidelity's Bond Funds (2002-2005), certain Balanced Funds (2002-2005), and certain Asset Allocation Funds (2002-2007), and as Senior Vice President (2002-2005) of Fidelity's Bond Division.
* Determined to be an “Interested Trustee” by virtue of, among other things, his or her affiliation with the trust or various entities under common control with FMR.
+ The information includes the Trustee's principal occupation during the last five years and other information relating to the experience, attributes, and skills relevant to the Trustee's qualifications to serve as a Trustee, which led to the conclusion that the Trustee should serve as a Trustee for each fund.
Independent Trustees:
Correspondence intended for an Independent Trustee may be sent to Fidelity Investments, P.O. Box 55235, Boston, Massachusetts 02205-5235.
Name, Year of Birth; Principal Occupations and Other Relevant Experience+
Dennis J. Dirks (1948)
Year of Election or Appointment: 2005
Trustee
Mr. Dirks also serves as Trustee of other Fidelity® funds. Prior to his retirement in May 2003, Mr. Dirks was Chief Operating Officer and a member of the Board of The Depository Trust & Clearing Corporation (DTCC). He also served as President, Chief Operating Officer, and Board member of The Depository Trust Company (DTC) and President and Board member of the National Securities Clearing Corporation (NSCC). In addition, Mr. Dirks served as Chief Executive Officer and Board member of the Government Securities Clearing Corporation, Chief Executive Officer and Board member of the Mortgage-Backed Securities Clearing Corporation, as a Trustee and a member of the Finance Committee of Manhattan College (2005-2008), as a Trustee and a member of the Finance Committee of AHRC of Nassau County (2006-2008), as a member of the Independent Directors Council (IDC) Governing Council (2010-2015), and as a member of the Board of Directors for The Brookville Center for Children’s Services, Inc. (2009-2017). Mr. Dirks is a member of the Finance Committee (2016-present) and Board of Directors (2017-present) of the Asolo Repertory Theatre.
Alan J. Lacy (1953)
Year of Election or Appointment: 2008
Trustee
Mr. Lacy also serves as Trustee of other Fidelity® funds. Mr. Lacy serves as a Director of Bristol-Myers Squibb Company (global pharmaceuticals, 2008-present). He is a Trustee of the California Chapter of The Nature Conservancy (2015-present) and a Director of the Center for Advanced Study in the Behavioral Sciences at Stanford University (2015-present). In addition, Mr. Lacy served as Senior Adviser (2007-2014) of Oak Hill Capital Partners, L.P. (private equity) and also served as Chief Executive Officer (2005) and Vice Chairman (2005-2006) of Sears Holdings Corporation (retail) and Chief Executive Officer and Chairman of the Board of Sears, Roebuck and Co. (retail, 2000-2005). Previously, Mr. Lacy served as Chairman (2014-2017) and a member (2010-2017) of the Board of Directors of Dave & Buster’s Entertainment, Inc. (restaurant and entertainment complexes), as Chairman (2008-2011) and a member (2006-2015) of the Board of Trustees of the National Parks Conservation Association, and as a member of the Board of Directors for The Hillman Companies, Inc. (hardware wholesalers, 2010-2014), Earth Fare, Inc. (retail grocery, 2010-2014), and The Western Union Company (global money transfer, 2006-2011).
Ned C. Lautenbach (1944)
Year of Election or Appointment: 2000
Trustee
Chairman of the Independent Trustees
Mr. Lautenbach also serves as Trustee of other Fidelity® funds. Mr. Lautenbach currently serves as Vice Chair of the Board of Governors, State University System of Florida (2013-present) and is a member of the Council on Foreign Relations (1994-present). He is also a member and has most recently served as Chairman of the Board of Directors of Artis-Naples (2012-present). Previously, Mr. Lautenbach served as a member and then Lead Director of the Board of Directors of Eaton Corporation (diversified industrial, 1997-2016). He was also a Partner and Advisory Partner at Clayton, Dubilier & Rice, LLC (private equity investment, 1998-2010), as well as a Director of Sony Corporation (2006-2007). In addition, Mr. Lautenbach also had a 30-year career with IBM (technology company) during which time he served as Senior Vice President and a member of the Corporate Executive Committee (1968-1998).
Joseph Mauriello (1944)
Year of Election or Appointment: 2008
Trustee
Mr. Mauriello also serves as Trustee of other Fidelity® funds. Prior to his retirement in January 2006, Mr. Mauriello served in numerous senior management positions including Deputy Chairman and Chief Operating Officer (2004-2005), and Vice Chairman of Financial Services (2002-2004) of KPMG LLP US (professional services, 1965-2005). Mr. Mauriello currently serves as a member of the Board of Directors of XL Group plc. (global insurance and re-insurance, 2006-present) and the Independent Directors Council (IDC) Governing Council (2015-present). Previously, Mr. Mauriello served as a Director of the Hamilton Funds of the Bank of New York (2006-2007) and of Arcadia Resources Inc. (health care services and products, 2007-2012).
Cornelia M. Small (1944)
Year of Election or Appointment: 2005
Trustee
Ms. Small also serves as Trustee of other Fidelity® funds. Ms. Small is a member of the Board of Directors (2009-present) and Chair of the Investment Committee (2010-present) of the Teagle Foundation. Ms. Small also serves on the Investment Committee of the Berkshire Taconic Community Foundation (2008-present). Previously, Ms. Small served as Chairperson (2002-2008) and a member of the Investment Committee and Chairperson (2008-2012) and a member of the Board of Trustees of Smith College. In addition, Ms. Small served as Chief Investment Officer, Director of Global Equity Investments, and a member of the Board of Directors of Scudder, Stevens & Clark and Scudder Kemper Investments.
William S. Stavropoulos (1939)
Year of Election or Appointment: 2001
Trustee
Vice Chairman of the Independent Trustees
Mr. Stavropoulos also serves as Trustee of other Fidelity® funds. Mr. Stavropoulos serves as President and Founder of the Michigan Baseball Foundation, the Great Lakes Loons (2007-present). Mr. Stavropoulos is Chairman Emeritus of the Board of Directors of The Dow Chemical Company, where he previously served in numerous senior management positions, including President, CEO (1995-2000; 2002-2004), Chairman of the Executive Committee (2000-2006), and as a member of the Board of Directors (1990-2006). Currently, Mr. Stavropoulos is Chairman of the Board of Directors of Univar Inc. (global distributor of commodity and specialty chemicals), a Director of Teradata Corporation (data warehousing and technology solutions), and a member of the Advisory Board for Metalmark Capital LLC (private equity investment, 2005-present). Mr. Stavropoulos is an operating advisor to Clayton, Dubilier & Rice, LLC (private equity investment). In addition, Mr. Stavropoulos is a member of the University of Notre Dame Advisory Council for the College of Science, a Trustee of the Rollin L. Gerstacker Foundation, and a Director of Artis-Naples in Naples, Florida. Previously, Mr. Stavropoulos served as a Director of Chemical Financial Corporation (bank holding company, 1993-2012) and Tyco International, Ltd. (multinational manufacturing and services, 2007-2012).
David M. Thomas (1949)
Year of Election or Appointment: 2008
Trustee
Mr. Thomas also serves as Trustee of other Fidelity® funds. Mr. Thomas serves as Non-Executive Chairman of the Board of Directors of Fortune Brands Home and Security (home and security products, 2011-present), as a member of the Board of Directors (2004-present) and Presiding Director (2013-present) of Interpublic Group of Companies, Inc. (marketing communication), and as a member of the Board of Trustees of the University of Florida (2013-present). Previously, Mr. Thomas served as Executive Chairman (2005-2006) and Chairman and Chief Executive Officer (2000-2005) of IMS Health, Inc. (pharmaceutical and healthcare information solutions), and a Director of Fortune Brands, Inc. (consumer products, 2000-2011).
+ The information includes the Trustee's principal occupation during the last five years and other information relating to the experience, attributes, and skills relevant to the Trustee's qualifications to serve as a Trustee, which led to the conclusion that the Trustee should serve as a Trustee for each fund.
Advisory Board Members and Officers:
Correspondence intended for an officer or Peter S. Lynch may be sent to Fidelity Investments, 245 Summer Street, Boston, Massachusetts 02210. Officers appear below in alphabetical order.
Name, Year of Birth; Principal Occupation
Peter S. Lynch (1944)
Year of Election or Appointment: 2003
Member of the Advisory Board
Mr. Lynch also serves as Member of the Advisory Board of other Fidelity® funds. Mr. Lynch is Vice Chairman and a Director of FMR (investment adviser firm) and FMR Co., Inc. (investment adviser firm). In addition, Mr. Lynch serves as a Trustee of Boston College and as the Chairman of the Inner-City Scholarship Fund. Previously, Mr. Lynch served on the Special Olympics International Board of Directors (1997-2006).
Elizabeth Paige Baumann (1968)
Year of Election or Appointment: 2017
Anti-Money Laundering (AML) Officer
Ms. Baumann also serves as AML Officer of other funds. She is Chief AML Officer (2012-present) and Senior Vice President (2014-present) of FMR LLC (diversified financial services company) and is an employee of Fidelity Investments. Previously, Ms. Baumann served as AML Officer of the funds (2012-2016), and Vice President (2007-2014) and Deputy Anti-Money Laundering Officer (2007-2012) of FMR LLC.
Marc R. Bryant (1966)
Year of Election or Appointment: 2015
Secretary and Chief Legal Officer (CLO)
Mr. Bryant also serves as Secretary and CLO of other funds. Mr. Bryant serves as CLO, Secretary, and Senior Vice President of Fidelity Management & Research Company (investment adviser firm, 2015-present) and FMR Co., Inc. (investment adviser firm, 2015-present); Secretary of Fidelity SelectCo, LLC (investment adviser firm, 2015-present) and Fidelity Investments Money Management, Inc. (investment adviser firm, 2015-present); and CLO of Fidelity Management & Research (Hong Kong) Limited and FMR Investment Management (UK) Limited (investment adviser firms, 2015-present) and Fidelity Management & Research (Japan) Limited (investment adviser firm, 2016-present). He is Senior Vice President and Deputy General Counsel of FMR LLC (diversified financial services company). Previously, Mr. Bryant served as Secretary and CLO of Fidelity Rutland Square Trust II (2010-2014) and Assistant Secretary of Fidelity's Fixed Income and Asset Allocation Funds (2013-2015). Prior to joining Fidelity Investments, Mr. Bryant served as a Senior Vice President and the Head of Global Retail Legal for AllianceBernstein L.P. (2006-2010), and as the General Counsel for ProFund Advisors LLC (2001-2006).
William C. Coffey (1969)
Year of Election or Appointment: 2009
Assistant Secretary
Mr. Coffey also serves as Assistant Secretary of other funds. He is Senior Vice President and Deputy General Counsel of FMR LLC (diversified financial services company, 2010-present), and is an employee of Fidelity Investments. Previously, Mr. Coffey served as Vice President and Associate General Counsel of FMR LLC (2005-2009).
Jonathan Davis (1968)
Year of Election or Appointment: 2010
Assistant Treasurer
Mr. Davis also serves as Assistant Treasurer of other funds, and is an employee of Fidelity Investments. Previously, Mr. Davis served as Vice President and Associate General Counsel of FMR LLC (diversified financial services company, 2003-2010).
Adrien E. Deberghes (1967)
Year of Election or Appointment: 2016
Assistant Treasurer
Mr. Deberghes also serves as an officer of other funds. He serves as Executive Vice President of Fidelity Investments Money Management, Inc. (FIMM) (investment adviser firm, 2016-present) and is an employee of Fidelity Investments (2008-present). Prior to joining Fidelity Investments, Mr. Deberghes was Senior Vice President of Mutual Fund Administration at State Street Corporation (2007-2008), Senior Director of Mutual Fund Administration at Investors Bank & Trust (2005-2007), and Director of Finance for Dunkin' Brands (2000-2005). Previously, Mr. Deberghes served in other fund officer roles.
Joseph DeSantis (1959)
Year of Election or Appointment: 2017
Vice President
Mr. DeSantis also serves as Vice President of other funds. Mr. DeSantis serves as a Director of Fidelity Management & Research (Japan) Limited (investment adviser firm, 2016-present), Chief Investment Officer, Equities (2010-present) and is an employee of Fidelity Investments.
Stephanie J. Dorsey (1969)
Year of Election or Appointment: 2010
Assistant Treasurer
Ms. Dorsey also serves as an officer of other funds. She is an employee of Fidelity Investments (2008-present) and has served in other fund officer roles. Prior to joining Fidelity Investments, Ms. Dorsey served as Treasurer (2004-2008) of the JPMorgan Mutual Funds and Vice President (2004-2008) of JPMorgan Chase Bank.
Howard J. Galligan III (1966)
Year of Election or Appointment: 2014
Chief Financial Officer
Mr. Galligan also serves as Chief Financial Officer of other funds. Mr. Galligan serves as President of Fidelity Pricing and Cash Management Services (FPCMS) (2014-present) and as a Director of Strategic Advisers, Inc. (investment adviser firm, 2008-present). Previously, Mr. Galligan served as Chief Administrative Officer of Asset Management (2011-2014) and Chief Operating Officer and Senior Vice President of Investment Support for Strategic Advisers, Inc. (2003-2011).
Brian B. Hogan (1964)
Year of Election or Appointment: 2009
Vice President
Mr. Hogan also serves as Trustee or Vice President of other funds. Mr. Hogan serves as a Director of FMR Investment Management (UK) Limited (investment adviser firm, 2015-present) and Fidelity SelectCo, LLC (investment adviser firm, 2014-present) and President of the Equity Division of FMR (investment adviser firm, 2009-present). Previously, Mr. Hogan served as Senior Vice President, Equity Research of FMR (2006-2009) and as a portfolio manager. Mr. Brian B. Hogan is not related to Mr. Colm A. Hogan.
Colm A. Hogan (1973)
Year of Election or Appointment: 2016
Deputy Treasurer
Mr. Hogan also serves as an officer of other funds. Mr. Hogan is an employee of Fidelity Investments (2005-present). Mr. Colm A. Hogan is not related to Mr. Brian B. Hogan.
Chris Maher (1972)
Year of Election or Appointment: 2013
Assistant Treasurer
Mr. Maher serves as Assistant Treasurer of other funds. Mr. Maher is Vice President of Valuation Oversight and is an employee of Fidelity Investments. Previously, Mr. Maher served as Vice President of Asset Management Compliance (2013), Vice President of the Program Management Group of FMR (investment adviser firm, 2010-2013), and Vice President of Valuation Oversight (2008-2010).
Rieco E. Mello (1969)
Year of Election or Appointment: 2017
Assistant Treasurer
Mr. Mello also serves as Assistant Treasurer of other funds. Mr. Mello is an employee of Fidelity Investments (1995-present).
Kenneth B. Robins (1969)
Year of Election or Appointment: 2016
Chief Compliance Officer
Mr. Robins also serves as an officer of other funds. Mr. Robins serves as Compliance Officer of Fidelity Management & Research Company and FMR Co., Inc. (investment adviser firms, 2016-present) and is an employee of Fidelity Investments (2004-present). Previously, Mr. Robins served as Executive Vice President of Fidelity Investments Money Management, Inc. (investment adviser firm, 2013-2016) and served in other fund officer roles.
Stacie M. Smith (1974)
Year of Election or Appointment: 2016
President and Treasurer
Ms. Smith also serves as an officer of other funds. She is an employee of Fidelity Investments (2009-present) and has served in other fund officer roles. Prior to joining Fidelity Investments, Ms. Smith served as Senior Audit Manager of Ernst & Young LLP (accounting firm, 1996-2009). Previously, Ms. Smith served as Deputy Treasurer of certain Fidelity® funds (2013-2016).
Marc L. Spector (1972)
Year of Election or Appointment: 2016
Assistant Treasurer
Mr. Spector also serves as an officer of other funds. Mr. Spector is an employee of Fidelity Investments (2016-present). Prior to joining Fidelity Investments, Mr. Spector served as Director at the Siegfried Group (accounting firm, 2013-2016), and prior to Siegfried Group as audit senior manager at Deloitte & Touche (accounting firm, 2005-2013).
Renee Stagnone (1975)
Year of Election or Appointment: 2016
Assistant Treasurer
Ms. Stagnone also serves as an officer of other funds. Ms. Stagnone is an employee of Fidelity Investments (1997-present). Previously, Ms. Stagnone served as Deputy Treasurer of certain Fidelity® funds (2013-2016).
Shareholder Expense Example
As a shareholder of the Fund, you incur two types of costs: (1) transaction costs, including sales charges (loads) on purchase payments or redemption proceeds, redemption fees and (2) ongoing costs, including management fees, distribution and/or service (12b-1) fees and other Fund expenses. This Example is intended to help you understand your ongoing costs (in dollars) of investing in the Fund and to compare these costs with the ongoing costs of investing in other mutual funds.
The Example is based on an investment of $1,000 invested at the beginning of the period and held for the entire period (May 1, 2017 to October 31, 2017).
Actual Expenses
The first line of the accompanying table for each class of the Fund provides information about actual account values and actual expenses. You may use the information in this line, together with the amount you invested, to estimate the expenses that you paid over the period. Simply divide your account value by $1,000.00 (for example, an $8,600 account value divided by $1,000.00 = 8.6), then multiply the result by the number in the first line for a class of the Fund under the heading entitled "Expenses Paid During Period" to estimate the expenses you paid on your account during this period. A small balance maintenance fee of $12.00 that is charged once a year may apply for certain accounts with a value of less than $2,000. This fee is not included in the table below. If it was, the estimate of expenses you paid during the period would be higher, and your ending account value lower, by this amount. In addition, the Fund, as a shareholder in the underlying Fidelity Central Funds, will indirectly bear its pro-rata share of the fees and expenses incurred by the underlying Fidelity Central Funds. These fees and expenses are not included in the Fund's annualized expense ratio used to calculate the expense estimate in the table below.
Hypothetical Example for Comparison Purposes
The second line of the accompanying table for each class of the Fund provides information about hypothetical account values and hypothetical expenses based on a Class' actual expense ratio and an assumed rate of return of 5% per year before expenses, which is not the Class' actual return. The hypothetical account values and expenses may not be used to estimate the actual ending account balance or expenses you paid for the period. You may use this information to compare the ongoing costs of investing in the Fund and other funds. To do so, compare this 5% hypothetical example with the 5% hypothetical examples that appear in the shareholder reports of the other funds. A small balance maintenance fee of $12.00 that is charged once a year may apply for certain accounts with a value of less than $2,000. This fee is not included in the table below. If it was, the estimate of expenses you paid during the period would be higher, and your ending account value lower, by this amount. In addition, the Fund, as a shareholder in the underlying Fidelity Central Funds, will indirectly bear its pro-rata share of the fees and expenses incurred by the underlying Fidelity Central Funds. These fees and expenses are not included in the Fund's annualized expense ratio used to calculate the expense estimate in the table below.
Please note that the expenses shown in the table are meant to highlight your ongoing costs only and do not reflect any transaction costs. Therefore, the second line of the table is useful in comparing ongoing costs only, and will not help you determine the relative total costs of owning different funds. In addition, if these transactional costs were included, your costs would have been higher.
| | Annualized Expense Ratio-A | Beginning
Account Value
May 1, 2017 | Ending
Account Value
October 31, 2017 | Expenses Paid
During Period-B
May 1, 2017
to October 31, 2017 |
| Fidelity Canada Fund | | | | |
| Class A | 1.33% | | | |
| Actual | | $1,000.00 | $1,104.70 | $7.06 |
| Hypothetical-C | | $1,000.00 | $1,018.50 | $6.77 |
| Class M | 1.63% | | | |
| Actual | | $1,000.00 | $1,103.20 | $8.64 |
| Hypothetical-C | | $1,000.00 | $1,016.99 | $8.29 |
| Class C | 2.06% | | | |
| Actual | | $1,000.00 | $1,100.60 | $10.91 |
| Hypothetical-C | | $1,000.00 | $1,014.82 | $10.46 |
| Canada | 1.02% | | | |
| Actual | | $1,000.00 | $1,106.30 | $5.42 |
| Hypothetical-C | | $1,000.00 | $1,020.06 | $5.19 |
| Class I | 1.00% | | | |
| Actual | | $1,000.00 | $1,106.60 | $5.31 |
| Hypothetical-C | | $1,000.00 | $1,020.16 | $5.09 |
| Fidelity China Region Fund | | | | |
| Class A | 1.30% | | | |
| Actual | | $1,000.00 | $1,219.10 | $7.27 |
| Hypothetical-C | | $1,000.00 | $1,018.65 | $6.61 |
| Class M | 1.66% | | | |
| Actual | | $1,000.00 | $1,217.40 | $9.28 |
| Hypothetical-C | | $1,000.00 | $1,016.84 | $8.44 |
| Class C | 2.05% | | | |
| Actual | | $1,000.00 | $1,214.90 | $11.44 |
| Hypothetical-C | | $1,000.00 | $1,014.87 | $10.41 |
| China Region | 1.00% | | | |
| Actual | | $1,000.00 | $1,221.00 | $5.60 |
| Hypothetical-C | | $1,000.00 | $1,020.16 | $5.09 |
| Class I | 1.02% | | | |
| Actual | | $1,000.00 | $1,221.10 | $5.71 |
| Hypothetical-C | | $1,000.00 | $1,020.06 | $5.19 |
| Fidelity Emerging Asia Fund | 1.09% | | | |
| Actual | | $1,000.00 | $1,199.90 | $6.04 |
| Hypothetical-C | | $1,000.00 | $1,019.71 | $5.55 |
| Fidelity Emerging Markets Fund | | | | |
| Emerging Markets | .96% | | | |
| Actual | | $1,000.00 | $1,187.80 | $5.29 |
| Hypothetical-C | | $1,000.00 | $1,020.37 | $4.89 |
| Class K | .82% | | | |
| Actual | | $1,000.00 | $1,188.40 | $4.52 |
| Hypothetical-C | | $1,000.00 | $1,021.07 | $4.18 |
| Fidelity Europe Fund | | | | |
| Class A | 1.34% | | | |
| Actual | | $1,000.00 | $1,122.10 | $7.17 |
| Hypothetical-C | | $1,000.00 | $1,018.45 | $6.82 |
| Class M | 1.66% | | | |
| Actual | | $1,000.00 | $1,120.30 | $8.87 |
| Hypothetical-C | | $1,000.00 | $1,016.84 | $8.44 |
| Class C | 2.13% | | | |
| Actual | | $1,000.00 | $1,117.70 | $11.37 |
| Hypothetical-C | | $1,000.00 | $1,014.47 | $10.82 |
| Europe | 1.02% | | | |
| Actual | | $1,000.00 | $1,123.90 | $5.46 |
| Hypothetical-C | | $1,000.00 | $1,020.06 | $5.19 |
| Class I | 1.00% | | | |
| Actual | | $1,000.00 | $1,123.90 | $5.35 |
| Hypothetical-C | | $1,000.00 | $1,020.16 | $5.09 |
| Fidelity Japan Fund | | | | |
| Class A | 1.14% | | | |
| Actual | | $1,000.00 | $1,152.90 | $6.19 |
| Hypothetical-C | | $1,000.00 | $1,019.46 | $5.80 |
| Class M | 1.48% | | | |
| Actual | | $1,000.00 | $1,150.50 | $8.02 |
| Hypothetical-C | | $1,000.00 | $1,017.74 | $7.53 |
| Class C | 1.83% | | | |
| Actual | | $1,000.00 | $1,149.50 | $9.91 |
| Hypothetical-C | | $1,000.00 | $1,015.98 | $9.30 |
| Japan | .85% | | | |
| Actual | | $1,000.00 | $1,155.00 | $4.62 |
| Hypothetical-C | | $1,000.00 | $1,020.92 | $4.33 |
| Class I | .78% | | | |
| Actual | | $1,000.00 | $1,155.10 | $4.24 |
| Hypothetical-C | | $1,000.00 | $1,021.27 | $3.97 |
| Fidelity Japan Smaller Companies Fund | .94% | | | |
| Actual | | $1,000.00 | $1,176.80 | $5.16 |
| Hypothetical-C | | $1,000.00 | $1,020.47 | $4.79 |
| Fidelity Latin America Fund | | | | |
| Class A | 1.38% | | | |
| Actual | | $1,000.00 | $1,106.00 | $7.33 |
| Hypothetical-C | | $1,000.00 | $1,018.25 | $7.02 |
| Class M | 1.65% | | | |
| Actual | | $1,000.00 | $1,104.40 | $8.75 |
| Hypothetical-C | | $1,000.00 | $1,016.89 | $8.39 |
| Class C | 2.13% | | | |
| Actual | | $1,000.00 | $1,101.80 | $11.28 |
| Hypothetical-C | | $1,000.00 | $1,014.47 | $10.82 |
| Latin America | 1.07% | | | |
| Actual | | $1,000.00 | $1,107.20 | $5.68 |
| Hypothetical-C | | $1,000.00 | $1,019.81 | $5.45 |
| Class I | 1.01% | | | |
| Actual | | $1,000.00 | $1,107.70 | $5.37 |
| Hypothetical-C | | $1,000.00 | $1,020.11 | $5.14 |
| Fidelity Nordic Fund | .98% | | | |
| Actual | | $1,000.00 | $1,095.80 | $5.18 |
| Hypothetical-C | | $1,000.00 | $1,020.27 | $4.99 |
| Fidelity Pacific Basin Fund | 1.10% | | | |
| Actual | | $1,000.00 | $1,188.70 | $6.07 |
| Hypothetical-C | | $1,000.00 | $1,019.66 | $5.60 |
A Annualized expense ratio reflects expenses net of applicable fee waivers.
B Expenses are equal to each Class' annualized expense ratio, multiplied by the average account value over the period, multiplied by 184/ 365 (to reflect the one-half year period).
C 5% return per year before expenses
Distributions (Unaudited)
The Board of Trustees of each fund voted to pay to shareholders of record at the opening of business on record date, the following distributions per share derived from capital gains realized from sales of portfolio securities and dividends derived from net investment income:
| | Pay Date | Record Date | Dividends | Capital Gains |
| Fidelity Canada Fund | | | | |
| Class A | 12/11/17 | 12/08/17 | $0.589 | $0.487 |
| Class M | 12/11/17 | 12/08/17 | $0.402 | $0.487 |
| Class C | 12/11/17 | 12/08/17 | $0.184 | $0.487 |
| Canada | 12/11/17 | 12/08/17 | $0.770 | $0.487 |
| Class I | 12/11/17 | 12/08/17 | $0.765 | $0.487 |
| Fidelity China Region Fund | | | | |
| Class A | 12/11/17 | 12/08/17 | $0.075 | $0.000 |
| Class M | 12/11/17 | 12/08/17 | $0.000 | $0.000 |
| Class C | 12/11/17 | 12/08/17 | $0.000 | $0.000 |
| China Region | 12/11/17 | 12/08/17 | $0.142 | $0.000 |
| Class I | 12/11/17 | 12/08/17 | $0.156 | $0.000 |
| Fidelity Emerging Asia Fund | | | | |
| Emerging Asia | 12/11/17 | 12/08/17 | $0.369 | $0.022 |
| Fidelity Emerging Markets Fund | | | | |
| Emerging Markets | 12/11/17 | 12/08/17 | $0.162 | $0.027 |
| Class K | 12/11/17 | 12/08/17 | $0.200 | $0.027 |
| Fidelity Europe Fund | | | | |
| Class A | 12/18/17 | 12/15/17 | $0.329 | $0.657 |
| Class M | 12/18/17 | 12/15/17 | $0.227 | $0.657 |
| Class C | 12/18/17 | 12/15/17 | $0.099 | $0.657 |
| Europe | 12/18/17 | 12/15/17 | $0.410 | $0.657 |
| Class I | 12/18/17 | 12/15/17 | $0.433 | $0.657 |
| Fidelity Japan Fund | | | | |
| Class A | 12/11/17 | 12/08/17 | $0.078 | $0.035 |
| Class M | 12/11/17 | 12/08/17 | $0.047 | $0.035 |
| Class C | 12/11/17 | 12/08/17 | $0.003 | $0.035 |
| Japan | 12/11/17 | 12/08/17 | $0.107 | $0.035 |
| Class I | 12/11/17 | 12/08/17 | $0.135 | $0.035 |
| Fidelity Japan Smaller Companies Fund | | | | |
| Japan Smaller Companies | 12/11/17 | 12/08/17 | $0.162 | $0.742 |
| Fidelity Latin America Fund | | | | |
| Class A | 12/11/17 | 12/08/17 | $0.210 | $0.000 |
| Class M | 12/11/17 | 12/08/17 | $0.148 | $0.000 |
| Class C | 12/11/17 | 12/08/17 | $0.020 | $0.000 |
| Latin America | 12/11/17 | 12/08/17 | $0.291 | $0.000 |
| Class I | 12/11/17 | 12/08/17 | $0.318 | $0.000 |
| Fidelity Nordic Fund | | | | |
| Nordic | 12/11/17 | 12/08/17 | $0.504 | $1.666 |
| Fidelity Pacific Basin Fund | | | | |
| Pacific Basin | 12/18/17 | 12/15/17 | $0.230 | $1.317 |
|
The funds hereby designate as capital gain dividend the amounts noted below for the taxable year ended October 31, 2017, or, if subsequently determined to be different, the net capital gain of such year.
| Fidelity Canada Fund | $5,081,189 |
| Fidelity Japan Smaller Companies Fund | $16,303,701 |
| Fidelity Nordic Fund | $3,560,225 |
| Fidelity Pacific Basin Fund | $32,200,886 |
|
A percentage of the dividends distributed during the fiscal year for the following funds qualify for the dividends–received deduction for corporate shareholders:
| | Class A | Class M | Class C | Retail Class | Class I | Class K |
| Fidelity Canada Fund | | | | | | |
| December, 2016 | 1% | 1% | 1% | 1% | 1% | – |
| Fidelity Emerging Markets Fund | | | | | | |
| December 9, 2016 | – | – | – | 15% | – | 13% |
| December 27, 2016 | – | – | – | 9% | – | 9% |
| Fidelity Latin America Fund | | | | | | |
| December, 2016 | 1% | 1% | 1% | 1% | 1% | – |
| Fidelity Pacific Basin Fund | | | | | | |
| December, 2016 | – | – | – | 1% | – | – |
|
A percentage of the dividends distributed during the fiscal year for the following funds may be taken into account as a dividend for purposes of the maximum rate under section 1(h)(11) of the Internal Revenue Code.
| | Class A | Class M | Class C | Retail Class | Class I | Class K |
| Fidelity Canada Fund | | | | | | |
| December, 2016 | 100% | 100% | 100% | 87% | 83% | – |
| Fidelity China Region Fund | | | | | | |
| December, 2016 | 91% | 100% | 100% | 70% | 68% | – |
| Fidelity Emerging Asia Fund | | | | | | |
| December, 2016 | – | – | – | 62% | – | – |
| Fidelity Emerging Markets Fund | | | | | | |
| December 9, 2016 | – | – | – | 100% | – | 100% |
| December 27, 2016 | – | – | – | 100% | – | 100% |
| Fidelity Europe Fund | | | | | | |
| December, 2016 | 100% | 100% | – | 100% | 100% | – |
| Fidelity Japan Fund | | | | | | |
| December, 2016 | 100% | 100% | – | 100% | 100% | – |
| Fidelity Japan Smaller Companies Fund | | | | | | |
| December, 2016 | – | – | – | 70% | – | – |
| Fidelity Latin America Fund | | | | | | |
| December 9, 2016 | 59% | 70% | 97% | 52% | 51% | – |
| December 29, 2016 | 3% | 3% | 3% | 3% | 3% | – |
| Fidelity Nordic Fund | | | | | | |
| December, 2016 | – | – | – | 100% | – | – |
| Fidelity Pacific Basin | | | | | | |
| December, 2016 | – | – | – | 94% | – | – |
|
The amounts per share which represent income derived from sources within, and taxes paid to, foreign countries or possessions of the United States are as follows:
| | Pay Date | Income | Taxes |
| Fidelity Canada Fund | | | |
| Class A | 12/12/16 | $0.7679 | $0.1269 |
| Class M | 12/12/16 | $0.6529 | $0.1269 |
| Class C | 12/12/16 | $0.4199 | $0.1269 |
| Canada | 12/12/16 | $0.9259 | $0.1269 |
| Class I | 12/12/16 | $0.9749 | $0.1269 |
| Fidelity China Region Fund | | | |
| Class A | 12/12/16 | $0.2936 | $0.0616 |
| Class M | 12/12/16 | $0.2226 | $0.0616 |
| Class C | 12/12/16 | $0.0796 | $0.0616 |
| China Region | 12/12/16 | $0.3826 | $0.0616 |
| Class I | 12/12/16 | $0.3926 | $0.0616 |
| Fidelity Emerging Asia Fund | | | |
| Emerging Asia | 12/12/16 | $0.4766 | $0.0856 |
| Fidelity Emerging Markets Fund | | | |
| Emerging Markets | 12/12/16 | $0.1744 | $0.0344 |
| Class K | 12/12/16 | $0.2124 | $0.0344 |
| Emerging Markets | 12/28/16 | $0.0090 | $0.0000 |
| Class K | 12/28/16 | $0.0090 | $0.0000 |
| Fidelity Europe Fund | | | |
| Class A | 12/19/16 | $0.3993 | $0.0493 |
| Class M | 12/19/16 | $0.2663 | $0.0493 |
| Europe | 12/19/16 | $0.5573 | $0.0493 |
| Class I | 12/19/16 | $0.5833 | $0.0493 |
| Fidelity Japan Fund | | | |
| Class A | 12/12/16 | $0.1187 | $0.0247 |
| Class M | 12/12/16 | $0.0687 | $0.0247 |
| Japan | 12/12/16 | $0.1707 | $0.0247 |
| Class I | 12/12/16 | $0.1687 | $0.0247 |
| Fidelity Japan Smaller Companies Fund | | | |
| Japan Smaller Companies | 12/12/16 | $0.3066 | $0.0343 |
| Fidelity Latin America Fund | | | |
| Class A | 12/12/16 | $0.3756 | $0.0296 |
| Class M | 12/12/16 | $0.3186 | $0.0296 |
| Class C | 12/12/16 | $0.2276 | $0.0296 |
| Latin America | 12/12/16 | $0.4246 | $0.0296 |
| Class I | 12/12/16 | $0.4356 | $0.0296 |
| Class A | 12/30/16 | $0.0800 | $0.0000 |
| Class M | 12/30/16 | $0.0800 | $0.0000 |
| Class C | 12/30/16 | $0.0800 | $0.0000 |
| Latin America | 12/30/16 | $0.0800 | $0.0000 |
| Class I | 12/30/16 | $0.0800 | $0.0000 |
| Fidelity Nordic Fund | | | |
| Nordic | 12/12/16 | $0.8960 | $0.1260 |
| Fidelity Pacific Basin Fund | | | |
| Pacific Basin | 12/19/16 | $0.3676 | $0.0456 |
|
The funds will notify shareholders in January 2018 of amounts for use in preparing 2017 income tax returns.
Board Approval of Investment Advisory Contracts and Management Fees
Targeted International Equity Funds
Each year, the Board of Trustees, including the Independent Trustees (together, the Board), votes on the renewal of the management contract with Fidelity Management & Research Company (FMR) and the sub-advisory agreements (together, the Advisory Contracts) for each fund. FMR and the sub-advisers are referred to herein as the Investment Advisers. The Board, assisted by the advice of fund counsel and Independent Trustees' counsel, requests and considers a broad range of information relevant to the renewal of the Advisory Contracts throughout the year.
The Board meets regularly and, at each of its meetings, covers an extensive agenda of topics and materials and considers factors that are relevant to its annual consideration of the renewal of each fund's Advisory Contracts, including the services and support provided to each fund and its shareholders. The Board has established various standing committees (Committees), each composed of and chaired by Independent Trustees with varying backgrounds, to which the Board has assigned specific subject matter responsibilities in order to enhance effective decision-making by the Board. The Board, acting directly and through its Committees, requests and receives information concerning the annual consideration of the renewal of each fund's Advisory Contracts. The Board also meets as needed to review matters specifically related to the Board's annual consideration of the renewal of the Advisory Contracts. Members of the Board may also meet with trustees of other Fidelity funds through ad hoc joint committees to discuss certain matters relevant to all of the Fidelity funds.
At its July 2017 meeting, the Board unanimously determined to renew each fund's Advisory Contracts. In reaching its determination, the Board considered all factors it believed relevant, including (i) the nature, extent, and quality of the services to be provided to each fund and its shareholders (including the investment performance of each fund); (ii) the competitiveness of each fund's management fee and total expense ratio relative to peer funds; (iii) the total costs of the services to be provided by and the profits to be realized by Fidelity from its relationships with each fund; and (iv) the extent to which, if any, economies of scale exist and would be realized as each fund grows, and whether any economies of scale are appropriately shared with fund shareholders.
In considering whether to renew the Advisory Contracts for each fund, the Board reached a determination, with the assistance of fund counsel and Independent Trustees' counsel and through the exercise of its business judgment, that the renewal of the Advisory Contracts was in the best interests of each fund and its shareholders and that the compensation payable under the Advisory Contracts was fair and reasonable. The Board's decision to renew the Advisory Contracts was not based on any single factor, but rather was based on a comprehensive consideration of all the information provided to the Board at its meetings throughout the year. The Board, in reaching its determination to renew the Advisory Contracts, was aware that shareholders of each fund have a broad range of investment choices available to them, including a wide choice among funds offered by Fidelity's competitors, and that each fund's shareholders, who have the opportunity to review and weigh the disclosure provided by the fund in its prospectus and other public disclosures, have chosen to invest in that fund, which is part of the Fidelity family of funds.
Amendment to Group Fee Rate. The Board also approved an amendment to the management contract for each fund to add an additional breakpoint to the group fee schedule, effective October 1, 2017. The Board noted that the additional breakpoint would result in lower management fee rates as Fidelity's assets under management increase.
Nature, Extent, and Quality of Services Provided. The Board considered Fidelity's staffing as it relates to the funds, including the backgrounds of investment personnel of Fidelity, and also considered the funds' investment objectives, strategies, and related investment philosophies. The Independent Trustees also had discussions with senior management of Fidelity's investment operations and investment groups. The Board considered the structure of the investment personnel compensation program and whether this structure provides appropriate incentives to act in the best interests of each fund. Additionally, the Board considered the portfolio managers' investments, if any, in the funds that they manage.
Resources Dedicated to Investment Management and Support Services. The Board and the Fund Oversight and Research Committees reviewed the general qualifications and capabilities of Fidelity's investment staff, including its size, education, experience, and resources, as well as Fidelity's approach to recruiting, training, managing, and compensating investment personnel. The Board noted that Fidelity has continued to increase the resources devoted to non-U.S. offices, including expansion of Fidelity's global investment organization. The Board also noted that Fidelity's analysts have extensive resources, tools and capabilities that allow them to conduct sophisticated quantitative and fundamental analysis, as well as credit analysis of issuers, counterparties and guarantors. Further, the Board considered that Fidelity's investment professionals have sufficient access to global information and data so as to provide competitive investment results over time, and that those professionals also have access to sophisticated tools that permit them to assess portfolio construction and risk and performance attribution characteristics continuously, as well as to transmit new information and research conclusions rapidly around the world. Additionally, in its deliberations, the Board considered Fidelity's trading, risk management, compliance, and technology and operations capabilities and resources, which are integral parts of the investment management process.
Shareholder and Administrative Services. The Board considered (i) the nature, extent, quality, and cost of advisory, administrative, and shareholder services performed by the Investment Advisers and their affiliates under the Advisory Contracts and under separate agreements covering transfer agency, pricing and bookkeeping, and securities lending services for each fund; (ii) the nature and extent of the supervision of third party service providers, principally custodians, subcustodians, and pricing vendors; and (iii) the resources devoted to, and the record of compliance with, each fund's compliance policies and procedures. The Board also reviewed the allocation of fund brokerage, including allocations to brokers affiliated with the Investment Advisers, the use of brokerage commissions to pay fund expenses, and the use of "soft" commission dollars to pay for research services.
The Board noted that the growth of fund assets over time across the complex allows Fidelity to reinvest in the development of services designed to enhance the value or convenience of the Fidelity funds as investment vehicles. These services include 24-hour access to account information and market information through telephone representatives and over the Internet, investor education materials and asset allocation tools, and the expanded availability of Fidelity Investor Centers.
In 2014, the Board formed an ad hoc Committee on Transfer Agency Fees to review the variety of transfer agency fee structures throughout the industry and Fidelity's competitive positioning with respect to industry participants.
Investment in a Large Fund Family. The Board considered the benefits to shareholders of investing in a Fidelity fund, including the benefits of investing in a fund that is part of a large family of funds offering a variety of investment disciplines and providing a large variety of mutual fund investor services. The Board noted that Fidelity had taken, or had made recommendations that resulted in the Fidelity funds taking, a number of actions over the previous year that benefited particular funds, including: (i) continuing to dedicate additional resources to Fidelity's investment research process, and to the support of the senior management team that oversees asset management; (ii) continuing efforts to enhance Fidelity's global research capabilities; (iii) launching new funds and making other enhancements to meet client needs; (iv) launching new share classes of existing funds; (v) eliminating purchase minimums and broadening eligibility requirements for certain lower-priced share classes; (vi) reducing management fees and total expenses for certain growth equity funds and index funds; (vii) lowering expense caps for certain existing funds and classes to reduce expenses borne by shareholders; (viii) eliminating short-term redemption fees for certain funds; (ix) introducing a new pricing structure for certain funds of funds that is expected to reduce overall expenses paid by shareholders; (x) rationalizing product lines and gaining increased efficiencies through proposals for fund mergers and share class consolidations; (xi) continuing to develop, acquire and implement systems and technology to improve services to the funds and shareholders, strengthen information security, and increase efficiency; and (xii) implementing enhancements to further strengthen Fidelity's product line to increase investors' probability of success in achieving their investment goals, including retirement income goals.
Investment Performance. The Board considered whether each fund has operated in accordance with its investment objective, as well as its record of compliance with its investment restrictions and its performance history. The Board noted that there were portfolio management changes for Fidelity Canada Fund in January 2014 and September 2014, for Fidelity Emerging Asia Fund in September 2016 and December 2016, for Fidelity Europe Fund in December 2013 and September 2014, for Fidelity Japan Fund in March 2014, for Fidelity Japan Smaller Companies Fund in March 2014, for Fidelity Nordic Fund in September 2014, and for Fidelity Pacific Basin Fund in October 2013.
The Board took into account discussions with representatives of the Investment Advisers about fund investment performance that occur at Board meetings throughout the year. In this regard the Board noted that as part of regularly scheduled fund reviews and other reports to the Board on fund performance, the Board considers annualized return information for each fund for different time periods, measured against a securities market index ("benchmark index") and a peer group of funds with similar objectives ("peer group"), if any. In its evaluation of fund investment performance, the Board gave particular attention to information indicating changes in performance of certain Fidelity funds for specific time periods and discussed with the Investment Advisers the reasons for any overperformance or underperformance.
In addition to reviewing absolute and relative fund performance, the Independent Trustees periodically consider the appropriateness of fund performance metrics in evaluating the results achieved. In general, the Independent Trustees believe that fund performance should be evaluated based on net performance (after fees and expenses) of both the highest performing and lowest performing fund share classes, where applicable, compared to appropriate benchmark indices, over appropriate time periods that may include full market cycles, and compared to peer groups, as applicable, over the same periods, taking into account relevant factors including the following: general market conditions; issuer-specific information; and fund cash flows and other factors.
The Independent Trustees recognize that shareholders evaluate performance on a net basis over their own holding periods, for which one-, three-, and five-year periods are often used as a proxy. For this reason, the performance information reviewed by the Board also included net cumulative calendar year total return information for each fund and an appropriate benchmark index and peer group for the most recent one-, three-, and five-year periods, as shown below. For Fidelity Emerging Markets Fund, Fidelity Europe Fund, and Fidelity Japan Fund, returns are shown compared to the 25th percentile (top of box, 75% beaten) and 75th percentile (bottom of box, 25% beaten) of the peer universe. For Fidelity Canada Fund, Fidelity China Region Fund, Fidelity Emerging Asia Fund, Fidelity Japan Smaller Companies Fund, Fidelity Latin America Fund, Fidelity Nordic Fund, and Fidelity Pacific Basin Fund, a peer group is not shown below because the funds do not generally utilize a peer group for performance comparison purposes. For Fidelity Emerging Asia Fund, Fidelity Europe Fund, and Fidelity Pacific Basin Fund, returns of the benchmark index are "net MA,"
i.e., adjusted for tax withholding rates applicable to U.S.-based funds organized as Massachusetts business trusts.
Fidelity Canada Fund
Fidelity China Region Fund
Fidelity Emerging Asia Fund
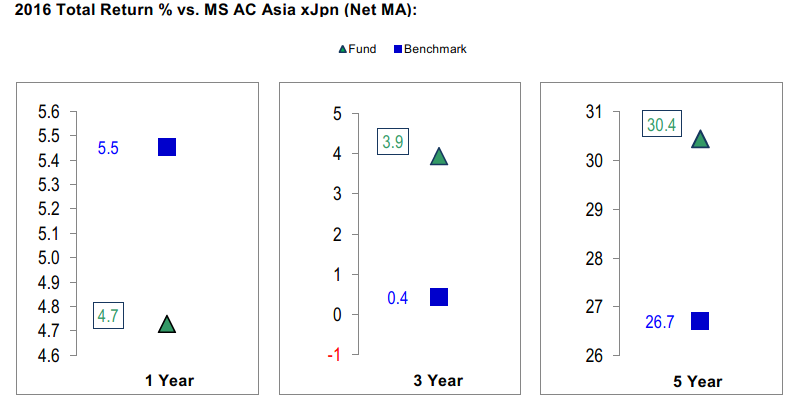
Fidelity Emerging Markets Fund
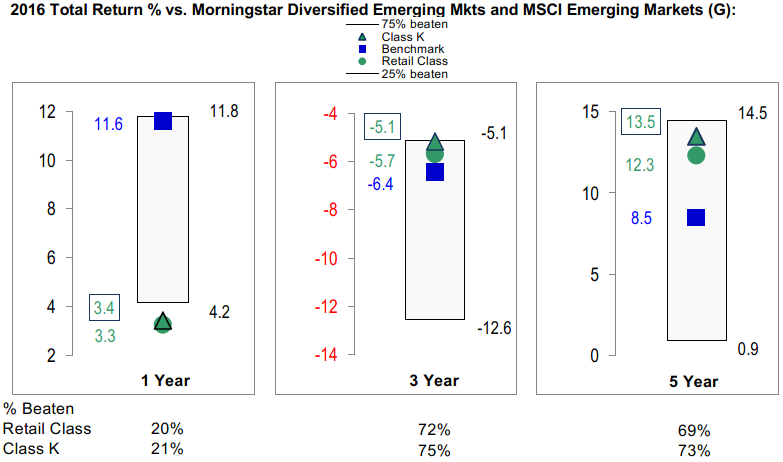
Fidelity Europe Fund

Fidelity Japan Fund
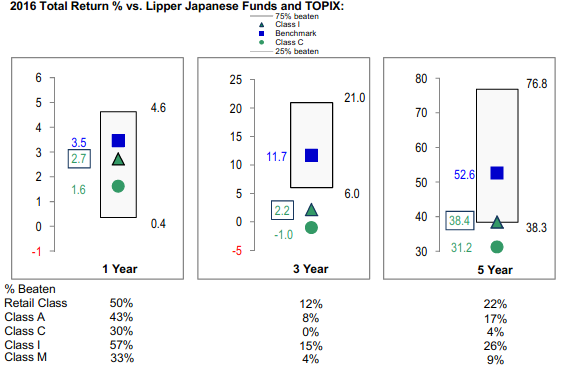
Fidelity Japan Smaller Companies Fund
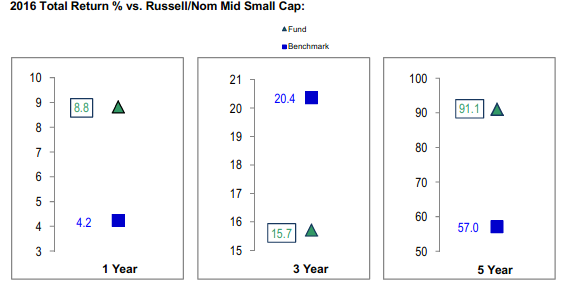
Fidelity Latin America Fund

Fidelity Nordic Fund
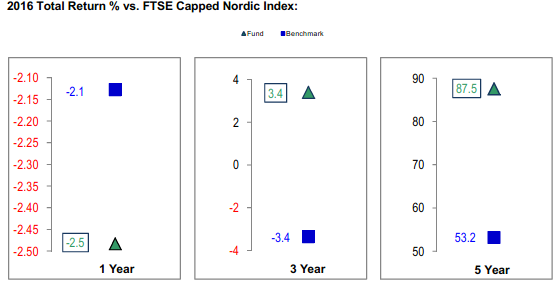
Fidelity Pacific Basin Fund
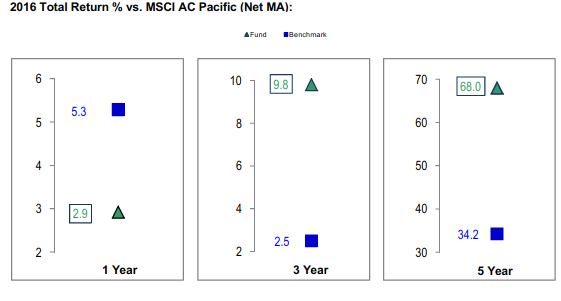
The Board has discussed Fidelity Latin America Fund's underperformance (based on the December 31, 2016 data presented herein) with FMR, including the fund's investment strategy, the portfolio management team, and broader trends in the market that may have impacted the fund's performance, and has engaged with FMR to consider what steps might be taken to remediate the fund's underperformance. The Board noted that the fund's performance has improved since the period shown. The Board noted that there were portfolio management changes for the fund in October 2015 and December 2015.
The Board also considered that each of Fidelity Canada Fund's, Fidelity Emerging Asia Fund's, Fidelity Europe Fund's, Fidelity Japan Fund's, and Fidelity Pacific Basin Fund's management fee is subject to upward or downward adjustment depending upon whether, and to what extent, the fund's investment performance for the performance period (a rolling 36-month period) exceeds, or is exceeded by, a securities index, thus leading to a performance adjustment for the same period. The Board noted that the performance adjustment provides FMR with a strong economic incentive to seek to achieve superior long-term performance for each fund's shareholders and helps to more closely align the interests of FMR and the shareholders of each fund.
Based on its review, the Board concluded that the nature, extent, and quality of services provided to each fund under the Advisory Contracts should continue to benefit the shareholders of each fund.
Competitiveness of Management Fee and Total Expense Ratio. The Board considered each fund's management fee and total expense ratio compared to "mapped groups" of competitive funds and classes created for the purpose of facilitating the Trustees' competitive analysis of management fees and total expenses. Fidelity creates "mapped groups" by combining similar Lipper investment objective categories that have comparable investment mandates. Combining Lipper investment objective categories aids the Board's management fee and total expense ratio comparisons by broadening the competitive group used for comparison.
Management Fee. The Board considered two proprietary management fee comparisons for the 12-month periods shown in basis points (BP) in the charts below. The group of Lipper funds used by the Board for management fee comparisons is referred to below as the "Total Mapped Group." For Fidelity Japan Fund, the Total Mapped Group is broader than the Lipper peer group used by the Board for performance comparisons because the Total Mapped Group combines several Lipper investment objective categories while the Lipper peer group does not. The Total Mapped Group comparison focuses on a fund's standing in terms of gross management fees before expense reimbursements or caps, and without giving effect to a fund's performance adjustment (if applicable), relative to the total universe of funds with comparable investment mandates, regardless of whether their management fee structures also are comparable. Funds with comparable investment mandates offer exposure to similar types of securities. Funds with comparable management fee structures have similar management fee contractual arrangements (
e.g., flat rate charged for advisory services, all-inclusive fee rate,
etc.). "TMG %" represents the percentage of funds in the Total Mapped Group that had management fees that were lower than a fund's. For example, a hypothetical TMG % of 20% would mean that 80% of the funds in the Total Mapped Group had higher, and 20% had lower, management fees than a fund. The funds' actual TMG %s and the number of funds in the Total Mapped Group are in the charts below. The "Asset-Size Peer Group" (ASPG) comparison focuses on a fund's standing relative to a subset of non-Fidelity funds within the Total Mapped Group that are similar in size and management fee structure without taking into account performance adjustments, if any. For example, if a fund is in the first quartile of the ASPG, the fund's management fee ranks in the least expensive or lowest 25% of funds in the ASPG. The ASPG represents at least 15% of the funds in the Total Mapped Group with comparable asset size and management fee structures, subject to a minimum of 50 funds (or all funds in the Total Mapped Group if fewer than 50). Additional information, such as the ASPG quartile in which a fund's management fee rate ranked and the impact of a fund's performance adjustment (if applicable), is also included in the charts and considered by the Board.
Fidelity Canada Fund

The Board noted that the fund's management fee rate ranked below the median of its Total Mapped Group and below the median of its ASPG for 2016. The Board also noted the effect of the fund's performance adjustment, if any, on the fund's management fee ranking.
Fidelity China Region Fund

The Board noted that the fund's management fee rate ranked below the median of its Total Mapped Group and below the median of its ASPG for 2016.
Fidelity Emerging Asia Fund
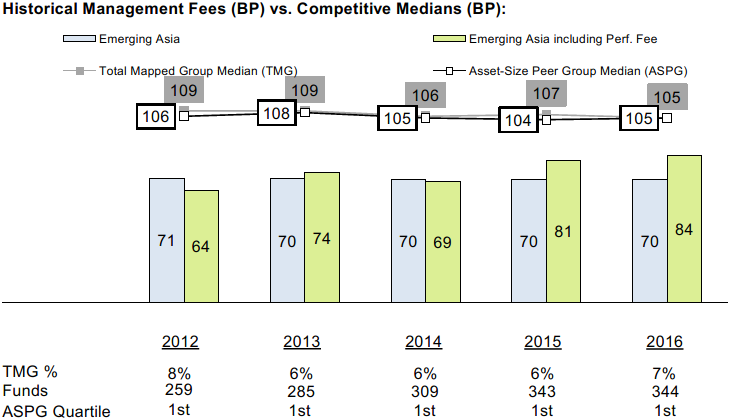
The Board noted that the fund's management fee rate ranked below the median of its Total Mapped Group and below the median of its ASPG for 2016. The Board also noted the effect of the fund's performance adjustment, if any, on the fund's management fee ranking.
Furthermore, the Board considered that shareholders of Fidelity Emerging Asia Fund approved a prospective change in the index used to calculate the fund's performance adjustment, beginning December 1, 2010. The Board also considered that, because the performance adjustment is based on a rolling 36-month measurement period, during a transition period the fund's performance is compared to a blended index return that reflects the performance of the former index for the portion of the measurement period prior to December 1, 2010 and the performance of the current index for the remainder of the measurement period. The Board noted that the fund's performance adjustments for 2012 and 2013 shown in the chart above reflect the effect of using the blended index return to calculate the fund's performance adjustment.
Fidelity Emerging Markets Fund

The Board noted that the fund's management fee rate ranked below the median of its Total Mapped Group and below the median of its ASPG for 2016.
Fidelity Europe Fund
The Board noted that the fund's management fee rate ranked below the median of its Total Mapped Group and below the median of its ASPG for 2016. The Board also noted the effect of the fund's performance adjustment, if any, on the fund's management fee ranking.
Fidelity Japan Fund
The Board noted that the fund's management fee rate ranked below the median of its Total Mapped Group and below the median of its ASPG for 2016. The Board also noted the effect of the fund's performance adjustment, if any, on the fund's management fee ranking.
Fidelity Japan Smaller Companies Fund
The Board noted that the fund's management fee rate ranked below the median of its Total Mapped Group and below the median of its ASPG for 2016.
Fidelity Latin America Fund
The Board noted that the fund's management fee rate ranked below the median of its Total Mapped Group and below the median of its ASPG for 2016.
Fidelity Nordic Fund
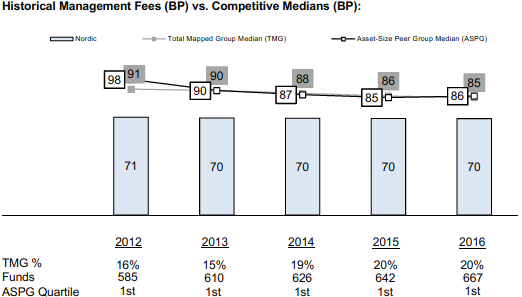
The Board noted that the fund's management fee rate ranked below the median of its Total Mapped Group and below the median of its ASPG for 2016.
Fidelity Pacific Basin Fund
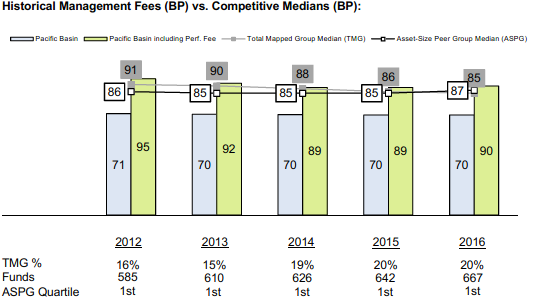
The Board noted that the fund's management fee rate ranked below the median of its Total Mapped Group and below the median of its ASPG for 2016. The Board also noted the effect of the fund's performance adjustment, if any, on the fund's management fee ranking.
The Board noted that, in 2014, the Board and the boards of other Fidelity funds formed the ad hoc Committee on Group Fee to conduct an in-depth review of the "group fee" component of the management fee of funds with such management fee structures. The Committee's focus included the mechanics of the group fee, the competitive landscape of group fee structures, Fidelity funds with no group fee component and investment products not included in group fee assets. The Board also considered that, for funds subject to the group fee, FMR agreed to voluntarily waive fees over a specified period of time in amounts designed to account for assets converted from certain funds to certain collective investment trusts.
The Board also noted that, in 2013, the ad hoc Committee on Management Fees was formed to conduct an in-depth review of the management fee rates of Fidelity's active equity mutual funds. The Committee focused on the following areas: (i) standard fee structures; (ii) research consumption and trading evolution; (iii) management fee competitiveness/profitability by category; and (iv) factors that drive institutional pricing.
Based on its review, the Board concluded that each fund's management fee is fair and reasonable in light of the services that the fund receives and the other factors considered.
Total Expense Ratio (for Fidelity Canada Fund, Fidelity China Region Fund, Fidelity Emerging Markets Fund, Fidelity Europe Fund, Fidelity Japan Fund, and Fidelity Latin America Fund). In its review of the total expense ratio of each class of each fund, the Board considered the fund's management fee rate as well as other fund or class expenses, as applicable, such as transfer agent fees, pricing and bookkeeping fees, fund-paid 12b-1 fees, and custodial, legal, and audit fees. The Board noted the impact of Fidelity Canada Fund's, Fidelity Europe Fund's, and Fidelity Japan Fund's performance adjustment. The Board also noted that Fidelity may agree to waive fees and expenses from time to time, and the extent to which, if any, it has done so for each fund. As part of its review, the Board also considered the current and historical total expense ratios of each class of each fund compared to competitive fund median expenses. Each class of each fund is compared to those funds and classes in the Total Mapped Group (used by the Board for management fee comparisons) that have a similar sales load structure.
The Board noted that the funds offer multiple classes, each of which has a different sales load and 12b-1 fee structure, and that the multiple structures are intended to offer a range of pricing options for the intermediary market. The Board also noted that the total expense ratios of the classes of each fund vary primarily by the level of their 12b-1 fees, although differences in transfer agent fees may also cause expenses to vary from class to class.
For Fidelity Canada Fund and Fidelity Europe Fund, the Board noted that the total expense ratio of the retail class ranked below the competitive median for 2016 and the total expense ratio of each of Class A, Class M (formerly Class T), Class C, and Class I ranked above the competitive median for 2016. The Board considered that, in general, various factors can affect total expense ratios. The Board noted that the total expense ratio of each of Class A, Class M, Class C, and Class I of Fidelity Canada Fund was above the competitive median because of a positive performance fee adjustment in 2016. The Board noted that the total expense ratio of each of Class A, Class M, Class C, and Class I of Fidelity Europe Fund was above the competitive median because of a positive performance fee adjustment in 2016 and relatively higher other expenses due to low asset levels. The Board noted that the total expense ratio of Class M was also above the competitive median because of higher 12b-1 fees on Class M as compared to most competitor funds. Class M has a higher 12b-1 fee, but a lower front-end sales charge, than traditionally priced front-end sales charge classes. The Board considered that Class M is primarily sold load-waived in the retirement plan market where its 0.50% 12b-1 fee is comparable to competing no-load, higher 12b-1 fee classes designed specifically for retirement plans. The Board noted that the total expense ratio of Class C was also above the competitive median because of its 12b-1 fees. The Board also noted that, although Class I is categorized by Lipper as an institutional class, Class I has a significantly lower investment minimum than most other funds and classes categorized as institutional. As a result, FMR believes Class I is generally more comparable to retail funds and classes.
For each of Fidelity China Region Fund, Fidelity Japan Fund, and Fidelity Latin America Fund, the Board noted that the total expense ratio of each of Class A, Class C, Class I, and the retail class of the fund ranked below the competitive median for 2016 and the total expense ratio of Class M ranked above the competitive median for 2016. The Board considered that, in general, various factors can affect total expense ratios. The Board noted that the total expense ratio of Class M was above the competitive median primarily because of higher 12b-1 fees on Class M as compared to most competitor funds. Class M has a higher 12b-1 fee, but a lower front-end sales charge, than traditionally priced front-end sales charge classes. The Board considered that Class M is primarily sold load-waived in the retirement plan market where its 0.50% 12b-1 fee is comparable to competing no-load, higher 12b-1 fee classes designed specifically for retirement plans.
The Board noted that the total expense ratio of each class of Fidelity Emerging Markets Fund ranked below the competitive median for 2016.
Total Expense Ratio (for Fidelity Emerging Asia Fund, Fidelity Japan Smaller Companies Fund, Fidelity Nordic Fund, and Fidelity Pacific Basin Fund). In its review of each fund's total expense ratio, the Board considered the fund's management fee rate as well as other fund expenses, such as transfer agent fees, pricing and bookkeeping fees, and custodial, legal, and audit fees. The Board noted the impact of Fidelity Emerging Asia Fund's and Fidelity Pacific Basin Fund's performance adjustment. The Board also noted that Fidelity may agree to waive fees and expenses from time to time, and the extent to which, if any, it has done so for each fund. As part of its review, the Board also considered the current and historical total expense ratios of each fund compared to competitive fund median expenses. Each fund is compared to those funds and classes in the Total Mapped Group (used by the Board for management fee comparisons) that have a similar sales load structure.
The Board noted that the total expense ratio of each of Fidelity Emerging Asia Fund, Fidelity Japan Smaller Companies Fund, and Fidelity Nordic Fund ranked below the competitive median for 2016.
The Board noted that Fidelity Pacific Basin Fund's total expense ratio ranked equal to the competitive median for 2016.
Fees Charged to Other Fidelity Clients. The Board also considered Fidelity fee structures and other information with respect to clients of Fidelity, such as other funds advised or subadvised by Fidelity, pension plan clients, and other institutional clients with similar mandates. The Board noted that an ad hoc joint committee created by it and the boards of other Fidelity funds periodically (most recently in 2013) reviews and compares Fidelity's institutional investment advisory business with its business of providing services to the Fidelity funds, including the differences in services provided, fees charged, and costs incurred, as well as competition in their respective marketplaces.
Based on its review of total expense ratios and fees charged to other Fidelity clients, the Board concluded that, although some classes of some funds were above the median of the universe presented for comparison, the total expense ratio of each fund or each class of each fund, as applicable, was reasonable in light of the services that the fund and its shareholders receive and the other factors considered.
Costs of the Services and Profitability. The Board considered the revenues earned and the expenses incurred by Fidelity in conducting the business of developing, marketing, distributing, managing, administering and servicing each fund and servicing each fund's shareholders. The Board also considered the level of Fidelity's profits in respect of all the Fidelity funds.
On an annual basis, Fidelity presents to the Board information about the profitability of its relationships with each fund. Fidelity calculates profitability information for each fund, as well as aggregate profitability information for groups of Fidelity funds and all Fidelity funds, using a series of detailed revenue and cost allocation methodologies which originate with the books and records of Fidelity on which Fidelity's audited financial statements are based. The Audit Committee of the Board reviews any significant changes from the prior year's methodologies.
PricewaterhouseCoopers LLP (PwC), independent registered public accounting firm and auditor to Fidelity and certain Fidelity funds, has been engaged annually by the Board as part of the Board's assessment of Fidelity's profitability analysis. PwC's engagement includes the review and assessment of the methodologies used by Fidelity in determining the revenues and expenses attributable to Fidelity's mutual fund business, and completion of agreed-upon procedures in respect of the mathematical accuracy of the fund profitability information and its conformity to established allocation methodologies. After considering PwC's reports issued under the engagement and information provided by Fidelity, the Board concluded that while other allocation methods may also be reasonable, Fidelity's profitability methodologies are reasonable in all material respects.
The Board also reviewed Fidelity's non-fund businesses and potential fall-out benefits related to the mutual fund business as well as cases where Fidelity's affiliates may benefit from or be related to the funds' business.
The Board considered the costs of the services provided by and the profits realized by Fidelity in connection with the operation of each fund and was satisfied that the profitability was not excessive.
Economies of Scale. The Board considered whether there have been economies of scale in respect of the management of the Fidelity funds, whether the Fidelity funds (including each fund) have appropriately benefited from any such economies of scale, and whether there is potential for realization of any further economies of scale. The Board considered the extent to which each fund will benefit from economies of scale as assets grow through increased services to the fund, through waivers or reimbursements, or through fee or expense ratio reductions. The Board also noted that a committee (the Economies of Scale Committee) created by it and the boards of other Fidelity funds periodically (most recently in 2013) analyzes whether Fidelity attains economies of scale in respect of the management and servicing of the Fidelity funds, whether the Fidelity funds have appropriately benefited from such economies of scale, and whether there is potential for realization of any further economies of scale.
The Board recognized that each fund's management contract incorporates a "group fee" structure, which provides for lower group fee rates as total group assets increase, and for higher group fee rates as total group assets decrease (with "group assets" defined to include fund assets under FMR's management plus the assets of sector funds previously under FMR's management). FMR calculates the group fee rates based on a tiered asset "breakpoint" schedule that varies based on asset class. The Board considered that the group fee is designed to deliver the benefits of economies of scale to fund shareholders when total Fidelity fund assets increase, even if assets of any particular fund are unchanged or have declined, because some portion of Fidelity's costs are attributable to services provided to all Fidelity funds, and all funds benefit if those costs can be allocated among more assets. The Board concluded that, given the group fee structure, fund shareholders will benefit from lower management fees as group assets increase at the fund complex level, regardless of whether Fidelity achieves any such economies of scale.
The Board concluded, taking into account the analysis of the Economies of Scale Committee, that economies of scale, if any, are being appropriately shared between fund shareholders and Fidelity.
Additional Information Requested by the Board. In order to develop fully the factual basis for consideration of the Fidelity funds' advisory contracts, the Board requested and received additional information on certain topics, including: (i) fund performance trends, in particular the underperformance of certain funds, and Fidelity's long-term strategies for certain funds; (ii) Fidelity's fund profitability methodology, profitability trends for certain funds, and the impact of certain factors on fund profitability results, including the impact of market trends on actively managed funds; (iii) the use of performance fees and the calculation of performance adjustments, including the impact of underperformance and fund outflows on performance adjustments; (iv) metrics for evaluating index fund performance; (v) Fidelity's group fee structure, including the group fee breakpoint schedules; (vi) the terms of Fidelity's contractual and voluntary expense cap arrangements with the funds; (vii) the methodology with respect to evaluating competitive fund data and peer group classifications and fee comparisons; (viii) the expense structures for different funds and classes; (ix) Fidelity's arrangements with affiliated sub-advisers on behalf of the funds; (x) information regarding other accounts managed by Fidelity, including institutional accounts and collective investment trusts; (xi) recent changes to the fee structure for certain funds of funds; and (xii) the impact of the Department of Labor's new fiduciary rule on the funds' comparative expense information.
Based on its evaluation of all of the conclusions noted above, and after considering all factors it believed relevant, the Board concluded that the advisory fee structures are fair and reasonable, and that each fund's Advisory Contracts should be renewed.
Corporate Headquarters
245 Summer St.
Boston, MA 02210
www.fidelity.com
TIF-ANN-1217
1.754542.117
Item 2.
Code of Ethics
As of the end of the period, October 31, 2017, Fidelity Investment Trust (the trust) has adopted a code of ethics, as defined in Item 2 of Form N-CSR, that applies to its President and Treasurer and its Chief Financial Officer. A copy of the code of ethics is filed as an exhibit to this Form N-CSR.
Item 3.
Audit Committee Financial Expert
The Board of Trustees of the trust has determined that Joseph Mauriello is an audit committee financial expert, as defined in Item 3 of Form N-CSR. Mr. Mauriello is independent for purposes of Item 3 of Form N-CSR.
Item 4.
Principal Accountant Fees and Services
Fees and Services
The following table presents fees billed by PricewaterhouseCoopers LLP (“PwC”) in each of the last two fiscal years for services rendered to Fidelity Canada Fund, Fidelity China Region Fund, Fidelity Emerging Asia Fund, Fidelity Emerging Markets Fund, Fidelity Europe Fund, Fidelity Japan Fund, Fidelity Japan Smaller Companies Fund, Fidelity Latin America Fund, Fidelity Nordic Fund and Fidelity Pacific Basin Fund (the “Funds”):
Services Billed by PwC
October 31, 2017 FeesA
| | | | |
| Audit Fees | Audit-Related Fees | Tax Fees | All Other Fees |
Fidelity Canada Fund | $57,000 | $5,900 | $5,700 | $2,800 |
Fidelity China Region Fund | $69,000 | $6,300 | $5,500 | $3,000 |
Fidelity Emerging Asia Fund | $62,000 | $5,900 | $5,500 | $2,800 |
Fidelity Emerging Markets Fund | $71,000 | $6,800 | $5,700 | $3,200 |
Fidelity Europe Fund | $64,000 | $6,100 | $7,200 | $2,900 |
Fidelity Japan Fund | $62,000 | $6,000 | $6,200 | $2,800 |
Fidelity Japan Smaller Companies Fund | $52,000 | $5,000 | $5,500 | $2,400 |
Fidelity Latin America Fund | $62,000 | $5,900 | $5,500 | $2,800 |
Fidelity Nordic Fund | $51,000 | $5,000 | $5,500 | $2,400 |
Fidelity Pacific Basin Fund | $63,000 | $6,000 | $5,700 | $2,900 |
| | | | |
| Audit Fees | Audit-Related Fees | Tax Fees | All Other Fees |
Fidelity Canada Fund | $62,000 | $6,100 | $5,700 | $2,900 |
Fidelity China Region Fund | $75,000 | $6,100 | $5,500 | $2,900 |
Fidelity Emerging Asia Fund | $62,000 | $6,100 | $5,500 | $2,900 |
Fidelity Emerging Markets Fund | $72,000 | $7,200 | $6,700 | $3,400 |
Fidelity Europe Fund | $66,000 | $6,300 | $12,700 | $3,000 |
Fidelity Japan Fund | $63,000 | $6,100 | $5,500 | $2,900 |
Fidelity Japan Smaller Companies Fund | $52,000 | $5,200 | $5,500 | $2,400 |
Fidelity Latin America Fund | $62,000 | $6,000 | $5,500 | $2,800 |
Fidelity Nordic Fund | $51,000 | $5,100 | $23,400 | $2,400 |
Fidelity Pacific Basin Fund | $63,000 | $6,100 | $5,700 | $2,900 |
A Amounts may reflect rounding.
B Certain amounts have been reclassified to align with current period presentation.
The following table presents fees billed by PwC that were required to be approved by the Audit Committee for services that relate directly to the operations and financial reporting of the Funds and that are rendered on behalf of Fidelity Management & Research Company (“FMR”) and entities controlling, controlled by, or under common control with FMR (not including any sub-adviser whose role is primarily portfolio management and is subcontracted with or overseen by another investment adviser) that provide ongoing services to the Funds (“Fund Service Providers”):
Services Billed by PwC
| | |
| October 31, 2017A | October 31, 2016A,B |
Audit-Related Fees | $12,525,000 | $5,550,000 |
Tax Fees | $155,000 | $10,000 |
All Other Fees | $- | $- |
A Amounts may reflect rounding.
B Certain amounts have been reclassified to align with current period presentation.
“Audit-Related Fees” represent fees billed for assurance and related services that are reasonably related to the performance of the fund audit or the review of the fund's financial statements and that are not reported under Audit Fees.
“Tax Fees” represent fees billed for tax compliance, tax advice or tax planning that relate directly to the operations and financial reporting of the fund.
“All Other Fees” represent fees billed for services provided to the fund or Fund Service Provider, a significant portion of which are assurance related, that relate directly to the operations and financial reporting of the fund, excluding those services that are reported under Audit Fees, Audit-Related Fees or Tax Fees.
Assurance services must be performed by an independent public accountant.
* * *
The aggregate non-audit fees billed by PwC for services rendered to the Funds, FMR (not including any sub-adviser whose role is primarily portfolio management and is subcontracted with or overseen by another investment adviser), and any Fund Service Provider for each of the last two fiscal years of the Funds are as follows:
| | |
Billed By | October 31, 2017A | October 31, 2016A,B |
PwC | $16,360,000 | $6,730,000 |
A Amounts may reflect rounding.
B Certain amounts have been reclassified to align with current period presentation.
The trust's Audit Committee has considered non-audit services that were not pre-approved that were provided by PwC to Fund Service Providers to be compatible with maintaining the independence of PwC in its audit of the Funds, taking into account representations from PwC, in accordance with Public Company Accounting Oversight Board rules, regarding its independence from the Funds and its related entities and FMR’s review of the appropriateness and permissibility under applicable law of such non-audit services prior to their provision to the Fund Service Providers.
Audit Committee Pre-Approval Policies and Procedures
The trust’s Audit Committee must pre-approve all audit and non-audit services provided by a fund’s independent registered public accounting firm relating to the operations or financial reporting of the fund. Prior to the commencement of any audit or non-audit services to a fund, the Audit Committee reviews the services to determine whether they are appropriate and permissible under applicable law.
The Audit Committee has adopted policies and procedures to, among other purposes, provide a framework for the Committee’s consideration of non-audit services by the audit firms that audit the Fidelity funds. The policies and procedures require that any non-audit service provided by a fund audit firm to a Fidelity fund and any non-audit service provided by a fund auditor to a Fund Service Provider that relates directly to the operations and financial reporting of a Fidelity fund (“Covered Service”) are subject to approval by the Audit Committee before such service is provided.
All Covered Services must be approved in advance of provision of the service either: (i) by formal resolution of the Audit Committee, or (ii) by oral or written approval of the service by the Chair of the Audit Committee (or if the Chair is unavailable, such other member of the Audit Committee as may be designated by the Chair to act in the Chair’s absence). The approval contemplated by (ii) above is permitted where the Treasurer determines that action on such an engagement is necessary before the next meeting of the Audit Committee.
Non-audit services provided by a fund audit firm to a Fund Service Provider that do not relate directly to the operations and financial reporting of a Fidelity fund are reported to the Audit Committee on a periodic basis.
Non-Audit Services Approved Pursuant to Rule 2-01(c)(7)(i)(C) and (ii) of Regulation S-X (“De Minimis Exception”)
There were no non-audit services approved or required to be approved by the Audit Committee pursuant to the De Minimis Exception during the Funds’ last two fiscal years relating to services provided to (i) the Funds or (ii) any Fund Service Provider that relate directly to the operations and financial reporting of the Funds.
Item 5.
Audit Committee of Listed Registrants
Not applicable.
Item 6.
Investments
(a)
Not applicable.
(b)
Not applicable
Item 7.
Disclosure of Proxy Voting Policies and Procedures for Closed-End Management Investment Companies
Not applicable.
Item 8.
Portfolio Managers of Closed-End Management Investment Companies
Not applicable.
Item 9.
Purchase of Equity Securities by Closed-End Management Investment Company and Affiliated Purchasers
Not applicable.
Item 10.
Submission of Matters to a Vote of Security Holders
There were no material changes to the procedures by which shareholders may recommend nominees to the trust’s Board of Trustees.
Item 11.
Controls and Procedures
(a)(i) The President and Treasurer and the Chief Financial Officer have concluded that the trust’s disclosure controls and procedures (as defined in Rule 30a-3(c) under the Investment Company Act) provide reasonable assurances that material information relating to the trust is made known to them by the appropriate persons, based on their evaluation of these controls and procedures as of a date within 90 days of the filing date of this report.
(a)(ii) There was no change in the trust’s internal control over financial reporting (as defined in Rule 30a-3(d) under the Investment Company Act) that occurred during the second fiscal quarter of the period covered by this report that has materially affected, or is reasonably likely to materially affect, the trust’s internal control over financial reporting.
Item 12.
Exhibits
| | |
(a) | (1) | Code of Ethics pursuant to Item 2 of Form N-CSR is filed and attached hereto as EX-99.CODE ETH. |
(a) | (2) | Certification pursuant to Rule 30a-2(a) under the Investment Company Act of 1940 (17 CFR 270.30a-2(a)) is filed and attached hereto as Exhibit 99.CERT. |
(a) | (3) | Not applicable. |
(b) | | Certification pursuant to Rule 30a-2(b) under the Investment Company Act of 1940 (17 CFR 270.30a-2(b)) is furnished and attached hereto as Exhibit 99.906CERT. |
SIGNATURES
Pursuant to the requirements of the Securities Exchange Act of 1934 and the Investment Company Act of 1940, the registrant has duly caused this report to be signed on its behalf by the undersigned, thereunto duly authorized.
Fidelity Investment Trust
| |
By: | /s/ Stacie M. Smith |
| Stacie M. Smith |
| President and Treasurer |
| |
Date: | December 27, 2017 |
Pursuant to the requirements of the Securities Exchange Act of 1934 and the Investment Company Act of 1940, this report has been signed below by the following persons on behalf of the registrant and in the capacities and on the dates indicated.
| |
By: | /s/Stacie M. Smith |
| Stacie M. Smith |
| President and Treasurer |
| |
Date: | December 27, 2017 |
| |
By: | /s/Howard J. Galligan III |
| Howard J. Galligan III |
| Chief Financial Officer |
| |
Date: | December 27, 2017 |